Expanding the Metabolome with Applications in Neuroscience ...
267
University of Tennessee, Knoxville University of Tennessee, Knoxville TRACE: Tennessee Research and Creative TRACE: Tennessee Research and Creative Exchange Exchange Doctoral Dissertations Graduate School 5-2018 Expanding the Metabolome with Applications in Neuroscience Expanding the Metabolome with Applications in Neuroscience and Bioremediation and Bioremediation Allen Bourdon University of Tennessee, [email protected] Follow this and additional works at: https://trace.tennessee.edu/utk_graddiss Recommended Citation Recommended Citation Bourdon, Allen, "Expanding the Metabolome with Applications in Neuroscience and Bioremediation. " PhD diss., University of Tennessee, 2018. https://trace.tennessee.edu/utk_graddiss/4880 This Dissertation is brought to you for free and open access by the Graduate School at TRACE: Tennessee Research and Creative Exchange. It has been accepted for inclusion in Doctoral Dissertations by an authorized administrator of TRACE: Tennessee Research and Creative Exchange. For more information, please contact [email protected].
-
Upload
khangminh22 -
Category
Documents
-
view
1 -
download
0
Transcript of Expanding the Metabolome with Applications in Neuroscience ...

University of Tennessee, Knoxville University of Tennessee, Knoxville
TRACE: Tennessee Research and Creative TRACE: Tennessee Research and Creative
Exchange Exchange
Doctoral Dissertations Graduate School
5-2018
Expanding the Metabolome with Applications in Neuroscience Expanding the Metabolome with Applications in Neuroscience
and Bioremediation and Bioremediation
Allen Bourdon University of Tennessee, [email protected]
Follow this and additional works at: https://trace.tennessee.edu/utk_graddiss
Recommended Citation Recommended Citation Bourdon, Allen, "Expanding the Metabolome with Applications in Neuroscience and Bioremediation. " PhD diss., University of Tennessee, 2018. https://trace.tennessee.edu/utk_graddiss/4880
This Dissertation is brought to you for free and open access by the Graduate School at TRACE: Tennessee Research and Creative Exchange. It has been accepted for inclusion in Doctoral Dissertations by an authorized administrator of TRACE: Tennessee Research and Creative Exchange. For more information, please contact [email protected].

To the Graduate Council:
I am submitting herewith a dissertation written by Allen Bourdon entitled "Expanding the
Metabolome with Applications in Neuroscience and Bioremediation." I have examined the final
electronic copy of this dissertation for form and content and recommend that it be accepted in
partial fulfillment of the requirements for the degree of Doctor of Philosophy, with a major in
Chemistry.
Shawn R. Campagna, Major Professor
We have read this dissertation and recommend its acceptance:
Ampofo K. Darko, Brain K. Long, Ralph B. Lydic
Accepted for the Council:
Dixie L. Thompson
Vice Provost and Dean of the Graduate School
(Original signatures are on file with official student records.)

Expanding the Metabolome with Applications in
Neuroscience and Bioremediation
A Dissertation Presented for the
Doctor of Philosophy
Degree
The University of Tennessee, Knoxville
Allen Bourdon
May 2018

ii
Copyright © 2018 by Allen Kenneth Bourdon
All rights reserved.

iii
DEDICATION
Whatever it takes.
iv
ACKNOWLEDGEMENTS
I would first like to thank my advisor, Dr. Shawn R. Campagna for the educational
opportunities and resources required to advance my career. When I got to Tennessee, I
didn’t know exactly what direction my career was headed, but you were exactly the type
of advisor I needed; extremely intelligent, down-to-earth, and straight to the point. I
appreciate everything you have done for me and hope to return the favor at some point.
Thank you for having confidence in my abilities.
Next, I need to thank my out-of-department mentors, Dr. Ralph Lydic and Dr. Helen
A. Baghdoyan, whom are the biggest reason for my neuroscience-based research.
People always say that timing is everything, and I couldn’t think of a more appropriate
use of the phrase. We moved to Tennessee at different times and with slightly different
goals, but in the end, we made for a productive team. These two mentors took me under
their wings and provided me the opportunity to attend multiple conferences in various
cities, and truly allowed me to navigate my career in a positive direction.
Thank you to my committee members; Dr. Brian Long, Dr. Ampofo Darko, and Dr.
Ralph Lydic, for your continued support and effort throughout this process. Additionally,
my collaborators and associated graduate students; (UTK) Dr. Matthew Cooper, Dr.
Frank Loeffler, Dr. Fred Becker, Dr. Steve Wilhelm, Dr. Elizabeth Fozo, Dr. Rebecca
Prosser, (UGA) Dr. Diana Downs, Dr. Mary Ann Moran, (FIU) Dr. DeEtta Mills. Thank you
all for the opportunity to learn from your research!
The Campagna lab group, across my five years has provided several long-term
contacts within the field. My research open house host, Stephen Dearth was my first
contact and whom provided significant training for the use of mass spectrometry
instrumentation and metabolomics analyses. My first set of graduate colleagues; Carson
Prevatte, Abigail Tester, Brandon Kennedy, and Maggie Lookadoo. Later down the road;
Eric Tague, Caleb Gibson, Alex Fisch, Josh Powers, and Jordan Rogerson. And who
could forget, Dr. Hector Castro-Gonzalez. Thank you everyone, I appreciate your
continued support and I hope to stay connected in the future.

v
I would like to make a small shout-out to my Uncle Clyde in San Antonio. You have
always had my career goals in mind, and I truly appreciate everything you have done to
advance my scientific career.
Now I must make room for my friends from the sleep research community, whom
I primarily met through the Gordon conference on sleep regulation and function in 2015;
Dr. Allison Brager, Dr. Nicolette Ognjanovski, Dr. Jimmy Fraigne, and my best-bro, soon
to be doctor, Zoltan Torontali. You will be life-long friends and I hope that we can continue
to advance our respective fields and survive all of our future encounters.
My final acknowledgments go out to the people that mean the most to me in life:
I would like to start by thanking my fiancée, Zoe Hanken for being a huge supporter
of my career goals, and her willingness to listen to my ramblings about science. Zoe, you
make my heart smile, and I can’t wait to see where life takes us.
Have to thank my little man, Oliver the lab dog, for his unconditional love. He’s the
best cockapoo a guy could ask for.
Lastly, I want to thank my family for their continued support. My parents, Ray and
Cathy have always been there when I needed them most, and I am truly grateful for
everything they have done for me. My sister, Kendra, and her two boys, Brody and
Landyn, are the real reason I moved to Tennessee in the first place. I am so happy that I
was able to see my nephews grow up over these past 5 years and can’t wait to see them
develop into young adults. I appreciate all of the love and support you have provided
along the way. Additionally, my extended family, from both the Bourdon and the Phelix
side. You have all been extremely supportive, and I couldn’t have asked for a better
family.

vi
ABSTRACT
The study of small molecules, while not a new concept, is still at its infancy for both
detection and structure identification. My work at the University of Tennessee, Knoxville
has been focused on the advancement of both analytical detection and identification of
novel compounds as potential small molecule targets. Using in vitro and in vivo
neurometabolomics on rodents as my foundation, I have been able to identify numerous
small molecules for further study in the areas of social defeat stress and across various
states of consciousness. Through untargeted metabolomics via liquid chromatography
coupled with high-resolution mass spectrometry, this research has provided the additional
hurdle of identifying novel targets among the unidentified spectral features, or “unknown”
metabolites. In the final chapter of this dissertation, I emphasize my ability to elucidate
the structure of a novel cobamide identified as a native prosthetic group in catalytically
active tetrachloroethene reductive dehalogenases of Desulfobacterium hafniense.
Utilizing stable isotope labeling of microbial cultures, mass spectrometry confirmed the
molecular formula, followed by 1D and 2D nuclear magnetic resonance spectroscopy to
characterize structural connectivity. The research presented in this dissertation advances
the field of novel compound discovery and characterization for the identification of small
molecule targets by highlighting unique research within the fields of neurometabolomics
and microbiology.

vii
PREFACE
“I not only use all the brains that I have, but all that I can borrow.”
-- Woodrow Wilson
“The measure of who we are is what we do with what we have.”
-- Vinci Lombardi
“He who is not courageous enough to take risks will accomplish nothing in life.”
-- Muhammad Ali
“It is likely that most of what you currently learn at school will be irrelevant by the time
you are 40…My best advice is to focus on personal resilience and emotional
intelligence.”
-- Yuval Noah Harari

viii
TABLE OF CONTENTS
INTRODUCTION ............................................................................................................. 1
MODERN METABOLOMICS ....................................................................................... 3
OPENING THE DOOR FOR UNTARGETED METABOLOMICS ................................ 4
NEUROMETABOLOMICS ........................................................................................... 4
THE KNOWLEDGE GAP ............................................................................................. 5
Chapter 1: NEUROMETABOLOMICS PROFILE CLASSIFICATION OF SYRIaN HAMSTERS AND B6 MICE AS A MODEL OF STRESS RESILIENCE ......................... 8
PREFACE .................................................................................................................... 9
1.1 ABSTRACT.......................................................................................................... 12
1.2 INTRODUCTION ................................................................................................. 13
1.3 METHODS ........................................................................................................... 15
1.3.1 Animals and Housing Conditions .................................................................. 15
1.3.2 Experimental Procedures .............................................................................. 16
Social Defeat Stress ........................................................................................... 16
Social Interaction Testing ................................................................................... 17
Dominant-Subordinate Relationships ................................................................. 18
Experimental Design .......................................................................................... 18
Tissue Collection ................................................................................................ 19
1.3.3 Untargeted Metabolomics using UPLC-HRMS .............................................. 19
1.3.4 Statistical Analysis ........................................................................................ 20

ix
1.4 RESULTS ............................................................................................................ 25
1.4.1 Behavioral Data ............................................................................................. 25
1.4.2 Metabolomics Data ....................................................................................... 27
PLS-DA Reveals Distinct Metabolic Profiles ....................................................... 27
Identifying Representative Known Metabolites ................................................... 27
Identifying Representative Unknown Metabolites ............................................... 32
1.5 DISCUSSION ...................................................................................................... 39
1.5.1 The Characteristic Metabolome Associated with Social Defeat .................... 39
1.5.2 Unidentified Spectral Features Affected by Social Stress ............................. 41
1.6 CONCLUSION ..................................................................................................... 44
1.7 REFERENCES .................................................................................................... 45
1.8 APPENDIX .......................................................................................................... 55
1.8.1 Supplemental Methods and Materials ........................................................... 55
Extraction Protocol ............................................................................................. 55
UPLC-HRMS ...................................................................................................... 55
Data Processing ................................................................................................. 55
Internal Ratio Normalization (IRN) ...................................................................... 56
Heatmaps ........................................................................................................... 56
Partial least squares discriminant analysis (PLS-DA) ......................................... 57
Identification and Statistical Reduction of USFs ................................................. 57

x
Statistical Analysis .............................................................................................. 58
1.8.2 Raw data files ................................................................................................ 58
Chapter 2: NEUROMETABOLOMICS OF ACUTE SLEEP DEPRIVATION THROUGH TEMPORAL ANALYSIS OF B6 MICE ........................................................................ 134
PREFACE ................................................................................................................ 135
2.1 ABSTRACT........................................................................................................ 138
2.2 INTRODUCTION ............................................................................................... 138
2.3 MATERIALS AND METHODS ........................................................................... 139
2.3.1 Animals ....................................................................................................... 139
2.3.2 Stereotaxic Surgery ..................................................................................... 140
2.3.3 Quantifying States of Sleep and Wakefulness ............................................ 140
2.3.4 Microdialysis Experiments ........................................................................... 140
2.3.5 Experimental Groups .................................................................................. 141
Group 1: Sleep for 6h followed by wakefulness on treadmill for 3h (S6-W3; n=7
mice) ................................................................................................................. 141
Group 2: Sleep deprivation for 6h followed by sleep for 3h (SD6-S3; n = 6 mice)
......................................................................................................................... 142
Group 3: Spontaneous wakefulness for 6h followed by wakefulness on treadmill
for 3h (W6-W3; n = 6 mice) .............................................................................. 142
2.3.6 Untargeted Metabolomics using UPLC-HRMS ............................................ 142
2.3.7 Statistical Analysis ...................................................................................... 143
Pre-processing normalization ........................................................................... 143

xi
Multivariate Analysis ......................................................................................... 144
Heatmap Analysis ............................................................................................. 144
Linear Mixed Effects Model .............................................................................. 144
Classification Analysis ...................................................................................... 146
2.4 RESULTS .......................................................................................................... 147
2.4.1 Temporal Fluctuation of Identified Metabolites ............................................ 149
2.4.2 Results of LME Analysis ............................................................................. 149
2.4.3 Classification Analysis ................................................................................. 151
2.5 DISCUSSION .................................................................................................... 161
2.5.1 Comparisons with Previous Metabolomics Studies ..................................... 165
2.6 CONCLUSION ................................................................................................... 167
REFERENCES ........................................................................................................ 168
Chapter 3: CHARACTERIZATION OF NATIVE COBAMIDE FROM Desulfitobacterium hafniense ................................................................................................................... 174
PREFACE ................................................................................................................ 175
3.1 ABSTRACT........................................................................................................ 178
3.2 INTRODUCTION ............................................................................................... 179
3.3 RESULTS .......................................................................................................... 182
3.3.1 Discovery and structure of a novel cobamide.............................................. 182
3.3.2 Confirmation of the novel lower base structure ........................................... 195
3.3.3 Purinyl-Cba is the prosthetic group of Dsf PceA RDases ............................ 196

xii
3.3.4 Dsf CobT substrate specificity and phylogenetic analysis ........................... 203
3.3.5 Effects of purinyl-Cba on dechlorinating activity .......................................... 214
3.4 DISCUSSION .................................................................................................... 224
3.5 METHODS ......................................................................................................... 226
3.5.1 Chemicals ................................................................................................... 226
3.5.2 Cultures ....................................................................................................... 226
3.5.3 Corrinoid extraction ..................................................................................... 227
3.5.4 Corrinoid analysis ........................................................................................ 229
3.5.5 NMR spectroscopy ...................................................................................... 230
3.5.6 Blue native PAGE (BN–PAGE), enzyme assays and proteomic analysis ... 230
3.5.7 Primer and probe design ............................................................................. 231
3.5.8 Chemical and molecular analyses ............................................................... 232
3.5.9 Statistical analysis ....................................................................................... 233
3.5.10 Bioinformatics and phylogenetic analyses................................................. 233
3.5.11 Heterologous expression and purification of CobT .................................... 233
3.5.12 In vitro CobT activity .................................................................................. 234
REFERENCES ........................................................................................................ 238
CONCLUSION ............................................................................................................ 245
VITA ............................................................................................................................ 249

xiii
LIST OF TABLES
Table 1.1 Total number of USFs ................................................................................... 35
Table 1.2 USFs selected for discussion ........................................................................ 37
Table 1.3 Raw Data of Dominant Hamsters from BLA/CeA .......................................... 59
Table 1.4 Raw Data of Handled Control Hamsters from BLA ........................................ 63
Table 1.5 Raw Data of Subordinate Hamsters from BLA .............................................. 67
Table 1.6 Raw Data of Dominant Hamsters from HPC ................................................. 71
Table 1.7 Raw Data of Handled Control Hamsters from HPC ....................................... 75
Table 1.8 Raw Data of Subordinate Hamsters from HPC ............................................. 80
Table 1.9 Raw Data of Dominant Hamsters from NAc .................................................. 84
Table 1.10 Raw Data of Handled Control Hamsters from NAc ...................................... 87
Table 1.11 Raw Data of Subordinate Hamsters from NAc ............................................ 89
Table 1.12 Raw Data of Dominant Hamsters from vmPFC ........................................... 92
Table 1.13 Raw Data of Handled Control Hamsters from vmPFC ................................ 95
Table 1.14 Raw Data of Subordinate Hamsters from vmPFC ....................................... 98
Table 1.15 Raw Data of Resilient Mice from BLA/CeA................................................ 101
Table 1.16 Raw Data of Control Mice from BLA/CeA .................................................. 104
Table 1.17 Raw Data of Susceptible Mice from BLA/CeA ........................................... 107
Table 1.18 Raw Data of Resilient Mice from HPC ....................................................... 110
Table 1.19 Raw Data of Control Mice from HPC ......................................................... 112

xiv
Table 1.20 Raw Data of Susceptible Mice from HPC .................................................. 114
Table 1.21 Raw Data of Resilient Mice from NAc ....................................................... 116
Table 1.22 Raw Data of Control Mice from NAc .......................................................... 119
Table 1.23 Raw Data of Susceptible Mice from NAc ................................................... 122
Table 1.24 Raw Data of Resilient Mice from vmPFC .................................................. 125
Table 1.25 Raw Data of Control Mice from vmPFC .................................................... 128
Table 1.26 Raw Data of Susceptible Mice from vmPFC .............................................. 131
Table 2.1 Significant Metabolites for Regulation of Behavioral States ........................ 152
Table 3.1 Proteomic analysis of the Desulfitobacterium (Dsf) hafniense strain JH1
proteins associated with different BN-PAGE slices .............................................. 204
Table 3.2 Information about CobT and homologous proteins used for phylogenetic tree
construction (Figure 4.4B in main text) ................................................................. 211
Table 3.3 Growth of corrinoid-auxotrophic organohalide-respiring Dehalobacter restrictus
(Dhb) and Dehlaococcoides mccartyi (Dhc) pure cultures with different cobamides
............................................................................................................................. 222
Table 3.4 Nucleotide sequences of the primers designed for PCR amplification of the
cobT genes to construct overexpression plasmids............................................... 236
Table 3.5 Information about the plasmids used for the overexpression of CobT enzymes.
............................................................................................................................. 237

xv
LIST OF FIGURES
Figure 1.1 Heatmap of all identified metabolites in mice from 4 brain regions .............. 21
Figure 1.2 Heatmap of all identified metabolites in hamsters from 4 brain regions ....... 23
Figure 1.3 Results of social interaction test for mice ..................................................... 26
Figure 1.4 Metabolite patterns of mice from untargeted metabolomic approach ........... 28
Figure 1.5 Metabolite patterns of hamsters from untargeted metabolomic approach .... 29
Figure 1.6 VIP score plot from metabolomics of mice ................................................... 30
Figure 1.7 VIP score plot from metabolomics of hamsters ............................................ 31
Figure 1.8 Effects of social defeat on the relative abundance of neurochemical
metabolites in mice ................................................................................................ 33
Figure 1.9 Effects of social defeat and dominance status on the relative abundance of
neurochemical metabolites in hamsters ................................................................. 34
Figure 2.1 Experimental design ................................................................................... 148
Figure 2.2 Observation of z-score fluctuation in LME significant metabolites .............. 153
Figure 2.3 PLSDA accurately classifies states of arousal and associated VIP classification
model ascribes significant features ...................................................................... 157
Figure 3.1 Cobamide general structure and the 16 known lower bases found in naturally
occurring cobamides ............................................................................................ 181
Figure 3.2 Spectrophotometric and structural features of Desulfitobacterium native
corrinoids ............................................................................................................. 184
Figure 3.3 The native corrinoids produced by several PCE-dechlorinating
Desulfitobacterium (Dsf) strains ........................................................................... 188

xvi
Figure 3.4 UV-Vis of novel cobamides ........................................................................ 190
Figure 3.5 The mass spectra of cobamides produced by different Dsf strains and
authentic vitamin B12 ........................................................................................... 191
Figure 3.6 Guided cobamide biosynthesis by Dsf hafniense strain Y51 ...................... 194
Figure 3.7 Results from homonuclear correlation spectroscopy (COSY) experiments 197
Figure 3.8 BN-PAGE of Dsf hafniense strain JH1 ....................................................... 199
Figure 3.9 Identification of purinyl-Cba as the native prosthetic group in Dsf PCE RDase
following nondenaturing, gel-electrophoretic separation of Dsf crude protein extracts
using BN–PAGE ................................................................................................... 200
Figure 3.10 Phylogenetic analysis of CobT homologous proteins and substrate specificity
of Dsf CobT .......................................................................................................... 205
Figure 3.11 Heterologous expression of Dsf CobT and Dhc CobT in E. coli and
requirements for lower base activation ................................................................. 215
Figure 3.12 Effects of purinyl-Cba substitution for vitamin B12 on the activity of corrinoid-
auxotrophic, organohalide-respiring bacteria. ...................................................... 218
Figure 3.13 Reductive dechlorination of cDCE to ethene in Dhc strain GT cultures ... 223
Figure 3.14 Demonstration of the utility of stable isotope 15N-labeling to obtain lower base
compositional information .................................................................................... 228

1
INTRODUCTION

2
Although the term “metabolome” was not introduced until 1998, the idea of
analyzing an organism’s fluids or tissue to determine overall health is not a new concept.
This idea can be dated back as far as ancient China (2000 – 1500 B.C.), where ants were
used to evaluate glucose concentration in urine for the diagnosis of diabetes mellitus. As
odd as it sounds, these ancient doctors even relied on tasting the patient’s urine for
diagnosis; can’t say modern physicians are that committed to their patients’ health these
days. Moving down the timeline, the Greek physician, Galen of Pergamon developed the
theory of humorism. This concept, also known as the four humors – black bile, yellow bile,
blood, and phlegm, provided physicians a simple diagnostic tool that was accepted by
Western medicine for more than 1,300 years. The scientific revolution of the 17th century
provided significant strides in the field of metabolomics, which were primarily advanced
by Santorio Sanctorius. Considered a founding father of the field, Santorio is recognized
for his work on “insensible perspiration,” where he determined that the amount of excreted
fluid was less than the fluid ingested. This study is the first documented case of physical
data collection for the quantitative analysis of pathology. From this research, Thomas
Willis (1674) was able to confirm that a patient with diabetes had sweet urine and coined
the term “mellitus”. The sweet smell from the patient’s urine was later identified to be a
sugar by Matthew Dobson in 1776 but were debated until the work of George Owen Rees
in the mid-19th century. We have since identified that elevated glucose levels occur due
to a lack of insulin production in diabetes patients, but this early metabolomics research
reveals the importance of studying small molecules for disease identification, and the true
duration of time that research has been focused on the study of the human metabolome.
Following the industrial revolution and moving into the modern era, J.J. Thompson
(1905) of the University of Cambridge must be given an enormous amount of credit for
where we are today with modern metabolomics research. The development of the first
mass spectrometer marked a new era of how the molecular space would be studied.
Although this technology has been refined in the century that has passed, the study of
molecules using their molecular weight has led to the identification of thousands, if not
millions, of compounds and has become a staple for the characterization of novel
compounds. Not to be over looked, the manufacturing of the first nuclear magnetic

3
resonance spectrometer (NMR) is equally as important for the field of metabolomics. In
1946, Felix Bloch of Stanford and Edward Purcell of Harvard simultaneously published
work using the first NMR in the same issue of Physical Review. The establishment of
NMR technologies have allowed researchers to characterize structural components of
novel compounds. Both analytical tools were further supplemented by the advancement
of chromatographic separation techniques in the 1960’s and made the analysis of a
complex metabolome possible. Each of these analytical technologies have made
significant advancements that have positioned the field of metabolomics as an emerging
field for drug development.
MODERN METABOLOMICS
Technological advances allowed for the first mass-based metabolomic
experiments in 1971 by Orval Mamer (Mamer, O. A., et al., Clin. Chim. Acta 1971), and
Evan and Majorie Horning (Horning, E. C.; Horning, M. G., J. Chrom. Sci. 1971) using
gas chromatography-mass spectrometry. These experiments provided evidence that
metabolic profiles could be generated from blood and urine samples. This was the trigger
for what is referred to as “modern metabolomics,” which started with research from Arthur
B. Robinson and Linus Pauling. Later that year, Robinson and Pauling (Pauling, L.;
Robinson, A. B., et al., PNAS 1971) published the first quantitative metabolomics
experiment showing biological variability of urine vapor and breath from humans following
dietary restriction. Now their original claim of the intestinal flora disappearing due to a
“defined diet” was corrected in 1970 (Winitz et al.), but this research still marks the
climactic beginning of large-scale, small molecule analysis. The term “metabolomics” was
first used by Stephen G. Oliver (Oliver, S. G. et al., Trends Biotechnol. 1998) for their
research on the yeast genome, and so began the era of metabolomics-based research.

4
OPENING THE DOOR FOR UNTARGETED METABOLOMICS
Targeted metabolomics research was the foundation of quantitative metabolomics
through 1970’s, 80’s and most of the 90’s until the invention and proof-of-principle of the
Orbitrap™ by Alexander Makarov (2000). Although, the concept of electrostatically
trapping ions in an orbit was in first developed almost a century prior by the physicist, K.
H. Kingdon (1923), the commercialization of this technology transitioned the world of
metabolomics from a targeted point-of-view to untargeted. See, targeted metabolomics
had technical limitations due to both hardware and software capabilities. Researchers
were only able to detect less than one percent of the metabolites present in biological
samples, which prevented the establishment of a comprehensive look at the entire
metabolome from a single sample. Now by generating a mass spectrum using Fourier
transform of the frequency signal, a high-resolution mass analyzer can detect thousands
of compounds simultaneously with a large dynamic range. This capability has spring
boarded the field into the direction of finding novel biomarkers as drug targets. Parallel to
this effort, the Human Metabolome Project started in 2004 and was led by David Wishart
of the University of Alberta, Canada. In a collaborative effort, over 50 scientists have
characterized over 2500 metabolites, 1200 drugs, and 3500 food components, which
have been compiled into the Human Metabolome Database for open-access.
Today, we have met a cross-roads of metabolomics research. The amount of data
generated presents computational limitations, and the field as a whole is attempting to
provide common practices for proper publication standards. Yet, as scientist, we strive to
achieve that next level of discovery in hopes of finding the next, great drug target. To
achieve this goal, we must continue to expand our technical and analytical tools for the
discovery and characterization of the undiscovered section of the metabolome.
NEUROMETABOLOMICS
A trending research topic is the analysis of neurometabolomics. The complexity of
studying the brain starts with the inherit selectivity of the blood brain barrier. The unique

5
feature of this organ provides additional hurdles when trying to understand its intricacies.
The specialized endothelial cells that line blood capillaries can selectively filter
compounds using passive diffusion based on size, polarity, and charge. Meaning that the
study of neuronal tissue cannot be directly supplemented with metabolic changes
observed from blood or other internal organs. Not to mention that the brain is arguably
the most complex organ of the body based on the sheer number of cooperative brain
regions and intricate arborization of nerve cells within/ across these regions. A major
emphasis on brain research was initiated by president George H. W. Bush when he
designated the 1990’s as the “Decade of the Brain” and continued when president Barack
Obama began the Brain Research through Advancing Innovative Neurotechnologies
(BRAIN) Initiative in 2013. These executive branch initiatives have increased funding and
recognition for the required advancement of brain research in hopes of solving problems
such as neurodegenerative diseases, genetic mutations, and psychological disorders.
THE KNOWLEDGE GAP
In the field of discovery-based small molecule investigation, we have developed a
diverse set of methods to determine “known” metabolites with the use of standards or
confirmation through fragmentation. Yet, it is after the detection where a lack of protocols
for interpretation exists. Following the integration of ion intensities, statisticians, both
advanced and novice, are presented with the challenge of authenticating significant
changes through various statistical routes and biochemists, both advanced and novice,
with the interpretation of metabolic changes and how those relate back to the
experimental perturbation. Both scenarios offer unique challenges, and as a field, we are
still laboring over which methods offer the most conclusive results. These are the current
state of affairs in the field of understanding known metabolites, a.k.a. metabolites from
your typical biochemistry textbook. When we move past our comfort zone and begin
looking into the metabolic space of “unknown” compounds, the field is presented with a
laundry list of challenges that complicate our ability to confirm molecular structure.

6
Identification of the full de novo structure is referred to as structure elucidation,
which includes the confirmation of molecular connectivity with correct stereochemical
assignments. The development of detailed bioanalytical approaches has become an
essential component for the advancement of novel structure elucidation, and specifically
relevant within the fields of metabolomics and pharmacology, including both discovery
and synthesis processing phases. Novel structure elucidation can be easily performed
using X-ray crystallography, given that you have a pure sample in the form of a crystal
structure. Since this is generally uncommon, additional analytical techniques have been
developed to further characterize the unknown biological space. Spectroscopic methods,
such as NMR, infrared, and UV-Vis, are staples within this field. NMR technologies
include the use of one- (1D) and two-dimensional (2D) analysis to determine bond
connectivity and atomic spatial resolution, which makes this technology a critical
component for compound characterization. Yet, this technique requires a relatively large
quantity of clean sample to obtain chemical shift information from nuclei other than
protons due to the low abundance of naturally occurring isotopes and complications
related to the nuclei’s spin quantum number.
Advances across mass spectrometry platforms have propelled mass-based
analysis of novel structures to the forefront of this field. The ability to obtain elemental
composition information from the parent mass and partial structure information from mass
fragments provides a unique opportunity to use a highly sensitive instrument that can
resolve several compounds from a complex mixture in a single sample. Platforms for this
analysis include time-of-flight, triple quadrupole, ion trap, and Fourier transform
instruments. Each of these instruments have unique figures of merit associated with their
mass accuracy, resolution, dynamic range, sensitivity, and robustness, which all
accompany their specific utility. Additionally, several forms of soft and ionization
techniques can be used to enhance ion detection. To accompany resolution of molecules
in the mass domain, chromatographic techniques, primarily liquid and gas, can assist in
feature identification and detection be resolving compounds in the time domain.
Currently, the field of discovery-based small molecule identification has an
abundance of analytical tools available at their disposal. The next major hurdle is the

7
handling of mass spectral data; including the development of mass spectral databases
and data interpretation (both ion intensities and spectral features), advancement of both
hardware and software packages, and development of strict protocols for the confirmation
of novel small molecules.

8
CHAPTER 1: NEUROMETABOLOMICS PROFILE CLASSIFICATION OF
SYRIAN HAMSTERS AND B6 MICE AS A MODEL OF STRESS
RESILIENCE

9
PREFACE
With neurometabolomics in its infancy, the first chapter of this dissertation offers
several key advancements to the field. First, the use of a social defeat model for hamsters
has been established, but this technique was less commonly used on mice. These
phenotypic, behavioral studies are important for the analysis of acute/ chronic stress
leading to depression, or even post-traumatic stress disorders. While this model presents
its own challenges, the following publication is the first record of neuronal metabolomics
used to study stress resistance from sub-milligram quantities of brain tissue. This study
involved the extraction of whole brains that were strategically sliced to expose four
different brain regions; medial prefrontal cortex, hippocampus, nuclear accumbens, and
basolateral amygdala from both Syrian hamsters and B6 mice. Following an aqueous
extraction technique, small molecule analysis was performed using an untargeted
metabolomics method that facilitated the identification of hundreds of identified
metabolites, thousands of unidentified spectral features, and the elucidation of several
novel metabolic targets.
A total of 54 hamsters and 70 mice were used to produce a total of 166 and 121
samples, respectively from the above-mentioned brain regions. Initially, the left and right
brain regions were tested separately, and confirmed to have no statistical differences in
metabolite levels. This lead to the collection of both the left and right side to produce a
sample mass ~300 - 400 ng. Samples were extracted in a cold-room (5 °C) using an
acidic acetonitrile solution with a previous established protocol. Samples were injected at
10 µL aliquots and chromatographically separated prior to analyte detection. Liquid
chromatography was performed in reverse phase with step-wise increments of methanol
and formic acid in water. Mass analysis was conducted on an Exactive Plus Orbitrap and
metabolite integration was completed using the MAVEN software package.
Statistical analysis, including ANOVA and PLS-DA, VIP scores, were used to
reduce the number of unidentified features to a consolidated list that was subject to a
database search using the Human Metabolome Database (HMDB). These statistical
approaches are commonly used in metabolomics research and provided sufficient feature

10
reduction. Manual investigation of HMDB metabolite hits resulted in novel experimental
targets for future studies. Although targets were ambiguously identified, we are still left
with thousands of unidentified features that were statistically significant to our stress
model, but whose molecular formula did not equate to a known, biologically active
compound.
The discovery-based approach of this study hallmarks a first-pass analysis of
metabolic profiles related to stress resistance. The known and unknown small molecules
identified in this study will be used to design future experimental endeavors in the pursuit
of diagnostic biomarkers. In parallel studies, we can continue to identify the small
molecule targets and metabolic pathways that have a strong correlation to the reduction
of long-term effects from trauma. These future analyses could lead to the discovery of
novel drug targets used in the diagnosis, treatment and/or prevention of depression and
acute/chronic trauma-related stress, such as post-traumatic stress disorder.

11
A version of this chapter was originally published by Dulka and Bourdon, et al.:
Reproduced with permission from Dulka, B. N.†; Bourdon, A. K. †; Clinard, C. T.; Muvvala,
M. B. K.; Campagna, S. R.; Cooper, M. A., Metabolomics reveals distinct neurochemical
profiles associated with stress resilience. Neurobiology of Stress 2017, 7, 103-112;
https://doi.org/10.1016/j.ynstr.2017.08.001. †Authors contributed equally.
Contributions:
This chapter contains only minor adaptations from the originally submitted manuscript.
BND, CTC, and MBM performed acute social defeat experiments and behavioral/
phenotype evaluations of subjects. AKB performed extractions and metabolomics studies
using UPLC-HRMS, and sequential statistics on results. AKB and BND equally
contributed to data analysis and interpretation, and AKB, BND, SRC, and MAC wrote the
manuscript.

12
1.1 ABSTRACT
Acute social defeat represents a naturalistic form of conditioned fear and is an
excellent model in which to investigate the biological basis of stress resilience. While
there is growing interest in identifying biomarkers of stress resilience, until recently, it has
not been feasible to associate levels of large numbers of neurochemicals and metabolites
to stress-related phenotypes. The objective of the present study was to use an untargeted
metabolomics approach to identify known and unknown neurochemicals in select brain
regions that distinguish susceptible and resistant individuals in two rodent models of acute
social defeat. In the first experiment, male mice were first phenotyped as resistant or
susceptible. Then, mice were subjected to acute social defeat, and tissues were
immediately collected from the ventral medial prefrontal cortex (vmPFC),
basolateral/central amygdala (BLA/CeA), nucleus accumbens (NAc), and dorsal
hippocampus (dHPC). Ultra-high performance liquid chromatography coupled with high
resolution mass spectrometry (UPLC-HRMS) was used for the detection of water-soluble
neurochemicals. In the second experiment, male Syrian hamsters were paired in daily
agonistic encounters for 2 weeks, during which they formed stable dominant-subordinate
relationships. Then, 24 hours after the last dominance encounter, animals were exposed
to acute social defeat stress. Immediately after social defeat, tissue was collected from
the vmPFC, BLA/CeA, NAc, and dHPC for analysis using UPLC-HRMS. Although no
single biomarker characterized stress-related phenotypes in both species, commonalities
were found. For instance, in both model systems, animals resistant to social defeat stress
also show increased concentration of molecules to protect against oxidative stress in the
NAc and vmPFC. Additionally, in both mice and hamsters, unidentified spectral features
were preliminarily annotated as potential targets for future experiments. Overall, these
findings suggest that a metabolomics approach can identify functional groups of
neurochemicals that may serve as novel targets for the diagnosis, treatment, or
prevention of stress-related mental illness.

13
1.2 INTRODUCTION
Stress is a contributing factor in the etiology of several psychiatric conditions
including depression1, panic disorder2, and post-traumatic stress disorder (PTSD)3.
Aggression is a particularly salient form of trauma, and people exposed to interpersonal
violence are at a greater risk for developing PTSD than those exposed to non-personal
trauma4. However, many individuals who experience stressful events do not develop a
stress-related psychopathology, and there is a great deal of interest in what makes certain
individuals resilient. Stress resilience refers to the ability of individuals to maintain normal
levels of psychological, biological, and social functioning following a traumatic event.
Importantly, resilience is an active process and not simply the absence of a pathological
response to stress5-7.
Animal models of social defeat stress have been put forth as high validity models
of stress-related mental illness and, interestingly, individuals exhibit pronounced
variability to the effects of social defeat8. Genetically identical, inbred mice display a great
deal of variability in social avoidance following 10 days of chronic social defeat9-10 and
two days of repeated social defeat11-12. Susceptible mice avoid novel animals in a social
interaction test following social defeat stress, whereas resilient (or resistant) mice
investigate novel animals following social defeat stress in a pattern similar to non-
defeated controls13. In the chronic social defeat model, brain-derived neurotrophic factor
(BDNF) signaling in a neural circuit involving the ventral tegmental area and nucleus
accumbens (NAc) is critical for the expression of defeat-induced social avoidance in
susceptible animals10. The ventromedial prefrontal cortex (vmPFC) also provides top-
down inhibitory control of the NAc and amygdala, which promotes a resistant phenotype
after social defeat stress 14. In a mouse model using a single day of acute social defeat,
BDNF signaling in the basolateral amygdala (BLA) is necessary for acquisition of defeat-
induced social avoidance15. The development of the susceptible and resistant
phenotypes is largely unknown, although the epigenetic changes that underlie stress
vulnerability may be linked to environmental influences during pre-natal and post-natal
development, including the establishment of early dominance hierarchies16-17.
14
Syrian hamsters are aggressive and territorial animals that exhibit a striking
change in behavior following social defeat stress. Following exposure to a single bout of
social defeat, male hamsters fail to defend their home territory and instead exhibit
submissive and defensive behavior toward novel non-aggressive intruders for up to one
month18. This stress-induced change in agonistic behavior is called the conditioned defeat
response and is similar to the defeat-induced social avoidance shown by rats and mice19-
20. The conditioned defeat response in hamsters is an ethologically relevant form of
conditioned fear and is regulated by many of the same brain regions, neural circuits, and
neurochemicals as conditioned fear. Neurotransmission in the central amygdala (CeA) is
critical for the expression of the conditioned defeat response21. In the BLA, NMDA
receptors, BDNF, and cAMP response element binding (CREB) protein are each
necessary for the acquisition of the conditioned defeat response22-24. Neurotransmission
in several other brain regions is known to modulate the conditioned defeat response, such
as the NAc, ventral hippocampus (vHPC), and vmPFC25-27. A great deal of variation exists
in the amount of submissive and defensive behavior exhibited by hamsters following
social defeat. To investigate vulnerability to the conditioned defeat response, we allowed
dyads of hamsters to establish and maintain dominance relationships and then tested
dominant and subordinate animals for their conditioned defeat response. We found that
dominant hamsters show a reduced conditioned defeat response and increased c-Fos
immunoreactivity in the vmPFC compared to subordinate and control animals28-29.
Furthermore, pharmacological blockade of neural activity in the vmPFC reinstated the
conditioned defeat response in dominant hamsters but did not alter conditioned defeat in
subordinates or controls30. While a great deal is known about the brain regions and neural
circuitry that control the conditioned defeat response, relatively little is known about the
neurochemistry within these structures.
There is growing interest in identifying neurochemical biomarkers to aid in the
diagnosis, risk assessment, and prevention of stress-related mental illnesses such as
PTSD31-33. Additionally, neurochemicals identified after a stressor can serve as
mechanistic biomarkers, and such biomarkers can be used to improve the treatment of
stress-related psychopathologies. While attempts to identify biomarkers continue to be a

15
major focus of biomedical research, at present biomarkers have not made it into clinical
application for mental illness. Part of the difficulty is that individual neurochemicals are
unlikely to correlate with diagnosis, risk, or treatment response for complex forms of
stress-related psychopathology. Taking a multifactorial approach is an essential first step
toward developing biomarkers for mental illness. Metabolomics is a quantitative analysis
of small molecules present in biological systems and has been increasingly used for the
discovery of biomarkers34-36. The use of untargeted metabolomics allows the user to take
a discovery-based approach, which initially results in a data generating experiment. After
relative quantitation of known metabolites based on pre-determined retention times and
accurate mass (< 5 ppm), the user is still left with thousands of unidentified spectral
features (USFs) that potentially relate to a novel compound.
This study focused on characterizing the neurochemical profiles in select brain
regions that distinguish animals that are susceptible and resistant to the effects of acute
social defeat stress. In both mice and hamster models, we expected that susceptible and
resistant animals would differentially express specific neurochemical metabolites in brain
regions known to modulate defeat-induced changes in behavior. Further, a comparative
approach is expected to aid in the discovery of biomarkers by identifying similar classes
of compounds associated with stress susceptibility and resilience in both animal models.
1.3 METHODS
1.3.1 Animals and Housing Conditions
Male C57BL/6 mice (7-8 weeks old, 20-27 g) were used as subjects (Envigo,
Indianapolis, IN). Mice were maintained on a 12:12 light/dark cycle with ad libitum access
to food and water in a temperature-controlled room (21 ± 2 °C). Animals were housed in
polycarbonate cages (18.4 cm x 29.2 cm x 12.7 cm) with corncob bedding, cotton nesting
materials, and wire mesh tops. All behavioral procedures were performed during the first
three hours of the dark phase of their cycle. Subjects were handled several times one
week prior to social defeat to habituate them to the stress of human handling.

16
Male Syrian hamsters (3-4 months old, 120-180 g) were obtained from our
breeding colony that is derived from animals purchased from Charles River Laboratories
(Wilmington, MA). All animals were housed in polycarbonate cages (12 cm × 27 cm × 16
cm) with corncob bedding, cotton nesting materials, and wire mesh tops. Food and water
were available ad libitum. Cages were not changed for one week prior to dominant–
subordinate encounters to allow individuals to scent mark their territory. Subjects were
handled several times one week prior to dominant–subordinate encounters to habituate
them to the stress of human handling. Animals were housed in a temperature-controlled
colony room (21 ± 2 °C) and kept on a 14:10 h light:dark cycle to facilitate reproductive
maturation. All behavioral protocols were performed during the first 3 h of the dark phase
of their cycle. Procedures in both mice and hamsters were approved by the University of
Tennessee Institutional Animal Care and Use Committee and are in accordance with the
National Institutes of Health Guide for the Care and Use of Laboratory Animals.
1.3.2 Experimental Procedures
Social Defeat Stress
Mice were subjected to acute social defeat stress using a resident-intruder model
adapted from the social defeat literature in Syrian hamsters18, 37-38. During social defeat
stress, subjects were exposed to adult male Hsd:ICR (CD1) mice that were individually
housed to maintain aggression (35-40 g, Evigo). The CD1 mice were prescreened for
high levels of aggression, and animals exhibited attack latencies of less than 30 sec.
Social defeat stress consisted of three, 2-min aggressive encounters in the home cage of
a novel CD1 resident aggressor mouse with 2-min inter-trial intervals in the subjects’
home cage, for a total duration of 10-min. These defeats were evaluated by an observer
in real time to verify that each subject received multiple attacks from each CD1 mouse.
An attack was defined as a rapid lunge followed by a bite or bite attempt. To correct for
potential variation in the amount of aggression subjects received, the first defeat episode
did not begin until the subject submitted to an attack from the resident aggressor. Non-
defeated control animals were exposed to the empty home cage of three separate CD1
mice for 2-min with 2-min inter-trial intervals in their home cage.

17
In hamsters, social defeat stress consisted of subjects being placed in the home
cages of three separate hamsters that were larger, older animals (>6 months, >190 g).
These larger animals were called resident aggressors, and they were individually housed
to maximize territorial aggression. Resident aggressors were also prescreened to ensure
that they reliably attacked and defeated intruders. Subjects were exposed to three
resident aggressors in consecutive 5-min aggressive encounters, with 5-min inter-trial
intervals in their own home cage, for a total duration of 25-min. Similarly to mice, the first
defeat episode did not begin until the subject submitted to an attack from the resident
aggressor. Subjects submitted immediately in the second and third defeat episodes. Non-
defeated control animals were placed in the empty home cages of three separate resident
aggressors for three 5-min exposures to control for the novel environment and olfactory
cues associated with social defeat stress. Social defeats were digitally recorded for
behavioral analysis. The frequency of attacks by the resident aggressor was recorded
and scored by a blind observer. Whether or not subjects fought back against the resident
aggressor during the first social defeat episode was also recorded.
In both mice and hamsters, aggressive encounters were carefully monitored for
wounding and animals that received minor scratches were treated with an antiseptic
solution. No animal received a wound that resulted in signs of pain or distress and none
of the animals were removed from the study because of wounding.
Social Interaction Testing
Social interaction testing was performed in mice to identify animals that were
susceptible and resistant to the effects of social defeat stress. Testing was performed in
an open field arena (43.2 cm x 43.2 cm x 43.2 cm) under dim light conditions. Social
interaction testing was modeled after conditioned defeat testing in Syrian hamsters18, 37,
as well as social interaction testing following chronic social defeat in mice13. Social
interaction testing consisted of two 5-min trials: CD1 mouse target absent and CD1
mouse target present. During the target absent trial, subjects were habituated to an empty
perforated plastic box that was positioned against one of the four walls. The target present
trial occurred immediately following the target absent trial, and a novel CD1 mouse was

18
placed inside the perforated plastic box. The perforated box allowed for sensory
information, but no physical contact. An observer blind to experimental conditions
quantified the duration of time the subject spent in the interaction zone. The interaction
zone was defined as a 3 cm area surrounding the plastic box. Considerable variation
exists in behavioral responses to social defeat in C57 mice, and an interaction ratio has
been used to categorize mice as either susceptible or resistant to social defeat9, 13. The
interaction ratio is calculated as (Time investigating target present) / (Time investigating
target absent). Defeated mice with interaction ratios of less than 1.0 are defined as
susceptible and defeated mice with interaction ratios equal to or greater than 1.0 are
defined as resistant to social defeat.
Dominant-Subordinate Relationships
Hamsters were not exposed to social interaction testing because it was not
necessary to phenotype animals following social defeat stress. Rather, hamsters were
given the opportunity to establish dominance relationships, and we have previously
shown that over time dominant animals become resistant to social defeat stress whereas
subordinates become susceptible29. To establish social status, subjects were weight-
matched into resident-intruder dyads and paired in daily social encounters for 14 days as
described previously29. Subjects were randomly assigned as a resident or intruder, and
all social encounters occurred in the resident’s home cage. Encounters were 10-min in
duration prior to the establishment of dominance relationships, while all subsequent
encounters were 5-min. Dominant and subordinate animals were identified by the
direction of agonistic behavior within each dyad. If a dyad did not form a dominance
relationship after 5 encounters, the animals were excluded from statistical analysis.
Experimental Design
In Experiment 1, 62 mice were exposed to social defeat stress and 12 mice were
non-defeated controls. Twenty-four hours later, mice received social interaction testing
and were identified as susceptible (N = 51) or resistant (N = 11). Mice were tested until
the resistant group reached sufficient statistical power, although brain tissue was
collected from only the first 11 mice identified as susceptible. It is noteworthy that the

19
percentage of resistant mice observed in this study (about 18%) is less than what has
been reported elsewhere in chronic social defeat models (about 30%)9. To investigate
defeat-induced changes in neurochemical activity, mice received a second bout of social
defeat stress or empty cage exposure one week following their social interaction test.
In Experiment 2, 30 hamsters were paired in daily dominant-subordinate
encounters. Three dyads were excluded from analysis because they failed to establish a
stable dominance relationship. Twenty-four hours after the final dominance encounter, 12
dominants and 12 subordinates received social defeat stress. Fourteen control animals
did not receive dominance encounters and were exposed to empty cages instead of social
defeat.
Tissue Collection
Immediately following the final social defeat encounter, animals were sacrificed
with isoflurane and rapidly decapitated. A brain matrix was used to generate 1 mm thick
brain slices that were rapidly frozen on glass slides. Tissue punches (1 mm diameter)
were collected bilaterally from regions containing the BLA/CeA, dorsal hippocampus
(dHPC), NAc, and vmPFC. Tissue punches were flash frozen in liquid nitrogen and stored
at -80 ºC until metabolite extraction. In some brain regions, tissue was not assayed
because of inaccurate punches. In mice, 3 samples were lost from the BLA/CeA, 4
samples were lost from the dHPC, 2 samples were lost from the vmPFC, and 1 sample
was lost from the NAc. In hamsters, due to inaccurate punches, 2 samples were lost from
the BLA/CeA, 8 samples were lost from the dHPC, 7 samples were lost from the vmPFC,
and 6 samples were lost from the NAc.
1.3.3 Untargeted Metabolomics using UPLC-HRMS
Analysis by UPLC-HRMS was completed in accordance with previously published
protocols39. Refer to appendix for additional details on the extraction protocol,
chromatography specifications, and mass spectrometry (MS) parameters. The
Metabolomic Analysis and Visualization Engine (MAVEN) software package, an open
source program that reduces the complexity of metabolomics analysis, was used to select
metabolites from a pre-existing list of over 270 compounds40. Henceforth, identified

20
metabolites are referred to as known metabolites, which were previously validated for
exact mass and retention time using chemical standards from Fisher Scientific or
preexisting chromatography39. MAVEN enables the user to directly extract all spectral
features from a single sample. Any spectral feature that was not confirmed as a known
metabolite will henceforth be referred to as an unidentified spectral feature (USF).
Metabolite ion counts were normalized using the ratios of intensities among metabolites
within a sample to remove errors due to sampling and instrumental variability using a
modification of known methods41-42. This internal ratio normalization (IRN; additional
information in appendix) technique provides normalized fold changes for the selected
array comparisons, as well as p-values from complimentary univariate analysis
techniques, one-way ANOVA with Tukey post-hocs and two-tailed Student’s t-tests.
These fold changes were then used to generate heatmaps of known metabolites (for mice
see Figure 1-1, for hamsters see Figure 1-2).
Additionally, unnormalized ion intensities of known and unknown metabolites were
also analyzed using partial least squares discriminant analyses (PLS-DA). PLS-DA is a
statistical method, similar to principal components regression, which finds a linear
regression model by projecting predicated variables and the observed variables into a
new space. From these PLS-DA analyses, variable importance in projection (VIP) score
plots can be extrapolated. The VIP score is a common feature selection tool that is a
probability function calculated by totaling the weighted sum of squares of the loading
vectors43, and this tool enables a matrix reduction of selected metabolites for further
investigation. A metabolite with a VIP score greater than or equal to 1.0 was considered
a variable that highly contributed to the observed separation within the PLS-DA plot.
Further description of the extraction protocol, the UPLC-HRMS procedures, and the data
processing methods can be found in the appendix.
1.3.4 Statistical Analysis
Data were analyzed using one-way ANOVAs followed by Tukey’s post-hocs,
Student’s t-tests, and chi-square tests, where appropriate. Statistical significance was set
at α = 0.05. Data are reported as mean ± SEM, except where noted. Statistical reduction

21
Figure 1.1 Heatmap of all identified metabolites in mice from 4 brain regions
Array comparisons are labeled at the top of the figure; R/C: resistant/ control, S/C:
susceptible/ control, and R/S: resistant/ susceptible.
Saturated colors are displayed on a log-2 scale. A Student’s T-test was used to produce
the p-values using a two-tail comparison of the arrays. Values were converted to symbols
and overlaid onto the figure.

22
Figure 1.1 Continued

23
Figure 1.2 Heatmap of all identified metabolites in hamsters from 4 brain regions
Array comparisons are labeled at the top of the figure; D/C: dominant/ control, S/C:
subordinate/ control, and D/S: dominant/ subordinate.
Saturated colors are displayed on a log 2 scale. A Student’s t-test was used to produce
the p-values using a two-tail comparison of the arrays. Values were converted to symbols
and overlaid onto the figure.

24
Figure 1.2 Continued

25
of USFs was accomplished using Student’s t-tests (p ≤ 0.05) and VIP score (≥ 1.0), and
individual metabolites of interest were confirmed to be significant through one-way
ANOVA analysis and Tukey’s post hoc tests.
1.4 RESULTS
1.4.1 Behavioral Data
To characterize mice as susceptible or resistant to the effects of acute social defeat
stress, mice were evaluated in a social interaction test. One-way ANOVA analysis
revealed significant differences in interaction ratios between non-defeated controls,
susceptible, and resistant mice (F(2, 30) = 31.11, p < 0.0001). Tukey’s post-hoc
comparisons demonstrated that susceptible mice had a significantly lower social
interaction ratio compared with resistant mice and controls (p < 0.001 and p < 0.001,
respectively), whereas resistant mice and controls did not significantly differ in their social
interaction ratios (p = 0.70) (Figure 1-3). A subset of the defeats were quantified, and
there were no significant differences between susceptible (8.81 ± 0.74) and resistant
(8.22 ± 0.40) mice in the number of attacks received per 2-min e (t = 0.38, df = 13, p =
0.71). No mouse, resistant or susceptible, fought back against the resident aggressor
during any of the defeat episodes, and all attacks occurred within the first 30-sec.
In hamsters, the daily dyadic encounters were videotaped and monitored in real time to
determine the direction of aggression. On average, dominance relationships were
established on day 1.07 (SD = 0.26). Dominant animals continued to direct aggression
towards the subordinate throughout the two-week period. Two pairs were excluded
because they did not form a dominance relationship after 5 days of dyadic encounters,
and one pair was excluded because of a switch in dominance status on day 6. The
number of attacks received during social defeat stress, as well as the duration of fighting
back by subjects during the first defeat were scored by an observer blind to treatment
conditions. There were no significant differences between dominant (5.94 ± 0.86) and
subordinate (5.14 ± 0.69) hamsters in the number of attacks received (t = 0.91, df = 70,

26
Figure 1.3 Results of social interaction test for mice
Mice were tested in a neutral arena for social avoidance 24 hours after their first social
defeat experience. We segregated defeated mice into two populations, resistant and
susceptible, based on their social interaction ratios. Mice with a social interaction ratio of
1 or greater were characterized as resistant, while mice with a social interaction ration of
less than 1 were characterized as susceptible. All non-defeated control mice always had
a social interaction ration greater than 1. One-way ANOVA analysis revealed significant
differences in interaction ratios between non-defeated controls, susceptible, and resistant
mice (F(2, 30) = 31.11, p < 0.0001). Tukey’s post-hoc comparisons demonstrated that
susceptible mice had a significantly lower social interaction ratio compared with resistant
mice and controls (p < 0.001 and p < 0.001, respectively), whereas resistant mice and
controls did not differ in their social interaction ratios (p = 0.70).

27
p = 0.37). Dominant hamsters (8/12) also fought back significantly more often than
subordinates (0/12) (χ2 = 12.00, df = 1, p = 0.0005).
1.4.2 Metabolomics Data
PLS-DA Reveals Distinct Metabolic Profiles
Figures 1.4 and 1.5 represent the PLS-DA plots generated from the four select
brain regions of both mice and hamsters, respectively. The shaded ellipses represent the
95% confidence intervals for each treatment condition. Significant separation of
metabolites was achieved for both mice and hamsters, which suggests that the
phenotypes exhibit a significantly different metabolic pattern of known and unknown
metabolites in each brain region. Furthermore, from the VIP scores derived from the PLS-
DA analyses, we extracted variables that differentiated susceptible and resistant mice or
subordinate and dominant hamsters. Each brain region exhibited a unique set of relevant
(VIP ≥ 1.0) metabolites (Mice; BLA/CeA: 29, dHPC: 25, vmPFC: 33, NAc: 33 and
Hamster; BLA/CeA: 48, dHPC: 39, vmPFC: 29, NAc: 29). VIP score plots are available
for both mice (Figure 1-6) and hamsters (Figure 1-7).
Identifying Representative Known Metabolites
Representative metabolites were chosen based on the following parameters: p ≤
0.05 and VIP ≥ 1.0. For mice, one-way ANOVA analyses revealed several significant
neurochemical metabolites that differentiated resistant and susceptible animals. In the
dHPC, significant differences were observed in the relative abundance of GABA (F(2, 25 =
4.360, p = 0.024); specifically, Tukey’s post hoc comparisons demonstrated that
susceptible mice had elevated levels of GABA compared to resistant mice (Figure 1.8A;
p = 0.018). In the NAc, significant differences were observed in the relative abundance of
cystine (F(2, 30) = 9.050, p = 0.001), and resistant mice had significantly higher levels
compared to subordinates (Figure 1.8B; p = 0.001). In the vmPFC, significant differences
were seen in the relative abundance of IMP (inosinic acid) (F(2, 28 = 3.487, p = 0.044) and
AMP (F(2, 28 = 3.334, p = 0.050). For both IMP and AMP, resistant mice had significantly
higher levels compared to subordinates (Figure 1.8C; p = 0.037 and Figure 1.8D; p =

28
Figure 1.4 Metabolite patterns of mice from untargeted metabolomic approach
Qualitative profiling for control (yellow), resistant (red), and susceptible (blue) mice was
conducted with PLS-DA. PLS component 1 (X-axis) and PLS component 2 (Y-axis)
represent the highest two X-scores of dimensions 1 and 2 for matrix X of metabolite ion
abundances, respectively. Ellipses express a 95% confidence interval. Plots exhibit
significant separation and clustering of samples across all four brain regions. A) BLA/CeA,
B) dHPC, C) NAc, D) vmPFC.

29
Figure 1.5 Metabolite patterns of hamsters from untargeted metabolomic approach
Qualitative profiling for control (yellow), dominant (red), and subordinate
(blue) hamsters was conducted with PLS-DA. PLS component 1 (X-axis) and PLS
component 2 (Y-axis) represent the highest two X-scores of dimensions 1 and 2 for
matrix X of metabolite ion abundances, respectively. Ellipses express a 95% confidence
interval. Plots exhibit significant separation and clustering of samples across all four brain
regions. A) BLA/CeA, B) dHPC, C) NAc, D) vmPFC.

30
Figure 1.6 VIP score plot from metabolomics of mice
VIP plots of identified metabolites in mice with a VIP score ≥ 1.0. Labels are provided to
explain the total number of metabolites within three ranges; VIP ≥ 1.0, 1.0 < VIP ≥ 0.8,
and VIP < 0.8. These plots are derived from PLS-DA multivariate analysis. A) BLA/CeA,
B) dHPC, C) NAc, D) vmPFC.

31
Figure 1.7 VIP score plot from metabolomics of hamsters
VIP plots of identified metabolites in hamsters with a VIP score ≥ 1.0. Labels are provided
to explain the total number of metabolites within three ranges; VIP ≥ 1.0, 1.0 < VIP ≥ 0.8,
and VIP < 0.8. These plots are derived from PLS-DA multivariate analysis. A) BLA/CeA,
B) dHPC, C) NAc, D) vmPFC.

32
0.042, respectively). Surprisingly, no significant differences were observed in the
BLA/CeA of mice.
In hamsters, one-way ANOVA analyses also revealed changes in neurochemical
metabolite expression. In the BLA/CeA, serine differed significantly across conditions (F(2,
33 = 3.542, p = 0.040); specifically, dominants had significantly lower levels compared to
controls (Figure 1.9A; p = 0.034). In the NAc of hamsters, a statistical trend was observed
in the relative abundance of fumarate (F(2, 30 = 2.837, p = 0.074; VIP = 0.831), and
dominant animals tended to have a higher expression compared to subordinates (Figure
1.9B; p = 0.063). In the vmPFC, tyrosine differed significantly across animals (F(2, 30 =
9.096, p = 0.001), and dominant hamsters had a higher relative abundance compared to
controls and subordinates (Figure 1.9C; p = 0.001 and p = 0.018, respectively). Also in
the vmPFC, significant differences were observed in the expression of methionine (F(2, 30
= 8.017, p = 0.002), specifically, dominants had a higher relative abundance compared
to controls and subordinates (Figure 1.9D; p = 0.001 and p = 0.023, respectively).
However, in the dHPC, no significant differences were observed across conditions.
Identifying Representative Unknown Metabolites
The discovery of thousands of USFs reveals the true complexity of mammalian
metabolism. In the BLA/CeA, dHPC, NAc, and vmPFC of hamsters, the total USFs
identified were 6981, 5622, 9565, and 7420, respectively, and 2383, 2457, 1987, and
2098 in mice (Table 1-1). Following statistical reduction of USFs, we identified a total of
27, 28, 33, and 28 features in hamsters and 27, 27, 30, and 29 features in mice from the
BLA/CeA, dHPC, NAc, and vmPFC, respectively. The compilation of USFs represents a
list of unique parent masses not found in our list of known metabolites.
Regarding unknown metabolites, only USFs that revealed significant changes
between dominant and subordinate hamsters, or resistant and susceptible mice, were
further investigated using the Human Metabolome Database (HMDB)44 to produce a list
of potential compound matches. Significance was established through the following
parameters: Student t-test: p ≤ 0.05, VIP ≥ 1.0, and the mean decrease in accuracy (MDA)

33
Figure 1.8 Effects of social defeat on the relative abundance of neurochemical
metabolites in mice
A) In the dHPC, susceptible mice had a greater relative abundance of GABA. B) In the
NAc, resistant mice had significantly higher levels of cystine. C) In the vmPFC, resistant
mice had higher levels of inosinic acid (IMP). D) Finally, also in the vmPFC, resistant mice
had a greater relative abundance of AMP. Data are shown as mean ± SEM. An asterisk
indicates a significant difference between groups as determined by a Tukey’s post hoc
test (*p ≤ 0.05).

34
Figure 1.9 Effects of social defeat and dominance status on the relative abundance
of neurochemical metabolites in hamsters
A) In the BLA/CeA, dominant hamsters had significantly lower levels of serine compared
to controls. B) In the NAc, dominant hamsters tended to have higher levels of fumarate.
C) In the vmPFC, dominant hamsters had a greater relative abundance of tyrosine
compared to controls and subordinates. D) Finally, also in the vmPFC, dominant
hamsters had significantly higher levels of methionine compared to controls and
subordinates. Data are shown as mean ± SEM. An asterisk indicates a significant
difference between groups as determined by a Tukey’s post hoc test (*p ≤ 0.05, #p =
0.074).

35
Table 1.1 Total number of USFs
Total number of unidentified spectral features (USFs) detected using UPLC-HRMS for
untargeted metabolomics.
Mic
e
Brain Region
USFs Significant*
USFs
Significant* USFs
(Res v Ctrl)
Significant* USFs
(Sus v Ctrl)
Significant* USFs
(Res v Sus)
Reduced List of USFs
BLA/CeA 2383 256 141 105 64 27
dHPC 2457 165 35 24 132 28
NAc 1987 586 301 63 471 33
vmPFC 2098 280 198 48 140 28
Ha
ms
ter
Brain Region
USFs Significant*
USFs
Significant* USFs
(Res v Ctrl)
Significant* USFs
(Sus v Ctrl)
Significant* USFs
(Dom v Sub)
Reduced List of USFs
BLA/CeA 6981 281 147 72 111 27
dHPC 5622 541 235 285 114 27
NAc 9565 421 101 195 194 30
vmPFC 7420 334 86 203 104 29
*Significant features refer to p-value ≤ 0.05 (in a Student’s t-test), variable importance in
projection (VIP) ≥ 1.0, and the mean decrease in accuracy (MDA) = top 10%.

36
(top 10%). Since each parent mass could exist as an adduct (i.e. [M+Na-H]), the number
of matches were anywhere from 0 to 50. Compound matches were screened against
existing literature to determine biologically relevant matches.
The following features were selected from both mice and hamsters (Table 1-2).
Two features from the BLA/CeA, m/z 279.0458 (F(2, 26 = 4.919, p = 0.015) and m/z
297.0563 (F(2, 26 = 5.2, p = 0.013), were significantly reduced in resistant mice compared
to controls (p = 0.036 and p = 0.043, respectively) and susceptible mice (p = 0.027 and p
= 0.017, respectively). These features are believed to be the same compound but
detected as separate adducts. In the NAc, the m/z 274.1045 feature (F(2, 30 = 242.613, p
< 0.001) revealed a significant decrease in susceptible mice compared to controls (p <
0.001) and resistant mice (p < 0.001), while resistant mice were also significantly
increased compared to controls (p < 0.001).
In the BLA/CeA of hamsters, the m/z 316.1012 feature (F(2, 33 = 11.073, p < 0.001)
was significantly increased in subordinates compared to controls (p = 0.001) and
dominants (p < 0.001). Also, in the BLA/CeA, the m/z 289.0903 feature (F(2, 33 = 3.434, p
= 0.044) was significantly decreased in subordinates compared to dominants (p = 0.044).
Two features; m/z 320.0619 (F(2, 29 = 3.163, p = 0.057) and m/z 342.0441 (F(2, 29 = 5.402,
p = 0.010) in the NAc were selected as potential adduct masses, which means that they
are derived from the same compound. These features showed a decreased concentration
in subordinate hamsters compared to dominant hamsters (p = 0.050 and p = 0.010,
respectively).

37
Table 1.2 USFs selected for discussion
Statistical reduction using Student’s t-tests identified several USFs with Human Metabolome Database (HMDB) matches
44, which were then confirmed to be significant through one-way ANOVA analysis and Tukey’s post-hoc tests.
Mic
e
Brain Region USF parent mass (Da) Retention time (min) Adduct HMDB match
BLA/CeA 279.0458
11.5 [M-H]
N-acetylserotonin sulfate 297.0563 [M-H2O-H]
dHPC No statistically and biologically active matches
vmPFC No statistically and biologically active matches
NAc 274.1045 4.7 [M-H] Norophthalmic acid
Ha
ms
ter
Brain Region USF parent mass (Da) Retention time (min) Adduct HMDB match
BLA/CeA 316.1012 11.6 [M+TFA-H] L-acetylcarnitine
289.0903 11.6 [M+Na-2H] N-acetylcarnosine
dHPC No statistically and biologically active matches
vmPFC No statistically and biologically active matches
NAc 320.0619
15.0 [M-H]
beta-citryl-L-glutamic acid 342.0441 [M+Na-2H]

38
Table 1.2 Continued
ANOVA Tukey Post-hoc Student T-test
Mic
e
Brain Region
df1 df2 F-test p-value Res/Ctrl Sus/Ctrl Res/Sus Res/Ctrl Sus/Ctrl Res/Sus
BLA/CeA 2 26 4.919 0.015 0.036 0.998 0.027 0.012 0.957 0.011
2 26 5.200 0.013 0.043 0.945 0.017 0.127 0.385 0.013
dHPC No statistically and biologically active matches
vmPFC No statistically and biologically active matches
NAc 2 30 242.613 0.000 0.000 0.000 0.000 0.049 0.172 0.006
Ha
ms
ter
Brain Region
df1 df2 F-test p-value Dom/Ctrl Sub/Ctrl Dom/Sub Dom/Ctrl Sub/Ctrl Dom/Sub
BLA/CeA 2 33 11.073 0.000 0.928 0.001 0.000 0.984 0.009 0.005
2 33 3.434 0.044 0.814 0.155 0.044 0.353 0.170 0.079
dHPC No statistically and biologically active matches
vmPFC No statistically and biologically active matches
NAc 2 29 3.163 0.057 0.586 0.288 0.050 0.845 0.041 0.017
2 29 5.402 0.010 0.606 0.074 0.010 0.830 0.029 0.025

39
1.5 DISCUSSION
1.5.1 The Characteristic Metabolome Associated with Social Defeat
For the first time, UPLC-HRMS based metabolomics analyses were used to
investigate the metabolic fluctuations associated with stress resistance. Metabolomics as
a field is currently at its infancy. Complications arising from biological diversity and poor
understanding of how to interpret results defines the current state of the field. There are
thousands of metabolites within a biological system, not to mention that each metabolite
can be involved within multiple metabolic pathways. These current issues present an
opportunity to discover novel aspects of biological systems. An untargeted method was
used for the current analysis, with the goal of identifying features that could lead to the
discovery of a novel biomarker. Specifically, we used a comparative approach to identify
similar metabolites that are associated with stress resistance in both models. The varying
levels of global metabolites for both mice and hamsters were analyzed using PLS-DA,
which resulted in significant clustering of subjects and separation of phenotypes. The
separation of the phenotypes in the PLS-DA plots suggests that stress-induced metabolic
fluctuations can reliably predict phenotypic responses to social defeat stress. Based on
VIP scores and Tukey’s post hoc comparisons, significant fluctuations were found in
amino acid and neurotransmitter metabolism that are associated with stress susceptibility
and resistance in both mice and hamsters.
Interestingly, both mice and hamsters that are susceptible and resistant to social
defeat stress show changes in small molecules in the NAc that modulate oxidative stress.
The relative abundance of the amino acid cystine was higher in resistant mice compared
to susceptible mice. Cystine is a critical component of the cystine-glutamate exchange,
also known as the system xc–. The uptake of cystine that results from a cystine-glutamate
exchange is important for maintaining the levels of glutathione, a critical antioxidant45-46.
Furthermore, system xc-dependent glutathione production modulates protection from
oxidative stress47. Taken together, the upregulation of cystine in resistant mice may help
protect them against defeat-induced social avoidance. In hamsters, the levels of fumarate
tended to be higher in the NAc of dominants compared to subordinates. Fumarate is an

40
intermediate in the Krebs cycle used by cells to produce energy in the form of adenosine
triphosphate (ATP). Not surprisingly, oxidative stress suppresses the Krebs cycle48.
Esterification of the unsaturated dicarbonic acid, fumarate can be enzymatically catalyzed
to form fumaric acid esters (FAEs), such as dimethyl fumarate that has been shown to
exert neuroprotective effects against neuroinflammation via activation of the Nrf2
antioxidant pathway49. Additionally, research has also shown that dimethyl fumarate
protects cells from oxidative stress50. In addition to these molecules within the NAc that
modulate oxidative stress, evidence of protection from oxidative stress was further
observed in the vmPFC of dominant hamsters. To illustrate, methionine was elevated in
dominants compared to both controls and subordinates. Methionine is an antioxidant that
has been shown to reverse the effects of oxidative stress51-53. Overall, subjects resistant
to acute social defeat had elevated levels of small molecules in the NAc and vmPFC
following social defeat that protect against oxidative stress, such as cystine, fumarate,
and methionine.
This study also revealed significant defeat-induced changes in neurotransmitters
and their precursors. In the dHPC, susceptible mice had significantly higher levels of
GABA compared to both resistant and control mice. Stress exposure has been shown to
increase GABA levels in the hippocampus. For instance, mild stressors such as novel
cage exposure and more intense stressors such as forced swimming both increase
hippocampal GABA levels54. Furthermore, microdialysis reveals increased extracellular
levels of GABA in response to novelty stress in the vHPC55. In hamsters, we found that
dominant animals had increased tyrosine concentrations in the vmPFC compared to
subordinates. Tyrosine serves as a critical precursor to catecholamines and has
antioxidant properties56-57. Rats given tyrosine before acute tail-shock displayed neither
shock induced norepinephrine depletion nor the deficits in exploratory behaviors
observed in saline-treated animals58. Similarly, pre-treatment with tyrosine not only
prevented behavioral depression and norepinephrine depletion after acute restraint stress
and intermittent tail-shock but also suppressed the rise in plasma corticosterone59.
Additionally, we found that dominant hamsters had lower serine concentrations in
the BLA/CeA compared to control hamsters. D-serine is an endogenous modulator of the

41
glycine site of NMDA receptors and functions to facilitate memory processes60-61.
Systemic administration of D-serine has been shown to enhance both object recognition
and T-maze performance62. While partial agonists at the glycine site on NMDA receptors
have been proposed as cognitive enhancers to facilitate cognitive behavioral therapy63,
systemic administration of D-serine induces oxidative stress in the rat brain64. One
possibility is that dominant animals may have less endogenous serine to bind to the
glycine site of the NMDA receptor in the BLA, which may also reduce the potential for
oxidative stress.
Finally, in the vmPFC of mice, changes were observed in molecules relate to
cellular energy consumption. More specifically, resistant mice had significantly higher
levels of IMP (inosinic acid) and AMP (adenosine monophosphate) in the vmPFC
immediately following social defeat compared to susceptible mice. AMP is produced
during adenosine triphosphate (ATP) synthesis, while IMP is generated via ATP
degradation in two metabolic pathways in which AMP is generated and then degraded to
either IMP or adenosine65. Taken together, these two molecules are indicative of
increased cellular activity in the vmPFC of resistant mice.
1.5.2 Unidentified Spectral Features Affected by Social Stress
The current state of metabolomics research is focused on the structural elucidation
of USFs from an untargeted experiment. Through this technology, the breadth of the
metabolome can be revealed but there are many steps involved with confirmation of
structure. This hypothesis driven experiment has produced thousands of USFs, which are
potential metabolites that could better explain the entire metabolome of a subject. Here,
we provided a high-throughput method for the characterization of USFs. In this
experiment, the aim was to find a reduced list of metabolites that exhibited significant
metabolic changes associated with social stress defeat and provide possible compound
matches to be evaluated in future experiments.
Preliminary annotation of USFs revealed a common trend in which several of the
compounds were related to oxidative stress. In the NAc of mice, the 274.1945 m/z at 4.7
min feature was matched to norophthalmic acid. This neurochemical was significantly

42
decreased in susceptible mice and increased in resistant mice. As a tripeptide analogue
of glutathione, norophthalmic acid has been shown to be an intracellular antioxidant. It is
known that disturbance of glutathione homeostasis either leads to or results from
oxidative stress66-67. This was particularly interesting because cystine levels in NAc of
mice were also elevated in resistant mice after social defeat. As a dimer of cysteine,
fluctuations in concentrations of this compound have a direct effect on levels of
glutathione. Because resistant mice show increased concentrations of both compounds,
it suggests that susceptible mice respond to social defeat stress with fewer essential
antioxidants which may reduce their coping ability. Also, in the BLA/CeA of hamsters, the
289.0903 m/z at 11.6 mins feature corresponded to N-acetylcarnosine (NAC). This free-
radical scavenger is a natural N-acetylated dipeptide consisting of alanine and histidine.
Carnosine derivatives have been shown to act as natural antioxidants with hydroxy
radical, singlet oxygen scavenging and lipid peroxidase properties68. Although this
compound hasn’t been associated with stress-related behavior, NAC treatment has been
shown to reduce the effects of cataracts, which are caused by oxidative stress on the
lens69. In the present study, NAC was increased in dominant hamsters, again suggesting
a potential mechanism that protects against oxidative stress.
In a separate correlation, two USF features from hamsters exhibited effects on the
efficiency of mitochondrial activity. In mammalian cells, mitochondria have been shown
to produce reactive oxygen species (ROSs) to reduce oxidative damage and contribute
to redox signaling to the nucleus70. Acetyl-L-carnitine (ALC) has a known biological
function of improving the efficiency of mitochondrial function by facilitating the movement
of acetyl CoA into the matrices71. In our study, the amount of ALC (316.1012 m/z at 11.6
min) was significantly increased in the BLA/CeA of subordinate hamsters. This
observation reveals that the cellular mitochondrial activity is being up-regulated in
subordinate hamsters after social defeat. Additionally, the NAc samples revealed a
significant decrease of relative concentration in subordinate hamsters for a set of parent
masses at 15 mins; 320.0619 m/z ([M-H]-) and 342.0441 m/z ([M+Na-2H]-). These
features both correlated to beta-citryl-L-glutamic acid (BCG), which is a derivative of
glutamate found in the developing brain of rats72. This metabolite has been shown to be

43
an iron carrier that is used to activate the enzyme aconitase73, which is used to enhance
cell viability by accelerating mitochondrial activity. Alterations to normal mitochondrial
function during stress can contribute to cell death through two mechanisms; change in
production of ROSs and release of death regulatory and signaling molecules from the
intermembrane space74-75.
Finally, preliminary annotation of unknown metabolites indicates changes in small
molecules associated with memory function. For example, in the BLA/CeA of mice, two
features (m/z, 279.0458 ([M-H]-) and 297.0563 ([M-H2O-H]-)) at 11.5 minutes revealed
the existence of the same compound, N-acetylserotonin sulfate (NAS). NAS is an
intermediate in the endogenous production of melatonin from serotonin76, and has been
shown to act as a classic antioxidant through hydrogen donation77. NAS has also been
shown to improve cognition78 and increases BDNF levels79. Interestingly, NAS has been
shown to directly activate the TrkB receptor80. TrkB, as the primary receptor for BDNF, is
critical for learning and memory related plasticity81. One possibility is that increased NAS
in susceptible mice is associated with a stronger memory of the defeat experience. This
possibility is consistent with our previous finding that inhibition of the BDNF synthesis
pathway in the BLA reduced defeat-induced social avoidance15.
Some limitations of the present study should be acknowledged. While untargeted
metabolomics provides opportunity for the discovery of novel biomarkers, large quantities
of data are produced and an agreed upon high-throughput method for structure
elucidation has not been validated. We have used statistical significance to reduce the
number of USF considered for discussion, although additional tandem MS/MS analyses
should be performed to definitively characterize novel metabolites. Additionally, this study
is limited in that it only used male subjects, which is particularly concerning given that
women are more likely to develop a stress-related mental illness82-83. Indeed, a sex bias
exists in neuroscience research84, especially within the realm of social defeat models.
One noteworthy exception can be seen in work with the California mouse (Peromyscus
californicus), a monogamous species in which both males and females aggressively
defend their home territories85. In this species, females are particularly susceptible to
social defeat compared to males, and analyses of brain activity immediately following

44
social interaction testing suggested that cellular activity in the NAc may be related to
social avoidance86. While these data suggest that the NAc may be ideally situated to study
biomarkers in females, sex-differences in stress-induced social withdrawal in the
California mouse are also associated with BDNF in the bed nucleus of the stria
terminalus87. Overall, further research is needed to characterize the stress-induced
neurochemical profiles of females.
1.6 CONCLUSION
We found that 18% of C57 mice show resistance to social avoidance following an
acute social defeat. Similarly, hamsters that have maintained dominant social status
exhibit less defeat-induced social avoidance compared to subordinates. While an analysis
of defeat-induced changes in metabolites within select brain regions indicates that the
concentrations of many small molecules differ between susceptible and resistant animals,
no single biomarker was observed in both species. However, both dominant hamsters
and resistant mice show changes in neurochemicals within similar functional classes.
Importantly, animals resistant to social defeat stress show an increased concentration of
molecules to protect against oxidative stress in the NAc and vmPFC. Overall, a
metabolomics approach to the study of stress resilience can identify functional groups of
neurochemicals that may serve as novel targets for the treatment of stress-related mental
illness.

45
1.7 REFERENCES
1. Heim, C.; Newport, D. J.; Mletzko, T.; Miller, A. H.; Nemeroff, C. B., The link between
childhood trauma and depression: insights from HPA axis studies in humans.
Psychoneuroendocrinology 2008, 33 (6), 693-710.
2. Abelson, J. L.; Khan, S.; Liberzon, I.; Young, E. A., HPA axis activity in patients with
panic disorder: review and synthesis of four studies. Depress. Anxiety 2007, 24
(1), 66-76.
3. Meewisse, M. L.; Reitsma, J. B.; de Vries, G. J.; Gersons, B. P.; Olff, M., Cortisol and
post-traumatic stress disorder in adults: systematic review and meta-analysis. Br.
J. Psychiatry 2007, 191, 387-92.
4. Charuvastra, A.; Cloitre, M., Social bonds and posttraumatic stress disorder. Annual
review of psychology 2008, 59, 301.
5. Charney, D. S., Psychobiological Mechanisms of Resilience and vulnerability:
Implications for Successful Adaptation to Extreme Stress. American Journal of
Psychiatry 2004, 161 (2), 195-216.
6. Russo, S. J.; Murrough, J. W.; Han, M. H.; Charney, D. S.; Nestler, E. J., Neurobiology
of resilience. Nature neuroscience 2012, 15 (11), 1475-84.
7. Feder, A.; Nestler, E. J.; Charney, D. S., Psychobiology and molecular genetics of
resilience. Nature reviews. Neuroscience 2009, 10 (6), 446-57.
8. Nestler, E. J.; Hyman, S. E., Animal models of neuropsychiatric disorders. Nature
neuroscience 2010, 13 (10), 1161-1169.
9. Krishnan, V.; Han, M. H.; Graham, D. L.; Berton, O.; Renthal, W.; Russo, S. J.; Laplant,
Q.; Graham, A.; Lutter, M.; Lagace, D. C.; Ghose, S.; Reister, R.; Tannous, P.;
Green, T. A.; Neve, R. L.; Chakravarty, S.; Kumar, A.; Eisch, A. J.; Self, D. W.;
Lee, F. S.; Tamminga, C. A.; Cooper, D. C.; Gershenfeld, H. K.; Nestler, E. J.,
Molecular adaptations underlying susceptibility and resistance to social defeat in
brain reward regions. Cell 2007, 131 (2), 391-404.
10. Berton, O.; McClung, C. A.; Dileone, R. J.; Krishnan, V.; Renthal, W.; Russo, S. J.;
Graham, D.; Tsankova, N. M.; Bolanos, C. A.; Rios, M.; Monteggia, L. M.; Self, D.
W.; Nestler, E. J., Essential role of BDNF in the mesolimbic dopamine pathway in
social defeat stress. Science 2006, 311 (5762), 864-8.

46
11. Meduri, J. D.; Farnbauch, L. A.; Jasnow, A. M., Paradoxical enhancement of fear
expression and extinction deficits in mice resilient to social defeat. Behavioural
brain research 2013, 256, 580-90.
12. Dulka, B. N.; Lynch Iii, J. F.; Latsko, M. S.; Mulvany, J. L.; Jasnow, A. M., Phenotypic
responses to social defeat are associated with differences in cued and contextual
fear discrimination. Behavioural Processes 2015, 118, 115-122.
13. Golden, S. A.; Covington III, H. E.; Berton, O.; Russo, S. J., A standardized protocol
for repeated social defeat stress in mice. Nature protocols 2011, 6 (8), 1183-1191.
14. Vialou, V.; Bagot, R. C.; Cahill, M. E.; Ferguson, D.; Robison, A. J.; Dietz, D. M.;
Fallon, B.; Mazei-Robison, M.; Ku, S. M.; Harrigan, E., Prefrontal cortical circuit for
depression-and anxiety-related behaviors mediated by cholecystokinin: Role of
ΔFosB. The Journal of Neuroscience 2014, 34 (11), 3878-3887.
15. Dulka, B. N.; Ford, E. C.; Lee, M. A.; Donnell, N. J.; Goode, T. D.; Prosser, R.; Cooper,
M. A., Proteolytic cleavage of proBDNF into mature BDNF in the basolateral
amygdala is necessary for defeat-induced social avoidance. Learning & memory
2016, 23 (4), 156-160.
16. Peaston, A. E.; Whitelaw, E., Epigenetics and phenotypic variation in mammals.
Mammalian Genome 2006, 17 (5), 365-374.
17. Wong, A. H.; Gottesman, I. I.; Petronis, A., Phenotypic differences in genetically
identical organisms: the epigenetic perspective. Human molecular genetics 2005,
14 (suppl 1), R11-R18.
18. Huhman, K. L.; Solomon, M. B.; Janicki, M.; Harmon, A. C.; Lin, S. M.; Israel, J. E.;
Jasnow, A. M., Conditioned defeat in male and female Syrian hamsters. Hormones
and behavior 2003, 44 (3), 293-299.
19. Kudryavtseva, N., Experience of defeat decreases the behavioural reactivity to
conspecifics in the partition test. Behavioural processes 1994, 32 (3), 297-304.
20. Meerlo, P.; Overkamp, G.; Daan, S.; Van Den Hoofdakker, R.; Koolhaas, J., Changes
in behaviour and body weight following a single or double social defeat in rats.
Stress 1996, 1 (1), 21-32.

47
21. Jasnow, A. M.; Huhman, K. L., Activation of GABA A receptors in the amygdala blocks
the acquisition and expression of conditioned defeat in Syrian hamsters. Brain
research 2001, 920 (1), 142-150.
22. Day, D. E.; Cooper, M. A.; Markham, C. M.; Huhman, K. L., NR2B subunit of the
NMDA receptor in the basolateral amygdala is necessary for the acquisition of
conditioned defeat in Syrian hamsters. Behavioural brain research 2011, 217 (1),
55-9.
23. Jasnow, A. M.; Shi, C.; Israel, J. E.; Davis, M.; Huhman, K. L., Memory of social defeat
is facilitated by cAMP response element-binding protein overexpression in the
amygdala. Behavioral neuroscience 2005, 119 (4), 1125-30.
24. Taylor, S.; Fedoroff, I. C.; Koch, W. J.; Thordarson, D. S.; Fecteau, G.; Nicki, R. M.,
Posttraumatic stress disorder arising after road traffic collisions: Patterns of
response to cognitive–behavior therapy. Journal of consulting and clinical
psychology 2001, 69 (3), 541.
25. Gray, C.; Norvelle, A.; Larkin, T.; Huhman, K., Dopamine in the nucleus accumbens
modulates the memory of social defeat in Syrian hamsters (Mesocricetus auratus).
Behavioural brain research 2015, 286, 22-28.
26. Markham, C. M.; Taylor, S. L.; Huhman, K. L., Role of amygdala and hippocampus in
the neural circuit subserving conditioned defeat in Syrian hamsters. Learning &
memory 2010, 17 (2), 109-16.
27. Markham, C. M.; Luckett, C. A.; Huhman, K. L., The medial prefrontal cortex is both
necessary and sufficient for the acquisition of conditioned defeat.
Neuropharmacology 2012, 62 (2), 933-939.
28. Morrison, K. E.; Swallows, C. L.; Cooper, M. A., Effects of dominance status on
conditioned defeat and expression of 5-HT1A and 5-HT2A receptors. Physiology
& behavior 2011, 104 (2), 283-90.
29. Morrison, K. E.; Bader, L. R.; Clinard, C. T.; Gerhard, D. M.; Gross, S. E.; Cooper, M.
A., Maintenance of dominance status is necessary for resistance to social defeat
stress in Syrian hamsters. Behavioural brain research 2014, 270, 277-86.

48
30. Morrison, K. E.; Bader, L. R.; McLaughlin, C. N.; Cooper, M. A., Defeat-induced
activation of the ventral medial prefrontal cortex is necessary for resistance to
conditioned defeat. Behavioural brain research 2013, 243, 158-64.
31. Yehuda, R.; Neylan, T. C.; Flory, J. D.; McFarlane, A. C., The use of biomarkers in
the military: From theory to practice. Psychoneuroendocrinology 2013, 38 (9),
1912-1922.
32. Zoladz, P. R.; Diamond, D. M., Current status on behavioral and biological markers
of PTSD: a search for clarity in a conflicting literature. Neuroscience &
Biobehavioral Reviews 2013, 37 (5), 860-895.
33. Baker, D. G.; Nievergelt, C. M.; O'Connor, D. T., Biomarkers of PTSD: neuropeptides
and immune signaling. Neuropharmacology 2012, 62 (2), 663-673.
34. Griffiths, W.; Karu, K.; Hornshaw, M.; Woffendin, G.; Wang, Y., Metabolomics and
metabolite profiling: past heroes and future developments. European Journal of
Mass Spectrometry 2007, 13 (1), 45-50.
35. Oldiges, M.; Lütz, S.; Pflug, S.; Schroer, K.; Stein, N.; Wiendahl, C., Metabolomics:
current state and evolving methodologies and tools. Appl Microbiol Biotechnol
2007, 76 (3), 495-511.
36. Kaddurah-Daouk, R.; Kristal, B. S.; Weinshilboum, R. M., Metabolomics: a global
biochemical approach to drug response and disease. Annu Rev Pharmacol Toxicol
2008, 48, 653-83.
37. McCann, K. E.; Bicknese, C. N.; Norvelle, A.; Huhman, K. L., Effects of inescapable
versus escapable social stress in Syrian hamsters: the importance of stressor
duration versus escapability. Physiology & behavior 2014, 129, 25-9.
38. Clinard, C. T.; Bader, L. R.; Sullivan, M. A.; Cooper, M. A., Activation of 5-HT2a
receptors in the basolateral amygdala promotes defeat-induced anxiety and the
acquisition of conditioned defeat in Syrian hamsters. Neuropharmacology 2015,
90, 102-12.
39. Lu, W.; Clasquin, M. F.; Melamud, E.; Amador-Noguez, D.; Caudy, A. A.; Rabinowitz,
J. D., Metabolomic Analysis via Reversed-Phase Ion-Pairing Liquid
Chromatography Coupled to a Stand Alone Orbitrap Mass Spectrometer.
Analytical Chemistry 2010, 82 (8), 3212-3221.

49
40. Melamud, E.; Vastag, L.; Rabinowitz, J. D., Metabolomic analysis and visualization
engine for LC− MS data. Analytical chemistry 2010, 82 (23), 9818-9826.
41. Altmaier, E.; Ramsay, S. L.; Graber, A.; Mewes, H.-W.; Weinberger, K. M.; Suhre, K.,
Bioinformatics Analysis of Targeted Metabolomics—Uncovering Old and New
Tales of Diabetic Mice under Medication. Endocrinology 2008, 149 (7), 3478-3489.
42. Suhre, K.; Shin, S.-Y.; Petersen, A.-K.; Mohney, R. P.; Meredith, D.; Wagele, B.;
Altmaier, E.; CardioGram; Deloukas, P.; Erdmann, J.; Grundberg, E.; Hammond,
C. J.; de Angelis, M. H.; Kastenmuller, G.; Kottgen, A.; Kronenberg, F.; Mangino,
M.; Meisinger, C.; Meitinger, T.; Mewes, H.-W.; Milburn, M. V.; Prehn, C.; Raffler,
J.; Ried, J. S.; Romisch-Margl, W.; Samani, N. J.; Small, K. S.; Erich Wichmann,
H.; Zhai, G.; Illig, T.; Spector, T. D.; Adamski, J.; Soranzo, N.; Gieger, C., Human
metabolic individuality in biomedical and pharmaceutical research. Nature 2011,
477 (7362), 54-60.
43. Xia, J.; Psychogios, N.; Young, N.; Wishart, D. S., MetaboAnalyst: a web server for
metabolomic data analysis and interpretation. Nucleic Acids Research 2009, 37
(Web Server issue), W652-W660.
44. Wishart, D. S.; Jewison, T.; Guo, A. C.; Wilson, M.; Knox, C.; Liu, Y.; Djoumbou, Y.;
Mandal, R.; Aziat, F.; Dong, E.; Bouatra, S.; Sinelnikov, I.; Arndt, D.; Xia, J.; Liu,
P.; Yallou, F.; Bjorndahl, T.; Perez-Pineiro, R.; Eisner, R.; Allen, F.; Neveu, V.;
Greiner, R.; Scalbert, A., HMDB 3.0—The Human Metabolome Database in 2013.
Nucleic Acids Research 2013, 41 (D1), D801-D807.
45. Bridges, R.; Lutgen, V.; Lobner, D.; Baker, D. A., Thinking outside the cleft to
understand synaptic activity: contribution of the cystine-glutamate antiporter
(system xc−) to normal and pathological glutamatergic signaling. Pharmacological
reviews 2012, 64 (3), 780-802.
46. Reissner, K. J., The cystine/glutamate antiporter: when too much of a good thing goes
bad. The Journal of clinical investigation 2014, 124 (8), 3279.
47. Shih, A. Y.; Erb, H.; Sun, X.; Toda, S.; Kalivas, P. W.; Murphy, T. H.,
Cystine/glutamate exchange modulates glutathione supply for neuroprotection
from oxidative stress and cell proliferation. The Journal of neuroscience 2006, 26
(41), 10514-10523.

50
48. Tretter, L.; Adam-Vizi, V., Inhibition of Krebs cycle enzymes by hydrogen peroxide: a
key role of α-ketoglutarate dehydrogenase in limiting NADH production under
oxidative stress. The Journal of Neuroscience 2000, 20 (24), 8972-8979.
49. Linker, R. A.; Lee, D.-H.; Ryan, S.; van Dam, A. M.; Conrad, R.; Bista, P.; Zeng, W.;
Hronowsky, X.; Buko, A.; Chollate, S., Fumaric acid esters exert neuroprotective
effects in neuroinflammation via activation of the Nrf2 antioxidant pathway. Brain
2011, 134 (3), 678-692.
50. Albrecht, P.; Bouchachia, I.; Goebels, N.; Henke, N.; Hofstetter, H. H.; Issberner, A.;
Kovacs, Z.; Lewerenz, J.; Lisak, D.; Maher, P., Effects of dimethyl fumarate on
neuroprotection and immunomodulation. J Neuroinflammation 2012, 9 (163),
2094-9.
51. Patra, R.; Swarup, D.; Dwivedi, S., Antioxidant effects of α tocopherol, ascorbic acid
and L-methionine on lead induced oxidative stress to the liver, kidney and brain in
rats. Toxicology 2001, 162 (2), 81-88.
52. Nandi, D.; Patra, R.; Swarup, D., Effect of cysteine, methionine, ascorbic acid and
thiamine on arsenic-induced oxidative stress and biochemical alterations in rats.
Toxicology 2005, 211 (1), 26-35.
53. Luo, S.; Levine, R. L., Methionine in proteins defends against oxidative stress. The
FASEB Journal 2009, 23 (2), 464-472.
54. De Groote, L.; Linthorst, A., Exposure to novelty and forced swimming evoke stressor-
dependent changes in extracellular GABA in the rat hippocampus. Neuroscience
2007, 148 (3), 794-805.
55. Bianchi, L.; Ballini, C.; Colivicchi, M.; Della Corte, L.; Giovannini, M.; Pepeu, G.,
Investigation on acetylcholine, aspartate, glutamate and GABA extracellular levels
from ventral hippocampus during repeated exploratory activity in the rat.
Neurochem Res 2003, 28 (3-4), 565-573.
56. Yen, G.-C.; Hsieh, C.-L., Antioxidant effects of dopamine and related compounds.
Bioscience, biotechnology, and biochemistry 1997, 61 (10), 1646-1649.
57. Gülçin, I., Comparison of in vitro antioxidant and antiradical activities of L-tyrosine and
L-Dopa. Amino acids 2007, 32 (3), 431-438.

51
58. Reinstein, D. K.; Lehnert, H.; Scott, N. A.; Wurtman, R. J., Tyrosine prevents
behavioral and neurochemical correlates of an acute stress in rats. Life sciences
1984, 34 (23), 2225-2231.
59. Reinstein, D. K.; Lehnert, H.; Wurtman, R. J., Dietary tyrosine suppresses the rise in
plasma corticosterone following acute stress in rats. Life sciences 1985, 37 (23),
2157-2163.
60. Mothet, J.-P.; Parent, A. T.; Wolosker, H.; Brady, R. O.; Linden, D. J.; Ferris, C. D.;
Rogawski, M. A.; Snyder, S. H., D-serine is an endogenous ligand for the glycine
site of the N-methyl-D-aspartate receptor. Proceedings of the National Academy
of Sciences 2000, 97 (9), 4926-4931.
61. Collingridge, G. L.; Volianskis, A.; Bannister, N.; France, G.; Hanna, L.; Mercier, M.;
Tidball, P.; Fang, G.; Irvine, M. W.; Costa, B. M., The NMDA receptor as a target
for cognitive enhancement. Neuropharmacology 2013, 64, 13-26.
62. Bado, P.; Madeira, C.; Vargas-Lopes, C.; Moulin, T. C.; Wasilewska-Sampaio, A. P.;
Maretti, L.; de Oliveira, R. V.; Amaral, O. B.; Panizzutti, R., Effects of low-dose D-
serine on recognition and working memory in mice. Psychopharmacology 2011,
218 (3), 461-470.
63. Davis, M.; Ressler, K.; Rothbaum, B. O.; Richardson, R., Effects of D-cycloserine on
extinction: translation from preclinical to clinical work. Biological psychiatry 2006,
60 (4), 369-375.
64. Armagan, G.; Kanıt, L.; Yalcin, A., D-serine treatment induces oxidative stress in rat
brain. Drug and chemical toxicology 2011, 34 (2), 129-138.
65. Seki, H.; Nakazato, K.; Hamada-Sato, N., Adenosine monophosphate degradation
and inosinic acid accumulation in the shrimp Penaeus japonicus. International
Aquatic Research 2017, 9 (1), 37.
66. Gonçalves, L.; Dafre, A. L.; Carobrez, S. G.; Gasparotto, O. C., A temporal analysis
of the relationships between social stress, humoral immune response and
glutathione-related antioxidant defenses. Behavioural brain research 2008, 192
(2), 226-231.

52
67. Schulz, J. B.; Lindenau, J.; Seyfried, J.; Dichgans, J., Glutathione, oxidative stress
and neurodegeneration. European Journal of Biochemistry 2000, 267 (16), 4904-
4911.
68. Babizhayev, M. A.; Seguin, M. C.; Gueyne, J.; Evstigneeva, R. P.; Ageyeva, E. A.;
Zheltukhina, G. A., L-carnosine (β-alanyl-L-histidine) and carcinine (β-
alanylhistamine) act as natural antioxidants with hydroxyl-radical-scavenging and
lipid-peroxidase activities. Biochemical Journal 1994, 304 (2), 509-516.
69. Babizhayev, M. A.; Deyev, A. I.; Yermakova, V. N.; Semiletov, Y. A.; Davydova, N.
G.; Kurysheva, N. I.; Zhukotskii, A. V.; Goldman, I. M., N-Acetylcarnosine, a natural
histidine-containing dipeptide, as a potent ophthalmic drug in treatment of human
cataracts. Peptides 2001, 22 (6), 979-994.
70. Murphy, Michael P., How mitochondria produce reactive oxygen species. Biochemical
Journal 2009, 417 (Pt 1), 1-13.
71. Wutzke, K. D.; Lorenz, H., The effect of l-carnitine on fat oxidation, protein turnover,
and body composition in slightly overweight subjects. Metabolism 2004, 53 (8),
1002-1006.
72. Miyake, M.; Kakimoto, Y.; Sorimachi, M., Isolation and identification of β-citryl-L-
glutamic acid from newborn rat brain. Biochimica et Biophysica Acta (BBA)-
General Subjects 1978, 544 (3), 656-666.
73. Hamada-Kanazawa, M.; Narahara, M.; Takano, M.; Min, K. S.; Tanaka, K.; Miyake,
M., β-Citryl-<small>L</small>-glutamate Acts as an Iron Carrier to Activate
Aconitase Activity. Biological and Pharmaceutical Bulletin 2011, 34 (9), 1455-
1464.
74. García-Ruiz, C.; Colell, A.; Morales, A.; Kaplowitz, N.; Fernández-Checa, J. C., Role
of oxidative stress generated from the mitochondrial electron transport chain and
mitochondrial glutathione status in loss of mitochondrial function and activation of
transcription factor nuclear factor-kappa B: studies with isolated mitochondria and
rat hepatocytes. Molecular Pharmacology 1995, 48 (5), 825-834.
75. Ouyang, Y.-B.; Giffard, R. G., Changes in astrocyte mitochondrial function with stress:
effects of Bcl-2 family proteins. Neurochemistry International 2004, 45 (2–3), 371-
379.

53
76. Weissbach, H.; Redfield, B. G.; Axelrod, J., Biosynthesis of melatonin: enzymic
conversion of serotonin to N-acetylserotonin. Biochimica et biophysica acta 1960,
43, 352-353.
77. Barsacchi, R.; Kusmic, C.; Damiani, E.; Carloni, P.; Greci, L.; Donato, L., Vitamin E
Consumption Induced by Oxidative Stress in Red Blood Cells Is Enhanced by
Melatonin and Reduced by N-Acetylserotonin. Free Radical Biology and Medicine
1998, 24 (7–8), 1187-1192.
78. Alvarez-Diduk, R. n.; Galano, A.; Tan, D. X.; Reiter, R. J., N-Acetylserotonin and 6-
hydroxymelatonin against oxidative stress: Implications for the overall protection
exerted by melatonin. The Journal of Physical Chemistry B 2015, 119 (27), 8535-
8543.
79. Yoo, D. Y.; Nam, S. M.; Kim, W.; Lee, C. H.; Won, M.-H.; Hwang, I. K.; Yoon, Y. S.,
N-acetylserotonin increases cell proliferation and differentiating neuroblasts with
tertiary dendrites through upregulation of brain-derived neurotrophic factor in the
mouse dentate gyrus. Journal of Veterinary Medical Science 2011, 73 (11), 1411-
1416.
80. Jang, S.-W.; Liu, X.; Pradoldej, S.; Tosini, G.; Chang, Q.; Iuvone, P. M.; Ye, K., N-
acetylserotonin activates TrkB receptor in a circadian rhythm. Proceedings of the
National Academy of Sciences 2010, 107 (8), 3876-3881.
81. Minichiello, L., TrkB signalling pathways in LTP and learning. Nature Reviews
Neuroscience 2009, 10 (12), 850-860.
82. Kessler, R. C., Epidemiology of women and depression. Journal of affective disorders
2003, 74 (1), 5-13.
83. Bekker, M. H.; van Mens-Verhulst, J., Anxiety disorders: sex differences in
prevalence, degree, and background, but gender-neutral treatment. Gender
medicine 2007, 4, S178-S193.
84. Beery, A. K.; Zucker, I., Sex bias in neuroscience and biomedical research.
Neuroscience & Biobehavioral Reviews 2011, 35 (3), 565-572.
85. Ribble, D. O.; Salvioni, M., Social organization and nest co-occupancy in Peromyscus
californicus, a monogamous rodent. Behavioral Ecology and Sociobiology 1990,
26 (1), 9-15.

54
86. Trainor, B. C., Stress responses and the mesolimbic dopamine system: social
contexts and sex differences. Hormones and behavior 2011, 60 (5), 457-469.
87. Greenberg, G. D.; Laman-Maharg, A.; Campi, K. L.; Voigt, H.; Orr, V. N.; Schaal, L.;
Trainor, B. C., Sex differences in stress-induced social withdrawal: role of brain
derived neurotrophic factor in the bed nucleus of the stria terminalis. Frontiers in
behavioral neuroscience 2013, 7.
88. Rabinowitz, J. D.; Kimball, E., Acidic Acetonitrile for Cellular Metabolome Extraction
from Escherichia coli. Analytical Chemistry 2007, 79 (16), 6167-6173.
89. Martens, L.; Chambers, M.; Sturm, M.; Kessner, D.; Levander, F.; Shofstahl, J.; Tang,
W. H.; Römpp, A.; Neumann, S.; Pizarro, A. D., mzML—a community standard for
mass spectrometry data. Molecular & Cellular Proteomics 2011, 10 (1), R110.
000133.
90. Chambers, M. C.; Maclean, B.; Burke, R.; Amodei, D.; Ruderman, D. L.; Neumann,
S.; Gatto, L.; Fischer, B.; Pratt, B.; Egertson, J., A cross-platform toolkit for mass
spectrometry and proteomics. Nature biotechnology 2012, 30 (10), 918-920.
91. Saldanha, A. J., Java Treeview—extensible visualization of microarray data.
Bioinformatics 2004, 20 (17), 3246-3248.
92. Wold, S.; Sjöström, M.; Eriksson, L., PLS-regression: a basic tool of chemometrics.
Chemometrics and intelligent laboratory systems 2001, 58 (2), 109-130.
93. Racine, J. S., RStudio: A Platform-Independent IDE for R and Sweave. Journal of
Applied Econometrics 2012, 27 (1), 167-172.

55
1.8 APPENDIX
1.8.1 Supplemental Methods and Materials
Extraction Protocol
Samples were transferred from a -80 °C freezer to a 5 °C cold room, where they were left
to thaw for 20 minutes. The samples were then extracted using a modified acidic
acetonitrile protocol88. To the tissue punches, 500 μL of extraction solvent (40:40:20
acetonitrile/methanol/water containing 0.1 M formic acid) was added and the mixture was
transferred to -20 °C for 20 minutes. The samples were then centrifuged for 5 minutes at
13,000 rpm and the resulting supernatant was collected. Pellets were washed twice with
100 μL aliquots of extraction solvent. The combined supernatants were then dried under
nitrogen, followed by resuspension with 150 μL of Millipore water.
UPLC-HRMS
Analysis by UPLC-HRMS was completed using an ultimate 3000 LC pump coupled with
an Exactive Plus Orbitrap MS (Thermo Fisher Scientific, Waltham, MA). All solvents were
HPLC grade and purchased from Fisher Scientific (Atlanta, GA). The mobile phases,
solvent A (97:3 water:methanol containing 10 mM tributylamine, and 15 mM acetic acid)
and solvent B (methanol), were set to use a multi-step gradient as follows; 0 to 5 min, 0%
B; 5 to 13 min, 20% B; 13 to 15.5 min, 55% B; 15.5 to 19 min, 95% B; and 19 to 25 min,
0% B. With a flow rate of 200 μL/min, a 10 μL aliquot of sample was injected through a
Synergi 2.5 μm Hydro-RP 100, 100 x 2.0 mm LC column (Phenomenex) maintained at
25 °C. While running full scan in negative mode, the eluent was introduced to the MS by
an electrospray ionization source39. Samples were analyzed with a resolving power of
140,000 and a scan window of 72 to 800 m/z from 0 to 9 min, and 100 to 1,000 m/z from
9 to 25 min. Samples were injected in a randomized order to reduce instrumental error.
Data Processing
Raw files generated by the Xcaliber software (Thermo Fisher Scientific) were converted
to an open source format, mxML89, via the open source MSConvert software, which is
part of the ProteoWizard package90. The converted files were then uploaded into the

56
Metabolomic Analysis and Visualization Engine (MAVEN) software, which automatically
adjusts the total ion chromatograms based on retention times for each sample40. Using
MAVEN40, metabolites were selected from a pre-existing list of 270 known compounds
with annotated biological activity. All retention times were previously validated for exact
mass and retention time using chemical standards from Fisher Scientific or preexisting
chromatography39. Integration of the area under the curve provided each metabolite with
a total ion count that can be considered the relative concentration of the metabolite within
a single sample.
Internal Ratio Normalization (IRN)
By assuming that intensity ratios within a sample are consistent across all metabolites,
an internal ratio can be used to normalize the data in an attempt to reduce instrumental
and technical variability. This technique constructs a correlation type matrix for each
sample, which is composed of the individual ratios across every metabolite within the
sample. These generated matrices are then averaged among replicates, followed by
comparison between treatments. Using the IRN R script (https://irn-
access:[email protected]/irn/irn.git), the data were normalized to produce
fold change and p-values across experimental comparisons. These normalized values
were used to produce the heatmap figures for known metabolites. The discussed IRN
script is currently in submission for publication.
Heatmaps
The fold-change data, after IRN, were log 2 transformed and clustered by average linkage
using Cluster software, version 3.0 (Eisen Lab, Berkeley, CA). This data was then
displayed in a heatmap generated by Java Treeview software91. Using a saturated color
scale ranging from +3 (red) to -3 (blue), visual comparison of concentration changes can
be observed. The two array comparisons are listed above each column on the heatmap.
Each cell has been overlaid with a symbol representing a specific p-value range (≤ 0.01
– “***”; ≤ 0.05 – “**”; ≤ 0.1 – “*”).

57
Partial least squares discriminant analysis (PLS-DA)
Within the field of metabolomics, a widely accepted statistical tool used to confirm
variation among variables is PLS-DA. As a two-dimensional, multivariate linear regression
model, PLS-DA finds the direction of maximum covariance between a data set (X) and
the class (Y)92. The original variables are compressed into fewer variables by using their
weighted averages, referred to as scores.
Following compilation of all spectral features detected (includes both identified and
unidentified spectral features), the grouped data was loaded into RStudio93. To generate
the PLS-DA data, the DiscriMiner package was utilized and specifically the PLS-DA
function. All data were normalized by using an auto-scaling method that attempts to scale
and center the data by dividing each value by the metabolites standard deviation. By
extracting the PLS-DA scores values, the visualization aid was generated using the ggplot
package with a 95% confidence interval. Variable importance projection (VIP) score plots
were also generated from the plsDA function of DiscriMiner. These VIP plots only
represent the identified spectral features to facilitate interpretation.
Identification and Statistical Reduction of USFs
The MAVEN software includes a peak picking algorithm that generates a list of all spectral
features detected by the HRMS in a single sample. A user generated training model
establishes a quality score for each peak, which enables the software to identify
thousands of USFs from each sample. All peaks were confirmed manually to have a
proper Gaussian curve, 3:1 signal-to-blank, and an ion count greater than 103.
Next, the lists were reduced using Student’s t-tests for three separate array comparisons;
resistant vs. control, susceptible vs. control, and resistant vs. susceptible for mice or
dominant vs. control, subordinate vs. control, and dominant vs. subordinate for hamsters.
Using this statistical tool dramatically reduces the overall number of identified metabolites,
which are then manually investigated to remove any “known metabolites” that were
previously identified, as well as any carbon-13 isomers.

58
Finally, the web-based statistical analysis tools of Metaboanalyst43 were used to focus on
a small number of these USFs. Through cross comparison of the variable importance
projection (VIP) score plots generated from the PLS-DA and the mean decrease in
accuracy (MDA) plots from the random forest classification, a reduced list of ~30
important USFs were extrapolated and used for additional investigation. By viewing Table
1-1, the specific quantities of USFs after each step can be observed for each brain region.
Statistical Analysis
Data were analyzed using one-way ANOVAs followed by Tukey post-hocs and Student’s
t-tests, where appropriate. Statistical significance was set at α = 0.05. Data are reported
as mean ± SEM, except where noted. Statistical reduction of USFs was accomplished
using Student’s t-tests (p ≤ 0.05) and VIP score (≥ 1.0) and metabolites selected for
further discussion were confirmed to be significant through one-way ANOVA analysis and
Tukey’s post hoc tests.
1.8.2 Raw data files
The following tables are raw ion intensities from both hamsters and mice.

59
Table 1.3 Raw Data of Dominant Hamsters from BLA/CeA
Sample Name H2 H3 H4 H5 H12 H19 H21 H25 H28 H33 H38 H47
2-Aminoadipate 2.83E+04 3.80E+04 7.77E+04 4.72E+04 7.24E+04 7.44E+03 6.26E+03 6.53E+04 4.32E+04 6.97E+04 9.07E+04 6.60E+04 2-Hydroxy-2-methylsuccinate 2.15E+05 4.01E+05 8.34E+05 4.07E+05 7.14E+05 4.01E+05 3.59E+05 5.86E+05 2.58E+05 7.12E+05 8.64E+05 6.60E+05
3-Methoxytyramine 9.51E+04 1.29E+05 1.15E+05 1.01E+05 1.12E+05 1.41E+05 1.45E+05 1.18E+05 1.32E+05 1.15E+05 1.26E+05 1.11E+05 3_4-Dihydroxyphenylacetate 8.78E+04 5.68E+04 6.02E+04 5.89E+04 9.65E+04 7.66E+04 8.87E+04 7.09E+04 1.23E+05 7.88E+04 1.99E+05 3.45E+04
4-Aminobutyrate 6.48E+05 9.99E+05 8.53E+05 8.59E+05 1.56E+06 1.61E+06 1.64E+06 1.43E+06 1.75E+06 2.00E+06 1.82E+06 1.38E+06 5-Hydroxyindoleacetic acid 4.49E+04 3.20E+04 3.98E+04 1.42E+04 7.29E+04 4.19E+04 4.33E+04 4.34E+04 6.85E+04 9.16E+04 4.21E+04 4.13E+04
6-Phospho-D-gluconate 1.60E+05 1.74E+05 1.80E+05 1.72E+05 4.67E+03 7.70E+03 7.85E+03 1.17E+05 9.13E+03 3.49E+03 8.78E+04 1.08E+05
Acadesine 2.99E+03 5.57E+03 9.27E+03 1.09E+04 9.53E+03 1.77E+04 1.64E+04 2.33E+04 1.49E+04 1.01E+04 2.29E+04 1.82E+04
Aconitate 1.68E+04 1.80E+04 1.35E+04 4.62E+04 1.24E+03 1.27E+03 1.44E+03 1.52E+05 1.62E+03 3.51E+03 8.95E+03 1.10E+04
Adenine 1.26E+05 3.52E+05 3.66E+04 1.10E+05 1.08E+05 2.15E+04 3.86E+04 1.47E+05 1.05E+05 6.58E+05 2.56E+05 2.49E+05
Adenosine 2.38E+05 5.83E+05 5.12E+04 2.23E+05 1.76E+05 3.20E+04 6.65E+04 2.76E+05 1.78E+05 8.67E+05 4.63E+05 3.72E+05
AICAR 1.87E+04 2.23E+04 3.46E+04 2.96E+04 6.86E+04 5.42E+04 4.87E+04 3.77E+04 5.14E+04 1.10E+05 9.13E+04 7.20E+04
Alanine 1.09E+06 1.67E+06 2.77E+06 2.02E+06 2.69E+06 2.62E+06 2.44E+06 2.92E+06 2.33E+06 2.76E+06 2.95E+06 2.48E+06
Allantoin 3.45E+03 5.95E+03 9.66E+03 1.57E+04 1.17E+04 6.78E+03 2.13E+04 3.83E+03 7.75E+03 1.12E+04 8.99E+03 7.26E+03
alpha-Ketoglutarate 7.92E+03 2.88E+04 1.56E+04 2.56E+04 1.32E+04 8.81E+03 8.75E+03 1.76E+04 7.93E+03 1.44E+04 2.42E+04 2.87E+04
AMP 2.03E+06 2.52E+06 3.70E+06 3.44E+06 3.67E+06 2.77E+06 2.14E+06 3.25E+06 2.68E+06 2.21E+06 3.33E+06 4.27E+06
Arginine 2.75E+03 2.66E+03 4.35E+03 6.53E+03 1.80E+04 8.12E+03 1.64E+04 1.44E+04 1.63E+04 2.23E+04 1.62E+04 6.36E+03
Ascorbate 7.39E+06 1.53E+07 2.28E+07 1.94E+07 2.18E+07 8.61E+05 5.63E+06 2.43E+07 1.50E+07 2.38E+07 4.31E+07 3.96E+07
Asparagine 1.21E+05 9.83E+04 1.00E+05 1.22E+05 1.60E+05 1.43E+05 1.11E+05 1.63E+05 1.54E+05 1.85E+05 1.63E+05 1.70E+05
Aspartate 4.67E+06 6.22E+06 8.70E+06 9.01E+06 1.04E+07 7.67E+06 6.18E+06 1.07E+07 9.18E+06 1.02E+07 1.07E+07 8.97E+06
Atrolactic acid 5.94E+04 4.51E+04 8.15E+04 5.25E+04 2.04E+05 1.06E+05 1.97E+05 4.42E+04 1.48E+05 2.82E+04 5.56E+04 4.55E+04
cAMP 3.46E+04 3.63E+04 3.39E+04 2.77E+04 2.26E+04 2.60E+04 3.06E+04 3.54E+04 1.85E+04 1.95E+04 3.14E+04 3.99E+04
CDP-ethanolamine 1.00E+05 1.16E+05 1.17E+05 1.14E+05 1.87E+05 8.83E+04 1.11E+05 1.28E+05 1.53E+05 1.71E+05 1.60E+05 1.45E+05
Citrate/isocitrate 2.26E+04 2.23E+04 3.04E+04 4.47E+04 3.28E+03 7.64E+03 1.06E+04 8.58E+04 7.34E+03 1.58E+04 5.12E+04 9.33E+04
Citrulline 4.10E+04 4.11E+04 6.30E+04 3.45E+04 1.21E+05 1.34E+05 9.25E+04 8.61E+04 9.72E+04 1.41E+05 1.20E+05 1.21E+05
CMP 1.94E+04 3.06E+04 6.65E+04 3.43E+04 7.05E+04 3.18E+04 4.58E+04 3.91E+04 4.33E+04 3.37E+04 5.00E+04 4.59E+04
Creatine 1.30E+06 1.61E+06 3.90E+06 2.44E+06 3.41E+06 3.52E+06 3.20E+06 4.28E+06 2.96E+06 3.74E+06 3.50E+06 3.48E+06
Creatinine 1.67E+04 1.64E+04 3.58E+04 1.59E+04 2.72E+04 3.20E+04 2.01E+04 4.42E+04 2.59E+04 3.59E+04 3.67E+04 3.03E+04
Cystathionine 6.98E+04 5.65E+04 1.55E+05 8.88E+04 2.03E+05 1.96E+05 1.75E+05 1.18E+05 1.63E+05 2.47E+05 1.89E+05 2.00E+05
Cysteine 1.59E+04 4.14E+04 6.78E+04 4.00E+04 1.77E+05 3.77E+04 4.37E+04 8.28E+04 2.27E+05 1.47E+05 1.23E+05 9.88E+04
Cystine 1.45E+03 4.92E+03 8.69E+03 4.61E+03 2.23E+04 3.35E+05 3.67E+05 4.82E+03 2.94E+04 4.81E+04 3.92E+03 7.50E+03

60
Table 1.3 Continued
Sample Name H2 H3 H4 H5 H12 H19 H21 H25 H28 H33 H38 H47
Cytidine 4.26E+04 5.68E+04 6.44E+04 9.74E+04 1.32E+05 1.21E+05 8.80E+04 1.47E+05 7.31E+04 1.34E+05 1.21E+05 1.02E+05
D-Gluconate 2.13E+05 8.35E+04 1.28E+05 1.51E+05 1.17E+05 1.44E+05 1.18E+05 1.86E+05 8.31E+04 1.42E+05 1.00E+05 1.07E+05 D-Glyceraldehdye 3-phosphate 1.74E+05 3.79E+05 2.96E+05 3.17E+05 3.16E+05 3.69E+05 1.46E+05 4.59E+05 2.21E+05 1.09E+05 2.14E+05 4.39E+05
Diiodothyronine 1.48E+05 1.48E+05 2.89E+05 3.08E+05 7.92E+05 6.14E+05 8.05E+05 2.97E+05 5.80E+05 1.02E+06 8.33E+05 9.21E+05
Dimethylglycine 6.48E+05 9.99E+05 8.53E+05 8.59E+05 1.56E+06 1.61E+06 1.64E+06 1.43E+06 1.75E+06 2.00E+06 1.82E+06 1.38E+06
Fumarate 1.07E+05 2.98E+05 4.14E+05 2.92E+05 8.11E+05 3.91E+05 3.46E+05 4.30E+05 5.77E+05 7.55E+05 3.95E+05 4.11E+05
Glucose 1-phosphate 1.60E+05 1.92E+05 8.57E+04 1.39E+05 2.35E+05 2.14E+05 2.92E+05 2.57E+05 2.71E+05 3.61E+05 2.70E+05 2.41E+05
Glucose 6-phosphate 2.78E+05 1.46E+05 1.09E+05 1.31E+05 1.63E+05 1.90E+05 1.68E+05 1.40E+05 1.55E+05 1.19E+05 1.85E+05 4.55E+05
Glutamate 7.71E+07 9.21E+07 1.07E+08 1.19E+08 1.06E+08 3.13E+07 3.37E+07 1.21E+08 8.42E+07 1.10E+08 1.31E+08 1.16E+08
Glutamine 1.96E+07 2.33E+07 2.32E+07 2.25E+07 3.89E+07 3.54E+07 3.56E+07 2.80E+07 3.20E+07 4.22E+07 3.46E+07 3.88E+07
Glutathione 8.93E+06 1.35E+07 1.59E+07 1.36E+07 1.39E+07 6.43E+06 7.60E+06 1.53E+07 1.17E+07 1.10E+07 1.94E+07 1.82E+07
Glutathione disulfide 1.13E+05 8.14E+04 4.27E+04 6.84E+04 2.72E+05 1.97E+05 2.41E+05 9.70E+04 2.30E+05 8.73E+05 8.58E+04 9.24E+04
Glycerate 3.57E+05 1.08E+05 1.23E+05 1.75E+05 6.78E+04 2.12E+05 1.56E+05 8.01E+05 9.18E+04 8.66E+04 9.98E+04 1.28E+05
Glycerone phosphate 1.74E+05 3.79E+05 2.96E+05 3.17E+05 3.16E+05 3.69E+05 1.46E+05 4.59E+05 2.21E+05 1.09E+05 2.14E+05 4.39E+05
GMP 1.31E+05 1.99E+05 2.30E+05 2.33E+05 4.58E+05 3.61E+05 4.16E+05 3.14E+05 3.37E+05 3.73E+05 3.09E+05 3.34E+05
Guanine 5.83E+03 5.55E+03 1.06E+04 8.05E+03 9.53E+03 1.29E+04 1.06E+04 8.40E+03 1.10E+04 1.62E+04 1.13E+04 1.72E+04
Guanosine 2.70E+05 4.93E+05 1.26E+05 1.28E+05 4.66E+05 2.31E+05 3.33E+05 3.83E+05 6.79E+05 1.14E+06 5.33E+05 3.30E+05
Histidine 7.29E+03 5.73E+03 1.29E+04 8.74E+03 3.03E+04 2.61E+04 3.55E+04 8.19E+03 2.93E+04 5.52E+04 2.23E+04 2.35E+04
Homocysteic acid 1.64E+04 2.56E+04 2.39E+04 1.33E+04 2.29E+04 6.36E+02 6.23E+03 2.35E+04 2.06E+04 2.10E+04 2.39E+04 1.51E+04
Homoserine 4.27E+05 6.29E+05 6.85E+05 7.64E+05 7.45E+05 1.04E+06 8.91E+05 1.03E+06 1.02E+06 1.13E+06 8.88E+05 1.16E+06
Homovanillic acid 8.18E+04 7.50E+04 7.80E+04 9.84E+04 8.92E+04 3.76E+04 3.27E+04 8.47E+04 7.56E+04 1.04E+05 1.04E+05 8.62E+04
Hydroxybenzoate 5.70E+04 2.71E+04 7.98E+04 2.45E+04 2.28E+04 2.35E+04 2.34E+04 2.09E+04 2.69E+04 1.17E+04 1.60E+04 9.24E+03
Hydroxyisocaproic acid 2.82E+05 2.53E+05 2.85E+05 2.86E+05 2.07E+05 1.50E+05 1.81E+05 4.63E+05 1.69E+05 9.94E+04 4.34E+05 4.62E+05
Hydroxyphenylpyruvate 4.82E+04 4.84E+04 4.07E+04 4.86E+04 4.46E+04 3.89E+04 9.67E+04 4.65E+04 4.28E+04 5.11E+04 4.57E+04 5.19E+04
Hypoxanthine 5.52E+05 5.46E+05 6.52E+05 2.44E+05 1.71E+06 1.40E+06 1.18E+06 1.08E+06 1.62E+06 1.70E+06 9.73E+05 9.23E+05
IMP 1.34E+05 1.13E+05 1.68E+05 1.43E+05 5.77E+05 3.18E+05 4.49E+05 3.20E+05 4.37E+05 4.44E+05 3.10E+05 1.78E+05
Indole-3-carboxylate 4.25E+03 2.32E+03 4.11E+03 2.34E+03 2.61E+03 3.20E+03 2.05E+03 2.67E+04 1.73E+03 4.16E+03 5.31E+03 1.83E+03
Inosine 2.67E+06 2.18E+06 2.31E+06 1.39E+06 4.81E+06 4.59E+06 5.53E+06 3.36E+06 5.56E+06 6.45E+06 4.06E+06 2.93E+06
Lactate 5.79E+07 6.38E+07 8.31E+07 6.99E+07 9.54E+07 2.45E+07 2.17E+07 8.24E+07 7.15E+07 9.03E+07 9.28E+07 1.00E+08
Leucine/Isoleucine 1.95E+05 3.10E+05 5.08E+05 3.51E+05 5.42E+05 5.69E+05 8.20E+05 5.80E+05 5.25E+05 6.17E+05 5.25E+05 6.38E+05
Malate 8.27E+05 1.21E+06 1.47E+06 1.19E+06 4.50E+04 3.97E+04 3.71E+04 1.04E+06 2.68E+04 3.19E+04 1.00E+06 1.07E+06
Mandelate 7.08E+05 6.53E+05 7.45E+05 5.79E+05 3.31E+05 2.34E+05 2.13E+05 7.26E+05 3.60E+05 1.46E+05 3.35E+05 4.81E+05

61
Table 1.3 Continued
Sample Name H2 H3 H4 H5 H12 H19 H21 H25 H28 H33 H38 H47
Methionine 4.61E+05 3.85E+05 5.97E+05 6.15E+05 7.32E+05 7.02E+05 6.28E+05 7.37E+05 6.70E+05 9.01E+05 9.24E+05 8.00E+05
Methionine sulfoxide 2.48E+05 1.66E+05 2.69E+05 2.59E+05 9.19E+04 7.29E+04 8.04E+04 3.53E+05 8.88E+04 7.34E+04 9.20E+04 1.45E+05
Methylmalonate 6.69E+06 1.30E+07 1.31E+07 1.51E+07 2.44E+06 1.60E+06 1.59E+06 1.27E+07 2.16E+06 2.60E+06 1.61E+07 1.61E+07
myo-Inositol 6.51E+05 6.12E+05 7.91E+05 6.51E+05 8.53E+05 6.76E+04 5.66E+04 8.19E+05 7.51E+05 8.52E+05 1.02E+06 7.93E+05
N-Acetyl-beta-alanine 1.93E+04 2.24E+04 2.72E+04 2.13E+04 2.73E+04 1.95E+04 1.63E+04 3.59E+04 2.69E+04 3.33E+04 3.10E+04 3.65E+04
N-Acetylglucosamine 4.35E+03 3.11E+03 4.38E+03 2.82E+03 3.93E+03 1.18E+03 5.04E+03 7.07E+03 1.91E+03 7.44E+03 5.90E+03 7.98E+03 N-Acetylglucosamine 1/6-phosphate 5.63E+03 5.94E+03 8.90E+03 5.83E+03 1.26E+04 1.05E+04 4.85E+03 8.83E+03 8.28E+03 1.27E+04 9.04E+03 1.52E+04
N-Acetylglutamate 4.15E+05 5.01E+05 6.78E+05 5.39E+05 5.65E+05 5.04E+05 3.72E+05 6.98E+05 5.68E+05 7.77E+05 8.40E+05 8.02E+05
N-Acetylglutamine 1.52E+05 2.23E+05 2.91E+05 3.43E+05 4.52E+05 2.36E+05 2.17E+05 3.82E+05 2.60E+05 4.95E+05 4.52E+05 5.43E+05
N-Acetylornithine 5.70E+03 8.67E+03 9.76E+03 6.62E+03 1.01E+04 7.98E+03 1.22E+04 1.34E+04 8.69E+03 1.98E+04 1.81E+04 1.25E+04 N-Carbamoyl-L-aspartate 2.31E+05 2.92E+05 3.46E+05 2.10E+05 4.04E+05 2.63E+05 2.53E+05 3.26E+05 2.02E+05 1.31E+05 3.71E+05 3.16E+05
NAD+ 5.46E+04 1.41E+05 7.50E+04 1.87E+05 8.56E+03 3.21E+04 4.36E+04 1.30E+05 5.61E+03 1.04E+04 1.58E+05 1.83E+05
Nicotinate 4.35E+04 7.27E+03 6.10E+03 7.80E+03 2.67E+03 7.33E+03 5.78E+03 3.11E+03 1.11E+04 3.81E+03 5.31E+03 4.67E+03
Orotate 4.51E+04 5.91E+04 4.70E+04 4.33E+04 5.62E+04 4.19E+04 3.46E+04 6.02E+04 4.60E+04 8.82E+04 1.13E+05 9.59E+04
Pantothenate 1.66E+06 2.07E+06 2.06E+06 1.92E+06 2.53E+06 2.52E+06 3.04E+06 2.94E+06 2.03E+06 2.52E+06 2.84E+06 2.63E+06
Phenylalanine 2.22E+05 1.89E+05 2.23E+05 2.54E+05 2.54E+05 4.69E+05 5.26E+05 2.62E+05 2.79E+05 3.61E+05 2.37E+05 2.89E+05
Phenylpyruvate 6.22E+03 2.79E+04 1.11E+04 4.60E+04 2.67E+03 1.00E+02 1.00E+02 2.29E+04 2.56E+03 2.74E+03 1.02E+05 8.24E+04
Phosphorylcholine 4.55E+04 5.26E+04 4.65E+04 4.74E+04 4.66E+05 1.18E+05 5.33E+04 2.49E+05 8.77E+04 5.74E+04 4.60E+05 1.75E+05
Prephenate 9.51E+04 1.08E+05 1.14E+05 9.21E+04 9.36E+05 5.57E+05 5.37E+05 1.01E+05 8.45E+05 9.06E+05 1.59E+05 1.64E+05
Proline 1.12E+05 1.21E+05 1.79E+05 1.30E+05 1.92E+05 1.74E+05 2.14E+05 2.03E+05 1.56E+05 2.57E+05 1.65E+05 2.13E+05
Pyroglutamic acid 2.04E+06 1.82E+06 1.59E+06 1.87E+06 2.88E+06 1.15E+06 1.46E+06 2.46E+06 3.00E+06 3.74E+06 1.75E+06 2.52E+06
Pyruvate 1.15E+06 1.34E+06 1.56E+06 1.47E+06 1.13E+06 1.22E+06 1.06E+06 8.30E+05 1.25E+06 1.45E+06 7.50E+05 1.05E+06
Ribose phosphate 1.29E+05 1.22E+05 1.08E+05 6.16E+04 4.84E+05 1.80E+05 2.23E+05 2.15E+05 4.05E+05 5.21E+05 2.65E+05 1.80E+05 S-Adenosyl-L-homocysteine 2.07E+03 1.14E+03 4.30E+03 7.23E+02 3.04E+03 4.76E+03 4.70E+03 3.46E+03 8.85E+03 6.51E+03 4.19E+03 3.13E+03
Sarcosine 1.09E+06 1.67E+06 2.77E+06 2.02E+06 2.69E+06 2.62E+06 2.44E+06 2.92E+06 2.33E+06 2.76E+06 2.95E+06 2.48E+06 Sedoheptulose 1/7-phosphate 1.95E+04 1.55E+04 1.60E+04 1.09E+04 1.17E+04 4.97E+03 4.68E+03 2.46E+04 2.62E+04 6.13E+03 2.29E+04 2.69E+04
Serine 1.48E+06 1.96E+06 2.59E+06 2.46E+06 3.42E+06 3.27E+06 3.28E+06 3.43E+06 2.72E+06 4.07E+06 3.36E+06 3.45E+06 sn-Glycerol 3-phosphate 1.12E+05 1.42E+05 4.89E+04 1.49E+05 3.14E+04 7.33E+04 3.57E+04 1.17E+05 2.00E+04 3.29E+04 7.63E+04 7.40E+04
Succinate 6.69E+06 1.30E+07 1.31E+07 1.51E+07 2.44E+06 1.60E+06 1.59E+06 1.27E+07 2.16E+06 2.60E+06 1.61E+07 1.61E+07
Sulfolactate 1.46E+04 1.93E+04 1.28E+04 3.71E+04 2.46E+03 1.96E+03 2.39E+03 1.18E+05 2.23E+03 2.29E+03 2.65E+03 1.38E+04

62
Table 1.3 Continued
Sample Name H2 H3 H4 H5 H12 H19 H21 H25 H28 H33 H38 H47
Taurine 1.78E+07 2.00E+07 2.20E+07 2.25E+07 2.92E+07 2.13E+07 3.04E+07 2.52E+07 2.72E+07 2.94E+07 3.35E+07 3.33E+07
Threonine 4.27E+05 6.29E+05 6.85E+05 7.64E+05 7.45E+05 1.04E+06 8.91E+05 1.03E+06 1.02E+06 1.13E+06 8.88E+05 1.16E+06
Thymidine 3.42E+03 2.48E+03 4.64E+03 4.57E+03 5.46E+03 1.00E+02 1.00E+02 3.68E+03 2.57E+03 9.90E+03 6.88E+03 8.69E+03
Trehalose/sucrose 9.91E+04 7.43E+04 7.47E+04 2.12E+05 4.53E+04 7.22E+04 6.26E+04 3.80E+04 3.43E+04 4.77E+04 2.27E+04 5.56E+04
Tryptophan 2.19E+05 2.94E+05 3.71E+05 3.46E+05 4.40E+05 2.20E+05 2.41E+05 4.11E+05 2.63E+05 3.96E+05 4.06E+05 5.33E+05
Tyrosine 1.02E+06 1.43E+06 1.75E+06 2.00E+06 1.76E+06 1.27E+06 1.42E+06 1.82E+06 1.50E+06 2.20E+06 1.88E+06 2.24E+06
UDP-glucose 2.15E+05 2.23E+05 3.71E+05 3.36E+05 5.98E+05 3.59E+05 7.08E+05 3.98E+05 5.34E+05 5.17E+05 4.71E+05 3.58E+05 UDP-N-acetylglucosamine 2.22E+05 2.18E+05 3.22E+05 3.37E+05 5.29E+05 3.71E+05 4.88E+05 4.02E+05 5.07E+05 5.36E+05 4.10E+05 3.57E+05
UMP 2.37E+05 3.40E+05 4.73E+05 4.19E+05 5.44E+05 3.09E+05 3.06E+05 5.07E+05 3.47E+05 4.20E+05 6.48E+05 5.91E+05
Uracil 8.50E+04 9.47E+04 1.11E+05 5.48E+04 4.70E+05 5.44E+05 4.78E+05 5.12E+05 4.67E+05 6.22E+05 3.22E+05 2.51E+05
Uric acid 1.26E+05 8.92E+04 1.32E+05 1.32E+05 8.04E+04 4.55E+04 9.07E+04 5.56E+04 3.87E+04 7.18E+04 6.85E+04 8.35E+04
Uridine 3.88E+04 3.51E+04 4.67E+04 4.43E+04 6.31E+04 4.88E+04 5.54E+04 5.61E+04 6.29E+04 7.63E+04 6.22E+04 6.04E+04
Valine 4.08E+05 5.10E+05 6.20E+05 6.00E+05 7.29E+05 5.57E+05 7.61E+05 8.38E+05 6.93E+05 8.01E+05 7.75E+05 8.91E+05
Xanthine 1.48E+03 4.10E+03 4.38E+03 2.97E+03 1.01E+04 2.56E+03 1.07E+04 4.23E+03 1.59E+03 1.43E+03 6.69E+03 2.94E+03
Xanthosine 7.53E+03 5.95E+03 3.80E+03 4.20E+03 9.68E+03 5.40E+03 4.23E+03 1.24E+04 1.15E+04 1.26E+04 6.43E+03 3.54E+03

63
Table 1.4 Raw Data of Handled Control Hamsters from BLA
Sample Name H1 H10 H11 H18 H26 H31 H32 H34 H43 H44 H49 H53
2-Aminoadipate 2.75E+04 4.90E+04 2.87E+04 4.42E+04 3.83E+04 1.37E+04 2.34E+04 6.01E+04 1.69E+03 4.39E+04 5.63E+04 5.31E+04
2-Hydroxy-2-methylsuccinate 1.42E+05 2.87E+05 1.71E+05 2.60E+05 6.65E+05 2.91E+05 3.12E+05 4.40E+05 1.08E+05 3.51E+05 6.62E+05 4.51E+05
3-Methoxytyramine 8.94E+04 8.65E+04 9.49E+04 1.36E+05 1.14E+05 1.18E+05 1.24E+05 1.32E+05 1.34E+05 1.18E+05 1.27E+05 1.18E+05
3_4-Dihydroxyphenylacetate 6.24E+04 4.35E+04 3.83E+04 5.44E+04 1.10E+05 1.17E+05 1.32E+05 1.20E+05 1.05E+05 5.28E+04 6.14E+04 4.98E+04
4-Aminobutyrate 1.09E+06 9.78E+05 1.18E+06 8.43E+05 1.27E+06 1.81E+06 2.15E+06 1.81E+06 1.48E+06 1.18E+06 1.23E+06 1.26E+06
5-Hydroxyindoleacetic acid 2.49E+04 1.68E+04 2.21E+04 2.05E+04 4.98E+04 6.40E+04 6.91E+04 1.01E+05 3.56E+04 1.39E+04 1.52E+04 2.84E+04
6-Phospho-D-gluconate 7.09E+04 1.20E+05 1.30E+05 1.93E+05 1.89E+05 5.39E+03 1.41E+04 1.06E+04 7.64E+03 1.18E+05 1.46E+05 7.94E+04
Acadesine 9.61E+03 1.72E+04 2.41E+04 7.74E+03 1.57E+04 1.28E+04 1.99E+04 1.13E+04 1.74E+04 1.54E+04 2.04E+04 2.88E+04
Aconitate 5.74E+03 8.70E+03 1.54E+04 4.33E+04 3.57E+04 1.31E+03 1.41E+03 2.62E+03 1.43E+03 1.17E+04 1.65E+04 6.48E+03
Adenine 2.37E+05 1.70E+05 1.47E+05 1.51E+05 2.09E+05 1.18E+05 4.96E+05 4.78E+05 6.99E+04 1.01E+05 1.36E+05 9.15E+04
Adenosine 4.52E+05 3.31E+05 2.85E+05 2.73E+05 4.25E+05 2.01E+05 7.10E+05 7.83E+05 1.04E+05 1.95E+05 2.92E+05 1.61E+05
AICAR 6.14E+04 5.24E+04 5.24E+04 1.82E+04 4.65E+04 6.61E+04 6.33E+04 8.45E+04 3.71E+04 7.67E+04 7.98E+04 6.90E+04
Alanine 2.10E+06 2.40E+06 2.23E+06 1.90E+06 2.31E+06 2.47E+06 2.50E+06 3.25E+06 2.07E+06 2.70E+06 2.73E+06 3.27E+06
Allantoin 7.79E+03 1.98E+03 4.00E+03 3.93E+03 1.18E+04 1.36E+04 8.43E+03 7.02E+03 8.05E+03 6.22E+03 5.34E+03 5.88E+03
alpha-Ketoglutarate 1.90E+04 2.22E+04 2.26E+04 1.97E+04 2.71E+04 8.76E+03 1.51E+04 6.72E+03 7.46E+03 2.08E+04 1.52E+04 1.87E+04
AMP 3.86E+06 3.01E+06 2.79E+06 2.45E+06 2.66E+06 2.24E+06 1.97E+06 1.81E+06 6.79E+05 4.55E+06 5.52E+06 3.90E+06
Arginine 4.20E+03 5.16E+03 1.17E+04 8.68E+03 2.19E+04 1.99E+04 1.72E+04 1.62E+04 9.32E+03 5.44E+03 1.39E+04 8.69E+03
Ascorbate 1.69E+07 2.51E+07 2.62E+07 1.81E+07 2.56E+07 1.32E+07 6.96E+06 2.95E+07 2.61E+06 2.84E+07 3.05E+07 2.88E+07
Asparagine 1.86E+05 1.56E+05 1.07E+05 8.48E+04 1.38E+05 1.92E+05 2.02E+05 2.08E+05 9.46E+04 1.80E+05 1.37E+05 1.36E+05
Aspartate 6.69E+06 9.06E+06 9.41E+06 6.81E+06 1.25E+07 1.03E+07 1.06E+07 1.07E+07 5.04E+06 1.02E+07 1.01E+07 8.48E+06
Atrolactic acid 4.88E+04 5.89E+04 5.17E+04 6.40E+04 5.37E+04 8.08E+04 4.92E+04 1.07E+05 4.21E+04 5.44E+04 8.23E+04 8.02E+04
cAMP 4.06E+04 3.77E+04 3.59E+04 2.46E+04 2.90E+04 2.56E+04 2.23E+04 2.07E+04 1.28E+04 5.38E+04 6.29E+04 3.35E+04
CDP-ethanolamine 1.19E+05 1.29E+05 9.61E+04 1.07E+05 1.23E+05 1.63E+05 1.80E+05 1.82E+05 6.36E+04 1.21E+05 1.38E+05 1.25E+05
Citrate/isocitrate 5.92E+03 5.27E+04 5.36E+04 7.85E+04 6.88E+04 1.36E+04 1.31E+04 2.93E+04 1.14E+04 8.04E+04 7.68E+04 7.07E+04
Citrulline 7.27E+04 6.56E+04 8.38E+04 8.01E+04 7.52E+04 1.33E+05 1.68E+05 1.24E+05 9.35E+04 6.04E+04 1.00E+05 6.36E+04
CMP 3.54E+04 3.75E+04 3.62E+04 2.96E+04 3.31E+04 4.39E+04 3.53E+04 5.47E+04 2.15E+04 5.45E+04 5.21E+04 3.68E+04
Creatine 2.63E+06 3.44E+06 2.92E+06 2.66E+06 3.03E+06 3.06E+06 3.18E+06 4.42E+06 2.96E+06 3.73E+06 3.45E+06 4.24E+06
Creatinine 2.51E+04 2.57E+04 2.91E+04 2.32E+04 3.19E+04 3.21E+04 3.79E+04 4.40E+04 2.57E+04 3.33E+04 3.87E+04 2.96E+04
Cystathionine 1.21E+05 1.46E+05 1.30E+05 7.27E+04 1.07E+05 1.87E+05 1.88E+05 2.84E+05 1.28E+05 1.83E+05 2.06E+05 3.11E+05
Cysteine 2.52E+04 4.61E+04 8.55E+04 4.13E+04 8.65E+04 1.10E+05 3.62E+04 3.01E+05 9.75E+03 2.71E+04 3.94E+04 6.08E+04
Cystine 3.02E+03 2.53E+03 2.06E+03 7.98E+03 5.54E+04 7.44E+04 6.29E+04 6.21E+04 2.08E+05 5.66E+03 2.85E+03 3.65E+03
Cytidine 7.43E+04 1.33E+05 8.82E+04 7.25E+04 1.29E+05 7.51E+04 9.57E+04 1.24E+05 7.09E+04 1.15E+05 1.11E+05 1.46E+05
D-Gluconate 1.12E+05 7.14E+04 7.47E+04 1.28E+05 2.17E+05 2.70E+05 1.95E+05 1.40E+05 1.08E+05 8.37E+04 1.12E+05 1.53E+05
D-Glyceraldehdye 3-phosphate 4.41E+05 2.18E+05 1.98E+05 1.97E+05 2.14E+05 1.08E+05 1.65E+05 1.53E+05 9.56E+04 4.23E+05 5.82E+05 3.85E+05

64
Table 1.4 Continued
Sample Name H1 H10 H11 H18 H26 H31 H32 H34 H43 H44 H49 H53
Diiodothyronine 5.87E+05 6.96E+05 7.23E+05 2.19E+05 5.94E+05 1.04E+06 9.99E+05 1.10E+06 4.61E+05 6.72E+05 7.10E+05 5.60E+05
Dimethylglycine 1.09E+06 9.78E+05 1.18E+06 8.43E+05 1.27E+06 1.81E+06 2.15E+06 1.81E+06 1.48E+06 1.18E+06 1.23E+06 1.26E+06
Fumarate 1.75E+05 2.00E+05 1.78E+05 1.98E+05 3.03E+05 6.93E+05 8.73E+05 9.35E+05 1.33E+05 2.84E+05 3.10E+05 2.71E+05
Glucose 1-phosphate 1.62E+05 1.73E+05 1.78E+05 1.55E+05 2.03E+05 3.93E+05 4.53E+05 4.92E+05 1.75E+05 1.43E+05 2.42E+05 1.62E+05
Glucose 6-phosphate 2.11E+05 9.35E+04 8.23E+04 7.83E+04 1.14E+05 1.15E+05 9.59E+04 1.53E+05 6.89E+04 1.97E+05 3.12E+05 1.43E+05
Glutamate 9.90E+07 1.13E+08 9.78E+07 9.41E+07 1.25E+08 9.64E+07 1.06E+08 1.15E+08 2.04E+07 1.10E+08 1.17E+08 1.17E+08
Glutamine 3.87E+07 3.06E+07 2.98E+07 2.39E+07 3.54E+07 4.17E+07 5.01E+07 5.09E+07 2.65E+07 3.37E+07 3.27E+07 3.46E+07
Glutathione 1.20E+07 1.64E+07 1.48E+07 1.40E+07 1.65E+07 1.21E+07 8.36E+06 1.45E+07 4.77E+06 1.74E+07 1.74E+07 1.59E+07
Glutathione disulfide 1.53E+05 1.76E+05 8.41E+04 9.12E+04 1.27E+05 9.90E+05 1.68E+06 6.63E+05 4.69E+05 9.88E+04 1.60E+05 7.25E+04
Glycerate 9.79E+04 9.55E+04 1.38E+05 2.83E+05 3.88E+05 9.16E+04 7.68E+04 9.70E+04 1.60E+05 9.68E+04 1.08E+06 1.58E+05
Glycerone phosphate 4.41E+05 2.18E+05 1.98E+05 1.97E+05 2.14E+05 1.08E+05 1.65E+05 1.53E+05 9.56E+04 4.23E+05 5.82E+05 3.85E+05
GMP 2.45E+05 2.18E+05 1.85E+05 2.40E+05 2.79E+05 4.43E+05 4.23E+05 4.33E+05 1.65E+05 2.44E+05 2.89E+05 2.46E+05
Guanine 7.67E+03 1.10E+04 6.74E+03 6.55E+03 1.04E+04 1.20E+04 7.15E+03 1.38E+04 4.86E+03 1.22E+04 1.35E+04 1.45E+04
Guanosine 2.86E+05 2.47E+05 2.30E+05 1.95E+05 4.20E+05 4.82E+05 1.08E+06 1.27E+06 3.29E+05 8.65E+04 1.77E+05 1.32E+05
Histidine 1.80E+04 1.05E+04 2.04E+04 8.84E+03 2.37E+04 2.67E+04 1.83E+04 3.17E+04 1.13E+04 1.12E+04 2.34E+04 1.76E+04
Homocysteic acid 2.62E+04 2.39E+04 1.97E+04 1.60E+04 1.93E+04 1.90E+04 7.46E+03 2.20E+04 2.60E+03 2.55E+04 2.43E+04 2.63E+04
Homoserine 8.89E+05 7.29E+05 8.88E+05 6.19E+05 9.87E+05 1.12E+06 1.44E+06 1.26E+06 8.10E+05 9.63E+05 1.08E+06 1.11E+06
Homovanillic acid 1.06E+05 8.05E+04 7.94E+04 9.13E+04 9.83E+04 7.23E+04 7.81E+04 9.01E+04 4.11E+04 1.07E+05 9.41E+04 9.73E+04
Hydroxybenzoate 2.27E+04 1.89E+04 1.84E+04 3.55E+04 2.93E+04 1.82E+04 2.34E+04 2.27E+04 1.55E+04 1.86E+04 2.50E+04 2.23E+04
Hydroxyisocaproic acid 2.81E+05 2.90E+05 3.89E+05 3.64E+05 4.66E+05 1.73E+05 1.58E+05 1.57E+05 9.75E+04 4.16E+05 1.96E+05 2.87E+05
Hydroxyphenylpyruvate 3.75E+04 4.88E+04 5.04E+04 4.19E+04 5.14E+04 4.35E+04 4.62E+04 4.57E+04 4.27E+04 4.94E+04 3.78E+04 4.90E+04
Hypoxanthine 2.81E+05 6.03E+05 4.96E+05 5.00E+05 2.03E+06 1.96E+06 2.18E+06 2.26E+06 9.27E+05 2.31E+05 9.72E+05 5.33E+05
IMP 1.90E+05 2.99E+05 3.37E+05 3.03E+05 5.79E+05 6.14E+05 4.26E+05 5.67E+05 1.47E+05 1.76E+05 2.01E+05 2.81E+05
Indole-3-carboxylate 2.59E+03 2.70E+03 2.72E+03 6.25E+03 5.36E+03 3.37E+03 4.54E+03 2.05E+03 2.15E+03 4.36E+03 5.03E+03 2.61E+03
Inosine 1.76E+06 2.31E+06 1.94E+06 2.13E+06 3.15E+06 5.64E+06 6.36E+06 8.06E+06 4.26E+06 8.81E+05 1.16E+06 1.72E+06
Lactate 7.10E+07 7.15E+07 6.64E+07 7.03E+07 8.44E+07 6.18E+07 9.12E+07 8.27E+07 1.86E+07 6.22E+07 7.38E+07 6.86E+07
Leucine/Isoleucine 5.03E+05 5.04E+05 5.74E+05 4.36E+05 7.91E+05 7.09E+05 9.29E+05 6.77E+05 3.86E+05 5.00E+05 8.70E+05 6.39E+05
Malate 5.95E+05 7.69E+05 6.30E+05 8.95E+05 1.18E+06 3.39E+04 4.10E+04 2.94E+04 2.64E+04 7.28E+05 7.86E+05 5.02E+05
Malate 3.38E+06 5.22E+06 4.76E+06 4.70E+06 7.25E+06 6.43E+06 7.82E+06 7.52E+06 3.26E+06 5.38E+06 6.24E+06 5.21E+06
Mandelate 6.53E+05 2.92E+05 3.56E+05 6.69E+05 3.95E+05 2.43E+05 2.74E+05 2.61E+05 2.30E+05 4.00E+05 4.33E+05 6.64E+05
Methionine 5.01E+05 6.83E+05 6.25E+05 5.52E+05 7.66E+05 5.89E+05 6.51E+05 1.00E+06 4.21E+05 6.73E+05 7.19E+05 6.82E+05
Methionine sulfoxide 9.99E+04 1.66E+05 1.57E+05 2.24E+05 1.50E+05 6.47E+04 5.19E+04 1.03E+05 1.17E+05 1.46E+05 1.06E+05 1.07E+05
Methylmalonate 1.44E+07 1.25E+07 1.11E+07 1.06E+07 1.23E+07 3.33E+06 3.47E+06 3.44E+06 2.37E+06 1.77E+07 2.44E+07 1.94E+07
myo-Inositol 7.23E+05 7.48E+05 7.34E+05 6.75E+05 8.69E+05 1.34E+05 8.74E+05 7.23E+05 4.11E+04 8.66E+05 7.84E+05 7.83E+05
N-Acetyl-beta-alanine 2.16E+04 2.12E+04 2.63E+04 1.58E+04 3.45E+04 2.23E+04 2.63E+04 3.36E+04 1.22E+04 1.89E+04 4.96E+04 3.50E+04
N-Acetylglucosamine 2.58E+03 6.07E+03 5.61E+03 2.67E+03 3.57E+03 7.52E+03 2.06E+03 7.73E+03 9.08E+02 5.76E+03 9.64E+03 5.48E+03

65
Table 1.4 Continued
Sample Name H1 H10 H11 H18 H26 H31 H32 H34 H43 H44 H49 H53 N-Acetylglucosamine 1/6-phosphate 6.62E+03 6.79E+03 3.77E+03 5.01E+03 3.93E+03 1.33E+04 1.79E+04 1.71E+04 3.31E+03 5.73E+03 7.57E+03 3.93E+03
N-Acetylglutamate 3.93E+05 5.60E+05 6.13E+05 4.73E+05 6.47E+05 6.58E+05 7.38E+05 7.65E+05 2.80E+05 5.56E+05 8.53E+05 5.53E+05
N-Acetylglutamine 3.06E+05 2.83E+05 2.30E+05 3.42E+05 4.07E+05 4.67E+05 5.80E+05 5.89E+05 1.69E+05 3.55E+05 4.98E+05 4.90E+05
N-Acetylornithine 1.38E+04 8.35E+03 1.42E+04 5.61E+03 1.36E+04 1.21E+04 1.43E+04 1.51E+04 1.06E+04 1.47E+04 1.28E+04 1.45E+04
N-Carbamoyl-L-aspartate 2.79E+05 3.22E+05 3.96E+05 2.04E+05 3.66E+05 4.08E+05 3.60E+05 4.20E+05 2.72E+05 3.36E+05 3.67E+05 2.91E+05
NAD+ 1.69E+05 1.60E+05 2.42E+05 1.40E+05 1.35E+05 2.22E+04 8.13E+03 1.04E+04 1.27E+04 2.85E+05 3.31E+05 1.68E+05
Nicotinate 6.27E+03 7.20E+03 5.46E+03 4.89E+03 1.04E+04 3.74E+03 7.50E+03 5.16E+03 6.97E+03 4.68E+03 1.06E+04 9.70E+03
Orotate 4.81E+04 7.87E+04 6.76E+04 5.31E+04 1.31E+05 1.11E+05 8.51E+04 1.23E+05 4.33E+04 6.36E+04 7.79E+04 5.47E+04
Pantothenate 2.34E+06 2.63E+06 2.24E+06 2.29E+06 2.90E+06 2.99E+06 2.90E+06 3.05E+06 2.42E+06 2.37E+06 3.01E+06 2.34E+06
Phenylalanine 2.15E+05 2.42E+05 2.60E+05 2.24E+05 3.96E+05 5.45E+05 3.26E+05 3.22E+05 4.26E+05 2.21E+05 4.35E+05 2.65E+05
Phenylpyruvate 2.34E+04 3.74E+04 7.33E+04 5.76E+04 1.00E+02 1.78E+03 2.57E+03 2.75E+03 1.91E+03 5.47E+04 1.53E+04 2.02E+04
Phosphorylcholine 5.05E+04 8.71E+04 1.11E+05 9.87E+04 1.08E+05 5.66E+04 8.87E+04 6.33E+04 7.63E+04 5.08E+04 6.15E+04 5.23E+04
Prephenate 1.61E+05 1.20E+05 1.16E+05 1.03E+05 1.31E+05 7.96E+05 8.33E+05 8.66E+05 5.45E+05 1.42E+05 1.32E+05 2.11E+05
Proline 1.17E+05 1.36E+05 1.36E+05 1.17E+05 1.91E+05 2.05E+05 2.11E+05 2.73E+05 1.26E+05 1.65E+05 1.97E+05 1.97E+05
Pyroglutamic acid 2.77E+06 2.39E+06 2.67E+06 1.80E+06 5.56E+06 3.33E+06 5.11E+06 4.28E+06 1.05E+06 1.81E+06 4.23E+06 3.39E+06
Pyruvate 1.47E+06 9.11E+05 8.57E+05 8.66E+05 1.73E+06 2.24E+06 2.13E+06 2.11E+06 7.88E+05 7.94E+05 9.91E+05 1.31E+06
Ribose phosphate 8.68E+04 1.11E+05 8.94E+04 1.18E+05 1.95E+05 3.38E+05 6.12E+05 6.50E+05 1.57E+05 4.82E+04 6.57E+04 1.07E+05
S-Adenosyl-L-homocysteine 1.00E+02 4.19E+03 7.18E+03 7.84E+03 6.16E+03 1.01E+04 3.69E+03 8.67E+03 4.13E+03 2.76E+03 1.17E+03 4.12E+03
Sarcosine 2.10E+06 2.40E+06 2.23E+06 1.90E+06 2.31E+06 2.47E+06 2.50E+06 3.25E+06 2.07E+06 2.70E+06 2.73E+06 3.27E+06
Sedoheptulose 1/7-phosphate 1.69E+04 1.35E+04 6.80E+03 1.42E+04 1.33E+04 1.99E+03 3.61E+03 7.00E+03 2.67E+03 5.97E+03 1.27E+04 1.44E+04
Serine 2.72E+06 3.60E+06 3.03E+06 2.38E+06 3.84E+06 3.88E+06 4.04E+06 4.04E+06 2.97E+06 3.36E+06 3.72E+06 4.10E+06
sn-Glycerol 3-phosphate 1.82E+05 8.94E+04 1.15E+05 1.19E+05 1.12E+05 2.43E+04 2.97E+04 3.02E+04 1.61E+04 2.50E+05 9.75E+05 8.94E+04
Succinate 1.44E+07 1.25E+07 1.11E+07 1.06E+07 1.23E+07 3.33E+06 3.47E+06 3.44E+06 2.37E+06 1.77E+07 2.44E+07 1.94E+07
Sulfolactate 2.26E+03 7.23E+03 2.37E+04 4.98E+04 3.30E+04 1.84E+03 2.88E+03 2.81E+03 2.33E+03 2.48E+03 4.76E+03 2.22E+03
Taurine 2.41E+07 3.16E+07 3.34E+07 2.32E+07 3.16E+07 3.82E+07 3.43E+07 3.77E+07 2.44E+07 2.99E+07 3.40E+07 2.57E+07
Threonine 8.89E+05 7.29E+05 8.88E+05 6.19E+05 9.87E+05 1.12E+06 1.44E+06 1.26E+06 8.10E+05 9.63E+05 1.08E+06 1.11E+06
Thymidine 4.53E+03 7.57E+03 1.24E+03 3.39E+03 7.70E+03 3.48E+03 7.04E+03 1.10E+04 1.00E+02 3.15E+03 6.98E+03 4.22E+03
Trehalose/sucrose 9.91E+04 4.80E+04 6.19E+04 4.02E+04 1.08E+05 5.77E+04 8.48E+04 3.91E+04 6.89E+04 3.02E+04 3.82E+04 6.79E+04
Tryptophan 2.94E+05 3.73E+05 2.98E+05 3.23E+05 5.15E+05 3.59E+05 3.83E+05 4.43E+05 1.47E+05 3.10E+05 5.64E+05 3.00E+05
Tyrosine 1.52E+06 1.84E+06 1.55E+06 1.38E+06 2.02E+06 1.76E+06 1.90E+06 1.99E+06 1.28E+06 1.72E+06 2.27E+06 2.00E+06
UDP-glucose 3.05E+05 3.33E+05 3.12E+05 3.65E+05 4.23E+05 7.69E+05 6.96E+05 1.00E+06 4.79E+05 3.33E+05 3.90E+05 3.74E+05
UDP-N-acetylglucosamine 2.80E+05 2.71E+05 2.74E+05 3.19E+05 4.09E+05 8.13E+05 8.07E+05 1.00E+06 4.60E+05 3.08E+05 3.80E+05 3.45E+05
UMP 3.66E+05 4.76E+05 3.86E+05 4.67E+05 5.36E+05 4.13E+05 3.45E+05 4.49E+05 1.49E+05 6.10E+05 6.85E+05 5.13E+05
Uracil 7.46E+04 2.37E+05 2.35E+05 2.35E+05 4.55E+05 5.22E+05 8.23E+05 7.05E+05 3.51E+05 3.66E+04 4.06E+05 2.07E+05
Uric acid 1.56E+05 7.75E+04 8.28E+04 5.32E+04 2.51E+05 1.37E+05 9.80E+04 8.66E+04 3.40E+04 3.18E+04 9.07E+04 5.43E+04
Uridine 3.67E+04 5.52E+04 5.40E+04 4.56E+04 6.26E+04 7.54E+04 6.39E+04 7.63E+04 4.07E+04 6.17E+04 6.43E+04 5.98E+04

66
Table 1.4 Continued
Sample Name H1 H10 H11 H18 H26 H31 H32 H34 H43 H44 H49 H53
Uridine 6.41E+05 6.01E+05 5.02E+05 5.80E+05 7.26E+05 1.21E+06 1.10E+06 1.19E+06 4.09E+05 4.32E+05 6.47E+05 5.49E+05
Valine 6.68E+05 6.58E+05 7.37E+05 5.58E+05 1.10E+06 8.57E+05 8.30E+05 9.35E+05 4.05E+05 8.30E+05 1.06E+06 8.43E+05
Xanthine 2.25E+03 1.73E+03 3.21E+03 3.61E+03 3.87E+03 7.21E+03 1.47E+03 2.46E+03 2.11E+03 2.29E+03 1.16E+03 6.48E+03
Xanthine 2.65E+05 4.19E+05 4.06E+05 2.22E+05 1.08E+06 7.13E+05 8.79E+05 1.05E+06 4.61E+05 2.77E+05 8.37E+05 2.05E+05
Xanthosine 3.40E+03 3.18E+03 2.13E+03 4.12E+03 8.69E+03 9.05E+03 1.45E+04 1.17E+04 1.66E+03 3.29E+03 7.34E+03 2.02E+03

67
Table 1.5 Raw Data of Subordinate Hamsters from BLA
Sample Name H6 H7 H8 H9 H14 H15 H17 H23 H24 H35 H36 H41
2-Aminoadipate 6.46E+04 6.86E+04 5.45E+04 3.98E+04 3.62E+04 4.26E+03 5.75E+03 4.81E+04 3.56E+04 6.69E+03 3.81E+04 4.93E+04 2-Hydroxy-2-methylsuccinate 1.05E+06 4.90E+05 3.08E+05 2.75E+05 5.88E+05 1.87E+05 3.58E+05 4.46E+05 5.05E+05 1.82E+05 3.77E+05 5.91E+05
3-Methoxytyramine 1.19E+05 1.03E+05 1.04E+05 1.10E+05 1.40E+05 1.12E+05 1.17E+05 1.31E+05 1.30E+05 1.37E+05 1.26E+05 1.43E+05 3_4-Dihydroxyphenylacetate 2.42E+05 5.65E+04 5.45E+04 5.77E+04 1.18E+05 8.05E+04 7.17E+04 4.20E+04 4.75E+04 1.12E+05 6.46E+04 1.14E+05
4-Aminobutyrate 1.16E+06 1.05E+06 1.12E+06 1.61E+06 1.65E+06 1.72E+06 2.23E+06 1.33E+06 1.40E+06 1.80E+06 5.64E+05 1.75E+06 5-Hydroxyindoleacetic acid 4.28E+04 4.42E+04 5.59E+04 5.32E+04 6.32E+04 4.65E+04 9.08E+04 4.23E+04 3.59E+04 5.02E+04 2.93E+04 7.96E+04
6-Phospho-D-gluconate 1.25E+05 1.71E+05 1.74E+05 1.30E+05 7.51E+03 5.73E+03 2.67E+03 1.71E+05 8.63E+04 2.93E+03 1.65E+05 2.76E+03
Acadesine 2.74E+04 2.25E+04 1.11E+04 2.57E+04 1.12E+04 1.69E+04 1.57E+04 1.72E+04 2.30E+04 2.44E+04 1.88E+04 1.09E+04
Aconitate 1.09E+06 2.78E+04 1.56E+04 9.17E+03 1.69E+03 1.00E+02 1.38E+03 1.38E+04 6.91E+03 1.73E+03 2.08E+04 1.41E+03
Adenine 1.34E+05 8.50E+04 3.28E+05 9.07E+04 3.54E+05 3.01E+04 4.48E+04 3.17E+05 2.53E+05 5.06E+04 2.85E+05 1.53E+05
Adenosine 2.87E+05 1.90E+05 5.87E+05 1.87E+05 5.90E+05 4.37E+04 7.09E+04 5.35E+05 4.44E+05 8.74E+04 4.22E+05 2.60E+05
AICAR 4.53E+04 4.48E+04 5.58E+04 5.89E+04 5.13E+04 5.44E+04 6.94E+04 6.34E+04 6.93E+04 4.13E+04 2.30E+04 6.66E+04
Alanine 2.89E+06 2.88E+06 2.39E+06 2.85E+06 2.81E+06 2.29E+06 2.49E+06 2.46E+06 2.44E+06 1.93E+06 2.08E+06 2.62E+06
Allantoin 6.35E+03 3.99E+03 5.25E+03 5.61E+03 5.83E+03 8.07E+03 9.64E+03 5.02E+03 8.78E+03 7.68E+03 5.04E+03 7.09E+03
alpha-Ketoglutarate 2.33E+04 2.43E+04 1.62E+04 1.62E+04 1.49E+04 9.87E+03 1.27E+04 1.45E+04 1.55E+04 8.43E+03 2.19E+04 1.01E+04
AMP 3.95E+06 3.27E+06 2.91E+06 3.31E+06 2.11E+06 1.34E+06 3.41E+06 2.54E+06 3.09E+06 1.49E+06 2.17E+06 2.93E+06
Arginine 7.51E+03 3.46E+03 4.07E+03 1.69E+04 1.51E+04 1.04E+04 3.07E+04 1.25E+04 1.06E+04 1.10E+04 8.78E+03 6.97E+03
Ascorbate 3.14E+07 2.53E+07 2.69E+07 2.74E+07 2.91E+07 4.61E+06 6.68E+06 3.08E+07 2.63E+07 2.46E+06 1.74E+07 5.72E+06
Asparagine 1.89E+05 8.95E+04 1.75E+05 2.07E+05 1.73E+05 1.07E+05 2.48E+05 1.46E+05 1.75E+05 1.37E+05 1.09E+05 1.61E+05
Aspartate 9.97E+06 8.94E+06 1.03E+07 1.07E+07 8.76E+06 5.95E+06 6.86E+06 9.07E+06 8.30E+06 5.88E+06 7.06E+06 8.70E+06
Atrolactic acid 7.90E+03 3.86E+04 6.66E+04 4.78E+04 8.90E+04 7.89E+04 5.92E+04 4.24E+04 6.89E+04 5.45E+04 3.19E+04 3.53E+04
cAMP 3.14E+04 2.97E+04 4.07E+04 3.83E+04 2.55E+04 1.15E+04 2.23E+04 1.78E+04 3.08E+04 1.44E+04 3.25E+04 1.77E+04
CDP-ethanolamine 1.33E+05 1.20E+05 1.71E+05 1.39E+05 1.95E+05 7.22E+04 7.97E+04 1.48E+05 1.43E+05 7.26E+04 1.23E+05 1.56E+05
Citrate/isocitrate 6.96E+04 3.93E+04 5.09E+04 3.55E+04 5.32E+03 6.26E+03 3.92E+03 6.67E+04 6.06E+04 1.22E+04 8.61E+04 1.04E+04
Citrulline 9.37E+04 6.86E+04 7.17E+04 8.33E+04 1.16E+05 1.25E+05 1.40E+05 1.03E+05 8.81E+04 1.01E+05 7.68E+04 1.50E+05
CMP 4.34E+04 4.28E+04 3.90E+04 4.18E+04 5.41E+04 2.50E+04 3.74E+04 3.89E+04 4.20E+04 2.95E+04 3.39E+04 5.02E+04
Creatine 3.43E+06 3.87E+06 3.03E+06 4.00E+06 3.56E+06 3.00E+06 3.26E+06 3.24E+06 3.14E+06 2.40E+06 2.74E+06 3.18E+06
Creatinine 3.34E+04 4.25E+04 2.76E+04 3.51E+04 3.80E+04 2.69E+04 3.47E+04 2.51E+04 2.74E+04 2.48E+04 2.45E+04 3.26E+04
Cystathionine 1.26E+05 1.13E+05 1.39E+05 1.47E+05 2.47E+05 1.68E+05 2.56E+05 1.23E+05 1.75E+05 1.46E+05 7.48E+04 1.69E+05
Cysteine 8.34E+04 6.04E+04 9.62E+04 8.05E+04 3.26E+05 1.72E+04 2.10E+04 6.36E+04 7.05E+04 1.78E+04 5.39E+04 3.24E+03
Cystine 3.30E+03 2.94E+03 5.78E+03 5.15E+03 3.84E+03 3.28E+05 5.15E+05 2.53E+03 3.14E+03 1.84E+05 1.46E+04 4.89E+04
Cytidine 2.94E+05 6.34E+04 1.05E+05 9.31E+04 1.07E+05 1.18E+05 1.34E+05 1.01E+05 1.12E+05 1.51E+05 7.83E+04 1.49E+05
D-Gluconate 3.97E+05 1.28E+05 7.82E+04 2.58E+05 9.78E+04 2.42E+05 1.48E+05 1.25E+05 8.92E+04 1.40E+05 1.26E+05 1.31E+05 D-Glyceraldehdye 3-phosphate 2.84E+05 3.95E+05 2.98E+05 3.24E+05 1.53E+05 2.32E+05 1.41E+05 2.36E+05 3.22E+05 2.64E+05 2.08E+05 4.87E+05

68
Table 1.5 Continued
Sample Name H6 H7 H8 H9 H14 H15 H17 H23 H24 H35 H36 H41
Diiodothyronine 6.82E+05 1.92E+05 4.56E+05 5.26E+05 9.25E+05 6.86E+05 1.12E+06 5.53E+05 6.27E+05 6.30E+05 2.11E+05 9.28E+05
Dimethylglycine 1.16E+06 1.05E+06 1.12E+06 1.61E+06 1.65E+06 1.72E+06 2.23E+06 1.33E+06 1.40E+06 1.80E+06 5.64E+05 1.75E+06
Fumarate 6.66E+05 3.96E+05 4.16E+05 3.96E+05 6.48E+05 4.57E+05 7.73E+05 3.41E+05 3.34E+05 3.23E+05 1.87E+05 9.25E+05
Glucose 1-phosphate 1.67E+05 1.76E+05 1.78E+05 1.62E+05 4.32E+05 1.78E+05 2.31E+05 1.85E+05 2.37E+05 2.48E+05 1.59E+05 4.09E+05
Glucose 6-phosphate 1.17E+05 1.69E+05 8.88E+04 1.38E+05 1.28E+05 9.71E+04 1.34E+05 1.43E+05 1.41E+05 1.00E+05 8.74E+04 1.06E+05
Glutamate 1.30E+08 1.25E+08 1.14E+08 1.20E+08 1.03E+08 3.08E+07 3.75E+07 1.01E+08 1.03E+08 3.86E+07 9.18E+07 9.68E+07
Glutamine 3.60E+07 2.17E+07 3.27E+07 3.46E+07 3.18E+07 3.66E+07 5.06E+07 3.32E+07 3.31E+07 2.95E+07 1.83E+07 3.90E+07
Glutathione 1.78E+07 1.54E+07 1.55E+07 1.62E+07 1.50E+07 5.82E+06 8.34E+06 1.62E+07 1.54E+07 4.62E+06 1.31E+07 5.97E+06
Glutathione disulfide 6.47E+04 1.42E+05 9.99E+04 9.83E+04 1.47E+05 3.74E+05 3.18E+05 9.99E+04 7.16E+04 6.71E+05 8.82E+04 2.06E+06
Glycerate 2.62E+06 1.25E+05 9.01E+04 1.09E+05 1.16E+05 1.79E+05 1.30E+05 2.84E+05 2.08E+05 1.39E+05 1.14E+05 7.64E+04
Glycerone phosphate 2.84E+05 3.95E+05 2.98E+05 3.24E+05 1.53E+05 2.32E+05 1.41E+05 2.36E+05 3.22E+05 2.64E+05 2.08E+05 4.87E+05
GMP 2.63E+05 2.73E+05 2.22E+05 2.73E+05 4.41E+05 2.22E+05 4.40E+05 1.98E+05 2.62E+05 2.78E+05 1.97E+05 5.28E+05
Guanine 8.24E+03 8.73E+03 1.37E+04 1.21E+04 1.67E+04 1.27E+04 1.19E+04 7.98E+03 1.56E+04 9.32E+03 6.62E+03 1.52E+04
Guanosine 2.70E+05 1.96E+05 5.61E+05 2.16E+05 8.91E+05 2.98E+05 2.66E+05 4.08E+05 4.60E+05 2.46E+05 4.28E+05 6.89E+05
Histidine 8.36E+03 8.18E+03 1.30E+04 4.38E+04 2.06E+04 2.14E+04 3.85E+04 1.74E+04 1.92E+04 2.25E+04 6.00E+03 3.55E+04
Homocysteic acid 1.97E+04 2.46E+04 2.23E+04 2.42E+04 1.99E+04 1.04E+04 7.02E+03 2.38E+04 2.22E+04 3.07E+03 1.59E+04 8.09E+03
Homoserine 9.52E+05 7.57E+05 9.34E+05 1.49E+06 6.44E+05 1.03E+06 1.21E+06 1.15E+06 1.01E+06 1.06E+06 8.20E+05 1.01E+06
Homovanillic acid 8.89E+04 7.51E+04 7.92E+04 9.16E+04 7.02E+04 4.13E+04 2.72E+04 8.65E+04 9.56E+04 5.73E+04 8.04E+04 9.28E+04
Hydroxybenzoate 5.26E+04 2.09E+04 7.28E+04 2.44E+04 1.84E+04 1.53E+04 1.68E+04 1.38E+04 1.50E+05 1.79E+04 2.63E+04 1.10E+04
Hydroxyisocaproic acid 2.44E+05 2.56E+05 4.06E+05 3.30E+05 1.66E+05 1.10E+05 1.18E+05 3.68E+05 2.25E+05 9.61E+04 4.99E+05 1.21E+05
Hydroxyphenylpyruvate 5.06E+04 4.20E+04 4.85E+04 4.58E+04 5.12E+04 3.99E+04 3.61E+04 5.41E+04 4.79E+04 3.11E+04 4.73E+04 4.96E+04
Hypoxanthine 7.35E+05 5.76E+05 7.19E+05 7.90E+05 2.01E+06 1.68E+06 1.35E+06 8.73E+05 7.92E+05 1.08E+06 5.95E+05 1.80E+06
IMP 2.93E+05 2.94E+05 2.48E+05 2.96E+05 4.64E+05 2.32E+05 4.07E+05 1.97E+05 2.63E+05 2.56E+05 2.04E+05 3.44E+05
Indole-3-carboxylate 1.73E+05 2.16E+03 2.50E+03 1.96E+03 1.78E+03 3.27E+03 2.05E+03 2.24E+03 5.14E+03 2.07E+03 2.93E+03 2.21E+03
Inosine 2.71E+06 2.23E+06 3.10E+06 2.57E+06 5.42E+06 6.22E+06 5.67E+06 2.76E+06 3.21E+06 3.66E+06 2.81E+06 5.12E+06
Lactate 8.37E+07 7.90E+07 7.40E+07 9.29E+07 7.22E+07 2.05E+07 2.52E+07 7.49E+07 8.48E+07 2.44E+07 7.65E+07 8.28E+07
Leucine/Isoleucine 5.81E+05 5.29E+05 5.22E+05 1.52E+06 6.04E+05 5.88E+05 5.05E+05 5.99E+05 5.63E+05 4.67E+05 5.38E+05 6.08E+05
Malate 9.85E+05 1.17E+06 1.04E+06 1.09E+06 3.72E+04 2.70E+04 4.36E+04 1.03E+06 7.87E+05 2.53E+04 7.26E+05 3.38E+04
Malate 1.06E+07 7.24E+06 6.52E+06 6.08E+06 7.30E+06 4.52E+06 7.07E+06 6.33E+06 6.10E+06 3.35E+06 4.82E+06 7.25E+06
Mandelate 3.11E+05 7.25E+05 4.36E+05 4.07E+05 3.98E+05 2.48E+05 2.75E+05 3.15E+05 5.71E+05 1.51E+05 5.68E+05 1.49E+05
Methionine 5.56E+05 6.79E+05 6.54E+05 1.18E+06 9.31E+05 5.89E+05 7.39E+05 6.47E+05 7.31E+05 5.06E+05 4.90E+05 7.17E+05
Methionine sulfoxide 9.81E+04 2.46E+05 1.64E+05 1.42E+05 8.06E+04 7.24E+04 5.18E+04 1.55E+05 1.27E+05 7.90E+04 2.71E+05 6.28E+04
Methylmalonate 3.42E+07 2.10E+07 7.26E+06 1.60E+07 2.94E+06 1.06E+06 1.86E+06 1.25E+07 1.30E+07 2.07E+06 6.79E+06 3.13E+06
myo-Inositol 8.35E+05 7.91E+05 6.92E+05 8.62E+05 5.98E+05 6.29E+04 5.73E+04 9.05E+05 9.74E+05 7.32E+04 7.91E+05 6.89E+05
N-Acetyl-beta-alanine 3.63E+04 2.19E+04 2.28E+04 4.96E+04 3.20E+04 1.71E+04 1.55E+04 3.26E+04 4.20E+04 1.45E+04 2.14E+04 3.29E+04
N-Acetylglucosamine 6.48E+03 3.21E+03 3.55E+03 1.85E+04 4.03E+03 2.41E+03 4.95E+03 7.84E+03 7.97E+03 3.26E+03 4.64E+03 2.12E+03

69
Table 1.5 Continued
Sample Name H6 H7 H8 H9 H14 H15 H17 H23 H24 H35 H36 H41 N-Acetylglucosamine 1/6-phosphate 5.09E+03 1.03E+04 6.87E+03 1.11E+04 7.76E+03 7.12E+03 9.26E+03 7.64E+03 8.14E+03 4.95E+03 1.18E+04 1.60E+04
N-Acetylglutamate 1.05E+06 9.25E+05 7.03E+05 7.72E+05 7.11E+05 3.38E+05 5.46E+05 6.59E+05 6.00E+05 3.64E+05 5.12E+05 7.43E+05
N-Acetylglutamine 5.01E+05 2.74E+05 3.04E+05 2.97E+05 3.47E+05 2.45E+05 4.18E+05 2.66E+05 3.09E+05 2.14E+05 2.32E+05 4.44E+05
N-Acetylornithine 7.04E+03 1.02E+04 9.20E+03 1.14E+04 1.23E+04 9.46E+03 1.56E+04 1.09E+04 1.24E+04 6.72E+03 8.41E+03 1.08E+04 N-Carbamoyl-L-aspartate 1.33E+05 3.14E+05 3.02E+05 2.87E+05 4.08E+05 2.52E+05 3.91E+05 3.35E+05 3.87E+05 2.26E+05 2.72E+05 3.96E+05
NAD+ 1.75E+05 1.50E+05 1.08E+05 1.42E+05 1.54E+04 8.76E+03 6.84E+03 1.58E+05 1.72E+05 2.47E+03 1.24E+05 4.06E+03
Nicotinate 8.20E+03 9.49E+03 5.18E+03 5.76E+03 4.41E+03 5.00E+03 2.65E+03 6.31E+03 6.79E+03 3.91E+03 8.56E+03 9.61E+03
Orotate 1.29E+05 5.76E+04 5.88E+04 5.85E+04 6.93E+04 4.51E+04 4.10E+04 7.76E+04 7.36E+04 5.17E+04 4.17E+04 6.77E+04
Pantothenate 2.67E+06 2.87E+06 2.62E+06 2.52E+06 2.83E+06 2.61E+06 2.84E+06 2.68E+06 2.49E+06 2.04E+06 1.94E+06 2.56E+06
Phenylalanine 2.27E+05 2.24E+05 2.26E+05 8.63E+05 3.51E+05 5.25E+05 4.74E+05 2.52E+05 2.93E+05 4.64E+05 2.41E+05 2.70E+05
Phenylpyruvate 3.70E+04 5.72E+04 9.68E+04 6.55E+04 3.56E+03 1.00E+02 1.00E+02 2.17E+04 6.02E+03 4.89E+03 5.34E+04 3.64E+03
Phosphorylcholine 5.01E+04 4.75E+04 5.27E+04 5.21E+04 8.11E+05 4.17E+05 7.75E+04 4.39E+05 1.11E+05 1.07E+05 5.88E+05 1.20E+05
Prephenate 1.24E+05 1.15E+05 1.29E+05 1.13E+05 7.95E+05 6.51E+05 5.58E+05 1.05E+05 1.65E+05 7.11E+05 1.17E+05 1.03E+06
Proline 2.10E+05 1.19E+05 1.09E+05 2.63E+05 1.54E+05 1.94E+05 1.99E+05 1.97E+05 2.26E+05 1.67E+05 1.32E+05 1.71E+05
Pyroglutamic acid 6.32E+06 1.68E+06 1.86E+06 1.35E+07 3.42E+06 1.60E+06 1.06E+06 2.70E+06 3.18E+06 1.73E+06 4.50E+06 3.53E+06
Pyruvate 1.07E+06 1.69E+06 1.06E+06 2.82E+06 1.30E+06 1.09E+06 9.21E+05 7.74E+05 9.61E+05 1.51E+06 1.14E+06 1.78E+06
Ribose phosphate 1.23E+05 9.35E+04 1.41E+05 1.10E+05 4.16E+05 2.48E+05 2.33E+05 1.55E+05 1.72E+05 1.91E+05 1.56E+05 5.04E+05 S-Adenosyl-L-homocysteine 5.91E+03 4.69E+03 2.21E+03 7.61E+03 5.98E+03 3.66E+03 4.89E+03 6.25E+03 5.51E+03 3.55E+03 1.92E+03 6.56E+03
Sarcosine 2.89E+06 2.88E+06 2.39E+06 2.85E+06 2.81E+06 2.29E+06 2.49E+06 2.46E+06 2.44E+06 1.93E+06 2.08E+06 2.62E+06 Sedoheptulose 1/7-phosphate 2.06E+04 1.81E+04 2.14E+04 2.01E+04 8.81E+03 7.90E+03 1.39E+04 2.43E+04 1.77E+04 2.30E+03 1.15E+04 1.09E+04
Serine 3.27E+06 2.88E+06 3.41E+06 5.27E+06 3.57E+06 2.92E+06 3.55E+06 2.78E+06 3.09E+06 2.98E+06 3.00E+06 3.49E+06 sn-Glycerol 3-phosphate 7.83E+04 5.53E+04 8.58E+04 6.80E+04 2.64E+04 2.14E+04 1.31E+04 1.02E+05 8.81E+04 2.82E+04 7.72E+04 1.74E+04
Succinate 3.42E+07 2.10E+07 7.26E+06 1.60E+07 2.94E+06 1.06E+06 1.86E+06 1.25E+07 1.30E+07 2.07E+06 6.79E+06 3.13E+06
Sulfolactate 2.68E+05 2.03E+04 3.32E+04 7.85E+03 2.34E+03 2.44E+03 3.48E+03 1.99E+04 4.70E+03 2.46E+03 2.94E+04 2.39E+03
Taurine 3.16E+07 2.26E+07 2.39E+07 3.01E+07 3.65E+07 2.50E+07 3.08E+07 2.92E+07 2.82E+07 2.25E+07 2.45E+07 2.85E+07
Threonine 9.52E+05 7.57E+05 9.34E+05 1.49E+06 6.44E+05 1.03E+06 1.21E+06 1.15E+06 1.01E+06 1.06E+06 8.20E+05 1.01E+06
Thymidine 1.07E+04 4.01E+03 6.82E+03 7.23E+03 8.41E+03 1.00E+02 1.00E+02 3.68E+03 2.95E+03 1.00E+02 2.55E+03 5.57E+03
Trehalose/sucrose 3.48E+04 1.11E+05 2.02E+05 1.10E+05 5.05E+04 5.12E+04 3.88E+04 7.68E+04 5.08E+04 7.11E+04 1.06E+05 4.74E+04
Tryptophan 3.12E+05 3.13E+05 3.63E+05 8.52E+05 3.58E+05 2.43E+05 3.08E+05 2.91E+05 3.39E+05 1.93E+05 2.69E+05 2.91E+05
Tyrosine 1.70E+06 1.76E+06 1.70E+06 3.44E+06 2.00E+06 1.54E+06 1.65E+06 1.42E+06 1.57E+06 1.08E+06 1.40E+06 1.53E+06
UDP-glucose 3.91E+05 4.19E+05 3.35E+05 4.13E+05 4.73E+05 2.88E+05 6.94E+05 3.11E+05 3.65E+05 2.11E+05 3.22E+05 4.90E+05 UDP-N-acetylglucosamine 3.82E+05 3.62E+05 3.02E+05 3.93E+05 3.89E+05 3.06E+05 6.25E+05 3.20E+05 3.45E+05 2.54E+05 3.07E+05 3.80E+05
UMP 5.23E+05 4.42E+05 4.07E+05 5.15E+05 3.50E+05 1.80E+05 3.85E+05 4.67E+05 3.99E+05 1.93E+05 4.30E+05 4.92E+05

70
Table 1.5 Continued
Sample Name H6 H7 H8 H9 H14 H15 H17 H23 H24 H35 H36 H41
Uracil 2.59E+05 1.38E+05 1.76E+05 1.57E+05 5.94E+05 5.95E+05 5.03E+05 3.88E+05 4.24E+05 5.02E+05 2.57E+05 5.03E+05
Uric acid 1.02E+05 7.57E+04 7.21E+04 2.57E+05 1.04E+05 1.00E+05 9.48E+04 8.21E+04 8.32E+04 4.94E+04 9.00E+04 6.06E+04
Uridine 6.38E+04 5.49E+04 5.51E+04 7.10E+04 6.51E+04 4.96E+04 5.57E+04 6.63E+04 6.89E+04 4.55E+04 4.77E+04 6.48E+04
Valine 9.88E+05 8.26E+05 7.24E+05 1.93E+06 7.36E+05 7.23E+05 7.84E+05 7.83E+05 8.87E+05 5.99E+05 7.67E+05 7.56E+05
Xanthine 1.49E+03 4.35E+03 2.29E+03 4.09E+03 7.37E+02 1.04E+04 1.12E+04 2.97E+03 3.52E+03 3.52E+03 1.26E+04 9.97E+03
Xanthine 4.02E+05 3.51E+05 6.90E+05 8.54E+05 8.91E+05 7.12E+05 5.75E+05 6.73E+05 7.43E+05 6.26E+05 3.61E+05 1.19E+06
Xanthosine 2.18E+03 1.10E+04 3.05E+03 7.21E+03 3.70E+03 8.97E+03 5.68E+03 6.63E+03 8.44E+03 5.57E+03 5.61E+03 1.50E+04

71
Table 1.6 Raw Data of Dominant Hamsters from HPC
Sample Name H2 H3 H4 H12 H19 H21 H25 H28 H33 H40
1-Methyladenosine 9.91E+03 6.52E+03 5.54E+03 4.12E+03 3.68E+03 2.06E+03 5.78E+03 2.93E+03 6.05E+03 3.15E+03
2-Aminoadipate 1.27E+04 1.34E+04 1.54E+04 3.38E+04 4.67E+04 1.65E+04 2.21E+04 4.07E+04 9.84E+03 3.76E+04
2-Dehydro-D-gluconate 3.79E+03 4.17E+03 3.72E+03 1.17E+04 3.01E+03 3.82E+03 4.83E+03 3.78E+03 3.37E+03 4.85E+03
2-Hydroxy-2-methylsuccinate 2.10E+05 2.43E+05 2.12E+05 9.52E+05 1.56E+05 1.07E+05 1.75E+05 6.85E+04 1.17E+05 2.25E+05
3-Methoxytyramine 4.44E+04 5.14E+04 4.68E+04 1.69E+05 5.69E+04 5.73E+04 4.67E+04 4.46E+04 4.74E+04 4.20E+04
3_4-Dihydroxyphenylacetate 2.37E+04 2.13E+04 2.08E+04 1.02E+05 2.52E+04 3.56E+04 2.63E+04 4.35E+04 3.32E+04 3.71E+04
4-Aminobutyrate 1.01E+06 1.14E+06 1.09E+06 2.74E+06 5.30E+05 4.45E+05 8.73E+05 4.52E+05 8.10E+05 3.56E+05
5-Hydroxyindoleacetic acid 5.45E+04 7.39E+04 6.71E+04 3.21E+04 3.03E+04 8.18E+03 1.58E+04 1.05E+04 1.34E+04 9.48E+03
Acadesine 5.06E+03 5.94E+03 5.94E+03 1.22E+04 8.31E+03 6.36E+03 6.17E+03 7.94E+03 6.93E+03 8.38E+03
Acetyllysine 3.35E+03 2.56E+03 3.84E+03 6.70E+03 3.17E+03 3.09E+03 4.24E+03 2.99E+03 3.69E+03 3.34E+03
Adenine 1.76E+04 1.77E+04 1.77E+04 2.94E+04 8.74E+03 5.84E+03 1.27E+04 6.75E+03 1.12E+04 6.02E+03
Adenosine 3.41E+04 3.33E+04 1.45E+04 7.68E+05 2.98E+04 2.85E+05 6.90E+05 3.29E+05 5.29E+05 9.53E+04
AICAR 8.61E+03 8.21E+03 1.01E+04 4.41E+04 1.12E+04 9.03E+03 1.06E+04 8.99E+03 6.08E+03 1.30E+04
Alanine 1.45E+06 1.40E+06 1.20E+06 2.66E+06 1.19E+06 1.12E+06 1.29E+06 1.16E+06 1.23E+06 1.08E+06
Allantoate 3.06E+03 1.68E+03 3.83E+03 1.11E+04 2.08E+03 6.72E+02 3.22E+03 1.63E+03 2.28E+03 7.37E+02
alpha-Ketoglutarate 1.80E+03 4.48E+03 2.54E+03 1.45E+04 1.44E+03 2.97E+03 3.17E+03 1.55E+03 1.54E+03 3.30E+03
AMP 3.35E+04 3.62E+04 1.15E+04 3.44E+06 2.88E+05 7.10E+05 8.03E+05 5.53E+05 6.39E+05 1.18E+06
Allantoin 2.81E+03 6.22E+03 6.24E+03 1.10E+04 6.29E+03 2.90E+03 3.32E+03 4.05E+03 3.24E+03 8.48E+03
Arginine 1.70E+04 2.18E+04 1.84E+04 1.13E+04 2.62E+04 1.30E+04 1.83E+04 1.85E+04 1.26E+04 2.13E+04
Ascorbate 1.11E+07 1.04E+07 1.46E+07 4.85E+07 6.30E+06 7.47E+06 1.54E+07 6.46E+06 1.09E+07 5.20E+06
Asparagine 4.81E+04 5.58E+04 6.24E+04 1.28E+05 3.91E+04 2.94E+04 5.70E+04 4.44E+04 3.97E+04 3.25E+04
Aspartate 2.30E+06 2.66E+06 2.53E+06 8.02E+06 2.65E+06 1.18E+06 2.25E+06 1.57E+06 1.75E+06 1.27E+06
beta-Alanine 1.45E+06 1.40E+06 1.20E+06 2.66E+06 1.19E+06 1.12E+06 1.29E+06 1.16E+06 1.23E+06 1.08E+06
Betaine 2.56E+05 2.61E+05 2.81E+05 7.73E+05 2.46E+05 1.86E+05 2.54E+05 3.00E+05 1.98E+05 2.33E+05
CDP-ethanolamine 3.25E+04 2.98E+04 2.47E+04 1.30E+05 3.22E+04 2.66E+04 3.42E+04 2.90E+04 3.42E+04 3.36E+04
Citrate/isocitrate 3.00E+03 4.75E+03 1.74E+03 7.36E+04 1.05E+04 1.63E+03 1.54E+04 2.44E+03 1.46E+03 3.82E+03
Citrulline 6.83E+04 7.90E+04 7.05E+04 8.47E+04 4.72E+04 5.04E+04 6.92E+04 6.22E+04 5.67E+04 4.54E+04
CMP 6.58E+03 7.20E+03 2.93E+03 5.34E+04 1.97E+04 1.68E+04 2.04E+04 1.63E+04 1.41E+04 2.94E+04
Creatine 1.50E+06 1.50E+06 1.32E+06 3.25E+06 1.37E+06 1.26E+06 1.38E+06 1.26E+06 1.33E+06 1.19E+06

72
Table 1.6 Continued
Sample Name H2 H3 H4 H12 H19 H21 H25 H28 H33 H40
Creatinine 1.36E+04 1.14E+04 1.69E+04 3.65E+04 1.39E+04 1.07E+04 1.10E+04 1.01E+04 1.00E+04 1.29E+04
Cystathionine 1.82E+05 1.75E+05 1.85E+05 3.72E+05 1.96E+05 2.16E+05 2.53E+05 2.38E+05 1.65E+05 2.94E+05
Cysteine 3.43E+05 3.42E+05 4.74E+05 1.91E+05 5.22E+05 9.10E+04 9.24E+04 1.01E+05 8.83E+04 1.06E+05
Cystine 1.83E+04 6.26E+04 2.80E+04 3.24E+03 2.83E+04 3.57E+03 2.16E+03 3.32E+03 2.36E+03 4.21E+03
Cytidine 6.54E+04 6.23E+04 9.61E+04 9.52E+04 3.55E+04 2.11E+04 4.67E+04 2.92E+04 3.75E+04 1.68E+04
Cytidine 3.30E+04 3.78E+04 3.81E+04 7.58E+04 4.85E+04 4.12E+04 3.56E+04 4.28E+04 2.96E+04 6.52E+04
D-Gluconate 5.16E+04 6.29E+04 5.81E+04 1.09E+05 4.27E+04 3.04E+04 4.76E+04 4.20E+04 3.69E+04 4.32E+04
D-Glucosamine 1-phosphate 7.72E+03 5.52E+03 6.52E+03 8.82E+02 4.77E+02 1.82E+02 2.56E+02 2.85E+02 2.06E+02 1.75E+02
D-Glyceraldehdye 3-phosphate 5.45E+05 5.49E+05 4.36E+05 8.39E+05 3.56E+05 1.53E+05 3.94E+05 1.79E+05 2.79E+05 3.01E+05
Diiodothyronine 1.73E+04 1.79E+04 1.27E+04 6.09E+04 2.30E+04 1.68E+04 1.57E+04 7.52E+03 1.03E+04 2.09E+04
Dimethylglycine 9.85E+04 1.07E+05 9.33E+04 3.69E+05 7.78E+04 7.22E+04 1.02E+05 6.87E+04 9.19E+04 7.01E+04
Dimethylglycine 1.01E+06 1.14E+06 1.09E+06 2.74E+06 5.30E+05 4.45E+05 8.73E+05 4.52E+05 8.10E+05 3.56E+05
Fumarate 1.37E+05 1.59E+05 1.65E+05 4.09E+05 4.43E+04 7.19E+04 1.69E+05 3.97E+04 9.54E+04 7.02E+04
Glucosamine 1.00E+02 3.86E+03 4.28E+02 1.00E+02 1.00E+02 4.08E+02 1.00E+02 1.42E+04 2.74E+02 4.16E+02
Glucose 1-phosphate 1.62E+05 1.74E+05 1.92E+05 4.56E+05 1.03E+05 8.30E+04 2.58E+05 9.85E+04 2.25E+05 9.33E+04
Glucose 6-phosphate 8.84E+05 3.79E+05 8.04E+05 1.61E+05 1.02E+05 3.44E+04 1.39E+05 1.12E+05 8.71E+04 8.92E+04
Glutamate 3.17E+07 3.14E+07 3.18E+07 1.04E+08 2.54E+07 2.26E+07 3.43E+07 2.32E+07 2.82E+07 2.38E+07
Glutamine 1.42E+07 1.37E+07 1.49E+07 3.09E+07 1.22E+07 9.81E+06 1.40E+07 1.09E+07 1.28E+07 1.11E+07
Glutathione 5.74E+06 5.98E+06 5.63E+06 1.88E+07 4.32E+06 5.21E+06 9.15E+06 5.68E+06 6.96E+06 6.62E+06
Glutathione disulfide 8.46E+04 1.05E+05 6.43E+04 9.93E+04 2.62E+04 1.28E+04 3.58E+04 1.86E+04 2.09E+04 2.78E+04
GMP 4.48E+03 6.72E+03 6.66E+02 2.99E+05 3.14E+04 5.23E+04 7.53E+04 5.70E+04 6.96E+04 7.51E+04
Guanine 6.57E+03 5.07E+03 6.24E+03 7.08E+03 5.40E+03 2.12E+03 1.50E+03 2.33E+03 4.69E+03 3.12E+03
Guanosine 1.05E+06 1.04E+06 1.10E+06 5.19E+05 4.96E+05 1.37E+05 3.19E+05 2.18E+05 2.49E+05 1.10E+05
Histidine 2.61E+04 2.12E+04 3.02E+04 3.66E+04 1.92E+04 1.47E+04 1.84E+04 2.35E+04 1.53E+04 1.78E+04
Homocysteic acid 1.45E+04 8.34E+03 1.33E+04 2.75E+04 1.37E+04 8.69E+03 1.03E+04 1.24E+04 9.68E+03 7.77E+03
Homoserine 3.15E+05 3.59E+05 3.74E+05 6.41E+05 3.97E+05 3.02E+05 3.70E+05 4.12E+05 2.52E+05 3.65E+05
Hydroxyphenylacetate 1.56E+05 1.88E+05 1.49E+05 2.49E+05 7.73E+04 9.30E+04 5.38E+04 3.34E+05 1.34E+05 8.12E+04
Hypoxanthine 8.87E+05 8.69E+05 9.16E+05 6.59E+05 9.62E+05 1.32E+05 2.60E+05 2.89E+05 1.58E+05 2.76E+05
Hypoxanthine 4.50E+03 6.64E+03 3.12E+03 5.35E+03 2.29E+03 3.67E+02 2.03E+03 1.82E+03 1.69E+03 2.22E+03

73
Table 1.6 Continued
Sample Name H2 H3 H4 H12 H19 H21 H25 H28 H33 H40
IMP 2.21E+04 1.81E+04 1.87E+04 2.64E+05 3.41E+04 5.54E+04 9.76E+04 5.82E+04 1.08E+05 3.72E+04
Inosine 5.34E+06 5.13E+06 5.35E+06 3.24E+06 3.59E+06 8.63E+05 1.87E+06 1.69E+06 1.47E+06 1.40E+06
Lactate 3.57E+07 4.40E+07 4.61E+07 9.17E+07 4.26E+07 3.47E+07 4.14E+07 4.15E+07 3.61E+07 4.42E+07
Leucine/Isoleucine 1.70E+05 2.17E+05 2.54E+05 3.71E+05 1.85E+05 8.52E+04 1.31E+05 1.50E+05 7.81E+04 1.30E+05
Lysine 7.98E+03 7.99E+03 7.17E+03 5.89E+03 9.04E+03 7.81E+03 8.51E+03 6.45E+03 4.28E+03 6.98E+03
Malate 3.63E+06 4.59E+06 4.36E+06 1.04E+07 1.68E+06 1.52E+06 2.84E+06 1.27E+06 1.84E+06 2.02E+06
Mandelate 6.42E+04 5.50E+04 5.13E+04 1.67E+05 9.25E+04 7.39E+04 1.02E+05 6.53E+04 7.65E+04 9.03E+04
Methionine 3.69E+05 3.36E+05 4.09E+05 8.30E+05 3.61E+05 1.68E+05 2.64E+05 2.42E+05 2.64E+05 2.20E+05
Methionine sulfoxide 2.59E+04 3.53E+04 3.06E+04 3.92E+04 3.26E+04 3.23E+04 3.43E+04 2.56E+04 2.93E+04 2.91E+04
Methylmalonate 5.03E+05 6.34E+05 3.88E+05 5.63E+06 5.39E+05 1.52E+06 1.88E+06 1.41E+06 1.17E+06 2.10E+06
myo-Inositol 2.89E+05 3.30E+05 3.51E+05 6.69E+05 3.24E+05 3.54E+05 3.39E+05 3.93E+05 3.31E+05 3.52E+05
N-Acetyl-beta-alanine 1.41E+04 1.42E+04 1.92E+04 3.12E+04 2.02E+04 9.01E+03 1.12E+04 1.05E+04 9.77E+03 1.41E+04
N-Acetylglutamate 3.63E+05 3.46E+05 3.30E+05 1.07E+06 2.04E+05 2.34E+05 3.60E+05 1.49E+05 2.47E+05 1.89E+05
N-Acetylglutamine 2.98E+05 2.73E+05 3.46E+05 4.11E+05 4.01E+05 1.75E+05 2.49E+05 1.84E+05 2.23E+05 4.25E+05
N-Acetylornithine 5.09E+03 4.90E+03 4.63E+03 1.52E+04 3.97E+03 3.96E+03 6.02E+03 3.29E+03 5.69E+03 4.44E+03
N-Acetyltaurine 1.23E+05 1.01E+05 8.26E+04 1.46E+05 4.59E+04 6.55E+04 1.24E+05 6.32E+04 7.98E+04 5.01E+04
N-Acetyltaurine 3.15E+03 3.12E+03 3.91E+03 2.46E+03 1.17E+04 2.47E+03 2.16E+03 4.58E+03 1.47E+03 2.87E+03
N-Carbamoyl-L-aspartate 5.09E+04 1.00E+05 1.01E+05 3.58E+05 8.49E+04 7.47E+04 1.00E+05 6.50E+04 8.67E+04 6.92E+04
NAD+ 7.16E+02 1.57E+03 6.07E+02 4.69E+04 2.72E+03 9.22E+03 3.65E+03 3.25E+03 2.93E+03 7.88E+03
Orotate 1.45E+04 1.68E+04 1.22E+04 3.69E+04 1.03E+04 7.44E+03 1.42E+04 8.21E+03 1.26E+04 8.36E+03
Pantothenate 4.63E+05 4.80E+05 4.55E+05 1.59E+06 6.92E+05 3.83E+05 5.08E+05 4.50E+05 3.91E+05 6.46E+05
Phenylalanine 1.67E+05 1.68E+05 1.91E+05 2.26E+05 2.30E+05 1.05E+05 1.12E+05 1.79E+05 1.16E+05 1.70E+05
Phenyllactic acid 9.86E+04 1.14E+05 1.05E+05 2.61E+05 7.34E+04 7.68E+04 5.67E+04 2.01E+05 8.55E+04 7.42E+04
Proline 9.99E+04 9.59E+04 8.50E+04 1.85E+05 7.05E+04 4.21E+04 7.96E+04 9.72E+04 6.45E+04 7.31E+04
Pyroglutamic acid 2.41E+06 2.39E+06 3.64E+06 2.92E+06 2.31E+06 1.18E+06 7.54E+05 1.83E+06 9.69E+05 1.39E+06
Pyruvate 4.55E+05 4.85E+05 6.53E+05 1.02E+06 3.04E+05 4.25E+05 3.19E+05 5.54E+05 3.42E+05 6.27E+05
Ribose phosphate 5.00E+05 4.39E+05 4.33E+05 3.08E+05 3.46E+05 7.38E+04 1.71E+05 1.19E+05 1.53E+05 8.81E+04

74
Table 1.6 Continued
Sample Name H2 H3 H4 H12 H19 H21 H25 H28 H33 H40
Sedoheptulose 1/7-phosphate 8.05E+04 5.86E+04 1.07E+05 2.03E+04 3.34E+04 3.65E+03 1.20E+04 9.69E+03 1.08E+04 5.80E+03
Serine 1.06E+06 1.10E+06 1.22E+06 2.30E+06 1.05E+06 9.04E+05 1.14E+06 1.21E+06 9.11E+05 1.12E+06
sn-Glycerol 3-phosphate 2.27E+04 2.43E+04 1.19E+04 6.57E+04 2.36E+04 5.81E+04 2.30E+04 2.07E+04 1.99E+04 3.30E+04
Succinate 5.03E+05 6.34E+05 3.88E+05 5.63E+06 5.39E+05 1.52E+06 1.88E+06 1.41E+06 1.17E+06 2.10E+06
Taurine 1.29E+07 1.17E+07 1.15E+07 3.93E+07 9.15E+06 8.71E+06 1.24E+07 9.90E+06 1.07E+07 1.06E+07
Thymidine 7.69E+03 5.80E+03 7.67E+03 4.78E+03 5.32E+03 2.23E+03 5.58E+03 3.73E+03 6.16E+03 3.60E+03
Thymine 5.91E+03 5.98E+03 5.32E+03 3.99E+03 5.81E+03 2.50E+03 6.14E+03 4.43E+03 2.67E+03 4.07E+03
Trehalose/sucrose 3.99E+04 4.52E+04 4.82E+04 3.24E+04 3.39E+04 5.79E+04 2.39E+04 1.55E+05 7.08E+04 6.95E+04
Tryptophan 2.29E+05 2.05E+05 2.09E+05 3.63E+05 2.09E+05 1.44E+05 1.96E+05 1.86E+05 1.88E+05 1.74E+05
Tyrosine 6.21E+05 5.92E+05 6.28E+05 1.46E+06 5.72E+05 4.96E+05 5.82E+05 5.87E+05 6.39E+05 5.51E+05
UDP-glucose 3.92E+04 6.06E+04 7.39E+04 4.23E+05 1.02E+05 1.02E+05 1.39E+05 1.31E+05 1.07E+05 1.20E+05
UDP-N-acetylglucosamine 7.74E+04 8.34E+04 9.07E+04 3.84E+05 7.89E+04 8.17E+04 1.44E+05 1.13E+05 1.15E+05 9.79E+04
UMP 8.12E+03 8.30E+03 2.61E+03 5.53E+05 4.89E+04 1.12E+05 1.33E+05 9.03E+04 9.24E+04 1.77E+05
Uracil 4.02E+05 4.09E+05 4.42E+05 4.70E+05 2.86E+05 4.18E+04 1.75E+05 9.26E+04 1.25E+05 6.94E+04
Uric acid 3.73E+04 4.24E+04 3.77E+04 1.18E+05 5.85E+04 3.73E+04 3.18E+04 5.36E+04 3.67E+04 7.97E+04
Uridine 2.88E+04 2.59E+04 2.71E+04 7.66E+04 1.73E+04 1.39E+04 2.46E+04 1.63E+04 2.27E+04 1.56E+04
Xanthine 6.69E+05 6.36E+05 6.62E+05 6.57E+05 5.41E+05 9.27E+04 2.39E+05 2.40E+05 1.66E+05 2.15E+05
Xanthosine 1.20E+04 1.13E+04 1.01E+04 2.39E+03 7.11E+03 1.66E+03 4.14E+03 2.92E+03 2.21E+03 2.62E+03

75
Table 1.7 Raw Data of Handled Control Hamsters from HPC
Sample Name H1 H10 H18 H26 H19 H32 H34 H43 H44 H49 H52 H53
1-Methyladenosine 4.89E+03 5.04E+03 6.05E+03 4.96E+03 6.29E+03 4.28E+03 4.88E+03 6.28E+03 9.10E+03 1.11E+04 9.67E+03 7.23E+03
2-Aminoadipate 2.97E+04 2.64E+04 8.87E+03 1.26E+04 1.14E+04 8.96E+03 1.40E+04 1.20E+04 1.07E+04 1.10E+04 1.33E+04 1.45E+04
2-Dehydro-D-gluconate 1.35E+03 9.26E+03 4.12E+03 4.27E+03 5.05E+03 5.75E+03 4.85E+03 5.41E+03 6.09E+03 4.32E+03 4.10E+03 3.89E+03
2-Hydroxy-2-methylsuccinate 5.49E+04 4.56E+05 1.63E+05 1.06E+05 9.35E+04 1.61E+05 1.37E+05 1.73E+05 2.09E+05 1.88E+05 1.64E+05 1.23E+05
3-Methoxytyramine 4.76E+04 1.33E+05 4.44E+04 4.73E+04 5.35E+04 5.04E+04 5.67E+04 4.16E+04 5.30E+04 1.73E+05 5.54E+04 3.65E+04
3_4-Dihydroxyphenylacetate 2.07E+04 1.25E+05 3.04E+04 2.73E+04 2.14E+04 3.64E+04 3.23E+04 2.47E+04 2.09E+04 2.92E+04 2.21E+04 2.05E+04
4-Aminobutyrate 4.83E+05 2.30E+06 7.61E+05 8.07E+05 1.01E+06 8.61E+05 1.01E+06 1.20E+06 1.08E+06 1.06E+06 7.56E+05 8.27E+05
5-Hydroxyindoleacetic acid 4.04E+04 1.73E+04 7.31E+03 1.12E+04 5.16E+04 1.24E+04 3.54E+04 6.66E+04 4.89E+04 6.37E+04 2.89E+04 4.89E+04
Acadesine 7.60E+03 9.00E+03 4.30E+03 5.82E+03 5.65E+03 6.01E+03 5.93E+03 5.87E+03 7.18E+03 7.53E+03 7.12E+03 5.75E+03
Acetyllysine 2.89E+03 7.57E+03 2.88E+03 3.20E+03 3.58E+03 4.01E+03 2.72E+03 2.40E+03 1.27E+03 2.62E+03 1.73E+03 2.19E+03
Adenine 6.16E+03 3.18E+04 8.44E+03 1.20E+04 1.54E+04 1.44E+04 1.29E+04 1.80E+04 1.54E+04 1.77E+04 1.74E+04 1.25E+04
Adenosine 1.51E+04 7.16E+05 4.78E+05 5.54E+05 7.60E+04 4.67E+05 5.28E+04 6.95E+04 2.16E+04 3.87E+04 4.08E+04 4.54E+04
AICAR 1.22E+04 4.01E+04 1.07E+04 1.15E+04 1.18E+04 8.83E+03 8.92E+03 1.21E+04 7.26E+03 1.18E+04 8.58E+03 8.51E+03
Alanine 9.87E+05 2.62E+06 1.11E+06 1.41E+06 1.32E+06 1.39E+06 1.29E+06 1.38E+06 1.16E+06 1.25E+06 1.32E+06 1.31E+06
Allantoate 3.60E+02 5.51E+03 2.36E+03 2.84E+03 5.61E+03 4.17E+03 3.96E+03 4.68E+03 3.59E+02 1.38E+03 1.00E+02 1.88E+03
alpha-Ketoglutarate 1.16E+03 9.32E+03 3.13E+03 2.94E+03 3.27E+03 4.13E+03 2.73E+03 1.81E+03 2.62E+03 1.63E+03 2.32E+03 1.16E+03
AMP 5.81E+05 3.19E+06 8.33E+05 9.90E+05 3.91E+04 9.01E+05 3.16E+04 2.20E+04 1.64E+04 1.28E+04 2.01E+04 4.15E+04
Allantoin 4.16E+03 1.26E+04 2.39E+03 4.11E+03 3.91E+03 3.26E+03 3.67E+03 4.66E+03 1.18E+04 2.43E+03 3.92E+03 4.66E+03
Arginine 2.44E+04 1.94E+04 1.30E+04 1.63E+04 2.69E+04 1.57E+04 2.12E+04 2.19E+04 1.60E+04 2.35E+04 1.75E+04 1.80E+04
Ascorbate 3.98E+06 2.96E+07 1.32E+07 1.53E+07 1.45E+07 1.59E+07 1.27E+07 1.55E+07 3.65E+06 5.24E+06 1.06E+03 7.44E+06
Asparagine 3.98E+04 1.08E+05 3.93E+04 5.17E+04 6.01E+04 5.02E+04 5.79E+04 5.66E+04 5.88E+04 5.60E+04 4.58E+04 4.70E+04
Aspartate 2.55E+06 7.68E+06 1.82E+06 2.29E+06 2.57E+06 2.26E+06 2.62E+06 3.15E+06 2.67E+06 2.62E+06 2.36E+06 2.28E+06
beta-Alanine 9.87E+05 2.62E+06 1.11E+06 1.41E+06 1.32E+06 1.39E+06 1.29E+06 1.38E+06 1.16E+06 1.25E+06 1.32E+06 1.31E+06
Betaine 2.05E+05 7.15E+05 1.66E+05 2.20E+05 2.75E+05 2.47E+05 2.60E+05 2.88E+05 2.52E+05 2.76E+05 2.40E+05 2.37E+05
CDP-ethanolamine 2.72E+04 1.33E+05 3.08E+04 3.11E+04 3.54E+04 4.12E+04 3.20E+04 4.23E+04 2.72E+04 2.56E+04 2.48E+04 2.44E+04
Citrate/isocitrate 2.71E+03 2.59E+03 2.69E+03 2.73E+03 3.43E+03 3.35E+03 5.74E+04 4.50E+03 1.59E+04 5.05E+03 3.51E+03 2.40E+03

76
Table 1.7 Continued
Sample Name H1 H10 H18 H26 H19 H32 H34 H43 H44 H49 H52 H53
Citrulline 3.86E+04 8.31E+04 5.85E+04 8.60E+04 9.17E+04 5.94E+04 8.19E+04 6.61E+04 6.46E+04 5.33E+04 6.14E+04 4.61E+04
CMP 1.64E+04 3.94E+04 1.45E+04 2.10E+04 1.07E+04 1.62E+04 8.87E+03 7.04E+03 5.43E+03 3.42E+03 3.45E+03 7.09E+03
Creatine 1.09E+06 3.05E+06 1.25E+06 1.52E+06 1.37E+06 1.47E+06 1.40E+06 1.52E+06 1.28E+06 1.44E+06 1.38E+06 1.42E+06
Creatinine 9.96E+03 2.96E+04 9.85E+03 1.24E+04 1.44E+04 1.54E+04 1.35E+04 1.26E+04 1.49E+04 1.48E+04 1.72E+04 1.18E+04
Cystathionine 1.06E+05 4.21E+05 1.64E+05 2.50E+05 2.37E+05 2.64E+05 2.12E+05 1.91E+05 1.24E+05 1.82E+05 1.11E+05 1.64E+05
Cysteine 3.51E+05 1.90E+05 1.01E+05 1.18E+05 4.47E+05 1.10E+05 4.31E+05 5.38E+05 6.19E+04 1.20E+05 1.56E+04 4.15E+05
Cystine 2.40E+04 5.92E+03 2.31E+03 3.72E+03 1.63E+04 8.29E+03 2.54E+04 2.41E+04 1.34E+05 1.67E+05 1.05E+05 2.00E+04
Cytidine 2.31E+04 1.10E+05 3.49E+04 4.28E+04 7.39E+04 5.12E+04 5.85E+04 8.87E+04 8.23E+04 7.73E+04 3.83E+04 4.90E+04
Cytidine 6.25E+04 8.11E+04 3.62E+04 3.49E+04 2.97E+04 3.85E+04 3.13E+04 2.90E+04 3.97E+04 3.42E+04 2.89E+04 3.25E+04
D-Gluconate 3.60E+04 1.16E+05 3.00E+04 3.72E+04 8.16E+04 5.99E+04 5.10E+04 5.56E+04 7.77E+04 5.44E+04 6.21E+04 4.23E+04
D-Glucosamine 1-phosphate 1.00E+02 5.00E+02 2.30E+02 1.78E+02 5.10E+03 4.14E+02 6.31E+03 6.79E+03 5.98E+03 6.55E+03 5.38E+03 3.85E+03
D-Glyceraldehdye 3-
phosphate
1.75E+05 7.99E+05 2.12E+05 3.72E+05 4.81E+05 3.32E+05 4.98E+05 5.71E+05 4.52E+05 4.49E+05 4.02E+05 3.45E+05
Diiodothyronine 1.92E+04 4.55E+04 1.58E+04 1.55E+04 1.36E+04 1.78E+04 1.49E+04 1.29E+04 1.46E+04 1.65E+04 9.96E+03 1.28E+04
Dimethylglycine 5.09E+04 3.25E+05 8.55E+04 1.06E+05 1.06E+05 1.10E+05 9.06E+04 1.16E+05 9.02E+04 1.14E+05 9.86E+04 8.00E+04
Dimethylglycine 4.83E+05 2.30E+06 7.61E+05 8.07E+05 1.01E+06 8.61E+05 1.01E+06 1.20E+06 1.08E+06 1.06E+06 7.56E+05 8.27E+05
Fumarate 3.34E+04 2.75E+05 1.37E+05 1.11E+05 1.07E+05 1.88E+05 1.15E+05 1.11E+05 1.32E+05 1.25E+05 8.92E+04 1.02E+05
Glucosamine 5.74E+02 1.00E+02 3.31E+03 4.09E+02 1.00E+02 1.37E+03 4.12E+02 5.91E+02 1.00E+02 2.48E+03 3.60E+02 4.99E+02
Glucose 1-phosphate 4.74E+04 3.22E+05 1.97E+05 1.51E+05 1.34E+05 2.58E+05 1.43E+05 2.52E+05 1.96E+05 2.22E+05 1.04E+05 1.25E+05
Glucose 6-phosphate 6.50E+04 1.87E+05 5.22E+04 1.04E+05 6.52E+05 8.02E+04 7.49E+05 7.79E+05 6.51E+05 8.02E+05 5.61E+05 3.29E+05
Glutamate 2.30E+07 9.87E+07 2.79E+07 3.10E+07 3.10E+07 3.61E+07 3.09E+07 3.38E+07 2.91E+07 3.13E+07 2.96E+07 2.93E+07
Glutamine 1.26E+07 2.63E+07 1.37E+07 1.33E+07 1.43E+07 1.42E+07 1.42E+07 1.36E+07 1.23E+07 1.24E+07 1.19E+07 1.29E+07
Glutathione 3.61E+06 1.56E+07 7.14E+06 8.02E+06 6.48E+06 9.71E+06 5.64E+06 6.95E+06 2.92E+06 4.16E+06 2.91E+06 4.92E+06
Glutathione disulfide 2.49E+04 7.16E+04 1.55E+04 2.25E+04 5.45E+04 6.72E+04 6.26E+04 1.04E+05 3.72E+05 2.86E+05 1.70E+05 4.08E+04
GMP 4.43E+04 2.86E+05 6.97E+04 7.56E+04 7.05E+03 8.36E+04 9.19E+03 2.04E+03 1.61E+03 8.00E+02 5.46E+03 1.27E+04
Guanine 6.67E+03 6.77E+03 3.21E+03 1.02E+03 5.17E+03 4.16E+03 3.74E+03 8.87E+03 5.82E+03 8.21E+03 5.65E+03 4.76E+03
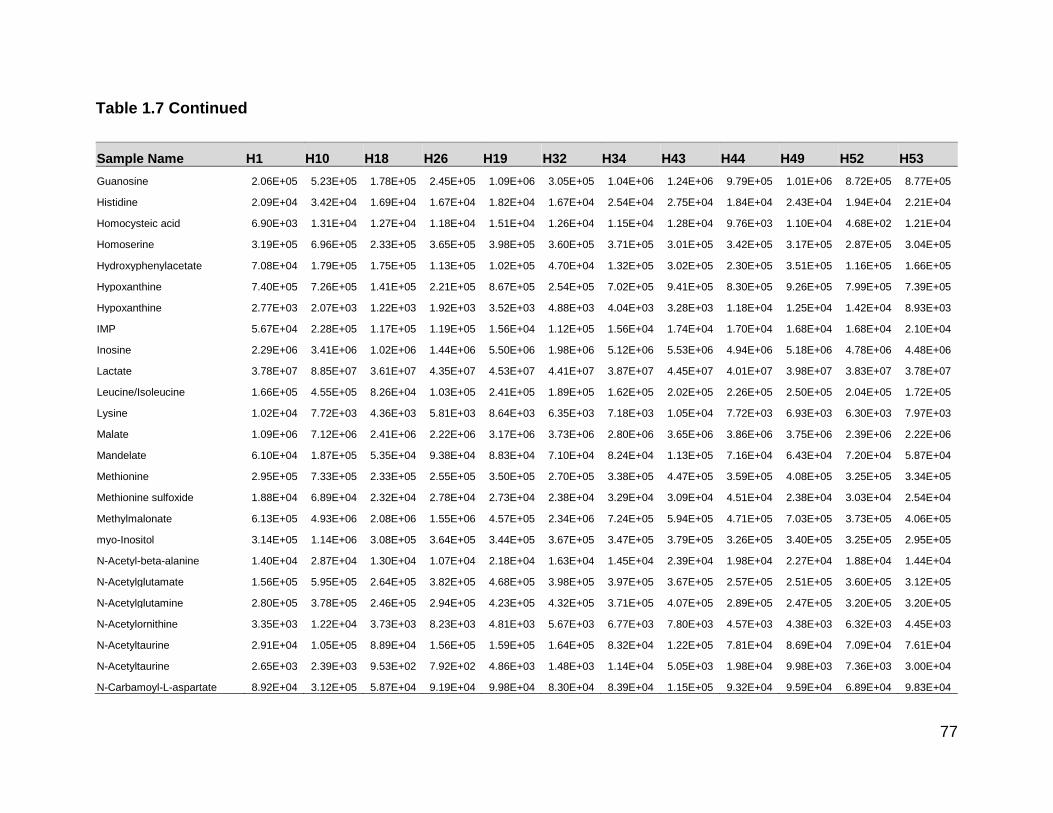
77
Table 1.7 Continued
Sample Name H1 H10 H18 H26 H19 H32 H34 H43 H44 H49 H52 H53
Guanosine 2.06E+05 5.23E+05 1.78E+05 2.45E+05 1.09E+06 3.05E+05 1.04E+06 1.24E+06 9.79E+05 1.01E+06 8.72E+05 8.77E+05
Histidine 2.09E+04 3.42E+04 1.69E+04 1.67E+04 1.82E+04 1.67E+04 2.54E+04 2.75E+04 1.84E+04 2.43E+04 1.94E+04 2.21E+04
Homocysteic acid 6.90E+03 1.31E+04 1.27E+04 1.18E+04 1.51E+04 1.26E+04 1.15E+04 1.28E+04 9.76E+03 1.10E+04 4.68E+02 1.21E+04
Homoserine 3.19E+05 6.96E+05 2.33E+05 3.65E+05 3.98E+05 3.60E+05 3.71E+05 3.01E+05 3.42E+05 3.17E+05 2.87E+05 3.04E+05
Hydroxyphenylacetate 7.08E+04 1.79E+05 1.75E+05 1.13E+05 1.02E+05 4.70E+04 1.32E+05 3.02E+05 2.30E+05 3.51E+05 1.16E+05 1.66E+05
Hypoxanthine 7.40E+05 7.26E+05 1.41E+05 2.21E+05 8.67E+05 2.54E+05 7.02E+05 9.41E+05 8.30E+05 9.26E+05 7.99E+05 7.39E+05
Hypoxanthine 2.77E+03 2.07E+03 1.22E+03 1.92E+03 3.52E+03 4.88E+03 4.04E+03 3.28E+03 1.18E+04 1.25E+04 1.42E+04 8.93E+03
IMP 5.67E+04 2.28E+05 1.17E+05 1.19E+05 1.56E+04 1.12E+05 1.56E+04 1.74E+04 1.70E+04 1.68E+04 1.68E+04 2.10E+04
Inosine 2.29E+06 3.41E+06 1.02E+06 1.44E+06 5.50E+06 1.98E+06 5.12E+06 5.53E+06 4.94E+06 5.18E+06 4.78E+06 4.48E+06
Lactate 3.78E+07 8.85E+07 3.61E+07 4.35E+07 4.53E+07 4.41E+07 3.87E+07 4.45E+07 4.01E+07 3.98E+07 3.83E+07 3.78E+07
Leucine/Isoleucine 1.66E+05 4.55E+05 8.26E+04 1.03E+05 2.41E+05 1.89E+05 1.62E+05 2.02E+05 2.26E+05 2.50E+05 2.04E+05 1.72E+05
Lysine 1.02E+04 7.72E+03 4.36E+03 5.81E+03 8.64E+03 6.35E+03 7.18E+03 1.05E+04 7.72E+03 6.93E+03 6.30E+03 7.97E+03
Malate 1.09E+06 7.12E+06 2.41E+06 2.22E+06 3.17E+06 3.73E+06 2.80E+06 3.65E+06 3.86E+06 3.75E+06 2.39E+06 2.22E+06
Mandelate 6.10E+04 1.87E+05 5.35E+04 9.38E+04 8.83E+04 7.10E+04 8.24E+04 1.13E+05 7.16E+04 6.43E+04 7.20E+04 5.87E+04
Methionine 2.95E+05 7.33E+05 2.33E+05 2.55E+05 3.50E+05 2.70E+05 3.38E+05 4.47E+05 3.59E+05 4.08E+05 3.25E+05 3.34E+05
Methionine sulfoxide 1.88E+04 6.89E+04 2.32E+04 2.78E+04 2.73E+04 2.38E+04 3.29E+04 3.09E+04 4.51E+04 2.38E+04 3.03E+04 2.54E+04
Methylmalonate 6.13E+05 4.93E+06 2.08E+06 1.55E+06 4.57E+05 2.34E+06 7.24E+05 5.94E+05 4.71E+05 7.03E+05 3.73E+05 4.06E+05
myo-Inositol 3.14E+05 1.14E+06 3.08E+05 3.64E+05 3.44E+05 3.67E+05 3.47E+05 3.79E+05 3.26E+05 3.40E+05 3.25E+05 2.95E+05
N-Acetyl-beta-alanine 1.40E+04 2.87E+04 1.30E+04 1.07E+04 2.18E+04 1.63E+04 1.45E+04 2.39E+04 1.98E+04 2.27E+04 1.88E+04 1.44E+04
N-Acetylglutamate 1.56E+05 5.95E+05 2.64E+05 3.82E+05 4.68E+05 3.98E+05 3.97E+05 3.67E+05 2.57E+05 2.51E+05 3.60E+05 3.12E+05
N-Acetylglutamine 2.80E+05 3.78E+05 2.46E+05 2.94E+05 4.23E+05 4.32E+05 3.71E+05 4.07E+05 2.89E+05 2.47E+05 3.20E+05 3.20E+05
N-Acetylornithine 3.35E+03 1.22E+04 3.73E+03 8.23E+03 4.81E+03 5.67E+03 6.77E+03 7.80E+03 4.57E+03 4.38E+03 6.32E+03 4.45E+03
N-Acetyltaurine 2.91E+04 1.05E+05 8.89E+04 1.56E+05 1.59E+05 1.64E+05 8.32E+04 1.22E+05 7.81E+04 8.69E+04 7.09E+04 7.61E+04
N-Acetyltaurine 2.65E+03 2.39E+03 9.53E+02 7.92E+02 4.86E+03 1.48E+03 1.14E+04 5.05E+03 1.98E+04 9.98E+03 7.36E+03 3.00E+04
N-Carbamoyl-L-aspartate 8.92E+04 3.12E+05 5.87E+04 9.19E+04 9.98E+04 8.30E+04 8.39E+04 1.15E+05 9.32E+04 9.59E+04 6.89E+04 9.83E+04

78
Table 1.7 Continued
Sample Name H1 H10 H18 H26 H19 H32 H34 H43 H44 H49 H52 H53
NAD+ 3.67E+03 2.02E+04 1.42E+04 3.94E+03 1.52E+03 9.39E+03 9.94E+02 1.53E+03 6.90E+02 1.00E+02 6.66E+02 1.13E+03
Orotate 9.40E+03 2.44E+04 1.55E+04 1.54E+04 1.64E+04 1.85E+04 1.49E+04 2.22E+04 5.51E+04 2.39E+04 1.38E+04 1.25E+04
Pantothenate 6.66E+05 1.45E+06 4.50E+05 4.97E+05 5.48E+05 5.41E+05 4.74E+05 5.69E+05 4.72E+05 4.84E+05 4.84E+05 4.83E+05
Phenylalanine 1.90E+05 1.75E+05 8.83E+04 9.85E+04 1.73E+05 9.84E+04 1.82E+05 2.11E+05 1.88E+05 2.08E+05 1.75E+05 1.67E+05
Phenyllactic acid 6.65E+04 2.02E+05 1.04E+05 7.15E+04 7.70E+04 6.55E+04 7.77E+04 1.52E+05 1.30E+05 6.02E+05 9.16E+04 1.03E+05
Proline 5.46E+04 1.57E+05 5.49E+04 7.17E+04 8.86E+04 7.24E+04 8.26E+04 1.04E+05 9.66E+04 1.02E+05 1.02E+05 8.79E+04
Pyroglutamic acid 1.48E+06 2.48E+06 7.56E+05 6.43E+05 2.91E+06 8.87E+05 2.94E+06 3.89E+06 3.04E+06 3.34E+06 2.62E+06 2.20E+06
Pyruvate 2.70E+05 9.48E+05 4.63E+05 3.18E+05 4.40E+05 4.34E+05 4.16E+05 4.80E+05 4.74E+05 4.48E+05 4.98E+05 3.97E+05
Ribose phosphate 1.96E+05 3.01E+05 1.15E+05 1.57E+05 4.54E+05 1.73E+05 4.83E+05 4.73E+05 4.09E+05 4.49E+05 3.99E+05 3.13E+05
Ribose phosphate 1.21E+05 1.57E+05 6.47E+04 7.62E+04 4.58E+05 1.11E+05 4.44E+05 4.97E+05 4.08E+05 4.27E+05 3.94E+05 2.91E+05
Ribose phosphate 3.33E+05 3.24E+05 1.39E+05 1.37E+05 2.42E+05 2.10E+05 2.67E+05 2.21E+05 2.27E+05 2.58E+05 2.85E+05 2.10E+05
Ribose phosphate 3.33E+05 3.24E+05 1.39E+05 1.57E+05 4.58E+05 2.10E+05 4.83E+05 4.97E+05 4.08E+05 4.27E+05 3.94E+05 3.13E+05
Sedoheptulose 1/7-phosphate 2.07E+04 2.83E+04 6.21E+03 8.34E+03 6.92E+04 8.91E+03 8.26E+04 1.12E+05 6.48E+04 9.10E+04 8.41E+04 5.65E+04
Serine 1.01E+06 2.24E+06 8.54E+05 1.16E+06 1.33E+06 1.08E+06 1.32E+06 1.38E+06 1.29E+06 1.19E+06 1.05E+06 9.74E+05
sn-Glycerol 3-phosphate 2.88E+04 7.32E+04 2.68E+04 1.85E+04 1.67E+04 3.50E+04 1.26E+04 1.98E+04 1.01E+04 1.32E+04 1.32E+04 1.27E+04
Succinate 6.13E+05 4.93E+06 2.08E+06 1.55E+06 4.57E+05 2.34E+06 7.24E+05 5.94E+05 4.71E+05 7.03E+05 3.73E+05 4.06E+05
Taurine 7.94E+06 3.32E+07 1.03E+07 1.26E+07 1.29E+07 1.27E+07 1.20E+07 1.28E+07 1.13E+07 1.26E+07 1.08E+07 9.79E+06
Thymidine 1.71E+03 7.90E+03 3.25E+03 3.75E+03 7.79E+03 5.15E+03 6.18E+03 6.28E+03 5.75E+03 8.16E+03 7.16E+03 4.60E+03
Thymine 4.17E+03 4.08E+03 2.57E+03 4.06E+03 4.71E+03 2.81E+03 6.04E+03 5.34E+03 7.34E+03 4.15E+03 3.88E+03 4.05E+03
Trehalose/sucrose 7.42E+05 8.95E+04 1.63E+04 1.46E+04 4.17E+05 7.44E+04 4.03E+04 1.02E+05 6.21E+04 6.33E+04 2.88E+04 2.93E+04
Tryptophan 1.72E+05 3.31E+05 1.59E+05 2.01E+05 1.99E+05 2.29E+05 2.64E+05 2.72E+05 1.86E+05 2.33E+05 1.91E+05 1.89E+05
Tyrosine 4.76E+05 1.57E+06 5.42E+05 5.88E+05 5.74E+05 6.29E+05 6.41E+05 8.30E+05 5.62E+05 6.97E+05 5.86E+05 5.62E+05
UDP-glucose 5.81E+04 2.87E+05 1.20E+05 9.80E+04 5.27E+04 1.03E+05 7.94E+04 7.33E+04 7.40E+04 8.03E+04 5.12E+04 8.06E+04
UDP-N-acetylglucosamine 4.07E+04 3.26E+05 1.11E+05 1.05E+05 8.55E+04 1.46E+05 1.00E+05 9.20E+04 8.21E+04 1.02E+05 5.68E+04 7.94E+04
UMP 7.82E+04 3.76E+05 1.25E+05 1.45E+05 9.57E+03 1.38E+05 1.12E+04 3.28E+03 4.51E+03 1.73E+03 4.95E+03 1.40E+04

79
Table 1.7 Continued
Sample Name H1 H10 H18 H26 H19 H32 H34 H43 H44 H49 H52 H53
Uracil 2.41E+05 4.33E+05 9.68E+04 1.54E+05 3.04E+05 1.90E+05 4.17E+05 4.80E+05 3.46E+05 4.54E+05 3.44E+05 3.37E+05
Uric acid 2.06E+04 5.97E+04 1.53E+04 2.55E+04 2.62E+04 2.28E+04 1.36E+04 3.51E+04 2.89E+04 4.13E+04 1.79E+04 2.28E+04
Uridine 1.29E+04 7.34E+04 1.99E+04 2.56E+04 2.69E+04 2.72E+04 2.49E+04 3.16E+04 3.12E+04 2.79E+04 2.12E+04 2.09E+04
Xanthine 3.69E+05 5.08E+05 1.22E+05 1.30E+05 5.08E+05 2.27E+05 4.24E+05 6.18E+05 5.38E+05 6.28E+05 5.81E+05 4.84E+05
Xanthosine 7.98E+03 2.02E+03 6.39E+02 3.67E+03 7.31E+03 2.71E+03 8.22E+03 7.76E+03 7.56E+03 1.05E+04 9.86E+03 8.13E+03

80
Table 1.8 Raw Data of Subordinate Hamsters from HPC
Sample Name H6 H8 H9 H14 H15 H17 H23 H24 H36 H41
1-Methyladenosine 5.92E+03 6.67E+03 3.61E+03 3.03E+03 2.86E+03 1.59E+03 4.68E+03 5.40E+03 3.82E+03 3.14E+03
2-Aminoadipate 1.51E+04 1.25E+04 2.44E+04 4.02E+04 2.05E+04 7.03E+03 1.28E+04 1.39E+04 1.29E+04 2.93E+04
2-Dehydro-D-gluconate 4.78E+03 2.97E+03 3.26E+03 9.61E+03 3.14E+03 3.54E+02 3.99E+03 4.27E+03 3.31E+03 2.76E+03
2-Hydroxy-2-methylsuccinate 2.52E+05 1.79E+05 1.16E+05 1.17E+05 1.92E+05 2.85E+04 2.61E+05 1.79E+05 1.46E+05 1.21E+05
3-Methoxytyramine 4.52E+04 4.79E+04 4.82E+04 4.13E+04 4.15E+04 4.38E+04 4.20E+04 4.71E+04 4.64E+04 4.98E+04
3_4-Dihydroxyphenylacetate 2.49E+04 2.22E+04 1.86E+04 3.30E+04 2.76E+04 2.44E+04 3.00E+04 3.02E+04 3.46E+04 2.28E+04
4-Aminobutyrate 1.33E+06 7.87E+05 4.77E+05 1.46E+06 3.81E+05 1.73E+05 7.99E+05 8.01E+05 8.06E+05 4.86E+05
5-Hydroxyindoleacetic acid 8.84E+04 5.86E+04 3.94E+04 8.33E+03 1.16E+04 2.25E+03 1.29E+04 1.57E+04 1.24E+04 2.62E+04
Acadesine 5.17E+03 5.95E+03 9.13E+03 1.18E+04 6.05E+03 9.14E+03 5.73E+03 7.43E+03 6.99E+03 8.28E+03
Acetyllysine 3.46E+03 2.75E+03 1.76E+03 7.10E+03 1.97E+03 1.00E+03 3.92E+03 4.74E+03 2.02E+03 2.42E+03
Adenine 2.16E+04 2.30E+04 8.92E+03 3.18E+04 8.12E+03 3.57E+03 8.22E+03 8.34E+03 8.31E+03 5.45E+03
Adenosine 9.51E+04 8.07E+04 2.94E+04 4.80E+05 8.23E+04 7.76E+04 4.98E+05 5.36E+05 4.93E+05 2.93E+04
AICAR 1.10E+04 7.04E+03 1.30E+04 5.65E+04 1.07E+04 3.22E+03 7.57E+03 1.01E+04 1.17E+04 1.19E+04
Alanine 1.48E+06 1.28E+06 1.25E+06 2.83E+06 1.22E+06 5.83E+05 1.28E+06 1.32E+06 1.21E+06 1.21E+06
Allantoate 3.04E+03 3.42E+02 4.04E+02 4.50E+03 9.19E+02 4.44E+02 5.13E+03 1.55E+03 2.68E+03 1.10E+03
alpha-Ketoglutarate 3.15E+03 4.36E+03 1.82E+03 2.96E+03 6.35E+03 1.80E+03 3.47E+03 3.65E+03 3.24E+03 1.16E+03
AMP 2.27E+04 1.87E+04 2.84E+05 9.05E+05 1.16E+06 4.28E+05 9.46E+05 8.57E+05 7.12E+05 3.94E+05
Allantoin 3.69E+03 2.44E+03 1.64E+03 7.83E+03 2.92E+03 1.68E+03 3.06E+03 3.80E+03 3.31E+03 5.09E+03
Arginine 2.24E+04 2.29E+04 2.31E+04 1.34E+04 1.41E+04 6.15E+03 1.54E+04 1.79E+04 1.36E+04 2.66E+04
Ascorbate 1.47E+07 2.38E+06 3.94E+06 2.79E+07 5.27E+06 1.38E+06 1.32E+07 1.32E+07 1.29E+07 5.69E+06
Asparagine 7.79E+04 5.06E+04 4.81E+04 1.28E+05 3.55E+04 1.38E+04 4.48E+04 5.84E+04 3.98E+04 4.41E+04
Aspartate 3.09E+06 2.93E+06 2.55E+06 6.08E+06 1.61E+06 4.93E+05 1.96E+06 1.94E+06 2.00E+06 1.82E+06
beta-Alanine 1.48E+06 1.28E+06 1.25E+06 2.83E+06 1.22E+06 5.83E+05 1.28E+06 1.32E+06 1.21E+06 1.21E+06
Betaine 3.27E+05 2.76E+05 2.61E+05 6.01E+05 1.99E+05 5.98E+04 2.46E+05 2.30E+05 2.30E+05 2.35E+05
CDP-ethanolamine 3.09E+04 3.31E+04 3.08E+04 1.10E+05 3.17E+04 1.28E+04 3.33E+04 3.18E+04 2.99E+04 3.19E+04
Citrate/isocitrate 3.42E+03 3.42E+03 4.49E+03 1.82E+03 2.03E+03 1.96E+03 2.31E+03 2.64E+03 3.81E+03 4.75E+03
Citrulline 6.10E+04 5.99E+04 4.67E+04 5.41E+04 4.83E+04 1.84E+04 7.75E+04 6.33E+04 6.13E+04 4.33E+04
CMP 4.44E+03 1.30E+03 1.92E+04 5.12E+04 1.78E+04 9.24E+03 1.80E+04 2.04E+04 1.48E+04 2.22E+04
Creatine 1.62E+06 1.41E+06 1.41E+06 3.80E+06 1.29E+06 6.34E+05 1.41E+06 1.51E+06 1.33E+06 1.34E+06

81
Table 1.8 Continued
Sample Name H6 H8 H9 H14 H15 H17 H23 H24 H36 H41
Creatinine 1.55E+04 1.30E+04 1.27E+04 2.72E+04 8.16E+03 4.96E+03 1.44E+04 1.12E+04 1.16E+04 1.09E+04
Cystathionine 1.72E+05 1.06E+05 1.19E+05 4.76E+05 1.56E+05 7.66E+04 1.82E+05 2.34E+05 2.14E+05 1.88E+05
Cysteine 5.46E+05 3.65E+05 5.52E+05 2.01E+05 1.18E+05 1.12E+04 7.12E+04 9.20E+04 9.17E+04 3.09E+05
Cystine 2.62E+04 5.74E+04 3.80E+04 9.62E+03 3.49E+03 1.02E+04 2.19E+03 1.97E+03 3.57E+03 1.32E+04
Cytidine 8.30E+04 4.23E+04 3.24E+04 7.48E+04 2.14E+04 8.34E+03 4.10E+04 3.26E+04 3.44E+04 2.06E+04
Cytidine 3.58E+04 2.94E+04 4.62E+04 7.69E+04 5.98E+04 4.29E+04 3.71E+04 3.81E+04 2.93E+04 6.51E+04
D-Gluconate 6.02E+04 6.20E+04 4.74E+04 9.98E+04 4.11E+04 1.23E+04 4.69E+04 4.41E+04 4.97E+04 3.16E+04
D-Glucosamine 1-phosphate 6.67E+03 5.62E+03 5.42E+02 1.00E+02 1.00E+02 1.00E+02 2.38E+02 3.91E+02 2.01E+02 1.82E+03
D-Glyceraldehdye 3-phosphate 4.96E+05 5.16E+05 2.02E+05 3.41E+05 4.64E+04 3.03E+04 3.03E+05 2.48E+05 3.30E+05 4.13E+05
Diiodothyronine 1.35E+04 1.14E+04 1.82E+04 6.79E+04 1.63E+04 1.35E+04 1.80E+04 9.87E+03 2.03E+04 1.72E+04
Dimethylglycine 1.21E+05 9.50E+04 9.17E+04 2.68E+05 7.40E+04 3.37E+04 1.03E+05 1.01E+05 1.01E+05 7.11E+04
Dimethylglycine 1.33E+06 7.87E+05 4.77E+05 1.46E+06 3.81E+05 1.73E+05 7.99E+05 8.01E+05 8.06E+05 4.86E+05
Fumarate 1.84E+05 1.23E+05 3.61E+04 5.45E+04 8.61E+04 1.45E+04 1.41E+05 1.58E+05 1.12E+05 4.83E+04
Glucosamine 1.00E+02 5.64E+02 3.86E+02 2.02E+03 1.00E+02 3.33E+02 1.00E+02 5.27E+02 1.00E+02 2.22E+02
Glucose 1-phosphate 1.88E+05 1.10E+05 7.11E+04 2.03E+05 9.39E+04 2.86E+04 1.75E+05 1.55E+05 1.87E+05 8.83E+04
Glucose 6-phosphate 6.00E+05 6.00E+05 9.71E+04 1.30E+05 2.98E+04 1.13E+04 8.23E+04 1.07E+05 5.96E+04 2.91E+05
Glutamate 3.35E+07 3.02E+07 2.53E+07 8.48E+07 2.36E+07 1.22E+07 3.25E+07 3.10E+07 2.93E+07 2.24E+07
Glutamine 1.44E+07 1.29E+07 1.11E+07 2.04E+07 1.18E+07 5.70E+06 1.36E+07 1.32E+07 1.21E+07 1.09E+07
Glutathione 6.97E+06 4.54E+06 3.33E+06 1.32E+07 5.58E+06 9.77E+05 7.38E+06 7.77E+06 7.25E+06 4.90E+06
Glutathione disulfide 9.44E+04 7.90E+04 2.60E+04 1.15E+04 1.64E+04 6.23E+04 3.01E+04 2.07E+04 2.76E+04 2.89E+04
GMP 2.99E+03 1.95E+03 3.48E+04 5.62E+04 7.44E+04 2.76E+04 7.91E+04 6.65E+04 6.23E+04 4.58E+04
Guanine 6.03E+03 5.52E+03 6.60E+03 8.98E+03 3.12E+03 2.91E+02 1.05E+03 3.03E+03 2.88E+03 4.09E+03
Guanosine 1.23E+06 1.03E+06 4.37E+05 3.12E+05 1.00E+05 3.48E+04 2.20E+05 2.17E+05 2.24E+05 3.42E+05
Histidine 1.93E+04 2.34E+04 1.90E+04 2.18E+04 1.73E+04 6.89E+03 1.63E+04 2.08E+04 1.52E+04 1.69E+04
Homocysteic acid 1.05E+04 5.76E+03 1.05E+04 3.48E+04 1.15E+04 3.21E+03 1.06E+04 9.35E+03 1.29E+04 1.03E+04
Homoserine 3.89E+05 3.57E+05 3.75E+05 7.12E+05 2.82E+05 2.02E+05 3.04E+05 3.75E+05 2.94E+05 3.94E+05
Hydroxyphenylacetate 1.35E+05 1.37E+05 2.65E+05 1.41E+05 1.24E+05 5.46E+04 5.12E+04 2.14E+05 1.83E+05 9.61E+04
Hypoxanthine 9.60E+05 8.42E+05 8.96E+05 7.52E+05 2.10E+05 5.95E+04 2.15E+05 1.86E+05 1.63E+05 6.19E+05

82
Table 1.8 Continued
Sample Name H6 H8 H9 H14 H15 H17 H23 H24 H36 H41
IMP 1.84E+04 1.82E+04 4.20E+04 5.15E+04 6.37E+04 1.87E+04 8.24E+04 6.31E+04 5.91E+04 2.55E+04
Inosine 5.65E+06 5.22E+06 3.58E+06 2.57E+06 1.01E+06 4.28E+05 1.29E+06 1.42E+06 1.57E+06 3.04E+06
Lactate 4.47E+07 3.52E+07 3.86E+07 9.07E+07 3.34E+07 2.19E+07 3.93E+07 4.70E+07 4.04E+07 3.72E+07
Leucine/Isoleucine 2.43E+05 2.23E+05 2.45E+05 4.22E+05 9.11E+04 2.36E+04 1.10E+05 1.12E+05 1.02E+05 1.45E+05
Lysine 8.72E+03 7.00E+03 9.27E+03 3.94E+03 5.69E+03 1.89E+03 5.96E+03 7.32E+03 5.63E+03 5.88E+03
Malate 5.08E+06 2.84E+06 1.21E+06 1.14E+06 1.61E+06 3.22E+05 2.94E+06 2.88E+06 2.13E+06 1.76E+06
Mandelate 5.35E+04 7.31E+04 4.84E+04 6.66E+04 6.39E+04 7.27E+04 8.72E+04 1.18E+05 9.87E+04 8.54E+04
Methionine 4.00E+05 3.60E+05 3.58E+05 6.94E+05 1.98E+05 5.63E+04 2.18E+05 2.37E+05 1.93E+05 2.90E+05
Methionine sulfoxide 2.33E+04 3.34E+04 4.01E+04 7.46E+04 2.20E+04 2.18E+04 1.88E+04 2.51E+04 2.97E+04 3.34E+04
Methylmalonate 6.35E+05 5.89E+05 4.15E+05 1.55E+06 1.80E+06 7.57E+05 1.86E+06 2.28E+06 1.41E+06 4.22E+05
myo-Inositol 3.54E+05 2.87E+05 3.24E+05 6.65E+05 2.64E+05 2.10E+05 3.33E+05 3.97E+05 3.42E+05 2.80E+05
N-Acetyl-beta-alanine 1.58E+04 1.80E+04 2.12E+04 3.07E+04 8.26E+03 6.47E+03 1.26E+04 1.12E+04 1.28E+04 1.59E+04
N-Acetylglutamate 4.54E+05 3.60E+05 2.22E+05 2.09E+05 2.22E+05 5.82E+04 3.55E+05 3.32E+05 3.16E+05 1.60E+05
N-Acetylglutamine 3.19E+05 2.85E+05 3.14E+05 4.98E+05 2.36E+05 5.57E+04 2.11E+05 2.12E+05 2.16E+05 3.07E+05
N-Acetylornithine 4.24E+03 5.36E+03 4.72E+03 7.14E+03 3.37E+03 1.30E+03 3.70E+03 6.60E+03 6.19E+03 3.53E+03
N-Acetyltaurine 1.11E+05 7.76E+04 3.29E+04 1.42E+05 5.01E+04 1.78E+04 1.46E+05 1.20E+05 8.29E+04 4.09E+04
N-Acetyltaurine 2.09E+03 4.40E+03 2.94E+03 1.24E+03 2.04E+03 1.56E+03 7.72E+02 2.03E+03 3.25E+03 5.63E+03
N-Carbamoyl-L-aspartate 6.94E+04 9.50E+04 7.85E+04 9.44E+04 8.51E+04 5.14E+04 8.42E+04 8.16E+04 9.58E+04 7.66E+04
NAD+ 1.15E+03 2.97E+03 2.95E+03 2.60E+04 1.84E+04 7.16E+03 6.32E+03 5.11E+03 6.07E+03 1.54E+03
Orotate 2.51E+04 1.09E+04 9.06E+03 2.67E+04 1.02E+04 3.35E+03 1.13E+04 1.46E+04 1.20E+04 1.02E+04
Pantothenate 5.77E+05 3.38E+05 6.21E+05 4.05E+05 4.51E+05 2.52E+05 6.46E+05 5.85E+05 4.07E+05 4.76E+05
Phenylalanine 1.90E+05 1.80E+05 2.47E+05 2.19E+05 1.09E+05 4.10E+04 9.11E+04 1.19E+05 8.71E+04 1.96E+05
Phenyllactic acid 1.10E+05 9.18E+04 1.42E+05 9.57E+04 7.77E+04 5.31E+04 5.38E+04 1.44E+05 9.34E+04 7.60E+04
Proline 1.15E+05 7.94E+04 6.17E+04 9.61E+04 4.37E+04 1.98E+04 8.84E+04 8.28E+04 7.33E+04 6.65E+04
Pyroglutamic acid 3.24E+06 2.90E+06 2.93E+06 2.88E+06 8.29E+05 6.17E+05 9.51E+05 1.18E+06 9.61E+05 1.59E+06
Pyruvate 5.80E+05 5.53E+05 4.12E+05 9.03E+05 3.44E+05 2.72E+05 3.81E+05 4.30E+05 4.25E+05 2.78E+05
Ribose phosphate 4.05E+05 4.05E+05 1.88E+05 2.20E+05 7.49E+04 2.81E+04 1.32E+05 1.15E+05 1.24E+05 2.68E+05
Sedoheptulose 1/7-phosphate 9.70E+04 9.03E+04 2.53E+04 1.37E+04 4.23E+03 2.08E+03 8.92E+03 8.75E+03 6.79E+03 2.62E+04

83
Table 1.8 Continued
Sample Name H6 H8 H9 H14 H15 H17 H23 H24 H36 H41
Serine 1.42E+06 1.19E+06 1.16E+06 2.92E+06 8.39E+05 5.19E+05 1.11E+06 1.07E+06 9.01E+05 1.11E+06
sn-Glycerol 3-phosphate 1.82E+04 1.85E+04 3.35E+04 7.14E+04 3.73E+04 4.52E+04 3.44E+04 1.93E+04 2.09E+04 1.74E+04
Succinate 6.35E+05 5.89E+05 4.15E+05 1.55E+06 1.80E+06 7.57E+05 1.86E+06 2.28E+06 1.41E+06 4.22E+05
Taurine 1.26E+07 1.25E+07 8.96E+06 3.36E+07 7.94E+06 4.41E+06 1.18E+07 1.02E+07 1.20E+07 9.77E+06
Thymidine 7.78E+03 9.78E+03 5.45E+03 1.06E+04 2.72E+03 5.85E+02 4.38E+03 4.76E+03 5.01E+03 2.40E+03
Thymine 5.30E+03 4.05E+03 4.26E+03 5.45E+03 2.25E+03 9.30E+02 3.01E+03 3.73E+03 3.23E+03 4.50E+03
Trehalose/sucrose 2.87E+04 4.15E+04 8.57E+04 6.53E+04 2.77E+04 2.99E+04 5.91E+04 3.37E+04 3.07E+04 3.07E+04
Tryptophan 2.14E+05 2.11E+05 1.99E+05 3.41E+05 1.76E+05 4.51E+04 1.69E+05 1.92E+05 1.57E+05 1.48E+05
Tyrosine 6.72E+05 6.10E+05 5.68E+05 1.72E+06 5.69E+05 1.89E+05 5.43E+05 6.10E+05 4.99E+05 4.86E+05
UDP-glucose 7.44E+04 2.84E+04 5.84E+04 7.73E+04 8.40E+04 4.56E+04 1.01E+05 9.77E+04 9.92E+04 1.08E+05
UDP-N-acetylglucosamine 9.87E+04 5.18E+04 4.56E+04 6.79E+04 7.97E+04 3.19E+04 1.04E+05 9.25E+04 9.97E+04 8.00E+04
UMP 5.78E+03 2.38E+03 5.79E+04 1.42E+05 1.33E+05 4.81E+04 1.29E+05 1.28E+05 1.08E+05 7.55E+04
Uracil 4.60E+05 3.27E+05 2.09E+05 3.17E+05 4.04E+04 2.02E+04 1.21E+05 1.21E+05 1.34E+05 1.93E+05
Uric acid 2.62E+04 1.81E+04 1.09E+05 1.28E+05 3.73E+04 8.66E+03 2.28E+04 2.95E+04 3.79E+04 4.12E+04
Uridine 3.07E+04 2.59E+04 1.51E+04 4.37E+04 1.68E+04 4.03E+03 2.28E+04 2.09E+04 2.05E+04 1.49E+04
Xanthine 6.85E+05 7.59E+05 4.84E+05 3.05E+05 1.14E+05 3.39E+04 2.17E+05 2.00E+05 1.68E+05 3.74E+05
Xanthosine 1.01E+04 8.76E+03 6.04E+03 4.50E+03 2.59E+03 8.73E+02 2.73E+03 3.12E+03 1.25E+03 6.34E+03

84
Table 1.9 Raw Data of Dominant Hamsters from NAc
Sample Name H2 H5 H12 H19 H25 H28 H33 H38 H45 H47
2-Hydroxy-2-methylsuccinate 5.68E+05 1.54E+05 5.48E+05 5.55E+05 4.08E+05 5.20E+05 6.13E+05 5.19E+05 3.04E+05 4.90E+05
3-Phosphoglycerate 9.59E+04 2.82E+04 1.00E+02 4.82E+03 1.00E+02 4.37E+03 1.00E+02 2.11E+05 6.28E+04 1.05E+05
3_4-Dihydroxyphenylacetate 5.28E+03 1.27E+04 2.42E+04 2.76E+04 2.81E+04 1.76E+04 2.44E+04 1.80E+04 2.92E+04 6.42E+03
4-Aminobutyrate 1.01E+06 1.76E+06 5.85E+05 8.49E+05 9.67E+05 6.60E+05 1.17E+06 6.99E+05 1.08E+06 6.42E+05
5-Hydroxyindoleacetic acid 3.60E+04 4.17E+04 8.14E+04 5.64E+04 5.03E+04 2.57E+04 5.70E+04 5.01E+04 7.19E+04 4.42E+04
Aconitate 1.21E+05 9.93E+04 9.26E+04 1.37E+05 9.99E+04 1.35E+05 9.51E+04 2.07E+05 1.04E+05 1.45E+05
Alanine 1.91E+06 1.42E+06 1.45E+06 1.41E+06 1.73E+06 1.55E+06 2.02E+06 1.89E+06 1.51E+06 1.53E+06
alpha-Ketoglutarate 9.24E+04 3.46E+04 2.89E+04 1.15E+05 5.45E+04 8.54E+04 6.02E+04 6.13E+04 4.18E+04 7.54E+04
AMP 6.14E+04 1.89E+04 3.79E+05 9.11E+04 2.67E+05 5.48E+04 6.79E+04 5.20E+04 4.79E+04 5.56E+04
Arginine 1.97E+04 1.72E+04 1.23E+04 7.83E+03 1.45E+04 1.22E+04 2.15E+04 2.34E+04 2.07E+04 2.89E+04
Ascorbate 1.00E+02 1.00E+02 1.32E+06 2.39E+04 1.00E+02 1.00E+02 7.31E+04 4.29E+05 4.21E+04 3.41E+04
Asparagine 6.45E+04 2.95E+04 5.25E+04 5.33E+04 5.94E+04 6.25E+04 6.47E+04 5.08E+04 6.49E+04 6.72E+04
Aspartate 8.03E+06 4.33E+06 5.76E+06 5.59E+06 6.11E+06 5.40E+06 6.88E+06 7.40E+06 7.29E+04 6.84E+06
CDP-ethanolamine 2.39E+04 5.98E+03 2.63E+04 2.25E+04 1.69E+04 7.35E+03 1.48E+04 2.98E+04 1.36E+03 1.91E+04
Citrate/isocitrate 4.95E+06 3.04E+06 2.71E+06 4.30E+06 2.64E+06 4.66E+06 4.24E+06 1.22E+07 2.94E+06 8.30E+06
Citrulline 1.88E+04 4.49E+03 1.17E+04 7.81E+03 5.49E+03 2.17E+04 1.17E+04 1.60E+04 9.52E+03 1.96E+04
Creatine 1.80E+06 1.29E+06 9.39E+05 9.24E+05 1.55E+06 1.29E+06 1.80E+06 1.55E+06 1.05E+06 1.31E+06
Creatinine 1.21E+05 4.52E+04 3.17E+04 4.20E+04 4.66E+04 4.77E+04 6.56E+04 8.76E+04 6.44E+04 1.12E+05
Cysteine 2.42E+03 1.68E+03 4.53E+02 7.99E+02 2.78E+03 1.00E+02 3.40E+03 1.23E+05 2.04E+03 1.13E+05
Cystine 1.41E+05 1.57E+05 9.32E+04 7.39E+04 5.38E+04 5.52E+04 9.93E+04 8.44E+04 1.11E+05 3.87E+04
Cytidine 4.04E+04 1.81E+04 1.81E+04 2.13E+04 1.84E+04 2.67E+04 2.56E+04 2.72E+04 5.16E+04 1.47E+04
Cytidine 2.26E+04 4.52E+04 1.01E+04 8.90E+03 2.42E+04 3.66E+04 4.13E+04 1.71E+04 1.30E+04 1.68E+04
D-Glyceraldehdye 3-phosphate 3.06E+05 4.33E+04 8.78E+04 4.24E+04 7.15E+04 9.34E+04 4.16E+04 3.01E+05 1.63E+05 2.74E+05
Dopamine 4.51E+04 1.74E+04 5.42E+04 4.17E+04 6.39E+04 3.71E+04 1.00E+05 1.41E+04 2.79E+04 4.95E+04
Fructose 1_6-bisphosphate 5.85E+04 6.30E+03 3.29E+03 1.00E+02 1.00E+02 1.00E+02 5.18E+03 1.73E+05 1.24E+05 1.31E+05
Fumarate 4.82E+06 8.44E+05 2.79E+06 2.19E+06 2.45E+06 3.42E+06 2.69E+06 4.21E+06 2.23E+06 4.27E+06
Glutamate 1.98E+07 6.96E+06 1.53E+07 1.55E+07 1.47E+07 1.52E+07 1.77E+07 1.65E+07 9.21E+06 1.55E+07
Glutamine 1.01E+07 5.78E+06 8.06E+06 7.55E+06 7.45E+06 7.77E+06 8.11E+06 8.20E+06 8.60E+06 7.94E+06
Glutathione 1.00E+02 3.81E+03 2.46E+05 2.63E+05 2.90E+05 1.00E+02 4.65E+05 3.28E+05 2.43E+05 4.38E+05
Glutathione disulfide 9.94E+04 4.92E+03 1.35E+05 6.91E+04 1.10E+05 3.02E+05 9.54E+04 1.06E+05 8.99E+04 2.10E+05
Glycine 3.90E+05 4.34E+05 7.56E+04 1.21E+05 2.60E+05 4.23E+05 2.79E+05 2.69E+05 3.09E+05 1.98E+05
Guanosine 4.51E+05 3.16E+05 2.96E+05 2.98E+05 2.74E+05 3.87E+05 3.65E+05 3.94E+05 2.37E+05 3.64E+05
Histidine 7.23E+04 3.89E+04 5.85E+04 4.24E+04 4.79E+04 4.94E+04 9.29E+04 7.30E+04 4.43E+04 8.24E+04

85
Table 1.9 Continued
Sample Name H2 H5 H12 H19 H25 H28 H33 H38 H45 H47
Homoserine 8.17E+05 4.33E+05 6.34E+05 4.99E+05 7.30E+05 6.97E+05 8.46E+05 6.23E+05 5.62E+05 7.31E+05
Homovanillic acid 1.22E+05 5.14E+04 9.89E+04 1.40E+05 9.59E+04 9.01E+04 1.42E+05 1.38E+05 7.29E+04 1.39E+05
Hydroxybenzoate 1.50E+06 5.57E+05 3.76E+06 3.09E+06 3.02E+06 4.43E+06 4.26E+06 9.37E+05 1.80E+06 1.77E+06
Hypoxanthine 2.85E+06 1.38E+06 1.06E+06 9.18E+05 1.07E+06 1.32E+06 1.41E+06 2.44E+06 2.62E+06 2.10E+06
IMP 1.68E+04 7.72E+03 8.79E+04 2.81E+04 7.89E+04 5.76E+03 2.18E+04 7.11E+03 6.12E+03 5.40E+03
Inosine 2.82E+06 1.50E+06 2.17E+06 2.19E+06 2.20E+06 2.42E+06 2.84E+06 2.39E+06 1.13E+06 2.61E+06
Lactate 7.55E+07 4.78E+07 6.74E+07 6.05E+07 6.73E+07 6.96E+07 6.46E+07 7.60E+07 2.23E+07 7.19E+07
Leucine/Isoleucine 1.89E+05 7.16E+04 8.95E+04 4.43E+04 7.46E+04 8.71E+04 1.14E+05 1.09E+05 1.37E+05 1.04E+05
Malate 5.46E+07 1.69E+07 3.28E+07 2.91E+07 3.25E+07 3.98E+07 3.44E+07 4.81E+07 2.48E+07 4.77E+07
Methionine 6.93E+04 3.14E+04 3.75E+04 2.94E+04 3.36E+04 4.38E+04 4.73E+04 6.32E+04 5.32E+04 4.56E+04
Methylmalonate 2.46E+06 1.13E+06 2.33E+06 3.18E+06 2.75E+06 3.68E+06 3.17E+06 2.88E+06 1.92E+05 1.91E+06
myo-Inositol 4.22E+05 2.15E+05 3.16E+05 3.06E+05 3.52E+05 3.94E+05 3.27E+05 4.21E+05 4.84E+04 2.93E+05
N-Acetyl-beta-alanine 1.04E+06 5.72E+05 6.83E+05 8.38E+05 7.71E+05 6.89E+05 8.23E+05 8.52E+05 5.45E+05 9.82E+05
N-Acetylglutamate 8.01E+05 3.27E+05 7.24E+05 6.36E+05 5.69E+05 4.30E+05 6.00E+05 6.68E+05 3.41E+05 5.73E+05
N-Carbamoyl-L-aspartate 1.74E+05 4.24E+05 4.12E+05 5.80E+05 5.55E+05 2.94E+05 3.93E+05 3.68E+05 3.72E+05 6.07E+05
Pantothenate 7.61E+05 5.82E+05 1.79E+06 8.94E+05 9.32E+05 4.85E+05 9.87E+05 6.91E+05 9.62E+05 7.83E+05
Phenylalanine 8.80E+04 4.99E+04 5.51E+04 4.91E+04 5.37E+04 5.86E+04 9.73E+04 7.94E+04 3.95E+04 9.75E+04
Phosphoenolpyruvate 1.13E+05 3.60E+04 1.00E+02 9.05E+03 1.00E+02 6.03E+03 1.00E+02 1.27E+05 5.85E+04 6.39E+04
Proline 1.15E+05 6.60E+04 6.86E+04 5.86E+04 6.81E+04 8.38E+04 9.06E+04 8.57E+04 8.10E+04 8.73E+04
Pyroglutamic acid 2.61E+06 1.43E+06 1.00E+06 7.03E+05 6.31E+05 1.75E+06 1.29E+06 2.44E+06 1.62E+06 1.28E+06
Serine 1.10E+06 5.71E+05 9.86E+05 1.00E+06 1.01E+06 1.14E+06 1.09E+06 8.38E+05 8.92E+05 1.01E+06
Succinate 2.46E+06 1.13E+06 2.33E+06 3.18E+06 2.75E+06 3.68E+06 3.17E+06 2.88E+06 1.92E+05 1.91E+06
Sulfolactate 1.15E+04 1.71E+04 1.21E+05 1.72E+05 1.14E+05 1.40E+05 7.36E+04 8.75E+04 1.06E+05 1.10E+05
Sulfolactate 4.38E+04 1.06E+04 4.33E+04 7.59E+04 3.14E+04 4.77E+04 3.62E+04 1.57E+04 2.85E+04 1.99E+04
Taurine 1.54E+07 5.52E+06 1.28E+07 9.92E+06 1.01E+07 1.27E+07 1.13E+07 1.31E+07 9.20E+06 1.18E+07
Trehalose/sucrose 2.58E+04 3.52E+04 2.45E+04 3.31E+04 3.72E+04 3.56E+04 4.49E+04 1.34E+04 4.53E+04 2.29E+04
Tyrosine 8.81E+04 5.78E+04 6.44E+04 5.25E+04 8.08E+04 6.77E+04 9.92E+04 9.62E+04 1.05E+05 9.71E+04
UDP-glucose 1.02E+05 5.30E+04 3.55E+05 1.33E+05 1.52E+05 8.49E+04 1.23E+05 1.17E+05 1.31E+05 1.14E+05
UDP-N-acetylglucosamine 8.61E+04 2.55E+04 2.19E+05 1.04E+05 8.46E+04 7.24E+04 8.69E+04 7.90E+04 6.77E+04 7.03E+04
UMP 5.77E+03 6.65E+03 1.25E+05 1.87E+04 8.51E+04 5.27E+03 8.72E+03 4.14E+03 5.66E+03 1.00E+02
Uracil 1.46E+06 5.53E+05 5.50E+05 5.40E+05 5.93E+05 7.57E+05 7.82E+05 1.44E+06 8.38E+05 9.47E+05
Uric acid 2.64E+04 7.70E+03 3.33E+04 4.57E+04 2.35E+04 4.50E+04 5.42E+04 4.19E+04 1.67E+04 9.76E+04

86
Table 1.9 Continued
Sample Name H2 H5 H12 H19 H25 H28 H33 H38 H45 H47
Uridine 2.07E+05 9.29E+04 1.52E+05 1.60E+05 1.55E+05 1.70E+05 2.07E+05 1.62E+05 1.47E+05 1.80E+05
Valine 1.72E+05 7.10E+04 1.81E+05 1.29E+05 1.60E+05 2.08E+05 1.59E+05 1.31E+05 1.20E+05 1.37E+05
Xanthine 1.27E+06 3.40E+05 2.89E+05 2.78E+05 2.92E+05 4.25E+05 3.39E+05 7.76E+05 1.26E+06 6.90E+05

87
Table 1.10 Raw Data of Handled Control Hamsters from NAc
Sample Name H1 H18 H26 H31 H32 H34 H43 H44 H49 H52 H53
2-Hydroxy-2-methylsuccinate 3.99E+05 3.92E+05 7.28E+05 4.79E+05 2.31E+05 5.15E+05 2.94E+05 3.84E+05 4.14E+05 4.74E+05 2.67E+05
3-Phosphoglycerate 1.14E+05 3.73E+03 3.38E+03 1.00E+02 1.00E+02 4.38E+03 2.72E+05 6.09E+04 3.41E+05 9.09E+05 1.01E+05
3_4-Dihydroxyphenylacetate 1.97E+04 4.02E+04 1.49E+04 1.19E+04 1.30E+04 5.57E+03 1.44E+04 3.82E+03 1.47E+04 7.11E+03 6.78E+03
4-Aminobutyrate 7.86E+05 7.55E+05 5.16E+05 5.18E+05 1.33E+06 6.61E+05 1.93E+06 7.17E+05 1.08E+06 8.50E+05 1.37E+06
5-Hydroxyindoleacetic acid 3.18E+04 7.09E+04 3.07E+04 3.26E+04 3.11E+04 5.82E+04 8.02E+04 3.06E+04 3.45E+04 1.37E+04 4.28E+04
Aconitate 1.01E+05 1.23E+05 1.38E+05 9.16E+04 1.08E+05 1.08E+05 1.74E+05 9.41E+04 1.29E+05 1.48E+05 8.64E+04
Alanine 1.70E+06 1.36E+06 1.72E+06 1.53E+06 1.74E+06 1.93E+06 1.65E+06 1.36E+06 1.40E+06 1.47E+06 1.24E+06
alpha-Ketoglutarate 4.34E+04 4.90E+04 5.09E+04 2.66E+04 5.02E+04 5.24E+04 5.78E+04 4.03E+04 6.07E+04 6.33E+04 3.00E+04
AMP 1.14E+05 9.49E+04 1.19E+05 1.53E+05 1.85E+05 1.34E+05 4.55E+04 2.37E+04 3.69E+04 4.40E+04 5.16E+04
Arginine 1.86E+04 1.01E+04 2.00E+04 1.84E+04 1.72E+04 2.65E+04 1.51E+04 2.46E+04 2.14E+04 2.20E+04 8.05E+03
Ascorbate 3.87E+05 1.63E+06 5.97E+04 1.20E+06 8.82E+05 3.22E+06 5.64E+04 3.37E+04 2.30E+03 2.71E+03 2.51E+04
Asparagine 5.53E+04 4.66E+04 5.06E+04 4.13E+04 4.60E+04 5.01E+04 3.24E+04 2.88E+04 3.55E+04 3.75E+04 2.37E+04
Aspartate 5.76E+06 4.25E+06 6.80E+06 4.22E+06 4.52E+06 5.42E+06 7.39E+06 6.90E+04 5.52E+06 5.37E+06 8.92E+04
CDP-ethanolamine 2.77E+04 1.98E+04 1.36E+04 1.58E+04 4.24E+03 2.40E+04 1.99E+04 9.92E+02 1.06E+04 1.67E+04 1.00E+02
Citrate/isocitrate 2.23E+06 5.00E+06 3.26E+06 2.39E+06 2.68E+06 4.96E+06 1.18E+07 1.64E+06 8.25E+06 1.29E+07 2.00E+06
Citrulline 1.01E+04 4.05E+03 2.02E+04 2.33E+04 2.06E+04 1.03E+04 9.99E+03 1.12E+04 6.73E+03 3.71E+03 3.18E+03
Creatine 1.30E+06 8.94E+05 1.49E+06 1.42E+06 1.34E+06 1.70E+06 1.43E+06 8.88E+05 1.03E+06 1.08E+06 6.82E+05
Creatinine 1.01E+05 4.15E+04 6.15E+04 4.08E+04 4.01E+04 7.44E+04 1.04E+05 3.74E+04 8.28E+04 1.30E+05 3.55E+04
Cysteine 9.50E+03 9.66E+02 1.57E+03 2.97E+03 1.20E+03 6.21E+03 1.42E+04 3.46E+03 5.12E+04 2.36E+03 7.53E+02
Cystine 1.09E+05 8.79E+04 7.03E+04 7.69E+04 9.77E+04 1.12E+05 1.31E+05 9.13E+04 7.17E+04 1.05E+05 8.51E+04
Cytidine 2.90E+04 2.40E+04 2.90E+04 2.22E+04 1.71E+04 3.12E+04 2.92E+04 3.64E+04 3.21E+04 1.90E+04 3.79E+04
Cytidine 4.35E+04 3.63E+03 1.38E+04 3.46E+04 2.27E+04 6.21E+04 1.86E+04 8.83E+03 5.04E+03 2.06E+04 4.06E+03
D-Glyceraldehdye 3-phosphate 3.61E+05 3.66E+04 1.48E+05 1.27E+05 1.33E+05 8.14E+04 1.36E+05 1.56E+05 3.41E+05 3.30E+05 7.76E+04
Dopamine 8.61E+04 7.22E+04 4.46E+04 8.56E+04 4.41E+04 8.32E+04 1.59E+04 6.15E+03 2.22E+04 2.19E+04 4.60E+03
Fructose 1_6-bisphosphate 1.17E+05 1.00E+02 1.36E+04 6.54E+03 1.00E+02 1.52E+04 2.12E+04 1.26E+05 2.17E+05 2.49E+05 9.50E+04
Fumarate 3.87E+06 1.99E+06 2.59E+06 1.94E+06 2.11E+06 2.82E+06 1.59E+06 1.55E+06 3.21E+06 2.99E+06 1.04E+06
Glutamate 1.74E+07 1.42E+07 1.95E+07 1.55E+07 1.51E+07 1.92E+07 1.31E+07 1.17E+07 1.30E+07 1.45E+07 5.55E+06
Glutamine 9.90E+06 8.51E+06 7.95E+06 8.90E+06 9.60E+06 9.63E+06 6.81E+06 6.06E+06 5.66E+06 5.89E+06 3.48E+06
Glutathione 2.53E+05 3.56E+05 1.54E+05 4.97E+05 4.22E+05 6.30E+05 3.36E+04 1.75E+05 1.54E+05 2.97E+04 3.66E+04
Glutathione disulfide 1.16E+05 2.39E+04 1.23E+05 6.94E+04 4.75E+04 5.88E+04 9.44E+04 3.60E+04 1.19E+05 1.48E+05 1.83E+04
Glycine 4.01E+05 7.76E+04 1.13E+05 9.13E+04 3.79E+05 3.38E+05 3.09E+05 9.35E+04 3.40E+05 3.86E+05 1.19E+05
Guanosine 3.17E+05 3.41E+05 4.14E+05 3.24E+05 2.81E+05 4.31E+05 2.77E+05 2.30E+05 2.95E+05 3.19E+05 1.63E+05
Histidine 1.06E+05 5.92E+04 5.84E+04 5.35E+04 4.42E+04 6.48E+04 8.90E+04 2.30E+04 4.99E+04 6.65E+04 2.06E+04

88
Table 1.10 Continued
Sample Name H1 H18 H26 H31 H32 H34 H43 H44 H49 H52 H53
Homoserine 6.23E+05 5.80E+05 6.55E+05 7.91E+05 5.85E+05 6.96E+05 4.80E+05 3.59E+05 4.76E+05 5.83E+05 2.23E+05
Homovanillic acid 5.23E+04 1.04E+05 9.84E+04 7.27E+04 6.64E+04 1.16E+05 9.25E+04 8.64E+04 1.13E+05 1.20E+05 5.82E+04
Hydroxybenzoate 1.29E+06 1.86E+06 2.53E+06 3.09E+06 1.86E+06 2.03E+06 6.87E+05 5.74E+05 4.63E+05 1.41E+06 5.76E+05
Hypoxanthine 2.55E+06 9.43E+05 1.19E+06 9.60E+05 9.59E+05 1.39E+06 2.65E+06 2.50E+06 2.57E+06 2.56E+06 2.17E+06
IMP 2.02E+04 2.55E+04 1.92E+04 5.92E+04 3.98E+04 5.71E+04 4.99E+03 6.49E+03 1.09E+04 5.55E+03 6.15E+03
Inosine 2.24E+06 2.37E+06 2.81E+06 2.49E+06 2.61E+06 2.88E+06 2.29E+06 9.59E+05 1.82E+06 1.92E+06 8.35E+05
Lactate 7.03E+07 5.77E+07 6.16E+07 6.76E+07 6.81E+07 6.90E+07 5.60E+07 1.83E+07 5.60E+07 6.01E+07 1.52E+07
Leucine/Isoleucine 1.38E+05 7.44E+04 7.60E+04 8.75E+04 8.50E+04 1.04E+05 1.00E+05 1.23E+05 1.09E+05 1.23E+05 1.19E+05
Malate 4.68E+07 2.33E+07 3.21E+07 2.69E+07 2.78E+07 3.65E+07 2.36E+07 2.02E+07 3.61E+07 3.53E+07 1.41E+07
Methionine 7.04E+04 3.35E+04 3.98E+04 3.46E+04 3.44E+04 4.54E+04 6.42E+04 4.70E+04 5.68E+04 5.28E+04 4.11E+04
Methylmalonate 2.47E+06 1.73E+06 2.34E+06 2.25E+06 2.35E+06 2.65E+06 1.58E+06 1.64E+05 1.45E+06 1.93E+06 1.98E+05
myo-Inositol 3.35E+05 2.49E+05 2.68E+05 3.63E+05 3.38E+05 3.60E+05 2.68E+05 2.77E+04 2.85E+05 2.44E+05 2.05E+04
N-Acetyl-beta-alanine 8.08E+05 9.83E+05 8.69E+05 8.83E+05 7.31E+05 8.40E+05 7.59E+05 5.78E+05 6.05E+05 7.73E+05 4.93E+05
N-Acetylglutamate 3.99E+05 6.01E+05 5.33E+05 4.69E+05 4.62E+05 5.52E+05 6.00E+05 2.84E+05 4.73E+05 6.02E+05 2.09E+05
N-Carbamoyl-L-aspartate 4.58E+05 4.10E+05 5.34E+05 3.40E+05 5.42E+05 2.03E+05 4.88E+05 4.85E+05 3.41E+05 5.06E+05 4.51E+05
Pantothenate 7.25E+05 9.75E+05 5.66E+05 6.66E+05 6.95E+05 7.92E+05 1.04E+06 5.74E+05 7.08E+05 7.23E+05 9.92E+05
Phenylalanine 1.03E+05 6.77E+04 6.41E+04 5.46E+04 7.05E+04 6.48E+04 7.38E+04 3.48E+04 6.86E+04 6.90E+04 2.56E+04
Phosphoenolpyruvate 9.70E+04 5.72E+03 1.00E+02 3.67E+03 1.00E+02 6.25E+03 1.94E+05 8.22E+04 1.42E+05 3.00E+05 7.23E+04
Proline 1.07E+05 4.48E+04 8.94E+04 8.62E+04 8.18E+04 1.31E+05 6.54E+04 6.93E+04 7.25E+04 1.05E+05 5.22E+04
Pyroglutamic acid 1.85E+06 8.39E+05 8.58E+05 8.56E+05 6.82E+05 8.44E+05 2.75E+06 1.52E+06 1.53E+06 3.22E+06 1.29E+06
Serine 1.10E+06 6.74E+05 1.06E+06 8.19E+05 8.75E+05 9.81E+05 7.38E+05 5.21E+05 7.52E+05 7.54E+05 2.92E+05
Succinate 2.47E+06 1.73E+06 2.34E+06 2.25E+06 2.35E+06 2.65E+06 1.58E+06 1.64E+05 1.45E+06 1.93E+06 1.98E+05
Sulfolactate 1.82E+04 1.67E+05 9.15E+04 1.99E+05 8.96E+04 1.14E+05 1.16E+05 1.84E+04 1.39E+04 2.59E+04 1.57E+04
Sulfolactate 5.40E+04 2.68E+04 4.71E+04 2.93E+04 2.28E+04 7.90E+03 2.93E+04 1.86E+04 2.97E+04 2.86E+04 3.62E+04
Taurine 1.30E+07 8.82E+06 1.46E+07 1.19E+07 1.14E+07 1.40E+07 9.64E+06 9.13E+06 1.01E+07 9.43E+06 4.82E+06
Trehalose/sucrose 2.19E+05 2.53E+04 2.97E+04 4.25E+04 4.53E+04 1.40E+04 8.98E+03 8.64E+03 4.55E+03 1.38E+04 1.30E+04
Tyrosine 9.70E+04 6.24E+04 6.74E+04 6.04E+04 5.65E+04 9.13E+04 1.12E+05 6.03E+04 6.64E+04 8.55E+04 6.05E+04
UDP-glucose 2.15E+05 1.48E+05 1.19E+05 1.46E+05 8.71E+04 1.26E+05 1.07E+05 1.20E+05 1.44E+05 7.28E+04 7.06E+04
UDP-N-acetylglucosamine 9.94E+04 9.43E+04 9.17E+04 1.14E+05 8.39E+04 8.23E+04 6.72E+04 7.85E+04 7.81E+04 4.58E+04 3.80E+04
UMP 1.65E+04 2.28E+04 2.07E+04 4.31E+04 4.69E+04 2.63E+04 1.00E+02 1.00E+02 1.00E+02 1.00E+02 1.00E+02
Uracil 1.02E+06 5.35E+05 8.62E+05 5.42E+05 6.09E+05 8.13E+05 1.24E+06 9.51E+05 1.16E+06 1.41E+06 8.14E+05

89
Table 1.11 Raw Data of Subordinate Hamsters from NAc
Sample Name H6 H7 H8 H9 H14 H15 H17 H23 H24 H35 H36 H41 2-Hydroxy-2-methylsuccinate 3.49E+05 2.10E+05 1.88E+05 5.16E+05 1.81E+05 1.67E+05 4.98E+05 6.02E+05 5.30E+05 3.43E+05 5.10E+05 2.42E+05
3-Phosphoglycerate 5.38E+04 8.13E+04 1.17E+05 1.23E+05 1.00E+02 1.00E+02 2.55E+03 1.00E+02 1.00E+02 4.87E+03 4.84E+03 4.82E+04 3_4-Dihydroxyphenylacetate 1.12E+04 4.79E+03 4.07E+03 5.47E+03 8.07E+03 1.02E+04 2.25E+04 3.58E+04 7.96E+03 1.10E+04 1.77E+04 5.21E+03
4-Aminobutyrate 8.34E+05 1.05E+06 1.97E+06 7.40E+05 8.56E+05 2.92E+05 3.45E+05 8.80E+05 6.64E+05 1.60E+06 1.42E+06 5.78E+05 5-Hydroxyindoleacetic acid 5.70E+04 6.21E+04 1.17E+04 3.18E+04 3.48E+04 1.44E+04 3.44E+04 3.76E+04 1.51E+04 2.59E+04 4.09E+04 1.38E+04
Aconitate 1.68E+05 1.42E+05 1.35E+05 1.44E+05 2.32E+04 2.32E+04 9.32E+04 1.44E+05 9.13E+04 7.51E+04 6.73E+04 1.14E+05
Alanine 1.95E+06 1.50E+06 1.49E+06 1.53E+06 1.19E+06 5.71E+05 1.29E+06 1.63E+06 1.29E+06 1.46E+06 1.76E+06 1.39E+06
alpha-Ketoglutarate 5.69E+04 4.50E+04 3.88E+04 6.08E+04 1.86E+04 1.80E+04 3.85E+04 4.88E+04 4.84E+04 4.26E+04 2.34E+04 3.02E+04
AMP 3.45E+04 3.71E+04 1.95E+04 6.83E+04 1.55E+05 8.32E+04 4.45E+04 1.46E+05 1.46E+05 4.69E+04 1.47E+05 3.03E+04
Arginine 3.57E+04 1.46E+04 1.98E+04 2.34E+04 9.11E+03 2.53E+03 1.41E+04 1.86E+04 1.55E+04 2.50E+04 2.30E+04 1.29E+04
Ascorbate 2.33E+04 3.97E+04 1.00E+02 1.00E+02 6.71E+04 1.00E+02 7.85E+05 3.75E+05 2.79E+04 1.00E+02 1.63E+06 1.95E+04
Asparagine 4.71E+04 5.50E+04 3.90E+04 5.09E+04 3.55E+04 2.62E+04 6.27E+04 6.99E+04 4.19E+04 4.40E+04 4.37E+04 2.95E+04
Aspartate 8.30E+04 9.81E+04 6.05E+04 7.12E+06 3.76E+06 1.52E+06 4.36E+06 5.62E+06 3.78E+06 5.35E+06 5.98E+06 4.45E+04
CDP-ethanolamine 5.12E+02 5.28E+03 4.70E+02 1.82E+04 1.04E+04 2.92E+03 3.45E+04 2.65E+04 9.36E+03 1.26E+04 2.44E+04 7.53E+02
Citrate/isocitrate 2.55E+06 3.87E+06 2.35E+06 7.18E+06 8.34E+05 3.33E+05 4.71E+06 3.37E+06 1.76E+06 1.91E+06 4.02E+06 2.06E+06
Citrulline 1.69E+04 1.07E+04 4.68E+03 1.49E+04 8.65E+03 1.61E+03 1.51E+04 2.71E+04 2.02E+04 1.06E+04 8.16E+03 8.44E+03
Creatine 1.57E+06 1.17E+06 1.27E+06 1.32E+06 9.89E+05 3.92E+05 1.03E+06 1.50E+06 9.90E+05 1.34E+06 1.68E+06 9.98E+05
Creatinine 5.22E+04 3.94E+04 3.47E+04 6.79E+04 2.20E+04 1.13E+04 4.64E+04 4.81E+04 2.18E+04 4.37E+04 5.50E+04 3.14E+04
Cysteine 2.70E+03 8.59E+02 1.87E+03 1.48E+04 1.60E+03 1.00E+02 1.81E+03 1.50E+03 1.53E+03 1.28E+03 1.02E+04 1.30E+03
Cystine 1.59E+05 1.09E+05 1.42E+05 2.27E+05 7.13E+04 2.58E+04 9.67E+04 9.20E+04 4.69E+04 6.74E+04 9.57E+04 9.30E+04
Cytidine 2.98E+04 2.36E+04 2.53E+04 3.08E+04 1.67E+04 5.64E+03 2.39E+04 1.64E+04 1.31E+04 2.04E+04 1.55E+04 2.07E+04
Cytidine 2.05E+04 1.55E+04 4.05E+04 3.98E+04 1.49E+04 1.18E+04 2.56E+04 2.32E+04 3.99E+03 3.91E+04 3.03E+04 1.23E+04 D-Glyceraldehdye 3-phosphate 7.64E+04 6.08E+04 1.04E+05 2.89E+05 2.89E+04 7.61E+03 4.56E+04 1.11E+05 8.13E+04 3.42E+04 6.29E+04 1.06E+05
Dopamine 1.82E+04 3.97E+04 6.44E+03 2.38E+04 3.41E+04 2.12E+04 5.71E+04 9.71E+04 2.23E+04 3.61E+04 3.92E+04 1.14E+04 Fructose 1_6-bisphosphate 1.26E+04 7.91E+03 2.47E+04 5.18E+04 3.97E+03 1.00E+02 4.31E+03 1.31E+04 4.71E+03 8.16E+03 6.79E+03 2.67E+04
Fumarate 6.54E+05 6.74E+05 5.27E+05 3.48E+06 1.85E+06 4.24E+05 2.26E+06 2.89E+06 1.57E+06 9.98E+05 2.29E+06 1.21E+06
Glutamate 1.43E+07 7.00E+06 7.04E+06 1.99E+07 9.62E+06 5.05E+06 1.49E+07 1.55E+07 1.21E+07 1.15E+07 1.43E+07 1.07E+07
Glutamine 1.03E+07 7.38E+06 6.11E+06 7.41E+06 6.21E+06 3.72E+06 8.61E+06 1.09E+07 6.09E+06 7.18E+06 7.59E+06 4.98E+06
Glutathione 9.63E+04 7.38E+03 7.09E+04 3.14E+04 1.04E+05 1.04E+04 2.63E+05 3.79E+05 1.80E+05 1.76E+05 4.59E+05 2.24E+05

90
Table 1.11 Continued
Sample Name H6 H7 H8 H9 H14 H15 H17 H23 H24 H35 H36 H41
Glutathione disulfide 4.60E+04 2.27E+04 2.80E+04 5.98E+04 5.84E+04 2.67E+04 1.12E+05 6.97E+04 3.17E+04 4.95E+04 7.38E+04 9.68E+04
Glycine 2.89E+05 3.47E+05 1.19E+05 3.21E+05 1.42E+05 4.74E+04 8.32E+04 2.16E+05 1.61E+05 3.88E+05 2.76E+05 5.22E+04
Guanosine 2.59E+05 2.24E+05 1.71E+05 3.54E+05 2.13E+05 9.53E+04 3.89E+05 2.92E+05 1.64E+05 2.84E+05 2.75E+05 2.11E+05
Histidine 8.59E+04 5.40E+04 5.27E+04 9.29E+04 3.74E+04 2.32E+04 6.10E+04 9.02E+04 3.55E+04 4.87E+04 4.34E+04 2.89E+04
Homoserine 7.69E+05 5.99E+05 5.16E+05 6.43E+05 3.87E+05 2.87E+05 6.28E+05 6.24E+05 4.36E+05 6.09E+05 5.40E+05 3.90E+05
Homovanillic acid 1.35E+05 9.95E+04 4.27E+04 7.68E+04 5.37E+04 2.36E+04 1.09E+05 1.04E+05 3.68E+04 8.42E+04 9.93E+04 8.50E+04
Hydroxybenzoate 7.62E+05 6.85E+05 7.84E+05 1.03E+06 1.58E+06 2.53E+06 3.52E+06 2.37E+06 3.73E+06 1.21E+06 2.59E+06 9.06E+05
Hypoxanthine 3.14E+06 2.27E+06 2.20E+06 2.09E+06 4.93E+05 2.90E+05 9.64E+05 1.05E+06 5.00E+05 9.42E+05 9.39E+05 2.49E+06
IMP 6.39E+03 9.99E+03 1.08E+04 9.41E+03 3.60E+04 2.54E+04 1.21E+04 3.79E+04 4.44E+04 2.16E+04 5.17E+04 5.96E+03
Inosine 1.12E+06 1.80E+06 7.28E+05 2.09E+06 1.58E+06 1.23E+06 2.47E+06 2.17E+06 1.70E+06 2.28E+06 2.29E+06 9.23E+05
Lactate 2.78E+07 2.44E+07 1.93E+07 6.52E+07 5.18E+07 3.91E+07 7.72E+07 6.40E+07 6.07E+07 4.97E+07 6.41E+07 2.17E+07
Leucine/Isoleucine 1.63E+05 9.75E+04 7.46E+04 1.21E+05 4.67E+04 3.16E+04 5.74E+04 9.17E+04 4.87E+04 4.48E+04 1.05E+05 1.18E+05
Malate 1.37E+07 1.38E+07 1.18E+07 3.83E+07 2.22E+07 7.73E+06 2.66E+07 3.29E+07 2.22E+07 1.80E+07 3.13E+07 1.98E+07
Methionine 1.19E+05 3.32E+04 4.38E+04 4.13E+04 3.06E+04 1.58E+04 3.42E+04 3.23E+04 2.08E+04 3.12E+04 4.65E+04 4.09E+04
Methylmalonate 1.39E+05 1.95E+05 1.92E+05 2.12E+06 1.23E+06 1.12E+06 1.60E+06 2.30E+06 2.01E+06 1.79E+06 2.10E+06 2.08E+05
myo-Inositol 7.32E+04 3.97E+04 3.76E+04 3.26E+05 1.99E+05 1.67E+05 3.84E+05 4.02E+05 2.95E+05 2.69E+05 3.07E+05 4.48E+04
N-Acetyl-beta-alanine 8.67E+05 5.53E+05 4.67E+05 8.41E+05 6.07E+05 3.45E+05 5.57E+05 8.67E+05 5.84E+05 6.98E+05 7.75E+05 6.81E+05
N-Acetylglutamate 3.41E+05 3.13E+05 2.27E+05 5.25E+05 2.69E+05 1.64E+05 5.42E+05 5.97E+05 3.02E+05 3.48E+05 4.44E+05 2.44E+05 N-Carbamoyl-L-aspartate 4.77E+05 2.52E+05 3.74E+05 3.52E+05 2.21E+05 1.48E+05 3.51E+05 2.35E+05 4.83E+05 2.96E+05 2.20E+05 5.70E+05
Pantothenate 8.05E+05 5.34E+05 6.42E+05 5.60E+05 1.06E+06 3.24E+05 8.45E+05 8.70E+05 3.88E+05 4.55E+05 8.83E+05 4.91E+05
Phenylalanine 4.97E+04 5.82E+04 2.51E+04 7.02E+04 4.10E+04 3.25E+04 5.39E+04 5.32E+04 5.59E+04 7.87E+04 6.08E+04 4.04E+04
Phosphoenolpyruvate 1.68E+05 1.15E+05 1.99E+05 8.84E+04 1.00E+02 1.00E+02 9.28E+03 4.44E+03 1.00E+02 4.32E+03 5.43E+03 6.12E+04
Proline 1.09E+05 7.33E+04 6.08E+04 6.93E+04 4.29E+04 5.59E+04 5.38E+04 8.57E+04 5.58E+04 6.07E+04 6.92E+04 8.42E+04
Pyroglutamic acid 2.69E+06 2.00E+06 1.59E+06 3.38E+06 6.01E+05 3.97E+05 1.15E+06 6.52E+05 6.24E+05 7.32E+05 1.03E+06 9.93E+05
Serine 9.02E+05 7.68E+05 6.94E+05 1.13E+06 8.44E+05 4.45E+05 1.12E+06 9.36E+05 7.32E+05 8.56E+05 9.48E+05 3.57E+05
Succinate 1.39E+05 1.95E+05 1.92E+05 2.12E+06 1.23E+06 1.12E+06 1.60E+06 2.30E+06 2.01E+06 1.79E+06 2.10E+06 2.08E+05
Sulfolactate 1.33E+04 1.85E+04 7.88E+03 2.75E+04 1.27E+05 1.24E+05 9.66E+04 1.29E+05 1.87E+05 2.04E+05 1.47E+05 9.37E+04
Sulfolactate 3.59E+04 1.64E+04 3.07E+04 1.73E+04 2.22E+04 2.10E+04 1.81E+04 2.90E+04 2.32E+04 2.73E+04 2.07E+04 1.93E+04
Taurine 1.39E+07 8.62E+06 8.07E+06 1.30E+07 7.39E+06 5.34E+06 9.70E+06 1.04E+07 9.11E+06 9.65E+06 1.06E+07 9.20E+06
Trehalose/sucrose 5.14E+04 1.73E+04 2.15E+04 4.78E+04 2.96E+04 3.55E+04 3.09E+04 1.71E+04 1.28E+05 1.79E+04 3.97E+04 1.69E+04
Tyrosine 1.05E+05 5.98E+04 6.17E+04 8.46E+04 5.87E+04 3.80E+04 6.94E+04 5.05E+04 3.65E+04 6.81E+04 6.74E+04 5.88E+04
UDP-glucose 1.24E+05 7.68E+04 6.69E+04 9.99E+04 1.86E+05 1.27E+05 2.54E+05 1.72E+05 5.75E+04 6.87E+04 1.29E+05 8.67E+04

91
Table 1.11 Continued
Sample Name H6 H7 H8 H9 H14 H15 H17 H23 H24 H35 H36 H41 UDP-N-acetylglucosamine 5.76E+04 4.46E+04 2.03E+04 5.20E+04 1.36E+05 8.20E+04 1.97E+05 1.11E+05 4.47E+04 4.79E+04 5.38E+04 6.03E+04
UMP 1.00E+02 1.00E+02 4.76E+03 4.98E+03 4.00E+04 1.96E+04 4.87E+03 4.34E+04 2.88E+04 6.24E+03 3.37E+04 1.00E+02
Uracil 1.21E+06 8.85E+05 7.47E+05 1.06E+06 2.62E+05 1.67E+05 6.38E+05 5.99E+05 3.94E+05 4.92E+05 5.37E+05 8.75E+05
Uric acid 1.63E+04 1.59E+04 1.78E+04 1.03E+04 6.67E+03 1.01E+04 2.37E+04 2.02E+04 3.55E+04 1.91E+04 3.57E+04 1.50E+04
Uridine 2.39E+05 8.81E+04 1.80E+05 1.17E+05 1.11E+05 6.64E+04 1.71E+05 1.63E+05 1.09E+05 1.18E+05 1.50E+05 1.57E+05
Valine 2.49E+05 1.10E+05 6.98E+04 1.22E+05 9.27E+04 5.09E+04 1.44E+05 1.54E+05 1.04E+05 7.79E+04 1.41E+05 8.73E+04
Xanthine 1.18E+06 8.08E+05 9.12E+05 7.13E+05 1.18E+05 7.72E+04 4.16E+05 2.48E+05 1.27E+05 1.77E+05 2.05E+05 1.01E+06

92
Table 1.12 Raw Data of Dominant Hamsters from vmPFC
Sample Name H2 H4 H5 H19 H21 H25 H33 H38 H47
2-Hydroxy-2-methylsuccinate 4.18E+05 3.85E+05 4.92E+05 2.07E+05 1.41E+06 2.17E+05 7.77E+05 7.10E+05 1.95E+05
3_4-Dihydroxyphenylacetate 6.97E+03 3.87E+03 3.22E+03 5.06E+03 7.11E+03 8.61E+03 3.61E+03 5.36E+04 4.86E+04
4-Aminobutyrate 2.82E+05 6.26E+05 2.55E+05 2.56E+05 1.82E+05 9.78E+04 9.47E+04 1.52E+05 2.33E+05
5-Hydroxyindoleacetic acid 3.02E+04 5.26E+04 2.23E+04 1.01E+04 7.51E+03 6.63E+03 2.68E+03 1.06E+04 1.23E+04
Aconitate 3.78E+04 5.76E+04 7.01E+04 2.93E+04 8.18E+04 2.52E+04 1.87E+04 2.91E+04 1.82E+04
Alanine 1.26E+06 1.51E+06 1.37E+06 6.74E+05 1.31E+06 6.84E+05 1.06E+06 1.27E+06 1.06E+06
alpha-Ketoglutarate 2.35E+04 1.81E+04 2.48E+04 1.86E+04 5.22E+04 1.23E+04 2.37E+04 3.21E+04 1.08E+04
AMP 2.89E+05 6.13E+04 1.47E+05 7.85E+05 2.88E+06 1.06E+06 1.16E+06 1.95E+06 3.66E+05
Ascorbate 8.65E+04 2.66E+05 1.00E+06 5.18E+04 1.00E+02 1.74E+04 3.07E+05 8.26E+05 6.87E+04
Asparagine 5.23E+04 6.37E+04 7.13E+04 2.14E+04 4.55E+04 1.96E+04 3.19E+04 4.89E+04 4.90E+04
Aspartate 4.48E+06 5.52E+06 5.21E+06 1.35E+06 4.45E+06 2.26E+06 2.40E+06 4.57E+06 2.85E+06
Citrate/isocitrate 4.24E+05 7.51E+05 1.09E+06 1.48E+05 8.47E+05 7.78E+04 1.90E+05 3.94E+05 9.85E+04
Citrulline 2.57E+04 7.54E+03 3.07E+04 5.99E+03 2.45E+04 1.04E+04 1.17E+04 3.47E+04 1.43E+04
Creatine 1.05E+06 1.33E+06 8.45E+05 3.72E+05 9.27E+05 4.59E+05 6.76E+05 1.02E+06 6.59E+05
Creatinine 3.13E+04 3.37E+04 5.49E+04 7.87E+03 1.68E+04 8.36E+03 1.40E+04 2.62E+04 3.29E+04
Cysteine 1.85E+03 1.57E+05 8.89E+04 1.98E+04 1.00E+02 2.09E+03 3.40E+04 3.25E+04 6.37E+03
Cystine 8.58E+04 1.82E+05 9.57E+04 1.22E+04 1.91E+04 6.56E+03 1.52E+04 1.03E+04 1.21E+04
Cytidine 3.44E+03 5.15E+03 7.01E+03 1.48E+04 1.49E+04 1.31E+04 1.59E+04 4.74E+03 2.71E+04
Cytidine 2.02E+04 2.03E+04 1.58E+04 1.57E+03 1.92E+04 3.11E+03 1.25E+04 1.71E+04 1.00E+04
dGMP 2.89E+05 6.13E+04 1.47E+05 7.85E+05 2.88E+06 1.06E+06 1.16E+06 1.95E+06 3.66E+05
Fumarate 2.63E+06 2.98E+06 2.65E+06 3.58E+05 2.06E+06 5.57E+05 1.35E+06 2.89E+06 1.67E+06
Glucose 1-phosphate 2.50E+04 1.22E+04 8.22E+03 1.00E+02 5.88E+03 1.00E+02 5.77E+03 8.37E+03 2.18E+04
Glutamate 1.52E+07 1.40E+07 1.46E+07 9.42E+06 1.64E+07 7.56E+06 1.14E+07 1.66E+07 1.15E+07
Glutamine 9.18E+06 1.00E+07 7.42E+06 3.54E+06 6.76E+06 3.49E+06 5.04E+06 7.81E+06 5.05E+06
Glutathione 1.14E+05 1.68E+05 2.08E+05 2.65E+05 1.00E+02 2.14E+05 4.37E+05 7.61E+05 2.54E+05
Glutathione disulfide 1.52E+05 2.13E+04 3.27E+04 2.89E+04 5.98E+05 1.29E+04 1.51E+04 6.32E+04 5.16E+04
Glycerone phosphate 8.24E+04 1.43E+05 8.36E+04 1.25E+04 6.23E+03 1.36E+04 6.32E+03 2.98E+04 2.05E+04
Glycine 1.27E+05 1.71E+05 1.16E+05 8.89E+04 1.78E+05 1.05E+05 9.67E+04 8.20E+04 1.80E+05
GMP 5.44E+04 1.73E+04 3.49E+04 4.41E+04 1.08E+05 2.61E+04 4.89E+04 1.02E+05 5.97E+04

93
Table 1.12 Continued
Sample Name H2 H4 H5 H19 H21 H25 H33 H38 H47
Guanosine 1.83E+05 2.73E+05 2.31E+05 3.17E+04 5.76E+04 1.52E+04 4.57E+04 5.38E+04 5.75E+04
Histidine 3.70E+04 5.09E+04 6.60E+04 2.67E+04 5.08E+04 9.74E+03 2.40E+04 5.63E+04 3.56E+04
Homoserine 5.82E+05 6.97E+05 5.57E+05 2.51E+05 4.57E+05 2.71E+05 3.20E+05 4.72E+05 4.02E+05
Hypoxanthine 8.47E+05 1.80E+06 1.13E+06 1.84E+05 2.39E+05 8.55E+04 1.50E+05 2.42E+05 2.68E+05
IMP 4.80E+04 1.83E+04 4.74E+04 7.66E+04 2.18E+05 4.94E+04 9.19E+04 1.94E+05 6.48E+04
Inosine 1.72E+06 2.07E+06 1.50E+06 6.77E+05 8.06E+05 5.45E+05 7.49E+05 8.82E+05 9.05E+05
Lactate 5.44E+07 6.01E+07 5.65E+07 3.62E+07 5.66E+07 3.36E+07 4.12E+07 5.73E+07 5.15E+07
Leucine/Isoleucine 8.03E+04 9.54E+04 9.09E+04 2.64E+04 5.82E+04 3.19E+04 4.53E+04 3.97E+04 4.91E+04
Malate 2.87E+07 3.46E+07 3.01E+07 7.74E+06 2.41E+07 9.08E+06 1.54E+07 3.21E+07 1.94E+07
Methionine 4.86E+04 3.71E+04 4.34E+04 2.58E+04 4.54E+04 1.21E+04 1.34E+04 2.38E+04 2.27E+04
Methylmalonate 8.62E+05 5.96E+05 6.83E+05 8.00E+05 1.18E+06 6.31E+05 6.61E+05 1.58E+06 9.13E+05
myo-Inositol 2.46E+05 2.40E+05 1.99E+05 1.27E+05 2.82E+05 1.02E+05 1.25E+05 2.91E+05 2.08E+05
N-Acetylglutamate 4.90E+05 6.03E+05 4.46E+05 1.71E+05 4.96E+05 1.27E+05 2.25E+05 5.65E+05 2.31E+05
N-Carbamoyl-L-aspartate 2.68E+05 3.38E+05 2.19E+05 1.55E+05 4.58E+05 6.37E+04 2.68E+05 3.79E+05 2.07E+05
N-Carbamoyl-L-aspartate 5.47E+03 8.24E+04 6.31E+03 6.26E+03 6.02E+03 8.22E+03 6.93E+03 1.38E+05 2.14E+04
Pantothenate 5.96E+05 1.65E+06 5.87E+05 7.01E+05 3.95E+05 3.48E+05 2.98E+05 4.54E+05 2.83E+05
Phenylalanine 6.34E+04 7.00E+04 5.89E+04 1.33E+04 3.96E+04 3.97E+04 4.85E+04 5.61E+04 4.41E+04
Proline 5.85E+04 5.13E+04 7.18E+04 3.71E+04 6.99E+04 2.93E+04 2.95E+04 5.68E+04 4.61E+04
Pyroglutamic acid 5.70E+05 1.53E+06 9.63E+05 2.88E+05 2.86E+05 2.27E+05 2.89E+05 2.43E+05 3.41E+05
Ribose phosphate 1.98E+05 2.80E+05 3.61E+05 3.01E+05 1.97E+05 7.78E+04 1.48E+05 1.09E+05 8.25E+04
Serine 1.17E+06 1.19E+06 1.39E+06 6.70E+05 1.19E+06 7.81E+05 9.42E+05 1.26E+06 1.02E+06
Succinate 8.62E+05 5.96E+05 6.83E+05 8.00E+05 1.18E+06 6.31E+05 6.61E+05 1.58E+06 9.13E+05
Sulfolactate 1.61E+04 1.95E+04 2.25E+04 9.88E+04 5.10E+04 1.07E+05 8.47E+04 1.17E+05 1.15E+05
Taurine 1.15E+07 8.75E+06 1.08E+07 4.62E+06 1.09E+07 5.30E+06 7.93E+06 1.20E+07 7.73E+06
Trehalose/sucrose 3.69E+04 1.49E+05 2.60E+05 3.16E+04 4.48E+04 2.94E+04 3.02E+04 2.54E+04 8.68E+04
Tyrosine 8.07E+04 6.11E+04 8.73E+04 3.47E+04 5.68E+04 2.37E+04 5.05E+04 4.70E+04 5.95E+04
UDP-glucose 1.73E+05 3.56E+05 3.75E+05 1.84E+05 1.77E+05 1.17E+05 1.55E+05 2.04E+05 1.51E+05
UDP-N-acetylglucosamine 1.47E+05 2.54E+05 2.51E+05 1.08E+05 1.86E+05 8.85E+04 1.26E+05 1.89E+05 1.37E+05

94
Table 1.12 Continued
Sample Name H2 H4 H5 H19 H21 H25 H33 H38 H47
UMP 1.22E+05 2.24E+04 1.03E+05 1.03E+05 2.12E+05 9.21E+04 1.19E+05 1.94E+05 1.37E+05
Uracil 3.55E+05 7.34E+05 5.81E+05 1.29E+05 2.88E+05 5.38E+04 8.07E+04 3.02E+05 1.90E+05
Uridine 8.86E+04 1.08E+05 1.21E+05 3.50E+04 7.27E+04 1.39E+04 5.38E+04 5.99E+04 3.45E+04
Valine 1.44E+05 1.41E+05 1.98E+05 5.64E+04 1.38E+05 5.55E+04 7.67E+04 1.07E+05 8.98E+04
Xanthine 1.88E+05 3.98E+05 2.67E+05 7.90E+04 7.69E+04 3.11E+04 5.51E+04 7.38E+04 7.55E+04

95
Table 1.13 Raw Data of Handled Control Hamsters from vmPFC
Sample Name H1 H10 H18 H26 H31 H32 H34 H43 H44 H52 H53
2-Hydroxy-2-methylsuccinate 2.72E+05 4.02E+05 1.58E+05 3.28E+05 2.77E+05 4.06E+05 2.21E+05 2.87E+05 1.58E+05 2.81E+05 2.72E+05
3_4-Dihydroxyphenylacetate 1.24E+04 7.91E+03 1.12E+04 3.78E+03 5.48E+03 3.27E+03 4.17E+03 7.99E+03 6.72E+03 2.15E+04 7.97E+03
4-Aminobutyrate 3.14E+05 1.58E+05 9.44E+04 1.08E+05 1.96E+05 1.88E+05 5.87E+04 1.08E+05 1.80E+05 1.64E+05 3.51E+05
5-Hydroxyindoleacetic acid 1.33E+04 1.05E+04 7.68E+03 2.29E+03 1.04E+04 1.81E+04 2.59E+03 6.48E+03 8.11E+03 3.63E+03 3.19E+04
Aconitate 5.69E+04 8.15E+04 1.32E+04 1.98E+04 2.15E+04 4.85E+04 8.28E+03 1.70E+04 2.56E+04 5.96E+04 3.19E+04
Alanine 1.17E+06 9.40E+05 4.86E+05 9.17E+05 1.21E+06 1.39E+06 7.68E+05 1.05E+06 9.30E+05 1.13E+06 1.09E+06
alpha-Ketoglutarate 3.57E+04 2.91E+04 1.18E+04 2.15E+04 1.77E+04 1.81E+04 1.22E+04 1.79E+04 1.38E+04 3.29E+04 2.70E+04
AMP 9.28E+04 3.11E+06 8.85E+05 1.46E+06 2.54E+06 2.99E+06 6.29E+05 2.06E+05 3.33E+05 1.61E+05 1.93E+04
Ascorbate 1.00E+02 1.77E+06 2.25E+05 4.94E+04 2.58E+06 2.94E+06 1.00E+02 6.48E+03 1.22E+05 1.00E+02 1.00E+02
Asparagine 5.62E+04 3.96E+04 1.71E+04 3.53E+04 4.58E+04 7.60E+04 1.95E+04 2.42E+04 4.00E+04 3.52E+04 3.72E+04
Aspartate 4.32E+06 1.57E+06 6.35E+05 2.84E+06 3.45E+06 3.78E+06 1.16E+06 2.68E+06 2.88E+06 3.17E+06 3.48E+06
Citrate/isocitrate 1.27E+05 1.61E+06 1.19E+05 1.50E+05 2.52E+05 4.59E+05 5.40E+04 1.33E+05 2.06E+05 5.23E+05 4.28E+05
Citrulline 6.46E+03 2.18E+04 1.34E+04 1.41E+04 3.01E+04 2.03E+04 1.03E+04 8.56E+03 1.93E+04 2.02E+04 4.70E+03
Creatine 6.50E+05 4.76E+05 2.93E+05 6.16E+05 1.02E+06 1.16E+06 5.27E+05 8.73E+05 7.13E+05 9.30E+05 9.55E+05
Creatinine 2.54E+04 1.23E+04 4.94E+03 1.03E+04 1.91E+04 2.48E+04 6.16E+03 1.79E+04 1.74E+04 2.38E+04 3.44E+04
Cysteine 4.86E+04 5.28E+04 2.39E+04 1.52E+04 4.73E+04 6.58E+04 1.00E+02 1.13E+04 2.19E+04 4.39E+03 4.89E+03
Cystine 8.93E+04 1.51E+04 7.16E+03 1.43E+04 1.48E+04 2.06E+04 1.64E+04 8.39E+04 2.70E+04 9.18E+04 1.44E+05
Cytidine 1.24E+04 1.63E+04 9.69E+03 3.14E+04 1.57E+04 9.09E+03 1.09E+04 3.60E+04 1.04E+04 2.47E+04 6.69E+03
Cytidine 1.88E+04 7.37E+03 1.11E+03 4.53E+03 1.75E+04 2.38E+04 7.37E+03 7.25E+03 9.39E+03 1.24E+04 2.50E+04
dGMP 9.28E+04 3.11E+06 8.85E+05 1.46E+06 2.54E+06 2.99E+06 6.29E+05 2.06E+05 3.33E+05 1.61E+05 1.93E+04
Fumarate 2.44E+06 5.60E+05 1.33E+05 6.91E+05 1.45E+06 2.13E+06 6.81E+05 9.80E+05 1.14E+06 9.46E+05 2.44E+06
Glucose 1-phosphate 1.78E+05 1.00E+02 1.00E+02 4.45E+03 8.00E+03 5.52E+03 1.00E+02 5.63E+03 9.56E+03 5.26E+03 1.35E+05
Glutamate 1.47E+07 8.85E+06 5.80E+06 1.10E+07 1.44E+07 1.49E+07 8.12E+06 9.97E+06 1.18E+07 1.06E+07 1.06E+07
Glutamine 6.69E+06 6.29E+06 3.66E+06 6.34E+06 5.95E+06 8.82E+06 3.45E+06 3.73E+06 4.76E+06 5.03E+06 5.73E+06
Glutathione 3.67E+05 6.49E+05 1.97E+05 3.57E+05 8.43E+05 1.02E+06 5.29E+04 4.81E+04 2.32E+05 3.18E+04 1.00E+02
Glutathione disulfide 4.25E+04 1.07E+05 1.16E+04 3.35E+04 2.81E+04 2.98E+04 5.78E+04 9.45E+03 2.41E+04 1.47E+04 1.62E+04
Glycerone phosphate 2.11E+05 5.34E+04 5.95E+03 1.74E+04 7.47E+04 4.29E+04 5.13E+03 3.96E+04 5.83E+04 3.75E+04 2.16E+05
Glycine 8.86E+04 1.37E+05 5.86E+04 1.27E+05 1.18E+05 2.02E+05 8.74E+04 8.63E+04 1.60E+05 2.11E+05 1.02E+05

96
Table 1.13 Continued
Sample Name H1 H10 H18 H26 H31 H32 H34 H43 H44 H52 H53
GMP 1.57E+04 1.83E+05 4.61E+04 6.34E+04 9.45E+04 1.31E+05 2.51E+04 2.40E+04 5.52E+04 3.41E+04 3.00E+03
Guanosine 2.76E+05 4.72E+04 2.32E+04 4.99E+04 5.56E+04 7.41E+04 2.87E+04 9.95E+04 5.24E+04 1.15E+05 2.09E+05
Histidine 5.58E+04 1.32E+04 8.18E+03 2.85E+04 2.40E+04 2.87E+04 1.70E+04 2.62E+04 2.13E+04 3.42E+04 3.32E+04
Homoserine 4.82E+05 2.82E+05 2.40E+05 3.63E+05 4.57E+05 4.73E+05 2.92E+05 3.11E+05 3.30E+05 4.02E+05 4.40E+05
Hypoxanthine 1.56E+06 1.84E+05 9.17E+04 1.80E+05 2.49E+05 3.13E+05 9.48E+04 4.86E+05 3.95E+05 5.05E+05 4.39E+05
IMP 2.49E+04 4.38E+05 8.43E+04 8.93E+04 1.41E+05 1.65E+05 9.34E+04 9.17E+04 4.59E+04 5.67E+04 5.71E+03
Inosine 2.31E+06 3.64E+05 3.63E+05 6.80E+05 8.60E+05 9.40E+05 4.83E+05 1.35E+06 9.36E+05 1.19E+06 1.78E+06
Lactate 4.98E+07 4.06E+07 3.49E+07 4.56E+07 5.10E+07 5.87E+07 3.71E+07 4.55E+07 3.55E+07 4.31E+07 5.22E+07
Leucine/Isoleucine 8.16E+04 3.15E+04 1.46E+04 3.92E+04 5.67E+04 5.68E+04 3.10E+04 4.44E+04 4.03E+04 4.85E+04 5.00E+04
Malate 2.75E+07 9.13E+06 3.99E+06 1.01E+07 1.68E+07 2.31E+07 9.73E+06 1.27E+07 1.40E+07 1.29E+07 2.83E+07
Methionine 3.79E+04 3.67E+04 9.24E+03 1.82E+04 2.08E+04 2.12E+04 8.36E+03 2.72E+04 1.95E+04 2.45E+04 2.36E+04
Methylmalonate 6.34E+05 6.83E+05 1.17E+06 8.23E+05 6.30E+05 8.54E+05 7.65E+05 6.19E+05 3.82E+05 8.77E+05 5.90E+05
myo-Inositol 2.20E+05 1.80E+05 1.16E+05 1.93E+05 1.70E+05 2.75E+05 1.41E+05 1.69E+05 1.03E+05 1.86E+05 2.18E+05
N-Acetylglutamate 3.79E+05 4.32E+05 1.19E+05 2.09E+05 3.41E+05 4.04E+05 1.06E+05 1.61E+05 2.21E+05 2.54E+05 3.71E+05
N-Carbamoyl-L-aspartate 3.80E+05 4.63E+05 1.28E+05 2.76E+05 2.83E+05 3.85E+05 1.15E+05 1.43E+05 2.34E+05 2.33E+05 2.62E+05
N-Carbamoyl-L-aspartate 2.86E+04 3.41E+03 6.00E+03 4.49E+03 5.70E+03 4.70E+03 1.06E+04 6.38E+04 3.05E+04 1.45E+05 2.57E+04
Pantothenate 7.85E+05 4.26E+05 2.51E+05 4.02E+05 5.77E+05 7.10E+05 3.06E+05 4.67E+05 3.12E+05 3.88E+05 8.53E+05
Phenylalanine 7.27E+04 2.37E+04 2.50E+04 3.17E+04 2.53E+04 4.05E+04 3.10E+04 4.62E+04 3.50E+04 4.05E+04 4.15E+04
Proline 6.43E+04 4.05E+04 1.12E+04 4.42E+04 4.67E+04 5.50E+04 3.45E+04 5.21E+04 4.76E+04 5.19E+04 4.72E+04
Pyroglutamic acid 5.11E+05 2.36E+05 2.09E+05 2.49E+05 2.23E+05 3.05E+05 2.31E+05 4.83E+05 2.48E+05 5.47E+05 6.45E+05
Ribose phosphate 7.41E+05 2.93E+05 6.18E+04 1.38E+05 1.22E+05 2.34E+05 3.67E+04 8.85E+04 9.90E+04 9.04E+04 3.27E+05
Serine 1.21E+06 7.97E+05 6.20E+05 9.67E+05 1.01E+06 1.26E+06 8.23E+05 1.02E+06 9.02E+05 1.27E+06 9.53E+05
Succinate 6.34E+05 6.83E+05 1.17E+06 8.23E+05 6.30E+05 8.54E+05 7.65E+05 6.19E+05 3.82E+05 8.77E+05 5.90E+05
Sulfolactate 1.21E+04 7.08E+04 1.54E+05 7.91E+04 6.62E+04 7.87E+04 1.03E+05 9.35E+04 1.58E+04 2.06E+04 9.04E+03
Taurine 1.22E+07 1.01E+07 4.17E+06 7.75E+06 1.03E+07 1.02E+07 5.95E+06 8.77E+06 7.81E+06 8.06E+06 7.77E+06
Trehalose/sucrose 5.24E+05 1.81E+04 3.17E+04 2.92E+04 1.89E+04 2.91E+04 5.21E+04 3.84E+04 5.21E+04 6.61E+04 4.40E+04
Tyrosine 5.51E+04 5.11E+04 2.40E+04 3.02E+04 5.54E+04 5.70E+04 1.92E+04 2.67E+04 3.87E+04 3.94E+04 4.23E+04
UDP-glucose 4.67E+05 2.98E+05 1.27E+05 1.73E+05 1.97E+05 3.68E+05 1.09E+05 1.61E+05 1.62E+05 1.79E+05 2.84E+05

97
Table 1.13 Continued
Sample Name H1 H10 H18 H26 H31 H32 H34 H43 H44 H52 H53
UDP-N-acetylglucosamine 2.74E+05 2.88E+05 7.48E+04 1.29E+05 2.06E+05 3.12E+05 8.18E+04 1.07E+05 1.12E+05 1.10E+05 1.33E+05
UMP 4.92E+04 2.44E+05 9.38E+04 1.33E+05 2.01E+05 2.25E+05 6.72E+04 7.63E+04 1.36E+05 7.74E+04 3.34E+03
Uracil 6.11E+05 2.30E+05 5.27E+04 1.23E+05 1.46E+05 2.81E+05 6.35E+04 3.10E+05 2.23E+05 3.60E+05 5.96E+05
Uridine 1.29E+05 4.15E+04 1.82E+04 3.94E+04 8.18E+04 6.57E+04 2.04E+04 4.77E+04 2.23E+04 4.77E+04 8.31E+04
Valine 1.36E+05 8.54E+04 3.65E+04 9.48E+04 1.21E+05 1.39E+05 5.98E+04 7.57E+04 8.92E+04 1.04E+05 1.05E+05
Xanthine 3.71E+05 1.09E+05 2.31E+04 4.89E+04 8.20E+04 7.30E+04 2.59E+04 8.68E+04 7.08E+04 1.07E+05 2.38E+05

98
Table 1.14 Raw Data of Subordinate Hamsters from vmPFC
Sample Name H6 H7 H8 H9 H15 H17 H23 H24 H35 H36 H41
2-Hydroxy-2-methylsuccinate 3.31E+05 3.76E+05 1.33E+05 3.97E+05 4.85E+05 4.97E+05 7.26E+05 1.52E+06 5.92E+05 2.79E+05 5.36E+05
3_4-Dihydroxyphenylacetate 3.38E+03 3.07E+03 1.04E+04 5.39E+03 5.55E+03 5.72E+03 7.34E+03 6.79E+03 3.35E+04 4.64E+03 2.12E+04
4-Aminobutyrate 2.59E+05 3.08E+05 5.47E+05 3.12E+05 1.57E+05 1.11E+05 1.63E+05 1.50E+05 7.26E+04 1.03E+05 1.67E+05
5-Hydroxyindoleacetic acid 3.41E+04 1.02E+04 2.30E+04 1.44E+04 1.16E+04 1.33E+04 5.55E+03 1.65E+04 9.57E+03 6.80E+03 1.89E+04
Aconitate 5.88E+04 7.30E+04 3.95E+04 5.16E+04 6.99E+04 3.97E+04 3.92E+04 4.53E+04 1.94E+04 2.27E+04 3.95E+04
Alanine 1.55E+06 1.53E+06 1.03E+06 1.26E+06 1.02E+06 1.10E+06 1.12E+06 1.09E+06 9.73E+05 7.73E+05 1.37E+06
alpha-Ketoglutarate 2.14E+04 3.96E+04 1.52E+04 1.73E+04 2.30E+04 2.17E+04 2.03E+04 3.08E+04 1.68E+04 9.88E+03 2.90E+04
AMP 3.96E+05 1.07E+05 3.67E+04 2.26E+05 2.80E+06 2.95E+06 2.33E+06 2.83E+06 9.25E+05 1.07E+06 7.12E+05
Ascorbate 5.59E+05 4.51E+03 2.19E+03 2.32E+05 4.97E+05 1.00E+02 1.00E+02 3.85E+05 1.00E+02 2.24E+05 8.90E+05
Asparagine 7.14E+04 6.39E+04 4.09E+04 7.29E+04 3.14E+04 5.93E+04 3.50E+04 5.65E+04 3.14E+04 2.54E+04 7.03E+04
Aspartate 5.48E+06 5.16E+06 2.72E+06 4.90E+06 3.21E+06 3.03E+06 2.41E+05 4.74E+06 2.73E+06 9.91E+05 4.68E+06
Citrate/isocitrate 1.48E+06 1.94E+06 3.69E+05 8.65E+05 8.55E+05 4.18E+05 2.24E+05 5.77E+05 9.25E+04 1.84E+05 8.56E+05
Citrulline 2.81E+04 2.27E+04 1.13E+04 1.95E+04 1.50E+04 1.26E+04 2.34E+04 2.01E+04 1.33E+04 1.08E+04 3.56E+04
Creatine 1.15E+06 1.06E+06 6.38E+05 1.10E+06 5.84E+05 7.23E+05 1.12E+06 1.01E+06 6.14E+05 4.74E+05 1.18E+06
Creatinine 3.49E+04 2.40E+04 1.68E+04 3.20E+04 1.20E+04 8.72E+03 1.26E+04 2.25E+04 1.43E+04 7.15E+03 2.49E+04
Cysteine 7.88E+04 2.33E+03 2.08E+04 9.21E+04 5.43E+04 2.78E+04 1.00E+02 1.50E+04 1.00E+02 1.24E+04 5.59E+04
Cystine 6.89E+04 1.52E+05 8.13E+04 7.99E+04 3.55E+03 3.47E+03 2.10E+04 2.34E+04 4.27E+04 8.16E+03 4.07E+04
Cytidine 2.00E+04 1.72E+04 1.91E+04 1.69E+04 2.63E+04 3.67E+04 2.19E+04 4.16E+04 1.62E+04 9.19E+03 2.76E+04
Cytidine 1.58E+04 1.88E+04 9.13E+03 2.44E+04 8.59E+03 1.22E+04 1.41E+04 1.94E+04 1.23E+04 4.61E+03 1.51E+04
dGMP 3.96E+05 1.07E+05 3.67E+04 2.26E+05 2.80E+06 2.95E+06 2.33E+06 2.83E+06 9.25E+05 1.07E+06 7.12E+05
Fumarate 2.35E+06 2.07E+06 1.15E+06 2.40E+06 5.72E+05 6.79E+05 1.19E+06 2.40E+06 9.02E+05 7.47E+05 2.87E+06
Glucose 1-phosphate 6.08E+03 1.02E+04 5.14E+03 6.40E+03 1.00E+02 1.00E+02 4.85E+03 5.59E+03 1.00E+02 1.00E+02 8.89E+04
Glutamate 1.53E+07 1.67E+07 8.70E+06 2.07E+07 1.21E+07 1.32E+07 3.22E+06 1.55E+07 1.08E+07 6.77E+06 1.70E+07
Glutamine 6.96E+06 6.59E+06 4.34E+06 5.89E+06 4.98E+06 6.41E+06 6.27E+06 7.15E+06 4.12E+06 3.34E+06 8.80E+06
Glutathione 3.55E+05 4.36E+03 3.67E+04 4.51E+05 5.77E+05 5.88E+05 2.44E+05 6.28E+05 3.20E+04 2.58E+05 6.17E+05
Glutathione disulfide 6.29E+04 7.88E+04 4.88E+03 7.08E+04 7.99E+04 1.05E+05 4.55E+04 1.26E+05 7.41E+04 1.47E+04 7.10E+04
Glycerone phosphate 5.94E+04 9.91E+04 8.27E+04 8.63E+04 1.14E+04 1.58E+04 3.40E+04 1.47E+04 9.11E+03 1.60E+04 1.09E+05
Glycine 1.01E+05 2.48E+05 1.28E+05 1.21E+05 1.45E+05 1.18E+05 1.53E+05 2.85E+05 1.06E+05 5.79E+04 2.12E+05

99
Table 1.14 Continued
Sample Name H6 H7 H8 H9 H15 H17 H23 H24 H35 H36 H41
GMP 9.15E+04 2.17E+04 6.51E+03 4.43E+04 1.29E+05 1.21E+05 9.83E+04 1.19E+05 2.94E+04 7.23E+04 1.07E+05
Guanosine 1.21E+05 2.53E+05 1.09E+05 1.79E+05 4.95E+04 4.83E+04 3.76E+04 4.37E+04 6.02E+04 3.08E+04 9.88E+04
Histidine 4.19E+04 3.85E+04 3.27E+04 4.38E+04 3.06E+04 2.63E+04 5.05E+04 4.23E+04 2.69E+04 1.42E+04 4.57E+04
Homoserine 5.71E+05 6.82E+05 3.77E+05 5.69E+05 3.33E+05 3.88E+05 3.52E+05 4.87E+05 2.71E+05 2.35E+05 6.33E+05
Hypoxanthine 9.55E+05 1.34E+06 7.75E+05 9.11E+05 1.68E+05 2.33E+05 2.62E+05 2.87E+05 1.58E+05 9.77E+04 6.82E+05
IMP 1.60E+05 3.62E+04 1.21E+04 1.23E+05 2.34E+05 1.39E+05 1.80E+05 2.04E+05 6.06E+04 6.36E+04 9.34E+04
Inosine 1.56E+06 1.88E+06 1.18E+06 1.66E+06 5.58E+05 6.65E+05 5.20E+05 8.94E+05 8.20E+05 4.47E+05 1.42E+06
Lactate 6.46E+07 5.08E+07 4.11E+07 5.97E+07 4.87E+07 5.38E+07 4.40E+07 6.31E+07 4.08E+07 3.60E+07 5.33E+07
Leucine/Isoleucine 1.05E+05 8.10E+04 4.47E+04 8.38E+04 4.44E+04 3.78E+04 5.56E+04 1.05E+05 3.64E+04 2.95E+04 9.57E+04
Malate 2.68E+07 2.37E+07 1.41E+07 2.63E+07 9.67E+06 1.09E+07 1.50E+07 2.72E+07 1.26E+07 1.04E+07 3.24E+07
Methionine 3.11E+04 2.65E+04 1.21E+04 2.57E+04 2.58E+04 2.67E+04 2.94E+04 2.82E+04 1.30E+04 9.72E+03 4.02E+04
Methylmalonate 7.73E+05 9.02E+05 4.57E+05 6.50E+05 7.03E+05 6.75E+05 7.37E+05 1.67E+06 9.79E+05 5.26E+05 1.12E+06
myo-Inositol 3.34E+05 2.18E+05 1.48E+05 3.11E+05 1.94E+05 2.02E+05 1.10E+05 2.78E+05 2.76E+05 1.15E+05 2.59E+05
N-Acetylglutamate 5.27E+05 5.90E+05 2.07E+05 5.12E+05 3.94E+05 3.90E+05 2.90E+05 4.65E+05 2.36E+05 1.87E+05 5.20E+05
N-Carbamoyl-L-aspartate 3.33E+05 3.16E+05 1.99E+05 3.31E+05 3.57E+05 2.11E+05 2.35E+05 4.68E+05 1.55E+05 1.79E+05 2.93E+05
N-Carbamoyl-L-aspartate 1.63E+04 5.00E+04 5.03E+03 3.54E+04 6.60E+03 3.95E+03 2.37E+03 2.56E+03 6.58E+03 3.04E+03 1.59E+05
Pantothenate 7.30E+05 5.06E+05 6.41E+05 4.55E+05 5.03E+05 4.18E+05 6.01E+05 7.70E+05 3.24E+05 2.95E+05 5.24E+05
Phenylalanine 8.36E+04 5.05E+04 3.44E+04 6.57E+04 3.60E+04 2.99E+04 2.71E+04 5.64E+04 3.61E+04 3.07E+04 4.99E+04
Proline 7.45E+04 6.05E+04 3.50E+04 6.53E+04 4.72E+04 5.10E+04 6.79E+04 5.42E+04 4.74E+04 3.79E+04 6.98E+04
Pyroglutamic acid 8.25E+05 8.20E+05 5.55E+05 7.34E+05 2.59E+05 1.94E+05 2.29E+05 3.47E+05 2.17E+05 2.07E+05 3.57E+05
Ribose phosphate 1.21E+05 2.10E+05 2.77E+05 1.03E+05 2.22E+05 1.67E+05 9.96E+04 1.24E+05 1.10E+05 1.20E+05 3.09E+05
Serine 1.39E+06 1.29E+06 7.82E+05 1.41E+06 9.85E+05 1.11E+06 1.02E+06 1.35E+06 8.02E+05 6.98E+05 1.24E+06
Succinate 7.73E+05 9.02E+05 4.57E+05 6.50E+05 7.03E+05 6.75E+05 7.37E+05 1.67E+06 9.79E+05 5.26E+05 1.12E+06
Sulfolactate 1.14E+04 6.97E+03 2.29E+04 7.65E+03 1.06E+05 5.07E+04 1.31E+05 1.25E+05 7.87E+04 1.26E+05 1.04E+05
Taurine 1.08E+07 1.21E+07 5.28E+06 1.32E+07 7.59E+06 7.89E+06 8.76E+06 1.07E+07 7.82E+06 5.26E+06 1.19E+07
Trehalose/sucrose 6.24E+04 2.13E+05 4.07E+05 7.12E+04 2.08E+04 2.15E+04 3.36E+04 3.90E+04 2.80E+04 3.66E+04 2.94E+04
Tyrosine 6.44E+04 5.86E+04 2.63E+04 5.29E+04 3.72E+04 3.12E+04 4.74E+04 4.79E+04 3.86E+04 2.55E+04 6.86E+04
UDP-glucose 3.25E+05 3.26E+05 1.35E+05 2.26E+05 2.70E+05 2.12E+05 1.76E+05 2.52E+05 1.45E+05 2.72E+05 2.53E+05

100
Table 1.14 Continued
Sample Name H6 H7 H8 H9 H15 H17 H23 H24 H35 H36 H41
UDP-N-acetylglucosamine 2.12E+05 2.57E+05 1.01E+05 1.73E+05 1.55E+05 1.54E+05 1.42E+05 2.35E+05 1.00E+05 2.00E+05 2.20E+05
UMP 1.82E+05 5.88E+04 1.89E+04 1.19E+05 2.31E+05 2.25E+05 1.99E+05 2.31E+05 1.07E+05 1.16E+05 2.44E+05
Uracil 5.59E+05 7.32E+05 2.79E+05 6.26E+05 1.39E+05 2.17E+05 1.36E+05 1.82E+05 9.29E+04 5.83E+04 4.58E+05
Uridine 6.47E+04 8.30E+04 6.22E+04 6.16E+04 4.05E+04 4.93E+04 7.57E+04 5.25E+04 4.27E+04 1.77E+04 4.77E+04
Valine 1.55E+05 1.50E+05 7.90E+04 1.72E+05 9.68E+04 9.98E+04 1.37E+05 1.62E+05 6.24E+04 6.40E+04 1.73E+05
Xanthine 1.73E+05 2.93E+05 1.83E+05 1.73E+05 8.00E+04 7.85E+04 7.13E+04 9.83E+04 4.37E+04 4.14E+04 1.38E+05

101
Table 1.15 Raw Data of Resilient Mice from BLA/CeA
Sample Name M2 M13 M16 M18 M44 M45 M46 M64 M69 M70
2-Aminoadipate 3.16E+04 3.20E+04 3.12E+04 5.76E+04 3.02E+04 7.18E+04 5.92E+04 7.84E+04 5.30E+04 7.59E+04
2-Hydroxy-2-methylsuccinate 1.98E+06 2.53E+06 2.11E+06 3.47E+06 2.86E+06 4.34E+06 4.04E+06 4.92E+06 2.28E+06 5.28E+06
2-Isopropylmalate 7.59E+04 7.00E+04 7.41E+04 6.96E+04 6.98E+04 8.68E+04 9.69E+04 7.81E+04 6.29E+04 6.35E+04
3_4-Dihydroxyphenylacetate 1.98E+05 1.60E+04 3.11E+04 1.83E+04 4.14E+04 2.37E+04 3.99E+04 1.81E+04 4.86E+03 9.24E+03
4-Aminobutyrate 1.52E+06 1.70E+06 1.30E+06 1.79E+06 1.53E+06 1.96E+06 2.04E+06 1.96E+06 1.60E+06 1.78E+06
5-Hydroxyindoleacetic acid 2.18E+04 2.99E+04 3.76E+04 3.82E+04 4.48E+04 4.45E+04 4.25E+04 7.76E+04 5.63E+04 5.02E+04
Aconitate 2.19E+06 3.15E+06 4.09E+06 6.27E+06 7.10E+06 6.15E+06 8.49E+06 6.29E+06 4.18E+06 5.45E+06
Adenine 3.50E+04 2.29E+04 2.33E+04 3.20E+04 2.21E+04 4.74E+04 3.78E+04 3.39E+04 2.89E+04 2.10E+04
Adenosine 1.11E+05 6.32E+04 3.00E+04 3.29E+04 2.56E+04 1.12E+05 7.28E+04 1.82E+05 5.48E+04 2.12E+03
Alanine/Sarcosine 1.36E+06 1.76E+06 1.46E+06 2.08E+06 2.05E+06 2.21E+06 2.16E+06 2.03E+06 1.95E+06 2.27E+06
alpha-Ketoglutarate 5.28E+04 2.57E+04 2.19E+04 3.82E+04 4.05E+04 4.11E+04 5.58E+04 4.10E+04 9.29E+03 1.85E+04
AMP/dGMP 1.33E+06 2.03E+06 1.88E+06 2.85E+06 3.89E+06 3.92E+06 3.78E+06 3.73E+06 2.77E+06 3.52E+06
Ascorbate 2.66E+06 7.40E+06 8.91E+06 1.36E+07 1.33E+07 1.81E+07 2.20E+07 1.91E+07 1.20E+07 1.54E+07
Asparagine 8.14E+04 4.49E+04 5.04E+04 4.80E+04 5.01E+04 7.95E+04 9.48E+04 9.70E+04 6.84E+04 6.49E+04
Aspartate 5.08E+06 6.42E+06 4.46E+06 8.06E+06 6.10E+06 9.32E+06 8.59E+06 7.46E+06 5.90E+06 7.72E+06
cAMP 1.40E+04 1.29E+04 1.24E+04 8.75E+03 2.36E+04 1.74E+04 2.50E+04 2.76E+04 1.70E+04 9.74E+03
CDP-ethanolamine 2.87E+04 2.97E+04 2.36E+04 3.39E+04 3.46E+04 3.86E+04 5.22E+04 3.69E+04 3.42E+04 3.46E+04
Citraconate 1.44E+05 1.76E+05 1.96E+05 2.76E+05 2.79E+05 3.01E+05 3.33E+05 2.32E+05 2.08E+05 2.69E+05
Citrate/isocitrate 1.37E+06 1.75E+06 2.61E+06 3.73E+06 4.10E+06 3.43E+06 6.24E+06 4.08E+06 2.29E+06 4.13E+06
Citrulline 9.29E+03 1.42E+04 1.34E+04 1.86E+04 4.14E+04 2.49E+04 2.79E+04 1.74E+04 1.48E+04 9.64E+03
Creatine 1.70E+06 2.12E+06 1.64E+06 2.40E+06 2.61E+06 2.70E+06 2.57E+06 2.60E+06 2.24E+06 2.83E+06
Cysteine 1.21E+04 6.91E+04 5.39E+04 7.79E+04 4.95E+04 1.38E+05 1.25E+05 1.16E+05 1.01E+05 1.25E+05
Cytidine 3.19E+03 7.75E+03 7.59E+03 1.06E+04 2.09E+04 1.30E+04 2.03E+04 1.11E+04 1.41E+04 1.50E+04
D-Glyceraldehdye 3-phosphate 1.96E+03 2.47E+03 1.00E+02 5.62E+03 4.30E+03 2.75E+03 4.36E+03 2.15E+03 3.19E+03 4.98E+04
Fumarate 3.16E+05 3.00E+05 1.96E+05 1.36E+06 5.22E+05 1.51E+06 9.51E+05 1.42E+06 6.84E+05 1.33E+06
Glucose 1-phosphate 5.99E+03 2.42E+04 1.27E+04 2.12E+04 3.81E+04 1.57E+04 1.54E+04 1.66E+04 2.75E+04 2.10E+04
Glucose 6-phosphate 1.33E+04 1.21E+04 1.27E+04 2.89E+04 2.13E+04 2.52E+04 2.09E+04 2.04E+04 2.27E+04 4.00E+04
Glutamate 1.39E+07 1.23E+07 1.13E+07 2.06E+07 1.63E+07 2.51E+07 2.08E+07 1.96E+07 1.69E+07 1.86E+07
Glutamine 3.04E+06 4.36E+06 3.21E+06 4.59E+06 4.47E+06 4.91E+06 5.79E+06 5.09E+06 3.39E+06 5.03E+06
Glutathione 5.56E+05 1.61E+06 8.96E+05 1.15E+06 1.39E+06 2.32E+06 2.26E+06 2.26E+06 1.38E+06 1.67E+06
Glutathione disulfide 2.44E+05 2.22E+05 2.62E+05 3.75E+05 3.41E+05 1.63E+05 3.18E+05 2.41E+05 2.10E+05 4.28E+05
Glycerate 1.88E+05 4.48E+04 3.74E+04 7.56E+04 4.25E+04 5.29E+04 1.73E+05 2.95E+04 4.23E+04 3.61E+04

102
Table 1.15 Continued
Sample Name M2 M13 M16 M18 M44 M45 M46 M64 M69 M70
Glycine 6.41E+04 1.12E+05 9.76E+04 2.92E+04 5.43E+04 1.90E+05 1.32E+05 5.39E+04 5.60E+04 1.06E+05
GMP 1.78E+05 2.06E+05 2.45E+05 3.05E+05 3.43E+05 4.27E+05 4.37E+05 4.70E+05 2.99E+05 3.57E+05
Guanosine 2.59E+04 2.65E+04 1.51E+04 4.32E+04 1.82E+04 4.79E+04 3.09E+04 2.70E+04 2.49E+04 2.32E+04
Histidine 4.71E+03 9.25E+03 6.17E+03 1.19E+04 8.46E+03 1.14E+04 9.19E+03 2.85E+03 1.13E+04 6.57E+03
Homoserine/Threonine 1.71E+05 1.36E+05 1.06E+05 1.83E+05 2.21E+05 1.53E+05 2.54E+05 1.62E+05 1.17E+05 1.78E+05
Homovanillic acid 7.49E+04 1.14E+05 7.49E+04 9.00E+04 1.63E+05 1.35E+05 1.40E+05 1.39E+05 1.07E+05 1.60E+05
Hydroxyisocaproic acid 3.10E+05 6.58E+05 4.10E+05 2.14E+05 1.30E+05 1.61E+05 2.03E+05 1.43E+05 1.56E+05 1.71E+05
Hypoxanthine 1.11E+06 1.27E+06 1.16E+06 2.29E+06 1.54E+06 2.13E+06 2.57E+06 1.92E+06 1.52E+06 1.69E+06
IMP 2.36E+05 4.76E+05 6.22E+05 5.24E+05 6.00E+05 8.08E+05 9.33E+05 7.45E+05 6.87E+05 1.14E+06
Inosine 7.97E+05 1.10E+06 7.39E+05 1.59E+06 1.01E+06 1.33E+06 1.39E+06 1.24E+06 1.14E+06 1.12E+06
Lactate 6.72E+07 6.12E+07 5.45E+07 7.02E+07 7.16E+07 7.27E+07 7.87E+07 7.36E+07 7.99E+07 6.77E+07
Leucine/Isoleucine 3.43E+05 3.06E+05 1.16E+05 5.64E+05 3.51E+05 5.24E+05 4.45E+05 3.97E+05 3.25E+05 4.62E+05
Lysine 2.20E+03 5.31E+03 3.20E+03 3.51E+03 3.06E+03 2.99E+03 2.55E+03 4.53E+03 5.85E+03 5.85E+03
Malate 1.62E+05 1.48E+05 1.10E+05 2.14E+05 1.36E+05 2.15E+05 1.75E+05 2.10E+05 1.83E+05 2.11E+05
Malate 5.93E+06 5.47E+06 3.45E+06 9.89E+06 6.09E+06 1.07E+07 7.99E+06 1.05E+07 5.79E+06 1.04E+07
Methionine 1.06E+05 1.41E+05 8.31E+04 2.40E+05 1.62E+05 2.88E+05 2.45E+05 3.03E+05 1.55E+05 1.69E+05
myo-Inositol 3.60E+05 3.77E+05 4.29E+05 4.49E+05 4.65E+05 5.38E+05 5.15E+05 4.67E+05 6.03E+05 4.96E+05
N-Acetylglutamate 8.15E+05 9.39E+05 8.91E+05 1.89E+06 1.43E+06 2.52E+06 2.03E+06 2.87E+06 1.19E+06 1.90E+06
N-Acetylglutamine 1.37E+04 1.73E+04 4.26E+03 2.74E+04 1.69E+04 4.24E+04 2.22E+04 3.40E+04 3.25E+04 1.95E+04
N-Carbamoyl-L-aspartate 5.48E+05 5.87E+05 3.65E+05 5.30E+05 7.87E+05 7.88E+05 7.13E+05 5.60E+05 4.28E+05 7.00E+05
Orotate 5.63E+03 2.34E+03 3.24E+03 4.47E+03 9.87E+03 3.84E+04 1.58E+04 1.62E+04 5.34E+03 6.50E+03
Pantothenate 2.35E+06 2.27E+06 2.19E+06 3.71E+06 2.96E+06 4.29E+06 4.23E+06 4.71E+06 3.00E+06 3.00E+06
Phenylalanine 9.05E+04 1.20E+05 7.13E+04 2.02E+05 8.06E+04 1.82E+05 1.65E+05 1.41E+05 1.57E+05 1.12E+05
Phosphoenolpyruvate 5.77E+04 3.56E+04 5.41E+04 5.95E+04 2.88E+04 5.38E+04 4.42E+04 5.94E+04 6.05E+04 7.45E+04
Proline 5.69E+04 4.56E+04 3.68E+04 6.90E+04 7.36E+04 7.74E+04 6.28E+04 4.92E+04 5.34E+04 5.62E+04
Pyroglutamic acid 3.94E+06 1.25E+06 1.07E+06 2.53E+06 3.14E+06 2.21E+06 3.34E+06 1.87E+06 1.93E+06 2.01E+06
Pyruvate 7.81E+05 7.41E+04 9.12E+04 7.67E+04 3.66E+05 1.14E+05 1.73E+05 1.25E+05 1.20E+05 8.17E+04
Ribose phosphate 2.45E+04 4.37E+04 3.60E+04 5.45E+04 7.46E+04 5.93E+04 5.58E+04 6.06E+04 5.52E+04 7.84E+04
Serine 8.43E+05 6.88E+05 6.03E+05 1.07E+06 1.11E+06 1.11E+06 1.12E+06 8.60E+05 8.43E+05 9.08E+05
Shikimate 5.71E+04 2.18E+04 3.37E+04 3.20E+04 2.66E+04 4.09E+04 4.32E+04 4.94E+04 4.21E+04 2.65E+04
Succinate 4.98E+06 3.63E+06 2.00E+06 3.80E+06 2.64E+06 3.81E+06 3.92E+06 3.08E+06 1.86E+06 1.66E+06
Sulfolactate 8.90E+04 6.70E+04 4.81E+04 3.88E+04 6.82E+04 9.01E+04 5.19E+04 5.19E+04 5.65E+04 7.37E+04

103
Table 1.15 Continued
Sample Name M2 M13 M16 M18 M44 M45 M46 M64 M69 M70
Taurine 1.71E+07 2.06E+07 1.87E+07 2.40E+07 2.08E+07 2.65E+07 2.68E+07 2.78E+07 2.01E+07 2.43E+07
Trehalose/sucrose 1.16E+05 1.65E+04 1.57E+04 6.96E+03 5.28E+04 1.20E+04 2.23E+04 3.39E+04 3.00E+04 1.14E+04
Tryptophan 2.62E+04 2.48E+04 1.17E+04 5.03E+04 3.41E+04 2.69E+04 8.02E+04 3.50E+04 3.51E+04 3.59E+04
Tyrosine 1.25E+05 1.32E+05 1.18E+05 2.21E+05 2.02E+05 1.87E+05 2.60E+05 2.29E+05 1.64E+05 1.41E+05
UDP-glucose 5.84E+04 8.08E+04 1.44E+05 1.81E+05 1.85E+05 2.46E+05 1.76E+05 1.90E+05 1.97E+05 1.28E+05
UDP-N-acetylglucosamine 6.71E+04 8.24E+04 8.70E+04 1.22E+05 1.60E+05 1.94E+05 1.37E+05 1.96E+05 1.57E+05 1.10E+05
UMP 8.59E+04 1.60E+05 1.78E+05 1.84E+05 2.58E+05 2.54E+05 2.51E+05 2.32E+05 1.58E+05 2.16E+05
Uracil 1.17E+05 1.47E+05 1.46E+05 2.93E+05 3.43E+05 3.90E+05 4.12E+05 3.25E+05 1.76E+05 3.12E+05
Uric acid 7.44E+04 3.05E+04 2.14E+04 2.35E+04 5.26E+04 3.57E+04 3.37E+04 2.11E+04 2.85E+04 3.26E+04
Uridine 2.23E+05 3.82E+05 2.39E+05 4.93E+05 3.33E+05 6.10E+05 5.73E+05 4.75E+05 4.61E+05 4.38E+05
Valine 2.80E+05 2.27E+05 1.83E+05 4.28E+05 3.45E+05 3.41E+05 3.96E+05 3.43E+05 2.97E+05 3.44E+05
Xanthine 3.15E+05 2.20E+05 1.44E+05 4.67E+05 2.48E+05 4.09E+05 6.98E+05 4.16E+05 1.84E+05 3.53E+05

104
Table 1.16 Raw Data of Control Mice from BLA/CeA
Sample Name M3 M5 M10 M12 M14 M26 M30 M32 M38
2-Aminoadipate 3.51E+04 6.24E+04 4.89E+04 6.51E+04 2.92E+04 8.09E+04 3.89E+04 7.26E+04 1.42E+05
2-Hydroxy-2-methylsuccinate 2.45E+06 4.54E+06 3.83E+06 3.64E+06 2.43E+06 3.73E+06 4.07E+06 4.12E+06 7.22E+06
2-Isopropylmalate 5.20E+04 4.51E+04 4.69E+04 3.88E+04 5.55E+04 6.73E+04 5.05E+04 4.98E+04 3.40E+04
3_4-Dihydroxyphenylacetate 1.79E+04 2.27E+04 6.35E+04 1.24E+04 2.32E+04 9.38E+03 1.72E+04 2.26E+04 6.97E+04
4-Aminobutyrate 1.34E+06 1.82E+06 1.61E+06 2.10E+06 1.33E+06 1.95E+06 1.71E+06 1.88E+06 2.34E+06
5-Hydroxyindoleacetic acid 1.73E+04 6.58E+04 5.54E+04 6.10E+04 2.89E+04 5.41E+04 6.44E+04 6.72E+04 7.29E+04
Aconitate 4.66E+06 7.50E+06 5.99E+06 6.69E+06 4.96E+06 7.74E+06 7.27E+06 6.19E+06 9.21E+06
Adenine 2.14E+04 3.12E+04 3.33E+04 3.41E+04 2.63E+04 3.01E+04 2.40E+04 2.00E+04 5.54E+04
Adenosine 4.34E+04 6.56E+04 7.34E+04 5.97E+04 4.55E+04 4.35E+03 2.23E+04 2.11E+03 1.62E+05
Alanine/Sarcosine 1.51E+06 1.84E+06 1.90E+06 2.09E+06 1.77E+06 2.19E+06 1.89E+06 2.36E+06 2.75E+06
alpha-Ketoglutarate 2.05E+04 5.24E+04 4.17E+04 4.09E+04 2.30E+04 4.19E+04 2.29E+04 3.11E+04 4.62E+04
AMP/dGMP 2.34E+06 3.58E+06 3.47E+06 4.09E+06 2.86E+06 3.85E+06 3.71E+06 3.29E+06 6.60E+06
Ascorbate 6.71E+06 1.51E+07 8.17E+06 1.98E+07 6.85E+06 1.86E+07 1.62E+07 2.26E+07 2.88E+07
Asparagine 6.02E+04 8.30E+04 8.30E+04 7.76E+04 6.06E+04 7.14E+04 5.13E+04 8.67E+04 9.86E+04
Aspartate 5.76E+06 9.02E+06 7.71E+06 8.73E+06 7.12E+06 9.39E+06 7.34E+06 8.46E+06 1.23E+07
cAMP 1.29E+04 2.98E+04 2.36E+04 3.74E+04 2.11E+04 4.05E+04 2.12E+04 1.98E+04 4.31E+04
CDP-ethanolamine 3.22E+04 3.92E+04 4.35E+04 4.15E+04 4.27E+04 3.81E+04 4.45E+04 3.79E+04 7.32E+04
Citraconate 2.02E+05 3.24E+05 2.51E+05 2.81E+05 2.03E+05 3.32E+05 2.83E+05 2.60E+05 4.19E+05
Citrate/isocitrate 2.10E+06 6.24E+06 3.81E+06 4.94E+06 2.46E+06 4.68E+06 6.02E+06 4.89E+06 5.89E+06
Citrulline 1.67E+04 1.73E+04 1.51E+04 2.72E+04 1.37E+04 3.25E+04 2.89E+04 1.34E+04 3.58E+04
Creatine 1.88E+06 2.16E+06 2.18E+06 2.51E+06 2.07E+06 2.85E+06 2.15E+06 2.63E+06 3.07E+06
Cysteine 6.22E+04 8.36E+04 7.50E+04 1.10E+05 5.14E+04 1.56E+05 1.04E+05 1.04E+05 2.24E+05
Cytidine 9.88E+03 1.35E+04 9.02E+03 1.54E+04 1.03E+04 2.31E+04 1.23E+04 8.55E+03 1.67E+04
D-Glyceraldehdye 3-phosphate 4.31E+03 2.14E+03 3.08E+03 3.26E+03 4.62E+03 1.59E+04 3.84E+03 1.50E+04 1.80E+04
Fumarate 4.68E+05 6.06E+05 6.25E+05 1.10E+06 3.38E+05 1.02E+06 7.86E+05 1.69E+06 2.60E+06
Glucose 1-phosphate 1.43E+04 2.13E+04 1.78E+04 1.27E+04 2.49E+04 3.64E+04 3.37E+04 3.71E+04 3.02E+04
Glucose 6-phosphate 1.32E+04 2.79E+04 2.46E+04 1.96E+04 2.00E+04 2.59E+04 2.20E+04 2.07E+04 4.38E+04
Glutamate 1.68E+07 1.99E+07 1.90E+07 2.35E+07 1.99E+07 2.18E+07 1.75E+07 1.91E+07 2.63E+07
Glutamine 3.39E+06 4.10E+06 3.63E+06 4.99E+06 4.57E+06 5.55E+06 4.77E+06 5.09E+06 5.54E+06
Glutathione 1.10E+06 1.33E+06 1.30E+06 2.18E+06 9.76E+05 2.04E+06 1.68E+06 1.96E+06 3.21E+06
Glutathione disulfide 2.22E+05 4.58E+05 4.49E+05 3.45E+05 3.94E+05 2.83E+05 3.96E+05 3.62E+05 2.57E+05

105
Table 1.16 Continued
Sample Name M3 M5 M10 M12 M14 M26 M30 M32 M38
Glycerate 4.55E+04 5.38E+04 8.72E+05 3.71E+04 5.62E+04 3.77E+04 3.94E+04 7.38E+04 4.96E+04
Glycine 3.16E+05 7.40E+04 3.26E+05 8.43E+04 1.91E+05 6.06E+04 2.44E+05 2.19E+05 7.02E+04
GMP 2.39E+05 3.72E+05 3.97E+05 3.72E+05 2.86E+05 4.09E+05 4.07E+05 3.85E+05 5.95E+05
Guanosine 1.89E+04 2.46E+04 2.99E+04 2.49E+04 1.65E+04 2.69E+04 2.06E+04 2.83E+04 3.53E+04
Histidine 9.37E+03 4.42E+03 3.11E+03 7.62E+03 8.09E+03 1.14E+04 1.12E+04 1.07E+04 1.66E+04
Homoserine/Threonine 1.70E+05 2.07E+05 1.95E+05 1.54E+05 1.46E+05 1.83E+05 2.00E+05 1.92E+05 2.52E+05
Homovanillic acid 6.73E+04 7.54E+04 8.08E+04 1.12E+05 8.31E+04 1.50E+05 1.40E+05 8.89E+04 2.17E+05
Hydroxyisocaproic acid 2.33E+05 1.86E+05 3.70E+05 2.72E+05 2.55E+05 1.98E+05 2.25E+05 1.50E+05 1.63E+05
Hypoxanthine 1.44E+06 2.12E+06 1.88E+06 1.98E+06 1.53E+06 2.45E+06 2.11E+06 2.04E+06 2.48E+06
IMP 4.64E+05 9.71E+05 8.00E+05 8.74E+05 6.87E+05 1.12E+06 9.29E+05 1.34E+06 6.86E+05
Inosine 9.05E+05 1.18E+06 1.11E+06 1.24E+06 1.02E+06 1.38E+06 1.20E+06 1.30E+06 1.43E+06
Lactate 5.78E+07 6.50E+07 7.69E+07 7.07E+07 5.64E+07 7.21E+07 7.03E+07 7.86E+07 1.03E+08
Leucine/Isoleucine 2.72E+05 4.27E+05 5.24E+05 4.41E+05 2.68E+05 6.48E+05 4.02E+05 6.56E+05 7.80E+05
Lysine 4.75E+03 3.62E+03 3.37E+03 2.79E+03 3.38E+03 6.46E+03 4.98E+03 7.25E+03 1.20E+04
Malate 1.59E+05 1.67E+05 1.66E+05 1.80E+05 1.78E+05 1.79E+05 1.76E+05 2.34E+05 2.12E+05
Malate 4.12E+06 7.30E+06 7.16E+06 6.30E+06 4.68E+06 7.31E+06 6.85E+06 1.30E+07 1.78E+07
Methionine 1.12E+05 1.64E+05 2.04E+05 2.41E+05 2.11E+05 3.41E+05 2.20E+05 3.50E+05 3.86E+05
myo-Inositol 4.32E+05 4.11E+05 5.22E+05 6.26E+05 4.21E+05 4.86E+05 4.42E+05 4.73E+05 7.14E+05
N-Acetylglutamate 1.53E+06 2.04E+06 2.09E+06 2.04E+06 1.19E+06 2.09E+06 1.88E+06 2.33E+06 3.55E+06
N-Acetylglutamine 1.97E+04 2.32E+04 2.76E+04 2.15E+04 2.27E+04 3.83E+04 3.47E+04 2.66E+04 4.07E+04
N-Carbamoyl-L-aspartate 3.45E+05 8.11E+05 2.68E+05 5.22E+05 4.64E+05 5.10E+05 3.75E+05 9.28E+05 3.71E+05
Orotate 4.01E+03 9.78E+03 2.32E+04 1.25E+04 2.75E+03 1.03E+04 8.73E+03 5.57E+03 1.56E+04
Pantothenate 2.65E+06 3.80E+06 3.24E+06 4.13E+06 2.92E+06 4.71E+06 4.12E+06 4.07E+06 7.00E+06
Phenylalanine 8.95E+04 1.52E+05 1.01E+05 1.68E+05 1.33E+05 2.32E+05 1.36E+05 1.90E+05 2.32E+05
Phosphoenolpyruvate 3.95E+04 3.36E+04 6.19E+04 3.45E+04 2.41E+04 4.89E+04 6.96E+04 3.61E+04 4.91E+04
Proline 5.72E+04 6.07E+04 7.22E+04 5.40E+04 5.57E+04 6.03E+04 6.41E+04 7.63E+04 1.02E+05
Pyroglutamic acid 2.57E+06 3.76E+06 1.32E+07 1.69E+06 2.58E+06 3.64E+06 2.99E+06 3.16E+06 4.30E+06
Pyruvate 1.54E+05 2.56E+05 4.60E+05 6.66E+04 1.75E+05 2.54E+05 1.74E+05 2.11E+05 5.78E+05
Ribose phosphate 4.39E+04 4.93E+04 6.91E+04 6.43E+04 5.10E+04 1.38E+05 6.45E+04 6.94E+04 8.25E+04
Serine 1.15E+06 1.03E+06 1.37E+06 9.09E+05 8.16E+05 1.49E+06 1.08E+06 1.22E+06 1.75E+06
Shikimate 2.40E+04 2.98E+04 7.64E+04 1.58E+04 2.26E+04 2.52E+04 1.99E+04 1.74E+04 1.71E+05
Succinate 2.20E+06 4.36E+06 7.78E+06 3.23E+06 3.68E+06 2.57E+06 2.25E+06 2.46E+06 6.10E+06

106
Table 1.16 Continued
Sample Name M3 M5 M10 M12 M14 M26 M30 M32 M38
Sulfolactate 5.64E+04 7.06E+04 2.62E+05 5.29E+04 7.22E+04 5.58E+04 5.32E+04 6.70E+04 7.92E+04
Taurine 1.97E+07 2.40E+07 2.23E+07 2.47E+07 2.12E+07 2.59E+07 2.32E+07 2.41E+07 3.20E+07
Trehalose/sucrose 4.00E+04 5.11E+04 1.42E+05 2.37E+04 3.48E+04 3.88E+04 2.56E+04 5.57E+04 4.44E+04
Tryptophan 2.50E+04 3.94E+04 3.27E+04 3.46E+04 2.17E+04 5.45E+04 3.69E+04 5.00E+04 7.72E+04
Tyrosine 1.37E+05 1.46E+05 1.49E+05 1.65E+05 1.77E+05 2.09E+05 3.34E+05 1.60E+05 3.27E+05
UDP-glucose 9.87E+04 1.39E+05 1.50E+05 1.51E+05 1.38E+05 2.39E+05 1.56E+05 1.70E+05 3.63E+05
UDP-N-acetylglucosamine 7.74E+04 1.14E+05 1.32E+05 1.41E+05 9.45E+04 1.83E+05 1.11E+05 1.76E+05 3.28E+05
UMP 1.99E+05 1.89E+05 2.08E+05 2.57E+05 1.85E+05 3.13E+05 2.42E+05 2.74E+05 3.15E+05
Uracil 1.83E+05 3.07E+05 3.27E+05 3.36E+05 2.94E+05 5.14E+05 3.28E+05 3.62E+05 4.64E+05
Uric acid 2.66E+04 3.60E+04 8.61E+04 1.90E+04 2.94E+04 3.67E+04 3.89E+04 4.79E+04 9.56E+04
Uridine 3.38E+05 5.09E+05 5.91E+05 4.97E+05 2.58E+05 4.79E+05 3.60E+05 3.76E+05 7.38E+05
Valine 2.97E+05 3.90E+05 3.84E+05 3.82E+05 2.85E+05 4.29E+05 3.59E+05 4.53E+05 5.84E+05
Xanthine 2.31E+05 4.03E+05 3.25E+05 3.59E+05 2.34E+05 2.89E+05 2.29E+05 1.89E+05 5.22E+05

107
Table 1.17 Raw Data of Susceptible Mice from BLA/CeA
Sample Name M1 M4 M15 M17 M20 M22 M23 M24 M25 M27
2-Aminoadipate 3.81E+04 8.97E+04 2.01E+04 3.90E+04 7.79E+04 1.49E+05 8.38E+04 1.31E+04 7.67E+04 4.16E+04
2-Hydroxy-2-methylsuccinate 2.29E+06 4.19E+06 2.38E+06 2.37E+06 3.85E+06 5.70E+06 4.37E+06 1.04E+06 4.80E+06 3.06E+06
2-Isopropylmalate 5.96E+04 7.65E+04 1.01E+05 5.10E+04 6.80E+04 6.20E+04 5.45E+04 4.77E+04 5.25E+04 7.02E+04
3_4-Dihydroxyphenylacetate 1.73E+04 2.79E+04 1.24E+04 2.05E+04 1.51E+04 2.20E+04 1.28E+04 1.90E+04 2.30E+04 3.72E+04
4-Aminobutyrate 1.51E+06 2.13E+06 1.28E+06 1.37E+06 1.98E+06 2.27E+06 2.19E+06 5.77E+05 1.80E+06 1.48E+06
5-Hydroxyindoleacetic acid 3.75E+04 5.22E+04 2.55E+04 1.79E+04 6.31E+04 7.64E+04 6.31E+04 2.23E+04 3.34E+04 1.28E+04
Aconitate 3.71E+06 6.41E+06 3.94E+06 3.10E+06 5.76E+06 8.76E+06 5.67E+06 3.12E+06 6.05E+06 7.00E+06
Adenine 1.65E+04 3.56E+04 2.44E+04 2.50E+04 4.40E+04 3.71E+04 2.41E+04 1.14E+04 1.70E+04 1.30E+04
Adenosine 3.56E+04 7.74E+03 4.64E+04 5.03E+04 6.16E+04 7.49E+04 4.94E+03 1.00E+02 6.31E+03 1.81E+04
Alanine/Sarcosine 1.68E+06 2.36E+06 1.58E+06 1.68E+06 2.56E+06 2.33E+06 2.34E+06 5.81E+05 2.28E+06 1.87E+06
alpha-Ketoglutarate 2.19E+04 3.41E+04 2.73E+04 4.02E+04 2.88E+04 1.92E+04 2.94E+04 3.58E+04 4.76E+04 3.19E+04
AMP/dGMP 2.20E+06 3.28E+06 2.23E+06 2.13E+06 3.69E+06 4.97E+06 3.96E+06 1.05E+06 4.60E+06 2.79E+06
Ascorbate 1.02E+07 1.95E+07 5.49E+06 1.09E+07 2.07E+07 2.43E+07 1.58E+07 4.23E+06 1.63E+07 6.33E+06
Asparagine 5.13E+04 7.48E+04 6.16E+04 4.69E+04 7.54E+04 5.72E+04 9.76E+04 2.94E+04 9.19E+04 8.43E+04
Aspartate 6.33E+06 9.52E+06 6.25E+06 6.06E+06 8.43E+06 9.60E+06 9.12E+06 3.30E+06 9.32E+06 7.52E+06
cAMP 1.46E+04 2.66E+04 1.45E+04 2.00E+04 3.41E+04 4.06E+04 2.14E+04 2.77E+03 2.75E+04 2.49E+04
CDP-ethanolamine 3.10E+04 5.44E+04 3.23E+04 2.90E+04 3.77E+04 5.00E+04 4.71E+04 1.39E+04 5.83E+04 3.61E+04
Citraconate 2.21E+05 2.88E+05 2.13E+05 1.52E+05 2.68E+05 3.14E+05 2.55E+05 1.35E+05 2.66E+05 3.27E+05
Citrate/isocitrate 2.62E+06 4.67E+06 2.12E+06 1.73E+06 3.68E+06 6.41E+06 2.92E+06 1.96E+06 4.56E+06 3.66E+06
Citrulline 1.53E+04 1.78E+04 8.71E+03 2.10E+04 2.65E+04 3.27E+04 2.01E+04 1.45E+04 2.56E+04 2.88E+04
Creatine 2.00E+06 2.88E+06 1.88E+06 2.00E+06 3.11E+06 2.75E+06 2.71E+06 6.06E+05 3.05E+06 2.17E+06
Cysteine 6.50E+04 1.62E+05 3.80E+04 4.82E+04 1.28E+05 2.18E+05 1.28E+05 1.99E+03 6.99E+04 9.62E+04
Cytidine 1.18E+04 1.02E+04 1.08E+04 9.67E+03 2.02E+04 1.76E+04 2.82E+04 9.25E+03 9.04E+03 1.07E+04
D-Glyceraldehdye 3-phosphate 2.34E+03 3.46E+03 1.06E+04 2.73E+03 3.37E+03 8.20E+03 2.04E+04 1.00E+02 2.68E+04 2.93E+03
Fumarate 3.81E+05 1.30E+06 3.23E+05 7.91E+05 1.35E+06 1.46E+06 1.70E+06 1.53E+05 9.68E+05 5.50E+05
Glucose 1-phosphate 3.20E+04 1.54E+04 1.89E+04 2.54E+04 1.28E+04 3.15E+04 3.75E+04 3.48E+03 4.70E+04 3.03E+04
Glucose 6-phosphate 1.69E+04 2.94E+04 8.90E+03 1.10E+04 3.50E+04 2.36E+04 2.69E+04 4.73E+03 4.86E+04 2.63E+04
Glutamate 1.71E+07 2.15E+07 1.54E+07 1.60E+07 2.14E+07 2.22E+07 2.44E+07 8.10E+06 2.10E+07 1.76E+07
Glutamine 3.81E+06 4.98E+06 3.55E+06 3.67E+06 5.75E+06 4.60E+06 5.09E+06 2.13E+06 5.18E+06 4.88E+06
Glutathione 1.11E+06 1.65E+06 6.58E+05 1.44E+06 2.69E+06 2.86E+06 2.17E+06 3.36E+05 1.61E+06 1.54E+06
Glutathione disulfide 2.41E+05 3.92E+05 3.83E+05 1.65E+05 2.55E+05 3.11E+05 2.44E+05 2.24E+05 7.07E+05 2.50E+05
Glycerate 5.45E+04 4.75E+04 4.78E+04 2.99E+04 3.96E+04 4.06E+04 4.23E+04 5.64E+04 5.16E+04 5.80E+04

108
Table 1.17 Continued
Sample Name M1 M4 M15 M17 M20 M22 M23 M24 M25 M27
Glycine 1.15E+05 1.82E+05 8.50E+04 1.36E+05 9.56E+04 2.67E+05 5.79E+05 2.18E+05 2.99E+05 2.92E+05
GMP 2.61E+05 3.54E+05 2.82E+05 2.23E+05 3.98E+05 4.81E+05 4.04E+05 1.37E+05 4.87E+05 3.01E+05
Guanosine 1.47E+04 3.38E+04 2.01E+04 2.40E+04 2.16E+04 2.42E+04 3.11E+04 6.04E+03 2.53E+04 3.82E+04
Histidine 6.44E+03 1.09E+04 8.35E+03 4.18E+03 1.09E+04 1.16E+04 8.56E+03 5.11E+03 1.54E+04 1.79E+04
Homoserine/Threonine 1.49E+05 2.34E+05 1.53E+05 1.11E+05 1.99E+05 1.66E+05 2.14E+05 1.31E+05 2.57E+05 2.67E+05
Homovanillic acid 5.85E+04 1.36E+05 8.12E+04 8.08E+04 1.52E+05 1.76E+05 1.22E+05 6.17E+04 1.47E+05 1.01E+05
Hydroxyisocaproic acid 1.90E+05 1.63E+05 3.38E+05 5.53E+05 1.92E+05 1.95E+05 1.34E+05 1.71E+05 1.54E+05 2.54E+05
Hypoxanthine 1.30E+06 2.45E+06 1.41E+06 1.52E+06 2.22E+06 2.25E+06 2.67E+06 5.29E+05 1.89E+06 1.87E+06
IMP 7.24E+05 1.06E+06 4.88E+05 4.78E+05 1.05E+06 1.53E+06 1.33E+06 4.06E+05 2.28E+06 8.93E+05
Inosine 8.69E+05 1.56E+06 9.46E+05 9.04E+05 1.78E+06 1.55E+06 1.25E+06 4.55E+05 1.17E+06 1.19E+06
Lactate 5.94E+07 7.15E+07 5.88E+07 6.32E+07 8.36E+07 8.41E+07 8.34E+07 5.08E+07 9.13E+07 8.31E+07
Leucine/Isoleucine 2.03E+05 4.77E+05 2.87E+05 1.86E+05 3.65E+05 4.72E+05 5.02E+05 1.69E+05 6.39E+05 6.04E+05
Lysine 3.37E+03 6.84E+03 4.70E+03 1.58E+03 1.07E+04 9.20E+03 6.81E+03 1.61E+03 7.71E+03 2.76E+03
Malate 1.34E+05 1.85E+05 1.74E+05 1.64E+05 2.37E+05 2.09E+05 2.65E+05 1.03E+05 2.10E+05 1.63E+05
Malate 4.28E+06 8.73E+06 5.20E+06 6.90E+06 1.02E+07 8.98E+06 7.97E+06 1.62E+06 1.45E+07 5.64E+06
Methionine 1.33E+05 2.95E+05 1.62E+05 1.36E+05 3.32E+05 2.96E+05 2.74E+05 5.71E+04 3.05E+05 2.69E+05
myo-Inositol 4.36E+05 4.55E+05 4.13E+05 4.58E+05 5.65E+05 6.24E+05 5.45E+05 3.09E+05 6.21E+05 5.57E+05
N-Acetylglutamate 1.09E+06 2.02E+06 8.21E+05 1.36E+06 2.43E+06 2.85E+06 2.11E+06 5.19E+05 2.11E+06 1.16E+06
N-Acetylglutamine 1.30E+04 3.66E+04 1.25E+04 1.47E+04 3.39E+04 3.21E+04 2.81E+04 1.91E+03 2.37E+04 1.20E+04
N-Carbamoyl-L-aspartate 6.39E+05 2.65E+05 3.59E+05 6.71E+05 5.42E+05 8.71E+05 5.16E+05 2.59E+05 5.02E+05 6.74E+05
Orotate 4.35E+03 8.39E+03 2.46E+03 7.70E+03 1.69E+04 1.41E+04 1.73E+04 2.54E+03 1.09E+04 5.99E+03
Pantothenate 2.26E+06 4.02E+06 2.38E+06 2.76E+06 5.01E+06 4.62E+06 4.18E+06 1.75E+06 4.15E+06 3.57E+06
Phenylalanine 8.35E+04 1.61E+05 1.02E+05 1.37E+05 2.06E+05 1.67E+05 1.77E+05 9.28E+04 2.18E+05 2.07E+05
Phosphoenolpyruvate 4.46E+04 4.62E+04 4.61E+04 3.45E+04 6.21E+04 2.46E+04 2.81E+04 6.85E+04 4.38E+04 3.46E+04
Proline 4.74E+04 6.94E+04 4.10E+04 4.19E+04 5.44E+04 6.95E+04 6.89E+04 3.66E+04 1.05E+05 8.31E+04
Pyroglutamic acid 1.71E+06 2.76E+06 2.57E+06 1.47E+06 1.75E+06 3.14E+06 3.39E+06 3.31E+06 6.34E+06 6.44E+06
Pyruvate 1.63E+05 1.02E+05 1.44E+05 1.03E+05 1.02E+05 1.83E+05 3.20E+05 3.31E+05 1.10E+06 8.41E+05
Ribose phosphate 4.77E+04 6.08E+04 5.20E+04 4.08E+04 7.21E+04 9.25E+04 8.07E+04 1.24E+04 8.73E+04 5.88E+04
Serine 6.35E+05 1.11E+06 7.31E+05 6.44E+05 1.39E+06 1.10E+06 1.43E+06 1.06E+06 1.71E+06 1.71E+06
Shikimate 2.59E+04 1.70E+04 2.63E+04 2.51E+04 5.32E+04 2.03E+04 3.72E+04 1.93E+04 2.21E+04 3.00E+04
Succinate 3.06E+06 2.79E+06 2.44E+06 4.59E+06 2.91E+06 2.21E+06 3.26E+06 2.08E+06 3.22E+06 2.87E+06
Sulfolactate 5.38E+04 5.00E+04 6.11E+04 5.70E+04 6.54E+04 4.73E+04 7.75E+04 5.72E+04 6.05E+04 8.96E+04

109
Table 1.17 Continued
Sample Name M1 M4 M15 M17 M20 M22 M23 M24 M25 M27
Taurine 1.93E+07 2.61E+07 1.84E+07 1.96E+07 2.84E+07 2.77E+07 2.76E+07 1.25E+07 2.56E+07 2.18E+07
Trehalose/sucrose 1.96E+04 1.44E+04 4.51E+04 3.25E+04 1.01E+04 2.21E+04 4.42E+04 1.52E+06 6.72E+04 8.36E+04
Tryptophan 1.48E+04 4.49E+04 2.08E+04 5.61E+04 4.72E+04 3.98E+04 5.32E+04 1.74E+04 4.37E+04 6.70E+04
Tyrosine 9.01E+04 1.63E+05 9.67E+04 1.83E+05 3.22E+05 2.31E+05 1.99E+05 8.53E+04 3.84E+05 2.46E+05
UDP-glucose 1.10E+05 1.19E+05 1.22E+05 1.22E+05 2.14E+05 2.63E+05 2.23E+05 5.29E+04 3.90E+05 1.24E+05
UDP-N-acetylglucosamine 7.45E+04 1.19E+05 8.53E+04 9.84E+04 2.10E+05 2.16E+05 1.80E+05 3.42E+04 2.57E+05 1.25E+05
UMP 1.21E+05 2.24E+05 1.55E+05 1.25E+05 2.43E+05 2.97E+05 2.90E+05 7.18E+04 4.01E+05 2.38E+05
Uracil 1.47E+05 3.39E+05 2.17E+05 1.81E+05 3.59E+05 3.94E+05 3.55E+05 5.20E+04 3.23E+05 3.75E+05
Uric acid 3.49E+04 3.37E+04 1.59E+04 3.25E+04 2.48E+04 3.64E+04 3.04E+04 6.51E+04 8.73E+04 6.09E+04
Uridine 2.86E+05 4.59E+05 3.16E+05 3.57E+05 6.30E+05 7.70E+05 4.31E+05 1.46E+05 3.60E+05 3.01E+05
Valine 2.41E+05 4.11E+05 1.97E+05 2.06E+05 3.74E+05 4.25E+05 4.60E+05 1.23E+05 5.25E+05 4.29E+05
Xanthine 1.30E+05 5.50E+05 1.85E+05 2.79E+05 4.02E+05 4.00E+05 3.60E+05 4.23E+04 1.69E+05 2.56E+05

110
Table 1.18 Raw Data of Resilient Mice from HPC
Sample Name M2 M13 M16 M44 M46 M69 M70
2-Hydroxy-2-methylsuccinate 1.02E+05 1.11E+05 1.43E+05 2.10E+05 1.78E+05 2.26E+05 2.32E+05
4-Aminobutyrate 7.28E+04 1.92E+05 1.08E+06 5.56E+05 1.52E+06 1.45E+06 1.38E+06
5-Hydroxyindoleacetic acid 1.00E+02 3.74E+03 8.84E+03 1.08E+04 1.52E+04 1.59E+04 1.11E+04
Acadesine 8.06E+03 1.26E+04 1.29E+04 1.24E+04 1.75E+04 1.37E+04 1.38E+04
Aconitate 2.97E+04 2.33E+04 5.48E+04 1.09E+05 7.70E+04 5.19E+04 7.28E+04
Adenosine 1.00E+02 1.00E+02 8.68E+04 1.00E+02 1.34E+05 1.54E+05 5.75E+04
Alanine 5.30E+05 6.96E+05 1.20E+06 1.06E+06 1.51E+06 1.57E+06 1.45E+06
AMP 2.69E+06 3.38E+06 5.06E+06 5.71E+06 5.42E+06 6.97E+06 6.06E+06
Arginine 1.84E+04 2.27E+04 1.84E+04 4.37E+04 1.65E+04 1.39E+04 2.88E+04
Ascorbate 2.10E+06 4.55E+05 6.40E+06 3.45E+06 7.54E+06 5.97E+06 8.99E+06
Asparagine 1.17E+04 1.37E+04 2.92E+04 2.16E+04 2.95E+04 2.28E+04 3.30E+04
Aspartate 2.31E+06 1.98E+06 4.40E+06 5.30E+06 6.05E+06 4.57E+06 5.53E+06
CDP-ethanolamine 5.70E+04 4.60E+04 6.85E+04 5.89E+04 4.70E+04 6.44E+04 5.17E+04
Citrate/isocitrate 7.51E+05 3.73E+05 1.72E+07 2.39E+06 3.96E+06 1.65E+06 2.07E+06
Citrulline 8.60E+03 6.23E+03 7.34E+03 7.91E+03 7.90E+03 4.85E+03 7.66E+03
CMP 3.79E+04 5.09E+04 6.24E+04 9.37E+04 5.57E+04 8.25E+04 6.23E+04
Creatine 6.55E+05 7.86E+05 1.40E+06 1.50E+06 1.91E+06 2.12E+06 1.99E+06
Creatinine 4.23E+04 2.03E+04 4.04E+04 3.91E+04 4.99E+04 4.20E+04 6.69E+04
Cysteine 1.00E+02 1.00E+02 5.16E+03 3.17E+04 2.58E+04 1.45E+04 2.38E+04
Cytidine 8.45E+03 1.47E+04 1.30E+04 1.66E+04 1.45E+04 1.16E+04 2.17E+04
Cytidine 8.57E+04 1.23E+05 1.43E+05 1.42E+05 1.73E+05 1.86E+05 1.90E+05
Diiodothyronine 3.86E+03 6.74E+03 4.54E+04 3.25E+04 4.66E+04 6.87E+04 5.54E+04
Glutamate 1.38E+07 1.46E+07 2.61E+07 2.53E+07 3.27E+07 3.85E+07 3.98E+07
Glutamine 3.02E+06 3.48E+06 6.57E+06 6.46E+06 7.83E+06 8.30E+06 9.22E+06
Glutathione 4.28E+05 2.68E+05 1.28E+06 1.43E+06 1.41E+06 1.88E+06 1.91E+06
Glutathione disulfide 1.00E+02 5.09E+03 8.59E+04 2.50E+04 9.12E+04 1.16E+05 8.18E+04
Glycerone phosphate 6.04E+03 4.08E+04 9.09E+04 7.61E+04 1.06E+05 1.25E+05 1.21E+05
GMP 1.47E+05 1.32E+05 1.76E+05 2.86E+05 2.20E+05 2.77E+05 3.54E+05
Guanosine 4.00E+04 1.93E+04 2.99E+04 7.36E+04 5.74E+04 6.50E+04 7.47E+04
Histidine 2.51E+04 3.23E+04 5.17E+04 4.07E+04 3.66E+04 4.96E+04 3.40E+04
Homoserine 1.70E+05 2.17E+05 3.01E+05 2.84E+05 3.75E+05 3.68E+05 3.57E+05
Homovanillic acid 2.43E+04 1.50E+04 3.39E+04 3.29E+04 4.48E+04 4.57E+04 5.49E+04

111
Table 1.18 Continued
Sample Name M2 M13 M16 M44 M46 M69 M70
Hydroxyphenylpyruvate 2.14E+06 2.07E+06 2.25E+06 2.22E+06 2.08E+06 2.21E+06 2.26E+06
Hypoxanthine 3.18E+05 3.51E+05 6.91E+05 8.04E+05 7.02E+05 4.89E+05 6.97E+05
IMP 1.81E+05 3.06E+05 3.08E+05 4.21E+05 4.08E+05 5.03E+05 5.05E+05
Inosine 1.43E+06 1.51E+06 2.45E+06 2.63E+06 2.53E+06 2.27E+06 2.83E+06
Lactate 3.12E+07 3.29E+07 3.96E+07 4.65E+07 4.88E+07 6.62E+07 5.01E+07
Leucine/Isoleucine 4.42E+04 4.19E+04 6.80E+04 4.31E+04 4.67E+04 5.77E+04 6.21E+04
Malate 7.14E+06 9.78E+06 1.74E+07 1.61E+07 2.06E+07 3.31E+07 2.76E+07
Methionine 2.42E+04 2.71E+04 6.22E+04 3.70E+04 5.16E+04 5.52E+04 5.49E+04
Methionine sulfoxide 3.82E+04 1.88E+04 2.60E+04 2.97E+04 5.25E+04 4.05E+04 6.11E+04
Methylmalonate 9.32E+05 1.05E+06 8.69E+05 8.01E+05 9.04E+05 8.11E+05 6.26E+05
myo-Inositol 3.72E+04 4.72E+04 7.60E+04 8.58E+04 9.09E+04 1.77E+05 1.13E+05
N-Acetylglutamate 3.47E+04 5.33E+04 1.15E+05 9.66E+04 1.26E+05 1.80E+05 1.82E+05
N-Carbamoyl-L-aspartate 3.11E+04 3.97E+04 9.63E+04 8.31E+04 1.80E+05 1.47E+05 1.18E+05
Normetanephrine 2.06E+05 1.99E+05 1.78E+05 2.05E+05 1.94E+05 2.38E+05 2.00E+05
Pantothenate 1.44E+05 1.32E+05 3.56E+05 2.74E+05 3.33E+05 3.41E+05 2.86E+05
Phenylalanine 7.86E+04 7.50E+04 9.55E+04 1.04E+05 1.19E+05 1.29E+05 1.27E+05
Proline 2.54E+04 2.91E+04 4.46E+04 4.22E+04 4.16E+04 3.93E+04 4.68E+04
Pyroglutamic acid 2.89E+05 2.68E+05 1.93E+05 3.23E+05 4.10E+05 2.30E+05 2.44E+05
S-Methyl-5--thioadenosine 2.91E+05 3.10E+05 3.53E+05 4.13E+05 3.68E+05 4.15E+05 4.16E+05
Serine 6.20E+05 6.57E+05 6.75E+05 8.85E+05 8.85E+05 9.71E+05 8.73E+05
Taurine 9.43E+06 1.13E+07 1.88E+07 1.89E+07 2.54E+07 3.07E+07 2.84E+07
Trehalose/sucrose 6.37E+04 5.39E+04 3.66E+04 1.07E+05 2.16E+04 3.16E+04 2.29E+04
Tyrosine 5.79E+04 5.46E+04 9.01E+04 6.50E+04 6.27E+04 7.21E+04 7.28E+04
UMP 2.35E+05 2.34E+05 2.38E+05 3.38E+05 2.43E+05 2.64E+05 3.17E+05
Uracil 9.02E+04 5.18E+04 2.12E+05 7.41E+04 1.97E+05 2.55E+05 2.29E+05
Uridine 1.18E+05 1.13E+05 3.27E+05 2.15E+05 2.69E+05 3.60E+05 3.17E+05
Valine 1.39E+05 1.15E+05 1.89E+05 1.32E+05 1.92E+05 2.18E+05 2.64E+05
Xanthine 9.52E+04 6.58E+04 1.27E+05 8.75E+04 1.09E+05 1.37E+05 1.15E+05

112
Table 1.19 Raw Data of Control Mice from HPC
Sample Name M3 M5 M10 M12 M14 M26 M30 M32 M38 M40
2-Hydroxy-2-methylsuccinate 2.63E+04 1.72E+05 1.97E+05 1.18E+05 1.49E+05 2.67E+05 1.58E+05 1.72E+05 2.56E+05 1.90E+05
4-Aminobutyrate 1.73E+05 1.22E+06 1.69E+06 9.91E+05 4.92E+05 1.55E+06 1.05E+06 1.44E+06 1.72E+06 1.31E+06
5-Hydroxyindoleacetic acid 2.81E+03 1.25E+04 1.72E+04 1.18E+04 1.20E+04 1.20E+04 1.29E+04 1.32E+04 1.57E+04 9.19E+03
Acadesine 9.22E+02 1.28E+04 1.96E+04 1.50E+04 7.29E+03 1.94E+04 1.42E+04 1.56E+04 2.20E+04 2.06E+04
Aconitate 7.63E+03 9.72E+04 6.83E+04 5.58E+04 3.78E+04 7.87E+04 3.64E+04 6.83E+04 8.05E+04 6.03E+04
Adenosine 1.53E+04 2.37E+04 1.18E+05 3.17E+04 1.00E+02 1.50E+05 5.07E+04 1.42E+04 6.82E+04 2.36E+04
Alanine 2.38E+05 9.94E+05 1.45E+06 1.17E+06 7.56E+05 1.56E+06 1.15E+06 1.12E+06 1.69E+06 1.44E+06
AMP 8.88E+05 5.45E+06 7.00E+06 5.11E+06 3.11E+06 8.44E+06 4.67E+06 5.64E+06 7.28E+06 7.70E+06
Arginine 1.43E+03 2.58E+04 2.87E+04 2.57E+04 1.30E+04 8.80E+03 2.76E+04 1.42E+04 2.18E+04 1.17E+04
Ascorbate 8.25E+05 5.46E+06 1.16E+07 5.58E+06 7.60E+05 1.22E+07 3.38E+06 5.93E+06 2.59E+06 8.02E+06
Asparagine 2.65E+03 1.92E+04 3.73E+04 2.61E+04 2.06E+04 3.01E+04 2.71E+04 2.47E+04 4.09E+04 3.27E+04
Aspartate 3.81E+05 5.27E+06 7.53E+06 3.91E+06 2.17E+06 6.79E+06 4.98E+06 4.95E+06 7.83E+06 4.99E+06
CDP-ethanolamine 4.65E+03 5.92E+04 6.98E+04 5.92E+04 3.43E+04 6.11E+04 4.98E+04 6.15E+04 6.44E+04 9.23E+04
Citrate/isocitrate 2.89E+04 5.63E+06 5.19E+06 1.98E+06 9.60E+05 4.22E+06 1.64E+06 1.35E+06 2.01E+06 2.74E+06
Citrulline 4.37E+03 6.38E+03 1.42E+04 3.74E+03 3.25E+03 7.17E+03 9.68E+03 4.89E+03 1.14E+04 4.80E+03
CMP 1.32E+04 4.97E+04 7.63E+04 3.79E+04 2.52E+04 7.54E+04 2.61E+04 5.85E+04 6.08E+04 6.75E+04
Creatine 1.89E+05 1.23E+06 1.82E+06 1.49E+06 8.94E+05 1.97E+06 1.44E+06 1.53E+06 2.25E+06 1.88E+06
Creatinine 2.00E+04 1.03E+05 4.97E+04 3.11E+04 3.57E+04 4.98E+04 3.63E+04 3.25E+04 4.93E+04 4.76E+04
Cysteine 1.00E+02 1.00E+02 1.40E+03 9.41E+02 5.20E+02 1.07E+04 9.35E+03 6.20E+03 2.94E+04 1.13E+04
Cytidine 2.44E+03 1.14E+04 1.83E+04 1.16E+04 6.98E+03 8.80E+03 1.48E+04 1.49E+04 2.12E+04 1.16E+04
Cytidine 2.40E+03 1.04E+05 1.44E+05 1.09E+05 5.76E+04 2.05E+05 7.95E+04 1.21E+05 1.88E+05 1.75E+05
Diiodothyronine 1.00E+02 2.17E+04 8.05E+04 2.92E+04 1.27E+04 6.85E+04 3.43E+04 2.92E+04 6.95E+04 5.89E+04
Glutamate 6.64E+06 2.67E+07 3.98E+07 2.58E+07 1.85E+07 3.71E+07 3.03E+07 3.03E+07 4.06E+07 3.65E+07
Glutamine 1.15E+06 6.20E+06 7.95E+06 6.33E+06 4.21E+06 6.94E+06 5.94E+06 6.77E+06 8.98E+06 6.74E+06
Glutathione 1.52E+05 6.72E+05 1.44E+06 1.07E+06 5.00E+05 1.62E+06 1.25E+06 1.47E+06 2.22E+06 1.46E+06
Glutathione disulfide 3.79E+03 1.11E+05 1.37E+05 7.91E+04 3.13E+04 1.91E+05 5.21E+04 5.74E+04 6.09E+04 1.36E+05
Glycerone phosphate 5.59E+03 6.36E+04 1.03E+05 7.29E+04 1.19E+04 1.22E+05 9.66E+04 1.03E+05 1.73E+05 1.54E+05
GMP 1.69E+04 2.52E+05 2.25E+05 1.76E+05 1.05E+05 2.93E+05 1.54E+05 2.34E+05 3.38E+05 3.05E+05
Guanosine 4.74E+03 5.90E+04 6.83E+04 6.19E+04 4.36E+04 5.43E+04 4.07E+04 3.98E+04 7.59E+04 4.54E+04
Histidine 4.60E+03 3.39E+04 5.49E+04 3.19E+04 2.85E+04 4.65E+04 4.64E+04 4.31E+04 6.45E+04 4.17E+04
Homoserine 4.46E+04 2.88E+05 3.44E+05 2.68E+05 1.84E+05 3.34E+05 2.79E+05 3.47E+05 5.80E+05 3.66E+05
Homovanillic acid 1.47E+04 4.57E+04 2.34E+04 1.99E+04 2.15E+04 7.68E+04 3.01E+04 2.77E+04 5.34E+04 3.46E+04

113
Table 1.19 Continued
Sample Name M3 M5 M10 M12 M14 M26 M30 M32 M38 M40
Hydroxyphenylpyruvate 2.00E+06 1.92E+06 1.96E+06 2.02E+06 2.11E+06 2.01E+06 2.11E+06 2.25E+06 2.09E+06 2.25E+06
Hypoxanthine 6.49E+04 5.74E+05 5.86E+05 4.19E+05 3.07E+05 5.50E+05 5.61E+05 5.56E+05 1.08E+06 5.29E+05
IMP 5.86E+04 5.83E+05 5.15E+05 3.40E+05 3.51E+05 7.22E+05 3.59E+05 3.68E+05 3.87E+05 1.14E+06
Inosine 4.08E+05 2.31E+06 2.39E+06 2.31E+06 1.53E+06 2.35E+06 2.26E+06 2.47E+06 3.09E+06 2.09E+06
Lactate 1.77E+07 3.49E+07 5.04E+07 3.30E+07 2.80E+07 4.91E+07 4.43E+07 4.81E+07 7.73E+07 4.70E+07
Leucine/Isoleucine 1.23E+04 5.43E+04 4.99E+04 4.29E+04 3.17E+04 5.31E+04 5.11E+04 7.01E+04 8.51E+04 3.59E+04
Malate 1.76E+06 1.08E+07 1.92E+07 1.52E+07 8.08E+06 2.51E+07 1.69E+07 1.77E+07 3.13E+07 1.89E+07
Methionine 2.90E+03 3.74E+04 3.82E+04 2.92E+04 2.33E+04 3.30E+04 3.99E+04 3.61E+04 4.74E+04 3.50E+04
Methionine sulfoxide 4.06E+04 1.12E+04 2.68E+04 1.82E+04 2.93E+04 3.74E+04 4.37E+04 4.39E+04 3.89E+04 3.39E+04
Methylmalonate 6.80E+05 8.20E+05 1.28E+06 7.50E+05 6.66E+05 9.74E+05 6.74E+05 6.93E+05 1.82E+06 7.75E+05
myo-Inositol 4.78E+03 5.01E+04 7.50E+04 4.34E+04 2.80E+04 1.25E+05 7.39E+04 1.22E+05 2.01E+05 9.51E+04
N-Acetylglutamate 1.37E+04 1.52E+05 2.00E+05 1.10E+05 7.80E+04 2.19E+05 1.18E+05 1.04E+05 1.71E+05 1.26E+05
N-Carbamoyl-L-aspartate 1.18E+04 1.09E+05 1.71E+05 9.67E+04 4.65E+04 1.64E+05 1.11E+05 1.37E+05 1.76E+05 1.44E+05
Normetanephrine 1.86E+05 2.32E+05 2.27E+05 2.24E+05 2.07E+05 2.28E+05 2.66E+05 2.31E+05 2.00E+05 2.66E+05
Pantothenate 6.12E+04 2.29E+05 2.64E+05 1.98E+05 1.62E+05 4.06E+05 2.44E+05 2.72E+05 3.61E+05 3.52E+05
Phenylalanine 2.05E+04 1.09E+05 1.28E+05 8.42E+04 9.75E+04 1.51E+05 1.10E+05 1.21E+05 1.76E+05 1.13E+05
Proline 1.57E+04 3.52E+04 5.24E+04 3.05E+04 2.16E+04 4.29E+04 4.71E+04 3.49E+04 5.83E+04 5.37E+04
Pyroglutamic acid 1.27E+05 2.29E+05 3.33E+05 2.32E+05 2.23E+05 1.84E+05 2.24E+05 2.05E+05 2.62E+05 3.18E+05
S-Methyl-5--thioadenosine 2.98E+05 2.81E+05 3.28E+05 2.92E+05 3.29E+05 4.12E+05 3.25E+05 3.83E+05 4.21E+05 3.92E+05
Serine 1.65E+05 6.24E+05 1.18E+06 8.31E+05 4.72E+05 8.93E+05 7.90E+05 7.89E+05 1.36E+06 9.83E+05
Taurine 5.81E+06 1.70E+07 2.35E+07 1.63E+07 1.06E+07 2.71E+07 1.63E+07 2.21E+07 2.59E+07 2.63E+07
Trehalose/sucrose 5.47E+04 4.74E+04 4.06E+04 4.87E+04 5.19E+04 2.51E+04 3.07E+04 3.73E+04 7.83E+04 4.73E+04
Tyrosine 1.25E+04 5.65E+04 6.45E+04 6.31E+04 5.94E+04 9.40E+04 6.83E+04 6.15E+04 1.23E+05 5.81E+04
UMP 4.23E+04 2.00E+05 2.65E+05 2.54E+05 1.35E+05 2.67E+05 1.66E+05 2.00E+05 2.81E+05 2.98E+05
Uracil 2.23E+04 1.11E+05 1.66E+05 8.27E+04 5.42E+04 2.24E+05 1.30E+05 1.82E+05 2.03E+05 3.10E+05
Uridine 7.68E+04 2.42E+05 3.32E+05 2.30E+05 1.80E+05 3.07E+05 2.43E+05 2.55E+05 3.62E+05 1.96E+05
Valine 5.55E+04 1.81E+05 2.19E+05 1.16E+05 1.17E+05 2.65E+05 1.53E+05 1.87E+05 3.31E+05 2.33E+05
Xanthine 2.82E+04 1.23E+05 1.46E+05 7.09E+04 8.59E+04 1.48E+05 8.81E+04 1.02E+05 1.39E+05 9.50E+04

114
Table 1.20 Raw Data of Susceptible Mice from HPC
Sample Name M1 M4 M15 M17 M20 M22 M23 M24 M25 M27 M28
2-Hydroxy-2-methylsuccinate 2.55E+05 1.47E+05 4.84E+05 1.83E+05 3.06E+05 2.62E+05 1.25E+05 1.86E+05 1.13E+05 1.44E+05 1.83E+05
4-Aminobutyrate 1.52E+06 1.13E+06 1.32E+06 1.70E+06 1.69E+06 1.34E+06 1.03E+06 1.68E+06 9.70E+05 1.18E+06 1.61E+06
5-Hydroxyindoleacetic acid 2.70E+04 7.85E+03 1.84E+04 2.82E+04 1.91E+04 1.60E+04 4.96E+03 2.72E+04 4.59E+03 6.74E+03 1.57E+04
Acadesine 1.22E+04 1.69E+04 7.51E+03 2.26E+04 2.15E+04 1.98E+04 1.04E+04 2.19E+04 1.72E+04 1.47E+04 1.31E+04
Aconitate 8.11E+04 3.61E+04 5.00E+04 8.72E+04 1.09E+05 6.89E+04 4.26E+04 7.25E+04 4.01E+04 6.91E+04 9.10E+04
Adenosine 2.19E+04 6.08E+04 7.35E+03 1.15E+05 9.50E+04 5.99E+04 6.69E+04 3.90E+04 1.86E+04 1.74E+04 6.44E+03
Alanine 1.18E+06 9.28E+05 1.07E+06 1.59E+06 1.55E+06 1.48E+06 9.75E+05 1.16E+06 1.00E+06 1.11E+06 1.29E+06
AMP 7.62E+06 5.78E+06 2.85E+06 7.82E+06 7.98E+06 7.86E+06 4.19E+06 6.27E+06 5.30E+06 5.78E+06 6.36E+06
Arginine 2.74E+04 7.40E+03 8.95E+03 3.58E+04 1.53E+04 1.88E+04 7.26E+03 1.85E+04 6.18E+03 7.73E+03 2.61E+04
Ascorbate 1.08E+07 7.60E+06 1.35E+03 1.06E+07 1.07E+07 7.87E+06 4.61E+06 5.94E+06 1.56E+06 4.86E+06 6.23E+06
Asparagine 2.04E+04 2.37E+04 1.18E+04 3.36E+04 2.96E+04 3.39E+04 1.68E+04 3.17E+04 1.89E+04 1.50E+04 2.90E+04
Aspartate 6.56E+06 4.06E+06 6.78E+05 6.97E+06 7.25E+06 6.90E+06 3.22E+06 5.64E+06 2.35E+06 3.63E+06 5.75E+06
CDP-ethanolamine 6.34E+04 4.60E+04 4.82E+02 8.31E+04 5.34E+04 9.05E+04 5.18E+04 5.12E+04 3.62E+04 3.88E+04 4.50E+04
Citrate/isocitrate 7.58E+06 1.98E+06 9.57E+04 4.46E+06 3.84E+06 3.22E+06 9.97E+05 4.58E+06 6.36E+05 1.49E+06 3.23E+06
Citrulline 9.84E+03 1.54E+04 7.01E+03 8.62E+03 1.95E+03 1.03E+04 5.48E+03 1.58E+04 8.21E+03 7.10E+03 6.86E+03
CMP 7.60E+04 3.39E+04 1.00E+02 5.89E+04 5.97E+04 9.00E+04 3.75E+04 5.18E+04 4.43E+04 6.94E+04 4.75E+04
Creatine 1.49E+06 1.16E+06 1.29E+06 1.99E+06 1.97E+06 1.90E+06 1.23E+06 1.63E+06 1.23E+06 1.44E+06 1.68E+06
Creatinine 3.50E+04 5.43E+04 3.63E+04 4.68E+04 3.19E+04 3.38E+04 2.90E+04 4.43E+04 2.21E+04 3.03E+04 4.09E+04
Cysteine 1.00E+02 1.00E+02 1.00E+02 1.19E+04 8.89E+03 1.52E+04 6.83E+02 9.04E+03 6.83E+02 3.20E+03 1.21E+04
Cytidine 1.24E+04 9.68E+03 8.30E+03 2.15E+04 1.17E+04 1.60E+04 7.22E+03 2.98E+04 7.08E+03 1.14E+04 2.14E+04
Cytidine 1.16E+05 8.85E+04 5.57E+04 1.44E+05 1.67E+05 1.50E+05 9.43E+04 1.53E+05 7.75E+04 7.98E+04 1.19E+05
Diiodothyronine 4.15E+04 1.77E+04 1.92E+04 6.63E+04 8.32E+04 6.17E+04 2.31E+04 5.27E+04 2.83E+04 2.77E+04 5.04E+04
Glutamate 2.97E+07 2.69E+07 9.59E+06 3.83E+07 3.85E+07 3.83E+07 2.29E+07 3.09E+07 2.57E+07 2.71E+07 3.25E+07
Glutamine 7.47E+06 5.27E+06 5.34E+06 9.83E+06 9.46E+06 8.90E+06 5.12E+06 7.68E+06 4.46E+06 6.03E+06 9.42E+06
Glutathione 9.30E+05 1.05E+06 4.89E+05 1.77E+06 1.88E+06 1.85E+06 9.95E+05 1.22E+06 7.08E+05 1.19E+06 1.56E+06
Glutathione disulfide 8.70E+04 9.03E+04 5.65E+04 1.05E+05 9.55E+04 7.80E+04 8.58E+04 1.33E+05 1.01E+05 1.00E+05 8.46E+04
Glycerone phosphate 9.61E+04 8.17E+04 2.83E+03 8.69E+04 1.03E+05 1.03E+05 7.94E+04 1.41E+05 9.36E+04 1.25E+05 1.06E+05
GMP 2.65E+05 1.67E+05 7.79E+04 2.88E+05 2.96E+05 2.59E+05 1.14E+05 2.01E+05 1.73E+05 2.26E+05 2.40E+05
Guanosine 5.25E+04 3.91E+04 1.91E+04 5.37E+04 5.10E+04 5.76E+04 2.28E+04 5.36E+04 2.00E+04 3.69E+04 4.70E+04
Histidine 3.00E+04 3.43E+04 6.92E+03 5.82E+04 4.33E+04 4.68E+04 3.41E+04 5.46E+04 3.25E+04 2.38E+04 5.34E+04
Homoserine 2.79E+05 2.87E+05 1.63E+05 3.90E+05 3.81E+05 3.98E+05 2.02E+05 3.99E+05 1.76E+05 2.38E+05 3.29E+05
Homovanillic acid 4.49E+04 3.66E+04 3.66E+04 6.20E+04 6.42E+04 3.54E+04 2.41E+04 5.65E+04 3.12E+04 3.33E+04 4.88E+04

115
Table 1.20 Continued
Sample Name M1 M4 M15 M17 M20 M22 M23 M24 M25 M27 M28
Hydroxyphenylpyruvate 2.04E+06 2.19E+06 1.97E+06 2.17E+06 1.94E+06 2.15E+06 2.07E+06 2.22E+06 2.16E+06 2.00E+06 1.95E+06
Hypoxanthine 6.49E+05 3.87E+05 3.30E+05 7.47E+05 6.52E+05 7.04E+05 2.90E+05 7.06E+05 2.50E+05 4.20E+05 6.42E+05
IMP 8.02E+05 3.59E+05 1.48E+05 6.04E+05 6.64E+05 6.24E+05 2.94E+05 4.24E+05 5.94E+05 4.88E+05 4.47E+05
Inosine 2.42E+06 1.57E+06 1.06E+06 2.53E+06 2.45E+06 2.85E+06 1.72E+06 3.00E+06 1.40E+06 1.79E+06 2.75E+06
Lactate 4.12E+07 4.22E+07 5.51E+06 5.94E+07 5.65E+07 5.36E+07 3.91E+07 7.03E+07 4.20E+07 4.51E+07 5.17E+07
Leucine/Isoleucine 5.02E+04 3.68E+04 5.89E+04 5.15E+04 5.24E+04 6.40E+04 3.99E+04 8.18E+04 4.25E+04 4.06E+04 6.86E+04
Malate 1.90E+07 1.53E+07 1.35E+07 2.84E+07 2.36E+07 2.44E+07 1.46E+07 2.09E+07 1.32E+07 1.61E+07 2.26E+07
Methionine 3.79E+04 3.25E+04 4.03E+04 7.09E+04 4.58E+04 5.01E+04 2.25E+04 3.98E+04 3.14E+04 2.71E+04 5.23E+04
Methionine sulfoxide 3.69E+04 1.56E+04 3.96E+04 4.05E+04 3.82E+04 2.91E+04 3.40E+04 4.07E+04 2.17E+04 4.87E+04 2.51E+04
Methylmalonate 7.38E+05 7.97E+05 7.12E+05 8.61E+05 1.12E+06 9.74E+05 8.87E+05 7.88E+05 8.54E+05 1.07E+06 7.73E+05
myo-Inositol 4.92E+04 9.00E+04 1.13E+03 1.31E+05 1.47E+05 9.70E+04 6.55E+04 1.74E+05 5.94E+04 7.29E+04 1.15E+05
N-Acetylglutamate 1.84E+05 1.08E+05 3.37E+04 1.92E+05 1.84E+05 1.52E+05 1.04E+05 1.46E+05 1.07E+05 1.05E+05 1.48E+05
N-Carbamoyl-L-aspartate 1.01E+05 6.91E+04 4.13E+04 1.48E+05 1.70E+05 1.21E+05 1.00E+05 1.49E+05 9.49E+04 1.02E+05 1.13E+05
Normetanephrine 2.18E+05 2.20E+05 2.14E+05 2.58E+05 1.97E+05 2.12E+05 2.29E+05 2.43E+05 2.15E+05 2.20E+05 2.53E+05
Pantothenate 2.78E+05 2.15E+05 1.89E+05 4.01E+05 4.37E+05 2.42E+05 2.24E+05 3.60E+05 2.10E+05 2.31E+05 3.65E+05
Phenylalanine 9.89E+04 1.08E+05 4.65E+04 1.62E+05 1.47E+05 1.22E+05 8.10E+04 1.52E+05 7.87E+04 1.10E+05 1.26E+05
Proline 3.42E+04 3.74E+04 2.80E+04 4.52E+04 4.77E+04 3.89E+04 3.38E+04 5.68E+04 3.34E+04 3.59E+04 3.86E+04
Pyroglutamic acid 2.34E+05 2.70E+05 1.59E+05 2.97E+05 2.83E+05 2.62E+05 2.41E+05 4.89E+05 2.71E+05 2.21E+05 2.88E+05
S-Methyl-5--thioadenosine 2.68E+05 2.86E+05 2.63E+05 3.36E+05 3.43E+05 3.81E+05 3.24E+05 3.66E+05 3.52E+05 3.88E+05 3.31E+05
Serine 6.69E+05 9.94E+05 5.03E+05 1.07E+06 1.10E+06 1.12E+06 6.34E+05 1.41E+06 7.52E+05 7.01E+05 8.87E+05
Taurine 2.07E+07 1.50E+07 1.89E+07 2.41E+07 2.82E+07 2.37E+07 1.81E+07 2.23E+07 1.71E+07 1.64E+07 1.89E+07
Trehalose/sucrose 3.07E+04 5.91E+04 2.52E+04 5.06E+04 4.99E+04 4.51E+04 6.73E+04 1.10E+05 1.27E+05 4.83E+04 4.08E+04
Tyrosine 5.69E+04 7.90E+04 4.94E+04 9.44E+04 7.51E+04 1.01E+05 4.67E+04 1.09E+05 4.47E+04 6.44E+04 9.15E+04
UMP 2.73E+05 1.73E+05 8.64E+04 2.94E+05 2.43E+05 3.43E+05 1.47E+05 1.66E+05 1.94E+05 2.78E+05 2.41E+05
Uracil 1.71E+05 9.04E+04 1.07E+05 1.82E+05 2.85E+05 1.38E+05 1.37E+05 2.29E+05 1.03E+05 1.68E+05 1.51E+05
Uridine 2.71E+05 2.16E+05 1.88E+05 3.84E+05 3.50E+05 2.96E+05 2.00E+05 3.06E+05 1.71E+05 1.51E+05 2.71E+05
Valine 1.85E+05 1.95E+05 1.28E+05 2.28E+05 2.51E+05 2.10E+05 1.32E+05 3.49E+05 1.31E+05 1.65E+05 2.06E+05
Xanthine 1.03E+05 9.93E+04 1.12E+05 1.53E+05 1.16E+05 9.94E+04 6.26E+04 1.39E+05 5.40E+04 8.71E+04 1.06E+05

116
Table 1.21 Raw Data of Resilient Mice from NAc
Sample Name M2 M8 M13 M16 M18 M44 M45 M46 M64 M69 M70
2-Aminoadipate 3.51E+04 2.16E+04 2.77E+04 3.18E+04 5.82E+04 1.09E+04 8.31E+04 1.68E+05 5.51E+04 1.02E+05 3.00E+04
2-Hydroxy-2-methylsuccinate 5.00E+06 2.62E+06 5.04E+06 4.78E+06 2.80E+06 3.72E+06 3.77E+06 5.97E+06 3.18E+06 1.84E+06 3.53E+06
2-Isopropylmalate 7.47E+04 5.32E+04 5.32E+04 5.93E+04 5.61E+04 5.42E+04 6.07E+04 5.98E+04 5.79E+04 5.45E+04 5.92E+04
3-Phosphoglycerate 3.77E+04 1.21E+04 2.47E+04 5.80E+03 1.21E+04 1.78E+04 2.10E+04 1.99E+04 1.75E+04 2.63E+04 3.42E+04
3_4-Dihydroxyphenylacetate 4.14E+04 2.33E+04 7.10E+04 2.31E+04 4.62E+04 7.16E+04 5.51E+04 4.67E+06 3.46E+04 2.01E+04 3.20E+04
4-Aminobutyrate 2.07E+06 2.81E+06 1.39E+06 1.55E+06 2.51E+06 3.07E+06 2.23E+06 2.32E+06 1.74E+06 2.79E+06 3.65E+06
5-Hydroxyindoleacetic acid 1.88E+04 2.83E+04 1.57E+04 2.09E+04 3.43E+04 3.00E+04 2.01E+04 2.92E+04 1.45E+04 1.55E+04 3.18E+04
Aconitate 5.13E+06 3.71E+06 8.16E+06 5.79E+06 7.30E+06 8.38E+06 7.08E+06 8.50E+06 5.85E+06 4.45E+06 5.09E+06
Adenine 3.14E+04 2.32E+04 3.45E+04 2.77E+04 4.38E+04 3.75E+04 3.63E+04 3.54E+04 3.45E+04 4.83E+04 3.53E+04
Adenosine 2.25E+05 5.50E+04 2.79E+05 1.89E+05 5.35E+04 1.11E+05 8.11E+04 5.98E+04 5.60E+04 4.63E+04 8.21E+04
Alanine/Sarcosine 1.32E+06 1.09E+06 1.14E+06 9.88E+05 1.29E+06 1.38E+06 1.28E+06 1.20E+06 1.26E+06 1.13E+06 1.33E+06
alpha-Ketoglutarate 3.07E+04 2.91E+04 1.67E+04 3.18E+04 3.88E+04 3.83E+04 2.98E+04 6.05E+04 1.94E+04 1.62E+04 2.56E+04
AMP/dGMP 3.22E+05 4.90E+05 3.32E+05 4.97E+05 2.04E+05 1.63E+05 2.07E+05 2.19E+05 1.88E+05 1.14E+05 9.87E+04
Arginine 4.76E+03 3.03E+04 5.52E+03 4.91E+03 3.66E+03 8.55E+03 6.63E+03 2.13E+03 6.53E+03 3.77E+03 7.83E+03
Ascorbate 4.89E+06 2.46E+06 7.26E+06 3.31E+06 4.41E+06 4.60E+06 4.23E+06 1.98E+06 1.23E+06 1.60E+06 4.24E+06
Asparagine 2.86E+04 2.33E+04 3.73E+04 2.88E+04 4.02E+04 4.34E+04 3.28E+04 2.94E+04 4.70E+04 5.35E+04 3.02E+04
Aspartate 6.04E+06 6.24E+06 6.12E+06 6.71E+06 2.37E+06 6.10E+06 4.05E+06 4.07E+06 4.83E+06 2.67E+06 7.02E+06
cAMP 1.49E+04 2.97E+04 4.13E+04 1.39E+04 3.69E+04 3.53E+04 3.25E+04 1.95E+04 3.71E+04 1.26E+04 1.25E+04
CDP-ethanolamine 2.60E+04 2.14E+04 2.47E+04 1.54E+04 1.34E+04 2.73E+04 1.48E+04 1.38E+04 1.67E+04 8.77E+03 2.19E+04
Citraconate 1.30E+05 1.22E+05 2.33E+05 1.97E+05 2.21E+05 1.98E+05 2.66E+05 2.84E+05 1.78E+05 1.58E+05 1.97E+05
Citrate/isocitrate 3.01E+06 1.79E+06 5.46E+06 3.01E+06 5.70E+06 5.84E+06 4.64E+06 5.29E+06 3.72E+06 2.54E+06 2.88E+06
Creatine 1.45E+06 1.40E+06 1.64E+06 1.32E+06 1.65E+06 1.60E+06 1.52E+06 1.23E+06 1.68E+06 1.62E+06 1.61E+06
Cysteine 7.47E+04 7.38E+04 1.07E+05 7.58E+04 2.65E+04 4.12E+04 2.86E+04 2.44E+04 3.81E+04 3.62E+04 1.28E+05
Cystine 4.34E+03 1.00E+02 1.00E+02 8.45E+03 6.83E+04 7.56E+04 6.13E+04 4.51E+04 5.54E+04 5.04E+04 1.85E+04
D-Gluconate 1.07E+04 8.82E+03 1.10E+04 4.97E+03 1.41E+04 2.38E+04 2.67E+04 2.56E+04 1.27E+04 1.55E+04 1.12E+04
D-Glyceraldehdye 3-phosphate 1.39E+04 3.72E+04 2.70E+03 1.88E+03 3.24E+03 3.32E+03 1.72E+04 1.63E+03 1.50E+04 1.74E+04 3.17E+04
Dopamine 1.25E+04 4.17E+03 2.00E+04 2.06E+03 2.19E+04 1.51E+04 1.53E+04 2.55E+03 6.87E+03 5.35E+03 8.68E+03
Fructose 1_6-bisphosphate 2.89E+03 1.20E+04 2.52E+03 1.00E+02 1.00E+02 1.00E+02 2.92E+03 1.00E+02 4.69E+03 4.12E+03 1.04E+04

117
Table 1.21 Continued
Sample Name M2 M8 M13 M16 M18 M44 M45 M46 M64 M69 M70
Fumarate 1.71E+06 1.19E+06 1.24E+06 1.17E+06 7.44E+05 1.31E+06 1.82E+06 1.48E+06 1.09E+06 1.00E+06 1.47E+06
Glucose 1-phosphate 4.88E+03 1.76E+04 8.33E+03 3.52E+03 2.01E+03 4.06E+03 1.45E+03 1.41E+03 2.69E+03 4.94E+03 1.05E+04
Glutamate 9.62E+06 7.52E+06 8.97E+06 8.91E+06 9.43E+06 3.70E+06 6.48E+06 6.11E+06 4.54E+06 4.38E+06 5.92E+06
Glutamate 5.66E+04 1.04E+05 5.02E+04 5.29E+04 2.03E+04 3.28E+04 2.68E+04 2.02E+04 1.33E+04 1.67E+04 1.78E+04
Glutamine 4.24E+06 2.35E+06 2.17E+06 2.67E+06 3.15E+06 4.16E+06 2.83E+06 1.48E+06 2.88E+06 2.91E+06 2.67E+06
Glutathione 8.75E+05 5.51E+05 1.17E+06 6.33E+05 7.32E+05 9.85E+05 6.26E+05 5.07E+05 6.55E+05 5.11E+05 6.56E+05
Glutathione disulfide 3.94E+05 3.22E+05 2.86E+05 2.53E+05 3.41E+05 3.97E+05 3.15E+05 2.42E+05 2.51E+05 2.45E+05 2.23E+05
Glycerate 9.44E+04 2.11E+04 3.40E+04 4.26E+04 1.41E+05 1.45E+05 1.54E+05 1.21E+05 1.43E+05 1.44E+05 7.42E+04
Glycine 5.77E+04 6.97E+04 1.11E+05 4.45E+04 6.00E+04 5.36E+04 1.35E+05 1.20E+05 3.60E+04 9.46E+04 1.01E+05
GMP 9.27E+04 1.23E+05 1.10E+05 1.04E+05 6.92E+04 8.44E+04 9.77E+04 6.07E+04 5.63E+04 4.34E+04 2.42E+04
Guanosine 1.07E+05 7.40E+04 9.82E+04 5.77E+04 9.06E+04 8.67E+04 8.51E+04 8.25E+04 9.13E+04 9.69E+04 9.29E+04
Histidine 3.60E+03 1.07E+04 6.30E+03 1.72E+03 6.60E+03 4.69E+03 6.31E+03 3.89E+03 3.91E+03 2.38E+03 4.08E+03
Homoserine/Threonine 1.50E+05 1.72E+05 1.00E+05 1.15E+05 1.38E+05 1.49E+05 1.15E+05 1.33E+05 9.52E+04 1.29E+05 1.43E+05
Homovanillic acid 1.56E+05 6.87E+04 2.55E+05 1.21E+05 2.17E+05 3.43E+05 2.66E+05 6.48E+05 1.83E+05 1.15E+05 1.51E+05
Hydroxyisocaproic acid 1.24E+05 1.01E+05 1.87E+05 1.02E+05 2.97E+05 1.70E+05 1.98E+05 2.41E+05 1.62E+05 1.03E+05 2.01E+05
Hypoxanthine 1.33E+06 1.46E+06 1.31E+06 1.01E+06 1.49E+06 1.48E+06 6.15E+05 6.24E+05 1.61E+06 1.05E+06 1.85E+06
IMP 9.75E+04 1.33E+05 1.78E+05 1.76E+05 1.27E+05 1.40E+05 1.41E+05 9.92E+04 1.07E+05 7.47E+04 5.55E+04
Inosine 1.07E+06 1.06E+06 1.06E+06 1.16E+06 1.07E+06 1.28E+06 9.84E+05 8.51E+05 1.29E+06 1.28E+06 1.34E+06
Lactate 4.85E+07 4.71E+07 4.43E+07 3.76E+07 6.18E+06 9.70E+06 7.32E+06 6.42E+06 7.38E+06 5.66E+06 2.08E+07
Leucine/Isoleucine 2.25E+05 1.97E+05 1.37E+05 1.34E+05 6.44E+04 1.98E+05 1.69E+05 1.49E+05 1.75E+05 1.35E+05 2.85E+05
Malate 1.77E+05 1.55E+05 1.27E+05 1.37E+05 8.93E+04 1.35E+05 1.97E+05 1.83E+05 1.45E+05 1.31E+05 1.60E+05
Malate 1.05E+07 5.98E+06 5.71E+06 6.24E+06 2.42E+06 4.61E+06 5.45E+06 5.94E+06 5.70E+06 4.04E+06 7.82E+06
Methionine 1.05E+05 8.90E+04 1.74E+05 8.38E+04 1.55E+05 1.37E+05 1.31E+05 1.29E+05 1.50E+05 1.05E+05 1.34E+05
myo-Inositol 4.67E+05 6.58E+05 3.90E+05 3.53E+05 2.35E+04 2.85E+04 2.99E+04 2.89E+04 2.96E+04 2.87E+04 1.05E+05
N-Acetyl-beta-alanine 1.11E+04 9.54E+03 8.29E+03 2.69E+03 4.15E+03 6.17E+03 6.88E+03 9.03E+03 4.16E+03 9.51E+03 1.90E+04
N-Acetylglutamate 7.77E+05 7.70E+05 9.93E+05 1.20E+06 6.21E+05 8.30E+05 7.88E+05 1.05E+06 6.62E+05 5.13E+05 9.25E+05
N-Acetylglutamine 1.12E+04 5.18E+03 9.02E+03 4.48E+03 3.37E+03 6.45E+03 4.93E+03 6.64E+03 5.36E+03 2.05E+03 1.13E+04
N-Carbamoyl-L-aspartate 6.88E+05 1.67E+05 7.08E+05 1.90E+05 4.61E+05 4.09E+05 4.43E+05 5.21E+05 3.81E+05 4.06E+05 6.40E+05

118
Table 1.21 Continued
Sample Name M2 M8 M13 M16 M18 M44 M45 M46 M64 M69 M70
O-Acetyl-L-serine 9.62E+06 7.52E+06 8.97E+06 8.91E+06 9.43E+06 3.70E+06 6.48E+06 6.11E+06 4.54E+06 4.38E+06 5.92E+06
Pantothenate 3.51E+06 3.74E+06 4.14E+06 2.71E+06 4.02E+06 5.08E+06 3.74E+06 4.41E+06 3.72E+06 3.95E+06 4.41E+06
Phenylalanine 1.60E+05 7.35E+04 6.40E+04 4.26E+04 1.66E+05 5.80E+04 8.80E+04 7.06E+04 6.57E+04 8.06E+04 5.79E+04
Proline 3.36E+04 2.83E+04 3.63E+04 3.68E+04 2.95E+04 3.50E+04 2.49E+04 3.36E+04 2.70E+04 2.52E+04 2.63E+04
Pyroglutamic acid 2.39E+06 3.11E+06 1.77E+06 2.09E+06 1.18E+06 1.65E+06 1.21E+06 1.15E+06 1.43E+06 8.44E+05 2.68E+06
Pyruvate 2.10E+05 2.25E+05 7.67E+04 1.25E+05 1.01E+05 1.22E+05 1.51E+05 1.34E+05 9.50E+04 6.13E+04 1.17E+05
Ribose phosphate 2.03E+04 3.43E+04 3.28E+04 1.36E+04 1.44E+04 1.97E+04 1.77E+04 1.20E+04 2.67E+04 2.02E+04 1.78E+04
Serine 3.56E+05 5.30E+05 3.84E+05 4.05E+05 4.78E+05 4.84E+05 5.36E+05 4.24E+05 3.53E+05 3.84E+05 3.20E+05
Succinate/Methylmalonate 1.77E+06 1.37E+06 1.70E+06 1.82E+06 4.09E+05 7.62E+05 1.25E+06 2.92E+06 6.42E+05 2.81E+05 1.22E+06
Sulfolactate 6.55E+04 4.90E+04 2.80E+04 4.76E+04 2.97E+04 3.00E+04 3.90E+04 1.00E+05 3.26E+04 3.57E+04 2.48E+04
Taurine 1.84E+07 1.17E+07 1.52E+07 1.42E+07 1.77E+07 1.79E+07 1.74E+07 1.61E+07 1.75E+07 1.52E+07 1.38E+07
Trehalose/sucrose 9.41E+03 3.61E+04 4.51E+03 1.19E+04 2.99E+03 4.26E+03 1.10E+04 5.69E+03 7.98E+03 2.19E+03 4.65E+03
Tryptophan 3.39E+04 1.81E+04 1.09E+04 7.77E+03 2.70E+04 3.29E+04 2.43E+04 1.71E+04 2.53E+04 1.61E+04 3.18E+04
Tyrosine 1.09E+05 6.09E+04 8.98E+04 7.38E+04 1.04E+05 8.72E+04 4.46E+04 4.20E+04 1.06E+05 8.22E+04 6.93E+04
UDP-glucose 9.66E+04 6.43E+04 1.62E+05 9.03E+04 1.13E+05 1.65E+05 1.56E+05 1.23E+05 1.14E+05 9.98E+04 1.20E+05
UDP-N-acetylglucosamine 8.65E+04 5.89E+04 9.89E+04 8.33E+04 8.93E+04 1.12E+05 1.32E+05 1.07E+05 8.71E+04 8.54E+04 8.38E+04
UMP 2.51E+04 2.07E+04 1.96E+04 3.88E+04 1.54E+04 1.44E+04 2.49E+04 1.84E+04 3.09E+04 6.01E+03 5.68E+03
Uracil 3.62E+05 2.78E+05 3.98E+05 4.36E+05 4.96E+05 6.42E+05 6.08E+05 5.95E+05 4.72E+05 4.15E+05 4.52E+05
Uric acid 1.35E+04 1.69E+04 2.44E+04 1.37E+04 1.90E+04 8.87E+03 1.73E+04 1.15E+04 7.55E+03 7.92E+03 6.24E+03
Uridine 1.06E+04 7.71E+03 1.70E+04 6.10E+03 1.23E+04 1.12E+04 1.32E+04 1.30E+04 1.27E+04 8.85E+03 9.64E+03
Valine 2.18E+05 2.24E+05 1.95E+05 1.69E+05 1.86E+05 2.34E+05 1.87E+05 1.39E+05 1.62E+05 1.53E+05 1.92E+05
Xanthine 4.21E+05 3.29E+05 5.54E+05 3.92E+05 4.22E+05 4.95E+05 5.61E+05 4.61E+05 3.82E+05 2.34E+05 4.57E+05
Xanthurenic acid 2.35E+04 1.76E+04 1.95E+04 1.80E+04 3.97E+04 2.59E+04 1.21E+04 2.72E+04 2.06E+04 1.12E+04 3.07E+04

119
Table 1.22 Raw Data of Control Mice from NAc
Sample Name M3 M5 M10 M12 M14 M19 M26 M31 M32 M38 M40
2-Aminoadipate 2.43E+04 2.16E+04 1.09E+04 2.33E+04 3.44E+04 3.10E+04 1.65E+04 2.73E+04 2.12E+04 3.72E+04 3.80E+04
2-Hydroxy-2-methylsuccinate 3.20E+06 4.13E+06 1.43E+06 3.16E+06 1.26E+06 2.55E+06 1.57E+06 4.53E+06 4.25E+06 4.18E+06 4.89E+06
2-Isopropylmalate 4.02E+04 5.59E+04 4.74E+04 2.95E+04 5.29E+04 3.77E+04 3.11E+04 5.79E+04 2.58E+04 2.65E+04 3.74E+04
3-Phosphoglycerate 1.42E+04 1.09E+04 8.35E+03 2.37E+04 1.33E+04 3.77E+03 6.30E+03 2.51E+04 3.49E+04 2.12E+04 1.98E+04
3_4-Dihydroxyphenylacetate 2.29E+04 5.53E+04 2.44E+04 3.20E+04 2.03E+04 2.85E+04 2.92E+04 3.22E+05 3.48E+04 3.99E+04 1.76E+04
4-Aminobutyrate 3.45E+06 2.32E+06 1.08E+06 2.14E+06 1.52E+06 2.57E+06 1.52E+06 3.55E+06 3.66E+06 3.40E+06 4.81E+06
5-Hydroxyindoleacetic acid 2.19E+04 2.78E+04 9.33E+03 1.23E+04 8.98E+03 1.97E+04 6.49E+03 3.60E+04 2.63E+04 3.81E+04 3.40E+04
Aconitate 3.80E+06 7.04E+06 2.95E+06 7.11E+06 4.16E+06 5.08E+06 4.44E+06 6.16E+06 7.24E+06 5.88E+06 7.88E+06
Adenine 2.08E+04 2.35E+04 1.66E+04 3.41E+04 2.48E+04 3.21E+04 2.23E+04 3.06E+04 4.92E+04 2.75E+04 3.99E+04
Adenosine 1.03E+05 1.85E+05 1.71E+05 2.31E+05 2.89E+04 6.10E+04 1.60E+05 1.77E+05 2.47E+05 2.34E+05 1.87E+05
Alanine/Sarcosine 1.10E+06 1.20E+06 7.81E+05 1.02E+06 1.16E+06 1.00E+06 9.76E+05 1.40E+06 1.31E+06 1.26E+06 1.47E+06
alpha-Ketoglutarate 1.31E+04 1.63E+04 2.94E+04 3.40E+04 2.00E+04 2.67E+04 1.95E+04 1.83E+04 3.95E+04 2.97E+04 2.74E+04
AMP/dGMP 2.57E+05 1.93E+05 6.01E+04 9.03E+04 9.34E+04 6.54E+04 5.27E+04 7.20E+04 9.96E+04 1.11E+05 1.72E+05
Arginine 4.91E+03 3.32E+03 2.79E+03 8.76E+02 2.15E+03 2.93E+03 4.55E+03 7.88E+03 7.55E+03 8.21E+03 7.51E+03
Ascorbate 1.84E+06 4.50E+06 1.15E+06 3.53E+04 1.60E+06 2.13E+06 1.30E+06 6.03E+06 5.75E+06 5.29E+06 3.33E+06
Asparagine 2.07E+04 2.52E+04 1.35E+04 3.74E+04 2.30E+04 5.35E+04 2.10E+04 3.64E+04 4.33E+04 5.34E+04 3.57E+04
Aspartate 6.53E+06 6.42E+06 3.03E+06 4.30E+06 1.13E+06 4.29E+06 4.98E+06 8.20E+06 7.44E+06 7.21E+06 9.47E+06
cAMP 1.04E+04 2.93E+04 2.02E+04 2.97E+04 4.17E+03 2.35E+04 2.33E+04 3.05E+04 3.61E+04 2.70E+04 2.10E+04
CDP-ethanolamine 2.06E+04 2.48E+04 1.29E+04 2.11E+04 4.02E+03 2.63E+04 1.44E+04 2.94E+04 3.19E+04 2.48E+04 2.29E+04
Citraconate 1.53E+05 2.22E+05 1.05E+05 2.62E+05 1.21E+05 1.76E+05 1.58E+05 2.00E+05 2.45E+05 2.22E+05 2.60E+05
Citrate/isocitrate 1.57E+06 4.33E+06 1.58E+06 5.01E+06 2.20E+06 3.68E+06 2.04E+06 3.17E+06 5.19E+06 2.55E+06 4.60E+06
Creatine 1.49E+06 1.53E+06 9.77E+05 1.19E+06 1.54E+06 1.37E+06 1.28E+06 1.67E+06 1.77E+06 1.58E+06 1.85E+06
Cysteine 8.11E+04 9.82E+04 3.54E+04 3.72E+04 1.95E+04 3.67E+04 4.70E+04 1.58E+05 1.47E+05 1.47E+05 1.58E+05
Cystine 4.70E+03 1.00E+02 2.46E+03 3.76E+03 3.08E+04 7.94E+04 6.26E+03 1.00E+02 1.00E+02 2.22E+03 1.05E+04
D-Gluconate 3.87E+03 8.62E+03 6.67E+03 5.02E+03 7.61E+03 1.41E+04 1.03E+04 1.17E+04 1.03E+04 6.82E+03 1.35E+04
D-Glyceraldehdye 3-phosphate 3.77E+04 1.46E+04 2.12E+03 4.45E+03 1.00E+02 5.95E+03 1.91E+03 2.06E+04 1.12E+04 4.18E+04 3.62E+04
Dopamine 2.54E+03 9.30E+03 3.20E+03 1.24E+04 7.82E+03 1.14E+04 6.93E+03 7.19E+03 1.84E+04 1.08E+04 1.45E+03
Fructose 1_6-bisphosphate 4.05E+03 2.72E+03 1.00E+02 1.00E+02 1.00E+02 5.86E+03 1.00E+02 3.91E+03 4.10E+03 1.35E+04 1.85E+04

120
Table 1.22 Continued
Sample Name M3 M5 M10 M12 M14 M19 M26 M31 M32 M38 M40
Fumarate 9.62E+05 1.25E+06 3.24E+05 6.63E+05 4.06E+05 1.04E+06 2.91E+05 1.57E+06 1.34E+06 1.88E+06 1.59E+06
Glucose 1-phosphate 9.64E+03 1.16E+04 9.74E+02 1.87E+03 1.10E+03 8.70E+02 1.82E+03 9.88E+03 1.33E+04 7.15E+03 7.50E+03
Glutamate 5.31E+06 8.71E+06 5.32E+06 7.19E+06 1.32E+07 3.34E+06 4.84E+06 8.07E+06 8.94E+06 8.72E+06 7.60E+06
Glutamate 5.02E+04 8.23E+04 7.27E+04 4.51E+04 3.24E+04 2.22E+04 3.01E+04 1.33E+05 1.25E+05 1.06E+05 8.19E+04
Glutamine 2.46E+06 2.52E+06 2.36E+06 2.19E+06 3.71E+06 2.57E+06 2.05E+06 2.93E+06 2.80E+06 2.61E+06 3.15E+06
Glutathione 5.47E+05 9.38E+05 3.60E+05 4.84E+05 2.09E+05 4.66E+05 2.97E+05 1.13E+06 1.09E+06 8.95E+05 6.75E+05
Glutathione disulfide 2.25E+05 3.30E+05 2.06E+05 3.59E+05 1.86E+05 3.21E+05 2.44E+05 3.12E+05 2.92E+05 2.81E+05 3.61E+05
Glycerate 3.33E+04 3.11E+04 3.62E+04 3.91E+04 1.78E+05 1.44E+05 3.48E+04 4.57E+04 4.39E+04 2.47E+04 4.86E+04
Glycine 1.34E+05 7.04E+04 7.06E+04 1.14E+05 2.78E+04 1.22E+04 1.96E+04 1.34E+05 8.74E+04 1.38E+05 2.05E+05
GMP 8.54E+04 1.06E+05 1.63E+04 3.71E+04 1.87E+04 5.56E+04 2.05E+04 4.63E+04 2.80E+04 7.38E+04 6.44E+04
Guanosine 8.13E+04 1.00E+05 4.83E+04 9.86E+04 5.72E+04 6.51E+04 7.73E+04 1.39E+05 1.42E+05 1.08E+05 1.31E+05
Histidine 2.74E+03 2.19E+03 2.72E+03 1.02E+04 8.88E+02 4.23E+03 2.79E+03 8.91E+03 9.40E+03 2.67E+03 3.73E+03
Homoserine/Threonine 1.31E+05 1.51E+05 1.07E+05 1.07E+05 1.53E+05 1.58E+05 9.88E+04 1.39E+05 1.52E+05 1.64E+05 1.85E+05
Homovanillic acid 8.24E+04 1.75E+05 9.16E+04 1.33E+05 7.63E+04 1.88E+05 1.17E+05 1.81E+05 1.73E+05 1.60E+05 1.80E+05
Hydroxyisocaproic acid 4.89E+05 2.59E+05 2.54E+05 1.62E+05 1.40E+05 1.60E+05 1.48E+05 1.26E+05 1.48E+05 1.72E+05 2.38E+05
Hypoxanthine 1.40E+06 1.43E+06 8.31E+05 1.12E+06 6.62E+05 1.49E+06 8.68E+05 1.88E+06 1.71E+06 2.26E+06 2.37E+06
IMP 8.46E+04 1.39E+05 3.13E+04 6.54E+04 4.18E+04 8.06E+04 4.25E+04 8.37E+04 4.36E+04 5.92E+04 1.35E+05
Inosine 9.70E+05 1.05E+06 6.05E+05 7.07E+05 5.27E+05 1.18E+06 7.88E+05 1.64E+06 1.29E+06 1.00E+06 1.54E+06
Lactate 3.83E+07 3.45E+07 3.57E+07 3.69E+07 3.66E+06 6.33E+06 3.69E+07 5.23E+07 5.25E+07 4.55E+07 4.71E+07
Leucine/Isoleucine 1.46E+05 1.75E+05 1.04E+05 1.73E+05 5.46E+04 1.03E+05 1.06E+05 2.64E+05 3.22E+05 2.40E+05 2.55E+05
Malate 2.00E+05 1.35E+05 8.56E+04 1.26E+05 8.10E+04 1.20E+05 9.63E+04 1.98E+05 1.73E+05 1.81E+05 1.45E+05
Malate 5.10E+06 4.27E+06 9.36E+05 2.48E+06 8.47E+05 3.34E+06 9.23E+05 9.07E+06 6.81E+06 6.96E+06 8.02E+06
Methionine 9.00E+04 2.17E+05 9.61E+04 1.25E+05 6.06E+04 1.37E+05 6.90E+04 2.26E+05 1.57E+05 1.33E+05 1.36E+05
myo-Inositol 3.34E+05 3.15E+05 3.44E+05 3.34E+05 1.51E+04 1.64E+04 3.32E+05 5.13E+05 4.69E+05 4.73E+05 3.96E+05
N-Acetyl-beta-alanine 1.20E+04 8.92E+03 4.18E+03 4.35E+03 1.58E+03 6.55E+03 2.16E+03 1.71E+04 1.28E+04 1.02E+04 2.27E+04
N-Acetylglutamate 7.91E+05 8.88E+05 2.81E+05 4.44E+05 2.95E+05 4.95E+05 2.94E+05 9.17E+05 8.50E+05 8.59E+05 1.36E+06
N-Acetylglutamine 7.22E+03 1.38E+04 1.61E+03 7.47E+03 4.81E+03 2.23E+03 3.51E+03 1.70E+04 1.20E+04 1.15E+04 1.61E+04
N-Carbamoyl-L-aspartate 5.14E+05 3.72E+05 3.03E+05 5.57E+05 1.24E+05 5.11E+05 2.80E+05 5.82E+05 6.44E+05 5.87E+05 5.43E+05

121
Table 1.22 Continued
Sample Name M3 M5 M10 M12 M14 M19 M26 M31 M32 M38 M40
O-Acetyl-L-serine 5.31E+06 8.71E+06 5.32E+06 7.19E+06 1.32E+07 3.34E+06 4.84E+06 8.07E+06 8.94E+06 8.72E+06 7.60E+06
Pantothenate 2.92E+06 4.72E+06 2.36E+06 3.70E+06 2.75E+06 3.52E+06 2.11E+06 4.96E+06 5.15E+06 4.74E+06 5.85E+06
Phenylalanine 9.86E+04 8.27E+04 4.33E+04 7.50E+04 6.34E+04 8.87E+04 5.66E+04 1.07E+05 9.24E+04 9.25E+04 8.21E+04
Proline 3.21E+04 3.17E+04 2.01E+04 3.13E+04 3.06E+04 2.62E+04 2.18E+04 4.30E+04 4.38E+04 3.73E+04 3.93E+04
Pyroglutamic acid 1.56E+06 2.34E+06 1.69E+06 2.47E+06 6.29E+05 1.44E+06 1.93E+06 3.23E+06 2.87E+06 3.60E+06 4.33E+06
Pyruvate 7.58E+04 1.32E+05 1.99E+05 9.60E+04 9.74E+04 9.20E+04 8.55E+04 2.95E+05 1.77E+05 1.57E+05 1.07E+05
Ribose phosphate 4.52E+04 3.42E+04 1.62E+04 2.80E+04 7.64E+03 8.42E+03 1.11E+04 3.44E+04 4.82E+04 2.78E+04 3.49E+04
Serine 3.82E+05 4.53E+05 3.65E+05 3.49E+05 3.54E+05 3.74E+05 3.47E+05 5.53E+05 4.75E+05 4.52E+05 4.29E+05
Succinate/Methylmalonate 7.10E+05 1.45E+06 8.92E+05 1.12E+06 4.07E+05 5.22E+05 1.01E+06 2.06E+06 1.17E+06 1.81E+06 1.37E+06
Sulfolactate 5.05E+04 4.42E+04 4.65E+04 4.99E+04 3.64E+04 2.66E+04 2.66E+04 2.47E+04 4.51E+04 3.78E+04 3.63E+04
Taurine 1.31E+07 1.44E+07 1.08E+07 1.30E+07 1.62E+07 1.50E+07 1.23E+07 1.70E+07 1.65E+07 1.44E+07 1.81E+07
Trehalose/sucrose 2.02E+04 1.51E+04 4.78E+04 1.69E+04 4.44E+03 4.32E+03 1.52E+04 1.36E+04 1.31E+04 6.07E+03 1.11E+04
Tryptophan 1.54E+04 2.64E+04 6.84E+03 1.04E+04 1.09E+04 2.42E+04 1.09E+04 2.83E+04 2.07E+04 1.75E+04 2.37E+04
Tyrosine 9.11E+04 9.47E+04 4.86E+04 7.13E+04 4.39E+04 1.02E+05 5.18E+04 1.28E+05 7.46E+04 9.79E+04 8.49E+04
UDP-glucose 1.05E+05 1.55E+05 5.90E+04 1.10E+05 5.92E+04 9.34E+04 6.37E+04 1.68E+05 1.42E+05 1.52E+05 1.43E+05
UDP-N-acetylglucosamine 5.38E+04 1.01E+05 4.62E+04 6.80E+04 4.32E+04 8.25E+04 4.34E+04 1.27E+05 1.07E+05 9.75E+04 1.15E+05
UMP 1.27E+04 1.40E+04 4.27E+03 3.99E+03 4.94E+03 5.09E+03 3.96E+03 1.00E+02 4.22E+03 7.09E+03 6.31E+03
Uracil 3.05E+05 3.59E+05 2.16E+05 3.97E+05 4.18E+05 4.70E+05 2.69E+05 4.75E+05 5.59E+05 5.35E+05 7.07E+05
Uric acid 1.89E+04 1.96E+04 1.43E+04 1.45E+04 1.48E+04 1.18E+04 1.46E+04 3.70E+04 1.60E+04 2.61E+04 1.72E+04
Uridine 8.38E+03 7.48E+03 4.52E+03 6.41E+03 5.38E+03 7.58E+03 6.00E+03 1.30E+04 8.84E+03 7.53E+03 8.57E+03
Valine 1.65E+05 1.90E+05 1.23E+05 1.29E+05 1.06E+05 1.52E+05 1.36E+05 2.81E+05 2.48E+05 2.63E+05 2.34E+05
Xanthine 4.65E+05 4.88E+05 3.33E+05 5.85E+05 3.11E+05 4.30E+05 3.81E+05 8.47E+05 5.56E+05 5.74E+05 7.00E+05
Xanthurenic acid 4.58E+04 3.58E+04 1.22E+04 2.34E+04 2.27E+04 2.05E+04 1.57E+04 4.29E+04 1.78E+04 5.37E+04 4.51E+04

122
Table 1.23 Raw Data of Susceptible Mice from NAc
Sample Name M1 M4 M15 M17 M20 M22 M23 M24 M25 M27 M28
2-Aminoadipate 3.18E+04 2.26E+04 2.89E+04 2.29E+04 1.87E+04 2.40E+04 3.00E+04 2.25E+04 2.30E+04 2.79E+04 2.58E+04
2-Hydroxy-2-methylsuccinate 5.47E+06 3.51E+06 3.64E+06 2.43E+06 2.97E+06 3.53E+06 3.69E+06 3.74E+06 3.75E+06 4.57E+06 3.27E+06
2-Isopropylmalate 3.02E+04 4.45E+04 6.37E+04 7.37E+04 5.09E+04 5.24E+04 6.63E+04 3.96E+04 6.06E+04 5.02E+04 5.11E+04
3-Phosphoglycerate 1.04E+04 2.58E+04 7.23E+03 4.55E+04 7.45E+03 6.13E+03 1.48E+04 1.56E+04 2.76E+03 1.36E+04 2.63E+03
3_4-Dihydroxyphenylacetate 1.99E+04 2.86E+04 3.57E+04 2.93E+04 1.58E+05 2.59E+04 2.89E+04 5.42E+04 3.72E+04 5.02E+04 7.70E+04
4-Aminobutyrate 1.51E+06 2.39E+06 1.55E+06 2.90E+06 1.61E+06 2.03E+06 2.13E+06 1.68E+06 2.64E+06 2.02E+06 1.93E+06
5-Hydroxyindoleacetic acid 2.02E+04 1.51E+04 1.76E+04 2.35E+04 3.12E+04 4.23E+04 3.52E+04 1.74E+04 2.25E+04 9.55E+03 3.13E+04
Aconitate 9.25E+06 6.53E+06 6.39E+06 3.92E+06 5.17E+06 6.50E+06 6.43E+06 6.64E+06 6.35E+06 6.99E+06 7.05E+06
Adenine 2.43E+04 3.70E+04 3.01E+04 2.15E+04 2.01E+04 2.29E+04 2.77E+04 3.00E+04 3.72E+04 4.56E+04 3.58E+04
Adenosine 1.32E+05 4.66E+05 1.94E+05 9.63E+04 1.04E+05 8.88E+04 1.92E+05 1.59E+05 1.37E+05 3.45E+05 1.93E+05
Alanine/Sarcosine 1.08E+06 1.14E+06 1.12E+06 8.58E+05 9.79E+05 1.15E+06 1.00E+06 1.18E+06 1.32E+06 1.34E+06 1.19E+06
alpha-Ketoglutarate 4.32E+04 2.71E+04 4.13E+04 1.51E+04 3.36E+04 3.02E+04 4.78E+04 3.47E+04 2.35E+04 3.11E+04 2.27E+04
AMP/dGMP 8.09E+05 3.30E+05 5.27E+05 2.67E+05 5.94E+05 1.25E+06 1.49E+05 1.46E+05 2.85E+05 1.35E+05 1.35E+05
Arginine 5.45E+03 3.78E+03 3.71E+03 2.91E+03 4.95E+03 3.74E+03 4.63E+03 5.63E+03 3.27E+03 4.93E+03 1.06E+04
Ascorbate 4.83E+06 1.81E+05 1.43E+06 2.20E+06 3.61E+06 2.43E+06 4.78E+06 1.55E+06 4.85E+06 1.49E+06 3.61E+06
Asparagine 1.42E+04 3.19E+04 2.95E+04 4.41E+04 2.20E+04 2.75E+04 6.96E+04 4.06E+04 4.53E+04 3.08E+04 3.78E+04
Aspartate 6.65E+06 6.03E+06 5.78E+06 4.71E+06 4.72E+06 6.22E+06 5.66E+06 6.04E+06 6.18E+06 6.60E+06 6.29E+06
cAMP 2.37E+04 3.85E+04 2.02E+04 2.18E+04 3.16E+04 2.80E+04 3.66E+04 2.67E+04 2.57E+04 2.48E+04 3.21E+04
CDP-ethanolamine 2.43E+04 2.77E+04 2.52E+04 2.03E+04 1.66E+04 2.59E+04 2.65E+04 2.38E+04 2.45E+04 2.53E+04 2.64E+04
Citraconate 2.59E+05 2.26E+05 2.34E+05 1.25E+05 1.79E+05 2.12E+05 1.93E+05 1.88E+05 2.22E+05 2.01E+05 2.24E+05
Citrate/isocitrate 5.16E+06 3.04E+06 3.65E+06 1.77E+06 2.51E+06 2.82E+06 3.54E+06 2.53E+06 3.03E+06 3.62E+06 3.29E+06
Creatine 1.37E+06 1.56E+06 1.33E+06 1.03E+06 1.11E+06 1.67E+06 1.25E+06 1.58E+06 1.64E+06 1.85E+06 1.44E+06
Cysteine 1.21E+05 3.97E+04 7.07E+04 4.93E+04 7.11E+04 1.14E+05 7.78E+04 4.48E+04 1.11E+05 1.26E+05 1.11E+05
Cystine 1.00E+02 1.52E+03 1.00E+02 1.00E+02 2.47E+03 3.79E+03 1.00E+02 2.19E+04 1.00E+02 5.20E+03 3.71E+03
D-Gluconate 4.76E+03 8.94E+03 7.23E+03 7.30E+03 8.82E+03 7.64E+03 1.04E+04 9.78E+03 8.25E+03 8.76E+03 1.07E+04
D-Glyceraldehdye 3-phosphate 4.66E+03 5.46E+03 2.27E+03 2.88E+04 9.93E+03 2.58E+04 9.81E+03 2.43E+03 1.12E+04 2.52E+03 2.09E+03
Dopamine 2.01E+03 2.42E+04 5.54E+03 3.78E+03 1.64E+04 2.39E+03 1.21E+04 1.02E+04 8.76E+03 1.21E+04 1.48E+04
Fructose 1_6-bisphosphate 1.00E+02 3.33E+03 2.90E+03 1.30E+04 2.64E+03 4.53E+03 2.55E+03 1.00E+02 4.15E+03 3.38E+03 1.00E+02

123
Table 1.23 Continued
Sample Name M1 M4 M15 M17 M20 M22 M23 M24 M25 M27 M28
Fumarate 7.71E+05 6.69E+05 7.95E+05 7.30E+05 9.17E+05 9.52E+05 1.32E+06 1.20E+06 1.55E+06 1.56E+06 7.15E+05
Glucose 1-phosphate 7.03E+03 1.11E+04 3.58E+03 2.24E+04 1.75E+03 1.96E+04 9.44E+03 5.20E+03 8.92E+03 8.28E+03 2.00E+03
Glutamate 1.19E+07 8.07E+06 8.81E+06 4.21E+06 6.15E+06 7.51E+06 7.67E+06 8.69E+06 6.71E+06 8.59E+06 9.22E+06
Glutamate 6.01E+04 6.57E+04 5.96E+04 4.93E+04 2.42E+05 4.58E+04 7.03E+04 8.45E+04 5.02E+04 3.15E+04 5.95E+04
Glutamine 1.84E+06 2.71E+06 4.00E+06 1.89E+06 2.08E+06 2.27E+06 3.17E+06 2.64E+06 3.37E+06 3.40E+06 2.91E+06
Glutathione 7.50E+05 6.90E+05 7.32E+05 3.92E+05 5.69E+05 5.53E+05 9.18E+05 4.81E+05 1.13E+06 1.07E+06 1.08E+06
Glutathione disulfide 1.63E+05 4.89E+05 3.85E+05 2.98E+05 1.80E+05 3.22E+05 4.61E+05 3.83E+05 3.35E+05 2.99E+05 2.07E+05
Glycerate 3.55E+04 4.74E+04 4.27E+04 4.92E+04 4.54E+04 3.93E+04 4.92E+04 4.68E+04 3.69E+04 6.03E+04 3.35E+04
Glycine 1.33E+05 7.58E+04 4.36E+04 1.10E+05 1.41E+05 1.35E+05 1.32E+05 1.11E+05 6.68E+04 7.12E+04 6.63E+04
GMP 1.44E+05 9.07E+04 1.05E+05 7.67E+04 1.03E+05 1.70E+05 4.97E+04 4.46E+04 1.46E+05 4.37E+04 9.55E+04
Guanosine 5.11E+04 9.02E+04 6.05E+04 7.23E+04 3.68E+04 5.52E+04 9.65E+04 9.81E+04 8.07E+04 1.14E+05 1.08E+05
Histidine 3.45E+03 4.36E+03 5.01E+03 4.67E+03 2.70E+03 2.41E+03 2.88E+03 5.57E+03 7.65E+03 4.71E+03 7.00E+03
Homoserine/Threonine 1.13E+05 1.77E+05 1.26E+05 1.23E+05 1.23E+05 1.07E+05 1.49E+05 1.30E+05 1.60E+05 1.19E+05 1.34E+05
Homovanillic acid 1.04E+05 1.68E+05 1.66E+05 7.67E+04 1.85E+05 1.21E+05 2.29E+05 1.59E+05 1.69E+05 2.09E+05 2.02E+05
Hydroxyisocaproic acid 1.94E+05 1.11E+05 1.87E+05 1.88E+05 1.88E+05 2.65E+05 3.43E+05 1.17E+05 1.99E+05 2.98E+05 1.79E+05
Hypoxanthine 1.31E+06 1.41E+06 9.76E+05 1.18E+06 1.08E+06 1.31E+06 1.43E+06 1.46E+06 1.82E+06 1.49E+06 1.52E+06
IMP 1.68E+05 1.19E+05 1.65E+05 7.42E+04 2.17E+05 4.50E+05 8.42E+04 1.01E+05 2.87E+05 8.06E+04 1.99E+05
Inosine 7.36E+05 7.70E+05 6.50E+05 6.84E+05 7.46E+05 9.31E+05 1.18E+06 1.26E+06 1.24E+06 1.02E+06 1.18E+06
Lactate 4.34E+07 4.33E+07 4.80E+07 3.58E+07 3.71E+07 3.51E+07 4.43E+07 4.85E+07 4.63E+07 4.56E+07 4.59E+07
Leucine/Isoleucine 2.02E+05 1.51E+05 1.15E+05 1.08E+05 1.60E+05 1.13E+05 1.79E+05 2.26E+05 1.81E+05 2.37E+05 1.62E+05
Malate 1.34E+05 1.19E+05 1.46E+05 1.22E+05 1.42E+05 1.24E+05 1.76E+05 1.39E+05 1.52E+05 1.70E+05 1.10E+05
Malate 3.83E+06 4.34E+06 5.54E+06 4.69E+06 3.87E+06 5.27E+06 6.08E+06 4.69E+06 7.02E+06 8.10E+06 3.34E+06
Methionine 6.05E+04 1.11E+05 1.92E+05 1.17E+05 7.56E+04 1.48E+05 1.24E+05 1.30E+05 1.57E+05 1.67E+05 1.59E+05
myo-Inositol 4.10E+05 4.41E+05 4.33E+05 3.11E+05 3.26E+05 2.84E+05 3.80E+05 3.56E+05 3.96E+05 3.91E+05 3.53E+05
N-Acetyl-beta-alanine 7.91E+03 5.06E+03 1.00E+04 7.93E+03 9.32E+03 5.55E+03 1.01E+04 7.10E+03 5.68E+03 6.85E+03 9.28E+03
N-Acetylglutamate 1.55E+06 7.19E+05 6.17E+05 5.80E+05 6.43E+05 7.53E+05 6.14E+05 6.82E+05 7.09E+05 5.07E+05 5.56E+05
N-Acetylglutamine 1.00E+04 1.12E+04 5.88E+03 8.37E+03 8.37E+03 1.04E+04 8.03E+03 1.36E+04 1.92E+04 1.03E+04 9.39E+03
N-Carbamoyl-L-aspartate 5.03E+05 3.24E+05 3.71E+05 4.76E+05 3.93E+05 6.35E+05 6.00E+05 4.99E+05 6.64E+05 2.28E+05 3.77E+05
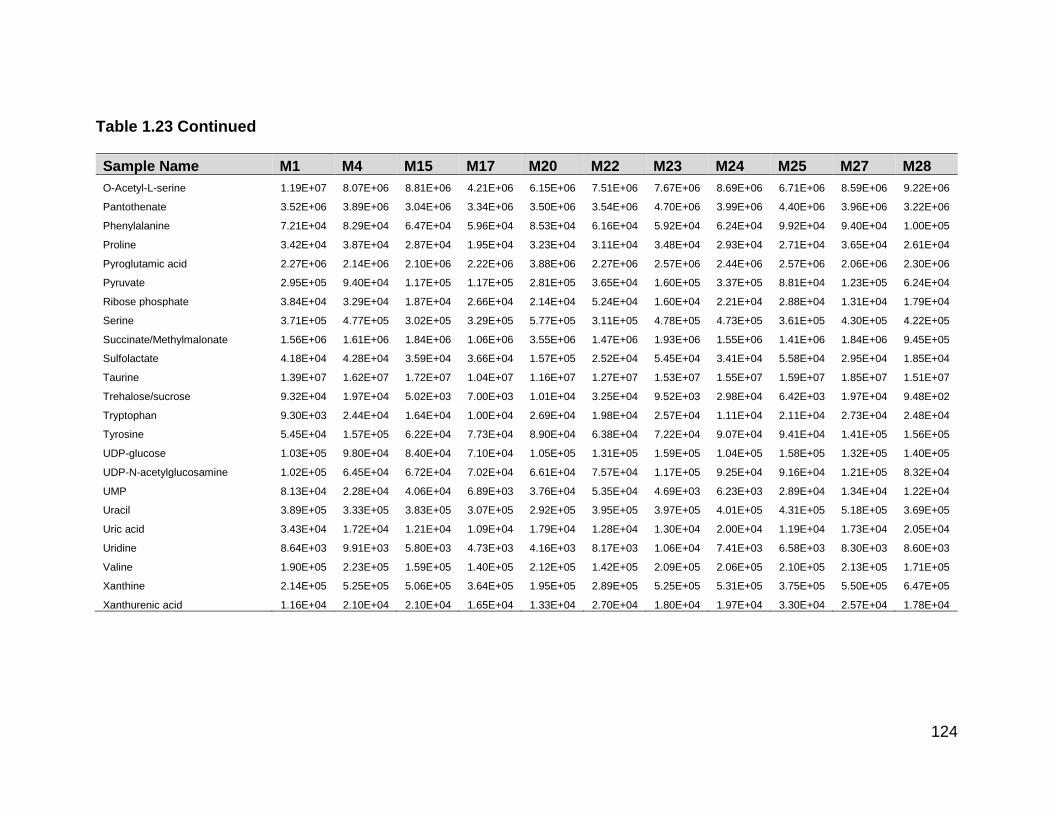
124
Table 1.23 Continued
Sample Name M1 M4 M15 M17 M20 M22 M23 M24 M25 M27 M28
O-Acetyl-L-serine 1.19E+07 8.07E+06 8.81E+06 4.21E+06 6.15E+06 7.51E+06 7.67E+06 8.69E+06 6.71E+06 8.59E+06 9.22E+06
Pantothenate 3.52E+06 3.89E+06 3.04E+06 3.34E+06 3.50E+06 3.54E+06 4.70E+06 3.99E+06 4.40E+06 3.96E+06 3.22E+06
Phenylalanine 7.21E+04 8.29E+04 6.47E+04 5.96E+04 8.53E+04 6.16E+04 5.92E+04 6.24E+04 9.92E+04 9.40E+04 1.00E+05
Proline 3.42E+04 3.87E+04 2.87E+04 1.95E+04 3.23E+04 3.11E+04 3.48E+04 2.93E+04 2.71E+04 3.65E+04 2.61E+04
Pyroglutamic acid 2.27E+06 2.14E+06 2.10E+06 2.22E+06 3.88E+06 2.27E+06 2.57E+06 2.44E+06 2.57E+06 2.06E+06 2.30E+06
Pyruvate 2.95E+05 9.40E+04 1.17E+05 1.17E+05 2.81E+05 3.65E+04 1.60E+05 3.37E+05 8.81E+04 1.23E+05 6.24E+04
Ribose phosphate 3.84E+04 3.29E+04 1.87E+04 2.66E+04 2.14E+04 5.24E+04 1.60E+04 2.21E+04 2.88E+04 1.31E+04 1.79E+04
Serine 3.71E+05 4.77E+05 3.02E+05 3.29E+05 5.77E+05 3.11E+05 4.78E+05 4.73E+05 3.61E+05 4.30E+05 4.22E+05
Succinate/Methylmalonate 1.56E+06 1.61E+06 1.84E+06 1.06E+06 3.55E+06 1.47E+06 1.93E+06 1.55E+06 1.41E+06 1.84E+06 9.45E+05
Sulfolactate 4.18E+04 4.28E+04 3.59E+04 3.66E+04 1.57E+05 2.52E+04 5.45E+04 3.41E+04 5.58E+04 2.95E+04 1.85E+04
Taurine 1.39E+07 1.62E+07 1.72E+07 1.04E+07 1.16E+07 1.27E+07 1.53E+07 1.55E+07 1.59E+07 1.85E+07 1.51E+07
Trehalose/sucrose 9.32E+04 1.97E+04 5.02E+03 7.00E+03 1.01E+04 3.25E+04 9.52E+03 2.98E+04 6.42E+03 1.97E+04 9.48E+02
Tryptophan 9.30E+03 2.44E+04 1.64E+04 1.00E+04 2.69E+04 1.98E+04 2.57E+04 1.11E+04 2.11E+04 2.73E+04 2.48E+04
Tyrosine 5.45E+04 1.57E+05 6.22E+04 7.73E+04 8.90E+04 6.38E+04 7.22E+04 9.07E+04 9.41E+04 1.41E+05 1.56E+05
UDP-glucose 1.03E+05 9.80E+04 8.40E+04 7.10E+04 1.05E+05 1.31E+05 1.59E+05 1.04E+05 1.58E+05 1.32E+05 1.40E+05
UDP-N-acetylglucosamine 1.02E+05 6.45E+04 6.72E+04 7.02E+04 6.61E+04 7.57E+04 1.17E+05 9.25E+04 9.16E+04 1.21E+05 8.32E+04
UMP 8.13E+04 2.28E+04 4.06E+04 6.89E+03 3.76E+04 5.35E+04 4.69E+03 6.23E+03 2.89E+04 1.34E+04 1.22E+04
Uracil 3.89E+05 3.33E+05 3.83E+05 3.07E+05 2.92E+05 3.95E+05 3.97E+05 4.01E+05 4.31E+05 5.18E+05 3.69E+05
Uric acid 3.43E+04 1.72E+04 1.21E+04 1.09E+04 1.79E+04 1.28E+04 1.30E+04 2.00E+04 1.19E+04 1.73E+04 2.05E+04
Uridine 8.64E+03 9.91E+03 5.80E+03 4.73E+03 4.16E+03 8.17E+03 1.06E+04 7.41E+03 6.58E+03 8.30E+03 8.60E+03
Valine 1.90E+05 2.23E+05 1.59E+05 1.40E+05 2.12E+05 1.42E+05 2.09E+05 2.06E+05 2.10E+05 2.13E+05 1.71E+05
Xanthine 2.14E+05 5.25E+05 5.06E+05 3.64E+05 1.95E+05 2.89E+05 5.25E+05 5.31E+05 3.75E+05 5.50E+05 6.47E+05
Xanthurenic acid 1.16E+04 2.10E+04 2.10E+04 1.65E+04 1.33E+04 2.70E+04 1.80E+04 1.97E+04 3.30E+04 2.57E+04 1.78E+04

125
Table 1.24 Raw Data of Resilient Mice from vmPFC
Sample Name M2 M8 M13 M16 M18 M44 M45 M46 M64 M70
2-Aminoadipate 5.54E+03 1.19E+05 2.06E+04 7.58E+03 4.11E+04 1.41E+04 2.33E+04 6.41E+04 8.33E+04 1.89E+04
2-Hydroxy-2-methylsuccinate 4.79E+06 1.37E+06 3.05E+06 3.55E+06 2.31E+06 4.42E+06 5.63E+06 2.10E+06 1.59E+06 2.86E+06
2-Isopropylmalate 7.47E+04 5.88E+04 5.91E+04 8.57E+04 8.59E+04 6.34E+04 8.49E+04 8.94E+04 8.66E+04 7.42E+04
3_4-Dihydroxyphenylacetate 1.31E+04 1.49E+04 3.90E+03 7.91E+03 2.27E+04 5.96E+03 1.15E+04 8.11E+03
3-Phosphoglycerate 5.37E+04 8.39E+04 1.74E+04 2.86E+04 2.09E+05 3.81E+04 4.38E+04 7.20E+03 4.47E+03 1.31E+05
4-Aminobutyrate 1.88E+06 2.86E+06 1.41E+06 2.29E+06 3.13E+06 1.64E+06 1.37E+06 1.55E+06 2.04E+06 1.54E+06
5-Hydroxyindoleacetic acid 3.59E+04 7.40E+03 1.43E+04 2.50E+04 1.57E+04 1.35E+04 2.24E+04 1.66E+04 2.22E+04 1.07E+04
Aconitate 6.10E+06 4.12E+06 5.21E+06 6.74E+06 7.27E+06 8.06E+06 8.70E+06 6.66E+06 4.85E+06 5.11E+06
Alanine/Sarcosine 1.88E+06 1.31E+06 1.60E+06 1.87E+06 2.05E+06 1.77E+06 1.67E+06 1.58E+06 1.97E+06 1.51E+06
alpha-Ketoglutarate 3.36E+04 7.88E+03 2.40E+04 2.03E+04 3.42E+04 3.91E+04 8.00E+04 2.84E+04 6.12E+03 2.14E+04
AMP/dGMP 8.44E+05 9.08E+04 9.21E+05 6.80E+05 1.23E+05 1.63E+06 1.02E+06 8.72E+05 7.88E+05 5.31E+05
Arginine 1.47E+04 4.72E+03 8.67E+03 1.99E+04 1.36E+04 7.89E+03 1.77E+04 6.51E+03 1.15E+04 1.65E+04
Ascorbate 2.03E+06 1.36E+04 1.26E+06 9.64E+04 2.48E+05 5.89E+03 8.46E+05 6.29E+05 7.42E+05
Asparagine 4.62E+04 5.51E+04 6.25E+04 5.55E+04 8.99E+04 6.12E+04 6.47E+04 4.64E+04 6.17E+04 4.86E+04
Aspartate 9.19E+06 3.68E+06 6.20E+06 7.26E+06 1.99E+06 6.66E+06 1.11E+07 3.42E+06 2.33E+06 6.15E+06
cAMP 1.60E+04 1.60E+04 1.23E+04 3.06E+04 1.57E+04 1.48E+04 2.59E+04 1.17E+04 1.17E+04 1.43E+04
CDP-ethanolamine 2.95E+04 1.05E+04 3.20E+04 2.92E+04 9.45E+03 3.69E+04 4.34E+04 1.56E+04 1.23E+04 2.95E+04
Citraconate 2.28E+05 2.08E+05 2.19E+05 2.51E+05 2.28E+05 2.98E+05 3.48E+05 2.73E+05 2.20E+05 2.33E+05
Citrate/isocitrate 3.75E+06 2.61E+06 2.46E+06 4.87E+06 6.62E+06 6.26E+06 6.84E+06 6.24E+06 2.41E+06 2.68E+06
Creatine 2.18E+06 1.67E+06 1.85E+06 2.08E+06 2.25E+06 2.01E+06 1.80E+06 1.82E+06 2.29E+06 1.81E+06
Cysteine 4.10E+04 3.06E+04 3.50E+03 2.92E+04 2.82E+04 2.72E+04 4.04E+04 2.28E+04 4.16E+04 8.04E+04
Cystine 6.19E+04 5.86E+04 3.24E+04 6.36E+04 1.38E+05 1.70E+04 5.93E+04 8.25E+04 7.77E+04 1.17E+04
D-Gluconate 2.27E+04 2.01E+04 1.87E+04 2.41E+04 2.14E+04 1.24E+04 7.15E+04 1.22E+04 2.18E+04 1.47E+04
Fumarate 1.76E+06 6.00E+05 7.03E+05 9.82E+05 8.45E+05 9.19E+05 1.36E+06 3.70E+05 9.10E+05 6.54E+05
Glucose 6-phosphate 7.24E+03 1.46E+03 1.25E+04 6.14E+03 3.99E+03 2.30E+04 2.64E+04 3.55E+03 8.87E+03 5.51E+04
Glutamate 8.05E+06 2.99E+06 1.10E+07 4.82E+06 2.54E+07 9.41E+06 1.36E+07 5.95E+06 2.31E+07 1.17E+07
Glutamine 2.99E+06 3.62E+06 2.09E+06 3.37E+06 5.52E+06 2.76E+06 2.97E+06 2.86E+06 3.70E+06 3.11E+06
Glutathione 3.10E+05 6.05E+04 9.02E+04 1.64E+05 1.21E+05 1.70E+05 2.30E+05 7.59E+04 1.17E+05 1.72E+05

126
Table 1.24 Continued
Sample Name M2 M8 M13 M16 M18 M44 M45 M46 M64 M70
Glutathione disulfide 4.29E+05 2.71E+05 3.65E+05 5.64E+05 3.75E+05 4.17E+05 4.71E+05 2.24E+05 2.21E+05 2.48E+05
Glycerone phosphate 3.10E+03 1.68E+04 1.72E+04 1.00E+04 3.16E+03 2.40E+04 1.61E+04 2.86E+03 2.51E+04 4.76E+04
Glycine 2.64E+05 9.24E+04 2.82E+05 2.44E+05 1.12E+05 1.10E+05 2.38E+05 2.05E+05 2.85E+05 2.51E+05
GMP 2.20E+05 2.14E+04 2.41E+05 2.20E+05 4.31E+04 2.78E+05 3.13E+05 1.83E+05 2.03E+05 1.51E+05
Guanosine 7.12E+04 8.66E+04 3.72E+04 7.05E+04 7.04E+04 5.14E+04 8.47E+04 2.38E+04 3.51E+04 6.71E+04
Histidine 9.69E+03 1.51E+03 1.06E+04 1.42E+04 7.29E+03 8.49E+03 1.59E+04 4.64E+03 1.15E+04 6.48E+03
Homoserine/Threonine 1.93E+05 2.23E+05 1.28E+05 1.69E+05 1.67E+05 1.20E+05 2.94E+05 1.34E+05 1.43E+05 2.08E+05
Homovanillic acid 2.04E+05 7.13E+04 1.16E+05 1.29E+05 1.30E+05 1.74E+05 2.23E+05 9.75E+04 1.51E+05 1.03E+05
Hypoxanthine 3.45E+06 1.75E+06 2.48E+06 3.17E+06 2.96E+06 2.60E+06 3.27E+06 1.98E+06 2.67E+06 2.72E+06
IMP 2.53E+05 4.71E+04 5.39E+05 4.43E+05 4.68E+04 7.08E+05 7.28E+05 5.46E+05 5.78E+05 2.82E+05
Inosine 2.08E+06 1.54E+06 1.20E+06 1.77E+06 1.88E+06 1.24E+06 1.79E+06 9.37E+05 1.14E+06 1.21E+06
Lactate 1.70E+07 7.10E+06 6.16E+07 1.46E+07 6.10E+06 5.62E+07 1.08E+08 6.99E+06 6.94E+06 5.11E+07
Leucine/Isoleucine 8.02E+05 2.04E+05 5.49E+05 6.45E+05 2.33E+05 3.85E+05 7.86E+05 1.66E+05 2.92E+05 6.03E+05
Malate 9.35E+06 3.06E+06 5.97E+06 5.61E+06 2.54E+06 7.09E+06 1.38E+07 1.38E+06 3.22E+06 4.59E+06
Malate 1.66E+05 1.24E+05 1.46E+05 1.41E+05 9.73E+04 1.48E+05 1.94E+05 8.33E+04 1.36E+05 1.34E+05
Methionine 2.61E+05 2.06E+05 1.69E+05 1.92E+05 3.30E+05 1.72E+05 3.01E+05 1.07E+05 3.31E+05 3.18E+05
myo-Inositol 3.67E+04 1.94E+04 3.81E+05 3.45E+04 1.72E+04 2.84E+05 5.34E+05 1.82E+04 2.67E+04 3.24E+05
N-Acetyl-beta-alanine 5.24E+04 7.58E+03 2.35E+04 1.65E+04 1.58E+04 2.52E+04 3.98E+04 1.17E+04 1.87E+04 4.77E+04
N-Acetylglutamate 1.94E+06 3.99E+05 1.18E+06 1.57E+06 8.02E+05 1.53E+06 1.78E+06 9.32E+05 1.10E+06 9.67E+05
N-Carbamoyl-L-aspartate 5.68E+05 4.87E+05 5.41E+05 4.03E+05 2.77E+05 3.75E+05 3.84E+05 2.93E+05 4.64E+05 2.81E+05
O-Acetyl-L-serine 6.23E+02 2.99E+06 5.92E+02 6.04E+02 2.54E+07 6.02E+02 9.65E+02 5.95E+06 2.31E+07 4.58E+02
Pantothenate 2.73E+06 3.54E+06 2.03E+06 2.66E+06 3.37E+06 2.37E+06 2.94E+06 2.15E+06 2.37E+06 2.21E+06
Phenylalanine 7.99E+04 7.84E+04 1.39E+05 8.09E+04 1.34E+05 1.33E+05 1.67E+05 8.59E+04 1.16E+05 1.15E+05
Phosphoenolpyruvate 4.22E+04 3.04E+04 2.42E+04 2.85E+04 5.29E+04 6.31E+04 5.44E+04 3.94E+04 3.64E+04 9.07E+04
Proline 7.64E+04 4.22E+04 5.97E+04 8.41E+04 5.86E+04 6.52E+04 9.67E+04 4.82E+04 9.10E+04 6.20E+04
Pyroglutamic acid 2.97E+06 2.32E+06 3.76E+06 3.23E+06 2.14E+06 4.14E+06 1.22E+07 1.66E+06 1.71E+06 3.95E+06
Pyruvate 1.40E+05 1.48E+05 1.66E+05 1.69E+05 1.94E+05 1.17E+05 2.44E+06 5.55E+04 1.51E+05 8.97E+04
Ribose phosphate 1.41E+05 1.03E+05 8.11E+04 1.08E+05 1.22E+05 1.56E+05 1.47E+05 5.55E+04 6.26E+04 1.81E+05

127
Table 1.24 Continued
Sample Name M2 M8 M13 M16 M18 M44 M45 M46 M64 M70
Serine 9.34E+05 7.55E+05 9.67E+05 9.96E+05 1.11E+06 7.60E+05 2.14E+06 9.64E+05 9.57E+05 7.63E+05
Succinate 1.33E+06 2.59E+05 1.44E+06 8.07E+05 2.46E+05 1.53E+06 3.74E+06 2.96E+05 3.51E+05 7.69E+05
Taurine 2.31E+07 1.95E+07 1.89E+07 2.29E+07 2.15E+07 2.03E+07 2.07E+07 1.73E+07 2.10E+07 2.02E+07
Trehalose/sucrose 5.76E+03 6.79E+03 1.16E+04 1.58E+04 4.70E+03 1.36E+04 1.06E+05 1.06E+04 1.06E+04 6.67E+03
Tryptophan 4.03E+04 2.00E+04 2.97E+04 3.28E+04 2.95E+04 3.17E+04 4.79E+04 2.73E+04 3.41E+04 2.79E+04
Tyrosine 1.49E+05 6.69E+04 1.27E+05 1.16E+05 1.11E+05 1.02E+05 2.49E+05 6.05E+04 1.29E+05 1.74E+05
UDP-glucose 1.13E+05 6.49E+04 1.13E+05 1.38E+05 1.33E+05 1.34E+05 1.37E+05 7.71E+04 9.84E+04 1.08E+05
UDP-N-acetylglucosamine 8.02E+04 3.77E+04 6.23E+04 7.85E+04 7.04E+04 9.46E+04 6.73E+04 5.48E+04 6.64E+04 4.17E+04
UMP 9.61E+04 7.89E+03 1.08E+05 9.78E+04 4.99E+03 1.62E+05 1.40E+05 9.02E+04 9.50E+04 7.79E+04
Uracil 8.05E+05 6.83E+05 5.16E+05 6.77E+05 8.85E+05 7.64E+05 8.33E+05 8.02E+05 7.93E+05 5.40E+05
Uric acid 1.63E+04 1.44E+04 4.45E+04 1.54E+04 2.82E+04 2.14E+04 8.95E+04 1.13E+04 3.86E+04 1.96E+04
Uridine 4.14E+05 2.91E+05 2.79E+05 3.71E+05 3.49E+05 1.78E+05 4.34E+05 2.58E+05 2.07E+05 2.05E+05
Valine 3.46E+05 2.32E+05 3.06E+05 3.01E+05 3.25E+05 2.85E+05 5.21E+05 2.51E+05 3.43E+05 2.86E+05
Xanthine 5.41E+05 8.61E+05 3.66E+05 4.90E+05 8.97E+05 3.84E+05 5.70E+05 2.18E+05 4.09E+05 5.79E+05

128
Table 1.25 Raw Data of Control Mice from vmPFC
Sample Name M3 M5 M10 M12 M14 M19 M26 M30 M32 M40
2-Aminoadipate 1.50E+05 7.66E+04 2.83E+04 1.95E+04 5.57E+04 1.54E+04 1.35E+04 1.82E+04 3.20E+04 9.04E+03
2-Hydroxy-2-methylsuccinate 2.12E+06 8.79E+05 3.72E+06 2.06E+06 1.60E+06 2.89E+06 1.35E+06 2.92E+06 2.27E+06 3.80E+06
2-Isopropylmalate 5.00E+04 5.21E+04 3.93E+04 5.30E+04 6.79E+04 4.56E+04 6.10E+04 5.67E+04 2.74E+04 6.69E+04
3_4-Dihydroxyphenylacetate 2.12E+04 9.44E+03 5.05E+03 8.55E+03 1.51E+04 4.30E+04 1.86E+04 9.96E+04
3-Phosphoglycerate 4.36E+04 5.59E+04 4.41E+04 5.73E+04 7.45E+04 1.30E+05 1.39E+04 1.67E+05 1.68E+04 2.88E+05
4-Aminobutyrate 2.61E+06 1.71E+06 3.53E+06 1.52E+06 2.13E+06 2.15E+06 1.45E+06 3.30E+06 2.59E+06 1.77E+06
5-Hydroxyindoleacetic acid 1.44E+04 9.87E+03 5.73E+04 8.51E+03 1.18E+04 3.02E+04 1.13E+04 1.09E+04 3.23E+04 9.83E+03
Aconitate 7.61E+06 4.83E+06 6.73E+06 7.02E+06 6.01E+06 8.58E+06 4.85E+06 8.28E+06 5.80E+06 1.09E+07
Alanine/Sarcosine 1.79E+06 1.34E+06 1.91E+06 1.36E+06 1.57E+06 1.64E+06 1.26E+06 1.70E+06 1.35E+06 1.55E+06
alpha-Ketoglutarate 2.02E+04 1.35E+04 2.59E+04 3.30E+04 9.58E+03 1.73E+04 2.10E+04 1.69E+04 1.50E+04 1.82E+04
AMP/dGMP 1.80E+05 1.34E+05 7.54E+05 1.68E+05 1.91E+05 1.01E+05 7.81E+05 1.00E+05 3.41E+05 5.51E+04
Arginine 1.23E+04 3.33E+03 1.47E+04 9.45E+03 9.19E+03 2.05E+04 6.29E+03 7.08E+03 1.24E+04 1.32E+04
Ascorbate 1.17E+06 5.33E+04 6.08E+04 1.35E+05 2.70E+05 2.80E+05 4.36E+03 4.26E+04 1.02E+05
Asparagine 6.38E+04 4.07E+04 7.57E+04 1.16E+05 4.77E+04 6.29E+04 3.62E+04 6.32E+04 5.32E+04 5.76E+04
Aspartate 3.53E+06 2.00E+06 9.92E+06 6.08E+06 1.33E+06 6.74E+06 4.83E+06 6.22E+06 5.62E+06 7.81E+06
cAMP 1.67E+04 6.64E+03 1.15E+04 5.25E+03 1.23E+04 2.13E+04 1.39E+04 2.50E+04 1.33E+04 1.35E+04
CDP-ethanolamine 1.80E+04 1.33E+04 3.64E+04 2.72E+04 1.01E+04 2.25E+04 1.99E+04 2.77E+04 2.18E+04 3.48E+04
Citraconate 3.09E+05 1.82E+05 2.56E+05 3.00E+05 2.23E+05 3.16E+05 2.00E+05 3.04E+05 2.39E+05 4.24E+05
Citrate/isocitrate 4.63E+06 2.66E+06 2.72E+06 3.60E+06 3.23E+06 7.54E+06 2.60E+06 6.28E+06 3.35E+06 9.35E+06
Creatine 2.08E+06 1.59E+06 2.15E+06 1.59E+06 1.85E+06 2.11E+06 1.49E+06 1.86E+06 1.58E+06 2.00E+06
Cysteine 2.10E+04 2.52E+04 1.85E+04 1.32E+03 3.39E+04 3.62E+04 2.70E+04 4.54E+04 3.16E+04 5.41E+04
Cystine 8.45E+04 4.78E+04 1.40E+05 7.96E+04 5.77E+04 8.76E+04 2.92E+04 9.49E+04 5.35E+04 9.33E+04
D-Gluconate 2.74E+04 1.53E+04 1.91E+04 2.17E+04 2.14E+04 3.73E+04 1.20E+04 2.28E+04 8.71E+03 1.05E+04
Fumarate 4.56E+05 1.84E+05 9.40E+05 3.55E+05 3.70E+05 2.38E+05 2.64E+05 9.05E+05 6.78E+05 1.95E+05
Glucose 6-phosphate 1.89E+03 2.21E+03 2.93E+04 5.32E+03 4.56E+03 2.30E+03 5.17E+03 2.87E+03 1.10E+04 4.88E+03
Glutamate 7.26E+06 3.92E+06 7.26E+06 9.10E+06 1.44E+07 4.13E+06 4.30E+06 3.22E+06 5.29E+06 1.03E+07
Glutamine 3.88E+06 3.01E+06 4.39E+06 4.56E+06 3.08E+06 2.93E+06 2.11E+06 3.20E+06 3.28E+06 5.14E+06
Glutathione 1.47E+05 4.98E+04 1.67E+04 2.90E+04 5.61E+04 1.07E+05 8.10E+04 1.25E+05 6.91E+04 1.05E+05

129
Table 1.25 Continued
Sample Name M3 M5 M10 M12 M14 M19 M26 M30 M32 M40
Glutathione disulfide 3.68E+05 2.83E+05 2.85E+05 2.87E+05 2.90E+05 2.76E+05 3.34E+05 3.73E+05 2.37E+05 2.69E+05
Glycerone phosphate 4.94E+03 3.28E+03 6.02E+04 4.45E+03 4.63E+03 1.63E+03 7.23E+03 1.11E+04 3.56E+04 2.87E+03
Glycine 4.01E+05 1.37E+05 1.48E+05 9.68E+04 1.76E+05 2.59E+05 2.29E+05 4.92E+04 1.14E+05 8.40E+04
GMP 4.11E+04 5.21E+04 2.16E+05 6.60E+04 6.15E+04 3.70E+04 1.96E+05 2.42E+04 1.27E+05 1.03E+04
Guanosine 1.74E+05 5.58E+04 9.81E+04 1.57E+05 9.05E+04 1.49E+05 4.15E+04 1.22E+05 6.43E+04 2.13E+05
Histidine 9.79E+03 6.98E+03 8.32E+03 7.70E+03 7.44E+03 4.83E+03 3.74E+03 2.31E+03 1.20E+04 1.07E+04
Homoserine/Threonine 2.18E+05 1.87E+05 2.24E+05 1.39E+05 1.60E+05 2.07E+05 1.51E+05 2.18E+05 1.69E+05 1.56E+05
Homovanillic acid 8.07E+04 5.93E+04 1.07E+05 1.00E+05 5.43E+04 1.11E+05 7.28E+04 9.70E+04 6.29E+04 1.14E+05
Hypoxanthine 2.97E+06 1.86E+06 3.69E+06 2.28E+06 2.61E+06 2.82E+06 1.92E+06 3.04E+06 2.41E+06 3.46E+06
IMP 1.12E+05 8.94E+04 4.89E+05 1.01E+05 8.75E+04 3.96E+04 3.34E+05 3.61E+04 3.43E+05 1.21E+04
Inosine 2.14E+06 1.18E+06 1.50E+06 1.33E+06 1.55E+06 1.72E+06 1.03E+06 2.10E+06 1.13E+06 2.25E+06
Lactate 7.77E+06 6.05E+06 5.80E+07 5.08E+07 5.73E+06 9.15E+06 7.07E+06 1.13E+07 5.51E+07 5.14E+07
Leucine/Isoleucine 1.61E+05 1.23E+05 6.43E+05 3.91E+05 1.57E+05 2.66E+05 1.50E+05 5.24E+05 3.59E+05 3.30E+05
Malate 2.31E+06 6.26E+05 7.48E+06 1.81E+06 1.82E+06 8.28E+05 1.30E+06 4.37E+06 3.91E+06 8.26E+05
Malate 1.19E+05 1.18E+05 1.67E+05 1.23E+05 1.33E+05 9.55E+04 1.07E+05 1.51E+05 1.64E+05 8.04E+04
Methionine 1.77E+05 1.06E+05 2.58E+05 1.71E+05 2.13E+05 1.31E+05 1.76E+05 2.58E+05 1.60E+05 2.25E+05
myo-Inositol 2.63E+04 1.51E+04 3.78E+05 3.41E+05 1.23E+04 1.94E+04 1.69E+04 2.64E+04 3.29E+05 3.55E+05
N-Acetyl-beta-alanine 1.40E+04 8.08E+03 4.65E+04 3.03E+04 1.05E+04 1.58E+04 1.10E+04 2.33E+04 2.60E+04 3.85E+04
N-Acetylglutamate 4.82E+05 3.49E+05 1.07E+06 6.09E+05 5.35E+05 8.12E+05 8.38E+05 6.91E+05 6.58E+05 5.01E+05
N-Carbamoyl-L-aspartate 4.67E+05 3.55E+05 2.02E+05 3.68E+05 2.77E+05 2.67E+05 4.60E+05 6.68E+05 4.76E+05 4.95E+05
O-Acetyl-L-serine 7.26E+06 3.92E+06 4.95E+02 4.68E+02 1.44E+07 6.29E+02 5.97E+02 5.97E+02 4.50E+02 5.13E+02
Pantothenate 2.95E+06 2.50E+06 3.92E+06 2.06E+06 3.12E+06 2.65E+06 2.05E+06 3.99E+06 3.26E+06 2.88E+06
Phenylalanine 1.05E+05 6.81E+04 1.34E+05 1.16E+05 9.98E+04 7.97E+04 6.02E+04 6.82E+04 7.72E+04 1.37E+05
Phosphoenolpyruvate 3.83E+04 3.83E+04 4.35E+04 3.76E+04 2.72E+04 4.41E+04 3.01E+04 5.99E+04 3.59E+04 1.17E+05
Proline 4.81E+04 4.70E+04 4.46E+04 6.63E+04 5.43E+04 6.89E+04 4.50E+04 4.77E+04 4.26E+04 5.36E+04
Pyroglutamic acid 2.29E+06 1.77E+06 9.37E+06 5.68E+06 1.74E+06 3.20E+06 1.72E+06 3.89E+06 4.08E+06 5.84E+06
Pyruvate 1.80E+05 1.64E+05 1.93E+05 4.97E+05 1.15E+05 1.64E+05 6.38E+04 2.09E+05 6.89E+04 8.94E+04
Ribose phosphate 1.28E+05 1.12E+05 1.80E+05 1.35E+05 1.45E+05 1.42E+05 7.97E+04 1.98E+05 9.64E+04 3.98E+05

130
Table 1.25 Continued
Sample Name M3 M5 M10 M12 M14 M19 M26 M30 M32 M40
Serine 9.59E+05 6.53E+05 5.32E+05 1.29E+06 8.24E+05 7.56E+05 6.99E+05 8.82E+05 6.44E+05 7.29E+05
Succinate 3.59E+05 2.02E+05 1.07E+06 1.21E+06 1.83E+05 3.50E+05 4.15E+05 3.42E+05 5.01E+05 7.66E+05
Taurine 2.22E+07 1.69E+07 1.80E+07 1.56E+07 1.92E+07 1.88E+07 1.64E+07 1.97E+07 1.46E+07 1.82E+07
Trehalose/sucrose 1.14E+06 7.79E+03 2.65E+04 2.28E+04 6.83E+03 5.11E+03 6.78E+03 5.55E+03 4.24E+03 3.33E+03
Tryptophan 2.93E+04 1.75E+04 3.29E+04 1.72E+04 2.20E+04 3.77E+04 1.38E+04 3.74E+04 2.81E+04 3.92E+04
Tyrosine 7.59E+04 6.12E+04 1.64E+05 1.15E+05 8.97E+04 7.63E+04 9.09E+04 1.20E+05 1.05E+05 9.63E+04
UDP-glucose 9.10E+04 7.66E+04 9.76E+04 6.49E+04 9.29E+04 7.08E+04 6.79E+04 1.25E+05 8.20E+04 9.61E+04
UDP-N-acetylglucosamine 5.12E+04 2.94E+04 5.46E+04 5.44E+04 4.64E+04 4.19E+04 4.40E+04 6.51E+04 3.27E+04 4.26E+04
UMP 2.55E+04 6.48E+03 8.60E+04 1.33E+04 1.58E+04 6.24E+03 7.92E+04 1.23E+04 3.97E+04 4.97E+03
Uracil 8.86E+05 4.97E+05 8.94E+05 4.25E+05 6.25E+05 7.37E+05 4.26E+05 9.17E+05 6.14E+05 9.35E+05
Uric acid 2.49E+04 1.76E+04 3.08E+04 4.04E+04 1.78E+04 1.44E+04 1.25E+04 9.35E+03 1.20E+04 2.27E+04
Uridine 2.47E+05 1.62E+05 1.28E+05 2.30E+05 2.75E+05 3.89E+05 1.51E+05 2.53E+05 8.54E+04 2.81E+05
Valine 2.09E+05 1.89E+05 3.11E+05 2.89E+05 2.63E+05 2.42E+05 1.80E+05 2.55E+05 2.30E+05 2.71E+05
Xanthine 5.46E+05 5.20E+05 6.60E+05 5.37E+05 5.61E+05 7.31E+05 1.79E+05 8.33E+05 3.44E+05 1.04E+06

131
Table 1.26 Raw Data of Susceptible Mice from vmPFC
Sample Name M1 M4 M15 M17 M20 M22 M23 M24 M25 M27 M28
2-Aminoadipate 1.54E+04 2.14E+04 4.35E+04 1.58E+04 2.59E+04 4.57E+04 4.65E+04 2.82E+04 4.82E+04 1.59E+05 9.01E+03
2-Hydroxy-2-methylsuccinate 3.81E+06 3.92E+06 1.10E+06 7.28E+05 3.37E+06 4.13E+06 4.86E+06 3.37E+06 1.00E+06 2.50E+06 3.40E+06
2-Isopropylmalate 7.25E+04 7.25E+04 7.45E+04 4.87E+04 8.60E+04 6.65E+04 1.00E+05 1.03E+05 5.40E+04 4.88E+04 7.51E+04
3_4-Dihydroxyphenylacetate 3.35E+04 1.69E+04 1.48E+04 1.57E+04 7.49E+03 1.56E+04 1.43E+04 3.53E+04 1.85E+04 6.10E+03 4.90E+03
3-Phosphoglycerate 1.58E+05 7.47E+05 3.89E+04 8.96E+04 1.75E+04 2.44E+05 3.22E+04 1.42E+05 1.38E+05 4.24E+05 2.17E+04
4-Aminobutyrate 3.30E+06 2.86E+06 2.11E+06 1.16E+06 1.71E+06 3.12E+06 2.36E+06 1.85E+06 1.86E+06 3.44E+06 1.67E+06
5-Hydroxyindoleacetic acid 3.15E+04 1.26E+04 1.34E+04 2.97E+03 2.66E+04 3.46E+04 3.00E+04 3.05E+04 1.39E+04 4.79E+04 1.92E+04
Aconitate 1.04E+07 9.23E+06 3.85E+06 3.78E+06 7.45E+06 7.89E+06 9.07E+06 9.69E+06 5.84E+06 7.82E+06 7.02E+06
Alanine/Sarcosine 2.16E+06 1.72E+06 1.39E+06 1.20E+06 1.82E+06 1.91E+06 1.91E+06 1.51E+06 1.40E+06 1.68E+06 1.48E+06
alpha-Ketoglutarate 3.16E+04 4.05E+04 1.18E+04 1.79E+04 1.94E+04 1.98E+04 2.87E+04 1.58E+04 9.89E+03 3.44E+04 2.40E+04
AMP/dGMP 2.05E+05 1.48E+05 1.95E+05 9.02E+04 9.59E+05 6.73E+04 2.79E+05 3.04E+05 8.26E+04 1.22E+05 8.56E+05
Arginine 1.25E+04 1.35E+04 3.65E+03 6.33E+03 1.20E+04 9.90E+03 7.86E+03 1.78E+04 6.78E+03 1.20E+04 3.52E+03
Ascorbate 2.33E+06 7.09E+05 1.89E+04 1.94E+05 6.77E+04 3.12E+05 2.38E+05 2.42E+05 2.02E+05 1.59E+06
Asparagine 1.05E+05 5.02E+04 4.91E+04 3.57E+04 5.30E+04 6.04E+04 7.60E+04 2.39E+04 5.91E+04 7.27E+04 4.16E+04
Aspartate 1.09E+07 8.55E+06 2.77E+06 1.09E+06 7.16E+06 7.53E+06 8.26E+06 6.87E+06 1.59E+06 3.05E+06 6.00E+06
cAMP 1.94E+04 2.08E+04 2.90E+03 3.05E+03 2.35E+04 2.45E+04 1.76E+04 1.45E+04 6.99E+03 1.60E+04 5.18E+03
CDP-ethanolamine 3.90E+04 3.04E+04 9.44E+03 4.23E+03 3.39E+04 3.48E+04 3.06E+04 2.72E+04 1.03E+04 1.24E+04 2.77E+04
Citraconate 4.34E+05 3.92E+05 1.68E+05 1.72E+05 2.79E+05 3.71E+05 3.63E+05 4.01E+05 2.52E+05 3.06E+05 2.73E+05
Citrate/isocitrate 7.22E+06 8.22E+06 1.91E+06 2.08E+06 4.40E+06 6.48E+06 7.64E+06 6.51E+06 3.64E+06 6.82E+06 5.28E+06
Creatine 2.72E+06 1.84E+06 1.68E+06 1.53E+06 2.14E+06 2.18E+06 2.24E+06 1.77E+06 1.63E+06 1.96E+06 1.45E+06
Cysteine 3.99E+04 3.87E+04 2.13E+04 1.57E+04 9.40E+03 3.44E+04 4.82E+04 4.45E+04 2.25E+04 3.21E+04 5.14E+04
Cystine 1.28E+05 8.81E+04 5.59E+04 3.99E+04 5.18E+04 5.99E+04 3.34E+04 2.64E+04 6.83E+04 9.60E+04 5.07E+04
D-Gluconate 2.95E+04 4.21E+04 1.50E+04 1.12E+04 1.47E+04 1.69E+04 1.52E+04 5.48E+03 2.08E+04 3.11E+04 1.03E+04
Fumarate 7.10E+05 6.77E+05 2.69E+05 1.56E+05 8.62E+05 1.47E+06 1.25E+06 2.82E+05 3.57E+05 1.17E+06 6.47E+05
Glucose 6-phosphate 6.67E+03 6.31E+03 2.21E+03 1.87E+03 1.96E+04 7.75E+03 7.06E+03 4.74E+03 3.50E+03 5.77E+03 4.41E+03
Glutamate 5.41E+06 3.68E+06 3.09E+06 2.30E+07 1.13E+07 8.52E+06 1.32E+07 1.18E+07 8.69E+06 8.40E+06 9.08E+06
Glutamine 4.08E+06 3.15E+06 3.37E+06 2.62E+06 2.95E+06 3.36E+06 3.66E+06 3.73E+06 3.42E+06 3.93E+06 2.85E+06
Glutathione 2.43E+05 1.73E+05 4.27E+04 3.61E+04 7.66E+04 1.19E+05 1.89E+05 1.45E+05 7.07E+04 1.30E+05 2.82E+05

132
Table 1.26 Continued
Sample Name M1 M4 M15 M17 M20 M22 M23 M24 M25 M27 M28
Glutathione disulfide 5.46E+05 6.47E+05 1.93E+05 2.06E+05 2.72E+05 4.21E+05 4.62E+05 3.25E+05 3.39E+05 3.75E+05 3.58E+05
Glycerone phosphate 6.06E+03 9.83E+03 5.86E+03 2.12E+03 1.85E+04 2.22E+04 2.78E+03 2.18E+04 2.19E+04 3.50E+04 1.19E+04
Glycine 3.50E+05 1.13E+05 2.15E+05 1.29E+05 1.48E+05 1.62E+05 3.08E+05 7.02E+04 3.84E+05 8.47E+04 6.63E+04
GMP 7.31E+04 3.33E+04 7.44E+04 2.36E+04 2.30E+05 1.59E+04 1.24E+05 7.99E+04 2.79E+04 2.91E+04 2.34E+05
Guanosine 1.66E+05 1.16E+05 6.22E+04 5.63E+04 4.94E+04 1.47E+05 1.97E+05 1.31E+05 5.73E+04 9.73E+04 2.42E+04
Histidine 3.39E+03 8.38E+03 7.87E+03 4.56E+03 5.28E+03 9.78E+03 9.52E+03 9.79E+03 3.65E+03 8.76E+03 9.57E+03
Homoserine/Threonine 2.97E+05 2.27E+05 1.54E+05 1.32E+05 1.56E+05 1.41E+05 2.10E+05 1.45E+05 1.63E+05 1.64E+05 1.73E+05
Homovanillic acid 9.08E+04 1.75E+05 7.72E+04 6.88E+04 1.47E+05 1.78E+05 1.47E+05 1.09E+05 7.84E+04 1.26E+05 1.40E+05
Hypoxanthine 4.26E+06 3.26E+06 1.48E+06 1.41E+06 3.18E+06 5.00E+06 3.69E+06 3.16E+06 2.12E+06 3.65E+06 2.59E+06
IMP 9.98E+04 3.64E+04 1.35E+05 7.84E+04 3.91E+05 2.76E+04 1.73E+05 1.47E+05 2.65E+04 2.83E+04 5.71E+05
Inosine 2.81E+06 2.61E+06 1.20E+06 1.02E+06 1.51E+06 2.36E+06 2.96E+06 1.57E+06 1.44E+06 1.90E+06 1.28E+06
Lactate 1.36E+07 1.34E+07 6.96E+06 4.21E+06 5.85E+07 5.23E+07 5.84E+07 4.90E+07 5.13E+06 7.61E+06 2.25E+07
Leucine/Isoleucine 5.68E+05 5.69E+05 1.42E+05 1.05E+05 3.80E+05 4.02E+05 5.13E+05 3.19E+05 1.41E+05 2.01E+05 4.20E+05
Malate 4.34E+06 5.50E+06 1.21E+06 4.52E+05 5.96E+06 8.38E+06 7.04E+06 2.46E+06 9.99E+05 6.82E+06 4.57E+06
Malate 1.79E+05 1.52E+05 9.56E+04 8.53E+04 1.42E+05 2.01E+05 1.53E+05 1.06E+05 1.13E+05 1.68E+05 1.60E+05
Methionine 3.30E+05 2.61E+05 1.73E+05 2.26E+05 1.86E+05 2.81E+05 2.54E+05 1.71E+05 1.40E+05 3.43E+05 2.47E+05
myo-Inositol 2.27E+04 3.07E+04 1.76E+04 7.80E+03 3.81E+05 2.92E+05 3.79E+05 2.85E+05 1.29E+04 2.33E+04 3.17E+04
N-Acetyl-beta-alanine 3.93E+04 3.93E+04 9.28E+03 8.61E+03 2.07E+04 1.93E+04 2.41E+04 1.25E+04 1.43E+04 2.29E+04 1.70E+04
N-Acetylglutamate 1.50E+06 7.98E+05 2.91E+05 1.83E+05 1.40E+06 9.80E+05 2.01E+06 7.69E+05 3.20E+05 6.62E+05 1.60E+06
N-Carbamoyl-L-aspartate 3.60E+05 3.92E+05 2.53E+05 1.66E+05 4.47E+05 4.52E+05 4.32E+05 2.88E+05 2.09E+05 6.22E+05 3.85E+05
O-Acetyl-L-serine 6.34E+02 3.09E+06 2.30E+07 5.57E+02 4.33E+02 4.10E+02 3.73E+02 8.69E+06 8.40E+06 4.72E+02
Pantothenate 3.45E+06 3.44E+06 2.38E+06 2.34E+06 3.01E+06 3.78E+06 3.30E+06 2.87E+06 2.60E+06 3.82E+06 2.42E+06
Phenylalanine 1.28E+05 1.98E+05 9.37E+04 6.31E+04 9.53E+04 1.46E+05 1.43E+05 1.14E+05 8.73E+04 1.47E+05 6.37E+04
Phosphoenolpyruvate 6.49E+04 2.75E+05 4.24E+04 3.28E+04 3.07E+04 7.40E+04 6.18E+04 6.15E+04 7.51E+04 1.93E+05 2.56E+04
Proline 6.79E+04 5.51E+04 4.15E+04 3.17E+04 6.54E+04 6.25E+04 6.12E+04 4.63E+04 3.70E+04 6.35E+04 5.29E+04
Pyroglutamic acid 4.04E+06 5.02E+06 1.87E+06 1.03E+06 4.12E+06 6.53E+06 4.39E+06 3.63E+06 1.65E+06 3.05E+06 3.12E+06
Pyruvate 2.37E+05 1.41E+06 8.54E+04 6.25E+04 1.21E+05 2.34E+05 1.43E+05 5.86E+04 1.57E+05 5.77E+05 1.10E+05
Ribose phosphate 3.58E+05 3.25E+05 9.98E+04 8.13E+04 1.19E+05 2.55E+05 1.85E+05 2.62E+05 2.48E+05 1.40E+05 8.95E+04

133
Table 1.26 Continued
Sample Name M1 M4 M15 M17 M20 M22 M23 M24 M25 M27 M28
Ribose phosphate 3.58E+05 3.25E+05 9.98E+04 8.13E+04 1.19E+05 2.55E+05 1.85E+05 2.62E+05 2.48E+05 1.40E+05 8.95E+04
Serine 1.24E+06 1.17E+06 7.00E+05 6.67E+05 9.28E+05 6.33E+05 9.52E+05 5.29E+05 8.90E+05 1.00E+06 6.59E+05
Succinate 3.86E+05 8.15E+05 3.61E+05 1.79E+05 1.09E+06 1.22E+06 1.60E+06 8.53E+05 2.38E+05 3.63E+05 1.68E+06
Taurine 2.74E+07 2.24E+07 1.66E+07 1.69E+07 2.01E+07 2.11E+07 2.31E+07 1.75E+07 1.70E+07 1.94E+07 1.86E+07
Trehalose/sucrose 1.23E+04 4.12E+04 1.21E+04 8.68E+03 6.61E+03 6.73E+03 4.53E+03 4.13E+03 1.91E+04 5.37E+04 5.18E+03
Tryptophan 3.15E+04 3.51E+04 1.31E+04 1.46E+04 2.25E+04 4.58E+04 2.91E+04 2.61E+04 1.68E+04 3.20E+04 4.30E+04
Tyrosine 1.37E+05 1.32E+05 7.82E+04 7.44E+04 1.12E+05 2.82E+05 8.92E+04 9.59E+04 6.12E+04 1.37E+05 1.02E+05
UDP-glucose 1.52E+05 1.55E+05 6.19E+04 6.93E+04 1.40E+05 9.15E+04 1.70E+05 9.92E+04 8.44E+04 1.40E+05 1.03E+05
UDP-N-acetylglucosamine 7.73E+04 9.48E+04 3.71E+04 4.40E+04 6.36E+04 5.47E+04 8.13E+04 4.44E+04 4.02E+04 8.21E+04 7.32E+04
UMP 2.69E+04 1.54E+04 1.65E+04 8.43E+03 1.12E+05 7.33E+03 6.04E+04 5.78E+04 1.13E+04 2.16E+04 1.19E+05
Uracil 9.50E+05 9.02E+05 4.84E+05 4.94E+05 6.40E+05 8.73E+05 7.17E+05 6.26E+05 5.95E+05 1.02E+06 6.19E+05
Uric acid 1.08E+04 3.11E+04 1.46E+04 2.21E+04 2.17E+04 2.31E+04 1.99E+04 2.81E+04 1.98E+04 4.20E+04 1.16E+04
Uridine 6.54E+05 4.11E+05 1.66E+05 2.30E+05 1.78E+05 4.43E+05 3.83E+05 2.34E+05 2.43E+05 3.76E+05 2.34E+05
Valine 3.59E+05 5.12E+05 1.77E+05 1.63E+05 2.57E+05 3.13E+05 3.66E+05 2.44E+05 1.73E+05 3.25E+05 2.85E+05
Xanthine 1.06E+06 1.51E+06 3.73E+05 4.48E+05 4.93E+05 1.08E+06 1.20E+06 7.27E+05 6.19E+05 9.02E+05 2.00E+05

134
CHAPTER 2: NEUROMETABOLOMICS OF ACUTE SLEEP
DEPRIVATION THROUGH TEMPORAL ANALYSIS OF B6 MICE

135
PREFACE
Upon arriving to the University of Tennessee, Knoxville, I had the pleasure of
collaborating with Drs. Ralph Lydic and Helen Baghdoyan. These two neuroscientists are
highly-recognized researchers within the field of sleep regulation and function. A primary
goal of their research was to gain a higher-level understanding of how neurochemicals
fluctuate during various states of consciousness, which was accomplished by combing
the well-established sampling technique of microdialysis with the versatility of LC-HRMS
untargeted metabolomics.
While quantitative and qualitative analysis of neurotransmitters has been studied
for decades, analytical limitations had prevented a holistic approach. Using HPLC-UV/Vis
or electrochemical detection (e.g. voltammetry), researchers were able to analyze one,
or two, neurotransmitters simultaneously from a single sample. Although the information
gained from these studies are integral to the understanding of neurochemistry, the
dynamic changes observed from the entire metabolome would provide a snapshot of how
neurons are chemically changing for communication across the interstitial space.
Microdialysis is a proficient sampling technique used by neuroscientists to obtain
information about temporal neurochemical changes. Through minimally invasive surgery,
a small probe can be strategically implanted into a specific region of the brain. Following
probe conditioning, dialysate is collected in small fractions that contain neurochemicals
from the extracellular space. The result of this analysis can provide valuable information
about the release and reuptake of specific neurotransmitters, and other small molecules
that are used for the regulation of neuronal synapses. This sampling technique was the
perfect tool for analyzing states of consciousness, as a single subject can be analyzed
across time to determine how neurochemicals change during natural states of sleep and
wake, through perturbed states, such as sleep deprivation or under the effects of
anesthesia.
Samples were collected with assistance from Dr. Chiara Cirelli et al., University of
Wisconsin, simultaneously from the prefrontal cortex and motor cortex of B6 mice at 15-
minute intervals. Experimental conditions included mice during natural sleep followed by

136
enforced wakefulness (S6-W3; N = 7), natural wake followed by enforced wakefulness
(W6-W3; N = 6), and sleep deprivation followed by natural sleep (SD6-S3; N = 6).
Untreated dialysate were diluted to 50 µL to provide repeat injections. Our untargeted
metabolomics method, using LC-HRMS, analyzed over 1,200 samples across 14 days.
Following peak identification with MAVEN software, raw ion intensity data was normalized
with assistance from Dr. William Marshall, University of Wisconsin.
This research provided insight about the current state of analytical technology and
advanced the field of sleep regulation and consciousness. Our results revealed that an
untargeted metabolomics technique could successfully identify 30+ known metabolites
from our current standard list of ~300 metabolites and thousands of unidentified spectral
features. This analysis marks the first time a global metabolic snapshot was observed
from microdialysate samples, which provided the challenge of small sample volume and
reduced metabolite concentration. By analyze metabolism in a temporal fashion, we were
able to observe how neurochemicals fluctuate during various states of consciousness.
With access to literature that identifies changes to neurotransmitters during these states,
we can now begin piecing together how these small water-soluble metabolites are related.
Additionally, we are providing the neuroscience community with a large set of unexplored
territory in the form of the unidentified spectral features.
Small molecule discovery can identify new, safe targets for the treatment or
prevention of sleep-related illnesses. Across the globe, irregular sleeping habits are
becoming common, and the medical consequences of these habits are well documented.
Sleep deprivation has been shown to effect both cardiac and respiratory function,
increase work-related injury due to drowsiness, and cause weight loss or gain. With the
completion of this research project, we have provided a new set of small molecules for
neuroscientist to continue researching for their role in consciousness.

137
A version of this chapter is being prepared for submission by Allen K. Bourdon, Giovanna
M. Spano, Michele Bellesi, William Marshall, Giulio Tononi, Pier Andrea Serra, Helen A.
Baghdoyan, Ralph Lydic, Shawn R. Campagna, and Chiara Cirelli:
Contributions:
Microdialysis samples were collected by Cirelli et al. from the University of Wisconsin,
Madison (GMS, MB, GT, CC). Sample analysis was completed in the UTK BSMMSC by
AKB. Statistical analysis was completed separately by UTK (AKB) and UWM (WM). All
authors contributed to data analysis and interpretation, and AKB, GMS, MB, CC, HAB,
SRC, and RL wrote the manuscript.

138
2.1 ABSTRACT
Cerebral metabolism plays an essential role in sleep-waking states, yet the primary
information available involves the analysis of a subset of small molecules known as
neurotransmitters. To date, most neurochemical analyses have involved the detection of
one, or two metabolites simultaneously. The lack of breadth knowledge has limited
neuroscientists from developing a greater understanding of how global metabolism
regulates these states of consciousness. This study has focused on developing a deeper
understanding of how central carbon metabolites fluctuate across sleep-waking states,
as well as expanding our knowledge about how sleep deprivation can impact
homeostasis. Using an untargeted UPLC-HRMS metabolomics method and sequential
statistical analyses resulted in 11 significant metabolites that fluctuated between the
sleep-waking cycle and sleep deprivation.
2.2 INTRODUCTION
Genome-wide transcriptomic studies have identified hundreds of mRNAs with
expression changes in neurons and glia that are associated with sleep and wakefulness,
independent of circadian time (Bellesi et al., 2015; Bellesi et al., 2013; Cirelli et al., 2004;
Mackiewicz et al., 2007; Maret et al., 2007; Mongrain et al., 2010). These studies have
suggested new hypotheses about the restorative functions of sleep, from synaptic
homeostasis to the synthesis of cellular components and membranes (Mackiewicz et al.,
2007; Maret et al., 2007; Tononi and Cirelli, 2014). Proteomic approaches also have been
used, although they are difficult to apply to brain homogenates (e.g.(Basheer et al., 2005;
Cirelli et al., 2009; Kim et al., 2014; Pawlyk et al., 2007; Poirrier et al., 2008)).
Metabolomics, or the study of small-molecule metabolites, is a powerful approach
for identifying endogenous molecules in brain extracellular fluid. Because metabolomics
provides functional information about cellular physiology, measuring the cortical
metabolome may help to clarify how changes in neurochemistry contribute to the
generation of sleep and wakefulness (Baghdoyan and Lydic, 2012). Metabolomics also

139
has the potential to provide insights about the functions of sleep. New detection methods
are now available to analyze brain microdialysis samples with high sensitivity and
specificity (Dunn et al., 2011; Snyder et al., 2013). According to the human metabolome
database, 440 compounds have been detected (quantified or not) in the cerebrospinal
fluid (Wishart et al., 2013). How these metabolites relate to metabolites present in the
brain extracellular fluid is unknown. The goal of the present study was to characterize
changes in the composition of the extracellular fluid that were associated with states of
sleep and wakefulness, independent of circadian time or stress caused by sleep
deprivation. To accomplish this aim we used Ultra Performance Liquid Chromatography-
High Resolution Mass Spectrometry (UPLC-HRMS) to identify and quantify molecules
comprising metabolomics profiles in mouse medial prefrontal cortex (mPFC) and primary
motor cortex (M1). In vivo microdialysis was used to collect samples from mice during
electrographically identified states of sleep and wakefulness during times when mice are
normally asleep (light period), normally awake (dark period), and during sleep deprivation.
We focused on mPFC and M1 because we recently found that noradrenaline levels
increased during waking and decreased during sleep in both regions, but they started
declining by the end of 6 hours of sleep deprivation only in mPFC. This decline correlated
with an increase in low EEG frequencies, suggesting that the build-up of sleep pressure
during waking may occur faster in mPFC (Bellesi et al., 2016).
2.3 MATERIALS AND METHODS
2.3.1 Animals
Adult, male C57BL/6J (B6, wild type) mice (25 to 30 g; n = 19) were used. All
animal procedures and experimental protocols followed the National Institutes of Health
Guide for the Care and Use of Laboratory Animals (2011) and were approved by the
University of Wisconsin-Madison licensing committee. Animal facilities were reviewed
and approved by the institutional animal care and use committee (IACUC) of the
University of Wisconsin-Madison and were inspected and accredited by association for
assessment and accreditation of laboratory animal care (AAALAC).

140
2.3.2 Stereotaxic Surgery
Implantation of recording electrodes and microdialysis guide tubes was performed
under isoflurane anesthesia (2% for induction, 1 to 1.5% for maintenance). Each mouse
was implanted with two microdialysis guide cannulae (Figure 1A). One cannula was
aimed for the left medial prefrontal cortex (mPFC) using stereotaxic coordinates Bregma
AP +1.94, ML -0.3; (Bicks et al., 2015). A second cannula was aimed for the right primary
motor cortex (M1) with stereotaxic coordinates of AP +1.5, ML +2 (Franklin and Paxinos,
2008). For electroencephalographic (EEG) recordings, screw electrodes were implanted
over left and right parietal cortex (AP -2, ML +/-2) and cerebellum (reference electrode).
To record the electromyogram (EMG), two stainless steel wires were implanted into the
nuchal muscles. Cannulae and electrodes were fixed to the skull with dental cement. After
surgery, mice were individually housed in transparent Plexiglas cages. Environmental
lighting provided a 12h:12h light/dark cycle (lights on at 8 am; 23 ± 1 °C) with food and
water available ad libitum and replaced daily at 8 am. Approximately one week was
allowed for recovery from surgery, and microdialysis experiments started only after the
temporal organization of sleep and wakefulness had normalized.
2.3.3 Quantifying States of Sleep and Wakefulness
For one week after surgery the mice were conditioned for sleep studies by
connecting them via a flexible cable to a multichannel neurophysiology recording and
stimulation system that enabled EEG and EMG recordings (Figure 1B) (Tucker-Davis
Technologies Inc.). EEG and EMG signals were amplified and filtered as follows: EEG,
high-pass filter at 0.1 Hz; low-pass filter at 100 Hz; EMG, high-pass filter at 10 Hz; low-
pass filter at 100 Hz). All signals were sampled and stored at 256 Hz. States of sleep and
wakefulness were scored off-line in 4-sec epochs using standard criteria.
2.3.4 Microdialysis Experiments
The day before the experiment, each mouse was briefly anesthetized with
isoflurane and the microdialysis probes (15 KDa pore size) were inserted into the guide
cannulae (Bellesi et al., 2016). Microdialysis probes in the mouse homologue of
prefmPFC and M1 were connected to the microfluidic circuit (Figure 1B) and perfused

141
with artificial extracellular fluid (aECF) comprised of mM concentrations of: NaCL 147,
KCl 2.7, CaCl2 1.2, MgCl2 0.85. The microperfusion pump (CMA/400, CMA Microdialysis),
maintained aECF flow rate of 1.1 µL / min. Experiments were conducted from 7am until
6pm or from 9pm until 6am, during which time microdialysis samples from each cortical
probe were collected every 15 min in 250 μL plastic vials (ESA, PN 70-1695; ESA, Inc.).
At the conclusion of each dialysis experiment, microdialysis sites were histologically
confirmed to be located in the targeted brain area. Dialysis samples were stored at -80ºC
until they were shipped to the University of Tennessee to be analyzed using Ultra
Performance Liquid Chromatography-High Resolution Mass Spectrometry (UPLC-
HRMS) and an established metabolomics method (Lu et al., 2010). At the University of
Tennessee samples were also maintained at -80ºC until they were thawed and measured.
2.3.5 Experimental Groups
Three different experimental groups were used (Figure 1C). In all cases mice were
first placed on a slowly rotating treadmill that kept them awake for 2h, and in statistical
analysis 2 (see below) dialysis samples collected during the second hour served as
reference to compare samples collected during the following 9h of the light period (first
two groups) or of the dark period (third group). Figure 1D shows the percent of time mice
in each of the three groups spent awake during each 15-min sampling bin.
Group 1: Sleep for 6h followed by wakefulness on treadmill for 3h (S6-W3; n=7 mice)
At 7am, one hour before lights-on, each mouse was placed on a slowly moving
treadmill (speed ≈ 0.7 cm/sec) and the flow for microdialysis probe was activated (1.1 µL
/ min). The mouse was awake while slowly moving on the platform, and four microdialysis
samples were collected during the second hour to serve as reference. The mouse was
then returned to its cage and allowed to sleep for 6h. After ad libitum sleep, at 3pm the
mouse was placed back on the slowly moving treadmill for 3h, to obtain EEG recordings
and microdialysis samples during a “standardized” period of wakefulness, in which the
mouse behavior was as homogenous as possible.

142
Group 2: Sleep deprivation for 6h followed by sleep for 3h (SD6-S3; n = 6 mice)
As described above, mice were placed on the slowly moving treadmill starting at
7am and the second hour was used as reference. Mice were then returned to their cage
and kept awake by exposure to novel objects for 6h, followed at 3pm by ad libitum sleep
for 3h.
Group 3: Spontaneous wakefulness for 6h followed by wakefulness on treadmill for 3h
(W6-W3; n = 6 mice)
Mice were placed on the slowly moving treadmill for 2h starting at 7pm, one hour
before lights-off, and the second hour served as reference. At 9pm mice returned to their
cage and as expected, were spontaneously awake for most of the time. A novel object
was placed in the cage every ~30 min to help maintain a sustained period of wake, but if
the mouse slept, it was allowed to do so and microdialysis samples were not used for
subsequent analyses. At 3am mice were placed back on the treadmill for 3h.
2.3.6 Untargeted Metabolomics using UPLC-HRMS
Mass spectrometry (MS) is a key approach for metabolic profiling of the brain by
making possible the simultaneous measurement of thousands of molecules from a small
volume sample (Patti et al., 2012). The present study used an untargeted approach to
determine how many metabolites could be identified in each dialysis sample, and a
targeted approach to query the structure of some unidentified spectral features. Prior to
untargeted analyses, a 15-μL aliquot of each microdialysis sample was diluted to 50 μL
of total volume using Ringer’s solution. Instrumentation for untargeted metabolomics
analysis included an Ultimate 3000 LC pump in line with an Exactive Plus Orbitrap™
mass spectrometer (Thermo Scientific). Ultra-performance liquid chromatography
(UPLC) was accomplished under previously established chromatography (Stough et al.,
2016) using a Synergi Hydro-RP column (100 mm x 2.1 mm, 2.5 μm, 100 Å). Metabolites
were detected using high-resolution mass spectrometry (HRMS) in negative mode with
an electrospray ionization (ESI) source.

143
Following detection, raw data were compiled using the Metabolomic Analysis and
Visualization Engine (MAVEN) software package (Melamud et al., 2010). Known
metabolites were selected from a pre-existing list of ~300 compounds based on exact
mass and previously determined retention times (Lu et al., 2010). Metabolite selection
resulted in the reliable identification of more than 40 small molecules in more than 80%
of subjects; Group 1 (31 ± 16, mean ± SD), Group 2 (47 ± 8), and Group 3 (45 ± 5).
Additionally, MAVEN enabled the extraction of all spectral features detected during
analysis. Each spectral feature refers to a potential metabolite with an exact parent mass
detected at a specific retention time. After removal of “known” metabolites and carbon-13
isomers, the remaining spectral features were classified as “unknown”. Total unknown
features: Group 1 (2436 ± 850, mean ± SD; range, 998 - 3755), Group 2 (2388 ± 1529;
range, 388 - 5016), and Group 3 (2297 ± 846; range, 947 - 2899).
2.3.7 Statistical Analysis
Pre-processing normalization
Known metabolites were filtered independently of brain region and must be
observed in at least three mice per treatment condition. This selection criteria provided a
list of 36 and 33 metabolites in mPFC and M1, respectively. It should be noted that 2/3 of
the missing data is accounted for by 3 mice from the sleep treatment condition. Samples
from these subjects were collected without error, analyzed without technical
complications, and statistically provided no evidence as significant outliers. For these
reasons, these subjects were included in the final data analyses. Raw ion intensities were
normalized to the baseline samples collected during the first hour of analysis. To generate
a z-score normalized matrix, raw values were subtracted from the per
mouse/location/metabolite mean, then divided by the standard deviation. To minimize the
number of missing data points, the time domain was coarse-grained into 1-hour segments
(i.e. 4, 15-minute sample collections), reducing the data set to 9-time points. To complete
multivariate analysis, a full dataset was required, and the remaining missing data points
were replaced in the following manner. For metabolites that were not detected in a mouse,
these values were replaced with the metabolites within treatment/location/time average.
The remaining missing data points were filled in with the k = 2 nearest neighbor.

144
Multivariate Analysis
Partial least squares discriminant analysis (PLSDA) was used as a classification
model. This analysis included the combined data from mPFC and M1 comparing the 6-
hour metabolic profiles of sleep (S6; blue), wake (W6; green), and sleep deprivation (SD6;
red). PLSDA computation was accomplished using the DiscriMiner package and plsDA()
function in R. Figures were generated using the ggbiplot package. Model predictive
accuracy was performed to validate the results using a repeated, stratified k-fold (k = 3)
cross validation. This approach applied a learning set to prevent over-fitting of the data.
A unique function of this technique is the feature classification model that produces a list
of variable importance of projection (VIP) scores for each metabolite. VIP scores were
extracted from the plsDA() function and plotted in Excel.
Heatmap Analysis
Heatmap analysis allows for facile interpretation of metabolic changes across
treatment conditions by converting a numerical value to a defined color scale. Treatment
group differences were calculated from the normalized z-score data (i.e. Δ z-score) and
expressed temporally using the 9-hour coarse-grained data. The first 9-hour segment
compares 9am to 3pm (i.e. 1 thru 6) of S6 and SD6, then 3pm to 6pm (i.e. 7 thru 9) of S6-
W3 and SD6-S3; second segment, 9am to 3pm of S6 and 9pm to 3am of W6, then 3pm
to 6pm of S6-W3 and 3am to 6am of W6-W3; and third segment, 9am to 3pm of SD6 and
9pm to 3am of W6, then 3pm to 6pm of SD6-S3 and 3am to 6am of W6-W3. The saturated
color scale ranges from ±3, where the metabolites concentration is blue when higher in
sleep, red when higher in sleep deprivation, or green when higher in wake. Heatmaps
were generated in R with the ggplot2 and colorspace packages.
Linear Mixed Effects Model
Statistical analyses of the microdialysis samples were performed using LME
models (Laird and Ware, 1982; Lindstrom and Bates, 1988). LME models are one of the
few statistical techniques that are appropriate for analyzing repeated measures data, as
most traditional parametric statistical techniques rely on the assumption of independence
between data points. The other common approach for this type of data is a repeated

145
measures ANOVA, but the LME analysis is more flexible with respect to missing data,
and our analysis included many missing values, due to the absence of a compound at a
specific time point or brain region, and/or due to a mouse that did not meet the criteria for
sleep or wake at a given time point.
A linear mixed effect model includes both “fixed” and “random” effects, allowing to
determine the effect of a variable with a fixed number of states (in our case, the 3
behavioral conditions of either sleep, spontaneous wake or sleep deprivation), while
simultaneously controlling for the effects of another variable for which only a random
sample of possible values are observed (e.g., a random sample of mice). A mixed effect
model has the form
𝑌𝑖,𝑡 = 𝛽0 + 𝑏𝑖,0 + ∑ 𝛽𝑝𝑋𝑖,𝑡,𝑝
𝑃
𝑝=1
+ ∑ 𝑏𝑖,𝑞𝑍𝑖,𝑡,𝑞
𝑄
𝑞=1
+ 𝜖𝑖,𝑡
where,
𝑏𝑖,𝑞 ∼ 𝑁(0, 𝜎𝑞2),
and
𝜖𝑖,𝑡 ∼ 𝑁(0, 𝜎2).
In this model, Yi,t is the response variable, in our case the compound sample of the ith
mouse at the tth time point. The residuals ϵi,t were assumed to be independent and
normally distributed with constant variance. To ensure the assumptions of normality and
constant variance were satisfied, response values for some compounds were
transformed using a log or square root transformation. The βp values correspond to the
fixed effects in the model and b0,q are the random effects, which are assumed to be
normally distributed, with mean zero and constant variance. The design matrices X and
Z contain the values for each fixed and random explanatory variable respectively.
Parameters for the LME models were estimated numerically using the lme4 library for the
R software package (Bates et al., 2015).

146
All data were baseline corrected before modeling by subtracting out the average
value of the compound in the second baseline hour on the treadmill. A model selection
procedure was applied separately for each analysis. Following (Bolker et al., 2008), we
included as many random effects terms in each model as the data supported; when the
variance of a random effect went to zero or two random effects became perfectly
correlated then the model was over parameterized. Once the structure of the random
effects was determined, the Akaike Information Criterion (Akaike, 1974) was used to
select the set of fixed effects in the model.
Statistical analysis of the LMEs was performed using likelihood ratio tests,
comparing the full model as identified by the model selection procedure with a reduced
model with the effect of condition removed. Depending on the specific form of the fixed
effects in the model, this could result in a test for a main effect of condition, a condition x
time interaction, a condition x brain region interaction, or a condition x time x brain region
three-way interaction.
Classification Analysis
Microdialysis samples were further analyzed using machine learning algorithms in
an effort to determine whether behavioral state sampling epochs could be accurately
classified as sleep, spontaneous wake or enforced wake. Baseline correction was applied
before classification, as with the above LME analysis. Because the number of explanatory
variables was so much greater than the number of mice in the study, we applied the
LASSO to fit a sparse model and prevent over-fitting the data (Tibshirani, 1996).
Classification accuracy was assessed using a 4-fold stratified cross-validation. Briefly, the
population was divided into 4 groups, with the number of mice from each condition
approximately equal for each group. Three of the groups were used to train the model
(training set) and the remaining group was used to test the accuracy (test set). This
process was repeated, so that every group (and thus every mouse) was used as the test
set exactly once. All machine learning analysis were performed using the Python package
Scikit-learn.

147
Significance testing for the classifiers was performed using a nonparametric
permutation test. The condition labels for the mice were randomly permutated to remove
any distinctions between the groups, and then the classifiers were reapplied, capturing
the expected accuracy under the hypothesis of no differences. This method captures both
the fact that chance levels of accuracy are 50% (33% for 3-way classification) and the
structure of the design matrix, i.e., the number of predictor variables compared to the
number of observations. The structure of the design matrix is important to consider
because with so many predictors, one might expect to do better than chance, even in the
absence of a true difference between groups.
2.4 RESULTS
Microdialysis samples were collected simultaneously in the mPFC and M1 of B6
mice over a 10-hour time period in 15-minute increments, resulting in a total of 1, 571
dialysate samples for analysis (Figure 2.1A, B). Experiments were performed in 3
separate groups of animals, all of which well entrained to the light/dark cycle. All mice
spent the first 2 hours awake, slowly moving on a treadmill, and were then studied during
the following 9 hours in different sleep/wake conditions (Figure 2.1C). The first 2 groups
were studied during the light phase, one group during a sustained period (~6h) of sleep
followed by 3h of wake on the treadmill (S6-W3), and the other group during 6h of sleep
deprivation enforced by exposure to novel objects, followed by 3h of sleep (SD6-S3).
Thus, these two groups of animals were studied at the same time of day and in the same
lighting conditions (lights on) but on average, they spent each of the last 9 hours of the
experiment in opposite behavioral states (sleep or wake). The third group of mice was
studied at the opposite circadian time, during the dark phase, and spent the last 9 hours
awake, the first 6 hours in their cages, and the last 3 hours on the treadmill (W6-W3). In
each mouse microdialysis samples were collected every 15 minutes (Figure 2.1D). The
combination of these 3 groups, including enforced wake during the day and spontaneous
wakefulness at night, allowed us to assess the effects of sleep and wakefulness
independent of possible confounding factors due to time of day, light exposure, and

148
Figure 2.1 Experimental design
(A) schematic diagram showing the placement of the microdialysis probes, EEG
electrodes and EMG wires; (B) set-up for EEG recording and microdialysis; (C) the 3
experimental groups. (D) mean % of wake for each group in 15-min intervals. For each
group, time points in black indicate the first two hours of the experiment, when all mice
were on the treadmill, to obtain a “reference” condition of standardized wakefulness. Blue
time points indicate the periods when mice had the opportunity to sleep. Time points in
red indicate the period of sleep deprivation using novel objects. Time points in orange
show when mice were either spontaneous awake at night or placed on the treadmill for
the last 3 hours of the experiment.

149
stimulation (novel objects) used to enforce wakefulness during the day, when mice would
spontaneously sleep.
From the mPFC and M1, respectively, of each experimental group, the following
microdialysis samples totals were collected; 286 and 290 from Group 1 (N = 7), 242 and
251 from Group 2 (N = 6), and 249 and 252 from Group 3 (N = 6). Following collection, a
10 µL injection of each sample was analyzed by an untargeted metabolomics method
using UPLC-HRMS.
2.4.1 Temporal Fluctuation of Identified Metabolites
First, known metabolites were compared in a pairwise fashion between treatment
groups using Δz-score of metabolite intensities as a proxy for relative metabolite
concentrations (Figure 2.1). To visualize these data, heatmaps (Saldanha, 2004) were
constructed that compared metabolite levels across each possible pair of experimental
groups in mPFC and M1. This visualization, shown in Figure 2, conserves the temporal
sampling provided by in vivo microdialysis while allowing for the interpretation of
metabolic trends between treatment conditions. The saturated color scale ranges from
±3, and the heatmaps were generated in R with the ggplot2 and colorspace packages.
Metabolites have been organized into their respective metabolic pathways and changes
in both brain regions have been aligned to assist in visual comparison of metabolic
changes. Note that the heatmap is designed to help visualize the temporal patterns of
metabolite levels but does not capture the statistical reliability of such patterns, which was
done using LME models (see below). Metabolites identified as statistically significant by
the LME models have been marked with an asterisk and bold text.
2.4.2 Results of LME Analysis
We applied 3 linear mixed effect models to each metabolite, one “between groups”
model that compared the levels of the compound during the first 6 consecutive hours of
either sleep, spontaneous wakefulness or enforced wakefulness (S6, SW6, EW6), and
two “within group” models that compared the levels of each metabolite during 9
consecutive hours (S6-EW3, EW6-S3). To be considered as state-dependent, a known
metabolite (or unidentified spectral features) was required to meet the following strict

150
Figure 2.1 Heatmap analysis of mPFC and M1
Graphical representation of the Δ z-score metabolite levels between microdialysis samples collected from mPFC and M1
during 6 hours of sleep (S6), sleep deprivation (SD6), and spontaneous wakefulness (W6), and 3 hours of post-sleep
wakefulness (S6-W3), post-sleep deprivation sleep (SD6-S3), and post-wake wakefulness (W6-W3). Each cell represents
1-hour coarse grained average ion intensity. Array comparisons are labeled above each panel, and a ±3 color legend is
found on the right (S6 and S6-S3, blue; SD6 and SD6-S3, red; W6 and W6-W3, green). To facilitate interpretation,
metabolites have been organized by metabolic pathway (pathway names down the middle of respective heatmaps) and text
was made bold, with an asterix (*) when identified as significant by LME analyses.

151
criteria: 1) show a statistically significant change in at least one model (p < 0.05); 2)
show biologically consistent changes, even if they did not reach significance, in the
other models.
Among the known metabolites (36 in mPFC and 33 in M1) 11 of them (11/36, 30%)
were modulated by sleep and wakefulness according to the strict criteria discussed
above, i.e. consistently across the 3 comparisons (Table 2.1): D-gluconate, glutamate,
homovanillic acid, lactate, N-acetyl-beta-alanine, N-acetylglutamine, orotate, pyruvate,
succinate/methylmalonate, tryptophan, and uridine. All analytes decreased throughout
the sleep period relative to both wake conditions (Figure 2.2A and B). One analyte
(homovanillc acid) had a significant condition by brain region interaction, showing state-
dependent changes primarily in mPFC. Several other metabolites, including
homoserine/threonine, uracil, and valine, showed highly significant temporal effects in all
3 behavioral states, with levels decreasing from hour 1 to hour 9. We assume this profile
likely reflects some form of “depletion” during prolonged sampling and these analytes are
not further discussed.
2.4.3 Classification Analysis
Next, we used partial least squares discriminant analyses (PLSDA) to determine
whether global metabolic profiles during the first 6 hours of sleep, enforced wakefulness,
and spontaneous wakefulness could be used to accurately distinguish between the 3
behavioral states. PLSDA is a commonly used statistical approach in metabolomics
because is properly suited for an uneven design matrix, in which the number of dependent
variables (e.g. detected metabolites) is larger than the number of independent variables
(e.g. number of samples). Indeed, we found that the metabolite profile from all 3
experimental groups (S6, EW6, SW6) was sufficient to classify the state of arousal using
data from both mPFC and M1., The PLSDA model perfectly classifies the mice into their
respective experimental conditions, As shown in Figure 2.2A plotting the PLSDA score
values of PLS Component 1 and PLS Component 2 demonstrates visible clustering and
clear separation between the 3 experimental groups. Additionally, PLSDA identifies the
metabolites that drive the separation among conditions by ascribing a variable importance
of projection score (VIP). As the weighted sum of the squared correlations between
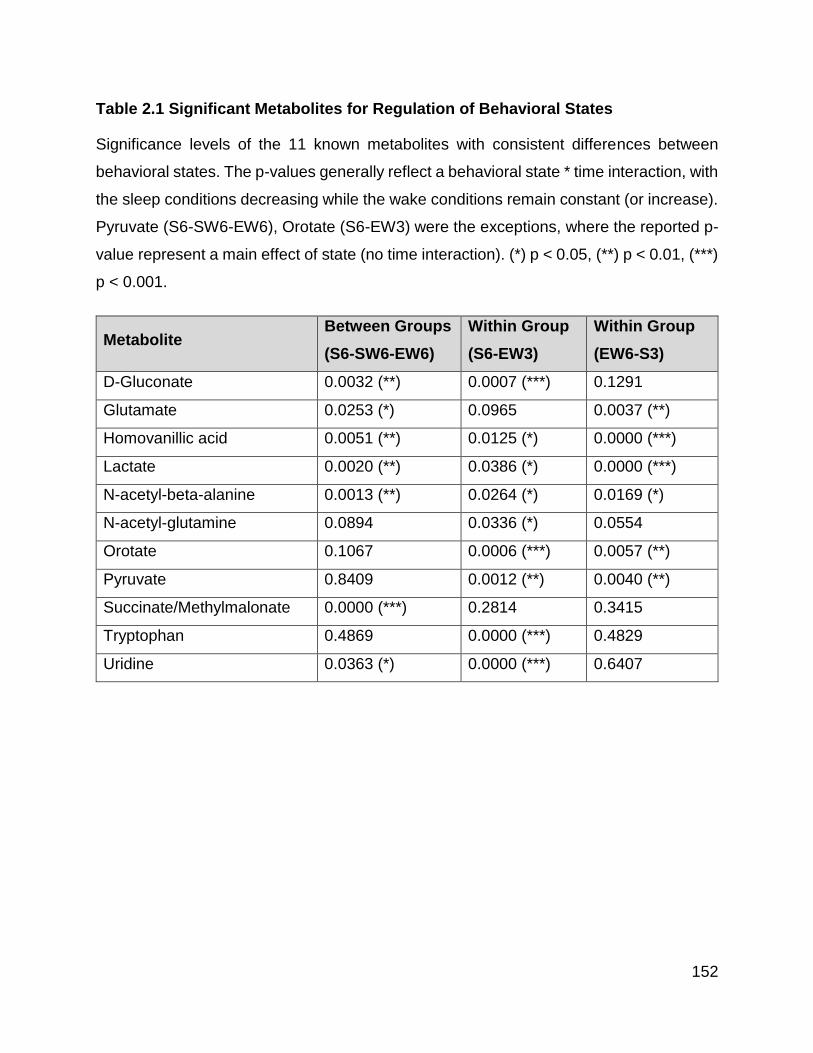
152
Table 2.1 Significant Metabolites for Regulation of Behavioral States
Significance levels of the 11 known metabolites with consistent differences between
behavioral states. The p-values generally reflect a behavioral state * time interaction, with
the sleep conditions decreasing while the wake conditions remain constant (or increase).
Pyruvate (S6-SW6-EW6), Orotate (S6-EW3) were the exceptions, where the reported p-
value represent a main effect of state (no time interaction). (*) p < 0.05, (**) p < 0.01, (***)
p < 0.001.
Metabolite Between Groups
(S6-SW6-EW6)
Within Group
(S6-EW3)
Within Group
(EW6-S3)
D-Gluconate 0.0032 (**) 0.0007 (***) 0.1291
Glutamate 0.0253 (*) 0.0965 0.0037 (**)
Homovanillic acid 0.0051 (**) 0.0125 (*) 0.0000 (***)
Lactate 0.0020 (**) 0.0386 (*) 0.0000 (***)
N-acetyl-beta-alanine 0.0013 (**) 0.0264 (*) 0.0169 (*)
N-acetyl-glutamine 0.0894 0.0336 (*) 0.0554
Orotate 0.1067 0.0006 (***) 0.0057 (**)
Pyruvate 0.8409 0.0012 (**) 0.0040 (**)
Succinate/Methylmalonate 0.0000 (***) 0.2814 0.3415
Tryptophan 0.4869 0.0000 (***) 0.4829
Uridine 0.0363 (*) 0.0000 (***) 0.6407

153
Figure 2.2 Observation of z-score fluctuation in LME significant metabolites
Line graphs represent the absolute z-score values across the 3 treatment conditions; S6-
W3, SD6-S3, and W6-W3, for the 11-significant metabolite, as determined by LME
analysis. Middle line represents the mean z-score, and outside fill section refer to the
standard deviation. Data from both (A) mPFC and (B) M1 brain regions. States of
consciousness are color coded to show states of sleep (S/RS) as blue, spontaneous wake
(SW) as green, and extended wake (EW) as red. S6-W3; blue, first six hours and red,
final three hours. SD-S3; red, first 6 hours and blue, final three hours. W6-W3; green, first
six hours and red, final three hours.

154
Figure 2.2A Continued
(A)

155
Figure 2.2 B Continued
(B)

156
PLSDA components and the original variables, these values represent the percentage of
variation explained by the component in the model. Generally, a VIP greater than 1.0 is
considered most significant (i.e., metabolites with VIP > 1 strongly contribute to the
observed differences among groups). The 15 metabolites with the highest VIP scores are
listed in Figure 2.3B (mPFC) and 2.3C (M1).
With so many explanatory variables and a relatively small number of mice,
overfitting the PLSDA model was a concern. To better understand how the results will
generalize, a K-fold stratified cross-validation procedure was used to estimate the
accuracy of the classifier and statistical significance was assessed using non-parametric
permutations tests. The cross-validation analysis resulted in an estimated accuracy of
76.4%, which was significantly greater than chance (p < 0.05). We then explored
alternative classification models to see if we could improve on the accuracy of PLSDA.
The best accuracy was achieved using a logistic regression classifier with an ℓ2
regularization penalty with sparsity parameter C = 0.001 (smaller values of C restrict the
model and promote more sparsity). For this classifier the cross-validation procedure
resulted in an estimated accuracy of 83%, which was significantly greater than chance (p
< 0.001). Further exploring the ability for this classifier to pair-wise discriminate between
conditions, we found that the sleep condition was distinguished from the two wake
conditions with greater accuracy (S vs. SW accuracy 91.8%, p < 0.01; S vs. EW accuracy
100%, p < 0.01) than the two wake conditions could be distinguished from each other
(SW vs. EW accuracy 82.1%, p = 0.003). This is consistent with the visualization of the
PLSDA model (Figure 2.3A), in which the clusters corresponding to the 2 wake conditions
are closer to each other than they are to the sleep cluster.

157
Figure 2.3 PLSDA accurately classifies states of arousal and associated VIP
classification model ascribes significant features
By combining the mPFC and M1 analyses, data from S6, SD6, and W6 were used in the
PLSDA to determine the overall variation between treatment conditions. (A) The PLSDA
plot shows significant separation of SD6 from S6 and W6 in Component 1, and additional
separation of S6 from W6 and SD6 in Component 2. Ellipses represent a confidence
interval of 95%. VIP score plots were generated from PLSDA calculation, where a value
greater than 1.0 is considered most significant for the observed separation. In the mPFC
(B) and M1 (C), the top-15 metabolites are highlighted as potential points of difference.
An asterisk (*), and bold text represents metabolites that were significant based on linear
mixed effects model.

158
Figure 2.3A Continued
(A)
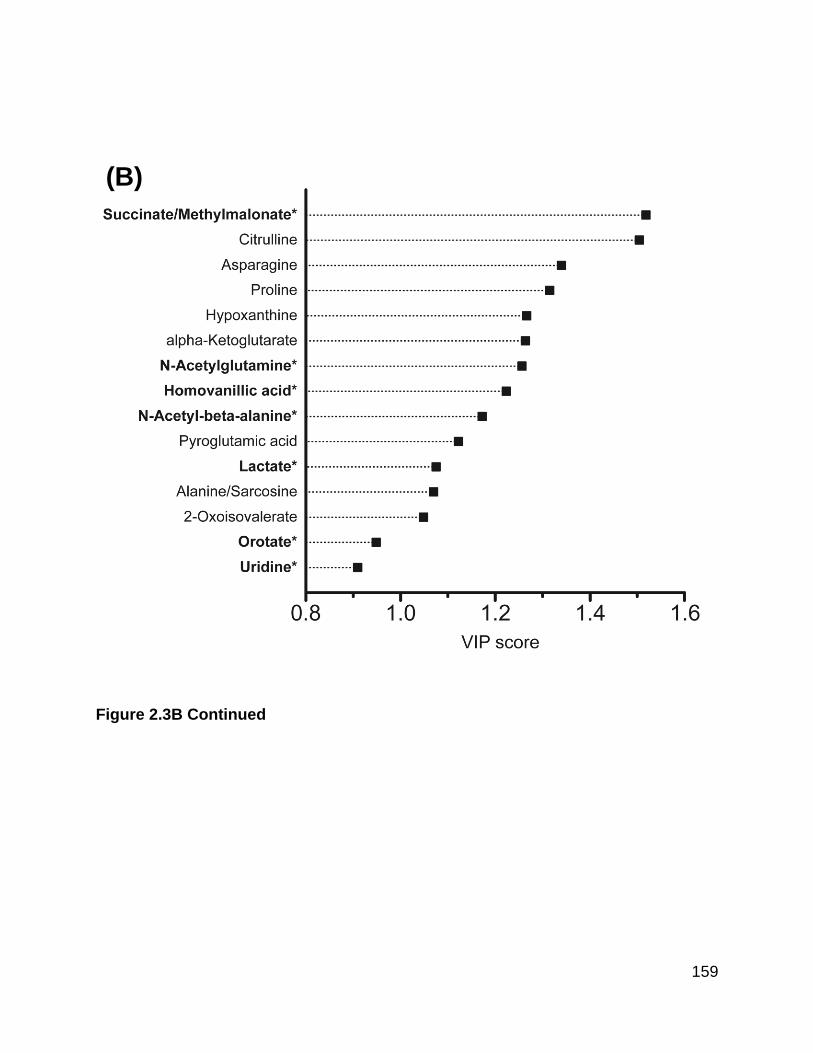
159
Figure 2.3B Continued
(B)

160
Figure 2.3C Continued
(C)

161
2.5 DISCUSSION
Many previous microdialysis studies measured neurotransmitters, neuropeptides
and metabolites in the rodent brain across the sleep/wake cycle. In some experiments
the high temporal resolution of biosensors was used to detect rapid changes in cortical
levels of glutamate, lactate and glucose during wake, NREM sleep and REM sleep (Dash
et al., 2013; Dash et al., 2009; Dash et al., 2012; Naylor et al., 2012; Wisor et al., 2013).
In these reports, however, one or at most a few analytes were measured (Lena et al.,
2005; Watson et al., 2011). A recent study did apply liquid chromatography and online
mass spectrometry to the mouse prefrontal cortex to test a metabolomics platform of
almost 300 metabolites, of which approximately 120 were identified in the extracellular
fluid (Kao et al., 2015), but sleep/waking changes were not studied. Thus, to our
knowledge, this is the first study providing a broader view of metabolome changes in the
cortical extracellular space across the sleep/waking cycle and after sleep deprivation.
We reliably (in at least 50% of mice) detected 33 metabolites in M1 and 36 in
mPFC. According to the LME model analysis, 11 of these metabolites were present at
significantly higher levels after wake, in most cases after both spontaneous and forced
wake and in both cortical regions, while no metabolite was detected at higher levels after
sleep. A similar trend was present among the 14 differentially regulated unidentified
spectral features, with 12 upregulated in wake and 2 in sleep. This “imbalance” between
waking-related and sleep-related compounds is not new. Among the hundreds of
transcripts modulated by sleep and wake in neurons, astrocytes, and oligodendrocytes of
rat and mouse cortex, the majority were “wake” transcripts whose expression was higher
in both spontaneous and forced wake than in sleep (Bellesi et al., 2015; Cirelli et al.,
2004), reflecting either increased transcription and/or decreased degradation of mRNAs
during waking. In the current study, higher wake levels of analytes could reflect increased
synthesis, decreased utilization, and/or decreased elimination by the glymphatic system
that drives exchange of interstitial fluid with cerebrospinal fluid (Iliff et al., 2012; Xie et al.,
2013). Wake-related metabolites reflect different signaling pathways and cellular
processes and most, but not all, of them were already known to be differentially expressed

162
across behavioral states. Below we first discuss each metabolite, and then summarize
our results in light of other metabolic studies in peripheral tissues.
Glutamate is the primary excitatory neurotransmitter released into the
extrasynaptic space. The extracellular concentrations of glutamate are positively
correlated to the regulation of sleep-wake states (Dash et al., 2009). The glutamate-
glutamine cycle is primary cellular nitrogen metabolism where glutamate is converted to
glutamine in the astrocytes, then released into the extracellular matrix for re-uptake into
a neuron and conversion back to glutamate or to GABA. Additionally, the glutamate-
leucine cycle is essential for the formation of glutamate in the cell because leucine can
pass the blood brain barrier followed by conversion to glutamate in the astrocyte. In
combination, these two metabolic cycles are essential for the formation of glutamate and
proper function of the cell. Our study correlates positively to the research of Dash et al.,
2009 where they found that glutamate levels were increased during periods of wake and
sleep deprivation. In the SD6-S3 mice, glutamate levels spike as sleep pressure
increases, then return to normal levels as the subjects move to recovery sleep. A similar
pattern exists across both brain regions.
Two other energy metabolites were upregulated in wake relative to sleep, pyruvate
and lactate, consistent with previous studies in rats and mice (Dash et al., 2012; Naylor
et al., 2012; Reich et al., 1972; Shram et al., 2002). Lactate is mainly derived from glucose
and glycogen via aerobic glycolysis inside neurons (Lundgaard et al., 2015) and
astrocytes (Belanger et al., 2011), although astrocytes can also produce lactate from the
metabolism of glutamate via the Krebs cycle (McKenna, 2012). The sleep-related drop in
lactate levels, which depends on the activity of the glymphatic system (Lundgaard et al.,
2015), is correlated with changes in SWA, a marker of sleep pressure (Dash et al., 2012).
These findings suggest that the regulation of sleep need is linked to glycolytic processes
(Wigren et al., 2009) and astrocytic functions (Haydon, 2017; Magistretti, 2009, 2011),
but the underlying mechanisms remain unclear. The oxygen to glucose ratio in the brain
is 5.1-5.4:1, below what would be expected from the full oxidation of glucose (6 mol of
oxygen are needed to fully oxidize 1 mol of glucose). This ratio further declines with
neuronal activation (Dienel and Cruz, 2016), indicating that the awake brain relies more

163
on glycolytic processes than the sleeping brain (Dienel and Cruz, 2016; DiNuzzo and
Nedergaard, 2017). From a purely energetic point of view this seems paradoxical, since
aerobic glycolysis produces far fewer ATP molecules than oxidative phosphorylation.
However, aerobic glycolysis is stimulated in conditions of synaptic growth, is blocked by
inhibition of the noradrenergic system (Dienel and Cruz, 2016), and lactate released from
astrocytes excites locus coeruleus neurons and increases NA release (Tang et al., 2014).
Lactate may also serve as a volume transmitter and the G protein coupled lactate receptor
GPR81 is concentrated in the synaptic membranes of excitatory synapses (Lauritzen et
al., 2014). Thus, lactate upregulation during wake may reflect more the need for synaptic
growth and potentiation than increased energy demand. The latter could be met via
increases in oxidative phosphorylation, and indeed mitochondrial enzymes of the
respiratory chain are upregulated during waking (Nikonova et al., 2010).
The gluconate shunt is a less known metabolic pathway that can facilitate the
breakdown of glucose. It has been studied mainly in plants and microorganisms but key
enzymes of the shunt, glucose dehydrogenase and gluconate kinase, have been
identified in mammals (Rohatgi et al., 2014). In this pathway glucose is oxidized by
glucose dehydrogenase to gluconic acid (or gluconate). Gluconate is then phosphorylated
by gluconate kinase to produce 6-phosphogluconate, the second intermediate of the
pentose phosphate pathway, thus bypassing the first rate-limiting step of this pathway
(Corkins et al., 2017). The main function of the pentose phosphate shunt is anabolic rather
than catabolic, producing pentose sugars for the synthesis of nucleic acids and amino
acids. Thus, like lactate, increased gluconate levels during wake may signal the need for
growth, rather than energy.
From the pyrimidine pathway, two metabolites were identified as significant.
Orotate (orotic acid) is an essential intermediate in the de novo pyrimidine pathway that
provides critical components for the synthesis of DNA, RNA, sugars, glycogen as well as
phosphatidylcholine and phosphatidylethanolamine, the major phospholipids of the
cellular membranes (Gerlach et al., 2011; Loffler et al., 2015). Orotate is the product of
dihydroorotate dehydrogenase, the only enzyme in the pathway directly connected to the
respiratory chain via its localization to the inner mitochondrial membrane. All genes

164
responsible for the synthesis of pyrimidines are expressed at high levels in cortex and
other brain regions (Gerlach et al., 2011), suggesting that the brain’s need for pyrimidines
may be met not only by the uptake of uridine from the blood, as previously believed, but
also by in situ production. Like lactate and gluconate increased orotate levels during wake
may signal the need for the synthesis of many essential components, from nucleic acids
to cellular membranes. Uridine is a pyrimidine-analogue that is one of the five standard
nucleosides but is only found in ribonucleic acid (RNA). This metabolite is actively
produced as uridine monophosphate through a de novo synthesis involving the
decarboxylation of orotidine monophosphate (the primary metabolite of orotate). These
two metabolites are directly linked in pyrimidine metabolism and exhibit a positive
correlation from our results, where the highest concentration is found in extended wake
following natural wake (i.e. W6-W3).
Two other metabolites upregulated during waking, homovanillic acid (HVA) and
tryptophan, reflect the activity of two well-known groups of wake-active neurons. HVA is
one of the major dopamine (DA) metabolites and a valid indicator of DA turnover. DA
extracellular levels in the mPFC are increased by novelty and higher during waking than
during sleep (Feenstra et al., 2000; Lena et al., 2005), consistent with the fact that DA
neurons in the ventral tegmental area, which project to mPFC, are more active during
wake than during sleep and promote arousal (Eban-Rothschild et al., 2016; Taylor et al.,
2016). Tryptophan is an essential amino acid and the precursor of the neurotransmitter
serotonin. Like DA neurons in the VTA, serotonin neurons in the dorsal raphe are more
active during waking than during sleep and extracellular levels of serotonin are higher in
waking than in sleep in different brain regions, including prefrontal cortex (Ursin, 2002).
N-acetylglutamine (NAg), commonly referred to as Aceglutamide, is an acetylated
analogue of glutamine. Sold under the brand name Neuroamina, this compound is
currently an experimental pharmaceutical used as a psychostimulant and nootropic (class
of compounds that reportedly improve cognitive function by modulating neurotransmitter
activity) to improve memory and concentration (Ganellin and Triggle, 1996). Information
on this compound are challenging to find currently, as research is actively being
conducted on this compound. In parallel with our results, we see a large increase of NAg

165
across both wake models, and no decrease during recovery sleep. This interpretation
makes NAg an interesting compound for further analysis as this may play a significant
role in cognitive awareness during wake.
N-acetyl-beta-alanine is an endogenous β amino acid that can be converted to
acetate and β alanine by N-acetyl-β alanine dehydrogenase (Fujimoto et al 1968;
Chesnoy-Marchais, 2016). In the brain, however, the best characterized pathway leading
to β-alanine synthesis is the deamination and carboxylation of the pyrimidine uracil
(Hayaishi et al., 1961; Tiedje et al., 2010), while very little is known about N-acetyl-β
alanine dehydrogenase. β-alanine is a molecular intermediary of GABA and glycine with
a very similar mechanism of action, and is considered an inhibitor neurotransmitter (Juge
et al., 2013). Thus, the upregulation of N-acetyl-beta-alanine during waking is difficult to
interpret, and it is not clear whether it linked to changes in β-alanine.
The metabolomics field can establish tremendous insights from the known
compounds using untargeted techniques, but the investigation of the unexplored space
of unidentified spectral features offers a unique opportunity. Although annotation of these
features presents challenges, as the field progresses, the information gained from these
early untargeted studies could lead to the discovery of major influence from novel
pathways and metabolites. The unidentified spectral features highlighted in this
manuscript revealed similar trends to the known metabolites, meaning they had an
elevated concentration in states of wake when compared to sleep. These trends reveal
that an unexplored space of metabolomics could lead to new information about various
states of consciousness.
2.5.1 Comparisons with Previous Metabolomics Studies
One study applied both liquid and gas chromatography coupled with mass
spectrometry to mouse cortical homogenates and identified 226 compounds, of which 20
changed in mice sleep deprived for 6 hours relative to controls allowed to sleep, mostly
belonging to the glycolytic pathways (SD increase in alanine and lactate) and to lipid
metabolism (SD increase in lysolipids due to breakdown of membrane phospholipids)
(Hinard et al., 2012).

166
In humans, metabolomics analysis of plasma found that the majority of the
identified compounds (109/171) showed time of day variations, but only 27 of them were
affected by 24 hours of sleep deprivation. These included tryptophan, serotonin, taurine,
8 acylcarnitines, 13 glycerophospholipids, and 3 sphingolipids, all of which increased after
24 hours of sleep deprivation (Davies et al., 2014). In the same subjects, metabolomic
analysis of urine samples found that out of 32 identified metabolites, 7 (22%) changed
due to time of day, and 16 due to sleep deprivation, with 8 increasing and 8 decreasing
due to sleep loss (Giskeodegard et al., 2015).
Another study used serum from sleep restricted rats from 2 independent
experiments (5 days; 20h/day): 3,380 unique metabolic species were measured, 407
identified, and 38 of them changed due to acute (1 day) sleep restriction; of them, 28 were
identified and were mainly (18/28) lipids, especially phospholipids (Weljie et al., 2015).
Among the non-lipid metabolites, isocitrate (Krebs/lipogenesis), urocanic acid (histidine
catabolism) and oxalic acid (glycolate metabolism) were reduced, while valine, leucine,
N-methyl-alanine were increased. After chronic (5 days) sleep restriction, 18 known
metabolites changed, including 15 lipids, as well as glycine (decreased) and sucrose and
malate (increased). Of note, the number of metabolites consistently affected in the 2
experiments was only ~10% of all analytes found to be changing in each separate
experiment, stressing the importance of using multiple experimental groups to identify
biologically significant differences, as we did here by comparing 3 independent groups of
animals.
In a parallel study of 5 days of sleep restriction in humans, 92 metabolites were
identified as potentially significant, 32 of which as lipids or fatty acid related compounds;
tryptophan and phenylalanine increased, and oxalic acid decreased with sleep loss;
overall, two metabolites were decreased with sleep loss in both species, oxalic acid and
diacylglycerol 36:3.

167
2.6 CONCLUSION
The completion of this study marks the first global metabolomics experiment from
a temporal analysis of two brain regions simultaneously comparing the sleep/wake cycle
to sleep deprivation. We have conclusively shown that many metabolites can be detected
from a limited sample volume, confirming that a temporal resolution of 15-minutes using
microdialysis coupled with LC-MS untargeted metabolomics is achievable. In this study,
the issue of missing data points was exemplified due to small sample volume and
metabolite concentrations. We have provided a standard protocol for the statistical
handling of temporal data from microdialysis samples that should be utilized in future
analyses.
The results of this study conclude that sleep deprivation perpetuates a demanding
strain on the neuronal cellular metabolism. We have provided a list of 11 small molecules
that should be analyzed in detail during future studies.

168
REFERENCES
1. Cirelli, C.; Gutierrez, C. M.; Tononi, G., Extensive and divergent effects of sleep and wakefulness on brain gene expression. Neuron 2004, 41 (1), 35-43.
2. Bellesi, M.; Pfister-Genskow, M.; Maret, S.; Keles, S.; Tononi, G.; Cirelli, C., Effects of sleep and wake on oligodendrocytes and their precursors. The Journal of neuroscience : the official journal of the Society for Neuroscience 2013, 33 (36), 14288-300.
3. Mackiewicz, M.; Shockley, K. R.; Romer, M. A.; Galante, R. J.; Zimmerman, J. E.; Naidoo, N.; Baldwin, D. A.; Jensen, S. T.; Churchill, G. A.; Pack, A. I., Macromolecule biosynthesis - a key function of sleep. Physiol Genomics 2007, 31, 441-57.
4. Maret, S.; Dorsaz, S.; Gurcel, L.; Pradervand, S.; Petit, B.; Pfister, C.; Hagenbuchle, O.; O'Hara, B. F.; Franken, P.; Tafti, M., Homer1a is a core brain molecular correlate of sleep loss. Proceedings of the National Academy of Sciences of the United States of America 2007, 104 (50), 20090-5.
5. Mongrain, V.; Hernandez, S. A.; Pradervand, S.; Dorsaz, S.; Curie, T.; Hagiwara, G.; Gip, P.; Heller, H. C.; Franken, P., Separating the contribution of glucocorticoids and wakefulness to the molecular and electrophysiological correlates of sleep homeostasis. Sleep 2010, 33 (9), 1147-57.
6. Bellesi, M.; de Vivo, L.; Tononi, G.; Cirelli, C., Effects of sleep and wake on astrocytes: clues from molecular and ultrastructural studies. BMC biology 2015, 13, 66.
7. Tononi, G.; Cirelli, C., Sleep and the price of plasticity: from synaptic and cellular homeostasis to memory consolidation and integration. Neuron 2014, 81 (1), 12-34.
8. Basheer, R.; Brown, R.; Ramesh, V.; Begum, S.; McCarley, R. W., Sleep deprivation-induced protein changes in basal forebrain: Implications for synaptic plasticity. J Neurosci Res. 2005, 82 (5), 650-8.
9. Pawlyk, A. C.; Ferber, M.; Shah, A.; Pack, A. I.; Naidoo, N., Proteomic analysis of the effects and interactions of sleep deprivation and aging in mouse cerebral cortex. Journal of neurochemistry 2007, 103 (6), 2301-13.
10. Poirrier, J. E.; Guillonneau, F.; Renaut, J.; Sergeant, K.; Luxen, A.; Maquet, P.; Leprince, P., Proteomic changes in rat hippocampus and adrenals following short-term sleep deprivation. Proteome Sci 2008, 6, 14.
11. Cirelli, C.; Pfister-Genskow, M.; McCarthy, D.; Woodbury, R.; Tononi, G., Proteomic profiling of the rat cerebral cortex in sleep and waking. Arch Ital Biol 2009, 147 (3), 59-68.
12. Kim, J. H.; Kim, J. H.; Cho, Y. E.; Baek, M. C.; Jung, J. Y.; Lee, M. G.; Jang, I. S.; Lee, H. W.; Suk, K., Chronic sleep deprivation-induced proteome changes in astrocytes of the rat hypothalamus. J Proteome Res 2014, 13 (9), 4047-61.

169
13. Baghdoyan, H. A.; Lydic, R., The neurochemistry of sleep and wakefulness. In Basic Neurochemistry, 8th ed.; Siegel, G. J.; Albers, R. W.; Price, D. L., Eds. Elsevier: 2012; pp 982-999.
14. Dunn, W. B.; Broadhurst, D.; Begley, P.; Zelena, E.; Francis-McIntyre, S.; Anderson, N.; Brown, M.; Knowles, J. D.; Halsall, A.; Haselden, J. N.; Nicholls, A. W.; Wilson, I. D.; Kell, D. B.; Goodacre, R.; Human Serum Metabolome, C., Procedures for large-scale metabolic profiling of serum and plasma using gas chromatography and liquid chromatography coupled to mass spectrometry. Nat Protoc 2011, 6 (7), 1060-83.
15. Snyder, N. W.; Khezam, M.; Mesaros, C. A.; Worth, A.; Blair, I. A., Untargeted metabolomics from biological sources using ultraperformance liquid chromatography-high resolution mass spectrometry (UPLC-HRMS). J Vis Exp 2013, (75), e50433.
16. Wishart, D. S.; Jewison, T.; Guo, A. C.; Wilson, M.; Knox, C.; Liu, Y.; Djoumbou, Y.; Mandal, R.; Aziat, F.; Dong, E.; Bouatra, S.; Sinelnikov, I.; Arndt, D.; Xia, J.; Liu, P.; Yallou, F.; Bjorndahl, T.; Perez-Pineiro, R.; Eisner, R.; Allen, F.; Neveu, V.; Greiner, R.; Scalbert, A., HMDB 3.0--The Human Metabolome Database in 2013. Nucleic Acids Res 2013, 41 (Database issue), D801-7.
17. Bellesi, M.; Tononi, G.; Cirelli, C.; Serra, P. A., Region-Specific Dissociation between Cortical Noradrenaline Levels and the Sleep/Wake Cycle. Sleep 2016, 39 (1), 143-54.
18. Guide for the Care and Use of Laboratory Animals 8th ed.; The National Academies Press: Washiungton, DC, 2011.
19. Bicks, L. K.; Koike, H.; Akbarian, S.; Morishita, H., Prefrontal Cortex and Social Cognition in Mouse and Man. Front Psychol 2015, 6, 1805.
20. Franklin, K. B. J.; Paxinos, G., The Mouse Brain in Stereotaxic Coordinates. Academic Press: 2008.
21. Lu, W.; Clasquin, M. F.; Melamud, E.; Amador-Noguez, D.; Caudy, A. A.; Rabinowitz, J. D., Metabolomic analysis via reversed-phase ion-pairing liquid chromatography coupled to a stand alone orbitrap mass spectrometer. Anal Chem 2010, 82 (8), 3212-21.
22. Lindstrom, M. J.; Bates, D. M., Newton-Raphson and EM algorithms for linear mixed-effects models for repeated measures data. J of the American Statistical Association 1988, 83, 1014-1022.
23. Laird, N. M.; Ware, J. H., Random effects models for longitudinal data. Biometrics 1982, 38, 963-74.
24. Bates, D.; Maechler, M.; Bolker, B.; Walker, S., Fitting Linear Mixed-Effects Models Using lme4. Journal of Statistical Software 2015, 67, 1-48.
25. Bolker, B. M.; Brooks, M. E.; Clark, C. J.; Geange, S. W.; Poulsen, J. R.; Stevens, M. H. H.; White, J.-S. S., Generalized linear mixed models: a practical guide for ecology and evolution. Trends in Ecology and Evolution 2008, 24, 127-135.

170
26. Akaike, H., A new look at the statistical model identification. EEE Transactions on Automatic Control 1974, 19, 716-723.
27. Tibshirani, R., Regression shrinkage and selection via the Lasso. J of the Royal Statistical Society. Series B. 1996, 58, 267-288.
28. Saldanha, A. J., Java Treeview--extensible visualization of microarray data. Bioinformatics 2004, 20 (17), 3246-8.
29. Dash, M. B.; Tononi, G.; Cirelli, C., Extracellular levels of lactate, but not oxygen, reflect sleep homeostasis in the rat cerebral cortex. Sleep 2012, 35, 909-919.
30. Naylor, E.; Aillon, D. V.; Barrett, B. S.; Wilson, G. S.; Johnson, D. A.; Harmon, H. P.; Gabbert, S.; Petillo, P. A., Lactate as a biomarker for sleep. Sleep 2012, 35 (9), 1209-22.
31. Dash, M. B.; Bellesi, M.; Tononi, G.; Cirelli, C., Sleep/wake dependent changes in cortical glucose concentrations. Journal of neurochemistry 2013, 124 (1), 79-89.
32. Wisor, J. P.; Rempe, M. J.; Schmidt, M. A.; Moore, M. E.; Clegern, W. C., Sleep slow-wave activity regulates cerebral glycolytic metabolism. Cerebral cortex 2013, 23 (8), 1978-87.
33. Dash, M. B.; Douglas, C. L.; Vyazovskiy, V. V.; Cirelli, C.; Tononi, G., Long-Term Homeostasis of Extracellular Glutamate in the Rat Cerebral Cortex across Sleep and Waking States. The Journal of Neuroscience 2009, 29 (3), 620-629.
34. Lena, I.; Parrot, S.; Deschaux, O.; Muffat-Joly, S.; Sauvinet, V.; Renaud, B.; Suaud-Chagny, M. F.; Gottesmann, C., Variations in extracellular levels of dopamine, noradrenaline, glutamate, and aspartate across the sleep--wake cycle in the medial prefrontal cortex and nucleus accumbens of freely moving rats. J Neurosci Res 2005, 81 (6), 891-9.
35. Watson, C. J.; Lydic, R.; Baghdoyan, H. A., Sleep duration varies as a function of glutamate and GABA in rat pontine reticular formation. Journal of neurochemistry 2011, 118 (4), 571-80.
36. Kao, C. Y.; Anderzhanova, E.; Asara, J. M.; Wotjak, C. T.; Turck, C. W., NextGen brain microdialysis: applying modern metabolomics technology to the analysis of the extracellular fluid of the central nervous system. . Molecular Neuropsychiatry 2015, 1, 60-67.
37. Iliff, J. J.; Wang, M.; Liao, Y.; Plogg, B. A.; Peng, W.; Gundersen, G. A.; Benveniste, H.; Vates, G. E.; Deane, R.; Goldman, S. A.; Nagelhus, E. A.; Nedergaard, M., A paravascular pathway facilitates CSF flow through the brain parenchyma and the clearance of interstitial solutes, including amyloid beta. Sci Transl Med 2012, 4 (147), 147ra111.
38. Xie, L.; Kang, H.; Xu, Q.; Chen, M. J.; Liao, Y.; Thiyagarajan, M.; O'Donnell, J.; Christensen, D. J.; Nicholson, C.; Iliff, J. J.; Takano, T.; Deane, R.; Nedergaard, M., Sleep drives metabolite clearance from the adult brain. Science 2013, 342 (6156), 373-7.

171
39. Shram, N.; Netchiporouk, L.; Cespuglio, R., Lactate in the brain of the freely moving rat: voltammetric monitoring of the changes related to the sleep-wake states. The European journal of neuroscience 2002, 16 (3), 461-6.
40. Reich, P.; Geyer, S. J.; Karnovsky, M. L., Metabolism of brain during sleep and wakefulness. Journal of neurochemistry 1972, 19 (2), 487-97.
41. Lundgaard, I.; Li, B.; Xie, L.; Kang, H.; Sanggaard, S.; Haswell, J. D.; Sun, W.; Goldman, S.; Blekot, S.; Nielsen, M.; Takano, T.; Deane, R.; Nedergaard, M., Direct neuronal glucose uptake heralds activity-dependent increases in cerebral metabolism. Nature communications 2015, 6, 6807.
42. Belanger, M.; Allaman, I.; Magistretti, P. J., Brain energy metabolism: focus on astrocyte-neuron metabolic cooperation. Cell Metab 2011, 14 (6), 724-38.
43. McKenna, M. C., Substrate competition studies demonstrate oxidative metabolism of glucose, glutamate, glutamine, lactate and 3-hydroxybutyrate in cortical astrocytes from rat brain. Neurochem Res 2012, 37 (11), 2613-26.
44. Wigren, H. K.; Rytkonen, K. M.; Porkka-Heiskanen, T., Basal forebrain lactate release and promotion of cortical arousal during prolonged waking is attenuated in aging. The Journal of neuroscience : the official journal of the Society for Neuroscience 2009, 29 (37), 11698-707.
45. Magistretti, P. J., Neuron-glia metabolic coupling and plasticity. Experimental physiology 2011, 96 (4), 407-10.
46. Magistretti, P. J., Role of glutamate in neuron-glia metabolic coupling. Am J Clin Nutr 2009, 90 (3), 875S-880S.
47. Haydon, P. G., Astrocytes and the modulation of sleep. Curr Opin Neurobiol 2017, 44, 28-33.
48. Dienel, G. A.; Cruz, N. F., Aerobic glycolysis during brain activation: adrenergic regulation and influence of norepinephrine on astrocytic metabolism. Journal of neurochemistry 2016, 138 (1), 14-52.
49. DiNuzzo, M.; Nedergaard, M., Brain energetics during the sleep-wake cycle. Curr Opin Neurobiol 2017, 47, 65-72.
50. Tang, F.; Lane, S.; Korsak, A.; Paton, J. F.; Gourine, A. V.; Kasparov, S.; Teschemacher, A. G., Lactate-mediated glia-neuronal signalling in the mammalian brain. Nature communications 2014, 5, 3284.
51. Lauritzen, K. H.; Morland, C.; Puchades, M.; Holm-Hansen, S.; Hagelin, E. M.; Lauritzen, F.; Attramadal, H.; Storm-Mathisen, J.; Gjedde, A.; Bergersen, L. H., Lactate receptor sites link neurotransmission, neurovascular coupling, and brain energy metabolism. Cerebral cortex 2014, 24 (10), 2784-95.
52. Nikonova, E. V.; Naidoo, N.; Zhang, L.; Romer, M.; Cater, J. R.; Scharf, M. T.; Galante, R. J.; Pack, A. I., Changes in components of energy regulation in mouse cortex with increases in wakefulness. Sleep 2010, 33 (7), 889-900.

172
53. Rohatgi, N.; Nielsen, T. K.; Bjorn, S. P.; Axelsson, I.; Paglia, G.; Voldborg, B. G.; Palsson, B. O.; Rolfsson, O., Biochemical characterization of human gluconokinase and the proposed metabolic impact of gluconic acid as determined by constraint based metabolic network analysis. PloS one 2014, 9 (6), e98760.
54. Corkins, M. E.; Wilson, S.; Cocuron, J. C.; Alonso, A. P.; Bird, A. J., The gluconate shunt is an alternative route for directing glucose into the pentose phosphate pathway in fission yeast. J Biol Chem 2017, 292 (33), 13823-13832.
55. Gerlach, J.; Loffler, M.; Schafer, M. K., Gene expression of enzymes required for the de novo synthesis and degradation of pyrimidines in rat peripheral tissues and brain. Nucleosides Nucleotides Nucleic Acids 2011, 30 (12), 1147-54.
56. Loffler, M.; Carrey, E. A.; Zameitat, E., Orotic Acid, More Than Just an Intermediate of Pyrimidine de novo Synthesis. J Genet Genomics 2015, 42 (5), 207-19.
57. Feenstra, M. G.; Botterblom, M. H.; Mastenbroek, S., Dopamine and noradrenaline efflux in the prefrontal cortex in the light and dark period: effects of novelty and handling and comparison to the nucleus accumbens. Neuroscience 2000, 100 (4), 741-8.
58. Taylor, N. E.; Van Dort, C. J.; Kenny, J. D.; Pei, J.; Guidera, J. A.; Vlasov, K. Y.; Lee, J. T.; Boyden, E. S.; Brown, E. N.; Solt, K., Optogenetic activation of dopamine neurons in the ventral tegmental area induces reanimation from general anesthesia. Proceedings of the National Academy of Sciences of the United States of America 2016.
59. Eban-Rothschild, A.; Rothschild, G.; Giardino, W. J.; Jones, J. R.; de Lecea, L., VTA dopaminergic neurons regulate ethologically relevant sleep-wake behaviors. Nature neuroscience 2016, 19 (10), 1356-+.
60. Ursin, R., Serotonin and sleep. Sleep Med Rev 2002, 6 (1), 55-69.
61. Ganellin, C.; Triggle, D. J., Dictionary of pharmacological agents. CRC Press: 1996.
62. Chesnoy-Marchais, D., Persistent GABAA/C responses to gabazine, taurine and beta-alanine in rat hypoglossal motoneurons. Neuroscience 2016, 330 (Supplement C), 191-204.
63. Hayaishi, O.; Nishizuka, Y.; Tatibana, M.; Takeshita, M.; Kuno, S., Enzymatic studies on the metabolism of beta-alanine. The Journal of biological chemistry 1961, 236, 781-90.
64. Tiedje, K. E.; Stevens, K.; Barnes, S.; Weaver, D. F., Beta-alanine as a small molecule neurotransmitter. Neurochemistry international 2010, 57 (3), 177-88.
65. Juge, N.; Omote, H.; Moriyama, Y., Vesicular GABA transporter (VGAT) transports beta-alanine. Journal of neurochemistry 2013, 127 (4), 482-6.
66. Hinard, V.; Mikhail, C.; Pradervand, S.; Curie, T.; Houtkooper, R. H.; Auwerx, J.; Franken, P.; Tafti, M., Key electrophysiological, molecular, and metabolic signatures of sleep and wakefulness revealed in primary cortical cultures. The

173
Journal of neuroscience : the official journal of the Society for Neuroscience 2012, 32 (36), 12506-17.
67. Davies, S. K.; Ang, J. E.; Revell, V. L.; Holmes, B.; Mann, A.; Robertson, F. P.; Cui, N.; Middleton, B.; Ackermann, K.; Kayser, M.; Thumser, A. E.; Raynaud, F. I.; Skene, D. J., Effect of sleep deprivation on the human metabolome. Proceedings of the National Academy of Sciences of the United States of America 2014, 111 (29), 10761-6.
68. Giskeodegard, G. F.; Davies, S. K.; Revell, V. L.; Keun, H.; Skene, D. J., Diurnal rhythms in the human urine metabolome during sleep and total sleep deprivation. Sci Rep 2015, 5, 14843.
69. Weljie, A. M.; Meerlo, P.; Goel, N.; Sengupta, A.; Kayser, M. S.; Abel, T.; Birnbaum, M. J.; Dinges, D. F.; Sehgal, A., Oxalic acid and diacylglycerol 36:3 are cross-species markers of sleep debt. Proceedings of the National Academy of Sciences of the United States of America 2015, 112 (8), 2569-74.

174
CHAPTER 3: CHARACTERIZATION OF NATIVE COBAMIDE FROM
DESULFITOBACTERIUM HAFNIENSE

175
PREFACE
In the spring of 2014, I was presented with an opportunity to collaborate with the
Lӧffler group to elucidate the structure of a novel, biosynthesized cobamide. Dr. Lӧffler
was a pioneer in the study of reductive dehalogenase microbial cultures, where he
assisted in the discovery of the first identified species, Dehalococcoides mccartyi. This
genus has the rare ability to use chlorine for respiration, where they frequently start with
perchloroethene and reduce this compound to ethene. Given this unique feature, a
combination of these species are now commonly used at bioremediation sites to remove
toxic levels of these chlorinated compounds.
Relative to this study, another unique feature of this genus is that they can
biosynthetically produce corrinoids, which are prosthetic groups for the enzymatically-
controlled reductive dechlorination. Prior to our study, 16 known cobamides had been
identified as naturally occurring compounds. The most commonly known cobamide is
vitamin B12, with all of these structures having an identical corrinoid ring; containing a
corrin cyclic system coordinated to cobalt, an alpha-ribazole phosphate moiety, and
accompanied lower base. The structure of the lower is base is commonly the unique
component of the naturally-occurring cobamide compounds.
Following the discovery of a novel cobamide compound by the Lӧffler group, I was
presented with the challenge of confirming the complete structure and identifying the
connectivity of the lower base. To accomplish the novel structure elucidation, I used high-
resolution mass spectrometry, isotope-labeling mass spectrometry, and nuclear magnetic
resonance spectroscopy.
The successful completion of this project marks the discovery of the 17th naturally-
occurring cobamide; the purinyl-cobamide was only the second compound discovered in
biology to contain unsubstituted purine. This compound was confirmed as a prosthetic
group for reductive dechlorination and could ultimately have additional biological function.
Personally, this project has additional meaning for research goals. By completing this
project, I have proven my skillset in the field of structure elucidation and provided a
technical set of tools for further analysis of novel cobamides, or other biological

176
compounds. When given a sufficient quantity of purified sample, and the correct set of
analytical instrumentation, a novel structure can successfully be elucidated.

177
A version of this chapter was originally published by Yan, et al.:
Reproduced with permission Yan, J.; Bi, M.; Bourdon, A. K.; Farmer, A. T.; Wang,
P.; Molenda, O.; Quaile, A.; Jiang, N.; Yang, Y.; Yin, Y.; Simsir, B.; Campagna, S. R.;
Edwards, E. A.; Loffler, F. Purinyl-cobamide is a Novel Native Prosthetic Group of
Reductive Dehalogenases. Nature Chemical Biology 2017, doi: 10.1038/nchembio.2512
Contributions:
FEL, JY, and SRC conceptualized the research and designed experiments. JY, MB, BS,
Y. Yang, and Y. Yin performed cultivation work, corrinoid extraction and purification, and
phylogenetic analyses. AKB and ATF performed LC–MS and structural analyses. PW,
OM and AQ performed BN–PAGE, enzyme assays, and proteomic analysis. NJ
generated cobT expression clones. All authors contributed to data analysis and
interpretation, and JY, AKB, SRC, EAE, and FEL wrote the manuscript.

178
3.1 ABSTRACT
Cobamides such as vitamin B12 are structurally conserved, cobalt-containing
tetrapyrrole biomolecules that have essential biochemical functions in all domains of life.
In organohalide respiration, a vital biological process for the global cycling of natural and
anthropogenic organohalogens, cobamides are the requisite prosthetic groups for
carbon–halogen bond-cleaving reductive dehalogenases. This study reports the
biosynthesis of a new cobamide with unsubstituted purine as the lower base and assigns
unsubstituted purine a biological function by demonstrating that Coα-purinyl-cobamide
(purinyl-Cba) is the native prosthetic group in catalytically active tetrachloroethene
reductive dehalogenases of Desulfitobacterium hafniense. Cobamides featuring different
lower bases are not functionally equivalent, and purinyl-Cba elicits different physiological
responses in corrinoid-auxotrophic, organohalide-respiring bacteria. Given that
cobamide-dependent enzymes catalyze key steps in essential metabolic pathways, the
discovery of a novel cobamide structure and the realization that lower bases can
effectively modulate enzyme activities generate opportunities to manipulate
functionalities of microbiomes.

179
3.2 INTRODUCTION
Corrinoids are the most complicated organometallic cofactors used in biology to
catalyze essential biochemical reactions including methyl group transfer, carbon skeleton
rearrangement and reductive dehalogenation1. Complete corrinoids (i.e., cobamides)
consist of an upper Coβ ligand, a central cobalt-containing corrin ring, and a lower Coα
base as part of the nucleotide loop that is connected to the corrin ring2. For example,
vitamin B12 (cyanocobalamin) carries the artificial cyano group as an upper Coβ ligand
and 5,6-dimethylbenzimidazole (DMB) as the lower base (Figure 3.1). Variations in
cobamide (Cba) structure exist in the upper ligand, the lower base, and, in one
documented case, the side chain in the nucleotide loop3. Physiologically functional
cobamides use a methyl group or a 5′-deoxyadenosyl moiety as the upper ligand and one
of 16 known lower bases connected to the nucleotide loop2 (Fig. 1). Reductive
dehalogenation reactions can be mediated abiotically by vitamin B12 and its analogs in
the presence of a strong reductant capable of generating the cobalt(I) supernucleophile4
or can be catalyzed by corrinoid-dependent reductive dehalogenases (RDases)5. In either
case, the cobalt(I) supernucleophile is critical for the initiation of carbon–halogen bond
cleavage6.
Recently resolved RDase crystal structures of NpRdhA (PDB ID 4RAS) from
Nitratireductor pacificus and PceA (PDB ID 4UR0) from Sulfurospirillum multivorans
demonstrate that their prosthetic groups coenzyme B12 and norpseudo-B12, respectively,
are in the base-off configurations, indicating that their respective lower bases, DMB and
adenine, are uncoordinated and distant from the redoxactive cobalt atom7,8. Therefore,
the lower base is not assigned a direct role in catalysis or electron transfer for restoring
the reactive cobalt(I) state. Contrary to expectations, lower-base structure does impact
reductive dechlorination rates and growth of obligate organohalide-respiring, corrinoid-
auxotrophic Dehalococcoides mccartyi (Dhc) strains9,10. Maximum reductive
dichlorination activity and Dhc growth require the addition of cobamides carrying DMB or
5-methylbenzimidazole (5-MeBza) as the lower base, and cobamides with other lower-
base structures compromise growth (e.g., 5-methoxybenzimidazole, 5-OMeBza;
benzimidazole, Bza) or cause complete loss of reductive dechlorination activity (e.g., 5-

180
hydroxybenzimidazole, 5-OHBza; adenine)10,11. The lower base structure also affects
substrate utilization in the homoacetogen Sporomusa ovata, which uses phenolic
cobamide-dependent methyltransferases for energy conservation and carbon
assimilation using the Wood–Ljungdahl pathway12. The addition of 5-Me- Bza or DMB to
the medium results in the formation of non-native 5-methylbenzimidazolyl-cobamide (5-
MeBza-Cba) or cobalamin, respectively, severely inhibiting growth with methanol or 3,4-
dimethoxybenzoate as substrates12. These findings indicate that the lower bases can
affect enzyme activity and cause substantial consequences to the host organisms;
however, the mechanistic understanding is lacking. To date, 16 naturally occurring lower
bases have been identified, mostly from anaerobic bacteria, with the most recent
structure, phenol in phenolyl-cobamide of Sporomusa ovata (Figure 3.1), discovered in
198913.
Members of the genus Desulfitobacterium (Dsf) are strictly anaerobic,
metabolically versatile, Gram-positive bacteria common in subsurface environments,
where they contribute to the reductive dehalogenation of organohalogens, including
groundwater contaminants such as chlorinated solvents14,15. The tetrachloroethene
(PCE) RDases have a strict requirement for cobamide as a prosthetic group, and
generate predominantly cis-1,2-dichloroethene (cDCE) and inorganic chloride as
products16. The characterized PCE-dehalogenating Dsf pure cultures grow in defined
medium without exogenous corrinoids, indicating that these Dsf strains are capable of de
novo corrinoid biosynthesis17. Genome sequence analysis corroborates that Dsf strains
possess the complete set of genes required for cobinamide biosynthesis and lower base
activation and attachment, but the identity of the lower base of native Dsf cobamide(s)
remains elusive18.
Here we report the discovery and characterization of purinyl-Cba (1) as the native
cobamide produced in axenic PCE-dechlorinating Dsf cultures and demonstrate its
distinct functionality in different corrinoid-auxotrophic organohalide-respiring bacteria.
Direct detection of purinyl-Cba was achieved in catalytically active PCE RDase following

181
Figure 3.1 Cobamide general structure and the 16 known lower bases found in
naturally occurring cobamides
Variations in cobamide structures are found in the Coβ upper ligand, the side chain at
position C176, and Coα lower base. 5-OHBza, 5-hydroxybenzimidazole; 5-OMeBza, 5-
methoxybenzimidazole; 5-OMe-6-MeBza, 5-methoxy-6-methylbenzimidazole; DMB, 5,6-
dimethylbenzimidazole; Bza, benzimidazole; 5-MeBza, 5-methylbenzimidazole; 2-
MeAde, 2-methyladenine; 2-SMeAde, 2-methylmercaptoadenine; 2-SOMeAde,2-
methylsulfinyladenine; 2-SO2MeAde, 2-methylsulfonyladenine.

182
electrophoretic separation, illustrating an innovative approach for rapid characterization
of corrinoid prosthetic groups. The results obtained expand the diversity of naturally
occurring cobamide structures and assign a biological function to unsubstituted purine.
3.3 RESULTS
3.3.1 Discovery and structure of a novel cobamide
HPLC analysis of the cyanated form (for example, a cyano group as the upper β
ligand) of corrinoid extracts from PCE-grown Dsf pure cultures (i.e., Dsf strains Y51, JH1,
Viet1 and PCE1) revealed the presence of three candidate corrinoids with retention times
of 11.79 min (1), 15.74 min (2) and 15.95 min (3) (Figure 3.2A and 3.3A). Integrated peak
areas at 361 nm of the total fractions eluting between 10 and 18 min (i.e., the range of
retention times for seven Cba standards, 4–10; Figure 3.2A) showed that the
predominant corrinoid produced in the Dsf cultures was associated with the 11.79 min
fraction. This retention time was different from that of cobinamide (Cbi; which eluted at
8.77 min as monocyano-Cbi and 15.63 min as dicyano-Cbi19; Figure 3.3B) and any of
the cobamide standards, indicating that the Dsf strains produced a distinct corrinoid. The
UV-visible (Vis) spectrum of the predominant D. hafniense strain Y51 corrinoid (1)
substantially overlapped with that of vitamin B12 (10), including the 361 nm absorption
maximum, but was distinct from the Cbi spectrum with a 355 nm absorption maximum
(Figure 3.2B). Two minor fractions that eluted after the predominant Dsf corrinoid showed
absorption spectra and retention times (15.74 and 15.95 min) similar to those of Cbi,
suggesting that these minor fractions may represent Cbi precursors (Figure 3.4).
Mass spectra of the D. hafniense strain Y51 corrinoid and of vitamin B12 standard
obtained using LC–MS displayed strong base peaks with m/z values of 1,329.54 and
1,355.58, respectively, corresponding to intact corrinoid ions [M+H]+ (Figure 3.5A, B).
The base peaks with m/z values of 1,351.52 and 1,377.56 represented the [M+Na]+ ion
form of the strain Y51 corrinoid and vitamin B12, respectively. The mass spectra of the
predominant corrinoids from Dsf strains JH1, Viet1 and PCE1 matched that of D.

183
hafniense strain Y51, showing base peaks with m/z values of 1,329.54 and 1,351.52
corresponding to their [M+H]+ and [M+Na]+ ion forms, respectively (Figure 3.5C–E). As
the molecular mass of the α-ribazole-5′-phosphate (α-RP) moiety in natural cobamides
ranges from 306.2 (with phenol as the lower base) to 425.31 Da (with 2-
methylsulfonyladenine as the lower base), a mass difference of 312.42 Da between the
measured molecular mass of the Dsf corrinoid and the calculated molecular mass of Cbi
(1,016.12 Da in the monocyano form) indicated that the predominant Dsf corrinoid was a
cobamide carrying an α-RP moiety with a yet-unidentified lower base. Comparison to the
calculated masses of naturally occurring cobamides in their cyanated form suggested that
the organohalide-respiring Dsf strains produce a unique cobamide that is distinct from
any currently known natural cobamide. Based on mass information, a possible molecular
formula for the Dsf cobamide was deduced as C59H82CoN16O14P.
In the nor-type corrinoid produced by Sulfurospirillum multivorans, C176 of the side
chain is demethylated3 (Figure 3.1). To test whether demethylation or any other
modification exists in the cobinamide structure of this novel Dsf cobamide, we grew D.
hafniense strain Y51 cultures with PCE as an electron acceptor in the presence of 25 μM
DMB. The addition of DMB was shown to trigger the synthesis of a non-native
cobamide12,20. This guided cobamide biosynthesis approach with strain Y51 resulted in
the formation of cobalamin, as determined by HPLC retention time, UV-Vis spectrum
(Figure 3.2C, D), and mass spectral features with two strong peaks having m/z values of
1,355.58 ([M+H]+) and 1,377.56 ([M+Na]+) (Figure 3.5F). Similarly, we detected Bza-Cba
(5) exclusively in strain Y51 cultures that received Bza (Figure 3.6). Guided cobamide
biosynthesis does not change the assembly of the cobinic acid skeleton as prior studies
have suggested20,21. Thus, similar PCE-to-cDCE dechlorination performance in strain
Y51 cultures producing the Dsf native cobamide, cobalamin, or Bza-Cba indicated that
the different prosthetic groups supported functionality of the Dsf PceA RDase.
Collectively, these findings confirmed that the new cobamide natively synthesized in Dsf
strains did not possess any unusual modifications. Based on this information, the
molecular mass of the lower base compound in the Dsf cobamide was estimated to be

184
Figure 3.2 Spectrophotometric and structural features of Desulfitobacterium native
corrinoids
(A) HPLC chromatograms of the native corrinoids produced by D. hafniense strain Y51
eluted at 11.79 min (1), 15.74 min (2), and 15.94 min (3). The predominant corrinoid peak
at 11.79 min accounted for 86% of the total corrinoids produced by strain Y51 based on
361 nm peak area integration. Cobamide standards (5 mg/L each) were norpseudo
vitamin B12 (4), 11.23 min; Bza-Cba (5), 13.34 min; 5-OMeBza-Cba (6), 13.88 min; p-
cresol-Cba (7), 17.23 min and 17.64 min; 5-OHBza-Cba (8), 13.13 min; 5-MeBza-Cba
(9), 13.89 min; vitamin B12 (10), 15.02 min. mAU, milli-absorbance units. (B) UV-Vis
spectra (250–600 nm) of cobinamide (cbi), vitamin B12 and the 11.79-min native Dsf
corrinoid. (C) HPLC chromatogram and (D) UV-Vis spectrum of the non-native cobamide
produced in strain Y51 cultures with 25 μM DMB amendment. Dotted lines in B and D
indicate the maximum absorbance wavelengths (λmax) of a cobinamide or a cobamide,
respectively. (E) Mass spectra of 15N-labeled and unlabeled native Dsf corrinoid. Mass
shifts in [M+H]+ and [M+Na]+ values (as shown by red arrows) confirmed that the Dsf
cobamide contains four N atoms in the lower base structure. (F) The superimposed 1H
NMR spectra of the Dsf corrinoid (black line) and the vitamin B12 standard (blue line). The
letters A, B and C in red correlate the protons on the structure to the corresponding 1H
NMR signals.

185
Figure 3.2A-B Continued
(A)
(B)
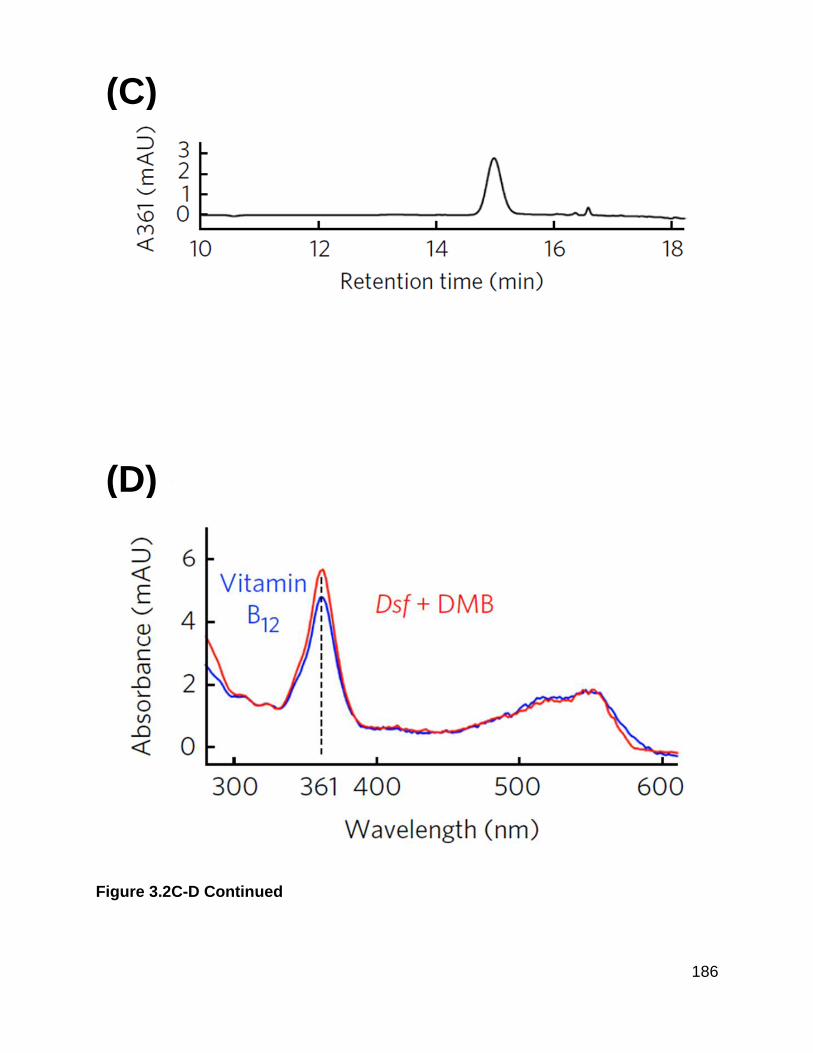
186
Figure 3.2C-D Continued
(C)
(D)

187
Figure 3.2E-F Continued
(E)
(F)
188
Figure 3.3 The native corrinoids produced by several PCE-dechlorinating
Desulfitobacterium (Dsf) strains
(A) HPLC chromatograms of the corrinoids extracted from axenic cultures of Dsf
hafniense strain JH1, Dsf sp. strain Viet1, and Dsf sp. strain PCE1.
(B) The HPLC chromatogram of a cobinamide standard (5 mg/L), which was separated
into the monocyano- (8.77 min) and dicyano- (15.63 min) forms.

189
Figure 3.3A-B Continued
(A)
(B)

190
Figure 3.4 UV-Vis of novel cobamides
The UV-Vis spectra (250-600 nm) of the two compounds that eluted after 15.74 min and
15.94 min showed absorption peaks at 355 nm, distinct from complete cobamides in the
cyano form. These compounds likely represent cobinamide precursors.

191
Figure 3.5 The mass spectra of cobamides produced by different Dsf strains and
authentic vitamin B12
(A) The mass spectrum of the predominant Dsf native corrinoid produced by Dsf
hafniense strain Y51. (B) The mass spectrum of authentic vitamin B12. The mass spectra
of the predominant corrinoid produced by (C) Dsf hafniense strain JH1, (D) Dsf sp. strain
Viet1, and (E) Dsf sp. strain PCE1. (F) The mass spectrum of the non-native cobamide
produced in Dsf hafniense strain Y51 cultures with 25 μM DMB amendment.

192
Figure 3.5A-C Continued
(A)
(B)
(C)

193
Figure 3.5D-F Continued
(D)
(E)
(F)

194
Figure 3.6 Guided cobamide biosynthesis by Dsf hafniense strain Y51
(A) HPLC chromatograms of a benzimidazolyl-cobamide (Bza-Cba) standard (5 mg/L)
and the non-native cobamide formed in strain Y51 cultures amended with 25 μM
benzimidazole (Bza). (B) UV-Vis spectra (250-600 nm) of the Bza-Cba standard and the
non-native cobamide synthesized in strain Y51 cultures with an adsorption maximum of
361 nm.
(A)
(B)

195
120.15 (1,329.54 ([M+H]+ of cyanated Dsf cobamide) – [1,355.58 ([M+H]+ of
cyanocobalamin) – 146.19 (DMB)]), which is suggestive of unsubstituted purine.
3.3.2 Confirmation of the novel lower base structure
The cobinic acid skeleton in the cyanated form carries a constant number of 12
nitrogen atoms. Depending on the lower base, naturally occurring cobamides possess 12
to 17 nitrogen atoms. Thus, the number of nitrogen atoms distinguishes a cobamide with
an unsubstituted purine as the lower base (12 + 4 = 16 nitrogen atoms) from cobamides
that carry nucleobases (for example, adenine or guanine; 12 + 5 = 17 nitrogen atoms),
Bza (12 + 2 = 14 nitrogen atoms) or phenol derivatives (12 + 0 = 12 nitrogen atoms).
Based on these structural characteristics, we conducted 15N isotope-labeling experiments
with D. hafniense strain Y51 to determine the number of nitrogen atoms in the unknown
lower base structure. The m/z values for the base peaks of the [M+H]+ and [M+Na]+ ion
forms of the 15N-labeled cobamide shifted from 1,329.54 to 1,344.48 and 1,351.52 to
1,366.46, respectively, corresponding to a 14.94 Da mass increase (Figure 3.2E). Based
on this mass shift, we calculated that the total number of nitrogen atoms in the native Dsf
cobamide is 16 (15 plus one unlabeled nitrogen in the upper CN ligand), indicating that
the lower base contains 4 nitrogen atoms (i.e., 16–12). Hypoxanthine, a purine derivative
with 4 N atoms, is the lower base of a native cobamide in Desulfovibrio vulgaris22;
however, hypoxanthine-Cba in its cyanated form has a calculated molecular mass of
1,345.29, which is different from the measured [M+H]+ m/z value of 1,329.54 for the Dsf
cobamide. Collectively, 15N isotope labeling followed by MS analysis provided additional
evidence that unsubstituted purine served as the lower base in the native Dsf cobamide.
To confirm unsubstituted purine as a new naturally occurring lower base, we
conducted 1D and 2D NMR spectroscopy experiments using the native Dsf cobamide.
The superimposed 1H NMR spectra (Figure 3.2F) of authentic vitamin B12 (10) and the
purified native Dsf cobamide (1) revealed that the only notable changes (i.e., chemical
shifts) occurred in the aromatic region (9.0–6.0 ppm.), which was primarily associated
with the DMB portion of vitamin B12. Homonuclear correlation spectroscopy (COSY)
experiments with the Dsf cobamide and vitamin B12 (Figure 3.7) revealed spin–spin

196
coupling between neighboring protons, but the spectra differed in the aromatic region.
The lower base aromatic protons in the Dsf cobamide lacked a correlation with other
protons in the molecule, suggesting that the aromatic moiety does not have any adjacent
protons. Hydrogen atoms A, B, and C in Figure 3.2F directly correlate with the three
hydrogen atoms of purine. In comparison, the vitamin B12 COSY spectrum demonstrated
direct correlations between the benzyl protons (7.3 and 6.5 ppm) and the adjacent methyl
group (2.2 ppm) of the DMB moiety. These experiments support the assignment of
unsubstituted purine as the lower base of native Dsf cobamide. Purine-containing
compounds can exist as four regioisomers through covalent bonding at each of the N
heteroatoms, but the limited amount of purinyl-Cba extractable from Dsf cultures did not
allow stereoisomer confirmation by 13C and/or 15N NMR spectroscopic analyses. Prior
research has shown that the 9H and 7H purine tautomers of purine are favored over 3H
and 1H purine because of increased aromaticity (tautomer stability: 9H > 7H > 3H > 1H)23.
Based on these observations and on precedence for purines to form bonds with an
imidazole nitrogen24, the N-glycosidic bond was inferred to be analogous to that observed
in other biomolecules. This combined suite of analytical techniques offers a practical
approach for lower base characterization and can aid in the discovery of new corrinoids.
3.3.3 Purinyl-Cba is the prosthetic group of Dsf PceA RDases
Mature Dsf PceA RDases are in the 50–60 kDa mass range14,16, but maximum
reductive dechlorination activity is generally associated with bands excised from blue
native PAGE (BN–PAGE) gels in the 242–480 kDa region, presumably because of
complexation with other proteins25. Following the nondenaturing separation of D.
hafniense strain JH1 crude extracts (Figure 3.8), the highest dechlorination activity was
found to be associated with gel slice #4, whereas the other five gel slices exhibited no
detectable or negligible (<8%) cDCE production from TCE (Figure 3.9A). Subsequent in-
gel extraction recovered corrinoid from gel slice #4, but not from slices #3 and #5, and
ultra-performance liquid chromatography-high resolution mass spectrometry (UPLC–
HRMS) revealed that the corrinoid associated with gel slice #4 and the purinyl-Cba
standard (Figure 3.9B, C) had matching retention times and m/z values. The proteomic
analysis of gel slices #3, #4, and #5 demonstrated that the Dsf PceA RDase

197
Figure 3.7 Results from homonuclear correlation spectroscopy (COSY)
experiments
Gradient-selected COSY nuclear magnetic resonance spectra of (A) the Dsf corrinoid
(0.7 mg in 250 μL methanol-d4 solution) and (B) a vitamin B12 standard (0.7 mg in 250
μL methanol-d4 solution).

198
Figure 3.7A-B Continued
(A)
(B)

199
Figure 3.8 BN-PAGE of Dsf hafniense strain JH1
Representative image of a blue native polyacrylamide gel electrophoresis (BN-PAGE) gel
used for Dsf hafniense strain JH1 crude protein separation and subsequent in-gel
analysis of PceA reductive dechlorination activity.

200
Figure 3.9 Identification of purinyl-Cba as the native prosthetic group in Dsf PCE
RDase following nondenaturing, gel-electrophoretic separation of Dsf crude
protein extracts using BN–PAGE
(A) TCE -to-cDCE dechlorination activity of different BN–PAGE gel slices measured using
dehalogenation enzyme assays.
(B,C) UPLC separation and MS analysis of the corrinoid recovered from BN–PAGE gel
slice #4 showing the highest dechlorination activity (B) and the purinyl-Cba standard (0.25
mg/L) (C).

201
Figure 3.9A Continued
(A)

202
Figure 3.9B-C Continued
(B)
(C)

203
(WP_011460641.1) was enriched in gel slice #4 along with carbon monoxide
dehydrogenase (CODH) and flavin adenine dinucleotide (FAD)-dependent fumarate
reductase, which are both corrinoid-independent enzymes (Table 3.1)26,27. CODH may
occur in complexes with corrinoid-dependent, Wood–Ljungdahl pathway enzymes (e.g.,
5-methyltetrahydrofolate-homocysteine methyltransferase), but no such proteins were
detected in gel slice #4. Purinyl-Cba was the only corrinoid detected in this gel slice,
confirming that the Dsf PceA RDase uses purinyl-Cba as the native prosthetic group.
3.3.4 Dsf CobT substrate specificity and phylogenetic analysis
The nicotinate-nucleotide-dimethylbenzimidazole phosphoribosyltransferase
(CobT) activates lower bases to their respective α-RP forms (Figure 3.10A), and the
CobT substrate specificity determines the type of cobamide produced19. CobT sequences
encoded in sequenced Dsf genomes are highly conserved (81.3–100% amino acid
identity) except for Desulfitobacterium metallireducens strain DSM 15288, whose CobT
shares no more than 58.5% amino acid identity with other available Dsf CobT sequences.
A broader phylogenetic analysis clustered bacterial CobT sequences into distinct clades
reflecting the substrate specificities (i.e., lower base type activated) of characterized
CobT, and provided clues about the native cobamides produced by the respective host
organisms (Figure 3.10B and Table 3.2). This analysis further revealed that the Dsf CobT
clade was distinct (<52% amino acid identity) from any other CobT implicated in phenol–
p-cresol, adenine, guanine–hypoxanthine or Bza-type lower base activation. The most
closely related sequences to the Dsf CobT clade (except for D. metallireducens CobT)
were found in Dehalobacter (Dhb) and Desulfosporosinus (e.g., Desulfosporosinus
youngiae strain DSM 17734, CM001441.1; Desulfosporosinus meridiei strain DSM
13257, CP003629.1; Desulfosporosinus orientis strain DSM 765, CP003108.1) genomes,
with 57.8–59.3% and 56.6–61.7% amino acid identity, respectively (Figure 3.10B);
however, the native corrinoids produced in either Dhb or Desulfosporosinus spp. strains
have not yet been identified. The high CobT sequence identities among these members

204
Table 3.1 Proteomic analysis of the Desulfitobacterium (Dsf) hafniense strain JH1
proteins associated with different BN-PAGE slices
Gel slice #
Protein ladder range (kDa)a
No. of distinct
peptidesb
Total species countsb
Protein description NCBI accession
no.
1 ≥ 720 - - - -
2 480 - 720 - - - -
3 346 - 480 5 11 Pyruvate ferredoxin
oxidoreductase WP_019849101.1
5 18 Acetyl-CoA synthase WP_005812973.1
4 204 - 346
6 8 CO dehydrogenase WP_011459977.1
4 6 Tetrachloroethene dehalogenase WP_011460641.1
5 11 FAD-dependent fumarate
reductase WP_005817128.1
5 112 - 204
2 6 Pyridoxamine 5'-phosphate
oxidase WP_005815111.1
7 10 FAD-dependent fumarate
reductase WP_005817128.1
3 4 Substrate-binding ABC
transporter WP_005812007.1
2 2 Peptidoglycan-binding protein
LysM WP_015943955.1
6 ≤ 112 - - - -
a BN-PAGE lanes were separated into slices based on the position of proteins in a MW
ladder. The MW ranges were estimated from a standard curve created by interpolating
the log MW of individual ladder proteins (146, 242, 480, 720 and 1,048 KDa) versus the
ratio (Rf) of migration distance of each ladder protein to the migration distance of the
Coomassie Blue dye front. Note that the actual MWs of Dsf proteins do not necessarily
match the calculated MWs based on BN-PAGE separation.
b In-gel peptide digestion and proteomic analysis were performed on gel slices # 3, 4, and
5, but not # 1, 2, and 6.

205
Figure 3.10 Phylogenetic analysis of CobT homologous proteins and substrate
specificity of Dsf CobT
(A) The Dsf CobT activated DMB or purine to their respective α-ribazole-5′-phosphate (α-
RP) forms. NaMN, nicotinic acid mononucleotide.
(B) Phylogenetic relationship of 40 CobT and homologous proteins from phylogenetically
diverse corrinoid-auxotrophic and prototrophic bacteria. Solid black dots indicate CobT
enzymes with biochemically determined substrate specificities. CobT enzymes of other
members of the Peptococcaceae may share catalytic features with the Dsf CobT and
activate purine as a lower base for cobamide biosynthesis (indicated by the dashed line–
enclosed pink area).
(C) HPLC analysis demonstrating purified CobT activity with NaMN and a lower base as
the substrates. The small peak to the left of nicotinic acid in the bottom trace (Dhc CobT
assay with purine) has a retention time similar to that of α-RP [purine] shown in the panel
above, but spectral analysis revealed distinct absorbance features.
(D) The formation of α-RP [DMB] or α-RP [purine] in CobT assays with DMB or purine
provided as a lower base substrate. The α-RP concentrations were calculated on the
basis of the concentration decreases of the respective lower base substrates. Data are
averages of measurements from duplicate assays. The (*) indicates that no α-RP [purine]
production was observed in Dhc CobT assays with purine as the lower base.
(E) MS analysis of α-RP [DMB] and α-RP [purine] formed in CobT enzyme assays.

206
Figure 3.10A Continued
(A)

207
Figure 3.10B Continued
(B)

208
Figure 3.10C Continued
(C)

209
Figure 3.10D Continued
(D)

210
Figure 3.10E Continued
(E)

211
Table 3.2 Information about CobT and homologous proteins used for phylogenetic
tree construction (Figure 4.4B in main text)
Indicated are the host organisms, the designations of the CobT homologous proteins, the
experimentally determined or inferred (based on the native types lower bases produced
in the respective host organisms) substrate specificity, the locus tag numbers of the
corresponding genes, and the NCBI accession numbers of the proteins.
Organism CobT
homologue Substrate specificity
Locus tag NCBI accession
no. Ref.
Acetobacterium woodii
DSM 1030 CobT Bza type Awo_c14620 AFA48245.1 1
Eubacterium limosum
strain KIST612 CobT Bza type ELI_4217 ADO39159.1 1
Geobacter sulfurreducens
strain PCA CobT Bza type GSU3009 AAR36401.1 1
Geobacter lovleyi
strain SZ CobT Bza type Glov_3678 ACD97377.1 1
Pelobacter propionicus DSM 2379
CobT Bza type Ppro_2806 ABL00406.1 2
Moorella thermoacetica ATCC 39073
CobT Bza type Moth_1721 ABC20023.1 3
Dehalococcoides mccartyi strain 195
CobT Bza type DET0657 AAW40094.1 4
Clostridium sticklandii DSM 519
CobT Adenine
type CLOST_0282 CBH20412.1 5
Sulfurospirillum multivorans DSM 12446
CobT Adenine
type SMUL_1547 AHJ12807.1 6
Clostridium cochlearium DSM 1285
CobT Adenine
type SAMN05216497_10222
6 SDK92407.1 7
Veillonella parvula
DSM 2008 CobT
Adenine type
Vpar_1602 ACZ25278.1 4
Lactobacillus reuteri
DSM 20016 CobT
Adenine type
Lreu_1695 ABQ83934.1 4

212
Table 3.2 Continued
Organism CobT
homologue Substrate specificity
Locus tag NCBI accession
no. Ref.
Salmonella enterica strain LT2
CobT Adenine
type STM2016 AAL20920.1 4
Pelosinus fermentans strain
R7 ArsA
Phenol type
N/A WP_007950675.1 8
Sporomusa ovata DSM 2662
ArsA Phenol
type N/A AEG78648.1 9
Veillonella parvula DSM 2008
ArsA Phenol
type Vpar_1456 ACZ25133.1 4
Pelosinus fermentans strain
R7 ArsB
Phenol type
N/A WP_007950676.1 8
Sporomusa ovata DSM 2662
ArsB Phenol
type N/A WP_021169525.1 9
Veillonella parvula DSM 2008
ArsB Phenol
type Vpar_1457 ACZ25134.1 4
Desulfovibrio vulgaris strain Hildenborough
CobT Guanine
type DVU_3279 AAS97749.1 10
Desulfobacterium sp. strain PCE1
CobT Purine DESPCE1_RS0113770 WP_014794544.1 This study
Desulfobacterium hafniense strain
Y51 CobT Purine DSY_RS11275 WP_018211350.1
This study
Desulfobacterium dichloroeliminans
strain LMG-P21439
CobT Unknown Desdi_2285 AGA69715.1 This study
Desulfobacterium dehalogenases ATCC 51507
CobT Unknown Desde_2751 AFM01064.1 This study
Desulfobacterium sp. strain PCP-1
CobT Unknown N/A WP_005812799.1 This study
Desulfobacterium hafniense strain
PCS-S CobT Unknown DPCES_2346 CDX02233.1
This study
Desulfobacterium hafniense strain
DCB-2 CobT Unknown DHAF_RS16390 WP_018211350.1
This study
Desulfobacterium hafniense strain
TCP-A CobT Unknown DESHAF_RS0103255 WP_018211350.1
This study
Desulfobacterium metallireducens
DSM 15288 CobT Unknown DESME_08705 AHF07147.1
This study

213
Table 3.2 Continued
Organism CobT
homologue
Substrate specificit
y Locus tag
NCBI accession no.
Ref.
Dehlaobacter sp. strain CF
CobT Unknown DCF50_p694 AFV04701.1 This study
Dehlaobacter sp. strain DCA
CobT Unknown DHBDCA_p636 AFV01665.1 This study
Dehlaobacter restrictus
strain PER-K23 CobT Unknown DEHRE_07530 AHF09955.1
This study
Dehlaobacter sp. strain UNSWDHB
CobT Unknown N/A WP_015042707.1 This study
Dehlaobacter sp. strain E1
CobT Unknown N/A WP_019225400.1 This study
Desulfosporosinus orientis
DSM 765 CobT Unknown Desor_1444 AET67101.1
This study
Desulfosporosinus meridiei
DSM 13257 CobT Unknown Desmer_1443 AFQ43436.1
This study
Desulfosporosinus youngiae
DSM 17734 CobT Unknown
DesyoDRAFT_1368
EHQ88526.1 This study
Desulfosporosinus sp. strain BRH_c37
CobT Unknown APF81_21415 KUO78188.1 This study
Desulfosporosinus sp. strain I2
CobT Unknown N/A WP_045573178.1 This study
Desulfosporosinus sp. strain HMP52
CobT Unknown N/A WP_034602331.1 This study

214
of the Peptococcaceae suggested that purine activation to the α-RP derivative is a shared
feature of this family (Figure 3.10B).
Cultivation work indicates that Dhc CobT utilizes a variety of benzimidazole-type
lower bases with a preference for DMB10,11. In vitro enzyme assays with purified Dsf CobT
and Dhc CobT (Figure 3.11A) with nicotinic acid mononucleotide (NaMN) and purine or
DMB as substrates verified that Dsf CobT and Dhc CobT both activated DMB to the α-
RP form of DMB (α-RP [DMB]; Figure 3.10C), consistent with the observation that
exogenous DMB guided Dsf to produce cobalamin as a non-native prosthetic group of
the PceA RDase. The Dsf and Dhc CobT enzymes activated DMB (250 μM), and 166.9
± 2.70 and 159.4 ± 1.13 μM α-RP [DMB], respectively, were produced following a 30-min
incubation period (Figure 3.10D). In Dsf CobT assays in which purine (250 µM) replaced
DMB, the conversion yield to α-RP [purine] exceeded 99% after a 30-min incubation
period (Figure 3.10C, D). In assays with Dhc CobT, purine was not consumed, α-RP
[purine] was not produced, and only small amounts of nicotinate were observed,
indicating that Dhc CobT was unable to activate unsubstituted purine (Figure 3.10C, D).
No α-RP formation occurred in controls lacking NaMN, a lower base, or CobT,
corroborating that Dsf CobT catalyzed the activation of unsubstituted purine to α-RP
[purine] (Figure 3.11B). MS analysis performed on fractions containing CobT enzyme
assay products showed strong adducts with m/z ([M+H]+) values of 359.10 and 333.06
matching the calculated molecular mass of α-RP [DMB] and α-RP [purine], respectively
(Figure 3.10E). These findings demonstrated an unprecedented Dsf CobT specificity for
unsubstituted purine, consistent with the discovery of purinyl-Cba as the native prosthetic
group of Dsf PceA.
3.3.5 Effects of purinyl-Cba on dechlorinating activity
To test whether purinyl-Cba supports corrinoid-dependent reductive dechlorination
in corrinoid-auxotrophic organohalide-respiring bacteria, we grew axenic Dehalobacter
restrictus strain PER-K23 and Dhc cultures with purinyl-Cba. Strain PER-K23 harbors a
PceA RDase with 98.7% amino acid identity to the PceA of D. hafniense strain Y51. Strain

215
Figure 3.11 Heterologous expression of Dsf CobT and Dhc CobT in E. coli and
requirements for lower base activation
(A) SDS-PAGE image of Dsf CobT and Dhc CobT carrying an N-terminal hexa-histidine
tag purified from recombinant E. coli cells.
(B) HPLC chromatograms of CobT enzyme assay controls demonstrating that the
formation of alpha-ribazole-5’-phosphate requires nicotinic acid mononucleotide (NaMN),
a lower base, and CobT.

216
Figure 3.11A-B Continued
(A)
(B)

217
PER-K23 cultures that received 36.9 nM of vitamin B12 (positive control) or purinyl-Cba
completely dechlorinated the initial amount of 64.4 ± 2.3 μmol of PCE to cDCE within 6 d
at statistically indifferent rates of 427 ± 25 and 471 ± 39 μM Cl− released per day,
respectively (Figure 3.12A). Much lower dechlorination rates of 23.7 ± 9.3 μM Cl−
released per day, resulting in the formation of small amounts of trichloroethene (TCE; 8.2
± 2.5 μmol) and cDCE (5.4 ± 2.5 μmol), occurred in control incubations without exogenous
corrinoid (Figure 3.12A). Strain PER-K23 cell numbers increased about 50-fold in purinyl-
Cba- and vitamin B12-amended cultures, whereas growth was negligible in control
cultures without corrinoid addition (Table 3.3). Biomass from purinyl-Cba- and vitamin
B12-fed Dhb cultures exclusively contained purinyl-Cba and vitamin B12, respectively,
indicating that cobamide or lower base modifications did not occur (Figure 3.12B). These
findings demonstrated that both D. restrictus strain PER-K23 and D. hafniense strain Y51
PceA RDases were fully functional with either purinyl-Cba or cobalamin as the prosthetic
group.
Corrinoid-auxotrophic Dhc pure cultures demonstrated a different response to
purinyl-Cba. Dhc strains BAV1 and GT express the BvcA and VcrA RDase, respectively,
which share less than 20% amino acid identity with the Dsf and Dhb PceA RDases.
Complete reductive dechlorination of cDCE to ethene occurred in vitamin B12-amended
Dhc strain BAV1 and strain GT cultures at rates of 201 ± 11 and 197 ± 10 μM Cl− released
per day, respectively (Figure 3.12C and 3.13). Strain BAV1 and strain GT cultures with
purinyl-Cba as the sole corrinoid amendment exhibited much slower cDCE dechlorination
rates of 17.6 ± 1.2 and 11.7 ± 0.7 μM Cl− released per day, respectively (Figure 3.12C
and 3.13). After a 32-d incubation period, the cultures dechlorinated about half of the
initially supplied cDCE (83 μmol) but produced no ethene. In control cultures without
exogenous corrinoid, strain BAV1 and strain GT dechlorinated no more than 22% and
7.3%, respectively, of the initial cDCE to vinyl chloride (presumably enabled by corrinoid
carryover with the inoculum), and formed no ethene (Figure 3.12C and 3.13). Consistent
with the observed reductive dechlorination activity, 16S rRNA gene enumeration indicated
robust Dhc growth in cultures amended with vitamin B12 but not in cultures that received

218
Figure 3.12 Effects of purinyl-Cba substitution for vitamin B12 on the activity of
corrinoid-auxotrophic, organohalide-respiring bacteria.
(A) Reductive dechlorination activity in D. restrictus cultures supplied with PCE as the
electron acceptor and 36.9 nM vitamin B12 (positive control), 36.9 nM purinyl-Cba, or no
corrinoid addition (negative control).
(B) HPLC chromatograms of the total intracellular corrinoids extracted from vitamin B12-
or purinyl-Cba-amended Dhb cultures. Purinyl-Cba was the only cobamide recovered
from purinyl-Cba-amended Dhb cultures.
(C) Reductive dehalogenation of cDCE to ethene in Dhc strain BAV1 cultures amended
with 36.9 nM vitamin B12 (positive control), 36.9 nM purinyl-Cba, or no corrinoid addition
(negative control). Unfilled squares, PCE; filled diamonds, TCE; filled triangles, cDCE;
inverted unfilled triangles, vinyl chloride; filled circles, ethene. Error bars represent mean
values ± standard deviation from three independent cultures.

219
Figure 3.12A Continued
(A)

220
Figure 3.12B Continued
(B)

221
Figure 3.12C Continued
(C)

222
Table 3.3 Growth of corrinoid-auxotrophic organohalide-respiring Dehalobacter
restrictus (Dhb) and Dehlaococcoides mccartyi (Dhc) pure cultures with different
cobamides
Organism (e- acceptor)
Cobamide
Dhc 16S rRNA or Dhb pceA gene copies per mL culturea
Average fold
increase Initial Final
Dhb
(PCE)
Vitamin B12 7.52 ± 0.25 x 10⁶ 3.89 ± 0.49 x 10⁸ 51.7
Purinyl-Cba 7.52 ± 0.25 x 10⁶ 3.75 ± 0.47 x 10⁸ 49.9
None 7.52 ± 0.25 x 10⁶ 1.70 ± 0.85 x 10⁷ 2.3
Dhc strain BAV1
(cDCE)
Vitamin B12 4.63 ± 0.22 x 10⁶ 1.83 ± 0.09 x 10⁸ 39.5
Purinyl-Cba 4.63 ± 0.22 x 10⁶ 1.29 ± 0.15 x 10⁷ 2.8
None 4.63 ± 0.22 x 10⁶ 6.26 ± 1.62 x 10⁶ 1.4
Dhc strain GT
(cDCE)
Vitamin B12 3.88 ± 0.70 x 10⁶ 1.68 ± 0.14 x 10⁸ 43.3
Purinyl-Cba 3.88 ± 0.70 x 10⁶ 2.00 ± 0.31 x 10⁷ 5.2
None 3.88 ± 0.70 x 10⁶ 4.62 ± 0.51 x 10⁶ 1.2
a Based on the available genome information, Dhc possess a single copy of the 16S rRNA
gene and Dhb possess a single copy of the pceA gene. Average and standard deviation
of gene copy numbers were calculated from qPCR measurements of triplicate cultures.

223
Figure 3.13 Reductive dechlorination of cDCE to ethene in Dhc strain GT cultures
Reductive dechlorination of cDCE to ethene in Dhc strain GT cultures receiving vitamin
B12 (36.9 nM, top panel), purinyl-Cba (36.9 nM, middle panel), or no corrinoid addition
(negative control, bottom panel). Solid triangles, cDCE; open, inverted triangles, vinyl
chloride; solid circles, ethene. Error bars represent the mean values ± standard deviation
from three independent cultures.

224
purinyl-Cba (Table 3.3). In contrast to the PceA RDases, the Dhc RDases BvcA and VcrA
had a pronounced preference for DMB over unsubstituted purine as the lower base,
emphasizing that the lower base can modulate the activity of corrinoid-dependent
RDases10.
3.4 DISCUSSION
The purine structure is the most widely distributed nitrogen-containing heterocycle
in nature, and purine derivatives fulfill many essential functions in biological systems28.
Obvious examples of purine derivatives include adenine and guanine, which are essential
building blocks of nucleic acids, and ubiquitous molecules such as adenosine 5′
triphosphate (ATP), nicotinamide adenine dinucleotide (NAD+ and NADH), and flavin
adenine dinucleotide (FAD and FADH2)28. Remarkably, compounds containing an
unsubstituted purine moiety are rare, and a specific biological function has never been
assigned to purine itself. To date, nebularine (purine nucleoside) is the only known
biological compound that contains unsubstituted purine. Nebularine was first isolated from
the fungus Clitocybe nebularis29 and is also produced by Streptomyces yokosukanensis30
and a Microbispora isolate31. Nebularine is a potent antibiotic against various
Mycobacterium species, exhibits cytotoxic effects in cell cultures and plants32,33, and is
toxic to the schistosomiasis (bilharzia) parasite34; however, its biological functions in the
hosts are unclear. In S. yokosukanensis, nebularine biosynthesis involves catalysis of the
reductive deamination of adenosine by a single enzyme35. Apparently, at least some
members of the domains Bacteria and Eukaryota synthesize unsubstituted purine,
indicating that purine is not a xenobiotic, a finding that has potential human health
implications. Purinergic membrane receptors, which include the adenosine-responsive
P1 purinoceptors, are found in almost all mammalian tissues, wherein they fulfill crucial
functions that can affect disease progression36–38. Although the occurrence of
unsubstituted purine in mammals is not established, the simple enzymatic conversion of
adenosine to nebularine has been demonstrated35, and enzymatic hydrolysis of the N-
glycosidic bond catalyzed by common nucleoside hydrolases (i.e., purine nucleosidases)

225
releases the corresponding free bases24. Thus, the formation of unsubstituted purine (or
purine nucleoside) could affect the regulation of cellular functions (purinergic signaling),
potentially enabling new disease therapies. Purinyl-Cba synthesis using Dsf CobT will
facilitate detailed investigations of its therapeutic potentials.
Corrinoid-dependent enzyme systems fulfill essential metabolic functions for
organisms in all branches of life, but only some members of Bacteria and Archaea have
the machinery for de novo corrinoid biosynthesis1,2,39–42. The discovery of a new member
of the corrinoid family of molecules, purinyl-Cba in organohaliderespiring members of the
Peptococcaceae, expands the number of naturally occurring, functional lower base
structures and assigns a function to unsubstituted purine in biological systems. From this
study and from recent reports, a concept emerges that lower base structures are
modulators of corrinoid-dependent enzyme function10,12,20,21. This concept applies to the
Dhc RDases, but may possibly expand to many other corrinoid-dependent enzyme
systems, emphasizing that enzyme-specific corrinoid cofactor requirements must be
understood to predict, and possibly manipulate, catalytic activity (for example, Dhc
reductive dechlorination rates and extents)43. The exact role(s) of the lower base in
RDase function is not resolved, but recent findings reveal a base-off configuration during
catalysis7,8. If not directly involved in catalysis, the lower base structures may affect
holoenzyme maturation, or, in the case of periplasmic enzymes such as respiratory
RDases, export through the cytoplasmic membrane. Cobamides fulfill essential metabolic
functions for the majority of organisms, including mammals, and the principle of lower
base-controlled activity of key corrinoid-dependent enzyme systems may provide new
avenues to manipulate environmental (for example, bioremediation) and biotechnological
(for example, anaerobic digestion, biogas production) processes and to expand treatment
options to affect progression of relevant human diseases.

226
3.5 METHODS
3.5.1 Chemicals
Vitamin B12 (≥98%), dicyanocobinamide (Cbi; ≥93%), 5,6-dimethylbenzimidazole
(DMB) (99%), 5-methylbenzimidazole (5-MeBza; 98%), 5-methoxybenzimidazole (5-
OMeBza) (97%), benzimidazole (Bza; 98%), and purine (98%) were purchased from
Sigma-Aldrich. 15NH4Cl (99%) was obtained from Cambridge Isotope Laboratories. Yeast
extract and peptone were purchased from Becton, Dickinson and Company. Bza-Cba, 5-
MeBza-Cba and 5-OMeBza-Cba were prepared via guided cobamide biosynthesis10.
Factor III (5-OHBza-Cba), norpseudo vitamin B12 and phenolic cobamides (i.e., Phenol-
Cba and p-Cresol-Cba) were extracted and purified from Methanosarcina barkeri strain
Fusaro (DSM 804), Sulfurospirillum multivorans (DSM 12446) and Sporomusa sp. strain
KB-1 (16S rRNA gene GenBank accession number AY780559.1) cells, respectively.
Concentrations of purified cobamides were determined at 361 nm with a Lambda 35 UV-
Vis spectrometer (PerkinElmer) using a molar extinction coefficient of 28,060 mol−1 cm−1
(ref. 12). Ethene (≥99.9%) and vinyl chloride (≥99.5%) were purchased from Sigma-
Aldrich. All other chemicals used were reagent grade or higher.
3.5.2 Cultures
Pure cultures were grown in 160 ml glass serum bottles containing 100 ml of
bicarbonate (30 mM) or phosphate (50 mM) buffered, defined mineral salts medium, the
Wolin vitamin mix excluding vitamin B12, and a N2/CO2 (80/20; v/v) headspace. D.
hafniense strains Y51 and JH1 and Dsf sp. Strains Viet1 and PCE1 cultures were
supplemented with pyruvate (10 mM) as fermentable substrate and with PCE (68 μmol
per bottle, 0.48 mM aqueous concentration) as electron acceptor44. Dhc strain BAV1 and
strain GT cultures were amended with 5 mM acetate as a carbon source, 10 ml hydrogen
as an electron donor, neat cDCE (79 μmol per bottle, 0.60 mM aqueous concentration)
as an electron acceptor, and a cobamide (for example, vitamin B12) as described10.
Geobacter sulfurreducens strain PCA cultures received 5 mM acetate as an electron
donor and 10 mM fumarate as an electron acceptor as described45. Sulfurospirillum

227
multivorans strain DSM 12446 cultures were grown with pyruvate (10 mM) and neat PCE
(0.48 mM) as electron acceptor as described21. D. restrictus strain PER-K23 cultures were
amended with 5 mM acetate as carbon source, 10 ml hydrogen as an electron donor,
neat PCE (0.48 mM) as electron acceptor, and peptone (0.5 g/L) as source of required
amino acids46. Sporomusa sp. strain KB-1 cultures were amended with betaine (50 mM)
as the sole substrate20. Methanosarcina barkeri strain Fusaro was grown with 123 mM
methanol as the sole substrate20. All vessels were incubated without agitation in the dark
at 30 °C. For 15N isotope experiments, 15NH4Cl (0.3 g/L) replaced unlabeled NH4Cl as the
nitrogen source. L-cysteine, a reductant added to the medium, is a potential nitrogen
source and was omitted in the labeling experiments. 15NH4Cl grown cultures were
transferred (1% inoculum; v/v) twice in 160 ml serum bottles containing 100 ml of medium
before scaling up to a 2.2 L vessel containing 1.8 L of medium to extract sufficient 15N-
labeled corrinoid for LC–MS analysis. Initial experiments with Geobacter sulfurreducens
strain PCA, a bacterium that natively produces 5-OHBza-Cba (14 N atoms in the cyano
form)47, demonstrated the utility of the 15N isotope labeling approach to determine the
number of N atoms in the lower base structure. We found that the mass spectra of 15N-
labeled versus unlabeled 5-OHBza-Cba produced in G. sulfurreducens cultures amended
with 15NH4Cl versus NH4Cl returned a mass shift of 12.96 Da, close to the expected value
of 13 total N atoms (14 minus one unlabeled N in the upper CN ligand, which was added
during the KCN extraction process) (Figure 3.14).
3.5.3 Corrinoid extraction
Cells were harvested from 0.3–1.8 L culture suspensions by centrifugation at
15,000 × g for 15 min at 4 °C, or by filtration onto 47-mm diameter 0.22-μm pore size
polyethersulfone membrane filters (Pall Life Sciences). The intracellular corrinoids were
extracted from the biomass following an established KCN extraction protocol and purified
using a C18 Sep-Pak cartridge (Waters Corp)10. To extract corrinoids from proteins
separated by BN–PAGE, gel slices were excised and transferred to individual 2 ml plastic
tubes with 1 ml of 90% (v/v) methanol containing 50 mM acetic acid and 10 mM KCN
(final pH 5.5) for corrinoid extraction. The closed tubes were incubated at 60 °C for 2 h to
solubilize corrinoids, before the solution was transferred to new 2 ml plastic tubes and

228
Figure 3.14 Demonstration of the utility of stable isotope 15N-labeling to obtain
lower base compositional information
Mass spectra of (A) unlabeled and (B) 15N-labeled 5-OHBza-Cba (i.e., factor III) produced
by Geobacter sulfurreducens strain PCA. The 15N-labeled 5-OHBza-Cba was purified
from Geobacter sulfurreducens cells grown with 15N-NH4Cl as the sole nitrogen source.
Mass shifts of 12.95 Dalton in the m/z values of [M+H]+ and [M+Na]+ base peaks matched
the predicted mass increase based on the total number of two N atoms in the Bza lower
base structure.
(A)
(B)

229
vacuum dried using a rotary evaporator at 45 °C for 2 h. The dry residues were suspended
in 75 μL ice-cold ammonium acetate (20 mM, pH 6.0), and centrifugation at 13,000 × g
for 5 min at 4 °C removed insoluble Coomassie Blue dye and gel residuals.
3.5.4 Corrinoid analysis
Intracellular corrrinoids were analyzed by HPLC, UV-Vis spectroscopy, and
UPLC–HRMS. HPLC analysis was performed with an Eclipse XDB-C18 column (Agilent
Technologies, 5 μm pore size, 4.6 mm inner diameter × 250 mm length) operated at a
flow rate of 1 ml per min at 30 °C using 0.1% (v/v) formic acid (≥88%, w/v; Thermo Fisher,
Waltham, MA, USA) in water as eluent A and 0.1% (v/v) formic acid in methanol as eluent
B. The initial mobile phase composition was 82% eluent A and 18% eluent B, before the
fraction of eluent B increased linearly to 25% over a 12-min and further to 75% over an
additional 3-min time period, held at 75% B for 5 min before being restored to initial
column conditions. UV-Vis spectra between 250 to 600 nm were collected using a diode
array detector. The upper ligand, cobalt oxidation state, and lower base coordination
influence the corrinoid absorbance spectrum in the UV region42. All corrinoid samples and
standards in this study carried the cobalt atom in the fully oxidized +3 state and a cyano
group as the upper ligand. Cbi lacks the entire α-ribazole-5′-phosphate (α-RP) moiety and
exhibited an UV-Vis spectrum with an absorption peak at 355 nm, distinct from the 361
nm absorption peak of vitamin B12 (Figure 3.2B). The corrinoids extracted from BN–
PAGE gels were analyzed using an UltiMate 3000 UPLC system in tandem with a high-
resolution Exactive Plus Orbitrap mass spectrometer (Thermo Fisher) and a UV-Vis
detector set to 361 nm as described48. Corrinoids were separated on a Hypersil Gold C18
column (Thermo Fisher; 1.9 μm pore size, 2.1 mm inner diameter × 50 mm length) at a
flow rate of 0.2 ml min−1 at 30 °C using 2.5 mM ammonium acetate in water as eluent A
and 100% methanol as eluent B. The mobile phase was 100% eluent A and 0% eluent B
for 0.46 min, followed by linear increases to 15% eluent B after 0.81 min, 50% eluent B
after 3.32 min, and 90% eluent B after 5.56 min with a 0.3-min hold before equilibration
to initial column conditions. Corrinoid mass spectra were collected in positive ionization
mode using a HESI II electrospray ionization source (Thermo Fisher) with a m/z scan

230
ranging from 1,000–1,500 and a resolution of 140,000. The detection limit for this LC–MS
method was 2.5 ng of corrinoid.
3.5.5 NMR spectroscopy
Growth of D. hafniense strain Y51 in twelve 2.2 L vessels yielded approximately
22 L of cell culture suspension. Each vessel received neat TCE (400 μL; 2.3 mM aqueous
concentration), yeast extract (2 g/L) and Cbi (0.5 μM) to enhance corrinoid production.
Cells were harvested after three TCE amendments (a total of 1,200 μL) were completely
dechlorinated to cDCE. Total intracellular corrinoids were extracted, and the predominant
corrinoid containing fraction was obtained following HPLC separation and manual
collection from the detector outlet informed by the detector response at 361 nm.
Approximately 0.7 mg of purified corrinoid was dissolved in methanol-d4 (250 μL) to
conduct 1H and COSY NMR experiments using an INOVA 600 MHz NMR spectroscopy
system (Varian). The 1H NMR experiments consisted of 1,024 scans, using PRESAT
solvent suppression multiple peak selection and a total measuring time of 1 h. The
gradient-selected COSY NMR experiments consisted of 256 scans per increment at 96
increments. The delay time between scans was 1.5 s, and the total measuring time was
1 h.
3.5.6 Blue native PAGE (BN–PAGE), enzyme assays and proteomic analysis
D. hafniense strain JH1 cells were harvested from 100 ml cultures and the crude
protein extracts were prepared as described49. BN–PAGE using pre-cast 4 to 16%
gradient Bis–Tris gel (Thermo Fisher) stained with Coomassie Blue was performed
following the NativePAGE Bis–Tris Gel Protocol49. Gel lanes were loaded with 25 μL of
protein standards or crude protein extracts containing approximately 6 μg of total protein
as estimated with the Bradford assay50. Electrophoresis was done using chilled buffers
and a BN–PAGE chamber placed in an ice bath, and separation occurred for 60 min at
150 V and then for another 45 min at 200 V. The blank, ladder and sample lanes were
separated and stained according to the fast Coomassie G-250 staining protocol (Thermo
Fisher). The gel slices were cut based on molecular mass ranges as visualized by the
protein standards in the ladder lane. Enzyme assays to detect dechlorinating activity were

231
conducted with D. hafniense strain JH1 cell lysate (positive control) and individual gel
slices inside an anoxic chamber (Coy Laboratory) as described49. The assays (1 ml) were
conducted in 2 ml sealed glass vials containing 100 mM Tris–HCl buffer (pH 7.4)
amended with 2 mM titanium citrate, 2 mM methyl viologen, and 2 mM TCE. Each assay
mixture was incubated in an anoxic chamber for 24 h and analyzed for cDCE formation
using gas chromatography49. In-gel digestion and MS analysis were performed at the
BioZone Mass Spectrometry Facility (University of Toronto, Toronto, Canada) using X!
Tandem for peptide/protein identification (The GPM, thegpm.org; version X! Tandem
Vengeance (2015.12.15.2))49. X! Tandem was set up to search for tryptic peptides based
on the D. hafniense strain Y51 genome, all characterized RDases, other Dsf proteins in
the NCBI database, as well as common contaminants such as human keratins and trypsin
(total of 33,950 proteins) using a fragment ion mass tolerance of 0.40 Da and a parent
ion tolerance of 2.5 Da. Deamidation of asparagine and glutamine, oxidation of
methionine and tryptophan, N-terminal ammonia loss, or cyclization of glutamine or
glutamic acid to pyroglutamine or pyroglutamic acid were allowed in X! Tandem as
possible peptide modifications. Further validation and refinement was performed using
Scaffold software version 4.5.3 (Proteome Software, Inc.) with a reverse decoy database
to establish a false discovery rate. Peptide identifications were accepted as valid at a
Peptide Prophet probability of greater than 95%51. Subsequent protein identifications
were considered valid at a Protein Prophet probability of greater than 99%52, which were
filtered to include those that had at least two unique peptide identifications.
3.5.7 Primer and probe design
Primers and TaqMan probe targeting the pceA gene in D. hafniense strain Y51
(locus # DSY2839), D. restrictus strain PERK23 (locus # DEHRE_12145), and pceA
homologs (>95% sequence identity) identified in other Dsf and Dhb strains (GenBank
accession numbers CAD28792.1, CDX02974.1, AAO60101.1 and AIA58680.1) were
designed using Primer Express software (Applied Biosystems). A consensus region of
the Dsf and Dhb pceA gene sequences was selected to meet the quantitative PCR
(qPCR) design criteria of (i) an amplicon size between 50–150 bp, (ii) a primer melting
temperature (Tm) of 58–60 °C, and (iii) a probe Tm of 68–70 °C53. The G+C content of the

232
primers and probe was between 30 to 80 mol %, with no more than three consecutive G
or C bases in either the primer or the probe sequences. The specificity of the forward
primer Df_pceA_1223F (5′-CGGACAAGCCGAGAAAATTC-3′), the reverse primer
Df_pceA_1286R (5′-GCATCCGCACATTTTTTGC-3′) and the probe Df_pceA_1247
probe (5′-6FAM-TACGCGAGTTCTGCCG-MGB-3′) to pceA genes was verified by using
BLAST search against the NCBI database.
3.5.8 Chemical and molecular analyses
Ethene and chlorinated compounds were quantified in triplicate cultures using an
Agilent 7890 gas chromatograph as described10. The two-step dechlorination processes
PCE-to-cDCE (Dhb) and cDCE-to-ethene (Dhc) were measured based on the
quantification of daughter and end products, TCE/cDCE and VC/ethene, respectively.
Each dichlorination step is associated with the release of one chloride ion and the PCE-
to-cDCE and cDCE-to-ethene dechlorination rates were reported as micromolar Cl−
released per day. The list of potential molecular formulas for the lower base of the Dsf
cobamide was generated using the web-based platform ChemCalc54. To obtain genomic
DNA, cells from 1 ml culture suspension were harvested via vacuum filtration onto a 0.22
μm polyvinylidene difluoride membrane filter (Merck Millipore Ltd.) and processed using
the MO BIO Soil DNA Isolation kit (MO BIO) as described45. Dhc 16S rRNA gene-targeted
qPCR was performed following established protocols using primer set
Dhc1200F/Dhc1271R and TaqMan probe Dhc1240probe53. The qPCR assay targeting
the Dhb pceA gene with the newly designed primers and probe used identical qPCR
conditions. Standard curves were generated using a serial dilution of plasmid pMK-RQ
(Life Technologies) with a D. hafniense strain Y51 pceA fragment (1,656 bp) insertion.
The pceA qPCR assay standard curve had a slope of −3.785, a y-intercept of 40.41, a R2
of 0.999, and a PCR amplification efficiency of 83.8%. The assay spanned a linear range
from 4.64 × 101 to 4.64 × 10⁸ pceA gene copies per reaction, with 4.6 pceA gene copies
per reaction as the detection limit. All qPCR assays used template DNA samples
extracted from triplicate cultures, and standard curves were generated from three
independently prepared serial dilutions of the respective plasmid DNA standards.

233
3.5.9 Statistical analysis
The PCE-to-cDCE dechlorination rates from three independent Dhb cultures
grown with purinyl-Cba or vitamin B12 were statistically compared. The two-sample t-test
was carried out using the data analysis tool provided in Microsoft Excel 2016.
3.5.10 Bioinformatics and phylogenetic analyses
RDase sequence alignments and identity comparisons were performed with
Clustal Omega (www.ebi.ac.uk/Tools/msa/clustalo)55. Reciprocal BLAST analysis was
used to query the sequenced Dsf genomes and search for orthologous bza genes
implicated in anaerobic DMB biosynthesis47. Twenty CobT amino acid sequences from
the genomes of nine Dsf strains, five Dhb strains and six Desulfosporosinus strains, along
with 20 CobT and homologous protein (i.e., ArsA and ArsB) sequences from other
bacteria (Table 3.2) were retrieved from GenBank, and aligned using the MUSCLE plug-
in in Geneious 8.1.7 with 10 iterations. The phylogenetic tree of CobT and homologous
proteins was constructed using the PHMYL maximum likelihood tree builder plug-in in
Geneious 8.1.7 with 100 bootstraps and the Le and Gascuel substitution model56.
3.5.11 Heterologous expression and purification of CobT
The pET-28a(+) vector (EMD Millipore) was used to clone and express cobT
carrying an N-terminal hexa-histidine tag. Dsf cobT (locus # DSY2114) and Dhc cobT
(locus # DehaBAV1_0626) were amplified using Phusion Flash High-Fidelity PCR Master
Mix (Thermo Fisher) and primer sets NJ459-NJ460 and NJ461-NJ462 (Table 3.4),
respectively, using genomic DNA from Dsf strain Y51 and Dhc strain BAV1 axenic
cultures. PCR products were cleaned using the UltraClean PCR Clean-Up Kit (MO BIO).
The pET-28a(+) vector backbone was digested with EcoRI and NdeI, dephosphorylated
with rSAP, and gel extracted to remove remaining supercoiled constructs. The prepared
plasmids pNJ050 and pNJ049 (Table 3.5), which contain Dsf cobT and Dhc cobT inserts,
respectively, were then transformed into BW25113 electrocompetent cells with pre-
induced λ Red recombinase from plasmid pKD46 for homologous recombination57.

234
Following sequence verification, recombinant vectors were introduced into E. coli strain
BL21(DE3) (New England BioLabs) for overexpression and purification.
Enzyme expression and purification were performed as described with
modifications58. In brief, E. coli strain BL21(DE3) carrying a cobT expression plasmid was
grown in 1 L of Terrific Broth (Thermo Fisher) with 50 μg/mL kanamycin at 37 °C and 180
rpm to an optical density at 600 nm (OD600) of 0.8. Cultures were induced with 0.4 mM
isopropyl β-D-1-thiogalactopyranoside (Thermo Fisher) and incubated overnight at 16 °C
and 180 rpm. Cells were collected by centrifugation at 9,000 × g for 20 min, suspended
in HEPES buffer (50 mM HEPES, 300 mM NaCl and 10 mM imidazole, pH 7.5), and
sonicated in an ice bath for 45 min (3-s on and 4-s off). The lysate was centrifuged at
38,000 × g for 20 min and the supernatant was passed through a 25 ml glass column
containing about 0.5 ml Ni-NTA resin (Qiagen). After washing with HEPES buffer (20 mM
imidazole), proteins were eluted with 5–7 mL of HEPES buffer containing 250 mM
imidazole and 5% (w/v) glycerol. Protein concentrations were estimated using the
Bradford assay50 and protein purity was examined by SDS–PAGE and Coomassie Blue
staining. The protein stock solutions (Dsf Y51 CobT, 15 mg/mL; Dhc BAV1 CobT, 10
mg/mL) were frozen in liquid nitrogen and stored at −80 °C. The N-terminal hexa-histidine
tag was retained for all experiments.
3.5.12 In vitro CobT activity
CobT assays were performed as described59. Briefly, each reaction (300 μL)
contained 30 μg CobT (corresponding to a final enzyme concentration of ~2.6 μM), 2 mM
NaMN, 10 mM MgCl2, and 0.25 mM of either purine or DMB in 50 mM pH 7.5 Tris–HCl
buffer. The assay vials were incubated at 30 °C for 30 min before the reactions were
terminated by the addition of 15 μL formic acid (≥88%; w/v) and then transferred to a
boiling water bath for 1 min. Following neutralizing the pH with 5 M NaOH, precipitated
protein was removed by centrifugation at 13,000 × g for 5 min. Lower bases and their
respective α-RPs were analyzed by injecting 10 μL samples into an Agilent Technologies
1200 series HPLC system equipped with a diode array detector set to 262 nm. Separation
was performed with an Eclipse XDB-C18 column (5 μm pore size; 4.6 mm inner diameter

235
× 250 mm length) at a flow rate of 1 ml per min at 30 °C using 0.1% (v/v) formic acid in
water as eluent A and 0.1% (v/v) formic acid in methanol as eluent B. The initial mobile
phase and time parameters for the gradient elution were as follows: t = 0, 15% eluent B;
t = 5 min, 25% eluent B; t = 11 min, 85% eluent B; t = 11.1 to 15 min, 15% eluent B. To
obtain material for subsequent MS analysis, semi-preparative HPLC was performed using
the method outlined above with minor modification as follows. The injection volume was
increased to 100 μL, and a 1 ml fraction containing α-RP [DMB] or α-RP [purine] was
manually collected from the detector outlet once the target peak was detected. Three
such injections were performed and the α-RP fractions from each were combined, and
then concentrated 10-fold from 3 mL to 300 μL using a Savant ISS110 vacuum dryer
(Thermo Fisher). Aliquots (10 μL) of the concentrated α-RP solutions were introduced into
an Exactive Plus Orbitrap MS via direct injection. The analytes were ionized using
electrospray ionization operated in positive mode and detected via high-resolution MS
with a mass range of 200 to 400 m/z10.

236
Table 3.4 Nucleotide sequences of the primers designed for PCR amplification of
the cobT genes to construct overexpression plasmids.
Primer set NJ459/NJ460 was used to amplify the Dsf cobT gene (locus # DSY2114) from
Dsf strain Y51 genomic DNA. Primer set NJ461/NJ462 was used to amplify the Dhc cobT
gene (locus # DehaBAV1_0626) from Dhc strain BAV1 genomic DNA. The homology
regions for vector recombination are in red color font.
Primer Sequence (5'-3')
NJ459 TCATCATCACAGCAGCGGCCTGGTGCCGCGCGGCAGCCATGTGGATGACTTCTTAAGACAGGAAAAC
NJ460 TGGTGCTCGAGTGCGGCCGCAAGCTTGTCGACGGAGCTCGTTAGTTTTTACCGCTGACTCCTGC
NJ461 TCATCATCACAGCAGCGGCCTGGTGCCGCGCGGCAGCCATATGGAACTATTAAACGCAACACTTGC
NJ462 TGGTGCTCGAGTGCGGCCGCAAGCTTGTCGACGGAGCTCGCTAACTTTGCTTTTCGGAAACCC

237
Table 3.5 Information about the plasmids used for the overexpression of CobT
enzymes.
Plasmid Description Source or reference
pET-28a(+) General E. coli expression vector with IPTG induction EMD
Millipore
pKD46 Red swap plasmid carrying λ Red recombinase Datsenko
2000
pNJ050 pET-28a(+) with IPTG-inducible expression of Dsf cobT (locus #
DSY2114) carrying N-terminal 6X-HIS tag This study
pNJ049 pET-28a(+) with IPTG-inducible expression of Dsf cobT (locus #
DehaBAV1_0626) carrying N-terminal 6X-HIS tag This study
IPTG: isopropyl β-D-1-thiogalactopyranoside

238
REFERENCES
1. Renz, P. in Chemistry and biochemistry of B12 (ed. Banerjee, R.) 558–572 (John Wiley
& Sons, Inc.: 1999).
2. Gruber, K.; Puffer, B.; Kräutler, B., Vitamin B 12-derivatives—enzyme cofactors and
ligands of proteins and nucleic acids. Chemical Society Reviews 2011, 40 (8),
4346-4363.
3. Kräutler, B.; Fieber, W.; Ostermann, S.; Fasching, M.; Ongania, K. H.; Gruber, K.;
Kratky, C.; Mikl, C.; Siebert, A.; Diekert, G., The Cofactor of Tetrachloroethene
Reductive Dehalogenase of Dehalospirillum multivorans is Norpseudo‐B12, a New
Type of a Natural Corrinoid. Helvetica Chimica Acta 2003, 86 (11), 3698-3716.
4. Im, J.; Walshe-Langford, G. E.; Moon, J.-W.; Loffler, F. E., Environmental fate of the
next generation refrigerant 2, 3, 3, 3-tetrafluoropropene (HFO-1234yf).
Environmental science & technology 2014, 48 (22), 13181-13187.
5. Maillard, J.; Schumacher, W.; Vazquez, F.; Regeard, C.; Hagen, W. R.; Holliger, C.,
Characterization of the corrinoid iron-sulfur protein tetrachloroethene reductive
dehalogenase of Dehalobacter restrictus. Applied and Environmental Microbiology
2003, 69 (8), 4628-4638.
6. Liao, R.-Z.; Chen, S.-L.; Siegbahn, P. E., Which Oxidation State Initiates
Dehalogenation in the B12-Dependent Enzyme NpRdhA: CoII, CoI, or Co0? ACS
Catalysis 2015, 5 (12), 7350-7358.
7. Bommer, M.; Kunze, C.; Fesseler, J.; Schubert, T.; Diekert, G.; Dobbek, H., Structural
basis for organohalide respiration. Science 2014, 1258118.
8. Payne, K. A.; Quezada, C. P.; Fisher, K.; Dunstan, M. S.; Collins, F. A.; Sjuts, H.; Levy,
C.; Hay, S.; Rigby, S. E.; Leys, D., Reductive dehalogenase structure suggests a
mechanism for B12-dependent dehalogenation. Nature 2015, 517 (7535), 513-
516.
9. Löffler, F. E.; Yan, J.; Ritalahti, K. M.; Adrian, L.; Edwards, E. A.; Konstantinidis, K. T.;
Müller, J. A.; Fullerton, H.; Zinder, S. H.; Spormann, A. M., Dehalococcoides

239
mccartyi gen. nov., sp. nov., obligately organohalide-respiring anaerobic bacteria
relevant to halogen cycling and bioremediation, belong to a novel bacterial class,
Dehalococcoidia classis nov., order Dehalococcoidales ord. nov. and family
Dehalococcoidaceae fam. nov., within the phylum Chloroflexi. International journal
of systematic and evolutionary microbiology 2013, 63 (2), 625-635.
10. Yan, J.; Şimşir, B.; Farmer, A. T.; Bi, M.; Yang, Y.; Campagna, S. R.; Löffler, F. E.,
The corrinoid cofactor of reductive dehalogenases affects dechlorination rates and
extents in organohalide-respiring Dehalococcoides mccartyi. The ISME journal
2016, 10 (5), 1092-1101.
11. Yi, S.; Seth, E. C.; Men, Y.-J.; Stabler, S. P.; Allen, R. H.; Alvarez-Cohen, L.; Taga,
M. E., Versatility in corrinoid salvaging and remodeling pathways supports
corrinoid-dependent metabolism in Dehalococcoides mccartyi. Applied and
environmental microbiology 2012, 78 (21), 7745-7752.
12. Mok, K. C.; Taga, M. E., Growth inhibition of Sporomusa ovata by incorporation of
benzimidazole bases into cobamides. Journal of bacteriology 2013, 195 (9), 1902-
1911.
13. Stupperich, E., Eisinger, H.-J. & Kräutler, B. Identification of phenolyl cobamide from
the homoacetogenic bacterium Sporomusa ovata. The FEBS Journal 1989, 186
(3), 657-661.
14. Villemur, R.; Lanthier, M.; Beaudet, R.; Lépine, F., The Desulfitobacterium genus.
FEMS microbiology reviews 2006, 30 (5), 706-733.
15. Ding, C.; Zhao, S.; He, J., A Desulfitobacterium sp. strain PR reductively dechlorinates
both 1, 1, 1‐trichloroethane and chloroform. Environmental microbiology 2014, 16
(11), 3387-3397.
16. Suyama, A.; Yamashita, M.; Yoshino, S.; Furukawa, K., Molecular characterization of
the PceA reductive dehalogenase of Desulfitobacterium sp. strain Y51. Journal of
Bacteriology 2002, 184 (13), 3419-3425.
17. Reinhold, A.; Westermann, M.; Seifert, J.; von Bergen, M.; Schubert, T.; Diekert, G.,
Impact of vitamin B12 on formation of the tetrachloroethene reductive

240
dehalogenase in Desulfitobacterium hafniense strain Y51. Applied and
environmental microbiology 2012, 78 (22), 8025-8032.
18. Nonaka, H.; Keresztes, G.; Shinoda, Y.; Ikenaga, Y.; Abe, M.; Naito, K.; Inatomi, K.;
Furukawa, K.; Inui, M.; Yukawa, H., Complete genome sequence of the
dehalorespiring bacterium Desulfitobacterium hafniense Y51 and comparison with
Dehalococcoides ethenogenes 195. Journal of bacteriology 2006, 188 (6), 2262-
2274.
19. Crofts, T. S.; Seth, E. C.; Hazra, A. B.; Taga, M. E., Cobamide structure depends on
both lower ligand availability and CobT substrate specificity. Chemistry & biology
2013, 20 (10), 1265-1274.
20. Yan, J.; Im, J.; Yang, Y.; Löffler, F. E., Guided cobalamin biosynthesis supports
Dehalococcoides mccartyi reductive dechlorination activity. Phil. Trans. R. Soc. B
2013, 368 (1616), 20120320.
21. Keller, S.; Ruetz, M.; Kunze, C.; Kräutler, B.; Diekert, G.; Schubert, T., Exogenous 5,
6‐dimethylbenzimidazole caused production of a non‐functional tetrachloroethene
reductive dehalogenase in Sulfurospirillum multivorans. Environmental
microbiology 2014, 16 (11), 3361-3369.
22. Guimarães, D. H.; Weber, A.; Klaiber, I.; Vogler, B.; Renz, P., Guanylcobamide and
hypoxanthylcobamide-corrinoids formed by Desulfovibrio vulgaris. Archives of
microbiology 1994, 162 (4), 272-276.
23. Stasyuk, O. A.; Szatyłowicz, H.; Krygowski, T. M., Effect of the H-bonding on
aromaticity of purine tautomers. The Journal of organic chemistry 2012, 77 (8),
4035-4045.
24. Moffatt, B.A.; Ashihara, H., Purine and pyrimidine nucleotide synthesis and
metabolism. The Arabidopsis Book 2002, e0018.
25. Kublik, A.; Deobald, D.; Hartwig, S.; Schiffmann, C. L.; Andrades, A.; Bergen, M.;
Sawers, R. G.; Adrian, L., Identification of a multi‐protein reductive dehalogenase
complex in Dehalococcoides mccartyi strain CBDB1 suggests a protein‐dependent

241
respiratory electron transport chain obviating quinone involvement. Environmental
microbiology 2016, 18 (9), 3044-3056.
26. Dobbek, H.; Svetlitchnyi, V.; Gremer, L.; Huber, R.; Meyer, O., Crystal structure of a
carbon monoxide dehydrogenase reveals a [Ni-4Fe-5S] cluster. Science 2001,
293 (5533), 1281-1285.
27. Iverson, T. M.; Luna-Chavez, C.; Cecchini, G.; Rees, D. C., Structure of the
Escherichia coli fumarate reductase respiratory complex. Science 1999, 284
(5422), 1961-1966.
28. Rosemeyer, H., The chemodiversity of purine as a constituent of natural products.
Chemistry & biodiversity 2004, 1 (3), 361-401.
29. Löfgren, N.; Lüning, B., On the structure of nebularine. Acta Chemica Scandinavica
1953, 7, 225.
30. Nakamura, G., Studies on antibiotic actinomycetes. III. on Streptomyces producing 9-
β-D-ribofuranosylpurine. Journal of Antibiotics 1961, 14 (2), 94–97.
31. Cooper, R.; Horan, A.C.; Gunnarsson, I.; Patel, M.; Truumees, I., Nebularine from a
novel Microbispora sp. Journal of Industrial Microbiology & Biotechnology 1986, 1
(4), 275–276.
32. Gordon, M. P.; Brown, G. B., A study of the metabolism of purine riboside. Journal of
Biological Chemistry 1956, 220 (2), 927-937.
33. Brown, E. G.; Konuk, M., Plant cytotoxicity of nebularine (purine riboside).
Phytochemistry 1994, 37 (6), 1589-1592.
34. el Kouni, M.H., Messier, N.J. & Cha, S. Treatment of schistosomiasis by purine
nucleoside analogues in combination with nucleoside transport inhibitors.
Biochem. Pharmacol. 1987, 36, 3815–3821.
35. Brown, E.G. & Konuk, M. Biosynthesis of nebularine (purine 9-β-Dribofuranoside)
involves enzymic release of hydroxylamine from adenosine. Phytochemistry 1995,
38, 61–71.

242
36. Ralevic, V.; Burnstock, G., Receptors for purines and pyrimidines. Pharmacological
reviews 1998, 50 (3), 413-492.
37. Burnstock, G., Purinergic signaling and disorders of the central nervous system.
Nature reviews Drug discovery 2008, 7 (7), 575-590.
38. Di Virgilio, F.; Adinolfi, E., Extracellular purines, purinergic receptors and tumor
growth. Oncogene 2017, 36 (3), 293-303.
39. Miles, Z. D.; McCarty, R. M.; Molnar, G.; Bandarian, V., Discovery of epoxyqueuosine
(oQ) reductase reveals parallels between halorespiration and tRNA modification.
Proceedings of the National Academy of Sciences 2011, 108 (18), 7368-7372.
40. Parks, J. M.; Johs, A.; Podar, M.; Bridou, R.; Hurt, R. A.; Smith, S. D.; Tomanicek, S.
J.; Qian, Y.; Brown, S. D.; Brandt, C. C., The genetic basis for bacterial mercury
methylation. Science 2013, 339 (6125), 1332-1335.
41. Randaccio, L.; Geremia, S.; Demitri, N.; Wuerges, J., Vitamin B12: unique
metalorganic compounds and the most complex vitamins. Molecules 2010, 15 (5),
3228-3259.
42. Schneider, Z.; Stroinski, A., Comprehensive B12: chemistry, biochemistry, nutrition,
ecology, medicine. Walter de Gruyter: 1987.
43. Degnan, P. H.; Taga, M. E.; Goodman, A. L., Vitamin B12 as a modulator of gut
microbial ecology. Cell metabolism 2014, 20 (5), 769-778.
44. Suyama, A.; Iwakiri, R.; Kai, K.; Tokunaga, T.; Sera, N.; Furukawa, K., Isolation and
characterization of Desulfitobacterium sp. strain Y51 capable of efficient
dehalogenation of tetrachloroethene and polychloroethanes. Bioscience,
biotechnology, and biochemistry 2001, 65 (7), 1474-1481.
45. Yan, J.; Ritalahti, K. M.; Wagner, D. D.; Löffler, F. E., Unexpected specificity of
interspecies cobamide transfer from Geobacter spp. to organohalide-respiring
Dehalococcoides mccartyi strains. Applied and environmental microbiology 2012,
78 (18), 6630-6636.

243
46. Holliger, C.; Hahn, D.; Harmsen, H.; Ludwig, W.; Schumacher, W.; Tindall, B.;
Vazquez, F.; Weiss, N.; Zehnder, A. J., Dehalobacter restrictus gen. nov. and sp.
nov., a strictly anaerobic bacterium that reductively dechlorinates tetra-and
trichloroethene in an anaerobic respiration. Archives of Microbiology 1998, 169 (4),
313-321.
47. Hazra, A. B.; Han, A. W.; Mehta, A. P.; Mok, K. C.; Osadchiy, V.; Begley, T. P.; Taga,
M. E., Anaerobic biosynthesis of the lower ligand of vitamin B12. Proceedings of
the National Academy of Sciences 2015, 112 (34), 10792-10797.
48. Wang, P.-H.; Tang, S.; Nemr, K.; Flick, R.; Yan, J.; Mahadevan, R.; Yakunin, A. F.;
Löffler, F. E.; Edwards, E. A., Refined experimental annotation reveals conserved
corrinoid autotrophy in chloroform-respiring Dehalobacter isolates. The ISME
journal 2017, 11 (3), 626-640.
49. Tang, S.; Chan, W. W.; Fletcher, K. E.; Seifert, J.; Liang, X.; Löffler, F. E.; Edwards,
E. A.; Adrian, L., Functional characterization of reductive dehalogenases by using
blue native polyacrylamide gel electrophoresis. Applied and environmental
microbiology 2013, 79 (3), 974-981.
50. Bradford, M. M., A rapid and sensitive method for the quantitation of microgram
quantities of protein utilizing the principle of protein-dye binding. Analytical
biochemistry 1976, 72 (1-2), 248-254.
51. Keller, A.; Nesvizhskii, A. I.; Kolker, E.; Aebersold, R., Empirical statistical model to
estimate the accuracy of peptide identifications made by MS/MS and database
search. Analytical chemistry 2002, 74 (20), 5383-5392.
52. Nesvizhskii, A. I.; Keller, A.; Kolker, E.; Aebersold, R., A statistical model for identifying
proteins by tandem mass spectrometry. Analytical chemistry 2003, 75 (17), 4646-
4658.
53. Ritalahti, K. M.; Amos, B. K.; Sung, Y.; Wu, Q.; Koenigsberg, S. S.; Löffler, F. E.,
Quantitative PCR targeting 16S rRNA and reductive dehalogenase genes
simultaneously monitors multiple Dehalococcoides strains. Applied and
environmental microbiology 2006, 72 (4), 2765-2774.

244
54. Patiny, L.; Borel, A., ChemCalc: A Building Block for Tomorrow’s Chemical
Infrastructure. Journal of Chemical Information and Modeling 2013, 53 (5), 1223-
1228.
55. Sievers, F.; Wilm, A.; Dineen, D.; Gibson, T. J.; Karplus, K.; Li, W.; Lopez, R.;
McWilliam, H.; Remmert, M.; Söding, J.; Thompson, J. D.; Higgins, D. G., Fast,
scalable generation of high-quality protein multiple sequence alignments using
Clustal Omega. Molecular Systems Biology 2011, 7, 539-539.
56. Kearse, M.; Moir, R.; Wilson, A.; Stones-Havas, S.; Cheung, M.; Sturrock, S.; Buxton,
S.; Cooper, A.; Markowitz, S.; Duran, C.; Thierer, T.; Ashton, B.; Meintjes, P.;
Drummond, A., Geneious Basic: An integrated and extendable desktop software
platform for the organization and analysis of sequence data. Bioinformatics 2012,
28 (12), 1647-1649.
57. Datsenko, K. A.; Wanner, B. L., One-step inactivation of chromosomal genes in
Escherichia coli K-12 using PCR products. Proceedings of the National Academy
of Sciences 2000, 97 (12), 6640-6645.
58. Huang, L.; Khusnutdinova, A.; Nocek, B.; Brown, G.; Xu, X.; Cui, H.; Petit, P.; Flick,
R.; Zallot, R.; Balmant, K.; Ziemak, M. J.; Shanklin, J.; de Crécy-Lagard, V.; Fiehn,
O.; Gregory Iii, J. F.; Joachimiak, A.; Savchenko, A.; Yakunin, A. F.; Hanson, A.
D., A family of metal-dependent phosphatases implicated in metabolite damage-
control. Nature Chemical Biology 2016, 12, 621.
59. Hazra, Amrita B.; Tran, Jennifer L. A.; Crofts, Terence S.; Taga, Michiko E., Analysis
of Substrate Specificity in CobT Homologs Reveals Widespread Preference for
DMB, the Lower Axial Ligand of Vitamin B12. Chemistry & Biology 2013, 20 (10),
1275-1285.

245
CONCLUSION

246
While spearheading the development of our neuroscience collaborations at the
University of Tennessee-Knoxville, I was able to advance the field of small molecule
detection and identification. These projects stretched the boundaries of our analytical
technologies and bolstered our current understanding of the true capabilities of high-
resolution mass spectrometry. Through our analyses, we established that a vast amount
of information can be gained from sub-milligram quantities of brain tissue or even from
dilute, small volume dialysate samples. Additionally, we have identified standard
statistical protocols for proper pre-processing normalization procedures and the
identification of significant metabolites through multiple statistical analyses. Through
literature research, we have tentatively interpreted the observed metabolic changes for
identified small molecules that will be studied in detail during future experimental
endeavors. Lastly, several unidentified features were ambiguously classified, and
represent the unique advantage of using an untargeted approach.
The analysis of stress-related changes to global metabolism provides the field of
behavioral psychology with a novel toolset to promote the research of new small molecule
targets. In the future, the results of our analyses may well lead to a therapeutic lead
discovery compound that could treat, or even prevent post-traumatic stress related
symptoms. This mental health condition is known to affect our war veterans, but it
stretches far beyond the military as ~10% of the population exhibits symptoms related to
PTSD. Unique to our study, future researchers can refer to our unidentified spectral
features list to determine if a compound of interest was detected in our study. This aspect
demonstrates the dynamic nature of untargeted metabolomics because even after the
research has been published, new discoveries could always be related back to our initial
discovery-based experiment.
The identification of thousands of small molecules from a 15-microliter sample of
dialysate represents the unparalleled qualities of a high-resolution mass spectrometer.
By detecting the global metabolism during various states of consciousness, we have
provided sleep researchers with comparable tools that will facilitate the expansion of
current neurochemical analyses within the field. It is foreseeable that future experiments
will be conducted based on our results. This is a simple prediction to make because the

247
function and regulation of the sleep-wake cycle is still generally unknown. The analysis
of native (underivatized) small molecules from dialysate of the extracellular matrix
reduces sample convolution and increases sample throughput. Although the true
understanding of neuronal function will forever be a complicated maze, this progression
of research brings us closer to full comprehension.
After analyzing thousands of known and unknown metabolites, the ability to
successfully characterize a novel compound was refreshing. The successful
characterization of purinyl-cobamide is a significant advancement within the fields of
microbiology and structure elucidation. In future studies of novel cobamides, we have
provided a strategy for the characterization of future cobamide species. This will be
essential for the continued research involving bioremediation. Microbial cultures are the
ideal biological system for the characterization of novel compounds. We can grow them
in large quantities with minimal biosafety regulation and relatively low costs, then following
analyte purification, we are left with a clean sample. The only limiting factor for cell
cultures are growth rates and the amount of analyte produced per cell.
The expansion of metabolomics for pharmacological development and clinical
practices is crucial for the treatment, or prevention of various health related
diseases/disorders. More specifically, the areas of neurological disorders and oncology
could benefit the most from continued development of small molecule analysis. From my
point-of-view, the study of small molecules needs to become a cross-functional ‘omics’
technique that is easily interpreted when combined with genomics, or even proteomics.
The disconnect from systems biology to the real-time snapshot analyses of metabolomics
is an issue that will be resolved over the next decade. Additionally, researchers need to
begin utilizing the true power of mass spectrometry by analyzing complex multicellular
organisms, such as rodents and humans, through flux analysis. Flux studies involve the
labeling of one, or more atoms using a heavy isotope, such as 13-carbon or 15-nitrogen.
These analyses provide a rate of metabolism because you can observe the appearance,
and disappearance of labeled metabolites. This process is commonly used in bacterial
and microbial cultures, and I think would greatly benefit the health research community if
we could begin using 13-carbon labeled glucose in a food or drink supplement to study

248
the rate of metabolism. Who knows, maybe mass spectrometry imaging or even magnetic
resonance could be used to show where the labeled material is being consumed fastest.
This could lead to a non-invasive technique for the identification of tumorous cells. In the
meantime, small molecule researchers need to continue conducting discovery-based
research projects, then use those results to begin performing targeted experiments. This
could include the administration of a small molecule of interest, or even the genetic
engineering of a knockout strain, given that your research is using rodents. These follow-
up studies would lead to the development of a single, or multiple small molecule targets
that could lead to the treatment of disease.
In closing, my research has all been focused on the study of small molecules and
the development of new technologies, or techniques for the identification of novel
compounds. I truly believe that the global biochemical community has only discovered
less than 5% of all biologically active compounds. As instrumentation becomes more
accurate and sensitive, as computers and related software enhances, and our ability to
analyze, comprehend, and learn develops, we can expand our current understanding of
how small molecule fluctuations occur as a response, or cause the response.

249
VITA
Allen Kenneth Bourdon grew up in Massena, NY, a small town in upstate New York
along the St. Lawrence River. Under the care of Raymond J. Bourdon and Cathy E.
Phelix, Allen lettered in three varsity sports; soccer hockey, and baseball, including a
2008 State Championship in hockey during his senior season. A 2008 graduation from
high school included the completion of an Advanced Regents diploma and an
International Bachelorette diploma. In the fall of 2012, Allen received his Bachelor of
Science in Medicinal Chemistry from the State University of New York at Buffalo. During
his time at UB, he worked as an undergraduate research assistant in two separate
laboratories; the organic division of Dr. Andrew Murkin, and the analytical division of Dr.
Luis A. Colon. It was under the supervision of Dr. Colon’s graduate student, Dr. J. Cody
Vinci that Allen accomplished his first authorship (Vinci, J. C. et al., Hidden Properties of
Carbon Dots Revealed After HPLC Fractionation. J. Phys. Chem. Lett 2013, 4 (2), 239-
243.) and propelled him towards a graduate career of his own. But before embracing the
life of a graduate student, Allen wanted a feel for the industrial work place, so in the
summer of 2012 he moved to Boston, MA to work as a chemical technician in the quality
control sector of Doble Engineering. In an attempt to get closer to his twin nephews, Brody
and Landyn Enslow, Allen began focusing on graduate programs in the southeastern
United States. This lead him to the acceptance of a graduate fellowship from the
University of Tennessee, and sequential move to Knoxville, TN in the summer of 2013.
In the spring of 2014, Allen began working with Dr. Shawn R. Campagna, originally
working on organic synthesis. His research quickly transitioned to the use of analytical
technologies, where he spearheaded the establishment of the neuroscience division for
the Biological Small Molecule Mass Spectrometry Core. Following graduate school, Allen
plans to join the research & development sector of a pharmaceutical company with long-
term goals of becoming a principal scientist for early-stage drug development.