613.full.pdf - Journal of Neuroscience
7
The Journal of Neuroscience, February 1990, IO(2): 613-619 Positron Emission Tomographic Measurements of Pulvinar Activity During an Attention Task David LaBerge and Monte S. Buchsbaum Departments of Cognitive Science and Psychiatry, University of California, Irvine, Irvine, California 92717 Positron emission tomographic scans were recorded from human subjects following an object-identification task, one version of which required attentional selection and the other version of which did not. In one experimental session, the attention-demanding displays were presented in the left vi- sual field and the nonattention displays were presented in the right visual field. In a second session, the sides of the displays were reversed. Analysis of the scans indicated that, averaged across the 2 sessions, the pulvinar showed greater glucose uptake when it was contralateral to the display of the selective attention task than when it was contralateral to the display of the nonattention task. The pattern of the data indicated that the degree of the attention task effect on pulvinar glucose uptake may differ between the hemi- spheres. In view of known connections beteen the pulvinar and cortical areas that mediate object identification, the present finding suggests that the pulvinar operates inter- actively with these cortical structures when an identification process demands selective attention. When a target object is displayed in the neighborhood of other objectsin the visual field, the visual systemmust somehow find a way to usejust the information at the location of the target object in order to identify that object. Exactly how the brain selects an object for identification or for a judgment of location is not known (Ullman, 1984; Shiffrin, 1988). Identification of an object in primates apparently involves the flow of infor- mation from the striate cortex to other areas of cerebral cortex, in particular to the occipital-temporal border (Petersen et al., 1988; Posner et al., 1988) and the inferotemporal lobe (Gross, 1973;Van Essen and Maunsell, 1983; Ungerleiderand Mishkin, 1982; Desimone et al., 1985). In contrast, judgment of the lo- cation of an object in space apparently involves a path from Vl to the more dorsal cortex, in particular, the posterior parietal lobe (Lynch et al., 1977; Wurtz et al., 1980; Mountcastle et al., 1981; Andersen et al., 1985; Posner et al., 1987). Thus, if an object is presented for identification or for judgment of location, it would seem that the principal connections link one cortical areato another. However, when an object suchasthe letter “0” is presentedwith other objects in its neighborhood, as in the Received June 21, 1989; revised Aug. 21, 1989; accepted Aug. 22, 1989. This research was supported by grants from the Office of Naval Research and the University of California to Dr. LaBerge, by the MacArthur Foundation to Dr. Buchsbaum, and by a gift to the Brain Imaging Center by Eldon and Marjorie Lockhart. We thank E. G. Jones for advice and for assistance with the pulvinar drawings, R. Haier for helpful comments, and V. Brown, S. Guich, L. Prager, and especially M. Carter, E. Hazlett, C. Reynolds, and K. Wong for technical assistance. Correspondence should be addressed to Dr. David LaBerge at the above address. Copyright 0 1990 Society for Neuroscience 0270-6474/90/100613-07$02.00/O display “HOT,” then the information arriving at the inferotem- poral areas could result in the identification of the word pattern “HOT,” as well asthe letter “0,” or the letters “H” and “T.” To prevent sucha confusion of identified objects, somekind of filtering would seem to be necessary. The notion of an atten- tional filter originated with the work of Broadbent (1958) and it hasbeeninfluential in the work of Hillyard and Picton (1987), Kahneman and Treisman (1984), Moran and Desimone(1985), Treisman (1969), Ullman (1984) and others (for reviews, see Johnston and Dark, 1986; Shiffrin, 1988). An adaptation of the notion of filtering to the identification of letters in a cluttered display is described in a recent theory (LaBerge and Brown, (1989) in which it is assumed that information flowing from a feature-registration area (e.g., areaVl) to an areaof shape iden- tification (e.g., area IT) undergoes filtering controlled by a central filtering mechanism.For example, to identify the letter “0” in the ensemble “HOT,” either the information flow correspond- ing to the target “0” is facilitated or the information flow cor- responding to the neighboring letters “H” and “T” is inhibited, or both types of operations occur. This theory of attention pro- poses further that the brain mechanismthat produces the fil- tering is not located within the cortical paths of information flow, but rather is more centrally located in a subcortical area of the brain, specifically in the pulvinar nucleus of the thalamus. The presentexperiment tests the hypothesisthat the pulvinar nucleusof the dorsal thalamus is the subcortical structure that interacts with cortical structures when a visual-identification task requires attentional filtering of a target object from other objectsin its surround. Lesions ofthe thalamushavebeen shown to affect the orienting of attention (Rafal and Posner, 1987),and the pulvinar hasbeenproposed by severalinvestigators asplay- ing an important role in selective attention (Chalupa, 1977; Petersen et al., 1985, 1987).Closely related to the pulvinar, and surrounding much of the thalamus,is a thin, shell-likestructure, called the reticular nucleus, which has also been implicated in the attention process (Yingling and Skinner, 1977; Crick, 1984). This structure exerts inhibitory influences on the cells of the thalamus (French et al., 1984) and is itself influenced by thal- amocortical and corticothalamic fibers as they penetrate this structure (Jones, 1985). It has been proposed that a network consistingof cells of both the reticular nucleus and a nucleusof the dorsal thalamus could support the selective function of at- tention (Crick, 1984). For the present task of identifying an object in a cluttered visual field, a network has been proposed that involves interactions amongthe pulvinar, reticular nuclei, and the cortical areas that support object registration and iden- tification (LaBergeand Brown, 1989). If the pulvinar nucleus plays a role in the attentional selection of information in a visual display, this areashouldshowa higher
-
Upload
khangminh22 -
Category
Documents
-
view
4 -
download
0
Transcript of 613.full.pdf - Journal of Neuroscience

The Journal of Neuroscience, February 1990, IO(2): 613-619
Positron Emission Tomographic Measurements of Pulvinar Activity During an Attention Task
David LaBerge and Monte S. Buchsbaum
Departments of Cognitive Science and Psychiatry, University of California, Irvine, Irvine, California 92717
Positron emission tomographic scans were recorded from human subjects following an object-identification task, one version of which required attentional selection and the other version of which did not. In one experimental session, the attention-demanding displays were presented in the left vi- sual field and the nonattention displays were presented in the right visual field. In a second session, the sides of the displays were reversed. Analysis of the scans indicated that, averaged across the 2 sessions, the pulvinar showed greater glucose uptake when it was contralateral to the display of the selective attention task than when it was contralateral to the display of the nonattention task. The pattern of the data indicated that the degree of the attention task effect on pulvinar glucose uptake may differ between the hemi- spheres. In view of known connections beteen the pulvinar and cortical areas that mediate object identification, the present finding suggests that the pulvinar operates inter- actively with these cortical structures when an identification process demands selective attention.
When a target object is displayed in the neighborhood of other objects in the visual field, the visual system must somehow find a way to use just the information at the location of the target object in order to identify that object. Exactly how the brain selects an object for identification or for a judgment of location is not known (Ullman, 1984; Shiffrin, 1988). Identification of an object in primates apparently involves the flow of infor- mation from the striate cortex to other areas of cerebral cortex, in particular to the occipital-temporal border (Petersen et al., 1988; Posner et al., 1988) and the inferotemporal lobe (Gross, 1973; Van Essen and Maunsell, 1983; Ungerleider and Mishkin, 1982; Desimone et al., 1985). In contrast, judgment of the lo- cation of an object in space apparently involves a path from Vl to the more dorsal cortex, in particular, the posterior parietal lobe (Lynch et al., 1977; Wurtz et al., 1980; Mountcastle et al., 1981; Andersen et al., 1985; Posner et al., 1987). Thus, if an object is presented for identification or for judgment of location, it would seem that the principal connections link one cortical area to another. However, when an object such as the letter “0” is presented with other objects in its neighborhood, as in the
Received June 21, 1989; revised Aug. 21, 1989; accepted Aug. 22, 1989. This research was supported by grants from the Office of Naval Research and
the University of California to Dr. LaBerge, by the MacArthur Foundation to Dr. Buchsbaum, and by a gift to the Brain Imaging Center by Eldon and Marjorie Lockhart. We thank E. G. Jones for advice and for assistance with the pulvinar drawings, R. Haier for helpful comments, and V. Brown, S. Guich, L. Prager, and especially M. Carter, E. Hazlett, C. Reynolds, and K. Wong for technical assistance.
Correspondence should be addressed to Dr. David LaBerge at the above address.
Copyright 0 1990 Society for Neuroscience 0270-6474/90/100613-07$02.00/O
display “HOT,” then the information arriving at the inferotem- poral areas could result in the identification of the word pattern “HOT,” as well as the letter “0,” or the letters “H” and “T.” To prevent such a confusion of identified objects, some kind of filtering would seem to be necessary. The notion of an atten- tional filter originated with the work of Broadbent (1958) and it has been influential in the work of Hillyard and Picton (1987), Kahneman and Treisman (1984), Moran and Desimone (1985), Treisman (1969), Ullman (1984) and others (for reviews, see Johnston and Dark, 1986; Shiffrin, 1988). An adaptation of the notion of filtering to the identification of letters in a cluttered display is described in a recent theory (LaBerge and Brown, (1989) in which it is assumed that information flowing from a feature-registration area (e.g., area Vl) to an area of shape iden- tification (e.g., area IT) undergoes filtering controlled by a central filtering mechanism. For example, to identify the letter “0” in the ensemble “HOT,” either the information flow correspond- ing to the target “0” is facilitated or the information flow cor- responding to the neighboring letters “H” and “T” is inhibited, or both types of operations occur. This theory of attention pro- poses further that the brain mechanism that produces the fil- tering is not located within the cortical paths of information flow, but rather is more centrally located in a subcortical area of the brain, specifically in the pulvinar nucleus of the thalamus.
The present experiment tests the hypothesis that the pulvinar nucleus of the dorsal thalamus is the subcortical structure that interacts with cortical structures when a visual-identification task requires attentional filtering of a target object from other objects in its surround. Lesions ofthe thalamus have been shown to affect the orienting of attention (Rafal and Posner, 1987), and the pulvinar has been proposed by several investigators as play- ing an important role in selective attention (Chalupa, 1977; Petersen et al., 1985, 1987). Closely related to the pulvinar, and surrounding much of the thalamus, is a thin, shell-like structure, called the reticular nucleus, which has also been implicated in the attention process (Yingling and Skinner, 1977; Crick, 1984). This structure exerts inhibitory influences on the cells of the thalamus (French et al., 1984) and is itself influenced by thal- amocortical and corticothalamic fibers as they penetrate this structure (Jones, 1985). It has been proposed that a network consisting of cells of both the reticular nucleus and a nucleus of the dorsal thalamus could support the selective function of at- tention (Crick, 1984). For the present task of identifying an object in a cluttered visual field, a network has been proposed that involves interactions among the pulvinar, reticular nuclei, and the cortical areas that support object registration and iden- tification (LaBerge and Brown, 1989).
If the pulvinar nucleus plays a role in the attentional selection of information in a visual display, this area should show a higher

614 LaBerge and Buchsbaum * PET Measurements of a Pulvinar in an Attention Task
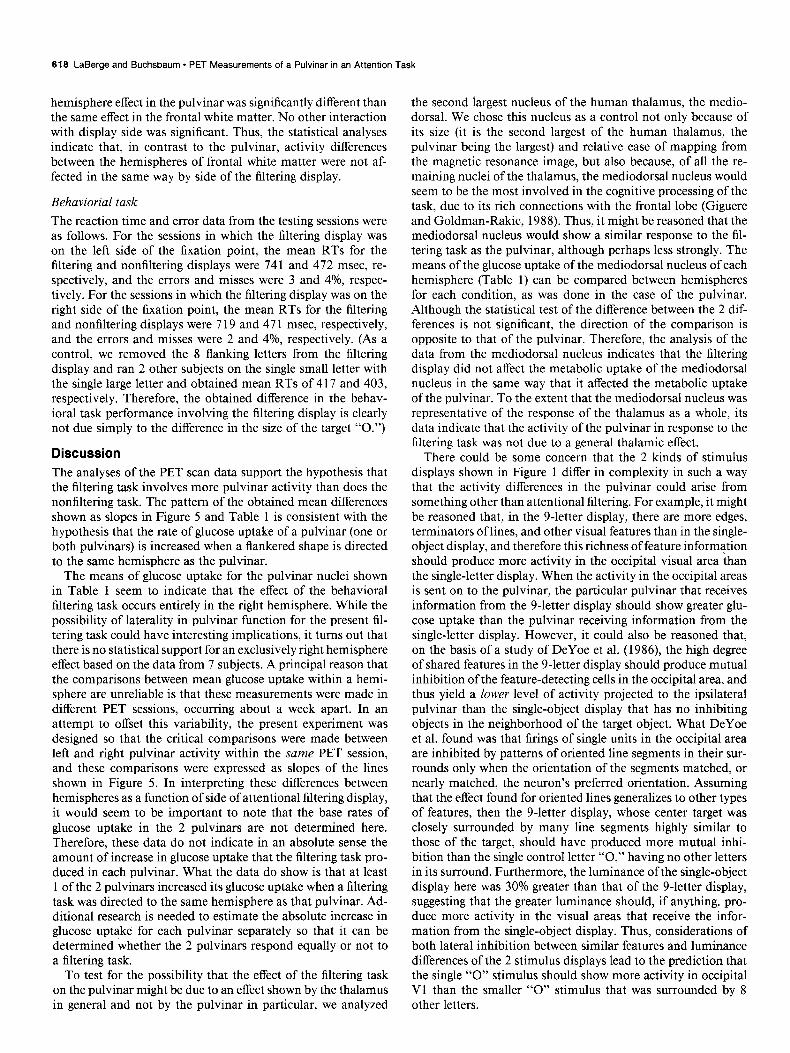
Figure 1. Example of one subject’s MRI. Visible are the internal cap- sule and ventricles surrounding each thalamus.
rate of glucose uptake when a display requiring selection is di- rected to it, as compared with the case in which a display not requiring selection is directed to it. Neural labeling studies in- dicate that direct projections to the pulvinar from the striate and peristriate areas apparently are entirely ipsilateral (Jones, 1985). Since there are no direct connections between the 2 pul- vinars themselves (Jones, 1985), connections between a pulvi- nar and striate or peristriate visual areas of the opposite hemi- sphere would have to proceed indirectly by way of the corpus callosum (or other commissures). There is evidence that the pulvinar on one side receives some visual information in this manner from Vl (Bender, 1981) and from V3, V4, and MT (Graham et al., 1979) of the opposite hemisphere, and single- cell recordings have indicated the existence of cells with bilateral receptive fields in the caudal portion of the pulvinar (Benevento and Davis, 1977), although apparently not in the posterior dor- sal medial pulvinar (Petersen et al., 1985). Therefore, from the anatomical evidence at hand, it would seem reasonable to expect that a visual display presented to one hemifield of the retina and therefore to the striate area of the contralateral hemisphere would project more strongly to the pulvinar in the same hemi- sphere.
The present experiment compared glucose uptake of the right and left pulvinars of human subjects after the subjects had per- formed a visual identification task that presented an attention- demanding display in the right visual field and a nonattention display in the left visual field (and vice versa in a second session). The way that the attention-demanding displays (henceforth re- ferred to as “filtering” displays) and the nonattention displays
(henceforth referred to as “nonfiltering” displays) were projected separately to the 2 hemispheres of the brain required the subject to fixate on a small dim dot at the center of a screen while the displays were being presented.
Materials and Methods Subjects. The 8 female normal subjects were volunteers from the student population of UCI. Their ages ranged from 19 to 29 years, and their weights ranged from 103 to 123 lb. They were given physical exami- nations a week prior to testing.
Magnetic resonance images. A few days before testing, each subject received an MRI scan of her brain. The subject’s head was held in an individually fitted thermosetting plastic mask. A triangle of plastic tub- ing marked the canthomeatal (CM) line. Sagittal scans identified the CM line, and the horizontal planes were obtained parallel to it at 10 mm increments. An example of a MRI from one subject is shown in Figure 1. Figure 2 shows the outline of the pulvinar area of the MRI shown in Figure 2. One subject’s MRI revealed an abnormal tilt of 4.5” of the CM line relative to the anterior/posterior commissure (AP) line compared with a mean tilt of - 9.6 (XL 4.8 SD) of the remaining 7 subjects (see Fox et al., 1985). This abnormal tilt precluded accurate estimates of the locations of the pulvinar and other thalamic nuclei, and this subject was therefore omitted in the analysis of results.
Stimulus displays and task procedure. The filtering task presented the letter “0” surrounded by 8 other letters, and the nonfiltering task pre- sented a larger letter “0” equal to the size of the 9-character ensemble of the filtering task. In one type of trial, the filtering display appeared on one side of a central fixation dot, with nothing on the other side. Examples of the displays for the 2 types of tasks are shown in Figure 3. On the other type of trial, the nonfiltering display appeared on- the opposite side of the central dot, with nothing on the other side. On half the trials of the filtering and nonfiltering tasks the letter “c” or the digit “B” appeared instead of the letter “0.” The subjects were instructed to press a button only when the letter “0” appeared. If “0” appeared to the left of center, the left button was to be pressed; if “0” aDoeared to the right of center, the right button was to de pressed. No re@onse was to be made to “c” or “0.” There were 2 different exnerimental sessions. given on 2 different days, spaced approximately a-week apart. In one session, the filtering display always appeared on the right side, and the nonfiltering display always appeared on the left side. In the other session, the sides of the displays were reversed. Order of sessions was balanced across subjects. The inner boundaries of the displays were 9.5 mm, or approximately 1” to the right and left ofthe fixation point. The 9-character displays were of the same size as the larger, single-character displays, that is, 19 mm wide x 22 mm high, or 2” x 2%“. Each character in the 9-character display measured 6 mm wide and 7 mm high, or 0.62” x 0.73”. The average numbers of pixels in the 9-character displays and single-character displays were 59 1 and 622, respectively, and the average luminances of the 2 types of displays were 1.08 and 1.32 foot-lamberts, respectively, as measured by a Pritchard Photometer (model 1980).
The subject sat in a comfortable chair in a darkened room with a button board containing 2 buttons on her lap, and a NEC monitor was positioned approximately 550 mm from her eyes. A small dot was drawn on the screen to enable the subject to fixate her eyes continuously at the central point between the 2 displays. Each display was flashed for 200 msec. When the subject responded, the 1383 msec intertrial interval began. If the subject did not respond, a 1000 msec delay ensued (one subject was given an intertrial interval of 550 msec and a delay of 700 msec). Subjects were told that a fast speed of responding was not de- sirable in this task, but rather they were to wait until they were sure of their judgments before responding. Errors and misses were indicated to the subject by a 100 msec flash of low-intensity blue color on the entire screen. A block of trials lasted approximately 5 min, and the rest period between blocks was 30 set, during which the subject relaxed and kept her eyes closed. A brief low tone signaled the end of the rest period. The subjects received 6 or 7 blocks of trials, which amounted to 33-40 min of testing. Eye movements were continuously recorded by an EOG instrument. It should be noted that eye movements that resulted in the display being centered on the fovea would have projected visual infor- mation to both hemispheres, thus reducing the expected difference in glucose uptake between the pulvinars of each hemisphere. As it turned out, the EOG measures showed that when the relatively few eye move- ments did occur, they almost never occurred shortly before or during the visual displays.

The Journal of Neuroscience, February 1990, 70(2) 615
GQQ
Figure 2. Outline of pulvinar area drawn on the MRI of Figure 1, including the trimmed posterior area of the pulvinar. This image was projected onto graph paper, and the areas of interest were outlined, using atlases of brain anatomy.
Positron emission tomography procedure. All subjects had fasted for at least 4 hr prior to each test session and, coinciding with the first trial of each session, received an injection of 4.0-5.2 mCi of l*F-2-deoxy- glucose in the right arm. Arterialized blood samples were drawn from the left arm during the test trials in order to estimate the absolute rate of glucose metabolism, as described elsewhere (Buchsbaum et al., 1984). A part of the left arm above the wrist was positioned through a slit in a large black curtain to isolate visually the blood sampling activity from the subject.
Following the visual display task, the subject was positioned in the position emission tomography (PET) scanner using the same head hold- er used for the MRI scan. The CM line was aligned with the PET laser. The PET scanner (neuroECAT, inplane resolution, 7.6 mm full-width half-maximum) obtained 6 planes parallel to the CM line, beginning in a plane above the thalamus. Relatively precise positioning of the scanner for each subject was accomplished by guidance from the MRI scan which had been performed on each subject in advance of the experiment. Each PET scan slice was approximately 10 mm thick, and successive slices were positioned at 5 mm intervals. In this manner, the approximately 16 mm vertical extent of the thalamus could be measured by 3 contig- uous overlapping slices. We confined our analysis to the upper 2 slices, since the lower slice is in close proximity to the visually active lateral geniculate nucleus. Each slice revealed a brain image following opera- tions of calculated attenuation correction and resolution filtering.
PET analysis. The scans were transformed to glucose metabolism rates following the model of Sokoloff et al. (1977), with constants from Phelps et al. (1979). The indicators ofglucose metabolic rate are reported in terms of pmol glucose/ 100 gm braimmin.
Matching brain slices were compared across the 2 sessions using glu- cose metabolic rates measured at specific regions of interest. Although the pulvinar regions of the 2 thalami were of main interest, we also examined a second large region of the thalamus, which contained the mediodorsal nucleus, and 2 areas outside the thalamus: the projection area, V 1, of the occipital lobe and an area of frontal white matter. These
Q O G l
G G Q
FLANKERED TARGET ON LEFT
SESSION A
GQQ n Q O G
G G Q
0 . L
FLANKERED TARGET ON RIGHT
SESSION B
Figure 3. Examples of target displays for sessions A and B. The upper display for session A is called the Ranker or filtering display and contains 9 relatively small letters. The task for the subject is to press the left button if the center item is an “0,” but to press no button if the center item is a “C” or “0.” The lower display for session A is called the nonflanker or nonfiltering display, and contains one large letter. When this display appears, the subject is to press the right button if the item is an “0,” but to press no button if the item is a “C” or “0.” The 2 displays were approximately the same size. Although the displays were constructed such that the number ofpixels was approximately the same, the measured luminance of the single-letter display was 30% greater than that of the 9-letter display.
2 areas and the mediodorsal nucleus of the pulvinar served as controls for general hemispheric changes as the filtering task was shifted from one visual hemifield to the other across the 2 testing sessions.
The pulvinar, mediodorsal, and occipital Vl areas of the individual subjects were traced on each subject’s MRI (echo #4) projected on graph paper, with the aid of a composite drawing of 25 subjects’ pulvinar and mediodorsal nuclei shown in the atlas of Van Buren and Borke (1972)

616 LaBerge and Buchsbaum * PET Measurements of a Pulvinar in an Attention Task
Figure 4. Example of the MRI tracing and x and y coordinates of pixels in the trimmed pulvinar area of one subject. After the vertical and horizontal widths of an individual’s brain image were determined on graph paper, the small boxes of the graph paper within the region of interest were marked with a dot, and each dot was assigned a pair of numbers (xJ), based on the percentage distance along the x and y axes. These normalized coordinate values were then matched to correspond- ing normalized coordinate values of the individual’s PET image. Each pixel that was more than 50% within the outline of the region of interest was included within that region.
and with the aid of Nolte’s (1988) illustrations of the central 10% of the visual field in occipital Vl All MRI tracings were drawn blind, and by a person who was not one of the two people who selected the 3 slices of PET scan images that intersected the thalamus of each subject. The MRI of each subject revealed very clearly the ventricles and white matter, so that the thalamus was easily outlined, due to the clear borders of the ventricles rostrally, caudally, and medially, and the white matter of the internal capsule laterally. In human thalamus, the pulvinar takes up between one-third and one-half of the posterior part of the thalamus, so this substructure of the thalamus constitutes a relatively large area on the MRI. Using the Van Buren and Borke drawings, we estimated the anterior borders of each subject’s pulvinar on the MRI tracings. In the mapping of the occipital Vl area from each subject’s MRI, some white matter was necessarily included because the gray matter in this area was often quite invaginated.
If pulvinar activity is measured after adjacent areas have been active, the pulvinar measure will also pick up significant activity approximately 4 mm into these other areas. (The value of 4 mm is the approximate radius ofthe full-width half-maximum circle of 7.6 mm diameter, which is the resolution power of the present PET scanner.) One thalamic nu- cleus adjoining the pulvinar which was expected to be active during the visual task is the ventral posterior lateral nucleus (VPLN), which con- tains the principal relay cells for the somatosensory receptors, Since the blood samples were drawn from the left arms of the subjects at frequent intervals during the task, it was to be expected that the contralateral VPLN relay cells corresponding to the receptors in this arm area would show elevated metabolic rates. (Note, however, that since the side of the filtering task alternated while the side of the blood sampling stayed the same, blood sampling had a constant effect on hemispheric differ- ences in metabolic activity.) Therefore, using each subject’s MRI record, we separated the measures of pulvinar activity from that of the adjacent VPLN by trimming the pulvinar region of interest away from the VPLN by approximately 4 mm. The pulvinar region was also trimmed ap-
proximately 4 mm away from the mediodorsal nucleus, which is also located near its rostra1 border. Thus, for each subject, the entire esti- mated anterior border of the pulvinar was moved approximately 4 mm in the posterior direction. The pulvinar area that remained was a region approximately 17.1 mm wide x 6.7 mm long (and 15 mm deep), on average, although the pulvinar areas of an individual subject varied somewhat in shape and extent. (The untrimmed pulvinar area was ap- proximately 19.6 mm wide and 11 .O mm long.) Trimming the pulvinar area in this way conservatively separates this nucleus metabolically from the activity of the nuclei on its anterior border. The remaining borders of the pulvinar were quite clearly delineated owing to the salient neigh- boring ventricles and white matter of the internal capsule. It was as- sumed that, given a PWHM value of 7.6 mm, scan counts in the trimmed pulvinar area would still be somewhat sensitive to neural activity taking place in the anterior pulvinar areas that had been trimmed away.
Therefore, we obtained 2 drawings of each subject’s pulvinars in horizontal orientation: one slightly larger than one-third the length of the thalamus, and the other somewhat smaller, due to the approximately 4 mm trimmed from the anterior border of the first drawing. The me- diodorsal area of interest was also trimmed approximately 4 mm away from adjacent areas on all sides, leaving an area approximately 5.1 mm wide and 9.4 mm long (and 12 mm deep), on average. (The untrimmed mediodorsal area was approximately 8.9 mm wide and 13.6 mm long.) Thus, from each subject’s MRI we obtained both trimmed and un- trimmed drawings of the mediodorsal nucleus of the thalamus as well as the pulvinar.
Since the MRI drawings were made on a grid, the center of each square within the MRI drawing of a brain structure was labeled in terms of its x and y coordinates. The x and y coordinates were expressed as a percentage of the lateral and anteroposterior dimensions of the brain viewed in horizontal section. An example of the x and y pixel mapping of one subject’s pulvinars is shown in Figure 4. The pixel coordinates for each subject were then applied to the subjects’ 2 PET images, and the average metabolic rate within the structure was computed.
Results Glucose uptake The results of the glucose analysis of the scans on 7 subjects for the pooled upper 2 slices of the thalamus and the single slice of the occipital Vl area are shown in Table 1 and Figure 5. Not shown are the mean glucose values for the pooled 3 slices of the pulvinar, which were as follows: Left visual field, 22.4 and 20.7; Right visual field, 22.2 and 17.3, for the left and right hemispheres, respectively. For the 2 upper slices of the pulvinar, the difference between hemispheric metabolic rates as a function of condition (side of the filtering display) was tested by a 3-way ANOVA (side of visual display by hemisphere by slice), which showed a significant display side x hemisphere interaction (fll,6] = 9.45, p < 0.05). The display side x slice x hemisphere in- teraction was not significant (fll,6] = 1.68, p > 0. lo), nor were any other main effects or interactions. When an ANOVA was applied to all 3 slices, a similar pattern of statistical results emerged: The display side x hemisphere interaction was sig- nificant (F[ 1,6] = 8.73, p < 0.05), and the display side x hemi- sphere x slice interaction was not significant (fl1,6] = 1.75, p > 0.10). Thus, the statistical analysis indicated that, taken to- gether, the 2 pulvinars showed greater glucose utilization when the attentional filtering task was directed to the hemisphere that was ipsilateral to a pulvinar.
An examination of all the data in Figure 5 and Table 1 gives the impression that changing the behavioral task from filtering (the 9-letter display) to nonfiltering (the single-letter display) affects the pulvinar, mediodorsal, and occipital V 1 areas in the right hemisphere much more than it affects these areas in the left hemisphere. However, the present experiment was not de- signed to make comparisons of glucose values within a given hemisphere, but rather to make comparisons of glucose values between hemispheres. Comparisons within a hemisphere, for

The Journal of Neuroscience, February 1990, 70(2) 617
PULVINAR MEDIODORSAL. OCCIPITAL VI
RIGHT 0 LEFT
0-r ’ I I I I I
LEFT RIGHT LEFT RIGHT LEFT RIGHT
HEMISPHERE
Figure 5. Glucose metabolic uptake of the pulvinar and mediodorsal nuclei of the thalamus and area Vl of the occipital lobe as a function of hemisphere and type of behavioral task (identification of the letter “0” with and without flankers). Points connected by a line represent average glucose values from one experimental session.
example, comparing in Figure 5 the 2 points for the right hemi- sphere, are based on only 2 pulvinar measures per subject, while comparisons between hemispheres are based on 4 pulvinar mea- sures per subject. Hence there is greater power (i.e., a smaller error variance term) in the statistical test for the comparisons between hemispheres than comparisons within one hemisphere. Therefore, the present experimental design took, as the basic comparison statistic for a region of interest, the difference in glucose uptake rate between the left and right hemisphere within a given session and averaged the difference from one session with the difference from the other session to obtain a statistic based on 4 pulvinar measures.
The comparison of the 2 pulvinars within a session is rep- resented in Figure 5 by the slope of a line connecting 2 points. Variability in glucose values from session to session is repre- sented by an upward or downward displacement of a line, while slope changes are independent of these vertical displacements (except in certain special cases, such as displacing the values close to a maximum or minimum value). Seen in this way, one can understand how one can obtain statistical evidence of a difference in slopes between hemispheres while, at the same time, not obtaining statistical evidence of a difference between individual points within a hemisphere. What this means for the present data shown in Figure 5 is that the slope changes for the pulvinar are significantly different, but we cannot determine statistically that the 2 points for the right hemisphere are dif- ferent, nor can we accept the null hypothesis that the 2 points for the left hemisphere are the same. In other words, what the statistical test of slopes tells us is that relative levels of activity in the 2 pulvinars changes with type of task. The direction of the difference in slopes tells us that it is the flankered stimulus that produces more activity in one or both of the pulvinars.
Table 1. Mean absolute glucose values for pulvinar, mediodorsal, and occipital neuclei (pm01 glucose/100 gm brain/min)
Location of filtering display
Left visual field Right visual field
Pulvi- Medio- Occip- Pulvi- Medio- Occip- Hemisphere nar dorsal ital Vl nar dorsal ital Vl
Left 22.4 20.4 25.1 22.4 21.3 25.6 (4.97) (7.27) (8.8 1) (3.20) (6.22) (3.25)
Right 21.7 15.7 19.5 17.4 18.0 23.1 (9.16) (4.33) (3.92) (7.01) (5.35) (3.33)
Difference 0.7 4.1 6.2 5.0 3.3 2.5 (6.97) (4.40) (6.49) (8.43) (4.48) (3.35)
Standard deviations are given in parentheses. Glucose values for the pulvinar and mediodorsal nuclei are averages of the upper 2 slices of the thalamus. The values for the occipital Vl nucleus are taken from one slice. Slices were approximately 10 mm thick, and adjacent slices overlapped by 5 mm.
Turning to the analysis of the glucose values of occipital area Vl, we note that, in contrast to the 2 slices used for the analyses of the pulvinar and mediodorsal areas, the analysis of the Vl area of the occipital lobes was based on one slice, since the region of interest was very small. Our basic comparison statistic was again the difference in activity between the 2 hemispheres, which was 6.11 when the filtering display was on the left and 2.48 when the filtering display was on the right. The t test of this difference was not significant (t = 1.30, p > 0.05). However, when the difference between the 2 differences is compared with that of the pulvinar by ANOVA (as was done in the case of the mediodorsal nucleus), the region x display side x hemisphere interaction narrowly missed significance (fl1,6] = 5.11, p = 0.06). If there is sufficient a priori reason to predict the direction of the same comparison, the 1 -tailed double-difference t test was significant (t = 2.26, p -C 0.05). In either case, one may appar- ently conclude that there was no PET evidence suggesting that the 9-letter flanker display produced greater average levels of occipital activity in these subjects.
Examination of Figure 5 indicates a general trend toward greater activity in the left hemisphere than in the right. A com- parison of average glucose values of the left and right hemi- spheres for the mediodorsal nucleus was significant (t = 3.176, p < 0.05), as was the comparison for the occipital Vl area (t = 2.60,~ < 0.05). However, the comparison ofoverall hemisphere differences for the pulvinar was not significant (t = 0.93).
Although the mediodorsal and occipital Vl analyses revealed significant overall hemisphere effects, the obtained difference in glucose values in the pulvinars due to type of task did not appear to be a general hemispheric effect. Examination of a large region of frontal white matter showed mean metabolic activity values of 2 1.74 for the 9-letter display (left hemisphere when this dis- play was in the right visual field averaged with the right hemi- sphere when this display was in the left visual field) and 21.68 for single-letter display (left hemisphere when this display was in the right visual field averaged with the right hemisphere when this display was in the left visual field). The double-difference t test yielded a nonsignificant t value of 0.06. Another way of analyzing the frontal white matter hemisphere differences is to contrast them with the pulvinar differences. A 4-way ANOVA of region x display side x hemisphere x slice yielded a sig- nificant 3-way interaction ofregion x display side x hemisphere (E71,6] = 6.44, p c 0.05) indicating that the display side x
616 LaBerge and Buchsbaum - PET Measurements of a Pulvinar in an Attention Task
hemisphere effect in the pulvinar was significantly different than the same effect in the frontal white matter. No other interaction with display side was significant. Thus, the statistical analyses indicate that, in contrast to the pulvinar, activity differences between the hemispheres of frontal white matter were not af- fected in the same way by side of the filtering display.
Behaviorial task
The reaction time and error data from the testing sessions were as follows. For the sessions in which the filtering display was on the left side of the fixation point, the mean RTs for the filtering and nonfiltering displays were 741 and 472 msec, re- spectively, and the errors and misses were 3 and 4%, respec- tively. For the sessions in which the filtering display was on the right side of the fixation point, the mean RTs for the filtering and nonfiltering displays were 7 19 and 47 1 msec, respectively, and the errors and misses were 2 and 4%, respectively. (As a control, we removed the 8 flanking letters from the filtering display and ran 2 other subjects on the single small letter with the single large letter and obtained mean RTs of 417 and 403, respectively. Therefore, the obtained difference in the behav- ioral task performance involving the filtering display is clearly not due simply to the difference in the size of the target “0.“)
Discussion The analyses of the PET scan data support the hypothesis that the filtering task involves more pulvinar activity than does the nonfiltering task. The pattern of the obtained mean differences shown as slopes in Figure 5 and Table 1 is consistent with the hypothesis that the rate of glucose uptake of a pulvinar (one or both pulvinars) is increased when a flankered shape is directed to the same hemisphere as the pulvinar.
The means of glucose uptake for the pulvinar nuclei shown in Table 1 seem to indicate that the effect of the behavioral filtering task occurs entirely in the right hemisphere. While the possibility of laterality in pulvinar function for the present fil- tering task could have interesting implications, it turns out that there is no statistical support for an exclusively right hemisphere effect based on the data from 7 subjects. A principal reason that the comparisons between mean glucose uptake within a hemi- sphere are unreliable is that these measurements were made in different PET sessions, occurring about a week apart. In an attempt to offset this variability, the present experiment was designed so that the critical comparisons were made between left and right pulvinar activity within the same PET session, and these comparisons were expressed as slopes of the lines shown in Figure 5. In interpreting these differences between hemispheres as a function of side of attentional filtering display, it would seem to be important to note that the base rates of glucose uptake in the 2 pulvinars are not determined here. Therefore, these data do not indicate in an absolute sense the amount of increase in glucose uptake that the filtering task pro- duced in each pulvinar. What the data do show is that at least 1 of the 2 pulvinars increased its glucose uptake when a filtering task was directed to the same hemisphere as that pulvinar. Ad- ditional research is needed to estimate the absolute increase in glucose uptake for each pulvinar separately so that it can be determined whether the 2 pulvinars respond equally or not to a filtering task.
To test for the possibility that the effect of the filtering task on the pulvinar might be due to an effect shown by the thalamus in general and not by the pulvinar in particular, we analyzed
the second largest nucleus of the human thalamus, the medio- dorsal. We chose this nucleus as a control not only because of its size (it is the second largest of the human thalamus, the pulvinar being the largest) and relative ease of mapping from the magnetic resonance image, but also because, of all the re- maining nuclei of the thalamus, the mediodorsal nucleus would seem to be the most involved in the cognitive processing of the task, due to its rich connections with the frontal lobe (Giguere and Goldman-Rakic, 1988). Thus, it might be reasoned that the mediodorsal nucleus would show a similar response to the fil- tering task as the pulvinar, although perhaps less strongly. The means of the glucose uptake of the mediodorsal nucleus of each hemisphere (Table 1) can be compared between hemispheres for each condition, as was done in the case of the pulvinar. Although the statistical test of the difference between the 2 dif- ferences is not significant, the direction of the comparison is opposite to that of the pulvinar. Therefore, the analysis of the data from the mediodorsal nucleus indicates that the filtering display did not affect the metabolic uptake of the mediodorsal nucleus in the same way that it affected the metabolic uptake of the pulvinar. To the extent that the mediodorsal nucleus was representative of the response of the thalamus as a whole, its data indicate that the activity of the pulvinar in response to the filtering task was not due to a general thalamic effect.
There could be some concern that the 2 kinds of stimulus displays shown in Figure 1 differ in complexity in such a way that the activity differences in the pulvinar could arise from something other than attentional filtering. For example, it might be reasoned that, in the 9-letter display, there are more edges, terminators of lines, and other visual features than in the single- object display, and therefore this richness of feature information should produce more activity in the occipital visual area than the single-letter display. When the activity in the occipital areas is sent on to the pulvinar, the particular pulvinar that receives information from the 9-letter display should show greater glu- cose uptake than the pulvinar receiving information from the single-letter display. However, it could also be reasoned that, on the basis of a study of DeYoe et al. (1986), the high degree of shared features in the 9-letter display should produce mutual inhibition of the feature-detecting cells in the occipital area, and thus yield a lower level of activity projected to the ipsilateral pulvinar than the single-object display that has no inhibiting objects in the neighborhood of the target object. What DeYoe et al. found was that firings of single units in the occipital area are inhibited by patterns of oriented line segments in their sur- rounds only when the orientation of the segments matched, or nearly matched, the neuron’s preferred orientation. Assuming that the effect found for oriented lines generalizes to other types of features, then the 9-letter display, whose center target was closely surrounded by many line segments highly similar to those of the target, should have produced more mutual inhi- bition than the single control letter “0,” having no other letters in its surround. Furthermore, the luminance of the single-object display here was 30% greater than that of the 9-letter display, suggesting that the greater luminance should, if anything, pro- duce more activity in the visual areas that receive the infor- mation from the single-object display. Thus, considerations of both lateral inhibition between similar features and luminance differences of the 2 stimulus displays lead to the prediction that the single “0” stimulus should show more activity in occipital Vl than the smaller “0” stimulus that was surrounded by 8 other letters.

The Journal of Neuroscience, February 1990, IO(2) 619
When we measured the rates of glucose uptake in occipital area V 1, we did not find a trend toward greater activity in the hemisphere that received the flankered stimulus. On the con- trary, the trend was in the opposite direction. When the differ- ence between hemispheres in the occipital V 1 area was compared with that of the pulvinar, the ANOVA and double-difference t test showed borderline statistical support for greater activity on the hemisphere that received the single “0” stimulus. Hence, it seems that the present pulvinar differences induced by the 2 kinds of stimulus displays occurred despite opposite differences in the visual projection area.
It is concluded that, of all the brain areas examined, the pul- vinar was the only one that showed significantly higher levels of metabolic activity when an attention-demanding task was directed to it than when a nonattention-demanding task was directed to it. This finding suggests that identification of a visual object in a cluttered field may require the subcortical pulvinar to participate as a filtering mechanism that operates on the information flow between cortical areas that mediate early fea- ture registration and cortical areas that mediate identification of the feature ensemble constituting an object.
References Anderson, R. A., G. K. Essick, and R. M. Siegel (1985) Encoding of
spatial location of posterior parietal neurons. Science 230: 456-458. Bender, D. B. (198 1) Retinotopic organization of macaque pulvinar.
J. Neurophysiol. 46: 672-693. Benevento, L. A., and B. Davis (1977) Topographical projection of
the prestriate cortex to the pulvinar nuclei in the macaque monkey: An autoradiographic study. Exp. Brain Res. 30: 405-424.
Broadbent, D. E. (1958) Perception and Communication, Pergamon, London.
Buchsbaum, M. S., L. E. DeLisi, H. H. Holcomb, J. Cappelletti, A. C. King, J. Johnson, E. Hazlett, S. Dowling-Zimmerman, R. M. Post, J. Morihisa, W. Carpenter, R. Cohen, D. Pickar, D. R. Weinberger, R. Margolin, and R. M. Kessler (1984) Anteroposterior gradients in cerebral glucose use in schizophrenia and affective disorders. Arch. Gen. Psychiatry 1: 1159-l 166.-
Chalupa, M. (1977) A review of cat and monkey studies implicating the pulvinar in visual function. Behav. Biol. 20: 149-167.
Crick, F. (1984) The function of the thalamic reticular complex: The searchlight hvnothesis. Proc. Natl. Acad. Sci. USA 81: 45864590.
Desimone: D., ‘s: J. Schein, L. G. Moran, and L. G. Ungerleider (1985) Contour, color, and shape analysis beyond the striate cortex. Vision Res. 25: 441-452.
DeYoe, E., J. Knierim, D. Sagi, B. Julesz, and D. Van Essen (1986) Single unit responses to static and dynamic texture patterns in ma- caque V2 and Vl cortex. Assoc. Res. Vis. Ophthal. Inc. (abstr.).
Fox, P. T., J. S. Perlmutter, and M. E. Raichle (1985) A stereotactic method of anatomical localization for positron emission tomography. J. Comput. Assist. Tomogr. 9: 141-153.
French, C. R., A. J. Sefton, and A. Mackay-Sim (1984) The inhibitory role of the visually responsive region of the thalamic reticular nucleus in the rat. Exp. Brainkes. 57: 47 l-479.
Ginuere. M.. and P. S. Goldman-Rakic (1988) Mediodorsal nucleus: ireal: laminar, and tangential distribution of afferents and efferents in the frontal lobe of rhesus monkeys. J. Comp. Neurol. 277: 195- 213.
Graham, J., C. S. Lin, and J. H. Kaas (1979) Subcortical projections of six visual cortical areas in the owl monkey. J. Comp. Neurol. 187: 557-580.
Gross, C. G. (1973) Visual functions of inferotemporal cortex. In Handbook of Sensory Physiology, Vol. 7, R. Jung, ed., pp. 45 1482, Springer-Verlag, Berlin.
Hillyard, S. A., and T. W. Picton (1987) Electrophysiology of cogni- tion. In Handbook of Phvsiolonv, Vol. 5, ut. 2, F. Plum, ed., PP. 5 19- 584, American Physiological Society, New York.
Johnston. W. A.. and V. J. Dark (1986) Selective attention. Annu. Rev. Psychol. 37: 43-75. ’ ’
Jones, E. G. (1985) The Thalamus, Plenum, New York. Kahneman, D., and A. Treisman (1984) Changing views of attention
and automaticity. In Varieties of Attention, R. Parasuraman and D. R. Davies, eds., pp. 29-61, Academic, New York.
LaBerge, D., and V. Brown (1989) Theory of attentional operations in shape identification. Psychol. Rev. 96: 10 l-l 24.
Lynch, J. C., Mountcastle, V. B., Talbot, W. H., and T. C. T. Yin (1977) Parietal lobe mechanisms for directed visual attention. Neurophysi- ology 40: 362-389.
Moran, J., and R. Desimone (1985) Selective attention gates visual processing in the extrastriate cortex. Science 229: 782. -
Mountcastle. V. B.. R. A. Andersen. and B. C. Motter (1981) The \ I
influence of attentive fixation upon the excitability of the light-sen- sitive neurons on the posterior parietal cortex. J. Neurosci. I: 12 18- 1235.
Nolte, J. (1988) The Human Brain, Mosby, St. Louis. Petersen, S. E., D. L. Robinson, and W. Keys (1985) Pulvinar nuclei
of the behaving rhesus monkey: Visual responses and their modu- lation. J. Neurophysiol. 54: 867-886.
Petersen, S. E., D. L. Robinson, and J. D. Morris (1987) Contributions of the pulvinar to visual spatial attention. Neuropsychology 25: 97- 105.
Petersen, S. E., P. T. Fox, M. I. Posner, M. Mintun, and M. E. Raichle (1988) Positron emission tomographic studies of the cortical anat- omy of single-word processing. Nature 331: 585-589.
Phelps, M. E., S. C. Huang, E. J. Hoffman, C. Selin, L. Sokoloff, and D. E. Kuhl (1979) Tomographic measurement of local cerebral glu- cose metabolic rate in humans (F- 18) 2-fluoro-2-deoxy-D-glucose: Validation of method. Ann. Neurol. 6: 37 l-388.
Posner, M. I., J. A. Walker, F. J. Friedrich, and R. D. Rafal (1984) Effects of parietal injury on covert orienting of attention. J. Neurosci. 4: 1863-1874.
Posner, M. I., S. E. Petersen, P. T. Fox, and M. E. Raichle (1988) Localization of cognitive operations in the human brain. Science 40: 1627-1631.
Rafal, R. D., and M. I. Posner (1987) Deficits in human visual spatial attention following thalamic lesions. Proc. Natl. Acad. Sci. USA 84: 7349-7353.
Shiffrin, R. M. (1988) Attention. In Stevens’ Handbook of Experi- mental Psychology, R. C. Atkinson, R. J. Hernstein, G. Lindzay, and R. D. Lute, eds., Wiley, New York.
Sokololf, L., M. Reivich, C. Kennedy, M. S. DesRosiers, D. S. Patlak, K. D. Pettigrew, 0. Sakurada, and M. Shinohara (1977) The [‘“Cl deoxyglucose method for the measurement of local cerebral glucose utilization: Theory, procedure, and normal values in the conscious and anesthetized albino rat. J. Neurochem. 28: 897-9 16.
Treisman, A. (1969) Strategies and models of selective attention. Psy- chol. Rev. 76: 282-299.
Ullman, S. (1984) Visual routines. Cognition 18: 97. Ungerleider,‘L. G:, and M. Mishkin (1982) Two cortical visual sys-
tems. In Analvsis of Visual Behavior. D. J. Inale. M. A. Goodale. and R. J. Mansfield, eds., pp. 549-586, ‘MIT, Cambridge, MA. ’
Van Buren, J. M., and R. C. Borke (1972) Varieties and Connections of the Human Thalamus, Springer-Verlag, New York.
Van Essen, D. C., and J. H. R. Maunsell (1983) Hierarchical orga- nization and functional streams in the visual cortex. Trends Neurosci. 6: 370-375.
Wurtz, R. H., M. E. Goldberg, and D. L. Robinson (1980) Behavioral modulation of visual responses in the monkey: Stimulus selection for attention and movement. Prog. Psychobiol. Physiol. Psychol. 9: 43- 83.
Yingling, C. D., and J. E. Skinner (1977) Gating of thalamic input to cerebral cortex by nucleus reticularis thalami. In Attention, Voluntary Contraction and Event-Related Cerebral Potentials: Progress in Clin- ical Neurophysiology, J. E. Desmedt, ed., pp. 70-96, Basel, Switzer- land.