Altered metabolome and microbiome features provide clues in ...
14
ARTICLE OPEN Altered metabolome and microbiome features provide clues in understanding irritable bowel syndrome and depression comorbidity Lijuan Han 1,2,13 , Ling Zhao 3,4,13 , Yong Zhou 5,13 , Chao Yang 2,6,13 , Teng Xiong 5,13 , Lin Lu 3,7,13 , Yusheng Deng 2 , Wen Luo 2 , Yang Chen 1 , Qinwei Qiu 1 , Xiaoxiao Shang 1 , Li Huang 1 , Zongchao Mo 8 , Shaogang Huang 1 , Suiping Huang 1 , Zhi Liu 9 , Wei Yang 3 , Lixiang Zhai 3 , Ziwan Ning 3 , Chengyuan Lin 3 , Tao Huang 3 , Chungwah Cheng 3 , Linda L. D. Zhong 3 , Shuaicheng Li 5,10 ✉ , Zhaoxiang Bian 3 ✉ and Xiaodong Fang 1,11,12 ✉ © The Author(s) 2021 Irritable bowel syndrome (IBS) is one of the functional gastrointestinal disorders characterized by chronic and/or recurrent symptoms of abdominal pain and irregular defecation. Changed gut microbiota has been proposed to mediate IBS; however, contradictory results exist, and IBS-specific microbiota, metabolites, and their interactions remain poorly understood. To address this issue, we performed metabolomic and metagenomic profiling of stool and serum samples based on discovery (n = 330) and validation (n = 101) cohorts. Fecal metagenomic data showed moderate dysbiosis compared with other diseases, in contrast, serum metabolites showed significant differences with greater power to distinguish IBS patients from healthy controls. Specifically, 726 differentially abundant serum metabolites were identified, including a cluster of fatty acyl-CoAs enriched in IBS. We further identified 522 robust associations between differentially abundant gut bacteria and fecal metabolites, of which three species including Odoribacter splanchnicus, Escherichia coli, and Ruminococcus gnavus were strongly associated with the low abundance of dihydropteroic acid. Moreover, dysregulated tryptophan/serotonin metabolism was found to be correlated with the severity of IBS depression in both fecal and serum metabolomes, characterized by a shift in tryptophan metabolism towards kynurenine production. Collectively, our study revealed serum/fecal metabolome alterations and their relationship with gut microbiome, highlighted the massive alterations of serum metabolites, which empower to recognize IBS patients, suggested potential roles of metabolic dysregulation in IBS pathogenesis, and offered new clues to understand IBS depression comorbidity. Our study provided a valuable resource for future studies, and would facilitate potential clinical applications of IBS featured microbiota and/or metabolites. The ISME Journal (2022) 16:983–996; https://doi.org/10.1038/s41396-021-01123-5 INTRODUCTION Irritable bowel syndrome (IBS) is a common functional gastro- intestinal disorder that affects around 11% of the population globally [1]. IBS is categorized into four subtypes including diarrhea-predominant IBS (IBS-D), constipation-predominant IBS (IBS-C), mixed IBS (IBS-M), and un-subtyped IBS (IBS-U) according to patients’ bowel habits. Moreover, psychological comorbidity including anxiety and depression is common in IBS population [2]. Although the precise mechanism of IBS remains unclear, the alteration of gut microbiota has been proposed to mediate IBS pathogenesis. Pittayanon and colleagues systematically reviewed gut micro- biota studies in IBS from inception to April, 2018, reported the IBS-specific intestinal microbiota characterized by an increase in family Enterobacteriaceae, family Lactobacillaceae and genus Bacteroides, together with a decrease in uncultured Clostridiales I, genus Faecalibacterium and genus Bifidobacterium [3]. However, inconsistent results exist among studies, probably due to the differences in methodology, the limited sample size, coupled with the lack of necessary information such as antibiotics/probiotics use and diet habit. For example, one study showed a relative increased abundance of bacterial species including Enterobacter- iaceae in feces of IBS patients, with decreased composition in Lactobacillus and Bifidobacterium; while opposite results found in another study described an increase in Lactobacillus genus or Lactobacillales in IBS-D [4]. Tap et al. reported the fecal and Received: 8 December 2020 Revised: 25 August 2021 Accepted: 20 September 2021 Published online: 8 November 2021 1 State Key Laboratory of Dampness Syndrome of Chinese Medicine, The Second Affiliated Hospital of Guangzhou University of Chinese Medicine, Guangzhou, China. 2 KMHD, Shenzhen, China. 3 Institute of Brain and Gut Research, School of Chinese Medicine, Hong Kong Baptist University, Hong Kong SAR, China. 4 Academy of Integrative Medicine, Shanghai University of Traditional Chinese Medicine, Shanghai, China. 5 Department of Computer Science, City University of Hong Kong, Hong Kong SAR, China. 6 Department of Computer Science, Hong Kong Baptist University, Hong Kong SAR, China. 7 Department of Neurology, The First Affiliated Hospital of Guangzhou Medical University, Guangzhou, China. 8 School of Biology and Biological Engineering, South China University of Technology, Guangzhou, China. 9 Department of Biotechnology, Huazhong University of Science and Technology, Wuhan, China. 10 Department of Biomedical Engineering, City University of Hong Kong, Hong Kong SAR, China. 11 BGI-Shenzhen, Shenzhen, China. 12 China National GeneBank, BGI-Shenzhen, Shenzhen, China. 13 These authors contributed equally: Lijuan Han, Ling Zhao, Yong Zhou, Chao Yang, Teng Xiong, Lin Lu. ✉ email: [email protected]; [email protected]; [email protected] www.nature.com/ismej
-
Upload
khangminh22 -
Category
Documents
-
view
1 -
download
0
Transcript of Altered metabolome and microbiome features provide clues in ...
ARTICLE OPEN
Altered metabolome and microbiome features provide cluesin understanding irritable bowel syndrome and depressioncomorbidityLijuan Han 1,2,13, Ling Zhao3,4,13, Yong Zhou5,13, Chao Yang2,6,13, Teng Xiong5,13, Lin Lu3,7,13, Yusheng Deng2, Wen Luo2, Yang Chen1,Qinwei Qiu1, Xiaoxiao Shang1, Li Huang1, Zongchao Mo8, Shaogang Huang1, Suiping Huang1, Zhi Liu 9, Wei Yang3, Lixiang Zhai3,Ziwan Ning3, Chengyuan Lin3, Tao Huang3, Chungwah Cheng3, Linda L. D. Zhong3, Shuaicheng Li 5,10✉, Zhaoxiang Bian 3✉ andXiaodong Fang 1,11,12✉
© The Author(s) 2021
Irritable bowel syndrome (IBS) is one of the functional gastrointestinal disorders characterized by chronic and/or recurrent symptomsof abdominal pain and irregular defecation. Changed gut microbiota has been proposed to mediate IBS; however, contradictoryresults exist, and IBS-specific microbiota, metabolites, and their interactions remain poorly understood. To address this issue,we performed metabolomic and metagenomic profiling of stool and serum samples based on discovery (n= 330) and validation(n= 101) cohorts. Fecal metagenomic data showed moderate dysbiosis compared with other diseases, in contrast, serummetabolites showed significant differences with greater power to distinguish IBS patients from healthy controls. Specifically, 726differentially abundant serum metabolites were identified, including a cluster of fatty acyl-CoAs enriched in IBS. We further identified522 robust associations between differentially abundant gut bacteria and fecal metabolites, of which three species includingOdoribacter splanchnicus, Escherichia coli, and Ruminococcus gnavus were strongly associated with the low abundance ofdihydropteroic acid. Moreover, dysregulated tryptophan/serotonin metabolism was found to be correlated with the severity of IBSdepression in both fecal and serum metabolomes, characterized by a shift in tryptophan metabolism towards kynurenineproduction. Collectively, our study revealed serum/fecal metabolome alterations and their relationship with gut microbiome,highlighted the massive alterations of serum metabolites, which empower to recognize IBS patients, suggested potential roles ofmetabolic dysregulation in IBS pathogenesis, and offered new clues to understand IBS depression comorbidity. Our study provided avaluable resource for future studies, and would facilitate potential clinical applications of IBS featured microbiota and/or metabolites.
The ISME Journal (2022) 16:983–996; https://doi.org/10.1038/s41396-021-01123-5
INTRODUCTIONIrritable bowel syndrome (IBS) is a common functional gastro-intestinal disorder that affects around 11% of the populationglobally [1]. IBS is categorized into four subtypes includingdiarrhea-predominant IBS (IBS-D), constipation-predominant IBS(IBS-C), mixed IBS (IBS-M), and un-subtyped IBS (IBS-U) accordingto patients’ bowel habits. Moreover, psychological comorbidityincluding anxiety and depression is common in IBS population [2].Although the precise mechanism of IBS remains unclear, thealteration of gut microbiota has been proposed to mediate IBSpathogenesis.Pittayanon and colleagues systematically reviewed gut micro-
biota studies in IBS from inception to April, 2018, reported the
IBS-specific intestinal microbiota characterized by an increase infamily Enterobacteriaceae, family Lactobacillaceae and genusBacteroides, together with a decrease in uncultured Clostridiales I,genus Faecalibacterium and genus Bifidobacterium [3]. However,inconsistent results exist among studies, probably due to thedifferences in methodology, the limited sample size, coupled withthe lack of necessary information such as antibiotics/probioticsuse and diet habit. For example, one study showed a relativeincreased abundance of bacterial species including Enterobacter-iaceae in feces of IBS patients, with decreased composition inLactobacillus and Bifidobacterium; while opposite results found inanother study described an increase in Lactobacillus genus orLactobacillales in IBS-D [4]. Tap et al. reported the fecal and
Received: 8 December 2020 Revised: 25 August 2021 Accepted: 20 September 2021Published online: 8 November 2021
1State Key Laboratory of Dampness Syndrome of Chinese Medicine, The Second Affiliated Hospital of Guangzhou University of Chinese Medicine, Guangzhou, China. 2KMHD,Shenzhen, China. 3Institute of Brain and Gut Research, School of Chinese Medicine, Hong Kong Baptist University, Hong Kong SAR, China. 4Academy of Integrative Medicine,Shanghai University of Traditional Chinese Medicine, Shanghai, China. 5Department of Computer Science, City University of Hong Kong, Hong Kong SAR, China. 6Department ofComputer Science, Hong Kong Baptist University, Hong Kong SAR, China. 7Department of Neurology, The First Affiliated Hospital of Guangzhou Medical University, Guangzhou,China. 8School of Biology and Biological Engineering, South China University of Technology, Guangzhou, China. 9Department of Biotechnology, Huazhong University of Scienceand Technology, Wuhan, China. 10Department of Biomedical Engineering, City University of Hong Kong, Hong Kong SAR, China. 11BGI-Shenzhen, Shenzhen, China. 12ChinaNational GeneBank, BGI-Shenzhen, Shenzhen, China. 13These authors contributed equally: Lijuan Han, Ling Zhao, Yong Zhou, Chao Yang, Teng Xiong, Lin Lu.✉email: [email protected]; [email protected]; [email protected]
www.nature.com/ismej

mucosal microbiota signatures that are related with the severity ofIBS [5]. Vich et al. reported a large scale of metagenomicsequencing of stool samples from 1792 individuals with IBS andinflammatory bowel disease (IBD), which demonstrate overlappedand specific species between IBD and IBS patients compared withcontrols [6]. Jeffery et al. reported significant differences in fecalmicrobiomes and metabolomes of individuals with or without IBS,and highlighted the potential of using metabolomes andmicrobiome in the diagnosis and treatment of IBS [7]. However,by analyzing the fecal and mucosa-associated microbiome of IBSpatients from a Swedish random population, it was reported thatno IBS-specific microbiota feature was identified [8].The microbial composition can shape the environment in the
colon as metabolites produced from microbes can be involved insignaling, immune system modulation, or have antibiotic activity.For example, short-chain fatty acids (SCFAs) showed lowerproportions in sera of IBS patients [9], which play major roles inthe microbiota−host interaction by inhibiting inflammatory andmalignant growth [10]. A recent study from our group revealed animpaired bile acid synthetic regulation with excessive bile acidexcretion contributed by the Clostridia-rich microbiota that isassociated with the severity of diarrheal symptoms in IBS-Dpatients [11].These results indicate a potential role of microbiota and
microbiota-related byproducts in IBS, but the alterations of fecaland serum metabolites and their interactions with gut microbiotaare not well established and interpreted. Here in this study, weintegrated microbiome and untargeted metabolites profiling datafrom discovery (n= 330) and validation (n= 101) cohorts tounderstand the IBS-specific microbiota and metabolite alterations.We found a moderate alteration of fecal microbiome andmetabolome in IBS patients, whereas clear separation betweenIBS patients and healthy controls was observed using serummetabolites. Interestingly, we found strong associations betweenfecal metabolites and microbiota, and identified dysregulatedtryptophan/serotonin metabolism correlated with the severity ofIBS depression. Collectively, our study provides a valuableresource to understand IBS-specific microbiota/microbiome fea-tures and interactions, highlights the potential application ofserum metabolites in laboratory diagnostics of IBS, and offers newclues to understand IBS depression comorbidity.
MATERIALS AND METHODSSample collectionAdults meeting the Rome IV criteria for IBS [12, 13] were prospectivelyrecruited at two Chinese medicine clinics affiliated with the School ofChinese Medicine, Hong Kong Baptist University. More specifically, IBSpatients were recruited on if they fulfilled the following inclusion criteria:(1) meeting the Rome IV criteria, including recurrent abdominal pain onaverage at least 1d/week in the last 3 months; (2) IBS Symptom SeverityScale (IBS-SSS) over than 75 points at baseline; (3) age of 18−65 years; (4)normal colonic evaluation with 5 years by examination of colonoscopy orbarium enema; (5) Written informed consent. Patients were excluded ifthey fulfilled one or more of the following exclusion criteria: (1) pregnancyor breast-feeding; (2) medical history of IBD, carbohydrate malabsorption,hormonal disorder, known allergies to food additives, and/or any otherserious diseases; (3) surgical histories of gallbladder removal, gastrointest-inal (GI) tract, and cerebral cranium; (4) having parasitic infections; (5) useof medications known to influence gastrointestinal function, bloodpressure, and fat. The disease status was classified by predominant bowelhabits on the days with abnormal bowel movements based on thequestionnaire of Bristol Stool Form scale and defecation frequency [12].Matched healthy controls without the medical history of neurodegenera-tive diseases, cardiovascular diseases, metabolic disorders, GI diseases, andsurgical histories of gallbladder removal, GI tract, and cerebral craniumwere also recruited in the same clinical centers. Included subjects wereinstructed to provide morning first stool samples and fasting bloodsamples on the same day for biochemical detection and omics analyses. Allincluded participants were required to stop using antibiotics, probiotics,
prebiotics, and other microbiota-related supplements at least three weeksbefore stool sampling. Specimens (serum and stools) were transported tothe laboratory using dry ice and were frozen at −80 °C.In total, we recruited 330 and 101 individuals for discovery and
validation cohorts, respectively. Specifically, we collected 330 fecal samples(including 24 IBS-C, 214 IBS-D, 19 IBS-M, 7 IBS-U, and 66 healthy controls)and 325 matched serum samples (including 24 IBS-C, 209 IBS-D, 19 IBS-M, 7IBS-U, and 66 healthy controls) from the discovery cohort, and collected101 fecal samples (including 7 IBS-C, 57 IBS-D, 13 IBS-M, 9 IBS-U, and 15healthy controls) and 98 matched serum samples (including 7 IBS-C, 55IBS-D, 13 IBS-M, 9 IBS-U, and 14 healthy controls) from the validationcohort.There were 24 intrinsic factors and 45 questionnaire factors collected for
each subject. The 24 intrinsic factors contained: Gender, Age, BMI, Subtype(including IBS-D, IBS-C, IBS-M, and IBS-U), Serum TBA (Serum Total BileAcids (TBAs), umol/g), Fecal TBA (Fecal TBAs, umol/g), ALP (Alkalinephosphatase, u/L), ALT (Alanine transaminase, u/L), AST(Aspartate transa-minase, u/L), Urea (mmol/L), Creatinine (umol/L), TC (Serum totalcholesterol, mmol/L), Fasting glucose (mmol/L), TG (Triglyceride, mmol/L), C4 (serum 7α-hydroxy-4-cholesten-3-one, ng/mL), FGF19 (serumfibroblast growth factor 19, pg/mL), Stool Freq (stool frequency per day),Bristol Stool Score, HAMD (Hamilton Depression Rating Scale), SAS (theZung Self-Rating Anxiety Scale), SDS (the Zung Self-Rating DepressionScale), IBS SSS Pain (IBS Symptom Severity Scale-Pain Score), IBS SSSDistention (IBS Symptom Severity Scale-Distention Score) and IBS SSS (IBSSymptom Severity Scale). The 45 questionnaire factors contained: (1) basicinformation (Education Level, Marriage and Monthly Income); (2) dietaryhabits (Rice Products Quantity and Frequency, Flour Products Quantity andFrequency, Coarse Cereals Quantity and Frequency, Viscera Blood ProductsQuantity and Frequency, Red Meat Quantity and Frequency, White MeatQuantity and Frequency, Egg Products Quantity and Frequency, Vege-tables Quantity and Frequency, Tuber Products Quantity and Frequency,Bean Products Quantity and Frequency, Fruit Quantity and Frequency,Vegetable Oil Quantity and Frequency, Animal Oil Quantity andFrequency); (3) beverage consumption (Tea Quantity and Frequency,Coffee Quantity and Frequency, Alcohols Quantity and Frequency, MilkProducts Quantity and Frequency); (4) physical exercise habits (PhysicalActivity Quantity, Exercise Quantity and Frequency); (5) sleeping status(Sleep Quality and Sleep Time); (6) smoking (Smoke Duration); (7) stressstatus (Spirit Quantity and Frequency).
Depression diagnosisIBS patients with depression were diagnosed by a combination of a SDSself-report and a 17-item HAMD-17 other-report. All subjects were firstlyrequested to complete the SDS, with an index score of 53 as a cut-off value[14]. Those with SDS score greater than 53 were received a professionaldiagnosis with a HAMD by a psychiatrist. The severity of depressivesymptom was categorized by the following severity range [15]: (1) HAMD< 7: no depression (rIBS); (2) HAMD 8−16: mild depression (mIBS); (3)HAMD ≥ 17: moderate and severe depression (17−23 for moderate and≥24 for severe) (sIBS). In the 330-member discovery cohort, 264 IBSpatients were further diagnosed as 185 rIBS, 63 mIBS, and 16 sIBS.
Approval for human patient researchThis study was approved by the Ethics Committee on the Use of Human &Animal Subjects in Teaching & Research (Approval no. HASC/15-16/0300and HASC/16-17/0027). Written informed consent was obtained from eachparticipant prior to sample collection.
Measurements of total bile acids, 7α-hydroxy-4-cholesten-3-one and fibroblast growth factor 19 in serum samplesConcentrations of TBAs and fibroblast growth factor 19 (FGF19) in humanserum were tested by using commercial TBA Assay Kit (Cell Biolabs, SanDiego, CA, USA) and Human Fibroblast growth Factor 19 Assay Kit (ThermoScientific, Waltham, MA, USA), respectively. The level of serum 7α-hydroxy-4-cholesten-3-one (C4) was quantified by a liquid chromatography coupledwith mass spectrometry (LC/MS)-based method developed fromour group.
Metabolite profiling of fecal and serum samplesMetabolites were extracted from serum and fecal samples as describedpreviously [16, 17]. Briefly, feces (100mg) were completely homogenizedwith five-fold volume of ice-cold distilled water. After high-speed
L. Han et al.
984
The ISME Journal (2022) 16:983 – 996
1234567890();,:
centrifugation (13,000 rpm for 15min at 4 °C), water extractions weretransferred to a new 2mL tube. Subsequently, another five-fold volume(500 μL) of methanol was added into the pellet sample. The mixture wascompletely homogenized and centrifuged again. Methanol extractionswere combined with the previous water extractions. Serum (50 μL) wasprepared with four volumes of cold methanol for protein precipitation, andmetabolite extracts were obtained after vortex and centrifugation. The 200μL of fecal or serum supernatant was dried and redissolved in the samevolume of solvent consisting of water and acetonitrile (98:2, v/v).Meanwhile, quality control (QC) samples pooling all samples wereindividually prepared using the same protocol. P-chlorophenylalanine (5μg/mL) was added as an internal standard.
Analytical conditions for the untargeted metabolic profilingThe 2 μL of the resulting supernatant was injected into a liquidchromatography system (UPLC, Agilent 1290 Infinity, USA) and separatedby gradient elution with 0.35mL/min of flow rate using ACQUITY UPLCBEH C18 column (1.7 μm, 2.1 × 50mm, Waters Corporation, Milford, MA).The gradient program consisted of phase A (0.1% formic acid in water) andphase B (0.1% formic acid in acetonitrile), which started from 2 to 5% B in1min, then raised to 100% B in the next 11min and maintained at 100% Bfor 3 min, finally turned back to 2% B in 2min. A quadruple time-of-flightmass spectrometer (Q-TOF/MS, Agilent 6543, USA) coupled with electro-spray ionization (ESI) was performed for the acquisition of metabolicfragments in both positive and negative ionic modes. The instrumentoperated in full scan mode from 100 to 1,000m/z and the capillary voltagewas set at 3,000 V.
Semi-quantification of neuroactive amides in feces and serumA total of 17 neuroactive metabolites including tryptophan (TRP), tryptamine(TRPT), n-acetylserotonin (NAS), 5-hydroxyindoleacetic acid (5-HIAA), melato-nin, kynurenine (KYN), kynurenic acid (KYA), serotonin, 3-indole acetic acid (3-IAA), 3-hydroxyanthranilic acid (3-HAA), tyrosine (TYR), succinic acid (SUCC),dopamine, glutamate (GLU), glutamine (GLN), histamine, aminobutyric acid(GABA) were purchased from Sigma-Aldrich (St. Louis, MO, USA). An isotopicglutamine-2,3,3,4,4-d5 as an internal standard was obtained from CDNisotopes (Pointe-Claire, Quebec, Canada). HPLC grade organic reagents formass spectrometric analysis were purchased from Sigma-Aldrich (St. Louis,MO, USA). The standard curves and regression coefficients were gainedbased on internal standard adjustment.The analytical conditions were referred to a published study [18]. Briefly,
a liquid chromatography (Agilent UHPLC 1290, USA) coupled with a triple-quadrupole mass spectrometer (Agilent QQQ-MS 6438, USA) was applied.Sample injection and flow rate were set at 2 μL and 0.4 ml/min for eachsample, respectively. Of neuroactive metabolites, GLU, GLN, histamine,GABA were separated using an ACQUITY BEH Amide column (1.7 μm, 100mm × 2.1mm) with a linear gradient of 100mM ammonium formate in95% water and 5% acetonitrile (mobile phase A) and 30mM ammoniumformate in 15% water and 85% acetonitrile (mobile phase B). The gradientprogram was: 100−80% B for the first 6 min, 80−50% B for 3 min, held at50% B for 3 min, 50−100% B for 3 min. The column temperature wasmaintained at 30 °C. Moreover, melatonin, NAS, KYN, KYA, TRP, 5-HIAA, TYR,serotonin, 3-IAA, TRPT, 3-HAA, dopamine, SUCC were separated using anACQUITY BEH C18 column (1.7 μm, 100mm × 2.1mm) with a lineargradient of 0.1% formic acid (FA) in water (mobile phase A) and 0.1% FA inacetonitrile (mobile phase B). The gradient program was: 2−30% B for thefirst 4 min, 30−100% B for 2 min, held at 100% B for 2 min, 100−2% B for 2min. The column temperature was maintained at 40 °C. The capillaryvoltage of the mass spectrometer for both acquisitions was 3.5 kV in thepositive mode. The acquisition data were analyzed using AgilentMassHunter Workstation Software for peak integration, calibrationequations, and quantification of individual metabolites.
Identification of differentially abundant metabolitesThe nonparametric univariate method (Wilcoxon rank-sum test) wasapplied to identify metabolites that differed in abundance between IBSpatients and controls and corrected for false discovery rate (FDR). Partialleast-squares discriminant analysis (PLS-DA) was applied by using thefunction plsda from the R package mixOmics. Differentially abundantmetabolites between IBS patients and healthy controls were identified byusing the combined statistical criteria of PLS-DA Variable Importance inProjection (VIP) score > 1.0, FDR adjusted p-value < 0.1, and fold change inthe range of 0.8−1.2.
Unsupervised clustering of differentially abundantmetabolitesWe performed unsupervised clustering using residual abundance valuesfrom linear modelling described in detail by Fransoza et al. [32] on alldifferentially abundant metabolites. The detailed analysis process includedtwo steps: calculating residual abundance values and clustering. Tocalculate residual abundance values, we firstly log-transformed the relativeabundance values to variance-stabilize the data. Zero values wereadditively smoothed by half the smallest non-zero measurement on aper-sample basis. We then modelled the transformed abundance of eachfeature as a function of IBS phenotype (modelled as a categorical variable),with age as a continuous covariate. Residual abundance values from thelinear models were used in subsequent cluster analyses.We performed clustering on residual abundance values of all
differentially abundant metabolites. This procedure enriches for covaria-tion between metabolites. Metabolites were firstly ranked according to therichness in IBS (the fold change). The highest-ranked metabolite wasassigned as an initial cluster. Each subsequent metabolite was thencompared to each extant cluster. If the metabolite had a mean similarity tothe cluster’s members exceeding a threshold, the metabolite was added tothat cluster (using Spearman’s rank correlation r= 0.7 as a threshold). If themetabolite was not added to any extant clusters, it was seeded into a newcluster. After scanning all metabolites, clusters were renumbered accord-ing to their size, of which cluster 1 had the largest size, and so on.
Metagenomic DNA extraction and sequencingWe used the phenol/chloroform/isoamyl alcohol method to extractmicrobial DNA from stool samples (200mg) of included subjects [19].The DNA that passed quality control was then subjected to libraryconstruction using the TruSeq DNA HT Sample Prep Kit. Paired-endsequencing (2 × 150 bp) was carried out using Illumina Hi-Seq platform.
Read-level quality control and metagenomic profilingRaw sequencing reads were filtered using SOAPnuke with the parameter“-l 20 -q 0.5 -n 0.1 -d” [20]. After the removal of adapter sequences and low-quality reads, host (human) reads were identified and removed bymapping against the human genome (hg19 build) with SOAP2 [21]. Theremaining high-quality reads were used for further analysis. MetaPhlAn2[22] (version 2.7.6) and default marker database mpa_v20_m200 wereused to estimate the relative abundance of taxonomic profile. Thedatabase contained ~ 1M clade-specific marker genes from approximately17,000 reference genomes. We only considered the species-level data andkept species that exceed 0.1% relative abundance in at least six samples.Functional profiling was performed using HUMAnN2 [23] (version 0.9.4) inUniRef90 mode. Detected genes were further regrouped into gene familiesand pathways and then sum-normalized within HUMAnN2. Lineardiscriminant analysis Effect Size (LEfSe) [24] analysis was applied on therelative abundance of species, gene families, and pathways to identifydisease-associated biomarkers. Features with Linear discriminant analysis(LDA) score > 2.0 and p-value < 0.05 were considered as statisticallysignificant. Association between microbiome composition and covariateswas estimated with PERMANOVA test using the R package vegan.In order to compare gut microbiota profile of IBS with that of other
diseases, the microbial taxonomic data including IBD [25], liver cirrhosis(LC) [26], colorectal cancer (CRC) [27], and type 2 diabetes (T2D) [28], werecollected using the R package curatedMetagenomicData [29].
Statistical analysisWe assessed which fraction of the total variation of Bray-Curtis distance ofmicrobiome and metabolome can be explained by clinical factors usingthe function adonis from the R (3.5.1) package vegan. The p-value wasdetermined by 1000x permutations and was further adjusted using theBenjamini and Hochberg method. The association between each factorand each diversity or richness measure was assessed by Spearmancorrelation. The 10-fold cross-validation random forest (RF) model wasgenerated using R (3.5.1) package randomForest. The cross-validationalerror curves from 5 trials of the 10-fold cross-validation were averaged, andthe minimum error in the averaged curve plus the standard error at thatpoint was used as the cutoff. The minimum number of species/metabolitesmarkers with an error less than the cutoff was chosen as the optimalmodel. The receiver operating characteristic (ROC) curves were drawnusing R (3.5.1) package pROC, and area under the curve (AUC) scores areused to compare different models.
L. Han et al.
985
The ISME Journal (2022) 16:983 – 996

RESULTSMulti-omics profiles associated with intrinsic andquestionnaire factors in IBS patientsTo investigate the potential mechanism of pathogenesis in IBS, wecollected 330 stool and 325 serum samples from a 330-memberdiscovery cohort included 264 IBS patients and 66 healthy controls(Supplementary Fig. 1). Nearly 30% (79 out of 264) of IBS patientsalso suffered from depression or anxiety (Supplementary Table 1).For each subject, 24 intrinsic factors (including symptom scoresand biochemical indices) and 45 questionnaire factors (includingbasic information, dietary habits, beverage consumption, exercisehabits, sleeping status, smoking, stress status, etc) were collected,and the intercorrelations between factors were analyzed (Supple-mentary Fig. 2).To characterize the microbiome and metabolic profile in IBS,
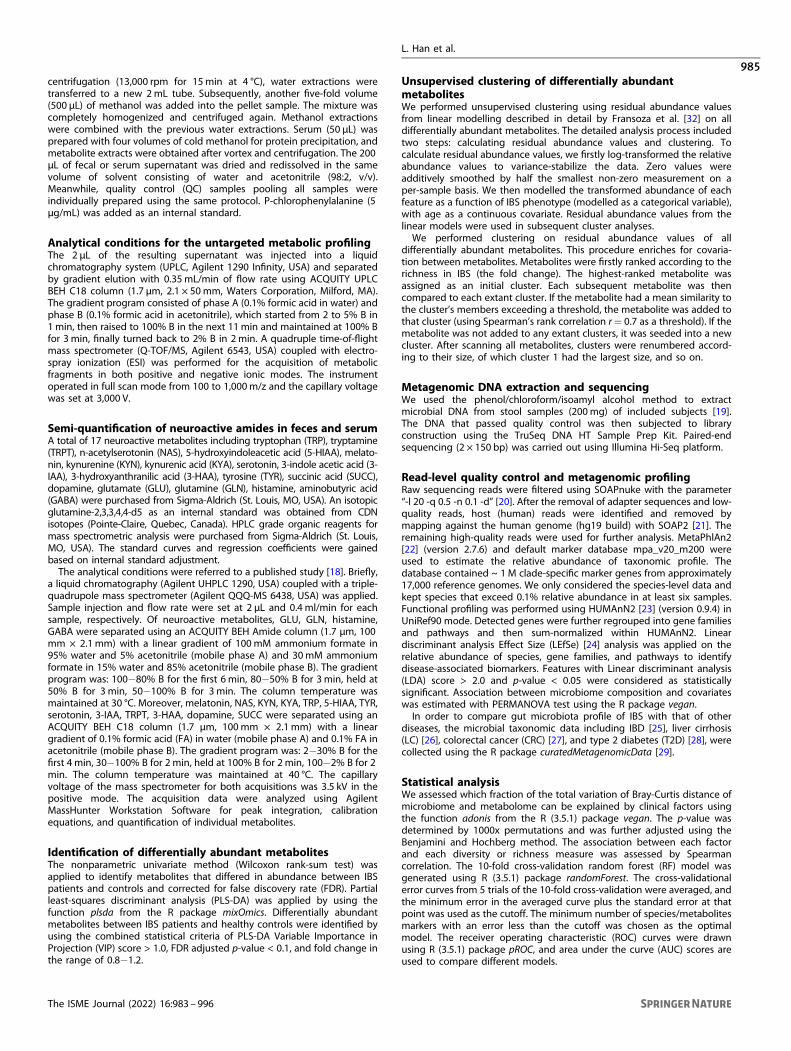
330 stool samples were subjected to metagenomic sequencing anduntargeted metabolomic analysis. In total, we captured 1788 knownand uncharacterized fecal metabolites (including 856 identified inthe positive mode and 932 identified in the negative mode).Regarding 325 serum samples available, we performed untargetedmetabolomic analysis by using high-resolution mass spectrometerand captured 1769 known and uncharacterized serum metabolites(including 879 identified in the positive mode and 890 identified inthe negative mode). We firstly assessed the overall differencesbetween IBS patients and healthy controls in the fecal microbiome,fecal, and serum metabolomes respectively. Compared with healthycontrols, IBS patients showed significantly elevated alpha and betadiversity in serum metabolome data (p= 1.04e−11 and 0.08 foralpha diversity by positive and negative ionization modes,respectively; p= 2.2e−16 and 2.2e−16 for beta diversity by positiveand negative ionization modes, respectively; Supplementary Fig. 3a),increased beta diversity in fecal microbiome (p= 8.6e−09, Supple-mentary Fig. 3c), but no obvious differences in fecal metabolomedata (Supplementary Fig. 3b). Interestingly, we noticed that theserum metabolites of IBS patients dramatically change from those ofhealthy controls, suggesting that serum metabolites have thepotential to be used for IBS laboratory diagnostics (Fig. 1a). Suchdifferences could result from a combination of multiple factors,including the effect of host disease status, the differences in dietaryhabits, medication use, etc. However, both IBS patients and healthycontrols were clustered together on Principal coordinates analysis(PCoA) plot based on fecal metabolome and microbiome data,indicating fecal data have less power to distinguish IBS patients(Fig. 1a). We subsequently compared the degree of IBS-relatedmicrobiota dysbiosis to other microbiota-mediated diseases, includ-ing IBD, LC, CRC, and T2D. As shown in Fig. 1b, only 0.5% of the gutmicrobiota dysbiosis could be explained by disease status in IBS,which was similar to T2D but much smaller than that of LC or IBD,suggesting a moderate degree of microbiota dysbiosis in IBScompared to other diseases.Further, we separately investigated the associations of intrinsic
and questionnaire factors with metabolic and microbial profiles(Fig. 1c). Previous studies have suggested that the alterations ofgut microbiome composition were influenced by clinical factors inIBD and IBS [6]. Here, we correlated those 24 intrinsic factors and45 questionnaire factors with the overall composition of micro-biota and metabolites based on Bray−Curtis dissimilarities,respectively. Permutational multivariate analysis of variance(PERMANOVA) revealed that IBS subtypes were associated withcomposition changes in both fecal microbiome and serummetabolome, but not with fecal metabolome. Based on fecalmicrobiome profiles, 10 factors were significantly associated (FDR< 0.1) with overall composition variation, which togetherexplained 9% of inter-individual variations. The strongest associa-tions with microbial composition were found to be the levels ofseveral biochemical indices, including fecal TBA and C4, which isconsistent with previous studies [30, 31]. Similar trends wereobserved in both positive and negative ionic mode fecal
metabolome profiles (Fig. 1c and Supplementary Fig. 4a) whichfecal TBA explained >6% of the composition variance that was fargreater than any other factors. We also noticed that the fecal TBAwas negatively correlated with the alpha diversity of fecalmetabolomic profiling (Spearman’s r=−0.17, p= 0.002). Bycontrast, in serum metabolomics data, the Zung Self-RatingAnxiety Scale (SAS) primarily explained >8% of the compositionalvariance and showed a positive correlation with the Shannonindex (Spearman’s r= 0.22, p= 0.0003) (Fig. 1c and Supplemen-tary Fig. 4b). This result demonstrated a close linkage betweenpsychological burden and serum metabolic alterations. Moreover,several dietary factors were also found to be associated withmetabolomic profiles, of which the frequency of tea drinkingshowed a significant relationship with fecal metabolic variation(Spearman’s r=−0.14, p= 0.016) (Supplementary Fig. 4a, c).
Metabolome alterations between IBS patients and healthycontrolsTo illuminate metabolic changes across groups, we performedPLS-DA on both serum and fecal metabolome data. The serumsamples were largely separated between IBS and controls, which isconsistent with broad changes in serum metabolite profilesdescribed in earlier context (Supplementary Figs. 5b and 6b). Bycontrast, IBS patients could not be discriminated from healthycontrols in fecal metabolome according to PLS-DA plots(Supplementary Fig. 7c, d). We then applied nonparametricunivariate method (Wilcoxon rank-sum test) to identify differen-tially abundant serum metabolites between IBS patients andhealthy controls. After correcting for FDR, a total of 726 serummetabolic fragments were significantly changed (FDR < 0.05) inIBS (Supplementary Figs. 5a and 6a and Supplementary Table 2),whereas only 8 fecal metabolites were identified (SupplementaryFig. 7a, b). When evaluating the generality of the differentiallyabundant serum metabolites in the validation cohort, 635 (87.5%)were enriched, of which 628 were also FDR significant (Supple-mentary Table 3).101 out of 726 different metabolic fragments in serum were
structurally identified (Fig. 2a). Compounds whose levels signifi-cantly changed between IBS patients and healthy controls includemany metabolites from food, such as γ-tocotrienol, myo-Inositol 1-phosphate, stearic acid, and actinidine, indicating that somedetected changes of metabolite were attributed to the differencesin dietary habits (Fig. 2b). Although total serum TBA levelincreased in IBS patients (Supplementary Table 1), we observeddepletions in bile alcohol 27-Norcholestanehexol and bile saltTaurochenodeoxycholate-3-sulfate. This discrepancy may be dueto different enzymes involved in the metabolism and synthesis ofdifferent types of bile acids [32]. Another control-enrichedmetabolite, Tetrahydrodeoxycorticosterone (THDOC), is a stress-induced neuroactive and anti-oxidative steroid, which mightprotect stress-induced responses [33]. Our result showed sig-nificant negative correlations between serum levels of THDOCwith SDS in IBS (Supplementary Fig. 8a).Considering the simultaneous elevation of four fatty acyl-CoAs in
IBS patients, we hypothesized that metabolites may be clustered forsimilar chemical and functional properties. Using the unsupervisedclustering method based on residual abundance values from linearmodelling described in detail by Franzosa et al. [25], 726differentially abundant serum metabolites were clustered into 78clusters which tend to covary independently of their relationshipwith IBS phenotype and age (Supplementary Table 2). Clusters ofmetabolites can be used to predict properties for unannotatedmetabolites by transforming knowledge from their annotatedpartners. The largest cluster enriched in IBS patients contained 70metabolites (Fig. 2c), which include the three out of the four fattyacyl-CoAs, enhanced the importance of dysregulation of fatty acidsin IBS patients. Other metabolites in this cluster included some sterollipids and structural variants of fatty acid. Moreover, 58 unlabeled
L. Han et al.
986
The ISME Journal (2022) 16:983 – 996
metabolites were also contained in this cluster which may also berelated to fatty acid metabolism via guilt-by-association logic. Thelargest cluster enriched in healthy controls contained 123 metabo-lites, and all of them elevated in healthy controls (SupplementaryFig. 8b). Validated standard metabolites in this cluster included avariety of Triglyceride (TG) metabolites and phosphates. Anotherinteresting cluster enriched in healthy control contained a variety ofamines, including Pyridoxamine-5′-Phosphate, Phenylethylamine,
and Dimethyltryptamine (Fig. 2d). Pyridoxamine 5′-phosphateis one form of vitamin B6, which is involved in many reactions ofamino acid metabolism [34]. Dimethyltryptamine has a similarchemical structure to the neurotransmitter serotonin and acts asan agonist in mammalian brain and blood [35]. Phenylethylamineis a monoamine neurotransmitter, which can stimulate the bodyto make certain chemicals that play a role in depression andother psychiatric conditions [36]. The co-functions of these
Fig. 1 Multi-omics profiles of IBS patients. a Principal coordinates analysis (PCoA) of discovery cohort individuals based on 330 gutmetagenomic (264 IBS and 66 HC), 330 fecal metabolomic (264 IBS and 66 HC), and 325 serum metabolomic profiles (259 IBS and 66 HC),respectively (Bray−Curtis distance). b Left panel shows the comparisons of gut microbiota dysbiosis in different diseases and differentsubtypes of IBS. The gut metagenomic data of other diseases, including inflammatory bowel disease (IBD, n= 155, including 121 IBD and 34HC) [25], liver cirrhosis (LC, n= 237, including 123 LC and 114 HC) [26], colorectal cancer (CRC, n= 128, including 74 CRC and 54 HC) [27], andtype 2 diabetes (T2D, n= 363, including 178 T2D and 185 HC) [28], were collected by the R package curatedMetagenomicData [29]. Right panelshows the comparisons of gut microbiota dysbiosis in different subtypes of IBS, including IBS-C (n= 90, 24 IBS-C and 66 HC), IBS-D (n= 280,214 IBS-D, and 66 HC), IBS-M (n= 85, 19 IBS-M, and 66 HC), and IBS-U (n= 73, 7 IBS-U, and 66 HC). c Shown are associated factors with gutmetagenomic, fecal metabolomic (negative ionization mode), and serum metabolomic (negative ionization mode) profiles in the 330-memberdiscovery cohort. Black bars indicate statistical significance (FDR < 0.1).
L. Han et al.
987
The ISME Journal (2022) 16:983 – 996

organic compounds in IBS still need further research. Most clustersremained largely undefined, allowing the potential correlationanalysis for many previously undescribed metabolites with microbialorigin.
Microbiome alterations between IBS patients and healthycontrolsAlthough several previous studies already explored the IBS gutmicrobiome characteristics in IBS even in large cohort [5, 6], much of
Fig. 2 Differentially abundant serum metabolites and their clusters. By analyzing the serum metabolomic profiles of 259 IBS and 66 HCfrom the discovery cohort, we identified 726 differentially abundant serum metabolites (including 364 identified in the positive mode and 362identified in the negative mode), among which 101 out of the 726 metabolites were structurally identified. a The barplot shows the PLS-DAVIP results in the projection of the 101 structurally identified differentially abundant serum metabolites. b Diet-associated differentiallyabundant serum metabolites that enriched in IBS patients and in healthy controls. The Y-axis represents each metabolite, and the X-axis showsthe log-transformed PPM units of the abundance of each metabolite. c The largest cluster enriched in IBS contained 70 metabolites, and all ofthem significantly elevated among IBS patients. d One interesting cluster enriched in healthy controls contained 46 metabolites and includeda variety of amines, all of which significantly elevated in healthy controls. Abundances are in log-transformed PPM units.
L. Han et al.
988
The ISME Journal (2022) 16:983 – 996

the data related to Western populations, limiting their application ina global context [29]. Considering the heterogeneity and complexityof IBS, together with the fact that the prevalence of IBS variesdramatically among geography, it is worth investigating in differentcountries and cultures. To infer the differences of gut microbiomebetween IBS patients and healthy controls in Hong Kong Chinesepopulations, we applied LEfSe [24] to the high-dimensionaltaxonomic profiles. A total of 33 species were identified asdifferentially abundant bacteria species, of which 23 were elevatedin IBS relative to controls, including Ruminococcus gnavus,Escherichia coli, Bacteroides plebeius, etc. In contrast, 10 speciesincluding Bacteroides uniformis, Prevotella stercorea, and Bacteroidescoprocola were among the species exhibiting the strongestenrichments in healthy controls (Supplementary Fig. 9a andSupplementary Table 4a). Of 33 differentially abundant species inthe discovery cohort, 24 trended in the same direction in thevalidation cohort, suggesting the majority of IBS-associated changesidentified in the discovery cohort generalized in their directionalityto the validation cohort. Notably, the enrichment of Bacteroidesplebeius and Lachnospiraceae bacterium 2_1_58FAA was alsoobserved in the validation cohort in spite of the small number ofdifferentially abundant species (Supplementary Table 5).
IBS patients could display different symptoms, for example,diarrhea versus constipation, thus it is important and interesting tofigure out the similarities and differences among subtypes interms of gut microbiome and metabolome. Figure 3a gives anoverview of the gut microbiota differentially identified in all IBSclinical subtypes, depicting the numbers of increased anddecreased species per family. In total, 16, 29, 9, and 7nonredundant taxa were associated with IBS-C, IBS-D, IBS-M andIBS-U patients, respectively (Supplementary Fig. 9b−e andSupplementary Table 4b−e). Compared with controls, patientswith IBS-C or IBS-D showed substantial overlap in the increase anddecrease in the relative abundance of bacterial species in their gutmicrobiome. There were 10 taxa associated with both IBS-D andIBS-C (Supplementary Table 6). These included an increase inseveral Gram-negative bacteria, including Bacteroides faecis,Escherichia coli, and Klebsiella pneumoniae. Furthermore, theBacteroides clarus and Bacteroides coprocola showed an oppositechanging direction, may be associated with the differentsymptoms in IBS-C and IBS-D. In addition, we also found somedisease-specific associations. The abundance of Fusobacteriumvarium, for example, was only elevated in patients with IBS-D butnot in those with IBS-C. An increase in species of the Clostridium
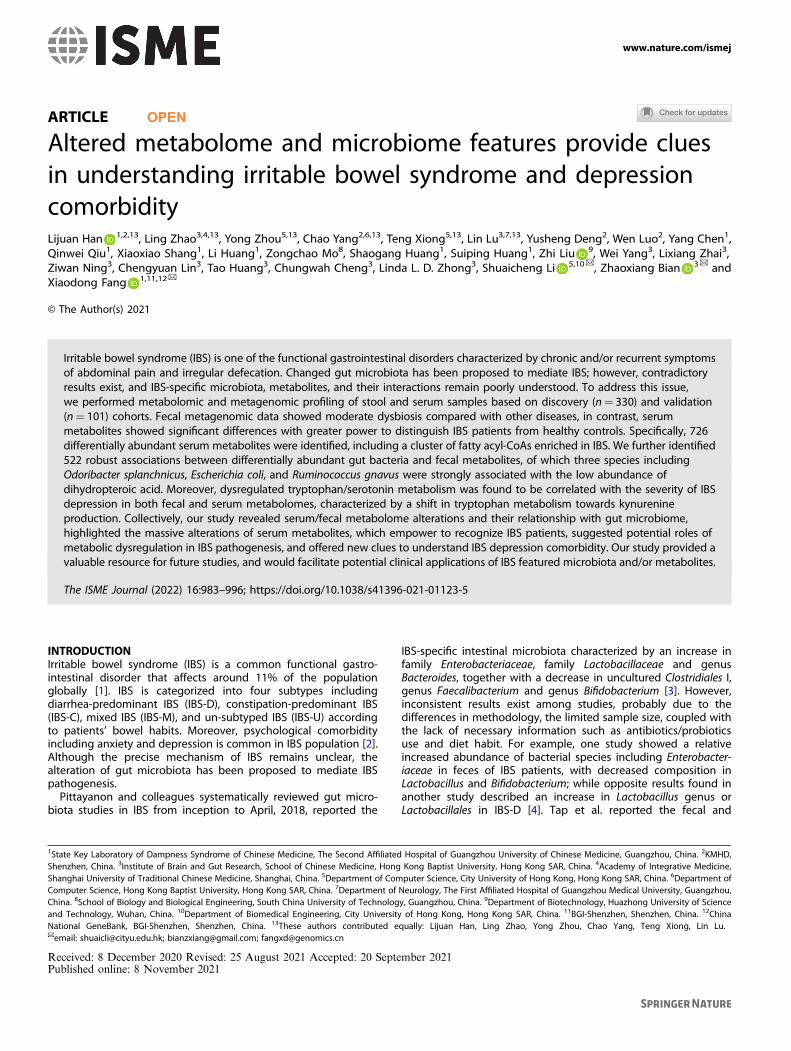
Fig. 3 Gut microbiota alterations between IBS patients and healthy controls. By analyzing the gut metagenomic profiles of 264 IBS and 66HC from the discovery cohort, we identified 33 differentially abundant gut microbiota species, with 23 enriched in IBS and 10 enriched in HC.a Differentially abundant gut microbiota species and their belonging taxon at the family level. The X-axis labels “# Species” represent thenumber of differentially abundant species, and the Y-axis represents the belonging taxon at the family level. Species that enriched in IBS andIBS subtypes are shown in red, whereas species that enriched in HC are shown in blue. b An example of differentially abundant pathwaysbetween IBS and HC, annotated by their taxonomic contributors. The Y-axis represents the relative abundance of MetaCyc pathway, while theX-axis represents ordered individuals from the 330-member discovery cohort.
L. Han et al.
989
The ISME Journal (2022) 16:983 – 996

was observed only in patients with IBS-C, including increases inClostridium symbiosum and Clostridium bartlettii [11].To understand the functional consequences of microbial
community changes in IBS, we profiled pathways in all metagen-omes using HUMAnN2 [23]. LEfSe [24] was applied on theabundance data, revealing 18 pathways differentially abundant inIBS patients and healthy controls (Supplementary Table 7). Of thedifferentially abundant pathways, 8 was significantly elevated inIBS patients. The glycolysis VI (mammalian) represented the mostsignificantly enriched functional pathway in IBS, which wasdominated by the Bacteroides genus (Fig. 3b). The synthesis ofstearate, androgen, and L-tyrosine were also enhanced in IBS(Supplementary Fig. 10a, b, and Supplementary Table 7). The mostcommon pathways enriched in healthy controls included bio-synthesis of L-lysine (PWY_5097, PWY_2941, PWY_2942, andPWY_724), and the biosynthesis of isoleucine and threonine(Supplementary Fig. 10c−e and Supplementary Table 7). Ourfunctional analysis revealed differential metabolic pathwaysbetween IBS patients and healthy controls, and these observationsmay help to explain the great divergence of serum metabolitesbetween these two groups.
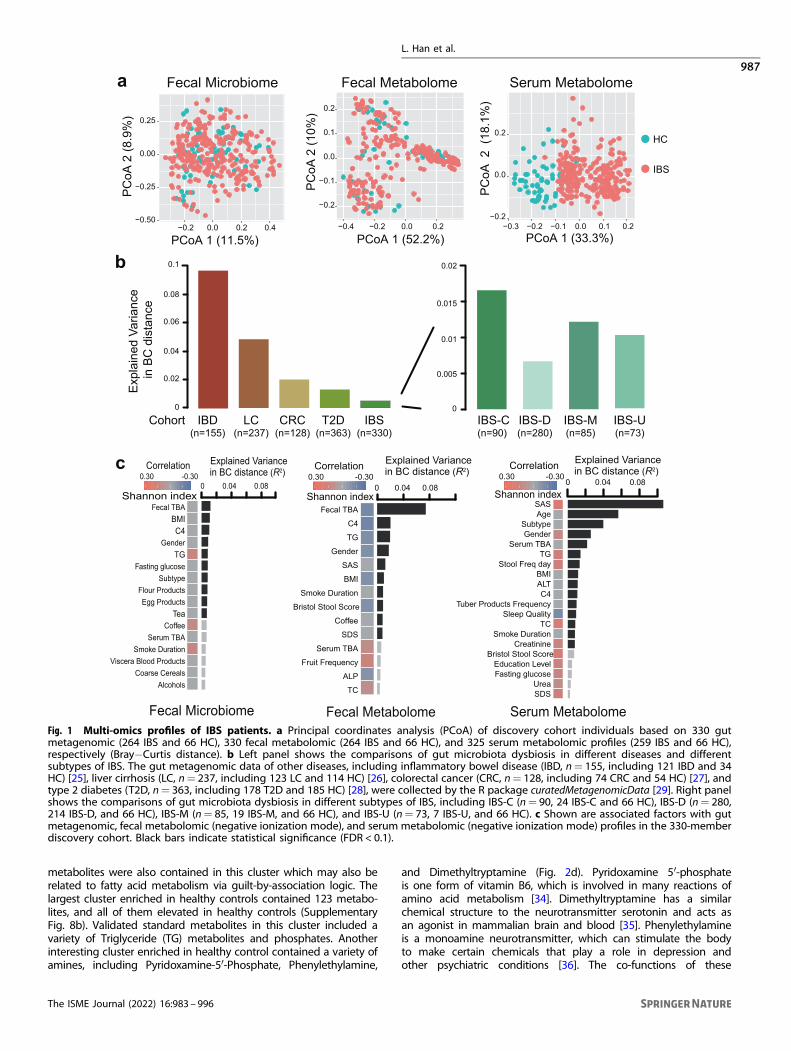
Associations between fecal/serum metabolites and gutmicrobiotaThe multi-omics nature of our data enables the identification ofdynamic interaction between differentially abundant microbialand metabolic features in IBS. Positive associations betweenmicrobiota and metabolites might suggest metabolites promotethe growth of certain species or species produce certainmetabolites; while negative associations may suggest competitiveor suppressive relationship. Here we analyzed the associationbetween species and fecal/serum metabolites. Interestingly, a totalof 522 associations (q < 0.05) between 113 differentially abundantfecal metabolites and 33 differentially abundant gut bacteriaspecies were revealed (Fig. 4a); however, the association betweendifferentially abundant serum metabolites and gut bacteriashowed no statistical difference. These findings suggested thatfecal metabolites, which could directly interact with gut micro-biota, in comparison serum metabolites are regulated by morecomplex and subtle mechanisms. To further confirm potentialmechanistic associations that are perturbed in IBS, we specificallyfocused on the subset of associations that were nominallysignificant (p-value < 0.05) and changes in the same direction inhealthy controls. This analysis showed that 30% (155 out of 522)associations could be validated in controls, including 43 associa-tions involving structurally known metabolites (SupplementaryTable 8). Of 43 associations, 13 out of 33 differentially abundantspecies were represented in at least one association. Ruminococ-cus gnavus associates with eight metabolites and followed byspecies Odoribacter splanchnicus and Escherichia coli that associatewith seven metabolites (Supplementary Table 8). In line with IBD,the over-represented abundance of Ruminococcus gnavus iselevated in IBS compared with healthy control, and it is negativelyassociated with metabolites such as dihydropteroic acid, sebacicacid, 2-methyl valeric acid, and cortisone. Especially, Ruminococcusgnavus is strongly associated with dihydropteroic acid (Spear-man’s r=−0.60), which is an important intermediate product forfolic acid. Folic acid is reported to be relatively low in IBS patients.Our result demonstrated that the enriched Ruminococcus gnavuswas closely related to the low level of folic acid in IBS. In addition,Odoribacter splanchnicus and Escherichia coli are also observed toassociate with dihydropteroic acid (Fig. 4b−e, Spearman’s r= 0.41and −0.35). Our data demonstrated the importance of integratinggut microbiome and metabolome, as it provides an explainingframework for IBS pathogenesis and complication, and identifiesmicrobial and metabolic candidates for further investigation andapplication.
Microbial and metabolic signatures associated with IBSdepressionTo investigate the potential association between multi-omicssignatures and severity of psychological symptoms, especiallydepression, we classified samples into four groups: healthycontrols (HC), regular IBS patients without depression (rIBS:HAMD < 7 and SDS < 53), IBS patients with mild depression (mIBS:7≤HAMD < 17 and SDS ≥ 53) and IBS patients with moderate orsevere depression (sIBS: HAMD ≥ 17 and SDS ≥ 53). By applyingPLS-DA, we revealed enormous differences between healthycontrols and IBS depression groups (including rIBS, sIBS, andmIBS) (Fig. 5a, b). The serum compositional changes involved 836and 754 metabolites that altered abundance in mIBS and sIBS,respectively (Supplementary Table 9). Of them, 693 metabolitesare shared. The significantly increased compounds includeguanine, stearamide, and anandamide. In contrast, we foundfewer differences in fecal metabolome between control anddepression groups (Fig. 5c, d and Supplementary Table 10). Asimilar phenomenon was observed in gut microbiota, and only37 species showed aberrant alterations (Fig. 5e and Supplemen-tary Table 11). However, functional analysis revealed a graduallyincreasing enrichment of L-tryptophan biosynthesis pathwayacross control, rIBS, mIBS, and sIBS groups (Fig. 5f andSupplementary Table 12).To identify metabolic and metagenomic features that distin-
guish depressed-IBS from regular subjects, we further make acomparison among rIBS, mIBS, and sIBS groups. The multi-omicsdivergence between rIBS and the depressed group was smallerthan that compared with healthy controls. Notably, the sIBSpatients showed more divergence than mIBS patients (Supple-mentary Fig. 11 and Supplementary Tables 13−15). Interestingly,the L-tryptophan biosynthesis pathway was over-represented insIBS patient compared with rIBS (Supplementary Table 16). Wealso quantified depression-related molecules using a targetedmetabolic profiling. Consistent with the enhanced TRP biosynth-esis ability in gut microbiota, the TRP intensity also significantlyincreased in serum (Fig. 5g). In addition, we also noticed that thereare some other elevated compounds in the depression groupcompared with healthy controls, including histamine, tryptamine,kynurenine (KYN) (Supplementary Fig. 12).To explore the associations between neuroactive amino acids/
neurotransmitters and gut microbiota, we selected eight repre-sentative species which have the greatest power to distinguish IBSpatients with depression from healthy controls (SupplementaryFig. 13a, b) and examined their relationships with these molecularcompounds. A positive association of Roseburia inulinivorans andhistamine was observed in both fecal and serum data (Supple-mentary Fig. 13c), indicating a promoting role of Roseburiainulinivorans in the production of histamine. In addition, Roseburiainulinivorans was associated with melatonin, tryptamine, 3-HAA,KYN, glutamine, and dopamine in serum, although theseassociations are not replicated in feces. Furthermore, the IBS-enriched species, Clostridium nexile, correlate with a broader rangeof metabolite changes, such as NAS, TRP, and 5-HIAA. Takentogether, our data suggested that gut microbiome producingamino acids and amines, such as TRP, serotonin, and histamine,could be involved in the synthesis and degeneration of manyneurotransmitters thus affecting the host’s mood and psycholo-gical conditions. The integration of metagenome and metabo-lome data enables us to connect certain bacteria and associatedmetabolic products, providing new clues to understand IBSdepression comorbidity.
Applications of multi-omics features in IBS detectionCurrently, IBS is basically diagnosed based on symptoms, lackingvalid biomarkers. We thus explored the performance of usingmicrobiome and/or metabolites features to distinguish IBS
L. Han et al.
990
The ISME Journal (2022) 16:983 – 996
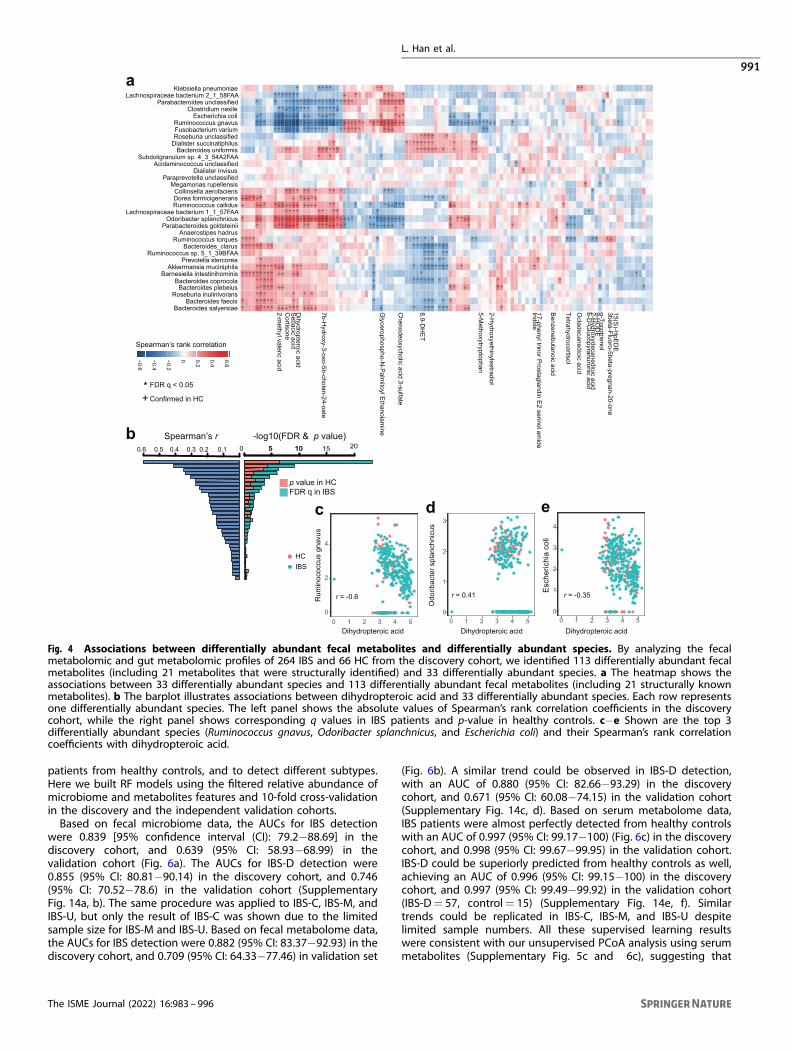
patients from healthy controls, and to detect different subtypes.Here we built RF models using the filtered relative abundance ofmicrobiome and metabolites features and 10-fold cross-validationin the discovery and the independent validation cohorts.Based on fecal microbiome data, the AUCs for IBS detection
were 0.839 [95% confidence interval (CI): 79.2−88.69] in thediscovery cohort, and 0.639 (95% CI: 58.93−68.99) in thevalidation cohort (Fig. 6a). The AUCs for IBS-D detection were0.855 (95% CI: 80.81−90.14) in the discovery cohort, and 0.746(95% CI: 70.52−78.6) in the validation cohort (SupplementaryFig. 14a, b). The same procedure was applied to IBS-C, IBS-M, andIBS-U, but only the result of IBS-C was shown due to the limitedsample size for IBS-M and IBS-U. Based on fecal metabolome data,the AUCs for IBS detection were 0.882 (95% CI: 83.37−92.93) in thediscovery cohort, and 0.709 (95% CI: 64.33−77.46) in validation set
(Fig. 6b). A similar trend could be observed in IBS-D detection,with an AUC of 0.880 (95% CI: 82.66−93.29) in the discoverycohort, and 0.671 (95% CI: 60.08−74.15) in the validation cohort(Supplementary Fig. 14c, d). Based on serum metabolome data,IBS patients were almost perfectly detected from healthy controlswith an AUC of 0.997 (95% CI: 99.17−100) (Fig. 6c) in the discoverycohort, and 0.998 (95% CI: 99.67−99.95) in the validation cohort.IBS-D could be superiorly predicted from healthy controls as well,achieving an AUC of 0.996 (95% CI: 99.15−100) in the discoverycohort, and 0.997 (95% CI: 99.49−99.92) in the validation cohort(IBS-D= 57, control= 15) (Supplementary Fig. 14e, f). Similartrends could be replicated in IBS-C, IBS-M, and IBS-U despitelimited sample numbers. All these supervised learning resultswere consistent with our unsupervised PCoA analysis using serummetabolites (Supplementary Fig. 5c and 6c), suggesting that
Fig. 4 Associations between differentially abundant fecal metabolites and differentially abundant species. By analyzing the fecalmetabolomic and gut metabolomic profiles of 264 IBS and 66 HC from the discovery cohort, we identified 113 differentially abundant fecalmetabolites (including 21 metabolites that were structurally identified) and 33 differentially abundant species. a The heatmap shows theassociations between 33 differentially abundant species and 113 differentially abundant fecal metabolites (including 21 structurally knownmetabolites). b The barplot illustrates associations between dihydropteroic acid and 33 differentially abundant species. Each row representsone differentially abundant species. The left panel shows the absolute values of Spearman’s rank correlation coefficients in the discoverycohort, while the right panel shows corresponding q values in IBS patients and p-value in healthy controls. c−e Shown are the top 3differentially abundant species (Ruminococcus gnavus, Odoribacter splanchnicus, and Escherichia coli) and their Spearman’s rank correlationcoefficients with dihydropteroic acid.
L. Han et al.
991
The ISME Journal (2022) 16:983 – 996

serum metabolites represented good predictors to distinguish IBSpatients from healthy controls. It was worth noting that theunbalanced sample size among subtypes impaired the efficacy toidentify subtype-specific microbiome/metabolome features, aswell as their potential to diagnose different subtypes. Therefore,we only found the mediocre performance of metabolome dataamong inter-subtypes models, such as the IBS-D versus IBS-C(Supplementary Fig. 14e, f).Since IBS is often accompanied by anxiety and depression, there
were investigations attempt to differentiate depression status
using microbiota [37]. Here in this study, using fecal microbiotadata, the AUC for predicting IBS patients with depression was 0.691(95% CI: 62.31−75.89) (Fig. 6d). After stratifying IBS patients intorIBS (n= 162), mIBS (n= 81) and sIBS (n= 17) subgroups, the AUCfor predicting each subgroup from healthy controls was greaterthan 0.8 (Supplementary Fig. 15a). Specifically, distinguishing rIBSfrom mIBS showed a relatively low AUC of 0.639 (95% CI: 56.76−70.96), indicating mild microbiota shift from rIBS to mIBS(Supplementary Fig. 15b). Similar trends were observed using fecalmetabolome data (Fig. 6e and Supplementary Fig. 15c, d). Whereas
Fig. 5 Aberrant metabolomic and metagenomic patterns in IBS patients with and without depression. a, b PLS-DA score plots based onthe serum metabolomic profiles of 259 IBS patients (including 181 rIBS, 62 mIBS, and 16 sIBS) and 66 healthy controls form the discoverycohort in both positive and negative ionization modes. c, d PLS-DA score plots based on fecal metabolomic profiles of 264 IBS patients(including 185 rIBS, 63 mIBS, and 16 sIBS) and 66 healthy controls form the discovery cohort in both positive and negative ion modes. eDifferentially abundant gut microbiota species among rIBS, mIBS, sIBS, and HC, by using LEfSe to analyze the gut metagenomic profiles ofindividuals from the discovery cohort. f The relative abundance of L-tryptophan biosynthesis pathway in rIBS, mIBS, sIBS, and HC. Here theabundance of TRP production is inferred by analyzing the fecal metagenomic profiles of 264 IBS and 66 HC from the discovery cohort, not yetmeasured in situ. g The signal intensity of tryptophan in serum and feces in rIBS, mIBS, sIBS, and HC, by analyzing the serum and fecal targetedmetabolic profiles of individuals from the discovery cohort.
L. Han et al.
992
The ISME Journal (2022) 16:983 – 996

based on serum metabolome data, the AUCs for predicting IBSpatients with depression were 0.724 (95% CI: 65.73−79.07) and0.691 (95% CI: 62.24−75.93) in positive and negative mode,respectively (Fig. 6f). All the subgroups including rIBS (n= 162),mIBS (n= 81) and sIBS (n= 17) could be distinguished fromcontrol, achieving the AUCs of 0.990 and even higher (Supple-mentary Fig. 15e). These results indicated that metabolome datamay not be good predictors for IBS depressive status, although itcould clearly distinguish IBS patients from healthy controls.
DISCUSSIONThis study reported large-scale integrated analysis of microbiomeand fecal/serum metabolome of IBS patients for the first time.Compared with other diseases’ relationship with microbiome, IBSpatients showed moderate alterations in both gut microbiomeand fecal metabolome compared to that of healthy controls, andthere was no clear separation observed between IBS patients andhealthy controls. Although we did not observe significant changesin the microbiome of IBS patients, we did notice 23 IBS enrichedspecies and eight IBS enriched functional pathways. The elevatedglycolysis VI (mammalian) pathway may suggest abnormalities inenergy metabolism involved in IBS; while the elevated synthesisstearate, androgen, and L-tyrosine pathways may increase thesensitivity of tyrosine receptor kinase receptors, associating withadjustment of neuronal transmission strength [38]. The biosynth-esis of L-lysine represented a functional pathway that enriched inhealthy controls but downregulated in IBS patients, and it wasreported to act as a partial serotonin receptor 4 antagonist andinhibit serotonin-mediated intestinal pathologies and anxiety [39].Moreover, tea drinking was observed to be associated with fecal
microbiota and metabolites in IBS, which is consistent with aprevious study that tea could have an effect on gut microbiota[40]. However, more detailed relationship between tea drinkingand IBS still needs further research. In contrast to fecalmicrobiome and metabolome, serum metabolites demonstratedclearly separation of IBS patients from healthy controls. Weobserved the serum metabolite THDOC was enriched in healthycontrols and depleted in IBS, and identified negative correlationbetween serum level of THDOC with SDS in IBS. This phenomenonis similar to a previous study that reported reduced serumconcentration of THDOC in women during menstruation epilepsywith depression [41], suggesting the metabolite may be involvedin the interaction between depression and IBS. In addition, ourdata revealed that nearly 50% of the serum metabolites exhibitsignificant changes even when adjusting for the linear influence ofdietary habits, and these data might provide important implica-tions for IBS diagnosis. It is worth noting that we tested theinfluence of dietary habits using a linear model. We cannot ruleout non-linear influences as the interactions between diet andserum metabolome are complicated and not well understood yet.According to the results, there are certain associations between
metabolic dysregulation and IBS pathogenesis. For example,guanine represented the most abundant metabolite in IBSpatients. It was proposed that guanine is involved in a specificguanine-based purinergic system which is able to affect thedevelopment and structure of neural cells in central nervoussystem and correlated with memory and anxiety [42]. The largestIBS-enriched serum metabolite cluster included three fatty acyl-CoAs (tetradecanoyl-CoA, myristoleoyl-CoA, and lauroyl-CoA),suggesting the dysregulation of fatty acid profile may involve inIBS and depression [16, 43]. Chua et al. showed omega-3
Fig. 6 Predicting depression status of IBS patients from multi-omics features. a Receiver operating characteristic curve (ROC) of the RFmodel using gut microbiota profiles to classify IBS patients from healthy controls in discovery and validation cohorts. b ROC of the RF modelusing the fecal metabolomic profiles to classify IBS patients from healthy controls in discovery and validation cohorts. c ROC of the RF modelusing serum metabolome data to classified IBS patients from healthy controls in discovery and validation cohorts. d−f ROC of the RF modelusing gut microbiota, fecal metabolomic, and serum metabolomic data, respectively, to train and predict depression status of IBS patients.AUC value is presented in the format of 95% confident interval. For serum and fecal metabolomic data, only the possibility distributionsderived from untargeted positive ion mode are presented.
L. Han et al.
993
The ISME Journal (2022) 16:983 – 996

polyunsaturated fatty acids deficiency in IBS which was ascribedto substantial effects on the nervous systems. Clarke et al. [44]suggested omega-3 supplementation may be a putative treat-ment for IBS. Previously, a population-based cross-sectional studyin IBS had found it was positively correlated to metabolicsyndrome [45], reinforcing the metabolic dysregulation in IBS. Inaddition, we found gut microbiota species associated withdihydropteroic acid, which is an intermediate product for folicacid. As 11 out of 33 differentially abundant species are associatedwith dihydropteroic acid, there is a possibility that IBS-featuringmicrobiome could affect disease by modulating the metabolism offolic acid. However, it is only an inference based on data analyzing,and not yet measured in cohort study. Further studies are neededto confirm the potential relationship and biological mechanismbetween these species, folic acid, and the pathogenesis of IBS.Our results suggested a correlation between TRP/serotonin
metabolism and IBS depression comorbidity. The irregularity ofTRP in serum was noticed in IBS-D [46], but its role in IBS-relevantdepression and associated gut microbiome alterations remainselusive. We identified certain gut bacteria strains such asClostridium nexile and Roseburia inulinivorans enriched in IBSpatients with depression, and associated with neuroactive TRPmetabolites alterations in serum. Clostridium nexile could produceneurotransmitter tryptamine, and some other Clostridium species,such as C. diffcile, have been reported to increase in patients withmajor depressive disorder [47, 48]. Functional analysis indicatedthe abundance of L-tryptophan pathway was elevated along withthe severity of depression. We also noticed that there are someother elevated compounds in the depression group comparedwith healthy controls, including kynurenine (KYN), tryptamine, andhistamine. Although more than 90% of the body’s serotonin isproduced in the gut by enterochromaffin cells under the influenceof the gut microbiota, peripheral serotonin does not cross theblood-brain barrier under physiological conditions. The neuro-transmitter serotonin is produced locally in the brain through theenzyme TRP hydroxylase 2 (TpH2). However, it is worth noting thatcertain gut bacteria strains can directly regulate TRP utilizationconsequently changing its availability to the host, impactingserotonin levels not only in the periphery but also in the brain. It iswidely accepted that there are three major TRP metabolismpathways in the gut, leading to serotonin, KYN, and indolederivatives, respectively. In the case of KYN-producing pathwayoveractivation, TRP is massively diverted to KYN production,causing a deficiency in brain TRP and in neurotransmitterserotonin production, subsequently leading to depression. Exten-sive KYN across the blood-brain barrier is also considered criticalto central nervous system disorders. Such cases have beenreported in several diseases. For example, in a study regardingdepression in obesity [49], the authors reported a conditioncharacterized by chronic inflammation and KYN activation thatcontributed to depression. In a study of autistic children [50], itdemonstrated abnormal TRP characterized by preferential trans-formation from TRP to kynurenic acid. Our finding that KYN waselevated in the depression group compared with healthy controlsfurther supports the overactivation of KYN-producing pathway,suggesting that gut microbiota may indirectly affect centralserotoninergic pathways by modulating TRP availability.We acknowledged some limitations here in this study. Firstly,
we did not set a strategy of matching patient number amongsubtypes of IBS when doing subject recruitment. Analytical resultsdisplayed a certain bias due to the vast predominance of IBS-D inthe discovery cohort, thus impaired the possibility to identifysubtype-specific microbiome and metabolome characteristics,especially for IBS-M and IBS-U. A more balanced sample sizeamong subtypes is needed for subtype-specific feature identifica-tion. Secondly, most differentially abundant species identified inthe discovery cohort only trended in the same direction but did
not achieve significance in the validation cohort. Considering thatgut microbiota is affected by multiple factors, and that both thediscovery and validation cohort represented combinations ofdifferent IBS subtypes and included high heterogeneity, thedifferent fecal traits during diarrhea and constipation wouldprobably affect the robustness of IBS related microbiota featuresand impair their application in disease classification. In compar-ison, serum metabolome showed more stable IBS specificcharacteristics in both the discovery and validation cohort, thushave great power to discriminate IBS patients from healthycontrols. Larger cohort would help to better characterize thecomplicated gut microbiome alterations. Thirdly, our resultssuggested a correlation between TRP/serotonin metabolism andIBS depression comorbidity. We proposed a hypothesis that gutmicrobiota of IBS patients with depression might favor TRP/serotonin metabolism along the KYN-producing pathway thusaffecting the TRP availability and serotonin levels in the brain.However, this is only an inference based on literature. Consideringthat the TRP/serotonin mediated gut-brain cross-talk is complexand remains poorly understood, extensive investigations based onin vitro and in vivo models are needed to uncover the exactmechanism.Finally, IBS is a collection of gastrointestinal syndromes with no
clear pathogenesis observed in certain organs. The partiallyunderstood pathophysiology, and consequently the absence ofuniversally accepted biomarkers, severely limited efficient diag-nosis and therapeutic approaches. Our multi-omics study revealedIBS specific serum/fecal metabolome alterations and their relation-ship with gut microbiome, highlighted the massive alterations ofserum metabolites which empower to recognize IBS patients,suggested potential roles of metabolic dysregulation of fatty acidsand folic acid in IBS pathogenesis, and offered new clues tounderstand IBS depression comorbidity. Our study provided avaluable resource for future studies to understand host-gutmicrobiota relationships in IBS, and would facilitate potentialclinical applications of IBS featured microbiota and (or)metabolites.
DATA AVAILABILITYFecal metagenomic sequencing reads can be downloaded from CNGB NucleotideSequence Archive under accession number CNP0000334. Serum and fecalmetabolome datasets are available at the MetaboLights database under accessionnumber MTBLS2774. Other supporting data can be found in supplementarymaterials.
REFERENCES1. Lovell RM, Ford AC. Global prevalence of and risk factors for irritable bowel
syndrome: a meta-analysis. Clin Gastroenterol Hepatol. 2012;10:712–21 e4.2. Zamani M, Alizadeh-Tabari S, Zamani V. Systematic review with meta-analysis: the
prevalence of anxiety and depression in patients with irritable bowel syndrome.Aliment Pharm Ther. 2019;50:132–43.
3. Pittayanon R, Lau JT, Yuan Y, Leontiadis GI, Tse F, Surette M, et al. Gut microbiotain patients with Irritable Bowel Syndrome—a systematic review. Gastro-enterology 2019;157:97–108.
4. Rodino-Janeiro BK, Vicario M, Alonso-Cotoner C, Pascua-Garcia R, Santos J. Areview of microbiota and Irritable Bowel Syndrome: future in therapies. Adv Ther.2018;35:289–310.
5. Tap J, Derrien M, Tornblom H, Brazeilles R, Cools-Portier S, Dore J, et al. Identi-fication of an intestinal microbiota signature associated with severity of IrritableBowel Syndrome. Gastroenterology 2017;152:111–23 e8.
6. Vich Vila A, Imhann F, Collij V, Jankipersadsing SA, Gurry T, Mujagic Z, et al. Gutmicrobiota composition and functional changes in inflammatory bowel diseaseand irritable bowel syndrome. Sci Transl Med. 2018;10:eaap891.
7. Jeffery IB, Das A, O’Herlihy E, Coughlan S, Cisek K, Moore M, et al. Differences infecal microbiomes and metabolomes of people with vs without Irritable BowelSyndrome and bile acid malabsorption. Gastroenterology 2020;158:1016–28.e8.
8. Hugerth LW, Andreasson A, Talley NJ. No distinct microbiome signature of irritablebowel syndrome found in a Swedish random population. Gut 2020;69:1076–84.
L. Han et al.
994
The ISME Journal (2022) 16:983 – 996

9. Undseth R, Jakobsdottir G, Nyman M, Berstad A, Valeur J. Low serum levels ofshort-chain fatty acids after lactulose ingestion may indicate impaired colonicfermentation in patients with irritable bowel syndrome. Clin Exp Gastroenterol.2015;8:303–8.
10. Guilloteau P, Martin L, Eeckhaut V, Ducatelle R, Zabielski R, Van Immerseel F. Fromthe gut to the peripheral tissues: the multiple effects of butyrate. Nutr Res Rev.2010;23:366–84.
11. Zhao L, Yang W, Chen Y, Huang F, Lu L, Lin C, et al. A Clostridia-rich microbiotaenhances bile acid excretion in diarrhea-predominant irritable bowel syndrome. JClin Invest. 2020;130:438–50.
12. Lacy BE, Mearin F, Chang L, Chey WD, Lembo AJ, Simren M, et al. Bowel disorders.Gastroenterology 2016;150:1393–407.e5.
13. Lacy BE, Patel NK. Rome criteria and a diagnostic approach to Irritable BowelSyndrome. J Clin Med. 2017;6:99.
14. Dunstan DA, Scott N. Clarification of the cut-off score for Zung’s self-ratingdepression scale. BMC Psychiatry. 2019;19:177.
15. Zimmerman M, Martinez JH, Young D, Chelminski I, Dalrymple K. Severity clas-sification on the Hamilton Depression Rating Scale. J Affect Disord.2013;150:384–8.
16. Chua CS, Huang SY, Cheng CW, Bai CH, Hsu CY, Chiu HW, et al. Fatty acidcomponents in Asian female patients with irritable bowel syndrome. Medicine.2017;96:e9094.
17. Lin CY, Zhao L, Huang T, Lu L, Khan M, Liu J, et al. Spexin acts as novel regulatorfor bile acid synthesis. Front Physiol. 2018;9:378.
18. Boughton BA, Callahan DL, Silva C, Bowne J, Nahid A, Rupasinghe T, et al.Comprehensive profiling and quantitation of amine group containing metabo-lites. Anal Chem. 2011;83:7523–30.
19. Zoetendal EG, Heilig HG, Klaassens ES, Booijink CC, Kleerebezem M, Smidt H, et al.Isolation of DNA from bacterial samples of the human gastrointestinal tract. NatProtoc. 2006;1:870–3.
20. Chen Y, Chen Y, Shi C, Huang Z, Zhang Y, Li S, et al. SOAPnuke: a MapReduceacceleration-supported software for integrated quality control and preprocessingof high-throughput sequencing data. Gigascience 2018;7:1–6.
21. Li R, Yu C, Li Y, Lam TW, Yiu SM, Kristiansen K, et al. SOAP2: an improved ultrafasttool for short read alignment. Bioinformatics 2009;25:1966–7.
22. Truong DT, Franzosa EA, Tickle TL, Scholz M, Weingart G, Pasolli E, et al.MetaPhlAn2 for enhanced metagenomic taxonomic profiling. Nat Methods.2015;12:902–3.
23. Franzosa EA, McIver LJ, Rahnavard G, Thompson LR, Schirmer M, Weingart G,et al. Species-level functional profiling of metagenomes and metatranscriptomes.Nat Methods. 2018;15:962–8.
24. Segata N, Izard J, Waldron L, Gevers D, Miropolsky L, Garrett WS, et al. Metage-nomic biomarker discovery and explanation. Genome Biol. 2011;12:R60.
25. Franzosa EA, Sirota-Madi A, Avila-Pacheco J, Fornelos N, Haiser HJ, Reinker S, et al.Gut microbiome structure and metabolic activity in inflammatory bowel disease.Nat Microbiol. 2019;4:293–305.
26. Qin N, Yang F, Li A, Prifti E, Chen Y, Shao L, et al. Alterations of the human gutmicrobiome in liver cirrhosis. Nature 2014;513:59–64.
27. Yu J, Feng Q, Wong SH, Zhang D, Liang QY, Qin Y, et al. Metagenomic analysis offaecal microbiome as a tool towards targeted non-invasive biomarkers for col-orectal cancer. Gut 2017;66:70–8.
28. Qin J, Li Y, Cai Z, Li S, Zhu J, Zhang F, et al. A metagenome-wide association studyof gut microbiota in type 2 diabetes. Nature 2012;490:55–60.
29. Pasolli E, Schiffer L, Manghi P, Renson A, Obenchain V, Truong DT, et al. Acces-sible, curated metagenomic data through ExperimentHub. Nat Methods.2017;14:1023–4.
30. Wong BS, Camilleri M, Carlson P, McKinzie S, Busciglio I, Bondar O, et al. Increasedbile acid biosynthesis is associated with irritable bowel syndrome with diarrhea.Clin Gastroenterol Hepatol. 2012;10:1009–15.e3.
31. Vijayvargiya P, Busciglio I, Burton D, Donato L, Lueke A, Camilleri M. Bile aciddeficiency in a subgroup of patients with Irritable Bowel Syndrome with con-stipation based on biomarkers in serum and fecal samples. Clin GastroenterolHepatol. 2018;16:522–7.
32. Wahlström A, Sayin SI, Marschall HU, Bäckhed F. Intestinal crosstalk between bileacids and microbiota and its impact on host metabolism. Cell Metab.2016;24:41–50.
33. Wetzel CH, Vedder H, Holsboer F, Zieglgansberger W, Deisz RA. Bidirectionaleffects of the neuroactive steroid tetrahydrodeoxycorticosterone on GABA-activated Cl- currents in cultured rat hypothalamic neurons. Br J Pharm.1999;127:863–8.
34. Merrill AH Jr., Henderson JM. Vitamin B6 metabolism by human liver. Ann N. YAcad Sci. 1990;585:110–7.
35. Smith RL, Canton H, Barrett RJ, Sanders-Bush E. Agonist properties of N,N-dimethyltryptamine at serotonin 5-HT2A and 5-HT2C receptors. Pharm BiochemBehav. 1998;61:323–30.
36. Szabo A, Billett E, Turner J. Phenylethylamine, a possible link to the anti-depressant effects of exercise? Br J Sports Med. 2001;35:342–3.
37. Peter J, Fournier C, Durdevic M, Knoblich L, Keip B, Dejaco C, et al. A microbialsignature of psychological distress in irritable bowel syndrome. Psychosom Med.2018;80:698–709.
38. Farzaei MH, Bahramsoltani R, Abdollahi M, Rahimi R. The role of visceral hyper-sensitivity in Irritable Bowel Syndrome: pharmacological targets and noveltreatments. J Neurogastroenterol Motil. 2016;22:558–74.
39. Smriga M, Torii K. L-Lysine acts like a partial serotonin receptor 4 antagonist andinhibits serotonin-mediated intestinal pathologies and anxiety in rats. Proc NatlAcad Sci USA. 2003;100:15370–5.
40. Huang F, Zheng X, Ma X, Jiang R, Zhou W, Zhou S, et al. Theabrownin from Pu-erhtea attenuates hypercholesterolemia via modulation of gut microbiota and bileacid metabolism. Nat Commun. 2019;10:4971.
41. Tuveri A, Paoletti AM, Orru M, Melis GB, Marotto MF, Zedda P, et al. Reducedserum level of THDOC, an anticonvulsant steroid, in women with perimenstrualcatamenial epilepsy. Epilepsia 2008;49:1221–9.
42. Schmidt AP, Lara DR, Souza DO. Proposal of a guanine-based purinergic systemin the mammalian central nervous system. Pharm Ther. 2007;116:401–16.
43. Mamalakis G, Tornaritis M, Kafatos A. Depression and adipose essential poly-unsaturated fatty acids. Prostaglandins Leukot Ess Fat Acids. 2002;67:311–8.
44. Clarke G, Fitzgerald P, Hennessy AA, Cassidy EM, Quigley EM, Ross P, et al. Markedelevations in pro-inflammatory polyunsaturated fatty acid metabolites in femaleswith irritable bowel syndrome. J Lipid Res. 2010;51:1186–92.
45. Guo Y, Niu K, Momma H, Kobayashi Y, Chujo M, Otomo A, et al. Irritable bowelsyndrome is positively related to metabolic syndrome: a population-based cross-sectional study. PLoS One. 2014;9:e112289.
46. Christmas DM, Badawy AA, Hince D, Davies SJ, Probert C, Creed T, et al. Increasedserum free tryptophan in patients with diarrhea-predominant irritable bowelsyndrome. Nutr Res. 2010;30:678–88.
47. Williams BB, Van Benschoten AH, Cimermancic P, Donia MS, Zimmermann M,Taketani M, et al. Discovery and characterization of gut microbiota decarbox-ylases that can produce the neurotransmitter tryptamine. Cell Host Microbe.2014;16:495–503.
48. Rogers MA, Greene MT, Young VB, Saint S, Langa KM, Kao JY, et al. Depression,antidepressant medications, and risk of Clostridium difficile infection. BMC Med.2013;11:121.
49. Chaves Filho AJM, Lima CNC, Vasconcelos SMM, de Lucena DF, Maes M, MacedoD. IDO chronic immune activation and tryptophan metabolic pathway: apotential pathophysiological link between depression and obesity. Prog Neu-ropsychopharmacol Biol Psychiatry. 2018;80:234–49.
50. Gevi F, Zolla L, Gabriele S, Persico AM. Urinary metabolomics of young Italianautistic children supports abnormal tryptophan and purine metabolism. MolAutism. 2016;7:47.
ACKNOWLEDGEMENTSThis study was supported by the Science Technology and Innovation Commission ofShenzhen Municipality, China (SGDX20190919142801722), the Project of State KeyLaboratory of Dampness Syndrome of Chinese Medicine, Science Technology andInnovation Committee of Shenzhen Municipality under grant No.JCYJ20160331190123578, and the Innovation and Technology Fund, Hong KongSAR (ITS-148-14FP). We also thank the support from China Postdoctoral ScienceFoundation (No. 2017M622793).
AUTHOR CONTRIBUTIONSLJH, YZ, CY, TX, WL, YC, QWQ, XXS, ZCM, and YSD analyzed the data; LJH, LZ, CY, TX,LH, SGH, SPH, and ZL interpreted the data; LZ, LL, WY, CYL, TH, LXZ, and ZWNcollected samples and conducted the experiments; CWC, LLZ, and ZXB recruitedpatients; LJH, CY, TX, ZCM and YZ wrote the paper. LJH, LZ, SCL, ZXB, and XDF revisedthe paper. XDF designed and supervised the project. All authors reviewed andapproved its final version.
COMPETING INTERESTSThe authors declare no competing interests.
ETHICS APPROVAL AND CONSENT TO PARTICIPATEThis study was approved by the Ethics Committee on the Use of Human & AnimalSubjects in Teaching & Research (Approval no. HASC/15-16/0300 and HASC/16-17/0027). Written informed consent was obtained from each participant prior to samplecollection.
L. Han et al.
995
The ISME Journal (2022) 16:983 – 996

ADDITIONAL INFORMATIONSupplementary information The online version contains supplementary materialavailable at https://doi.org/10.1038/s41396-021-01123-5.
Correspondence and requests for materials should be addressed to Shuaicheng Li,Zhaoxiang Bian or Xiaodong Fang.
Reprints and permission information is available at http://www.nature.com/reprints
Publisher’s note Springer Nature remains neutral with regard to jurisdictional claimsin published maps and institutional affiliations.
Open Access This article is licensed under a Creative CommonsAttribution 4.0 International License, which permits use, sharing,
adaptation, distribution and reproduction in anymedium or format, as long as you giveappropriate credit to the original author(s) and the source, provide a link to the CreativeCommons license, and indicate if changes were made. The images or other third partymaterial in this article are included in the article’s Creative Commons license, unlessindicated otherwise in a credit line to the material. If material is not included in thearticle’s Creative Commons license and your intended use is not permitted by statutoryregulation or exceeds the permitted use, you will need to obtain permission directlyfrom the copyright holder. To view a copy of this license, visit http://creativecommons.org/licenses/by/4.0/.
© The Author(s) 2021
L. Han et al.
996
The ISME Journal (2022) 16:983 – 996