Microbiome and Metabolome Features of the Cardiometabolic ...
75
NMED-A111916 1 CLEAN Main TEXT on January 6, 2022 1 Microbiome and Metabolome Features of the Cardiometabolic Disease 2 Spectrum 3 4 Authors: 5 Sebastien Fromentin 1,* , Sofia K. Forslund 2,3,4,5,6,* , Kanta Chechi 7,8,34* , Judith Aron- 6 Wisnewsky 9,10,* , Rima Chakaroun 11,* , Trine Nielsen 12,* , Valentina Tremaroli 13 , Boyang Ji 14 , Edi 7 Prifti 15,16 , Antonis Myridakis 7 , Julien Chilloux 7 , Andrikopoulos Petros 7,34 , Yong Fan 12 , Michael 8 T. Olanipekun 7 , Renato Alves 2 , Solia Adiouch 9 , Noam Bar 18,19 , Yeela Talmor-Barkan 18,19,20,21 , 9 Eugeni Belda 9,15,16 , Robert Caesar 13 , Luis Pedro Coelho 2 , Gwen Falony 22,23 , Soraya Fellahi 24 , 10 Pilar Galan 1 , Nathalie Galleron 1 , Gerard Helft 25 , Lesley Hoyles 7,26 , Richard Isnard 25 , 11 Emmanuelle Le Chatelier 1 , Hanna Julienne 1 , Lisa Olsson 13 , Helle Krogh Pedersen 12 , Nicolas 12 Pons 1 , Benoit Quinquis 1 , Christine Rouault 9 , Hugo Roume 1 , Joe-Elie Salem 27 , Thomas SB 13 Schmidt 2 , Sara Vieira-Silva 22,23 , Peishun Li 14 , Maria Zimmermann-Kogadeeva 2 , Christian 14 Lewinter 28 , Nadja B Søndertoft 12 , Tue H Hansen 12 , Dominique Gauguier 29 , Jens Peter Gøtze 30 , 15 Lars Køber 28 , Ran Kornowski 20 , Henrik Vestergaard 12,31 , Torben Hansen 12 , Jean-Daniel 16 Zucker 15,17 , Serge Hercberg 32 , Ivica Letunic 33 , Fredrik Bäckhed 12,13 , Jean-Michel Oppert 10 , Jens 17 Nielsen 14 , Jeroen Raes 22,23 , Peer Bork 2 , Michael Stumvoll 11 , Eran Segal 18,19 , Karine Clément 9,10,+ , 18 Marc-Emmanuel Dumas 7,34,35,+ , S. Dusko Ehrlich 1,+ , and Oluf Pedersen 12,+ 19 20 21
-
Upload
khangminh22 -
Category
Documents
-
view
1 -
download
0
Transcript of Microbiome and Metabolome Features of the Cardiometabolic ...

NMED-A111916
1
CLEAN Main TEXT on January 6, 2022 1
Microbiome and Metabolome Features of the Cardiometabolic Disease 2
Spectrum 3
4
Authors: 5
Sebastien Fromentin1,*, Sofia K. Forslund2,3,4,5,6,*, Kanta Chechi7,8,34*, Judith Aron-6
Wisnewsky9,10,*, Rima Chakaroun11,*, Trine Nielsen12,*, Valentina Tremaroli13, Boyang Ji14, Edi 7
Prifti15,16, Antonis Myridakis7, Julien Chilloux7, Andrikopoulos Petros7,34, Yong Fan12 , Michael 8
T. Olanipekun7, Renato Alves2, Solia Adiouch9, Noam Bar18,19, Yeela Talmor-Barkan18,19,20,21, 9
Eugeni Belda9,15,16, Robert Caesar13, Luis Pedro Coelho2, Gwen Falony22,23, Soraya Fellahi24, 10
Pilar Galan1, Nathalie Galleron1, Gerard Helft25, Lesley Hoyles7,26, Richard Isnard25, 11
Emmanuelle Le Chatelier1, Hanna Julienne1, Lisa Olsson13, Helle Krogh Pedersen12, Nicolas 12
Pons1, Benoit Quinquis1, Christine Rouault9, Hugo Roume1, Joe-Elie Salem27, Thomas SB 13
Schmidt2, Sara Vieira-Silva22,23, Peishun Li14, Maria Zimmermann-Kogadeeva2, Christian 14
Lewinter28, Nadja B Søndertoft12, Tue H Hansen12, Dominique Gauguier29, Jens Peter Gøtze30, 15
Lars Køber28, Ran Kornowski20, Henrik Vestergaard12,31, Torben Hansen12, Jean-Daniel 16
Zucker15,17, Serge Hercberg32, Ivica Letunic33, Fredrik Bäckhed12,13, Jean-Michel Oppert10, Jens 17
Nielsen14, Jeroen Raes22,23, Peer Bork2, Michael Stumvoll11, Eran Segal18,19, Karine Clément9,10,+, 18
Marc-Emmanuel Dumas7,34,35,+, S. Dusko Ehrlich1,+, and Oluf Pedersen12,+ 19
20
21

NMED-A111916
2
* Contributed equally 22
+ Corresponding authors 23
24
1 MetaGenoPolis, INRAe, AgroParisTech, Université Paris-Saclay, Paris, France 25
2 Structural and Computational Biology, European Molecular Biology Laboratory, Heidelberg, 26
Germany 27
3 Experimental and Clinical Research Center, a cooperation of Charité-Universitätsmedizin and 28
the Max-Delbrück Center, Berlin, Germany 29
4 Max Delbrück Center for Molecular Medicine (MDC), Berlin, Germany 30
5 Charité University Hospital, Berlin, Germany 31
6 DZHK (German Centre for Cardiovascular Research), partner site Berlin. 32
7 Division of Systems Medicine, Department of Metabolism, Digestion and Reproduction, 33
Faculty of Medicine, Imperial College London, Sir Alexander Fleming building, London SW7 34
2AZ, UK. 35
8 School of Public Health, Faculty of Medicine, Imperial College London, Medical School 36
Building, St Mary's Hospital, Norfolk Place, London W2 1PG, UK. 37
9 Sorbonne Université, INSERM, Nutrition and obesities; systemic approaches (NutriOmics), 38
Paris, France 39
10 Assistance Publique Hôpitaux de Paris, Pitié-Salpêtrière Hospital, Nutrition department, Paris, 40
France 41
11 Medical Department III - Endocrinology, Nephrology, Rheumatology, University of Leipzig 42
Medical Center, Leipzig, Germany 43

NMED-A111916
3
12 Novo Nordisk Foundation Center for Basic Metabolic Research, Faculty of Health and 44
Medical Sciences, University of Copenhagen, Copenhagen, Denmark 45
13 The Wallenberg Laboratory, Department of Molecular and Clinical Medicine, Institute of Medicine, 46
Sahlgrenska Academy, University of Gothenburg, Gothenburg, Sweden 47
14 Department of Biology and Biological Engineering, Chalmers University of Technology, 48
Gothenburg, Sweden 49
15 Institute of Cardiometabolism and Nutrition, Integromics unit, Paris, Franc 50
16 Integrative Phenomics, Paris, France 51
17 Unité de modélisation mathématique et informatique des systèmes complexes, UMMISCO, F-52
93143, Bondy, France 53
18 Department of Computer Science and Applied Mathematics, Weizmann Institute of Science, 54
Rehovot 7610001, Israel 55
19 Department of Molecular Cell Biology, Weizmann Institute of Science, Rehovot 7610001, 56
Israel 57
20 Department of Cardiology, Rabin Medical Center, Petah Tikva, Israel 58
21 Sackler Faculty of Medicine, Tel-Aviv University, Tel-Aviv, Israel 59
22 Laboratory of Molecular Bacteriology, Department of Microbiology and Immunology, Rega 60
Institute, KU Leuven, Leuven, Belgium 61
23 Center for Microbiology, VIB, Leuven, Belgium 62
24 Assistance Publique-Hôpitaux de Paris, Hôpitaux Universitaires Henri Mondor, Département 63
de biochimie-pharmacologie-biologie moléculaire-génétique médicale, Créteil, France 64
NMED-A111916
4
25 Assistance Publique Hôpitaux de Paris, Pitié-Salpêtrière Hospital, Cardiology department, 65
Paris France 66
26 Nottingham Trent University, Department of Bioscience, School of Science and Technology, 67
Clifton, Nottingham, UK 68
27 AP-HP, Pitié-Salpêtrière Hospital, Department of Pharmacology, UNICO Cardio-oncology 69
Program, CIC-1421; INSERM, Sorbonne Université, F-75013 Paris, France 70
28 Department of Cardiology, Rigshospitalet, University of Copenhagen, Copenhagen, Denmark 71
29 Université de Paris, INSERM UMR 1124, 75006 Paris, France. 72
30 Department of Clinical Biochemetry, Rigshopitalet, University of Copenhagen, Copenhagen, 73
Denmark 74
31 Department of Medicine, Bornholms Hospital, Rønne, Denmark 75
32 Sorbonne Paris Cité Epidemiology and Statistics Research Centre (CRESS), U1153 Inserm, 76
U1125, Inra, Cnam, University of Paris 13, Nutritional Epidemiology Research Team (EREN), 77
93017, Bobigny, France 78
33 Biobyte solutions GmbH, Bothestr 142, 69126 Heidelberg, Germany 79
34 Genomic and Environmental Medicine, National Heart and Lung Institute, Faculty of 80
Medicine, Imperial College London, Guy Scadding building, London SW3 6LY, UK 81
35 European Genomics Institute for Diabetes, UMR1283/8199 INSERM, CNRS, Institut Pasteur 82
de Lille, Lille University Hospital, University of Lille, 1 place de Verdun 59045, Lille, France 83
84
Corresponding authors 85
NMED-A111916
5
Oluf Pedersen, Novo Nordisk Foundation Center for Basic Metabolic Research, Faculty of 86
Health and Medical Sciences, University of Copenhagen, Blegdamsvej 3B, 2200 Copenhagen, 87
Denmark. 88
Email: [email protected] 89
S. Dusko Ehrlich, Metagenopolis, INRAE, 78350 Jouy-en-Josas, France. 90
Email: [email protected] 91
Marc-Emmanuel Dumas, Imperial College London, Division of Systems Medicine, Department 92
of Metabolism, Digestion and Reproduction, Faculty of Medicine, Sir Alexander Fleming 93
building, London SW7 2AZ, UK; Genomic and Environmental Medicine, National Heart and 94
Lung Institute, Faculty of Medicine, Guy Scadding building, London SW7 2AZ, UK; European 95
Genomics Institute for Diabetes, UMR1283/8199 INSERM, CNRS, Institut Pasteur de Lille, 96
Lille University Hospital, University of Lille, 1 place de Verdun 59045, Lille, France. 97
Email: [email protected] 98
Karine Clément, Sorbonne University, Inserm, NutriOmics, Faculty of Medicine Paris, 91 99
Boulevard de l’Hôpital, Paris, France. 100
Email: [email protected] 101
102

NMED-A111916
6
Abstract 103
Previous microbiome and metabolome analyses exploring non-communicable diseases have paid 104
scant attention to major confounders of study outcomes, such as common, pre-and co-morbid 105
conditions or polypharmacy. Here in the context of ischemic heart disease (IHD), we used a 106
study design that recapitulates disease initiation, escalation and response to treatment over time, 107
mirroring a longitudinal study that would otherwise be difficult to perform given the protracted 108
nature of IHD pathogenesis. We recruited 1,241 middle-aged Europeans including healthy 109
individuals, individuals with dysmetabolic morbidities (obesity and type 2 diabetes) but lacking 110
overt IHD diagnosis, and IHD cases at three distinct clinical stages; acute coronary syndrome, 111
chronic IHD and IHD with heart failure, and characterized their phenome, gut metagenome and 112
serum and urine metabolome. We found that about 75% of microbiome and metabolome features 113
that distinguish IHD cases from healthy individuals after adjustment for effects of medication 114
and lifestyle are present in individuals exhibiting dysmetabolism, suggesting that major 115
alterations of the gut microbiome and metabolome may begin long before clinical onset of IHD. 116
We further categorized microbiome and metabolome signatures related to prodromal 117
dysmetabolism, specific to IHD in general or to each of its three subtypes, or related to escalation 118
or de-escalation of IHD. Discriminant analysis based on specific IHD microbiome and 119
metabolome features could better differentiate IHD cases from healthy individuals or 120
metabolically-matched individuals as compared to the conventional risk markers, pointing to a 121
pathophysiological relevance of these features. 122
123
124
125

NMED-A111916
7
Introduction 126
Epidemiological and genetic studies in humans and experimental studies in animals have shown 127
that the pathogenesis of most common chronic non-communicable diseases involves a complex 128
interplay between polygenic susceptibility, aging, sex and a multitude of environmental 129
exposures1. Intriguingly, the environmental components like diet, physical activity and smoking 130
may exert some of their pathogenic impact via modification of the intestinal microbiome2. 131
Therefore, a first logical step in exploring a role of the intestinal microbiome as a putative 132
chronic disease co-trigger appears to be conduction of studies integrating epidemiology and 133
various –omics analyses. However, for the reliability of such study outcomes and for the 134
planning of subsequent clinical interventions and mechanistic experiments, disease-specific 135
microbiome and linked metabolome features need to be separated from confounders introduced 136
by pre- and co-morbidities3-5 and by multifactorial treatment6. Commonly prescribed drugs, for 137
example, widely influence the gut microbiome and host metabolome7, and can confuse for or 138
even mask genuine disease signatures7,8. Accordingly, a recent report argues for extensive 139
adjustments for confounders that influence human gut microbiome to avoid spurious associations 140
and to identify genuine disease-specific variance9. 141
The present microbiome and metabolome study is focused on ischemic heart disease (IHD), a 142
leading cause of mortality worldwide10. Previous reports comparing microbiome and 143
metabolome markers of IHD cases and controls usually failed to adjust for the massive 144
confounding by polypharmacy8 and the impact of metabolic abnormalities occurring during a 145
long prodromal phase prior to diagnosis of IHD11-13. Such common metabolic dysfunctions 146
include overweight and obesity3,5, type 2 diabetes (T2D)4, hypertension14 and dyslipidaemia15 147

NMED-A111916
8
(collectively termed ―dysmetabolism‖ in the present study), all of which have been shown to 148
exhibit both shared and disease-specific aberrations in microbiome and metabolome profiles. 149
Individuals with the metabolic syndrome or overt T2D have vastly increased risk of IHD16, and 150
asymptomatic T2D is often coincidentally found at IHD diagnosis17, highlighting these pre-151
morbidities to be a clinically relevant baseline for studying overt IHD. Most studies to date have 152
overlooked this aspect by either comparing IHD cases with healthy lean individuals11 or not 153
focusing on IHD per se but on various forms of atherosclerotic organ damage12,13,18. Segregating 154
IHD-specific changes in gut microbial and metabolomic features from such potential 155
confounders, thus, remains an utmost priority. 156
In the MetaCardis consortium we designed the present cross-sectional study including healthy 157
individuals, individuals with dysmetabolic morbidities and individuals with IHD at three distinct 158
clinical stages capturing a wide spectrum of gut microbiome and plasma and urine metabolome 159
signatures for cardiometabolic diseases (CMD). With our approach for integrative analysis of the 160
–omics data we adjust for confounding by polypharmacy and the impact of metabolic 161
abnormalities occurring during the prodromal phase prior to diagnosis of IHD. Further, we 162
categorize microbiome and metabolome pathophysiological signatures related to dysmetabolism 163
or to escalation, de-escalation or stabilization of IHD and its subtypes. 164
165
Results 166
Study design, in-depth phenotyping and multi-omics profiling. The study encompassed 372 167
IHD cases including 112 with acute coronary syndrome (ACS), 158 with chronic ischemic heart 168
disease (CIHD) and 102 with ischemic heart disease and heart failure (HF). In addition, we 169

NMED-A111916
9
included 275 healthy controls (HC) matched on demographics, age and sex, and 222 untreated 170
metabolically matched controls (UMMC); i.e. individuals with features of the metabolic 171
syndrome and thus at increased risk of IHD but receiving no lipid-lowering or anti-diabetic or 172
anti-hypertensive drugs. Finally, we included 372 controls matched with IHD cases on T2D 173
status and body mass index (BMI), thereafter termed metabolically matched controls (MMC) 174
(Figure 1). We profiled their serum and urine metabolome (1,558 metabolites and lipids), and 175
examined their intestinal microbiome considering inter-individual variations in absolute fecal 176
bacterial cell density, a factor potentially reflecting both the disease state and obscuring genuine 177
microbiome involvement19. Inclusion of MMC and UMMC groups allowed for the 178
differentiation of the gut microbial and metabolomic signatures of IHD from the often-179
accompanied metabolic dysfunctions and related drug intake. 180
As expected from inclusion criteria, we found increasing CMD phenotype severity and related 181
drug intake along the implied progression from healthy controls (HC) through treated and 182
untreated metabolically matched controls (MMC and UMMC, respectively) to overt IHD cases 183
(Extended Data Figure 1, and Supplementary Tables 1-3). Despite matching for country, age, 184
sex, body mass index (BMI) and T2D status, cases with IHD remained phenotypically distinct 185
from MMC. They displayed increased visceral fat (p = 0.048), worse glycaemia (HbA1c; p = 186
0.005 and fasting plasma glucose; p = 0.006), higher plasma concentration of liver enzymes 187
(ASAT, ALAT, GCT; p < 0.001) and increased prevalence and severity of hypertension (p < 188
0.001) (Supplementary Tables 1-2). Similarly, IHD cases had decreased heart contractility 189
mirrored in reduced left ventricular ejection fraction (LVEF) and increased plasma pro-atrial 190
natriuretic peptide (pro-ANP) levels relative to both HC and MMC (p < 0.001), which was 191

NMED-A111916
10
further altered in the HF subgroup relative to ACS and CIHD (p < 0.001) (Extended Data 192
Figure 1, and Supplementary Table 2). 193
Diet and physical activity variation across study groups. Diet affects microbiome 194
composition and IHD risk2. We found that HC individuals reported healthier diets than the IHD 195
and MMC groups with higher values of composite metrics such as alternative healthy eating 196
index (aHEI20) (HC versus IHD; p < 0.001), diet diversity score (DDS21) (HC versus IHD; p = 197
0.001) and dietary approaches to stop hypertension (DASH22) score (HC versus IHD; p = 0.013), 198
and lower overall daily energy intake (HC versus IHD; p = 0.013). HC consumed significantly 199
less of fatty animal-based food and meat and more plant-based food rich in non-digestible 200
polysaccharides (Supplementary Table 4). They further reported higher physical activity levels 201
(Extended Data Figure 1), more often being in manual work and undertaking more frequent 202
moderate to vigorous leisure time activities than IHD or MMC (Supplementary Table 4). Some 203
of the microbiome differences between MMC and IHD as opposed to HC may also reflect a less 204
healthy lifestyle. 205
Microbiome and metabolome changes related to dysmetabolism. Both the taxonomy and 206
functional potential of the gut microbiome as well as the metabolome differed significantly 207
between IHD and HC in accordance with previous reports11-13. Remarkably, comparing HC to 208
MMC revealed even more differential features than comparing HC versus IHD (Figure 2a, and 209
Supplementary Tables 5-8). Moreover, the discriminatory potential of microbiome and 210
metabolome features was significantly higher between IHD and HC than between IHD and 211
MMC (Figure 2b). We recovered most previously published IHD-related gut microbiome 212
findings (Extended Data Figure 2, and Supplementary Tables 15-16), primarily by contrasting 213

NMED-A111916
11
HC and IHD. However, most were already significant in MMC versus HC comparisons, 214
suggesting that previous studies may have erroneously reported dysmetabolism features as bona 215
fide IHD features. These might contribute to increased risk of IHD, but our analyses indicate that 216
they are not specific for IHD. 217
At higher microbiome architecture levels, there was a significant shift from the Bacteroides 1 218
and Ruminococcus enterotypes towards the low bacterial cell count–associated Bacteroides 2 as 219
disease worsened23 (Figure 2c). These findings mirror significant loss of microbial gene richness 220
(Figure 2d) and absolute gut bacterial cell load (i.e. microbial load) in both MMC and IHD 221
relative to HC. In contrast, no differences were found when IHD were compared with MMC 222
(Supplementary Table 5). Bacterial gene depletion and Bacteroides 2 prevalence were even 223
more exacerbated in UMMC, possibly due to drugs not yet being prescribed and the presence of 224
a more obese phenotype in this group24. Consistently, the total number of gut microbiome and 225
metabolome features significantly differential in abundance was higher when HC was compared 226
to UMMC relative to MMC (Extended Data Figure 3). 227
Microbiome and metabolome signatures of IHD. We consider the identification of genuine 228
microbiome and metabolome signatures of IHD, i.e., disease features not better explained as 229
indirect associations via drugs and demographics, a major contribution of our study. Additionally, 230
we further differentiate IHD features from their metabolic morbidities by categorizing them 231
according to their signatures among the various group comparisons across the CMD spectrum, 232
focusing qualitatively on condition specificity and quantitatively on effect size (Figure 3 and 233
Extended Data Figure 4). We identify features as being specific to dysmetabolism (Figure 3a, 234
b) or IHD (Figure 3a, c) by exhibiting a significant change only under the respective condition, 235

NMED-A111916
12
i.e. HC versus MMC/UMMC for dysmetabolic features (DMF) or MMC/UMMC versus IHD for 236
IHD-specific features (IHDF). Additionally, we identify features based on whether they exhibit a 237
typical shift in effect size in both dysmetabolism and IHD, either maintaining it in the same 238
direction from dysmetabolism to IHD, i.e. escalation features (ESCF) or on the contrary in the 239
opposite direction, i.e. de-escalation features (DSCF) (Figure 3a, d). Specifically, ESCF 240
represents early markers of IHD that continue to increase/decrease during metabolic morbidity 241
(i.e. HC versus MMC/UMMC) to overt IHD (i.e. MMC/UMMC versus IHD) (Figure 4b). In 242
contrast, DSCF exhibit a reverse pattern of shift when considering the effects sizes between HC 243
versus MMC/UMMC and MMC/UMMC versus IHD (Figure 4c). In brief, for features already 244
aberrant in MMC, DSCF represents those being restored towards HC levels in diagnosed and 245
treated IHD, plausibly associated to disease stabilization. 246
Most significant IHD-associated features were categorized as primarily indicators of general 247
dysmetabolism rather than specific to IHD, whereas next in order of frequency were features 248
specific to IHD, then de-escalation- and escalation features (Figure 1, 3, Supplementary Figure 249
1, and Supplementary Table 17). This pattern remained largely valid also when the three IHD 250
subtypes were considered separately (Supplementary Figure 2), in line with our observation of 251
a major shift in gut microbiome and metabolome during the dysmetabolic stage prior to IHD 252
diagnosis. 253
Of 121 species that were markers of dysmetabolism (i.e. DMFs) (Supplementary Table 17), an 254
overwhelming majority (85 %) was depleted in IHD, paralleling observations for the ACS cases 255
analyzed in the companion manuscript (Talmor-Barkan et al.). Twenty-three species were IHD 256
specific markers (Figures 4a, 5), with a similar trend towards depletion in patients (65%). They 257

NMED-A111916
13
included three proteobacteria, Acinetobacter, Turcimonas and Acetobacter, previously reported 258
depleted in IHD (Extended Data Figure2). Among eight species enriched in IHD, two were 259
Betaproteobacteria of the Burkholderiales order. Interestingly, Burkolderia pseudomallei is 260
reported as a possible cause of endocarditis25. A single species, an uncharacterized 261
Ruminococcus depleted in IHD, was an IHD escalation marker (Figure 4b); ruminococci 262
include butyrate producers and their depletion might contribute to the reduced production 263
potential of short chain fatty acids (SCFAs) in IHD. Six species were de-escalation markers 264
(Figure 4c); they belonged to Clostridiales order and all but one, Eubacterium siraeum, were 265
unclassified at species or even genus taxonomic level. Eubacterium was previously reported to 266
be depleted in atherosclerosis (Figure 4, Supplementary Table 17). In contrast, microbiome 267
functions (GMM and KEGG modules) were mostly enriched in IHD (Extended Data Figure 5). 268
In parallel, the metabolome reporting most of IHD-specific markers, showed a marked 269
enrichment with only 50 out of 203 IHD-specific markers (25%) being depleted in IHD relative 270
to HC (Figure 4, Supplementary Table 17). We identified enrichment of a range of IHD-271
specific metabolites, including intermediaries of the choline and carnitine pathways quantified by 272
UPLC-MS/MS, i.e. choline, betaine-aldehyde, 4-butyrobetaine, linoleylcarnitine, and 273
trimethylamine (TMA), the precursor of trimethylamine N-oxide (TMAO) known to modulate 274
IHD risk26. Other such carnitine metabolites included medium- and long-chain fatty acyl 275
carnitines, suggesting an increase in transport into the mitochondria through the carnitine shuttle, 276
typically for -oxidation. In particular, microbial aromatic acids such as phenylacetate reported 277
to be inversely associated with species-level genome bin (SGB) 4712 in the companion 278
manuscript, Talmor-Barkan et al.) or benzoate follow a similar process producing 279

NMED-A111916
14
phenylacetatylcarnitine or benzoylcarnitine. They undergo conjugation with amino acids to form 280
for instance phenylacetylglutamate or hippurate27, of which both phenylacetylcarnitine and 281
phenylacetylglutamate are IHD-specific markers in our study (Figure 4a). 282
Along the same lines, we observed an increase in proinflammatory lipids derived from 283
arachidonic acid (C20:4) starting with arachidonoylcarnitine, 5-hydroxyeicosatetraenoic acid (5-284
HETE) as well as leukotriene B4 and 9- / 13- hydroxyoctadecadienoic acid (9-HODE/13-HODE) 285
which are known mediators of inflammation and atherogenesis28,29. In contrast, fatty acid methyl 286
esters including methyl hexadecanoate, methyl linolenate and methyl oleate along with alpha-287
tocopherol, known for vasoprotective30 and antioxidant properties31, respectively, were among 288
the top metabolites whose depletion constitutes markers specific for IHD (Figure 4a). 289
Importantly, similar patterns remained in IHD subtype-specific analyses (Extended Data 290
Figures 6-8, Supplementary Table 17). 291
Most IHD-escalation features represented by the metabolome exhibited an initial depletion upon 292
dysmetabolism, which continued following IHD diagnosis (Figure 4b and Supplementary 293
Table 17). Besides a number of complex phospholipids including sphingomyelins and 294
glycerophospholipids, several carotenoids (e.g. carotene diols and -cryptoxanthin) and 295
ergothioneine, which are known to improve cardiovascular health exhibited the above depletion 296
pattern whereas glutathione metabolism and markers of oxidative stress (e.g. cystathionine, cys-297
gly oxidized) instead escalated. Ergothioneine, in particular, has been associated with reduced 298
cardiovascular and overall mortality32 and was also identified as a key metabolite exhibiting a 299
positive correlation with SGB 4712 (i.e. both SGB 4712 and ergothioneine exhibiting depletion) 300
in ACS cases relative to controls in the companion manuscript (Talmor-Barkan et al.). 301

NMED-A111916
15
Consistently, a reduction in circulating level of ergothioneine was also observed in ACS and HF 302
cases relative to healthy controls in the present study (Supplementary Table 17). 303
In contrast, 4-cresol exhibited an enrichment pattern from dysmetabolism to IHD (Figure 4b). 4-304
cresol is a bacterial product of colonic fermentation of phenylalanine and tyrosine and a 305
precursor for uraemic toxin 4-cresylsulfate. Similarly, phenylacetylglutamine, another uraemic 306
toxin derived from microbial phenylacetate and which acts through adrenergic receptors33 307
showed an enrichment pattern from dysmetabolism to IHD. It was also shown to be inversely 308
associated with SGB 4712 by Talmor-Barkan et al.). The findings implicate these metabolites as 309
key targets for early intervention. 4-cresol, in particular, has been found in lower concentrations 310
in the blood of vegetarians than of omnivores34, and shown to inhibit colonocyte oxygen 311
consumption35 as well as to be reduced once fat intake is curbed36. In our study this compound 312
appeared as a ACS and CIHD escalation feature and it was also one of the top markers 313
specifically enriched in blood of HF cases, likely related to its role in uraemia37 with 314
dysregulation of fluid homeostasis being a key feature of HF (Extended Data Figure 7). 315
Interestingly, we also observe in another MetaCardis study that 4-cresol plays a causal role in the 316
gut microbiome–kidney–heart axis in HCs, culminating in increased pro-ANP levels (Chechi et 317
al., in revision). 318
A majority of DSCF (89% and 100% for metabolites and predicted microbiome functions, 319
respectively) exhibited the pattern of initial depletion at the stage of dysmetabolism but an 320
apparent reversal at the stage of treated IHD (Figure 4c). For instance, O-acetylsalicylate, the 321
active component in aspirin, appeared as an archetypal DSCF putatively due to patient treatment 322
compliance in IHD. Similarly, a number of catecholamine intermediates and end-products, 323

NMED-A111916
16
bilirubin products, bile acids and odd-chain lipids with bacterial origin were identified as DSCF. 324
Moreover, TMA production (MC0022) and butyrate production II (MF0089) as gut microbial 325
functional features exhibited a depletion at the dysmetabolism stage but an apparent restoration 326
at the IHD stage (Extended Data Figure 5). Overall, these observations may point towards a 327
responsiveness of both microbiome and metabolome features to long-term multifactorial 328
treatment plausibly contributing to stabilization of IHD. In addition, achieving a stabilized IHD 329
state appeared to involve restoring lost gut microbial cell density (Figure 4c) alongside a 330
capacity to degrade BCAAs and galactose while restoring lost capacity for butyrate and acetate 331
production (Extended Data Figure 5). 332
Microbiome and metabolome markers of IHD sub-phenotypes. Detailed analysis of ACS, 333
CIHD and IHD-caused HF groups provided more granularity for relative shifts in microbiome 334
and metabolome features (Figure 5, Extended Data Figures 6-9, and Supplementary Table 335
17). 336
The total number of features typical for each IHD subgroup compared with controls was highest 337
for CIHD followed by HF and ACS. CIHD exhibited the most differential changes in the gut 338
microbiome functional potentials (Extended Data Figure 9) whereas ACS exhibited 339
predominantly differential changes in metabolome features (Figure 5, Extended Data Figures 340
6-9, and Supplementary Table 17). 341
Most (69%) of the dysmetabolism-linked species found by IHD versus HC comparisons were 342
also present in comparisons of IHD subgroups versus HC, suggesting that the major disruption of 343
the microbiome, which appears to be related to metabolic dysfunction, may persist throughout 344
the various stages of IHD. 345

NMED-A111916
17
Strikingly, for the ACS subgroup, besides the 91 dysmetabolism-related species, no other species 346
markers (ACS-specific, ESCF or DSCF- related) were found (Supplementary Table 17). In the 347
same ACS group, the pattern was very different for serum metabolites where only 55% of 348
markers were related to dysmetabolism while 25% were ACS-specific (Supplementary Table 349
17). We thus observed the acute disease phase being characterized by microbiome alterations 350
almost exclusively related to dysmetabolism, presumably accumulating during the long 351
prodromal stage, as well as host metabolome perturbations unrelated to dysmetabolism, 352
presumably beginning only shortly before the ACS event. It is tempting to suggest that the 353
conjunction of the two may be conducive to some of the decompensation observed in ACS. 354
When considering the metabolome markers specific to ACS, eight out of the top 10 metabolites 355
were drug analytes or drug metabolites, related to aspirin, metroprolol and atorvastatin. There 356
was also an increase in proinflammatory metabolites such as 5- and 12-hydroxyeicosatetraenoic 357
acid (HETE), leukotriene B4 and B5, as well as products of microbial-host phenylalanine co-358
metabolism (phenylacetylcarnitine, phenylacetylglutamate, and 2-hydroxyphenylacetate), 359
followed by indoxylsulfate and TMA, which is consistent with the identified overall IHD-360
specific signature. Likewise, some of the ACS-specific depleted metabolites were also less 361
abundant in IHD, including health beneficial metabolites such as alpha-tocopherol, ergothioneine, 362
methyl oleate and methyl hexadecanoate (Extended Data Figure 6, Supplementary Table 17). 363
In contrast to the findings in ACS, 19 and 31 specific species markers were found, for CIHD and 364
HF, respectively, indicating additional microbiome changes in the chronic phases of IHD. 365
Noticeably, these changes affected genera represented by only a few species: 8/14 depleted and 366
11/17 enriched species in HF cases, respectively, belonged to genera represented by no more 367

NMED-A111916
18
than six species (p=2.9 x 10⁻⁵ as estimated by the number of species belonging to different 368
genera found in our study (Extended Data Figures 6-8, and Supplementary Table 17). 369
The majority of the CIHD-specific features was enriched in cases over controls (Extended Data 370
Figures 7 & 9, supplementary Table 17). This was particularly the case for microbiome 371
functional potentials for amino acid biosynthesis, including BCAA, (KEGG modules M00019, 372
M00570, M00432), methionine (KEGG module M00017) and lysine (KEGG module M00030) 373
(Extended Data Figure 9). Similarly, enhanced degradation of aromatic amino acids 374
phenylalanine, tyrosine (GMM modules MF0027, MF0026) was reflected by increased 375
abundance of phenylacetate metabolites (phenylacetylcarnitine and phenylacetylglutamate).We 376
also observed increased abundance of methionine and two of its metabolites (N-acetylmethionine 377
sulfoxide, and gamma-glutamylmethionine), which are known to be associated with 378
cardiovascular phenotypes38. Of interest, the gut microbiome-derived L-methionine biosynthesis 379
pathway was recently directly associated with atherosclerotic plaque burden and enhanced 380
metabolic risk score for cardiovascular disease18, whereas L-methionine sulfoxide as a product of 381
protein methionine oxidation may influence thrombosis and vascular function39 (Extended Data 382
Figures 7 & 9, and Supplementary Table 17). In addition, the abundance of multiple UPLC-383
MS/MS quantified carnitines including decanoylcarnitine and oleoylcarnitine was elevated in 384
CIHD. 385
Some metabolite features also exhibited HF-specificity with an enrichment of 4-cresol, 4-cresyl 386
sulfate (also called p-cresol sulfate), 4-cresylglucuronide (also called p-cresol glucuronide), 387
choline and TMA as well as several carnitines (3-methylglutarylcarnitine, suberoylcarnitine (C8), 388
octadecanedioylcarnitine (C18), levulinoylcarnitine, including microbiome-derived carnitines 389

NMED-A111916
19
(benzoylcarnitine, phenylacetylcarnitine). In contrast, metabolites such as alpha-tocopherol, 390
ergothioneine and 3-indoleglyoxylic acid exhibited HF-specific depletion (Extended Data 391
Figure 8, Supplementary Table 17). These findings point towards altered fatty acid metabolism, 392
which is known to play a crucial role in HF pathogenesis40. 393
Classification of participants into clinical subgroups. Robustness of our microbiome and 394
metabolome signatures was evaluated by comparing the performance of orthogonal partial least 395
squares discriminant analysis (O-PLS-DA) models for classifying ACS (n=112), CIHD (n=158) 396
and HF (n=102) relative to HC (n=275) and MMC (n=372) (Extended Data Figure 10). 397
Classification was based on (i) clinical markers routinely assessed during IHD diagnosis; (ii) 398
deconfounded microbiome and metabolome markers specific for each IHD subtype identified in 399
the current study and (iii) a combination of the two. Models were built by randomly splitting our 400
MetaCardis study population into groups of 70% and 30%, respectively, and using the former for 401
training and latter for testing; the process was iterated 1,000 times to minimize overfitting. The 402
performance of the specific -omics markers on the testing sets yielded area under the curve 403
(AUC) values superior to 0.7 in all cases and was systematically higher than that of clinical 404
markers only, in particular for classification relative to the MMC group. Combination of the two 405
marker types did not improve classification relative to MMC and only marginally improved 406
classification relative to HC (Extended Data Figure 10). 407
To validate our classification models further, we took advantage of the independent data set from 408
the companion manuscript (Talmor-Barkan et al.), focusing on our ACS subgroup to match the 409
pathology of the Israeli study sample. ACS-specific-metabolomics markers from the two studies 410
were highly correlated (Cliff’s Delta values computed relative to HC are shown in Figure 6a, 411

NMED-A111916
20
Supplementary Table 18), confirming that similar changes were observed in the two studies 412
and validating a large fraction of our ACS-specific metabolome features. Importantly, our 413
markers exhibited strong discriminatory potential when employed in O-PLS-DA models trained 414
in our population and tested in the independent Israeli population (Talmor-Barkan et al.). Models 415
based on our ACS-specific metabolome markers with (model 3, AUROC= 0.87) or without 416
clinical variables (model 2, AUROC: 0.85) performed substantially better than a model based on 417
clinical variables alone (AUROC; 0.764 Figure 6c). Altogether, this independent replication 418
confirmed the robustness of the discriminatory potential of our deconfounded microbiome and 419
metabolome markers in a clinical setting (Figure 6 (metabolome markers) and Extended Data 420
Figure 10 (microbiome and metabolome markers)). 421
Discussion 422
We show that a vast majority of the intestinal microbiome and circulating and urine metabolome 423
signatures that were previously reported as characteristic of IHD and which do not reduce to 424
drug treatment effects is in fact present already in individuals with common dysmetabolic 425
phenotypes like obesity and T2D. Our observations further align with the presence of a reduced 426
gut bacterial cell density and changes in the abundance of multiple species and microbial 427
functional potentials. Accounting for bacterial cell density, we identify the low cell count 428
Bacteroides 2 enterotype23 as a biomarker both in individuals with dysmetabolism and in 429
individuals diagnosed with IHD. We particularly highlight low gut bacterial cell count as one of 430
the microbiome features linked with IHD, which appears to reverse in treated IHD cases. 431
Interestingly, both the present manuscript and another recent MetaCardis publication41 suggest 432
that statin drugs widely prescribed to CMD cases may help restore gut bacterial cell load. These 433

NMED-A111916
21
results are particularly relevant since several statins and their drug metabolites (mostly related to 434
atorvastatin), and -blockers (metroprolol and its metabolites) are reflected in the here identified 435
specific signatures of IHD and its subtypes. 436
In cases with diagnosed IHD and treatment-induced improvement of vascular, inflammatory and 437
lipid health markers, we found less aberrant microbiome and metabolome profiles when 438
compared with healthy individuals. Still, we found bacterial species specifically altered in IHD 439
cases and most of them were depleted in agreement with findings of the companion manuscript 440
(Talmor-Barkan et al.). Similarly, we observed a depletion of IHD-specific metabolites including 441
the fatty acid esters ergothioneine and alpha-tocopherol, known for vasoprotective30 and 442
antioxidant properties31, whereas metabolites enriched in IHD cases included intermediates 443
related to TMA and compounds derived from tryptophan and phenylalanine metabolism. Finally, 444
4-cresol and phenylacetylglutamine stood out as representatives of ESCF potentially mirroring 445
disease severity. 446
In IHD subtype analyses, we identified multiple dysmetabolism-related gut microbiome changes 447
in ACS cases, further strengthening our hypothesis that gut microbiome alterations take place in 448
the prodromal stages prior the onset of IHD. In contrast, a substantial fraction of altered host 449
metabolites (45%) in ACS cases was unrelated to dysmetabolism. In addition, we found 450
alterations of the microbiome and metabolome that were specific for CIHD and HF, putatively 451
conditioned by a conjunction of intervention and disease worsening. 452
Of relevance for actionable targets in future preclinical and clinical trials, we confirm reduced 453
microbiome potentials for biosynthesis of SCFAs and increased production of BCAAs42 in 454

NMED-A111916
22
individuals at increased risk of asymptomatic coronary atherosclerosis prior to IHD diagnosis. In 455
the later phases of IHD pathogenesis, we show an overwhelming role for microbial-host 456
metabolism of aromatic amino acids derived from phenylalanine and tyrosine, i.e. emerging from 457
phenylacetate and cresol co-metabolism. Thus, our findings suggest that beyond diminishing 458
microbial-host production of TMAO, future interventions aiming to delay or prevent IHD might 459
be directed at increasing microbial SCFA biosynthesis but lowering microbial production of 460
aromatic amino acids and BCCAs. Finally, the identified microbiome and metabolome features 461
allowed us to stratify IHD cases from healthy individuals or metabolically matched individuals at 462
levels above that achieved with conventional risk markers pointing to their pathophysiological 463
relevance. 464
In conclusion, at prodromal dysmetabolic stages and at both early and late clinical manifestations 465
of IHD, multiple deconfounded microbiome and metabolome alterations are present reflecting 466
distinct metabolic pathways. Several of these are modifiable and might be targets for future 467
mechanistic experiments and clinical trials aiming at IHD prevention. 468
Acknowledgements 469
We are indebted to the MetaCardis study participants and patient associations (Alliance du Coeur 470
and CNAO) for their input and interface. Similarly, we are much indebted to the MetaCardis 471
consortium (http://www.metacardis.net/) collaborators for contributions at multiple levels since 472
consortium start in 2012. A full list of collaborators is given in Supplementary Information. We 473
further thank Dr Dominique Bonnefont-Rousselot (Department of Metabolic Biochemistry, Pitié-474
Salpêtrière hospital) for the analysis of plasma lipid profiles. The assistance of nurses, dietitians, 475
NMED-A111916
23
laboratory technicians, clinical research assistants and data managers at Novo Nordisk 476
Foundation Center for Basic Metabolic Research, Clinical Research Unit at Fredriksberg and 477
Bispebjerg Hospitals, Copenhagen, Clinical Investigation Platform at the Institute of 478
Cardiometabolism and Nutrition for patient investigations and the Clinical Investigation Center 479
(CIC) from Pitié-Salpêtrière Hospital, Paris, and University of Leipzig Medical Center, Leipzig, 480
is greatly appreciated. Quanta Medical provided regulatory oversight of the clinical study and 481
contributed to the processing and management of electronic data. 482
Our study, Metagenomics in Cardiometabolic Diseases with the acronym METACARDIS was 483
sponsored by the European Union’s Seventh Framework Program for research, technological 484
development and demonstration under grant agreement HEALTH-F4-2012-305312. Assistance 485
Publique-Hôpitaux de Paris (AP-HP) is the promoter of the clinical investigation. Parts of the 486
studies were also supported by the Metagenopolis grant ANR-11-DPBS-0001, the Leducq 487
Foundation, the Novo Nordisk Foundation, the NIHR Imperial Biomedical Research Centre, and 488
by grants from the French National Research Agency (ANR-10-LABX-46 [European Genomics 489
Institute for Diabetes]), from the National Center for Precision Diabetic Medicine – PreciDIAB, 490
which is jointly supported by the French National Agency for Research (ANR-18-IBHU-0001), 491
by the European Union (FEDER), by the Hauts-de-France Regional Council (Agreement 492
20001891/NP0025517) and by the European Metropolis of Lille (MEL, Agreement 493
2019_ESR_11) and by Isite ULNE (R-002-20-TALENT-DUMAS), also jointly funded by ANR 494
(ANR-16-IDEX-0004-ULNE), the Hauts-de-France Regional Council (20002845) and by the 495
European Metropolis of Lille (MEL). The Novo Nordisk Foundation Center for Basic Metabolic 496
Research is an independent research institution at the University of Copenhagen partially funded 497

NMED-A111916
24
by an unrestricted donation from the Novo Nordisk Foundation. KChe is supported by Medical 498
Research Council (MRC) Skills Development Fellowship (grant number MR/S020039/1) and 499
Wellcome Trust funded Institutional Strategic Support Fellowship [grant number 500
204834/Z/16/Z]. LH was in receipt of an MRC Intermediate Research Fellowship in Data 501
Science (grant number MR/L01632X/1, UK Med-Bio). SKF was supported by DZHK (German 502
Centre for Cardiovascular Research), by DFG (German Research Council - projects SFB1365, 503
SFB1470 & KFO339) and by BMBF (German Ministry of Education and Research). 504
Author contributions 505
OP, SDE and ME-D developed the present project concept and protocol and supervised the 506
project. KC (coordinator), OP, MS, SDE, PB, JR, M-ED, FB and JN conceived the overall 507
objectives and study design of the MetaCardis initiative. MetaCardis cohort recruitment, 508
phenotyping and lifestyle: JA-W, TN, RC, CL, LK, TH, THH, HV, KA and supervised by KC, 509
MS and OP. Data curation: RC, KA, SKF, JA-W, TN. Faecal microbial DNA extraction and 510
shotgun sequencing: NP, ELC, SF. Bacterial cell count measurement: GF, SVS. Serum and urine 511
metabolome profiling: LH, JC, AM, MO. Biochemical analyses: J-PG. Bioinformatics and 512
statistical analyses: SF, SKF, RA, LPC, SS, EP, EB, PA, BJ, KChe. Modelling of microbiome 513
data: KChe, HJ, SKF, SF, GF, SVS. Drug-deconfounding: SKF and MZ-K. The manuscript was 514
drafted by J-AW, RC, SKF, KChe, M.-E.D., S.D.E. and OP. All authors participated in the 515
project development, discussion of results, and revision of article and approved the final version 516
for publication. 517
Competing Interests Statement 518

NMED-A111916
25
F.B. is shareholder in Implexion Pharma AB. K.C. is a consultant for Danone Research, LNC 519
therapeutics and CONFO therapeutics for work that is unassociated with the present study. K.C. 520
has held a collaborative research contract with Danone Research in the context of MetaCardis 521
project. The other authors declare no competing interests. 522

NMED-A111916
26
Figure Legends 523
Figure 1. Overview of the study design. Top, the individuals studied are a subset of 1,241 524
individuals from the European MetaCardis cohort, in which participants underwent deep 525
bioclinical phenotyping combined with gut microbiome and serum and urine metabolome 526
profiling. Participants were classified as being healthy controls (HC, n = 275, healthy by self-527
report and no intake of lipid-lowering, anti-diabetic or anti-hypertensive drugs) and a combined 528
group of patients diagnosed with ischemic heart disease (IHD, n = 372, on various drugs). The 529
IHD group included cases with acute coronary syndrome (ACS, n = 112), chronic ischemic heart 530
disease (CIHD, n = 158) and heart failure (HF, n = 102) due to CIHD. Two additional control 531
groups were included: metabolically matched controls without diagnosed IHD (MMC, n = 372, 532
matched on age, body mass index and T2D status of the IHD cases, some of whom were 533
prescribed lipid-lowering, antidiabetic and anti-hypertensive medication but no IHD related 534
drugs) and untreated (non-medicated) metabolically matched non-IHD controls (UMMC, n = 535
222, no intake of lipid-lowering, anti-diabetic, anti-hypertensive or IHD drugs). Bottom, 536
microbiome and metabolome features were segregated into four categories, as indicated. The 537
human icons were adapted from smart.servier.com. 538
Figure 2. Alterations of gut microbiome and metabolome features along the natural history 539
of ischaemic heart disease. a, Violin plots representing the distribution of significant gut 540
microbiome and metabolome features among various group comparisons before and after data 541
being subjected to the drug-deconfounding pipeline (lower line, lower quartile; medium line, 542
median; upper line, upper quartile). Numbers below each subplot represent total features in 543
the respective group comparison (shown as x-axis) that retained significance (FDR ≤ 0.1) 544

NMED-A111916
27
plotted against the Cliff’s Delta (y-axis) for each set of features before (uncorrected) or after 545
drug deconfounding (corrected) b, Boxplots showing classifier performance comparison using 546
HC or MMC as controls relative to IHD cases, based either on all microbial features (left) or 547
quantified metabolome features (right) as input (center line, median; box limits, upper and lower 548
quartiles; whiskers, 1.5× interquartile range; points, outliers). Two-sided MWU P are included 549
for each comparison. c, Pie chart (right) comparing the percent (shown as numbers) distribution 550
of four enterotypes among various study groups. Table (left) shows the Chi2 P for each study 551
group relative to the three control groups i.e., HC, MMC, and UMMC. d, Boxplots (upper) 552
comparing gut bacterial gene richness among the indicated study groups (violin, distribution; 553
center line, median; box limits, upper and lower quartiles; whiskers, 1.5× interquartile range; 554
points, outliers). Table (below) shows the two-sided MWU P for each study group relative to the 555
three control groups i.e., HC, MMC, and UMMC. Two-sided MWU and Chi2 tests were used for 556
assessing the significance of group-wise comparisons in a, b, d and c, respectively, using HC (n 557
= 275), MMC (n = 372), UMMC (n = 222), IHD (n = 372), ACS (n = 112), CIHD (n = 158), HF 558
(n = 102) groups. Multiple testing corrections were done using Benjamini-Hochberg method and 559
FDR <= 0.1 was considered significant. HC: healthy controls, MMC: metabolically matched 560
controls, UMMC unmedicated metabolically matched controls, IHD: ischemic heart disease, 561
ACS: acute coronary syndrome, CIHD: chronic IHD, HF: heart failure due to IHD, MGS: 562
metagenomic species, GMM: gut microbial modules, KEGG, Kyoto Encyclopedia of Genes and 563
Genomes, MWU: Mann-Whitney U, FDR: false-discovery rate. 564
Figure 3. Approach used for categorization of microbiome and metabolome features in the 565
cross-sectional study. Gut microbiome and plasma and urine metabolome features that 566
exhibited a statistically significant shift uniquely when either metabolically matched controls 567

NMED-A111916
28
(MMC), untreated metabolically matched controls (UMMC) or cases with ischemic heart disease 568
(IHD) were compared to healthy controls (HC) were categorized as dysmetabolism features 569
(DMF; a, b) as these features exhibited significant alterations in association with metabolic 570
syndrome (i.e. obesity, type 2 diabetes) and not IHD per se. In contrast, gut microbiome and 571
plasma and urine metabolome features that exhibited a significant change when either MMC or 572
UMMC subjects were compared with IHD cases were categorized as IHD-specific features 573
(IHDF; a, c). In addition, features exhibiting a significant change in IHD cases relative to HC 574
subjects were categorized as IHDF when they exhibited a simultaneous significant shift in IHD 575
cases relative to MMC or UMMC subjects. Next, we considered the natural trajectory of IHD in 576
two stages i.e., HC vs MMC or UMMC (representing the dysmetabolism stage) and MMC or 577
UMMC vs IHD (representing the IHD stage). Features exhibiting a significant change under both 578
dysmetabolic and IHD stages, and in the same direction (representing disease progression), were 579
thus labelled as escalation features (ESCF; a, d), whereas those exhibiting a significant change in 580
the reverse direction (representing disease stabilization) were labelled as de-escalation features 581
(DSCF; a, d). Our approach evaluated every feature across all group comparisons using the 582
criteria of 1) non-confounded status (i.e., feature cannot be confounded by any tested host 583
variables including drug treatment). 2) significance status i.e., feature has to exhibit FDR < 0.1 584
for respective group comparison, and 3) a directional alignment status (i.e., direction of change 585
when disease stages are considered) for categorization as either as DMF (b), IHDF (c), ESCF or 586
DSCF (d). Please see Extended Data Figure 4 and the Methods for more details. The arrow size 587
further reflects the number of features identified by each route for respective categorization: 767 588
DMFs, 283 IHDFs and 98 each of ESCFs and DSCFs were identified. Two-sided MWU tests 589
were used for assessing the significance of group-wise comparisons using HC (n = 275), MMC 590

NMED-A111916
29
(n = 372), UMMC (n = 222) and IHD (n = 372) groups. Multiple testing corrections were done 591
using Benjamini-Hochberg method and FDR <= 0.1 was considered significant. MWU: Mann-592
Whitney U, FDR: false-discovery rate. The human icons were adapted from smart.servier.com. 593
Figure 4. Microbiome and metabolome features linked with ischaemic heart disease and its 594
dysmetabolic pre-morbidities. Using the categorization scheme described in Figure 3 and 595
Extended Data Figure 4, gut microbiome and metabolome markers were categorized as 596
dysmetabolic features (DMF), IHD-specific features (IHDF), IHD-escalation features (ESCF) or 597
IHD de-escalation features (DSCF), of which IHDF (a), ESCFs (b) and DSCFs (c) are displayed 598
here. In each panel, arrow length show effect sizes (Cliff’s Delta) for respective group 599
comparisons. Cliff’s Delta for HC vs IHD comparison are displayed for IHDFs (a), whereas 600
Cliff’s Delta for both HC vs MMC and MMC vs IHD are displayed for ESCFs (b) and DSCFs 601
(c), with arrow head pointing to the direction of change. Only features exhibiting an absolute 602
effect size > 0.1 are displayed; inclusive of serum metabolites, metagenomic species and 603
microbial density indices (see Supplementary Table 17 for a description of effect sizes and 604
confounding status). Two-sided MWU tests were used for assessing the significance of group-605
wise comparisons using HC (n = 275), MMC (n = 372), UMMC (n = 222) and IHD (n = 372) 606
groups. Multiple testing corrections were done using Benjamini-Hochberg method and FDR <= 607
0.1 was considered significant. IHD: ischemic heart disease, HC: healthy controls, MMC: 608
metabolically matched controls, UMMC: unmedicated metabolically matched controls, MWU: 609
Mann-Whitney U, FDR: false-discovery rate. 610
Figure 5. Metabolome and microbiome features altered uniquely in ischaemic heart disease 611
(IHD) and its subtypes. Circle plot shows gut microbial species and serum metabolites that 612
were categorized as being specific to IHD or to its subtypes; ACS, CIHD and HF due to CIHD as 613

NMED-A111916
30
per our categorization scheme shown in Figure 3 and Extended Data Figure 4. Each layer 614
shows effect sizes (Cliff’s Delta) for individual features that were either enriched or depleted in 615
cases (IHD or its subtypes) versus healthy controls (see also Supplementary Table 17 for all 616
features listed as being specific to IHD and its subtypes. Only features exhibiting absolute effect 617
sizes > 0.1 for HC vs IHD are displayed. HC: healthy controls, IHD: ischemic heart disease, 618
ACS: acute coronary syndrome, CIHD: chronic IHD, HF: heart failure due to IHD. 619
Figure 6. Validation of markers for acute coronary syndrome (ACS). For the gut microbial 620
and plasma metabolome features common to both MetaCardis and Israeli cohorts, a Spearman 621
correlation analysis (a) was conducted between the effect sizes (Cliff’s Delta) for HC vs ACS 622
comparison in each study after recalculating Cliff’s Delta’s in the Israeli population. Next, ROC 623
curves depicting the classifier performance (AUROC) of five-fold cross-validated O-PLS-DA 624
models based on the overlapped set of ACS biomarkers in three settings are shown for 625
MetaCardis as the training population (b) and Israeli cohort as the test population (c). Model 1 626
included nine clinical ACS risk variables (i.e. age, sex, body mass index, systolic blood pressure, 627
diastolic blood pressure, glycated haemoglobin (factored as > 5.7, 5.7-6.4 and < 6.4 mmol/l) and 628
smoking status), fasting total-cholesterol and HDL-cholesterol (mmol/l). Model 2 included ACS-629
specific biomarkers identified in our study that were also found in Talmor-Barkan et al (118 630
variables) whereas model 3 involved all variables considered for model 1 and 2 (i.e., 127 631
variables). Two-sided MWU tests were used for assessing the significance of group-wise 632
comparisons using HC (n = 275) and ACS (n = 112) in MetaCardis population and HC (n = 473) 633
vs ACS (n =156) in the Israeli population. Multiple testing corrections were done using 634
Benjamini-Hochberg method and FDR <= 0.1 was considered significant. HC: healthy controls, 635
ACS: acute coronary syndrome, O-PLS-DA: orthogonal partial least squares-discriminant 636

NMED-A111916
31
analysis, ROC: Receiver-operating characteristics, AUROC: Area under the ROC curve, MWU: 637
Mann-Whitney U, FDR: false-discovery rate. 638
639
Reference: 640
1 Heymsfield, S. B. & Wadden, T. A. Mechanisms, pathophysiology, and management of 641
obesity. N. Engl. J. Med. 376, 254-266 (2017). 642
2 Rothschild, D. et al. Environment dominates over host genetics in shaping human gut 643
microbiota. Nature 555, 210-215 (2018). 644
3 Cotillard, A. et al. Dietary intervention impact on gut microbial gene richness. Nature 645
500, 585-588 (2013). 646
4 Karlsson, F. H. et al. Gut metagenome in European women with normal, impaired and 647
diabetic glucose control. Nature 498, 99-103 (2013). 648
5 Le Chatelier, E. et al. Richness of human gut microbiome correlates with metabolic 649
markers. Nature 500, 541-546 (2013). 650
6 Forslund, K. et al. Disentangling type 2 diabetes and metformin treatment signatures in 651
the human gut microbiota. Nature 528, 262-266 (2015). 652
7 Maier, L. et al. Extensive impact of non-antibiotic drugs on human gut bacteria. Nature 653
555, 623-628 (2018). 654
8 Forslund, S. K. et al. Combinatorial, additive and dose-dependent drug–microbiome 655
associations. Nature, 1-6 (2021). 656
9 Vujkovic-Cvijin, I. et al. Host variables confound gut microbiota studies of human 657
disease. Nature, 1-7 (2020). 658

NMED-A111916
32
10 Mozaffarian, D. et al. American Heart Association Statistics C, Stroke Statistics S: Heart 659
disease and stroke statistics--2015 update: a report from the American Heart Association. 660
Circulation 131, e29-322 (2015). 661
11 Jie, Z. et al. The gut microbiome in atherosclerotic cardiovascular disease. Nat. Commun. 662
8, 1-12 (2017). 663
12 Pasini, E. et al. Pathogenic gut flora in patients with chronic heart failure. JACC: Heart 664
Failure 4, 220-227 (2016). 665
13 Karlsson, F. H. et al. Symptomatic atherosclerosis is associated with an altered gut 666
metagenome. Nat. Commun. 3, 1-8 (2012). 667
14 Li, J. et al. Gut microbiota dysbiosis contributes to the development of hypertension. 668
Microbiome 5, 1-19 (2017). 669
15 Matey-Hernandez, M. L. et al. Genetic and microbiome influence on lipid metabolism 670
and dyslipidemia. Physiol. Genomics 50, 117-126 (2018). 671
16 Einarson, T. R., Acs, A., Ludwig, C. & Panton, U. H. Prevalence of cardiovascular 672
disease in type 2 diabetes: a systematic literature review of scientific evidence from 673
across the world in 2007–2017. Cardiovasc. Diabetol. 17, 83 (2018). 674
17 Association, A. D. Classification and diagnosis of diabetes: standards of medical care in 675
diabetes—2019. Diabetes Care 42, S13-S28 (2019). 676
18 Kurilshikov, A. et al. Gut microbial associations to plasma metabolites linked to 677
cardiovascular phenotypes and risk: a cross-sectional study. Circ. Res. 124, 1808-1820 678
(2019). 679

NMED-A111916
33
19 Vieira-Silva, S. et al. Quantitative microbiome profiling disentangles inflammation-and 680
bile duct obstruction-associated microbiota alterations across PSC/IBD diagnoses. Nat. 681
Microbiol. 4, 1826-1831 (2019). 682
20 Consortium, I. Adherence to predefined dietary patterns and incident type 2 diabetes in 683
European populations: EPIC-InterAct Study. Diabetologia 57, 321-333 (2014). 684
21 Jeurnink, S. et al. Variety in vegetable and fruit consumption and the risk of gastric and 685
esophageal cancer in the European prospective investigation into cancer and nutrition. Int. 686
J. Cancer 131, E963-E973 (2012). 687
22 Sacks, F. M. et al. Rationale and design of the Dietary Approaches to Stop Hypertension 688
trial (DASH): a multicenter controlled-feeding study of dietary patterns to lower blood 689
pressure. Ann. Epidemiol. 5, 108-118 (1995). 690
23 Vandeputte, D. et al. Quantitative microbiome profiling links gut community variation to 691
microbial load. Nature 551, 507-511 (2017). 692
24 Aron-Wisnewsky, J. et al. Major microbiota dysbiosis in severe obesity: fate after 693
bariatric surgery. Gut 68, 70-82 (2019). 694
25 Velusamy, R. & Muhi, S. Melioidosis and the heart: A systematic review. Trop. Med. 695
Infect. Dis. 5, 121 (2020). 696
26 Tang, W. W., Bäckhed, F., Landmesser, U. & Hazen, S. L. Intestinal microbiota in 697
cardiovascular health and disease: JACC state-of-the-art review. J. Am. Coll. Cardiol. 73, 698
2089-2105 (2019). 699
27 Pallister, T. et al. Hippurate as a metabolomic marker of gut microbiome diversity: 700
Modulation by diet and relationship to metabolic syndrome. Sci. Rep. 7, 1-9 (2017). 701

NMED-A111916
34
28 Kaduce, T. L., Figard, P. H., Leifur, R. & Spector, A. A. Formation of 9-702
hydroxyoctadecadienoic acid from linoleic acid in endothelial cells. J. Biol. Chem. 264, 703
6823-6830 (1989). 704
29 Jang, M. K. et al. Oxidized low-density lipoproteins may induce expression of monocyte 705
chemotactic protein-3 in atherosclerotic plaques. Biochem. Biophys. Res. Commun. 323, 706
898-905 (2004). 707
30 Lee, Y.-C. et al. Role of perivascular adipose tissue–derived methyl palmitate in vascular 708
tone regulation and pathogenesis of hypertension. Circulation 124, 1160-1171 (2011). 709
31 Ziegler, M., Wallert, M., Lorkowski, S. & Peter, K. Cardiovascular and Metabolic 710
Protection by Vitamin E: A Matter of Treatment Strategy? Antioxidants 9, 935 (2020). 711
32 Smith, E. et al. Ergothioneine is associated with reduced mortality and decreased risk of 712
cardiovascular disease. Heart 106, 691-697 (2020). 713
33 Nemet, I. et al. A cardiovascular disease-linked gut microbial metabolite acts via 714
adrenergic receptors. Cell 180, 862-877. e822 (2020). 715
34 Patel, K. P., Luo, F. J.-G., Plummer, N. S., Hostetter, T. H. & Meyer, T. W. The 716
production of p-cresol sulfate and indoxyl sulfate in vegetarians versus omnivores. Clin. J. 717
Am. Soc. Nephrol. 7, 982-988 (2012). 718
35 Andriamihaja, M. et al. The deleterious metabolic and genotoxic effects of the bacterial 719
metabolite p-cresol on colonic epithelial cells. Free Radic. Biol. Med. 85, 219-227 (2015). 720
36 Wan, Y. et al. Effects of dietary fat on gut microbiota and faecal metabolites, and their 721
relationship with cardiometabolic risk factors: a 6-month randomised controlled-feeding 722
trial. Gut 68, 1417-1429 (2019). 723

NMED-A111916
35
37 Poesen, R. et al. Cardiovascular disease relates to intestinal uptake of p-cresol in patients 724
with chronic kidney disease. BMC Nephrol. 15, 87 (2014). 725
38 Razavi, A. C. et al. Pseudouridine and N-formylmethionine associate with left ventricular 726
mass index: metabolome-wide association analysis of cardiac remodeling. J. Mol. Cell. 727
Cardiol. 140, 22-29 (2020). 728
39 Gu, S. X., Stevens, J. W. & Lentz, S. R. Regulation of thrombosis and vascular function 729
by protein methionine oxidation. Blood 125, 3851-3859 (2015). 730
40 Lopaschuk, G. D., Ussher, J. R., Folmes, C. D., Jaswal, J. S. & Stanley, W. C. 731
Myocardial fatty acid metabolism in health and disease. Physiol. Rev. 90, 207-258 (2010). 732
41 Vieira-Silva, S. et al. Statin therapy is associated with lower prevalence of gut microbiota 733
dysbiosis. Nature 581, 310-315 (2020). 734
42 Pedersen, H. K. et al. Human gut microbes impact host serum metabolome and insulin 735
sensitivity. Nature 535, 376-381 (2016). 736
737
738
739
740
741
742
743
744
745
746

NMED-A111916
36
Online Methods 747
Study design and participants 748
The MetaCardis project included healthy control individuals and individuals at increasing 749
stages of dysmetabolism and ischaemic heart disease (IHD) severity, aged 18–75 years old, and 750
recruited from Denmark, France and Germany between 2013 and 2015. IHD cases were 751
classified into: patients with first case of acute coronary syndrome (<15 days) (ACS), patients 752
with chronic IHD (CIHD) with normal heart function and patients with documented heart 753
failure (HF) and IHD as demonstrated by echocardiography-evaluated left ventricular ejection 754
fraction (LVEF)<45%. Our study encompassed 372 IHD cases (112 ACS, 158 with CIHD and 755
102 with HF caused by CIHD). In addition, 275 healthy controls (HC) matched on 756
demographics, age and sex, and 222 untreated metabolically matched controls (UMMC); i.e. 757
individuals with features of the metabolic syndrome but receiving no lipid-lowering,anti-758
diabetic or anti-hypertensive drugs. Finally, we included 372 controls matched with IHD cases 759
on type 2 diabetes (T2D) status and body mass index (BMI), metabolically matched controls 760
(MMC) thereafter. 761
Exclusion criteria were known confounders of the gut microbiome; i.e., antibiotic use in the 762
3months prior to inclusion, past history of abdominal cancer+/- radiation therapy, intestinal 763
resection except for appendectomy, inflammatory or infectious diseases including, Hepatitis B 764
and C or human immunodeficiency virus. 765
Additionally,, patients with a history of organ transplantation,receiving immunosuppressants, 766
estimated Glomerular Filtration Rate (eGFR) < 50 ml/min.1.73/m2), drug or alcohol addiction 767

NMED-A111916
37
were excluded. Ethical approval was obtained from the Ethics Committee CPP Ile-de France, 768
the Ethical Committees of the Capital Region of Denmark (H-3-2013-145) and Ethics 769
Committee at the Medical Faculty at the University of Leipzig (047-13-28012013). All study 770
participants provided written informed consent and all clinical investigations were undertaken 771
according to Helsinki Declaration II. 772
Bioclinical variables 773
Clinical measurements were made using standardized operating procedures concludedprior 774
patient recruitment. Bioclinical variables include age, sex, BMI, smoking status, dietary intake, 775
physical activity, and drug intake. We obtained habitual dietary information using food-776
frequency questionnaires (FFQ) adapted to cultural habits of each of country of recruitment. 777
Smoking status was obtained from a standardized questionnaire while information on physical 778
activity was assessed using the Recent Physical Activity Questionnaire (RPAQ). Drug intake 779
was assessed by either recall or from medication list, and a medical specialist interviewed 780
study participants about adherence to prescribed medication. 781
T2D was defined as fasting plasma glucose ≥ 7 mmol/l and/or Hba1c ≥ 6.5% and/or 782
individuals taking any glucose lowering agents; hypertension was defined as systolic blood 783
pressure>140 mmHg and/or diastolic blood pressure>90 mmHg and/or subjects taking anti-784
hypertensive drugs. Echocardiography enabled the measure of left ventricular ejection fraction 785
(LVEF) for diagnosis of HF (LVEF <45%). Renal function was assessed via eGFR calculated 786
using the Modification of Diet in Renal Disease (MDRD) equation43. 787
NMED-A111916
38
Blood was collected in the morning after an overnight fast. Plasma and serum samples were 788
stored at the clinical centres at -80°C until shipment to a central laboratory facility. Fasting 789
plasma glucose, total and HDL cholesterol, triglycerides, creatinine and HbA1c levels were 790
measured using standard enzymatic methods. LDL-cholesterol concentrations were measured 791
enzymatically for German participants or by the Friedwald equation for French and Danish 792
participants. Alanine aminotransferase (ALAT), aspartate aminotransferase (ASAT), and γ-793
glutamyltransferase (GGT) were measured by enzyme-coupled kinetic assays. Ultrasensitive 794
C-reactive protein (usCRP) was measured using an Image Automatic Immunoassay System 795
(Beckman Coulter). High-sensitivity IL-6 was measured using the Human IL-6 Quantikine 796
HSELISA Kit (R&D Systems). IFN-γ–induced protein 10 (IP-10) and C-X-C motif chemokine 797
ligand 5 (CXCL5), CCL2, Eotaxin, IL7, MIF, MIP1b, SDF1 and VEGFa were measured using 798
a Luminex assay (ProcartaPlex Mix&Match Human 13-plex; eBioscience, San Diego, CA, 799
USA). Plasma pro-ANP was measured using a processing-independent assay44. 800
Stool sample collection 801
Stool samples were processed according to International Human Microbiome Standards (IHMS) 802
guidelines (SOP03V1). Samples were collected by study subjects at home and immediately 803
stored at -20°C until they were transported on dry ice and frozen 4-24h later at -80°C in plastic 804
tubes at the biobanks of corresponding recruitment centers. 805
Microbial load measurement by flow cytometry 806
Microbial loads of fecal samples were processed and analyzed as described23. Briefly, 0.2g 807
frozen (-80°C) aliquots were suspended in physiological solution to a total volume of 100mL 808

NMED-A111916
39
(8.5g/L NaCl; VWR), the slurry was diluted 1,000 times andsamples were filtered using a 809
sterile syringe filter (pore-size 5µm; Sartorius). Next, 1mL of the microbial cell suspension 810
was stained with 1µL SYBR Green I (1:100 dilution in DMSO; shaded 15min incubation at 811
37°C; 10,000 concentrate, Thermo Fisher Scientific). The flow cytometry analysis was 812
performed using a C6 Accuri flow cytometer (BD Biosciences) based on Prest et al.45. Events 813
were monitored using the FL1 533/30nm and FL3 >670nm detectors. Instrument and gating 814
settings were kept identical for all samples (fixed staining/gating strategy45) and cell counts 815
were converted to microbial loads per gram of faecal material (microbial load index). 816
Stool sample processing and metagenomic analyses 817
Total faecal DNA was extracted following the International Human Microbiome Standards 818
(IHMS) guidelines (SOP-07V2 H). Samples were sequenced in a non-randomized order using 819
ion-proton technology (ThermoFisher Scientific) resulting in 23.3 ± 4.0 million (mean ± SD) 820
single-end short reads with an on average length of 150 bases. Sequencing was carried out with 821
standardized protocols at a single site (Metagenopolis, Paris) over a period of 18 months. There 822
was no significant bias of the sequencing date for different Metacardis groups (Kruskal Wallis 823
p value of 0.4 for HC, MMC, UMMS & IHD groups). Reads were cleaned using Alien 824
Trimmer (v0.4.0)46 in order (i) to remove resilient sequencing adapters and (ii) to trim low-825
quality nucleotides at the 3’ side using a quality and length cut-off of 20 and 45bp, respectively. 826
Cleaned reads were subsequently filtered from human and other possible food contaminant 827
DNA using human genome RCh37-p10, Bos taurus and Arabidopsis thaliana with an identity 828
score threshold of 97%. Gene abundance profiling was performed using the 9.9 million gene 829
integrated reference catalogue of the human microbiome47. Filtered high-quality reads were 830

NMED-A111916
40
mapped with an identity threshold of 95% to the 9.9million-gene catalogue using Bowtie2 831
(v2.3.4)48 included in METEOR v3.2 (https://forgemia.inra.fr/metagenopolis/meteor) 832
software49. Gene abundance profiling table was generated by means of a two-step procedure 833
using METEORv3.2. First, reads mapped to a unique gene in the catalogue were attributed to 834
their corresponding genes. Second, reads that mapped with the same alignment score to 835
multiple genes in the catalogue were attributed according to the ratio of their unique mapping 836
counts. Gene abundance table was processed for rarefaction and normalization and further 837
analysis using the MetaOMineR (momr, v1.31) R package5. To decrease technical bias due to 838
different sequencing depth and avoid any artifacts of sample size on low abundance genes, read 839
counts were rarefied. The gene abundance table was rarefied to 10million reads per sample by 840
random sampling of 10million mapped reads without replacement. The resulting rarefied gene 841
abundance table was normalized according to the fragments per kilo base per million mapped 842
reads (FPKM) approach to give the gene abundance profile table. 843
Metagenomic species (MGS) are co-abundant gene groups with more than 500 genes 844
corresponding to microbial species. 1436 MGS were clustered from 1267 human gut 845
microbiome samples used to construct the 9.9 million-gene catalogue47. MGS abundances were 846
estimated as the mean abundance of the 50 genes defining a robust centroid of the cluster (if 847
more than 10% these genes gave positive signals). Abundances were corrected for bacterial 848
cell count by multiplying by an index factor calculated as the bacterial cell count of the sample 849
divided by the mean value of this bacterial cell count over the dataset as a whole. MGS 850
taxonomical annotation was performed using all genes by sequence similarity using NCBI 851
blast N; a species-level assignment was given if >50% of the genes matched the same reference 852
genome of the NCBI database (November 2016 version) at a threshold of 95% of identity and 853

NMED-A111916
41
90% of gene length coverage. Remaining MGS were assigned to a given taxonomical level 854
from genus to super-kingdom level, if more than 50% of their genes had the same level of 855
assignment. MGS richness (MGS count) was calculated directly from the rarefied MGS 856
abundance matrix. Bacterial gene richness (gene count) was calculated by counting the number 857
of genes detected at least once in a given sample, using the average number of genes counted 858
in 10 independent rarefaction experiments. MGS richness (MGS count) was calculated directly 859
from the rarefied MGS abundance matrix. 860
Customized microbial module analysis 861
Customized module sets included previously described gut metabolic modules (GMM)50 862
covering bacterial and archaeal metabolism specific to the human gut environment with a focus 863
on anaerobic fermentation processes, expanded with a specific set of six modules zooming in 864
on bacterial TMA metabolism51. Additionally, following a previously published strategy to 865
build manually curated gutspecific metabolic modules50,52, we constructed a novel set of 20 866
modules describing microbial phenylpropanoid metabolism (phenylpropanoid metabolism 867
modules, PPM) from shotgun metagenomic data. Abundances of customized modules were 868
derived from the ortholog abundance tables using Omixer-RPMv1.0 869
(https://github.com/raeslab/omixer-rpm)50,53. The coverage of each metabolic variant encoded 870
in a module was calculated as the number of steps for which at least one of the orthologous 871
groups was found in a metagenome, divided by the total number of steps constituting the 872
variant. The coverage of the GMM was defined as equal to the one of the variants with 873
maximum coverage. Module presence/absence was identified with a detection-threshold of 874
more than 66% coverage to provide tolerance to miss-annotations and missing data in 875

NMED-A111916
42
metagenomes. Module abundance was calculated as the median of KEGG orthology (KO) 876
abundance in the pathway with maximum coverage. Abundances were corrected for bacterial 877
cell count similarly to MGSs. 878
Metabolic profiling 879
We deployed a comprehensive metabolic phenotyping strategy combining in-house analysis by 880
proton nuclear magnetic resonance (1H-NMR) spectroscopy, gas chromatography coupled to 881
mass spectrometry (GC-MS) and targeted ultra-performance liquid chromatography coupled to 882
tandem mass spectrometry (UPLC-MS/MS) with untargeted UPLC-MS data generated by 883
Metabolon as described in detail below: 884
1H Nuclear Magnetic Resonance spectroscopy (
1H-NMR):
1H-NMR experiments were 885
carried out using a Bruker Avance spectrometer (Bruker GmbH) operating at 600MHz as 886
reported54-56. Structural assignment was performed using data from literature, HMDB 887
(http://www.hmdb.ca/), S-Base (Bruker GmbH) and in-house databases54. 1H-NMR spectra 888
were pre-processed and exported to Matlab for multivariate statistical analyses using 889
orthogonal partial least square discriminant analysis (O-PLS-DA) as previously reported57. 890
Absolute metabolite quantifications were also derived using Bruker’s ―In Vitro Diagnostics for 891
research‖ (IVDr) quantification algorithms. 892
Gas Chromatography coupled Mass Spectrometry (GC-MS) semi-targeted profiling: 893
Serum samples were prepared, analyzed and processed using standard protocols. Briefly, 894
serum samples (100μL) were cleaned up with methanol protein precipitation, evaporated to 895
dryness, derivatized and injected to an Agilent 7890B-5977B Inert Plus GC-MS system. The 896
NMED-A111916
43
chromatographic column was an Agilent ZORBAX DB5- MS (30 m X 250µm X 0.25µm + 897
10m Duragard). The temperature gradient was 37.5min long and the mass analyzer was 898
operated in full scan mode between 50-600m/z. Peaks were annotated with the use of the Fiehn 899
library (Agilent G1676AA Fiehn GC/MS Metabolomics RTL Library, User Guide, 900
Agilent Technologies, 901
https://www.agilent.com/cs/library/usermanuals/Public/G1676-90001_Fiehn.pdf). Metabolic 902
features with high reproducibility (CV <30%) and linearity (i.e. dilution signal rho > 0.9 FDR 903
corrected p < 0.05 (1-tailed-Spearman)) were kept in the final dataset resulting in one hundred 904
and two annotated metabolic features. 905
UPLC-MS/MS isotopic quantification of methylamines and carnitines. Ultra-Performance 906
Liquid Chromatography-Tandem Mass Spectrometry (UPLC-MS/MS) was employed for the 907
determination of absolute concentrations for trimethylamine (TMA), trimethylamine-N-oxide 908
(TMAO), choline, betaine, γ-butyrobetaine, betaine-aldehyde, butyryl-carnitine, isovaleryl-909
carnitine, OH-isovaleryl-carnitine, stearoyl-carnitine, oleoyl-carnitine, linoleoyl-carnitine, 910
myristoyl-carnitine, lauroyl-carnitine and decanoyl-carnitine. 911
Serum samples (50μL) were prepared as follows: I) samples were spiked with 10μL Internal 912
Standard (IS) solution (13C3/15N-TMA, d9-TMAO, d4-choline, d9-isovaleryl carnitine and d9-913
betaine in water; 1mg/L, Sigma-Aldrich), II) 30μL of ethyl-2-bromoacetate solution (22.5g/L 914
ethyl-2-bromoacetate, 1.4% NH4OH in acetonitrile) were added and derivatisation of 915
trimethylamines (TMA and 13C3/15N-TMA) to their ethoxy- analogues was completed after 916
30minutes at room To, III) 910μL of protein/lipid precipitation solution (94% 917
acetonitrile/5%water/1% formic acid) was added, samples were centrifuged for 20minutes (4oC, 918

NMED-A111916
44
20,000g) and 400μL the supernatants were transferred to UPLC-autosampler 500μL well-plates. 919
Sample injections (5μL, full loop) were performed to a Waters Acquity UPLC-Xevo TQ-S 920
UPLCMS/MS system equipped with an Acquity BEH HILIC (2.1×100mm, 1.7µm) 921
chromatographic column. An isocratic elution was applied with 10mM ammonium formate in 922
95:5 (v/v) acetronitrile:water for 11.5minutes at 500μL/min and 50oC. Positive electrospray 923
(ESI+) was used as ionisation source and mass spectrometer parameters were set as follows: 924
capillary, cone and sources voltages at -700, -18 and 50V, respectively, desolvation 925
temperature at 600oC, desolvation/cone/nebuliser gases were high purity nitrogen at 1000L/hr, 926
150L/hr and 7bar, respectively. Collision gas was high purity argon. Mass spectrometer was 927
operated in a multiple reaction monitoring (MRM) mode. The monitored transitions were the 928
following: for derivatised-TMA, +146à+118/59 m/z (23/27V); for derivatised-13C3/15N-TMA, 929
+150à+63/122 m/z (27/22V); for TMAO, +76à+59/58 m/z (12/13V); for d9-TMAO, +85à+68/66 930
m/z (18/20 V); for choline, +104à+60/45 m/z (20/22V); for d4-choline, +108à+60/45 m/z 931
(20/22V); for isovaleryl-carnitine, +246à+85/145 m/z (19/19V); for d9-isovaleryl-carnitine, 932
+255à+85 m/z (19V); for betaine, +118à+59/73 m/z (18/19V); for d9-betaine, +127à+68 m/z 933
(19V); for γ-butyrobetaine, +146à+87/60 m/z (17/19V); for betaine aldehyde, +103à+60.5/74 934
m/z (12/12V); for butyryl-carnitine, +232à+85/173 m/z (14/12V); for OH-isovaleryl-carnitine, 935
+262à+86/61 m/z (20/20V); for stearoyl-carnitine, +428à+86/371 m/z (21/17V); for oleoyl-936
carnitine, +426à+86/61 m/z (22/22V); for linoleoyl-carnitine, +424à+86/69 m/z (24/24V); for 937
myristoyl-carnitine, +372.5à+86/61 m/z (24/24V); for lauroyl-carnitine, +344.5à+86/61 m/z 938
(21/21V); for decanoyl-carnitine, +316.5à+86/145 m/z (21/21V). The system was controlled by 939
the MassLynxTM (Waters corporation; Version 4.2) software, also used for the data acquisition 940
and analysis. 941

NMED-A111916
45
Ultra-Performance Liquid Chromatography coupled to Mass Spectrometry (UPLC-MS) 942
untargeted profiling. Serum samples were extracted and profiled by Metabolon (Durham, NC) 943
using a UPLC-MS based methodology58. Annotated metabolites and unknown features 944
(denoted X-00000) were identified by comparing sample features with ion features in a 945
reference database of pure chemical standards and previously detected unknowns, followed by 946
detailed visual inspection and quality control as reported59. 947
For all metabolomic assays, we randomized the sample preparation order across the whole 948
study so that each sample preparation batch included samples from all study groups. For MS 949
untargeted assays, median batch-correction was performed by adjusting batch-wise study 950
sample variable medians according to a scalar derived from adjusting pooled reference sample 951
medians, so that pooled reference sample medians are identical across all batches. 952
The randomized sample-preparation batches were also tested for association with study groups 953
using univariate statistics (Fisher’s Exact or Kruskal-Wallis) and P > 0.05 was observed across 954
all methods (GCMS, Fisher’s Exact P = 0.23; UPLCMS targeted, Fisher’s exact P = 0.12 and 955
UPLCMS untargeted (Metabolon) Fisher’s Exact P = 0.65). In addition, NMR run order 956
exhibited a Kruskal Wallis P = 0.49. To choose a single measurement for the duplicate 957
metabolites observed across platforms, we prioritized measurements based on the analytical 958
quality of the data as following: 959
1) Targeted quantification using isotopic standards (e.g. UPLC-MS/MS for acylcarnitines and 960
TMA). 961

NMED-A111916
46
2) Relative abundance with structural ID confirmed by native standards (e.g. Metabolon 962
UPLC-MS). 963
3) Relative/absolute or quantification by NMR calibrated against a database/reference dataset 964
(e.g. > NMR quantifications and manually assigned peaks) 965
4) Relative or quantification with metabolite ID check against a standards database (e.g. GC-966
MS) 967
Drug deconfounding analysis 968
The pipeline was used to assess to what extent observed differences between groups of study 969
participants in microbiome, metabolome and bioclinical feature abundance are confounded, in 970
the sense of, being consequences of other (treatment or risk factor) variables different between 971
the groups more so than characteristic of the specific phenotype itself. We employed the post-972
hoc filtering approach implemented in the R package metadeconfoundR (v0.1.8 - see 973
https://github.com/TillBirkner/metadeconfoundR or https://doi.org/10.5281/zenodo.4721078) 974
that was devised within the MetaCardis consortium8. 975
The pipeline has two steps. In the first, all associations between -omics features and the set of 976
independent variables (disease status, drug treatment status, and risk markers including age, 977
and smoking status) are determined under nonparametric statistics (Mann-Whitney U test or 978
Spearman tests, adjusted for multiple testing using the Benjamini-Hochberg method). For each 979
feature significantly (FDR < 0.1) associated with defined phenotype status, it is checked 980
whether it has significant associations with any potential confounder. If not, it is considered 981
NMED-A111916
47
trivially unconfounded (NC - Not Confounded). If at least one covariate also has significant 982
association with the feature, then for each such covariate a post-hoc test for confounding is 983
applied. This test takes the form of a nested linear model comparisons (likelihood ratio test for 984
P-values), where the dependent variable is the feature (X), and the independent variables are 985
the disease status (A) and the tested covariate (B) versus a model containing only the covariate 986
(B), thus testing whether disease status (A) adds explanatory statistical power beyond the 987
covariate (B). If this holds (likelihood ratio test (LRT) p < 0.05) for all covariates (B), then 988
disease status is confidentially deconfounded (CD) concerning its effect on feature X; it cannot 989
be reduced to any confounding factor. For each covariate (B) where significance is lost, a 990
complementary modelling test is performed of the complementary model pairs - predicting X 991
as a function of (A) and (B) versus a model containing (A) alone, thus testing whether the 992
covariate (B) in turn is equally reducible to (A). If for at least one such covariate (B), (B) has 993
independent effect (LRT p < 0.05) on top of (A), then the feature X is considered confounded 994
by (B). However, if in none of the pairwise tests, the original significance holds, then (A) and 995
(B) are considered so correlated that their relative influence cannot be disentangled. We 996
consider these cases laxly deconfounded (LD), in the sense that for these cases clear 997
confounding influence can neither be concluded nor ruled out. The R package was applied to 998
the present dataset considering medication status either as binary variables or as normalized 999
dosages. 1000
Our deconfounding pipeline takes into account linear effects related to drug categories. Still, 1001
we were not able to control for every possibly lifestyle confounding factor making a lack of 1002
full confounding adjustment a limitation of our study. 1003
NMED-A111916
48
Statistical analyses 1004
Down-sampled microbiome functional profile and taxonomic composition data, metabolite and 1005
quantitative clinical phenotype measurements were assessed between and within groups using 1006
nonparametric tests (Mann-Whitney U test, Spearman test) corrected for multiple testing using 1007
the Benjamini-Hochberg approach. All tests undertaken as part of the univariate biomarker 1008
analyses involved comparing only two groups. The main exception was the comparison between 1009
the three study centers where we applied a Kruskal-Wallis test. Nonparametric directional 1010
standardized effect sizes were likewise taken as the Cliff’s Delta and Spearman Rho, respectively. 1011
Classification models were built using multivariate orthogonal partial least squares- discriminant 1012
analysis (O-PLS-DA) using ropls r package. ROC analysis was performed using ROCR package. 1013
To control for influence of covariates associated with disease severity including sex, smoking, 1014
dietary indices and drug treatment a post-hoc test approach was adopted as outlined above. R 1015
packages including lmtest, orddom, ropls, ROCR, circlize, ggplot2, PCMCR using R versions 1016
4.0.2 and R studio versions 1.4.1717 and 1.2.5033 were used for various analyses. 1017
Data Availability 1018
Supplementary Information on data availability is linked to the online version of the paper at 1019
www.nature.com/nature. Raw shotgun sequencing data that support the findings of this study 1020
have been deposited in European Nucleotide Archive with accession codes PRJEB37249, 1021
PRJEB38742, PRJEB41311, and PRJEB46098 with public access. Metabolome data have been 1022
uploaded to Metabolights and MassIVE with respective accession numbers i.e., serum UPLCMS, 1023
serum NMR and urine NMR with accession number MTBLS3429, serum GCMS with accession 1024
NMED-A111916
49
number MassIVE MSV000088042, and additional isotopically quantified serum metabolites 1025
using UPLC-MS/MS with accession number MassIVE MSV000088043. Processed 1026
pseudonymized per-subject -omics and metadata are provided in Supplementary Tables 9-13, 1027
and medication profiles are given in Supplementary Table 14. 1028
Code availability 1029
The novel drug-aware univariate biomarker testing pipeline, described in full elsewhere8 , is 1030
available as an R package (metadeconfoundR; Birkner et al., manuscript in preparation) on 1031
Github (https://github.com/TillBirkner/metadeconfoundR) and also under 1032
https://doi.org/10.5281/zenodo.4721078. The latest version (0.1.8) of this package was used to 1033
generate the data shown in this publication. In addition, the scripts using this package to perform 1034
the analysis here presented available under https://doi.org/10.5281/zenodo.5516219. 1035
1036
Extended Data Figure 1. Overview of selected bio-clinical variables of the various groups. 1037
Box plots (above) representing the distribution of key bio-clinical variables in various study 1038
groups (lower line, lower quartile; medium line, median; upper line, upper quartile). Table 1039
(below) shows the two-sided MWU P for respective group comparisons using HC (n = 275), 1040
MMC (n = 372), UMMC (n = 222), IHD (n = 372), ACS (n = 112), CIHD (n = 158), HF (n = 1041
102). IHD: ischemic heart disease patients, HC: healthy controls, MMC: metabolically matched 1042
controls, UMMC unmedicated metabolically matched controls, ACS: acute coronary syndrome, 1043
CIHD: chronic IHD, HF: heart failure due to CIHD, BMI: body mass index; HbA1c: glycated 1044
haemoglobin, pro-ANP: pro-atrial natriuretic peptide, MWU: Mann-Whitney U. 1045

NMED-A111916
50
Extended Data Figure 2. Microbiome findings from the literature. Cuneiform plot shows 1046
literature review of gut microbial taxonomic and predicted functional features reported to be 1047
associated with IHD, while highlighting their individual replication in the present MetaCardis 1048
study group either as a general dysmetabolism biomarker (seen only in case of HC versus 1049
MMC), or as an IHD biomarker (seen also in case of MMC versus IHD) (Supplementary Table 1050
15). The literature review was performed as a keyword search in PubMed (Medline) using 1051
combinations of the words ―microbiota‖ and ―microbiome‖ with the word ―atherosclerosis‖, 1052
―cardiovascular disease‖, ―coronary artery disease‖, ―ischemic heart disease‖, ―myocardial 1053
infarction‖, ―acute coronary syndrome‖, ―angina pectoris‖ and ―heart failure‖. Studies11,13,60-71 1054
were identified that met the following criteria: 1) published during the recent 15 years, 2) 1055
reporting data from human studies with at least 15 participants, 3) using culture-independent 1056
methods for microbiota profiling and 4) evaluating the link between human microbiota and 1057
manifestations of impaired heart disease (Supplementary Table 16). Results on functional 1058
features were derived from four studies using whole-genome shotgun sequencing11,13,69,70 Results 1059
imputed from 16S rRNA gene analyses were not included. Point marker color and size reflect 1060
MetaCardis findings (Cliff’s delta), with arrows displaying direction of effects. Literature 1061
findings are shown at a uniform effect size. Markers are shown only for features significantly 1062
different in abundance (FDR < 0.1) and have a bold border if they cannot be reduced to the 1063
confounding influence of any drug or drug combination prescribed to treat dysmetabolism. 1064
While the majority of literature findings are recaptured in our study when comparing HC and 1065
IHD, relatively fewer were found in MMC and IHD comparisons, implying them to be general 1066
markers of dysmetabolism rather than being IHD-only microbiome markers. Two-sided MWU 1067
tests were used for assessing the significance of group-wise comparisons using HC (n = 275), 1068

NMED-A111916
51
MMC (n = 372), UMMC (n = 222) and IHD (n = 372) groups. Multiple testing corrections were 1069
done using Benjamini-Hochberg method and FDR <= 0.1 was considered significant. IHD: 1070
ischemic heart disease patients, HC: healthy controls, MMC: metabolically matched controls, 1071
MWU: Mann-Whitney-U tests, FDR: false-discovery rate. 1072
Extended Data Figure 3: Distribution of differential features among various group 1073
comparisons pre- and post- deconfounding. (a) Venn diagrams showing the comparative shift 1074
in the number of gut microbiome and metabolome features that remain differentially abundant 1075
(FDR <0.1) in various group comparisons when healthy individuals (HC) and drug-treated IHD 1076
cases are compared to untreated metabolically matched controls (UMMC) or (b) drug-treated 1077
metabolically matched controls (MMC) without any adjustments for potential confounders 1078
followed by (c) drug-deconfounding. Two-sided MWU tests were used for assessing the 1079
significance of group-wise comparisons using HC (n = 275), MMC (n = 372), UMMC (n = 222) 1080
and IHD (n = 372) groups. Multiple testing corrections were done using Benjamini-Hochberg 1081
method and FDR <= 0.1 was considered significant. IHD: ischemic heart disease patients, 1082
MWU: Mann-Whitney-U tests, FDR: false-discovery rate. 1083
Extended Data Figure 4: Operational classification of microbiome and metabolome 1084
features from the perspective of IHD pathology (Further details covered in supplementary 1085
methods section). 1086
A classification tree was constructed based on significance and alignment of effect size and 1087
directionality of microbiome and metabolome features in the various group comparisons leading 1088
to the identification of: 1089
1) Features that reflect metabolic dysregulation in the individual but are not associated with 1090
diagnosed IHD: dysmetabolism features (DMF). 1091

NMED-A111916
52
2) Features that are significantly associated with IHD but are also significantly altered in 1092
metabolically dysregulated individuals in the same direction; we suggest that these 1093
features are early markers of IHD pathogenesis in individuals with metabolic 1094
dysregulation: IHD escalation features (ESCF). 1095
3) Features that are significantly associated with IHD but are also significantly altered in 1096
metabolically dysregulated individuals in the reverse direction; we suggest that these 1097
features are early markers of IHD seen in metabolically dysregulated individuals. 1098
However, they exhibit reversibility. This may plausibly be due to 1) long-term drug-1099
treatment and improvement in overall lifestyle of the IHD individuals, 2) a compensatory 1100
response to the initiation of disease or 3) a trajectory-associated differential response to 1101
disease development. We propose that some of these features contribute to the 1102
stabilization of IHD and dysmetabolism and we coin those IHD de-escalation features 1103
(DSCF). 1104
4) IHD-specific features (IHDF) that achieve a significant shift only under IHD diagnoses. 1105
Two-sided MWU tests were used for assessing the significance of group-wise comparisons 1106
using HC (n = 275), MMC (n = 372), UMMC (n = 222), IHD (n = 372), ACS (n = 112), 1107
CIHD (n = 158), HF (n = 102) groups. Multiple testing corrections were done using 1108
Benjamini-Hochberg method and FDR <= 0.1 was considered significant. HC: healthy 1109
controls, MMC: metabolically matched controls, UMMC unmedicated metabolically 1110
matched controls, IHD: ischemic heart disease, ACS: acute coronary syndrome, CIHD: 1111
chronic IHD, HF: heart failure due to IHD, MWU: Mann-Whitney U, FDR: false-discovery 1112
rate. 1113
NMED-A111916
53
Extended Data Figure 5: Gut microbial functional features categorization. Gut microbial 1114
functional features (GMM and KEGG modules) categorized as escalation-, de-escalation-, and 1115
IHD-specific biomarkers when features classification scheme (as shown in Figure 3, Extended 1116
Data Figure 4 and described in supplementary methods) was applied to various group 1117
comparisons involving HC, MMC and IHD subjects. HC: healthy controls, MMC: metabolically 1118
matched controls, IHD: ischemic heart disease. 1119
Extended Data Figure 6: Features categorization for ACS subgroup. Microbiome and 1120
metabolome features categorized as escalation-, de-escalation-, and ACS-specific biomarkers 1121
when features classification scheme (as shown in Figure 3, Extended Data Figure 4 and 1122
described in supplementary methods) was applied to various group comparisons involving HC, 1123
MMC and ACS groups. HC: healthy controls, MMC: metabolically matched controls, ACS: 1124
acute coronary syndrome, ESCF: escalation features, DSCF: De-escalation features. Gut 1125
microbiome features included taxonomic (prefix: Taxon) and microbiome density indices, 1126
whereas metabolome features included serum and urinary metabolites. Only features exhibiting 1127
absolute effect size > 0.1 are displayed whereas the full list is given in Supplementary Table 1128
17). 1129
Extended Data Figure 7: Features categorization for CIHD subgroup. Microbiome and 1130
metabolome features categorized as escalation-, de-escalation- and CIHD-specific biomarkers 1131
when features classification scheme (as shown in Figure 3, Extended Data Figure 4 and 1132
described in supplementary methods) was applied to various group comparisons involving HC, 1133
MMC and CIHD groups. HC: healthy controls, MMC: metabolically matched controls, CIHD: 1134
chronic IHD. ESCF: escalation features, DSCF: De-escalation features. Gut microbiome features 1135

NMED-A111916
54
included both taxonomic (prefix: Taxon) and microbiome density indices, whereas metabolome 1136
features included serum and urinary metabolites. Only features exhibiting absolute effect size > 1137
0.1 are displayed whereas the full list is given in Supplementary Table 17). 1138
Extended Data Figure 8: Features categorization for HF subgroup. Microbiome and 1139
metabolome features categorized as escalation-, de-escalation- and HF-specific biomarkers when 1140
features classification scheme (as shown in Figure 3, Extended Data Figure 4 and described in 1141
supplementary methods) was applied to various group comparisons involving HC, MMC and HF 1142
groups. HC: healthy controls, MMC: metabolically matched controls, HF: heart failure due to 1143
CIHD. ESCF: escalation features, DSCF: De-escalation features. Gut microbiome features 1144
included both taxonomic (prefix: Taxon) and microbiome density indices, whereas metabolome 1145
features included serum and urinary metabolites. Only features exhibiting absolute effect size > 1146
0.1 are displayed whereas the full list is given in Supplementary Table 17). 1147
Extended Data Figure 9: Gut microbial functional features categorization for IHD 1148
subgroups. Microbial functional features (GMM and KEG modules) categorized as escalation-, 1149
de-escalation- and subtype-specific biomarkers when features classification scheme (as shown in 1150
Figure 3, Extended Data Figure 4 and described in supplementary methods) was applied to 1151
various group comparisons involving HC, MMC and IHD subgroups (i.e., ACS, CIHD and HF). 1152
HC: healthy controls, MMC: metabolically matched controls, ACS: acute coronary syndrome, 1153
CIHD: chronic IHD, HF: heart failure due to CIHD. Only features exhibiting absolute effect size > 1154
0.1 are displayed whereas the full list is given in Supplementary Table 17). 1155
Extended Data Figure 10. Discriminatory potential IHD subtype-specific features. Here, we 1156
compared clinical variables assessed for risk prediction in the companion manuscript (Model 1) 1157

NMED-A111916
55
(Talmor-Barkan et al.) with our IHD subgroup-specific gut microbiome and metabolomic 1158
features (Model 2) and a combination of the two (Model 3) for their discriminatory potentials 1159
using orthogonal partial least squares- discriminant analysis (O-PLS-DA; ropls r package). 1160
Model 1 included ten variables (i.e. age, sex, body mass index, waist circumference, hip 1161
circumference, waist to hip ratio, systolic blood pressure, diastolic blood pressure, glycated 1162
haemoglobin (factored as > 5.7, 5.7-6.4 and < 6.4 mmol/l) and smoking status). Model 2 1163
included each IHD subgroup-specific metagenomic species and fasting serum metabolites. 1164
Model 3 involved a combination of model 1 and 2 variables. OPLS-DA models were trained on 1165
70% of the subgroup specific population and then tested in 30% of the remaining subgroup 1166
population using 1000 iterations of random sampling (bootstrapping). Boxplots represent the 1167
distribution (center line, median; box limits, upper and lower quartiles; whiskers, 1.5× 1168
interquartile range; points, outliers) of area under the receiver operating characteristic (ROC) 1169
curves derived from 1000 bootstraps based on these models in the training set (A) and test set (B) 1170
using both healthy controls (HC, n = 275) and metabolically matched controls (MMC, n = 372) 1171
relative to the IHD subtype cases (ACS, n = 112, CIHD n = 158 and HF n = 102). Models were 1172
compared using Kruskal-Wallis test and Dunn’s pairwise multiple comparisons post hoc testing 1173
with Bonferroni correction. Dunn’s test P are shown for each comparison HC: healthy controls, 1174
MMC: metabolically matched controls, IHD: ischemic heart disease. ACS: acute coronary 1175
syndrome, CIHD: chronic IHD, HF: heart failure due to CIHD. 1176
1177
Reference: 1178

NMED-A111916
56
43 Levey, A. S. et al. A more accurate method to estimate glomerular filtration rate from 1179
serum creatinine: a new prediction equation. Ann. Intern. Med. 130, 461-470 (1999). 1180
44 Hunter, I., Rehfeld, J. F. & Goetze, J. P. Measurement of the total proANP product in 1181
mammals by processing independent analysis. J. Immunol. Methods 370, 104-110 (2011). 1182
45 Prest, E., Hammes, F., Kötzsch, S., van Loosdrecht, M. C. & Vrouwenvelder, J. S. 1183
Monitoring microbiological changes in drinking water systems using a fast and 1184
reproducible flow cytometric method. Water Res. 47, 7131-7142 (2013). 1185
46 Criscuolo, A. & Brisse, S. AlienTrimmer: a tool to quickly and accurately trim off 1186
multiple short contaminant sequences from high-throughput sequencing reads. Genomics 1187
102, 500-506 (2013). 1188
47 Li, J. et al. An integrated catalog of reference genes in the human gut microbiome. Nat. 1189
Biotechnol. 32, 834-841 (2014). 1190
48 Langmead, B. & Salzberg, S. L. Fast gapped-read alignment with Bowtie 2. Nat. Methods 1191
9, 357 (2012). 1192
49 Pons, N. et al. METEOR, a platform for quantitative metagenomic profiling of complex 1193
ecosystems. Journées Ouvertes en Biologie, Informatique et Mathématiques http://www. 1194
jobim2010. fr/sites/default/files/presentations/27Pons. pdf (2010). 1195
50 Vieira-Silva, S. et al. Species–function relationships shape ecological properties of the 1196
human gut microbiome. Nat. Microbiol. 1, 1-8 (2016). 1197
51 Falony, G., Vieira-Silva, S. & Raes, J. Microbiology meets Big Data: the case of gut 1198
microbiota–derived trimethylamine. Annu. Rev. Microbiol. 69, 305-321 (2015). 1199
52 Valles-Colomer, M. et al. The neuroactive potential of the human gut microbiota in 1200
quality of life and depression. Nat. Microbiol. 4, 623-632 (2019). 1201
NMED-A111916
57
53 Darzi, Y., Falony, G., Vieira-Silva, S. & Raes, J. Towards biome-specific analysis of 1202
meta-omics data. ISME J. 10, 1025-1028 (2016). 1203
54 Dona, A. C. et al. A guide to the identification of metabolites in NMR-based 1204
metabonomics/metabolomics experiments. Comput. Struct. Biotechnol. J. 14, 135-153 1205
(2016). 1206
55 Rodriguez-Martinez, A. et al. J-resolved 1H NMR 1D-projections for large-scale 1207
metabolic phenotyping studies: application to blood plasma analysis. Anal. Chem. 89, 1208
11405-11412 (2017). 1209
56 Dona, A. C. et al. Precision high-throughput proton NMR spectroscopy of human urine, 1210
serum, and plasma for large-scale metabolic phenotyping. Anal. Chem. 86, 9887-9894 1211
(2014). 1212
57 Würtz, P. et al. Metabolite profiling and cardiovascular event risk: a prospective study of 1213
3 population-based cohorts. Circulation 131, 774-785 (2015). 1214
58 Long, T. et al. Whole-genome sequencing identifies common-to-rare variants associated 1215
with human blood metabolites. Nat. Genet. 49, 568-578 (2017). 1216
59 DeHaven, C. D., Evans, A. M., Dai, H. & Lawton, K. A. Organization of GC/MS and 1217
LC/MS metabolomics data into chemical libraries. J. Cheminformatics 2, 1-12 (2010). 1218
60 Liu, H. et al. Alterations in the gut microbiome and metabolism with coronary artery 1219
disease severity. Microbiome 7, 68 (2019). 1220
61 Lanter, B. B., Sauer, K. & Davies, D. G. Bacteria present in carotid arterial plaques are 1221
found as biofilm deposits which may contribute to enhanced risk of plaque rupture. MBio 1222
5 (2014). 1223

NMED-A111916
58
62 Emoto, T. et al. Characterization of gut microbiota profiles in coronary artery disease 1224
patients using data mining analysis of terminal restriction fragment length polymorphism: 1225
gut microbiota could be a diagnostic marker of coronary artery disease. Heart Vessels 32, 1226
39-46 (2017). 1227
63 Ott, S. J. et al. Detection of diverse bacterial signatures in atherosclerotic lesions of 1228
patients with coronary heart disease. Circulation 113, 929-937 (2006). 1229
64 Yin, J. et al. Dysbiosis of gut microbiota with reduced trimethylamine‐ N‐ oxide level in 1230
patients with large‐ artery atherosclerotic stroke or transient ischemic attack. J. AM. 1231
Heart Assoc. 4, e002699 (2015). 1232
65 Zhu, Q. et al. Dysbiosis signatures of gut microbiota in coronary artery disease. Physiol. 1233
Genomics 50, 893-903 (2018). 1234
66 Kelly, T. N. et al. Gut microbiome associates with lifetime cardiovascular disease risk 1235
profile among bogalusa heart study participants. Circ. Res. 119, 956-964 (2016). 1236
67 Zheng, Y.-Y. et al. Gut Microbiome-Based Diagnostic Model to Predict Coronary Artery 1237
Disease. J. Agric. Food Chem. 68, 3548-3557 (2020). 1238
68 Koren, O. et al. Human oral, gut, and plaque microbiota in patients with atherosclerosis. 1239
Proc. Natl. Acad. Sci. USA 108, 4592-4598 (2011). 1240
69 Feng, Q. et al. Integrated metabolomics and metagenomics analysis of plasma and urine 1241
identified microbial metabolites associated with coronary heart disease. Sci. Rep. 6, 1-14 1242
(2016). 1243
70 Cui, X. et al. Metagenomic and metabolomic analyses unveil dysbiosis of gut microbiota 1244
in chronic heart failure patients. Sci. Rep. 8, 1-15 (2018). 1245

NMED-A111916
59
71 Sanchez-Alcoholado, L. et al. Role of gut microbiota on cardio-metabolic parameters and 1246
immunity in coronary artery disease patients with and without type-2 diabetes mellitus. 1247
Front. Microbiol. 8, 1936 (2017). 1248
1249
1250
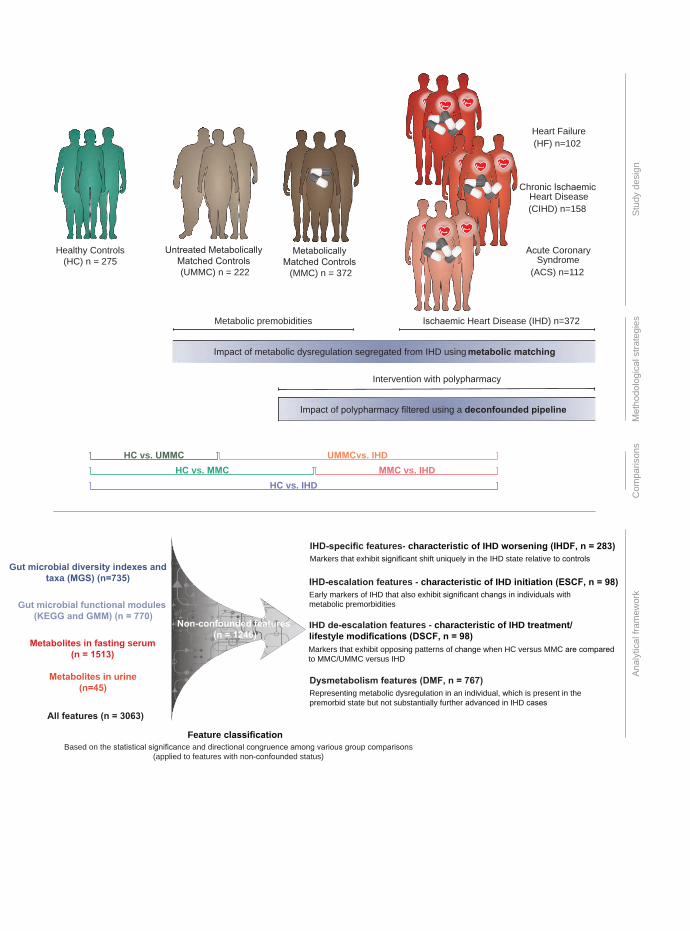
Feature classification
IHD-specific features- characteristic of IHD worsening (IHDF, n = 283)Markers that exhibit significant shift uniquely in the IHD state relative to controls
IHD-escalation features - characteristic of IHD initiation (ESCF, n = 98)Early markers of IHD that also exhibit significant changs in individuals with metabolic premorbidities
IHD de-escalation features - characteristic of IHD treatment/lifestyle modifications (DSCF, n = 98)Markers that exhibit opposing patterns of change when HC versus MMC are comparedto MMC/UMMC versus IHD
Dysmetabolism features (DMF, n = 767)Representing metabolic dysregulation in an individual, which is present in thepremorbid state but not substantially further advanced in IHD cases
Healthy Controls(HC) n = 275
Untreated Metabolically Matched Controls (UMMC) n = 222
Acute CoronarySyndrome
(ACS) n=112
Chronic IschaemicHeart Disease(CIHD) n=158
Heart Failure(HF) n=102
HC vs. UMMC UMMCvs. IHDHC vs. MMC MMC vs. IHD
HC vs. IHD
Stud
yde
sign
Com
paris
ons
Met
hodo
logi
cals
trate
gies
Anal
ytic
alfra
mew
ork
Ischaemic Heart Disease (IHD) n=372
Intervention with polypharmacy
Impact of polypharmacy filtered using a deconfounded pipeline
Metabolic premobidities
Impact of metabolic dysregulation segregated from IHD using metabolic matching
Based on the statistical significance and directional congruence among various group comparisons(applied to features with non-confounded status)
Gut microbial diversity indexes andtaxa (MGS) (n=735)
Gut microbial functional modules (KEGG and GMM) (n = 770)
Metabolites in fasting serum(n = 1513)
Metabolites in urine(n=45)
All features (n = 3063)
Non-confounded features (n = 1246)
Metabolically Matched Controls
(MMC) n = 372

1537 1506 904 352 361−1.0
−0.5
0.0
0.5
All f
eatu
res
(Clif
f’s D
elta
)
241 191 33 11 16−0.4
−0.2
0.0
0.2
Met
agen
omic
spe
cies
(Clif
f’s D
elta
)
347 219 60 21 51−0.4
−0.2
0.0
0.2
Gut
func
tiona
l mod
ules
(Clif
f’s D
elta
)
932 1084 805 318 293−1.0
−0.5
0.0
0.5
Seru
m m
etab
olite
s(C
liff’s
Del
ta)
17 12 6 2 1−0.50
−0.25
0.00
0.25
Uncorrected − H
C275 vs M
MC
269
Uncorrected − H
C275 vs IH
D372
Uncorrected − M
MC
372 vs IHD
372
Corrected − U
MM
C222 vs IH
D222
Corrected − M
MC
372 vs IHD
372
Urin
ary
met
abol
ites
(Clif
f’s D
elta
) a b
�
�
����
���
�
�
�
�
�
�
�
�
�
���
�
Microbial features Metabolites
< 2.2e-16
0.5
0.6
0.7
0.8
0.9
1.0
Taxa (MG
S)
Function (GM
M)
Function (KEGG
)
Serum m
etabolites
Urine m
etabolites
Cla
ssifi
er p
erfo
rman
ce (A
UC
)
HC vs IHDMMC vs IHD
0.0
< 2.2e-16 < 2.2e-16
< 2.2e-16
< 2.2e-16
26.7
20.918.9
45.5
34.4
36.4
34.2
35.938.9
38.9
2.9 9.9
10.0
2.6
10.5
15.6
14.221.8
25.0
29.827.6
32.7
27.0
29.8
30.6
23.8
35.5
19.9
Bacteroides 1Bacteroides 2PrevotellaRuminococcusHF
CIHD
ACS
IHD
UMMC
MMC
HCH
C
MM
C
UM
MC
NS NS
NS NS
NS
NS NS
5.5e-05
2.1e-04
1.0e-04
6.9e-06
3.7e-05
3.7e-05 6.9e-06
5.2e-03NS
c
d
250000
500000
750000
1000000
Gen
e R
ichn
ess
0 HF
CIH
D
ACS
IHD
UM
MC
MM
C
HC
2.1e-04 NS NS NS NS3.4e-10
HCMMC
UMMC
NS2.1e-04 3.4e-10 2.7e-04 3.3e-03 2.0e-03
2.0e-03 3.1e-03 3.0e-025.0e-02
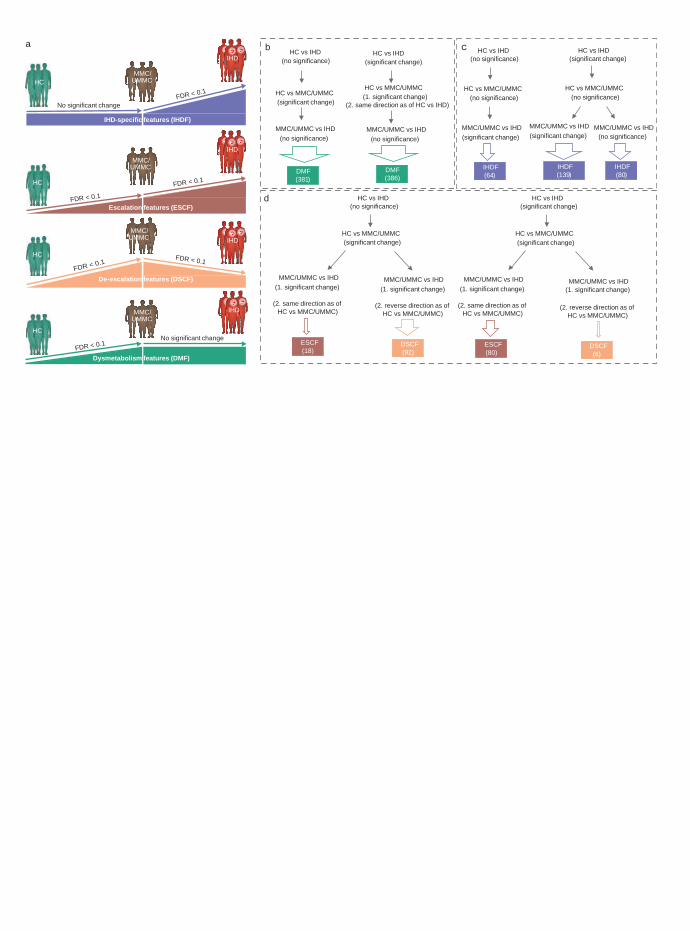
MMC/UMMC vs IHD(no significance)
HC vs IHD(no significance)
HC vs MMC/UMMC
HC vs IHD(significant change)
HC vs MMC/UMMC(significant change)
d
MMC/UMMC vs IHD(significant change)
HC vs IHD(no significance)
HC vs MMC/UMMC(no significance)
IHDF(64)
MMC/UMMC vs IHD(significant change)
HC vs IHD(significant change)
HC vs MMC/UMMC(no significance)
IHDF(139)
IHDF(80)
C
MMC/UMMC vs IHD(no significance)
HC vs IHD(no significance)
HC vs MMC/UMMC(significant change)
DMF(381)
MMC/UMMC vs IHD(no significance)
HC vs IHD(significant change)
HC vs MMC/UMMC(1. significant change)
(2. same direction as of HC vs IHD)
DMF(386)
MMC/UMMC vs IHD(1. significant change)
(2. same direction as of HC vs MMC/UMMC)
ESCF(18)
MMC/UMMC vs IHD(1. significant change)
(2. reverse direction as of HC vs MMC/UMMC)
DSCF(92)
MMC/UMMC vs IHD(1. significant change)
(2. same direction as of HC vs MMC/UMMC)
ESCF(80)
MMC/UMMC vs IHD(1. significant change)
(2. reverse direction as of HC vs MMC/UMMC)
DSCF(6)
b
No significant change
HC
MMC/UMMC
MMC/UMMC
MMC/UMMC
MMC/UMMC
HC
HC
HC
a
IHD-specific features (IHDF)
FDR < 0.1
FDR < 0.1
Escalation features (ESCF)
FDR < 0.1
FDR < 0.1
De-escalation features (DSCF)
FDR < 0.1
IHDIHD
IHDIHD
IHDIHD
FDR < 0.1No significant change
IHDIHD
(significant change)
Dysmetabolism features (DMF)

maleate
N-formylmethionine
X-11979
choline
Fibrinopeptide B (1-13)**
X-24408
N,N,N-trimethyl-alanylproline betaine (TMAP)
X-25433
X-17348
5,6-dihydrouracil
sulfate*
ADpSGEGDFXAEGGGVR*
X-11378
2-hydroxyphenylacetate
X-11381
(2,4 or 2,5)-dimethylphenol sulfate
linoleylcarnitine
mannitol/sorbitol
X-22143
3-methoxytyramine sulfate
X-11795
picolinate
hydroxycotinine
glucuronate
5alpha-pregnan-3beta,20alpha-diol disulfate
gamma-glutamylmethionine
2-keto-3-deoxy-gluconatebetaine-aldehyde
1-oleoyl-GPG (18:1)*
N-acetyl-1-methylhistidine*
salicyluric glucuronide*
4-butyrobetaine
X-12410
N-acetylaspartate (NAA)
N-acetylthreonine
3-(3-amino-3-carboxypropyl)uridine*
O-sulfo-L-tyrosine
X-26119
N-acetyl-beta-alanine
leukotriene B4
X-25422
dihomo-linolenoylcarnitine (C20:3n3 or 6)*
gamma-glutamyltryptophan
L-urobilin
5,6-dihydrouridine
Fibrinopeptide A (7-16)*
Fibrinopeptide B (1-9)**
xanthosine
N-acetylmethionine sulfoxide
gamma-glutamyl-epsilon-lysine
ornithine
2-pyrrolidinone
gamma-glutamyl-alpha-lysine
taurochenodeoxycholate
5alpha-androstan-3alpha,17alpha-diol disulfate
beta-hydroxyisovaleroylcarnitine
p-cresol glucuronide*
2-methoxyacetaminophen sulfate*
X-24456
ethanolamine
7-methylguanine
pseudouridine
2-hydroxy-4-(methylthio)butanoic acid
4-acetaminophen sulfate
1-methyl-5-imidazoleacetate
1-methyl-4-imidazoleacetate
3-methylglutaconate
N6-acetyllysine
succinoyltaurine
androstenediol (3alpha, 17alpha) monosulfate (3)
2-hydroxyfluorene sulfate
1-oleoyl-2-arachidonoyl-GPE (18:1/20:4)*
1-methylhistidine
N-acetylputrescine
methylnaphthyl sulfate (2)*
omeprazole
atorvastatin (lipitor)
3-methylglutarylcarnitine (2)
spermidine
cotinine
N-(2-furoyl)glycine
X-17676
alpha-hydroxymetoprolol
methyl indole-3-acetate
indole-3-carboxylate
X-12112
N(1)-acetylspermidineX-25937
X-24812
norcotinine
N-acetylglutamine
X-24571
xanthine
2-methoxyacetaminophen glucuronide*
trimethylamine
caproate (6:0)
13-HODE + 9-HODE
metoprolol acid metabolite*
3-methylhistidine
X-21796
5-HETE
2-ethylphenylsulfate
X-12007
5,6-dihydrothymine
N-acetyltaurine
glycochenodeoxycholate 3-sulfate
4-methylguaiacol sulfate
glutamine_degradant*
N-acetylneuraminate
X-12100
X-24669
X-25468
N-acetylserine
X-23593
vanillactate
creatinine
p-hydroxyatorvastatin
3-hydroxy-3-methylglutarate
X-12026
X-12713
N-acetyl-3-methylhistidine*
N-acetylalanine
N-carbamoylaspartate
ectoine
2-hydroxyheptanoate*
maltose
X-23666
1,3,7-trimethylurate
tauroursodeoxycholic acid sulfate (1)
dihydroorotate
X-13658
metoprolol
4-acetamidophenol
o-hydroxyatorvastatin
N-acetylarginine
arachidonoylcarnitine (C20:4)
succinimide
N6,N6,N6-trimethyllysine
phenylacetylcarnitine
phenylacetylglutamate
N-acetyl-2-aminoadipate
Taxon: Firmicutes sp. (CAG01001)Taxon: Lachnoclostridium sp. (CAG00333)
12-HHTrE
sphingomyelin (d18:1/20:0, d16:1/22:0)*
1-palmitoyl-2-docosahexaenoyl-GPC (16:0/22:6)
1-myristoyl-2-arachidonoyl-GPC (14:0/20:4)*
3,7-dimethylurate
(2 or 3)-decenoate (10:1n7 or n8)
X-24328
3-hydroxylaurate
X-21353
cholesterol
X-23974
cholesterol sulfateglucoheptonate
4-methylbenzenesulfonate
cholestanol
arachidonoyl ethanolamide
alpha-tocopherol
docosahexaenoate (DHA; 22:6n3)
X-21834
sphingomyelin (d17:2/16:0, d18:2/15:0)*
theobromine
palmitoyl ethanolamide
methyl hexadecanoate
X-17335
sphingomyelin (d18:1/19:0, d19:1/18:0)*
1-stearoyl-2-arachidonoyl-GPI (18:0/20:4)
1-stearoyl-2-oleoyl-GPC (18:0/18:1)
sphingomyelin (d18:0/20:0, d16:0/22:0)*
behenoyl sphingomyelin (d18:1/22:0)*
N-behenoyl-sphingadienine (d18:2/22:0)*
X-21607
tetracosane
3-indoleglyoxylic acid
ethanol
sphingomyelin (d18:1/17:0, d17:1/18:0, d19:1/16:0)1-palmitoleoyl-2-linolenoyl-GPC (16:1/18:3)*methyl oleate
sphingomyelin (d18:2/14:0, d18:1/14:1)*sphingomyelin (d18:2/21:0, d16:2/23:0)*
1-myristoyl-2-palmitoyl-GPC (14:0/16:0)
4-hydroxychlorothalonil
1-linolenoylglycerol (18:3)
1-linoleoyl-GPI* (18:2)*
methyl linolenatelignoceroyl sphingomyelin (d18:1/24:0)
Taxon: unclassified (CAG00064)
Taxon: Lactobacillus rogosae (CAG00414)
Taxon: Clostridium sp. (CAG00493)
Taxon: Bacteroides intestinalis (CAG00298)
Taxon: C. secundus / G. massiliensis (CAG00756)
Taxon: Acetobacter sp. (CAG00188)
Taxon: Ruminococcus callidus (CAG00557)
Taxon: Clostridium sp. (CAG00079)Taxon: Eubacterium ramulus (CAG00554)
Taxon: unclassified (CAG00754)
X-25454
cysteinylglycine disulfide*adipoylcarnitine (C6-DC)
S-adenosylhomocysteine (SAH)
C-glycosyltryptophan
phenylacetylglutamine
2-hydroxyglutarate
N2,N2-dimethylguanosine
gamma-glutamylphenylalanine
N-acetylphenylalanine
allantoin
X-24811
X-23739
cystathionine
X-15503
cys-gly, oxidizedacetoacetate
3-decenoylcarnitine
N6-carbamoylthreonyladenosine
isobutyrylcarnitine (C4)
urate
guaiacol sulfate
3-(4-hydroxyphenyl)lactate (HPLA)
hydroxy-N6,N6,N6-trimethyllysine*
N,N-dimethyl-pro-pro
hydantoin-5-propionate
X-12127
cytidine
X-21471
N-carbamoylvaline
methionine sulfoxide
X-21441
4-cresol
X-12104
cysteine s-sulfate
X-21467
5-hydroxymethyl-2-furoylcarnitine*
N-acetylglucosamine/N-acetylgalactosamine
2-hydroxyhippurate (salicylurate)
N1-methylinosine
dimethylglycine
sphingomyelin (d18:1/21:0, d17:1/22:0, d16:1/23:0)*
phytanate
1-stearoyl-GPI (18:0)
glycerate
1-stearoyl-2-linoleoyl-GPI (18:0/18:2)
1-(1-enyl-stearoyl)-2-linoleoyl-GPE (P-18:0/18:2)*
X-24556
myristoyl dihydrosphingomyelin (d18:0/14:0)*
glycerophosphorylcholine (GPC)carotene diol (1)
glycosyl ceramide (d18:1/20:0, d16:1/22:0)*
1,2-dilinoleoyl-GPC (18:2/18:2)
1-palmitoyl-2-linoleoyl-GPI (16:0/18:2)
beta-cryptoxanthin
ergothioneine
1-linoleoyl-2-linolenoyl-GPC (18:2/18:3)*
1-stearoyl-GPC (18:0)
carotene diol (2)
1-(1-enyl-palmitoyl)-2-linoleoyl-GPC (P-16:0/18:2)*
1-linolenoyl-GPC (18:3)*
1-stearoyl-GPE (18:0)
sphingomyelin (d18:1/22:1, d18:2/22:0, d16:1/24:1)*sphingomyelin (d18:1/14:0, d16:1/16:0)*1-linoleoyl-2-arachidonoyl-GPC (18:2/20:4n6)*
1-linoleoyl-GPC (18:2)
phosphocholine
glycosyl-N-stearoyl-sphingosine (d18:1/18:0)
nonadecanoate (19:0)
carotene diol (3)
1-palmitoyl-GPC (16:0)
sphingomyelin (d17:1/14:0, d16:1/15:0)*
N-palmitoylglycine
stearoyl ethanolamide
1-palmitoyl-2-linoleoyl-GPC (16:0/18:2)
sphingomyelin (d18:2/23:0, d18:1/23:1, d17:1/24:1)*
glycosyl ceramide (d18:1/23:1, d17:1/24:1)*
tartronate (hydroxymalonate)
X-23782
glycerophosphoethanolamine
1-palmitoleoyl-GPC* (16:1)*
1-lignoceroyl-GPC (24:0)
glycosyl-N-tricosanoyl-sphingadienine (d18:2/23:0)*
1-palmitoyl-GPE (16:0)
1-palmitoyl-GPI* (16:0)sphingomyelin
tricosanoyl sphingomyelin (d18:1/23:0)*
1-stearoyl-2-linoleoyl-GPC (18:0/18:2)*
lactosyl-N-behenoyl-sphingosine (d18:1/22:0)*
X-24425
sphingomyelin (d17:1/16:0, d18:1/15:0, d16:1/17:0)*
X-17761
2-palmitoyl-GPC* (16:0)*
1-palmitoyl-2-stearoyl-GPC (16:0/18:0)
2,4-di-tert-butylphenol
Taxon: Ruminococcus sp. (CAG00250)
behenoyl dihydrosphingomyelin (d18:0/22:0)*
1-stearoyl-GPG (18:0)
ursodeoxycholateisoursodeoxycholate
heneicosapentaenoate (21:5n3)
1-stearoyl-rac-glycerol
deoxycholate
tetrahydrocortisone glucuronide (5)
3-hydroxydecanoate
dihomolinolenate (20:3n3 or 3n6)
Taxon: Megamonas funiformi/rupellensis (CAG00417)
gamma-glutamylcitrulline*
octanoylcarnitine (C8)
vanillylmandelate (VMA)
taurine
linoleoylcarnitine (C18:2)*
3beta-hydroxy-5-cholestenoate
hexadecanedioate (C16)
tauro-beta-muricholate
taurodeoxycholic acid 3-sulfate
X-18935
N,N-dimethylalanine
orotate
X-22162
octadecadienedioate (C18:2-DC)*
bilirubin degradation product, C16H18N2O5 (2)**
O-acetylsalicylate
octadecanedioylcarnitine (C18-DC)*
taurocholenate sulfate*
citrulline
bilirubin degradation product, C16H18N2O5 (4)**
X-25790
3-amino-2-piperidone
X-12126succinate
dimethylarginine (ADMA + SDMA)
catechol glucuronide
taurolithocholate 3-sulfate
hexadecenedioate (C16:1-DC)*
N-acetyl-isoputreanine
2-O-methyluridine
3beta,7alpha-dihydroxy-5-cholestenoate
salicylate
bilirubin degradation product, C16H18N2O5 (3)**
2-methylcitrate/homocitrate
nonanoylcarnitine (C9)
linolenoylcarnitine (C18:3)*
octadecenedioylcarnitine (C18:1-DC)*
catechol
biliverdin
octadecenedioate (C18:1-DC)
methylsuccinoylcarnitine
pregnanediol-3-glucuronide
homostachydrine*
taurochenodeoxycholic acid 3-sulfate
X-25420
3-methoxytyrosine
octadecanedioate (C18)glutarylcarnitine (C5-DC)
2-O-methylcytidine
X-21830
bilirubin degradation product, C16H18N2O5 (1)**
Microbial load
Microbial load index
Taxon: Clostridiales sp. (CAG00327)
Taxon: Clostridiales sp. (CAG00259)
Taxon: Clostridiales sp. (CAG00445)
Taxon: Eubacterium siraeum (CAG00653)
Taxon: Lachnospiraceae sp. (CAG00102)
Effect size (Cliff’s Delta) Effect size (Cliff’s Delta)-1 .0 -0 .5 0.0 0.5 1.0 -1 .0 -0 .5 0.0 0.5 1.0
-1 .0 -0 .5 0.0 0.5 1.0
IHD-specific features
IHD de-escalation features
IHD escalation features a
c
b
HC vs IHDHC vs MMC
Serum metabolitesMetagenomic featuresMicrobiome density features
MMC vs IHD
Group comparison
Feature type
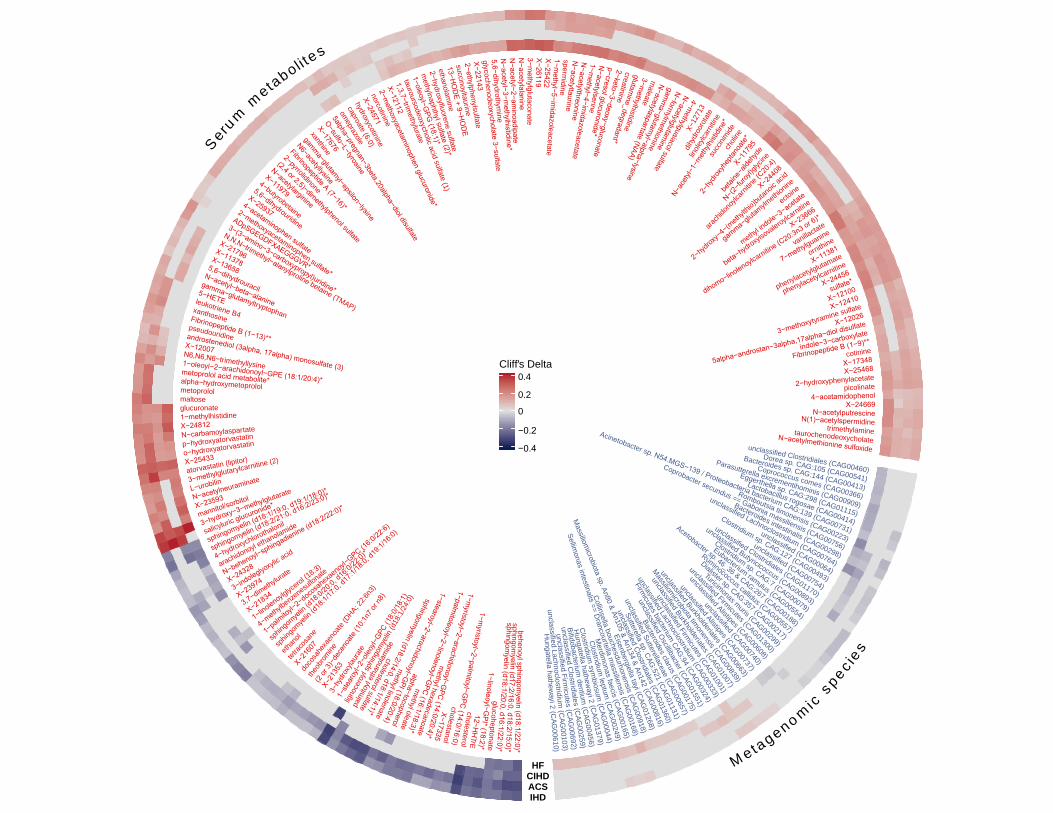
unclassified Clostridiales (CAG00460)
Dorea sp. CAG:105 (CAG00541)
Bacteroides sp. CAG:144 (CAG00413)
Coprococcus comes (CAG00366)
Parasutterella excrementihominis (CAG00909)
Eggerthella sp. CAG:298 (CAG01115)
Lactobacillus rogosae (CAG00414)
Acinetobacter sp. N54.MGS−139 / Proteobacteria bacterium CAG:139 (CAG00731)
Romboutsia timonensis (CAG00223)
Coprobacter secundus == Gabonia massiliensis (CAG00756)
Bacteroides intestinalis (CAG00298)
unclassified Lachnoclostridium (CAG00764)
unclassified (CAG00064)
Clostridium sp. CAG:127 (CAG00493)
unclassified (CAG00754)
unclassified Clostridiales (CAG01170)
unclassified Butyricicoccus (CAG00893)
Clostridium sp. CAG:7 (CAG00079)
Eubacterium ramulus (CAG00554)
Acetobacter sp. 46_36 & CAG:267 (CAG00188)
Ruminococcus callidus (CAG00557)
Dialister sp. CAG:357 (CAG00217)
Turicimonas muris (CAG00299)
unclassified Firmicutes (CAG01300)
unclassified Alistipes (CAG00608)
unclassified (CAG00740)
unclassified Alistipes (CAG00737)
unclassified Burkholderiales (CAG00663)
Massiliomicrobiota timonensis (CAG00839)
unclassified Burkholderiales (CAG01007)
unclassified Firmicutes (CAG01001)
unclassified Lachnoclostridium (CAG00333)
Firmicutes bacterium
CAG:94 (CAG00324)
unclassified Oscillibacter (CAG01551)
Bacteroides clarus (CAG00175)
unclassified Sutterellaceae (CAG00657)
Sutterella sp. CAG:521 (CAG
01131)
unclassified Clostridiales (CAG01360)
Massiliom
icrobiota sp. An80 & An105 & An134 & An142 (CAG00816)
Eisenbergiella tayi (CAG01268)
Collinsella bouchesdurhonensis (CAG00918)
Sellimonas intestinalis == D
rancourtella massiliensis (C
AG00168)
Merdim
onas faecis (CAG
00165)
Clostridium
leptum (C
AG00249)
Clostridium
symbiosum
(CAG
00044)
Hungatella hathew
ayi 2 (CAG
01379)
Bifidobacterium dentium
(CAG
00456)
unclassified Clostridiales (C
AG00259)
unclassified Firmicutes (C
AG00692)
unclassified Lachnoclostridium (C
AG00103)
Hungatella hathew
ayi 2 (CAG
00610)
palm
itoyl
etha
nolam
ide
)0:42/1:81d( nileymognihps lyorecongil1−
stear
oyl−2
−oleo
yl−GPC
(18:
0/18
:1)
3−hy
drox
ylaur
ate
X−21
353
(2 or
3)−d
ecen
oate
(10:1
n7 or
n8)
theob
romine
doco
sahe
xaen
oate
(DHA; 2
2:6n3
)
X−216
07
tetrac
osan
e
ethan
ol
sphin
gomye
lin (d
18:1/
17:0,
d17:1
/18:0,
d19:1
/16:0)
sphin
gomye
lin (d1
8:0/20
:0, d1
6:0/22
:0)*
1−palmitoy
l−2−docosa
hexaenoyl
−GPC (16:0/22:6)
4−methylbenzenesulfonate
1−linolenoylglyc
erol (18:3)
X−218343,7−dimethylu
rate
X−239743−indoleglyoxylic acid
X−24328N−behenoyl−sphingadienine (d18:2/22:0)*
arachidonoyl ethanolamide
4−hydroxychlorothalonil
sphingomyelin (d18:2/21:0, d16:2/23:0)*
sphingomyelin (d18:1/19:0, d19:1/18:0)*
salicyluric glucuronide*
3−hydroxy−3−methylglutarate
mannitol/sorbitolX−23593N−acetylneuraminate
L−urobilin3−methylglutarylcarnitine (2)atorvastatin (lipitor)X−25433o−hydroxyatorvastatinp−hydroxyatorvastatinN−carbamoylaspartateX−24812
1−methylhistidineglucuronatemaltosemetoprololalpha−hydroxymetoprolol
metoprolol acid metabolite*
1−oleoyl−2−arachidonoyl−GPE (18:1/20:4)*
N6,N6,N6−trimethyllysine
X−12007
androstenediol (3alpha, 17alpha) monosulfate (3)
pseudouridine
Fibrinopeptide B (1−13)**
xanthosine
leukotriene B4
5−HETE
gamma−glutamyltryptophan
N−acetyl−beta−alanine
5,6−dihydrouracil
X−13658
X−11378
X−21796
N,N,N−trimethyl−alanylproline betaine (TMAP)
3−(3−amino−3−carboxypropyl)uridine*
ADpSGEGDFXAEGGGVR*
2−methoxyacetaminophen sulfate*
4−acetaminophen sulfate
X−25937
5,6−dihydrouridine
4−butyrobetaine
X−11979
N−acetylarginine
(2,4 or 2,5)−dimethylphenol sulfate
2−pyrrolidinone
Fibrinopeptide A (7−16)*
N6−acetyllysine
gamma−glutamyl−epsilon−lysine
xanthineX−17676
O−sulfo−L−tyrosine
5alpha−pregnan−3beta,20alpha−diol disulfate
omeprazole
caproate (6:0)
hydroxycotinine
X−24571norcotinine
2−methoxyacetam
inophen glucuronide*
X−121121,3,7−trim
ethylurate
tauroursodeoxycholic acid sulfate (1)
1−oleoyl−GPG
(18:1)*
methylnaphthyl sulfate (2)*
2−hydroxyfluorene sulfate
ethanolamine
13−HO
DE + 9−H
OD
Esuccinoyltaurine2−ethylphenylsulfateX−22143glycochenodeoxycholate 3−sulfate5,6−dihydrothym
ineN
−acetyl−3−methylhistidine*
N−acetyl−2−am
inoadipateN
−acetylalanine3−m
ethylglutaconateX−26119X−254221−m
ethyl−5−imidazoleacetate
spermidine
N−acetyltaurine
N−acetylthreonine
1−methyl−4−im
idazoleacetate
N−acetylserine
p−cresol glucuronide*
2−keto−3−deoxy−gluconate
creatinine
glutamine_degradant*
3−methylhistidine
maleate
N−acetylaspartate (NAA)
gamm
a−glutamyl−alpha−lysine
N−formylm
ethionine
N−acetylglutamine
etafl
us l o
caiau
gl yht
em−
4
behenoyl sphingomyelin (d18:1/22:0)*
sphingomyelin (d17:2/16:0, d18:2/15:0)*
sphingomyelin (d18:1/20:0, d16:1/22:0)*
glucoheptonate1−linoleoyl−G
PI* (18:2)*12−H
HTrE
cholesterol
1−myristoyl−2−palm
itoyl−GPC
(14:0/16:0)cholestanol
X−17335
1−myristoyl−2−arachidonoyl−G
PC (14:0/20:4)*
methyl hexadecanoate
1−palmitoleoyl−2−linolenoyl−G
PC (16:1/18:3)*m
ethyl oleatealpha−tocopherol
1−stearoyl−2−arachidonoyl−GPI (18:0/20:4)
methyl linolenate
sphingomyelin (d18:2/14:0, d18:1/14:1)*
etafl
us l
oret
sel o
hc
31721−X
etatoroordyhidlin
oleylc
arnit
ine
N−ac
etyl−
1−m
ethy
lhisti
dine*
succ
inimide
choli
ne
2−hy
drox
yhep
tanoa
te*X−1
1795
betai
ne−a
ldehy
de
N−(2−fu
royl)g
lycine
arach
idono
ylcarn
itine (
C20:4)
X−2440
8
2−hy
droxy−
4−(m
ethylth
io)bu
tanoic
acid
gamma−glutamylmethionine
ectoine
methyl indole−3−acetate
beta−hydroxyisovaleroylc
arnitine
X−23666
dihomo−linolenoylcarnitine (C
20:3n3 or 6)*
vanillactate
7−methylguanine
ornithine
X−11381
phenylacetylglutamate
phenylacetylcarnitine
X−24456
sulfate*
X−12100
X−12410
3−methoxytyramine sulfate
X−12026
5alpha−androstan−3alpha,17alpha−diol disulfate
indole−3−carboxylate
Fibrinopeptide B (1−9)**cotinine
X−17348X−25468
2−hydroxyphenylacetatepicolinate
4−acetamidophenolX−24669
N−acetylputrescineN(1)−acetylspermidine
trimethylaminetaurochenodeoxycholateN−acetylmethionine sulfoxide
seiceps
cimonegateM
Seru
mmetaboli te
s
Cliff's Delta
−0.4
−0.2
0
0.2
0.4
HFCIHDACSIHD

Model 1: Clinical variables aloneModel 2: ACS-specific biomarkersModel 3: Clinical variables with ACS-specific biomarkers
Healthy controls (HC) versus Acute Coronary Syndrome (ACS) in the present study (training set)
0.7640.8510.886
AUROC (Model1) AUROC (Model2)AUROC (Model3)
True
pos
itive
rate
0.0
0.2
0.4
0.6
0.8
1.0c
False positive rate0.0 0.2 0.4 0.6 0.8 1.0
0.9780.9980.999
AUROC (Model 1)AUROC (Model 2)AUROC (Model 3)
False positive rate0.0 0.2 0.4 0.6 0.8 1.0
True
pos
itive
rate
0.0
0.2
0.4
0.6
0.8
1.0
b
Healthy controls (HC) versus Acute Coronary Syndrome (ACS) in Talmor-Barkan et al. (testing set)
Spearman’s rho = 0.46Spearman’s pval = 2.0e-08
Replicated ACS-enriched biomarker Replicated Control-enriched biomarker Non-replicated ACS-enriched biomarker Non-replicated Control-enrichedbiomarker
a
Healthy controls (HC) versus Acute Coronary Syndrome (ACS) (Cliff’s Delta in the present study)
Hea
lthy
cont
rols
(HC
) ver
sus
Acut
e C
oron
ary
Synd
rom
e (A
CS)
(Clif
f’s D
elta
in T
alm
or-B
arka
n et
al.)
-0.5
0.0
0.5
-0.5 0.0 0.5
63% of ACS-enriched biomarkers replicated (40/63)
40% of Control-enriched biomarkers replicated (22/55)

0
50
100
150
0
5
10
15
20
0
10
20
0
1000
2000
3000
0
2
4
6
8
25
50
75
0
50
100
150
30
60
90
120
0
20
40
60
50
100
150
0
20
40
60
0
5
10
HbA
1c (%
)Ag
e (y
ears
)
BMI (
kg/m
²)Sy
stol
ic b
lood
pre
ssur
e (m
mH
g)
Wai
st c
ircum
fere
nce
(cm
)D
iast
olic
blo
od p
ress
ure
(mm
Hg)
Fast
ing
plas
ma
trigl
ycer
ides
(mm
ol/L
)Le
ft ve
ntric
ular
eje
ctio
n fra
ctio
n (%
)
Fast
ing
plas
ma
adip
onec
tin (m
g/L)
Fast
ing
plas
ma
pro-
ANP
(pm
ol/L
)
Fast
ing
plas
ma
CR
P (m
g/L)
Phys
cial
act
ivity
(h/w
eek)
HC275
MMC372
UMMC222
IHD372
ACS112
CIHD158
HF102
HC vs CIHD
Age (years)
BMI (kg/m²)Wasit circumference (cm)
Fasting plasma triglycerides (mmol/L)
Fasting plasma adiponectin (mg/L)
Fasting plasma CRP (mg/L)
HbA1c
Systolic blood pressure (mmHg)
Diastolic blood pressure (mmHg)
Left ventricular ejection fraction (%)
Fasting plasma pro-ANP (pmol/L)
Physical activity (h/week)
HC vs MMC
HC vs UMMC
HC vs IHD
HC vs ACS
HC vs HF
MMC vs IHD
MMC vs ACS
MMC vs CIHD
MMC vs HF
UMMC vs IHD
UMMC vs ACS
UMMC vs CIHD
UMMC vs HF
NS
NS
NS
2.8e-10
< 2.2e-16
< 2.2e-16
< 2.2e-16
< 2.2e-16
2.3e-11
< 2.2e-16
2.3e-16
8.7e-15
2.9e-05
NS
1.2e-05
< 2.2e-16
< 2.2e-16
< 2.2e-16
< 2.2e-16
< 2.2e-16
9.6e-14
1.1e-04
2.2e-07
< 2.2e-16
< 2.2e-16 NS
2.2e-09
< 2.2e-16
< 2.2e-16
< 2.2e-16
< 2.2e-16
2.2e-09
< 2.2e-16
1.4e-02
8.4e-05
7.8e-13
< 2.2e-16
NS
NS
< 2.2e-16
< 2.2e-16
7.2e-12
9.5e-13
2.8e-07
< 2.2e-16
5.8e-04
2.5e-15
3.8e-05
NS
3.1e-10
< 2.2e-16
< 2.2e-16
< 2.2e-16
< 2.2e-16
1.2e-13
< 2.2e-16
8.9e-03
2.5e-13
5.4e-04
4.2e-04
NS
NS
3.6e-07
< 2.2e-16
< 2.2e-16
< 2.2e-16
1.2e-06
2.0e-07
< 2.2e-16
< 2.2e-16
< 2.2e-16
NS
NS
NS
NS
NS
NS
NS
NS
5.1e-03
1.5e-07
3.0e-08
< 2.2e-16
< 2.2e-16
NS
NS
NS
NS
1.4e-04
2.0e-04
< 2.2e-16
1.0e-06
3.0e-03
2.0e-02
NS
1.7e-02
NS
NS
NS
NS
2.1e-02
NS
NS
1.4e-02
2.1e-04
1.2e-04
< 2.2e-16
1.3e-06
NS
NS
NS
NS
NS
NS
1.2e-04
2.8e-04
3.7e-05
< 2.2e-16
< 2.2e-16
3.7e-02
NS
1.0e-06
< 2.2e-16
2.0e-08
3.5e-05
6.3e-03
1.2e-04
5.1e-04
6.9e-10
2.1e-13
< 2.2e-16
7.2e-12
NS
6.5e-07
< 2.2e-16
1.3e-08
1.0e-04
4.2e-03
3.5e-06
3.0e-09
< 2.2e-16
2.8e-09
NS
NS
NS
< 2.2e-16
5.6e-11
7.5e-07
4.2e-13
1.3e-05
1.4e-12
2.0e-15
3.4e-10
NS
1.0e-04
< 2.2e-16
NS
3.1e-14
< 2.2e-16
8.8e-07
7.0e-04
3.3e-04
3.4e-05
7.7e-11
< 2.2e-16
NS
2.1e-07
< 2.2e-16

Arginine transport system (M00229)Biotin biosynthesis, pimeloyl−ACP/CoA => biotin (M00123)
Branched−chain amino acid transport system (M00237)C1−unit interconversion, eukaryotes (M00141)
C1−unit interconversion, prokaryotes (M00140)Cobalamin biosynthesis, cobinamide => cobalamin (M00122)
Coenzyme A biosynthesis, pantothenate => CoA (M00120)Cystine transport system (M00234)
D−Methionine transport system (M00238)Dipeptide transport system (M00324)
Glutamine transport system (M00227)Glycine betaine/proline transport system (M00208)
Heme biosynthesis, glutamate => protoheme/siroheme (M00121)Histidine transport system (M00226)
Lysine/arginine/ornithine transport system (M00225)Menaquinone biosynthesis, chorismate => menaquinone (M00116)
N−Acetylglucosamine transport system (M00205)NAD biosynthesis, aspartate => NAD (M00115)
Octopine/nopaline transport system (M00231)Pantothenate biosynthesis, valine/L−aspartate => pantothenate (M00119)
Peptides/nickel transport system (M00239)PTS system, arbutin−, cellobiose−, and salicin−specific II component (M00272)
PTS system, arbutin−like II component (M00268)PTS system, ascorbate−specific II component (M00283)
PTS system, beta−glucosides−specific II component (M00271)PTS system, cellobiose−specific II component (M00275)
PTS system, fructose−specific II component (M00273)PTS system, fructose−specific II component (M00304)
PTS system, galactitol−specific II component (M00279)PTS system, galactosamine−specific II component (M00287)PTS system, glucitol/sorbitol−specific II component (M00280)
PTS system, glucose−specific II component (M00265)PTS system, lactose−specific II component (M00281)
PTS system, maltose and glucose−specific II component (M00266)PTS system, mannitol−specific II component (M00274)
PTS system, mannose−specific II component (M00276)PTS system, N−acetylgalactosamine−specific II component (M00277)
PTS system, N−acetylglucosamine−specific II component (M00267)PTS system, N−acetylmuramic acid−specific II component (M00303)
PTS system, sorbose−specific II component (M00278)PTS system, sucrose−specific II component (M00269)
PTS system, trehalose−specific II component (M00270)Putative glutamine transport system (M00228)
Pyridoxal biosynthesis, erythrose−4P => pyridoxal−5P (M00124)Riboflavin biosynthesis, GTP => riboflavin/FMN/FAD (M00125)
Tetrahydrofolate biosynthesis, GTP => THF (M00126)Thiamine biosynthesis, AIR => thiamine−P/thiamine−2P (M00127)
Tryptophan metabolism, tryptophan => kynurenine => 2−aminomuconate (M00038)Ubiquinone biosynthesis, prokaryotes, chorismate => ubiquinone (M00117)
HC
275 vs IHD
372M
MC
372 vs IHD
372Literature
AcetobacterAcinetobacterAnaerostipesAnaerotruncusAzospirillumbeta−Carotene biosynthesis, GGAP => beta−carotene (M00097)beta−Oxidation (M00087)beta−Oxidation, acyl−CoA synthesis (M00086)Betaine biosynthesis, choline => betaine (M00555)BifidobacteriumBilophilaCatenibacteriumCitrobacterCloacibacillusCMP−KDO biosynthesis (M00063)CollinsellaCoprobacillusDuodenibacillusEggerthellaEnterobacterEnterococcusErysipelatoclostridiumEscherichiaGemmigerHaemophilusHafniaKlebsiellaLachnospiraLactobacillusLactococcusLipopolysaccharide biosynthesis, inner core => outer core => O−antigen (M00080)MegamonasMethanobrevibacterNegativibacillusParaprevotellaParasutterellaRuthenibacteriumSubdoligranulumSutterellaTriacylglycerol biosynthesis (M00089)TuricimonasTyzzerellaunclassified Alphaproteobacteriaunclassified Burkholderialesunclassified Desulfovibrionaceaeunclassified Eggerthellaceaeunclassified Firmicutesunclassified Rhodospirillaceaeunclassified Sutterellaceae
HC
275 vs IHD
372M
MC
372 vs IHD
372Literature
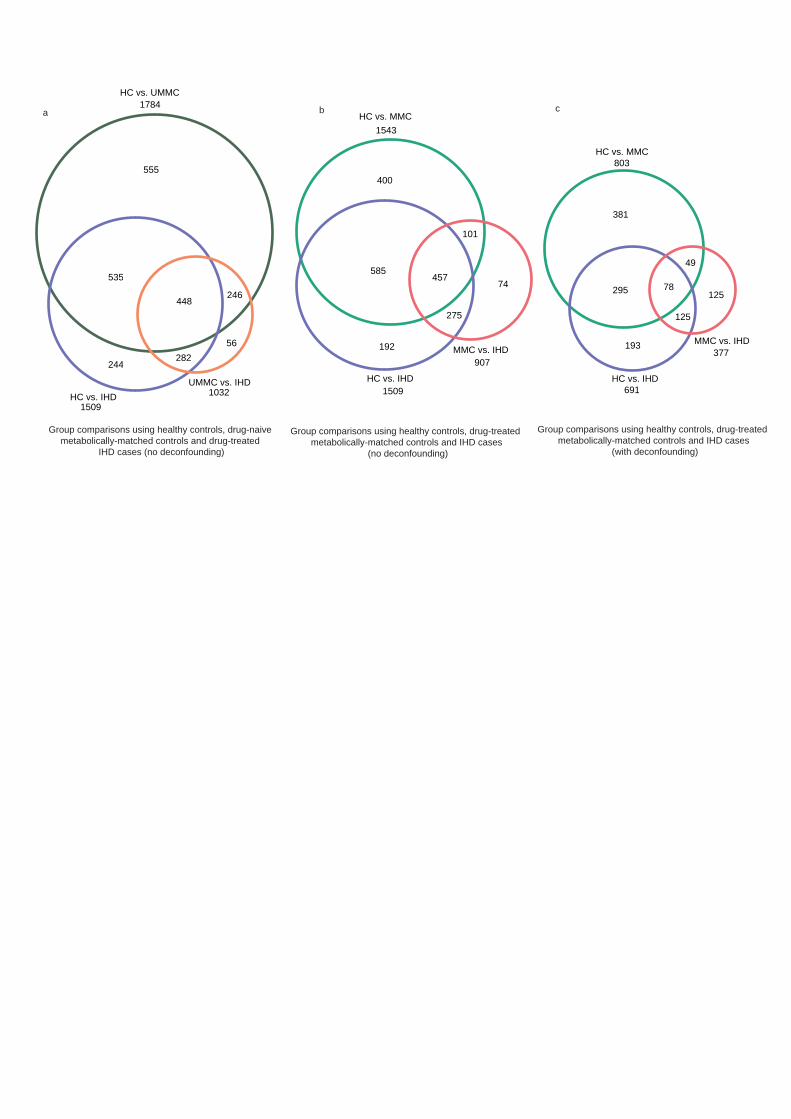
HC vs. IHD691
MMC vs. IHD377
HC vs. MMC803
381
193
295 78
49
125
125
HC vs. IHD1509
MMC vs. IHD907
HC vs. MMC
400
192
585457
101
275
74
HC vs. IHD1509
UMMC vs. IHD1032
HC vs. UMMC1784
a b c
1543
555
244
56
535
246
282
448
Group comparisons using healthy controls, drug-naive metabolically-matched controls and drug-treated
IHD cases (no deconfounding)
Group comparisons using healthy controls, drug-treated metabolically-matched controls and IHD cases
(no deconfounding)
Group comparisons using healthy controls, drug-treated metabolically-matched controls and IHD cases
(with deconfounding)

no signficance (HC vs UMMC) and no signifnace (UMMC vs IHD)
no signficance (HC vs IHD) andno significance (MMC vs IHD) and
signifnace (HC vs MMC)
signficance (HC vs UMMC) andno significance (UMMC vs IHD) and
no congruence (MMC vs IHD) with (HC vs MMC)
no signficance (HC vs UMMC) and significance (UMMC vs IHD)
signficance (HC vs UMMC) and significance (UMMC vs IHD) and
no congreunce (MMC vs IHD) with (HC vs MMC)
signficance (HC vs UMMC) and significance (UMMC vs IHD) and
congreunce (MMC vs IHD) with (HC vs MMC)
signficance (HC vs UMMC) andno significance (UMMC vs IHD) and
congruence (MMC vs IHD) with (HC vs MMC)
no significance (MMC vs IHD) and no congreunce (HC vs MMC)
with (HC vs IHD)
no congreunce (HC vs MMC) with (MMC vs IHD)
congreunce (HC vs MMC) with (MMC vs IHD)
no significance (MMC vs IHD) and no congreunce (HC vs MMC)
with (HC vs IHD)
significance (MMC vs IHD) and no congreunce (HC vs MMC)
with (MMC vs IHD)
significance (MMC vs IHD) and congreunce (HC vs MMC)
with (MMC vs IHD)
no significance (HC vs UMMC) and no significance (UMMC vs IHD)
significance (HC vs UMMC) andsignificance (UMMC vs IHD) and
no congruence (HC vs IHD) with (HC vs MMC)
significance (HC vs UMMC) and no significance (UMMC vs IHD)
no significance (HC vs UMMC) andsignificance (UMMC vs IHD)
significance (HC vs UMMC) andsignificance (UMMC vs IHD) and
congruence (HC vs IHD) with (HC vs MMC)
significance (MMC vs IHD) significance (MMC vs IHD)
no significance (MMC vs IHD)
significance (HC vs MMC)
significance (HC vs MMC)
no significance (HC vs MMC)
no significance (HC vs MMC)
significance (HC vs IHD)
no significance (HC vs IHD)and significance (MMC vs IHD)Root
IHD SPECIFIC MARKER
IHD DE-ESCALATIONMARKER
IHD ESCALATION MARKER
DYSMETABOLISM MARKER
* in all cases, directional alignment has been reported using HC vs MMC and MMC vs IHD/HC vs IHD in order to be consistent with Figure 3. HC vs UMMC, UMMC vs IHD always exhibited directional alignment with HC vs MMC and MMC vs IHD, respectively, for our escalation and de-escalation markers.
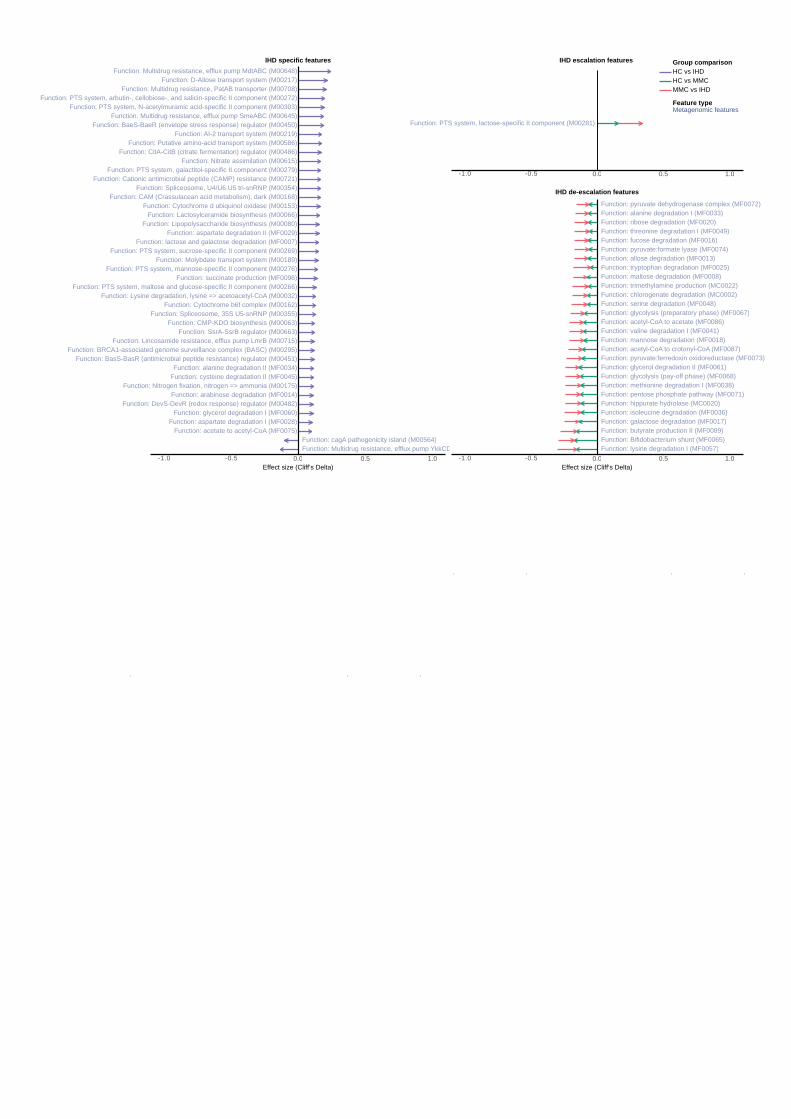
Function: CAM (Crassulacean acid metabolism), dark (M00168)
Function: AI-2 transport system (M00219)
Function: D-Allose transport system (M00217)Function: Multidrug resistance, efflux pump MdtABC (M00648)
Function: Lincosamide resistance, efflux pump LmrB (M00715)
Function: Spliceosome, U4/U6.U5 tri-snRNP (M00354)
Function: PTS system, arbutin-, cellobiose-, and salicin-specific II component (M00272)
Function: Cationic antimicrobial peptide (CAMP) resistance (M00721)
Function: Molybdate transport system (M00189)
Function: Lysine degradation, lysine => acetoacetyl-CoA (M00032)
Function: CitA-CitB (citrate fermentation) regulator (M00486)
Function: BRCA1-associated genome surveillance complex (BASC) (M00295)
Function: PTS system, sucrose-specific II component (M00269)
Function: PTS system, galactitol-specific II component (M00279)
Function: BaeS-BaeR (envelope stress response) regulator (M00450)
Function: PTS system, N-acetylmuramic acid-specific II component (M00303)
Function: Lactosylceramide biosynthesis (M00066)
Function: Putative amino-acid transport system (M00586)
Function: Nitrogen fixation, nitrogen => ammonia (M00175)
Function: PTS system, maltose and glucose-specific II component (M00266)
Function: SsrA-SsrB regulator (M00663)
Function: DevS-DevR (redox response) regulator (M00482)
Function: Cytochrome b6f complex (M00162)
Function: PTS system, mannose-specific II component (M00276)
Function: CMP-KDO biosynthesis (M00063)
Function: Multidrug resistance, efflux pump SmeABC (M00645)
Function: Lipopolysaccharide biosynthesis (M00080)
Function: Cytochrome d ubiquinol oxidase (M00153)
Function: Nitrate assimilation (M00615)
Function: Spliceosome, 35S U5-snRNP (M00355)
Function: BasS-BasR (antimicrobial peptide resistance) regulator (M00451)
Function: Multidrug resistance, PatAB transporter (M00708)
Function: arabinose degradation (MF0014)
Function: acetate to acetyl-CoA (MF0075)
Function: succinate production (MF0096)
Function: aspartate degradation II (MF0029)
Function: glycerol degradation I (MF0060)
Function: lactose and galactose degradation (MF0007)
Function: alanine degradation II (MF0034)
Function: aspartate degradation I (MF0028)
Function: cysteine degradation II (MF0045)
Function: cagA pathogenicity island (M00564)Function: Multidrug resistance, efflux pump YkkCD (M00712)
-1.0 -0.5 0.0 0.5 1.0
Function: PTS system, lactose-specific II component (M00281)
-1.0 -0.5 0.0 0.5 1.0
Function: glycolysis (pay-off phase) (MF0068)
Function: pyruvate:ferredoxin oxidoreductase (MF0073)
Function: fucose degradation (MF0016)
Function: acetyl-CoA to acetate (MF0086)
Function: pyruvate:formate lyase (MF0074)
Function: tryptophan degradation (MF0025)
Function: lysine degradation I (MF0057)
Function: ribose degradation (MF0020)
Function: valine degradation I (MF0041)
Function: maltose degradation (MF0008)
Function: isoleucine degradation (MF0036)
Function: serine degradation (MF0048)
Function: pyruvate dehydrogenase complex (MF0072)
Function: allose degradation (MF0013)
Function: acetyl-CoA to crotonyl-CoA (MF0087)
Function: glycolysis (preparatory phase) (MF0067)
Function: threonine degradation I (MF0049)
Function: hippurate hydrolase (MC0020)
Function: Bifidobacterium shunt (MF0065)
Function: trimethylamine production (MC0022)
Function: mannose degradation (MF0018)
Function: methionine degradation I (MF0038)Function: pentose phosphate pathway (MF0071)
Function: alanine degradation I (MF0033)
Function: glycerol degradation II (MF0061)
Function: butyrate production II (MF0089)
Function: chlorogenate degradation (MC0002)
Function: galactose degradation (MF0017)
-1.0 -0.5 0.0 0.5 1.0Effect size (Cliff’s Delta)Effect size (Cliff’s Delta)
IHD specific features
IHD de-escalation features
IHD escalation features HC vs IHDHC vs MMC
Metagenomic features
MMC vs IHD
Group comparison
Feature type

stearoyl-arachidonoyl-glycerol (18:0/20:4) [1]*
1-arachidonylglycerol (20:4)
Fibrinopeptide B (1-13)**
X-17010
X-25433
X-17348
thyroxine
beta-citrylglutamate
pregnenolone sulfate
sulfate*
2-hydroxyphenylacetate
X-11381
X-25957
1-margaroylglycerol (17:0)
mannitol/sorbitol
C-glycosyltryptophan
X-21470
pregnanolone/allopregnanolone sulfate
3-methoxytyramine sulfate1-stearoyl-2-oleoyl-GPS (18:0/18:1)
picolinate
docosatrienoate (22:3n6)*
aspartate
hydroxycotinine
glucuronate
5alpha-pregnan-3beta,20alpha-diol disulfateerythronate*
salicyluric glucuronide*
4-hydroxyhippurate
X-12410
N-acetylthreonine
leukotriene B4
androsterone sulfate
X-25422
phosphate
21-hydroxypregnenolone disulfate
6-oxopiperidine-2-carboxylate
estrone 3-sulfate
L-urobilin
Fibrinopeptide B (1-9)**
xanthosine
N-acetylmethionine sulfoxide
ornithine
histidylalanine
taurochenodeoxycholate
5alpha-androstan-3alpha,17alpha-diol disulfate
X-24456
1-heptadecenoylglycerol (17:1)*
7-methylguanine
pseudouridine
gamma-glutamylthreonine
12-HETE
1,5-anhydroglucitol (1,5-AG)
1-methyl-5-imidazoleacetate
1-methyl-4-imidazoleacetate
3-indoxyl sulfate
androstenediol (3alpha, 17alpha) monosulfate (3)
1-oleoyl-2-arachidonoyl-GPE (18:1/20:4)*
1-methylhistidine
N-acetylputrescine
methylnaphthyl sulfate (2)*
omeprazole
atorvastatin (lipitor)
5alpha-pregnan-3beta-ol,20-one sulfate
X-24608
3-methylglutarylcarnitine (2)
spermidine
cotinine
alpha-hydroxymetoprolol
indole-3-carboxylate
1-oleoylglycerol (18:1)
N(1)-acetylspermidine
X-24812
norcotinine
X-24571
acisoga
2-methoxyacetaminophen glucuronide*
trimethylamine
caproate (6:0)
cytidine
2-oleoylglycerol (18:1)
metoprolol acid metabolite*
5-HETE
X-12007
1-dihomo-linolenylglycerol (20:3)
N-acetyltaurine
N-acetylneuraminate
X-12100
X-24669
X-25468
N-acetylserine
X-23593
vanillactate
p-hydroxyatorvastatin
3-hydroxy-3-methylglutarate
X-12026
N-carbamoylaspartate
2-hydroxyacetaminophen sulfate*
sphingosine
maltose
N6-carboxymethyllysine
leukotriene B5
metoprolol
4-acetamidophenol
o-hydroxyatorvastatin
2-hydroxyhippurate (salicylurate)
N6,N6,N6-trimethyllysine
phenylacetylcarnitine
phenylacetylglutamate
tridecenedioate (C13:1-DC)*
beta-sitosterol
5-dodecenoylcarnitine (C12:1)
docosapentaenoate (DPA; 22:5n3)
12-HHTrEsphingomyelin (d18:1/20:0, d16:1/22:0)*
X-24556
myristoylcarnitine (C14)
10-nonadecenoate (19:1n9)
1-myristoyl-2-arachidonoyl-GPC (14:0/20:4)*
3-hydroxyoleoylcarnitine
2-ketocaprylate
branched-chain, straight-chain, or cyclopropyl 12:1 fatty acid*(2 or 3)-decenoate (10:1n7 or n8)
X-24328
sulfate of piperine metabolite C16H19NO3 (2)*
palmitoylcarnitine (C16)
ergothioneine
X-24585
undecenoylcarnitine (C11:1)
X-26107
X-26106
thymol sulfate
linoleate (18:2n6)
3-hydroxylaurate
X-21353
stearate (18:0)
3-hydroxyhexanoate
acetylcarnitine (C2)
3-hydroxymyristate
cholesterol
retinol (Vitamin A)glutamine conjugate of C6H10O2 (2)*
trans-2-hexenoylglycine
1-methylnicotinamide
1-(1-enyl-stearoyl)-2-oleoyl-GPE (P-18:0/18:1)
cholesterol sulfate
glucoheptonate
cholestanol
alpha-tocopherol
pentadecanoate (15:0)
docosahexaenoate (DHA; 22:6n3)
stigmasterol
3-hydroxydodecanedioate*
pipecolate
3-hydroxybutyrate (BHBA)
sphingomyelin (d17:2/16:0, d18:2/15:0)*
theobromine
palmitoleoylcarnitine (C16:1)*
glutamine conjugate of C7H12O2*laurate (12:0)
palmitoyl ethanolamide
tetradecanoylcarnitine
methyl hexadecanoateX-17335
dodecadienoate (12:2)*
myristoleoylcarnitine (C14:1)*
dihomolinoleate (20:2n6)
ascorbate (Vitamin C)
1-stearoyl-2-arachidonoyl-GPI (18:0/20:4)
1-stearoyl-2-oleoyl-GPC (18:0/18:1)
eicosenoate (20:1n9 or 1n11)
1-(1-enyl-stearoyl)-2-arachidonoyl-GPE (P-18:0/20:4)*
X-12839
behenoyl sphingomyelin (d18:1/22:0)*
1-(1-enyl-palmitoyl)-2-oleoyl-GPE (P-16:0/18:1)*
glutamine conjugate of C6H10O2 (1)*
X-21607
tetracosane
3-indoleglyoxylic acid
ethanol
1-(1-enyl-palmitoyl)-2-linoleoyl-GPE (P-16:0/18:2)*
(14 or 15)-methylpalmitate (a17:0 or i17:0)
1-palmitoleoyl-2-linolenoyl-GPC (16:1/18:3)*
methyl oleate
sphingomyelin (d18:2/14:0, d18:1/14:1)*
1-myristoyl-2-palmitoyl-GPC (14:0/16:0)
1-linoleoyl-GPI* (18:2)*
2-hydroxyoctanoate
S-carboxymethyl-L-cysteine
methyl linolenate
lignoceroyl sphingomyelin (d18:1/24:0)
linolenate (18:3n3 or 3n6)
-1.0 -0.5 0.0 0.5 1.0
X-11979
GlycA
S-adenosylhomocysteine (SAH)N-acetylphenylalanine
3-(3-amino-3-carboxypropyl)uridine*
X-26119
allantoin
gamma-glutamyltryptophan
5,6-dihydrouridine
3,4-dihydroxybutyrate
p-cresol glucuronide*
N6-carbamoylthreonyladenosine
1-palmitoleoylglycerol (16:1)*
X-21364
phenylalanine
hydroxy-N6,N6,N6-trimethyllysine*
hydantoin-5-propionate
X-21471
N-acetylvaline
X-23787
methionine sulfoxidecreatinine
X-21441
4-cresol
X-12104
cysteine s-sulfate
X-21467
N1-methylinosine
sphingomyelin (d18:1/21:0, d17:1/22:0, d16:1/23:0)*
phytanate
lignoceroylcarnitine (C24)*
glycerate
1-stearoyl-2-linoleoyl-GPI (18:0/18:2)
behenoylcarnitine (C22)*
caprate (10:0)
1-(1-enyl-stearoyl)-2-linoleoyl-GPE (P-18:0/18:2)*
(16 or 17)-methylstearate (a19:0 or i19:0)
palmitoyl-sphingosine-phosphoethanolamine (d18:1/16:0)
1-palmitoyl-2-docosahexaenoyl-GPC (16:0/22:6)
myristoyl dihydrosphingomyelin (d18:0/14:0)*
carotene diol (1)
glycosyl ceramide (d18:1/20:0, d16:1/22:0)*
1,2-dilinoleoyl-GPC (18:2/18:2)
palmitoyl dihydrosphingomyelin (d18:0/16:0)*
beta-cryptoxanthin
3-hydroxybutyroylglycine**
1-linoleoyl-2-linolenoyl-GPC (18:2/18:3)*
1-stearoyl-GPC (18:0)
carotene diol (2)
dihydrocaffeate sulfate (2)
1-(1-enyl-palmitoyl)-2-linoleoyl-GPC (P-16:0/18:2)*
X-11858
1-linolenoyl-GPC (18:3)*
1-stearoyl-GPE (18:0)
sphingomyelin (d18:1/14:0, d16:1/16:0)*
1-linoleoyl-2-arachidonoyl-GPC (18:2/20:4n6)*
1-linoleoyl-GPC (18:2)
nonadecanoate (19:0)
carotene diol (3)
1-palmitoyl-GPC (16:0)
sphingomyelin (d17:1/14:0, d16:1/15:0)*
N-palmitoylglycine
X-21834
1-palmitoyl-2-linoleoyl-GPC (16:0/18:2)
3-hydroxyoctanoylcarnitine (1)
X-11483
oxalate (ethanedioate)
tartronate (hydroxymalonate)
10-undecenoate (11:1n1)
stearoylcarnitine (C18)
X-23782
dodecenedioate (C12:1-DC)*
pristanate
1-lignoceroyl-GPC (24:0)
glycosyl-N-tricosanoyl-sphingadienine (d18:2/23:0)*
3-hydroxyoctanoylcarnitine (2)
imidazole lactate
3-(3-hydroxyphenyl)propionate sulfate
sphingomyelin (d18:1/25:0, d19:0/24:1, d20:1/23:0, d19:1/24:0)*
X-26111
tricosanoyl sphingomyelin (d18:1/23:0)*
arachidoylcarnitine (C20)*
1-stearoyl-2-linoleoyl-GPC (18:0/18:2)*
lactosyl-N-behenoyl-sphingosine (d18:1/22:0)*
arachidate (20:0)
3-hydroxydecanoylcarnitine
sphingomyelin (d17:1/16:0, d18:1/15:0, d16:1/17:0)*
1-stearoyl-2-oleoyl-GPI (18:0/18:1)*
leucylalanine
X-17761
2-palmitoyl-GPC* (16:0)*
1-palmitoyl-2-stearoyl-GPC (16:0/18:0)
laurylcarnitine (C12)
2,4-di-tert-butylphenol
-1.0 -0.5 0.0 0.5 1.0
behenoyl dihydrosphingomyelin (d18:0/22:0)*
2,3-butanediolmyristate (14:0)
glucuronide of piperine metabolite C17H21NO3 (5)*
ursodeoxycholate
isoursodeoxycholate
1-palmitoyl-2-oleoyl-GPI (16:0/18:1)*
prolylglycine
3-methyl-2-oxobutanoate
linoleate
7-ketodeoxycholate3-hydroxy-2-ethylpropionate
X-21736
1-palmitoyl-2-palmitoleoyl-GPC (16:0/16:1)*
1-stearoyl-rac-glycerol
sphingomyelin (d18:0/20:0, d16:0/22:0)*
3-hydroxyoctanoate
X-25936
6-phosphogluconate
tetrahydrocortisone glucuronide (5)
sphingomyelin (d18:0/18:0, d19:0/17:0)*
cortolone glucuronide (1)
X-12101
X-18886
taurohyocholate*
5-oxoproline
etiocholanolone glucuronide
tauro-beta-muricholate
taurodeoxycholic acid 3-sulfate
N,N-dimethylalanine
orotate
N-acetylaspartate (NAA)
cortisolbilirubin degradation product, C16H18N2O5 (2)**
O-acetylsalicylate
taurocholenate sulfate*
bilirubin degradation product, C16H18N2O5 (4)**
X-25790
N6-acetyllysine
succinate
dimethylarginine (ADMA + SDMA)
bilirubin degradation product, C17H20N2O5 (2)**
taurolithocholate 3-sulfate
N-acetyl-isoputreanine
3beta,7alpha-dihydroxy-5-cholestenoate
salicylate
bilirubin degradation product, C16H18N2O5 (3)**
2-methylcitrate/homocitrate
pregnanediol-3-glucuronide
taurochenodeoxycholic acid 3-sulfate
isobutyrylglycine (C4)
X-25420
3-methoxytyrosine
5alpha-pregnan-3beta,20alpha-diol monosulfate (2)
bilirubin degradation product, C16H18N2O5 (1)**
N-acetyl-aspartyl-glutamate (NAAG)
-1.0 -0.5 0.0 0.5 1.0Effect size (Cliff’s Delta) Effect size (Cliff’s Delta)
ACS de-escalation features
ACS specific features ACS escalation features
HC vs ACSHC vs MMC
Serum metabolitesMetagenomic featuresMicrobiome density features
MMC vs ACS
Group comparison
Feature type
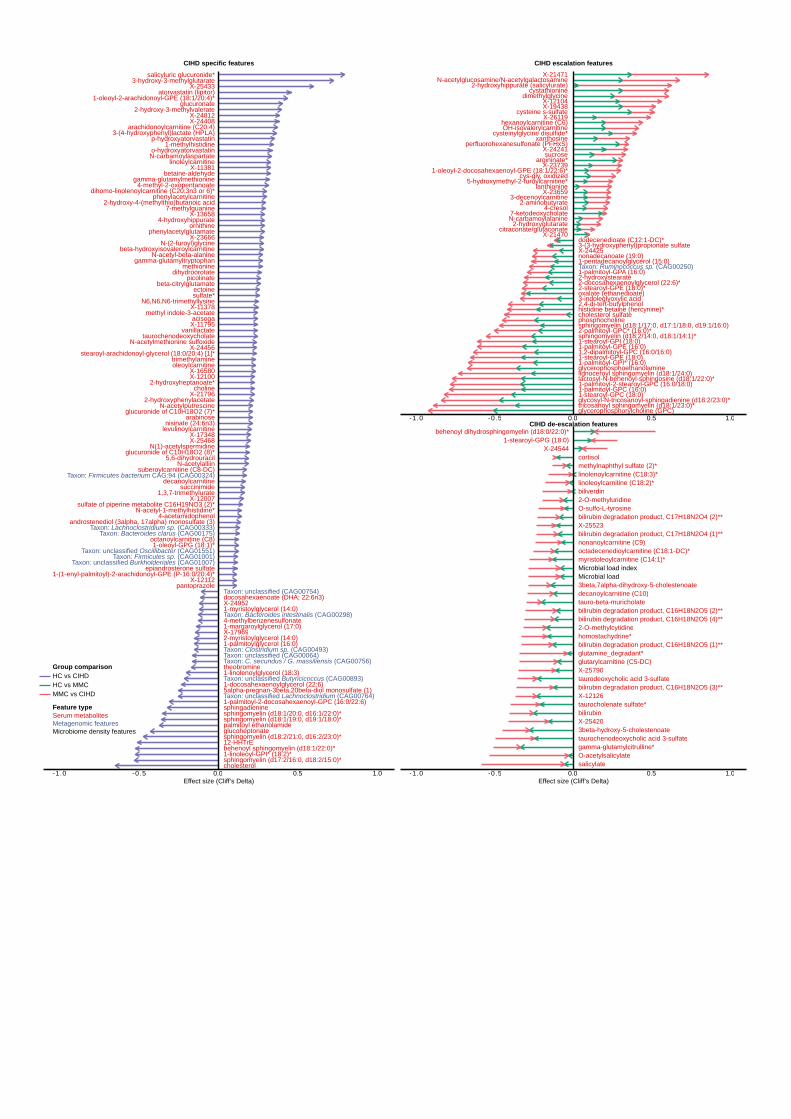
stearoyl-arachidonoyl-glycerol (18:0/20:4) [1]*
octanoylcarnitine (C8)
choline
levulinoylcarnitine
epiandrosterone sulfate
X-24408
X-25433
X-17348
glucuronide of C10H18O2 (8)*
beta-citrylglutamate
5,6-dihydrouracil
sulfate*
X-11378
2-hydroxyphenylacetate
X-11381linoleylcarnitine
sulfate of piperine metabolite C16H19NO3 (2)*
X-11795
4-methyl-2-oxopentanoate
picolinate
glucuronate
gamma-glutamylmethionine
arabinose
betaine-aldehyde
N-acetylalliin
pantoprazole
1-oleoyl-GPG (18:1)*
N-acetyl-1-methylhistidine*
salicyluric glucuronide*
4-hydroxyhippurate
2-hydroxy-3-methylvalerate
N-acetyl-beta-alanine
glucuronide of C10H18O2 (7)*
dihomo-linolenoylcarnitine (C20:3n3 or 6)*
gamma-glutamyltryptophan
decanoylcarnitine
N-acetylmethionine sulfoxide
1-(1-enyl-palmitoyl)-2-arachidonoyl-GPE (P-16:0/20:4)*
ornithine
taurochenodeoxycholate
suberoylcarnitine (C8-DC)
beta-hydroxyisovaleroylcarnitine
X-24456
7-methylguanine2-hydroxy-4-(methylthio)butanoic acid
androstenediol (3alpha, 17alpha) monosulfate (3)
1-oleoyl-2-arachidonoyl-GPE (18:1/20:4)*
1-methylhistidine
N-acetylputrescine
atorvastatin (lipitor)
nisinate (24:6n3)
N-(2-furoyl)glycine
methyl indole-3-acetate
X-12112
N(1)-acetylspermidine
3-(4-hydroxyphenyl)lactate (HPLA)
X-24812
acisoga
trimethylamineoleoylcarnitine
X-16580
X-21796
X-12007
X-12100
X-25468
vanillactate
p-hydroxyatorvastatin
3-hydroxy-3-methylglutarate
N-carbamoylaspartate
ectoine
2-hydroxyheptanoate*
methionine
X-23666
1,3,7-trimethylurate
dihydroorotate
X-13658
4-acetamidophenol
o-hydroxyatorvastatin
arachidonoylcarnitine (C20:4)
succinimide
N6,N6,N6-trimethyllysine
phenylacetylcarnitine
phenylacetylglutamate
Taxon: unclassified Burkholderiales (CAG01007)
Taxon: Bacteroides clarus (CAG00175)
Taxon: Firmicutes sp. (CAG01001)
Taxon: Lachnoclostridium sp. (CAG00333)
Taxon: Firmicutes bacterium CAG:94 (CAG00324)
Taxon: unclassified Oscillibacter (CAG01551)
12-HHTrE
sphingomyelin (d18:1/20:0, d16:1/22:0)*
1-palmitoyl-2-docosahexaenoyl-GPC (16:0/22:6)
1-margaroylglycerol (17:0)
sphingadienine
1-myristoylglycerol (14:0)
cholesterol
5alpha-pregnan-3beta,20beta-diol monosulfate (1)
glucoheptonate
4-methylbenzenesulfonate
docosahexaenoate (DHA; 22:6n3)
sphingomyelin (d17:2/16:0, d18:2/15:0)*
theobromine
palmitoyl ethanolamide
1-docosahexaenoylglycerol (22:6)
1-palmitoylglycerol (16:0)
sphingomyelin (d18:1/19:0, d19:1/18:0)*
behenoyl sphingomyelin (d18:1/22:0)*
X-24952
X-17969
sphingomyelin (d18:2/21:0, d16:2/23:0)*
1-linolenoylglycerol (18:3)
1-linoleoyl-GPI* (18:2)*
2-myristoylglycerol (14:0)
Taxon: unclassified (CAG00064)Taxon: Clostridium sp. (CAG00493)
Taxon: Bacteroides intestinalis (CAG00298)
Taxon: C. secundus / G. massiliensis (CAG00756)
Taxon: unclassified Lachnoclostridium (CAG00764)
Taxon: unclassified (CAG00754)
Taxon: unclassified Butyricicoccus (CAG00893)
-1.0 -0.5 0.0 0.5 1.0
sucrose
citraconate/glutaconate
cysteinylglycine disulfide*
X-24241
X-214702-hydroxyglutarate
N-carbamoylalanine
OH-isovalerylcarnitineX-26119
X-23739
xanthosine
cystathionine
2-aminobutyrateX-23659
cys-gly, oxidized
7-ketodeoxycholate
X-19438
perfluorohexanesulfonate (PFHxS)
3-decenoylcarnitine
hexanoylcarnitine (C6)
1-oleoyl-2-docosahexaenoyl-GPE (18:1/22:6)*
X-21471
lanthionine
4-cresol
X-12104
argininate*
cysteine s-sulfate
5-hydroxymethyl-2-furoylcarnitine*
N-acetylglucosamine/N-acetylgalactosamine2-hydroxyhippurate (salicylurate)
dimethylglycine
1-stearoyl-GPI (18:0)
2-hydroxystearate
glycerophosphorylcholine (GPC)
1-stearoyl-GPC (18:0)
histidine betaine (hercynine)*
1-stearoyl-GPE (18:0)
2-stearoyl-GPE (18:0)*
phosphocholinecholesterol sulfate
2-docosahexaenoylglycerol (22:6)*
nonadecanoate (19:0)
1-palmitoyl-GPC (16:0)
1,2-dipalmitoyl-GPC (16:0/16:0)
oxalate (ethanedioate)
1-pentadecanoylglycerol (15:0)1-palmitoyl-GPA (16:0)
dodecenedioate (C12:1-DC)*
glycerophosphoethanolamine
glycosyl-N-tricosanoyl-sphingadienine (d18:2/23:0)*
1-palmitoyl-GPE (16:0)
1-palmitoyl-GPI* (16:0)
3-(3-hydroxyphenyl)propionate sulfate
3-indoleglyoxylic acid
tricosanoyl sphingomyelin (d18:1/23:0)*
sphingomyelin (d18:1/17:0, d17:1/18:0, d19:1/16:0)
lactosyl-N-behenoyl-sphingosine (d18:1/22:0)*
X-24425
sphingomyelin (d18:2/14:0, d18:1/14:1)*2-palmitoyl-GPC* (16:0)*
1-palmitoyl-2-stearoyl-GPC (16:0/18:0)
2,4-di-tert-butylphenol
lignoceroyl sphingomyelin (d18:1/24:0)
Taxon: Ruminococcus sp. (CAG00250)
-1.0 -0.5 0.0 0.5 1.0
behenoyl dihydrosphingomyelin (d18:0/22:0)*
X-245441-stearoyl-GPG (18:0)
decanoylcarnitine (C10)
gamma-glutamylcitrulline*
bilirubin
linoleoylcarnitine (C18:2)*
3beta-hydroxy-5-cholestenoate
tauro-beta-muricholate
taurodeoxycholic acid 3-sulfate
bilirubin degradation product, C17H18N2O4 (2)**O-sulfo-L-tyrosine
cortisol
bilirubin degradation product, C16H18N2O5 (2)**
O-acetylsalicylate
taurocholenate sulfate*
bilirubin degradation product, C16H18N2O5 (4)**
X-25790
X-12126
methylnaphthyl sulfate (2)*
myristoleoylcarnitine (C14:1)*
2-O-methyluridine
bilirubin degradation product, C17H18N2O4 (1)**
3beta,7alpha-dihydroxy-5-cholestenoate
salicylate
bilirubin degradation product, C16H18N2O5 (3)**
X-25523
glutamine_degradant*
nonanoylcarnitine (C9)
linolenoylcarnitine (C18:3)*
octadecenedioylcarnitine (C18:1-DC)*
biliverdin
homostachydrine*
taurochenodeoxycholic acid 3-sulfate
X-25420
glutarylcarnitine (C5-DC)
2-O-methylcytidine
bilirubin degradation product, C16H18N2O5 (1)**
Microbial load Microbial load index
-1.0 -0.5 0.0 0.5 1.0Effect size (Cliff’s Delta) Effect size (Cliff’s Delta)
CIHD escalation features
CIHD de-escalation features
CIHD specific features
HC vs CIHDHC vs MMC
Serum metabolitesMetagenomic featuresMicrobiome density features
MMC vs CIHD
Group comparison
Feature type
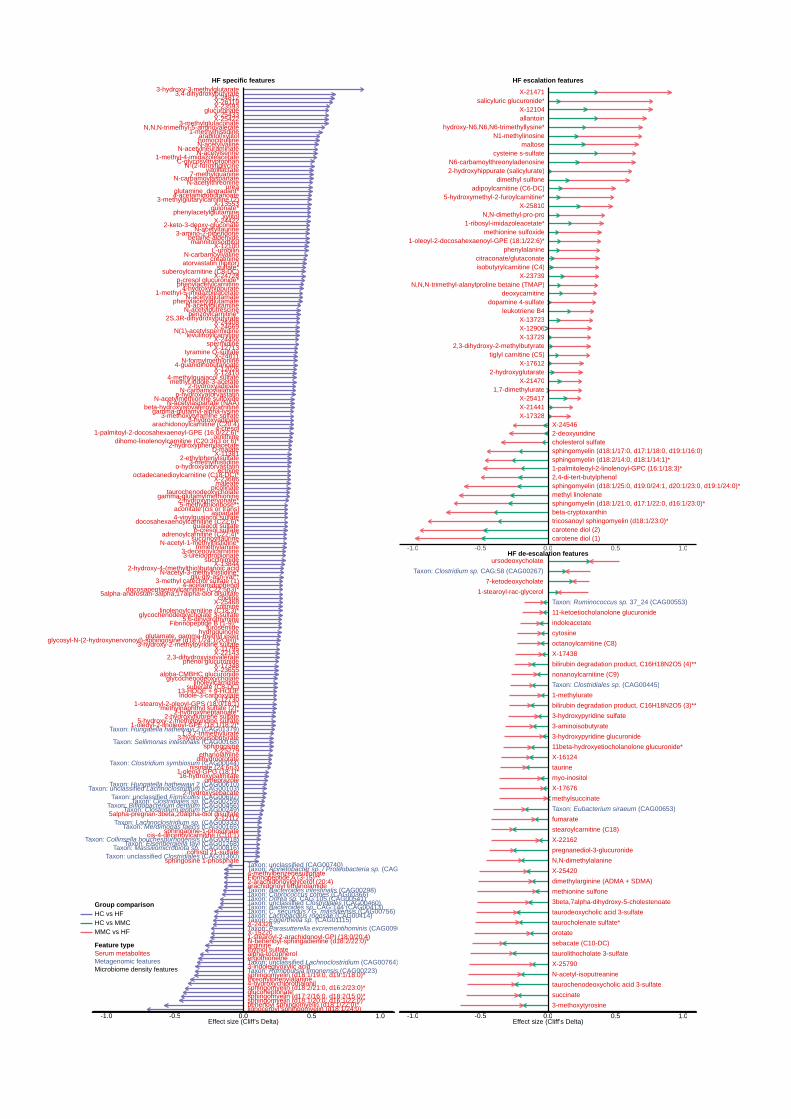
X-23655
maleate
N-formylmethionine
suberate (C8-DC)
choline
levulinoylcarnitine
docosahexaenoylcarnitine (C22:6)*
N,N,N-trimethyl-5-aminovalerate
X-24408
X-25433
X-17348
3-hydroxyisobutyrate
sulfate*
2-hydroxyphenylacetate
cis-4-decenoylcarnitine (C10:1)
X-11381
linoleylcarnitine
furosemide
mannitol/sorbitol
4-vinylguaiacol sulfate
2S,3R-dihydroxybutyrate
glycosyl-N-(2-hydroxynervonoyl)-sphingosine (d18:1/24:1(2OH))*
C-glycosyltryptophan
X-13553phenylacetylglutamine
X-22143
3-methoxytyramine sulfate
X-11795
1-stearoyl-2-oleoyl-GPS (18:0/18:1)
picolinate
2-hydroxynervonate*
aspartate
glucuronate
5alpha-pregnan-3beta,20alpha-diol disulfate
gamma-glutamylmethionine
X-12730
1-palmitoyl-2-docosahexaenoyl-GPE (16:0/22:6)*
2-keto-3-deoxy-gluconate
N-carbamoylalanine
betaine-aldehyde
1-oleoyl-GPG (18:1)*
N-acetyl-1-methylhistidine*
4-hydroxyhippurate
X-12410
N-acetylaspartate (NAA)
N-acetylthreonine
benzoylcarnitine*
X-26119
alpha-CMBHC glucuronide
X-24811
D-malate
3-hydroxy-2-methylpyridine sulfate
glu-gly-asn-val**
X-25422
octadecanedioylcarnitine (C18-DC)*
dihomo-linolenoylcarnitine (C20:3n3 or 6)*
4-acetamidobutanoate
L-urobilin
Fibrinopeptide B (1-9)**
N-acetylmethionine sulfoxide
3,4-dihydroxybutyrate
ornithine
xylitol
gamma-glutamyl-alpha-lysine
adrenoylcarnitine (C22:4)*
taurochenodeoxycholate
5alpha-androstan-3alpha,17alpha-diol disulfate
suberoylcarnitine (C8-DC)
beta-hydroxyisovaleroylcarnitine
p-cresol glucuronide*
X-24456
ethanolamine
homocitrulline
7-methylguanine
2-hydroxy-4-(methylthio)butanoic acid
1-methyl-5-imidazoleacetate
1-methyl-4-imidazoleacetate
3-methylglutaconate
X-25279
3-amino-2-piperidone
3-decenoylcarnitine
succinoyltaurine
2-hydroxyfluorene sulfate
1-methylhistidine
3-ureidopropionate
N-acetylputrescine
methylnaphthyl sulfate (2)*
omeprazole
atorvastatin (lipitor)
nisinate (24:6n3)
3-methyl catechol sulfate (1)
3-methylglutarylcarnitine (2)
sphinganine-1-phosphate
spermidine
cotinine
N-(2-furoyl)glycine
docosapentaenoylcarnitine (C22:5n3)*
gulonate*
aconitate [cis or trans]
methyl indole-3-acetate
indole-3-carboxylate
3-hydroxyadipate
guaiacol sulfate
X-12112
N(1)-acetylspermidine
urea
2-hydroxyadipate
N-acetylglutamate
X-24812
N-acetylglutamine
16-hydroxypalmitate
X-13844
trimethylamine
13-HODE + 9-HODE
1-oleoyl-2-linoleoyl-GPE (18:1/18:2)*
sphingosine 1-phosphate
p-cresol sulfate
3-methylhistidine
N-carbamoylvaline
2-ethylphenylsulfate
tyramine O-sulfate
N-acetylvaline
5,6-dihydrothymine
N-acetyltaurine
glycochenodeoxycholate 3-sulfate
4-methylguaiacol sulfate
glutamine_degradant*
N-acetylneuraminate
X-12100
X-24669
X-25468linolenoylcarnitine (C18:3)*
N-acetylserine
arabitol/xylitol
X-23593
vanillactate
creatinine
p-hydroxyatorvastatin
3-hydroxy-3-methylglutarate
X-12026
X-12713
5-methylthioribose**
hydroquinone
X-24422
N-acetyl-3-methylhistidine*
N-carbamoylaspartate
glutamate, gamma-methyl ester
ectoine
4-cresol
2-hydroxyheptanoate*
sphingosine
X-23666
1,3,7-trimethylurate
glycochenodeoxycholate
5-hydroxy-2-methylpyridine sulfate
cortisol 21-sulfate
dihydroorotate
2-hydroxysebacate
4-acetamidophenol
o-hydroxyatorvastatin
2,3-dihydroxyisovalerate
arachidonoylcarnitine (C20:4)
phenol glucuronide
succinimide
X-24728
4-guanidinobutanoate
phenylacetylcarnitine
phenylacetylglutamate
Taxon: Clostridiales sp. (CAG00259)
Taxon: Lachnoclostridium sp. (CAG00333)
Taxon: unclassified Firmicutes (CAG00692)
Taxon: Merdimonas faecis (CAG00165)
Taxon: unclassified Clostridiales (CAG01360)
Taxon: unclassified Lachnoclostridium (CAG00103)
Taxon: Clostridium leptum (CAG00249)
Taxon: Clostridium symbiosum (CAG00044)
Taxon: Bifidobacterium dentium (CAG00456)
Taxon: Massiliomicrobiota sp. (CAG00816)Taxon: Collinsella bouchesdurhonensis (CAG00918)
Taxon: Sellimonas intestinalis (CAG00168)
Taxon: Hungatella hathewayi 2 (CAG01379)
Taxon: Hungatella hathewayi 2 (CAG00610)
Taxon: Eisenbergiella tayi (CAG01268)
sphingomyelin (d18:1/20:0, d16:1/22:0)*
2-arachidonoylglycerol (20:4)
X-24328
ergothioneinethymol sulfate
threonylphenylalanine
glucoheptonate
4-methylbenzenesulfonate
arachidonoyl ethanolamide
alpha-tocopherol
Fibrinopeptide A (3-15)**
sphingomyelin (d17:2/16:0, d18:2/15:0)*
sphingomyelin (d18:1/19:0, d19:1/18:0)*
1-stearoyl-2-arachidonoyl-GPI (18:0/20:4)
behenoyl sphingomyelin (d18:1/22:0)*
N-behenoyl-sphingadienine (d18:2/22:0)*
3-indoleglyoxylic acid
arginine
X-15220
sphingomyelin (d18:2/21:0, d16:2/23:0)*4-hydroxychlorothalonil
lignoceroyl sphingomyelin (d18:1/24:0)
Taxon: unclassified (CAG00740)
Taxon: Bacteroides sp. CAG:144 (CAG00413)Taxon: Lactobacillus rogosae (CAG00414)
Taxon: Bacteroides intestinalis (CAG00298)Taxon: Coprococcus comes (CAG00366)
Taxon: C. secundus / G. massiliensis (CAG00756)
Taxon: unclassified Lachnoclostridium (CAG00764)
Taxon: Parasutterella excrementihominis (CAG00909)
Taxon: Romboutsia timonensis (CAG00223)
Taxon: unclassified Clostridiales (CAG00460)Taxon: Dorea sp. CAG:105 (CAG00541)
Taxon: Eggerthella sp. (CAG01115)
Taxon: Acinetobacter sp. / Proteobacteria sp. (CAG00731)
-1.0 -0.5 0.0 0.5 1.0
X-24546
sphingomyelin (d18:1/21:0, d17:1/22:0, d16:1/23:0)*
carotene diol (1)
beta-cryptoxanthin
carotene diol (2)
cholesterol sulfate2-deoxyuridine
sphingomyelin (d18:1/25:0, d19:0/24:1, d20:1/23:0, d19:1/24:0)*
tricosanoyl sphingomyelin (d18:1/23:0)*
sphingomyelin (d18:1/17:0, d17:1/18:0, d19:1/16:0)
1-palmitoleoyl-2-linolenoyl-GPC (16:1/18:3)*sphingomyelin (d18:2/14:0, d18:1/14:1)*
2,4-di-tert-butylphenol
methyl linolenate
citraconate/glutaconate
N,N,N-trimethyl-alanylproline betaine (TMAP)
adipoylcarnitine (C6-DC)
tiglyl carnitine (C5)
dopamine 4-sulfate
X-214702-hydroxyglutarate
salicyluric glucuronide*
allantoin
leukotriene B4
X-23739
X-13723X-12906
X-25417
N6-carbamoylthreonyladenosine
isobutyrylcarnitine (C4)
X-17612
deoxycarnitine
phenylalanine
hydroxy-N6,N6,N6-trimethyllysine*
N,N-dimethyl-pro-pro
X-17328
X-13729
1-oleoyl-2-docosahexaenoyl-GPE (18:1/22:6)*
X-21471
2,3-dihydroxy-2-methylbutyrate
methionine sulfoxide
X-25810
X-21441
X-12104
maltosecysteine s-sulfate
5-hydroxymethyl-2-furoylcarnitine*
1-ribosyl-imidazoleacetate*
dimethyl sulfone2-hydroxyhippurate (salicylurate)
1,7-dimethylurate
N1-methylinosine
-1.0 -0.5 0.0 0.5 1.0
ursodeoxycholate
7-ketodeoxycholate1-stearoyl-rac-glycerol
Taxon: Clostridium sp. CAG:58 (CAG00267)
octanoylcarnitine (C8)
taurine
11beta-hydroxyetiocholanolone glucuronide*
taurodeoxycholic acid 3-sulfate
N,N-dimethylalanine
orotatesebacate (C10-DC)
X-22162
taurocholenate sulfate*
bilirubin degradation product, C16H18N2O5 (4)**
3-hydroxypyridine sulfate
X-25790
cytosine
3-hydroxypyridine glucuronide
methionine sulfone
succinate
dimethylarginine (ADMA + SDMA)
X-17676
stearoylcarnitine (C18)
taurolithocholate 3-sulfate
1-methylurate
indoleacetate
N-acetyl-isoputreanine
fumarate
X-17438
11-ketoetiocholanolone glucuronide
3beta,7alpha-dihydroxy-5-cholestenoate
bilirubin degradation product, C16H18N2O5 (3)**
3-aminoisobutyrate
nonanoylcarnitine (C9)
myo-inositol
X-16124
pregnanediol-3-glucuronide
taurochenodeoxycholic acid 3-sulfate
X-25420
methylsuccinate
3-methoxytyrosine
Taxon: Clostridiales sp. (CAG00445)
Taxon: Ruminococcus sp. 37_24 (CAG00553)
Taxon: Eubacterium siraeum (CAG00653)
-1.0 -0.5 0.0 0.5 1.0Effect size (Cliff’s Delta) Effect size (Cliff’s Delta)
HF de-escalation features
HF escalation featuresHF specific features
HC vs HFHC vs MMC
Serum metabolitesMetagenomic featuresMicrobiome density features
MMC vs HF
Group comparison
Feature type

Effect size Effect size
Function: CAM (Crassulacean acid metabolism), dark (M00168)
Function: Keratan sulfate degradation (M00079)
Function: NAD(P)H:quinone oxidoreductase, chloroplasts and cyanobacteria (M00145)
Function: Mce transport system (M00670)
Function: Leucine biosynthesis, 2-oxoisovalerate => 2-oxoisocaproate (M00432)
Function: AlgZ-AlgR (alginate production) two-component regulatory system (M00493)
Function: D-Allose transport system (M00217)
Function: Multidrug resistance, efflux pump MdtABC (M00648)
Function: Ubiquinone biosynthesis, prokaryotes, chorismate => ubiquinone (M00117)
Function: Isoleucine biosynthesis, threonine => 2-oxobutanoate => isoleucine (M00570)
Function: Lipopolysaccharide export system (M00320)
Function: Nucleotide sugar biosynthesis, eukaryotes (M00361)
Function: Lipopolysaccharide biosynthesis, KDO2-lipid A (M00060)
Function: Glyoxylate cycle (M00012)
Function: Phosphatidylethanolamine (PE) biosynthesis, PA => PS => PE (M00093)
Function: Dermatan sulfate degradation (M00076)
Function: N-glycan biosynthesis, high-mannose type (M00074)
Function: C10-C20 isoprenoid biosynthesis, bacteria (M00364)
Function: Pertussis pathogenicity signature 2, T1SS (M00575)
Function: Multidrug resistance, efflux pump MexXY-OprM (M00643)
Function: Ascorbate degradation, ascorbate => D-xylulose-5P (M00550)
Function: Pantothenate biosynthesis, valine/L-aspartate => pantothenate (M00119)
Function: Dipeptide transport system, Firmicutes (M00566)
Function: Thiamine biosynthesis, AIR => thiamine-P/thiamine-2P (M00127)
Function: Entner-Doudoroff pathway, gluconate/galactonate => glycerate-3P (M00633)
Function: Multidrug resistance, efflux pump VexEF-TolC (M00720)
Function: NAD biosynthesis, aspartate => NAD (M00115)
Function: Incomplete reductive citrate cycle, acetyl-CoA => oxoglutarate (M00620)
Function: Fatty acid biosynthesis, elongation (M00083)
Function: NADH:quinone oxidoreductase, prokaryotes (M00144)
Function: Pyridoxal biosynthesis, erythrose-4P => pyridoxal-5P (M00124)
Function: Cell division transport system (M00256)
Function: Capsaicin biosynthesis, L-Phenylalanine => Capsaicin (M00350)
Function: PhoR-PhoB two-component regulatory system (M00434)
Function: Spliceosome, U4/U6.U5 tri-snRNP (M00354)
Function: Monolignol biosynthesis, phenylalanine/tyrosine => monolignol (M00039)
Function: Cationic antimicrobial peptide (CAMP) resistance (M00721)
Function: Ascorbate biosynthesis, plants, glucose-6P => ascorbate (M00114)
Function: Molybdate transport system (M00189)
Function: Lysine degradation, lysine => acetoacetyl-CoA (M00032)
Function: Lipoprotein-releasing system (M00255)
Function: Heparan sulfate degradation (M00078)
Function: CitA-CitB (citrate fermentation) regulator (M00486)
Function: BRCA1-associated genome surveillance complex (BASC) (M00295)
Function: Entner-Doudoroff pathway, glucose-6P => glyceraldehyde-3P + pyruvate (M00008)
Function: Tyrosine biosynthesis, chorismate => tyrosine (M00025)
Function: Dicarboxylate-hydroxybutyrate cycle (M00374)
Function: PTS system, galactitol-specific II component (M00279)
Function: HRD1/SEL1 ERAD complex (M00403)
Function: NarX-NarL (nitrate respiration) two-component regulatory system (M00471)
Function: RaxAB-RaxC type I secretion system (M00339)
Function: Melatonin biosynthesis, tryptophan => serotonin => melatonin (M00037)
Function: BaeS-BaeR (envelope stress response) regulator (M00450)
Function: Dissimilatory sulfate reduction, sulfate => H2S (M00596)
Function: Multidrug resistance, efflux pump AcrAD-TolC (M00646)
Function: Multidrug resistance, efflux pump MdtEF-TolC (M00697)
Function: RTX toxin transport system (M00326)
Function: Ethylmalonyl pathway (M00373)
Function: Citrate cycle, first carbon oxidation, oxaloacetate => 2-oxoglutarate (M00010)
Function: Multidrug resistance, efflux pump AcrEF-TolC (M00696)
Function: Isoleucine biosynthesis, pyruvate => 2-oxobutanoate (M00535)
Function: CAMP resistance, phosphoethanolamine transferase PmrC (M00722)
Function: Methionine biosynthesis, apartate => homoserine => methionine (M00017)
Function: Adhesin protein transport system (M00330)
Function: AlgE-type Mannuronan C-5-Epimerase transport system (M00571)
Function: Zinc transport system (M00242)
Function: Chondroitin sulfate degradation (M00077)
Function: Citrate cycle (TCA cycle, Krebs cycle) (M00009)
Function: Phospholipid transport system (M00210)
Function: Putative amino-acid transport system (M00586)
Function: Tetrahydrofolate biosynthesis, GTP => THF (M00126)
Function: Proline biosynthesis, glutamate => proline (M00015)
Function: NtrY-NtrX (nitrogen regulation) two-component regulatory system (M00498)
Function: HydH-HydG (metal tolerance) two-component regulatory system (M00499)
Function: Nitrogen fixation, nitrogen => ammonia (M00175)
Function: Multidrug resistance, efflux pump EmrAB (M00701)
Function: Lysine biosynthesis, 2-oxoglutarate => 2-aminoadipate => lysine (M00030)
Function: PTS system, maltose and glucose-specific II component (M00266)
Function: Valine/isoleucine biosynthesis, pyruvate => valine => isoleucine (M00019)
Function: SsrA-SsrB regulator (M00663)
Function: beta-Lactam resistance, AmpC system (M00628)
Function: Polyamine biosynthesis, arginine => agmatine => putrescine => spermidine (M00133)
Function: Inosine monophosphate biosynthesis, PRPP + glutamine => IMP (M00048)
Function: Ascorbate biosynthesis, animals, glucose-1P => ascorbate (M00129)
Function: DevS-DevR (redox response) regulator (M00482)
Function: Menaquinone biosynthesis, chorismate => menaquinone (M00116)
Function: Reductive citrate cycle (Arnon-Buchanan cycle) (M00173)
Function: Manganese transport system (M00316)
Function: PTS system, cellobiose-specific II component (M00275)
Function: Twin-arginine translocation (Tat) system (M00336)
Function: Cytochrome b6f complex (M00162)
Function: p97-Ufd1-Npl4 complex (M00400)
Function: alpha-Hemolysin/cyclolysin transport system (M00325)
Function: NreB-NreC two-component regulatory system (M00483)
Function: Iron complex transport system (M00240)
Function: BarA-UvrY (central carbon metabolism) two-component regulatory system (M00475)
Function: Uridine monophosphate biosynthesis, glutamine (+ PRPP) => UMP (M00051)
Function: Ornithine biosynthesis, glutamate => ornithine (M00028)
Function: CMP-KDO biosynthesis (M00063)
Function: Multidrug resistance, efflux pump AcrAB-TolC/SmeDEF (M00647)
Function: Multidrug resistance, efflux pump SmeABC (M00645)
Function: Macrolide resistance, MacAB-TolC transporter (M00709)
Function: CheA-CheYBV (chemotaxis) two-component regulatory system (M00506)
Function: Lysine biosynthesis, DAP aminotransferase pathway, aspartate => lysine (M00527)
Function: gamma-Hexachlorocyclohexane transport system (M00669)
Function: Ski complex (M00392)
Function: Lipopolysaccharide biosynthesis (M00080)
Function: Cytochrome d ubiquinol oxidase (M00153)
Function: Ubiquinone biosynthesis, eukaryotes, 4-hydroxybenzoate => ubiquinone (M00128)
Function: Nitrate assimilation (M00615)
Function: Tyrosine degradation, tyrosine => homogentisate (M00044)
Function: Coenzyme A biosynthesis, pantothenate => CoA (M00120)
Function: Spliceosome, 35S U5-snRNP (M00355)
Function: Phenylalanine biosynthesis, chorismate => phenylalanine (M00024)
Function: 3-Hydroxypropionate bi-cycle (M00376)
Function: Phthalate degradation, phthalate => protocatechuate (M00623)Function: Citrate cycle, second carbon oxidation, 2-oxoglutarate => oxaloacetate (M00011)
Function: Urea cycle (M00029)
Function: Leucine degradation, leucine => acetoacetate + acetyl-CoA (M00036)
Function: BasS-BasR (antimicrobial peptide resistance) regulator (M00451)
Function: Lysine biosynthesis, DAP dehydrogenase pathway, aspartate => lysine (M00526)
Function: Tryptophan biosynthesis, chorismate => tryptophan (M00023)
Function: Succinate dehydrogenase, prokaryotes (M00149)
Function: Multidrug resistance, PatAB transporter (M00708)
Function: C4-dicarboxylic acid cycle, phosphoenolpyruvate carboxykinase type (M00170)
Function: Methylaspartate cycle (M00740)
Function: Nucleotide sugar biosynthesis, prokaryotes (M00362)
Function: Riboflavin biosynthesis, GTP => riboflavin/FMN/FAD (M00125)
Function: KinB-AlgB (alginate production) two-component regulatory system (M00505)
Function: tyrosine degradation II (MF0027)
Function: arabinose degradation (MF0014)
Function: acetate to acetyl-CoA (MF0075)
Function: trimethylamine production (MC0021)Function: glutamate degradation I (MF0030)
Function: sucrose degradation II (MF0011)
Function: arginine degradation IV (MF0054)
Function: succinate production (MF0096)
Function: trehalose degradation (MF0012)
Function: tyrosine degradation I (MF0026)
Function: arabinoxylan degradation (MF0001)
Function: trimethylamine production (MC0023)
Function: sucrose degradation I (MF0010)
Function: glyoxylate bypass (MF0063)
Function: aspartate degradation II (MF0029)
Function: maltose degradation (MF0008)Function: glycerol degradation I (MF0060)
Function: lactose and galactose degradation (MF0007)
Function: leucine degradation (MF0037)
Function: serine degradation (MF0048)
Function: alanine degradation II (MF0034)
Function: allose degradation (MF0013)
Function: melibiose degradation (MF0009)
Function: threonine degradation I (MF0049)
Function: starch degradation (MF0005)
Function: glutamine degradation II (MF0047)
Function: pectine degradation II (MF0004)
Function: arginine degradation I (MF0051)
Function: aspartate degradation I (MF0028)
Function: fructan degradation (MF0002)
Function: cysteine degradation II (MF0045)
Function: cysteine degradation I (MF0044)
Function: quinate degradation (MC0010)Function: lactose degradation (MF0006)
Function: galacturonate degradation I (MF0022)
Function: trimethylamine production (MC0022)
Function: Multidrug resistance, efflux pump YkkCD (M00712)-1.0 -0.5 0.0 0.5
Function: PTS system, N-acetylgalactosamine-specific II component (M00277)
Function: Betaine biosynthesis, choline => betaine (M00555)
Function: FA core complex (M00413)
Function: Fatty acid biosynthesis, elongation, endoplasmic reticulum (M00415)
-0.5 0.0 0.5 1.0
Function: Nucleotide sugar biosynthesis, galactose => UDP-galactose (M00554)
Function: LytS-LytR two-component regulatory system (M00492)
Function: Catechol meta-cleavage, catechol => acetyl-CoA / 4-methylcatechol => propanoyl-CoA (M00569)
Function: Ribose transport system (M00212)
Function: Pyruvate oxidation, pyruvate => acetyl-CoA (M00307)
Function: Hydroxypropionate-hydroxybutylate cycle (M00375)
Function: CAM (Crassulacean acid metabolism), light (M00169)
Function: Pyrimidine ribonucleotide biosynthesis, UMP => UDP/UTP,CDP/CTP (M00052)
Function: Multiple sugar transport system (M00216)
Function: PTS system, fructose-specific II component (M00273)
Function: Methionine salvage pathway (M00034)
Function: Lysine biosynthesis, acetyl-DAP pathway, aspartate => lysine (M00525)
Function: Cobalamin biosynthesis, cobinamide => cobalamin (M00122)
Function: VicK-VicR (cell wall metabolism) two-component regulatory system (M00459)
Function: PTS system, D-glucosaminate-specific II component (M00610)
Function: F-type ATPase, prokaryotes and chloroplasts (M00157)
Function: cAMP signaling (M00695)
Function: Cystine transport system (M00234)
Function: D-galactonate degradation, De Ley-Doudoroff pathway, D-galactonate => glycerate-3P (M00552)
Function: C1-unit interconversion, eukaryotes (M00141)
Function: Inositol transport system (M00593)
Function: Cholesterol biosynthesis, squalene 2,3-epoxide => cholesterol (M00101)
Function: Glutathione biosynthesis, glutamate => glutathione (M00118)
Function: Ectoine biosynthesis, aspartate => ectoine (M00033)
Function: Pyrimidine deoxyribonuleotide biosynthesis, CDP/CTP => dCDP/dCTP,dTDP/dTTP (M00053)
Function: Formaldehyde assimilation, xylulose monophosphate pathway (M00344)
Function: Putative polar amino acid transport system (M00236)
Function: Ergocalciferol biosynthesis (M00102)
Function: Aminoacyl-tRNA biosynthesis, prokaryotes (M00360)
Function: Formaldehyde assimilation, ribulose monophosphate pathway (M00345)
Function: N-Acetylglucosamine transport system (M00205)
Function: Reductive acetyl-CoA pathway (Wood-Ljungdahl pathway) (M00377)
Function: D-Galacturonate degradation, D-galacturonate => pyruvate + D-glyceraldehyde 3P (M00631)
Function: CAMP resistance, N-acetylmuramoyl-L-alanine amidase AmiA and AmiC (M00727)
Function: DNA polymerase III complex, bacteria (M00260)
Function: Pimeloyl-ACP biosynthesis, BioC-BioH pathway, malonyl-ACP => pimeloyl-ACP (M00572)
Function: beta-Oxidation, acyl-CoA synthesis (M00086)
Function: SalK-SalR two-component regulatory system (M00522)
Function: KdpD-KdpE (potassium transport) two-component regulatory system (M00454)
Function: PRPP biosynthesis, ribose 5P => PRPP (M00005)
Function: Reductive pentose phosphate cycle (Calvin cycle) (M00165)
Function: Sec (secretion) system (M00335)
Function: Phosphate transport system (M00222)
Function: Heme biosynthesis, glutamate => protoheme/siroheme (M00121)
Function: Methionine degradation (M00035)
Function: Competence-related DNA transformation transporter (M00429)
Function: Methyl-galactoside transport system (M00214)
Function: PTS system, N-acetylglucosamine-specific II component (M00267)
Function: Trehalose biosynthesis, D-glucose 1P => trehalose (M00565)
Function: Formaldehyde assimilation, serine pathway (M00346)
Function: C10-C20 isoprenoid biosynthesis, archaea (M00365)
Function: Guanine ribonucleotide biosynthesis IMP => GDP,GTP (M00050)
Function: Putative ABC transport system (M00258)
Function: Cationic antimicrobial peptide (CAMP) resistance, factors DegP and DsbA (M00728)
Function: Fluoroquinolone resistance, gyrase-protecting protein Qnr (M00729)
Function: N-glycan precursor biosynthesis (M00055)
Function: Ribosome, archaea (M00179)
Function: C5 isoprenoid biosynthesis, mevalonate pathway (M00095)
Function: Glucuronate pathway (uronate pathway) (M00014)
Function: ABC-2 type transport system (M00254)
Function: GABA biosynthesis, eukaryotes, putrescine => GABA (M00135)
Function: Gluconeogenesis, oxaloacetate => fructose-6P (M00003)
Function: Cysteine biosynthesis, methionine => cysteine (M00609)
Function: (-1)
Function: D-Methionine transport system (M00238)
Function: C4-dicarboxylic acid cycle, NAD - malic enzyme type (M00171)
Function: Spermidine/putrescine transport system (M00299)
Function: Reductive pentose phosphate cycle, ribulose-5P => glyceraldehyde-3P (M00166)
Function: Photorespiration (M00532)
Function: Lysine biosynthesis, succinyl-DAP pathway, aspartate => lysine (M00016)
Function: C5 isoprenoid biosynthesis, non-mevalonate pathway (M00096)
Function: D-Glucuronate degradation, D-glucuronate => pyruvate + D-glyceraldehyde 3P (M00061)
Function: Energy-coupling factor transport system (M00582)
Function: Inositol phosphate metabolism, Ins(1,3,4,5)P4 => Ins(1,3,4)P3 => myo-inositol (M00131)
Function: Methanogenesis, acetate => methane (M00357)Function: Threonine biosynthesis, aspartate => homoserine => threonine (M00018)
Function: Catechol ortho-cleavage, catechol => 3-oxoadipate (M00568)
Function: Phosphate acetyltransferase-acetate kinase pathway, acetyl-CoA => acetate (M00579)
Function: Nucleotide sugar biosynthesis, glucose => UDP-glucose (M00549)
Function: YesM-YesN two-component regulatory system (M00519)
Function: C10-C20 isoprenoid biosynthesis, non-plant eukaryotes (M00367)
Function: Adenine ribonucleotide biosynthesis, IMP => ADP,ATP (M00049)
Function: Semi-phosphorylative Entner-Doudoroff pathway, gluconate => glycerate-3P (M00308)
Function: Serine biosynthesis, glycerate-3P => serine (M00020)
Function: Fatty acid biosynthesis, initiation (M00082)
Function: RNA polymerase, bacteria (M00183)
Function: Galactose degradation, Leloir pathway, galactose => alpha-D-glucose-1P (M00632)
Function: Glycolysis (Embden-Meyerhof pathway), glucose => pyruvate (M00001)
Function: C4-dicarboxylic acid cycle, NADP - malic enzyme type (M00172)
Function: Pentose phosphate pathway, non-oxidative phase, fructose 6P => ribose 5P (M00007)
Function: Reductive pentose phosphate cycle, glyceraldehyde-3P => ribulose-5P (M00167)
Function: Glycolysis, core module involving three-carbon compounds (M00002)
Function: C10-C20 isoprenoid biosynthesis, plants (M00366)
Function: Ribosome, bacteria (M00178)
Function: Ethylene biosynthesis, methionine => ethylene (M00368)
Function: C1-unit interconversion, prokaryotes (M00140)
Function: Tetracycline resistance, efflux pump (M00667)
Function: Aminoacyl-tRNA biosynthesis, eukaryotes (M00359)
Function: RNA degradosome (M00394)
Function: Histidine biosynthesis, PRPP => histidine (M00026)
Function: Pentose phosphate pathway (Pentose phosphate cycle) (M00004)
Function: Inositol phosphate metabolism, PI=> PIP2 => Ins(1,4,5)P3 => Ins(1,3,4,5)P4 (M00130)
Function: PTS system, beta-glucosides-specific II component (M00271)
Function: Ketone body biosynthesis, acetyl-CoA => acetoacetate/3-hydroxybutyrate/acetone (M00088)
Function: Shikimate pathway, phosphoenolpyruvate + erythrose-4P => chorismate (M00022)
Function: Cysteine biosynthesis, serine => cysteine (M00021)
Function: glycolysis (pay-off phase) (MF0068)
Function: pyruvate:ferredoxin oxidoreductase (MF0073)
Function: hydrogen metabolism (MF0098)
Function: acetyl-CoA to acetate (MF0086)
Function: pyruvate:formate lyase (MF0074)
Function: rhamnose degradation (MF0019)
Function: arginine degradation V (MF0055)
Function: xylose degradation (MF0021)
Function: valine degradation I (MF0041)
Function: succinate consumption (MF0083)
Function: isoleucine degradation (MF0036)
Function: threonine degradation II (MF0050)
Function: acetyl-CoA to crotonyl-CoA (MF0087)
Function: glycolysis (preparatory phase) (MF0067)
Function: hippurate hydrolase (MC0020)
Function: Bifidobacterium shunt (MF0065)
Function: mannose degradation (MF0018)
Function: lactaldehyde degradation (MF0078)
Function: methionine degradation I (MF0038)
Function: pentose phosphate pathway (MF0071)
Function: alanine degradation I (MF0033)
Function: formate conversion (MF0077)
Function: glycerol degradation II (MF0061)
Function: chlorogenate degradation (MC0002)
Function: galactose degradation (MF0017)
-0.5 0.0 0.5 1.0
Effect size Effect size
Function: NADH:ferredoxin oxidoreductase (MF0069)-1.0 -0.5 0.0 0.5
Function: AI-2 transport system (M00219)
Function: D-Allose transport system (M00217)Function: Multidrug resistance, efflux pump MdtABC (M00648)
Function: PhoQ-PhoP (magnesium transport) two-component regulatory system (M00444)
Function: Putative amino-acid transport system (M00586)
Function: Cationic antimicrobial peptide (CAMP) resistance, protease PgtE (M00744)
Function: PTS system, mannose-specific II component (M00276)
Function: lactose and galactose degradation (MF0007)
-1.0 -0.5 0.0 0.5 1.0
HF specific features ACS de-escalation features
CIHD specific features CIHD escalation features
CIHD de-escalation features
HC vs HF
HC vs MMCMMC vs ACS
Group comparison
Metagenomic featuresFeature type
Group comparison
HC vs CIHDHC vs MMCMMC vs CIHD
Group comparison
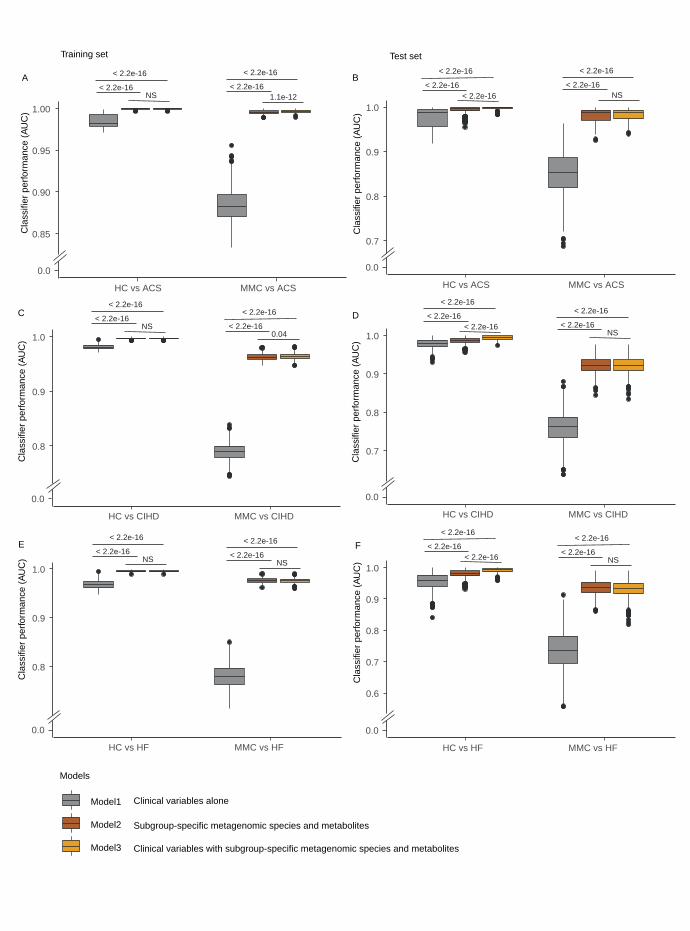
0.85
0.90
0.95
1.00
Cla
ssifi
er p
erfo
rman
ce (A
UC
)
Training set
A
0.8
0.9
1.0
Cla
ssifi
er p
erfo
rman
ce (A
UC
)
C
0.8
0.9
1.0
Cla
ssifi
er p
erfo
rman
ce (A
UC
)
E
0.7
0.8
0.9
1.0
Cla
ssifi
er p
erfo
rman
ce (A
UC
)
Test set
B
0.7
0.8
0.9
1.0
Cla
ssifi
er p
erfo
rman
ce (A
UC
)
D
0.6
0.7
0.8
0.9
1.0
Cla
ssifi
er p
erfo
rman
ce (A
UC
)
F
Models
Model1
Model2
Model3
Clinical variables alone
Subgroup-specific metagenomic species and metabolites
Clinical variables with subgroup-specific metagenomic species and metabolites
HC vs HF MMC vs HF
0.0
HC vs HF MMC vs HF
0.0
HC vs CIHD MMC vs CIHD
0.0HC vs CIHD MMC vs CIHD
0.0
HC vs ACS MMC vs ACS
0.0
HC vs ACS MMC vs ACS
0.0
< 2.2e-16
< 2.2e-16NS
< 2.2e-16
< 2.2e-161.1e-12
< 2.2e-16
< 2.2e-16NS
< 2.2e-16
< 2.2e-16< 2.2e-16
< 2.2e-16
< 2.2e-16NS
< 2.2e-16
< 2.2e-160.04
< 2.2e-16
< 2.2e-16< 2.2e-16
< 2.2e-16
< 2.2e-16NS
< 2.2e-16
< 2.2e-16NS
< 2.2e-16
< 2.2e-16NS
< 2.2e-16
< 2.2e-16< 2.2e-16
< 2.2e-16
< 2.2e-16NS