Fatness, Fitness, and Cardiometabolic Risk Factors among Sixth-Grade Youth
18
Fatness, Fitness, and Cardiometabolic Risk Factors among Sixth-Grade Youth RUSSELL JAGO 1 , KIMBERLY L. DREWS 2 , ROBERT G. MCMURRAY 3 , DEBBE THOMPSON 4 , STELLA L. VOLPE 5 , ESTHER L. MOE 6 , JOHN M. JAKICIC 7 , TRANG H. PHAM 2 , STEVE BRUECKER 8 , TARA B. BLACKSHEAR 9 , and ZENONG YIN 10 1 Department of Exercise, Nutrition & Health Sciences, University of Bristol, Bristol, England, UNITED KINGDOM 2 The George Washington University Biostatistics Center, Washington, DC 3 Department of Exercise & Sport Science, University of North Carolina at Chapel Hill, Chapel Hill, NC 4 USDA/ARS Children's Nutrition Research Center, Baylor College of Medicine, Houston, TX 5 Division of Biobehavioral and Health Sciences, University of Pennsylvania, School of Nursing, Philadelphia, PA Copyright © 2010 by the American College of Sports Medicine Address for correspondence: Russell Jago, Ph.D., Department of Exercise, Nutrition and Health Sciences, Centre for Sport, Exercise and Health, University of Bristol, Tyndall Ave., Bristol, England, BS8 1TP, United Kingdom; [email protected].. The writing group for this article was the following: R. Jago (chair), K. L. Drews, R. G. McMurray, D. Thompson, S. L. Volpe, E. L. Moe, J. M. Jakicic, T. H. Pham, S. Bruecker, T. B. Blackshear, and Z. Yin. The HEALTHY Study Group (* indicates principal investigator or director): STOPP-T2D study chair Children's Hospital Los Angeles: F. R. Kaufman Field centers Baylor College of Medicine: T. Baranowski*, L. Adams, J. Baranowski, A. Canada, K. W. Cullen, M. H. Dobbins, R. Jago, A. Oceguera, A. X. Rodriguez, C. Speich, L. T. Tatum, D. Thompson, M. A. White, and C. G. Williams Oregon Health & Science University: L. Goldberg*, D. Cusimano, L. DeBar, D. Elliot, H. M. Grund, K. Kuehl, S. McCormick, E. Moe, J. B. Roullet, A. Sleigh, and D. Stadler Temple University: G. D. Foster* (Steering Committee Chair), J. Brown, B. Creighton, M. Faith, E. G. Ford, H. Glick, S. Kumanyika, J. Nachmani, J. Rosen, L. Rosen, S. Sherman, S. Solomon, A. Virus, S. L. Volpe, and S. Willi University of California at Irvine: D. Cooper*, S. Bassin, S. Bruecker, D. Ford, P. Galassetti, S. Greenfield, J. Hartstein, M. Krause, N. Opgrand, Y. Rodriguez, and M. Schneider University of North Carolina at Chapel Hill: J. S. Harrell*, A. Anderson, T. Blackshear, J. Buse, J. Bridgman, A. Gerstel, C. Giles, W. Hall, A. Jessup, P. Kennel, R. Matthews, R. G. McMurray, D. Rubin, A. M. Siega-Riz, M. Smith, A. Steckler, A. Stringer, and A. Zeveloff University of Pittsburgh: M. D. Marcus*, M. Carter, S. Clayton, B. Gillis, K. Hindes, J. M. Jakicic, R. Meehan, R. Noll, T. Songer, J. Vanucci, and E. M. Venditti University of Texas Health Science Center at San Antonio: R. Treviño*, A. Garcia, D. Hale, A. E. Hernandez, I. Hernandez, C. Mobley, T. Murray, K. Surapiboonchai, and Z. Yin Other investigators K. Resnicow, University of Michigan; M. Goran, University of Southern California; M. Engelgau, L. Y. Wang, and P. Zhang, Centers for Disease Control and Prevention Coordinating center George Washington University: K. Hirst*, K. L. Drews, S. Edelstein, L. El ghormli, L. S. Firrell, M. Huang, P. K. Feit, S. L. Mazzuto, T. Pham, and A. Wheeler Project office National Institute of Diabetes and Digestive and Kidney Diseases: B. Linder*, C. Hunter, M. Staten Central blood laboratory University of Washington Northwest Lipid Metabolism and Diabetes Research Laboratories: S. M. Marcovina* No conflicts are reported. The results of the present study do not constitute endorsement by the American College of Sports Medicine. NIH Public Access Author Manuscript Med Sci Sports Exerc. Author manuscript; available in PMC 2010 August 13. Published in final edited form as: Med Sci Sports Exerc. 2010 August ; 42(8): 1502–1510. doi:10.1249/MSS.0b013e3181d322c4. NIH-PA Author Manuscript NIH-PA Author Manuscript NIH-PA Author Manuscript
-
Upload
independent -
Category
Documents
-
view
0 -
download
0
Transcript of Fatness, Fitness, and Cardiometabolic Risk Factors among Sixth-Grade Youth

Fatness, Fitness, and Cardiometabolic Risk Factors amongSixth-Grade Youth
RUSSELL JAGO1, KIMBERLY L. DREWS2, ROBERT G. MCMURRAY3, DEBBETHOMPSON4, STELLA L. VOLPE5, ESTHER L. MOE6, JOHN M. JAKICIC7, TRANG H.PHAM2, STEVE BRUECKER8, TARA B. BLACKSHEAR9, and ZENONG YIN101Department of Exercise, Nutrition & Health Sciences, University of Bristol, Bristol, England,UNITED KINGDOM2The George Washington University Biostatistics Center, Washington, DC3Department of Exercise & Sport Science, University of North Carolina at Chapel Hill, Chapel Hill,NC4USDA/ARS Children's Nutrition Research Center, Baylor College of Medicine, Houston, TX5Division of Biobehavioral and Health Sciences, University of Pennsylvania, School of Nursing,Philadelphia, PA
Copyright © 2010 by the American College of Sports MedicineAddress for correspondence: Russell Jago, Ph.D., Department of Exercise, Nutrition and Health Sciences, Centre for Sport, Exerciseand Health, University of Bristol, Tyndall Ave., Bristol, England, BS8 1TP, United Kingdom; [email protected] writing group for this article was the following: R. Jago (chair), K. L. Drews, R. G. McMurray, D. Thompson, S. L. Volpe, E. L.Moe, J. M. Jakicic, T. H. Pham, S. Bruecker, T. B. Blackshear, and Z. Yin.The HEALTHY Study Group (* indicates principal investigator or director):STOPP-T2D study chairChildren's Hospital Los Angeles: F. R. KaufmanField centersBaylor College of Medicine: T. Baranowski*, L. Adams, J. Baranowski, A. Canada, K. W. Cullen, M. H. Dobbins, R. Jago, A.Oceguera, A. X. Rodriguez, C. Speich, L. T. Tatum, D. Thompson, M. A. White, and C. G. WilliamsOregon Health & Science University: L. Goldberg*, D. Cusimano, L. DeBar, D. Elliot, H. M. Grund, K. Kuehl, S. McCormick, E.Moe, J. B. Roullet, A. Sleigh, and D. StadlerTemple University: G. D. Foster* (Steering Committee Chair), J. Brown, B. Creighton, M. Faith, E. G. Ford, H. Glick, S. Kumanyika,J. Nachmani, J. Rosen, L. Rosen, S. Sherman, S. Solomon, A. Virus, S. L. Volpe, and S. WilliUniversity of California at Irvine: D. Cooper*, S. Bassin, S. Bruecker, D. Ford, P. Galassetti, S. Greenfield, J. Hartstein, M. Krause,N. Opgrand, Y. Rodriguez, and M. SchneiderUniversity of North Carolina at Chapel Hill: J. S. Harrell*, A. Anderson, T. Blackshear, J. Buse, J. Bridgman, A. Gerstel, C. Giles, W.Hall, A. Jessup, P. Kennel, R. Matthews, R. G. McMurray, D. Rubin, A. M. Siega-Riz, M. Smith, A. Steckler, A. Stringer, and A.ZeveloffUniversity of Pittsburgh: M. D. Marcus*, M. Carter, S. Clayton, B. Gillis, K. Hindes, J. M. Jakicic, R. Meehan, R. Noll, T. Songer, J.Vanucci, and E. M. VendittiUniversity of Texas Health Science Center at San Antonio: R. Treviño*, A. Garcia, D. Hale, A. E. Hernandez, I. Hernandez, C.Mobley, T. Murray, K. Surapiboonchai, and Z. YinOther investigatorsK. Resnicow, University of Michigan; M. Goran, University of Southern California; M. Engelgau, L. Y. Wang, and P. Zhang, Centersfor Disease Control and PreventionCoordinating centerGeorge Washington University: K. Hirst*, K. L. Drews, S. Edelstein, L. El ghormli, L. S. Firrell, M. Huang, P. K. Feit, S. L. Mazzuto,T. Pham, and A. WheelerProject officeNational Institute of Diabetes and Digestive and Kidney Diseases: B. Linder*, C. Hunter, M. StatenCentral blood laboratoryUniversity of Washington Northwest Lipid Metabolism and Diabetes Research Laboratories: S. M. Marcovina*No conflicts are reported.The results of the present study do not constitute endorsement by the American College of Sports Medicine.
NIH Public AccessAuthor ManuscriptMed Sci Sports Exerc. Author manuscript; available in PMC 2010 August 13.
Published in final edited form as:Med Sci Sports Exerc. 2010 August ; 42(8): 1502–1510. doi:10.1249/MSS.0b013e3181d322c4.
NIH
-PA Author Manuscript
NIH
-PA Author Manuscript
NIH
-PA Author Manuscript
6Division of Health Promotion and Sports Medicine, Oregon Health & Sciences University,Portland, OR7Department of Health and Physical Activity, University of Pittsburgh, Pittsburgh, PA8Department of Health and Physical Activity, University of California at Irvine, Irvine, CA9Health and Physical Education, Cairo American College, Cairo, EGYPT10Department of Health and Kinesiology, University of Texas at San Antonio, San Antonio, TX
AbstractPurpose—Examine whether cardiometabolic risk factors are predicted by fitness or fatnessamong adolescents.
Methods—Participants are 4955 (2614 female) sixth-grade students with complete data from 42US middle schools. Fasting blood samples were analyzed for total cholesterol, HDL- and LDL-cholesterol, triglyceride, glucose, and insulin concentrations. Waist circumference and bloodpressure were assessed. Body mass index (BMI) was categorized as normal weight, overweight, orobese as a measure of fatness. Fitness was assessed using the multistage shuttle test and wasconverted into gender-specific quintiles. Gender-specific regression models, adjusted for race,pubertal status, and household education, were run to identify whether BMI group predicted riskfactors. Models were repeated with fitness group and both fitness and fatness groups as predictors.
Results—Means for each risk factor (except HDL, which was the reverse) were significantlyhigher (P < 0.0001) with increased fatness and differed across all BMI groups (P < 0.001). Waistcircumference, LDL-cholesterol, triglycerides, diastolic blood pressure, and insulin were inverselyassociated with fitness (P < 0.001). When both fatness and fitness were included in the model,BMI was associated (P < 0.001) with almost all cardiometabolic risk factors; fitness was onlyassociated with waist circumference (both genders), LDL-cholesterol (males), and insulin (bothgenders). Other associations between fitness and cardiometabolic risk factors were attenuated afteradjustment for BMI group.
Conclusions—Both fatness and fitness are associated with cardiometabolic risk factors amongsixth-grade youth, but stronger associations were observed for fatness. Although maintaining highlevels of fitness and preventing obesity may positively affect cardiometabolic risk factors, greaterbenefit may be obtained from obesity prevention.
KeywordsFIT; OBESITY; CHILDREN; ADOLESCENTS; CARDIOVASCULAR DISEASE
Data from the 1999–2002 US National Health and Nutrition Examination Survey indicatedthat less than one-third of 12- to 19-yr-old adolescents in the United States met fitnessrecommendations (28). Low aerobic fitness levels have been associated with increased riskfor cardiovascular diseases (21) and diabetes mellitus among adults (23). In children andadolescents, low aerobic fitness has also been associated with cardiometabolic (5) riskfactors (large waist circumference, high blood pressure, and high insulin, glucose, and lipidlevels) (15). Data from 9- and 15-yr-old youths participating in the European Youth HeartStudy indicated that low aerobic fitness was associated with increased waist circumference,insulin, glucose, and lipid concentrations and a clustered score that included all of thecardiometabolic risk factors (13). Interestingly, the researchers also found that theseassociations were independent of both physical activity (the behavior that influences fitness)and fatness (13).
JAGO et al. Page 2
Med Sci Sports Exerc. Author manuscript; available in PMC 2010 August 13.
NIH
-PA Author Manuscript
NIH
-PA Author Manuscript
NIH
-PA Author Manuscript

Extensive research has shown that the risk of cardiovascular disease and diabetes amongoverweight adults is ameliorated if the adult has a high level of fitness (22,32). For example,data from the Cooper Clinic in Dallas showed that unfit, lean men had double the risk ofcardiovascular disease and all-cause mortality than lean men who were fit (22). Moreover,unfit lean men had a higher risk of cardiovascular disease and all-cause mortality than fit butoverweight men (22). These findings suggest that fitness offers a degree of protectionagainst cardiovascular disease and mortality even if the individual is overweight. Similarfindings have been reported for women (32). Although there is a lack of evidence about theassociations among childhood fitness, adiposity, and mortality, the prevalence ofcardiometabolic risk factors has been shown to increase with higher levels of obesity amongyouth (20,31). Higher levels of obesity among children and adolescents have also beenassociated with low levels of aerobic fitness (16). Comparable associations among fitness,adiposity, and cardiometabolic risk factors findings have also been reported among arelatively small (296 boys and 188 girls) sample of 8- to 18-yr-old US youths (12). It is notclear if associations are evident for all cardiometabolic risk factors among adolescents.Understanding the importance of fitness, obesity status, and the prevalence ofcardiometabolic risk factors among adolescents will provide key information to aid thedesign of strategies to reduce the prevalence of cardiometabolic risk factors amongadolescents, thereby reducing disease risk.
Boys have higher levels of aerobic fitness than girls (28), with some evidence of ethnicdifferences in fitness levels (16). Maturation differences in both fitness (28) and cardio-metabolic risk factors have also been reported (39). Thus, in examining the associationsamong fitness, obesity, and cardiometabolic risk factors, it is important to account for thesebiological and sociodemographic factors. It is also important to recognize that the majorityof previous studies that have examined associations between aerobic fitness and cardio-metabolic risk factors among youth have reported fitness in relation to body mass (mLO2·kg–1·min–1 or W·kg–1) (4,30), which precludes the necessary examination of theindependent effects of fitness and fatness. In light of the evidence presented above, the aimof this article was to examine the extent to which fitness and obesity status areindependently associated with cardiometabolic risk factors among a large, ethnically diversesample of sixth-grade US adolescents.
METHODSSample
Data were collected as part of the baseline assessment of the HEALTHY Study, a NationalInstitute of Diabetes and Digestive and Kidney Diseases multisite study designed to reducethe prevalence of risk factors for type 2 diabetes mellitus among middle school children(7,18). Data were collected at seven field centers (Baylor College of Medicine, Houston,TX; Oregon Health & Science University, Portland, OR; University of California at Irvine,Irvine, CA; Temple University, Philadelphia, PA; University of North Carolina at ChapelHill, Chapel Hill, NC; University of Pittsburgh, Pittsburgh, PA; and University of TexasHealth Science Center at San Antonio, San Antonio, TX), with a coordinating center inWashington, DC (George Washington University Biostatistics Center). Participants wererecruited from 42 middle schools, 6 per field center. Schools were required to have at least50% of students eligible for free or reduced-price lunch or belonging to a minority groupand an annual student attrition rate from all causes ≤25%. All sixth-grade students wereinvited to participate in a “health screening.” Students were given a $50 incentive for datacollection. This study was approved by the institutional review boards at each field center,and written informed parental consent and child assent were obtained.
JAGO et al. Page 3
Med Sci Sports Exerc. Author manuscript; available in PMC 2010 August 13.
NIH
-PA Author Manuscript
NIH
-PA Author Manuscript
NIH
-PA Author Manuscript

ProceduresMeasurements were conducted by personnel who were trained and certified in recordingheight, weight, and waist circumference accurately. Height and body mass were measuredwithout shoes using the Prospective Enterprises PE-AIM-101 stadiometer and the SECACorporation Alpha 882 electronic scale. Body mass index (BMI; kg·m–2), which provides anindex of overweight or obesity, was calculated and, for the purposes of this article, wasinterpreted as an indicator of “fatness.” Waist circumference was taken using a Gulick tapemeasure (G-tape) with a tension device on bare skin measured just above the iliac crest.Blood pressure was recorded three times using an automated blood pressure monitor(HEM-907XL; Omron, Vernon Hills, IL). The initial value was recorded after theparticipant had been seated quietly for 5 min with each subsequent value recorded 1 minafter the preceding recording. An appropriate size cuff was used for all participants. Themean of the second and third recordings was used in all subsequent analyses.
Pubertal status was self-reported individually in private using the Pubertal DevelopmentScale (29) and was converted to pubertal stage groups that are consistent with the fivepubertal stages that have been outlined by Tanner (33). Ethnicity and race were collected bystudent self-report in response to two separate items. Frequently, this age group did notunderstand the distinction between ethnicity and race, and the information from both itemswas combined and categorized as follows: anyone checking “Hispanic or Latino” ethnicitywas classified as Hispanic, non-Hispanics choosing only “black or African American” racewere classified as black, non-Hispanics choosing only “white” race were white, and all otherresponse categories were combined into “other.” A parent or guardian completed aquestionnaire providing the highest level of education in the household. On the basis ofthese responses, the highest household education level was classified as low (less than highschool or some high school), middle (high school graduate or some college or specializedtraining), or high (college or university graduate or postgraduate training or degree).
Fitness was assessed using the 20-m shuttle test (20-MST) (24,25), most frequently during aphysical education class. The test required students to run back and forth between two linesset 20 m apart. The running pace was determined by audio signals emitted from a pre-recorded CD. The test started at 8.5 km·h–1 and increased by 0.5 km·h–1 with eachsubsequent level. The test was completed when the participant was not able to complete thedistance at the stipulated pace on two laps. A score for the test was based on the number oflaps completed, and for the reasons outlined above, this score was not adjusted for bodymass.
Participants were called the night before data collection to remind them not to eat or drinkanything but water after midnight and were asked at the beginning of the blood screeningwhen they last ate. Participants who reported eating after midnight were considerednonfasting and asked to return another day. Experienced pediatric phlebotomists obtainedfasting blood samples that were processed and then shipped to the central blood laboratoryat the University of Washington Northwest Lipid Research Laboratories for all analyses.Analyses of glucose were performed on a Roche P module autoanalyzer by the hexokinasemethod using reagent from Roche Diagnostics (Indianapolis, IN). Insulin was measured by atwo-site immunoenzymometric assay performed using a Tosoh 1800 autoanalyzer (TosohBiosciences Inc., San Francisco, CA). The assay sensitivity level was 2.0 μU·mL–1, withinterassay and intra-assay coefficients of variation <10%. The assay had a high specificity ascross-reactivity with human C-peptide and pro-insulin was 0% and 2%, respectively.Measurements of total plasma cholesterol, cholesterol in the lipoprotein fractions, andtriglycerides were performed enzymatically on the Roche Modular-P autoanalyzer usingmethods standardized to the Centers for Disease Control and Prevention reference methods(37). Determination of HDL-cholesterol was performed after precipitation of apolipoprotein
JAGO et al. Page 4
Med Sci Sports Exerc. Author manuscript; available in PMC 2010 August 13.
NIH
-PA Author Manuscript
NIH
-PA Author Manuscript
NIH
-PA Author Manuscript

B–containing particles by dextran sulfate Mg2+. LDL-cholesterol was calculated using theequation of Fridewald et al. (14). This approach for calculating LDL is clinically reliable ifthe measurements of total and HDL-cholesterol are performed with a high level of accuracyand triglycerides are <400 mg·dL–1 (38). In the case of elevated triglycerides, a completelipoprotein separation by ultracentrifugation, which allows quantization of the individuallipoprotein classes, was performed using the Lipid Research Clinics Beta Quantificationprocedure (17). The interassay coefficients of variations are consistently <1.5% for totalcholesterol and triglycerides and <2% for HDL-cholesterol.
Statistical analysisA total of 6358 sixth-grade students participated in the HEALTHY Study at baseline. Ofthese participants, 5394 had complete data for anthropometric assessments, blood values,20-MST, pubertal stage survey, and parental or guardian report of highest level of householdeducation. However, 439 of these participants reported other or mixed race and weredropped from all analysis because the results for this ethnic group are too heterogeneous tointerpret. Therefore, analyses are presented for the remaining 4955 participants (2614females). Pubertal data were collapsed into three groups, prepubertal (stage 1), earlypubertal (stages 2 and 3), and pubertal (stages 4 and 5).
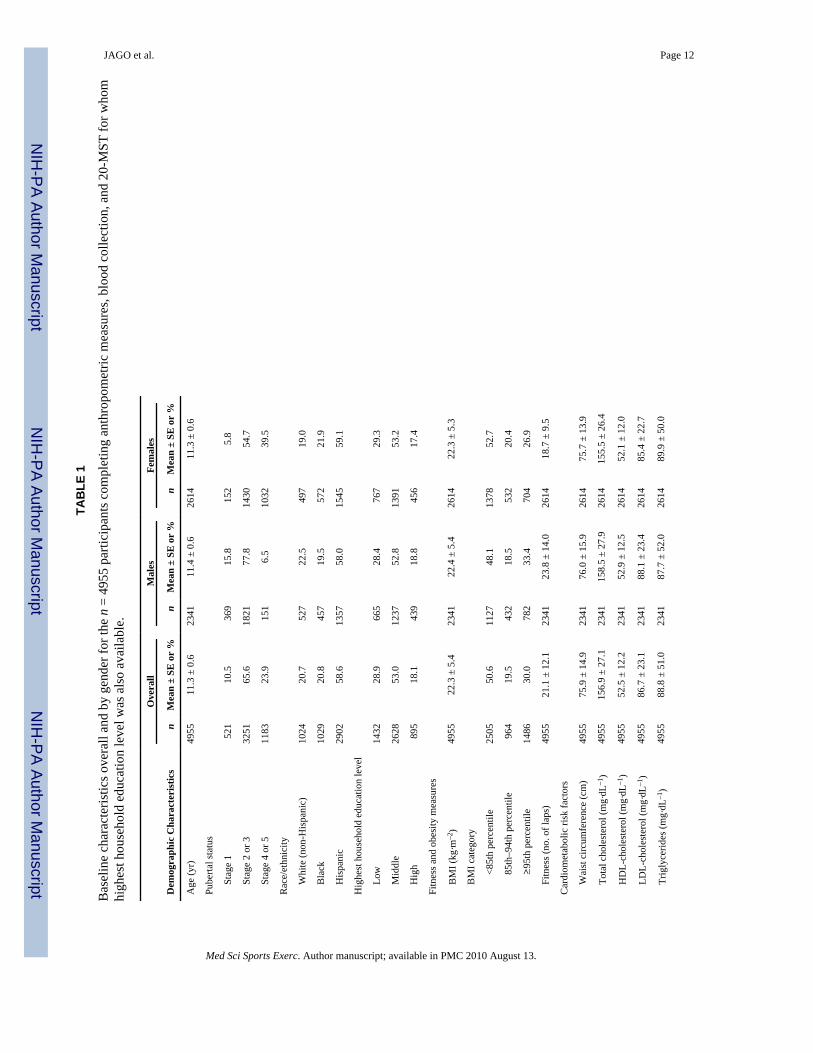
Descriptive statistics with means and SE for continuous measures and frequency distributionfor categorical variables are presented in Table 1, both overall and by gender for thecomplete sample listed above. Fitness category was determined by quintiles on the basis ofthe number of laps for both genders, which are inexact because of ties. BMI percentile byage and gender was calculated using the Centers for Disease Control and Prevention 2000criteria (8,9). Youth with BMI ≥85th but <95th percentile were classified as overweight, andthose with BMI ≥95th percentile were classified as obese (1). In this study, the three-levelBMI-based obesity status is used as a proxy of fatness.
Separate regression models were fitted for each continuous cardiometabolic risk factor usingthe PROC GLIMMIX procedure with either fitness or BMI group as an exposure measure.To adjust for the clustering of participants within schools, a random effect for school wasincluded in the models. Because one-way ANOVA tests indicated that there were genderdifferences for both fitness (P < 0.0001) and BMI categories (P < 0.0013), models were runseparately for males and females. All models were adjusted for pubertal stage group, race,and household education. Adjusted least-square means and 95% confidence intervals wereobtained from the model, with the overall P values for a test of group differences (Tables 2and 3). Where there were statistically significant group differences (P < 0.01), pairwisecomparisons were carried out to determine which differences between categories werestatistically significant. To account for multiple testing, Bonferroni P value adjustmentswere performed for all pairwise comparisons.
Models including both BMI and fitness categories were fitted to examine whether theirconcurrent relationships with each cardiometabolic risk factor changed from the initial setsof models where BMI and fitness categories were entered into the model separately (Table4). The models were adjusted for pubertal stage group, race, and household education. Toaid in the interpretation of each model, overall F test statistic values are presented (Table 4).As another measure of model fit, the Akaike Information Criterion (AIC) is also presented(Table 4). The AIC is AIC = 2k – 2ln(L), where k is the number of parameters in thestatistical model and L is the maximized value of the likelihood function for the estimatedmodel. The AIC is not a test on the model in the sense of hypothesis testing; rather, it is atool for model selection. Given a data set, competing models may be ranked according totheir AIC. In terms of interpretation, the model with the lowest AIC provides the best modelfit (6).
JAGO et al. Page 5
Med Sci Sports Exerc. Author manuscript; available in PMC 2010 August 13.
NIH
-PA Author Manuscript
NIH
-PA Author Manuscript
NIH
-PA Author Manuscript
Further analyses were also conducted using BMI percentile and number of laps ascontinuous variables instead of the categorical approach reported above; however, as similarresults were observed for these models, findings are not reported here. The data presentedhere are from the baseline data collection of a cluster-randomized controlled trial in whichthe effect of a multicomponent intervention is being tested to prevent risk factors for type 2diabetes. Therefore, although to take account of the multiple tests performed α was set at0.01, all P values reported within this article represent exploratory findings because thestudy was powered to test the effect of the intervention on the final primary outcomes only.All analyses were performed using SAS version 9.2 (SAS Institute, Cary, NC).
RESULTSAs shown in Table 1, the sample that was included in the analysis was 58.6% Hispanic,20.8% black, and 20.7% white and included a spread of pubertal stages and socioeconomicgroups (Table 1). A little more than half (50.6%) of the participants were normal weight(BMI <85th percentile) with 30.0% obese (BMI ≥95th percentile). One-way ANOVA testsindicated that there were gender differences for both fitness (P < 0.0001) and BMIcategories (P < 0.0013), with higher levels of obesity among the males and lower levels offitness among the girls. The distribution of fitness laps and the associated quintile thresholdsare presented separately for males and females in Figure 1. There was an approximatelyeven distribution of girls (631, 554, 385, 573, and 471) and boys (560, 438, 433, 458, and452) within each quintile, with the slight variations in quintile size because of ties in thenumber of laps. The gender-specific fitness quintiles were as follows: level 1 = 0–11 laps forboth males and females, level 2 = 12–16 laps for males and 12–15 laps for females, level 3 =17–24 laps for males and 16–18 laps for females, level 4 = 25–35 laps for males and 19–26laps for females, and level 5 = 36–89 laps for males and 27–74 laps for females.
Means and 95% confidence intervals for each of the cardiometabolic risk factors arepresented for BMI groups for both genders in Table 2. The mean values for each risk factor(except HDL which was the reverse) increased across the obesity groups (P < 0.001), withvalues highest for the obese group (BMI ≥95th percentile) and lowest for the normal weightgroup (BMI <85th percentile). Follow-up tests indicated that waist circumference, HDL-cholesterol, triglycerides, diastolic blood pressure, and insulin were different among each ofthe three BMI groups for both genders.
Means and 95% confidence intervals for each of the cardiometabolic risk factors arepresented stratified by gender-specific fitness quintiles for both genders in Table 3. Waistcircumference, LDL-cholesterol, triglycerides, diastolic blood pressure, and insulin were allinversely associated with fitness quintiles, with higher levels of fitness associated with lowerrisk factor means in both boys and girls. HDL-cholesterol levels were positively associatedwith fitness quintiles in both boys and girls, with higher levels of HDL associated withhigher quintiles of fitness. Fitness quintiles were not associated with girls’ total cholesterolor the systolic blood pressure and with glucose levels of either gender. Follow-up testsindicated that, with the exception of male waist circumference, there were no significantdifferences between the cardiometabolic risk factor levels of all quintiles. For example, forgirls’ LDL-cholesterol, there was only a significant difference between the lowest and toptwo highest quintiles of fitness. Moreover, only waist circumference and insulin weresignificantly different between the first and second quintiles of fitness. Similarly, very fewof the comparisons between adjacent fitness quintiles (e.g., 2 vs 3) were significant for mostof the cardiometabolic risk factors. Collectively, these findings demonstrate a patternwhereby, although cardio-metabolic risk factors differed by quintiles of fitness, differencestended to be statistically significant only when nonadjacent groups with greater differencesin fitness levels were compared.
JAGO et al. Page 6
Med Sci Sports Exerc. Author manuscript; available in PMC 2010 August 13.
NIH
-PA Author Manuscript
NIH
-PA Author Manuscript
NIH
-PA Author Manuscript
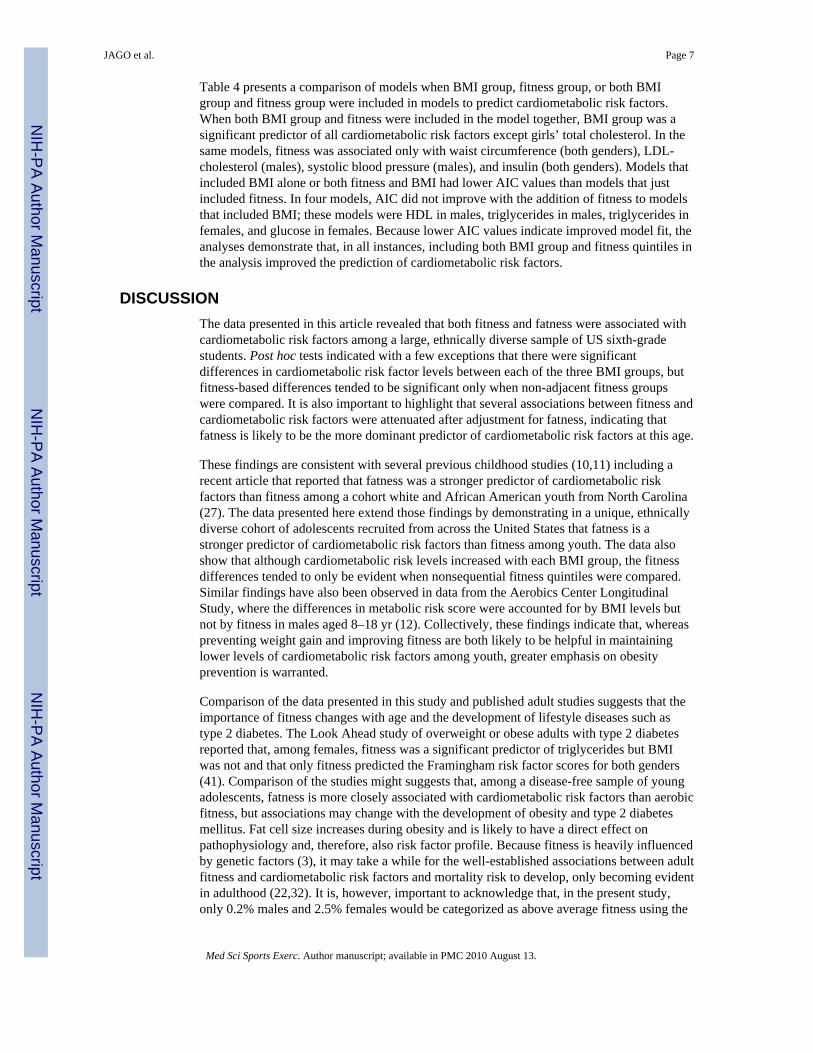
Table 4 presents a comparison of models when BMI group, fitness group, or both BMIgroup and fitness group were included in models to predict cardiometabolic risk factors.When both BMI group and fitness were included in the model together, BMI group was asignificant predictor of all cardiometabolic risk factors except girls’ total cholesterol. In thesame models, fitness was associated only with waist circumference (both genders), LDL-cholesterol (males), systolic blood pressure (males), and insulin (both genders). Models thatincluded BMI alone or both fitness and BMI had lower AIC values than models that justincluded fitness. In four models, AIC did not improve with the addition of fitness to modelsthat included BMI; these models were HDL in males, triglycerides in males, triglycerides infemales, and glucose in females. Because lower AIC values indicate improved model fit, theanalyses demonstrate that, in all instances, including both BMI group and fitness quintiles inthe analysis improved the prediction of cardiometabolic risk factors.
DISCUSSIONThe data presented in this article revealed that both fitness and fatness were associated withcardiometabolic risk factors among a large, ethnically diverse sample of US sixth-gradestudents. Post hoc tests indicated with a few exceptions that there were significantdifferences in cardiometabolic risk factor levels between each of the three BMI groups, butfitness-based differences tended to be significant only when non-adjacent fitness groupswere compared. It is also important to highlight that several associations between fitness andcardiometabolic risk factors were attenuated after adjustment for fatness, indicating thatfatness is likely to be the more dominant predictor of cardiometabolic risk factors at this age.
These findings are consistent with several previous childhood studies (10,11) including arecent article that reported that fatness was a stronger predictor of cardiometabolic riskfactors than fitness among a cohort white and African American youth from North Carolina(27). The data presented here extend those findings by demonstrating in a unique, ethnicallydiverse cohort of adolescents recruited from across the United States that fatness is astronger predictor of cardiometabolic risk factors than fitness among youth. The data alsoshow that although cardiometabolic risk levels increased with each BMI group, the fitnessdifferences tended to only be evident when nonsequential fitness quintiles were compared.Similar findings have also been observed in data from the Aerobics Center LongitudinalStudy, where the differences in metabolic risk score were accounted for by BMI levels butnot by fitness in males aged 8–18 yr (12). Collectively, these findings indicate that, whereaspreventing weight gain and improving fitness are both likely to be helpful in maintaininglower levels of cardiometabolic risk factors among youth, greater emphasis on obesityprevention is warranted.
Comparison of the data presented in this study and published adult studies suggests that theimportance of fitness changes with age and the development of lifestyle diseases such astype 2 diabetes. The Look Ahead study of overweight or obese adults with type 2 diabetesreported that, among females, fitness was a significant predictor of triglycerides but BMIwas not and that only fitness predicted the Framingham risk factor scores for both genders(41). Comparison of the studies might suggests that, among a disease-free sample of youngadolescents, fatness is more closely associated with cardiometabolic risk factors than aerobicfitness, but associations may change with the development of obesity and type 2 diabetesmellitus. Fat cell size increases during obesity and is likely to have a direct effect onpathophysiology and, therefore, also risk factor profile. Because fitness is heavily influencedby genetic factors (3), it may take a while for the well-established associations between adultfitness and cardiometabolic risk factors and mortality risk to develop, only becoming evidentin adulthood (22,32). It is, however, important to acknowledge that, in the present study,only 0.2% males and 2.5% females would be categorized as above average fitness using the
JAGO et al. Page 7
Med Sci Sports Exerc. Author manuscript; available in PMC 2010 August 13.
NIH
-PA Author Manuscript
NIH
-PA Author Manuscript
NIH
-PA Author Manuscript

FITNESSGRAM cutoff criteria (40). Therefore, to assess associations with a range offitness levels, we created gender-specific fitness quintiles instead of using the dichotomousFITNESSGRAM criteria in our analysis. This approach limits our ability to drawconclusions about “fit” versus “unfit” adolescents. In addition, the low levels of fitness andthe lack of highly fit adolescents could have attenuated the relationship between fitness andthe cardiometabolic risk factors.
Consistent with previous studies, the girls in this study had lower levels of fitness than boys(19,34). Therefore, although the associations between fitness and cardiometabolic riskreported here suggest a need to develop interventions aimed at maintaining adolescentfitness, there is a particular need to develop strategies to increase girls’ fitness. This isparticularly important because low levels of fitness track into adulthood (35), thus increasingthe importance that children, especially girls, develop habits to promote and maintain fitnessthat will benefit them later in life.
Strengths and limitationsThis study has extended the current literature base by providing new information about theassociations among fitness, obesity, and cardiometabolic risk factors among a large,ethnically diverse sample of sixth-grade youth. This study does, however, have somelimitations that need to be recognized. Although the 20-MST has been strongly associated (r= 0.69–0.96) (2,26,36) with aerobic fitness in laboratory tests, the 20-MST does not directlymeasure aerobic fitness. Validity of estimated aerobic fitness is largely influenced by levelsof maximal exertion or motivation of participants. Therefore, 20-MST only provides anestimate of fitness. The study is also limited by the single age group, which precludes anassessment of age or maturation-related differences in associations. It is also important torecognize that although a validated scale was used, pubertal stage was self-reported by theparticipants and could therefore be prone to a degree of measurement error. Finally, becausethe study is cross-sectional, it is not possible to identify directions of associations orcausation between variables of interest.
In conclusion, the data presented in this article have shown that, among a large, ethnicallydiverse cohort of US youth, both fatness and fitness are associated with cardiometabolic riskfactors. Associations were, however, stronger for fatness than fitness, and several fitnessassociations were attenuated after controlling for fatness. Results, therefore, suggest thatalthough maintaining high levels of fitness and preventing obesity may positively affectcardiometabolic risk factors, the greater benefit may be obtained from obesity prevention,and there is a need to redouble efforts in this area.
AcknowledgmentsThis work was completed with funding from National Institute of Diabetes and Digestive and Kidney Diseases/National Institutes of Health grant numbers U01-DK61230, U01-DK61249, U01-DK61231, and U01-DK61223 tothe STOPP-T2D collaborative group, with additional support from the American Diabetes Association.
REFERENCES1. American Medical Association. Expert Committee Recommendations on the Assessment,
Prevention, and Treatment of Child and Adolescent Overweight and Obesity [Internet]. AmericanMedical Association; Washington (DC): [2007 Nov 2]. Available from:http://www.ama-assn.org/ama1/pub/upload/mm/433/ped_obesity_recs.pdf
2. Boreham CA, Paliczka VJ, Nichols AK. A comparison of the PWC170 and 20-MST tests of aerobicfitness in adolescent schoolchildren. J Sports Med Phys Fitness 1990;30(1):19–23. [PubMed:2366530]
JAGO et al. Page 8
Med Sci Sports Exerc. Author manuscript; available in PMC 2010 August 13.
NIH
-PA Author Manuscript
NIH
-PA Author Manuscript
NIH
-PA Author Manuscript
3. Bouchard C, Dionne FT, Simoneau J-A, Boulay MR. Genetics of aerobic and anaerobicperformance. Exerc Sport Sci Rev 1992;20:27–58. [PubMed: 1623888]
4. Brage S, Wedderkopp N, Ekelund U, et al. Features of the metabolic syndrome are associated withobjectively measured physical activity and fitness in Danish children: the European Youth HeartStudy. Diabetes Care 2004;27(9):2141–8. [PubMed: 15333475]
5. Brunzell JD, Davidson M, Furberg CD, et al. Lipoprotein management in patients withcardiometabolic risk: consensus conference report from the American Diabetes Association and theAmerican College of Cardiology Foundation. J Am Coll Cardiol 2008;51(15):1512–24. [PubMed:18402913]
6. Burnham KP, Anderson DR. Multi-model inference: understanding AIC and BIC in modelselection. Sociol Methods Res 2004;33:261–304.
7. Buse J, Hirst K. The HEALTHY Study: introduction. Int J Obes (Lond) 2009;33(4 suppl):S1–2.[PubMed: 19623183]
8. Centers for Disease Control National Center for Health Statistics [Internet]. CDC Growth Charts forthe United States. Centers for Disease Control; Atlanta (GA): 2000 [2009 Jun 1]. Available from:http://www.cdc.gov/growthcharts
9. Centers for Disease Control National Center for Health Statistics [Internet]. A SAS Program for theCDC Growth Charts. Centers for Disease Control; Atlanta (GA): [2009 Jun 1]. Available from:http://www.cdc.gov/nccdphp/dnpa/growthcharts/sas.htm
10. Cook S, Auinger P, Li C, Ford ES. Metabolic syndrome rates in United States adolescents, fromthe National Health and Nutrition Examination Survey, 1999–2002. J Pediatr. 2008 152(2):165–70.
11. Eisenmann JC. Aerobic fitness, fatness and the metabolic syndrome in children and adolescents.Acta Paediatr 2007;96(12):1723–9. [PubMed: 17971189]
12. Eisenmann JC, Welk GJ, Wickel EE, Blair SN. Combined influence of cardiorespiratory fitnessand body mass index on cardiovascular disease risk factors among 8–18 year old youth: theAerobics Center Longitudinal Study. Int J Pediatr Obes 2007;2(2):66–72. [PubMed: 17763013]
13. Ekelund U, Anderssen SA, Froberg K, Sardinha LB, Andersen LB, Brage S. Independentassociations of physical activity and cardiorespiratory fitness with metabolic risk factors inchildren: the European youth heart study. Diabetologia 2007;50(9):1832–40. [PubMed: 17641870]
14. Fridewald WT, Levy RI, Fredrickson DS. Estimation of the concentration of low-densitylipoprotein cholesterol in plasma, without use of the preparative ultracentrifuge. Clin Chem1972;18:499–502. [PubMed: 4337382]
15. Froberg K, Andersen LB. Mini review: physical activity and fitness and its relations tocardiovascular disease risk factors in children. Int J Obes (Lond) 2005;29(2 suppl):S34–9.[PubMed: 16385750]
16. Gutin B, Yin Z, Humphries MC, Barbeau P. Relations of moderate and vigorous physical activityto fitness and fatness in adolescents. Am J Clin Nutr 2005;81(4):746–50. [PubMed: 15817847]
17. Hainline, AJ.; Karon, J.; Kippel, K. Manual of Laboratory Operations: Lipid Research ClinicsProgram, Lipid and Lipoprotein Analysis. 2nd ed.. US Department of Health & Human Services;Washington (DC): 1983. p. 75-628.
18. Hirst K, Baranowski T, DeBar L, et al. HEALTHY Study rationale, design and methods:moderating risk of type 2 diabetes in multi-ethnic middle school students. Int J Obes (Lond)2009;33(4 suppl):S4–20. [PubMed: 19623188]
19. Hussey J, Bell C, Bennett K, O'Dwyer J, Gormley J. Relationship between the intensity of physicalactivity, inactivity, cardiorespiratory fitness and body composition in 7–10-year-old Dublinchildren. Br J Sports Med 2007;41(5):311–6. [PubMed: 17395610]
20. Jago R, Harrell JS, McMurray RG, Edelstein S, El Ghormli L, Bassin S. Prevalence of abnormallipid and blood pressure values among an ethnically diverse population of eighth-gradeadolescents and screening implications. Pediatrics 2006;117(6):2065–73. [PubMed: 16740849]
21. Lee CD, Blair SN. Cardiorespiratory fitness and stroke mortality in men. Med Sci Sports Exerc2002;34(4):592–5. [PubMed: 11932565]
22. Lee CD, Blair SN, Jackson AS. Cardiorespiratory fitness, body composition, and all-cause andcardiovascular disease mortality in men. Am J Clin Nutr 1999;69:373–80. [PubMed: 10075319]
JAGO et al. Page 9
Med Sci Sports Exerc. Author manuscript; available in PMC 2010 August 13.
NIH
-PA Author Manuscript
NIH
-PA Author Manuscript
NIH
-PA Author Manuscript
23. Lee DC, Sui X, Church TS, Lee IM, Blair SN. Associations of cardiorespiratory fitness and obesitywith risks of impaired fasting glucose and type 2 diabetes in men. Diabetes Care 2009;32(2):257–62. [PubMed: 18984778]
24. Leger LA, Lambert J. A maximal multistage 20-m shuttle run test to predict ṾO2max. Eur J ApplPhysiol Occup Physiol 1982;49(1):1–12. [PubMed: 7201922]
25. Leger LA, Mercier D, Gadoury C, Lambert J. The multistage 20 metre shuttle run test for aerobicfitness. J Sports Sci 1988;6(2):93–101. [PubMed: 3184250]
26. Liu NY, Plowman SA, Looney MA. The reliability and validity of the 20-meter shuttle test inAmerican students 12 to 15 years old. Res Q Exerc Sport 1992;63(4):360–5. [PubMed: 1439160]
27. Ondrak KS, McMurray RG, Bangdiwala SI, Harrell JS. Influence of aerobic power and percentbody fat on cardiovascular disease risk in youth. J Adolesc Health 2007;41(2):146–52. [PubMed:17659218]
28. Pate RR, Wang CY, Dowda M, Farrell SW, O'Neill JR. Cardiorespiratory fitness levels among USyouth 12 to 19 years of age: findings from the 1999–2002 National Health and NutritionExamination Survey. Arch Pediatr Adolesc Med 2006;160(10):1005–12. [PubMed: 17018458]
29. Petersen AC, Crockett L, Richards M, Boxer A. A self-report measure of pubertal status:reliability, validity, and initial norms. J Youth Adolesc 1988;17:117–33.
30. Ruiz JR, Ortega FB, Rizzo NS, et al. High cardiovascular fitness is associated with low metabolicrisk score in children: the European Youth Heart Study. Pediatr Res 2007;61(3):350–5. [PubMed:17314696]
31. STOPP-T2D Prevention Study Group. Presence of diabetes risk factors in a large U.S. eighth-gradecohort. Diabetes Care 2006;29(2):212–7. [PubMed: 16443862]
32. Sui X, Hooker SP, Lee IM, et al. A prospective study of cardiorespiratory fitness and risk of type 2diabetes in women. Diabetes Care 2007;31(3):550–5. [PubMed: 18070999]
33. Tanner, JM. Growth at Adolescence. Blackwell; Oxford (UK): 1962. p. 34034. Treuth MS, Hou N, Young DR, Maynard LM. Accelerometry-measured activity or sedentary time
and overweight in rural boys and girls. Obes Res 2005;13(9):1606–14. [PubMed: 16222064]35. Twisk JWR, Kemper HCG, Van Mechelen W. The relationship between physical fitness and
physical activity during adolescence and cardiovascular disease risk factors at adult age. TheAmsterdam Growth and Health Longitudinal Study. Int J Sports Med 2002;23(suppl):S8–14.[PubMed: 12012256]
36. van Mechelen W, Hlobil H, Kemper HCG. Validation of two running tests as estimates of maximalaerobic power in children. Eur J Appl Physiol Occup Physiol 1986;55(5):503–6. [PubMed:3769907]
37. Warnick GR. Enzymatic methods for quantification of lipoprotein lipids. Methods Enzymol1986;129:101–23. [PubMed: 3724535]
38. Warnick GR, Knopp RH, Fitzpatrick V, Branson L. Estimating low-density lipoprotein cholesterolby the Fridewald equation is adequate for classifying patients on the basis of nationallyrecommended cutpoints. Clin Chem 1990;36:15–9. [PubMed: 2297909]
39. Weir MR, Stafford EM, Gregory G, Lawson MA, Pearl W. The relationship between sexualmaturity rating, age and increased blood pressure in adolescents. J Adolesc Health Care1988;9:465–9. [PubMed: 3182359]
40. Welk, GJ.; Meredith, MD. Fitnessgram/Activitygram Reference Guide. The Cooper Institute;Dallas (TX): 2008. p. 96-121.
41. Wing RR, Jakicic J, Neiberg R, et al. Fitness, fatness, and cardiovascular risk factors in type 2diabetes: look ahead study. Med Sci Sports Exerc 2007;39(12):2107–16. [PubMed: 18046181]
JAGO et al. Page 10
Med Sci Sports Exerc. Author manuscript; available in PMC 2010 August 13.
NIH
-PA Author Manuscript
NIH
-PA Author Manuscript
NIH
-PA Author Manuscript
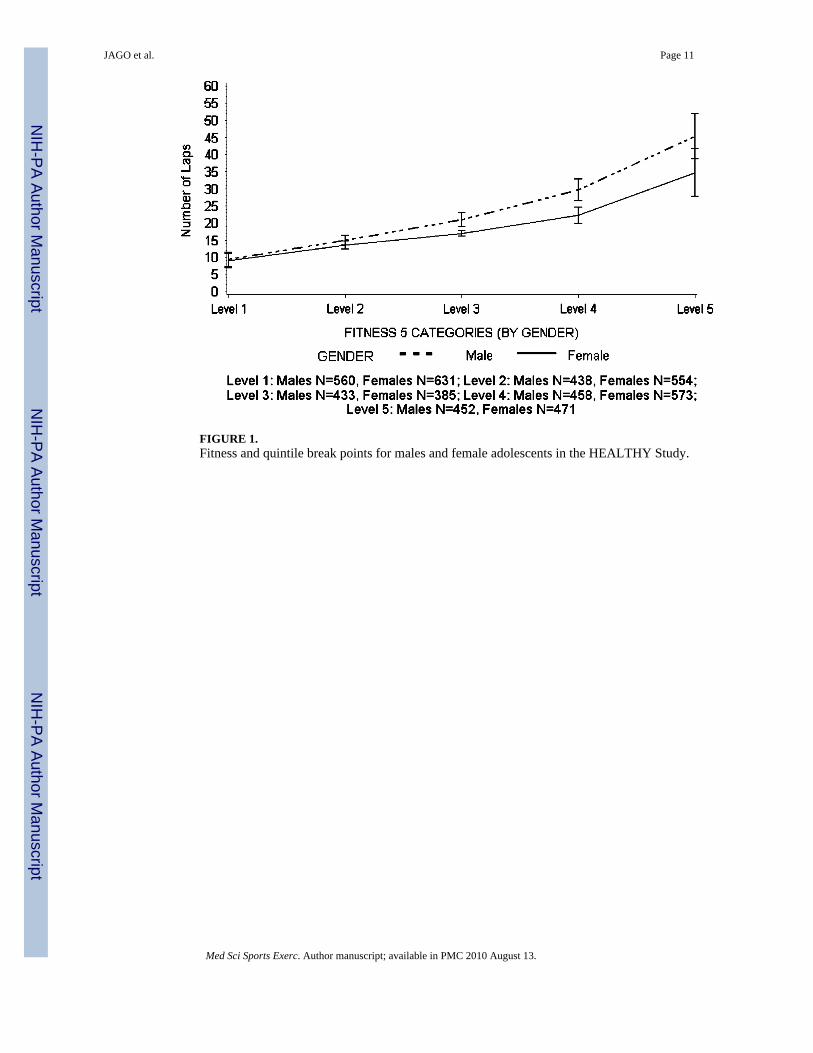
FIGURE 1.Fitness and quintile break points for males and female adolescents in the HEALTHY Study.
JAGO et al. Page 11
Med Sci Sports Exerc. Author manuscript; available in PMC 2010 August 13.
NIH
-PA Author Manuscript
NIH
-PA Author Manuscript
NIH
-PA Author Manuscript
NIH
-PA Author Manuscript
NIH
-PA Author Manuscript
NIH
-PA Author Manuscript
JAGO et al. Page 12
TAB
LE 1
Bas
elin
e ch
arac
teris
tics o
vera
ll an
d by
gen
der f
or th
e n
= 49
55 p
artic
ipan
ts c
ompl
etin
g an
thro
pom
etric
mea
sure
s, bl
ood
colle
ctio
n, a
nd 2
0-M
ST fo
r who
mhi
ghes
t hou
seho
ld e
duca
tion
leve
l was
als
o av
aila
ble.
Ove
rall
Mal
esFe
mal
es
Dem
ogra
phic
Cha
ract
eris
tics
nM
ean
± SE
or
%n
Mea
n ±
SE o
r %
nM
ean
± SE
or
%
Age
(yr)
4955
11.3
± 0
.623
4111
.4 ±
0.6
2614
11.3
± 0
.6
Pube
rtal s
tatu
s
S
tage
152
110
.536
915
.815
25.
8
S
tage
2 o
r 332
5165
.618
2177
.814
3054
.7
S
tage
4 o
r 511
8323
.915
16.
510
3239
.5
Rac
e/et
hnic
ity
W
hite
(non
-His
pani
c)10
2420
.752
722
.549
719
.0
B
lack
1029
20.8
457
19.5
572
21.9
H
ispa
nic
2902
58.6
1357
58.0
1545
59.1
Hig
hest
hou
seho
ld e
duca
tion
leve
l
L
ow14
3228
.966
528
.476
729
.3
M
iddl
e26
2853
.012
3752
.813
9153
.2
H
igh
895
18.1
439
18.8
456
17.4
Fitn
ess a
nd o
besi
ty m
easu
res
B
MI (
kg·m
–2)
4955
22.3
± 5
.423
4122
.4 ±
5.4
2614
22.3
± 5
.3
B
MI c
ateg
ory
<85
th p
erce
ntile
2505
50.6
1127
48.1
1378
52.7
85t
h–94
th p
erce
ntile
964
19.5
432
18.5
532
20.4
≥95
th p
erce
ntile
1486
30.0
782
33.4
704
26.9
F
itnes
s (no
. of l
aps)
4955
21.1
± 1
2.1
2341
23.8
± 1
4.0
2614
18.7
± 9
.5
Car
diom
etab
olic
risk
fact
ors
W
aist
circ
umfe
renc
e (c
m)
4955
75.9
± 1
4.9
2341
76.0
± 1
5.9
2614
75.7
± 1
3.9
T
otal
cho
lest
erol
(mg·
dL–1
)49
5515
6.9
± 27
.123
4115
8.5
± 27
.926
1415
5.5
± 26
.4
H
DL-
chol
este
rol (
mg·
dL–1
)49
5552
.5 ±
12.
223
4152
.9 ±
12.
526
1452
.1 ±
12.
0
L
DL-
chol
este
rol (
mg·
dL–1
)49
5586
.7 ±
23.
123
4188
.1 ±
23.
426
1485
.4 ±
22.
7
T
rigly
cerid
es (m
g·dL
–1)
4955
88.8
± 5
1.0
2341
87.7
± 5
2.0
2614
89.9
± 5
0.0
Med Sci Sports Exerc. Author manuscript; available in PMC 2010 August 13.

NIH
-PA Author Manuscript
NIH
-PA Author Manuscript
NIH
-PA Author Manuscript
JAGO et al. Page 13
Ove
rall
Mal
esFe
mal
es
Dem
ogra
phic
Cha
ract
eris
tics
nM
ean
± SE
or
%n
Mea
n ±
SE o
r %
nM
ean
± SE
or
%
S
BP
(mm
Hg)
4955
107.
6 ±
10.1
2341
108.
4 ±
10.2
2614
106.
9 ±
9.9
D
BP
(mm
Hg)
4955
63.7
± 8
.723
4163
.5 ±
8.8
2614
63.8
± 8
.6
G
luco
se (m
g·dL
–1)
4955
93.5
± 6
.623
4194
.5 ±
6.6
2614
92.6
± 6
.6
In
sulin
(μU
·mL–1
)49
5513
.2 ±
11.
123
4112
.0 ±
11.
626
1414
.2 ±
10.
6
DB
P, d
iast
olic
blo
od p
ress
ure;
SB
P, sy
stol
ic b
lood
pre
ssur
e.
Med Sci Sports Exerc. Author manuscript; available in PMC 2010 August 13.

NIH
-PA Author Manuscript
NIH
-PA Author Manuscript
NIH
-PA Author Manuscript
JAGO et al. Page 14
TAB
LE 2
Mea
ns a
nd 9
5% c
onfid
ence
inte
rval
s for
car
diom
etab
olic
risk
fact
or b
y B
MI c
ateg
ory
adju
sted
for r
ace,
hou
seho
ld e
duca
tion
leve
l, an
d pu
berta
l sta
ge(m
ales
n =
234
1, fe
mal
es n
= 2
614)
.
BM
I Cat
egor
y
Car
diom
etab
olic
Ris
k Fa
ctor
Gen
der
<85t
h pe
rcen
tilea
85th
–94t
h pe
rcen
tilea
≥95
th p
erce
ntile
aPr
> F
Wai
st c
ircum
fere
nce
(cm
)M
ale
63.8
(63.
0–64
.6)
75.9
(74.
9–77
.0)
93.2
(92.
3–94
.1)
<0.0
001c
,d,e
Fem
ale
65.3
(64.
5–66
.1)
77.6
(76.
7–78
.5)
92.9
(92.
0–93
.8)
<0.0
001c
,d,e
Tota
l cho
lest
erol
(mg·
dL–1
)M
ale
154.
1 (1
51.7
–157
.1)
159.
2 (1
55.8
–162
.6)
164.
4 (1
61.4
–167
.3)
<0.0
001d
Fem
ale
156.
1 (1
54.0
–158
.2)
160.
1 (1
57.3
–162
.8)
160.
5 (1
58.0
–163
.1)
0.00
02d
HD
L-ch
oles
tero
l (m
g·dL
–1)
Mal
e57
.9 (5
6.8–
59.1
)51
.6 (5
0.1–
53.1
)46
.4 (4
5.2–
47.7
)<0
.000
1c,d
,e
Fem
ale
56.9
(55.
8–58
.0)
50.7
(49.
4–52
.0)
46.0
(44.
7–47
.2)
<0.0
001c
,d,e
LDL-
chol
este
rol (
mg·
dL–1
)M
ale
83.5
(81.
4–85
.6)
90.4
(87.
7–93
.2)
95.7
(93.
4–98
.1)
<0.0
001c
,d,e
Fem
ale
85.0
(83.
2–86
.8)
90.7
(88.
4–93
.1)
92.8
(90.
6–95
.0)
<0.0
001c
,d
Trig
lyce
rides
(mg·
dL–1
)bM
ale
60.1
(57.
7–62
.5)
75.7
(71.
8–79
.9)
98.3
(94.
0–10
2.8)
<0.0
001c
,d,e
Fem
ale
66.1
(64.
0–68
.4)
83.3
(79.
7–87
.0)
95.9
(92.
1–99
.9)
<0.0
001c
,d,e
SBP
(mm
Hg)
Mal
e10
6.8
(105
.7–1
07.9
)10
7.4
(106
.0–1
08.7
)11
2.5
(111
.3–1
13.7
)<0
.000
1d,e
Fem
ale
105.
1 (1
04.1
–106
.1)
106.
2 (1
05.0
–107
.4)
109.
4 (1
08.3
–110
.5)
<0.0
001d
,e
DB
P (m
m H
g)M
ale
61.2
(60.
4–61
.9)
63.1
(62.
1–64
.1)
67.7
(66.
9–68
.6)
<0.0
001c
,d,e
Fem
ale
62.3
(61.
6–63
.0)
64.3
(63.
4–65
.2)
68.1
(67.
2–68
.9)
<0.0
001c
,d,e
Glu
cose
(mg·
dL–1
)M
ale
93.5
(92.
9–94
.2)
94.3
(93.
5–95
.1)
94.7
(94.
0–95
.4)
0.00
03d
Fem
ale
91.6
(91.
0–92
.2)
92.0
(91.
3–92
.7)
93.2
(92.
5–93
.9)
<0.0
001d
Insu
lin (μ
U·m
L–1)b
Mal
e6.
1 (5
.8–6
.4)
9.6
(9.0
–10.
2)16
.0 (1
5.2–
16.9
)<0
.000
1c,d
,e
Fem
ale
7.7
(7.3
–8.0
)12
.0 (1
1.3–
12.7
)18
.2 (1
7.3–
19.2
)<0
.000
1c,d
,e
a Num
ber o
f par
ticip
ants
in e
ach
cate
gory
: <85
th p
erce
ntile
, mal
es n
= 1
127
and
fem
ales
n =
137
8; 8
5th–
94th
per
cent
ile, m
ales
n =
432
and
fem
ales
n =
532
; ≥95
th p
erce
ntile
mal
es n
= 7
32 a
nd fe
mal
es n
=70
4.
b Var
iabl
es w
ere
log-
trans
form
ed fo
r ana
lysi
s, m
eans
and
95%
con
fiden
ce in
terv
als w
ere
trans
form
ed b
ack
to th
e or
igin
al sc
ale.
c Bon
ferr
oni P
≤ 0
.001
, <85
th p
erce
ntile
vs 8
5th–
94th
per
cent
ile.
Med Sci Sports Exerc. Author manuscript; available in PMC 2010 August 13.

NIH
-PA Author Manuscript
NIH
-PA Author Manuscript
NIH
-PA Author Manuscript
JAGO et al. Page 15d B
onfe
rron
i P ≤
0.0
01, <
85th
per
cent
ile v
s ≥95
th p
erce
ntile
.
e Bon
ferr
oni P
≤ 0
.001
, 85t
h–94
th p
erce
ntile
vs ≥
95th
per
cent
ile.
Med Sci Sports Exerc. Author manuscript; available in PMC 2010 August 13.

NIH
-PA Author Manuscript
NIH
-PA Author Manuscript
NIH
-PA Author Manuscript
JAGO et al. Page 16
TAB
LE 3
Mea
ns a
nd c
onfid
ence
inte
rval
s for
car
diom
etab
olic
dis
ease
risk
fact
or b
y fit
ness
leve
l adj
uste
d fo
r rac
e, h
ouse
hold
edu
catio
n le
vel,
and
pube
rtal s
tage
(mal
es n
= 2
341,
fem
ales
n =
261
4).
Fitn
ess C
ateg
orya
Car
diom
etab
olic
Ris
k Fa
ctor
Gen
der
Lev
el 1
Lev
el 2
Lev
el 3
Lev
el 4
Lev
el 5
Pr >
F
Wai
st c
ircum
fere
nce
(cm
)M
ale
87.5
(85.
9–89
.1)
79.3
(77.
5–81
.0)
73.0
(71.
3–74
.8)
68.6
(66.
9–70
.3)
64.3
(62.
6 66
.0)
<0.0
001b
–k
Fem
ale
85.1
(83.
6–86
.6)
76.6
(75.
0–78
.2)
72.1
(70.
5–73
.8)
69.3
(67.
7–70
.8)
65.3
(63.
7–66
.9)
<0.0
001b
–h,j,
k
Tota
l cho
lest
erol
(mg·
dL–1
)M
ale
163.
4 (1
60.2
–166
.6)
159.
3 (1
55.9
–162
.7)
159.
5 (1
56.0
–162
.9)
155.
2 (1
51.9
–158
.6)
153.
5 (1
50.1
–156
.8)
<0.0
001d
,e
Fem
ale
160.
1 (1
57.5
–162
.7)
159.
1 (1
56.3
–161
.9)
159.
3 (1
56.3
–162
.4)
156.
0 (1
53.2
–158
.8)
155.
1 (1
52.3
–158
.0)
0.00
71
HD
L-ch
oles
tero
l (m
g·dL
–1)
Mal
e48
.9 (4
7.5–
50.4
)50
.9 (4
9.4–
52.4
)54
.1 (5
2.5–
55.6
)55
.7 (5
4.2–
57.2
)57
.7 (5
6.2–
59.2
)<0
.000
1c–h
,j
Fem
ale
49.4
(48.
1–50
.7)
51.6
(50.
3–53
.0)
53.5
(52.
0–55
.0)
54.8
(53.
4–56
.1)
56.9
(55.
5–58
.3)
<0.0
001c
–e,g
,h,j
LDL-
chol
este
rol (
mg·
dL–1
)M
ale
94.6
(92.
0–97
.1)
89.9
(87.
1–92
.6)
89.2
(86.
4–92
.0)
85.2
(82.
5–88
.0)
82.5
(79.
8–85
.2)
<0.0
001d
–e,h
,j
Fem
ale
91.3
(89.
1–93
.6)
88.9
(86.
5–91
.3)
89.4
(86.
7–92
.0)
86.0
(83.
7–88
.4)
84.0
(81.
6–86
.4)
<0.0
001d
,e
Trig
lyce
rides
(mg·
dL–1
)lM
ale
86.5
(81.
9–91
.4)
80.8
(76.
2–85
.7)
71.6
(67.
5–76
.0)
65.3
(61.
6–69
.2)
60.8
(57.
4–64
.5)
<0.0
001c
–e,g
,h,j
Fem
ale
86.0
(82.
4–89
.9)
81.5
(77.
8–85
.4)
74.1
(70.
4–78
.0)
69.5
(66.
4–72
.8)
66.9
(63.
7–70
.1)
<0.0
001c
–e,g
,h
SBP
(mm
Hg)
Mal
e10
9.4
(108
.2–1
10.7
)10
9.1
(107
.7–1
10.4
)10
8.6
(107
.2–1
09.9
)10
8.0
(106
.7–1
09.3
)10
8.2
(106
.9–1
09.6
)0.
1753
Fem
ale
106.
9 (1
05.8
–108
.0)
106.
7 (1
05.5
–107
.9)
106.
4 (1
05.1
–107
.6)
105.
8 (1
04.6
–106
.9)
106.
0 (1
04.8
–107
.2)
0.28
61
DB
P (m
m H
g)M
ale
66.0
(65.
0–67
.0)
64.6
(63.
6–65
.7)
63.3
(62.
2–64
.3)
62.4
(61.
4–63
.5)
60.9
(58.
9–62
.0)
<0.0
001c
–e,h
,j
Fem
ale
66.3
(65.
4–67
.2)
64.9
(64.
0–65
.8)
64.0
(63.
0–65
.0)
62.8
(61.
8–63
.7)
61.9
(61.
0–62
.9)
<0.0
001c
–e,g
,h
Glu
cose
(mg·
dL–1
)M
ale
94.6
(93.
9–95
.3)
94.1
(93.
3–95
.0)
93.6
(92.
8–94
.4)
93.8
(93.
0–94
.6)
93.7
(93.
0–94
.5)
0.11
77
Fem
ale
92.5
(91.
8–93
.2)
92.1
(91.
4–92
.8)
92.4
(91.
6–93
.2)
91.9
(91.
2–92
.6)
91.4
(90.
7–92
.2)
0.06
60
Insu
lin (μ
U·m
L–1)l
Mal
e13
.0 (1
2.1–
13.9
)10
.6 (9
.9–1
1.4)
8.3
(7.7
–9.0
)7.
1 (6
.6–7
.7)
6.3
(5.9
–6.8
)<0
.000
1b–h
,j
Fem
ale
14.3
(13.
4–15
.2)
11.1
(10.
4–11
.8)
9.9
(9.3
–10.
7)9.
0 (8
.4–9
.6)
7.6
(7.2
–8.2
)<0
.000
1b–e
,g,h
,j,k
i Bon
ferr
oni P
≤ 0
.001
, lev
el 3
vs l
evel
4.
a Fitn
ess c
ateg
ory
is d
efin
ed to
app
roxi
mat
e qu
intil
es o
f the
ove
rall
data
. Exa
ct q
uint
iles a
re n
ot a
chie
vabl
e be
caus
e of
bre
aks o
ccur
ring
at p
artia
l lap
num
bers
and
ties
in th
e nu
mbe
r of l
aps.
The
leve
ls o
rap
prox
imat
e qu
intil
es w
ere
dete
rmin
ed o
vera
ll an
d by
gen
der.
The
leve
ls (a
nd th
e nu
mbe
r of o
bser
vatio
ns) a
re d
efin
ed a
s fol
low
s: m
ales
: lev
el 1
= 0
–11
laps
(n =
560
), le
vel 2
= 1
2–16
laps
(n =
438
), le
vel 3
= 17
–24
laps
(n =
433
), le
vel 4
= 2
5–35
laps
(n =
458
), an
d le
vel 5
= 3
6–89
laps
(n =
452
); fe
mal
es: l
evel
1 =
0–1
1 la
ps (n
= 6
31),
leve
l 2 =
12–
15 la
ps (n
= 5
54),
leve
l 3 =
16–
18 la
ps (n
= 3
85),
leve
l 4 =
19–
26 la
ps (n
= 5
73),
and
leve
l 5 =
27–
74 la
ps (n
= 4
71).
b Bon
ferr
oni P
≤ 0
.001
, lev
el 1
vs l
evel
2.
Med Sci Sports Exerc. Author manuscript; available in PMC 2010 August 13.

NIH
-PA Author Manuscript
NIH
-PA Author Manuscript
NIH
-PA Author Manuscript
JAGO et al. Page 17c B
onfe
rron
i P ≤
0.0
01, l
evel
1 v
s lev
el 3
.
d Bon
ferr
oni P
≤ 0
.001
, lev
el 1
vs l
evel
4.
e Bon
ferr
oni P
≤ 0
.001
, lev
el 1
vs l
evel
5.
f Bon
ferr
oni P
≤ 0
.001
, lev
el 2
vs l
evel
3.
g Bon
ferr
oni P
≤ 0
.001
, lev
el 2
vs l
evel
4.
h Bon
ferr
oni P
≤ 0
.001
, lev
el 2
vs l
evel
5.
j Bon
ferr
oni P
≤ 0
.001
, lev
el 3
vs l
evel
5.
k Bon
ferr
oni P
≤ 0
.001
, lev
el 4
vs l
evel
5.
l Var
iabl
es w
ere
log-
trans
form
ed fo
r ana
lysi
s; m
eans
and
95%
con
fiden
ce in
terv
als w
ere
trans
form
ed b
ack
to th
e or
igin
al sc
ale.
Med Sci Sports Exerc. Author manuscript; available in PMC 2010 August 13.

NIH
-PA Author Manuscript
NIH
-PA Author Manuscript
NIH
-PA Author Manuscript
JAGO et al. Page 18
TAB
LE 4
P va
lues
of B
MI a
nd fi
tnes
s cat
egor
ies i
n re
latio
n to
car
diom
etab
olic
dis
ease
risk
fact
ors a
djus
ting
for r
ace,
hou
seho
ld e
duca
tion
leve
l, an
d pu
berta
l sta
ge(m
ales
n =
234
1, fe
mal
es n
= 2
614)
.
BM
I + F
itnes
s Tog
ethe
r M
odel
BM
I-O
nly
Mod
elFi
tnes
s-O
nly
Mod
elB
MI
Fitn
ess
Car
diom
etab
olic
Ris
k Fa
ctor
Gen
der
PF
AIC
PF
AIC
PF
PF
AIC
Wai
st c
ircum
fere
nce
(cm
)M
ale
<0.0
001
2617
.27
16,7
40.6
<0.0
001
221.
9018
,738
.2<0
.000
117
40.2
9<0
.000
133
.50
16,6
07.9
Fem
ale
<0.0
001
3594
.83
17,5
92.3
<0.0
001
214.
5920
,297
.2<0
.000
125
79.2
8<0
.000
136
.33
17,4
50.9
Tota
l cho
lest
erol
(mg·
dL–1
)M
ale
<0.0
001
30.2
122
,097
.0<0
.000
19.
4222
,113
.1<0
.000
115
.13
0.09
262.
0022
,077
.7
Fem
ale
0.00
028.
4724
,422
.20.
0071
3.53
24,4
19.3
0.01
444.
250.
2207
1.43
24,4
06.0
HD
L-ch
oles
tero
l (m
g·dL
–1)
Mal
e<0
.000
125
3.71
17,8
51.7
<0.0
001
42.3
618
,143
.7<0
.000
116
0.83
0.11
701.
8517
,840
.3
Fem
ale
<0.0
001
247.
8119
,830
.2<0
.000
131
.97
20,1
55.9
<0.0
001
176.
650.
3796
1.05
19,8
22.7
LDL-
chol
este
rol (
mg·
dL–1
)M
ale
<0.0
001
67.2
021
,218
.3<0
.000
119
.14
21,2
68.1
<0.0
001
34.8
80.
0077
3.48
21,1
94.7
Fem
ale
<0.0
001
32.6
523
,580
.1<0
.000
18.
4723
,605
.8<0
.000
119
.37
0.09
851.
9623
,563
.2
Trig
lyce
rides
(mg·
dL–1
)aM
ale
<0.0
001
286.
4228
30.9
<0.0
001
43.7
031
85.2
<0.0
001
188.
380.
3552
1.10
2848
.3
Fem
ale
<0.0
001
193.
2028
94.5
<0.0
001
30.4
431
46.5
<0.0
001
132.
800.
0136
3.15
2904
.5
SBP
(mm
Hg)
Mal
e<0
.000
184
.23
17,2
69.5
0.17
531.
5917
,423
.8<0
.000
194
.01
<0.0
001
6.17
17,2
42.0
Fem
ale
<0.0
001
47.6
119
,112
.70.
2861
1.25
19,1
99.5
<0.0
001
49.3
60.
0765
2.11
19,1
02.0
DB
P (m
m H
g)M
ale
<0.0
001
145.
9716
,513
.2<0
.000
124
.39
16,6
91.9
<0.0
001
95.1
60.
5118
0.82
16,5
08.3
Fem
ale
<0.0
001
111.
2418
,412
.7<0
.000
121
.85
18,5
39.2
<0.0
001
70.5
00.
0382
2.54
18,4
01.3
Glu
cose
(mg·
dL–1
)M
ale
0.00
038.
2215
,355
.00.
1177
1.84
15,3
63.8
0.00
345.
700.
6638
0.60
15,3
52.9
Fem
ale
<0.0
001
14.5
717
,140
.40.
0660
2.21
17,1
60.6
<0.0
001
11.1
00.
7367
0.50
17,1
39.2
Insu
lin (μ
U·m
L–1)a
Mal
e<0
.000
176
3.39
3668
.6<0
.000
110
4.69
4467
.5<0
.000
148
9.21
<0.0
001
7.35
3659
.6
Fem
ale
<0.0
001
700.
8038
42.8
<0.0
001
83.8
746
56.6
<0.0
001
486.
34<0
.000
16.
5038
38.4
a Var
iabl
es w
ere
log-
trans
form
ed fo
r ana
lysi
s.
Med Sci Sports Exerc. Author manuscript; available in PMC 2010 August 13.