SIXTH FIVE YEAR PLAN 1980— 85
140
SIXTH FIVE YEAR PLAN 1980— 85 MID-TERM APPRAISAL GOVERNMENT OF INDIA PLANNING COMMISSION (August, 1983) NIEPA - DC G0748
-
Upload
khangminh22 -
Category
Documents
-
view
0 -
download
0
Transcript of SIXTH FIVE YEAR PLAN 1980— 85

SIXTH FIVE YEAR PLAN
1980— 85
MID-TERM APPRAISAL
GOVERNM ENT OF INDIA PLANNING COMMISSION
( A u g u s t , 1983) NIEPA - DC
G0748

(V- '1 M §
:v>;

FOREWORD
The work o f preparation o f the Sixth Five Year Plan covering the period 1980— 85 was taken up in April 1980. The Plan was approved by the National Development Council in February 1981 and presented to Parliament and the nation.
Three years o f the Plan have now been completed. A mid-term appraisal o f a Five Year Plan is normally conducted half-way through its progress. Thus, the mid-term appraisal o f the Sixth Five Year Plan 1980— 85 should have been presented sometime towards the latter half o f 1982. As is know'll, however, adverse weather in the kharif season o f 1982 affected agricultural production, which is by far the most important component o f the economy. The prospects for growth in 1982-83, together with the likely impact on savings, resources, and investments that would be available over the balance o f the Plan period had therefore to be carefully assessed. This has taken some time. In the result, the mid-term appraisal now covers the progress o f the first three years o f the Plan.
Though there has been delay in the finalisation and the presentation o f the mid-term appraisal document, the exercise has been purposeful. A close and detailed evaluation has been made of the performance so far and o f the prospects for the remaining period o f the Plan. The estimated growth over the Plan period will be close to the Plan target, and the comparatively efficient use o f resources together with structural adjustments have developed significantly the resilience and self-reliance o f the economy. An ambitious programme o f mobilisation of additional resources was drawn up and successfully implemented both by the Centre and the States.
While the Plan targets will be fulfilled in full or adequate measure in a number o f areas including many in the sectors o f agriculture and industry, some special efforts would yield improved performance in the production o f foodgrains, as also in the infrastructural sectors. The appraisal deals with some o f the measures necessary in this regard, so that a firm basis is laid for the continued growth o f the economy to the end o f the Plan period, as W'ell as in the post-Plan period.
1 have great pleasure in presenting this appraisal to Parliament and the nation.
S. B. CHAV ANMinister for Planning
New Delhi,19 A ugust, 1983.
(0

TABLE O F CONTENTS
P ages
Part I The Overall Assessment
Chapter 1 Overview of the Economy in the first three years of the Plan . . . . . 1—3
Chapter 2 Growth o f Output . . . . . . . . . . . . . 4—8
Chapter 3 The Prospects for the Sixth Plan ............................................................................................. 9 — 11
Chapter 4 Balance o f Payments . . . . . . . . . . . . 12—24
Tables 1 to 1 3 .................................................................................................................................................. 16—24
Part II Sectoral Reviews
Chapter 5 Agriculture & Allied Sectors . . . . . . . . . . . 27—39
Chapter 6 Irrigation, Command Area Development & Flood Control . . . . . 40—47
Chapter 7 Rural Development and C o - o p e r a t i o n ................................................................................... 48—54
Chapter 8 Village and Small Industries . . . . . . . . . 55—61
Chapter 9 Labour, Manpower and Employment . . . . . . . . . 62—63
Chapter 10 Minimum Needs Programme . . . . . . . . . . . 64—66
Chapter 11 Energy . . . . . . . . . . . . . . 67—74
Chapter 12 Industry and M i n e r a l s .................................................................................................................. 75—83
Chapter 13 T r a n s p o r t ....................................................................................................................................... 84—88
Chapter 14 Communications, Information & Broadcasting . . . . . . . . 89—90
Chapter 15 E d u c a t i o n ....................................................................................................................................... 91—98
Chapter 16 Health, Family Welfare and N u t r i t i o n .................................................................................... 99— 104
Chapter 17 Housing, Urban Development and Water Supply . . . . . . . 105—108
Chapter 18 Hill Area Development ................................................................................................................... 109—111
Chapter 19 Development o f Backward C la s s e s .............................................................................................. 112—115
C haptor20 Social Welfare . . . . . . . . . . . . . 116— 117
C hapter 21 Women and Development . . . . . . . . . . . n g —119
Chapter 22 E nv ironm en t....................................................................................................................................... 120— 121
Chapter 23 Science and Technology ................................................................................................................... 122— 133
Appendix
I'ables 1 to IV . ...................................................... . . 139
( i l l )

PART
CHAPTER 1
OVERVIEW OF TOE ECONOMY IN THE FIRST TH REE YEARS OF THE PLAN
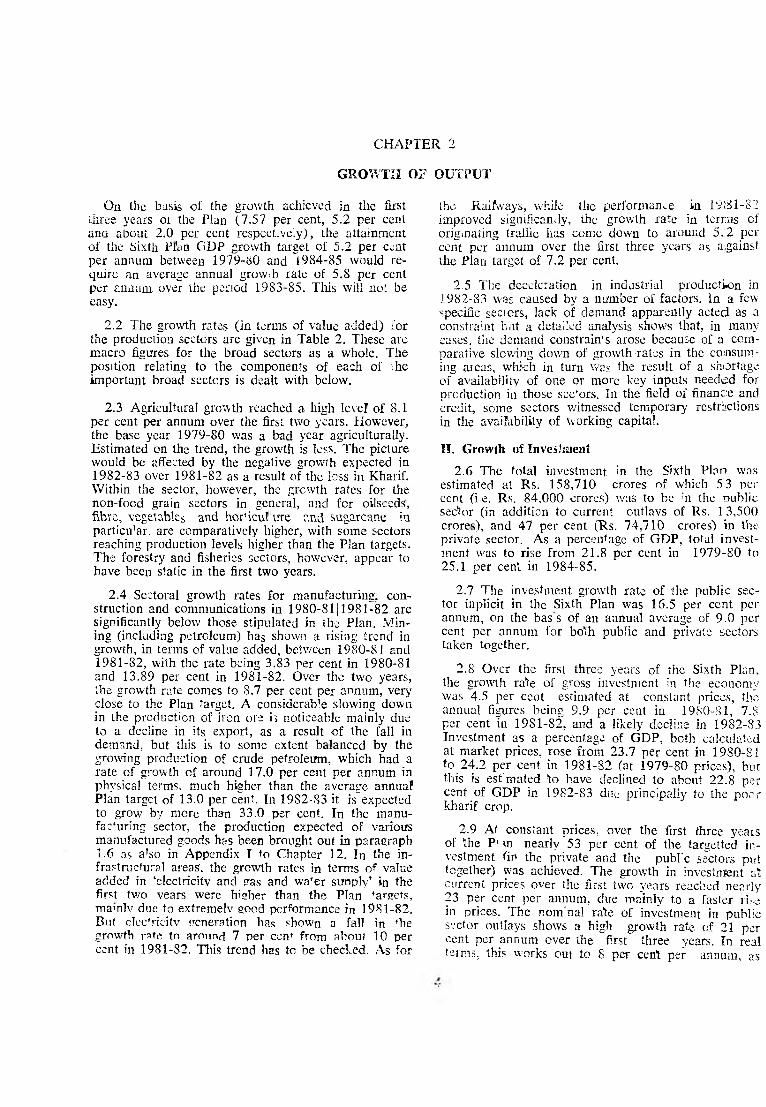
The Sixth Five Year Plan started in extremely difficult circumstances and had to contend with a number of unfavourable factors. The year 1979-80 witnessed a bad drought which affected agricultural production considerably. Foodgrain production recorded a heavy fall of 16.8 per cent compared to the previous year. There was an absolute dccline in GDP of nearly 5 per cent. As a consequence, savings and investment went down significantly, thereby reducing the resources base of the Sixth Plan. In general, the economy was not in a very satisfactory state and the functioning of the infrastruc'urc, in particular, had been badly affected. Against this background, the Sixth Plan was launched with a very ambitious programme of growth, poverty alleviation and self- reliance. The task of recovery from the low base was made more difficult by the contemporary international situation which was extremely unfavourable with heavy economic recession in most of the countries of the wor’d, especially in the developed countries, and a shrinking volume of international fr?>de. The external terms of trade in India had significantly deteriorated, one of the main reasons for this bei^g the consenuential effects of <he second oil mice hike. In the domestic econnmv. fhe Plan effort had to contend with a high rate of inflation.
1.2 An almost complete recovery of the economy was achieved in 1980-81. This was due largely to the ambitious investment programme of the Sixth Plan. This was concentrated in all the major infrastructure sectors, which had stagnated in the years immediate'y preceding the Sixth Plan. Indeed, in 1980-81 the economy was set for a fast growth and development in alignment with the major targets of the Sixth Plan and the GDP grew by 7.9 per cent. In 1981-82, almost all the sectors picked up the growth rate stipulated in the Plan and the GDP went up by 5.2 per cent. Thus,
over the first two years of the Plan, the economy grew at a rate of 6.5 per cent in real terms, exceeding the Plan annual growth rate of 5.2 per cent per annum. The year 1982-83, however, proved to be a very bad year for agriculture with severe drought, Hoods and cyclones in different parts of the country. However, the damage to the economy was significantly minimised, principally as a result of the public sector programmes, and the fall in foodgrain production was comparatively much lower than in previous years of adverse seasonal conditions. The growth rate in 1982-83 is estimated to be 2 per cent. Indus'rial growth which was 5.6 per cent in 1980-81 and 8.6 per cent in 1981-82 fell to about 3.5 per cent in 1982-83. The average growth rate of the economy over the first three years of the Plan came to 5 per cent. This performance has to be viewed in the background of a number of growth decelerating elements prevailing during this period. The recession in the international situation continued, the recovery being extremely slow. The international trade prospects also continued to be gloomy. Between 1980-81 and 1982-83 the growth of international trade was almost zero. India’s realised volume of growth of export of 1.4— 1.5 per cent should be seen against this background. The Government’s effor's to protect the deve'opment activities of the economy were successful and the domestic rate of inflation was significantly reduced as measured by the movement in the wholesale price index from the very high rate of nearly 18 to 20 per cent in 1980-81 to around 2 ner cenf in 1982-83-
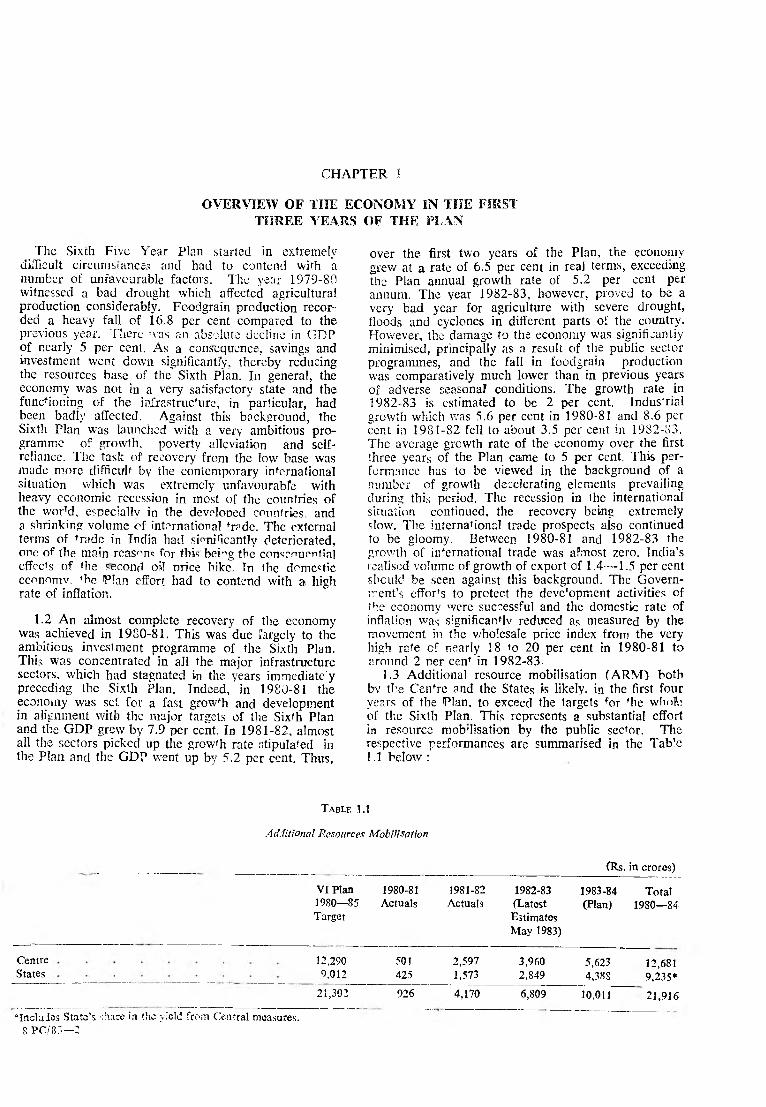
1.3 Additional resource mobilisation (ARM ) both bv the Cen*re and the States is likely, in the first four years of the Plan, to exceed the targets for fhe whole of the Sixth Plan. This represents a substantial effort in resource mob'lisation by the public sector. The respective performances are summarised in the Tab’e1.1 below :
T able 1.1
Additional Resources Mobilisation
CentreStates
VI Plan1980—85Target
12,2909,012
21,302
•IncluJas State’s share in the yield from Central measures.S P C /83—2
1980-81Actuals
501425
926
1981-82Actuals
(Rs. in crorcs)
1982-83 (Latest Estimates May 1983)
2,5971,573
3,9602,849
4,170 6,809
1983-84(Plan)
5,6234,388
10,011
Total1980—84
12,6819,235*
21,916

In over-all availability of resources for the Plan, however, there has been a heavy deficit in the States, principally dire to the State E'fectricity Boards and State Road Transport Corporations not achieving their targets of surpluses. Increases in current expenditure on the services sector, due partly to DA and wage increases, have also cut into the resources available for developmental outlays, both at the Centre and in the States. The mobilisation of additional external borrowings has been close to target and a prudent foreign exchange reserve poi'icy has been adopted in the initial years of the Plan, both for protecting essential technological imports and for facilitating the required structural adjustment of the country’s economy.
1.4 Taking the first four years of the Plan, the totai1 actual or approved outlays come to 83 per cent (Rs. 79,880 crores) of the public sector Plan outlay of Rs. 97,500 crores. However, inflation, particularly in the costs of capital' goods, especially imported capital goods, has eroded the real value of Plan investments. At 1979-80 prices, this represents 62 per cent of the Plan outlay. For 1983-84, it has been decided now (Julv, 1983) to raise the Centre’s Annual Plan investment by Rs. 800 crores directed mostly towards the core sectors. Public Sector investment m real terms would have been higher but lor the adverse factors already mentioned and such exogenous causes as the second oil price hike.
1.5 Turning to physical achievement, the mid-term estimates indicate that the Plan targets wilt be fulfilled in full or adequate measure in a number of areas including many in the sectors ot agriculture and industry. But special efforts will be called for to improve performance in some other areas notably in the infrastructural sectors.
1.6 Specifically, as against the 1984-85 foodgrains production target of 149— 154 million tonnes projected in the Plan, the achievement may be nearer the lower end of the range i.e. 146-148 million tonnes. In sugarcanc again, the production is likefy to be short o f 'th e Plan projections. However, the production of other crops, like jute and mesta, cotton, the five major oilseeds, tea and coffee will be generally equal to the Sixth Plan targets. The production of sugar and vanas- paii is likely to equal or exceed the targets.
1.7 In the field of manufactured goods, the production of newsprint, low-density and high-density polyethylene, paper and paper board, DMT,^viscose filament yarn, polyester filament yarn and aciyiic fiore, decentralised sector cloth, commercial vehicles together with passenger cars and jeeps, and industrial machinery generally, is likefy to be equal to the Plan targets or a little more. However, shortfalls in production asainst Plan targets are likely in the case of steel ingoTs and saleable steel, non-ferrous metafs (aluminium, blister copper and zinc), caustic soda, soda ash and sulphuric acid, PVC, mill sector cloth, power cables and electrical transformers, as well as in the electronics sector generally. Production of synthetic rubber, caprolactam, cement, hvdro and thermal turbines, and agricultural tractors is' likely to be equaf to or near about the Plan targets. The production of nifrosenous and phosphatic fertilisers is likely to be
slightly short of target while production of irom ore and concentrates is likely to fa.ll appreciably shoirt of target.
1.8 lhe production of crude oil and petroleum products will be substantially in excess of the oriigmal Plan target, as a result of the large increase in inivest- ment as compared to the Plan, decided upon w/ith a view to quicker achievement of sel'f-reliancc in, this sector. Generation of electricity will be about 170 billion KWH in the last year of the Plan, while additional electricity generating capacity installed over the Plan period wii'l be of the order of 14000— 14500 MW. While these represent increases in electrical generation by over 51 per cent and capacity addition by over 46 per cent compared to 1979-80, there are, nevertheless, shortfalls in these two areas against the Plam targets of 191 billion KWH and 19666 MW respectively^. Coal production is expccted to be J 54 million tonnes against the projected 165 million tonnes. This, aigain, would be a 50 per cent addition to the production level at the beginning of the Plan. Here, however, it is likely that this order of production, with draw-down from accumulated stocks, would be adequate to m eet requirements. Lignite production will hit the Plan target. Railways originating traffic, which is a derived demand, is like/y to be only 280— 285 million tonnes as a:gaimt the original target of 309 million tonnes.
1.9 In the aggregate, over the first three years >of the Plan, the public sector investment has exceeded the Plan target. Along with this, the real GDP growth per annum over the three years i;; also equal to the Plan target rate. But keeping in view the fact that, on the one hand, there has been an erosion in the nominal investment by cost escalation and that on the other hand, the realised additional production in 19 80-81 took advantage of the idle capacity that existed in the year 1979-80, the Plan objective of a significant step up in the rate of growth in investment has to be pursued with greater determination. Investment in those sectors which are sensitive to real investment shortfalls, and which have strong linkages throughout the economy, namely, irrigation (and agriculture in general), power, coal, railways and some segments of industry1 have to be protected against such shortfalls to the maximum extent possible. If this should require some temporary' shift of priorities in sectoral allocations anti within the sectors themselves in the last year of the Plan, such shift should be considered in order that the tempo already created is not disrupted and new starts are not severely affected. Any delays in such long-Fead investment cannot be made-up in the short-term; and in the medium term, unless' corrective steps arc taken now. capacity constraints mav develop in these sectors which would then act as major brakes on sustained "rowth in the Seventh Plan and beyond.
1.10 The economy would appear to have made: comparatively efficient use of resources. Structural adjustments in terms of developing a self-reliant production system are in progress especially in the use of oil as an indigenous energy source, though our limited economically cxtractable reserves should be exploited w^h some degree of caution. What is1 necessary is to improve the efficiency of utilisation of the investment in infrastructure and in productive equipment. Tt r.

also essential that public enterprises function so as to maximise surpluses. The improvement in resources and the lowering of the capital-output ratio that would result would ensure more efficient implementation ot' the Plan. An encouraging fact is that elasticity of tax revenues to price changes is close to unity. Given thv. present tax ratio to GDP, and the efforts needed for additional resource mobilisation for the Plan, efforts would be called for to expand the_tax base and streamline the tax administration. This has to go hand in hand with a significant curb in the current consumption expenditure of Government. The export thrust has to be intensified as part of achieving our goal of self- reliance, together with very carefully worked out strategies for managing the foreseable strains in the balance of payments position in the Seventh Plan. This will
require a coordinated set of policies and measures in a number of areas : further strengthening of the trade policy framework to attain a more rapid developmentoS exports; continued prudent management of the economy to ensure relative price stability and to contain pressures on the balance of payments; and avoidance of infrastructure bottlenecks or shortages of basic intermediates.
1.1 i in conclusion, some concentration of investments in the infrastructure and a few other sensitive areas is called for, and some economy in Government’s current consumption expenditure would be necessary, both to achieve the maximum possible in physical terms in the Sixth Plan and to establish a firm basis
for the Seventh Plan.
CHAPTER 2
GROW TH OF OUTPUT
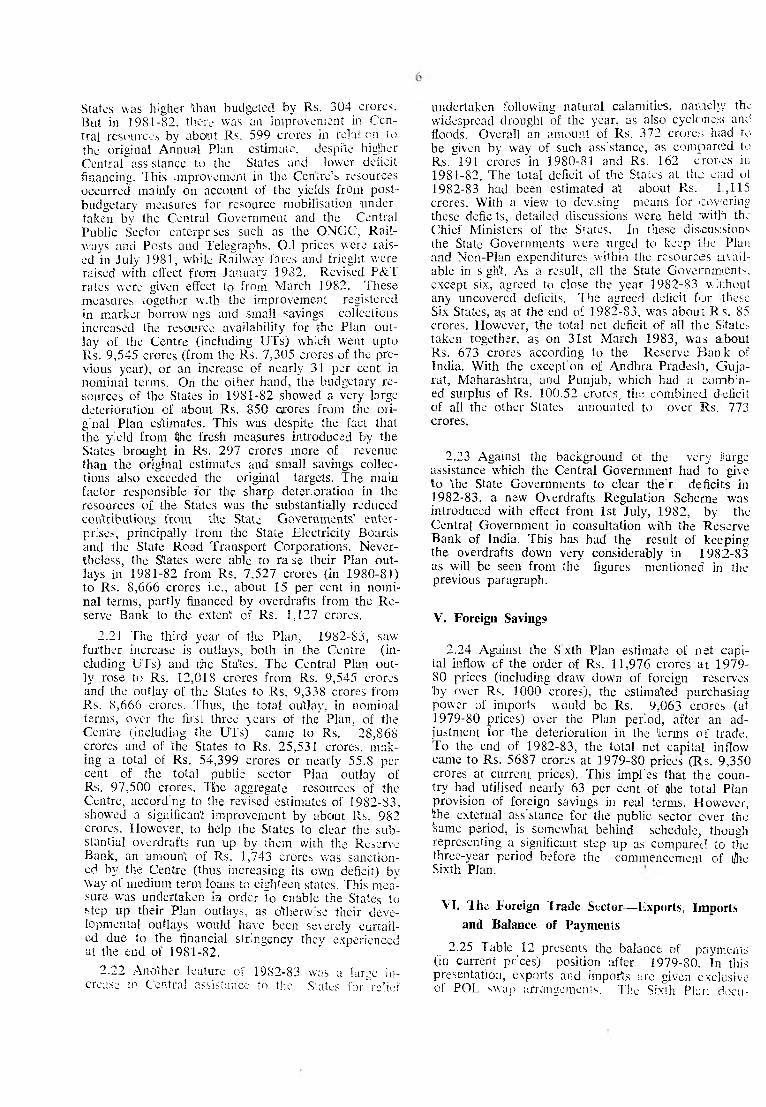
On the basis oi the growth achieved in tlie first three years or the Plan (7.57 per cent, 5.2 per cent ana about 2.0 per cent respectively), the attainment of the Sixth Pi'dn GDP growth target of 5.2 per c^nt per annum between 1979-80 and 1984-85 would require an average annual growth rate of 5.8 per cent per annum over the period 1983-85. This will not be easy.
2.2 The growth rates (in terms of value added) for the produciion sectors are given in Table 2. These are macro figures for the broad sectors as a whole. The position relating to the components of each of vhe important broad sectors is dealt with below.
2.3 Agricultural growth reached a high level of 8.1 per cent per annum over the first two years. However, the base year 1979-80 was a bad year agriculturally. Estimated on the trend, the growth is less. The picture would be affected by the negative growth expected in 1982-83 over 1981-82 as a result of the loss in Kharif. Within the sector, however, the growth rates for the non-food grain sectors in general, and for oilseeds, fibre, vegetables and hor'icu! ure and sugarcane in particu'ar, are comparatively higher, with some sectors reaching production levels higher than the Plan targets. The forestry' and fisheries sectors, however, appear to have been static in the first two years.
2.4 Sectoral growth rates for manufacturing, construction and communications in 1980-8111981-82 are significantly below those stipulated in ihe Plan. Mining (including petroleum) has shown a rising trend in growth, in terms of value added, between 1980-81 and1981-82, with the rate being 3.83 per cent in 1980-81 and 13.89 per cent in 1981-82. Over the two years, the growth rate comes to 8.7 per cent per annum, very' close to the Plan target. A considerable slowing down in the production of iron ore i; noticeable mainly due to a decline in its export, as a result of the fall in demand, but this is to some extent balanced by the growing production of crude petroleum, which had a rate of growth of around 17.0 per cent per annum in physical terms, much higher than the average annua! Plan target of 13.0 per cent. In 1982-83 it is expected to grow by more than 33.0 per cent. In the manufacturing sector, the production expected of various manufactured goods has been brought out in paragraph1.6 as a’so in Appendix I to Chapter 12. In the infrastructural areas, the growth rates in terms of value added in ‘electricity and eas and wa'er simply’ in the first two years were higher than the Plan targets, mamlv due to extremelv good performance in 1981-82. But elec'ricitv generation has shown a fall in 'he growth r^te tn around 7 per cent from about 10 per cent in 1981-82. This trend has to be checked. As for
the Railways, while the performance in 1931-82 improved significantly, the growth rate in terras of originating traffic has come down to around 5.:2 per cent per annum over the first three years as against the Plan target of 7.2 per cent.
2.5 The deceleration in industrial production in 1982-83 was caused by a number of factors. In a few specific sectors, lack of demand apparently acted as a constraint but a detailed analysis shows that, in many eases, the demand constrain's arose because of a comparative slowing down of growth-rates in the consuming areas, which in turn was the result of a shortage of availability of one or more key inputs needed for production in those sec'ors. In the field of finance and credit, some sectors witnessed temporary restrictions in the availability of working capital.
II. Growth of Investment
2.6 The total investment in the Sixth Plan was estimated at Rs. 158,710 crores of which 5 3 per cent (i.e. Rs. 84,000 crores) was to be 'n the -public sector (in addition to current outlays of Rs. 1 3,500 crores), and 47 per cent (Rs. 74,710 crores) in the private sector. As a percentage of GDP, total investment was to rise from 21.8 per cent in 1979-80 to25.1 per cent in 1984-85.
2.7 Tlie investment growth rate of the public sector inplicit in the Sixth Plan was 16.5 per cent per annum, on the bas s of an annual average of 9.0 per cent per annum for bo’ih public and private sectors taken together.
2.8 Over the first three years of the Sixth Plan, the growth rate of gross investment in the economy was 4.5 per cent estimated at constant prices, the annual figures being 9.9 per cent in 1980-81, 7.8 per cent in 1981-82, and a likely decline in 1982-83 Investment as a percentage of GDP, both calculated at market prices, rose from 23.7 per cent in 1980-81 to 24.2 per cent in 1981-82 (at 1979-80 prices), but this is est'mated to have declined to about 22.8 per cent of GDP in 1982-83 due principally to the poor kharif crop.
2.9 Af constant prices, over the first three years of the P' \n nearly 53 per cent of the targetted investment fin the private and the publ'c sectors put together) was achieved. The growth in investment at current prices over the first two years readied nearly 23 per cent per annum, due mainly to a faster rise in prices. The nom'nal rate of investment in public sector outlays shows a high growth rate of 21 per cent per annum over the first three years. In real terms, this works out to 8 per cent per annum, as

5
against the Plan assumption of 16.5 per cent per annum. The increase in outlay of 12 par cent (in real terms) in 1983-84 Annual Plan \vour.i correct th s to some extent. The difference between real and nominal growth rates in public sector investment is explained largely by a s gnificant rise in the .nvest- rnent cost index— nearly 11 per cent in the aggregate in 1980-81 and 14 per cent n 1981-82, both being higher than the increase in 'die GDP deflators for these years.
2.10 A sectoral anaiys's of public sector outlays presented in Table 3. ih e Sectoral comparison or investment, after making corrections for changes in prices, indicates the need for increase in investment in sectors like irrigation, power, coal and railways. This is necessary because of their long gestation periods and very strong backward and forward iinkages throughout 'the economy and is of particular importance in the context of Seventh Plan prospects.
III. Growth of Savings
2.11 The Sixth Plan assumed an increase in the .domestic savngs (as percentages of GDP at constant prices) from 22.5 per cent in i979-;s0 to 24.4b par cent in 1984-85. Domestic savings were assumed to grow at nearly 9.2 per cent per annum and add upto a total of Rs. 149,647 crores over the Plan Period. Implied was a marginal savings rate of 33.7 per cent over the period 1980— 85.
2.12 Over the first two years the grow'.h rate of domestic savings achieved carnc to nearly iS .l par cent at current prices which was much higher than the plan assumption, with inflation no doubt contributing its share. The savings rate estimated on the basis of its purchasng power (in terms of investment goods) was 6.7 per cent per annum. Expressed in terras of percentages of GDP (at cons'iant prces), the savings rates achieved in 1980-81 and 1981-82 came to 21.9 per cent and 22.7 per cent respectively, implying a marg nal savings rate of 24.1 per cent between 1979-80 and 1981-82.
Public Savings
2.13 Table 5 presents the Sixth Plan target of public savings both for the Centre and the States taken together. Of this, the public sector’s target of “own resources” was placed at Rs. 45,175 crores representing 30 per cent of total .domestic sav ngs and comprising : (i) contribution from the balance of current revenues of the Centre and the States arising as budgetary surpluses, and (ii) the surpluses of the public sector enterprises. All additional revenues arising from proposed new fiscal measures are included in these resource estimates of the public sector. Nearly 60 per cent of the Rs. 45,175 crores was to come from budgetary surpluses from current revenues of the CentraljState Governments, and the rest from public sector enterprises.
—. 14 Against these targets, the actual achievement in the first three years of the Plan was Rs. 21,207
crores or 46.9 per cent in nominal terms (36.8 percent at 1979-80 prices). The surpluses of public enterprises were 47.0 per cent in nom.nal terms (36.4 par cent in 1979-80 prices).
2.15 There are four other major sources w’hich finance the public sector investment programmes. These are: (a) draft on private savings (including provident funds, small savings, term loans from financial institutions, and net miscellaneous capital receipts), (b) market borrowings, (c) net externa! assistance, and finally, (d) deficit financing. Table 6 gives the Plan targets under these heads and the achievements in ‘ihe first thiee years of the Plan.
2.16 The resource mobilisation effort of both the Centre and the States (taken together) has been s gnificantly large and the buoyancy of revenues has been maintained. The public sector revenue over the first three years of the Plan has been rising by nearly15.7 par cent per annum. However, current expenditure particularly on salaries ;D'A also rose at about14.5 per cent per annum. The increase in the investment costs also was faster than the corresponding GDP deflator. Cost cf imported equipment and machinery rose much more than the costs of other inputs required by the public sector. At the Centre, the increased outlays on Defence have reduced further the availablity of the balance from the current revenues. Thus, even though the total revenues raised by the Central and the State Governments over the fir1-’! three years of the Plan were significantly large, the public sector investment outlay, as a percentage of the total investment over the first three years of the Plan is below the Plan target. Private sector investment has, broadly, kept to target largely through increased nominal investment.
2.17 The improvement in the resource mobilisation of the public sector is reflected in an increase in the percentage of the public sector’s own resources to total domestic saving. This is brought out in Table 5. It reached a figure of 24.67 per cent in 1982-83, significantly higher than what had been achieved :n the recent past. But additional efforts will be needed in future to reach the target of 30.2 per cent.
IV. Financing of the Public Sector Outlay
2.18 The total Plan outlay of tlhe Centre and the States over the first four years comes to Rs. 79,880 crores. The details of this and the sources from which it has been raised are given in Table 7 .
The detailed yearwise sources of financing have been given in Tables 8, 9, 10 and 11.
2.19 These figures are evidence of the substantial effort in raising resources that has been successfully- undertaken. These resources have come from the total domestic budgetary resources and from deficit financing, with net external aid contributing Rs. 4.257 crores over the first three years of the Plan.
^2 .20 In 1980-81, there was shortfall in the Centre’s Plan expenditure (and resources) to the extent of Rs. 390 crores, while the Plan outlav of the
States was higher than budgeted by Rs. 304 crores. But in 1981-82, there was an improvement in Central resource., by about Rs. 599 crores in relat on lo the original Annual Plan estimate, despite higjher Central ass.stance to the States and lower deficit financing. This improvement in the Centre’s resources occurred mainly on account of the yields from post- budgetary measures for resource mobilisation iinder- taken by the Central Government and the Central Public Sector entcrpr ses such as the ONGC, Railways and Posts and Telegraphs. 0.1 prices were raised in July 1981, while Railway fares and fricght were raised with effect from January 1982. Revised P&T rates were given effect io from March 1982. These measures together w.th the improvement registered in market: borrowings and small savings collections increased the resource availability for the Plan outlay of the Centre (including UTs) which went upto Rs. 9,545 crores (from the Rs. 7,305 crores of the previous year), or an increase of nearly 31 per cent in nominal terms. On the other hand, the budgetary resources of the States in 1981-82 showed a very large deterioration of about Rs. 850 crores from the original Plan estimates. This was despite the fact that the yield from <}he fresh measures introduced by the States brought in Rs. 297 crores more of revenue than the original estimates and small savings collections also exceeded the original targets. The main factor responsible for the sharp deter, oration in the resources of ilie States was the substantially reduced contributions from the State Governments’ enterprises, principally from the State Electricity Boards and the State Road Transport Corporations. Nevertheless, the States were able to ra se their Plan outlays in 1981-82 from Rs. 7,527 crores (in 1980-81) to Rs. 8,666 crores i.e., about 15 per cent in nominal terms, partly financed by overdrafts from the Reserve Bank to the extent of Rs. 1,127 crores.
2.21 The third year of the Plan, 1982-83, saw further increase is outlays, both in the Centre (including UTs) and the States. The Central Plan out- ly rose to Rs. 12,018 crores from Rs. 9,545 crores and the outlay of the States to Rs. 9,338 crores from Rs. 8,666 crores. Thus, the total outlay, in nominal terms, over the first three years of the Plan, of the Centre (including the UTs) came to Rs. 28,868 crores and of the States to Rs. 25,531 crores, making a total of Rs. 54,399 crores or nearly 55.8 per cent of the total public sector Plan outlay of Rs. 97,500 crores. TSie aggregate resources of the Centre, accord'ng to the revised estimates of 1982-83, showed a significant improvement by about Rs. 982 crores. However, to help the States to clear the substantial overdrafts run up by them with the Reserve Bank, an amount of Rs. 1,743 crores was sanctioned by the Centre (thus increasing its own deficit) byway of medium term loans to eighteen states. This me assure was undertaken >u order to enable the States to step up their Plan outlays, as otherwise then.' developmental outlays would have been severely curtailed due to the financial stringency they experienced at the end of 1981-82,
2.22 Another feature of 1982-83 was a larae increase in Central assistance to the States for "relief
undertaken following natural calamities, namely/ the widespread drought of the year, as also cyclone^; and floods. Overall an amount of Rs. 372 crores h;ad to be given by way of such ass'stance, as comparted to Rs. 191 crores in 1980-81 and Rs. 162 crones in1981-82. The total deficit of the States at the end of1982-83 had been estimated at about Rs. 1,115 crores. With a view to dev.sing means for cov'ering these defic ts, detailed discussions were held witlh the Chief Ministers of the Slates. In these discussions the State Governments were urged to keep the Plan and Non-Plan expenditures within the resources available in s ght. As a result, all the State Governmient-., except six, agreed to close the year 1982-83 without any uncovered deficits. 1 he agreed deficit fo r these Six States, as at the end of 1982-83, was about R s. 85 crores. However, the total net deficit of all the Sitates taken together, as on 31st March 1983, was about Rs. 673 crores according to the Reserve B an k of India. With the except on of Andhra Pradesh, G ujarat, Maharashtra, and Punjab, which had a com piled surplus of Rs. 100.52 crores, the combined d eficit of all the other States amounted to over Rs. 773 crores.
2.23 Against the background of the very large assistance which. the Central Government had to givelo the State Governments to clear the r deficir.s in 1982-83, a new Overdrafts Regulation Scheme was introduced with effect from 1st July, 1982, by the Central Government in consultation with the Reserve Bank of India. This has had the result of keeping the overdrafts down very considerably in 1982-83 as will be seen from the figures mentioned in the previous paragraph.
V. Foreign Savings
2.24 Against the S xth Plan estimate of net capital inflow of the order of Rs. 11,976 crores a t 1979- 80 prices (including draw dowrn of foreign reserves by over Rs. 1000 crores), the estimated purchasing power of imports would be Rs. 9,063 crores (at1979-80 prices) over the Plan period, after an adjustment for the deterioration in the terms of trade. To the end of 1982-83, the total net capital inflow came to Rs. 5687 crores at 1979-80 prices (Rs. 9,350 crores at current prices). This impl'es that the country had utilised nearly 63 per cent of flhe total Plan provision of foreign savings in real terms. However, the external ass'stance for the public sector over the 'same period, is somewhat behind schedule, though representing a significant step up as compared to the three-year period before the commencement of t|he Sixth Plan.
YI. The Foreign Irade Sector— Exports, Imports and Balance of Payments
2.25 Table 12 presents the balance of payments (in current pr'ces) position after 1979-80. In this presentation, exports and imports are given exclusive of POL swap arrangements. The Sixth Plan docu-

7
,ent presented the ; follows :
balance of. p a y m e n ts p ro jec tio n '
(Rs. crores)
Plan Estimates EstimatesTarget (at current (at(at 1979-80 p ices) 1979-30prices)1980-85
1980-83 prices)1980-83
1 . Experts 4107S 22317 196742. Im ports 58851 39752 31595
3. B alanceofTiv.de — 17773 —17435 — 1202!4. Invisibles .5. Balance on Cm rent
S710 875 1 70f,6
A/c (net) —9063 —'86SI —4955
2.26 As the table shows, the exports at 1979-80 prices over the first three years of the Plan came to nearly 48 per cent of the Plan's total targeted value. Similarly, the percentage of import was 54 per cent. Thus, a sizeable fall in export is not.ceable, although ’this has been compensated partly by a higher level of import substitut on than stipulated in the Plan.As for import, the comparatively lower volume as against the Plan figures in this period is partly the result of ,some slowing down in the rate of growth, of the economy compared to what was-assumed in the Plan. The rate of growth of export over '!he first three years came to 7.6 per cent in nominal terms, but when converted to 1979-SO constant prices it comes down to nearly 1.4 per cent per annum. The low volume growth of exports is explained partly by the adverse international trading environment. The growth rate of 1.4 per cent should be compared to the zero growth rate of the world as a whole and the negative growth rate (— 0.5 per cent) of the developing countries. Similarly, on the import side, the rate of increase over the three years in nominal terms comes to 14.6 per cent, and in real terms to 4.5 per cent. Since the import base in 1979-80 was 50 per cent more than the export, a higher growth rate of import as against that of export implies an 'ncreas- ing deterioration of the balance of the trade.
2.27 Over the first three years of the Plan, the import elastic'ty came down on the average to 1.2 . This is to be reckoned against the plan assumption of 1.5, and the observed trend in the 1970s of 1.5 to 2.0. This decline over 1980-83 is explained largely by the substitution of bulk imports, particularly crude oil. This emphasises the need for intensification of structural adjustment through greater diversification of import substitution and vigorous export development efforts.
2.28 Turning to the individual years, 1980-81 was a bad one with a decline in the volume of exports and a very high rise in imports. The slow growth of export was mainly the consequence of an unfavourable world market and protectionary barriers in the importing countries and was not so" much due to supply constraints in the domestic sector. On the o ther hand, due to declining production in some of the key sectors like crude o l , petroleum products, nitrogenous fertilisers and steel and cement, the need for bulk imports greatly increased in 1980-81. As a
consequence, the trade balance deteriorated significantly and a large part of it had 'to be financed by the depletion of foreign exchange reserves. Invisible earnings m 1980-81, however, showed a significant increase mainly because of a spurt in remittances from expatriate workers and helped to offset half of the trade gap.
2.29 There was a notable turn-around in export performance during 1981-82. The volume of non- traditional exports continued to expand. In contrast, the rate of growth in the volume of import went down sharply. Domestic production picked up significantly, making large import substtution possible. POL and fertiliser imports, in particular, dropped significantly. These two together accounted for nearly 80 per cent of the bulk imports in 1981-82. Despite the lower imports and higher exports, the trade deficit remained almost unchanged at current prices and marginally fell a’t constant prices. Th's was pr'marily due to further deterioration in the terms of trade. In addii'on, there was a significant decline in the level of invisible earn'ngs.
2.30 In 1982-83. the export performance excluding the oil swap, has not been very satisfactory compared to the Plan targets. The volume of bulk import continued to decl:nc largely as a result of a higher domes*.'c crude oil production. The domestic production in crude oil reached the Plan targctted level of 21 million tonnes in 1982-83.
VII. Prices and Money
2.31 The behaviour of pr'ces in the first three years of the Sixth Plan was encouraging, showing a declining trend in the rate of inflation. The grow'th in the wholesale price index which was as much as18.2 per cent in 1980-81, came down to 9.3 per cent in 1981-82 and to nearly 2.5 per cent in 1982- 83. The r se in the consumer price index during 1982-83 was also less as compared to 'the rise in1981-82. Investment costs have, however, risen comparatively faster due to the sharp rises in the costs of construction inputs like iron and steel, cement, logs and timber, etc.
_ 2.32 Monetary policy was used flexibly with a view to controlling inflationary pressures and to meeting the growing needs of the production and priority sectors. Aggregate monetary supply (M3) increased by 16.8 per cent in 1980-81, 12.6 per cent in 1981-82 and 14.8 per cent during 1982-83. Monetary policy will continue to be restrained and cautious because of probable inflationary pressures, but the growing requirements of credit for poduction purposes will also have to be met fully.
2.33 Particular attention will have to be given to increasing domest:c production and efficient management of supplies in the case of essentia] commodities. Where necessary, domestic production will have to be supplemented by timely imports. Since the maintenance of adequate stocks of foodgrains with public agencies helps -in keeping in check the market expectations of price rises, continued efforts wrill have to be made to maximise the procurement

8
of foodgrains. The public distribution system will have to be further expanded, strengthened and streamlined in order to make available essentia! consumer goods to people, particularly the weaker sections, at reasonable prices throughout the country. Bes:des, hoarding, profiteering and other anti-social act'vities will have to be effectively curbed by taking stringent action aga'nst those indulging in such activities.
V IE Population
2.34 The Sixth Plan document used the estimates of population projections for 1971-91 prepared bv an Expert Committee constituted by the Planning Commission under the Chairmanship of the Registrar General and Census Commissioner. The provisional 1981 population, according to the Census, was 12 mill'on more than the Plan projection for that year. Although iSi'js is less than 2 per cent, the size of the 1981 population puts a substantia! extra burden on the country’s resources, and also affects all the per capita targets of the Plan. However, a re-estirmtion of populat'on projections on the basis of the latest Census has not been undertaken .since deta led tables on fertility and mortality of the 1981 Census are not yet available.
IX. Poverty and Employment2.35 The Sixth Plan document assumed a reduc
tion in the percentage of people below the poverty line from 47 per cen’t to 30 per cent. In absolute terms, the number of persons below the poverty line was expected to ccme down to 215 million from 316 million. Subsequently, because of the revision in the population estimates based on the 1981 census, the figures of populat’on below the poverty line in 1979- 80 were revised, and worked out to 51.1 per cent (nearly 339 million people). Over 1980-81 and1981-82, a large number of families below the poverty line are expected to have crossed i't bccausc of the rise in the r real incomes, partly through the adoption of specific poverty alleviation programmes like 1RDP and NREP. The exact d stribut'on pattern of expenditure below and above the poverty line will
not be available until the results of the Nailiontr Sample Survey for the year 1983 become available Until 'that time, the number and percentage o f pee pic below the poverty line may be estimated con the basis of tjie assumption that increase in real imcom is un'form in all the expenditure classes and the number of families brought above the poverty lline is relatable directly to the corresponding expemditurc in TRDP and NREP. Adopt:ng th 's metho'd, the percentage of poverty, it is estimated, came donvn to41.5 and the total number of persons belonv the poverty to 282 million in 1981-82. Thus, oveer the two years 1980-82. 34 per cent of the total Plain target of people to be taken above the poverty line: were; so taken.
2.36 The aggregate employment target >n terrm of ‘‘Standard person year” has been placed at 34 million over the Sixth Plan period. This employment is primarily to be venerated in agr’culture, mar.rJfactur- ir.3 and the services sectors, the last including the two m a:or employment generation proerammes. IRDP and NREP. An employment of 4 million stomdard person years exclusively from these two programmes, is expected over the Plan period.
2.37 As indicated in Table 13, nearly 12 million standard person years of additional employment were estimated to have been generated over ihte first two years of the Plan, constituting about 34 pe;r cent cf the total employment target of the Plan. Tniis suggests some shortfalls in this area. The major shiortfall is located in the Manufacturing and Construct'on scctor, where the growth rate over the Plan per’od is below the Plan target. Furthermore, in thie year1982-83, a further deceleration in growth is expected, m anly due to a bad harvest. Taking all th is into consideration, a significant shortfall in the Plan 's employment target in 1982-83 is apprehended T!he 1981 population Census has shown that the ra te of growth of population is higher than assumed in the Sixth Plan document. The pressure on the labour market, as a result, however, will not be felt in the immediate failure.

CHAPTER 3
TH E PROSPECTS FOR THE SIXTH PLAN
Three \ears of the Sixth Plan are over. Over these three years there have been many areas of success in our Plan programmes. But at the same time, there are a few specific areas where our achievements fall short of our goals. Many unexpected turns in the internal aud external environment of the country largely disturbed the Plan’s course of development. The econo. \s capacity to adjust to, and recover from, some of these setbacks will largely shape the future coi:r-c and the level of achievements as against Sixth Plan targets. The ma n aim of this mid-term appraisal is to examine the economy’s capacity to adjust to the new situation, and to identify appropriate strategies and policy packages best suited to these changed conditions so that the Sixth Plan achievements will be as near the targets given in the Plan document as possible.
3.2 The year 1980-81 witnessed a good recovery from the low base of 1979-80. This happened inspite oS very \iigV> iv.fiaV.csn ar.d advwsc ext£:?.3l terms of trade. This was made possible by a sireable increase in public sector investment, moderately good weather and a more efficient use of the resources and installed capacity of the economy. All these helped the economy to recover from the very low dip of 1979-80.
3.3 Jn the year 1981-82, the economy reached an appropriate tempo of development, matching closely the Sixth Plan goals. In almost all sectors, the growth rates picked up and attained the targets stipulated in the Plan. Also, the rate of investment kept pace with the Plan stipulat;on, in nominal terms. Increase in the level of investment to compensate for the significant rise in investment costs was found difficult because of the problem of mobilisation of additional resources. In the event, the realised increase in the level of public sector outlay and its financing had to rely on depletion in our foreign exchange reserves and a higher level of deficit financing.
3.4 Although the growth of the economy in general was satisfactory in 1981-82, the growth rates in manufacturing and construction were below the Plan targets. As for other sectors, including power and transport, where the forward and backward linkages are very high, the improvements in growth rates came mainly from better utili: :,tion of capacities. Though this, in itself, is a good sign, in the longer perspective it will be equally important to create new and add:tional capacities in order to sustain a reasonably high growth rate. Over the first three years of the Plan investment shortfalls are noticeable in some
I. General Review of the major infrastructure sectors like power, railways, irrigation, coal and steel. In the two years1982-83 and 1983-84, the rate of growth in real investment comes to 9 per cen't per annum, which is below the plan annual average target, and is well below the 1980-81 rate of real investment.
3.5 Keeping these facts in v'ew, an approxim ates has been made regarding the likely rivisions needed in the Sixth Plan’s output, investment, savings and other relevant targets. This has been worked out with the help of a dynamic input-output model. This model is almost the same as the one used while formulating the Sixth Plan. The following broad assumptions regarding the future have been made in using th :s model for projecting the relevant macro-variables for the year 1984-85.
3.6 It has been assumed that the years 1983-84 and 1984-85 will w'tness normal seasonal conditions. It is also assumed that, the real foreign resources inflow over the remaining years of the Plan period will be very close to what has been stipulated in the Plan. Regarding imports, sign'fteani success it\ import substitution has been assumed, based partly on the experence of the first three years and partly on information regarding the likely additional capacities that will be available in many sectors covering mainlv those where there are bulk imports (including
’oil) over the remaining years of the Plan. In thelight of the recent movement of oil prices and trends in international inflation, an improvement in the terms of trade in favour of India has also been assumed. Furthermore, in these projections, an export volume erowth of 7 per cent for the remaining years of the Plan has been stipulated. Although judging by past performance this is optimistic, all efforts need to be made to atta’n it so as to strengthen the structure of the balance of payments.
If. Oatpnt Projections3.7 Table 2 presents the sectoral “value added”
growth rates, projected upto the end of the Sixth Plan as emerging from the present exercise. They show a decline from the Plan targetted GDP growth rate of 5.27 per cent to 4.98 per cent, on an annual average. The sectors where significant shortfalls are expected are power, railways, construction and, to some extent, manufacturing. In agriculture, the assumption is that it will erow at 3.9 per cent per annum in term of value added, at constant prices over the last two years of the Plan. This is based on a moderately optinr’stic assu.mpt:on of normal weather conditions prevailing during the remaining plan period. The revised Plan tar set. of foodgrains production is placed at 146-148 million tonnes by 1984-85, which is considered achievable.
8 PC/83—3

10
3.8 In the power sector, the likely generation of electricity in the year 1984-85 will be about 170 billion KWH. This may match the likely demand forecast for 1984-85. The rate of increase of electricity generation decelerated in 1982-83 significantly to 6.5 per cent as against 9.85 per cent in1981-82. However, according to the latest information the growth or generation of electricity may again accelerate to a figure of 10.40 per cent in1983-84.
3.9 In 1983-84 the demand for coal is cxepcted to be around 147 million tonnes (excluding 3 million tonnes of middlings). Taking into account the production capacity that has been built up over the previous years, the 1983-84 target has been set at 142 million tonnes together with a liquidation of 4 million tonnes of pit-head stocks and about 1.2 million tonnes of imports of superior quality coal. For the last year of the Plan, an output of 154 m'llion tonnes, together with some draw down of stocks and marginal import of coking coal is likely to be adequate to meet the anticipated level of demand.
3.10 In JulyjAugust, 1982, the projection of originating traffic for 1984-85 was revised at 280-285 million tonnes including 257-262 million tonnes revenue earning. Within the outlays approved for1983-84, it is estimated that the railways would have the capacity to carry about 264 million tonnes of traffic (including 241 million tonnes revenue earning) in 1983-84, against a projected demand cf about 275 million tonnes (including 252 million tonnes revenue earning) and with some additional allocations in 1983-84 the gap may be reduced from 11 million tonnes to 6 million tonnes.
3.11 Railways may be able to achieve a capacity of about 280 million tonnes by 1984-85 if the investments in the last two years are substantially increased enabling acquisit:on of at least 77,000 wagons and execution of other works to enable mobility at the level of 1175 net tonne-kilometers (NT-KMS) per wagon day.
3.12 The target of output of iron-ore has been reduced from 60 million tonnes to 45 million tonnes. This should not create any supply shortage since a large part of it w;ll be matched by corresponding decrease in the export demand for iron-ore.
3.13 Tn the manufacturing sector, the production target of saleable steel has been reduced to 10.9 million tonnes as against the Plan target of 11.51 million tonnes. The shortfall in production can be attributed mainly to slower improvement in capacity utilisation than assumed in the Plan. But this :s not expected to pose any problem in meeting the likely demand.
ITI. Investment Projections
3.14 The total investment stipulated in the Sixth Plan was Rs. 158710 crores (at 1979-80 prices) over the entire Plan period. Of this, Rs. 84283 crores, i.e. 53 per cent, has been covered over the
first three years. But taking 'nto account the ivevisec, output projections and the actuai rate ul moiniiisa tion of resources so far, the aggregate investment target has been projected at Rs. J 5 2216 crones (at constant prices). This should mean revising line in vestment growth rate from 9 per cent to 8 per- cent per annum over the whole Plan period.This rediuction is required mainly in order to match a corresipond- ing shortfall in domestic savings mobilisation. The major shortfall in the domestic savings mobiliisation is in the public -sector’s mobilisation of “Owra Resources” . The growth in real investment in thie private corporate sector (excluding cooperative biut including non-financial services) over the first: two years of the Plan came very close to the Plan stipulated rate. The total ‘ Own Saving'’ (depreciation plus retained earnings) of the private corporate; sector over the Plan period 1980-85 is likely to be Rs. 13336 crores (at current 1981-82 prices). This converted to constant prices, comes very close to Rs, 10588 crores assumed in the Sixth Plan for investment in this sector. Thus, the savings of the private non-corporate sector can be regarded to have grown s’gnificantly above the indicated rate iin the Plan. Thts is the sector which includes household establishments, non-factory production and possibly a sizeable part of die unreported economy.
3.15 The public sector’s “Own Resources"’ over this Plan, at 1979-80 prices, on the other hand, are likely to be lower than the target. The rate of growth of investment in this sector over the last four years has been much lower than that assumed in the Plan. In the present exercisc, an acceleration in the public sector investment programme of 10 to E2 per cent in real terms to the end of the Plan has been assumed, primarily to work out the growth implications of the Sixth and Seventh Plans, fn nominal terms, the estimated total Plan outlay will exceed the Plan target by nearly 10 to 12 per cent. This would mean that a sizeable amount of erosion i.n the Plan’s total public sector real investment arising due to price rise will be compensated by a higher resources mobilisation effort in nominal terms. Nevertheless, on a rough calculation, the shortfall m the public sector outlay in real terms wvuld come to about 15— 20 per cent over the whole Plan period.
IV. Sectoral Investments
(i) Irrigation3.16 The shortfall in investment in this case has
to some extent been made up in 1983-84 by raising the allocation in the Annual Plan by about 12 per cent over that of 1982-83. If further additional investment could be made in the last Uvo years of the Plan, additional irrigation potential of one million hectares could be created and. further, utilisation of irrigation potent:a1 created could also he stepped up by one million hectares by some marginal investment. These additional investments deserve prior'!'..
(ii) Power3.17 Since this is one of the '■universal interme
diate inputs” , and because of the long gestation

11
pcricds involved in power projects, any shortfall in inve.'tmuil, in real terms, in this sector will give rise to problems both in the Sixth and the Seventh Plans. It lie piueiiy of resources affects the on-going projects expected to yield results in the Seventh Plan and nev starts, it will effectively mean the slowing down o: activity in the economy as a whole m the med.um term.
(ii:) Coal3.18 This, too, is a sector with long gestation,
and any retardation in on-going projects designed to neet demand in the Seventh Plan or on fresh start, fcr projects whose production is already linked t) o:bcr Seventh Plan consuming units should be avoided. Additional outlay iu this sector will be required.
(h ) R ailw ays
3.19 It has to be ensured that the ability of the railways to carry projected demand levels is built up continuously. This is of importance for all sectors of the e.onomy. Though, as a result of the detailed review of demand carried out recently, the original targtt o:' 309 mill on tonnes can be scaled down to abou 2'JO-285 million tonnes of originating traffic, addi:ion.il investment is necessary even for the reduced kvel.
(vt S'xe!
3.20 Shortfall in investment here will mainly affect the projects designed for the Seventh Plan. As far as ’the Sixth Plan is concerned, the total production of saleable steel in this sector in 1984-85 will remain close Ui the target, i.e., 10.9 million tonnes as agairst 11.51 million tonnes. But due to the fall in investment in the Sixth Plan, the capacity generation in the Seventh Plan will be adversely affected. It is necessary to ensure that resource constraints do not further delay the on-going projects expected to come to production in the Seventh Plan.V. The Balance of Payment Prospects
3.2! Considering commodity-wise prospects, the aggregate volume of exports could be expected to increase at. an average annual rate of about 7 per cent over the next two years. However, as a result of the decline in the volume of exports in 1980-81 and the further setback ;n 1982-83, exports (excluding crude oil) over the Plan period as a whole may increase on an average at an annual rate of only about 4 per cent.
3.22 The volume of imports over the rest of the Plan period could be expected to increase ch i an average by 8 per cent annually, and as compared to the 9.5 annual increase envisaged in the S:xth Plan, the actual growth of imports during 1980-85 may eventually turn out to be only 6 per cent.
3.23 It now appears that the terms of trade would be less unfavourable during the rest of the Sixth Plan period. Even so, because of the serious worsening of the terms-of trade in earlier years, the loss
from adverse international price movements over the Plan period as a whole may not differ significantly from initial projections.
3.24 The prospects are not very favourable for invisible earnings, which are likely to decl ne in real terms during 1983-85. St ll, owing to the higher than expected average level of eailier years, net receipts from invisibles would significantly exceed the projections for the Plan period.
3.25 The overall balance of payments outlook for 1980-85 emerging from the present reassessment of prospects does not mater ally differ from the S xth Plan projections in constant prices. The substantial shortfall in exports would be compensated more or less by greater import savings and higher net invisible receipts, with the result that the current account deficit in 1979-80 prices would not, allowing for the margin of error to wh ch such projections are subject, diverge significantly from the initial Sixth Plan es'imates. Even as regards net aid and other external borrowings the Sixth Plan assumptions do not, in retrospect, appear to have been unrcalist c. so that gross foreign exchange reserves arc unlikely to decline more than had been projected (Please See Table 4.2).
3.26 The adjustment strategy adopted in the Sixth Plan has been successful in bringing about significant improvements in the structure of the balance of payments, despite setbacks caused by an unfavourable economic environment and the severe drought of1982-83. Thus, by 1984-85, the cost of energy imports, as a proportion of the total import bill would fall to about 20 per cent from 43 per cent in the initial year of the Plan. Also, between 1980-81 and 1984-85 the dependence on oil imports relative to requirements is expected to drop from about 71 per cent to about 35 per cent. Again, as compared to a little over half of the cost of imports in 1980-81 exports are likely to cover nearly two-thirds by the terminal year of the Plan. Finally, following a declining trend, the currcnt account deficit relative ta GDP would drop from 2.2 per cent in 19S1-82 t<j1.7 per cent in 1984-85.
3.27 To conclude, the assessment of prospects at this stage reveals that there is little likelihood of the emergence of a serious foreign exchange constraint during the rest of the Plan period. But the likely shorfall in exports increases the vulnerability of the balance of payments in the post-Plan period. Accordingly, timely corrective action to birng about a substantial reduction in the trade gap, and so in the current account deficit in 1985-86 and subsequent years will be needed to avert renewed strains in the balance of payments position.
VI. Concluding Observations3.28 The revisions in the major macro econortrc
\ariables are presented in Table 1-A column (4). In general, the achievements of the Plan are seen to be very close to all assumptions made during its formulation.

CHAPTER 4
BALANCE OF PAYiMLNl'S
Generalfollowing <1 relative!) short pc-iiod Oi adjustment to
lhe first oil crisis there was an ovciaii improvement in the balance oi' payments situation during the second half of the 1970s. However, the second oil price hike and, to a smaller extent, the severe drought in 1979-60, subjected the external sector to a massive shock, leading to a sudden and serious worsening of the balance Oi payments situation. The problem was furtner aggravated by a marked deterioration in the international economic environment characterised by the onset oi recessionary trends, near stagnation of world trade, depressed commodity prices, unencouraging outlook for concessional aid, high interest rates and the prospect of harder terms for external assistance as well as conventional borrowing. The Sixth Five Year H an strategy was, accordingly, designed to help the economy adjust to the disruptions triggered by hign oil prices aud deteriorating terms of trade without sacrificing output growth and capital formation. Thus, priorities were reoriented to attain a rapid increase in the output of petroleum, coal, fertiliser, cement and metals so as to restrain the growth of bulk imports at a comparatively low cost in terms of domestic resources. Higher growth of exports was sought to be achieved through removal of obstacles to expansion of production for the international market by timely and adequate provision of scarce inputs, including imported materials, intermediates and equipment. At the same time, incentives to exporters were to be suitably restructured in order to insulate exports from the pull of domestic demand. Moreover, pressures o'n the balance of payments were to be dampened generally through vigorous resource mobilization, easing of infrastructure bottlenecks and maintenance of relative price stability. These structural adjustment measures to narrow the trade gap and to strengthen the balance of payments could, in the nature of the case, become fully effective only over a period of time, and so were expected to be sustained by recourse to other sources of external' finance besides anticipated net aid flows. The Government, therefore', entered into an Extended Fund Facility (E FF) arrangement with the IMF for SDR 5 b : 1 lion, to be provided as balance of payments support for the Sixth Plan adjustment strategy, over a three year period from November 1981 to November 1984.Balance of payments developnrinis
4.2 Tlie balance of payments situation deteriorated sharply during 1980-81, the first year of the Sixth Plan; the trade deficit more than doubled largely as a result of the setback suffered by exports, steep increase in the demand for imports clue to 'oor performance of the econcfmy, and a severe woisrnina of the terms of trade. The volume of exports declined by about 1.4 per cent, more as a consequence of unfavourabfe world
market conditions and pxoteciiouisi barrier ;> than due to infrastructure bottlenecks o’r shortages of basic inputs. In fact, better access to imports had largely insulated export production from the scarcity of essential materials and inputs, and enabled such non-traditionaJ manufactures as engineering goods, chemicals, gem s and jewellery to record rather high real rates of export growth. But other dynamic non-lradiuonal m anufactures, such as marine products, leather and leather gocds were hit by non-tariff barriers, while the growth of garment exports was constrained by quota restrictions. Handicrafts, particularly handkniUed carpets fared badly as a result of slack demand in principal import markets. Among traditional exports, tea, and more so cofiee, recorded substantial real growth, reflecting high output and the consequent improved availability for sales abroad. However, increasing competition from synthetics, on the one hand, and Bangladesh, on the other and the resulting erosion of the market for carpet backing led to a steep drop in the volume ol“ exports of jute manufactures. As for cotton textiles, export performance suffered due to a weakening competitive position and inadequate adaptation ot the product mix to the changing pattern of world demand.
4.3 The malfunctioning of the economy, particularly stagnant or declining production in such key sectors as crude oil, petroleum products, nitrogenous fertilisers and steel greatly increased the requirements for bulk imports. As a consequence, the volume of bulk imports were up by nearly 18 per cent, with POL and fertilisers alone accounting for over 40 per cent of the addition to the aggregate real inflow of imports. Other imports, which include capital goods, chemicals, pi'astic materials, pharmaceuticals, fibres, precious and semi-precious stones, also recorded a similar steep increase because of domestic .shortages and, to some extent, due to inventory related demand. While the overall volume growth of imports rose to 18 per cent, the accompanying marked worsening of the terms of trade, due mainly to the rise in international energy prices, led to a further widening of the trade gap. The merchandise deficit thus more than doubled to a staggering Rs. 5,849 crores in 1980-81.
4.4 Invisible earnings, however, showed a significant increase, mainty because cf a spurt in remittances from expatriate workers, and helped offset, well over half of the trade deficit. Even so, the current account deficit amounted to Rs. 2,131 crores. or about 1.7 per cent of GDP. fiie current account deficit cf this magnitude, however, did not create an unmanageable financing problem. Higher net aid, owing mainly to the Trust Fund Loan of Rs. 538 crores, and drawings under the Compensaton Financing Facility of IMF limited tte drain on foreign exchange reserves to Rs. 342 crores, a level more or less consistent with Plan projections.
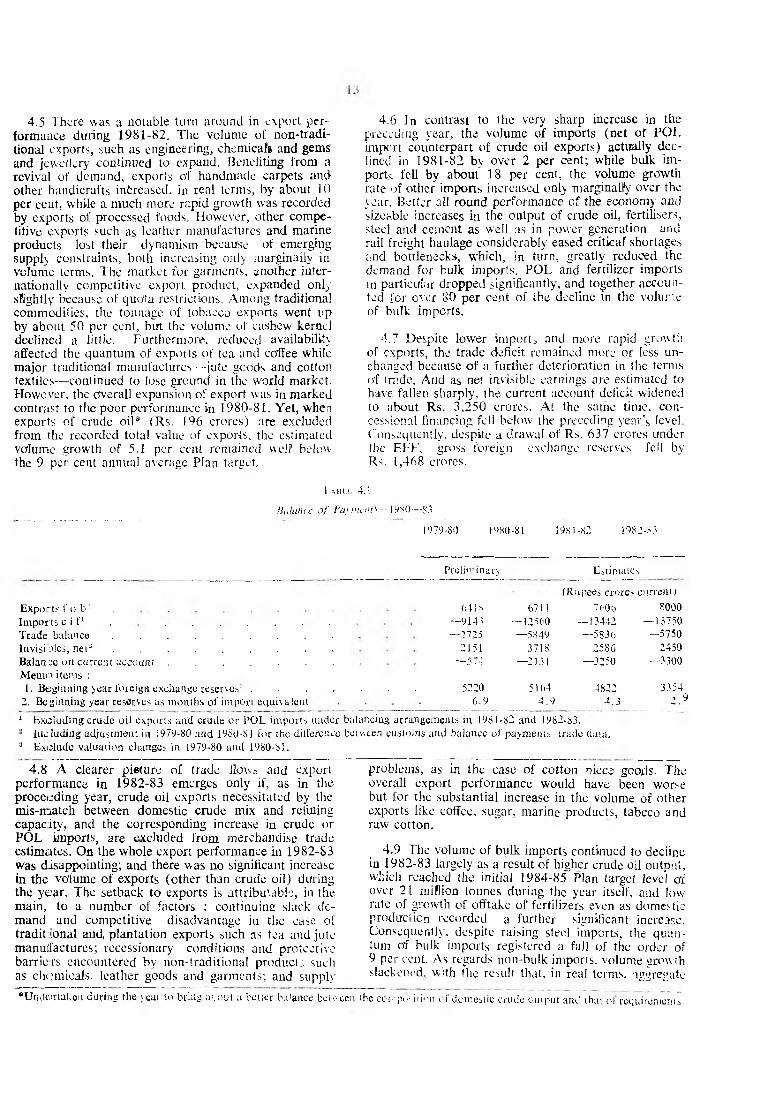
4.5 There was a notable turn around in export performance during 1981-82. The volume of non-tradi- tional exports, such as engineering, chemicals and gems and jewellery continued to expand. Benefiting from a revival of demand, exports of handmade carpets and other handicrafts intreased, in real terms, by about 10 per cent, while a much more rapid growth was recorded by exports of processed foods. However, other competitive exports such as leather manufactures and marine products lost their dynamism because of emerging supply constraints, both increasing only marginally in volume terms. The market for garments, another internationally competitive export product, expanded only slightly becausc of quo'ta- restrictions. Among traditional commodities, the tonnage of tobacco exports went lip by about 50 per cent, but the volume of cashew kernel declined a littie. Furthermore, reduced availability affected the quantum of exports of tea and co'ffee while major traditional manufactures— jute goods and cotton textiles— continued to lose ground in the world market. However, the overall expansion of export was in marked contrast to the poor performance in 1980-81. Yet, when exports of crude oil* (Rs. 196 crores) are excluded from the recorded total value of exports, the estimated volume growth of 5.1 per cent remained well below the 9 per cent annual average Plan target,
4.6 In contrast to the very sharp increase in the preceding year, the volume of imports (net of POL import counterpart of crude oil exports) actually declined in 1981-82 by over 2 per cent; while bulk imports fell by about 18 per cent, the volume growth rate of other imports increased only marginally over the year. Better all round performance of the economy and sizeable increases in the output of crude oil, fertilisers, steel and cement as well as in power generation and rail freight haulage considerably eased critical shortages and bottlenecks, which, in turn, greatly reduced the demand for bulk imporLs. POL and fertilizer imports in particular dropped significantly, and together accounted for over 80 per cent of the decline in the volume of bulk imports.
4.7 Despite lower imports and more rapid growth of exports, the trade deficit remained more or less unchanged because of a further deterioration in the terms of trade. And as net invisible earnings are estimated to have fallen sharply, the current account deficit widened to about Rs. 3,250 crores. At the same time, concessional financing fell below the preceding year’s level. Consequently, despite a drawal of Rs. 637 crores under the EFF. gross foreign exchange reserves fell by Rs. 1,468 crores.
I - \ B U . 4.1
Hdlanve of Payments — i 980—83
1979-80 1980-81 1981-82 1982-83
Exports f o b - .Im ports c i f1 . . ....................................................Trade balance . . . . . . . . .Invisibles, net" . . . . . . . . .Balance on current account . . . . . . .M em o items :
1. Beginning year foreign exchange resenoa'1 . . . .2. Beginning year reserves as months of import equivalent
1 Excluding crude oil exports and crude or POL imports under b2 Including adjustment in 1979-80 and 1980-81 for the difference b a Exclude valuation changes in 1979-80 and 1980-81.
4.8 A clearer picture of trade flows and export performance in 1982-83 emerges only if, as in the proceeding year, crude oil exports necessitated by the mis-match between domestic crude mix and refining capacity, and the corresponding increase in crude or POL imports, are excluded from merchandise trade estimates. On the whole export performance in 1982-83 was disappointing; and there was no significant increase in the volume of exports (other than crude oil) during the year. The setback to exports is attributable, in the main, to a number of factors : continuing slack demand and competitive disadvantage in the ease of tradit ional and, plantation exports such as tea and jute manutfactures; recessionary conditions and protective barriers encountered by non-traditional product;, such as chcmieals. leather goods and garments; and supply
•U m tertakon during the \ea r to bring about a better balance be tweet
Preliminary Estimates
(Rupees crore> current)6418 6711 7606 8000
— 9143 — 12560 — 13442 — 13750— 2725 — 5849 — 5836 — 5750
2151 3718 2586 2450— 574 — 2I3J — 3250 — 3300
5220 5164 4822 33546 .9 4 . 9 4 .3 2 . 9
alancing arrangements in 1981-82 and 1982-83. oiwcen customs and balance of payments trade data.
problems, as in the case of cotton piece goods, The overall export performance would have been worse but for the substantial increase in the volume of other exports like coffee, sugar, marine products, tabcco and raw cotton.
4.9 The volume of bulk imports continued to deciine in 1982-83 largely as a result of higher crude oil output, which reached the initial 1984-85 Plan target level erf over 21 million tonnes during the year itself, and low rate of growth of offtake of fertilizers even as domestic production recorded a further significant increase. Consequently, despite raising steel imports, the quantum of bulk imports registered a fall of the order of9 per cent. As regards non-bulk imports, volume growth slackened, with the result that, in real terms, ‘ig^regate
the cor;’.pi“ ition < i domestic crude output an<J ihat ol requirements.

imports continued to decline. Accordingly, with the terms of trade improving a little, the trade dcticir can be expected to have been smaller than in 1981-82. Even though net invisible earnings might have dcciined somewhat during the year, the current account balance is likely to have recorded a small increase. Taking into account the drawal of Rs. 1891.00 crores under the E FF as well as other capital inflows, some replenishment of foreign exchange reserves was anticipated by the end of th<* year; the actual increase in foreign exchange reserves, however, turned out to be of the order of Rs. 900 crores, partly as a result of lead? and lags in settlements.
Balance of Payments Prospects
4.10 The Sixth Plan balance of paym ent prospects have been favourably influenced by a number oil developments. The implementation of the adjustment programme to strengthen the balance of payments is unlikely to be constrained by the growth performance of the economy. Real GDP over the first two years of the Plan increased at an average annual rate of about6 per cent; and despite the setback resulting from poor harvests and slower industrial growth in 1982-83, the pace of growth over the five years ending in 1984-85 may not on average deviate significantly from the 5.2 per cent target. Fiscal and monetary policies succeeded in bringing about a sharp abatement o'f the rate ot inflation. Critical shortages and constraints were greatly cased by sizeable increases after 1980-81 in the output of basic intermediates, including power, coal, steel, cement, fertilizers and crude oil. The accelerated offshore production programme, initiated after the commencement O'f the Plan, is now expected to raise crudeoil production by nearly 12 million tonnes over the target for 1980— 85, while the initial output target for1984-85 has already been attained. Despite rising industrial production and power output, significant reserves of capacity exist for pefwer generation as well as for the manufacture of fertilizers, railway wagons and newsprint. Moreover, additional capacity is slated to go on stream in such key sectors as petroleum refining, fertilizers, steel, aluminium and cement. Finally, international oil prices ttf Lite have weakened; and even though the market situation remains unclear, it is becoming evident that international oil prices would continue to be lower than the levels that had earlier been anticipated.
4.11 The balance of payments, however, will continue to be under pressure over the rest of the Plan period partly because of the size of the trade gap itself, and parfly due to the operation of certain adverse factors over the past three years. The volume growth of exports, affected as it was, among other things, by persistent recession in industrialised countries and consequent protectionist policies, has remained far below the 9 per cent annual target. Although international price movements are now likely to be less unfavourable, the loss imposed by the deterioration of the terms of trade over the Plan period w'ould, as had been initially expected, remain substantial. Invisible earnings, which had helped finance a sizeable part of t he trade deficit in 1980-81 as well as in 1981-82. are es'imated 1o have fallen in 1982-83; and the outlook is unencouraging for subsequent vears as well.
4.12 Considering past developments and c\ mmoditj, wise prospects, the aggregate volume ot exports cuh be expected to increase at an average annual ra te o; about 7 per cent o'ver the two years ending in 19 84-8,> However, as a result of the decline in the volume oi exports, m i 980-81 and a further setback in 1982-8 ' exports (net of POL) over the Plan period as a whole may increase on average at an annual ra te of only about 4 per cent.
4.13 Over the rest of the Plan period, the volume of imports could be expected to increase on average by 8 per cent annually owing to a number of factors : anticipated higher GD?P growth rates following recovery from the drought in 1982-83; step up in re;ii investment in certain key sectors necessitated by the comparatively slow pace of expansion in earlier years; and contingency provision for unforeseen developments such as unfavourable weather or adverse changes in international prices. However, as compared to the9.5 per cent annual increase envisaged in the Sixth Pian, the likely average growth of imports during 1980— 85 may eventually turn out to be only about6 per cent. Moreover, this deviation from initial projections would be accompanied by a significantly different pattern of import growth. Thus, bulk imports may decline by 4.5 per cent per year during 1980— 85 as compared to the projected growth rate of 15.1 per cent, partly because of the declining trend of POL imports over the Plan period. On the other hand, as it now appears, the average annual olume growth of non-bulk imports, including contingency requirements would, if at alJ, exceed only marginally the 13 per cent Sixth Plan forecast for the five years ending in 1984-85.
4.14 As it appears, the terms of trade would be less unfavourable during the rest of the Plan period. Consequently, the loss resulting from adverse terms of trade during 1983-85 would be smaller than the one actually suffered during the first three years of the Sixth Plan. Even so, because of the serious worsening of the terms of trade in the earlier years, the loss from adverse international price movements over the Plan period may not differ significantly from initial projections.
4.15 According to present indications, net invisible earnings would be declining in real terms during the last two years of the Pian. All the same, taking the live years 1980— 85 together, act reccipis from invisibles would significantly exceed the Sixth Plan projections, dire particularly to the larger than expected level of expatriate remittances.
4.16 The overall balance of payments outlcok for1980— 85 emerging from the present reassessrient of prospects does not materially differ from the Sixth Plan projections in constant prices. The substantia! shortfall in exports would be compcnstated more or ess by greater import savings and higher net invisible receipts, with the result that the current account def.cit in1979-80 prices would not. allowing for the margin of error to which such projections are subject, liverge significantly from the ini'ial Sixth Plan estimates. Even as regards net aid and other externa! borrowings the Sixth Plan assumptions do not, in retrospect, appear <o have been unreali'-tie. so that gross .forevan es.’hange reserves are unlikely to decline more th.in haJ been projected
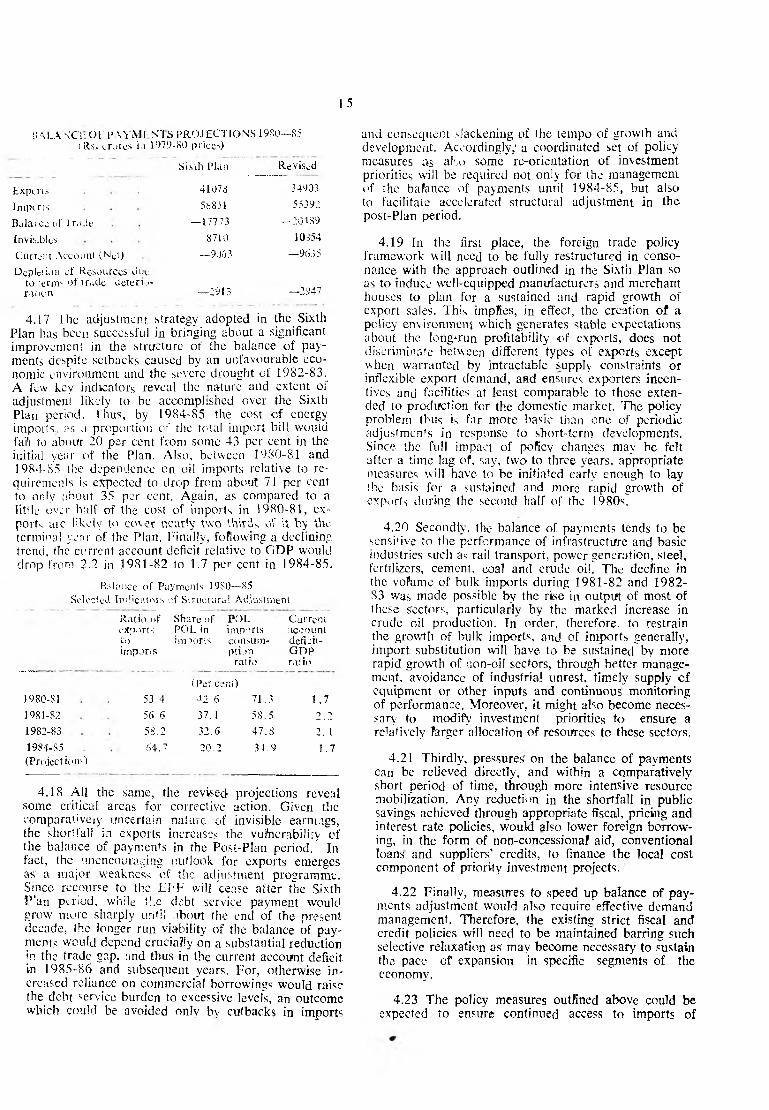
15
BALANCI- O f I 'W .M ! M .S PR O JE C TIO N S 19S0—85 i Rs. erures i.i 1979-80 prices)
Si.sth Plan Revised
Exptris 41073 34903
lnipcns 58851 5539.’.
Balance of 1 r.tde — 17773 — 204S9
Invisibles 8710 10 >54
Current Account (Net) —9063 —9635
Depletion of Resources Jt-e to :.ernr' of trade deterioration — 2913 —2947
4.17 The adjustment strategy adopted in the Sixth Plan has been successful in bringing about a significant improvement in the structure or the balance of payments despite setbacks caused by an unfavourable economic environment and the severe drought of 1982-83. A few key indicators reveal the nature and extent of adjustment likely to be accomplished over the Sixth Plan period. Thus, by 1984-85 the cost of energy imports, as a proportion of the total import bill would falfi to about 20 per cent from some 43 per cent in the initial year of the Plan. Also, between 1980-81 and1984-85 the dependence on oil imports relative to re
quirements is expected to drop from about 71 per cent to only about 35 per cent. Again, as compared to a little over half of the cost of imports in 1980-81, exports arc likely to cover nearly two thirds of it by the. terminal y e a r of the Plan. Finally, foHowing a declining trend, the current account deficit, relative to GDP would drop from 2.2 in 1981-82 to 1.7 per cent in 1984-85.
Balance of Payments 19S0—85 Selected Indicators of Structural Adjustment
Ratio nf Share of POL Currentexports POL in imports accountto invnorts consu ni deficit-im pjris pt i. in G D P
ratio ratio
(Per ce nt)1980-SI 53.4 -12.6 71.3 1 .71981-82 56 6 37. 1 58.5 2 .21982-83 58.2 32.6 47.8 2. 11984-85 64.7 20.2 34.9 1.7(Projections)
4.18 All the same, the revised projections reveal some critical areas for corrective action. Given the eomparat:veiy uncertain nature of invisible earnings, the shortfall in exports increases the vulnerability of the balance of payments in the Posi-Plan period. In fact, the ’.mencouraging outlook for exports emerges as' a major weakness of the adjustment programme. Since recourse to the EFF will cease after the Sixth P ’an period, while the debt service payment would grow more sharply until ibout the end of the present decade, the longer run viability of the balance of payments would depend crucially on a substantial reduction in the trade gap, and thus in the current account deficit in 1985-86 and subsequent years. For, otherwise increased reliance on commercial borrowings would raise the debt service burden to excessive levels, an outcomc which could be avoided only by cutbacks in imports
and consequent slackening of the tempo of growth and development. Accordingly,' a coordinated set of policy measures as aho some rc-orientation of investment priorities will be required not only for the management of the bafence of payments until 1984-85, but also to facilitate accelerated structural adjustment in the post-PJan period.
4.19 In the first place, the foreign trade policy framework will need to be fully restructured in consonance with the approach outlined in the Sixth Plan so as to induce well-equipped manufacturers and merchant houses to plan for a sustained and rapid growth of export sales. This impfies, in effect, the creation of a policy environment which generates stable expectations about the long-run profitability of exports, does not discriminate between different types of exports except when warranted by intractable supply constraints or inflexible export demand, aad ensures exporters incentives and facilities at least comparable to those extended to production for the domestic market. The policy problem thus is far more basic than one of periodic adjustments in response to short-term developments. Since the full impact of poficy changes may be felt after a time lag of, say, two to three years, appropriate measures will have to be initiated early enough to lay the basis for a sustained and more rapid growth of exports during the second half of the 1980s.
4.20 Secondly, the balance of payments tends to be sensi'ive to the performance of infrastructure and basic industries such as rail transport, power generation, steel, fertilizers, cement, coal and crude oil. The decfine in the vo?ume of bulk imports during 1981-82 and 1982- 83 was made possible by the rise in output of most of these sectors, particularly by the marked increase in crude oil production. Tn order, therefore, to restrain the growth of bulk imports, and of imports generally, import substitution will have to be sustained by more rapid growth of non-oil sectors, through better management, avoidance of industrial unrest, timely supply cf equipment or other inputs and continuous monitoring of performance. Moreover, it might also become necessary' to modify investment priorities to ensure a relatively larger allocation of resources to these sectors.
4.21 Thirdly, pressures on the balance of payments can be relieved directly, and within a comparatively short period of time, through more intensive resource mobilization. Any reduction in the shortfall in public savings achieved through appropriate fiscal, pricing and interest rate policies, would also lower foreign borrowing, in the form of non-concessional aid, conventional loans and suppliers’ credits, to finance the local cost component of priority investment projects.
4.22 Finally, measures to speed up balance of payments adjustment would also require effective demand management. Therefore, the existing strict fiscal and credit policies will need to be maintained barring such selective relaxation as' may become necessary to sustain the pace of expansion in specific segments of the economy.
4.23 The policy measures outlined above could be expected to ensure continued access to imports of

Ifi
critical materials, inletmediates and equipment for t!ic modernization a;, well as optima! utilir.ation of existing productive capacities without excessive foreign borrowings on commercial terms. Nevertheless, import policy should be administered in a flexible manner permitting such selective curbs on imports as might become necessary from time to time to prevent disruption of domestic production due to dumping at exceptionally
4.24 To concFude. the assessment of the balance • payments outlook at this stage reveals that the prccssure emerging in the wake of the second oil shcock ii ]97 l)-80 have been contained. Also, there is littke likcli hood of serious foreign exchange constraints during th> rest of the Plan period. However, the Indian ecxraonv will still have to cope with strains on the balaince o payments during the second half of 1980s, buit thesi difficulties can be overcome by initiating coirrectiv-
low prices.
Physical Tarim
ae iio n w e FI in tim e. T abu 1
’’t.s o f Production for Principal Coiiwioditics'St rviccs
SI. Item Uit'l 1979-SO 1984-85No.
Sixth Plan Projections
Midt-termEstim ates
! 2 4 5 6
1. Fooilgrains . . . . . . . Mill, tonnes 109 149—154 1416-1482. S u g a rc a n e ................................................... . Mill, tonnes 128 200—215 19>0 193. Jute and Mesta . . . . . Lakh bales 80 3 91.0 91.04. Oilseeds (five major) . . . . Lakh tonnes 81 110 1105. Cotton . . . . . . Lakh bales 77 92 90.91’6. Tea . . . . . . . . Mill. Kgs. 550 705 7057. Coffee . . . . . . . Mill. Kgs. 150.00 159.45 159.458. M i l k .............................................................. Mill, tonnes 30.27 38 3S9. E g g s .............................................................. . Mill. Nos. 12320 16303 1400 i
10. Coal . . . . . . . . Mill, tonnes 103.96 165.00 15411. Lignite . . . . . . Mill, tonnes 3.12 8.00 8.0012. Crude Petroleum . . . . . Mill, tonnes 11 .77 21.6 27.5.?13. Iron ore and concentrate'; Mill, tonnes 39 60 45.014. Sugar . . . . . . Mill, tonne? 3.9 7.6 7.6415. Vanaspati ’000 tonnes 626 900 95016. Cloth (Mill and decentralised sector) . Mill, metros 10435 13030 1300017. Jute M anufactures . . . . . Thousand tonnes 1336 1500 to 1540 150018. Paper and Paper Board . Thousand tonnes 1050 1500 150019. Newsprint . . . . . . . Thousand-tonnes 47.45 180 20020. LD Polyethylene . . . . . . Thousand tonnes 71.3 100 10521. H .D. Polyethylene . . . . Thousand tonnes 25.4 27.0 35.022. P.V .C ............................................................... 49.9 128.0 12023. N atural Rubber . . . . . Thousand tonnes 148.47 200.0 200.024. Synthetic Rubber (SBR & PBR) . . Thousand tonnes 30.3 45 4225. Petroleum Products (including lubricants) . Mill, tonnes 25.8 35.3 39.2626. Sulphuric Acid . . . . . Thousand tonnes 2131 3600 260027. Caustic Soda . Do 549.6 850 77528. Soda A s h .................................................... . Do 555.8 850 72029. P o ly p r o p y le n e ......................................... Do 13.4 27.0 27.030. C a p r o l a c t a m ......................................... . Do. 13.5 18.0 18.031. D .M .T ............................................................. Do. 27.9 56.0 65.032. Nitrogenous Fertilizers (N) . Do. 2226 4200 410033. Phosphatic Fertilisers (P.O .) Do. 757 1400 130034. Nylon Filament Yarn . . . . Do. 17.7 28.0 28.035. Polyester Filament Yam & Staple Fibre . Do. 32.6 73.0 75.036. C e m e n t ................................................... . Mill, tonnes 70.68 34 to 34.5 34.537. Pig Iron for sale . . . . . Do. 1.09 1.52 1.4738. Saleable Steel (Plain Carbon) . Do. 7.3S 11.51 10.9039. Aluminium . . . . . . ‘OX) tonnes 192 300 26040. Copper R e f in e d ......................................... . Do. 18.8 45.0 40.041. Zinc . . . D \ 52.65 85.00 70.042. Lead . . . . . . Do. 11 . 4 25.0 25. ft43. Agricultural Tractors . . . ‘000 Nos. 62.5 100.0 (00.040. Machine tools . . . Rs. million 161’ 2500 35004 5. Hydro Turbines . . . . . Mil). KW 0.95 1 .20 1 :’j

17
SI.Nc.
Ilem Unit 1979-80 1984-85
146. Thermal Turbines47. Electric Transformers .48. Commercial Vehicles .49. Electricity Generation. .50. Railways Originating Traffic51. Irrigation :
(a) Additional Potential(b) Additional utilisation
Mill. KW Mill.KV ‘000 Nos. Billion KWH
Million tonnes
Mill. Hecs Do.
Sixth Plan Projections
Mid-termEstimates
4 5 6
2.28 3.50 3.5018.7 35.00 25.00
57.4 105.00 120.00112 191 170
217.8 309 280 to 285
56.50 13.74 11.4552.32 13.60 11.50 to 12
T a b l e 1-A
Selected Macro-Economic Indicators
SI. Indicator 1979-80 Plan 1984-85No. (actual) 1984-85 (Revised)
Growth Rates ( %)1. Gross Domestic Product at factor cost 5.20 4.982. Private Final Consumption E x p e n d i t u r e ................................................... .......... 4 .69 3.14
9.27 7.164. Import of Goods . . . . . . . . . . . . . 7.89** 6.05. Export o f Goods . . . . . . . . . . . . . 9. 0 3. 9
Ratios and Propensities (%) *1. Saving Ratio . . . . . . . . . . . . . . 22.5 24.48 24.00Z. Ratio of Current Account Balance to Investment over the Plan period (Balance of Payments) 3.71 6.343. Marginal propensity to save over the Plan p e r i o d ......................................... .......... — 33.73 29.424. Marginal propensity to consuma over the Plan pet iod . . . . . . . — 64.37 67.325. Import elasticity (Merchandise) over the Plan p e r i o d ............................................................. — 1.27 1.206. Imports to GDP (M arket Prices) ratio . . . . . . . . . . 8.54 8.77 8.97
**A11 ratios and propensities are with respect to G DP at 1979-80 market prices. ♦’ Excluding contingency imports.
T able 2
G.D.P. at Factor Cost and its Growth by Sectors(Rs. crores at 1979-80 prices)
Sectors 1979-80 1980-81 1981-82 1984-85**
1
1. Agriculture . . . .
2. Forestry & Logging
3. Fisheries . . . .
4. Mining & Quarrying
5. Manufacturing .
6. Construction
7. Railways . . . .
8. Electricity, Gas & Water Supply
9 . Other Transport .
10. Communication .
Target Revised
2 3 4 5 6
32567 36778 38057 39566 39414(12.93) (3.48) (3.97) (3.89)
1028 1012 993 1036 1036-(1 .5 8 ) —(1.88) (0.16) (0.16)
774 784 774 930 930(1.26) - 0 . 2 8 ) (3.73) (3.73)
1515 1573 1791 2582 2713(3.83) (13.89) (11.25) (12.36)
16989 17473 18479 23276 23080(2.85) (5.76) (6.50) (6.32)
4658 4747 4961 5973 5613(1.91) (4.51) (5.10) (3.80)
1105 1137 1231 1547 1439(2.93) (8.31) (6.96) (5.42)
1701 1801 1995 2403 2198(5.89) (10.75) (7.15) (5.20)
3884 4173 4476 5336 5336(7.44) (7.26) (6.56) (6.56)
760 817 862 1021 1021(7.55) (5.48) (16.08) (6.08)
8 PC/83—4
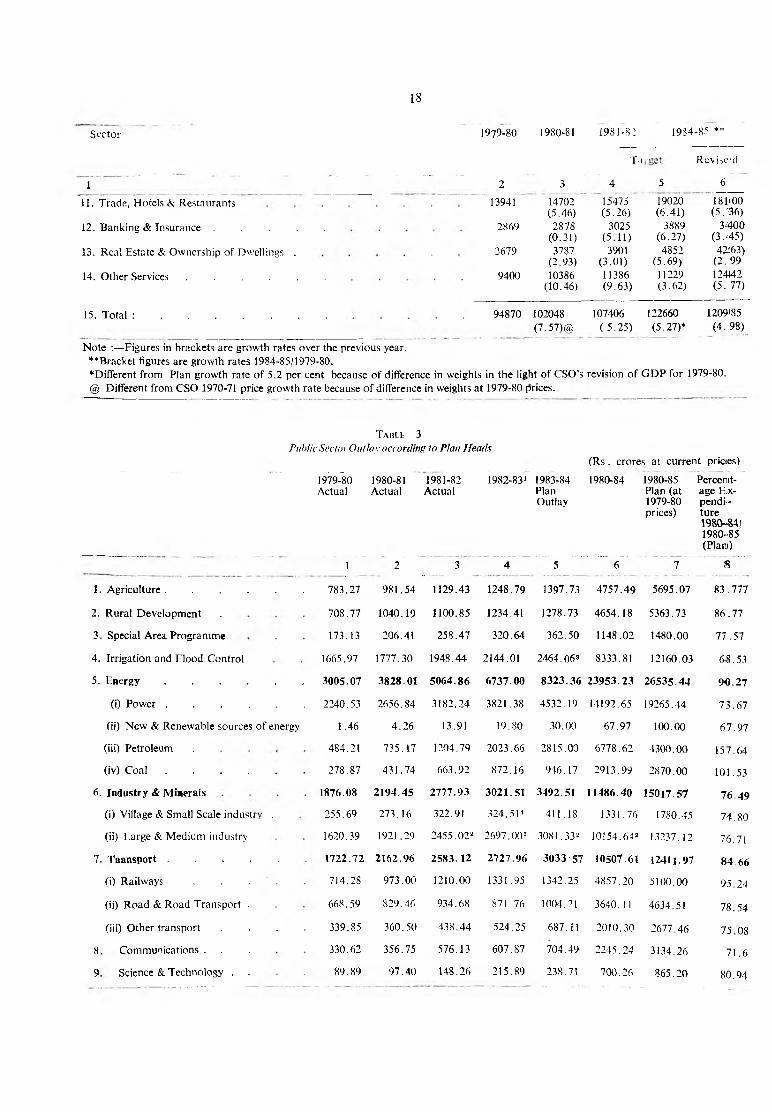
18
Sector 1979-80 1980-81 1981-8: 1984-85 **
T.i R evised
1 2 3 4 5 6
11. Trade, Hotels & Restaurants 13941 14702 15475 19020 181(00(5.46) (5.26) (6.41) (5 .36)
12. Banking & Insurance . . . . . 2869 2878 3025 3889 3400(0.31) (5.11) (6.27) (3 .‘45)
13. Rea! Estate & Ownership of Dwellings . 3679 3787 3901 4852 42163)(2.93) (3.01) (5.69) (2. 99
14. Other Services . . . . . . 9400 10386 11386 11229 124M2(10.46) (9.63) (3.62) (5. 77)
15. Total : .............................................................. 94870 102048 107406 122660 1209>85(7 .57)@ (5 .25) (5.27)* (4. 98)
Note :—Figures in brackets are growth rates over the previous year.**Bracket figures are growth rates 1984-85/1979-80.♦Different from Plan growth rate of 5.2 per cent because of difference in weights in the light of CSO's revision of GDP for 1979-80. @ Different from CSO 1970-71 price growth rate because of difference in weights at 1979-80 prices.
T able 3Public Sector Outlay according to Plan Heads
(Rs . crores at current pricies)
1979-80 1980-81 1981-82 1982-83* 1983-84 1980-84 1980-85 Percemt- Actual Actual Actual Plan Plan (at age E.x-
Outlay 1979-80 pendi-prices) ture
1980-84J1980-85(Plaru)
1 2 3 4 5 6 7 8 .....
1. Agriculture . . . . . . 783.27 981.54 1129.43 1248.79 1397.73 4757.49 5695.07 83 .777
2. Rural Development . 708.77 1040.19 1100.85 1234.41 1278.73 4654.18 5363.73 86.77
3 Special Area Programme 173.13 206.41 258.47 320.64 362.50 1148.02 1480.00 77.57
4. Irrigation and Flood Control 1665.97 1777.30 1948.44 2144.01 2464.06* 8333.81 12160.03 68.53
5. Energy . . . . . . 3005.07 3828.01 5064.86 6737.00 8323.36 23953.23 26535.44 90.27
(i) Power . . . . . . 2240.53 2656.84 3182.24 3821.38 4532.19 14192.65 19265.44 73.67
(ii) New & Renewable sources of energy 1.46 4.26 13.91 19.80 30.00 67.97 100.00 67.97
(iii) Petroleum . 484.21 735.17 1204.79 2023.66 2815.00 6778.62 4300.00 157.64
(iv) Coal . . . . . . 278.87 431.74 663.92 872.16 946.17 2913.99 2870.00 101.53
6. Industry & Minerals 1876.08 2194.45 2777.93 3021.51 3492.51 11486.40 15017.57 76.49
(i) Village & Small Scale industry . 255.69 273.16 322.91 324.51* 411.18 1331.76 1780.45 74.80
(ii) Large & Medium industry 1620.39 1921.29 2455.022 2697.003 3081,332 10154.64a 13237.12 76.71
7 T a a n sp o rt......................................... 1722.72 2162.96 2583.12 2727.96 3033■57 10507.61 1241J.97 84.66
(i) Railways . . . . 714.28 973.00 1210.00 1331.95 1342.25 4857.20 5100.00 95.24
(ii) Road & Road Transport . 668.59 829.46 934.68 871.76 1004.21 3640.11 4634.51 78.54
(iii) Other transport . . . . 339.85 360.50 438.44 524.25 687.11 2010.30 2677.46 75.08
8 Communications . . 330.62 356.75 576.13 607.87 704.49 2245.24 3134.26 71.6
9 Science & Technology . . 89.89 97.40 148.26 215.89 238.71 700.26 865.20 80.94

19
(Rs. crores at current prices)1979-80 1980-81 Actual Actual
1981-82Actual
1982-831 1983-84 Plan
outlay
1980-84 1980-85 Plan (at 1979-80 prices)
Percentage Expenditure 1980-84/ 1980-85
(Plan)1 2 3 4 5 6 7 8
10. Social Services 1548.03 2074.65 2487.15 2953.21 3632.10 U 1 9 7 .ll 14035 26 79.78(i) Education . . . . . 262.96 339.54 435.64 537.55 686.44 1999.17 2523.74 79.21(ii) Health & Family Planning 341.66 411.52 530.43 682.99 798.02 2422.96 2831.05 85.59(iii) Housing & Urban Development 392.77 477.34 488.13 538.84 650.83 2155.14 2488.40 86.61(iv) Other Social Services 550.64 846.25 1032.95 1193.83 1546.81 4619.84 6192.07 74.61
11. Others . . . . . . 72.98 112.78 136.21 145.36 202.56 596.91 801.47 74.4812. Special Incentives . . . . — — — — 300.00 300.00 —13. T o ta l ..............................................................14. Central Assistance against Natural cala-
12176.53 14832.44 18210.85 21356.65 25480.32 79880.26 97500.00 81.93
mities . . . . . . 191.00 162.00 372.00 — 725.00
1 Figures for Central Plan 1982-83 are based on R.E. 1982-83 and anticipated expenditure for States and U.Ts. as circulated by the State Plans Division.
2 Includes outlay/expenditure for Export-Import Bank of India and Share capital to Nationalised Banks.3 A provision of Rs. 0.11 crore for Manipur on account of Command Area Development has been included under Agriculture.4 Excludes Rs. 5.82 crores for Madhya Pradesh and Rs. 0.24 crore for Chandigarh which have been reflected in the figure for Large and
Medium Industries.
Year
1979-80 .
1980-81 .
1981-82 .
1980-81 & 1981-82
1982-83 .
1980-81 to 1982-83 .
Sixth Plan (1980-85)
T able 4
Investment for the economy as a whole and Public Sector Plan Investment
Total
......................................... 24678
......................................... 27133
......................................... 29255
......................................... 56388(35.53)
......................................... 28125
......................................... 84513(53.25)
......................................... 158710(100.00)
(R.s. c rjres at 1979-80 prices)
Public Sector
10190
11491
12305
23796(28.33)
13131
36927(43.96)
84000(100.00)
Figures in brackets are the percentages to the total plan investment (1980-85).
Table 5Own Resources and Investment of Public Sector
(Rs. crores at current prices)1977-78 1978-79 1979-80 1980-81 1981-82 1982-83 1980-85
(1979-80prices)
1 2 3 4 5 6 7 8
1. Own Resources of which . . . . . 4026 5015 4301 4819 7567 8821 45175(i) Balance from current revenue . . . . 2604 3317 2783 3285 4115 5238 26930(ii) Contribution of public enterprises 1422 1698 1518 1534 3452 3583 18245
2. Total Domestic S a v i n g s ......................................... 19235 23797 24098 28068 33627 35998 1496473 . Public Sector I n v e s t m e n t ......................................... 8341 9607 10490 12780 15690 18410 840004. Ratio of own resources of Public sector and its
investment ( p e r c e n t ) ................................................... 48.27 52.20 41.00 37.71 48.23 47.91 53.785. Ratio of public sector own resources to total domes
tic saving ( p e r c e n t ) ................................................... 20.93 21.07 17.85 17.66 21.55 24.67 30. 19

20
Table 6Resources for Public Sector Plan Outlay
(Rs. crores at current prices)
1977-78 1978-79 1979-80 1980-81 1981-82 19:32-853
1 2 3 4 5 6
1. Revenue Receipts........................................ .......... 18264 20905 22764 25712 30327 35i23?(i) Tax Revenue . . . . . . . 13215 15491 17296 19888 24113 282252(ii) Non-Tax Revenue . . . . . . 5049 5414 5468 5824 6214 69)85
2. Total E x p e n d i t u r e ................................................... 15660 17588 19981 22427 26212 295995(i) Non-Development expenditure . . . . 8043 8983 9983 12845 14125 1(6329(ii) Non-Plan Development expenditure . 7617 8605 9998 9583 12087 133670
3. Balance from current Revenues . . . . 2604 3317 2783 3285 4115 521384. Market B o r r o w i n g ................................................... 1387 1857 2147 3160 3700 A im5. Draft on other Private savings . . . . 2059 2542 2129 1644 3073 3<4986. Contribution by Public enterprises 1422 1698 1518 1534 3452 235837. Net External Assistance . . . . . 738 728 939 1719 1352 1' 7248. Budgetary D e f i c i t ................................................... 1016 631 2661 3490 2519 2(6089. Plan Expenditure including UTs . . . . 9226 10773 12177 14832 18 21135
Note : Draft on other private savings includes State provident funds, small savings, compulsory deposits, term loans from financial institutions, miscellaneous capital receipts etc.
Tablb 7 Plan Outlay & Resources Raised
(R s . c ro re s)
Plan Outlay1980-81 1981-82
Centre/UTs
States Total Centre/UTs
States To>tal
Plan O u t l a y ........................................ ......................................... 7305 7527 14832 9545 8666 1(8211Financed from(i) Total Domestic Budgetary Resources ......................................... 5980 3834 9814 9881 4621 14;50’
(ii) Net External Aid ......................................... 1181 — 1181 1352 — 1 352(iii) Loan from IM F Trust Fund ......................................... 538 — 538 — — —(iv) Budgetary Deficit ......................................... 2577 913 3490 1392 1127 21519(v) Central Assistance for State Plans .........................................—2971 +2971 — —3080 + 3080 _
(of which, relief assistance) ..........................................(191) -(1 9 1 ) - (1 9 1 ) (162) - (1 6 2 ) - ( 1 6 2 )7305 7527 14832 9545 8666 1:821*
1982-83 1983-84
Centre/ State Total Centre/ States "lotalUTs UTs ------
Plan O u t l a y ........................................ ......................................... 12018 9338 21356 14351 111301 25481
Financed from(i) Total Domestic Budgetary Resources ........................................... 12224 5172 17395 14625 7289 21914
(ii) Net External Aid .........................................1724 — 1724 1940 — 194°(iii) Loan from IM F Trust Fund ......................................... — — — — — _(iv) Budgetary Deficit .........................................19353 673 ic m 1'>S7 — 1687(v) Central Assistance for State Plans . .........................................—3865 + 3865 — —390 1 +3901 --
(of which, relief assistance) . (372) -(3 7 2 ) -(3 7 2 ) (60) - ( 6 0 ) — (60)12018 9338 21356 14351 11130 2548
1 Excludes outlay on REC Programmes.* Excludes Rs. 1743 crores given as loans to States for clearing their over-drafts with RBI, as on 31-3-82.

21
Estimates o f financial Resources for the Plan in the Public Sector for 1980-81
T a b l e 8
(Rs. crores)
Annual Plan Estimates Actuals
Centre* States Total Centre* States Total
2 3 4 5 S 71
A. P lai O utlay .B. Finsncing of the PlanI. D oirestic resources at 1979-80 rates of taxes, freights & tariffs :
1. Bahnce from current revenues . . . . . .Internal resources of public Enterprises . . . . .
(i) R a i l w a y s ..................................................................................(ii) °osts & T eleg raphs........................................................................(iii) Others . . . . . . . . . .
3. Market borrowings of Government Public Enterprises & Local Bo lies . . . . . . . . . .
4. Smill S a v i n g s .................................................................................5. S tae Provident Funds . . . . . . . .6. Term loans from financial institution . . . . .7. Misc. Capital Receipts ( n e t ) .............................................................
Totil I ...........................................................................................
II. Additional Resource Mobilisation(a) Centre : 1980-81 Measures . . . . . .(b) States : 1980-81 Measures . . . . . . T o U : 1 1 ..............................................................................................
III. Total Domestic Budgetary Resources ( I + 11)IV. External Assistance ( N e t ) ........................................V'. Loan from IM F Trust F u n d .........................................VI. Budgetary D e f i c i t ................................................... ........... .VII- Aggregate Resources . . . . . .V III. Assistance to State P l a n s ........................................ .......... .IX ■ Assistance to States for relief on account of N atural Calam ities X . Resources for the P l a n .............................................................
7695 7414 15109 7305 7718 15023
483 2028 2511 691 1971 26621770 246 2016 1411 —180 1231
212 — 212 351 — 351342 — 342 210 — 21
1216 246 1462 850 —180 6700
2500 570 3070 2579 581 3160385 367 667 409 712 1121
300 715 1100 247 344 618— 435 435 — 438 348
699 —549 150 115 —457 —4326137 3812 9949 5479 3409 8888
1018 59 1077 501 61 562— 402 402 — 364 364
1018 461 1479 501 425 926
7155 4273 11428 5980 3834 98141252 — 1252 1181 — 1181540 — 540 538 — 5381445 277@ 1722 2577 913 3490
10392 4550 14942 10276 4747 15023—2547 2864£ 317 —2971 2780 |
—150 — —150 — 191 y7695 7414 15019 7305 7718 | 1592
(a) Represents withdrawal from Reserves.£Represents actual allocation made by the Planning Commission on the basis of Plan Outlays financed in July-August,1980. ^Inclusive of Union Territories.
T a b le 9
Estimates o f Financial Resources for the Plan in the Public Sector for 1981-82(Rs. crores)
Annual Plan Estimates Actuals
Centre States Total Centre States Total
A. Plan O utlay...........................................................................................B. Financing of the p l a n .......................................................................
1. Domestic resources at 1979-80 rates of taxes, fares, freights & tariTs1. Bala ncc from current revenue . . . . . .
2. Internal Resources of Public Enterprises . . . .(i) R a i l w a y s .................................................................................
(ii) Posts & T e l e g r a p h s .............................................................(iii) Others . . . . . . . . . .
8946
3851808196409
1203
8471
2255—73
—73
17417
2 )4 J 17351964091130
9645
5 l i 1549368251930
8828 18373
2J33 25 ti I—713 836
— 368— 251
—713 217

2 2
1 2 3 4 5 6
3. M arket borrowings of Govt. Public enterprises and local bodies 2800 782 3582 2913 787 37C4. Small S a v i n g s .............................................................. 460 7 90 1250 517 882 13<5. State Provident F u n d s ......................................... 320 373 693 298 307 606. Term loans from financial institutions . . . . — 481 481 — 446 44
7. Miscellaneous Capita! Receipts (Net) . . . 1795 —405 1390 1479 —694 7STotal : I ........................................................................ 7568 4203 11771 7284 3408 1033
11. Additional Resources Mobilisation(a) Centre : 1980-81 Measures . . . . . . 1056 84 1140 1145 92 123
1981-82 Measures . . . . . . 454 — 75 379 1452 —75 137(b) States : 1980-81 Measures . . . . . . — 507 507 — 652 66.:
1981-82 Measures . . . . . . — 752 752 — 894 89Total : I I ............................................................................................. 1510 1261 2778 2597 1573 4170
III. Total. Domestic Budgetary Resources ( I +11) . . . 9078 5471 14549 9181 4621 1450IV. External Assistance (Net) . . . . . 1379 — 1379 1352 — 135:V. Loan from IM F T rust Fund . . . . . . — — _ __ _
VI. Budgetary D e f i c i t ......................................................................... 1539 — 1539 1392 1127 251VII. Aggregate R e so u r c e s ......................................... .......... 11996 5471 14457 12652 5748 is :VIII. Assistance of State Plans . . . . . . . —3000 3000 — —2918 2918 —,IX . Advance Plan assistance to States for relief against natural
calamities . . . . . . . — 50 — —50 —162 + 162 —X. Resources for the Plan . . . . 8946 8471 17417 9545 8828 18372
T a b l e 10
Estimates o f Financial Resources for the Plan in the Public Sector for 1982-83 :(Rs. in crores)
Annual p lan Estimates Latest Estimates
Ce ntre* States Total Centre* States Total
1 2 3 4 5 6 7
A. Plan O utlay.................................................................................. 11394 95401 20934 12018 9710 21728
B. Financing of the Plan
1 Domestic resources at 1979-80 rates of taxes, fares, freights & tariff s1. Balance from current r e v e n u e s ................................................... —62 1710 1648 —688 1297 6092. Internal resources of Public E n te rp r ise s ......................................... 2423 —939 1484 2731 - -1328 1403
(i) R a i l w a y s .................................................................................. 110 — 110 191 — 191(ii) Posts & T e l e g r a p h s .............................................................. 331 — 331 242 — 242
(iii) O th e r s ............................................................................................. 1982 —939 1043 2298 --1 3 2 8 2 9703. Market borrowings of Govt. Public Enterprises & Local Bodies 3200 904 4104 3800 905 4705A. Small S a v i n g s .................................................................................. 500 930 1430 450 1100 15505. State Provident F u n d s ........................................................................ 330 434 764 480 469 9496. Term Loans from financial in s t i tu t io n s ......................................... — 523 523 — 535 5357. Misc. Capital Receipts ( n e t ) ............................................................. 1479 — 408 1071 14913 — 6553 —836
Total : I ............................................................................................ 7870 3154 11024 8264 2323 10587
11. Addl. Resources Mobilisation •(a) Centre : 1980-81 M e a s u r e s .................................................... 1195 92 1287 1052 97 1149
1981-82 M e a s u r e s ................................................... 2268 — 83 2185 2095 — 81 20141982-83 Measures . . . . . . 528 54 582 813 53 866
(b) States 1980-81 Measures . . . . . . _ 796 796 — 770 7701981-82 Measures . . . . . . — 1390 1390 — 1327 13271982-83 Measures . . . . . . — 656 656 — 6S3 683
Total : 11. . . . . . . . . 3991 2905 6896 3960 2849 6809

23
[II. Toal Domestic Budgetary Resources (I—II) . . . .V. Ex«rnal Assistance ( N c O .............................................................V. Budgetary deficit . . . . . . . . .VI. Agjregate Resources ........................................................................VII. Aisistance for State Plans . . . . . . ./I I I . Advance plan assistance to States for relief against natural
cdamities . . . . . . . . .IX. Risources for the Plan . . . . . . .
1. Excudes lump sum provision of about Rs. 55 crores for REC Programmes, the State-wise break-up of which is not available.2. Inchdes the finally approved outlay of Rs. 490 crores for West Bengal against Rs. 638 crores as finalised in Annual Plan 1982-83
siors.3. Exc udes Rs. 1743 crores of loans given by the Centre to the States to clear the deficit with the RBI a ; on 31-3-1982.♦Inclnsve t.f Union T i_;nU iii'.
T able 11
Estimates o f Financial Resourcces for the Plan in the Public Sector for 1983-84
1 2 3 4 5 6
11861 6059 17920 12224 5172 173961669 _ 1669 1724 —3 17241371 — 1371 19353 673 260g14901 6059 20960 15883 5845 21728
—3407 3481 74 1Y —3865 3865
—100 _2 —100 J11394 9540 20934 12018 9710 21728
disciis-
Centre*
2
A. Plan Outlays . . . . . .B. Financing of the PlanI. Domestic Resources at 1979-80 rates o f taxes, fares, freights and tariffs
Balance front current revenues . . . . . .Internal resources of public enterprises. . . . .
(i) Railways . . . . . . . .(ii) Posts & Telegraphs . . . . . . .(iii) Others ........................................................................Market borrowings of Govt. Public Enterprises & Local Bodies.Small Savings ...................................................................................State Provident Funds . . . . . . .Term loans from financial in s titu tio n s .........................................Misc. Capital, Receipts (Net) . . . . . .
others . . . . . . . . . .
(b) States
T otal
I. Addi- Resources Mobilisation (a) Centre : 1980-81 measures
1981-82 measures1982-83 measures1983-84 measures1980-81 measures1981-82 measures1982-83 measures1983-84 measures
T o t a l —II .|II . Total Domestic Budgetary Resources (I- tv . External Assistance (Net) . . . . . .V. Deficit Financing . . . . . . . .Vi. Aggregate Resources . . . . . . .VII. Assistance to the State Plans . . . . . .VIII. Assistance to States for relief on account of natural calamitiesIX. Resources for the Plan . . . . . . .
LTI)
♦Inclusive of Union Tevritories. ♦♦Adjustment of 1982-83 Deficit of Two States.
14351
-16483710—56
23835284000
600330
2111
9103
100020031667953
562314726
19401586
18252—3841
—6014351
States
3
11130
1723-1537
-153711091100481575
—521_29**
2901
112—86
11797
8581482
978830
43887289
72893841
11130
(Rs. crores)
Annual Plan Estimates
Total
4
25481
752173—56238199151091700811575
1590—2912004
1112191717841050858
1482978830
10011
2201519401586
25541
—6025481

24
T a b le 12
Balances o f Payments— 1980-83
(Rs. crores at currenit prices
1979-80 1980-81 1981-82 1982-83
Preliminary Estimates
(1) (2) (3) (4) (5)
Exports f.o.b.1 ................................................... 6418 6711 7606 800'(6331) (6826) (66S9
Im ports c.i.f.1 9143 12560 13442 1375'(10790) (10465) (10440
Trade Balance .................................................... -2725 -5 8 4 9 -5 8 3 6 -5 7 5(-4 4 5 9 ) (-3 8 1 1 ) (-3751
Invisibles, net* . 2151 3718 2586 245ialarace on current account ............................................................ -5 7 4 -2 1 3 1 -3250 —330'Memo items1. Beginning year reserves3 ............................................................ 5220 5164 4822 33;2. Beginning year reserves as months of import equivalent 6.9 4 .9 4.3 2 ,
1. Excluding crude oil exports and POL imports under balancing arrangements in 1981-82 and 1982-83.
2. Including adjustm ent in 1979 -80 and 1980-81 for the difference between customs and balance of payments trade data.
3. Exclude valuation changes in 1979-80 and 1980-81.Figures in brackets are estimates at constant prices (1979-80).
T able 13
Sectoral Employment in 1979-80 and 1984-85
(In million Standard Person Yean
5r. Sector No.
1979-80 1984-85(SixthPlan)
1981-82 Addition in Sixth Plan)
Achievementupto
1981-82
Addition ii the Sixth
Plan (Revised)
1 2 3 4 5 6 7 8
1. A g r ic u l tu r e ^ .................................................... 80.331 95.251 85.292 14.920 4.961 14.151
2. M ining & Quarrying 0.724 0.894 0.773 0.170 0.049 0.271
3. M a n u f a c t u r i n g .......................................... 22.012 27.759 23.209 5.747 1.297 5.54!
4. C o n s t r u c t io n .................................................... 9.286 11.321 9.764 2.035 0.478 0.971
5. Electricity, Gas & Water Supply 0.723 0.927 0.779 0.204 0.056 0.36!
6. R ailw ays............................................................... 1.662 1.704 1.675 0.042 0.013 0.18:
7. Other T r a n s p o r t .......................................... 7.109 8.677 7.995 1.568 0.886 1.04'
8. C o m m u n ic a t io n s .......................................... 0.800 0.917 0.848 0.117 0.048 0.18*
9. Others* ♦ .............................................................. 28.463 37.939 32.621 9.476 4.158 9.711
T otal . . . . . . 151.110 185.389 162.956 34.279 11.846 32.441
♦Including forestry, logging and fishing.♦♦Include Trade, storage and warehousing, banking and insurance, real estate and ownership of dwellings, other services and empl;
ment generation in IR D P and NREP.
8 PC/83—5
PART II
25-. 26
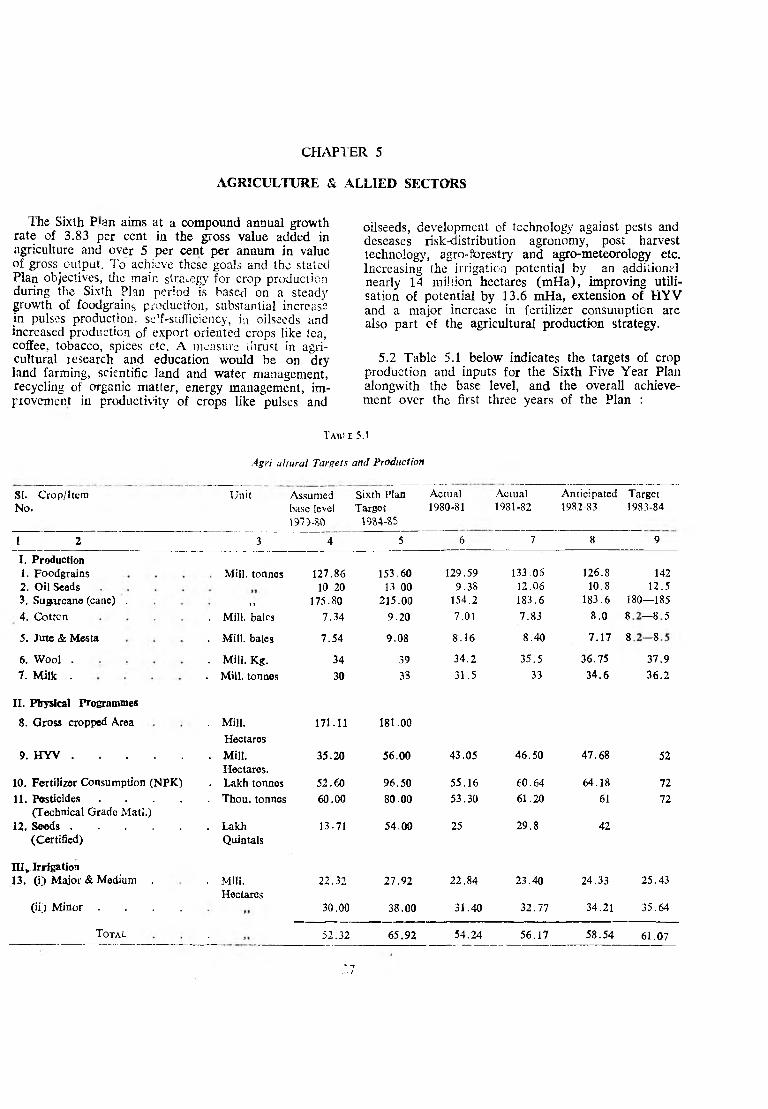
CHAPTER 5
AGRICULTURE & ALLIED SECTORS
The Sixth P'an aims at a compound annual growth rate of 3.83 per cent in the gross value added in agriculture and over 5 per cent per annum in valueof gross output. To achieve these goals and the stated Plan objectives, the main strategy for crop production during the Sixth Plan period is based on a steady growth of foodgrains production, substantial increase in pulses production, se’.f-sufficiency, in oilseeds and increased production of export oriented crops like tea, coffee, tobacco, spices etc. A measure thrust in agricultural research and education would be on dry land farming, scientific land and water management, recycling of organic matter, energy management, improvement in productivity of crops like pulses and
oilseeds, development of technology against pests and deseases risk-distribution agronomy, post harvest technolog}', agro-forestry and agro-meteorology etc. Increasing the irrigation potential by an additional nearly 14 million hectares (mHa), improving utilisation of potential by 13.6 mHa, extension of HYV and a major increase in fertilizer consumption are also part of the agricultural production strategy.
5.2 Table 5.1 below indicates the targets of crop production and inputs for the Sixth Five Year Plan alongwith the base level, and the overall achievement over the first three years of the Plan :
T able 5.1
Agri ultural Targets and Production
SI. Crop/Item No.
Unit Assumed base level 1975-S&
Sixth Plan Target
1934-85
Actual1980-81
Actual1981-82
Anticipated1982-83
Target1983-84
1 2 3 4 5 6 7 8 9
I. Production1. Foodgrains Mill, tonnes 127.86 153.60 129.59 133.06 126.8 1422. Oil Seeds 10.20 13.00 9.38 12.06 10.8 12.53. Sugarcane (cane) . >> 175.80 215.00 154.2 183.6 183.6 180—1854. Cotton . Mill, bales 7.34 9.20 7.01 7.83 8.0
IA001OO
5. Jute & Mesta . Mill, bales 7.54 9.08 8.16 8.40 7.17
OO1OO
6. W ool . . Mili. Kg. 34 39 34.2 35.5 36.75 37.97. M ilk . . Mill, tonnes 30 38 31.5 33 34.6 36.2
II. Physical Programmes8. Gross cropped Area
9. HYV . . . . .
. Mill.Hectares
. Mill.
171.11
35.20
181.00
56.00 43.05 46.50 47.68 52
10. Fertilizer Consumption (NPK)Hectares.
. Lakh tonnes 52.60 96.50 55.16 60.64 64.18 7211. Pesticides . . . . . Thou, tonnes 60.00 80.00 53.30 61.20 61 72
(Technical Grade Matl.)12. S e e d s .........................................
(Certified). Lakh
Quintals13-71 54.00 25 29.8 42
HI*. Irrigation13. (i> M ajor & Medium . . Mill. 22.32 27.92 22.84 23.40 24.33 25.43
(ii;) M inor . . . .Hectares
30.00 38.00 31.40 32.77 34.21 35 .64
T o t a l • 52.32 65.92 54.24 56.17 58.54 61. 07
27

28
5.3 The Sixth Plan outlays* (Central as well as culture and Allied Sectors and the actualsjantiicipatid States and Union Territories) by sub-scctors on Agri- expenditure are giver, below’ ir. Table 5.2.
T a b le 5.2
Financial Outlays
(Rs. in icrorosi
Hoad of DevelopmentSixth Plan Outlay
1980-81Actuals
1931-82Actuals
1982-83R.E.
1983-84Outlay
19>80—84 T otal
(Co.l. 3-r 4 + '5 + 6 )
1 2 3 4 5 6 n
Agricultural Research & Education . 537.67 64.20 72.85 84.37 101.62 323.04Crop Husbandry . . . . . . . 1233.08 183.25 227.72 2S4.36 347.36 1(042.69Soil & Water Conservation . . . . . 433.5 7 75.09 96.28 95.30 126.23 .-392.90Animal Husbandry & Dairying . . . . 851 . 33 133.31 143.94 175.90 187.27 (640.42Fisheries . . . . . . . . 371.42 48.86 48.05 52.62 6 6 .7J .'216.2-;F o r e s t r y .............................................................. 692.64 96.25 118.97 142.45 187.80 5’45 .47La,nd Reforms . . . . . . . 304.63 44.62 52.88 56.67 63.69 217.86Management of N atural Disasters . . . . 15.00 — — — -Agricultural Marketing . . . . . . 96.11 17.26 17.30 17.OS 13.99 65.63Food Storage & Warehousing . . . . 337.61 47.93 41.82 44.63 51.77 186.15Investment in Agricultural Financial Institutions 821.06 270.77 309.62 295.41 251.29 1127.09
T otal : ............................................. 5695.07 981.54 1129.43 1248.79 1397.73 4757.49
Review of Agricultural Performance5.4 That there has been marked progress in Indian
agriculture since 1950s is a fact now universally accepted. Production of rice increased from 23.54 mill inn tonnes to 53.59 million tonnes between 1949- 50 and 1981-82 and that of foodgrains by 2.4 times from 54.92 million tonnes to 133.06 million tonnes. Increase in wheat production was much more spectacular, being nearly six times over 1949-50. Cash crops too recorded significant gains, particularly cotton and sugarcane.
5.5 The upsurge in agriculture "was punctuated by frequent upsets, brought about mainly by the truant weather. As agricultural production climbed to newer and newer heights, supported by a series of measures like iirigation development, supply of seed, fertilizers and credit, extension and research support and similar programmes organised by the Centre and the State Governments, the country also witnessed shortfalls brought about by exogenous forces like widespread failures of the monsoon (sometimes in successive years), devastating cyclones and floods, and untimely hailstorms and rain which destroyed crops ready for harvesting. Nevertheless, the fact remains that the new peak reached has been invariably higher than the preceding one and the latest trough to which production has been foced down has always been higher than the previous one. This is a more reliable measure of the new strength acquired by the agriculture sector
and the resilience gained by it since the country chose the path of planned development. Table 5.3 below gives an illustration of the big leaps made in foodgrains production, from peak to peak, and the rate of increase registered at every stage:
T able 5.3
Pe ik Production o f Foodgrains
Peak year Peak Year production (M illion Tonnes)
Average annual increase
(Million tonnes
per year)
1 2 3
1953-54 . 69.82 —,1961-62 . 82.71 1.611970-71 . 108.42 2.861978-79 . 131.90 2.94
5.6 Performance of all crops during the last three decades, however, has not been similar. A brief review of crop production targets set for different FiVe Yeai Plans and relative achievements (Annexure 5.1) car facilitate a better appreciation of the agricultural scenario.
5.7 Table 5.4 below gives the annual average rate of growth of major crops during 1949-50 to 1980-81for the country as a whole.

Crop Production ( Triennial Average ) and Growth Rates
29
Ta ble 5 .4
Crop Unit 1949-50to
1951-52
1978-79to
1980-81
Annual Growth Rate
(Per cent)*
1 2 3 4 5
R i c e ................................................... Mill, tonnes 21.80 49.78 2.9
Jowar . . . . . . • » » 5.82 11.20 2.3
Bajra . . . . . . . . f t 2.59 4.98 2.3
Maize . . . . . . »> 1.95 6.20 4.1
Wheat . . . . . . M 6.34 34.60 6.0
Other Cereals • 5.75 6.42 0.4
Total Cereals • 44.25 113.18 3.3
Pulses f t 8.33 10.64 0.8
Total Foodgrains 52 .5S 123.s : 3 .0
Cotton . . . . Mill, bales(of 170 kgs. each)
3.02 7.63 3.4
Jute Mill, bales(of 180 kgs. each)
3.71 6.35 : .o
Sugarcanc . . . .
Oilseeds
. Mill, fonnci of cane
56,29 143.67 3.3
Groundnut . . . . Mill, tonnes 3.37 5.66 1.8
Rape/Mustard ■ 0.84 1.84 2.8
Sesamum . . . . ■ 0.45 0.43 ( - )0 .1
Major oilseeds (5 oilseeds)
5.14 8.58 1.8
‘ Growth rates are worked out on the basis o f triennial averages of production for 1949-50 to 1951-52 and 1978-79 to 1980-81.
The laggards are easily identified as millet crops, mainly jowar, bajra and small millets and pulses among focdgrains, groundnut and sesamum among oilseeds and jute, Major growing aro?s of theS'' crops other than jute are broadly the same. By and large, these areas arc situated in the rain-shadow belt of the country stretching from Tamil Nadu in the South to Haryana in the North, and also extending through Madhya Pradesh and parts of U ttar Pradesh and A ndhra Pradesh to reach no to Bihar and OrisSa. These areas generally receive comparatively inadequate & rainfall, and this itself is marked lay a wide
degree of variability and uncertainty. Anv improvement in the performance of these crops will lead not only to higher production and availability, but also to an overall improvement in the agricultural performance by the States growing these crops in a sizeable manner.
5.8 The petfoimance of the States in regard to agricultural production to a large extent could be explained in terms of certain important inputs like irrigation, fertilier application, area under high yielding yarieties and multiple croping. credit avail-

ability etc. The availability position regarding these irrupts is indicated State-wise in the table 5.5 IbelowT a b l e 5.5
Availability!Use o f inputes— Statewise
State Percentage of gross irrigated areato gross sown area (1978-79)
Percentage of area under HYV to gross
sown area (1978-79)
Per hectare consumption of
fertilizers (1981-82)(Kg.(/ha)
Institutional credit p/ha
of gca. (1978-79) (Rs.)
Average: yield of foodlgrains
per ha. (Tonne/lna) (1981-821)
1 2 3 4 5 6
Andhra Pradesh 35.8 24.8 50.0 7.29 1.2-1Assam 17.3 19.7 3.3 4 .0 0.97Bihar 32.6 27.8 18.0 21.8 0.87Gujarat 18.6 18.7 38.6 146.0 1.07Haryana 53.9 36.1 45.5 177.9 1.39Himachal Pradesh 16.7 42.9 19.5 2.5 1.24Jammu & Kathmir . 40.9 42.9 21.8 27.9 1.53K arnataka 15.4 15.3 34.4 71.1 0.98Kerala 12.3 9.7 32.9 481.5 1.54Madhya Ptadesh 11.1 13.5 10.9 47.0 0.72M aharashtra 11.6 19.4 26.6 81.3 0.74Orissa 19.2 11.7 9 .9 23.5 0.91Punjab 83.0 56.3 123.7 184.2 2.67Rajasthan 19.6 8.4 7 .9 41.0 0.55Tamil Nadu 49.7 35.6 66.7 159.4 1.52U ttar Pradesh 43.5 33.8 52.2 74.0 1.19West Bengal 19.6 26.3 32.8 81.3 1.07All-lndiJ . 27.5 22.9 34.6 83.1 1.03
In Assam, Bihar, West Bengal, M adhya Pradesh, M aharashtra, Rajasthan, K arnataka and Kerala, availability/'use of the four in puts was generally in the lower side, much below the national average level.
Sixth Plan— Crop Targets and Achievement's
5.9 Keeping in view the past trends, the Sixth Planhas set a target of 149— 154 million tonnes of toccl- grains which implies an annual increase of 2.6 per
cent per annum over the achievement of 131.90 million tonnes of 1978-79. Table 5.6 gives details of the targets set and achievement in the Sixth Plan and the constituent Annual Plans.
Table 5.6Targets Under the S ix th Plan!Annual Plans
Rice Wherft Millets Pulses
(Million Tonnes)
TotalFood-grains
1Sixth Plan (Target)
Annual Plan 1980-31Target . Achievement
Annual Plan 1981-82Target . Achievement
Annual Plan 1982-83 Target*Anticipated Ach.
Annual Plan 1983-84T a rg e t .
63.00
55.0053.63
58.0053.59
58.0045.80
?.00
44.00
36.0036.31
38.0037.83
39.0041.60
41.00
32.10
30.0029.02
30.0030.29
31.0027.50
31.00
14.50
14.0010.63
12.5011.35
13.5011.90
13.00
153.6(154.0)
135.0129.59
138.50133.06
141.50126.80
142.00
*1982-83 Annual Plan targets arc indicated in ranges—upper limits are indicated.
31
5.10 Among difierent crops only wheat has been keeping pace with the Plan targets. Production of rice, though it came close to the target of 55 million tonnes in 1980-81, did not show any improvement in 1981-82. In 1982-83 however the kharif crop suffered a severe setback as a result of drought condition in many parts of the country. Pulses production, as in the past, continued to la^ behind. The lag. vis-a-vis, the Sixth Plan targets, has been as much as 22 per cent in the case of pulses and 14 per cent in the case of rice, which nc.ds to be made up in the two years1983-84 and 1984-85 if the Sixth Plan targets are
to be realised. Though millet production during the first two years of the Plan has been moving close to the targets, it need to be admitted that these were pitched rather low.
5.11 Thus the focus falls on the pulse-millet conglomeration, w;:h rice on the side lines. Any significant improvement in agriculture at the national level will be possible only if the performance of millets and and pulses is improved and if rice cultivation in the eastern legicii, including Madhya Pradesh and eastern Uttar Pradesh, is assisted to give a better account. Similar measures in respect of wheat in Madhya Pradesh could also yield good results.Inputs and other Supporting Programme*
5.12 Efforts being made for extending irrigation facilities, promoting use cf high yielding varieties ar.d fertilizers and making available credit for agricultural purposes are discussed in this part. Weather continues to play a dominant role in agriculture, particularly in States where agricultural operations are carried out mainly under rainfed conditions. Institutional factors like tenancy, size and state of agricultural holdings too have a bearing on agricultural production. These factors are also discussed in this part.Weather
5.13 Agriculture in India is dependent on weather and rainfall conditions. Out of the total net sown area of 143 million hectares, nearly 105 million hectares continue to be rainfed despite the continuous efforts made to increase irrigation. Weather condition* in terms of mi in turn and timeliness of rainfall received were more favourable in recent vears, in 1978-79 and 1981-82. enabling farmers to make better use of infrastructure and inputs and reap a bountiful harvest. Foodgrains production in these two years was estimated at 131.9 million tonnes and 133.1 million tonnes respectively. On the other hand, production of foodgrains sustained a fall of 22.2 million tonnes in 1979-80 when the countrv suffered a revere drought Adverse weather including drought, cyclones and Roods affected agricultural production during 1982-83 and. as a result, agricultural production had been lower as compared to 1981-82,
5.14 Even so, the year 1982-83 could be considered as marking turning point in Tndian agriculture for a vew valid reason. For the first time in Indian agriculture, the new production technology hi-v'ed on modern inputs and a well co-ordinated approach could stand the challenge of natural calami- t ’es a^d ••m°riTe from it wi'h comparative1? 1ecs damage. The shortfall in production of foodgrains dur
ing the current year compared to the preceding year is expected to be only about 5 per cent or 6.20 m illbn tonnes, as against a drop of 16.8 per cent or 22.2 million tonnes in 1979-80. This can be taken as a fair measure of the inherent strength and the much desired resilience developed by Indian agriculture in recent years.Socio-Instifutioual Factors
5.15 About half of the population in rural areas lives below the poverty line. A Inajor part of the assets in rural areas are concentrated in a few hands. For example, in 1971 the top 30 per cent of the rural population claimed nearly 82 per cent of the total assets, and within this group the first 10 per cent monopolised as much as 51 per cent of the total assets. On the other hand, the lowest 10 per cent possessed a mere 0.1 per cent of the assets and the lower 30 per cent had to be content with 2 per cent share. Similarly, in regard to distribution of agricultural holdings, the small and marginal farmers, who constituted over 70 per cent of the land holders, operated barely 24 per cent of the agricultural land. The average size of operational holding in the country shrank to 2 hectares in 1976-77 as compared to 2.28 hectares in 1970-71, which is indicative of the continuous pressure being exerted on limited land resources by a steadily growing population. The average size of operational holding is less than 2 hectares in a number of States, e.g., Assam, Bihar, West Bengal, Orissa, U ttar Pradesh, Tamil Nadu and Kerala. Besides th ; agricultural holdings are also badly subdivided and fragmented) in many of the States. Further consideration of holdings has not yet been undertaken in most of the States except Haryana, Punjab and U ttar Pradesh. According to the National Commission on Agriculture, the extent of area under tenancy is significantly higher in wet areas (including irrigated areas) than in dry areas. The mal-distribution of physical and financial assets and the incidence - of tenancy exert an inhibiting influence on production efforts in the affected areas.
Irrigation5.16 W ater is one of the primary' inpHits for success
ful agriculture. However, even to this day, about 73 per cent of the country’s cropped area is entirely dependent on the various vagaries of rainfall, most of which is concentrated in a few months of the year. The rainfall in many parts of the country is very low and uncertain in its distribution and it does not induce the farmer to provide the necessary inputs in time and in adequate quantities. Even where the overall annual precipitation is sufficiently high, the available moisture in the winter and summer months is not adequate to support multiple cropping. The broad strategy is, therefore, to develop irrigation rapidly, extending it to as large an area as possible, particularly in drought prone and backward areas. The most efficient and expeditious use of the existing facilities is another important element in this strategy.
5.17 The land area that can be ultimately irrigated on full development of irrigation potential has been estimated at 113.5 million hectares as against the possible gross cropped area of 200 million hectares.
32
Thus, on present assessment, it may not be possible to provide irrigation facilities to the entire cultivated area in the country.
5.18 Prior to 1951, the total irrigated area in the country was 22.6 million hectares (9.7 million hectares from major and medium irrigation prijects and12.9 million hectares from minor irrigation schemes). The extent of the area irrigated more than doubled during the following three decades and increased to 52.32' million hectares by 1979-80, out of which22.32 million hectares were from major and medium and 30.00 million hectares from minor schemes.
5.19 The Sixth Plan has set a target of additional irrigation of 5.6 million hectares from major and medium and 8 million hectares from minor schemes, i.e. a total of 13.6 million hectares by 1984-85. Under the 20-Point Programme, the target was raised to 14 million hectares. The anticipated achievement in the first three years of the Sixth Plan is 6.22 million hectares. The likely achievement during the Sixth Plan, according to the present assessment would be of the order of 11.5 million to 12 million hectares against a target of 14 million hectares. The main reasons for shortfall in the achievement of targets have been discussed in the chapter on ‘Irrigation and Flood Control’.
Dryland Far mini?,
5.20 R a infed | dryland agriculture is practised overnearly 105 million hectares out of the net cultivated area of about 143 million hectares in the country. Dryland areas account for about 73 per cent of the cultivated area and contribute about 42 per cent of the foodgranis produced in the country. The bulk of the pulses, oilseeds, millets, coarse grains and cash crops like cotton and groundnuts are produced under ramfed conditions. Performance of crops in the vast dryland , is closcly linked with weather conditions. Any significant shortfall in rainfall affects production and any shortfall in production on drylands is immediately reflected in the c\era!'i av'MahUiU cf foodgrains in the country.
5.21 Agricultural development efforts in the initial stages of the post-Independence period were largely concentrated in irrigated areas, capable of yielding quick and assured results. In view of the vital role of dryland farming in narrowing down the regional imbalances between the irrigated and rainfed regions and in creating rV’ral employment, the development of dryland agriculture is now assuming increasing inportance. The programme of dryland fanning has been included in the New 20— point Programme. The two-pronged strategy evolved for dryland agriculture is as follows’:—
(i) In ten s ive A p p ro a c h : Under this, in selected blocks, one rn.icrorwatershcc^ of about 1000 Vri. rrjc1! ' ', ’11 taker* ” 0 for in^ei’sec development of dryland agriculture thronch a !t!u!fi-d’scit)l:nan- anproach including cron production, horticulture. sociM forest rv, pasture development, water harvesting pest con
trol, use of modern implements like; sec-i cum-fertilizcr drills, application of lmiprovtd seeds, fertilizer, etc. Multi-disciiplinarv teams are to be constituted for each watershed.
(ii) Extensive Approach : Covers all dryland areas wfcere all the on-going programmes and tesources will be utilised op«imal3v and the ?vnilable tedinolo?’:*. dis*?rvr"J 1 for increasing production of dryland agriculture by extension, introduction o f new cropping pattern, use of fertilizers, new agricultural implements, etc.
5.22 A total number of 3824 micro-wat<ersheds covering 3.8 million hectares were to be identified by various States during 1982-83 for development of Dryland Farming. For the first time, a comprelhensivc Field Manual on Dryland Fanning, giving location* specific strategies and technologies, has been prepared in close collaboration with the Indian Council of Agricultural Research and copies were distributed to the State Governments and others concerned for the guidance of field workers and farmers.
5.23 Development of dryland agriculture has been receiving special attention in all the States after its inclusion in the 20 Point Programme. Organisational arrangements at various levels from the State H eadquarters to field level have been made for monitoring and overseeing development activities in rainfed areas. Inter-Departmental Coordination Committees have also been set up in the States.
5.24 The States, for the first time, are going ahead in a planned manner, with the identification of micro-watersheds and introduction of suitable dry farming techniques both in and outside the watersheds, According to the latest available reports upto March, 1983, the number of selected micro-watersheds has gone up to 4111 as against the national target of 3824 watersheds. The total area covered fcy various dry farming practices is estimated at 20.17 million hectares ( 2.72 million hectares in the selected watersheds and 17.45 million hectares outside the watersheds) .
5.25 Development of micro-watersheds is a longterm programme and needs to be viewed in a three year time frame. During the first year, the watershed is identified and benchmark surveys are conducted. In the second year, various land and water development measures are planned and executed. Tn the third year, the production technology is superimposed on the reinforced land and water resources. State G overnments are being urged to continue the process of identification and development of watersheds in dryland areas so that the targets set under it during (he Sixth Plan are fully achieved. More than 2760 v’lluges ha\te been adopted for intensive agricultural development work in the dryland areas. These villages are intended to serve as examples or models for popularisation of dryland farming technologies in the neighbouring areas.

C h cm ica l F ertilize rs
5.26 Chemical fertilizer has a prominent role to play in modern agriculture. In 1951-52 i.e. at the beginning of the first Five Year Plan consumption of fertilisers was a bare 65.6 thousand tonnes, nearly 90 per cent of it in the form of nitrogenous fertilizers. There has been significant increase in fertilizer consumption since then, thanks to the concerted efforts made by the Centre and the States. To popular! e the use of fertilisers among farmers, field trials, composite demonstrations and education through the mass media were introduced. Increased use of fertilizer was an important element of the strategic programmes such as the National Extension Service, Intensive
Agricultural Development Programme (IA D P) and Intensive Agricultural Area Programme (1AAP)1'lunched in the fifties and the early sixties. However, a real break-through in the use of fertiliser came only in the late 1960s with the introduction of dwarf,— high yielding varieties of wheat and rice which required large doses of fertilizer, compared with traditional varieties to give better results. As a result, there was achieved a nearly four-fold increase in fertilizer use since 1965-66.
5.27 The Sixth Plan had set a target of 96.5 lakh tonnes of NPK Table 5.7 below indicates the progress of fertiliser use in terms of NPK during the period 1970-71 to 1982-83:
T\I!L£ 5.7
I.eve! o f Fertiliser Consumption in India
Year Consumption of Fertiliser
N P(in lakh tonnes)
3
5.28 There is signficant variation in fertilizer consumption from region to region and from State to State. Table 5.8 gives State-wise consumption of plant nutrients per unit of gross cropped area for 1980-81 and 1981-82:
195
T abie 5.8Fertilizer consumption per hectare o f cropped area—Statc-
(Total N P K nutrien's in Kgs/heci
1 ''...... 2
Zone/State 19S0-S1Central : . . . 24. 1M adhya Pradesh 9-2Rajasthan . . . 8 .0U t ta r Pradesh 49 4! as! : I 8 1Assam . . . . 2.SBihar . 17.8Orissa . . . . 9.6West Bens >! . 3'" 9North : . . . 74.6II rv . . . 42 .5
wiseare)“ 3
81-82 26.0 10. 9 7.9
5 \ 2 17 6
‘8.0 O Q3 2. 8 79.0 45.5
1PunjabSouth : Andhra P;- K arnataka Kerala . Tamil Nadu West : G ujarat . Maharashtra
All-India
■sh
Percent growth over the previous
year
6
1970-71 14.8 5.4 2.4 22.613.817.7
1971-72 . 1S.0 5.6 3.0 26.6 4.11972-73 ............................................. 18.4 * .3 ' 5 2 .51973-74 ............................................. 18.3 6.5 3.6 28.4 4 .21974-75 . . . . 17.7 4 .7 3.4 25.8 (—)9 ■ 21975-76 ............................................. 21.5 4 .7 2.8 29.0 12.41976-77 ............................................. 24.6 6.3 3.2 34.1 17.6
1977-78 . . . . 29.1 8.7 5.1 42.9 25. S1978-79 ............................................. 34.2 l t . l 5.9 51.2 19.41979-80 ............................................. 34.9 11.5 6.1 52.6 2.71 9 8 0 - 8 1 ............................................. 36.8 12.1 6.2 55.2 4 .91981-82 ............................................. 40.7 13.2 6.7 60.6 9 .819S2-83 . . . 42.6 <4.2 7.4 fit. 2 5 .8
(Anticipated)
117 9 14 3
45.931.133.463.2 25.734.421.2
31 9
1 ’3. 7 47 6 50.0 34.4 32.966 .730.838.626.6
34 6
5.29 With a view to minimising the regional imbalance in the fertilizer use, an intensive promotional campaign by mobilising the efforts of SJate Governments and fertilizer manufacturers has been launched in 100 selected districts. The campaign covers those districts which have gocd irrigation potential but are low in fertilizer consumption.
In this campaign, preference has been given to districts ‘having assured rainfall for developina agricul-
8 P C '83—fi

tural production based on available technological package. For each district, a lead manufacturer has been designated, and State Governments have been advised to ensure a higher rate of growth in collaboia- tion with the manufacturers. Besides, the Hindustan Fertilizer Corporation Limited with the assistance of the UK Government has initiated a special fertilizer promotion programme in 25 selected districts in the States of Orissa, West Bengal, Assam, Bihar Madhya Pradesh and U ttar Prade h which were found to have a low growth rate in rice production. This programme aims at increasig fertilizer consumption, promoting its balanced and scientific use, and establishing fertilizer storage network in the interior to ensure timely and adequate availability.
Iligh Yielding Varieties Programme
5.30 Appearance of the high yielding varieties on the agricultural scene since the mid 1960’s represents a technological break-through in agriculture. By 1981- 82 an area of 46.5 million hectares was brought under high yielding varieties. The new varieties have made a significant impact on crop production, particularly in areas with assured irrigation, as for example, wheat and rice in the States of Punjab, Haryana and Western part of U ttar Prdesh. Some of the problems pertaining to seeds which require attention are :
(a) A number of plant diseases like blast and bacterial leaf blight and pests like brown plant hopper have become common phenomena retarding progress. Suitable disease resistant varieties need be evolved.
(b) The replacement oE seeds of high yielding varieties is necessary after evfery three to four years in order to maintain high levels of productivity. To achieve this objective, it is necessary to step up the production o f certified seeds and make systematic arrangements for their distribution.
(c) In. the case of coarse cereals, the coverage under high yielding varieties is very small. Presumably, varieties suited to different agro-climatic and soil complexes are not yet a\*ailable to farmers for replacing the traditional varieties.
Minikits and other Programmes
5.31 To supplement the efforts of the State Governments for raising agricultural production, work on various Centrally sponsored and Central sector schemes has been intensified in the Sixth Plan. These programmes mainly, include distribution of minikit* for oaddv, wheat, millets, pulses and oilseeds establishment of community nurseries for rice, assistance for promotion of breeded seed of p-:K-. - and oilseeds, intensive development programmes for oilseeds, pulses, cotton and iut-?. and development of red oil palm. Besides, special projects for groundnut, in Gujarat and for soyabean in Madhya Pradesh have Veen taken up m further support of the oiFoed--
development programme. The Central outlay for thcs programmes has been increased.
5.32 For introducing new varieties, two Central schemes are in operation, viz., establishment of com munity nurseries of rice and the programme of' dK tribution of minikits of various crops. Under the Minikit Programme, newly released pre-released varieties are being given to farmers in larger numbers. In view of the Various measures taken as part c>f the Action Plan for the Productivity Year 1982, the Central sector scheme of community nurseries o>f rice and minikit distribution of rice, wheat, jowar, bajra. maize and ragi, etc. were intensified in order to create a visible impact on production of cereal crops. The physical target of coverage of area under the community nurseries of rice was raised from about 15,000 hectares in 1981-82 to 25,000 hectares in1982-83; the actual achievement in respect of which is expected to be higher. Similarly, the programme of distribution of minikits was considerable expanded as per details given in Table 5.9:
T abi.f 5.9
Distribution o f M iiiikif;
(in lakhs)
Crop 198! -S:2 1982-83
Target Ant . ach.
1 3 4
Rice . 2 .77 12.00 12.00Wheat 0.14 0.26 1 .42Millets 0.23 2.00 2 .0 0
T otal 3.14 14.26 15.42
5.33 Wheat is the main crop which is erowiduring the rabi season. It may be observed ~ thaagainst the distribution of 14,000 minikits durin;1981-82, about 1.42 lakh minikits were distributed during 1982-83. The varieties distributed in the programme this vear are : HD-2285. WH-291. HUW-55. WH-147, DWI-5023. HD-2177, Rai-148. WL-1562, HUW-37 and HD-2185. These are the varieties which are recommended for different agro-climatic and soil fertility conditions. The objective is to replace the most prevalent varieties like Sonalika and Kalyan Sona.
Agricultural Research & Education
5.34 One of the important projects being implemented is the National Agricultural Research Project (NARP). The regional imbalance in the research efforts in different States is being remedied under this project. Several sub-projects received by the ICAR from Agricultural Universities are sanctioned from time to time by a committee constituted for the purpose. A review of the working of this project lias shown that some of the States like Rajasthan Maharash'ra. Orissa. Uttar Pradesh and West Bengal are behind schedule. Follow up action has been initiated.

5.35 ICAR is the mam executing and coordinating agency for research and education activities under the Central sector and tkose activities in the State sector which are financed through the Central Plan, i.e. All India Coordinated Research Projects, National Agricultural Research Project (NARP), Agricultural Universities’ Development etc. There is need for bringing about better coordination in these activities under the Central and State Sectors. The ICAR should undertake effective steps to ensure proper coordination of research and education activities in the State sector and also for linking research activities with the development plans.
Agricultural Marketing and Rural Godowns5.36 Agricultural marketing and storage are impor
tant components of post-harvest operations. In the case of agricultural marketing, Central assistance is given for development of intVastructurai facilities in selected regulated markets and in agricultural markets in rural and backward areas. In 1982-83, 40 selected regulated markets and 2 terminal markets were provided assistance, besides 350 primary rural markets and 20 wholesale markets in backward areas. For1983-84, a target of assisting 20 regulated markets,1 terminal market, 140 primary rural markets and 10 wholesale markets in backward areas lias been fixed.
5.37 In order to create a network of godowns in rural areas for taking care of storage requirements of producers at the farm level, a Centrally sponsored scheme of National Grid of Rural Godowns was taken up in 1979-80. Since then, 2371 godowns having a storage capacity of 10.65 lakh tonnes were sanctioned upto 1981-82. In 1982-83, the target of additional 4 lakh tonnes capacity was expected to have been achieved. During 1983-84, a provision of Rs. 5 crores has been made for this scheme to build a further storage capacity of 4 lakh tonnes.
Crop Insurance5.38 A pilot scheme of Crop Insurance was taken
up from 1979 onwards in the States of West Bengal, Gujarat and Tamil Nadu. A provision of Rs. 20 crores has been made under the Central sector in the Sixth Plan, with the intention to extend the coverage of the Crop Insurance Scheme to some more States during the Plan period. Though a large number of States have since introduced it, the progress has been unsatisfactory. The main reason for the slow progress is reported to be that the General Insurance Corporation, which is implementing this scheme, is not adequately equipped in terms of staff and other organisational matters. In consequence, there is likely to be a big shortfall in the Plan allocation of Rs. 20 crores for this purpose. Steps are proposed to be taken to put the scheme on a firm basis by making alternative organisational arrangements, and strengthening of data base.for adopting a more homogeneous unit of the insurance.
Agricultural Credit
5.39 Since the inception of planning, continuous efforts have been made by Government for expanding the supply of institutional credit for agriculture. The
principal institutional agency is the network of cooperatives, but in recent years commercial banks and regional rural banks have also started playing an increasing role. As on 30th June, 1981, there were 27 State Cooperative Banks, 337 Central Cooperative Banks and 94,019 Primary Agricultural Credit Societies functioning in the country.
5.40 Cooperative Land Development Banks arc playing an important part in providing long-term credit. At the end of June, 1981, there were 19 State Land Development Banks with 1731 Primary Land Development Banks|Branches functioning in the country. The Commercial Banks had 17,658 rural branches and 8370 semi-urban branches on the same date.
5.41 I able 5.10 below- gives the progress of short, medium and long term credit advanced by cooperatives and commercial banks :
T a b l e 5 . i n
Credit A dva n ced to A g r ic u ltu n m(Rs. in crores)
1960-61 1971-72 1980-81 1981-82 (Provi- (Pro- sional) visional)
1 2 4 5
Shon-ttim :(i) Cooperatives 1 S.' 541 1385 1525
(ii) CommercialBanks . N.A. N.A. 575 N.A.
.Medium/Long Term(i) Cooperatives 31 204 643 729
(ii) CommercialBanks . N.A. 15* 700 N.A.
‘"Loans routed through schemes financed by ARDC andAFC.
On the 12th July, 1982, the National Bank for Agriculture and Rural Development (NABARD) was set up. It would help to bring short-term credit and investment credit under one umbrella.
5.42 An important aspect of credit policy is to iemove regional imbalances in the provision of institutional credit. Another important problem that needs immediate attention is to improve the recovery of loans and rehabilitation of Land Development Banks carrying a heavy burden of overdues.
Prospects of achieving Foodgrains Production Targets5.43 The rice production target of 63 million
tonnes is considered a little too ambitious in the light of past trends. The upsurge in rice production in recent years has been mainly confined to the wheat production heartland, namely, Punjab, Haryana and Western U ttar Pradesh. The new crop varieties are making some headway in the traditional rice growing areas. The State Governments are also assisting rice production programmes through various supporting schemes. Despite these efforts, the Plan target of rice production is likely to register a short

fall of 3-4 million tonnes. Production drives in the tiaditicnal rice growing States h a\e been reinforced to reduce the estimated shortfall.
5.44 In the case of wheat, production has been increasing at the enviable rate cf 6 per cent per annum during the Plan decades, which is more than adequate to realise the Sixth Plan target if the present tempo is maintained.
5.45 The target for other cereals like jowar, bajra and maize, set for the Sixth Plan are moderate and even lower compared to the Fourth Plan targets. Persistent efforts are being made to evolve and disseminate a suitable technology for dry land farming which will benefit these crop's more than others,
5.46 Considering the fact that production of pulses has been increasing on an average by a mere 0.8 per cent per annum during the last three decades, an incseae of 2.9 per cent per annum over the 1978-79 level appears to be rather unrealistic. There could be a shortfall of about 1-2 million tonnes.
5.47 Thus, as against the 1984-85 foodgrain production target of 149— 154 million to n e s projected in the Plan, the ach'evemcnt may be nearer the lower erd of the range i.e. 146— 148 million tonnes.
Animal Husbandry and Dairying •5.4S Plan tar gels ot e^gs and wool may not be
achieved in full by the end of 1984-85. The revised target of eggs is placed at 14,000 million against 16.300 million and that of wool at 36.8 million Kg. Igainst 39.0 million kg. This is largely due to die prevailing high prices of poultry feed. On the other hand, the Plan target of milk production i.e. 38 million tonnes is likely to be achieved with a marginal shortfall by the end of 1984-85.
5.49 Based on the advice cf the intern:iti:nal organisations like WHO and FAO as well as the re- com m en'atiors of the N a io a l Commi-sion o i Agriculture and a^o in the light of a Lok Sabha discussion about the sub-standard supply of veterinary biolcgicals by certain institution, the Department of Agriculture and Cooperation have proposed a new Central scheme for setting up a National Centre for Quality Contrcl of Ve'erinary B r l o j r a ’s. Thh proposal has already been cleared by the Planning Commission and is presently being processed, by the Ministry of Finance. This scheme would help in augmenting animal production besides increasing the credibility of our vaccines and diagnostic agents in the international markets.
5.50 While increasing emphasis has been laid in the past on improving fhe milk production potential o" our cattle through selective breeding and crossbreeding programmes, very little attention has bren given to the develorment of draught animal p.iv.er and improvement of indigenous recognised breeds of c itt 'e and baff lo^s. It goes without sa' ing that small and mar<>:m l farm?rs will cmHnu:* to depend heavily oil bullock power for agricultural operations and rural transport. The Department of Agriculture and Cooperation have suggested a new centrally
sponsored scheme with an outlay of Rs. 2 crores lo: giving assistance to the states for improving and developing infrastructural facilities etc., at about 15 cattle and buffalo breeding farms having importan; indigenous breeds. This would help to augment tht production of merited bulls for use in the cattle and buffalo development programmes in the field. TIk details of the scheme are being worked oVii by the Department of Agriculture and Cooperation. This proposal on its approval this year (1983-84), could be implemented in the last year of the Sixth Plan period, with spill over to the Seventh Plan, and would go a long way in helping the small and marginal far niers to have the benefit of this development.
5.51 Experience has shown that most o[ tin States do not provide adequate outlays for feed and fodder development in the State Plans. Even the animals having the best germ plasm are unable to express themselves in terms of production without the supply of adequate and quality balanced feed. Having regard to this, the proposal is tu strengthen the existing 12— 15 State Fodder Seed Production Farms to ensure supply of certified and quality seeds of high yielding varieties of fodder crop's as is being done in the case of oilseeds and pulses. Details of this proposal are being formulated by the Dcpait ment of Agriculture and Cooperation. This should rccei\e priority attention.
5.52 Three sheep farms in U ttar Pradesh, Bihar and Madhya Pradesh started earlier, as part of a Centrally sponsored scheme were transferred to the State sector in 1979-80. In consequence, adequate outlays were not provided by the concerned States, and hence these farms have not been fully developed to become operational. This also calls for urgent remedial steps.
5.53 The Central Sheep Breeding Farm, Hissar established with Australian assistance has been in operation for the last 12-13 years and is distributing Corricdale rams (dual purpose breed) to various States for cro-s-brceding. Recently, it has been decided to change the breeding policy at this Farm as the Cotries!al:s hrve not fared w.ll. Now the introduction of Rambouillet— a fine wool breed from the USA is envi-aged. For this purpose, the Department of Agriculture and Co-operation have propos;d to import 2000 Rambouillet sheep for this Farm
5.54 Lastly, in regard to the Operation Flood II Project, it has been observed that progress relating to artificial insemination, frozen semen technology and the rearing of cross-bred calves is not satisfactory. Farther, progress of the work done by Punjab, Gujarat and Tamil Nadu States under this project is satisfactory while in 18 other States and in 4 Union Territories, achievements are much belov the targets. This will, in turn, lead to short-fails in the target laid down for indigenous milk prodiction under this project. The Indian Dairy Corporation (ID C) has to take necessary and urgent step, to accelerate the progress of this project m difcrent States through continuous monitoring at various levels.
3
5.55 Under Fisheries a Plan provision ot' Rs. 173.72 rores was made for Central and Centrally Spun or d Schemes. During the first three years 1980—83 he expenditure is likely to be of the order oi Is. 53.78 crores. An outlay of Rs. 20 crores has teen provided for 1983-84.
5.56 Exploratory Fisheries Project lias a Plan allocation of Rs. 48 crores. The shortfall in this jroject is expected to be Rs. 13 crores cine to the lelay in the acquisition of deep sea fishing vessels for urveying the Exclusive Economic Zone (F.EZ) and ilso due to slow construction activities. Of this ;aving an amount of Rs. 3.4 crores will be utilised or the Integrated Fisheries Project, which will cover .iiversilied fishing activities and modernisation o!: ish processing and marketing.
5.57 The Central scheme for assistance from the 'hipping Development Fund Committee for trawler levelopment has a Plan outlay of Rs. 50 crores.\ saving of Rs. 6.33 crores is anticipated under this jroject. The project has since gathered momentum *vith the liberalisation of the policy under Shipping Development Fund Committee rules. 118 DSF {Deep Sea Fi hing) Vessels have been introduced by he end of 1982-83 against the Plan target of 350. Looking to this performance, this programme ha« to dc further intensified.
5.58 Under the fish seed development programme with an outlay of Rs. 8 crores, there may be a saving r>f Rs. 2.8 crores since the scheme was sanctioned in [the third year of the Plan only. Similarly there is likely to be a saving of Rs. 50 lakhs in the scheme bf development of Inland Fisheries statistics with an priginal outlay of Rs. 100 lakhs due to late start ofhe scheme.
I5.59 The Central scheme of "Landing and Berth
ing facilities at major ports” was commenced in the 'ourth Plan and work executed by the Major Port Trust Authorities under the Ministry of Shipping and Transport. Major fishing harbours have been sanctioned at Cochin, Visakhapatnam, Roychowk, Bombay and Madras. Cf these, the harbours at Visakhapatnam, Roychowk and Cochin have already- been completed. The harbour at Madras is nearing completion and has become partly operational. The vork at Sassoon Dock (Bombay) is progressing. Studies for locating an alternative site for the construction of fishing harbour at Paradeep are in progress. The programme for construction of fishing harbours lias thus been behind schedule. Steps for >roper monitoring of this project are needed.
5.60 Under the Centrally Sponsored Schemes there s a shortfall of Rs. 100 lakhs each under Fish Farmers Development Agency (FFDAS) and Prawn latcheries and farming. The saving under FFDAS
ish cries are due to the change in the pattern of Central assistance from 1982-83. Till 1982-83 the total cost of the Centrally sponsored FFDAS was shared by the Centre and the State Governments on 50 : 50 basis. Now the State Governments arc bearing in full the expenditure on the base staff and contingencies. The expenditure on the incremental staff, training of fanners, subsidy on first year inputs and reclamation of target and capital investment on the fish seed farms are shared on 50 : 50 basis between Government of India and the State Governments. Under the Prawn hatcheries and farming project, the shortfall is due to the start of the scheme onlv in1982-83.
5.01 The Inland Fisheries Project with World Bank assistance was taken up in the five States of Bihar, Madhya Pradesh, Orissa, U ttar Pradesh and West Bengal. Under the project, 58 Fish Fanners Development Agencies (FFDAS) and five Fish Seed Development Corporations have been set up in the live project States. As against the Plan target for construction of 27 commercial fish seed hatcheries covering an area of 435 hectares of nursery space, the number of hatcheries has be'en raised to 35, retaining the same nursery area. Out of these, by December 1982, work had been started on six hatcheries (75 hectares) and detailed plans, approved for 13 hatcheries (173.4 hectares). Expeditious steps are to be taken for completing all the 35 hatcheries during the current Plan period.
5.62 Nine new schemes have been proposed by the Department of Agriculture & Cooperation. One is for the enforcement of Maritime Zones of India Act, 1981 aiming at protecting the interests of coastal fishermen operating small boats and crafts. The second scheme is for assessment of marine resources and acsociated requirements of training. Other new schemes proposed by the Department of Agriculture and Cooperation are project preparations for IDA assistance on inland and brackish water fisheries, introduction of beach landing crafts, construction of dry docks for fishing vessels, Group Insurance scheme for active fishermen, development of botanical garden near Sassoon Dock, building of wooden hull trawlers with World Bank assistance and techno-eco- nomic survey of fishermen. Details of all these schemes except Group Insurance Scheme for active fishermen are being worked out by the Department of Agriculture and Cooperation.
Forestry
5.63 An important objective of forestry programmes under the Sixth Plan is development without destruction. In conformity with this objective, attention is being focused on ecological balance, energy conservation, generation of employment and economic stability of people whose living is linked with forests. Physical progress of selected program-
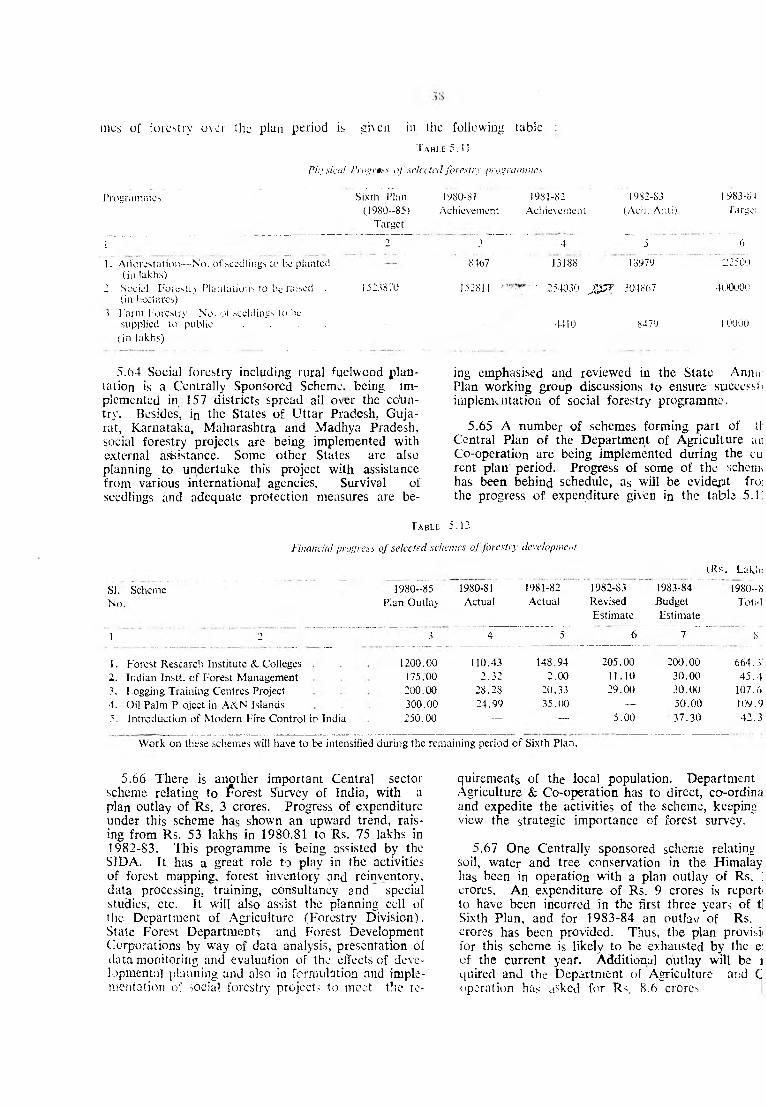
mes of forestry over the plan period is given in the following tableT able 5.11
Physical Progress o f selected fo re s try program m es
Programmes Sixth Plan(1980-85)
Target
1.................. "" .... .... ’ .................... 2
1. Afforestation—No. of seedlings to be planted(in lakhs)
2. Social Forestry Plantations to be raised ■ I523S70 (in hectares)
.1 . Farm Forestry—-No. of seeklings to be supplied to public . . . .
(in lakhs)
1980-Si 1981-82 1982-83 1983-8-!Achievement Achievement (Ach. A r.ti) ’Targe:
3 4 5 6
8467 1318S 13979 22500
15281 1 • 25-4030 J & F 304867 41)0000
4410 8479 10000
5.64 Social forestry including rural fuelwood plantation is a Centrally Sponsored Scheme, being implemented in 157 districts spread all over the country. Besides, in the States of U ttar Pradesh, Gujarat, Karnataka, M aharashtra and Madhya Pradesh, social forestry projects are being implemented with external asisistance. Some other States are also planning to undertake this project with assistance from various international agencies. Survival of seedlings and adequate protection measures are be
ing emphasised and reviewed in the State Annu Plan working group discussions to ensure success ft implementation of social forestry programme.
5.65 A number of schemes forming part of tl Central Plan of the Department of Agriculture an Co-operation are being implemented during the cu rent plan period. Progress of some of the schenit has been behind schedule, as will be evident froi the progress of expenditure given in the table 5 .F
Financial progress
Table 5 .12
o f selected schemes o f fo re s try development
(Rs. Lakh;
SI. Scheme 1980-85 1980-81 1981-82 1982-83 1983-84 1980-8N o Plan Outlay Actual Actual Revised
EstimateBudgetEstimate
Total
1 2 3 4 5 6 7 S
1 . Forest Research. Institute & Colleges 1200.00 110.43 148.94 205 .00 200 .00 664.32. Indian Instt. of Forest Management 175.00 2 .3 2 2 .0 0 11.10 3 0 .0 0 4 5 . 43. Logging Training Centres Project 200 .00 28 .28 20.33 2 9 .0 0 3 0 .0 0 107.64. Oil Palm P.-oject in A&N Islands 300.00 24 .99 35 .00 — 5 0 .0 0 109 .95. Introduction of Modern Fire Control in India 250 .00 — — 5 .0 0 3 7 .3 0 4 2 .3
Work on these schemes will have to be intensified during the remaining period of Sixth Plan.
5.66 There is another important Centra] sector scheme relating to fo rest Survey of India, with a plan outlay of Rs. 3 crores. Progress of expenditure under this scheme has shown an upward trend, raising from Rs. 53 lakhs in 1980.81 to Rs. 75 lakhs in1982-83. This programme is being assisted by the SIDA. It has a great role to plav in the activities of forest mapping, forest inventory and reinventory, data processing, training, consultancy and special studies, etc. It will also assist the planning cell of the Department of Agriculture (Forestry Division). State Forest Departm ent; and Forest Development Corporations by way of data analysis, presentation of data monitoring and evaluation of the effects of developmental planning and also in formulation and implementation of social forestry projects to meet the re
quirements of the local population. Department Agriculture & Co-operation has to direct, coord ina and expedite the activities of the scheme, keeping view the strategic importance of forest survey.
5.67 One Centrally sponsored scheme relating soil, water and tree conservation in the Himalay has been in operation with a plan outlay of Rs. i crores. An, expenditure of Rs. 9 crores is report to have been incurred in the first three years of tl Sixth Plan, and for 1983-84 an outlay of Rs. crores has been provided. Thus, the plan provisi for this scheme is likely to be exhausted by the e: of the current year. Additional outlay will be i quired and the Department of Agriculture and C operation has asked for Rs. 8.6 crores.

\N \T . XUR.!'- 5.1
Plan T argets and A ch ievem en ts — Foodgrain*
Rice W heat Jov.ar Bajra Mai/e Oilier C.tc .h
( M i l io n (onne-.)
Total pulses I'atal Cereals l-'ood-
£■' in-;
8 0 1 )
Base Year production (1949-50) . Z? 5 6 .4 5 .9 2.8 First PlanTargets for 1955-56 27.fi S .4 — —Actual ProuLiciicn 1955 56 . ' 7 6 8 6 6 7 3 A
Sctond I’haTargets for 1960-61 . 2 9 .5 0 11.2 — —Actual Production 1960-61 . 34.5 1 1 .0 9 . 8 3.3
Third P!;tnTarget for 1965-66 . 45.7 15.2 — —Actual Production 1965-66 30.6 10.4 7 6 .’-.8
; . i 6 6
4 . x2 3 . 4
5 , 3
46.8 8.1 54,9
5 ’■ t 9. I 62 .511.0 i'-6. S
■- 12 0 7 6 . :(>). 3 12.7 N 2. <
17.3 101.61 62.4 9 .9 7 ’ .3
Annual PlansTarget for 1968-69 Actual production 196N-69 .
Vourth P k nTarget for 1973-74 Actual Production 1973-74
45.739.8
52 .044.1
15.2 I S .6
24.0 21 .8
9.8
15.09.1
3.8
7.07.5
8.0 5 8
23.45 . 9
8.0
6.4
S3.6
114.094,7
17.3 1O2.010.4 94.0
1.5.0 129.00 10.0 104.7
Fifth PlanTarget for 1978-79 Actual Production 1978-79 , 6?. R 11 .4 5.6 6.2
— — 125.0119.7 12.2 131.9
Sixlh PlanTarget for 1984-85
Annual Plans 1980-81TargetAchievement
6 3 . 0 -‘ 4 . 0
55.053.63
36.036.31
, X 6.X 139.1 14.5 154.00
3 0 . 029 . 02
121.00 14.0 118.96 10.63
135.0129.59
Annual Plsn 1981-82 .TargetAchievement
58.00 53. 59
38.00 30.030.29
126.0 121 . 0
12.5 138.50 11.35 1 33.0(i
Annual Plan 1982-83Target Anticipated Target 1983-84 .
58.00 45.8057.00
3 9 .0 0 41 .604 1 .0 0
31.0 27.90 31 .00
128.0115.30129.00
13.50 141.5011.50 126.80 13.00 142.00
*Sec< nd Plan targets were set in ranges.Hence crop-wise figures do not tally with the total
"0

CHAPTER 6
/RRIATION COMMAND AREA DEVELOPMENT AND FLOOD CONTROL
Irrigation
The broad heads of development of irrigation are as follows :
(a) Major & Medium Irrigation.
(b) Minor Irrigation.
(c) Command area development and water management, and
(d) Flood Control.
6.2 The Sixth Plan envisages the following outlays on each of these :
(n) Major & Medium Irrigation
(b) Minor Irrigation .
(Rs. in crorcs)
. 8391.36
1X11.30
(e' Com mand area development & water management . . . . . . . . 855.7 7
(d) f lood Control . . . . . . 1045.10
6.3 The actual expenditure in the first two years of the Plan, the likely expenditure in 1982-83 and the approved outlav for .1983-84 are as aiven in Table 6.1.
1 980-81 Actual'.
I'AM.r 6.1"
I981-S2 Actuals
1( a ) Major & Me
dium Irrigation
(h) Minor Irrigation
(c) C om m and areadevelopment Sc water m an a gement . 110.67
(d) F lood Control 155.35
l Ks, n croi
1982-83 tvs- Reviseu A ppro ' Approved out Ire. outlay
4 5
1.710.62 1364.9.) 1515. 5S
291.21 2( 1 .29 326. ^2
1 16.07 163.89
144.90
154.21
1747
1 .So . <
161
6.4 At the beginning of the Sixth Plan, the an brought under major and medium irrigation was 22.J M.FIa. and under minor irrigation 30 M.Ha. T
physical targets for the creation of irrigation poienii for the Sixth Plan and the benefits achieved durir the first three years as also the plan target current year are as given in table 6 .2.
for !
* Figures under Table 6.1 are on the basis scheme-wise information furnished by the Sts Governments and are different from Ihose in Pari of the document.
T\mt 6.2
(M. MiTarge! Tor the Sixth
Plan
1 )8,)-8I 1981-82 1987-83 ( V i •.)
198(T !
1 2 4 5
(a) M ajor & Medium Irrigation . . . . . 5.74 0.83 0.87 0 9.) I
(b) M inor In igat i m 8. 03 I .4 ) 1 3 7 1 4 4 1
(c) Com mand Area Development & Water Management :
ti) FieM Channels . . . . . . . 4.00 0 -Vi 0.98 !.•)) 1( ii) Land levelling . . . . . . . i.o:> 0 0) 0.0 s 0 1 I 0
Major & Medium Irrigation Programmes
6.5 All irrigation schemes arc investigated, planned, constructed and maintained by the State Governments and all funds for these schemes are provided from the State Plans. The Centre's role is limited to monioring of 66 selected major irrigation and multipurpose projects, preparation of long-term perspective plans in water resources, technical examination ‘T
major and medium irritation schemes, project pre
paration and monitorine of externally-aided :-che;ni some inter-state control boards. consultancy a; design, research etc.
6.6 When the Sixth Plan commenced, 172 maj projects and over 450 medium projects wete tir’d construction. Some provision was made in the Six Plan for a few new starts. It was envisaged that I major projects which had been ia progress as < J -4-1976 and were incomplete at t!:c becinninc
40

41
the SkUi Plan would be completed by the end of the, Sixth Plan. Statements showing the outlays for major and 1-: tiuiv; irrigation schemes in the first three yearsof tb Plan and the approved outlay for the fourth year giycu in Statement 6.1. Statement 6.11 gives the U;£;.\s of additional potential for (he Sixth Plan and t?c likely achievement. If the outlay during the Sixth Pla i is to be maintained at about the same level as en isaged in the Sixth Plan document, the step up has t< be substantial in some States like Bihar, Haryana, Madhya Pradesh, Rajasthan and West Bengal. It is i moor point whether in these S'ates a step up of thi; order can really be sustained either from the resource point of view or from the point of view of admh: sMvitive arrangements like providing necessary staff. material etc.
6.7 IT additional funds cannot be provided, the result, would be ihat the available funds for the irrigation programme during the plan period would, in real t-rms, be much less than the plan provision. Therefore. thc target of 5.7 M.Ha. additional irrigation potential during the Sixth Plan is unlikely to be achieved, and the shortfall is likely to be about 1.3 M.Ha. Only 38 out of 65 major irrigation projects which were ongoing; as on 1-4-1976 and remained incom rl.’e at the beginning of the Sixth Plan may be computed by the end of the Sixth Plan and the other 27 wii: soiil over into the Seventh Plan. Efforts arc therefore necessary to increase the tempo of completion o: projects and to provide the minimum funds necessary for this purpose. The bulk of the outlay .on ma or end medium irrigation projects in the Sixth IPlan, aearly 6,000 crores of rupees, is on ongoing ’schemes, Rs. 1278 crores are for modernisation, in- yestiga'ion and water development and only Rs. 1056 ■Crores fo r new sch em es. Most of the new schemes are *tn backward and drought prone areas. During 1980-81. *1981-82 and 1982-83 only Rs. 54 crores, Rs. 78 crores nnd Rs. 150 crores respectively were spent on Slew schemes and the rest was spent on ongoing Schemes. There is thus little scope for readjustment within the. approved outlays for expediting on?oine? schemes. The emphasis has to be on application of luch additional funds as can be made available to Ihe comoledon of as many of the oneo:ng projects as possible. Specie! effort is required to be directed to Ihe long drawn out schemes like Nagariunasagar, Rajasthan Canal Stage II, Gandak, Kosi, Vtalaprabha, Kallada. etc. The monitoring of ongoing projects at the Centre should be aimed at ensuring these objectives.
i 6.8 During the last few years, a number of major ind medium irrigation schemes have been taken up inder the externallv-aided programmes especially nder World Bank assistance. A sizable portion of lie outlav under major and medium irrigation in M arat. Maharashtra, Madhva Pradesh, Orissa and [amataka is for e^temallv-aided projects. The ner- srmance of the different States on externallv-aided injects has to be analysed to identify' deficiencies in realisation, procedures likely to cause delays and ther bottlenecks before a commitment is made to Kternal acencies for more irrigation schemes. The reference for new projects for such external assis- ince should not be allowed to delay further any of
s P C ••'83— -"
the ongoing projects. Specific mention may be made in this context of the Malaprabha and Ghataprabha Projects in Karnataka, the Rajghat (Madhya Pradesh and Uttar Pradesh) and Bansagar (Uttar Pradesh, Madhya Pradesh and Bihar) Danis which are interstate in nature and the Narmada Sagar Dam and the Sardar Sarovar Dam which are to be completed in10 \ears according to the final award of the Narmada Tribunal.
6.9 Trie progress of some inter-State projects has not been saiisfacory for want of provision r f oinds on a matching basis by the State concerned. Mention has already been made of the Rajghat project, the Narmada Projects (Sardar Sarovar and Narmadcsagar) and the Bansagar project. In the light of these facts, it is necessary to exercise caution in taking up new projects and they should generally wait for the ongoing projects to be substantially completed. This principle is not always followed. The number of new projects should generally be limited to those in drought prone, tribal and backward areas as envisaged in the Plan,
6.10 There has been some progress in advance planning for acquiring scarce m ateria l of construction and supplving them to 'he project authorities. The position with regard to steel, c em e n t coal and diesel has improved during the past three venrs. Special efforts have to be made to ensure supply of scarce materials if the progress on the projects is not to be hampered on this account.
6.11 In many of the projects that have been In progress for more than 15— 20 years, th" construction of the last few kilometers of the channels or a few distributaries, has been delaved for a number of reasons. In som« cases, the d am . the mam canal and one or two branches are completed but there is delay in completion of the other branches. Tn all. such cases, particularly in maW rtro'eefs. it would be preferable to take un the work in phases and complete each phase according tn a time-bound schedule. What happens Ts that estimates framed earlier for a branch or a main canal taken up a f te r 10 or 12 vears are totally out of date and considerable eceal*tion has to be provided for. The construction esrirnatps could be closed after a particular rteriod and the balance of works taken uo as a separate phase under a new estimate. Similarlv. there should be a time-bound schedule for completion of medium projects also.
6.12 In some of the nroiects, the progress has been hampered due to delay in land aeonisit’’on particularly in forest areas. T h ; procedure for clearance from the forest angle has to be streamlined in order that the progress on the projects is not delaved on this account.
New Twenty-Point Programme and Irrigation Targets
6.13 Increase in irrigation potential ic point no. 1 under the new 20-Point Programme. The aim was that the additional benefit would be 9 M.Ha. irrigation in the last three years of the Sixth Plan at an average of 3 M.Ha. per year. The actual achievement was

2.23 M.Ha in 1980-81, 2.24 M.Ha. in 1981 S2 and 2.34 M.Ha. in 1982-83. As has already been mentioned, the ques'ion of the outlays being stepped up fo achieve the targets has to be considered.
Utilisation of Irrigation potential created
6.14 The Sixth Plan target for utilisation of irrigation potential is 13.6 M.Ha. The progress during the first three years is as follows :
Ui : ;.ui i.bC:
m o-?i1981-821982-83
M. Ha,
1.92 1 93 2.37
With the outlay as now anticipated, it is unlikely that the balance of 7.78 M.Ha. would be achie ved by March 1985. As already slated, there is lively to he a shortfall of 2.3 M.Ha. even in the erection of the potential. It is likely that there will be a shortfall of the order of 1.60 to 2.1 M.Ha. in the utilisation of irrigation potential also.
6.15 The potential created so far and its utilisation are as given in table 6.3.
T ABl £ 6 .5
SI.No.
(M a Ha.)
Ttem M ajor M inor Total&
Medium
1. Cumulative achievement to end o f 1979-80 :(i) Potential
(ii) Utilisation
2. O'rniiV1! ive pc.'seven-cru to end o f 1980-81 :
(H Po*c:tial (ii) Utilisation
3. Achievement to end of 1981-82 :
(i) Polcrlial (ii) Utilisation
4. Anticipated achievemert to the end c f 1982-83 :
(i) Potential(ii) Utilisation
5. Cumulative target for 1983-84 :
(i) Potential(ii) Utilisation
26 50 22.32
27.322.8
28.223.4
29 1 24.3
30,025.4
30.00 30 00
31 .4 31 4
32 8 32.8
34.234.2
35.635.6
56 ,50 52.32
58 70 54.20
6 1 .0 56 .2
63.353.5
65 .6 61 .0
6.16 In major and medium irrigation projects, the potential created in any year is usually compared with its utilisation a year later as the storages etc. need to be filled up in the monsoons and the farmers require time to build field channels. In minor irrigation, the potential created is generally deemed to
be fully utilised on completion ercopl a few State works. But p tib 1 ' n]J L ability of electric power and u 1 - of tubewells and lift irrigatic i c . etrtes.
6.17 The bulk of the rap be:’v . j ■ r utilisation is in Andhra Pradesh. r:Madhya Pradesh, M aharash tra , a,nPradesh. The command area devel p.';:- has been taken up during *h? >"■'' Vc:in sixteen States and one Union r> . i -gramme envisages ots-farm develcp^icnf ' "'-'1 ' prising construc'icn of f i;!J char:r>'Is, Uland shaping etc. f ir s has helned m o'/ utilisa’ion but the progress co-’M be m r c The farmers were originally expected to ti construction of field channels belcw the 4- ) ■. ;a With a view to improving utilisation this ha/ reduced to 5 18 Ha. blocks. Below this the : have to construct tin field channels. 1 he S*x‘ envisages construction of fic’d charm-'Is to r 4 under the CAD Programme. The r>ro»n;;s in 1 was 0.66 M.Ha.. in 1981-82 0.98 M.H?. : 1982-83 1.0 M.Ha.
:.jV
i :iU:
r'if ■
.ke
b' 'arrm- ■
pi.
)”0 !■,1
6.18 A factor which will help in irrnrovn-' ti utilisation of created irrigatio.. potential is th, ; i; duction of warabandi or rotational water suopjy. 5 i this also, a beginning has be.-n made and assis-n-- ... is given under the CAD programme. T-Iov " r. great deal of work still remriv.s to. he c,.'>rc ?"<j. ■ States have to expedite this activity in all th ;ir maW projects.
6.19 As for Minor Irrigation, the correctness f the assumption that the created potential is anw ";;t cally utilised needs to ba looked into. S n '' inition has to be paid to ensurins availftbilifv of eV-tf’ • power or diesel for tubewells and pumps^N.
Mino Irrigation
6.20 The Minor im 'a^ion nro«ram r'e ; mostlv of exploitation of nroimd ws*?r tv-tM'tUO. T ! > tP r se t for the Six'h Plan >s 8 M.Ha addi' 5o»\')1 n ' t n • tial. 7 million Ha. from fhe of ornin-d w^'cr ar.-i 1 million Ha. from surface irr'«ntion. "T>rs-e , allow for depreciation on existing worVs ine''>dr-: derelict tubewells, tanks, etc. The m rtovfor m 'nnr irrigation nrowramme for »t*e Siyfh r/-Year Plan is Rs. 1811 30 crores m r i - , > i ' »r ■ Secfor Programme. Here also, as *n the ;” a:0’ • ? medium irrigation pro<T?mnT\ t^e O ovcrm — , are implementing th" nrorTnron->e fnllw 's ft-,--'-- resource^ svnoleme-’'ted bv instiftH’o^a’ fc--w.i ■ ■■■ '■ some private investments bv th-- frT "*^ JvThe minor irrigation nro«*rn?nme ’’s ^iso s. e n n i^ to some exfent bv other sofTcs 1 i1 -c TrH-rd iTRT)P, Scheduled Cast*\s end .S^her'td vd ' !'-p~>. gramme. Western Ghat
6.21 Statement 6 .TTI rbo’-vs th > vear-v.he. e ';,r' fure on the minor irrs"ation nropffirst three v.’ - 's o f the Plan f .ioutlaw's for t];-’ l 7onrfV> yeav S ffie- ' ‘n* 6 ■the position renard’na r . - , . - ^ r,the first three vears of the Si'nh Finn er.d !,f ‘ai-"-1 for 1983-84. fn real terms, the outlav

minor irrigation programme during the Sixth Plan would dc i.ss man sue nuicis provided in lhe beginning
of til;: rUisi. 'j'fcis would result in a siiortfaliin a c i u v . , ' ;l;j ;,a.vm fiii.i iar^,ct Oi 6 m iihon Ha. poi.cat.ai wnicn may b.; reduced lo
aboa: .• i iVa . p ia i .aipoliy uuc lo three icdsou’j :
(1) price escalation ; (2) snoiiiali in cicd»t ik>w and
(3) shotdad in tne aeu;e\emcm of targets in the energisation of kngaUOi, puri'ipseis (.Sui'.cnieni 6.V).
6.22 Spcciai adaiUo^ai outlay has been provided in the c t iin y l Sccx-r r ian In 19J3-84 to be given to
the Sdues as a matchiao grant ror uunor irr ig ation
schema.-, to; s-suai and m arg in a l i'aniseis. in is has to be jsc ,c;.; Lr a t ic q aA e i i _ s l i l t i i t a l ereoia in
this ea ue;;t. she recovery p o r t io n o f ii'.e Land Devc- lopmei;-. aaaaa; a.id o the r commcrcial bunks will have
to be improved by special recovery uruas. A llo c a t io n
of moic funds ior stepping up energisation ot pum pse ts
is also e:*iicu ic jy e.a,_noa! Linou.;h higher provision of oud - , for Oijceiai A ja.auuare i-rogramuie, R b C
(n o rm a l in xL) and aLo for providing exclusive
feeders ;ur ritiviuc irii.^a-icn pampse.s and State tubeweii:.. Ae,> * .aa.d ..;.aa approach should be adopted to, high.r uddiarii on yf pubuc d.s be wells and surface miner ln'Actio,, schemas. spec,ally tanks.
6.23 As ,i; die case oi major and medium irrigation seSiiO.ics, it ij essential that the States concen
trate O' .aua^icoon oi' ongoing' naaor irrigation
schcaie.. mi imraediaie review vhould be caicied outof tile 00:0 ;\o;ui:cOiv,o af funds I'or completing lire
on-goi- s aem.,, a.>:d a phased programme worked
out for caiiy completion,
6.24 A.:.oi;cr iniy, n..ana feature that requires iiraac... . t a a b n is the ssA.aAc o-.uvey aad assess •
mem <> ,;a an near hdgadon potential. At presaoo
the bca,a ,, m ihh s.a.vot are largely calcula-'ed on a thumb iule basis. i t i.-; la.ccasary iliui a systematic survey is carried out at least once in three years to
find out life, aciaai area irrigated from minor irrigation
works, dia; posit!..n is pailieutariy Lapoctanl in respect of dag-vvelis and private tubevrells as a part or the v/iaac of die area covered by many of them
may o >/•::?lap areas irrigated by Government canal systems, ia fact, this is probably one of the reasons
why there is a discrepancy between the areas as
reported by the project authorities on the one band and the land utilisation statistics on the other.
Command Area Development Frograamae
6.25 44 CAD Authorities have been set up to cover 71 projects in 16 States and the Union Territory of
Goa for carrying out the programme under 76 appro
ved irrigation commands. The approved Sixth Plan outlay for the programme in the State & Central
Sector is Rs. 856 crores. The expenditure during1980-81 was 111 crores, Rs. 116 crores in 1981-82 and Rs. 145 crores in 1932-83. The available funds
for the programme during the Sixth Plan might fall
short of the approved Sixth Plan ouday, partly, due to the cansAaa:! of rasaaeeas. particularly in the State Sector 1 aa , d a p, da: dntian’ae.; ia the imple-
m enA ' aa : a a ;? a a ; a a : i : saA; a.; inadequate
impleaa.;A-^a^ capacity and complexity u'i the pro- grarurue in v tew of its mulii-disciplinary character.
6.26 It will be seen from the lable in para 6.4
that me target for tieiu enunnels nugtu be ucm^vtfU by iy84-8;>, while the achievement in respect ot land
levelling rnignt fail snori ot tne target. One oi me
mam reasons lor ons snordall is me slow uiaDurse-
mcni ot msinutionai creuit in most o i tne biaies. iluo iner deiieicncy m me inipieiueauiu.jn oi aic pio-
graniuie is me iacK o i adequate organisation in many
Mates. Suortage or iramcu stau uus Ov^u a uiujoi
lraiiclicap. Anomer diincuPy experiwiived in tne
speedy implementation ot me command uiea development programme is me irequent trai.sler o i uuiea's
at tne top level and the absence oi Siau a-, die luwer
level, lire State siiould ensure iliat uuequaie stail is posted m the command area aiuaouiucs and uiey
stay there for at least a period or 3 or 4 years.
6.2 / I here is need ior ineieasing tne outlay under
the command area development pr^graanrnc so uuu
lire pos.eut;al already created can be useiuliy uuia,eu. This is particularly necessary ior expeuiiing construe-
tiou of held channels and iand leveiimg. xveccntiy
the Centre nas agreed to provide an uduu>oaal allocation of Rs. 51) crores from tne Central Sector oi wnich Rs. 25 crores will be provided on a matching basis for expediting the construction of held channels by
the States. The balance outlay of Ks. 25 crores wiit
be disbursed from the Central Sector ior expediting the Command Area Development i'rogranime.
Flood Control
6.28 The approved Sixth Plan outlay ior the flood
control programme is Rs. 1045 crores. The expenditure was Rs. 155 crores in 1980-81, Rs. 164 croies in 1981-82 and Rs. 154 crores in 1962-83. ilie
focus here is on completion of ongoing schemes
particularly embankment and diainage salaries, ilie States have been advised to complete the on-going schemes in a phased manner at the earliest.
6.29 The Government of India have also set up the Brahmaputra Board under an Act of Parliament
for preparing a comprehensive master plan for the control of floods in Biahmapuira Valley and develop
ment of its water resources, The Central Water
Commission has taken up systematic monitoring of the flood control schemes and this is expected to help
in identifying the problem areas and take remedial action promptly. The achievement during the first
two years has been very low compared to the Sixth
Plan target of 4 M .Ha. This aspect, therefore, needs immediate review. It is likely that only 2 M .Ha.
will be provided with flood control benefits in the
Sixth Plan as per present assessment. A detailed
analysis has to be carried out t0 find out how the
benefits could be extended to larger areas to achieve
the targets laid down in the Sixth Plan. The anti- Sea-erosion works in Kerala have been continued.
The State has been told to take steps to improve this programme by analysing the work done so far. The
Centre has also taken up the work of flood plain zoning and regulation so as to enable effective manage
ment of areas liable to floods, Assistance has been
given to some of the States, although in a limited way, for expediting some of the on-going flood control schemes.
43

6.30 The Centre is giving 100 per cent loan assistance for meeting the cost of flood control works in
Assam (excluding land acquisition and establishment
charge^), the share cost of flood control for Ihe Rengali D am in Orissa and two-third of the cost of anti-sea erosion works in Kerala. However, the reporting of
the progress on these Centrally aided schemes and their monitoring needs further improvement.
Conclusions
6.31 The outlays in the hist three years of the; plan
have been less than what had been envisaged at the time of formulating the Sixth Plan, due to constraints
on resources. Special efforts have, therefore, to be
made during the last two years even to reach the nominal financial targets envisaged in the Sixth Plan. This is particularly so in Bihar, Haryana, Karnataka,
Madhya Pradesh, Orissa, Rajasthan and Uttar Pradesh.
6.32 Outlays on onging medium schemes have to
be increased over what lias been envisaged in the Sixth
Plan. This would naturally mean a reduction in the outlays on new schemes and some of the modernisation
schemes envisaged in the Sixth Plan document.
6.33 The total outlay during the Sixth Plan w ill fall
short of the total envisaged in the Sixth Plan docuiment.
6.34 Because of escalations in costs and the limited
oultays in the first three years cf the Plan, there would
be a shortfall in the potential to be created at the end of the Sixth Plan. This is estimated to be of the
order of 2.3 M .Ha. A similar shortfall is also expected
in the utilisation figures.
6.35 The Sixth Plan had envisaged completion of
65 out of the on-going major projects started before
1976. The present review indicates that only 38 of
these are likely to be completed and the others will
spill over into the Seventh Plan. If special oil or is ai
made, it is likely that some of these schemes couAl >:•
completed even during the Sixth Plan period '• ■ eif.
6.36 Most of the on-going medium scfcvUies a .. likely to be completed. However, Stages hav-a iu ensu;
that outlays for these schemes are provided in iui.i.
6.37 The States should also give special auention la completion of on-going minor suriace irrigaiioi
schemes. In some of the States, there are a large num ber of on-going schemes, particularly on Madhya
Pradesh. Adequate outlays are not being provided
the present context of constraint of resources.
6.38 Ground water development particularly con
struction of dugwells and energisation of pumpse:s hac
to be accelerated. This will require special efforts o'n the part of the Stale M inor Irrigation Departments and credit agencies.
6.39 The command on development programme is
not making as much progress as it should, i t is stJ! suffering from the same disadvantages as before, like
frequent transfer of officers, lack of trained personnel,
inadequate outlays and absence of proper coordination. The idea of taking up some more commands under
this programme has not yet materialised.
6.40 The progress in ihe Hood contrci i>e.:it.r is ais;. not very satisfactory. States need to give ai-ention to
the early completion of on-going schemes to derive furf advantage. Only essential new schemes should be taken up.
6.41 It is estimated that in the two years 1983-84
and 1984-85 an additional potential of 1 M . Ha. could
be created if substantial additional funds couH be
provided for completion of on-gcing scheme;,. This will come to about Rs'. 400 crores each year.
STATEM ENT 6 .1
Mud-term Review o f S ixth Plan Major & M edium Irrigation Programme— Outlays
(Bs. in lak liij
1983-84(Approved
outlays)
SI. Stales No.
Sixth P lan Outlay
1980-81(Actual)Expdr.)
1981-82(AcutalBxpdr.)
1982-83(Revisedapprovedoirl.iys)
i ; 3 4 5 6 7
1. Andhra Pradesh . 79129 12921 12997 1.3650 12700
2. Assam . . . . . . 6250 993 1128 1030 ! 2303. Eihar . . . . . 9924 12505 13651 155 304. Gujarat . . . . . . 98000 13171 14535 18198 213005. Haryana . . . . . 36225 4405 4739 .5910 82596. H imachal pradesli . . . . 1045 211 143 5! ! 507. Jam m u & Kashmir . . . . 6094 826 1018 1143 11078. Karnataka . . . . . . 44050 7270 8192 8007 86909. Kerala . . . 25605 4 1 0 4344 4.500 y -J 7^
10. Madhya Pradesh , 78000 9860 1159: 1104a i a40/11. Maharash'.ro I i 3866 ■ 751.: : 094a ■ - .a-
M an ipur 4039 5 i '5 '• U ) ■ i

45
1 3 4 6 7
13. !hy:t . . . . . < >J — - 33}
14. Na:,-.l\nd . . . . . . . —
l j . Or i 3'vj )j ■ -,-! 3 ■■ ? .) : > '■
16. pli ; . . 32 -> ' > 4 ■ 1 3 4337 !.) :o
17. IV. .ii; : ; : 1 ...................................................... . 75 ■! v> ; ■, / •)/! 3)230 7670
18. ...................................................... . ..... —
19. Tar.ui Nadu . . . . :v/; 'v i 6 3 1 i 53 37y 1 5383
2 0 . Tri ivra . . . . . . \ 9j:'i 219 317 350 400
2 1 . tJ:t y Pr?-:c-:!i . . 1 04974 H'65's 13294 ■ -3_:2 : 19070
>2. Wc:i E c n r . J ........................................... ;■ scco 3 247 3 R 7 7 >06 > 3til 3
Sub-Toti'i • r . ; i i ) 1 1 ); ; >■ >4; ■: 1715)4
I I . I i i , . ■■ icr;'iLor\:>'. ; ' - i ; ' ; : Kl 15 :-i
[II. C .i . i . i ..cH>r >■■<) 'i ■■/) 1! ,3.)
Li. i> Itu/.L. . . . ■ 3 i i] ) U 0 > : i :>o i93 i ■: i 5 ' -I 1 ’ 4 -2 :s
■i! \i3.:vt :,:v[ v i i
M i ! - ! . I i l l ! ' ..'V'i ■’/ 7
M njor & Medium hrff.iritm Piogr.’Mnv
SI. U itim uc p Xontial i’r > n lJl.tn i .3 u n ; s i t ■; lj\J(, p i 11 ■) fi I • -------------------------------------------------
79-78 ’80-81 "61-ij. ‘82-33 \i3-34
1 3 !- 5 ■3 7... - ...........
i
1. Aucikr.i !:!;au:sii 3000 Io76 1 1 J4 ■ ; 293 1 ! ’0 1 ;93 1 5 i
2. Ass'ii; . . . . 970 — ; i ■ ; 1 5 0
3. Iii!. . . . . 6500 4 04 2043 :1 4 3 : ).■> 3 )J 23 )2
>4. Guj;..i;. . . . 3000 33 9 3; i )i > : )V ; ’• ; ! 11 -.2
5. HJiajrits. . . . . 30 J0 436 \ 333 i •. -! ) 3 7 1 ! 1.13 145 J
6 . Himacha Pradesh 50 — — > ■ >■
7. JamiTiii & Kashmir 2.50 43 63 '15 33 9 i i 1 ,
8. Karnataka . . . . 2500 3 OS 76’j 7 ) / 33 : i ,’4. OH
9. Ket'dla. . . . . . 1000 158 300 313 ■ P 33 i
0. Madhya Pradesh . 6000 513 927 1022 i i .n 1 I"7.' I 20’S
1. Maharashtra 4100 255 979 1063 1157 i ;- 7 140
2. M anipur . . . . 135 __ 8 I ! 13
3. Meghalaya . 20 — — — — __
4. Nagaland . 10 —- — — — ...
5. Orissa . . . 3600 455 972 1013 ! no i n » 1 1 ))
[6. Punjab . . . . 3000 1220 103J ! H ) iisi- :2 i ’ 1279
7. Rajasthan . . . . 2750 320 1215 1228 1254 133 1 1438
18. Sikkim . . . . 20 — — — — — —
19. Tamil Nadu 1500 891 288 300 303 >19 33 3
:0. Tripura . . . . 100 — — — —
!1. Uttar Pradesh 12500 2553 3476 3723 4007 3-142 4197
12. West Bengal . . . . 2310 440 1027 105 5 i o n M }5 i i3 !
Iub To i al : State 58315 9705 16776 17611 1S484 19336 20325
Jnion Territories 160 — 19 19 19 1 .-) 1 >
•Ian benefits 58475 9705 16795 :7530 18503 19105 203 *r4
're-Plan benefit-' 9705 170 ’ 9705 9 ; j ' 9 70 5
otalincl tiding lVc -i'lan rcuetits . 26500 • ^ 333:/.r ; . ; i l , i 3)0, i
dduionaJ tVem ia i S35 873 0 02 939
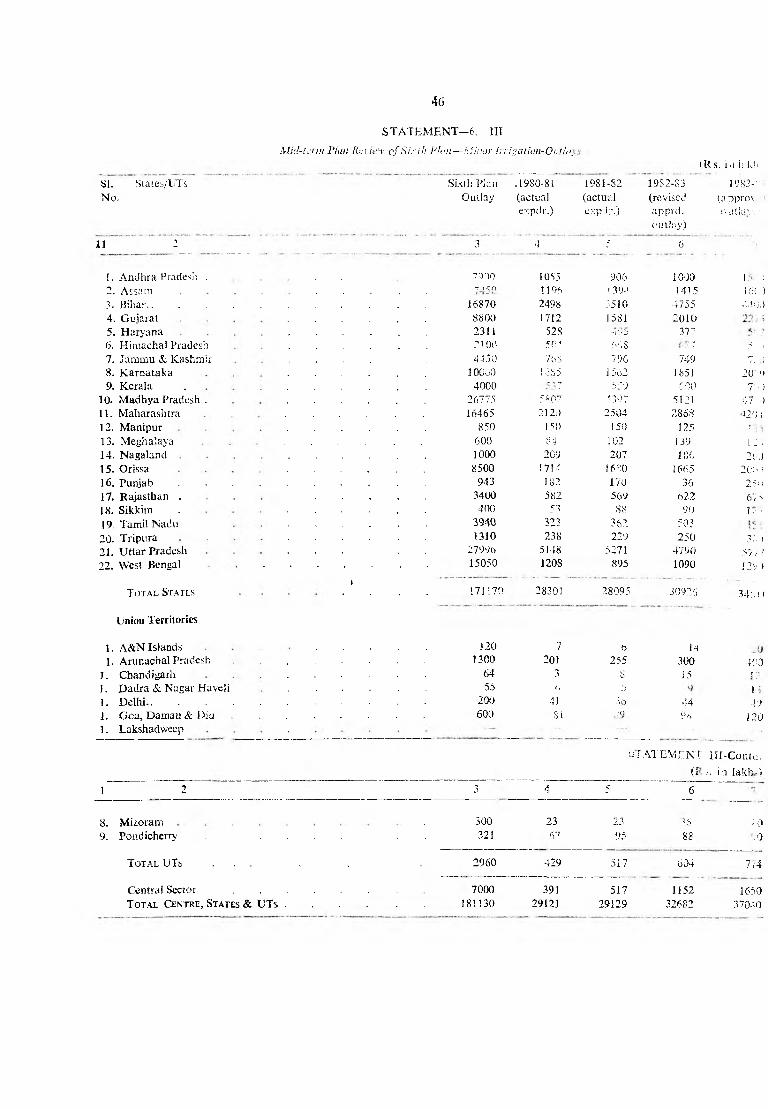
46
ST A T EM EN T — 6. I l l
Mid-wnn Plan Jh-yiew of S ink Plan—Minor In igativn-Ou'la,
(.R s. i ;i l;ik!i
SI. Siates/lQ s Sixth Plan .1980-81 1981-82 19S2-83 1983-"
No. Outlay (actual (actual (revised (a ?pro\
expdr.) expdr.) apprd. O Jtk'V: :
outlay)
11 2 3 4 5 6
1. Andhra Pradesh . 7910 1055 906 1000 !. :
2. Assam t ten. 1 1 % ! 39-! 1415 160 1
3. Bihar.......................................... ................................................... 16870 2498 3510 4755 ■-M00
4. Gujarat .................................................... 8801) 1712 1581 2010
5. Haryana .................................................... 2311 528 “i y'j 377 V f
6. Himachal Pradesh .................................................... 2100 50 * r.r>s : 5 •
7. Jammu &. Kashmir 4450 768 796 749 7; ;
8. Karnataka .................................................... 10000 1685 1562 1851 20*-')
9. Kerala . .................................................... 4000 " ' ■; 559 (00 70 i
10. Madhya Pradesh . .................................................... 26775 5807 1307 5121 -',7 ’ !
11. Maharashtra .................................................... 16465 2120 2504 2868 420 i
12. Manipur .................................................... 850 .150 150 125 1
13. Meghalaya .................................................... 600 8-1 102 139 1 .: :
14. Nagaland ................................................... 1000 209 207 186 2CJ
15. Orissa ................................................... 8500 17T4 16 R0 1665 20: ■ >
16. Punjab . . . . .................................................... 943 182 170 36 25o
17. Rajasthan . ......................................... 3400 582 569 622 6/ *>
18. Sikkim . .................................................... 400 53 88 90 1 / '<
19. Tamil Nadu .................................... 394Q 323 362 50?
20. Tripura ................................................... 1310 238 229 250 30 i
21. Uttar Pradesh .................................................... 27996 5148 5271 4790 57/ '
22. West Bengal ............................................................. 15050 1208 895 1090 J2v )
Total Statls . ' . . . 171170 2830! 28095 30906 34;, 1 (
Union Territories
1. A&N Islands ......................................... 120 7 t> 14
1. Arunachal Pradesh .................................................... 1300 201 255 300 40 J
I . Chandigarh .................................................... 64 3 8 15 I ;
1. Dadra & Nagar Haveli .................................................... 55 <•, 5 1! . Delhi.. . . . . .................................................... 200 41 3 b 44 49
1. Goa, Daman & Diu .................................................... 600 Si ;u 9i> 1201. Lakshadweep .
Ur A T EM EN ’T lll-Contci,
(1 >'. i n lakh-)
1 2 3 4 5 6
8. Mizoram . 300 23 23 <6 /(I
9. P o n d i c h e r r y ................................................................................... 321 67 95 88 .0
To tal UTs . . . . , 2960 429 517 604 7/4
Central Sector . . . . . . 7000 391 517 1152 1650
Total Centre , States & U T s .................................................... 181130 29121 29129 32682 370-10

STATEMENT 6 .IV
Mid-term Review of the Sixth Plan—Minor irrigation
{Irrigation potential)
( ‘000 hectare-;)
S. Staf-s/UTs. Ultimate Cummulative benefits to end ofNo, potential
‘79-80 ‘80-81 ‘81-82 81-82 ‘S3-84
(Actuals) (Actuals) Actuals (Anti) (Targets)
1 ~ 2 3 4 5 6 7
.............. ' ------ • ' ---------- ---- — ..... ---------- ..... - ------ ---- -- ----- -------
1. Ar.dhra Prndesh , . 4200 1985 2037 2083 5 2138.5 2203.52. As>,_ii.i 1700 288 299 310.0 333 3583. Bp'ii . 5900 2335 2464 2613 2818 30684. G jjarat 1750 1431 1454 1485 1523 15635. Hiryan'! 1550 1257 1292 1333 1362 13906. Hhu.chal i'rat-csh 285 96.5 102 107 112.2 117.27. JariiV!.., u kashm ir . 550 313 317.8 321.6 325.78 329.788. Kcmaiafca 2100 1015 1045 1073.4 1103.4 1125.49. Ke.aia 1100 310 323 337 354.4 371.4
10. Mr. ,v.. I.avVsh 4200 1550 1622 1708 1767 185211. M. harashtra . 3200 1632 1676 1743 1786 185812. M uvpur 105 26.3 29.2 32.3 34.2 36.213. McghaLya 100 23.7 26 28.4 31.3 33.314. Nagaland 80 42 44 46.87 49.69 51.6915. Or- . 2300 665 708 754 856 92016. Pu 'jp!' 3550 2914 2956 2988.4 3021.4 3054.417. Rivasihan 2400 1812 1848 1880.15 1919.15 1953.118. Sikkim n 9 ;r> 1075 11.75 12.7519. Tamil Nadi: 2400 1887 1915.5 1945.69 1975.22 2005.220. Tripura . 115 38.4 39.4 40.60 41.8 42.821. Uttar Pradesh . 13200 8840 S595 10312 10971 1157722. West Be-.gai . 3800 1430 1495 1514.07 1567.32 1602.32
Totai S ta tu s . 54607 29899.9 31297.9 32667.73 34102.11 35525.1 1
Total Union Territories . . 320 100 102 105 112.11 120.2j
Total States & U. Tn........................................................... 54927 29999.9 31391.9 32772.73 34214.32 35645.32
Additional P o t e n t i a l .................................................... 1400 1373 1441 1,1431
STATEMENT 6 .V.
Mid-term Review o f Sixth Plan—Minor Irrigation
Likely Physical Achievements during Sixth Plan
Sixth Plan
Target
1980-81 1981-82 1982-83 1983-84 1980-84
1 2 j 4 5 6 7
D u g w e l i s ......................................... 12.00 1.87 1.38 2.34 2.41 1.00(Lakhs Nos.)
Private Tubewells . . . . 12.00 2.44 2.10 2.14 2.32 9.00(Nos. Lakhs)
Public Tubewells . . . . 15000 2906 2147 3069 3070 21192(Nos.)
Energisation of puanpsets 25.00 3.81 3.29 3.02 3.68 13.80(Lakhs Nos.)

CHAPTER 7
R U R A L D E V E L O P M E N T A N D C O O P E R A T IO N
Alleviation of rural poverty is one of the prime
objectives of the Sixth Plan. The hard core of poverty
is to be found ia rural areas. The poorest sections belong to the families .of landless labourers, small and
marginal farmers, rural artisans. Scheduled Castes, Scheduled Tribes and social!y and economically back
ward classes. The strategy and methodology' for
accelerated rural development in the Sixth Plan is as
follows :
(a ) increasing production and productivity in
agriculture and allied sectors ;
(b ) resources and income development of vulne
rable sections of rural population through
development of the primary, secondary and
tertiary sectors ;
(c) skill formation and skT! upgrading, programmes 'o promote self and wage employ
ment amongst the rural ;-ooi
(d ) facilitating adequate availability of credit ;
(e) promo+ing marketine support to errure the
viability of production programmes ;
(f) provision of additional emplovment opportu
nities to the rural ooor for gainful employ
ment during the lean agricultural scasoii : and
(g) provision of essential m inimum needs.
7 2 W i'h a view to achieving these aims a number
of programmes have been talcen ut> dur'nrr the Sixth Plan for the development of the tarre* eroim of the
rural noor. Those orosrammes enn be classified into the following three broad categories :
H ) Resources and income development programme.
I'll) Special area development programme.
(ITT) Works programme for c-ent;^ of supplemen
tary employment opportunities.
J. IJptnvcot; <mt) rs-'vi'lonraonl
Integrated Rurn* Revelo^nen* Pro«nr!>»iiwc fTODPl
7 3 The intp"vr.tf*d Rural TVvelotwf'vt Prnommmc wa« lyn Or-toT-ior ? in nD 501 1 rl^ve-
hi-.cl'c iri r-n’ ii',tr<j Tf)f> r.'^i i nrvr-'-frvf- of
the t r d i* is to .'’-••five an operationally integrated stra
tegy for the purpose, on the one hand, of increasL:t
production and productivity in agriculture r.uc ■"
sectors', based on better use of land, water and
and, on the other, o f the development of resou; : v art;!
income of vulnerable sections of the populat;on wirt
a view to lifting the poorest of the poor above- tlr-
poverty line. This programme has completed flirce yen ■■
and its progress on a national basis has been
under : —
Tablf.
Beneficiaries Assist'., i
(M illions)
Target Achiew-
nen t
1980-81 3 .00 2
1981-8 2 3 .00
1982-83 3.00 ' O
7.4 Under this programme, assistance is availab e
for^very viab?e eoonomic activity which aims at raising
the income of the large- group. The emphasis is' on
selecting one or more schemes in which the beneficiary
has genuine interest. Th's programme is being impV-
menfed Tirough the District Rural Develormer;* Age?-
cies with the help of the block machinery. The figures
given in the previous paragraph would show that the
programme has gathered momentum. But there is sit--
n ’fican* vsration in performance among the different
Stntes. Wh'le Tamil Nadu. Andhra Pradesh. Haryan-u
Ptiniab and Rnir«than have done well, achievement in
some o ^e r States like Bihar, Orissa, West Penpal and
Maharash*ra has been below target.
7.5 The programme envisages grant of subsidies'
which amount to 25 per cent of the capita1 =.ost for
smal? farmers. 33-113 per cent for maranal farmer--,
arrricu’tura: labourers and rural arti-ans and 50 per cent
for tribal benefHan’es. Community Works are eligible1
f^r 50 per ce«f subsidv. Nearly 20 per cent of t’T<e
outlay on this programme is being utilised for strene-
4R

49
thening administrative and infrastructural support and
the by lance of 80 per cent is meant for suosidies to
the beneficiaries for acquisition of assets. The utilisation, oi' subsidy for 1RDP was Rs. 156 crores in 1 980-81, Rs. 260 crores in 1981-82 and Rs. 320.6 crores in
1982-83. The term credit utilisation was Rs. 237 cre.res
iii 1980-81, Rs. 485 crores in 1981-82 and Rs. 660
crores in 1982-83. The per capita investment was Rs. 1411 in 1980-81, Rs. 2641 in 1981-82 and Rs. 3164 in 1982-83. The annual average crcdit should
have been of the order of Rs. 600 crores for achieving
the Plan targets. Credit agencies have to step up their
performance to catch up with the backlog in the remaining years of the Plan. It should also be ensured
that credit Hows to every potentially viable scheme
which would benefit* the poorest scctic/ns of the
community.
7.6 As regards the quality of the programme, sample .studies*have been carried out by a few States. A signi
ficant point that emerges is that although 1RDP requires that the beneficiaries should be selected from the poorest
groups below the poverty Pine, it has so happened that
in quite a few States a sizeable number of the beneficiaries selected belong to the category of small and marginal farmers. The percentage of such beneficiaries
varies from Sta'e to State and is some times as high as
30 per cent. 'This has resulted because of the relatively better viability of small and marginal farmers from the
credit angle and the preference of block officials and
credit agencies for extending assistance to them. While
marginal farmers below the poverty line will rank with the poorest of the poor, it should be made clear that
small fanners should not be selected as beneficiaries at
the expense cf the poorest groups below the poverty line. To ensure proper identification of beneficiaries,
continuous monitorimr of’ the programme with close involvement of field level officials and Panchavatiraj
agencies is essential. Another weakness of the pro
gramme is the deficiency in administrative infrastruc
ture. There are still large numbers of vacancies in the
implementation set-up in the District and Block levels. Special elforts are needed to get the involvement of the
people’s representatives at the Block and village level for proper implementation of the programmes. Activi
ties supportive of the beneficiaries under the 1RDP
should be organised in an integrated manner under the general development programme. A de!ailed evalua-; tion study is being taken up by the Programme
Evaluation Organisation of the Planning Commission.
II . Special Area Development Programmes
Drought Prone Area Programme
7.7 DPAP is an integrated area development
programme in the agricultural sector for optimum utilisation cf land, water and livestock resources,
restoration of ecological balance and stabilising the
income of the people, particularly the weaker sections
of society. The programme is continuing in the Sixth
Plan period with the strategy for the development of
these areas being reoriented towards insulating the
economy of those areas from the effects of recurring
droughts through diversification of agriculture and
promoting afforestation, pasture development and soil and water conservation.
7.8 This programme has been in operation since the Fourth Five Year Plan. Upto the year 1981-82, the
programme covered 557 blocks in 74 districts cf 13 States. From 1982-83 onwards it is being implemented
in 510 blocks in 69 districts of 13 States. The coverage
of the programme has been changed on the basis of the recommendations of a Task Force which was set
up by the Government of India in June, 1980.
7.9 No plan targets were fixed for this programme.
The actual achievements during 1980— 83 under DPAP are given in Table 7.1.
Table 7. ]
Item
N o.
1
(Key indicators)
1. Soil & Moisture Conservation (Hectares)
2. Creation of irrigation potential Minor Irrigation
(Hectares) . . . . . .
3. Afforestation & Pasture Development (Hectares)
4M ilk Societies Established (Nos.) .
Sheep Societies Established (Nos.)
6. Number of Families assisted (Thousands)
(a) T o t a l ..............................................................
(b) Scheduled Castes . . . . .
(c) Scheduled Tribes . . . . .
7. Employment Generated (‘000 mandays)
5 PC/83— S
1980-81
3
159600
45228
86966
405
387
907
275
119
57170
1981-82 1982-83
(Upto Dec. *82)
4
82071
80894
75455
387
40
1519
355
173
33421
5
34750
68559
92690
279
53
410
85
94
13957

Allocation of funds both Centre and State fcxpcnouurts inc-.irrcj
1980-81 1981-82 1982*83 1980-81 19S1-S2 i982-S.:-
~ 85.05 84.6'i 81.35 73.14 73.10 39.33
Desert Development Programme (DDF )
7.11 The Desert Development Programme was
started in 1977-78 with the objective of controlling
desertification and promotion of opportunities for raising the level of production, income and employment in the areas covered. The present coverage of the pro
gramme is 126 blocks against 132 blocks till the end of 1981-82. These 126 blocks cover 21 districts in >
States.
7.12 N o Plan targets were feed. The physical achievements of this programme are as indicated
below -
T a b le 7.2
SI. Section .1980-81 1981-82 1982-S3
No. (Upto Dec.,‘82)
1 2 * 3 ~4 ~ 5~ '
! . Afforestation
(i) Plantation including roadside plantation, pasture development, fuel &
foder plantation (Herts.) . . , . , . . .
(ii) Shelter belts ( k m s .) .............................................................................................
(iii) Sand dune stabilisation (hectares': . . . . . . .
2. Irrigation potential created (heels.) . . . . . . .
9598
7034
2182
620
8412
4516
1954
2961
m i7139
2693sso,
3. Rural Electrification
Tubewells/pump sets energised (Nos.) 425 511 10
4. Agriculture
(i) Soil Survey ( H e c t a r e s ) ..........................................
(ii) Area treated under soil conservation schcroe (beets.)
30620
1425
14089
2137
116;
5. Anima! Hitsbandary
(i) New Veterinary dispensaries/Centres (Nos.) . . . . . 37
(ii) New Wool Extension centres (Nos.) .................................................. —
(iii) New Milk collection centres(Nos.) . . . . . . 311
6. Employment generated (‘000 mandays) . . . . . . . 1745
7.13 This another Centrally Sponsored Programme gress of expenditure on this programme has been as
with 50 per cent assistance from the Cenire. The pro- under :—
] 5
4
40
2425
41S
141537
Allocation of funds Central & States Share
1980-11 1981-82 1982-83
16.00 16.00 21.18
7.14 The National Committee on Development of
Backward Areas has made several recommendations
for improving the impact and coverage of the D PA P
and D D P which are under detailed examination. Mean
while on flic basis of the recommendations of a Task Force on the D PA P and DDP . the coverage of the two
(Rs. crores)
1 • v. pen J i {ure-incurred
1530-81 1931-82 1982-83
(upto Dec., ‘S2)
13.49 15.47 8.00
programmes has been revised and the criteria for allocation of funds under the D D P has been Jinked to
the area and extent of desertification as asainst the earlier criterion of fixed per block allocations. Both
these Committees have stressed the need for adopting a scientific watershed management approach within

clear! conceived perspective of land and medium term
develipment. Geared to this end, there also appears to be ar immediate need for evolving adequate indicators
of peiormance to enable more effective monitoring
and evaluation.
I l l : Yorks Programme for Creation of Supplementary
im p lo jm ent Opportunities
Natio.al Rural Employment Programme
7.1.’ 'I'he Food for Work Programme was reviewed
durin; 1980-81 and it was decided to restructure the
prognmme as the “National Rural Employment Pro- gramne (N R E P ) from October, 1980. The N REP ,
therebre, became a regular part of the Sixth Five Year Plan .rom 1st April, 1981 since when it is being
implemented as a Centrally Sponsored Programme with 50 per cent Centra! Assistance. Under this programme
generation ot additional gainful employment to the
extent cC 300—400 million mandays per year for the unemployed and under-employed in the rural areas is
envisaged. The employment generated was 420.81 million mandays in 1980-81, 354.52 million mandays
in 1981-82 ^nd 337.83 million mandays' in 1982-83.
It is expee'ed that the Sixth Plan targets would be fully achieved under this programme.
7.16 Another important objective of the programme
is the creation o f durable community asse's for strengthening the rural infrastructure. The progress achieved
in this respect d in ing the past two years is indicated in Table 7.3.
SI. iMiure of Assets
No.
1. Aea covered uadcr Aiibrosiauon an,! social forestry work* on (..iow. lanJb
2. Dmking water uells, crnu irrigation w db, G'-oup Hoiking & land
divclopment for SC.v'S>Ts
3. C.’flbtl liCtion of village iiiilkb . . . . . . . . .
4. Mnor irrigation works including dio.-.e relasii.g to ilood protecuon craniaix
:ud an;i-\vaicr togging works, construction of intermediate and main drains,
tieds channels and 'and levelling in the common area of irrigation projects
5. Sol & Water conservation Jt Land reclamation . . . . .
o. Rtral RoaJ Constructed/improved . . . .............................
7. Sctool & Balvvatli buildings, Panchayat ghars, community Centos, drinking
waer wells, drinking water sources for wild animals, cattle ponds, pinjra-
pdes, gaushates, commuuity poultry and piggery houses, batbii/g ar.u wash-
in; platforms, etc. . . . . . . . . . . .
8. Gtier wcrki . . . . . . . . . . . .
Ur.il
3
i iect.
No--.
iNos.
H,u.
liect.
Kin .s.
Nos.
Nos.
19S1.-S2
4
i,o3,3iy
yo,423
13,709
1,05,640
1,36,964
73,010
21,302
7,276
63,492
1,55,635
12,777
1,06,244
36,190
93,335
62,267
20,171
7.1' A number of problems have been encountered
in the implementation c£ this programme; particular
mentiui may be made of (a ) supply and distribution
Df fooigrains, (b ) time taken in preparation of shelf
af proects in different States; (c) non-availability oi'
technical mamralsiguide books in local languages for
.acililsing the task of Block staff; (d ) difficulties in ocal resource mobilisation; and (e) durability of assets
m d th;ir maintenance.
7.1c Another aspect of the programme which re
quired critical assessment is the content of the projects
andertjken. Works implemented through N R EP are,
jften, lo t coordinated or integrated with the require
ments )f families identified for assistance under IR D P . Potentality of N R E P works to assist newly liberated
bc-ndec labourers or to support the attempts of agricul
tural vorkers to secure m inimum wages fixed under
the lav is also not always appreciated. Stereo typed iarth ixcavation works mainly relating to kachcha
tillage- roads, reminiscent of the old famine relief
.varies, arc undertaken ignoring The fact that thi, pro- ’ ’ anim; Las a enicirJly supportive r*>le to piav for the
>ei5e Scary oriented development programme of IR D P
and other area development programmes. Further,
adequate matching funds are not always provided for
this programme in a number of States. Normal funds
of departments like PW D , Irrigation, etc., are some
times shown as the matching contribution from the States. That N R E P is an additional programme for
generating additional employment over and above what could be achieved through normal departmental acti
vities is often overlooked. Works to be selected or
undertaken under N R E P in the villages should be de
cided through popular participation and in consultation
with village panchayatsigram j^abhas. The current ten
dency to go in for building construction with high material component runs counter to the basic objective of the programme and requires to be modified. The Ministry of Rural Development is making efforts to
ensure "that the programme is implemented in the proper
manner so as to achieve its basic projectives.
IV . Trjsem
"'.19 lie ' National Scheme ut Training of Rural
You'h for <eE-erapIoyment (T R Y S E M ) has been in operation since the 15th August, 1979. The major

thrust of this scheme is on equipping rural Youth with
necessary skills and technology to enable them to take up vocations on a self-employment basis. The Sixth
Plan target for training rural youth is 2 lakhs per annum, i.e. 40 youth per block every year. The figures
of people trained and people sePi-cmploycd during the
past three years arc as follows : —
Year Youth Y o u thtrained self-em-
p oy..d
1980-81 1.22,596 4-V94
1981-82 2,02,417 98,189
1982-83 . . . . . . 1,84,990 95,031
7.20 A provision of Rs. 5 crores has been made in the Sixth Plan tor strengthening infrastructure for
TRYSEM , out of which about Rs. 1.4 crores were
utilised in the first two years. For 1982-83 an outlay
of Rs. 1.5 crores was provided. Subsidy and credit for
enabling the trainees to set up ventures are met out oi'
IR D P funds. Evaluation studies conducted in some
States have highlighted ccrtain problems like i'ack of
finance and lack o i confidence among the trainees in the implementation of this programme. There is need
to have an integrated system of supply of raw materials
and marketing of products through cooperatives or
government-sponsored agencies like Rural Marketing
Congress, Crcdit Institutions, Banks etc. Greater atten
tion would also have to be given to the diversification of activities for self-employment of the trainees, since whatever units have come up so far, are largely only
in the fields of poultry, dairying and allied activities.
7.21 It appears to be a little too optimistic to expcct rural youth from the poor families to set up industry
business or services ventures on their own. A more
practical and modest objective of the programme would
be to enable trainees to get wage employment in smalf
and village industries and' under artisans after gi\n
them the necessary training.
7.22 Another way of improving the effectiveness • [
the programme would be to enable selected 1 i Is to sot up a T R Y SE M Wing where rural youths without formal
education could be given practical training in simpie
skiiis.
Co-operation
7.23 The strategy for development oi cooperai; >t
during the Sixth Five Year Plan is as under : —
(i) Drawing up a clearly conceived action pro gramme for strengthening of primary viiiag
societies so that they are able to act eiicc a . 1 as multi-purpose units catering to the divers
needs of their members;
(ii) Re-examination of the existing co-operarv
policies and procedures with a view to u suring that the efforts of the co.-operativ\
are more systematically directed townrc ameliorating the economic conditions of d rural poor;
(iii) Re-orientation and consolidation of the io of the co-operative federal organisations ;
that they arc 'able, through their constiU’..: organisations, to effectively support a rapid diversifying and expanding agricultural sectc
including horticulture, food processing, pen try, dairying, fishery, animal husbandi
sericulture, etc. with credit, in pm supp
marketing and other service^: and
(iv) Development of professional manpower a appropriate professional1 cadres to m managerial positions.
7.24 The Sixth Plan targets for the co-operative pi
grammes and the progress recorded is given below table 7.4.
T a b l e -7.4
(Rs. in crores)
Programme Base, level ant. ach. 1979-80
Level for the
term inalvear1984-85
1980-81 Ant. Ach.
1981-82 Ant. Ach.
1982-S3 A nt. Ach.
198.'-T ar^s
1. Short term loans . . . . 1300 2500 1385 1525 1900 ;;
2. M edium term loans 125 240 279 321 200
3. Long-term loans . . . . 275 555 364 408 440
4. V a lu i ot Agricultural produce marketed . . . . . . i 750 2500 1950 210=1 23^11 " M
5. Value o f retail s iie o f fertilisers ■WO 1600 1114 1248 1200 1 '
6. V ah u o f consumer good.-, distributed by Urban consumer co-operatives . ' 800 1600 9:o I oon 1 i-i0 i
7. Value o f consumer goi.d-; distributed
in rural areas . . . to.) 2000 * i >9 10sr.

53
7.25 It will be noted that the progress in the dis
bursement of cooperative jhcrt-term creak d .ring1980-81 ard 1981-82 was below the H an expe.t.;-
ti".ns. The main bottleneck in the exp::nsi.:n of ere it
has been drought conditions in some parts oi' the
: country and continued existence of high le\ cl of
■ overdue* in some States p.irticula’ ly As am, Bihar,
• Guja.at, J&K, Maharashtra and West Bengal. The■ disbursement of term loans has, however, recorded
; satisfactory progress. Significant expansion oi co
operative credit woald be nece sary in the remaining
period of the Sixth Plan. W ith a view to meeting
adequately the short-term, medium-term and long
term credit requirements of agriculture, rural dc\e-
lopniom and small scale industries in rund arms, a National Bank for Agriculture and Rural Develop
ment has been established with effect from July 12.
1982. With the coming into operation of this bank,
a significant increase in the How of co-operative credit
is expected to take place in the coming years. It
would also be necessary to take concerted steps to
improve the reooxcry position of the credit institu
tions and reduce their ovcrducs. Steps would also
have to be taken to ensure substantial increase in the flow of institutional credit to small farmers, marginal
farmers, tenan’s, share cropers, agricultural labourers, rural artisans and self-employed.
7.26 In the field of marketing of agricultural pro
duce, the co-operatives recorded good progress during
[980-81 and 1981-82. The slow progress in lctailing
of fertilizers through cooperatives has been partly due to stagnation in the credit flow and part<y due to
increase in their prices. The progress of consumer
cooperatives have also lagged behind the Sixth Plan
expectations, mainly becau c of the share of co opera
tives in the consumer business has come down with
the setting up of Civil Supplies Corporations in Some
Suites. As regards consumer business in rural areas,
the slow progress was due to lack cf adequate sup
plies of essential' goods like kerosene od and controlled
cloth, and the absence of accessary sun! arid storage facilities.
Financial Outlays
7.27 An outlay of Rs. 2314.87 crores has been
provided in the Central Plan for programmes covered under R ical Development including Co-operation.
The procrcss of expenditure so far is siven in Table
7.5.
I I „\i;l oi developm.,'!)!
I
1. F'UepMtix! R u ra l Dev . & related
progra'iime-, . . . . .
2. N a t io n a l R u r a l l .n ip lo y m cn t Pro-
gramme . . . . .3. C .-m m un i ty D ev e lo p m e n t & Punel'ii-
v ;l> I Vstitutions .
C eope ra tion
'Iota!
SK tli H.so-s 1
IVw A-u.'.sOutlay
(O rig ina l)
'>97.55 142.. 69
980.0'} 345.85
7.17 1.21
1981-82
'v.T'iu .ij.'*
4
IS2. 38
188..12
198'-83
(Rs. ni crores)
4 Balanee1983-84 1980-84
oa'uv o './■f3 ; ■! ; - 5 6) !o
1984-8
22;!. 70
is0.00
3 5 0 .I: 43 .72
t . 64 Included
under Hern N o . 1
65.12 75.69
269.30
1 .70
523.07
M-t >7
174.48
65. 73
2.62
437.56 484.39
77.89 262.42
548.89 2004.31 3 i u . 56
La)ul Reforms
7.28 Development efforts will tend to by-pass the majority of the rural poor if their lack of absorptive
capacity arising out of productive assetlessness is
not rectified. Land reform which -envisages distribu
tion of surplus land among the landless and security
of tenancy for the unprotected tenants!share croppers
provides the critical element for triggering off the
process of development among the rural destitute.
Land asset endowment to the landLss is one of the
basic pre-requistes for initiating a programme of economic uplift of the landless,
7.29 Upto July. 1983, 43.31 lakh acres of land
had been declared surplus under the revised land
cc-iliup laws enacted in the light of the National Guide
lines. 29.45 lakh acres have been taken over bv the States anti, out of this, 20.05 lakh acres have been
distributed among 14.82 lakh eligible families of landless agricultural workers and other sections of the
rural poor. 6.15 lakh families belong to the Scheduled
Castes and 1.88 lakh to the Scheduled Tribes, together
accounting for 54.15 per cent of the total number of
beneficiary families and 52 per cent of the total area distributed. Since the inception of Hie New 20 Point
Programme 3.99 lakh acres have been declared sur
plus, 3.13 lakh areas have been taken possession of
and 1.47 lakh acres have been distributed to 1.11 lakh eligible families.
7.30 12.18 lakh acres of land declared surplus by Revenue Officers and Revenue Tribunals is held up
in litigation. The pendency in Civil Courts is parti
cularly high in the Suites or -\iidhr.i Pradesh, Bihar.
Madhva Pradesh, Maharashtra and West Peneai.“-iis'iraLiven its. State GovernmentsWithin
are trying to get these cases disposed of either In

i i
;uv;m; Special Benches or by having Special CeUs of
lawyers in the concerned courts. N-iorc than 6.44
lakh acres of area already taken possession of is not
distributed because of its unsuitability for agriculture.
1 his is exported to be reserved for public purposes like social forestry, etc.
7.31 W'-tli a view to assisting allottees cf cciitng
surplus lands to take to productive cultivation, a
central sector scheme was taken up for implementa
tion in J 975-76. Under the scheme financial assis
tance of Rs. 1,000 per hectare is ghcn as an outright grant. The cost cf the scheme is »hared between ihe
Centre and the States equally. A provision of Rs. 30
crores was made for the scheme in the Sixth Five
Year Plan 1980— 85 in the Central Sector. The ex
penditure under this scheme was Rs. 0.54 crore in
1981-82, Rs. 1.13 crores in 1981-82, Rs. 0.98 crore in 1982-83.
Land Records
7.32 '1 lie Sixth l ive Year Plan recommended
that a sj stematie programme should be taken up for
compilationjupdating of land records and completed
within a period of 5 years. Under the new 20-Point Programme, it has been emphasized that compilation
and updating of land records should be completed
with the utmost urgency. Correct and up-to-date
land records are not only necessary for effective
implementation of land reform measures but also to
enable How of credit to small landholders.
7.33 In the ex-iiiiormuiiary areas, the records
were not regularly maintained and were largely out of
date. In addition, large tracts in hilly areas, where
the concept of community ownership is in vogue,
remained un-surveyed. Resurvey operations are being
carried out in the State of Andhra Pradesh, Assam,
Bihar, Gujarat, H imachal Pradesh, Kerala, Madhya Pradesh, Manipur, Meghalaya, Orissa. Sikkim, Tri
pura aud West Bengal under the State Plans. As re
ported by some of the State Governments, financial
constraint is the main factor for the slow execution
of this programme.
7.34 In Andhra Pradesh, Bihar, Haryana, Karna
taka, Vbdhva Pradesh, Punjab, Maharashtra. Orissa, Rajasthan, Tamil Nadu and U ttar Pradesh, pass books
are being issued to landowners on the basis of entries
in the record of rights.
Tenancy Reforms
7.35 The National Policy on Tenancy aims at security of tenure for tenants. i.egulation and fixation
of rents, at one-fourth to one-fifth of the gross produ.ee
and progressive transfer of ownership to tenants.
Almost all the States have enacted legislation provkl ing for security of tenure to tenants and their laws
prohibit ejectment of such tenants except under cer
tain conditions. As a result, about 7 million tenants
share cropper have acquired ownership right. In
West Bengal share-croppers are being registered in
the record of rights under a special programme to
enable them to get the benefit of security of tenancy.
So far o\er 1.1, m illion share-croppers have benefited
from this programme. The State-wise figures of the
tenants and share-croppers registered is indicated
below:
si.No.
Slaiei No. o f Tenantv Share-croppers
registered
0 ) 12)
1. AvjUM .
2. Gujurul .
3. K o a la .
4. Karnataka
5 Maharashtra
0. Tamil N adu
7. West Bengal
T o t a l
Cv
2,51,159
10,50,000
2 ;,40,0u0
4.76.000
12.53.000
4, i 2,280
11.03.000
70,15,439
7.36 Rents have been reduced from 1J4th to lj5 th of the gross produce in all States excepting Andhra
Pradesh, Haryana and Punjab. Efforts are being madeio bring down the fevel of rent in these States also.
7.37 Unless the beneficiaries of land reform, most of whom belong to the poorest segments of the com
munity, are supported by other ongoing rural development schemes like IR D P , D PA P , N REP , etc., it
would be difficult for (hem to make productive use of the land or to reap the benefit of security of tenancy.
Hence a conscious policy has to be followed for con
vergence of benefit from other schemes to the benefi
ciaries of land reforms to make them economically
\iabie. The immediate credit needs of the beneficiaries require to be satisfied through institutional sources
as trie old links would be snapped in the post-reform
stage. The mechnism evolved in this regard in West
Bengal for the recorded share-croppers and assigness of ceiling surplus land may be adopted with suitable
changes in' other areas also.

CHAPTER 8
V IL L A G E \NI3 S M A U . IN D U ST RIES
i lie? programmes of the Village & Small Indus
tries Seaor as outlined in the Sixth Plan 1980— 85
were to sub-serve the objecthtes of improvement in
the le'.vels of production and earnings through meas
ures liike upgradation of skills and technologic-;,
creation of addition.-1.! employment opportunities f n a dispersed and decentralised basis, fuller utilisation
of existing installed capacities, establishment of a
wider entrepreneurial base through appropriate training atnd package of incentives and expanded effort'' in exiport promotion.
8.2 T ie policy support for implementation of
development programmes for Village & Small Indus
tries bias been ia the direction of :
( i) I nterg ration of promotional programmes with other area development programmes
particularly in the Integrated Rural Development ( IR D ) areas.
(in) Restructuring of the organisational base at the district level to make it more effective
and result-oriented,
(iui) Development of appropriate technologies
atid skills,
i i v ) Arrangements for increased availabilities of raw materials,
('v) Accelerated flow of institutional credit,
(vi ) Selective reservation of items for exclusive production and purchase from the cottage
and small industries as well as effective
promotion of ancillaries.
(viii) Strengthening and expansion of the cooper
ative form of organisation, and
(viii ) Building up of a sound data base to facili
tate proper policy formulation and evalua
tion.
8.3 ‘Some policy measures haev already beer taken
with respect to integration of the promotional
programmes in the cottage & village industries sector
.vith tine IR D programme. Necessary guidelines have
Seen issued for identifying the beneficiaries for im-
provemtent in cottage and village industries along-
with tine package of assistance to be given to them.
Hie Klnadi & Village Industries Commission (K .VIC)
vvas nr.ade responsible to cover beneficiaries at the
rate of 50 families per block per year under the IR D .
A decision to restructure the organisational set up
of District Industries Centres (D IC ) with a view to strengthening their technological competence has
been taken. In the field of industrial cooperatives,
the scheme of coopcrativi?ation of the coir industry
recommended by the High Level St'ucly Team has been taken up for implementation. A scheme for
setting up of industrial cooperatives in the handicrafts
sector has also been approved.
8.4 In order to provide the necessary technical
input to the rural industries a Council for Advance
ment of Rural Technology (C A R T ) has been regis
tered in Oct. 1982 and the Council and Executive
Committee formed in April,. 1983. Technical & tech
nological improvements have been effected in the
spinning sector and in the weaving sector and also
through addition of power ised j improved processes. Mention may be made of pot charkha which incorpo
rates semi open-end spinning technology, 4— spindle
wool spinning charkha incorporating ring spinning
technology and 10— spindle coarse count spinning
charkha with higher revolutions per minute. On the
processing side, improvements have been effected
through the introduction o f small mercerising equipment capable of handling 25 kgs of yarn per shift
and thermostating resin treatment for anti-crease
properties. A power-driven portable ghani has also
been introduced. Improvements have also been effec
ted in bio-gas plants, power operated potter’s wheel,
toilet and liquid soap manufacture.
8.5 To upgrade the technology of small scale
sector a scheme for setting up o f Product-cum-Pro-
cess Development Centres (P PD C ) is being taken up.
Existing Field Testing Stations have been strengthen
ed and new ones created to assist in improving the quality standards of small industry products. Tool
room facilities are being strengthened.
8.6 In the field of sericulture, a Central Silk Tech
nological Research Institute (C ST R I) is being
established by the Central Silk Board (CSB) essen
tially for improvements in post-cocoon technology and finishing of silk fabrics.
8.7 In the case of handlooms, a National Hand-
loom Development and Financing Corporation has
been set up to attend, inter-alia, to the problem of
yarn supply to handloom weavers at reasonable pri
ces. The Rural Marketing Centres (R M C ) were set
up on a pilot basis at the block level for the supply
of raw materials required by the artisans and tiny
units and provide the necessary marketing support.
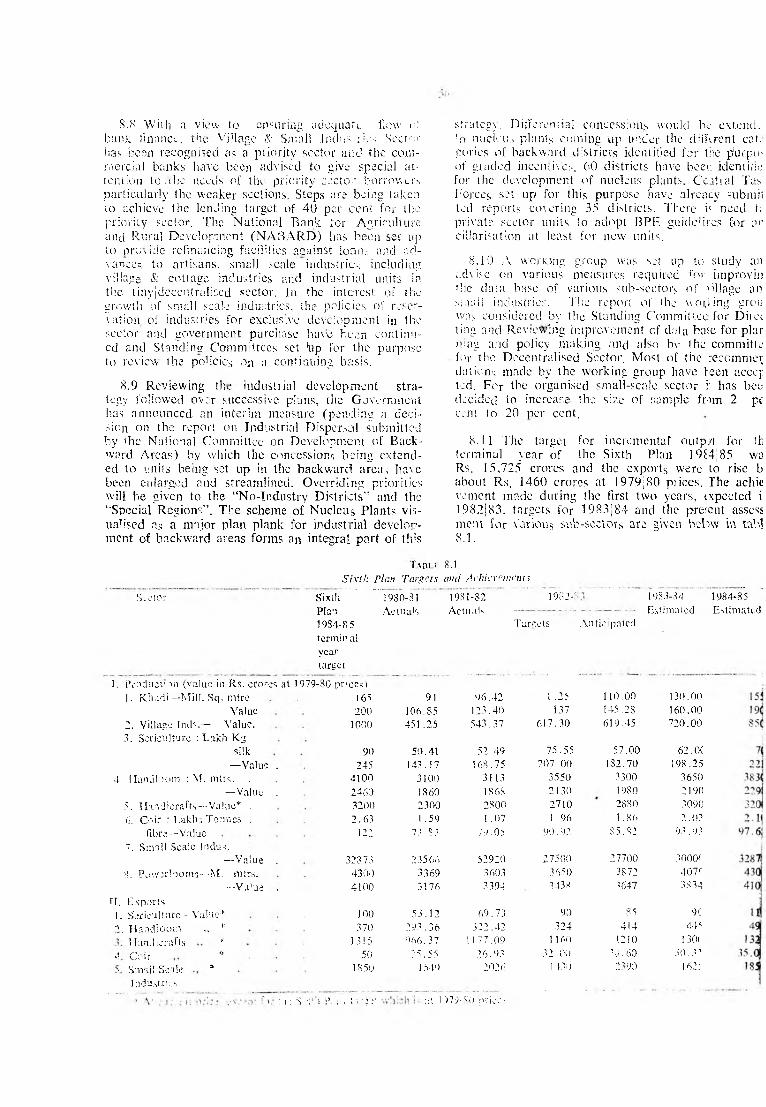
8.8 W illi a view to ensuring adequate flaw of
bank finance, the Village & Small Indns.ries Sector
has been recognised as a priority scctor and the com
mercial banks have been advised to give special at
tention to - the needs of the priority secto;* borrow er-,
particularly the weaker sections. Steps are being taken
to achieve the lending target of 40 per cent for the
priority sec I or. The National Bank for Agriculture
and Rural Development (N A 8A R D ) has been set up
to pro>idc refinancing facilities asainst loan:, and ad
vances to artisans, small scale industries including
village & cottage industries and industrial units in
the tinyjdecentralised sector. In the interest of the growth of small scale industries, the policies of reser
vation of industries for exclusive development in the
sector and government purchase have been continu
ed and Standing Committees set top for the purpose
to review the policies on a continuing basis.
8.9 Reviewing the industrial development stra
tegy followed over successive plans, the Government
has announced an interim measure (pending a deci
sion on the report on Industrial Dispersal submitted
by the National Committee on Development of Back
ward Areas) by which the concessions being extend
ed to units being set up in the backward area.; have
been enlarged and streamlined. Overriding priorities
will be given to the “No-Industry Districts” and the
“Special Regions'’. The scheme of Nucleus Plants vis
ualised as a major plan plank for industrial develop
ment of backward areas forms an integral part of this
strategy. Differential concessions would be ext.cink
fo nucleus plants coming up under the different cat, gories of backward districts identified for the ptorpo-
of guided incentives. 60 districts have beer, identify for the development of nucleus plants. Ceatial "fas
Forces set up for this purpose have already submit
ted reports co\ering 35 districts. There i< need 1c
private sector units to adopt BPE guide'ires for an
ci!!arisation at least for new units.
8.10 A working group was set up to study an
advise on various measures required for improvin
the data base of various sub-sector? of Ullage an
small industries. The report of the worling grou was considered by the Standing Committee for Direc
ting and Reviewing improvement of data base for plar
mng and policy making and also by the committe for the Decentralised Sector. Most of the :ecomme£
dations made by the working group have Veen acccp
ted. For the organised small-scale sector i: has bee
decided to increase the size of sample from 2 pt
cent to 20 per cent.
8.11 The target for incremental outp.it for !h
terminal year of the Sixth Plan 19£4j85 v/a
Rs. 15,725 crores and the exports were to rise b
about Rs. 1460 crores at 1979; SO prices. The achie
vement made during the first two years, cxpected i:
1982183, targets for 1983]84 and the present assess
mem ior Various sub-sectors are given befow in tab!8 .1 .
rmu i s.iSixth Plan Targets and Achievements
S. clor Sixth
Plan
1034-8 5
term inal
year
target
19SO-31
Actuals
1981-82
Actuals
1982-'
Tareets Anticipated
1983-34
Estimated
I. Product' m (value in Rs. crores at 1979-80 prces)
1. K h a d i—M ill. Sq. nitre 165 91 96.42 ! .25 110.00 130.00
Value 200 106.85 123.40 137 145.28 160.00
2. Village Inds.— Value.
3, Sericulture : L akh Kg
1000 451.25 543.37 617.30 619.45 720.00
silk 90 50.41 52.49 75.55 57.00 62 .0C
— Value . 245 143.17 168.75 207.00 182.70 198.25
4. 1-Iandloom : M . mtrs. . 4100 3100 3113 3550 3300 3650
— Value . 2460 I860 1868 2 1 30 1980 2190
5. H and icra fts—Value* . 3200 2300 2800 2710 2880 3090
6. Coir : Lakhs Tonnes . 2.63 1.59 1 .07 1 .96 1 .86 2.02
fibre— Value
7. Small Scale Indus.
122 73.83 79.05 90.92 85.82 93 .93
— Value . 32373 23566 52920 27500 27700 3000C
8. Pcw jr!ootns--M . mtrs. 4300 3369 3603 3650 3872 407f
tl.
--Value .
Exports
4100 3176 339-1 3438 3647 3834
1. Sericulture - Value* 100 53.12 69.73 90 85 9(
->. H and loom ,, * 370 293.36 322.42 324 414 445
Handicrafts * 1315 •">66.37 1 I 77.09 1 160 1210 1 30<
j Coir ■* 50 25 .55 26.93 32.00 23.60 30.3?
> Sni'iil Scale *
Industries
1850 1 549 2026 1 430 2.'90 1 62.'
'. 1: S v. 1 i\ i ) t > ’.pi :e f :)7')- so price-:
1984-85
Estimated
5 .12 Jt would be seen from the above tabic thatii is only in the case of small, scale industries, power-
looms and handicrafts that the output is expected
to be in keeping with the targets of the Sixth Five
Year Plan. In traditional industries, there may be
substantial shortfalls. As regards exports, in the case ot; coir, there will be shortfall even at current prices,
l or other sub-sectors, the exports at current prices
are likely to exceed the targets.
Khadi and Village Industries
8.13 During the Sixth Plan, the khadi and village
industries programme has been assigned an impor
tant role in the generation of employment opportunities. O f about 2 m illion additional employment
target ted for the Plan period, about 10 lakhs was to
he generated through appropriate linkage and co
ordination of the K V l programme with the IR D pro
gramme under which beneficiaries at the rate of 50
families per block were to be identified. However,
progress on this front has been somewhat slow be
cause of certain operational difficulties as to the
identification of the appropriate fie'd agency to im
plement the cottage and village industries programme as a component of the IR D Programme. It has
since been decided that, in whichever block the
KV IC has its own agency ,the implementation as well
as monitor ng of the cottage and village industries programme would he done by that agency. According
ly, the K V IC had taken up 200 blocks in 1982-83
and proposes to take up 300 blocks cach in 1983-84
and 1984-85 for implementation of the IR D pro
gramme. In the context of this, the target of gene
ration of employment opportunities as a component of the IR D programme would be only partvalPy
achieved.
8.14 On the organisational plane it was, inter-
u!ia, envisaged that the State K V I Boards would be
revitalised. A ‘model’ bill for amending the consti
tution of the State K V I boards to establish better
linkages with K V IC and incorporate other items
such as official membership, accountability to State
legi lature etc. has been circulated to the States. The
progress in this regard has not been very' encourag-
i ng.
8.15 During the course of the first 3 years of the
Sixth Plan, the K V IC have taken some measures for
development of the khadi and village industries. The
Reserve Bank of India have since included the K V I
activities and the K V I institutions in the ‘priority’
sector for bank finance with the benefit of lower mar
gins and lower rate of interest (of 13.5 per cent).
A l :b?rali?ed pattern of assistance has been e1 tene'ed
to the physically handicapped so as to provide incre
asing avenues of employment to them in the KVI
sector. Activities benefiting the scheduled castes and
tribes like leather, fibre, forest-based product,
bee-keeping, cane and bamboo and silk have been
identified for intensive development. The employment of SC 1ST in the overall context is expected to
increace from 25 per cent to 36 per cent by the ter
minal vear of the Sixth Plan. Participation of women
s I T / S ’ <J
is likely to go up lrom 45 per cent to 48 per cent dur
ing the Plan period.
8.16 Subsequent to the introduction of New Model
Charkha (N M C) and semi-automatic looms, the productivity of spinners and weavers have gone up and
the level of fuller employment also has moved from
7-8 per cent about 10 years ago to about 30 per cent
obtainable at present. The N M C yarn constituted about 45 per cent of the total khadi yarn production
in 1981-82 as against 33 per cent in 1S79-80. The
quality of yarn has also improved substantially which
can be utilised by handlooms during shortage of mill
hank yam . This has enhanced 'the quality of khadi
fabrics in general and that of many end-use products
like ready-made garments and others. In the case of
poly vast ra, certain post-i'oom processing problems have surfaced. Against the Sixth Plan target of pro
duction of Rs. 54 crores, the actual production in
1981-82 was of the value of about 1.0 crore only.
The question of assisting individual artisans, besides the registered institu'ions and the cooperative societies
is proposed to be examined to facilitate extension of the coverage of the K V IC programme.
8.17 A t the time of the formulation of Sixth Plan,
it was envisaged that there would be adequate
credit flow from commercial hanks for this sector.
Although adquate efforts have been made by K V IC to obtain credit facilities from the institutions these
b.-\sz r.cl become available to the extent anticipated.
Additional budgetary outlav might be required for this sector.
Small Scale Industry
8.18 Small scale industry exceeded the targetted
growth rate envisaged during the first three years
and according to the available indications, the tar
get set for Sixth Five Year Plan is likely to be achieved. This has been mainly possible due to a number of
policy measures taken during the first three years. The availability of raw materials has been substantially
enhanced. The quantity of iron and steel supplied through State Industries Development Corporations
was significantly stepped up. Orders have also been
issued for the supply of levy cement for small and tiny
units using cement as a raw meterial. The import
po'icy has been liberalised and supply of imported
pig iron was arranged at the stock yard. The value
cf import licences issued to small scale units went
up substantially and a large number of items were brought under O G L category for actual users.
8.19 Another notable feature has been the availability of credit on easy terms to the smafl scale sector. The loans outstanding from small scale indu
stry went up from Rs. 3106 crores in January, 1981 to Rs. 3893 crores by January, 1982. Next to agri
culture, small scale industries were the major beneficiaries of the allocation of credit to priority sectors.
Under the Credit Guarantee Scheme, claims amounting to Rs. 104.18 crores have been invoked by June,
1981 against a total default of Rs. 203 crores as on
March. 1981. It has been estimated that a total amount of Rs. 80 crores will be needed against the pro
vision of Rs. 42.50 crore- durina the Sixth Plan
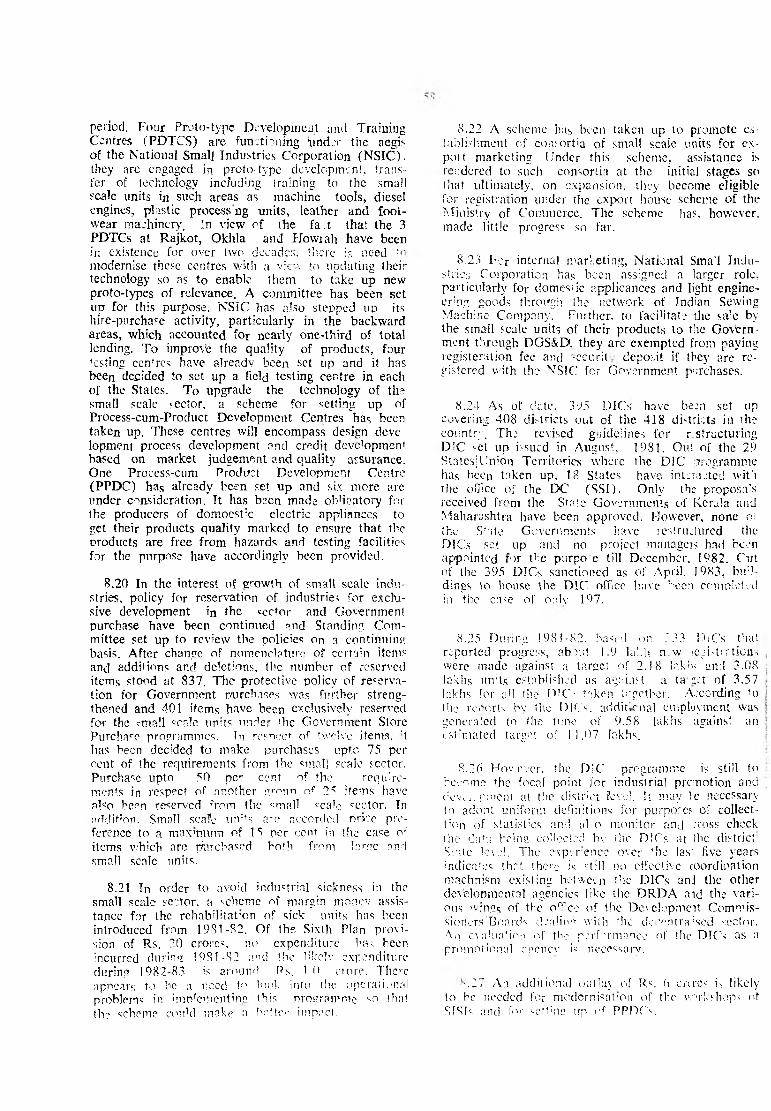
period. Four Proto-type Development and Training Centres (PDTCS) are fun .tinning under the aegis
of the National Smal] Industries Corporation (N S IC ).
they are engaged in proto-type development, transfer of technology including (raining to the small
scale units in such areas as machine tools, diesel
engines, plastic processng units, leather and foot
wear machinery. In view of the fact that the 3
PDTCs at Rajkot, Okhla and Howrah have been
in existence for over two decadcs, there is need tf' modernise these centres with a view to updating their technology so as to enable them to take up new
proto-types of relevance. A committee has been set
up for this purpose. N S IC has also stepped up its hire-purchase activity, particularly in the backward
areas, which accounted for nearly one-third of total lending. To improve the quality of products, four
lesting cenfres have already been set up and it has
been decided to set up a field testing centre in each
of the States. To upgrade the technology of the small scale rector, a scheme for setting up of
Process-cum-Product Development Centres has been
taken up. These centres will encompass design deve
lopment process development and credit development based on market judgement and quality assurance.
One Process-cum Product Development Centre
(PPDC) has already been set up and six more are
under consideration. It has been made obligatory for
the producers of domoestic electric appliances to
get their products quality marked to ensure that the
products are free from hazards and testing facilities
for the purpose have accordingly been provided.
8.20 In the interest of growth of small scale indu
stries, policy for reservation of industries for exclu
sive development in the sector and Government
purchase have been continued and Standing Com
mittee set up to review the policies on a continuing
basis. After change of nomenclature of ccrtain items
and additions and deletions, the number of reserved
items stood at 837. The protective policy of reserva
tion for Government purchases was further streng
thened and 401 items have been exclusively reserved
for the email «cn!c units under <hc Government Store
Purcharc programmes. In rcsnect of tw e lve items, ’t has been decided to make purchases upt.c 75 per
cent of the requirements from the small scale sector.
Purchase upto 50 per cent of the require
ments in respect of another group of 25 items have
aI«o been reserved from the small scale sector. Tn
addition. Small scafe uni's arc accorded price pre
ference to a max’mum of 15 per cent in the case or
items which are purchased both from Inrse and
small scale units.
8.21 In order to avoid industrial sickness in the
small scale sector, a scheme of margin monev assis
tance for the rehabilitat’on of sick units has been
introduced from 1981-82. O f the Sixth Plan provision of Rs. 20 crores, no expenditure ha-; been
incurred during 1931 -82 and the Hlcelv expenditure
during 1982-83 is around Rs. 1.0 crorc. There
appears to he a need to loo], jnto the operational
problems in implementing this procram me “-o tha t
the scheme could m a k e a better impact.
8.22 A scheme has been taken up to promote es
tablishment of consortia of small scale units for ex
port marketing. Under this scheme, assistance is
rendered to such consortia at the initial stages so
that ultimately, on expansion, they become eligible
for registration under the export house scheme of the
Ministry of Commerce. The scheme has, however,
made little progress so far.
8.23 For internal marketing, National Sma'l Indu
stries Corporation has been assigned a larger role, particularly for domestic applicances and light engine
ering goods through the network of Indian Sewing
Machine Company. Further, to facilitate the sa'c by the small scale units of their products to the Govern'
ment through DGS&D, they are exempted from paying
registeration fee and -ecurit deposit if they are re
gistered with the NSIC for Government purchases.
8.24 As of date. 395 D ICs have been set up
covering 408 districts out of the 418 di>tricts in the
country. The revised guidelines for p.structuring
D ’C set up issued in August, 1981. Out of the 29
States j Union Territories where the D iC programme
has been taken up. 18 States have interaetcd with
the office of the DC (SS I). Only the proposa's
received from the Stare Governments of Kerala and
Maharashtra have been approved. However, none oi
the S'ate Governments have restructured the DICs set up and no project managers had been
appointed for the purpo e till December. 1982. Cut of the 395 D ICs sanctioned as of April. 1983, bud
dings to house the D IC office have been completed
in the ca;e of or>1v 197.
8.25 Daring 1981-82. based on '33 DiC's that
reported progress, ab)ut 1.9 lakh n .w ic^i-tTtions were made against a target of 2.18 lak!'-' and 3.08
lakhs units established as against a tazet of 3.57
lakhs for ah the D'C- taken together. According <o
the re.'ork by the DICs. additional employment was generated to the tune of 9.58 lakhs against an
estimated target o!' 11.07 lakhs.
8.26 Hov ever, the D IC programme is still to
become the focal point for industrial promotion and
dev..!, pnent at the district ?evel. 1? may le necessary
to adopt uniform definitions for purpose? of collect
io n of statistics a.nd al o monitor and eross check
the data bcins collected bv the D iCs at the district
S'.nte level. The csperence over *he las: five years
indicates thrt thec is still no effective coordination
machnism existing between the D ICs anj the other developmental agencies like the D R D A a id the vari
ous wings of the o°'ce of the Development Commis
sioners’Boards dealing with the de v>ntra !sed sector. Ail evahia'iop of the performance of the DICs as a promotional agency is necessary.
• 0 7 An additional outlay of Rs. h crcres is likely to be needed for modernisation of the workshops ot
SISK and for setting irp of PPDCv

59
< oir
5.28 The development ot the coir industry has not been satisfactory so far. Production in the first
two years o>f the Sixth Five Year Plan was lower than
the production achieved in the base year 1979-80
and according to the available information the pro
duction in 1 982-83 is likeK to be around the 1979-80 level of production. Judging from the production achievement: of the first three years, the target
envisaged f'or Sixth Five Year Plan may not be
achieved. The exports of coir products have also
declined dicring the first three veais due to rcee.sMc-!i
: i European countries. .'eveiv competition from synthetic substitutes and non-competitiveness in
terms of dost. There might be substantial shortfall
m the export targets of coir and coir products.
8.29 The problems of the coir industry have been
examined by a High Level Study Team. As recommended by this Study i cam. the scheme oi' co-operatW
visation of icoir has already been approved and action plan has been initiated. There is need to expedite a
decision on other recommendations of the High Level Team.
8.30 The:re has been some improvement in the
industry in responding to the needs for adopting programmes; of quality improvement, product bet ter-
inentjdiversiification o* use;', design development and
bcUti ra?,tiK'eUng \edY.Viv',yc:.. T’ncic ',s vtrswu ths&I
■or intensification of research activities lor product
diversification as well as alternative uses of coir.
Coir mattii'.g is being promoted as barricading
medium in coal mines and 'die sea erosion measures. National Ins'itute of Design is also
engaged ini the improvements in desisn of coir products. T here seem to be need for further intensive efforts to piromote coir products in industrial use.
Revamping the functions of the Coir Board is also
necessary. As the developmental programmes have
not gained sufficient momentum, the level of utilisa
tion of fumds would be less and a saving of Rs. 4
crores wouild accrue.
Handloom?*
8.31 Tine main thrust of the handloom develop
ment programme has been to provide assistance in
terms of inputs to the industry including raw
materials, ,credit and marketing cf the products as well as progressive cooperativisation of handloom
weavers so as to eliminate exploitation at the hands
of the micldlemen. The NHPDC 's functions would include procurement and distribution of hank yarn
and other raw material's to handloom sector, opening
of retail outlets and financing of spinning'reeling
units in t'he non-cooperative sector. Other pro-
grammes include expansion of technical facilities through si'-ppiy 0f improved tools and equipments,
strengthening of the Institutes of Handloom Techno
logy, modernisation,1 re novation of looms to increase productivity and reduce fatigue and drudgery,
provision of pre-loom and post loom proccssiny, facilities o* dveing. bleaching. mercerising,
Centering, printing, sizing, calendering etc, ,o that
the vah.e-:.ddcd council! could be increased, resulting
in higher earnings to the handloom weavers. In order
to enable the handloom sector to register faster
growth in blended fabrics, fu ll excise duty exemption
has been given ter polys ter blended fabrics woven
on handlooms from process stage duties by units set
up by the State Huucdoom Development Corporations
and Apex Cooperative Societies.
8.32 The total number of handlooms (excluding
domestic looms in some States) in the country has
been estimated at about three m illion in the begin
ning of the Sixth Plan. So far, about 16.8 lakh wea
vers have been brought w ithin the co-operative fold
and the number is expected to increase to 19.75
lakh weave, s under the programme of co-operativi-
sation.
8.33 About L5uU0 looms were estimated to have
been modernise jjrenc>va ted during each of the years 1981-82 anu 198.2-8 3. Composite processing facili
ties for over 70 million metres of cloth per year have
been created in the handloom sector so far. A new institute of Ha.ndlocui Technology at Gauhati to
serve the North Eastern Region has started func-
. tioning.
8.34 Tlie hauuloom industry has recorded a growth rate of 7.? p>cr cent during the first two years
of the Plan. Based on the production of 3300 m il
lion metres in 198 2-S3, it is estimated that the hand-
looni sector will fall short of the target of 4100 m il
lion metres and the likely achievement w'ould be
around 3-830 million, metres in 1984-85.
8.35 l or providing increased supply of hank yarn
to handloom weavers.., a scheme of setting up|expan-
sion of weavers’ Coope.ative Spinning Mills has been
included in the Sixth Plan, with a provision of Rs. 32
crores. 13 new mills are proposed to be set up and
6 existing mills strengthened. However, the progress
of setting up of mills under the scheme is tardy and
there is a considerable time lag in sanctions and ac
tual releases!utilisation of funds. In the first two years
of the Sixth Plan, release of funds has been about
Rs. 6.9 crores against a sanction of Rs. 29.33 crores
during the period amd no new m ill has yet gone on
stream in the hanidlooin weavers’ cooperative sector.
Implementation of the scheme would require to be
monitored periodically to prevent time and cost
oxer-run-. The S;xth Plan provides that new spin
ning mills should be set up in yarn deficit areas hav
ing concentration of handlooms such as the North
Eastern Region, An additional Rs. 10 crores would
be needed on account of longer gestatio.n period esca-
i'at'on in co:-t and for initiating action in yam deficit areas.
8.37 As envisaged in the Textile policy, the proart men t of Textiles to determine the cost handicaps
suffered by the handloom sector vis-a-vis power- looms. The Report of this Study Group is expected to be submitted shortly.
A-. L>iV!-.u;ai it, the Textile policy, the production e:i Jn iu ’n do th in the handloom sector has been progu'cs'-ivelv increasing from 206 million

60
metres in 1979-80 to 340 million metres in 1982-83.
In order to enable the North-Eastein region to
participate in the Jana!a cloth scheme, local variety
of "M ekhala Cliaddar" of Assam has been included. An evaluation oi' the scheme is a necessary to know
whether the Janata clo'h being distributed is reaching the target groups.
Powerlooms
8.38 The number of authorised powerlooms has
gone up by 90,000 from 4.83 iakhs in Dec. 1979 to -■'.73 lakhs by the end of 1982. Over 49,000 looms
are in the process of registration. Apart from this, it
is estimated that a large number of ‘unauthorised
powerlooms are in existence which continue to
encroach on the handloom sector. The reservation of
certain items in the handloom sector has not been effective and the relevant provision made under the
Essential Commodities Act has been challenged in
the Courts. A separate legislation for this purpose
is under contemplation and w^ould need to be expe
dited. Although a Powerloom Board w;as established
in 1981 to check expansion of unauthorised Power
looms and their encroachment or. the handloom sector, no tangible measures have been drawn up till may, 1983.
8.39 Production of cloth by powerlooms is likely to exceed the target of 4300 million metres by the
end of the Sixth Plan. The entire Textile Policy needs
to be reviewed for assigning specific roles for the handloom, powerloom and the mill sectors.
Handicrafts
8.40 In the handicrafts sector, there has been
shortfall in the utilisation of funds in the first three years of the Sixth Plan. This is on account of delay in the setting up of Craft Institutes, namely National
Institutes of Carpet Technology and Hand Printed Tex
tiles and lack of desired progress in the implementation of training programmes. The pace of implementation
of Plan programmes is required to be improved. The employment coverage in the handicraft sector is esti
mated to have increased from 20.3 lakh persons in1979-80 to 23.90 lakh persons in 1981-82 and likely achievement for 1982-83 is 25.05 lakh persons against
a target of 24 lakh persons.
8.41 Substan'ial production in handicrafts is export oriented. Training for imparting improved skills to artisans is of the utmost importance to preserve and continuously upgrade the quality to meet the export
marketing requirements. Therefore, around 60 per ccnt
of the public sector outlay is earmarked for training covering crafts like, ( 1) carpet weaving, ( 2) printing
of textiles, (3 ) cane and bamboo crafts, (4 ) metal art-
ware etc. A programme of upgrading carpet weaving
lias been initiated through establishment of centres
which would impart training in 400 knots and above. The impact of ?hc training programmes of production of handicrafts and the position regarding absorption
of trainees in the industry require to be studied. Further, there is an urgent need for mnr'keting of cat pets
produced by the weaver trainees and to evolve a suitable methodology for expeditious implementation. To
provide adequate technological inputs. 4 Regional
Uesign and Technical Development Centres have been esiaoushed in 4 metropolitan cities. They have developed about 900 new designs out of which 575 designs
are stated to have been commercially accepted during1981-82. During April-June 1982, 581 new design.-,
were developed and 324 designs were commercially accepted. A comprehensive review' has been made by
the sub-committee on Design and Technical Eevelop-
ment Centres set up by A ll Ind ia Handicralts Board
regarding their functioning. The Committee has made
a series of recommendations relating to their structure, objectives, monitoring and funding of the Centres.
These recommendations are under consideration.
8.42 A n Institute of Carpet Technology i> being
established at Bhadohi, U.P. for product deveopment including standardisation of raw materials, applied
research in the techniques of weaving, dyehg and tinishing. For promotion of exports, an Expor. Deve
lopment Council has been set up. An evalmtiQjj of
the working of the Central and State Handicrafts Corporations is needed to know whether the objedives of
increasing the earnings of the artisans and emancing the sale of handicrafts has been achieved. A scheme
for cooperativisation of handicraft artisans has recently
been instituted. The scheme of RM Cs set up vith the objectives of providing a total package in the nature of raw materials and marketing and act as multi- product outlets for rural industries has net been
successful. ..
8.43 The M ajor provision for the handicrafts sector is for training programmes. Considering the progress
of expenditure in the handicrafts sector, thex is a
likelihood of saving of about Rs. 15 crores.
Sericulture
8.44 As against the target of 90 lakh kgs. set for the terminal year of the Sixth Plan (1984-85) from a
level of 48 lakh kgs. in 1979-80, it appears from the trend of raw silk production for the first thrte years
of die Plan period, there will be a significant ;hortfall
in achieving the targets. Estimated productici would be around 70 lakh kgs. Drought conditions in the major mulberry silk producing State of KanaUika,
Uzi fly infestation in the States of Karna'aka, Andhra Pradesh, Tamil Nadu and W . Bengal, poor quality
and inadequate production of silk seeds ha’e been among the major factors resufting in slow progress'.
Stabilisation in the production of non-mulbery silk is to be still achieved. The basic seed for nulberry
silk production in J&K continues to be import'd from
Japan and the silk production in the State is also showing a declining trend. Due to monopoly procure
ment, high overheads etc, the silk cocoons do not fetch remunerative prices. A Committee has leen s'et
up to go into these issues and concrete neasures
w'ould be drawn up by the State Government ifter the
recommendations become available.
8.45 Against the target, of 1500 tonnes of hvoltine
silk, only about 115 tonnes was produced during1981-82. The cost of production of hi voltinc cocoon
is higher than nniltivoltine breed mid t.hev do not fetch remunerative prices in spite of the fan that
the filament produced is superior. T lv outputhectare

61
'i mulberry) silk obtainable in. India is still around ’6.6 Kgsiheectare against the level of 133.S Kgsjhec- tare achieveed in Japan in 1975. Although the Central
Sericulture Research and Training Institutes in the• ountry are; able to obtain an output of over 100 Kgs,hectare,, the output achieved at field conditions
is very low;. The management and delivery of tech
nology needds to be improved. There is need for im provement iin the existing system of seed maintenance and seed nmultiplication. Considerable attention is
required to be given to extension and training work as well as nearing of young age silkworms in chawki
rearing centitres.
8.46 Presently, seed production i.s being carried
out by a iuumber of Training Institutes, State Departments of Sericulture and private seed producers. The role of eachh agency needs to he clearly defined. The possibility cof compulsory certification of seeds needs
to be exploded. It is essential that the Central Silk Hoard shoulld concentrate efforts for (i) research, (ii)
testing. ( iiii) production of basic seeds (P1 and PJ levels), ( iv)) training of personnel at advanced levef
>.ic. lhe acttivitv of the States may include expansion of area uncder food plants for silk worms, extension
and demonstration, setting up of chawki rearing centres lor reairino of young age silkworms, production of seeds at PJ and P1 levels and industrial seeds,
training of personnel at artisan and middle level etc.
M ? oak tassar industry v,-, Manipur suffered a steep deccline over the years. The Centra! Silk
Hoard (CSI-B) has set up a Task Force to go into the question of fall in oak tassar cocoon production and
to suggest remedial measures regarding increasing production in the entire North Eastern Region. The Report is urnder the consideration of the CSB. Production of m u fga and eri silk in the N .E. Region and
mulberry ini J and K is stagnant or declining over the years. Siteps to be taken to improve silk production in thesse areas and programme of bringing new
areas underr mulberry cultivation in potential States like U .P ., W. Bengal, Orissa etc. are required to be identifierd and schemes for these purposes in
different Stcates should be dovetailed with those of the
CSB.
8.48 Ai ^National Silkworm Seed project has been
'rganised to) strengthen the seed production programme inc lud ing basic seed by establishing seed cocoon iarms. A prroject for development of moriculture has
also been* irnitiated under which it is proposed to supply new varieties of Kanva 2, S30, S36, S41, and
S54, to prospective sericulturists in new areas on a tapering suiibsidy basis.
8.49 To develop the sericulture industry and ensure fair resmuneration to rearers as well as reelers,
prices of coicoons and raw silk need to be stablilised. rn this eomncction, the Department of Textiles and
set up a Price Stabilisation Committee lor Raw Silk in 1981 to study the procurement operations of raw
siik| cocoons with a view to stabilising the prices of raw cocoons including the import of silk and upgrad- ation of raw silk through the provision of testing and
grading facilities. The Report of the Committee is still awaited. It is necessary to maintain a buffer stock
of silk to regulate the market.
8.50 W ith a view to exploiting the tassar potential
and improving the life of the tiibals an Inter-State
tassar project with a five year perspective has been taken up by the CSB in 1981 in the States of Bihar, M .P., Orissa, U.P., A .P., Rajasthan, Maharashtra
and W. Bengal at an estimated cost of Rs. 10.50 crores for which Sixth Plan allocations are to the tune of Rs. 8.00 crores. Under the project, 6000 hectares
of land would be planted with arjun trees in the above States. Seedlings will be prepared in 60 nurseries. The infrastructure envisaged under the pro
ject include setting up of 7 units each of cold storages, project centres, marketing complexes and reeling units (one in each State) 12 grainages and 12 exten
sion centres. Training would also be imparted. The beneficiaries of the project, would be given the right
to utilise one hectare each of the plantation. The project is estimated to benefit 30,000 persons and produce an additional quantity of one lakh Kg. of tassar raw silk. Under this project, Arjun plantation
is expected to be completed in 2 9 17 hectares of the target oi 6000 hectares by 31-3-1983. O f the im plementing States, Bihar has not made any headway
at all; however, in the case of U.P., the coverage has been modified on the iower side when compared to
the original target. Despite marginal variations in the implementing States, the project has made good progress and the overall target would be exceeded.
8.51 The CSTRI being established by CSB will engage itself with post-cocoon technology from reel
ing to the finished fabric and would draw on the available infrastructural facilities and expertise from the existing Research Institutes'Institutions. A muga
project for the North Eastern Region for ensuring increase in the production of quality muga seed and
better remuneration to rearers is being taken up bv
the CSB.
8.52 Regular monitoring of production targets and production programmes are cruciaf for assessing the temporal progress of this industry. The present data
base is inadequate and efforts would need to be made to evolve a proper system for collection of statistics
and reliable estimation procedurejdata flow mechanism.
8.53 Taking into account certain new projects which are under consideration for maintaining the
tempo of developmental schemes|programmes, an
additional outlay of R ;. 10 crores may be needed.

CHAPTER 9
LABOUR, MANPOWER AND EMPLOYMENT
Labour and Employment
A total outlay of about Rs. 167 crores was approv
ed fm programmes relating to Craftsmen and allied training and Labour Welfare comprising about Rs. 82
crores in the Centra! Sector and about Rs. 85 crores in the plans of the States and Union Territories. The break-up of the Five Year Plan outlay according to major programme categories was— Craftsmen and
allied training about Rs. 89 crores, Employment Service about Rs. 19 crores. Labour Welfare about Rs. 2n crores and Rehabilitation of Bonded Labour (Centrally Sponsored) about Rs. 32 crcres. The
likely expenditure during the first three years of the Sixth Plan i.e. 1980-81 to 1982-83 would amount to about Rs. 88 crores constituting roughly about 53 per cent of the total five year outlay. However,
the progress of implementation has lagged behind relatively in the Central Sector Plan in which the expenditure during the first three years would be about 30 per cent only. The general reasons for shortfall in the Central Sector have been delays in the finaiisation and formal clearance of the projects,
problems in the sanction and placement o£ staff
completion of the civil works component etc. In the case cf many States, the expenditure level has
been in excess of the approved outlays in successive Annual Plans. The progress of implementation in
the Central Sector has started picking up and revision of priorities and readjustments in the outlays has been suggested to ensure effective utilisation of the provisions for essential schemes. In the 1983-84 A nnual Plan, a total outlay of the order of Rs. 48 crores
has been approved comprising Rs. 15 crores in the Central Sector and about Rs. 33 crores in the plans of the States and Union Territories.
9.2 W ith this level of outlays and taking into account the requirement of funds for the last year
of the Sixth Plan i.e. 1984-85, the revised five year outlay in the Central Sector would be about Rs. 62.00
crores resulting in a saving of about Rs. 20 crores.
However, in the case of the StatesjUTs the original five year provision is likely to be exceeded even in
the fourth year of the Plan and additional provision w ill be required to meet the last year's requirements.
9.3 Highlights of some major programmes are indicated below.
Rehabilitation of Bonded Labour
9.4 This is one point of ihe 20-point Programme and is being implemented as a Centrally Sponsored
Scheme under which matching grant assistance is provided by the Centre to the State Government to
the extent of 50 per cent of the cost of approved schemes. From tile beginning of the programme in 1975-
76 to the end of March, 1983 about 1.52 lakh bond
ed labourers had been identified and freed, and out
of these about 1.13 lakh bonded labourers had been rehabilitated. The number identified and freed and.
the number rehabilitated in each year of the Sixth
Plan are as follows:—
Year No. of bondedlabourers
Identified Rehabi-
and freed liiated
1 ................................. " ’ 2 3
1980-81 679 19,300
1981-82 12,579 17,658
1982-83 21,803 36,019
Efforts at identification are being continued by the State Governments. Certain procedures regarding the release and the utilisation of the Central assist
ance which were slowing down the pace of the im
plementation have now been simplified.
An integrated approach with other ongoing schemes in sectors like Rural Development (IRD P ,
N R E P , etc.), Social Services, etc., has been suggested for more effective rehabilitation. Against the tenta
tive outlay of Rs. 31.68 crores, the requirement of
funds for completing the task of rehabilitation during the Sixth Plan period is now estimated at Rs. 46.50
crores. The addition will be called for entirely in the
States Sector.
Revision of Minimum Wages iu Agriculture
9.5 Since 1980, most of the State Governments
and Union Territories have effected revision of the m inimum wages in agriculture. Measures for strengthening the enforcement machinery for implementation of m inimum wages in agriculture have also been
undertaken in a number of States.
Other Programmes
9.6 SchemOvS are being implemented for the modernisation and upgradation of the vocational training
system with a view to improvement of quality by
providing the necessary' facilities in Advanced Train
ing Institutes and Central Training Institutes under the Centre and Industrial Training Institutes adminis
tered by the State GovernmentsiUnion Territories. Efforts have also been made to locate and utilise more training places for apprenticeship training. The training needs of women job seekers and of rural areas
have also been kept in view in undertaking programmes in this area. In the case of StatesjUnion Terri-

iorics particularly vocational training programmes
have been implemented at an accelerated pace resulting! in expenditure exceeding the approved outlays.
9.7 Under Employment Service, schemes are imple-
mentecd for the vocational rehabilitation of physically handicapped, coaching -cum-guidan.ee of Scheduled
Caste|!Scheduled Tribe job seekers, strengthening of
vocational guidance in the employment exchanges etc. inc lud ing for self-employment. The Workers’
educattion programme has been expanding to cover more icategories and rural areas. Some other program
mes im this sector relate to strengthening of Industrial and M in e Safety, Industrial Relations Machinery. Reseairch and Survey, etc.
9.8 Given below in Table 9.1 is a summary state
ment iindicating the provision made in the Sixth Five Year Plan, the progress of expenditure, the likely
outlays in the Craftsmen Training and Labour W elfare Se;ctor :
Y-ar
T uu 1 9. J
Centre States
(Rs. in crores)
!9C) - N5 f’Ir.n oullay Ceil ,il)
1 v'80 - to ta l likely outlay
i9fO-S-<4 approveJ outlay
I 980 —-85
('Pro)bablc'.
S I . 97 75.42
24.48 58.35
15.00 30.79
62.00 124.00
U nion Total Territories
4 5
9 .22 166. f,!
5.19 88.02
2.69 4S.-1S
11 .00 197 0.)
Y!anp<cnver
9.9 On the basis of the results of the 32nd Round Survey/ (19 77-78) of the NSSO and taking into account the official population projections, the Sixth
Plan estimated a need to generate employment oppcr-• unities of the order of 46.3 million during the Sixth Plan iperiod and as against this, placed the employ
ment .generation likely during the Sixth Plan period at 34..3 m illion standard person years.
9.10 To provide additional employment opportu- lities to unskilled rural labour and "to increase the
ncom<e level of the rural poor, the National Rural
im ploym ent Programme (NREP) and ?he Integrated lural Development Programme (IRD P) are under
mplcrmentation throughout the country. Conscious .'fTorts ate being made to s’rengthen and expand the
•cope of these programmes keeping in view the local iceds for additional employment generation.
9.11 Adequate attention is being paid to the development of small and village industries in view of their high employment potential. A number of
other programmes for upgrading skills and technology and providing inputs and marketing supports are also under implementation. The scheme of Training of Rura? Youth for Self-employment aims at
equipping rural youth belonging to the poorest fami
lies to take up self-employment by way of providing
trainingjwork experience and other assistance.
9.12 As part of the efforts for easing unemploy
ment, some State Governments (Maharashtra, Gu ja
rat. Andhra Pradesh Jammu and Kashmir, Karnataka West Bengal, etc.) are implement!;-5 Special Employment Programmes. These programmes concentrate on providing training facilities cither for self-employ
ment or to make the trainees more employable. In deserving cases, seed money|margin money is also provided for setting up self-employment ventures.
9.13 In pusuance of the Sixth Plan strategy most of the State Governments have set up Dis'riot M an
power Planning and Employment Generation Coun
cils. These Councils are expected to look into the employment needs of the districts and prepare inte
grated manpower plans. However, not much headway has been made in this direction so far. It is necessary that the planning machinery' at the district level is
suitably restructured or strengthened to focm after - tion on local problems of the area under development,
including unemployment problems.
9.14 There is no regular annual series of data to
indicate employment generation in the entire economy. It. is. however, possible estimate the likely employment generation during the first two years of the
Pian period following the methodology adopted in
the Sixth Plan. Based on the provisional results of sectoral growth rates and other relevant variables,
employment has been roughly estimated at 157.75 million standard person years in 1980-81 and 162.96
m illion standard person years in 1981-82, This in dicates that the rate of growth of employment was
of the order of 4.4 per cent in 1980-81 and 3.3 per cent in 1981-82. The Sixth Plan envisaged an annual rate of growth of employment of 4.2 per cent. Thus,
the rate of growth of employment was marginally higher than the target in 1980-81 but lower in 1981-82.
This underscores the need for grea'er efforts fo create employment opportunities. An important, item of the
20-Point Programme is strengthening and expanding the Rural Employment Programmes. In addition,
conscious efforts to promote self-employment parti
cularly for the educafed unemployed would be required. These efforts and prope- effective implementation of all Plan programmes are lik'd'-- to enhance the rate of crowth of employment in the following vearv

CHAPTER 10
MINIMUM NEEDS PROGRAMME
The M inimum Needs Programme began in the Fifth
P lan (1974-79) as an investment in human resources
development. Through public sector expenditure and investment, consumption levels of free or subsidised social services are to be improved, particularly for those
whose consumption levels are below the poverty line.
Integration of social consumption programmes with economic development programmes is sought to be
established for providing a basis for accelerated growth,
as also for reducing disparities in consumption levels. National objectives are laid down for each of its nine
components as follows :—
Programme
Outlays (Rs. crores)
Objective Targets by 1985
1. Elsmentary Education
S:ates/UTs Centre
851 54
2. A Jult Education
6i 60
3. Rural Healih
408 1 69
4. R ira l Water Supply 1407 6005. Rural Roads 1165 —
6. Rural Electrification 301 —
100% enrolment in the age group in 6— 14
by 1990, to be supplemented by non-for
mal education.
100% coverage of adults in age group 15—35
by 1990,through non-formal education.
1. One C im n i' i i t y Health Volunteer for
every 1000 population or village by 1990.
2. Establishment of one primary health
Sub-centre for a population o f 5000 in
plaints and 3000 in tribal and hilly areas
by 2000 A D .
3. One Primary Health Centre for a popu
lation o f 30,000 in plaints and 20,000 in
tribal and hilly areas by 2000 AD .
4. O ie Community Health Centre for a population o f one lakh or one C D Block by 2000 A D .
95% enrolment in the age-group 6— 11,
and 50% in the age-group 11— 14. It
would be supplemented with non-formal
education.
Target not fixed.
To increase the Community Health Volun
teers from 1.40 lakhs in April, 1980 to
3.60 lakhs in 1984-85.
To increase the number o f sub-centres by
40,000.
Linking up of all villages with a population o f 1500 and
above and 50% of (he villages with population o f 1000—1500 by 1990.
A t least 60% of the villages in eaoh State and Union Territory to be electrified by 1990.
To add 600 additional primary health cen
tres and 1000 Subsidiary Health Centres
during 1980-85, over 5400 PHCs/1000
SHCs existing.
To add 174 Community Health Centres in addition to converting existing 340 upgraded PHCs into CHCs.
To cover 2,30,784 “ Problem” Villages, exccpt some in desert/hilly areas.
To connect about 20,000 additional villages with rural roads.
About 46,464 additional villages to be electrified.
7. Housing Assistanc to Rural landless labourers.354 —
Provision o f House sites and construction To provide house-sites to 68 lakh house assistance to all the landless abour house- holds, and construction assistance to holds by 1990. 36 lakh house holds.
8. Environ m :ntal Improvement of Urban Slums. —
151
9. Nutrition 219
Total Outlay State UTs. 4924
100% coverage of urban slums population by 1990.
Centre883 -- Rs. 5807 crorcs.
^Supplementary Nutrition Programme.
**Mid-day Meal Schcrai for school children,
10 million slum dwellers to be covered bv 1985.
SNP* : 5 million children in 600 IC D S blocks and 5 Jakh women to be oovered with intepratfd services.
M D M ** : The existing level o f beneficiariesi.e. about 17.4million children to be con
tinued and the programme to be integrated with other essential services.
64

65
;''.2 l ln the State Sector, the trend of expenditure i' uired so far shows that except for the Programmes
n 'Eloussing for the rural landPess’ and 'Nutrition’ the
prcograisunes would by and large hit their tar- :’s withiiin the funds provided in the Flan. The funds
miiremaent under 'Nutrition’ has to be increased be- i:iso of (he decision to increase the number of ICDS !'>cks boy 400.
H).3 I In the Central Sector, the balances of Plan
•ovisionns left would be adequate to meet the require- ents in i respecf of Elementary Education, but outlays
ill need! to be increased under Adult Education, Rural Valth aand Rural Water Supply.
10.4 5 Some comments on the attainment of physical
■ i'ets anre offered below : —
Klemoentary Education
10.5 \While the overall target of enrolment is 180 khs, ICJ5 lakh children were enrolled during 1980-83.
'Iiile thhe target for additional children enrolled in hisses I f — V I I I is likely to be achieved, there would be
■rtfall in the enrolment of girls. The enrolment of
Ts is rrequired to be stepped up to achieve the Plan n>ei. (Thus, the thrust of the programme has to be
: incici'asing enrolment of girls and on retaining the. h It Iren in school at least till Class V II I A concer-
i efforrt is required in the low literacy pockets, es-
.-dafly in the educationally backward States, i.e. sam, 1 Bihar, Madhya Pradesh, Rajasthan, Uttar Pra~
vi ancd West Bengal.
Adulilt Education
10.6 . Data regarding targets and achievements are
'ailablee annually. The programme needs to be con-
.lerablyy accelerated and reoriented. Due to socio-eco-
nnic faactors, poor motivation of learners and to some
dent oof functionaries, there are problems of imple-
cntatioan that have to be overcome. Retention ratio
so neeeds improvement.
Ruraal Health
10.7 The Plan targets of training 3.60 lakh Vol-
itary IHealth Guides, establishment of 600 PHCs and
15 CH ICs are expected to be achieved. The target of
• !ablishhment of 40,000 sub-centres is likely to be
hievedil to the extent of 90 per cent. Some States
peciallly in the North-East, have felt a critical shor-
ue of < doctors and para-medical staff. Trained ANM s
c not available in sub-centres in some areas.
Ruraal Water Supply
10.8 Under the M inimum Needs Programme,
30784 problem villages were targetted to be covered
iring the Sixth Plan period, with an outlay of
200J7.1 I crores (Rs. 1407.11 crores in the State
- PC -'83— 10
sector Rs, 600 crores in Central Sector). During the
lirst three ycars 1980— 83, 99965 problem villages had
been covered under this programme. Another 48846
villages are targetted to be covercd during 1983-84.
Considering the progress so far, there is fikely to be
a shortfall in the achievement of this target. During the.
first three years 1980— 83 the likely expenditure on this
programme is Rs. 1093.18 crores. A provision of
Rs. 518.01 crores has been made for 1983-84.
5. Rural Roads
10.9 Against the target of covering 20,000 villages
with a population of 1000 and above, 11270 villages
are expected to be covered during the first three vears.
The States and Union territories would be in a position
to cover another about 6000 villages during the rest
of two years 1983— 85 and thus there would be a short-
falF of about 20 percent in the achievement during the
Sixth Plan. Since population in most of the vi lages
in hilly, tribal and desert areas is generally low, thev
may not qualify for the M N P. In view of this, rela
xation in population norms for such areas is under
consideration.
6. Rural Electrification
10.10 O f the Sixth Plan target of electrifying 46464
villages 21439 villages are expected to be electrified
during the first three years 1980— 83. The ahievements
are likely to fall short of 20 per cent dire to low per
formance in Bihar and U.P.
7. Housing for the Rural Landless
10.11 Against the modest level of assistance of
Rs. 750 per house, the State Governments are provi
ding assistance ranging from Rs. 1000 to Rs. 5000.
Such a high rate of assistance results in a distortion
of the Programme in that the physical achievements
will fall short of the targets at the same 1evel of ex
penditure.
8. Environment Improvement of Slums
10.12 Against the Sixth Plan targets of covering of
about 10 million slum dwellers, about 3.77 million
slum dwellers are likely to be covered during the per
iod 1980— 83, leaving a balance of 6.23 million for the
remaining two years. There is likely to be a shortrall
in the achievement of the targets. As far as outlays
are concerned, as against the Sixth Plan outlay of
Rs. 151.45 crores, the expenditure during the period
1980— 83 is of the order of Rs. 74.68 crores.

MINIMUM NEEDS PROGRAMME
e ’:o L ■ - ’ o.\ . 1 v' _ ‘:
Program,ne- -......... - -
‘iixth Plan
Outlay
approved
1980-81
A ’jtu il-
1981-S:
A-.t ivs
(Rs.
1932-83
Anticipated
Expenditure
e~orcs)
1980-8
(1) (2) P ) (4) (5) (6)
1. Elementary Education 851 101.15 121.77 178.15 401 .07
‘•54 -4.82 -1- 7.44 r 10.91 4- 23.17
2. Adult Education 68 8.86 10.80 13.82 33.48
•io ') -6.08 -f-S .92 -!-16.29 ;■ 31 .79
Rura l llc a iih 408 47.12 60.87 80.96 188.95
-169 -47.14 £ 4- 48.75 95 .89
-1. Rural Water Supply 1407 209.16 260.34 259.18 728.68
o 600 -209.00 £ 155.50 3:64.50
5. Rural Electrification 301 52.74 60.41 65.83 1 78.98
h. Rura l R 'ads 1165 196.46 232.43 204.95 6,33.84
7. Rurd ! H n:a:ng for til* 354 ^3.67 73 1- 72.37 : 79. 1.9
R. Improve:’.!'tvs o f Itrban S'ums . < 51 21.1') 24.51 2 1, '"is 74.68
9. Nutrition . . . . 219 28 .33 35.01 ■17.85 1 11 .19
to ta l 4924 718.98 879.29 951.79 25:50.06
r-883 267.04 -i 16.36 231 .45 + 514.85
<;ran.cl Total: - 5807 986.02 895.65 1183.24 30164.9!
£ Iflc!v.d"d under C o l. 3
rF i" ire; indicate out lays for Central Sector Programmes.
Statemient If
M IN IM U M NEEDS P RO G RA M M E
Targets and Achievements of Selected Physical Programmes 1980— 8 5
Programme Unit Base level Sixth Plan 1980-8! 1981-8?. 19182-83
achievement Targets Actuals Actual Anticipated
1979-80* Achieve- Achieve
ments memts
( U _____________ _ (2) _ (3) (4) (5) .6) (7i
1. RuralHealth Programme
1. Sub-centres . . . . . Nos. 50,000 40,000 £ 3,259 5,504 7,668
2. P H C s ..............................................................Nos. 5.400 600 £ 257 112 191
3. Subsidiary Health Centres . . . . . . 1,000 1,000 £ 240 244 723
4. Up-'raded PHCs to be converted into CHCs . 340 174 £ 101 38 5:;
[I. Rural Water SuPply
N o. o f problem villages eevercd . . . No. 2,30,784 ■ -------- 99.965 ...... ..............
I I I . Rural Roark
Lin Icing o f villages (with popuhtien o f 1000 and
above) with rural reads . . . . No. 20,000 £ --- ----- 11,270 — — __
(V. Rural Electrification
No. of villages t" be electrified . . . Nos. 45.464 -- -- 21,439 -- -___ .
V. Rural House sites-cmii-ffouse Construction
Provision of House sites to landless . . No. in 68 — — — 23.74 ____________
lakhs
Construction assistance ............................................. 3 6 .................- ‘ 5.53 -............. ......
£ Additional.
“As "iven i ) Sixth 1 i\e Ye ir Plan (W O -r'5> d^e imc it: oag e 367. Table No. 2? I
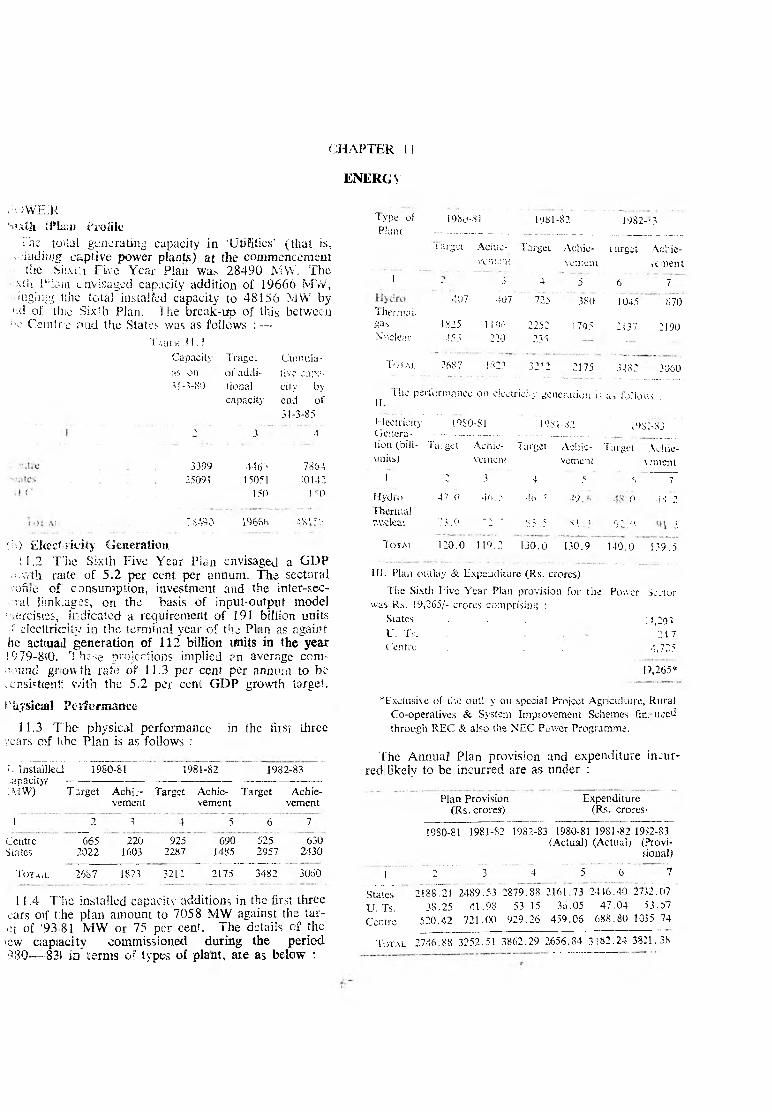
CHAPTER I!
ENERGY
. :t iW EiR
Hixtli IPlaui Profile
i'be total generating capacity in 'Utilities' (that is,
xciudiing captive power plants) at the commencement
1 the Siixih Five Year Plan was 28490 M W . Thex i i i I“ laiu envisaged capacity addition of 19666 M W , i i ig i i i jg ulic total instaifed capacity to 48156 M W by
1 :d of tbio Six;h Plan. The break-up of this between ;ic Ceintr e pud the States was as follows : —
Taule l l . l
Capacity Tragel CliilHlla-
as on of addi live c:ipa-
3S-3-SO tional city by
capacity end
31-3-f
of
S5
2 3 4
3399 446"’ 7854
25091 15051 ■if)142
150 1 '0
1.5490 l%S’b ‘,8,IC\
<,U) EI<ec< iiciiy Generation
i 1.2 T'he Sixth Five Year Pian envisaged a G D P■ ‘.wth raite of 5.2 per cent per annum. The sectoral ■'oftie of consumption, investment and the inter-sec- ral limk.ages, on the basis of input-output model
:>ercistss, indicated a requirement of 191 billion units
■S’ electtricitv in the terminal year of the Plan as agaiot he aetiuail generation of 112 billion units in the year
!979-&0. These projections implied an average compound grow th rate of 11.3 per ccnt per annum to be
, onsistcentt w ith the 5.2 per cent G D P growth target.
Physical Performance
11.3 T he physical performance in the firs; three years o f tihe Plan is as follows :
i. In s ta lle d 1980-81 1981-82 1982-83
opacity/ --- --------- -— ------------------------------
!M W ) Target Achk- Target Achie- Target Achievement vement vement
1 2 3 4 5 6 7
Centre 665 220 925 690 525 630States 2022 J603 2287 1485 2957 2430
To taiL 2687 1823 3212 2175 3482 3060
11.4 T'he installed capacity additions in the first three cars o f t:he plan amount to 7058 M W against the tar-
■et of '93 81 M W or 75 per cent. The details of the tew c;ap;acity commissioned during the period
980— 821 ia" terms of types of plant, are as below :
Type of 1980-81 1 >j81 -82 1982--3
Plant ----------- . . .... ......... ......................./ ______
target Achic- Target Achie- Target Achie
vement ven-ent vement
1 - 3 4 5 6 7
''07 407 725 380 1045 S70
Therm;'!,.
gas 1825 11% 2252 1795 2 {37 2190
Nuclear 455 220 235
T o t a l 2687 1*2) 3212 2175 3482 3060
^ 1 he performance oil eiectricry gencr.uion i; as f.jllous ;
Electricity I9S0-81 1981-82 i98:-83Genera- ---------- --- — ............................
tion (bill- Ta.get Achic- Target Achic- Target Achte-
tjtii ts) m n e m vement wment
I 2 3 4 5 6 7~
Hydro 47.0 46.5 46 5 i‘J ■ o .f'j 2
Thermalr.\xk;»Y ’’ } .0 "2 ' 8 5.5 ■» \. ’ ‘I . ' / ' j
Tor a i 120.0 119.2 130.0 130.9 140.0 139.5
III. Plan outlay & Expenditure (Rs. crores)
The Sixth Five Year Plan provision for the Power Sc .nor
was R». 19,265/- crores comprising :
States . . . . . ; 1,293
U. Ts. 24 7
Centre . . . -1,725
D.265*
‘ Exclusive of the out! y on special Project Agriculture, Rural
Co-operatives & System Improvement Schemes fin." need
through REC & also the NEC Power Programme.
The AnnuaP Plan provision and expenditure incur- redilikely to be incurred are as under :
Plan Provision Expenditure(Rs. crores) (Rs. crores>
19S0-81 1981-82 1982-83 1980-81 1981-82 1932-83 (Actual) (Actual; (Provi
sional)
t 2 ............ 3 4 5 6 7
States 2188721 2489.53 2879.88 2161.73 2446.40 2732.07
ET. Ts. 38.25 41.98 53.15 36.05 47.04 53.57
Centre 520.42 721.00 929.26 459.06 688.80 1055 74
T o t a l 2746.88 3252.51 3862.29 2656.84 3182.24 3821.38
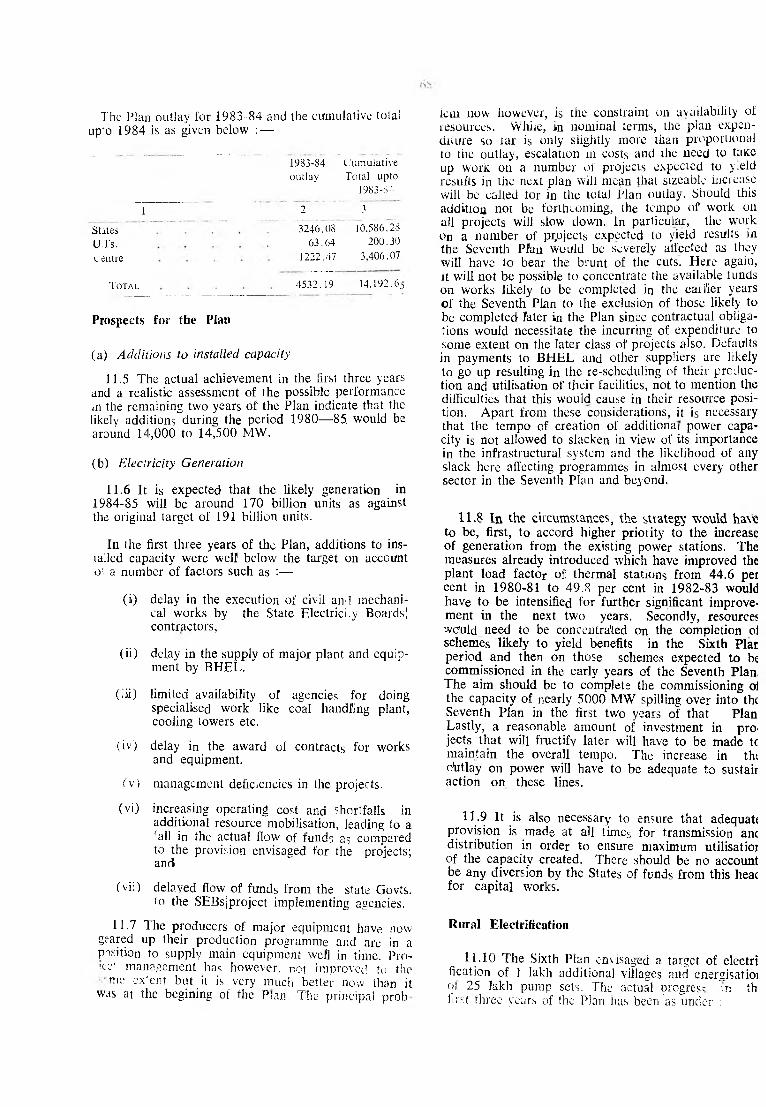
The Plan outlay for 1983-84 and the cumulative total
up'o 1984 is as given below : —
1983-84
outlay
Cumulative
Total upto
1983-84
1 2 3
Stiles 3246.08 10,586.28
UTs. 63.64 200.30
centre 1222.47 3,406.07
T o t a l 4532.19 14,192.65
Prospects for the Plan
(a) Additions to installed capacity
11.5 The actual achievement in the first three years
and a realistic assessment of the possible performance
<n the remaining two years of the Plan indicate that the
likely additions during the period 1980— 85. would be
around 14,000 to 14,500 M W .
(b) Electricity Generation
11.6 It is expected that the likely generation in 1984-85 will be around 170 billion units as against the original target of 191 billion units.
In the first three years of the Plan, additions to installed capacity were well below the target on account
oi a number of factors such as :—
(i) delay in the execution of civil and mechani
cal works by the State Electrici.y Boards! contractors,
(ii) delay in the supply of major plant and equipment by BH EL.
(iii) limited availability of agencies for doing
specialised work like coal handling plant, cooling towers etc.
(iv) delay in the award of contracts for works and equipment.
( v ) management deficiencies in the projects.
(vi) increasing operating cost and shortfalls in
additional resource mobilisation, leading to a
fall in the actual flow of funds as compared
to the provision envisaged for the projects; and
(vii) delayed flow of funds from the state Govts.Io the SEBsjproject implementing agencies.
11.7 The producers of major equipment have now
geared up their production programme and are in a position to supply main equipment well in time. Pro- ;cc‘ management has however, not improved to the
me ex'ent but it is very much better now than it was at the begining of the Plan The principal prob
iem now however, is the constraint on availability of
resources. While, in nominal terms, the plan expenditure so iar is only slightly more than proportional
to the outlay, escalation m costs and the need to take up work on a number of projects expected to yield
results in the next plan will mean that sizeable increase
will be called lor in the total Plan outlay. Should this addition not be forthcoming, the tempo of work on all projects will slow down. In particular, the work
on a number of projects expected to yield results in the Seventh Plan would be severely affected as they
will have to bear the brunt of the cuts. Here again,
it will not be possible to concentrate the available funds on works likely to be completed in the earlier years
of the Seventh Plan to the exclusion of those likely to be completed later in the Plan since contractual obliga
tions would necessitate the incurring of expenditure to some extent on the later class of projects also. Defaults
in payments to B H E L and other suppliers are likely to go up resulting in the re-scheduling of their produc
tion and utilisation of tjheir facilities, not to mention the
difficulties that this would cause in their resource position. Apart from these considerations, it is necessary
that the tempo of creation of additional power capa
city is not allowed to slacken in view of its importance
in the infrastructural system and the likelihood of any
slack here affecting programmes in almost every other sector in the Seventh Plan and beyond.
11.8 In the circumstances, the strategy would hast
to be, first, to accord higher priority to the increase
of generation from the existing power stations. The
measures already introduced which have improved the
plant load factor of thermal stations from 44.6 pei
cent in 1980-81 to 49.8 per cent in 1982-83 would
have to be intensified for further significant improvement in the next two years. Secondly, resources
wculd need to be concentrated on the completion oi schemes likely to yield benefits in the Sixth Plat
period and then on those schemes expected to be
commissioned in the early years of the Seventh Plan
The aim should be to complete the commissioning oi
the capacity of nearly 5000 M W spilling over into th«
Seventh Plan in the first two years of that Plan
Lastly, a reasonable amount of investment in pro
jects that will fructify later will have to be made tc
maintain the overall tempo. The increase in ths
outlay on power will have to be adequate to sustair action on these lines.
11.9 It is also necessary to ensure that adequati
provision is made at all times for transmission anc
distribution in order to ensure maximum utilisatioi
of the capacity created. There should be no account
be any diversion by the States of funds from this heac for capital works.
Rural Electrification
11.10 The Sixth Plan envisaged a target of electri fication of 1 lakh additional villages and cnergisatioi
of 25 lakh puinp sets. The actual progress ;n th first three years of the Plan has been as under :

Village Electrification Pump energisation
Target Achievc- Target Achieve
ment ment
I 2 3 4
1980- .'-8 11 . 25.000 22.4SS 4.10,000 364625
1981-1-8:: 22,000 22.614 4,25,000 322763
1982-1-83; 25,000 23,572* 4,30,000 301986 s
72,000 68,674 12,65,000 989374
*Pro-ov'Uiorial
11 l . l 1 The shortfalls in the targets have already
been t due to steep escalation in the cost of input
matenrkals. difficult financial position of the SEBs ;
inade<eqiuate power supply in some casci, in adequate
sub-t-tramsmission systems particularly in the N E Rcgioon and organisational delficiencies in the SEBs.
111.112 On the basis of present indications, the tai-
get oof village electrification is likely to be achieved;
but : shortfalls are expected in the target of pumps
energgisation programme. A number of steps like
frequuemt review meetings with SEBs to step up tempo obf work, close liaison with the field organisations
and eliose monitoring of the on-going schemes have
been i introduced to improve performance.
I inanncial Performance of State Electricity Boards \SEEBsi)
I 1 1.113 A t the time of the formulation of the Sixth
f ive ; V ear Plan, the commercial losses of the Boards
weree (estimated at Rs. 4400 crores at 1979-80 rates.
The , P ’lan had envisaged that, by way of improvement
of thhe:ir financial working, the Boards would aim at
teduuciing these losses by 80 per cent i.e. by about
Rs. 1 3500 crores. Thus the Board: were expected to
bringg down the losses to less than Rs. 1000 crores.
Howwewer, this expectation has not materialised. On
the 1 baisis of present assessment these losses are esti
mate ed at about Rs. 4300 crores. The Boards have
no ddoiubt taken measures to revise tariff rates in the
first 3 ’ years of the Sixth Plan which are expected to
yieldd an amount of about Rs. 4300 crores over the
Plan l period. It is possible that there will be further
revis sions in the tariff in the remaining 2 years of die
Plan l which would increase this contribution. In spite
of t thiis substantial mobilisation effort, the Boards
havee mot been able to show any significant reduction
in ccotmmercial losses for a number of reasons. The
Boarirdis have suffered reduction in revenues on ac- counnt of lower sale of energy consequent on short
fall i in generation interm due to slippages in the com- miss;sio)ning of projects, lags in the utilisation of capa
city ;and high T&D losses. Further, operational
coststs have gone up due to incre?se in the cost of ma- teriaal inputs, wages of staff and increase in interest
paynments. However, at the recent discussions in
connneiction with the mid-term review of the financial
perfeforrmance of Boards, they ha"3 been requested to impnrowe their financial working by improving their
eapaaciity utilisation, reducing the Transmission and
Distitriibution losses and economising in inputs like coalj
oil ffo it thermal generation. Other areas for the atten
tion ! n r the Boards which were emnh.irv;c,1 durine the
discussions were economy in staff costs, better inventory control and early and full realisation of assess
ed revenue to prevent accumulation of arrears. The
Boards have been requested to consider appropriate
revisions in tariff also in this context.
C O A L
Physical Performance
11.14 The demand for coal in the Sixth Plan was
placed at 168 m illion tonnes (excluding 5 million
tonnes of washcrv middlings) and the overall pro
duction targe; at- 165 million tonnes. I’t was assumed that the gap between the demand and availability
would be bridged by imports of coking coal and timely adjustment of pithead stocks and consumption
patterns. The production programme envisaged
production of 143.8 milfion tonnes from the mines
sanctioned upto the beginning of ihe Sixth Plan and
production of 21.2 million tonnes from mines to be approved in the Sixth Plan.
11.15 The actual figures of demand, production
and pit-head stocks during the first three years of
the Plan arc as follows :
(In m illion tonnes)
Dem and Produe- Coal- Pithead
assessed tion Produe- stock?
taruet tion at the
end of
year
T 2 3 4 5
1980-81 . . 119.8 113.5 114.0 18.2
1981-82 . . 127.0 121.0 124.9 21.0
19S2-83 . . 137.0 133.0 130.6 23.3
Demand
11.16 The overall offtake was 109.8 million tonnes
in 1980-81 and 122,5 million tonnes in 1981-82
indicating a substantial gap between demand and ac
tual offtake|conslumption during these years. The
same trend is noticeable in 1982-83 also when the offtake was 128 to 129 million tonnes. A n analysis
of the pattern of consumption indicates that, while a small proportion of the demand had not materialis
ed due to slower growth in the important consuming
sectors like Steel, Power, Cement and other indus
tries, there was yet some unsatisfied demand despite
encouraging production trends of coal and the large
pit-head stocks. Stress has, therefore, to be laid on
optimisation of the demand-supply management.
Production
11.17 For the first time in the Sixth Plan 1982-83
saw a shortfall in coal production a? compared to
the Plan target, mainly on account of constraints in
power supply absenteeism, labour unrest and other
miscellaneous factors such as delayed supplies of
equipment etc. A review' of the production so far
indicates that production from mines which had been
sanctioned at the beginning of the Sixth Pian has

been below target. I here has also been a shortfall
in production from underground mine, which, in
most cases, has been made up by higher opencast mines production as follows :
M in in g ,'le>h';d'.v!sc p ro duc t io n of csa!
(In miiiioti :c.i)>e:w
Underground Produc- Ope:.cast Produc
tion tiou
Target Achieve- Targes Achieve
ment ment
1980-81 ' ~ 7 79.34 73.55 34.19 40.45
1981-S2 . 79.07 77.40 4) 93 47.50
1982-83 . 84.12 75.29 48.33 55.36
11.18 This shift varies not only from the pro
grammed production pattern, but presages a qualita
tive imbalance in overall production planning and
investment planning. For example, the norm of
consumption of coal in the power sector per KW h
generation showed an abnormal increase on account of deterioration in the calorific content of open
cast mine coal, which had repercussion on the entire
demand-supply planning for the power sector. Higher
incidence of ash affected the coke rate in some steel
plants and othei^consumers also.
Stocks
11.19 The pithead stocks have risen over the
three years and stood at 23.3 m illion tonnes by the
end of 1982-83, reflecting essentially a mismatch bet
ween production, despatch and consumption. The
main reasons for this increase are (i) an unplanned
growth in production which was not dictated by a
systems approach, ( ii) slippages in the consuming
sectors and (iii) inadequacy of rail transport to meet
the spurt in production at several mines,
Outlay
11.20 The Sixth Plan envisaged an outlay of
Rs. 2,870.00 crores (at 1979-80 prices) on coal
and lignite against which the expenditure so far is
as follows :
(Rs. crores)
At current prices
1980-SI ................................................... 431.74
1982-83 ......................................... . 663.92
1982-83 ( R E ) ......................................... 872.16
1983-8-! (Approved ou;iayj . . 946.17
Totai. : T930— 84) . . . . 2913.S9
% of total outlay 101.53
Thus, the estimated expenditure in the first four
ytars h more than th ; Sixth F laa outlay in nominal term*, although in real tens? :nve?t~isrit m t%is
,’itai sector is lagging.
Monitoring and implementation
11.21 A t the end oi' December, 1982, 99 tcoal
nuning projects were under implementation (all tlhese
projects cost Rs. 5 crores and above) with a tcotal
sanctioned invesiment of Rs. 2,339 crores and lulti-
mate capacity of about 150 million tonnes per anmum
of coal production. Large numbers of projects
have slipped by one to five years, and the stat*uss of these projects is as follows :
Total O n Comp- Delayed by
Schedule leted ----- ------------ -----------
! 2 J 4 5
\r. Yrs. Yj's. Yrs. Vrsi.
and
c bo i\e
1 2 3 -1 5~ 6 7 8
99 4b i 14 10 10 5 13
The main reasons for these delays are
(i) land not being available andjor law ;and
order problems
(ii) difficult geomining conditions met duiring
development of mines and|or difficulties? in
regard to technology.
(iii) feasibility reports having been prepaired
cn insufficient geological data
(iv) non-availability in time of plant and m a
chinery, and
(v) other reasons like non-availability of R a i l
way siding, delays on the part of the ccon-
tractors etc.
Lignite11.22 The Neyveli Lignite complex con.-ists o>£ a
lignite mine, a thermal power station, a fertiliser
plant, briquetting and carbonisation plant and a clay washing unit. The mine and the power staticons
which comprise the important units of the complex
achieved, during the first three years, performamce
marked by a high degree of efficiency. In 1982--83
the capacity utilisation of the mine and the pow er
plant were 95 per cent and 99 per cent respectivrely.
Outlook for the rest of the Plan
11.23 The requirement of coal in 1983-84 is pllac-
ed at 147 million tonnes (excluding 3 million tonmes of m iddlings). To meet this demand the productiion
target has been pegged at 142 million tonnes (C 'oal
Ind ia Ltd; 123 million tonnes; Singareni Collieriers :
15 million tonnes; and T ISC O IIISC O and Otherrs :
4 million tonnes), providing for a draw down of
around 4 million tonnes of pit-head stocks. Tak:ing
into account the urgent need for (a ) regulating the
production effort in time with the growth in the
uatfem of d em and , ( b ) depletion of pit-head stoccks
Had ( c) the '-hycical prcerCTiaes “ *ith 'the
fe a rcM nr-.vts. tbs ^reduction of coal in 1984-85- cuvi-r.sed at i 5-i rniaior, ;onr,2 fG oa l

ndia d : 133 million tonnes; Singareni. Collieries : 17
r-M's-'jn'- tc&nes; T lSC O jllSC O ar.d 3thsrs; 4 million
oaneies >). Th<*. requirements of coal in 19b4-85 are
’ipecrcteed to be adequately met from the above ievel
■f pnrooduction and through timely adjustments from
he p pitit-head stocks and imports of low ash coking
coals, s.
11.1.224 In 1983-84, the target for lignite production
peseggged at 6.3 million tonnes against the mine ca
p a c i ty of 6.5 million tonnes taking into account the
icquinirceinents of the down-stream units. The power
eenereniution target is set at 99 per cent of the capa
city. In 1984-85 the original targets feed for these
units ? ; ore expected to be fulfilled.
1 1.1.225 Tn rehtion to the physical programmes ap-
prove/cd:! in the first four years of the Plan, financial
nntkravss made for this period have alre-v.L exceeded
ihe o owerall plan outlay of Rs. 2870 crores for the
I'Ttl ; nr.nd lignite sectors. This increase was necessary
ii'r tlthoe following reasons :
i fi i) Cost escalation of roughly 33 per cent in
most of the equipment, particularly heavy
earth moving equipment, in 1980-81 and
1981-82.
( ( i i i ) New major coal projects taken up to meet
requirements of linked thermal stations.
( (ii'ii) Additional investment on washeries. parti
cularly coking coal washeries,
( five) Action initiatied on Jharia Coalfields re
construction, railway diversion, Damodar
river diversion programme etc.
The FPlan outlay, has, therefore, to be stepped up
consicidderably.
11 1.226 ff additional funds are not available not
only ccurrent production but also work on new coal
projecectts is likely to be affected. It is essential to en
sure ; acdequate availability of coal to consuming indus
tries ; a and linked projects, both in this Plan as well
as inin the Seventh Plan.
I i . 1.227 The following issues require urgent atten-
; ion t t o ) improve the present position :
( ( i i ) There has to be a careful demand-availabi-
lity management by adopting a total sys
tems approach to production, movement,
consumption and stocks.
< Ciii) Modernisation of the exploratory effort en
suring speed and accuracv.
(iii) Production optimisation by laying emphasis
ch,-^-
(a ) maximisation of production from exist
ing as well as approved mines.
(b ) quantitative and qualitative orientation
to meet consumer needs.
(c) prcjects yielding benefits' in the Sixth Plan
itself.
(d ) dedicated schemes with specific linkages.
(c) restructuring production in r^a iion to
infrastructural build up.
(iv ) improvement in productivity.
fv) Setting up of coal handling plants to pro
mote physical and qualitative control of
coals and facilitate t loading.
(v i) Speedier construction of minci, specially
washeries.
(v ii) Improvement in facilities at pit heads for
enabling better accessibility, loading and
despatch by Railways.
(v iii) Improvement in measures for the safety of
workers.
P E T R O L E U M
Physical Performance
A. Crude Oil Production
11.28 The Sixth Plan originally envisaged cumula
tive production of domestic crude during the Plan
period of 93.4 million tonnes. This was made up
of 79.0 m illion tonnes from the O N G C and 14.4
m illion tonnes from O IL . In the case of ON GC , it
comprised 51.3 million tonnes from offshore areas
and 27.7 m illion tonnes from onshore areas. Sub
sequent to the finalisation of Sixth Plan, the O N G C
submitted an ‘accelerated’ programme of production
from offshore areas, which envisaged speedier deve
lopment of Bombay H igh and satellite fields in off
shore during Sixth Plan to get an additional produc
tion of 12.04 million tonnes. This accelerated pro
gramme was approved in July 1982. As a result,
the O N G C ’s target of crude production from off
shore areas increased from 51.3 m illion tonnes to
63.34 m illion tonnes and domestic crude production
target during the Plan period increased from 93.4
m illion tonnes to 105.44 million tonnes. The details
of domestic crude targets originally fixed for the
Sixth Plan and revised targets on account of imple-
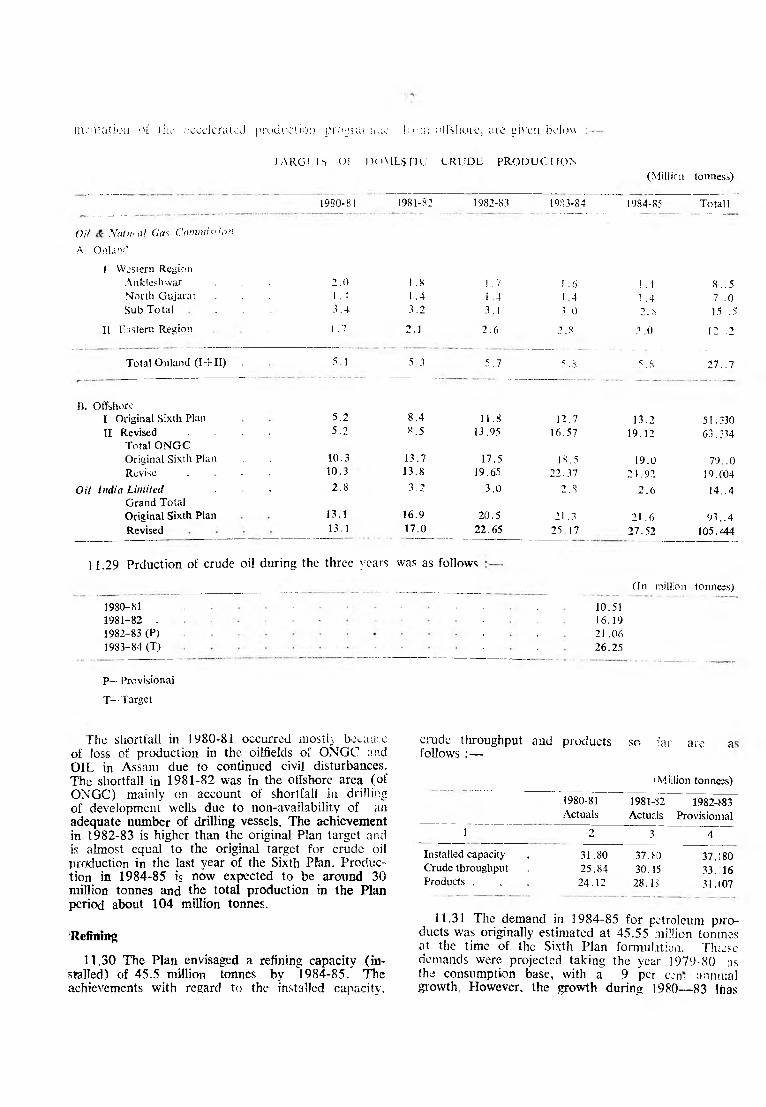
ni.'nlati'.'n of lhe n cc e le n ue e l production p r o g r a m m e !'r<>rn o l f s h o re , a rc g iv en below
1ARGL1S OI DOM ESTIC C R U D E PRO D U C T IO N
1980-81
Oil Natural Gas Commission
A. Oi'.ianf!
! Western Region
Anklestnvar , . . 2.0
North Gujarat . . . 1.4
Sub Tola! . . 3 .4
H Eastern Region 1.7
Total Onland (I + II) . 5 1
B. Offshore
I Original Sixth Plan 5.2
II Revised . . . . 5.2
Total O N G C
Original Sixth Plan . . 10.3
Revise . ■ ■ 10. ;>
Oil India Limited . . 2.8
Grand Total
Original Sixth Plan 13.1
Revised 13.1
11.29 Prduction of crude oil during the three years
1980-81
1981-82 .
1982-83 (P)
1983-84 (T)
P— Provisional
T— Target
(Millie n tonness)
1981-82 1982-83 1983-84 !984-85 Total 1
1.8 ! .7 ! .6 i .4 S.. 5
1.4 1.4 1 .4 1 .4 7. .03.2 3.1 3.0 2. 8 15 .5
2.1 2.6 2.8 3 .0 12..2
5.3 5.7 5.S 5.8 27.. 7
8.4 11.8 12.7 13.2 51 .330*.5 13.95 16.57 19.12 63.314
13.7 17.5 18.5 19.0 79..013.8 19.65 22.37 24.92 19.C04
3.2 3.0 2.8 2.6 14..4
16.9 20.5 21.3 21.6 93..417.0 22.65 25.17 27.52 105.-544
was as follows
___ ___________ (In million tonness)
10.51
16.19
21 .06
26.25
The shortfall in 1980-81 occurred mostly bci.au;e
of loss of production in the oilfields of O N G C and O IL in Assam due to continued civil disturbances.
The shortfall in 1981-82 was in the offshore area (of O N G C ) mainly on account of shortfall in drilling
of development wells due to non-availability of an
adequate number of drilling vessels. The achievement
in 1982-83 is higher than the original Plan target and
is almost equal to the original target for crude oil
production in the last year of the Sixth PPan. Produc
tion in 1984-85 is now expected to be around 30
m illion tonnes and the total production in the Plan
period about 104 million tonnes.
‘Refining
11.30 The Plan envisaged a refining capacity (in
stalled) of 45.5 million tonnes by 1984-85. TTic achievements with regard to the installed capacity.
crude throughput and products so far are a follows : —
(Million tonness)
1980-81 1981-32 1982483
Actuals Actuals Provisiomal
1 2 3 4
Installed capacity . 31.80 37.80 37.!80
Crude throughput . 25.84 30.15 33. 16
Products . . , 24.12 28. I i 31.(07
11.31 The demand in 1984-85 for petroleum p ro ducts was originally estimated at 45.55 million tomnes
at the time of the Sixth Plan formulation. TIkcsc
demands were projected taking the year 1979-80 as
the consumption base, with a 9 per c.'n- annuial growth. However, the growth during 1980— 83 Idas
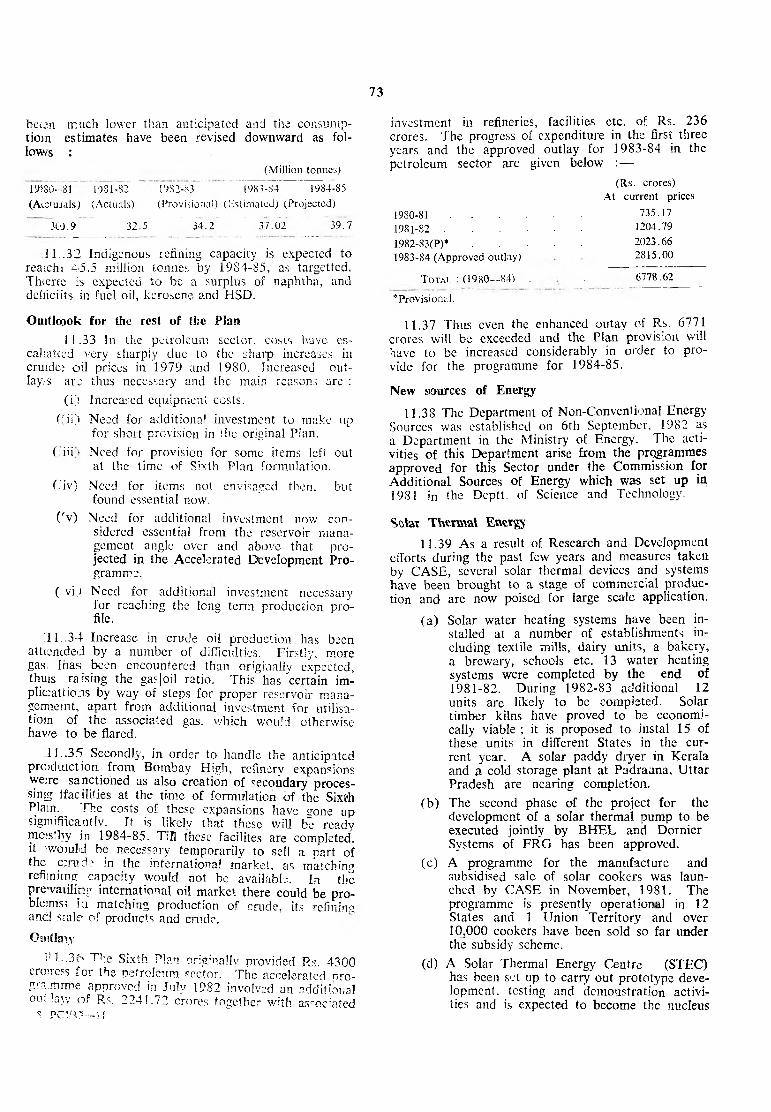
73
been much lower than anticipated and the consump
t io n estimates have been revised downward as fol
lows :
(Million tonnes)
19f80- ’81 1981-32 ~~ 1932-83 1983-84 1984-85
(A ietiua ls) (Actuals) (Provisional) (iisUmateJ) (Projected)
3C0.9 32.5 34.2 37.02 39.7
.J1..32 Indigenous refining capacity is expected to
reatchi 4-5.5 million tonnes by 1984-85, as targetted.
Thteree is expected to be a surplus of naphtha, and
defiiciits in fuel oil, kerosene and HSD.
Omtlcook for the rest of the Plan
11.33 In the petroleum sector, costs have es-
cahatced very sharply due to the sharp increases in
cruide; o il prices in 1979 and 1980. Increased out
lay/s are thus necessary and the main reasons are :
( i) Increased equipment costs.
(f ii) Need for additional investment to make up
for short provision in the original Plan.
( iii • Need for provision for some items left out
at the time of Sixth Plan formulation.
fiiv) Need for items not envisaged then, but
found essential now.
('v ) Need for additional investment now con
sidered essential from the reservoir management angle over and above that pro
jected in the Accelerated Envelopment Programme.
( v ij Need for additional investment ncccssary
for reaching the long term production profile.
111..34 Increase in crude oil production has been
attiencded by a number of difficulties. Firstly, more
gas, Inas been encountered than originally expected,
thuis raising the gas|oil ratio. This"has certain im
p lic a t io n s by way of steps for proper reservoir mana
gem ent, apart from additional investment for utilisa
t io n of the associated gas, which would otherwise hav/e to be flared.
11..35 Secondly, in order to handle the anticipated
p rod iuction from Bombay H igh, refinery expansions
we;re sanctioned as also crcation of secondary proces
sing ffacilities at the time of formulation of the Six'rh Plain. The costs of these expansions have gone up s ign ifican t I v. If is likely that these will be ready
mo;sfhy in 1984-85. TiH these facilites are completed, it 'womld be necessary temporarily to sell a part of
the c;ri’ d:' in the international market, as matching refimimg capacity would not be available. In the
prevailing, international oil market there could be pro
blems; in matching production of crude, its refining and ssale of products and cnide.
Owitlaiy
V 1..36 The Sixth P lan originally provided Rs. 4300
croiress for the petroleum sector. The accelerated vro-
gra.mrme approved in July 1982 involved an additional
out lay/ o f Rs. 2241.72 c.rores together with associated 8 p c r /^ —n
investment in refineries, facilities etc. of Rs. 236
crores. The progress of expenditure in the first three
years and the approved outlay for 1983-84 in the
petroleum sector are given below : —
(Rs. crores)
At current prices
735.17
1204.79
2023.66
2815.00
6778.62
1980-81
1981-82
1982-83(P) *
1983-84 (Approved outlay) .
T o t a l : (1980— 84) . . ______
‘ Provisional.
11.37 Thus even the enhanced outay of Rs. 6771
crores will be exceeded and the Plan provision will have to be increased considerably in order to pro
vide for the programme for 1984-85.
New sources of Energy
11.38 The Department of Non-Conventional Energy
Sources was established on 6th September, 1982 as a Department in the Ministry of Energy. The acti
vities of this Department arise from the programmes
approved for this Sector under the Commission for
Additional Sources of Energy which was set up in 1981 in the Deptt. of Science and Technology.
Sotar TV.trmal Energy
11.39 As a result of Research and Development
efforts during the past few years and measures taken by CASE , several solar thermal devices and systems
have been brought to a stage of commercial produc
tion and are now poised for large scale application.
(a ) Solar water heating systems have been installed at a number of establishments in
cluding textile mills, dairy units, a bakery,
a brewary, schools etc. 13 water heating
systems were completed by the end of
1981-82. During 1982-83 additional 12 units are likely to be completed. Solar
timber kilns have proved to be economi
cally viable ; it is proposed to instal 15 of these units in different States in the cur
rent year. A solar paddy dryer in Kerala
and a cold storage plant at Padrauna, U ttar
Pradesh are nearing completion.
(b ) The second phase of the project for the
development of a solar thermal pump to be
executed jointly by B H E L and Dornier
Systems of F R G has been approved.
(c) A programme for the manufacture and
subsidised sale of solar cookers was laun
ched by CA SE in November, 1981. The programme is presently operational in 12
States and 1 Union Territory and over
10,000 cookers have been sold so far under the subsidy scheme.
(d) A Solar Thermal Energy Centre (STEC) has been set up to carry out prototype deve
lopment, testing and demonstration activities and is expected to become the nucleus

74
of national effort in the utilization of solar
thermal energy.
(e) A National Soiar Photovoltaic Energy D e
monstration Programme ( \ .\ i.:. being implemented through the Central
.Electronics Limited (C lfL ) . lhe programme involves the production of solar
cells, modules and systems on a pilot scale, demonstration of various photovoltaic sys
tems and developments of techniques i'er
the production of low cost soi'ar cells. D uring 1981-82, a total of 21.07 KW of ceils
and modules were produced against 10.35
K W in the previous year. During the first
nine months of 1982-83, the production
amounted to 31.75 KW . 60 soiar pumps have been supplied so far, for purposes of
irrigation and drinking water supply as well as demonstration and evaluation in several States. Photovoltaic power pack
age has been delivered for installation on
off-shore platforms of the O N G C . Power
supply package was also supplied to the
first Indian Antarctica Expedition where it performed satisfactorily.
Bio-Energy
National Project on Biogas Development11.40 The Sixth Plan envisaged setting up Cl
4 lakh individual biogas units in the country. The
number of units commissioned were 25,369 in 1981- 82 and 57,498 in 1982-83, the highest achievement,
since the inception of the programme. The target for 1983-84 is 75,000 units. A survey of the
operating units is in progress regarding the main
tenance aspects, the results of which will enable the
Department to strengthen the future programme.
Community and Institutional Biogas Plants11.14 Under the demonstration programme launch
ed by CASE, community biogas plants are being
established at a number of locations throughout the
country. These plants provide biogas for cooking to a
large number of families (typically 60 to 100) in the communities they serve. The target for such nlnnts
during the Sixth Plan was originally fixed at 100: this figure has, however, been raised to 1000 under
the 20-Point Programme. So far 97 Diants have been sanctioned, of this 24 have been completed and lhe
remaining are under various stages of construction. Having regard to the local management problems the
achievements will fall short of the target under the 20-Point programme.
11.42 Under Energy plantation programme, several
species of quick growing are being tried out in different agroclimatic conditions. Plantations have alreadv
been set uo at Lucknow, Madurai, Bbavnaear and Yeotmal (Maharashtra).
T a b l e I t . I
Dep-mmont to'/n ~l?s
______ ___ t n r V'i i i V'
NV’W Hn<»rPfy Source* . . . . . . 50 01Nation?.! Project on Biogas Dpvelnonvjnt . 50.00
11.43 Two Biomass Research Centres, one at
and aaouier at ivjuuurai, are being suppor
ted io cany oi.u a varie.v <:■ ..ev :stiga.iOus on the pio-
duuue^on and availability of biomass. A n Agro Energy Centre supported by the Department has also
sxaried iuncUonir.g ai the Tamil Nadu Agricultural University, Coimbatore. Research is also being supported on the conversion arid utilisation of biomass
inciacin’K microbial product ion o" methanol, bycon
version of l'gnoccllulosic residues etc.
W IN D E N E R G Y
11.44 A country-wide programme of demon
stration of water pumping wind mills is being imple
mented mainly through the Institute of Engineering
and Rural Technology (1ERT ), Allahabad, 57 such
wind mills were installed till the end of 1981-82.
This figure is expected to rise to 400 by the end of1982-83. imastructure facilities for the fabrication of
wind mills are being set up at 4 additional establish
ments besides IE R T Some technical problems have
been encountered in the demonstration programme;
these are be:ng attended to and necessary corrective
measures initiated.
11.45 Useful results have been achieved on the
R&D projects relating to multi-blade wind mills and vertical a vs wind generator. Further work is being supported on lh :s and on the development of wind
electric generator mateiols and aerodynamics studies.
Other Renewable Soarces of Energy
11.46 Programme relating to various other renewable sources of energy such as ocean energy, geo
thermal energy, small hydro power, chemical sources
of energy etc. have been initiated. Certain items like
battery powered vehicles and small hydro systems are
being designed in laboratories and H ed out as prototypes and demonstration units.
M 5 D Power Plant
11.47 The project for the establishment of an ex
perimental coal based M F D power plant was ap
proved by Government in 1976 for erecu' ion jointly
bv Bharat Heavy Electricals Ltd. tp H P 1 ) and The
Bhabha Atomic Research Centre (BARC). The tes
ting and experimental runs on the 5 M W Plant will be taken up d’.inrs 3 983-84. A proposal for the
expansion of the plant to a level of 15 M W (Thermal) is under consideration.
11.48 The following table No. 11.1 gives the out
lay for 1980-85, the actual expenditure in 1980-81 nnd lpo i.o ? .. the rov--H e'-'imate-l ec !982-83 and
the h’r 1eef o^fhv o* 83-84. Again?', the plan provi
sion of Rs. 50 chores "01* the rroara^nnes of CASE,
+e exne.ndHure in *he f^rrt four ’ 'ears is likelv to be iRc. 44 59 croTV"'. Increase in the Plan rrovision to
H’e rc'!ivrcmcr!ts of the 1?r.t vear would befnr
1m »i i i ’ v ’ i v v v n ■ i >._ • tf»r\
S3 p i ’-) 17 00 41 50
3 .3 ' ^ n t l .0 0 '>3. 3^

CHAPTER 12
IN D U ST R Y & M IN E R A L S
A . Physical Targets asid Fetfornianct
As against the physical targets for major industries
listed in the V i Flan document, the capacity and pro
duction level expected to le achieved in 1984-85 are
presented in the statement at Appenuix I. Tne btate- ment aiso contains figures of actuates;!; ira ed achieve
ments during the first three years of the Plan, targets
ror 1983-8'i and the Lively es:iniaics ror iyo-,— 6j . /iii
estimate oi! the likely es.ce_sjsiiortfa.l oil capacity and
production in relation to the targeis se: for the terminal year of the Sixth Plan, i.e., 19S-;-85 is u;So given.
12.2 A review of performance reveals .hat while targets are likely to be achieved, in some impor;ant industries, e.g. petroleum, paper and paper board, com
mercial vehicles, scooters, motor cycles and mopeds,
machine tools, D .M .T ., etc., shorL'ai’s are iLeiy m a
number of oilier important induvries such as steel, non-ferrous metals, textiles, fertilizers, locomotives,
railway coaches, electric cables, trail ^ r k f
notes in respect of imper unt industries are given bdow.
12.3 The Plan had emphasized the need for mcder-
nisation and technological1 advance in the industry
sector. Satisfactory progress was maintained in this regard. These measures will yield resui's in the coming years. During 1983-84 a package of steps was announc
ed for speeding up industrialisation of backward districts.
Steel
12.4 A shortfall of 1.15 million tonnes is e>:p_:ted
in the production of steel ingots from integrated plants
Similarly, there would be a shortLai'r in tne product.on of saleable steel to the extent of about 0*.8 million
tonnes. The shortfall in steel production is primarily because of the slippages in the construction schedules of the Bhilai and the Bokaro expansion programmes.
Bhilai expansion from 2.5 miriion tonnes to 4 million
tonnes is now expected to be completed in March 1985 as against 1983-84 envisaged earlier. The Bokaro ex
pansion to 4 million tonnes is now likely to be com pleted only by December 1984 instead of in 1982-83
as planned earlier. The progress on the new steel plant at Vizag is also behind schedule. A shortfall of about
150,000 tonnes is also likely in the production capacity for sponge iron because there has been a slippage in
the commissioning schedule of the two sponge iron
projects being set up in the joint sector in Ori s?. and Bihar. Suitable changes in the product-mix of the exis
ting steel plants are being devised with a view to re
ducing imports. The emphasis will shift from total tonnage of saleable steel produced to production oriented to sale and the requirements of the market. Pro
duction of steel has been badly affected by constraints on power availability and deterioration in qualify or
coal. Steps for improving the infrastructure, especially
power, iiave been taken and these are expected to yield
results during the remaining period of the Sixth Plan.
Captive power plants are being set up at Bhilai, Bokaro, Durgapur and Rourkefa.
Iron Ore
12.5 The output of iron ore is now expected to be
around 45 million tonnes as against 60 million tonnes
envisaged in the Plan. The lower output is partly due to the shortfall in the estimated production of indi
genous steel in 1984-85 and partly because of lower experts due to worid-wide recession in the steel industry, which is undergoing a prolonged slump concu rren t
with the recession in the industrialised countries.
Non-ferrous Metals
12.6 Shortfalls in production to the extent of 40,000 tonnes in aluminium, 8000 tonnes in copper and 1 j ,000
tonnes in zinc are likely in 1984-85. These are attributable primarily to the shortage of power in a number
of SVai.es, particularly in Rajasthan. The expansion c£
the copper smei'ter at Khetri by 14,000 tonnes is also not likeiy to materialise by the end of the Plan period
as envisaged earlier. In the case of aluminium, the shortfall is mainly due to non-availability of power to
B A L C O smelter at Korba from the Madhya Pradesh State Electricity Board. Long term solutions to meet
the power needs have been approved and these will hefp in improving the output. These steps include firming
up power supply from the Madhya Pradesh grid as also
a captive power plant of 270 M W capacity at the Korba
aluminium complex.
Fertilizers
12.7 Shortfalls in capacity creation and production
are expected both in nitrogenous and phosphatic ferti
lizers in 1984-85 in relation to the targets in the Plan. There has been a slippage in the construction schedule
of the fertilizer project being set up at Thai Vaishet,
Hazira and Namrup-III. The Thai Vaishet project is now expected to be commissioned in December 1984
instead of August 1984 as envisaged earlier. There has
been a slippage of about six months in the case of Namrup-III which is now expected to be completed in May. 1985. The first phase of the Hazira fertilizer
project is now expected to be commissioned in January 1985 instead of September 1984 as envisaged earlier.It is doubtful if any of these projects would be able_ to
make any contribution to the output of fertilizers during
the Sixth Plan period. The shortfall in the production
of phcsohatic fertilizers is attributable to the poor performance of the fertilizers plants at Sindri and Khetri
75

76
as also to the delay in the commissioning of single
superphosphate plants.
12.8 There has been delay in commencing work on
the additional gas-based fertilizer plants. Decisions on
locations have been taken and work on these is likely
to commence during the remaining years of the Plan.
Speedy implementation is called for if ail these plants are to start making a contribution to fertilizer produc
tion during the Seventh Plan.
Chemicals
12.9 Shortfalls in output are expected in the pro
duction of caustic soda, soda ash and calcium carbide. These are primarily because of the delay in the commissioning of plants, demand constraints and power
scarcity. The liberal import of soda ash has also, to
some extent, affected indigenous production.
Textiles12.10 A shortfall of about 50 million kgs. of yarn
(cotton, blended and mixed) and about 440 million
metres of cloth in the mill sector is likely in 1984-85 as compared to the targets in the Sixth Plan. The short
fall is attributable to a number of factors such as inadequate domestic demand because of erosion in purchasing power, the strike in the textile mill industry
and the consequent lack of promotional efforts towards
sales or reducing costs of production and decline in
exports.
Automobiles12.11 In spite of the transitory phase of slack ia
demand, the targets for automobiles production, includ
ing commercial vehicles, are likely to be achieved. In
the case of scooters, motor cycles <ind mopeds, there is, in fact, a great spurt in demand and the output in
1984-85 is expected to be substantially higher than the
targets envisaged in the Sixth Plan.
12.12 Apart from the spurt in demand and G u tp u t
the industry has taken major steps for upgrading designs and technology of manufacture for the vehicles
and their auxiliaries. The first public sector unit for passenger vehicles is expected to go into production during 1983-84.
Electrical Equipment12.13 A shortfall in production of electrical trans
formers and cables is likely. This is primarily clue to the lack of adequate orders from the State Electricity
Boards and also to delav in payments by the SEBs due to paucity of funds. The output of power generating
equipment like boilers. Steam turbines and turbo
generators has shown satisfactory growth.
Electronics12.14 Shortfalls in production m a number of
electronics industries are also expected. Although the reasons for shortfall vary from industry to industry, a
major factor is the financial stringency being faced by
the electronics sector as a whole. W ith the commission
ing of the semi-conductor complex in 1983-84 the
country would be taking an important step in the field of micro-electronics, an area of future growth.
Cement
12.15 This industry is likely to register satisfactory
growth. The insi ailed capacity at the beginning of the
Sixth Plan was around 24 million tonnes which is expected to go upto 38 million tonnes by the end of
1983-84. The' capacity by the end of the Plan would be around 43 million tonnes. The industry has launched
a major modernisation programme. The ongoing
programme of adding about 275 M W of captive power
will help in raising the output in the remaining period of the Sixth Plan.
12.16 The expected shortfalls in physical production
in a number of industries in 1984-85 are primarily duo to delays in the execution of projects, shortages of
power in a number of States and demand constraints.
B. Financial Outlay
12.17 A statement showing department-wise details of the Sixth Plan outlay, the actual expenditure in
1980-81 and 1981-82, the revised estimates for1982-S3 and the approved outlay for 1983-84 will be
found at Appendix II. The indications are that additions to the Sixth Plan outlay of a varying order will be
required by the Department of Steel, Mines, Industrial
Development, Heavy Industry, Agriculture and Coope
ration, the Banking Division of' the Department of Economic Affairs and some, others. There will be a
shortfall, principally in petro-chemicals and Chemicals and Fertilizers. Overall, a net increase over the outlay
provided in the Sixth Plan will be called for in the sector of Industry and Minerals.
12.18 During the rest of the Plan period, provision will have to be made for (i) ongoing schemes, taking
into consideration escalations in cost and the progress
that has been achieved so far; (ii) a start in 1984-85 on new schemes which are included in the Six:h Plan (and will yield benefits in the Seventh) but for which
no provision could be made so far; (iii) new but
critical projects like captive power facilities for B A L C O ’s A lum inium plant, the National Fertilizer
Corporation’s fertilizer plants and the plants of H indu
stan Zinc which were not included in the Six.h Plan but are essential.
12.19 The projects under the Department cf Steel
would require additional outlays primarily because of
the escalations in cost of the ongoing projects. This is true of the Vishakhapatnam Steel Plant, Boktro ex
pansion, Bhilai expansion and the Kudremukh Iran Ore project. If the completion of ihese projects coatinues
to be delayed, there is bound to be further escalation
in cost with a consequent larger drain on financial re
sources. The entire question of the adequacy of investment in the steel sector with reference to the long-term requirements of s‘ed in the country would
need to be looked at carefully. It is necessary to ensure
that the addit'oral capacity programmed to be created
h the Seventh Plan through Vizag and the expansion
of (he existing plants does become available withcut too

77much further delay so that the demand for steel does not out-grow likely internal production. In this context,
the need to modernise the four old steel plants in a cost eSective manner calls for immediate examination since this will have a crucial bearing on the production
of steel in the Seventh Plan and beyond.
12.20 Considerable additional outlay will also be re
quired for projects under the Department of Mines specifically for the A lum inium project of N A L C O and
for the captive power plants required by the smelters
for non-f'errcus metals like aluminium, zinc and copper. Another project which would require additional outlay
is the gas-based fertilizer plant of K R IB H C O under the
Department of Agriculture and Cooperation. Projects under the Department of Heavy Industry, particularly,
Maruti Udyog Limited and some schemes of B H E L and HM T, where costs have gone up ,will require additional
funds. A substantial increase in outlay will also be required by the Banking Division of the Department of Economic Affairs to meet the larger fund requirements
of all India term lending institutions for augmenting
their share capital.
12.21 In the field of petro-chemicals, the shortfall
as compared to the original plan outlay is likely to occur primarily because the Maharashtra Gas Project
is still to be taken up. In the sector of chemicals and fertilizers again, there is likely to be a shortfall. This is
because work has not yet started on the new gas based
fertilizer projects. As against this, however, the require
ments of the gas based fertilizer plants at Thai Vaishetand Namrup and of the Paradeep Phosphate Fertilizer project will go up. But the net effect will be a
substantial reduction.
12.22 The overall step-up of investment in the
industry and minerals sector in 1984-85 will have to be
fairly large to meet the requirements indicated in the paragraphs above. This is necessary in order to avoid delay in the execution of a number of projects in this
critical sector of the economy, which would mean a consequent loss of production and possible increases in costs. In particular, investment on projects expected
to yield results in the Seventh Plan, especially in steel,
fertilizers and mines and metals needs to be provided to the maximum extent possible. In the context of the need for additional investment, the necessity of maxi
mising generation of internal resources in the public undertakings cannot be over-emphasized. The recent
improvements in the infrastructural areas should help in this.
12.23 The number of ongoing schemes in this sector is large, and many of these will spill over into the Seventh Plan. The spill over expenditwe will be consi
derable in the sectors of steel, mines, petro-chemicals
and chemicals and fertilizers. Thus, in this sector, the Seventh Plan will start with a proportionately larger
spill over expenditure from the Sixth Plan than in other sectors.

Mid-term Appraisal of the Sixth Five Year Plan—Physical TargetsA p p e n d i x I
S. Industry No.
Unit 1984-85 Targets
Sixth Plan
1980-81(Actuals) 1981-82(Actuals
Estimated)
1982-83Anticipated
1983-84Targets/
Estimates
1984-85(RevisedTargets)
Variation (+) (- )
Cap. Prod. Cap. Prod. Cap. Prod. Cap. P rjd . Cap. ?r jd . Cap. P rjd . Cap Prod.
0 1 2 3 4 5 6 7 8 9 10 11 12 13 14 15 16
Mining
1. C o a l .........................................
M illionTonnes
165 ; . . 113.96 124.9 130.6 142 154 ( - ) l 1
2 . Lignite . . . . 8.0 5. 1 6.31 3 93 6.92 8.0
3. Crude O il . . . . 21.60 10.51 16 I ? 1 0> >6 25 27.52 (+ )5 .9 i
4. Iron Ore . . . . »» 60 40.6 39.9 40.2 42 45 (— )15
Basic Metals
5. Hot Metal (Integ. Plants) M 15.27 13.20 12.2 8.38 13.14 9.5 13.14 9.49 14.16 10.77 15.27 12.30 (— )0.90
6 . Pig Iron for sale . >* 1.52 . , 1.44 1.27 1.30 1.47 1.47 (— >0.0 5
7. Steel Ingots »• 17.90 14.45 14.47 9.31 14.47 10.40 15.97 10.62 17.01 11.93 17.9 13.50 (— >0.95
8. Steel Ingots (Integrated Plants) ♦ » 14.56 12.45 11.4 7.35 11.4 8.6 12.90 8.62 13.81 9.58 14.56 11.30 ( - ) l . i 5
9. Saleable Steel »* 14.30 11.51 11.18 7.81 11.18 8.66 11.72 9.09 12.83 9.59 14.30 10.90 (— )0.61
10. Saleable Steel M 11.30 9.71 8.7 6.28 8.7 7.26 9.24 7.29 10.13 7.59 11.30 8.90 (— )0 .81(Integrated Plants)
11. Alloy and Spccial Steel ’000 1050 920 800 670 837 744 850 805 950 800 1050 920
12. Sponge Iron »» 330 160 30 27 ISO 75 14) 73 ISO 15 J (— ) 15 J
13. Alum inium . ♦ ♦ 350 300 321 199 321 207 321 208 367. 250 341 260 (—)9 (— )40
14. Copper (Blister) »» 60 50 47.5 25.3 47.5 27.44 47.5 35 47*5 4J 47.5 42 (— )12.5
oooT
15. Zinc . . . . . 98 85 92 45.5 92 57.7 92 52 92 65 95 7.) (- ) J (- )15
16. Lead . . . . . » 30 25 18 14.9 18 14.46 18 14.8 30 18 33 ’.5
Metal Products
17. Steel Casting >» 200 135 178 71 174 80 182 86.1 185 90 190 100 (—)10 (— )35
18. Steel Forgings 240 180 240 145.4 260 162.6 260 150 270 175 280 195 (+)40 (+)15
Non-MetalUc
Mineral Products
19. Cement . . . . M illion 43 34.5 26.99 18.6 29.25 21.07 34 23.5 38 28 43 31.5
20. Refnxtories
tonnes
. ’000 1800 1250 1620 900 1682 875 1790 1050 1790 1150 1800 1250
21. Petroleum Products
Tonnes
M illion. 35.34 25.84 24.12 30.15 28.18 33.16 31.07 34.42 32.01 39.26 (+>3.92Tonnes

-2. Caustic Soda . 1000T 1050 850 779 575 778.3 614 817.2 600 969 710 1050 775 (— >75
2J. Soda Ash . 1000 850 633 563 680 632 746 600 761 630 1000 720 (— )1 30
24. Calcium Carbide . 250 200 167 82 1 67 74 170.4 70 176 90 240 150 (-)10 (— )50
25. Industrial Oxygen . M C M 200 150 124 95 .1 135 115 150 115 165 125 200 140 (—>10
Agricultural Chemicals
26. Nitrogenous Fertilizers ’000T 5938 4200 4575 2164 4719 3144 5144 2420 5295 3800 5760 4100 (->178 (-)100
( - n o 027. Phosphatic Fertilizers . 1825 1400 1282 842 1418 949 1418 976 1493 1150 1598 1300 C—>227
28. B .H .C . (in terms of 13% 43.9 43 37.9 28.8 41.9 28.4 41 .9 35 41.9 40 44.5 43 (+ )0.6
Isomer)
29. D .D .T . »> 9.10 10 4.1 4 .0 4.1 3.2 9.1 5.0 9. i 8.0 9.1 9.0 ( - ) i
30. Other Pesticides ♦ J> 37.60 26.4 27.5 9.3 29.3 14.4 31.7 16.4 31.7 21 37.6 26.4
31. Malathion . 9.2 7.5 5.3 1.3 6.3 3.0 12.8 5.6 12.8 8.0 12.8 10.0 (+ )3 .6 (+ )2 .5
Thermo Plastic and Synthetic Rubbers32. L .D . Polyethylene "OOOT 112 100 112 87.2 112 85.53 112 100.4 112 105 112 105
<+>533. H .D . Polyethylene * » 30 27 30 24.3 30 31.7 30 32.1 30 33 30 35 ( - i s
34. Polyvinyl Chloride 173 128 77.9 42.1 85.8 37.4 85.8 37 86.4 55 175 120 (+)2 (_ )8
35. Polyprophylene . »♦ 30 27 30 16.7 30 19.3 30 22 30 25 30 27
36. Polystyrene 23.5 20 23.5 10.2 23.5 7.9 23.5 10.5 26.1 12 23.5 15 (_ )5
37. Styrene Butadiene Rubber 30 27 30 19.0 30 17.4 30 14.6 30 20 30 24 (->3
38. Polybutadiene Rubber 20 18 20 6.5 20 11.5 20 16.1 20 14.5 20 18
39. Acrylonitrile • >> 24 20 24 10.4 24 14 24 16.7 24 18.3 24 20
40. D .M .T . »» 66 56 24 23.1 24 27.3 30 22.8 30 30 135 65 (+)69 (+)9
41. Caprolactam *» 20 18 20 13.1 20 9.9 20 14 20 15 20 18
42. Detergent Alkylate 37.5 35 30 17.4 30 30.3 30 25.7 30 28.5 30 30 (—)7 .5 (- )5
43. Methanol • »» 124 100 44.5 41 44.5 43.3 44.5 41.2 85.7 65 102.8 80 (— )21.2 (—)20
44. Phenol ■ 20.9 12.4 20.9 11.8 20.9 15.1 20.9 15 20.9 15
Man-Made Fibres45. Viscose Filament Yarn I) 43 43 41 43 44.4 42 44.4 40 50 45 55 50 (+)12 (+ )7
46. Viscose Staple Fibre Ji 150 120 89 80 106 80 125 50 125 90 138 110 (—>12 (—>1047. Viscose Tyre Cord »» 21 21 20 14 21 14 21 15 18 15 21 21
48. Nylon Filament Yarn >> 31.4 28 22 20.8 24.5 23.4 28.2 26 28.2 26 31.4 2.8
49. Nylon Tyre Cord and Indus M 13.5 13.5 10.5 11.8 13.5 14.3 13.5 16 13.5 16 13.5 16 (+ )2 .5trial Yarn.
50. Polyester Staple Fibre . 58.6 55 32.1 22.4 34.5 29.0 34.3 27.7 40.4 31 46.5 40 (—)12.1 (- )1 551. Polyester Filament Yarn tt 18 18 8 10.7 8 15.4 22.5 20.8 37.9 28 37.9 35 (+)19.9 (—)17
52. Acrylic Fibre 16 14 16 8 16 13.5 16 16 16 16 16 16 (4 )2
Drugs and Pharmaceuticals
53. Bulk Drug Rs. Crores 665 240 289 325 360 375 500 (—)L65
54. Formulations ft 2450 1200 1430 1545 1625 1650 1950 (—)500
Food Products55. Sugar* . . . . M . Tonnes 8 7.64 6.3 5.15 6.5 8.4 6.8 8.3 7 .5 7 .2 8.0 7.64
56. Vanaspati . . . . ‘000 Tonnes 351 900 1385 753 1385 820 1415 875 1460 900-950 1415 950 (+)64 ( 4-)50
* Figures for sugir s n s a i (October— September)

0 1 2 3 4 5 6 7
Textiles
57. All Yarn (Cotton Blended Cap. 22.76 1425 21.23 1298 21.73
Mixed).
58. Cloth (M ill Sector).
Mill, and Spindles
Prod. M ill. Kgs.
Cap. 2.17 4900 2.08 4368 2.10
59. Cloth (Decentralised Sector).
Lakh looms Prod.
Mill. Meters
Mill 8400 6923
60. Jute Manufacturers.
Metres
‘000 T 1500 1393
Leather and Rubber Goods
61. Leather Footwear (Org. Sector) Mill. 30 25 21.5 13.5 21.52
62. Rubber and Canvas Footwear
pairs
a 57 55 54.88 43.83 54.88
(Org. Sector)
63. Bicycle Tyres (Org. Sector) . Mill. Nos. 34 34 34 27 34
64. Automobile Tyres » 12.8 11.5 9.28 7.97 10.4
Paper and Paper Products
65. Paper and Paper Board ‘000 T 2050 1500 1657 1145 1844
66. Newsprint *» 230 180 75 51 150
Soaps & Detergents
67. Soaps (Org. Sector) ,, 370 337
68. Synthetic Detergent (Org. 375 300 240 175 240
Sector)
Industrial Machinery
69. Machine Tools Rs. Crores 300 250 210 196.2 290
70. Mining machinery ,, 50 45 45 37.3 45
71. Metallurgical machinery 82 55.6
72. Cement Machinery 75 60 45 33.6 56
73. Chemicals and Pharmaceuti 150 130 112 106.6 135cals machinery.
74. Sugar machinery 88 70 51.8 24.2 52
75. Rubber Machinery 20 14 15 10.2 16
76. Paper anti Pulp 50 42 47 36.8 50
77. Printing Machinery . , 17 14 10 8.2 11
78. Textile machinery ,, 370 295 330 302.7 400
79. Boilers . . . . >. 430 346 324.4 308.4 400
Electrical Power Equipment
80. Steam Turbines . M K W 4 3.50 3 2.15 3.4
81. Hydro Turbines . 1.50 1.20 1 .03 0.33 1.282. Transformers M K VA 40 35 31.15 19.5 31.5
8 9 10 11 12 13 14 15 16
1249 22.80 1200 23.3 1327 23.50 1375 (+ )0.74 (— )50
4038 2.10 3100 2.15 4350 2.17 4460 (—)440
7200 7258 7400 8130 (— )270
1340 1250 1300 1500
14.4 20.12 12.97 22.6 15.5 25.36 19.50 (—)4.64 (~ )5 .50
35.79 56.23 38 56.23 40 56.23 47 (- )0 .77 (—)8
27 34 27.5 34 29 34 34
8.7 11.3 8.7 11.5 9.5 12.0 10.5 T © 00 (.1)1
1242 1950 1202 2100 1400 2200 1500 (4)150
64 230 121 230 180 230 200 (+)20
340 334 355 370
176 277.2 200 287.2 230 320 225 (—>55 (— )75
245 290 270 340 317 440 350 (4 )140 (+)10039.3 50 64.6 50 70 70 55 (4 )2 0 ( + )1064.1 65.1 70 95 (+)13
40.5 68.5 41 75 53 SO 60 (4)15
115 150 141.3 150 150 200 150 (+)50 (—)20
29.8 57.5 34.5 60 35 60 50 (—)28 (4 )20
6.7 19.5 11 19.5 14 20 14
33.5 51.6 21.7 51.6 42 60 42 ( 4)10
10.8 18 21.7 22 20 20 15 (+)3 (+)1330 460 365 460 390 500 420 (4-)130 (4-)125
388.6 500 430 470 420 550 480 (4-)120 (4)134
2.7 3.7 3 4 3.4 4 3.5
1.2 1.5 1.1 1.5 1.1 1.5 1.221.4 33 18.8 33 23 35 25 {—)5 (-)10
• - ■ - <• O C / \l . / -41

£8
84. Eanu Moving Equipment Nos. 2700 2200 2060 99 685. Road Rollers » 1800 1400 1800 948
Agricultural Machinery
86. Tractors . . . . ’000 Nos. 110 100 77 71
Rail and Water Transport
87. Diesel Locomotives Nos. 225 210 210 213
88. Elcctric . ,, 80 78 80 69
89. Railway Coaches }J 2100 1700 1650 1044
90. Railway Wagons . ’000 Nos. 30 25 25 13.7
91. Ship Building ’000 G RT 186 140 140 90
Road Transport
92. Commercial Vehicles ’000 Nos. 140 105 95 71.8
93. Passenger Cars 1. ,, 60 48 53 31.3
94. Jeepsc . . . ,, 25 20 18 17.9
95. Scooters, Motor Cycles ir:Mqpeds . . . . ,, 675 500 590 447.2
96. Bicycles (Org. Sectors) M ill. Nos. 8 6 5.2 4.19
Mechanical Components and Consumer Durables
97. Ball and Roller Bearings M ill. Nos. 80 64 45 34.3
98. Type writers ’000 Nos. 170 143 138.4 96.4
99. Sewing Machines 555 470 573 335.3
100. Mechanical Watches . . M ill. Nos.
Electrical Components and Consumer
15 12.50 6.1 4.6
Durable
101. ACSR and A A Conductors . ’000 137.30 120 139.6 86tonnes
102. PVC & V1R cables (Org. Sector) . . . . MC M 1281 900 1281 506.9
103. Dry Cells . . . . M ill. Nos. 1750 1400 1336 994.4
104. Storage Batteries . ,, 2.77 2.31 2.27 1.74
105. G LS Lamps M ill. Nos. 360 290 240 198.1
106, Flourcscent Tubes ,, 52.50 42 27.92 28.3
107. HT Insulators ’000 T 64 51 27.62 24
108. HT Circuit Breakers i) 17 • 13 16.46 9.1
109. Domestic Refrigerators ’000 Nos. 520 390 339 289.8
110. Power Capacitors M VAR (R T & L T ) 2750 2200 1238 1204
111. Welding Electrodes M R M 800 715 742.8 512.8
112. Electric Fans M ill Nos. 8.25 6.60 3.52 4.18
113. Power Cables ELPE (XLPE,
P1GL PVC ’000 Km. 60 45 41.8 25.2
2060
JSOO
100
21080
1650
28
140
103
53
20
672
5.2
45
140.4
555
6.1
154
1400
1504
2.68
278.5
35.98
27.62
16.46
339
1482
742
5.0
43
*Excludes 0.61 Million Nos. capacity for export.
1740 2100 2195 2300 2200 2700 2300
1065 1800 1 146 1800 1300 1800 1400
84. 2 yo 62.8 90 . 70 110 100
170 210 150 210 100 210 170
60 so 56 80 60 80 70
1233 1650 1200 1650 121 1 1650 1 300
13.8 2S 15.35 28 12.5 25 20
95 156 102 176 120 186 140
91.1 103 86 109 95 150 120
42.5 53 43.6 73 45 78 56
20 .2 25 21.8 25 25 30 27
525 750 633.5 800 730 900 780
4.36 6.9 4.73 7.0 5.6 S.O 6 .0
38.3 50 35.84 60 42 63 5389.4 146.4 116.7 156.4 120 156.4 120
343 573 309 573 350 573 3605.15 6. 1 5 7 6 9 8
66.1 1.54 52.4 154 60 154 85
483.1 1400 4S0 1400 500 1400 5501104 1504 11.15 1504 1270 1700 1400
1.97* 2.68 1.9 2.65* 2.4 2.11* 2 .6266.6 278.5 273 344 320 400 35031.9 35.98 33.26 45 38.5 52 42
25 46 30 46 32 52 359.5 19.95 9.87 19.95 10 16.46 11327 563 378 563 400 520 390
1085 1582 950 1715 1100 2000 1600521 742 624 742 730 742 750
3.84 5.0 4.2 6 .0 4 .6 7.0 5.0
->2 45.8 20 45 .S 22 43 35
(... .115
( —)450
(~ )5
( H 10
( 4-)l8
(— )5
( -H225
( )17
<- )1 3.6
(+>18
(—)6
( . .116.7
< ->l 19
(—>50
(-! )40
( —)0. 5
(—>12
(— )0.54
<—>750
(—>58
( .25
(-017
(-<_iS
( —)4C0
(— )5
(-;-)i5
(-MS
( -)7
(-.->280
(- )U (—>23
(—•>! 10 (—>4.5
(— )3 5
( —;350
( -i >0.29
( + >60
(— >16
(-)2
(—J600
(->35
(—>1.6
(—>10

(0) (1) (2)
Electronics
114. Consumer Electronics . . Rs. crores
115. Radio Receivers ,,
116. TV Receivers ,,
117. Tape Recorders . . . „
118. Record Players „
119. Amplifiers and PA Systems . „
120. Calculators „
121. Electronic Watches . . ,,
122. Others (OTV, TV Glass)
Industrial Electronics
123. Instruments (T&M Analytical)
124. Process Control Equipment . „
125. Power Electronics . . ,,
126. Medical Electronics
Communication Equipment .
127. Mass Communication . . „
128. Tele-Communication . . „
129. Two-way Communication . „
130. Aero-Space „
Computer Systems ,,
131. C P U .........................................
132. Peripherals „
133. Unbundled Soft Ware . ,,
D . Product in Free Trade Zone
134. Components . . .
(3) (4) (5) (6) (7)
602 522.50 305 210.5 349
200 177 118 94 130
200 180 98 69 105
50 38 22 18.8 35
13 11.50 11 8.1 11
25 19 20 13.8 21
36 32 22 8.1 22
60 50 10 5 10
18 15 6.8 15
465 350 205 140 240
148 102.5 65 33.5 72
157 122.50 75 49 79.5
118 95 49 44.5 70
42 30 16 13 18
653 509.4 315.2 216 362
13 10.40 4 1.5 5
400 306 190 144.5 230
35 30 11.2 7 12
205 163 110 63 115
120 90 34 23.8 46
70 50 20 12.3 24
25 2? 10 7.8 15
25 20 4 3.7 8
45 18.6
450 395 210 160 255
(8) (9) (10) ( 11) ( 12) (13> (14) (15) (16)
272 415 370 482 427 580 476 (—)22 ( —)46.?
105 150 120 160 135 188 150 (—)12 (■—>27
92
28.5
130
40
160
35
155
60
170
48
190
75
175
60
<—)io
( 4)25
(--)5
(4 )22
7.5 11 7 11 8 11 9 (— )2 (- )2 .5
14 22 12 22 15 22 17 (—)3 (— >"
7 22 8 20 9 20 10 ( —)16 ( —)22
5 15 8 20 15 30 20 (— )30 (~)3()
13 25 20 34 27 44 35 (4 )26 ( + ;20
163 261 197 320 229 380 275 (—>85 (. —)75
38 72 45 75 50 75 58 <-)73 ( —>44.5
46.8 52 52.7 90 60 115 80 (—)42 (-142.5
55 83 70 120 90 160 115 (— )42 ( 4 :20
10.3 20 11 22 12 30 22 < -)12 (- )S
253 373 293 405 329 460 377 (—) 193 ( —>132.4
4 8 6 8 6 10 7 (— )3 (->3 .4
170 235 205 260 230 310 270 (.—>90 ( —)36
9 15 12 17 13 20 15 <— )I5 ( —)15
70 115 70 120 80 120 85 (— )85 (— )7S
34 63 45 85 66 125 90 0 ) 5
17 35 25 45 36 70 50 l ■ •
11.5 18 14 25 17 30 20 (4 )5
5.5 10 6 15 1.3 25 20
28 55 60 70 (.4)25
180 300 210 360 250 430 300 <—)20 ( —)95

Mid-Term Appraisal of the Sixth Five Year Plan—Industries & Minerals (Central Sector)A p p e n d ix I I
(Rs. crores)
SI* Ministry/Department Sixth Plan 1980-81 1981-82 1982-83 1982-83 1983-84
N o. Outlay Actual Actual Budgotiry Revised Approved
(Original) Expenditure Expenditure Provisions F ti'-islo o-.itl.iy
1. Department of Steel . . . . 4000.00 758.56 796.22 859.90 870.31 820.37
2. Department of Miacs . . . . 1380.00 15!. 29 147.51 292.35 326.03 491.0J
3. Ministry of Petroleum (Petro-Chemiculs) . ‘>35.00 ■','..30 61.55 105.15 115.53 112.0J
4, Ministry of Chemicals & Fertilizers 2350.00 25'). 40 278.19 386.65 351.11 428.83
5. Deptt. of Agriculture & Cooperation . 325.00 30.00 75.00 120.00 105.01) 145.00
6. Deptt. of Industrial Development 850.00 138.90 155.61 193.41 191.68 167.90
7. Deptt. of He ivy Industry . . . . 704.04 83.16 118.9: 153.00 119.85 207.43
8. Ministry of Shipping & Transport 97.37 13.54 14.75 14.96 11.65 16.10
(Ship building industry)
9. Department of Electronics 140.28 10.63 19.18 37.49 47.00 32.00
10. Department of Atomic Energy 352.05 37.51 43.58 56.03 62.41 91.49
11. Department of Economic Affairs 40.02 10.04 8.80 6.97 6.12 4.00
(Currency & Coinr.ge)
12. Department of Economic Affairs 354.70 100.83 299.33 83.03 81.00 122.75
(Banking Division)
13. Depa rtrrcnt of Revenue . 0.21 0.01 0.10 0.07 0.01
14. Department oi Civil Supplies 48.90 1.37 1.13 3.30 1.36 3.28
15 . Department of Commerce—
(i) Plantations . . . . 137.00 15.00 20.00 25.15 23.19 30.00(ii) Other Schemes . . . 25.36 2.52 4.58 3.35 4.22 7.38
16. Department of Textiles . . . . 102.13 21.94 21.11 22.43 22.63 24.89
17. Department of Science and Technology 6.00 0.65 0.75 0.80 0.80 0.80
T o ta l.................................................... 11848.07 1680.61 2061.31 2364.81 2379.06 2708.28*
‘ Excludes allocation of additional outlay decided in July 1983
83

CHAPTER 13
T RAN SPO RT
Railways
Tlic position in respect of some of the basic assets
a id output indicators of the Railways at the end of
e ich Plan period and up to 1981-82 may be seen in
^•nnexure 13.1 attached.
13.2 The position regarding some of the major
t|:rgets!projections for Railways as given in the Sixth
Plan Document and the progress so far in respect
thereof is uiven in the Table 13.1 below : —
Ta b u : 13.1
Item
IJo.
!. Clearance of originating traffic per year (million tonnes)
-'. Clearance of originating revenue earning traffic
-. Net Tonne KM 's per
Procurement of Locomo
tives . . . .
t. Procurement of coaches and E M U ’s
Electritication (KMs)
1984-85
T argets
Achieve
ments
up to
1982-83
Antici
pated
up to
1983-84
Antici
pated
up to
1984-S5
309 254 264 282A
287 228 241 25 7A
1125 1125 1150 1175 B
100,000 43,500 60,000 77.000C
780 607 782 980D
6070 3275 4486 5900
14,000 4300 7050 10,400
2800 874 1490 2500
(A) Trallic projections are less than original Sixth Plan figures d'te to lower demand from commodity sectors as compared to those assessed at the time of Sixth Plan formulation.
IB) Achievements in utilisation expected to be higher than *h‘! original Sixth Plan target.
(C ) Keeping in view the lower demand for rail transport [note (A ) above] and higher utillation is [not (B ) above] the requirement of wagons has gone down t'o about 80,000 wagons aSains( the original projection of 100,000 wagons. However due to constraint of resources actual procurement is expected 10 about 77.000 wagons.
'D ) In order to achieve better trallic clearance with fewer wajons through greater mobility, a higher level of locomotive
nisition has been programmed.
J3.3 The position in respect of some of the impor
tant performance indicators during Ihe first three years
of the Plan as compared to the base year 1979-80 is given in Table 13.2 below :
T a u l l 13.2
Performance indicators (BG— Good's traffic)
SI. Indicator 1979-80 1980-81 1981-82 1982-83No. (Estimated)
1. Wagon KM's/Wagon day 73.3 73.4 83.7 85.0
2. N T K M ’s/Wagon day . 972 986 1112 1125
3. Average gross trainload
(tonnes) i694 1721 1775
4. Average speed (Kmph) . 19.5 19.7 20.8 22.6
5. KM 's per Engine Day
Diesel 307 303 370 388
Electric 289 274 366 390
13.4 It will be seen from Table 13.1 above that in some of the critical areas of the Railway’s programme like procurement of wagons, track renewal and electri
fication, there are likely to be shortfalls in the fulfilment of targets. In respect of clearance of traffic, after a very
bad three year patch from 1978-79 to 1980-81, the capacity of the Railways for clearance (during the past
two years 1981-82 and 1982-83) remained broadly
adequate to meet the demands of rail transport from the commodity sectors. During these two years, the
traffic clearance as well as wagon utilisation indices on the Railways broke all previous records and the Plan target for wagon utilisation for 1984-85 wa; achieved in 1982-83 itself. However, even on the basij of conservative estimates of demand during 1983-84 and 1984-85 a sizeable gap between the anticipated
capacity of the Railways and the total demand for rail transport is likely to emerge despite the achievement o]
further increase in the utilisation fevels by the Railways. For example on the basis of present allocation for wagons etc., and the achievement of a higher utilisation level of 1150 NTKM s per wagon day the capacity for
clearance of the Raiways during 1983-84 is assessed us 264 million tonnes (including 241 million tonnes
revenue earning traffic). On the other hand, the total demand for rail transport in 1983-84 is assessed as
275 milFion tonnes (including 252 million tonnes revenue earning) and is further expected to go up in
1984-85 to 280 million tonnes). In order to prevent
recurrence of bottlenecks in rail transport along wilt
the attendent chain reactions it would be necessary apart from other measures ‘to step up the investment ir the Railway sector in the coming years. The Railway;
on their part will have to devote attention to bettei
monitoring of projects some of which are heavilj
behind schedule with corresponding cost:lime over runs
84
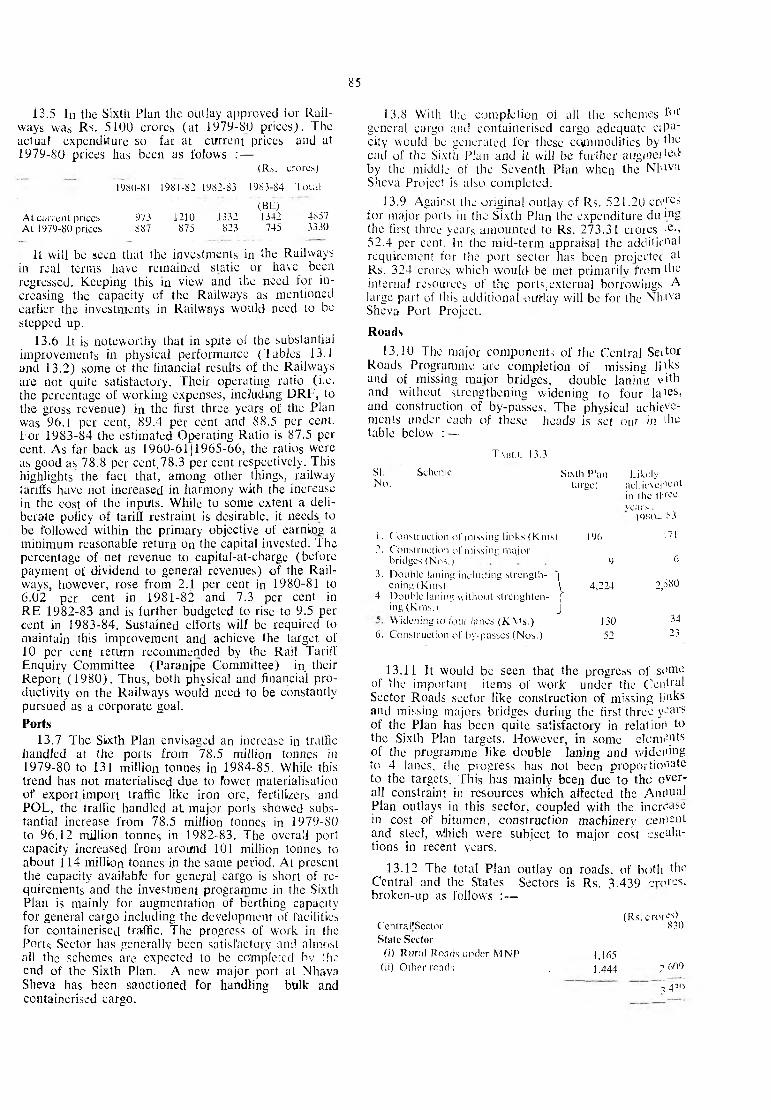
85
13.5 In the Sixth Plan the outlay approved for Rail
ways was Rs. 5100 crorcs (at 1979-80 prices). The
actuaf expenditure so far at current prices and at 1979-80 prices has been as folows : —
(Rs. crores)
1980-81 1981-82 1982-83 1983-84 Total
(BE)
A t current prices 973 1210 1332 1342 4857
A t 1979-80 prices 887 875 823 745 3330
It will be seen that the investments in the Railways in real terms have remained static or have been
regressed. Keeping this in view and the need for increasing the capacity of the Railways as mentioned
earlier the investments in Railways would need to be
stepped up.
13.6 It is noteworthy that in spite of the substantial
improvements in physical performance (Tables 13.1 and 13.2) some ot the financial results of' the Railways are not quite satisfactory. Their operating ratio (i.e. the percentage of working expenses, incl'udvng D R F , to
the gross revenue) in the first three years of the Plan was 96.1 per cent, 89.4 per cent and 88.5 per cent. For 1983-84 the estimated Operating Ratio is 87.5 per cent. As far back as 1960-61 j 1965-66, the ratios were as good as 78.8 per cent|78.3 per cent respectively. This
highlights the fact that, among other things, railway
lariffs have not increased in harmony with the increase in the cost of the inputs. While to some extent a deliberate policy of tariff restraint is desirable, it needs to
be followed within the primary objective of earning a m inimum reasonable return on the capital invested. The percentage of net revenue to capital-at-charge (before
payment of dividend to general revenues) of the R a ilways, however, rose from 2.1 per cent in 1980-81 to6.02 per cent in 1981-82 and 7.3 per cent in
R E 1982-83 and is further budgeted to rise to 9.5 per
cent in 1983-84. Sustained efforts wilf be required to
maintain this improvement and achieve the target of10 per cent return recommended by the Rail Tariff
Enquiry Committee (Paranjpe Committee) in their Report (1980). Thus, both physical and financial pro
ductivity on the Railways would need to be constantly
pursued as a corporate goal.
Ports
13.7 The Sixth Plan envisaged an increase in traffic
handled at lhe ports from 78.5 million tonnes in 1979-80 to 131 million tonnes in 1984-85. While this trend has not materialised due to tower materialisation
of export, import traffic like iron ore, fertilizers and P O L , the traffic handled at major ports showed subs
tantial increase from 78.5 million tonnes in 1979-80 to 96.12 million tonnes in 1982-83. The overaij port
capacity increased from around 101 million tonnes to
about 114 million tonnes in the same period. At present the capacity available for general cargo is short of re
quirements and the investment programme in the Sixth Plan is mainly for augmentation of berthing capacity
for general cargo including the development of facilities
for containerised traffic. The progress of work in the
Ports Sector has generally been satisfactory and almost
all the schemes are expectcd to be co'mplcrcd bv ‘.he end of the Sixth Plan. A new major port at Nhavn
Sheva has been sanctioned for handling bulk and
containerised cargo.
13.8 With the completion of all the schemes l'°r general cargo and containerised cargo adequate c;Pa_
city would be generated for these ccvmnodities by the end of the Sixth Plan and it will be further aug/uer^d
by the middle of the Seventh Plan when the Nhiva Sheva Project is also completed.
13.9 Against the original outlay of Rs. 521.20 eri,_res for major ports in the Sixth Plan the expenditure du nig
the first three years amounted to Rs. 273.31 crores -e->52.4 per cent. In the mid-term appraisal the additional
requirement for the port sector has been projectec al Rs. 324 crores which would be met primarily from the
internaf resources of the portsjexterna] borrowings A large part of this additional oirtiay will be for the N hiva Sheva Port Project.
Roads
13.10 The major components of the Central Seitor
Roads Programme are completion of missing li'ks and of missing major bridges, double lanins vith and without strengthening widening to four la'cs,
and construction of by-passes. The physical achievements under each of these heads1 is set out in the table below :—
Ta b u : 13.3
S! Scheme Sixth Plan LikelyNo. target achic\er'ent
in the tfree
vcars.— (QSO- 83
1. Construction of missing links (Kms) 196 171
2. Construction of missing majorbridges (N os.) 9 6
3. Double laning including strength- ~)cuing (Kms) \ 4,224 2,^80
4. Double laning without strenghten- (ing (Kms.) J
sWidening to four lanes (K\’s.) 130 34
6. Construction of by-passes (Nos.) 52 23
13.11 It would be seen that the progress of si'mc of 'the important items of work under the Central
Sector Roads sector like construction of missing links and missing majors bridges during the first three years
of the Plan has been quite satisfactory in relation to the Sixth Plan targets. However, in some elem^pts
of the programme like double laning and widening to 4 lanes, the progress has not been proportionate
to the targets. This has mainly been due to the over
all constraint in resources which affected the Animal Plan outlays in this sector, coupled with the increase in cost of bitumen, construction machinery cenient
and steel, w'hich were subject to major cost e sc a la
tions in recent years.
13.12 The total Plan outlay on roads, of both the Central and the States Sectors is Rs. 3,439 cro res .
broken-up as follows :—
(Rs. cror1CentraFSeclor 830
State Sector
(i) Rum] Ronds under M N P |Jrt5
(ii) Other ronds . 1,444 2 600
3 43c>

36
13.13 The Plan expenditure in the Central Sector along with the scheme-wise break-up is given in the
TAM!-.!;
SI. Schcme
N o .
1 -
1. N a tion a l Hit;],ways . . . . . . .
2. Machinery ...................................................
3. Strategic R o a d s ..............................................................................
4 . Roi-ds and .Bridges o l'fceo . & Inter-Siak impe-nai cc
5. Roads in sensitive b o a k r arc; s . . . . .
6. Highway Research Dcvclopnicr.t am 1 Planning studies
7. Highway Training In s t i t u te .......................................................
8. C\or/Undcr Britiges . . . . . . .
9. Roads in tribal a r e a s ..................................................................
Total
;>Rs . 3 C ro a s tor CRR1 transferred io CS1R subsequently.
13.14 It would be seen that the total expenditure! outlay during fihe first three years of the Plan was Rs. 386 crores against the Sixth Plan outlay of
Rs. 827 crores. The llow of expenditurejoutiay in 'ihis
sector has been low mainly due to overall constraint
of resources. The outlays approved in the Annual
Plans were fully utilised.
State Sector Programmes
13.15 The outays and expenditure under the State
Sector have been as follows :—
(Rs. crorcs)
Plans Total Rura l RoadsRoads under
M NP*
Sixth Plan 1980-85 2608.90 1164.90
J980-81 (Expenditure) . 517.40 196.46
J981-82 (Expenditure) . 581.26 232.43
1982-83 (Anticipated expenditure) . 514.31 204.95
J983-84 (Outlay) 586.70 229.85
* M in im um Needs Programme.
13.16 The most important element of the State Sector Roads Plan is flhe construction of rural roads
under the M inim um needs Programme (MNP). This
envisages provision of all weather link roads for all villages with a population of 1500 and above and for
50 per cent of the villages with a population of 1000- 1500 within a time frame cf 10 years, that is by 1990.
13.17 According to a rough assessment, grouping
both the population categories together and aggregating the figures' of individual States, it is estimated
that a total of about 20,000 villages would need to be connected with al! weather link roads under this
programme during the Sixth Plan period. As against
this, the achievements in the first three years acere-
following table :—
13.4
(Rs. crores)
1980-85 1980-82 1982-83 Total 1983 84
Outlay Expenditure Antic ipated first three outlay
j -.p;n ji.t iro years
3 4 5 6 7
660. 00 203.08 128.32 331.40 128.50
18.00 3.10 1.25 4.35 1.50
38.00 19.88 6.90 26.78 8 .50
40.50 7.77 3.50 11.27 5 .00
50.00 7.18 3.85 11.03 5 .50
4.00 1.12 0.50 1.62 0.75
1.00 — — — —
9.00 — 0.20 0.20 0.25
6.50 — — — —
830.00* 242.13 144.52 386.65 150.00
gated to around 11270 villages whiclh will be about 56 per cent of the Plan target. On an aggregated basis the achievements are thug in line with the target.
However, in some of the States the achievements are higher than the target (due to various reasons including construction of rural roads under other programmes) which, while aggregating, cover the figure
of shortfall in others. It is assessed that in nearly two-thirds of the States, the Sixth Plan targets are likely to be achieved. The m'ain reason for the short
fall in the rest of the States is the difficulty in provid
ing adequate earmarked outlays for rural roads under the M in im um Needs Programme within the lim ita
tions of the total size of the Plan of the State con
cerned.
Shipping
13.18 The Sixth Plan envisaged that India’s Shipping tonnage which, as on 1-4-80, stood at about5.5 million tonnes Gross Registered Tonnage (G R T )
(including 5.3 million G R T overseas tonntge and
0.25 coastal tonnage) would be increased during the
Sixth Plan period by another 2.0 million tonnes net.
However, due to a severe and unprecedented recession in the international shipping sector the actual increase in the tonnage in the country during the
first three years has been only 0.464 million GRT .
The outlay provided in the Sixth Plan was R,s. 720 crores and the actual expenditure during the first
three years was only Rs. 265.40 crores. It is assessed
that there may be a saving of about Rs. 250 crores in the Sixth Plan outlay for this sector.
Civil Aviation and Meteorology
13.19 Traffic on Indian Airlines and A ir India routes has increased. The acquisition of aircraft pro
ceeded according to programme— Revenue Tonne
Kilometres (R T K M ’s) on A ir India increased from 816 million in 1979-80 to 1114 million in 1982-83.
The Sixth Plan target of capacity at about 1900 mil
lion available Tonne K M ’s for A ir India is likely to
be achieved in 1983-84 itself. Similarly, traffic on
87
the llndian Airlines increased from about 399 million
RT K IM ’s in 1979-80 to around 520 million RTKM 's in 1*982-83 and the Sixth Plan target of capacity acquisition at 8750 million. Available Seat K M ’s
(A S K M ’s) is likely to be achieved in 1983-S4 itself. Both: Indian Airlines and A ir India were able lo im-
provfe their financial performance and to generate
net surpluses despite the difficult global position in
this : sector.
13 .20 New aircrafts are required for the phasing
out o f the fuel inefficient older aircraft of both Indian
Airliines and A ir India. This will necessitate upgra-
datiom of airports to higher, standards (on the internal air nietwork). H igh capital intensity and operating costs underscore the need for attaining high stan
dards of utilisation efficiency. The total ouUuv of Rs. 8S55 crores for the civil aviation sector may need
to be: increased by about Rs. 72 crores.
13..21 Under Meteorology, some additionality to
the aipproved outlay of Rs. 43 crores would be need
ed tro cover the increase in the cost - of inputs and additiional provision for the INSAT project.
Tourrism
13.-22 The outlay provided in the Sixth Plan is Rs. (67 crores. The actuals were Rs. 9.55 crores in 19801-81, Rs. 16.85 crores in 1981-82 and Rs. 19.51 crorers in 1982-83. A n increase in the outlay Princi
pally for IT D C would be required. This is mainly
due Uo the requirement of IT D C for the Asian
Oamtes, for completing joint venture schemes and for the rcequirements of the Non-Aligned Meet and
C H O tG M .
Inlam d Water Transport
13..23 The major schemes approved in the Sixth
Plan were the acquisition of vessels and capital repairs to vessels belonging to the Central Inland Water
Transsport Corporation (C IW TC), improvement of the Rlajabagan Dockyard and provision of infra
structural facilities in the Eastern region. These schermes are intended to augment the capacity of
CIWTTC to carry cargo to the North Eastern Region from the prescent level of about 2 lakh tonnes to 5.8
lakh tonnes per annum. Another important scheme
was tfhe declaration of the Ganga-Bhagirathi-Hooghly
Systemi between Haldia-Farraka and Allahabad
stretclh as a National Waterway.
13..24 Against an outlay of Rs. 45 crores provided in the: Sixth Plan for the Central Sector, the expendi
ture ii the first three years is estimated to be Rs. 1*6.12 crores. For 1983-84, an outlay of Rs. 12
crores; ’has been provided. A n additional outlay of
Rs. 5 ; crores would be needed mainly to allow for the inicrease in the cost of inputs and to cover the sehemies for acquisition of vessels and other facilities with tthe C IW T C to be completed in the Sixth Plan peroidl itself, instead of spilling over to the Seventh
Plan ; as envisaged earlier.

AN N EXU RE 3.1
Plan Progress in respect of some basic assets and output indicators
S.N o .
1950-51 End of first
Five Year Pl.n
End of Second Five
Year Plan
End ofThirdFiveYearP l.ii
End of Fourth Five Year PI a i
End of Fifih Five Y r Plaa
As on 31-3-80
As on 31-3-81
Ats on 31-3-82
1 2 4 5 6 7 8 ) 1 ) 11
1. General
(a) M Capial-at-charge (Rs. in crores) 827.0 9(9 .0 1520.9 2680.3 3893.4 4797.1 5484.6 6096.35 SO 00 © L/l
(b) Route Kilomelrcs 535 96 55011 56247 58399 60234 60693 60533 61240 (61230(c) Electrified Route Kms. 38S 388 748 1423 4191 i l lO 4820 5345 5473
(d) Number of Stations 597(5 6152 6523 6986 7079 7020 7017 7035 7072
(e) No. of Staff (in thousand) 914 1025 1157 1352 1432 1495 1551 1572 1575
11. Ro llins Stock
(a) No. of Locomotives
(i) Steam 8)20 9026 10312 10613 8847 S215 7856 7469 7296
(ii) Diesel 17 67 181 727 1610 20 2231 2403 2515
(iii) Electric 72 79 131 403 669 901 974 1036 1104
(h) No. of Passenger Vehicles* 13109 1 5984 20178 22804 26108 26647 27290 27434 2:7257
(c) Electric Multiple Unitcc aches 460 574 846 1355 1892 2321 2473 2625 2658
(d) Other Coaching Vehicles 6059 6730 7415 8763 8422 8260 8289 8210 :8066
(e) No. of Wagons 205596 240756 307907 370019 388366 399971 405185 400946 39234 9
* I r,eludes Rail Cars.
I II . Volume of Traffic
(a) Tonnage originating Revenue (in millions) 73.2 92 2 119.8 162.0 162.1 210.8 193.1 195.9 221
T o t a l 93.0 115.9 156.2 203.0 184.9 237.3 217.8 220.0 245
(b) Net Tonne Kilometres Revenue
(in Millions) 37565 50435 72333 98978 109391 150250 144559 147652 164253
T o t a l . . . . 44117 59576 87680 116936 122354 162687 155995 158474 174202
(c) Passenger originating (in million)
(i) Suburban . 412 495 680 1018 1437 1928 1903 2000 2064
(ii) Non-Suburban 872 780 914 1064 1217 1575 1602 1612 f 640
88

CHAPTER 14
COMMUNICATION, INFORMATION &
BROADCASTING
ommiunication Sector
A provision of Rs. 2810 crores has been includedl the Central Sector in the Sixth Plan for the pro- rammtes relating to Communications. The progress
f expenditure so far has been as below :
Year Expenditure(Rs. crores)
080-81 ......................................................................... 320.81
1081-82 521.31
1082-83 (RE) .................................................... 550.61
1083-84 (as approved) . . . . . 630.00
Total : (-4 years (1980-84) . . . . 2031.73
1084-85 787.50
Assumiing a 25 % increase over 1083-84)
Grand TTotal . . . . . . 2819.2.3(lor 5 ye.-ars)
14.2 It will be seen from the above that, on prc-
;ent estimates, a sum of Rs. 2031.73 crores is exacted to be utilised in the first 4 years of the Plan. 'Vssumiing a 25 per cent step up in 1984-85 over
l983-8<4, a provision of Rs. 787.50 crores may be
:'stimatied for the next year. Taking into account this jstimatie for the last year of the Plan, a total expendi- :ure o f Rs. 2819.23 crores may be expected to be
incurred in the 5-year period, thus exceeding the Plan
Tiovisicon by Rs. 9.23 crores.
• 14.3 However, while in financial terms, the Plan
provision may be exceeded marginally, the physical targets of the Sixth Plan are not likely to be achieved in ithe case of telecommunications and Indian
Telephcone Industries, some shortfalls in achieve
ments are expected under most of the items under telecomimunication. The expected achievements bv the encd of March, 1983 are 5.26 lakh lines of
switching equipment and 5.30 lakh Direct Ex- :hange Lines as compared with the Sixth Plan tar
gets of 14.80 lakh lines and 13.30 lakh lines respec- :ively. 'The achievements in the long distance switch
ing a n d transmission systems have generally been in he ranige of 15 per cent to 25 per cent. I t would be
lecessairy to show considerable improvement in this irea.
14.4 If the trend of performance in the first three
pa rs o)f the Plan is any indication, the p ro jec ts for ndhievimg the physical targets in full by the end of
he Plain period are not very bright. In the case of ocal switching capacity, the likelv achievement may
:>e aroiund 11-12 lakh lines, i.e. 80 per cent of the arget «et for the Sixth Plan. As for Direct Exchange
Lines, ithe achievement may be about 8-9 lakh lines, .e. abciut 65 per cent of the Sixth Plan target. The
8 PC/83!— 13
performance in the long distance switching and transmission systems is likely to be around 50 per cent. The performance in the case of U H F systems may also show considerable shortfall. While reviewing
the physical programme, it will have to be borne in m ind that, when the Sixth Plan was being formulated
the physical targets were not related to the Plan outlay of Rs. 2810 crores but to a higher outlay of Rs. 3100 crores. Even after making allowance for this factor, the achievements may not reach a satis
factory level. The reasons given for not achieving the targets are inter-alia, the inadequate supply or nonsupply of equipments by the public sector under
takings, delay in the receipt of imports etc. There is much leeway to be made and this may call for the
urgent adoption of strong and effective measures.
14.5 The Telecommunication Plan being depen
dent on the IT I Plan, it is essential that the IT I Plan is implemented on a strictly time-bound basis ensuring adequate supplies particularly of critical parts to the P&T Department in time. There would appear
to be complaints f ta t ihc supplies of the TT1 do not contain all critical parts and, as a result, there is con- siderble delay in commissioning. Likewise, attention has to be paid to the repeated slippages in imports. The administrative machinery has to be geared to
avoiding these delays and slippages.
14.6 O f the other communication programmes which include the Indian Telephone Industries, the Hindustan Teleprinters (HTL), Overseas Communication Service (OCS) and the Monitoring Organisa
tion, the outlays of CCS and H T L are likely to be fully utilised. The performance of the OCS has been
satisfactory and mlany of the important projects like the IO C O M Cable Project, Indo-USSR Tropo
Scatter line etc. as well as some of the swit
ching programmes have already been completed. The
Monitoring Organisation has to be further activised. It appears doubtful if this Organisation would be able
to spend the projected Plan outfay of Rs. 8 crores.
14.7 The fund requirements of the IT I will go up
appreciably to provide for the newly sanctioned
E.S.S. Factory at Gonda and the increase in costs of the on-going Palghat Expansion Scheme, expansion
of the Telephone Instruments Division and expansion
of the Transmission Unit.
14.8 The Postal Sector has been doing well both
in regard to utilisation of Plan outlays and achievement of physical targets. Full performance may be
expected in most of the schemes except the construc
tion programmes. While framing the Sixth Plan, it was considered necessary' to give a boost to the construc-
89

90
tion of postal buildings and stall quarters as many of these buildings are very old and the percentage satisfaction of stall' quarters is also quite low. However, due to funding compulsions in the Telecommunication sector, it has become necessary to restrict, investment in the construct on area of the postal sector.
14.9 The internal resources generation of the P&T Department is not likely to improve appreciably in spite of the revision in the postal and telecommunication tariffs. The internal resources for the Plan may be about 50 per cent of the earlier estimate of Rs. 2798 crores. Budgetary support at a sizeable level would, therefore, have to be continued for the P&T Plan in the terminal year also.
14.10 Internal resources generation and constant updating of technology hold the clue to the success of the Communication Plan. In Telecommunication, a better balance has to be achieved between local switching system and the long distance switching and transmission networks. Such a balance should have a viable impact on resources.
Information and Broadcasting Sector
14.11 A provision of Rs. 240.33 crores has been included in the Sixth Plan under Central Sector for the programmes relating to Information and Broadcasting. The progress of expenditure so far has been as below :
Year
1980-81 .
1981-82 .
1982-83 (RE)
1983-84 (as approved)
Total : (4 years 1980-84)
Expenditure
(Rs. crores)
15.36
29.73
33.14
50.00
128.23
1984-85
(Estimates, assuming a 25 \ increase over 1983-84)
Grand Total (for 5 years) . . . .
62.50
190.73
14.12 It will be seen from the above that, on present estimates, a sum of Rs. 128.23 crores is expected to be utilised in the first 4 years of the Plan. Assuming a 25 per. cent step up in 1984-85 over1983-84, a provision of Rs. 62.5 crores may be re- akoned for next year. Taking this into account, an expenditure of Rs. 190.73 crores may be incurred in the 5-year period, leaving a balance of Rs. 49.60
crores. In view, however, of (i) the Specia AIR, IV; Plan for the N.E. Region and (ii) the Speia Plan for expansion of Television network during he Sixth; Plan (approved recently), there may not be ny shortfall in financial terms. Nevertheless, this wiuld have implications on the physical achievements envisaged in the Plan.
14.13 As regards the Sound Broadcastin, Schemes which 'have spilled over from earlier plans, he physical progress has been satisfactory and mos of them are expected to be completed during th( current plan period. Only some would spili over into the Seventh Plan including the scheme for nw broadcasting house for External Services DiviionjNewS; Services Division.
14.14 The important new starts in the Plan ar^ upgradation of power of tire medium-wave transmit-l ters, setting up of 1000 KW Medium-w.ve trans-j mitter at Nagpur for National Channel, seting up o:2 numbers of 250 KW Shortwave transmitters at A ll garh and an equal number of 500 KW ihortwrave transmitters at Bangalore for strengthenin' the ex ternal services. A number of these new st;rts woulc not be completed during the current Pltn period Notable amongst them are the 1000 KV Mcdiun wave transmitter at Nagpur for National Clannel anc the shortwave transmitters at Bangalore f*r externa services. Slippages are also expected in the programme for strengthening of the regional progranme diree torates as well as construction of staff quavers.
14.15 Under Television; attempts wouli have ti be made to complete within the current Pltn period the TV Centres at Ahmedabad, Bangalore Trivand rum and Gauhati as the project costs are increasing owing to normal escalation as well as intrduction o colour compatibility in implementation of thess schemes. The three programme productim centre: to be set up at Raipur, Muzaffarpur and Gulbarg; are likely to spill over into the Seventh Pan. Particular attention would have to be paid to Iring these programme production centres to commissim quickl) so that software capabilities do not lag bihind. Th( increase of software capabilities is of specal importance in the context of the large expanson of TV coverage now stipulated under the Specia’ Plan foi expansion of TV network. ]
14.16 In the area of Information and Publicity,( work on the construction of Soochna Bhavm is also falling behind schedule and appears likey to over into the Seventh Plan,

CHAPTER 15
EDUCATION
15.il The Sixth Five-Year Plan envisaged a balanc- :d stnategy of educational planning with the long- ange goal of making available diverse networks of acilitues and programmes for education, combining ormal and non-formal modes of learning, to enableil citii/.ens to acquire literacy numeracy, computations sk;ills, basic understanding of the surrounding urrld and functional skills of relevance to daily life ind to> lucal environment. It also emphasised that >launinig effort s'hould shift from provision of inputs nd cx;pans:on of facilities in general terms to results i be atchieved and tasks to be performed with speci- c reference to target grotips of population, particu- nly thie socially disadvantaged. Other important ob- .'etives. envisaged included development of scientific wtjook:, sensitization to ethical, social and cultural alues which go to make an enlighteaed nation, and npartiing knowledge, skills and attitudes enabling letter (contribution to productive programme in na- ional (.development.
15.2 lhe programme of universaiisation of ele- iientar\y education was given the highest pr.orhy. In erms o f physical targets, the enrolment of students n Clashes 1 to V was expected to be raised from3.6 pe;r cent of the relevant age group to 95.2 per :enl by the end of the Plan, while the enrolment in kisses VI to V III was similarly expected to be in-
,.eased from 40.2 per cent to 50.3 per cent. The ■:irolme;nt of girls in Classes I to V III was expected
be imcreased from 52.2 per cent to 65 per cent of lie rele-vant age-group. Based on existing projections >f population in the relevant age-groups and base :vel daita of enrolment in 1979-80, these targets imbed am additonal enrolment of about 180 lakh child- m in Classes I to V III in full-time institutions. In ad- I'ion, inon-formal education programmes for chil- ren in the age-group 9-14 were to be developed to over 8(3 lakh children during the Sixth Plan, althouh
was recognised that it would be unrealistic to lay ;>>vn amy specific targets for the purpose.
Similarly, while no physical targets were laid down, .dult ecducation programmes were to be developed i a large scale for the age-group 15 to 35 to combat ie problem of illiteracy. In the field of secondary id highier secondary education, facilities were to be tendedi to rural and backward areas and access pro- ed to the weaker and more backward sections of c people with consolidation of existing facilities id improvement of standards. A major effort was be maide in the area of vocationalisafion of secon- rv education based on detailed surveys of existing J potential work opportunities and available edu- tional and training facilities. In the area of higher ucatiom. consolidation of facilities and improve- :i)t of standards and quality with emphas;s on re
structuring of courses was envisaged. In technical education, emphasis was laid on furthernance of na- tionl efforts to develop science and technolog as an instrument of the country’s economic progress, and on identification of critical areas and creation of necessary facilities for education in emerging technologies.
An appraisal of the implementation of the different programmes indicates considerable progress in the directions indicated above. There are, however, certain areas which require special attention in order to achieve the objectives of the Sixth Plan in lull measure. Some of these are dealt with below :
Elementary Education
15.3 While the overall target of enrolling an additional 180 lakh children in full-time educational institutions is likely to be achieved by the end of the Plan (Annexures l&ll), the progress in this regard is lagging in certain States. Bihar, Jammu & Kashmir, Madhya Pradesh, Meghalaya, Orissa and Sikkim are lagging in respect of enrolments in Classes I to V. Similarly, Andhra Pradesh, Bihar, Gujarat, Madhya Pradesh, Haryana, J&K, Meghalaya, Orissa, Rajasthan, U. P. and West Bengal are showing shortfalls in girls’ enrolment in these classes. There has been ■slow progress in regard to enrolment in Classes VI to V III in the States of Jammu & Kashmir, Karnataka, Madhya Pradesh, Meghalaya, Nagaland, Rajajasfhan, Tamil Nadu and U.P. Girls’ enrolment has been on the lowej- side in Class VI to VIII in Andhra Pradesh, J&K, Karanataka, M. P., Me- galaya, Nagaland, U.P. and the Union Territories of Andaman & Nicobar Islands, Chandigarh, Goa, Daman & Diu. There is a need to accelerate the implementation of the new strategies envisaged in the Sixth Plan, viz.
(a) intensified use of existing facilities including adjustment of schooling hours according to local conditions;
(b) provision of new facilities which would be economically viable and educationally relevant; and
(c) introducing measures with a view to eliminating wastage and reducing drop-cuts in elementary education.
These strategies call for a detailed local level planning involving the local community aspects to which the State Governments need to pay much more attention than hitherto.
91
92
Under the non-formal system of elementary education for the age-group 9—14 current assessment indicates that the coverage may be of the order of 35 lakh in the Plan period as against the 80 lakh envisaged. It is, therefore, necessary to diversify non-formal learning programmes so that a variety of options arc made available to school children especially in the villages to suit their diversified needs.
According to the present assessment, the total achievement of enrolment in elementary classes (6—14 age group), both under formal and non-formal system is estimated to be of the order of 110 million by the end of the Sixth Plan. As the estimated population of the 6— 14 age-group on the basis of 1981 census is of 1'he order of 140 million, there will be a backlog of about 30 million non-attending children of this age-group in 1984-85. If universalisation of elementary education is-to be achieved by 1990, as envisaged under the 20 point programme, nearly 50 million additional children of the age-group 6— 14 will have to be covered in the Seventh Plan, as the estimated population of the age-group 6— 14 would be of the order of 160 million in 1990. The adoption of the different strategics referred to earlier is, therefore, of particular importance for achieving the goal of universalisation ol elementary education.
Secondary Education
15.4 In the field cf secondary education, the Sixth Plan recognised that, with the expansion of the base of education at the elementary stage, an increasing number of students, including large numbers of lirst-generation learners, would reach the secondary education stage and facilities have to be provided for their education, since such education is the only means of social mobility and economic independence, particularly among (he socially disadvantaged. However, the Plan emphasised the importance of paying special attention to the quality of education at this stage and to improving internal efficiency of the system and enhancing the employability of its products. There is still a great need for more sustained and planned effort and clear targets in respect of these qualitative improvement programmes.
Vocationalisation
15.5 Apart from emphasis on science education and recognising the needs of exceptionally talented children, a major programme of manpower development through •Vocationalisation’ of higher secondary education related to employment opportunities was to be developed. So far, satisfactory progress can be said to have been made only in t'he States of Tamil Nadu, Maharashtra, Karnataka, Andhra, Pradesh and Gujarat. The number of vocational courses and thcr coverage needs to be enhanced considerably and substantial number of students attracted to these courses. Vocational courses also need to be developed in close association available facilities in factories and other establishments in the area with a
view to keep down the per capita cost and to attract trained persons in industry lor imparting requisite skill-tra'ning.
Higher Education
15.6 in the field of higher education, the main emphasis is on consolidation of existing facilities, tackling the problem of non-viable institutions and preventing proliferation of new higher educational institutions and improvement of quality of higher education with special emphasis on :
(a) restructuring of under-graduate courses to make them purposeful and also terminal for those who would seek employment;
(b) provision for vocational courses leading to employment and stress on certiiicate or diploma rather than an academic degree; and
(c) pormotion at post-gradute level of research on practical problems of local and regional relevance as well as of fundamental research.
While significant initiatives have been taken by the University Grants Commission in all these areas, a major impact on the higher education system in these directions is yet to be made. Special efforts are also being made to forge links between the higher educational system and the requirements of the science and technology policy.
Adult Education
15.7 According to report received from the States, the total achievement by the end of the Sixth Five Year Plan is estimated at around 20 million. A big leeway is thus yet to be covered in this regard. The University Grants Connnissxin has recently approved a major programme for involving students. Further efforts need to be made to make the programme mass- based wifh widespread involvement of local communities, voluntary organisations and panchayats and also for improving the delivery system, and supervision and material content of the programmes, linking them to various developmental and welfare activities. The consolidation and expansion of the programme in the remaining years of the Sixth Five Year Plan would be crucial for the achievement of the estimated targets of 115 million by the year 1990.
20-Point Programme
15.8 Apart from other measures taken to achieve the targets of universalisation of Elementary Education and eradication of illiteracy by 1990, a schemc of Awards to States for excellem performance in improving girls’ enrolment both in elementary classes and adult centres has been introduced with a sum of Rs. 10 crores earmarked for this purpose in 1983-84.
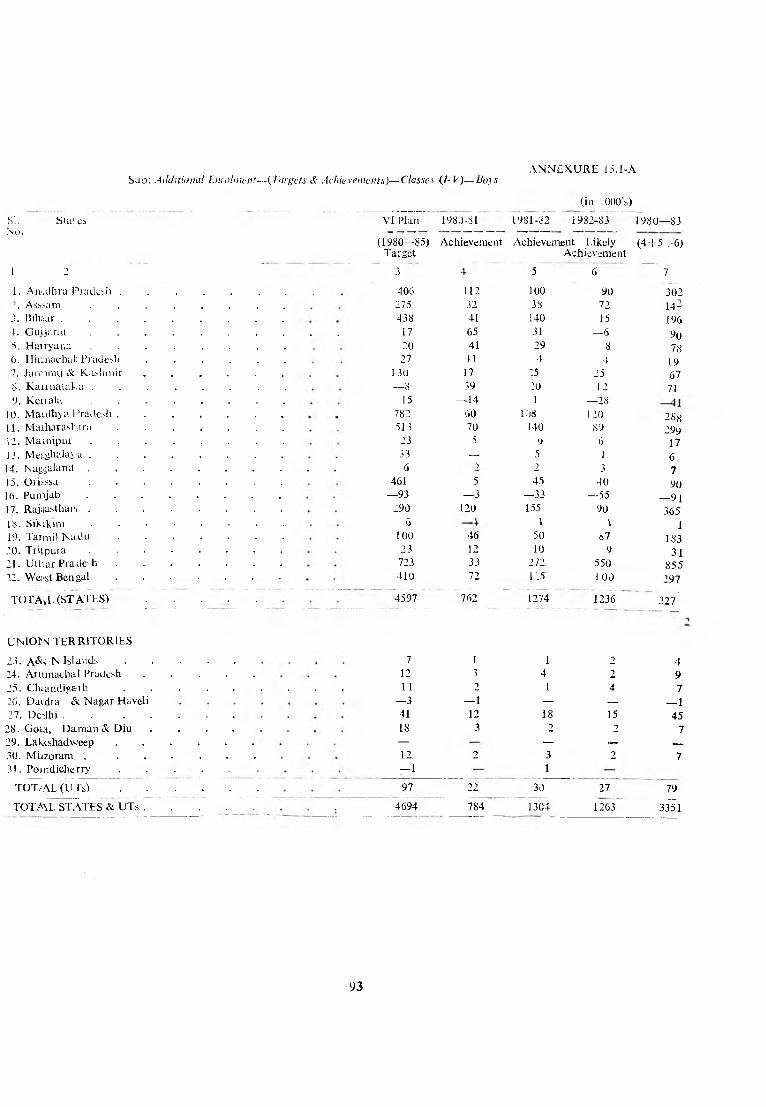
Suo: Additional Emohnent--(Targets ii Achievements)— Classes (t-V)— B0}sA N N G X U R E 15.1-A
(in 000’s)
Sl. SUi! csi .
VI Plan 1980-81 1981-82 1982-83 1980— 83'.NO.
(1980— 85)Target
Achievement Achievement Likely Achievement
(4 + 5+6)
1 2 3 4 5 6 7
1. AiRiihra Pradesh . . . . . . 406 112 100 90 302
.:. Asbham . . . . . . . 275 32 38 72 14-3. Bih.iar . . . . . . . . 438 41 140 15 1964. Guijarut . . . . 17 65 31 — 6 905. Hairyar.ii . . . . . . . 20 41 29 8 780. Hirmachui: Prades.li . . . . . 27 11 4 4 197. Janvimu & Kashmir . . . . . 130 17 75 25 678. Kairnataka . . . . . . . — 8 39 20 12 719. Kciialii . . . . . . . 15 — 14 1 — 28
10. M aalliya Pradesh . . . . . . 782 60 t;j8 1 20 28s11. Maiharashtra . . . . . . 513 70 140 89 29y12. M am ipur . . . . . . . 23 5 i) (5 1713. Me;;ghala> a .............................................................. 33 — 5 1 614. N a g a l a n d .............................................................. 6 ") 2 3 715. Orisssa . . . . . . . 461 5 45 40 9016. P u m j a b .............................................................. — 93 — 3 — 33 — 55 - 9 117. R a ja a s th a r i.............................................................. 290 120 155 90 365
IS . Sikikim .............................................................. 6 1 4. 1
19. Tarmil N a d u .................................................... 100 46 50 87 18320. T r i f p u r a .............................................................. 23 12 10 9 3121. UtUar Pradesh . . . . . . 723 33 272 550 855
22. Wesst Bengal . . . . . . 410 72 1:5 1 00 297
TOTAvL ( S T A T E S ) ......................................... 4597 762 1274 1236 327'
UNlObN T ERR IT ORIES
23. A & N Islands . . . . . 7 1 1 2 4
24. AriunacliaJ Pradesh . . . . . 12 3 4 2 9
25. Chtandigaih . . . . . 11 2 1 4 7
26. Daidia & Nagar Haveli — 3 — 1 — — — 1
27. D e^ lh i................................................................ 41 12 18 15 45
28. Goaa, Daman & D iu . . . . IS 3 2 2 7
29. Lalxshadweep . . . . . . — — — __
30. M iizoram . . . . . . .
3). Poindicherry . . . . .
12
— 1
2 3
1
2 7
TOT/AL ( U T s ) .................................................... 97 22 30 27 79
TOTM L STATES & U T s ......................................... 4694 784 13C4 1263 3351
93

SI.No.
Slates
(in 000‘s)
1980—85 1980-81 1981 82 1982—83 1980— ^3
VI PLAN Aehicvcnunt Achievement Likely (4+5+6)
A N N E X U R E 15.1 3Sub : Additional Enrolment ( Targets & Achievements) Classes I- V-Girls
Target Achievement
1 2 3 4 5 6 7
J . Anuhra Prai'.c: h 547 74 99 50 :23
2. Assam . . . . . . 275 32 1 '-8 58 138
3. B ih a r ............................................................... 119-1 28 161 148 337
‘1. Gujasat . . . . . . 495 17 ) ) 75 1)2
5. Haryana . . . . . . 224 42 2 5 17 84
(i. Himachal Piadc: h . . . . 2<) 20 5 5 3 0
7. Jammu & Kashmir . . . . 115 13 17 15 45
8 . Karnataka . . . . . . 103 34 17 44 95
9. K e r a l a .................................................. 15 — 9 1 — 17 — 5
JO. Madhya P ra d e s h ........................................ 369 10 22 130 162
11. Maharashtra . . . . . 398 72 145 150 36
12. M a n i p u r .................................................. 13 7 8 8 23
13. Meghalaya . . . . . . . 32 5 __ 1 4
14. N a g a la n d .................................................. . . . . 7 i 2 2 6
15. Oiis>a 252 25 28 36 89
16. Punjab . . . . . . . — 56 4 — 27 —28 -51
17. Rajasthan . . . . . . . 360 48 64 48 16 0
18. S ikkim . . . . . . . 10 1 I 5
19. Tamil Nadu . . . . . 400 72 50 1 ).) 22 2
20. Tripura . . . . . . . 1 7 11 9 1 ) id
21. U ttar Pradesh . . . . . 1080 97 146 87 -•30
22. West B e n g a l ................................................... 921 121 ’.5? . 77 4 :4
TOTAL S T A T E S .................................................. 6828 ID 1172 1019 2920
23. A & N Islands 6 1 1 1 3
24. Arunachal Pradesh 6 3 I 7
25. Chandigarh 12 1 ’ 3 ')
26. Dadra & Nagar Haveli — — — 1 _ - 1
27. D e lh i ........................................ 112 12 10 1 ) ■; ■>
28. Goa. Daman & D iu 12 T ■> 1 5
29. Lakshadweep — — — — -
30. Mizoram 9 1 3 •> 6
31. Pondichtriy 5 1 - I 3
TOTAL (UTs) • 162 21 20 2 ) 61.
TOTAL STATES & UTs . 699.) 750 ! 192 1039 29} 1
94

A N N L X U R L 15.1-C
Sub ; Additional Ijirolinent ( Target!, <& Aehievenh nts)— Classes I— V-Total(in 000’s)
SI. SlatesNoi.
1. Andlltra Pradesh .
2. A ssa m
3. Ii.hair .
4. G ujarat
5. H ary ana
6 . Ilim a icha l Pradesh
7. .la innnu & Kashm ir
8 . K arm ataka .
9. K e ra la
10. M ad hv a Pradesh .
11. M aharash tra
12. M a n ip u r
13. M eghalaya .
14. N aga land
15. O iiss .,1
16. P un jab
17. R a jas th an .
18* Sikk'i m
19. T am il N adu
20. T ripura
21. U tta r Pradesh
22. West Bengal
T 'O T A L (STATES) .
23. A & N W ands .
24. A run acl utl Pradesh
25. C hand igarh
26. D ad ra Sc N agar Haveli
27. D e lh i
28.. G oa , D am an & D iu
29. Laksihadweep
30.. M izo ram
31.. Pondicherry
T 'O T A L , (UTs)
T 'O T A L STATES & UTs.
1980— 85 1980-81
VI PLAN Achievement
1981-82 1982-83 1980— 83
Achievement Likely (4 +5-1-6)Target
3 4 5
Achievement
6 7
953 186 199 140 525
550 64 86 130 280
1632 69 301 163 533
512 82 130 70 281
244 83 54 2 5 162
53 31 9 9 49
245 30 42 40 112
96 73 37 56 166
30 —23 2 — 45 — 66
1 151 70 130 250 450
91 1 142 2S5 239 666
66 12 14 14 40
65 5 3 2 10
13 1 t 5 13
713 30 73 76 179
— 149 1 — 60 — 83 — 142
650 16S 219 138 ' 525
H> -?> 3 o 6
500 118 1 10 187 405
40 23 19 19 61
1803 130 418 637 1185
1331 196 378 177 751
11425 1491 2446 2255 6192
13 2 2 3 7
18 6 7 3 16
23 3 3 7 13
— 3 — 1 — 1 __2
153 24 28 25 77
30 5 4 3 12
— — — — —21 3 6 4 13
4 1 1 2 4------ . -- — _____ _.__ _259 43 50 47 140
11684 1534 2496 2302 6332 1
95

A N N L X U R E 15.2—A
SI.No.
1
STATES
1. Anti lira Pradesh .
2. Assam
3. Bihar .
4. Gujarat
5. Haryana
6 . Himachal Pradesh
7. Jam m u & Kashmir
8. Karnataka .
9. Kerala
10. Madhya Pradesh .
11. Maharashtra
12. Manipur
13. Meghalaya
14. Nagaland
15. Orissa
16. Punjab
17. Rajasthan
18. Sikkim
19. Tamil Nadu
20. Tripura
21. Uttar Pradesh
22. West Bengal
TOTAL (STATES)
23. A. & N Islands .
24. Arunachal Pradesh
25. Chandigarh
26. Dadra & Nagar Haveli
27. Delhi .
28. Goa, Daman & D iu
29. Lakshadweep
30. Mizoram
31. Pondicherry
I o t ALCUTs.)
TOTAL STATES & UTs.
Achievements)
VI Pian
- Classes ( VI- V III)— Bovs
1980-81 1981-82
(in 000's)
1982-83 1910— 83
1980— 85Achievement Achievement Likely (4-5+6)
Target
3 4 5
Achievement
6 7
253 46 41 52 139
125 24 17 55 96
300 73 108 105 286
351 26 31 135 192
60 31 22 7 60
28 15 6 6 27
37 7 6 6 19
180 20 7 9 36
55 — 19 14 32 27
324 30 38 40 108
284 84 73 80 237
19 4 5 5 14
22 2 1 1 4
9 — 2 2 4
136 24 22 3S 84
154 20 28 47 95
225 38 37 61 1 36
5 1 1 — 2
250 46 50 26 122
12 1 3 3 7
420 42 194 95 331
340 96 184 208 488
3589 611 890 1013 2514______ ___ . ________ __________ _______________ • - ■— —..---- ---— ----------------- -— -------------- --
3 — 1 — 1
3 — 1 1 2
6 1 1 3 5
1.3 — — 1 1
39 12 9 11 32
13 1 1 1 3
— — — — —■
10 2 1 2 5
5 1 3 — 1 3
80.3 17 17 18 52
3669 628 907 1031 2566
96

Sub
A N N EX U RE IS.2— B
: Additional Enrolment (Targets & Achievements)—Classes < VI- VIII)— Girls
STATES
(in OOO’s)
:. AndHirai Pradesh
Assa;m
Bihair .
!. G ujaaraf :
Haryyama
>. Himatchial Pradesh
Jam im u & Kashmir
i, Karmataka- .
9. Keraila
0. MadJhy.a Pradesh -
1. Mahtaraishiira
2. Mamipuir
3. Meglha!;ay?i
!• Nagnla-.nd
5. Orisssa
!>. Punjtab
7. RayaisUv.an .
S. Sikkiim
9. Tamiil N a d u
>.0. Tripiurat
M. Uttair P’radesh
12. Westt Bicngal
TOTAL (STATES)
23. A & N Islands
24. Aruinaehal- Pradesh
25. Chamdi'garh
26. Dadira .& Nagar Haveli
27. Delh ii .
28. Goa., Bfaman & D iu
29. Lakssha.dweep
30. Miz<.ora.m
31. Pomdicherry
OTAL (UTs.) .
OTAL, STATES & UTs.
VI Plan 1980-85
Target
3
1980-81 1981-82 1982-83
Achieve,vent Achievement Likely
Achievement
195
125
200260
60
26
45
124
45
88153
31
20
99
95
1003
250
4
460
226
2616
3
4
7
127
7
9
9
57
24
1128
15
16
9
121
—2 7
59
5
3
18
19
10 1
29
147
63
385
8
2
23
16
32
38
50
3
6
5
8
3
26
9
50
6
1
18
24
13
502
3
123
470
1—3
30
38
43
117
14
5
5
10
26
20
28
6
1
29
11—1
133
3
103
192
714
23
1980-83
(4-I--5+6)
7
8687
121135
36
19
14
34
50
36
137
17
23
65
54
.222
1126
153
378
1569
223
25
48
2683 401 479 737 1617
:< pC/8.3— 14
97

A N N E X U R E 15.2—C
Sub : Additional Enrol m-’nt (Twgs:s & Achievements)— Classes (VI- VIfI)--Tc!ul
Si.No.
STATES VT Plan
1980-85
Target
1980-81 1081-82
Achievement Achievement Likely
achievement
Un COO’s)
!98;0-83
(44-5+6)
1 2 3 4 5 6 7
J. Andhra Pradesh . 448 70 73 82 2:25
2. Assam . . . . 250 35 55 93 1 83
3. Bihar . . . . . 500 101 158 148 4'07
4. Gujarat . . . . <311 41 34 252 3:27
5. Haryana . . . . 120 47 28 21 <96
6. Himachal Pradesh 54 24 11 11 46
7. Jammu & Kashmir 82 8 14 11 33
8. Karnataka . . . . 304 41 10 19 770
9. Kr.nTa . . . . 100 —21 40 58 77
10. Madhya Pradesh . 412 37 47 60 1 44
11. Maharashtra 437 143 123 108 3!74
12. Manipur . . . . 50 9 11 11 31
13. Meghalaya . . . . 42*> 6
14. Nagaland . . . . 16 3 2 9 7
15. Orissa 235 42 40 o7 1 49
16. Punjab . 249 39 52 58 1 49
17. Rajasthan . . . . 325 48 50 60 1 58
18. Sikkim 8 2 1 1 4
19. Tamil Nadu 500 75 100 59 2134
20. Tripura . . . . 16 2 5 6 13
21. Uttar Pradesh 880 S9 197 198
OO
22. West Bengal 566 159 307 400 1866
TOTAL (STATES) 6205 996 1360 1727 4083
23. A & N Islands 6 ■— 2 1 3
24. Arunachal Pradesh 7 1 1 4
25. Chandigarh 13 1 5 8
26. Dadra & Nagar Haveli — - 1 I
27. Delhi . . . . 66 20 17 20 57
28. Goa, Daman & Diu 20 3 2 1 6
29. Lakshadweep — — — — —
30. Mizoram 19 4 2 4 10
31. Pondicherry 14 4 — 11
TOTAL (UTs.) 147 33 26 41 1100
TOTAL STATES & UTs. 6352 1029 1386 1708 4183
98

CHAPTER 16
HEALTH, FAM ILY WELFARE & NUTRITION
lniily ^Welfare
The J PI lam documeut aims at the long term goal of cducingg thie net reproduction rate of the country to nity byy 1995. This implies that the birth rate would ic reduuceed from about 33 at the beginning of the 'lan to i 211 by 1995 and the death rate from 14 to 9 iuring tfciie same period. For achieving this it had icen esstirimated that the level of effective couple pro- cction slhomld be raised from 22.5 per cent in 1980 > 60 poerr cent by 1995. For the V I Plan period the arget vvva;is to increase the percentage of eligible cou- ile protitecctiion to 36.6 per cent by the end of 1984-85. his wuas; to be achieved by carrying out 22 million
terilisaati(.on:s, 7.9 million 1UD insertions and raising lie leveel of CC & OP Users from 3 million to 11 nillion toy 1984-85.
i 981 (Ceensiiis Findings
16.2 irhe 1981 Census has revealed that the popu- ution cof the country by March, 1981 was higher by ibout 113^.2 million than what had been assumed in he Plann document on the basis of the projections of he Exj pe^rt Committee. The 1981 Census results also howedl tthat the assumptions on which the Expert "ommiiitteee had projected the population of the coun- ry hacid been over optimistic and the demographic larameeteirs at the beginning of the VI Plan such as he birrthi ratejdeath rate, annual growth rats were ictuallyy hiigher. The final data based on the 1981 Jensus ; oire still awaited from the Registrar General. Towevuer:, it was obvious that a much larger effort )n the: ]Fa.mily Planning side was called for. The .■/hole miatter was reviewed by the Cabinet and a mmbecr of decisions were taken to strengthen the Family/ (Planning programme which included the following^:--
(ii) The Plan target for sterilisation w'as raised from 22 millions to 24 millions. To facilitate this, the scale of payments to State Governments for sterilisation was liberalised by providing an additional Rs. 50 per sterilisation.
(iii)i Lt was decided to position in each village with a population of 1000 a traiped health guide preferably a local woman by March, 1984, the Government of India meeting 100 per cent of the cost of the scheme.
(i:iii)) A Cabinet Committee with the Prime Minister was also set up to consider further
proposals for providing incentives for improving the performance of the Family Planning Programme.
(iv) A Population Advisory Council was set up under the Ministry of Health w'ith the Health Minister as Chairman to keep the Population Control Programme under close surveillance and advise Government on policy matters. Item No. 13 of the New 20-Point Programme specifically enjoins that Family Planning be made a people’s movement on voluntary basis.
Financial Outlays
16.3 An outlay of Rs. 1010 crores was earmarked for the Family Welfare Sector in the Sixth Plan. With the transfer of the Health Guide Scheme from the Health Sector to the Family Welfare Sector in1981-82. the unspent balance of Rs. 68 crores for that scheme was also transferred to Family Welfare, bringing the total available provision to Rs. 1078 crores. The outlays approved for 1980-81, 1981-82 and 1982-83 and the expenditure relating to these years of the Family Welfare Programmes are given below:—
(Rs. in crores)
1980-81 1981-82 1982-83
Approved . . . . 140.00 155.00 245.00
Actual . . . . 141.92 183.90 294.75
16.4 The expenditure trends indicate that the allocation for Family Welfare for the V I Plan period will have to be substantially augmented keeping in view the higher targets envisaged for the year 1983-84 and the increase in costs necessitated by the decisions referred to in para 16.2 above and also general escalations in the cost of POL, additional D.A. etc.
Review of Performance
16.5 The actual achievements so far and the targets suggested by the Ministry under different methods of family planning in 1983-84 in relation to the Sixth Plan targets are indicated in Table 16.1.
99
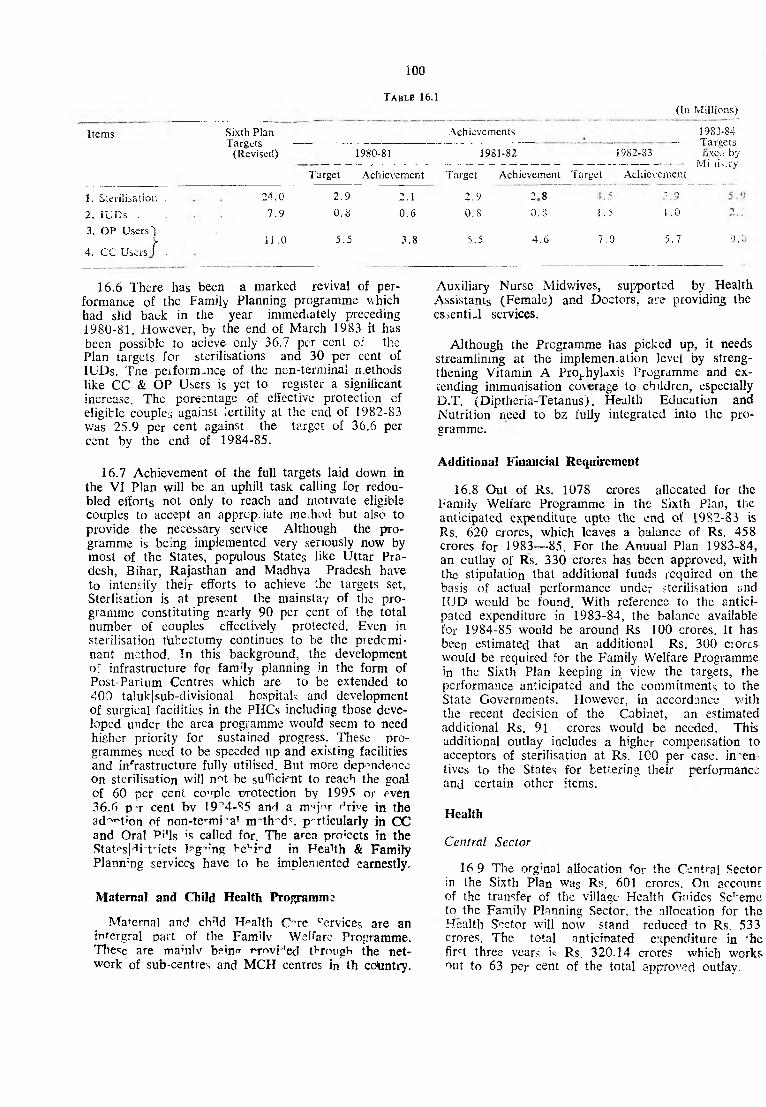
100
T a b l e 16.1
Items Sixth Plan Targets
(Revised)
Achievements
1980-81 1981-82 1982-83
Target Achievement Target Achievement Target
1. Sterilisation . 24.0 2.9 2.1 2.9 to 00
2 . lU D s . 7.9 0.8 0.6 0.8 0.8 1.5
3. OP Users']> l i .0 5.5 3.8 5.5 4.6 7.0
4. CC Users 1 .
Achievement
' ri
1.0
5.7
(In Millions)
1983-84 — Targets
n.xeJ by Mi lis.ry
y.c
16.6 There has been a marked revival of performance of the Family Planning programme which had slid back in the year immediately pxeceding 1980-81. However, by the end of March 1983 it has been possible to acieve only 36.7 per ccnt of the Plan targets for sterilisations and 30 per cent of lUDs. Tne peiform-nce of the ncn-terminal methods like CC & OP Users is yet to register a significant increase. The poreentage of effective protection of eligible couples against lertility at the end of 1982-83 was 25.9 per cent against the target of 36.6 per cent by the end of 1984-85.
16.7 Achievement of the full targets laid down in the VI Plan will be an uphill task calling for redoubled efforts not only to reach and motivate eligible couples to accept an apprcp.iate me.hod but also to provide the necessary service Although the programme is being implemented very seriously now by most of the States, populous States like Uttar Pradesh, Bihar, Rajasthan and Madhya Pradesh have to intensify their efforts to achieve the targets set, Sterlisation is at present the mainstay of the programme constituting nearly 90 per cent of the total number of couples effectively protected. Even in sterilisation tufcectomy continues to be the predominant method. In this background, the development of infrastructure for fam'ly planning in the form of Post Partum Centres which are to be extended to 400 taluk|sub-divisional hospitals and development of surgical facilities in the PHCs including those developed under the area programme would seem to need higher priority for sustained progress. These programmes need to be speeded up and existing facilities and infrastructure fully utilised. But more dependence on sterilisation will n^t be sufficient to reach the goal of 60 per cent couple protection by 1995 or even36.6 p’r cent bv 19">4-<?5 and a m^j^r f’rpe in the ad^t'on of non-tcrnra1 m~th~ds. particularly in CC and Oral Pi'ls ’’s called for. The area projects in the Statesf^rt-ictc bg^ng 1~eui”d in Health & Family PIann:ng services have to be implemented earnestly.
Maternal and Child Health Programme
Maternal and ch'ld Health C°re Services are an intergral part of the Family Welfare Programme. These are mamlv bein<* nr>viJed through the network of sub-centres and MCH centres in th country.
Auxiliary Nurse Midwives, supported by Health Assistants (Female) and Doctors, are providing the esientiJ services.
Although the Programme has picked up, it needs streamlining at the implemen.ation level by strengthening Vitamin A Prophylaxis Programme and extending immunisation coverage to children, especially D.T. (Diptlieria-Tetanus). Health Education and Nutrition need to bz fully integrated into the programme.
Additional Financial Requirement
16.8 Out of Rs. 1078 crores allocated for the Family Welfare Programme in the Sixth Plan, the anticipated expenditure upto the end of 1982-83 is Rs. 620 crores, which leaves a balance of Rs. 458 crores for 1983— 85. For the Anuual Plan 1983-84, an outlay of Rs. 330 crores has been approved, with the stipulation that additional funds required on the basis of actual performance under sterilisation tind 1UD would be found. With reference to the anticipated expenditure in 1983-84, the balance available for 1984-85 would be around Rs 100 crores. It has been estimated that an additional Rs. 300 crores wrould be required for the Family Welfare Programme in the Sixth Plan keeping in view the targets, the performance anticipated and the commitments to the State Governments. However, in accordance with the recent decision of the Cabinet, an estimated additional Rs. 91 crores would be needed. This additional outlay includes a higher compensation to acceptors of sterilisation at Rs. 100 per case, incentives to the States for bettering their performance and certain other items.
Health
Central Sector
16,9 The org’nal allocation for the Central Sector in the Sixth Plan was Rs. 601 crores. On account of the transfer of the village Health Guides Scheme to the Family Planning Sector, the allocation for the Health Sector will now stand reduced to Rs. 533 crores. The total anticinated expenditure in 'he first three years is Rs. 320.14 crores which works nut to 63 per cent of the total approved outlay.

u_
(i) The Scheme of training of existing uni-purpose workers for converting them into multi-purposev/oiKers has been completed in 320 districts oy the ;nd of March 1983 and the training is continuing h i 41 districts. The remaining districts are also expected to be costered during 1983-84. The q'uality of implementation of the multi-purpose workers scheme has not been satisfactory except in some States like Karnataka, Gujarat and Maharashtra. In most others, optimal and cost effective use of the trained multipurpose workers is yet to be made.
(ii) Under the Village Health Guides Scheme a total of 4247 primary health Centre were covered till inarch 1983 and 2,42,161 Health Guides trained and positioned upto the end of March 1983. By March, 1984 all the PHCs in the country are expected to be co\cred except some PHCs in Bihar. The Community Health Guides Scheme has made seme impact in those States like Gujarat, Maharashtra and West Bengal etc., where the selection of the workers was made properly and the guides trained well. In these States the Health Guides have done good work in Malaria control, Family Planning education ;.nd motivation, MCH work, disinfection of wells etc. In other States the scheme is yet to make a significant impact. The concept cf the community being invol ed in the management of its health problems is yet to be translated into action except in the case or the Mini-Health Centre.; scheme cl Tamil Nadu which is being operated on a limited scale.
(iii) The scheme of training of male multi-puipose workers (new workers), medical and pare-medical Staff has no made much progress except in the ca^e
. of one or two categories like laboratory technician', pharmacists etc. This is so in spite of the fact that the Government of India has undertaken to meet 100 per cent of the cost of the training. The main hurdie has been indentifying the requirements of States of trained personnel in different areas on account or lack of response from them. There is likely to be some savings in the allocation made for these schemes.
(iv) As-a result of the modification in the pattern of assistance for the ROME Scheme, the entire allocation is likely to be utilised. The manner of implementation of the scheme and its impact could, however, bear a critical evaluation, particularly the use of the three mobile clinics supplied to each medical college under the scheme which are stated to be unwidely and not suited to our rural conditions.
Control of Communicable Diseases and Blindness
(i) Malaria.— The inc:dence of disease has declined from 6.5 million cases in 1976 to 2.08 million cases (provisional) in 1982, during which period there had been an extended coverage of cases as reflected by increase in the number of blood smears examined from 55 million in 1976 to 60 million (provisional) in 1982. The strategy adopted for containing P. falci
Rural Health Programme parum is reported to have proved effective and there has been a decilene in th- incidence of these cases from 7 5 lakhs in 1976 to 4.7 lakhs (provisonall in 1982, as also substntial decrease in the number of reported deaths. Tl%re are, however, localised proolems of P. falciparum infection, resistance of the vector to DDT|BHC and resistance of the malaria parasite to drugs. These need to be tackled firmly by intensified spraying with appropriate insecticides, effective surveillance combined with presumptive [radical treatment.
(ii) Tuberculosis.— It is estimated that there arc about 10 million eases of tuberculosis in the country.3 million cases had been detected by the beginning of the Sixth Plan. It is targeted to detect an additional 3 million cases in the Sixth Plan raising case detection from 30 percent of the total cases detected to 70 per cent of the total estimated cases. It is also targeted to increase ‘case arrest’ from 50 per cent of the detected cases to 75 per cent. The main strategy of the TB control programme is early case detection and prompt domiciliary treatment coupled with health education and follow up. Fully equipped and staffed district TB clinics and centres undertake case findings and treatment activities in close coliabcr- lion with the existing medical and health institutions in districts. There are at present 353 District TB Centres, 353TB clinics and about 44,000 indoor beds for tuberculosis set up by the States|UTs. Central assistance for the National Tuberculosis Programme since 1979-80 i; limited to provision of X- Ray equipment and anti-TB drugs to district TB Centres. Generally the provisions made by the States for drugs are far less than the requirements. Tuberculosis control has been included in 20-Point Programme. During the year 1982-83 the target for case detection was 10 lakh new cases. 10.6 lakh cases are reported to have been tetected by March, 1983. The facilities to treat and follow up these cases, how- over need to be strengthened and streamlicd. Adequaet Plan provision must be ensured for supply of anti-TB rugs Microscopy, the only tool of cases detection at the primary health centre level needs to be augmented and acce’erated. Maintenance of X-Ray facilities and supply of X-Ray films need careful consideration.
The other critical areas that need attention are the acute shortage of trained Radiographers, shortage of X-Ray films, poor involvement of multi-purpose health workers in the programme of case detection ard impro’ ement in the performance of the programme. A Task Force has been set up by the Ministry of Health for streamlining and strengthening the National Tuberculosis Programme. Action on implementation of its recommendations is under the active consideration of the Ministry of Health.
(iii) Leprosy Control Programmes.— The estimated number of leprosy cases in the country at the beginning of the Sixth Plan was approximately 3.2 million, of these 15 to 20 per cent would be of the infectious type, 25 per cent with disabilities of varying degree and abc/ut 20 per cent, of these cases will be of children. The strategy under the National Programme for Control of Leprosy continues to be early case detection through mass survey and education and

bringing cases under treatment., it is estimated that upto the end of 1982-83, 31 lakh eases have been detected and registered for treatment. Good number oi cases have been discharged from the list due to cure, drop out or death etc. At present 29 lakhs are under treatment. The Sixth Plan target is to reach 90 per cent case detection and increase the level of disease arrest from 20 to 40 per cent.
The programme is funded 100 per cent by the Centre with effect from 1981-82. During the year 1982-83 the States of Haryana and Maharashtra have exceeded the set targets. Andhra Pradesh, Tamil Nad*u, Pondicherry and Andaman & Nicobar Islands reported 70 per cent to 80 per cent achievement. Poor performance has been reported from Himachal Pradesh, Jammu & K.shmir, Manipur Naga'and, Sikkim, Tripura and Lakshadweep. In pursuance of the recommendations of a Task Force headed by Dr. M.S. Swaminathan former Member, Planning Commission, an additional outlay of Rs. 50 crores has been agreed to for the programme for 1983— 85. The programme which is included in the 20-Point Programme is being revamped with emphasis on early case detection, effective treatment including introduction of multi-drug regimen on a pilot basis, surgical correction of de'.ormaties, rehabilitation of arrested cases and intensive health education.
(iv) Control oj Blindness.— It is estimated that there are 9 million cases of blindness in the countty and another 45 million are estimated to be suffering from visual impairment. Cataract constitutes about 55 per cent of the cases of blindness which is curable by surgical intervention. The programme of control of blindness was initiated in 1976. During the Sixth Plan it was targeted to bring dov/n the level of blindness from 1.4 per cent to 1 per cent. Ophthalmic care facilities have been strengthened in 540 primary health centres, 250 District hospitals and 30 Medical Colleges. Non-Government organisations are being encouraged and assisted to participate m the programme particularly in conducting mobile eye camps. 26 centres have been identified for training ophathalmic assistants who will be posted at the primary health ccntres. During 1982-83 a target of 12.94 lakh cataract operations was fixed against which the performance was 7.8 lakhs. Punjab, Pondicherry and Chandigarh hnve exceeded the taigeU assigned to them. Madhv;-. Pradesh. Harvana, Tamil Nadu and Meghalava have reported good performance. The poor performing States are Assam. Bihar, West Bengal, Manipur, Kerala and Sikkim. The main reasons for tie low oerotmnnce on the wh^le aie shortage o<" trained doctors & oothalmic assistants, slow process in the installation and use of equipments and other facilities by the StatesJUTs and poor utilisa-
T able
Pronrcmmo No. inposition as on.1-4-80
Sub-Centres . . . . . 48960PHCs . .................................................... 5484Subsidiary Heal ti Centres 2056Community Hetlih Centres . . . . 218
tion of mobile units set up under the programme. The blindness control programme is being restructured on the basis of the recemmenJations of tne Swaminathan Committee, and additional resources are being earmarked for the programme which is now included in the 20 point Programme. The monitoring and evaluation of the programme need to be strengthened to obtain a relevant and reliable feed back on performance at various levels.
Health Programmes in the State Sector
16.10 Since primaiy health care is essentially a States’ Subject, the bulk of the outlays for this piuposc falls under the State Sector. Besides providing for the minimum needs programme and for matching share for Centrally Sponsoieu Schemes of Control cf Communicable Diseases, Control of Bimdness and Rural Health, the Stale Plans piovide foi cevelopmer.t of hospitals and dispesaries, medical educaton development cf ISM Homoeopathy and other miscellaneous schemes such as drug control and prevention of food adulteration, school health etc.
16.11 The total approved outlay for the Sbith Plan for all States and UTs is Rs. 1220.05 crores. In the first three years of t he Plan, a total expenditure of Rs.684.23 crores, (56.1 per cent of total P!;,n outlay) is expected to be incurred Against the approved outlay of Rs. 408.46 crores foi the minimum Needs Programme in t he Sixth Plan, the likclv expcm'ilute upto 1982-8? works cut to Rs. 188 95 crores. which accounts for about -6 per cent of the total outlay.
16.12 The State have generally been under com- pul ion to alloca e larger resources to development of medical colleges and attached hospitals to bring them in conformity with Medical Council of India’s stan- ards. Medical education, research and development of super-specialities have also received relatively larger allocations in the course of actual implementation than was originallv co1 templared. Simiiaily the States have been spending larger allocation for development of district, sub-divisional and taluka hospitals on consideration of local needs.
Minimum Needs Programme
16.13 The population and cost norms of sub-centres and primary health centres wee revised when the Sixth Plan was formulated. Some States particularly those in the North fc'nslern Region have found the cost norms not ienl'sric enough, while the population norms have been generally acccptcd The target set and achivements reported under the minimum needs programme during tiie lir^t two years c f the Plan and l'kelv achievements against the targets set {or the annual Plan 1982-83 are given in Table 16.2
6.2
1980-85 1980-81 1981-82 1982-83(targets) Achievement (Addl.)
(Addl.) Target Achievement
40000 3259 5504 7931 7668600 257 112 209 191
1000 240 244 783 723174 101 38 76 58
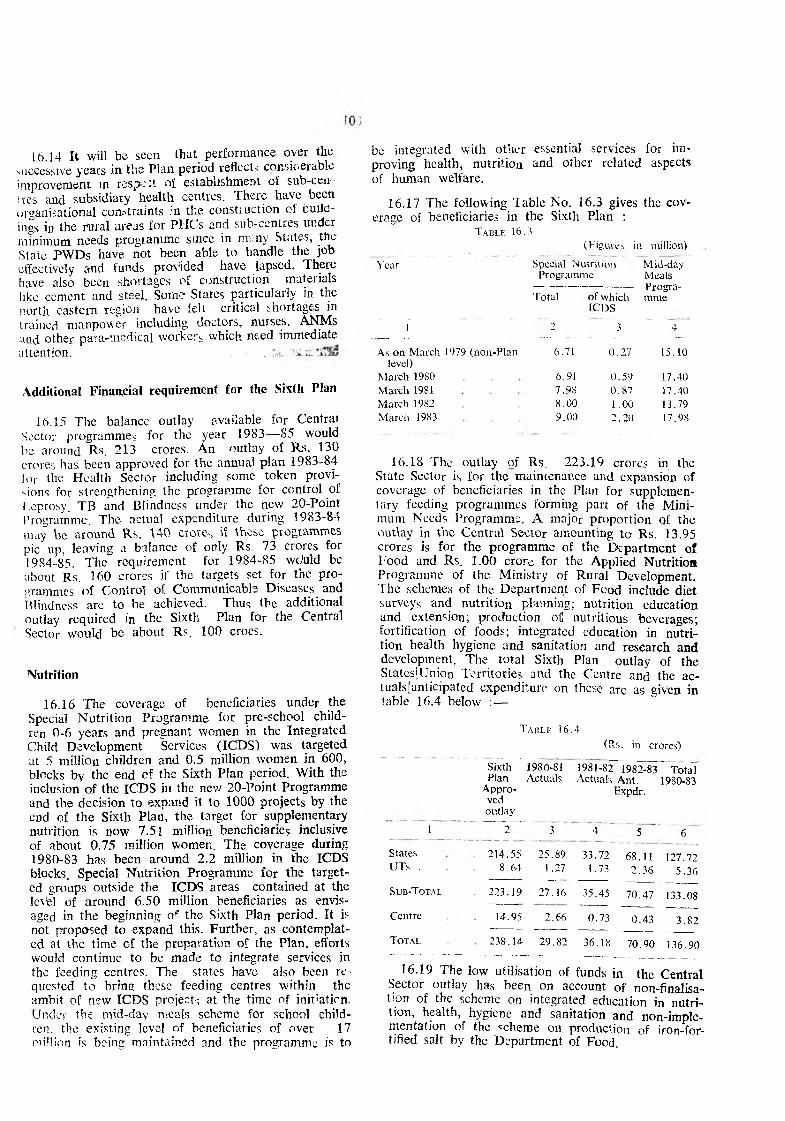
16.14 It will be seen that performance over the successive years in the Plan period reflects considerable improvement in rcsp: ;t of establishment of sub-ceu- ires and subsidiary health centres. There have been organisational constraints :n the constiuction of bulla- ings in the rural areas for PHCs and sub-centres under minimum needs programme sincc in mirny States, the State PWDs have not been able to handle the job effectively and funds provided have lapsed. There have also been shortages of construction materials like cement and steel. Some States particularly in the north eastern region have felt critical shortages in trained manpower including doctors, nurses. ANMs and other para-medical workers which need immediate
attention. . ,
Additional Financial requirement for the Sixth Plan
16.15 The balance outlay available for Central Sector programmes for the year 1983— 85 would be around Rs. 213 crores. An outlay of Rs. 130 crores has been approved for the annual plan 1983-84 lor the Health Sector including some token provisions for strengthening the programme for control of Leprosy. TB and Blindness under the new 20-Point Programme. The actual expenditure during 1983-84 may be around Rs. 140 crores if these programmes pic up, leaving a balance of only Rs 73 crores for1984-85. The requirement for 1984-85 wduld be about Rs. 160 crores if the targets set for the programmes of Control of Communicable Diseases and Blindness are to be achieved. Thus the additional outlay required in the Sixth Plan for the Central Sector would be about Rs, 100 croes.
Nutrition
16.16 The coverage of beneficiaries under the Special Nutrition Programme for pre-school children 0-6 years and pregnant women in the Integrated Child Development Services (ICDS) was targeted at 5 million children and 0.5 million women in 600, blocks by the end cf the Sixth Plan period. With the inclusion of the ICDS in the new 20-Point Programme and the decision to expand it to 1000 projects by the end of the Sixth Plan, the target for supplementary nutrition is now 7.51 million beneficiaries inclusive of about 0.75 million women. The coverage during 1980-83 has been around 2.2 million in the ICDS blocks. Special Nutrition Programme for the targeted groups outside the ICDS areas contained at the level of around 6.50 million beneficiaries as envisaged in the beginning of the Sixth Plan period. It is not proposed to expand this. Further, as contemplated at the time of the preparation of the Plan, efforts would continue to be made to integrate services in the feeding centres. The states have also been requested to bring these feeding centres within the ambit of new ICDS project^ at the time of initiation. Under the mid-day meals scheme for school children. the existing level of beneficiaries of over 17 million is being maintained and the programme is to
be integrated with other essential services for improving health, nutrition and other related aspects
of human welfare.
16.17 The following Table No. 16.3 gives the coverage of beneficiaries in the Sixth Plan :
T a b le 16.3
(Figures in million)
Year Special Nutrition Mid-dayProgramme Meals----------------- Progra-
Total of which mrne ICDS
1 2 3 4---- ------------------------ - - — - - ---
As on March 1979 (non-Plan level)
6.71 0.27 15.10
March 1980 6.91 0.59 17.40
March 1981 7.98 0.87 17.40
March 1982 8.00 1.00 13.79
March 1983 9.00 2.20 17.98
16.18 The outlay of Rs. 223.19 crores in the State Sector is for the maintenance and expansion of coverage of beneficiaries in the Plan for supplementary feeding programmes forming part of the Minimum Needs Programme. A major proportion of the outlay in the Central Sector amounting to Rs. 13.95 crores is for the programme of the Department of Food and Rs. 1.00 crore for the Applied Nutrition Programme of the Ministry of Rural Development. The schemes of the Department of Food include diet surveys and nutrition planning; nutrition education and extension; production ofi nutritious beverages; fortification of foods; integrated education in nutrition health hygiene and sanitation and research and development. The total Sixth Plan outlay of the StatesjUnion Territories and the Centre and the ac- tuals|anticipated expenditure on these are as given in table 16.4 below :—
T a b l e 16.4
(Rs. in crores)
Sixth 1980-81 1981-82 1982-83 T ota lPlan
Approvedoutlay
Actuals Actuals Ant.Expdr.
1980-83
1 2 3 4 5 6
States 214.55 25.89 33.72 68.11 127.72UTs . 8.64 1.27 1.73 2.36 5.36
Su b -To t al 223.19 27.16 35.45 70.47 133.08
Centre 14.95 2.66 0.73 0.43 3.82
To t al . 238.14 29.82 36.18 70.90 136.90--- - ------ - —----- ---- ----- _____
16.19 The low utilisation of funds in the Central Sector outlay has been on account of non-finalisa- tion of the scheme on integrated education in nutrition, health, hygiene and sanitation and non-implementation of the scheme on production of iron-for- tified salt by the Department of Food.

1.6.20 Whereas there is a likelihood of shortfall in the Central Sector Plan outlay for the Sixth Plan increased outlays have been asked for in the States Sector. The increase is mainly on account of (i) addition of ICDS projects from 600 to 1000 and(ii) espansion on mid-day meals in Andhra Pradesh (this accounts for an expected additional expenditure of Rs. SO crores in 1983-84).
16.21 The expansion of the SNP programme outside ICDS is being discontinued. Efforts are to be made to integrate the other essential services at the feeding centres. The mechanism for monitoring and coordination needs to be strengthened. Further, to make mid-day meals programme effective, it is necessary to structure and integrate it with the essential services of health, sanitation and water supply.

CHAPTER 17
HOUSING, URBAN DEVELOPMENT AND WATER SUPPLY
Housing
The Sixth Five Year Plan envisages maximising benefits by allocating the available funds for low cost housing schemes. The objective of the Plan is to reduce substantially the number of absolutely shelterless people and to provide conditions for others to improve their housing environment. The Plan lays emphasis on the following measures:
(i) Provision of house-sites and assistance for the construction of dwellings for rural landless labourers.
(ii) The public sector housing schemes should be so designed as to benefit th; maximum number of people.
(iii) To reduce the cost of public housing schemes by using cheap and alternative building material.
Targets and achievements of selected physical pro- r.vummcs for 1980— S5 are given in Table 17.1.
17.2 The Sixth Plan provides funds for providing house sites to 68 lakh landless families in rural areas and assistance for house-construction to 36 lakh families. This scheme is a component of the new 20- Point Programme, as well as the M.N.P. During the
. Annual Plan 1983-84 discussions, the need to achi
eve the target in full in respect of house-sites has been emphasised. As against the modest level of construction assistance visualised in the Plan, the State Governments are providing substantially, lafger quanta of assistance with the result that the Plan targets in respect of construction might not be realised.
17.3 Firm data in respect of the performance of EVVS Housing Scheme under State Sector for the first three years is not available. The achievement of the target cf 16.19 lakh dwelling units during 1980—85 is unlikely.
General Pool Office and Residential Accommodation
17.4 The Plan envisaged provision of 26615 housing units and 0.157 million sq. metres of office accommodation. During the first three years, the achievements are 14971 housing units and 101.674 sq. metres of office accommodation. It is visualised that the original Sixth Plan target would be achieved without any additional allocation.
17.5 In the case of subsidised housing scheme for plantation labour, there was low physical achievement. because the planters contribution of 124- per cent was practically nil.
17.6 Table 17.2 gives Plan outlayslexpenditure on Housing programmes.
T ablf 17.1
Targets and Achievements of Selected Physical Programmes 1980-85
Programmes Unit Sixth Plan 1980-81 1981-82 1982-83
Targets Actuals Actuals Anticipated
( 1) (2) (3) C4) (5) (6)
State Sector
1. L. I. G. H . Scheme . . . . Nos. 64000 4346 99"2 101721 0 0 0 0 0 la
.1. M. 1. G. H . Scheme . . . . . Nos. 2 0 00 0 2163 3837 3761
45000(«!
3. Econom ically Weaker Section Kousirg In Lakhs 16.19 5987 1 3085 990003 OOff (Nos.) (Nos.) (Nos.)
4. Rural House-Sites Scheme . In Lakhs 6 8 . 0 0 1------------- 23.74----------- 1
5. Rura l Mouse Construction Scheme . . 36.00 1----- ----- 15 53------- ----]
Central Sector
(a) Residential accommodation . Nos. 26615 [------ ------ 14911 ------------]
(b) Oiiice accon-r;’ Kiation . Area sq. metres 157000 I ------ ------ 101674 -------- 1
S H U D C O tarsu i.
llOff
8 PC/83-1 5
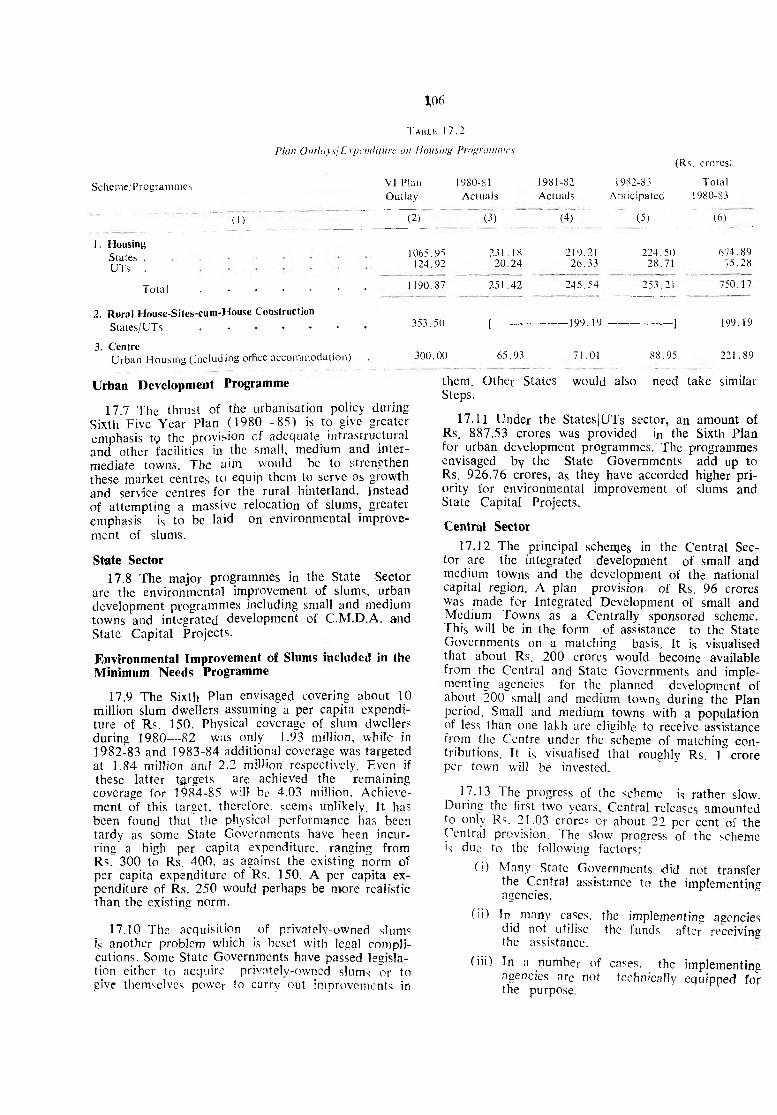
106
T a b l e 1 7 . 2
Plan Outlays/ Expenditure an Housing Programmes
Scheme/Programmes
1. Housing
States . UTs .
V I Plan
Outlay
1980-81Actuals
1981-82 1982-83 Total
Actuals Anticipated 1980-83
(Rs. croresi
( 1)
Total . . . . . . .
2. Rural House-Sites-cum-House Construction
States/UTs ....................................................................
3. CentreUrban Housing (inc lud ing office accommodation) .
Urban Development Programme
17.7 The thrust of the urbanisation policy during Sixth Five Year Plan (1980— 85) is to give greater emphasis tg the provision of adequate infrastructural and other facilities in the small, medium and intermediate towns. The aim would be to strengthen these market centres to equip them to serve as growth and service centres for the rural hinterland. Instead of attempting a massive relocation of slums, greater emphasis is to be laid on environmental improve
ment of slums.
State Sector
17.8 The major programmes in the State Sector are the environmental improvement of slums, urban development programmes including small and medium towns and integrated development of C.M.D.A. and State Capital Projects.
Environmental Improvement of Slums included in the Minimum Needs Programme
17.9 The Sixth Plan envisaged covering about 10 million slum dwellers assuming a per capita expenditure of Rs. 150. Physical coverage of slum dwellers during 1980— 82 was only 1.93 million, while in 1982-83 and 1983-84 additional coverage was targeted at 1.84 million and 2.2 million respectively. Even if these latter targets are achieved the remaining coverage for 1984-85 will be 4.03 million. Achievement of this target, therefore, seems unlikely. It has been found that the physical performance has been tardy as some State Governments have been incurring a high per capita expenditure, ranging from Rs. 300 to Rs. 400, as against the existing norm of per capita expenditure of Rs. 150. A per capita expenditure of Rs. 250 would perhaps be more realistic than the existing norm.
17.10 The acquisition of privately-owned slums is another problem which is beset with legal complications. Some State Governments have passed legislation either to acquire privatelv-owned slums or to give themselves power to carry out improvements in
(2 ) (3) (4) (5) (6 ) __
1065.95 231.18 219.21 224.50 674.89
124.92 20.24 26.33 28.71 75.28
1 190.87 251.42 245.54 253.21 750.17
353.50 [------- - - 199.19 ------------] 199.19
300.00 65.93 71.01 88.95 221.89
them. Other States would also need take similar Steps.
17.11 Under the States|UTs sector, an amount of Rs. 887.53 crores was provided in the Sixth Plan for urban development programmes. The programmes envisaged by the State Governments add up to Rs. 926.76 crores, as they have accorded higher priority for environmental improvement of slums and State Capital Projects.
Central Sector
17.12 The principal schenjes in the Central Sector are the integrated development of small and medium towns and the development of the national capital region. A plan provision of Rs. 96 crores was made for Integrated Development of small and Medium Towns as a Centrally sponsored scheme. This will be in the form of assistance to the State Governments on a matching basis. It is visualised that about Rs. 200 crores would become available from the Central and State Governments and implementing agencies for the planned development of about 200 small and medium towns during the Plan period. Small and medium towns with a population of less than one lakh are eligible to receive assistance from the Centre under the scheme of matching contributions. It is visualised that roughly Rs. 1 crore per town will be invested.
17.13 The progress of the scheme is rather slow. During the first two years, Central releases amounted to only Rs. 21.03 crores or about 22 per cent of the Central provision. The slow progress of the scheme is due to the following factors:
(i) Many State Governments did not transfer the Central assistance to the implementing agencies.
(ii) In many cases, the implementing agencies did not utilise the funds after receivins the assistance.
(iii) Tn a number of cases, the implementing agencies are not technically equipped for the purpose.
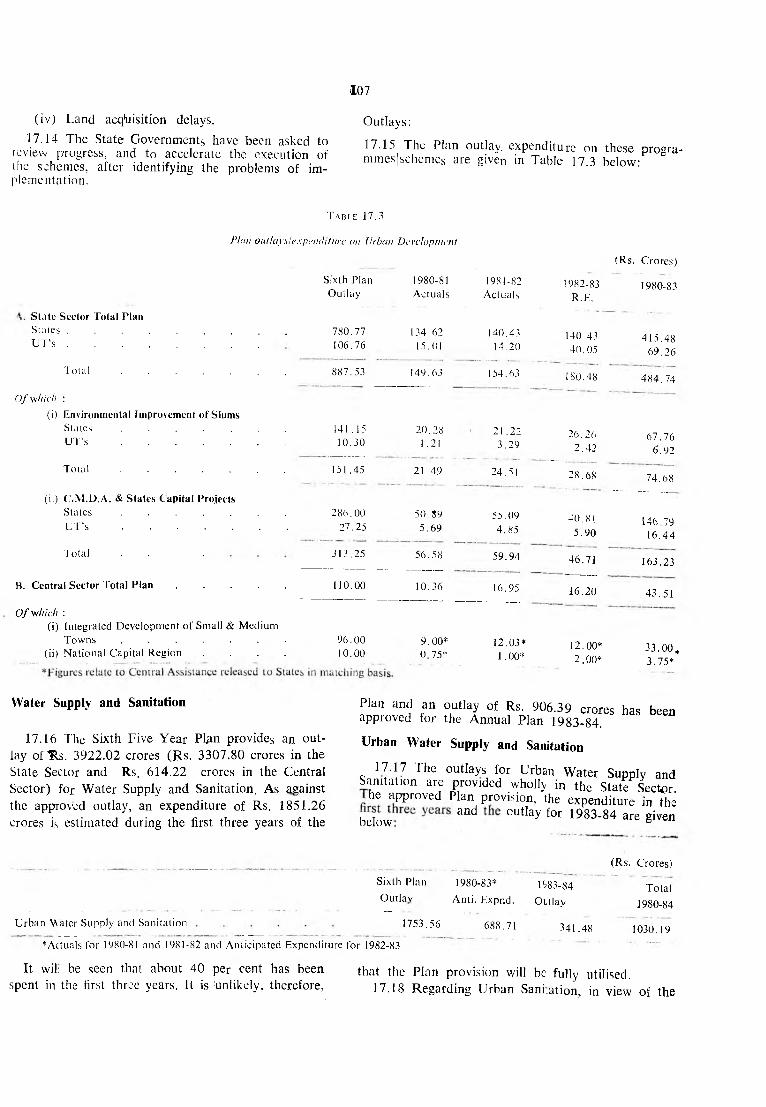
107
(iv) Land acquisition delays.
17.14 The State Governments have been asked to review progress, and to accelerate the execution of the schemes, after identifying the problems of implementation.
Outlays:
17.15 The Plan outlay, expenditure on these progra- mmesjschemes are given in Table 17.3 below:
T able 17.3
Plan oiillayslexpenditare on Urban Development
(Rs. Crores)
State Sector Total Plan
Sixth Plan
Outlay
1980-81
Actuals
1981-82
Actuals1982-83
R.E.1980-83
States . . . . . . . . . 780.77 134.62 140.43 140,43 415.48U T ’s . .............................................................. 106.76 15.01 14.20 40.05 69.26
T o t a l ............................................................. 887.53 149.63 154.63 180.48 484.74
Of which :
(i) Environmental Improvement of Slums
States . . . . . . . 141.15 20.28 21 .22 26.26 67. 76UT’s ............................................................. 10.30 1 .21 3.29 2.42 6.92
T o t a l .............................................................. 151.45 21.49 24.51 28.68 74.68
(ii) C .M .D .A . & States Capital Projects
States . . . . . . . 286.00 50.89 55.09 40,81 146.79
16.44UT’s .............................................................. 27.25 5.69 4.85 5.90
Total . . . 313.25 56.58 59.94 46.71 163.23
B. Central Sector Total Plan . . . . . 110.00 10.36 16.95 16.20 43.51
O f which :
(i) Integrated Development oi’ Small & Medium
Towns . . . . . . .
(ii) National Capital Region . . . .
96.00
10.00
9.00*
0.75*
12.03*
1 .00*12.00*
2 .00*33.00*
3.75*
Water Supply and Sanitation
17.16 The Sixth Five Year Pl^n provides an out
lay of Us. 3922.02 crores (Rs. 3307.80 crores in the
State Sector and Rs. 614.22 crores in the Central
Sector) for Water Supply and Sanitation. As against
the approved outlay, an expenditure of Rs. 1851.26
crores is estimated during the first three years of the
Plan and an outlay of Rs. 906.39 crores has been approved for the Annual Plan 1983-84.
Urban Water Supply and Sanitation
17.17 The outlays for Urban Water Supply and Sanitation are provided wholly in the State Sector,
he approved Plan provision, the expenditure in the
below and °Utlay f°r 1983' 84 are given
Urban Water Supply and Sanitation
Sixth Plan
Outlay
1753.56
1980-83*
Anti. Expnd.
688.71
1583-84
Outlay
341.48
(Rs. Crores)
Total
1980-84
1030.19
* Actuals for 1980-81 and 1981-82 and Anticipated Expenditure for 1982-83
It will be seen that about 40 per cent has been
spent in the first three years. It is Unlikely, therefore,that the Plan provision will be fu lly utilised.
17.18 Regarding Urban Sani.ation, in view of the
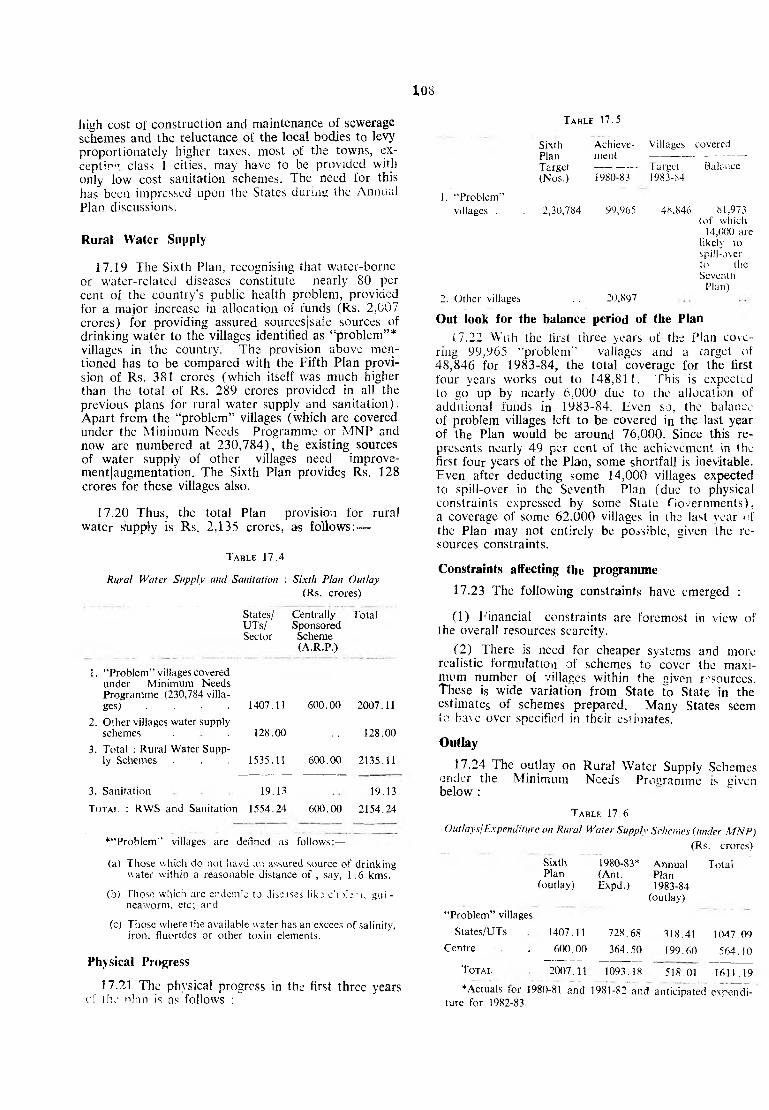
108
high cost of construction and maintenance of sewerage schemes and the reluctance of the local bodies to levy proportionately higher taxes, most of the towns, ex- ceptir" class 1 cities, may have to be provided with only low cost sanitation schemes. The need for this has been impressed upon the States during the Annual Plan discussions.
Rural Water Supply
17.19 The Sixth Plan, recognising that water-borne or water-related diseases constitute nearly 80 per cent of the country’s public health problem, provided for a major increase in allocation of funds (Rs. 2,007 crores) for providing assured sourcesjsafe sources of drinking water to the villages identified as “problem”* villages in the country. The provision above mentioned has to be compared with the Fifth Plan provision of Rs. 381 crores (which itself was much higher than the total of Rs. 289 crores provided in all the previous plans for rurai water supply and sanitation). Apart from the “problem” villages (which are covered under the Minimum Needs Programme or MNP and now are numbered at 230,784), the existing sources of water supply of other villages need improve- ment|augmentation. The Sixth Plan provides Rs. 128 crores for these villages also.
17.20 Thus, the total Plan provision for rural water supply is Rs. 2,135 crores, as follows:—
T a b le 17.4
Rural Water Supply and Sanitation : Sixth Plan Outlay
(Rs. crores)
States/ Centrally Total UTs/ Sponsored Sector Scheme
(A.R.P.)
1. “Problem” villages covered under M inimum Needs Programme (230,784 villages) . . . . 1407.11 600.00 2007.11
2. Other villages water supplyschemes . . 128.00 .. 128.00
3. Total : Rural Water Supply Schemes . . . 1535.11 600.00 2135.11
3. Sanitation 19.13 19.13
T o t a l : RW S and Sanitation 1554.24 600.00 2154.24
‘ “Problem” villages are defined as follows:—
(a) Those which do not havd an assured source of drinking water within a reasonable distance of , say, 1.6 kms.
(b) Those which are endemic to diseases lik: c 'i)b r i, gui - neaworm, etc; and
(c) Those where the available water has an excees of salinity, iron, fluorides or other toxin elements.
Physical Progress
17.21 The physical progress in the first three yearsof I he nlan is as follows :
Sixth Achieve- Villages coveredPlan ment ----------------Target ------- Target Balance
(Nos.) J 980-83 1983-84
1. "Problem”
villages . . 2,30,784 99,965 48,846 81,973(of which
14,000 are likely to spill-over to the Seventh
Plan)2. Other villages . . 20,897
Out look for the balance period of the Plan
17.22 Wiih the first three years of the Plan covering 99,965 “problem” valiages and a target of 48,846 for 1983-84, the total coverage for the first four years works out to 148,811. This is expectcd to go up by nearly 6,000 due to the allocation of additional funds in 1983-84. Even so, the balance of problem villages left to be covered in the last year of the Plan would be around 76,000. Since this represents nearly 49 per cent of the achievement in the first four years of the Plain, some shortfall is inevitable. Even after deducting some 14,000 villages expected to spill-over in the Seventh Plan (due to physical constraints expressed by some State Governments), a coverage of some 62.000 villages in the last vcar of the Plan may not entirely be possible, given the resources constraints.
Constraints affecting the programme
17.23 The following constraints have emerged :
(1) Financial constraints are foremost in view of the overall resources scarcity.
(2) There is need for cheaper systems and more realistic formulation of schemes to cover the maximum number of villages within the given resources. These is wide variation from State To State in the estimates of schemes prepared. Many States seem to ba\e over specified in their estimates.
Outlay
17.24 The outlay on Rural Water Supply Schemes under the Minimum Needs Programme is given below :
T a b le 17.6
Outlays!Expenditure on Rural Water Supply Schemes (under MNP)
(Rs. crorcs)
Sixth 1980-83* Annual TotalPlan (Ant. Plan
(outlay) Expd.) 1983-84
(outlay)
“Problem” villages
States/UTs 1407.11 728.68 318.41 1047.09
Centre . 600.00 364.50 199.60 564.10
T o t a l . 2007.11 1093.18 518.01 1611.19
‘ Actuals for 1980-81 and 19S1-82 and anticipated expendi
ture for 1982-83.
T a b le 17.5
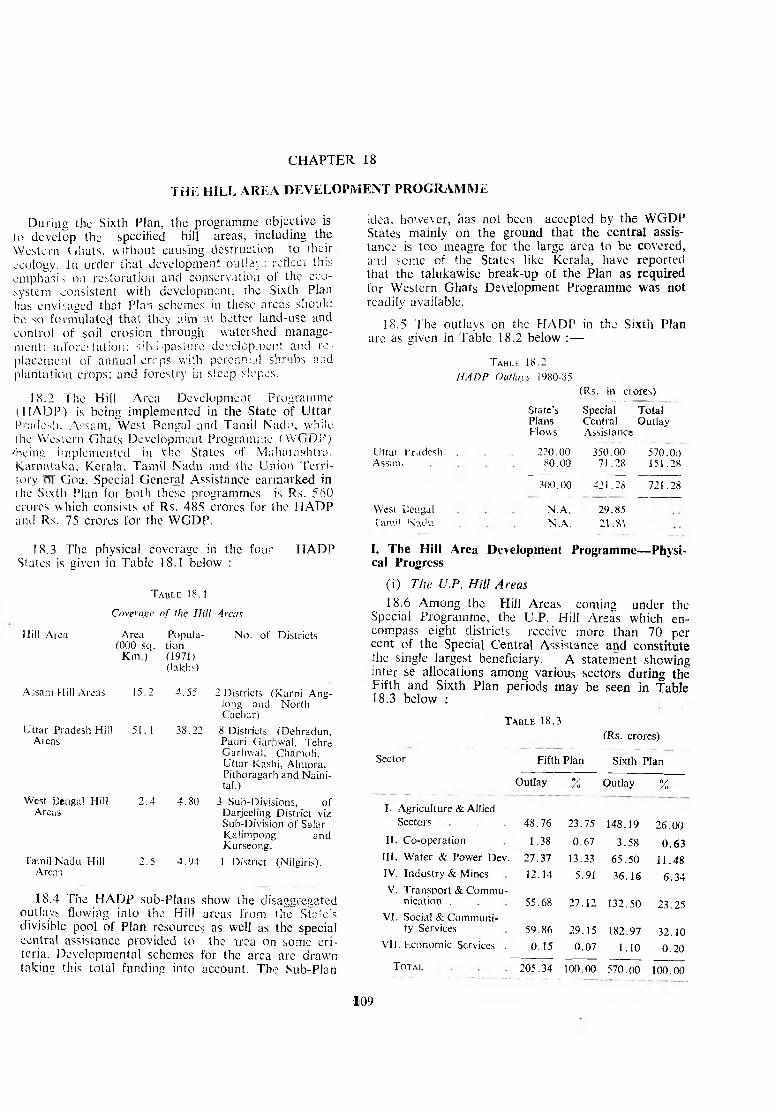
CHAPTER 18
THE HILL AREA DEVELOPMENT PROGRAMME
During the Sixth Plan, the programme objective is lo develop the specified hill areas, including the Western Ghats, without causing destruction to iheir ecology. In order that development outlays reflect this emphasis on restoration and conservation of the ecosystem consistent with development, the Sixth Plan has envisaged that Plan schemes in these areas should he so formulated that they aim ai better land-use and control of soil erosion through watershed management: afforestation; sil\i-pasture development and replacement of annual-crops with perennial shrubs and plantation crops; and forestry in steep slopes.
18.2 The Hill Area Development Programme (HADP) is being implemented in the State of Uttar Pradesh. Assam, West Bengal and Tamil Nad;', while the Western Ghats Development Programme (WGD!-') •'being implemented in 'the States <>f Maharashtra, Karnataka, Kerala, Tamil Nadu and the Union Territory Goa. Special General Assistance earmarked in the Sixth Plan for both these programmes is Rs. 560 crores which consists of Rs. 485 crores for the HADP and Rs. 75 crores for the WGDP.
idea, however, has not been accepted by the WGDP States mainly on the ground that the central assistance is too meagre for the large area to be covered, and some of the States like Kerala, have reported that the talukawise break-up of the Plan as required for Western Ghats Development Programme was not readily available.
18.5 The outlays on the HADP in the Sixth Plan are as given in Table 18.2 below : —
Tabi.l 18.2
HADP Outlays 1980-85
(Rs. in ci ores)
State’s Special TotalPlans Central OutlayFlows Assistance
Uttar Fradesh 220.00 350.00 570.00Assun, 80.00 71.28 151.28
300.00 421.28 721.28
West lien gal N .A . 29.85
Tamil N-.\du N.A . 21.81
18.3 The physical coverage in the four HADP States is given in Table 18.1 below :
T a b le 18.1
Coverage of the Hill Areas
Hill Area Area Popula- No. of Districts(000 sq. tion
Km .) (1971)(lakhs)
Assam Hill Areas 15.2 4.55 2 Districts (Karoi Ang-long and North Cachar)
IJttar Pradesh Hill 51.1 38.22 8 Districts (Dehradun, Areas Pauri Garhwal, Tehre
Garhwal, Chamoli, Uttar Kashi, Almora, Pithoragarh and Naini- tal.)
West Bengal Hill 2.4 4.80 3 Sub-Divisions, of Areas Darjeeling District viz
Sub-Division of Salar Kalimpong andKurseong.
Tamil Nadu Hill 2.5 4.94 1 District (Nilgiris). Arens
18.4 The HADP sub-Plans show the disaggregated outlays flowing into the Hill areas from the State's divisible pool of Plan resources as well as the special central assistance provided to the area on some criteria. Developmental schemes for the area are drawn taking this total funding into account. The Sub-Plan
I. The Hill Area Development Programme— Physical Progress
(i) The U.P. Hill Areas
18.6 Among the Hill Areas coming under the Special Programme, the U.P. Hill Areas which encompass eight districts receive more than 70 per cent of the Special Central Assistance and constitute the single largest beneficiary. A statement shewing mter se allocations among various sectors during the Fifth and Sixth Plan periods may be seen in Table18.3 below :
T a b le 18.3
(Rs. crores)
Sector Fifth Plan Sixth Plan
I. Agriculture & Allied
Outlay % Outlay %
Sectors 48.76 23.75 148.19 26.00
II. Co-operation 1.38 0.67 3.58 0.63
III . Water & Power Dev. 27.37 13.33 65.50 11.48
IV. Industry & Mines 12.14 5.91 36.16 6.34
V. Transport & Communication . 55.68 27.12 132.50 23.25
VI. Social & Community Services 59.86 29.15 182.97 32.10
VII. Economic Services . 0.15 0.07 1.10 0.20
T o t a l 205.34 100.00 570.00 100.00
109
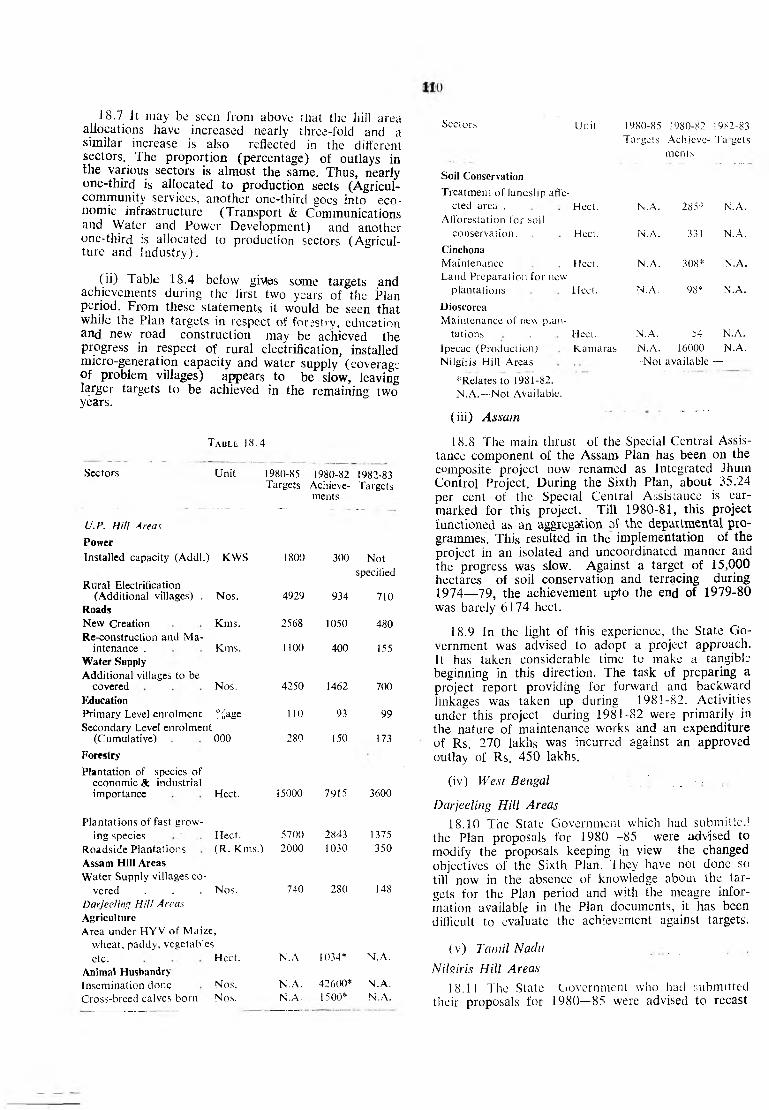
.18.7 It may be seen from above ifiat the hill area allocations have increased nearly three-fold and a similar increase is also reflected in the different sectors. The proportion (percentage) of outlays in the various sectors is almost the same. Thus, nearly one-third is allocated to production sects (Agricul- •community services, another one-third goes into economic infrastructure (Transport & Communications and Water and Power Development) and another one-third is allocated to production sectors (Agriculture and Industry).
(ii) Table 18.4 below giMeis some targets jand achievements during the first two years of the Plan period. From these statements it would be seen that while the Plan targets in respect of forestry, education and new road construction may be achieved the progress in respect of rural electrification, installed micro-generation capacity and water supply (coverage of problem villages) appears to be slow, leaving lajger targets to be achieved in the remaining two years.
T a b l e 18.4
Sectors Unit 1980-85Targets
1980-82Achieve
1982-83Targets
U.P. Hill Areas
Power
-- —ments
—
Installed capacity (Addl.)
Rural Electrification
KWS 1800 300 Not
specified
(Additional villages) .
Roads
Nos. 4929 934 710
New Creation
Re-construction and M a
Kins. 2568 1050 480
intenance .
Water Supply
Additional villages to be
Kms. 1100 400 155
covered
Education
Nos. 4250 1462 700
Primary Level enrolment
Secondary Level enrolment
%age 110 93 99
(Cumulative)
Forestry
Plantation of species of economic Sc. industrial
000 280 150 173
importance
Plantations o f fast grow
Hect. 15000 7915 3600
ing species Hect. 5700 2843 1375
Roadside Plantations
Assam Hill Areas
Water Supply villages co
(R . Kms.) 2000 1030 350
vered . . . Nos.
Darjeeling Hill Areas
Agriculture
Area under HYV of Maize,
wheat, paddy, vegetables
740 280 148
etc.
Animal Husbandry
Hect. N.A. 1034* N.A.
Insemination done Nos. N .A . 42600* N.A.
Cross-breed calves born Nos. N.A. 1500* N.A.
Sectors Unit 1980-85 1980-82 1982-83
Targets Achieve
ments
Tagets
Soil Conservation
Treatment of landslip affe
cted area . Hect. N.A. 285* N.A.
Afforestation for soil
conservation. Hect. N.A. 331 N.A.
Cinchona
Maintenance Hect. N.A. 308* N.A.
Land Preparation for new
plantations Hect. N.A. 98* N.A.
Dioscorca
Maintenance of new plan
tations Hect. N.A. 54 N.A.
Ipecac (Production) Kamaras N.A. 16000 N.A.
Nilgiris H ill Areas --- Not available —
^Relates to 1981-82.
N .A .—Not Available.
( i i i ) Assam... _ - -
18.8 The main thrust of the Special Central Assistance component of the Assam Plan has been on the composite project now renamed as Integrated Jhum Control Project. During the Sixth Plan, about 35.24 per cent of the Special Central Assistance is earmarked for this project. Till 1980-81, this project functioned as an aggregation of the departmental programmes. This resulted in the implementation of the project in an isolated and uncoordinated manner and the progress was slow. Against a target of 15,000 hectares of soil conservation and terracing during 1974— 79, the achievement upto the end of 1979-80 was barely 6174 hect.
18.9 In the light of this experience, the State Government was advised to adopt a project approach. It has taken considerable time to make a tangible beginning in this direction. The task of preparing a project report providing for forward and backward linkages was taken up during 1981-82. Activities under this project during 1981-82 were primarily in the nature of maintenance works and an expenditure of Rs. 270 lakhs was incurred against an approved outlay of Rs. 450 lakhs.
(iv) West Bengal ' . . - .
Darjeeling Hill Areas
18.10 The State Government which had submitteJ the Plan proposals for 1980— 85 were adv:ised to modify the proposals keeping in view the changed objectives of the Sixth Plan. They have not done so till now in the absence of knowledge about the targets for the Plan period and with the meagre information available in the Plan documents, it has been difficult to evaluate the achievement against targets.
(v) Tamil Nadu _ .....
Nilgiris Hill Areas
18.11 The State Government who hatl submitted their proposals for 1980—85 were advised to recast

i iic proposals keeping in view the guidelines on Hill Areas Development contained in the Sixth Five Year Plan. They have not submitted the revised proposals, in the; absence of which it is not possible to have an objective review of their achievements.
18.12 In the Nilgiris District, the area under tea. ultivation constitutes nearly 40 per cent of the cropped a.rea and thus forms the mainstay of the economy Cultivation of paddy, potato, ginger and other vegetable seeds were the other important agricultural . n'p- The main thrust of the sub-Plan, therefore, is on soil conservation measures in the tea and potato cultivation areas like construction of chcck-dams, contour walls, etc. Rejuvenation of tea holdings, increasing the tea bush density in the existing plantations through distribution of seedlings,! fertilizers, etc. at subsidised rates are the main activities under the sub- Plan. With a view to encouraging the cultivation of spices, vegetable seeds and potatoes, a scheme for distribution of seedlings, etc. has also been taken up. There are also schemes to help the formers’ tea cooperatives in processing and marketing of the tea-crop. Comparable data about targets and achievements for the various sub-Plans are, however, not available.
18.13 The Hill Area Development Programme Plans have not vet been able to bring the required tUvvrst. and emphasis in the planning and execution oi the programme, despite the fact that in UP the HADP has been under implementation sincc the Fifth Plan. It is even difficult to say that the first two years of the Plan (i.e. 1980-82) were a period of transition to this approach as the anniial plans prepared by the States have continued with narrow sectoral schemes
■ without adequate emphasis on eco-conservation or eeo-restoration.
Western Ghats Development Programme
18.14 The utilisation of plan funds during the three year period 1980-83 was, by and large, more than 98 per cent of what was provided. However, during 1980-81 some shortfalls have occurred in Kerala (Rs. 13 lakhs i.e. 5.8 per cent of Special Central Assistance), Tamil Nadu (Rs. 12 lakhs i.e. 6.7 per cent of Special Central Assistance), and Goa (Rs. 6.55 lakhs i.e. 13 per cent of Special Central Assistance). Tn 1982-83 there was a shortfall in Karnataka (Rs. 20.83 lakhs i.e. 7 per cent of the Special Central Assistance). Since the Sub-Plan approach is not being followed in respect of this programme, no idea of the (low of funds from the State Plan Resources to this area is available. Hencc. this review is confined to the
performance under the Special Central Assistance Component.
The emphasis and strategy of the programme
18.15 During the Fifth Plan period, this programme was heavily tilted in favour of schemes of a beneficiary- oriented type as characterised in the 1RD Programme. In the Sixth Plan, an eco-development objective has been emphasised consistent with development. The States were told to re-orient their programme and utilise the Special Central Assistance component mainly for bringing about this shift in emphasis. Detailed discussions were held in the official level committee in August, 1980, lanuary, 1982 and December, 1982. It was noted that the schemes showed no improvement. Fresh guidelines were issued again, laying emphasis on the need for selecting one or two watersheds as the basis of development. The trends, as revealed by the programme content of" the Annual Plans 1980-81 and 1981-82, indicate that the old approach is still persisting and a change-over to the new pattern would need to be ensured.
Review of the HADP & GDP
18.16 Review of the performance of the States in both these programmes reveals the following:—
(i) None of the States seems to have worked out a five-year perspective in respect of these programme. Consequently goals and objectives lack definitional clarity and with available information, monitoring at the State level as well as the level of Planning Commission is difficult.
(ii) Linkages, complementarities and infrastructural and organisational support so essential in these areas are often not perceived or provided for. As a result not only does the approach vary from State to State, but schemes where institutional finance was expected do not measure upto the financial institution’s criteria for bank ability. Whatever plans are prepared by the States, are weak both in technical content as well as in presentation or conceptualisation. With the lack of precision in framing plans for both these programmes, the annual plans prepared by the State Governments are mostly on ad hoc basis.
(iii) There is lack of effective monitoring of hillarea programme at all levels, as also a general lack of coordination in the multilevel planning effort that is essentially required.

CHAPTER 19
DEVELOPMENT OF BACKWARD CLASSES
The Backward Classes comprise Scheduled Tribes, Scheduled Castes, denotified nomadic and semi-nomadic tribes and other castes which are socially and educationally backward. By devolution of funds, through special component Plans (for States; UTs) and Special Central Assistance to a much larger extent than in the earlier Plans, it was the aim to see that at least half of them are provided substantial assistance to enable them to cross the poverty line.
19.2 The total outlays contemplated in the Sixth Plan for development of backward classes and the expenditure actually incurred]estimated!provided for are given in Table 19.1.
T a b le 19.1
(Rs. crores)
VI Plan 1980-81 1981-82 1982-83 Total
1980-85 Actuals Antici Antici (1980-
Outlay pated pated 83)
Expdr. Expdr.
. Scheduled Tribes
State Flow (Tri
bal Sub-Plan) 3521 467 594 687 1748
Special Central
Assistance 470 70 85 95 250
Total—A 3991 537 679 782 1998
Scheduled Castes
State Flow
(Spl. Component
Plan) 4204 457 651 710 1818
Spl. Central
Assistance 600 100 110 120 330
Total—B 4804 557 761 830 2148
19.3 To achieve this objective, comprehensive development plans are required to be formulated keeping in view special problems and needs of each of these communities. Also the programmes have to be integrated with other general programmes in the context of the overall development strategy of the Plan.
19.4 For tribals and tribal areas, the strategy is to continue with tribal sub-Plans (TSP) and for scheduled castes, Special Component Plans are being formulated. The major thrust of the tribal sub- Plans and special components plans is to come from State’s own Plan funds with the Centre providing an
additive in the form of Special Central Assistance. Besides these allocations, Central Ministries ire also required to identify programmes and allocate funds for tribal sub-Plans and Special Component Plans out of Central and Centrally-sponsored schemes.
Tribal Development
19.5 The State Governments have, by and large, established a system of showing flow of funds from the State Plans to the TSP in different sectors’ development schemes. However, the Central Ministries have yet to establish a similar system for Central and Centrally sponsored schemes.
19.6 Apart from the Tribal sub-Plnn, areas having, a minimum of 10,000 population with 50 per cent or more tribal concentration have been identified in blocks or talukas for integrated development. The total number of such pockets identified so far is 235 covering a population of 32.36 lakhs.
19.7 For the Sixth Five Year Plan a flow of Rs. 3521 crores is envisaged out of the State Plans for the tribal areas against which it is expected that Rs. 1748 crores would be utilised by the end of 1932-83 leaving a balance of Rs. 1780 crores. Special Central Assistance amounting to Rs. 250 crores has been allocated by 1982-83, out of Rs. 470 crores allocated for the Sixth Plan, leaving a balance of Rs. 220 crores.
19.8 The strategy for tribal sub-plan during the Sixth Plan has been modified from the previous Plan to placc more emphasis on family-oriented programmes than on infrastructure development. In the Sixth Plan there is also an emphasis on development of tribal pockets with a minimum of 10,000 population containing at least 50 per cent tribal population, as well as on development of primitive tribes.
19.9 Tribal sub-Plans are being implemented in 19 States|UTs where the tribal population is 50 per cent or more in concentration in blocks I taluks in scheduled areas and other tribal areas. These plans, however, are not formulated for the tribal majority States of Meghalaya and Nagaland and the UTs of Arunachal Pradesh. Dadra and Nagar Haveli, Lakshadweep and Mizoram as their entire State-Plans are for tribals.
19.10 The Tribal sub-Plans are divided into a number of Integrated Tribal Developments Projects (ITDPs) for planning and operational purposes. By the end of the Fifth Plan. 180 projects had been recognised. While the TSP programmes have been implemented since Fifth Plan, and a system of flow of State Plan funds to tribal areas established, it is
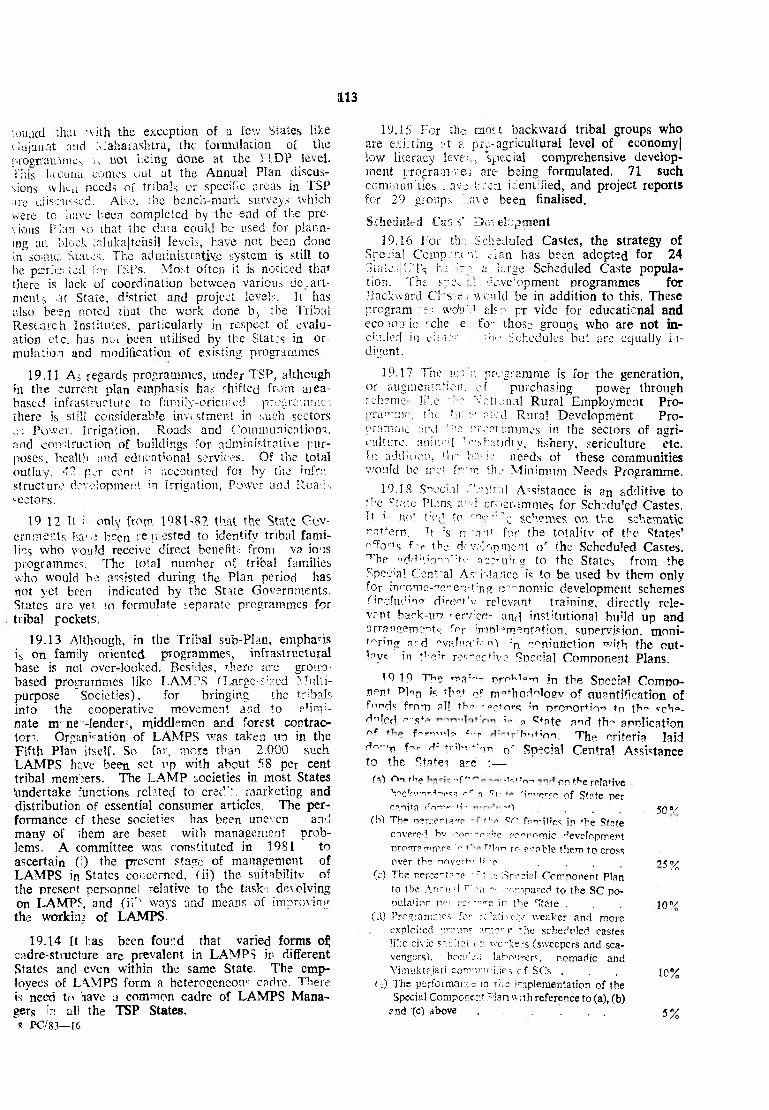
113iouucd -that • vith the exception of a few States like (.iujajrat and Maharashtra, ihe formulation of the iifoerrannmcs e. not being done at the 11 DP level, Yhis la curia comes out at the Annual Plan discussions wheu needs of tribals or specific areas in TSP are dismissed. Also. the bench-mark surveys which were to have been completed by the end of the pre- vious Plan so ihat the data could be used for planning atl block ;nluka|tehsil levels, have not been done in soimc Stales. The administrative system is still to be perfected for TSPs. Most often it is noticed that there is lack of coordination between various departments ;at State, district and project levels, ft has also be:en noted that the work done by the Tribal Research Institutes, particularly in respect of evaluation etc. has not been utilised by the States in or mulation and modification of existing programmes,
19.11 As regards programmes, under TSP, although in the. current plan emphasis has shifted from area- based infrastructure to family-oriented programme', there is still considerable investment in such sectors as Power, Irrigation, Roads and Communications, and construction of buildings for administrative purposes, health and educational services. Of the total outlay, 42 per cent r. accounted for by the infra structure development in Irrigation, Power and Roads sectors.
19.12 It ' ■ only from 1981-8?. that the Statt Govern meets hav.i been revested to identify tribal families who vould receive direct benefits from va ions programmes. The total number of tribal families who would be assisted during the Plan period has not yet been indicated by the State Governments. States are yet to formulate separate programmes for tribal pockets.
19.13 Although, in the Tribal sub-Plan, emphasis is on family oriented programmes, infrastructural base is not over-looked. Besides, there are group- based programmes like LAMPS (Large-s^ed Multipurpose Societies), for bringing the trials into the cooperative movement and to elinr'- nate nrne -lender, middlemen and forest contractor'. Organiration of LAMPS was taken ur> in the Fifth Plan itself. So far, more than 2,000 such LAMPS have been set up with about 58 per cent tribal members. The LAMP societies in most States Undertake functions related to cred'f marketing and distribution of essential consumer articles. The performance ef these societies has been uneven arid many of them are beset with management problems. A committee was constituted in 1981 to ascertain (0 the present stage of management of LAMPS in States concerned, (ii) the suitabilitv of the present personnel relative to the task; devolving on LAMPS, and. ( iP ways and means of improving the workin: of LAMPS.
19.14 It has been found that varied forms ofj cadre-structure are prevalent in LAMPS in different States and even within the same State. The employees of L\MPS form a heterogeneous cadre. There is need to have a common cadre of LAMPS Managers in al! the TSP States,* PC/83— 16
19.15 For the most backward tribal groups who are existing at a pre-agricultural level of economy] low literacy levee., special comprehensive development programmes are being formulated. 71 such communities i.avs been identified, and project reports for 29 groups have been finalised.
Scheduled Cas's* Dovelcjpnient
19.16 For the Scheduled Castes, the strategy of Special Ccmp encnt Plan has been adopted for 24 State3|UTs ha 're' a large Scheduled Caste population. The srec deve’opment programmes for Backward Chs-e-: would be in addition to this. These program :es wo'u'r! also pr.vide for educational and economic cche e for those groups who are not included in eii'ie-- . ■ h-e Schedules but are equally indigent.
19.17 The m:'n programme is for the generation, or augmentation, cf purchasing power through scheme; li'-.e 'ee N’ r.tbnal Rural Employment Programme, the f-i: j". eted Rural Development Pro- p.ramhie and fhe rresrremmes in the sectors of agriculture. annual V-sbandry, fishery, sericulture etc. h: add men, '.l ie b:e ie needs of these communities would be me! from the Minimum Needs Programme.
19.18 So'ccul renireil Assistance is an additive to the State Plans, ae d nroicMmmes for Schedu’?d Castes. It i no! tv<t to '■rK", 'i£ schemes on the schematic re,Hern. It >s rr aa* for the totality of the States’ r‘To,-<s for the development o' the Scheduled Castes, ^he edfH;o-n;:tv accrirr.fr to the States from the Spec>'a! Central Asistaeice is to be used bv them only for inrome-',c”c-ft:ng e^nomic development schemes (including direct1 v relevant training, directly relevant baek-uT -erv'ce- and institutional build up and arrangements for implementation, supervision, moni- t 'r r g aed ^valna'iVn) ?n conjunction w'th the outl i v e in tV r res-ect've Special Component Plans.
19 19 The ma:~r pr^terr, in the Special Component Pl<»n is tfn* 0f m^hodoloev of ouantification of funds from all th» 'prtoi-c; ;n proportion to th” SCh.“- d"led '’"S^ i- „ «!fate. and the applicationof f~r,r.viH f-r N-.fion The criteria laid do-ri fo-- d?-tn>,-*;0R 0> special Central Assistance to the States are :—
( ) On ftie "'f ’tn* ;n~> on tbe relative h->cVvW->i»c=; rr n * t ' 'i'-^'erse of State r>er
canjta rto-n»'-, i- -o 50°/
(b) The penrfrfa*»e t'-'e s r fn-nilies in fbe State
covered by "r.r--n■■ ee economic development
programme' ■>. n|nn tr> c-p_b!e them to cross
over the nove^t" !i -e . . . ^5°/
(c) The perce’••t.T ->e -f tee Spenial Component Plan
to the Annual r '".i rs ..-r.nipai-ed to the SC po
pulation Per ec' t-K's in the ^tate . . . ]o°/
(c!) Programmes for relatively weaker and more
exploited "rcunj arno'-p the scheduled castes
like civic senitai re wo-kers (sweepers and sca
vengers'), bonc'eJ labourers, nomadic and
Vimuktajati cora-vmrtos c f SCs . . , lC°/a
<;) The performance in the implementation of the
Special Component ? !an w:th reference to (a), (b)
and '(c) above . . . . . 5 %
114
The S ate Governments are being urged to maximise the flew of funds to the SCP and increase the quantum tc correspond to the percentage of SC population in the total population. However, due to high allocation', to the non-divisible sectors, the States have not been able to achieve this objective.
19.20 Under the Special Component Plans, programmes are aimed at economic betterment of SC familk-s. The SC families engaged in traditional occupations like leather works, scavenging, fishing, weaving etc.. from The target groups. Definitive evaluation of these programmesjschemes is yet to be done.
19.21 The flow of finance from Central Ministries to the Tribal Sub-Plan areas and for scheduled castes has rot been encouraging.
Problem of Institutional Finance
19.22 The flow of institutional finance which is important both for tribal sub-plans and Special Component Plan still remains weak.
Monitoring & Evaluatioa
19.23 The monitoring system has not yet been fully established in the States. Only 8 States have so far set up monitoring cells. At the Centre, the Programme Evaluation Organisation (PEO) of the Planning Commission has taken up evaluation of some TTDPs. while some States have entrusted the Tribal Research Institutes with this work.
Backward Classes
19.24 The Backward Classes sector comprises educational incentives, some economic programmes and provision of amenities like drinking "water, house sites etc. as supplemental to the general benefits. In addition, there are 9 Centrally sponsored schemes. Of the important schemes in this sector, the post- matric scholarships scheme is expected to help 7.3 lakhs Scheduled Caste and Scheduled Tribe students in getting scholarships during 1982-83. The rates of post-matric scholarships have recently been increased and the scheme is gaining popularity. The progress of expenditure of the scheme indicates that the Plan outlay may have to be increased. Lastly. 100 per cent grants are provided to all-India and regional voluntary organisations carrying out work among Scheduled Castes and Scheduled Tribes.
1925 In regard to the targets, this is a sector where very few States give prede targets under each of the schemes. The only substantial schemes under this sector are pre-matric educational incentives in terms of stipends, scholarships, boarding grants, etc. and post-matric scholarships for which a provision of Rs. 130 crores exists in the Plan.
19.26 During the Sixth Plan, lhe Plan investment envisaged for the sector of Welfare of Backward Classes
and Centrally sponsored schemes and th e p r o g r e s s of expenditure is as given in Table 19.2.
Table !9 .2
(Rs. crores)
O utlay Actuals Anti-Exp. Likely Totil
1980-85 1980-81 1981-82 O utlay I9SOS3
19X2-83
8 . C . Sector
S ta te /m - . . 726* 103.31 113.87 146.48 363 66
C.S.S. . . 240 29 .94 48.25 53.40 131 59
Total . . 966 133.25 162.12 199.98 495.25
♦Revised outlay shown by States, UT s against the Rs. 72
crores provided in the Plan.
19.27 Under the Scheduled Caste Finance and Development Corporations Scheme, which is meanl to help she Scheduled Caste families to avail themselves of institutional finance by providing margin moneys, more than 5 lakh Scheduled Caste families have keen assisted. However,, the tardiness of the banks in providing necessary loans to Scheduled Caste families remains a major handicap for these corporations.
19.28 The expenditure on the scheme of Machinery for Implementation of the Protection of Civil Rights Act is cxpected to be Rs. 7.21 crorcs by the eni of1982-83 as against an outlay of Rs. 6 crores for the entire Plan period. The last two years of the Plan also would need more than Rs. 8 crores since S‘a!es are being assisted to improve sanitation on a whole town basis so as to free scavengers from this occupation.
19.29 Central assistance is sanctioned to voluntary organisations for doing welfare work among SCjSTs so as to improve the Socio-economic conditions of the?e communities. In all, 22 all-India- voluntary organisations and regional agencies received srants-in-aid during the three years of the Plan. Rs. 7.50 crores have been provided for the scheme in the Plan and the expenditure upto 1982-83 is estimated at about Rs. 3.23 crores. The schemes taken up by these agencies are : settingup institutions like hostels, dispensaries, training centres. etc. or doing publicity or propaganda for removal of untouchability and tribal welfare,
Conclusion
19.30 To conclude, the following measures appear to be necessary for achieving the objectives of the Sixth Plan :
(i) For Tribal sub-Plans', it will be necessary to streamline planning and implementation machinery at blockfprojectlState level. Special attention should be paid to primitive tribal groups.
r;n Tn view of the difficulties encounter'd b'- State Governments in maximising the Special Component Plan size in proportion to the percentage of Scheduled < aste po ulati.-v-i v their total ponnWion. it is susrrrested that the formula for distribution of srerrl r'c”!rn1 assistance may be reviewed.
115
( ( iiii) It is imperative that flow of institutional finance is ensured for both Tribual sub-Plan and Special Component Plan if these families have to be assisted in generating additional income to cross the poverty line.
( ( i v ) Effective methods of quick evaluation of programmes and feed-back from States to the
Centre have to be evolved.
(v) In view of the tempo of expenditure ip the Central Sector of Development of Backward Classes, an enhancement of the outlays for the Centrally Sponsored Schemes appeals necessary.

CHAPTER 20
SOCIAL WELFARE
The economic needs of the most deprived sections of the society are to be iaken care of in the general development sectors, particularly thr crush target-group oriented approach. Additionally, ce-":ain orogratr.mes are being implemented in the social welfare sector which are of a supplemental nature. Though, in the
overall context, the total impact of ;hc latter may nut
be very significant, their chief utility lies in their xing able to add an incremental factor which could tit the balance in favour of the general sector programmes. In the Sixth Plan an outlay of Rs. 271.97 crores has been provided under this sector. Against th>s, the estimated expenditure ia the period 1980-83 aggregates tj Rs.163.17 crores as given in TabPe 20.1 below
T ab le 20 . 1(Rs. in crores)
Sixth Plan
Outlay
1980-81
Actuals
1981-82
Actuals
1982-83
R.E.
1980-83
Total•’{.age
1 '•>A. 3 4 5 6
States 109.78* 13.05 19.34 19.88 52,27** ; 95-»“
UTs 12.19 1.56 2.08 2.90 6.54 53.65
To t a l 121.97* 14.61 21.42 22.78 58.81** 56.56**
Centre 150.00 23 .50 31.12 49.74 104.36 69 .57
G R A N D TOTAL 271.97* 38.11 52.54 72.52 163.17** (.4.25*“
•Includes Rs. 8 crores for Special Employment Scheme (SES) under Labour & Employment Sector.
** Excludes expenditure on SES.
20.2 Both in the State and Central Sectors, the expenditure is likely to exceed the approved outlay as indicated below:
(Rs. in croie;)
1980-85 Expdr.
Outlay 1980-83
States/UIs
Centre
121.9/*
150.00
58.81
104.36
Outlay
1983-84
31.39
60.00
•Includes Rs. 18 crores fox SES.
20.3 As may be seen, the balance for the State Sector for 1984-85 is much less Chan the current year’s outlay while in the Central Sector the expenditure already exceeds the Plan outlay.
20.4 The scheme ‘Integrated Child Development Services’ (ICDS) is a major programme in She Central Sector. Its main object is improvement of nutritional and health status of children in the age-group 0-6 years, reduction in the incidence of morbidity, mortality, malnutrition and school drop-out and enhancement of capabilities of the mother to look after the normal heal h and nutritional needs of the children through proper nutrition and health education. The scheme aims nl providing a package of services consisting of (i) supplementary nutrition (ii) immunisation (iii) health check up (:v) referral services (v) nutrition end health education and (vi) non-formal education to children below
the age of six years and pregnant and nursing mothers.
The administrative unit for the location of ICDS project is a community development block in the rural|tribal area and a ward in urban slums. Upto 1979-80, 150 ICDS projects had been sanctioned. The target for the Sixth Plan was establishment of 600 projects; later it was decided to increase the number of 1,000 projects. Upto 1982-83, the total number of projects sanctioned was 620, but not all of them have become operational. For 1983-84, 200 additional projects have been approved.
20.5 The scheme of Functional Literacy for Adult Women (FLAW) which js being implemented in ICDS projects aims at imparting non-formal education ro adult women, using functional literacy as the means in the field of health and hygiene, food and nutrition, home management, child care and civic educational skills. Its operation has been restricted to the 300 ICDS projects sanctioned upto 1981-82. In the Sixth Plan, provision for this scheme is made on a year to year basis.
20.6 The Ministry of Social Welfare had envisaged the sctrirg up of national institutes, one each for the visually handicapped, the oithopaedically handicapped, the hearing handicapped and the mentally retarded with the object of undertaking research, training, rehabilitation and providing certain national level services in the respective fields. Tire National Institute for the Visually Handicapped and the National Institute for the
It'S

117
1 Jithojpaedically Handicapped have been functioning ati ’ehracduji and Calcutta respectively for some >ears. The Nutiomal Institute for the Hearing Handicapped has !x:en stet up at Bombay in 1982-83. The National 1ns- •. iito lfor the Mentally Retarded is likely to be set up ui 19SS3-84.
20.'7 The Ministry of Social Welfare has also been involving the State Governments in several ways for reachiing out benefits to the disadvantaged. Funds have been placed at the disposal of the Stale Governments for promoting institutional and lion-institutional services for children in need of care and protection and giving; scholarchips to the handicapped for education, techniical and professional training. The number oi benefiiciaries under the former scheme is 0.28 lakh durin;g 1980— 83 while under the latter it is about 0.30 lakh during the same period.
20..8 There are a number of other schemes which .ire run through voluntary organisations with funds made available by the Ministry of Social Welfare. Some- selected schemes and the likely achievement durimg 1980— 83 are as follows : —
Ccmtienscd courses
of education for ad
ult: women
Unit
No. of courses
Achieve
ment
2,876
U .i
\chiew
mem
2. Socio-economic pro- NS. of units 2,331
gramme (c.y. hatid loom units,
dairy units)
3. Hostels for working No. of hostels
women
4. Creches for children No. of creches
of working mothers
1 17
5,000
(cumulative
since 1974-75)
j . Assistance to u i;- No. of organisations 56
sabled persons loi assisted (Cumulative
puicha.se/liltir.g of since.i 980-81)
aids and appliances,
20.9 Besides, some import an t schemes coming item the earlier Plan periods like N.Uional Institute of Social Defence, National Institute of Public Cooperation and Child Development, grants to the Central Social Welfare Board, grants to all-India voluntary organisations continue to be operated in the Cen- triui Sector.
20.10 Monitoring of the programme performance of the social welfare programmes so far has been in terms of financial achievements rather than on their physical performance. Emphasis has to be laid on the latter aspect as well.
CHAPTER 21
WOMEN AND DEVELOPMENT
The Chapter on 'Women and Development’ was introduced lor the first time in the Sixth Plan (1980— 85). fhe chapter deals with the efforts required in the different welfare and development sectors for women; no separate outlays and programmes were emisaged. The Plan recognised three sectors--education, employment and health— as of particular importance for formulating a strategy for women.
Education
21.2* In the field of education, under the programme for universalisation of elementary education, there has been a special drive for higher enrolment and retention of girls in schools. The enrolment of girls increased from 272.78 lakhs (64.9 per cent) in 1979- 80 to 281.18 lakhs (66.2 per cent) in 1980-81; 291.19 lakhs (70.3 per cent) in 1981-82 and 301.58 lakhs (72.4 per cent) in 1982-83 in Classes I— V. The target for 1983-84 is 319.60 lakhs (76.3 per cent). Similarly, for Classes V I— VIII, the enrolment of girls improved from 61.53 lakhs (26.0 per cent) in1979-80 to 65.68 lakhs (27.2 per cent) in 1980-81, 73.83 lakhs (31.0 per cent) in 1981-82 and 81.20 lakhs (33.7 per cent) in 1982-83. The target for1983-84 is 87.41 lakhs (35.8 per cent).
21.3 School-going girls are being provided in cen- ti\es like uniforms, free books, stationery and attendance scholarships.
21.4 To encourage Scheduled Caste and Scheduled Tribe girls to continue higher education., a centrally spjnsored scheme on 50:50 basis with the State Governments provides for construction of hostel facilities. The Central outlay has been as follows : —
(Rs. lakhs)
1 < 8 0 - 3 5 .............................................................. 1300
Ii80-St . . . . . . 265
1 C 8 1 - S 2 .............................................................. 390
1 <82-33 (Revised) . . . . . 325
1 <83-34 (Approved outlay) . . . 325
‘ figures in parenthesis represent enrolment ratios of the
corresponding population age-groups.
So far approximately 1000 hostels hav; been constructed. The rates of post-matric scholarships are a .so higher for girls belonging to Scheduled Castes aid Scheduled Tribes as compared to boys.
21.5 In training programmes like TRYSEM. seals hive been reserved in many States for girls.
Employment
21.6 A number of steps have been adopted by the Government to promote the employment of women. These include, inter-alia, expansion and diversification of education and training opportunities available for women and better implementation to ex is ling laws for provision of creches. The Ministry of Luboui has set up Advisory Committees in 20 States and Union Territories for creation of employment opportunities for women under the Equal Remuneration Act of 1976. The Ministry of Health and Family Welfare has sent guidelines to the State Governments for relaxation of the existing criteria in the selection of ANMs so as to facilitate local recruitment. Mahila ivlandals and other voluntary organisations lire being encouraged to take up socio-economic programmes for providing wage and self-employment. Efforts are made to offer a larger proportion of jobs to women in the schemes relating to the public distribution system, rural godowns, Operation Flood II, dairy development. social forestry and the armed forces. The reduction of the burden of household chores on women is among the aims of the schemes relating to development of low-cost, efficient fuels and delivery systems of such fuels, fodder and water supply. Special attention is being paid to these schemes. The revised 20-Point Programme envisages provision of potable water supply to all problem villages. Special forestry programmes for providing fuel and fodder have been undertaken in many States.
Health
21.7 The mother being a very important element: of society, the welfare of the mother and indirectly that of all women, is an essential component of the health sector. The health sector stresses the importance of ‘mother care’ in view of the prevailing socioeconomic conditions. Besides, importance is being given to the creation of employment opportunities for women in the health sector. These avenues are in the form of Female Health Guides, Health Workers (Females), Health Assistants (Female) and Lady Medical Officers at the primary health centre level. In urban areas, women are involved at every level in all fields related to health measures. Recently it has been decided that all health Guides should preferably be women in order to facilitate rapport with locai women for the improvement of their health.
21.8 The health sector has organised health services for the women under the package porgrsrme of Maternity and Child Health Care (MCH). EMm ioiliarv care of ante-natudal mothers, raising the immunisation

119
tutus of expectant mothers and provision of r.utii- Jii p-iackage to overcome nutritional deficiencies are .aom.'. the major programmes in the field of Mater
nity ;unci Child Health Care. Development of areas like nnother-craft, training in breast-feeding, underhand iing the growth and development pattern of the diildrren are some of the other programmes in the healthi sector aimed at women. Health insurance benefms is the form of maternity leave, diet supplements., vocational placements and Labour laws go- veminig the working hours and working conditions of wome.-n form part of the general welfare programme.
21. 9 The total number of MCH beneficiaries has increatsed from 68 million in 1981-82 to 74 million in 19>82-83. During the last three years the training intake; of female workers has increased from 5,012 (1979J-80) to 14,309 and Female Health Assistant from 1,062 (1979-80) to 1,558. Upto March, 1982,3.6 luikh dais have been trained including 1980-81 (76,2:15), 1981-82 (55,782).
Sodail Welfare
21. 10 The scheme of ‘condensed Courses of Edu- . a;iom for Audit Women’ aims at : (i) opening up new vistas of employment to a large number of needy womem ; and (ii) creating a band of competent uaine-d workers to man various developmental presets. Two-year condensed courses are organised to ■•RabUc U\c adult women v>ho ha\e some schooling to appeatr in middle]high school examinations. During1980-— 83, 2,876 courses are expected to have been organised. The other important scheme is the ‘socioeconomic programme’ under which voluntary organi- atioms are given grants-in-aid to organise a wide
varietty of income-generating projects for the benefit• of needy women. Nearly 2,331 units arc expected to
have been set up during 1980— 83. Grants-in aid are sdso being provided to voluntary organisations for tlhc constructionlexpansion of hostels for working womien. Five thousand creches are being maintained for t he children of working mothers, The scheme 'Functional Literacy for Adult Women' continued to function in the Integrated Child Development Services (ICDS) projects. Its operation would continue in
300 ICDS projects sanctioned upto 1981-82. Besides, ICDS, which offers a package of services to mothers and children, specially pregnant and nursing mothers, has been expanded to cover 620 blocks by 19H2-83. For the welfare of destitute women, training centres| institutes for the rehabilitation of women in distress are being set up through the voluntary organisations.
Scieace and Technology for Women
21.11. Another important area taken up with regard to developmental programmes for women is a scheme on “Science and Technology for Women”. The main objective of the scheme is to improve the life and status of women by the application of science and technology, by providing employment opportunities to them, reducing the element of drudgery in their lives and improving their health and environmental conditions. Another objective is to brine; about greater imblvcment of women in science and technology. Significant progress has been made in the implementation of the scheme, and mere than 40 projects have been sanctioned so far. Several integrated programmes for women have been taken up in ruraljtribal areas which include : identification of location-specific problems of women; demonstration and field trials of relevant technologies; and evaluation of the impact of the technologies introduced.
21.12 An All India Coordinated Project on Fuel and Cooking System is bein^ implemented by 12 research institutionsjvoluntary agencies. The results of this project will help women to ecQnomise the use of cooking fuel and reduce their drudgery, specially the harmful effect of smoke on their health conditions. Several skill training programmes have been supported to train women in areas such as spinning, weaving, safety match making, fabrication of solar stills, radio repair, biodynamic gardening, manufacture of PVC and leather goods, floral crafts etc. The States covered are : West Bengal, Maharashtra. Gujarat, Rajasthan, Himachal Pradesh, Uttar Pradesh, Tamil Nadu| Assam, Meghalaya, Haryana, Delhi (UT) and Kerala. Non-formal education programmes in .nutrition, health and sanitation and ~ dissemination of information through workshops and publications have also been supported.
CHAPTER 22
ENVIRONMENT
A new Department of Environment has been set up during the Sixth Plan period. The following are the main components that come under tiic auiaim--- trative control of the Department :
(i) Botanical Survey of India, Zoological Survey of India, National Committee on Environmental Planning, Environmental Research, Man and Biosphere Programme, Environmental Impact assessment. National Museum of Natural History (N.M.N.H.) earlier supported by the Department of Science and Technology.
(ii) Integrated eccdcvelopment research projects for Himalayas. Western Ghats and region along Ganga Basin pertaining to hill area development.
(iii) Hazardous Chemicals & Micro-organismsControl (recommended by the Science Advisory Committee to the Cabinet).
(iv) Public Health relating to operation of Prevention and Control of Water Act, Water Cess Act, Air Act and Central Board for Prevention and Control of Water Pollution.
(v) Work relating to Agriculture & other services pertaining to wild life preservation and protection of wild birds & animals.
Environment Planning and Coordination
22.2 Under the Environmental Research Programme important major schemes taken up include Heavy Metal Pollution, microbial degradation of industrial wastes, etc. Regarding the integrated eco- development programme for Himalayas, Western Ghats & Ganga basin guidelines 011 priority areas for action oriented research projects were prepared and discussed with the Vice Chancellors of the concerned Universities in the Western Ghats and the Himalayan Region. A similar exercise u being taken up in respect of the universities in the vicinity of the Ganga. An Environmental Information System (ENVIS) has been approved by the Gaverrment in 1982-83 under which a computer terminal and a mini computer is being installed in the Department bv the National Information Centre (N IC ). DOEN has started the work on computerised environmental information. With recard to Environmental Monitoring Organisation (EM O). a Technical Advisory Board and a cell for secretariat support is being created. An assessment with regard to the existing structure in the StatefUTs has been made and guidelines prepared for initiating environmental activities at the States! UTs level.
Eco-dcvelopment Programmes
22.3 Reports on three biosphere reserves viz. Nil- giri, Namdapha and Nanda Devi have been prepared. Project reports for the biosphere reserves at Gulf of Manner, North Islands of Andaman and Valley of Flowers are under preparation. An Eeo-development task force was created to work in Shivalik, U.P. in the area of afforestation and soil conservation. A simiar task force is planned to be deployed in Himachal Pradesh. Eco-deveiopment Camps have been organised in collaboration with NSS scheme of the Ministry of Education where thousands of students from various states have been involved for tree plantation and other afforestation programme. In addition, Universities as well as voluntary organisations have undertaken massive programme of tree plantations digging pits for manure, soil conservation, etc.
Environmental Education and Training
22.4 An Environmental Education Re earch and Training Centre has been set up at IISc, Bangalore; and proposals for other new centres are under consideration. The proposal for the establishment of a National Institute of Environmental Management is under active consideration. The Department has initiated several activities for creating environcental awareness thrdugh seminars, symposia, audiovisual presentations, popular lectures, etc.
22.5 The activities of BST and ZSI have now been oriented to cover survey of eco-systems, biosphere reserves data on endangered species, evaluation of economic plant resources for rural development and social forestry Several programmes have been initial B I like e ' bank a '? Natio a! Herbarium, Floristic resources in 100 selected districts etc. A 10 year review in respect of appendices on flora for the Convention on International Trade in Endangered Species of Flora and fauna (CITES) has been prepared. Faunistic survteys are being conducted by ZSI in important eco-systems like estuaries, coastal areas, mangreves hilly tracts of eastern ghats, selected high altitude, areas in Himalayan region, etc. Surveys of parasites and predators of major agricultu- ral;crops intensive faunistic surveys in NE States, status survevs of endangered and threatened birds and animals of Nanda Dfevi sanctuary, faunal component of the continental shelf, etc. are being initiated. National Museum of Natural History has undertaken various activities on non-forma] education on natural sciences for school children, teenagers, teachers, handicapped etc. Work on setting up a gallarv on Introduction Ecology has been completed, the design
120

121or thie Mobile Museum has been developed and unit ill b>e acquired soon.
!-tivinonmental Pollution Control (HUD) & Water<ector')
22.(6 The Air (Prevention & Control of Pollution) Act oif 1981 has been entrusted to the Central Board for thie Prevention and Control of Water Pollution. The nnain laboratory of the Board has acquired capability to measure toxic metals and special organic chemiicals like pesticides. The major thrtist of the laboratory will be in the area of special chemicals, ioxiciuy assessment including bioassa treatment, plan performance investigations, pilot plant studies tor small scale industries etc. Upgrading of the main laboratory for air quality measurements both for ambiemt as well as stack emission will be taken up. An imtegrated study of the Ganga Basin has been complleted and integrated River Basin Studies for the Brahnnputra, Indus & Narmada are proposed to be taken up. Comprehensive industry documentation and 1 the industry-specific national implementation programmes have been initiated in the area of sugar, ferine.1',ntation, fibre, oil refinery, caustic, chlorine, etc. Simikar programmes in the are:-* of Textiles, Fertilizers, Steel mills, etc. are being initiated. Two continuous moniUoring stations one for carbomonoxide nnd the other for sulphur dioxide have been installed in Delhi.
Environmental impact assessment of major power & industrial projects has continued,
Wild Life Preservation & Protection (Agriculture Sector)
22.7 The Wild life Institute of India was set up in 1982-83 for building up scientific knowledge on wildlife reserve, developing trained personnel, earring out research and providing information and advice on specific wild life management. The Institute has started functioning with the nucleous of its staff at FRI, Dehra Dun and a Board has been constituted to oversee the growth of the Institute. Assistance is being provided for development of national parks sancturies and selected zoos. In the tiger project, in addition to 11 existing tiger reserves, four more areas in West Bengal, Arunachal Pradesh, M. P., and A. P. are being taken up. The area under the scheme is expected to increase from 15,800 sq. km. to 25,000 sq. km.
22.8 The following table gives for the field of environment, the 1980-85 provision, act'ual expenditure in 1980-81 and 1981-82 and revised estimates for 1982-83 and plan outlay for 1983-84 under the S&T sector, HUD & Wafer supplv sector (Water & Air Pollution Control) and Wild life Preservation and Protection (Agriculture Sector).
T a b lf . 22.1
(Rs. crores)
F.nv/ironment 1980-85 1980-81 1981-82 1982-83 1983-84 1980-84
(Provisions) (Act.) (Act.) (RE) (B E ) (Expected
(i) S & T Sector . . . . 42.00* 1.71 3.52 5.14 9,50 19.87
(ii) Environmental Pollution Control
(H U D Sector) . . . . 12.00 1.33 2.23 2.15 2.50 8.21
(iii) Wildlife Preservation (Agri. Sector) 12.44 1.09 1.10 2.35 3.00 7.54
T o t a l . . . . 66.44 4.13 6.85 9.64 15.00 35.62
*Fxclnding Rs. 8 crores for Integrated Eco-development Programme for Himalayas, Western Chats & Ganga.
8 "PC'13— 17

CHAPTER 23
SCIENCE AND TECHNOLOGY
The Sixth Five Year Plan 1980-85 for Science and Technology envisages the development and implementation of several policies, as well as institutional measures to develop a sound base in science and technology, in competence and in skills and its ncreasing application to problems of national development. During the period 1980-83, the following institutional mechanisms have been created :
(1) A Cabinet Committee on Science and Technology has been formed to provide policy guidance for development of S and T efforts and to review the progress of efforts in the S and T sector.
(ii) A Science Advisory Committee to the Cabinet (SACC) was constitute in March, 1981.
(iii) A Science and Technology Entrepreneurship Board has been set up to promote entrepreneurship amongst S & T personnel to increase employment opportunities using avalible institutional finance.
(iv) A National Bio-technology Board has beenconstituted to take steps to achieve self- reliance in this newly emerging frontier area.
(v) A Commisson for Additional Sources ofEnrgy (CASE) was estabished in 1981 for formulation of policies, development and implementation of R and D projects and applications in the area of new and renewable energy sources. The Deparatment of Non-Con ventional Energy Sources (DNES) was established in September 1982 as a Department in the Ministry of Energy.
(vi) Department of Environment was set up inNovember, 1980.
(Vii) Department of Ocean Development (DOD) was set up in July, 1981 and is entrusted with planning and coordination of oceanographic research and development, setting up of research facilities, expeditions to Antarctica. dealing with the newly emerging area of ocean bed resources pertaining to polymetallic nodules etc.
23.2 An Ocean Policy was announced in Parliament in November 1982 which provides for optimum utilisation of ocean resources, acquisition of basic knowledge and development of appropriate technology, creation of an integral legal framework together with enforcement agencies and building up suitable manpower and skills.
23.3 A Technology policy statement, aimed at npid achievement of self-reliance, promoting indigenois S and T, aproprate adaptation of imported technolcgies and ensuring transfer of technology for efficient application of research results has been announced.
23.4 SACC has made several important recommendations. Mention may be made of populaiion stabilisation including new immunological approaches to fertility regulation; eradication and control of leprosy; import, distribution and usage of hazardous chemicals and micro-organism; strengthening of mathematical research in the country, amenities and :aci- lities for scientists. On the recommendation of SACC a special programme to support educational institutions in the country to build up their infrastructure capabilities for work S and T has been initiated. SACC also considered measures for greater involvement of women in S&T and special personnel ooli- cies for women scientists and technologists, developing excellence in selected areas of Science. in:pact and assessment of the Scientific Policy Resolution and thrust areas in Electronics.
23.5 A Status Report on Science and Technology for Women has been compiled and published. An Ail India Coordinated project on Fuel and Cooking systems to reduce drudgery of rural women has been formulated.
23.6 Two All India meetings of State Councils on Science and Technology were held for effective implementation of S and T programmes at State level. The programme is expected to pick up during; the coming years. Two expert Committees for S’ and T for Scheduled Castes and Scheruled Tribes and S and T for young scientists have been constituted.
A. Scientific Agencies
Atomic Energy (R&D)
23.7 The major outlay on S and T in the Sixth Plan is in relation to the Bhabha Atomic Research Centre (BARC) and the Reactor Research Centre (RRC). The major continuing projects of BARC pertain to the 100 MW Thermal Research Reactor (R-5 project), the New Engineering Halls and the Plutonium Recycling Project. R-5 is expected to be commissioned sometime in 1984 during this Plan period The main constraint in attaning criticality would be ava' lability of Heavy Water. All the on-going scheme' are expected to be completed except the P'utoniun Recycling Project; Phase II of the project is expect ed to spill over to the 7th Plan. Among major nev projects, mention may be made of the "deveiopmen and procurement of hot cel! equipment, modcn
122

| 2 3
Uea-.avy ion accelerator, and new and modern com- pututer system for R and D work. The medium heavy ion 11 accelerator facility at T1FR would consist of a ] 4 ;i million volt terminal, pclletron type of tandem ac- celeierator incorporating the most modem electrostatic ; accelerator technology. At the Reactor Research CenMitre (RRC), the Fast Breeder Test Reactor (FBTR) is e expected to be completed during 1984. The Vari- ablele Energy Cyclotron (VEC) has been commissioned at Calcutta as a national facility for advanced wonrk in nuclear physics and controlled d'rect irra- diatition of biological and agricultural products. Re- seanrch facilities are being set up for optimal utilisation-n of the cyclotron. Due to heavy pressure of work at ' Trombay, the Atomic Energy Commission have decscided to set up a Third R and D Centre at Indore.
Spaaicc Science and Technology2 23.8 The proiile for the activities of the Depart
m e n t for the decade 1980-90 was approved in July.19880 with lhe total 10-years outlay of Rs. 854 cioure.s. in December, 1980 the National Remote Sen:nsing Agency was transferred to the Department of I Space from the Deptt. of Science and Technology '. Amongst the on-going projects, APPLE, India’s firstst experimental geo-s’tationary 3 axis stabilised tele-e-communication satellite which was launched in Junne, 1981, continues to be operational. APPLE uulA’Saiion is being carried out by 1SRO and other usersr agencies. Bhaskara II, a remote sensing satellite e launched in 1981 from the USSR, also continueslo be operational. The second development version of 1 !ihe Satellite Launch Vehicle SLV (SLV-3-D-II) wasis successfully launched in April, 1983.
2 23.9 Three major projects, viz. the Indian Re- monte Sensing Satellite (IRS), Augmented Satellite Lauunch Vehicle (ASLV) and Polar Satellite Launch Vebhiele (PSLV) were approved in June, 1982. The IRRS will now be a 800 kg. satellite as against 600 kg.;, envisaged earlier. The data from IRS during its designed life of 3 years would be used for resource.' surrvey in agriculture, forestry, geology, hydrology andd meteorology. It is scheduled for launch in 1985-86 > from the USSR. ASLV is a follow up of SLV devvelopment programme whose main objective is to uppgrade SLV performance and increase its payload cappabiFty. The vehicle will have the capability of lauunching satellite of approx. 150 kg. in near earth orbbit. Some of the major components of the PSLV Miission would get proven with this vehicle; these in- cluude strap on technology, on-board computer and thee execution of yaw manoeuvres after launch. Thae launch vehicle is scheduled for first launch in 19984. The PSLV was earlier asessed to have initial cappability of placing a 600 kg. satellite in sunsynch- ronnous orbit. Due to increase in the weight of the Inddian Remote Sensing Satellite, the Polar Satellite Lauunch Vehicle has been designed to have the capab ility to launch satellites in the thousand kg. class. A preparatory Committee has been constituted with Meember (Science). Planning Commission as Chair- maan with the mandate to report on the mechanism antid modalities for the evolution of a National Natural* T>u sources Management System.
Deptt. of Science and Technology
23.10 Some of the major schees under implementation relate to Intensification of Research in High Priority Areas (1RHPA), Science and Engineering Research Council (SERC), Regional Sophisticated Instrumentation Centre and Integrated Facilities. Under IRHPA a major programme in plasma physics has been taken up at the Physical Research Laboratory, Ahmedabad. Similarly research in immunology has been taken up as high priority area with the setting up a National Institute of Immunology. Other high priority researches taken up for intensive support include the Centre for Study of Visceral Mechanism at the Patel Chest Institute, Delhi, partial support for the Indian Middle Atmosphere programme being coordinated by the Department of Space, a project on metallic glass, provision of a 200 KV National Electron Miscroscopic Facility at Banaras Hindu University, a 500 MHZ Fourier Transform Nuclear Magnetic Resonance Spectrometer (FTNMR) at TIFR, a multi-agency project for study of seismicity and seismotectonics of the Himalayan Region etc. Major emphasis under SERC is being given in promoting front-line carefully selected areas. A comprehensive research programme on Genetic Engineering covering both the basic and applied aspects have been initiated. Thrust areas in Chemical, Engineering and Physical Sciences have been finalised. Four Regional Sophisticated Instrumentation Centres at Calcutta, Lucknow, Madras and Bombay have already been ,set up for providing expensive and sophisticated research equipmentjinstruments to scientific workers. Three new Regional Centres for the same purpose have also been set up at Chandigarh. Nagpur, Shillong and action is in progress to provide the initial complement of research equipment at these Centres. The instrument development programme is meant for indigenous development of sophisticated instruments required for scientific and technological work. The work on the second phase of 'the project is expected to be completed in the present plan period. The_ first phase of the Resin project involving 9 institutions was completed under newer fibres and com posite programme. The second phase of this project with UNDP assistance has been initiated. Several new programmes have been initiated : to promote scientific interest in various spheres like State S and T Councils, S and T for Youth, Women. Scheduled Castes|Scheduled Tribes etc. Arising from these efforts, 22 States and 8 Union Territories have formulated programmes for establishment of State Committees: Councils on S and T.
Council of Scientific and Industrial Research
23.11 The various laboratories are classified under six categories, viz. Physical and Earth Sciences, Chemical Sciences, Biological Sciences, Engineering Sciences, Information Sciences and Industrial Re^ search Associations. To enable internal laboraton inter-institutional approach, R and D programmes have been grouped under 26 areas of research, Amongst the important on-going programmes to re eeive sustained support are cellular and molecular

m
biology, collagen and bio-polymers, catalysis, photo chemistry, computerisation, process design and simulation design, tissue culture and polymer technology. New computer facilities are proposed to be added at some ot ihe national laboratories like 8ERC, Roorkce, Madras, NAL etc. Multi-disciplinary and multi-agency projects are being formulated jointly with other agencies like Department of Steel, Deptt. of Ocean Development, Department of Electronics, Department of Coal etc. In these programmes the exis'Lng investments of CS1R laboratories would be utilised along with the expertise and facili't.es available with the concerned collaborating agencies towards solution of major tasks defined under a project. The multiagency projects of relevance to steel sector so far identified pertain to conservation of coking coal, raw material beneficiation and agglomeration, conservation of energy, new high valued steel alloys, alternative process for steel making refractories, corrosion resistant materials for tribology. Major programme in the area of electronics so far identified pertain to development of semi conductor devices, process control instrumentation, vacuum tubes thyristor inverter for railways fibre optics, electronics and electronic materials. Similarly in the area of oceanography, a long term plan has been evolved relating to exploration of sea bed minerals, minerals under shallow waters, living resources, training centre as well as an Institute ior Shipping and Occan Engineering Research.
Department of Ocean Development
23.12 DOD has acquired through a grant-cum- loan scheme from the FRG an oceanographic research vessel, “Sagar Kanya” meant for scientific research in the fields of geology, geophysical sciences, oceanography, mateorology etc. The ship has been delivered recently. DOD will carry out cruise planning in consultation with various agencies. The acquisition of a fisheries and oceanographic research vessel (FORV) is another continuing scheme. The ship is being acquired from Denmark. The ship is likely to be delivered in November, 1984 and this will be used for carrying out research in the field of living resources, leca'tion of fish resources etc. Among the new major programmes of the Department, mention may be made of the Antarctica Expedition and Polymetallic Nodules Programme. Two successful expedition to Antarctica were undertaken during 1981-82 and1982-83. The Department envisages two or three such expeditions annually from 1983-84 onwards. Antarctica Study would be a continuing one and the Department envisages to set up a permanent and seasonally manned station at Antarctica, and for servicing the station, the Department proposes to acquire an ice breaker. An Antarctica Study Centre is proposed to be set up consisting of scientific technical and logistic personnel. The polymetallic nodules programme envisages survey, exploration, collecuon, laboratory investisations of marine mineral resources and feasibility studies for their commercial exploitation. India has been recognised as a pioneer investor by the Third UN Conference on the Laws of the Seas in April, 1982. The programme would be sharpened in the coming years by wav of detailed ex
ploration and collection cf nodules. The DOD is currently engaged on developing a Decade proiilt on various aspects of development and its related programmes.
National Tent House
23.13 During 1980-83 a number of sophistiiated equipments have been purchased and four new Divisions, viz. Agro Chemicals, Metrology, Rubber and Plastics, Electronics were created. Part II oj the UNDP Project relating to augmentation of te;ting facilities at NTH is expected to be operational during 1983-84. Other programmes include introdu:ticn of new areas for testing and calibration, organisition of training cells, maintenance of bettter liaison with industry and building and construction worts at Bombay, Ghaziabad and Madras.
Environment
23.14 Please see the Chapter on Enviroiimeit.
B. S. & T Component under Depits {Ministries
Agriculture, Animal Husbandry & Fisheries
23.15 The main S and T thrust in the fled ot crop production has been on varietal improvement and development of new technologies to diversify agricultural production. Several improved varieties of rice were recommended for release specifically for(i) upland, midland and low land situtaion; (ii.i resistance to gall-ridge, brown plant hopper, lungo virus etc. An early maturing rice variety suitafcb for flood prone areas of Assam and a variety for saline area were also major releases. Several disease resistant varieties of wheat were developed. Unde: theoil seeds programe about 30 improved varieties of ground nut were released for various parts o: the country; several other varieties of oil seeds like Se- samum, safflower etc. have also been developed and released. Several varieties like sorghum, cauliflower, potato etc. were also identified[developed. In diy i'and agriculture. : 'table crop production technology for the rainfed a as has been developed. Number of infer cropping sysicms have also been tested at different research centres.
23.16 In the field of animal sciences high priority has been given to the conservaiion of important indigenous livestock resources, their multiplication and improvement through selection.. An Indian Mohair breed was developed in Maharashtra through grading of local goats and angora. A few broiler strains were also recommended for release and commercial exploitation. A number of strains of rabbits introduced irom USSR and the U.K. for meat, fur and skin products gave highfy satisfactory performance. A significant break-through was achieved in artificial breeding and rearing of Pearl oyster and in breeding the commercially important tiger prawn and white prawn. Under the Agricultural education programme, a University is being set up in J&K. In addition to the 19 Krishi Vigyan Kendras and 7 Trainer’s Training Centres in the country, 45 new Krishi Vigyan Kendras and 1 new Trainers Training Centre have been approved for establishment during the plan period. Human re-
121,ourcce-s development in backward areas has been con- 'inuecd through grant of scholarships to selected con- ..iidatuess from SC|ST. In addition to the existing Ad~ vance:edl Centres for post-Graduatc Research, seven moree mew centres were sancdoned in various disciplines and are to be established soon with UNDP as- istannc:e. Communication Centres have been esablish-
..:d fifort dissemination of improved technologies in cereaalsi, pulses and oil seed crops using modern me- thodsls of communication, training of extension of workers . etc. The transfer of technology programme throuugflr laboratories to land. National demonstration and ojpera'tions research projects have ben oriented to provvidle proper emphasis on dry land farming, oil seed and ■ piulse production. The lab. to i'and programme has been i (expanded to cover additional 25,000 families, repreeskennng small and marginal fanners of dry land; rainiiiecd areas. Assistance is also being provided foi the £ establishment, of pilot projects for Research Centre on L Dry Land Agriculture and for preparation of field manuuails for oilseeds, pukes and dry farming.
i-oood
-23. 17 S&T programmes pertaining to rood arc unde.cruaken in National Sugar institute (NS1), Kanpur ana iindian Grain Storage institute (iG si) Hapur. auniiie or me major R & D programmes initiated by NSII imclude manufacture of lacJic acid from waste nidl&as^es by chemical means, maniuacturc oi yeast usinng sugar cane molasses and production of High Fraccuose-Glucose Syrup by chemical means. In addition,!, istudies on treatment of effluents and specifying polhiubion tolerance limits have been initiated. Some of the achievements of iGSI are fabrication of 10 bins of cdiliferent capacities, design of 2 metal bins and 2 non-i-mietal storage structure, development of a simple dcsipgm of grain dryer etc. In addition, several audio- visuual aids like exhibition sets, posters and slides were preppaiixd for demonstration, number of samples of gran ins* were tested for insecticidesjpesticides etc.
r or>res;try
223..18 The Forest Research Institute & Colleges at Dehhnadun with its regional branches and field centres conntimued to be the main centre for carrying out researrclh in forestry and forest products. Some of the imppojrtant works undertaken include provennes trials withh regard to natural and exotic specks, intensive management of production forest, fuel and energy plantation, biomass tree breeding; completion of Vol. V < of' Indian Wood on structure, identification and prooperties of 134 tree species; setting up of a National Forresst Computer Centre etc. Some of the important propgrammes like forest fire protection research, forest prooduiclivity, physological studies of logging operations etc.-. ;are in progress. Several important programmes woiiuld be initiated like Establishment of Electron Mic- rosccoipe Laboratory, Design and Development of con- tairneir from wood products, studies on sheet forma- liorm of paper efc. The Science Advisory Committee to t tine Cabinet has reviewed the research support needed for Forestry through a Task Force. The recom- meiinalations of SACC would be taken into account v-'li’iilo forimikitiiii: the Seventh Five Year Plan,
Irrigation
23.19 Research Projects in the Irrigation Sector are taken up by the Central Water and Fewer Research Station, Poona, Central Soil and Materials Research Station, New Delhi, National institute of Hydrology and Central Board of Irrigation ard Power. Of these the National Institute of Hydrology is still in a formative stage. The progress of research projects under the CW&PRS, Poona and CS&MRS, New Delhi has been slow for various reasons such as preparation of poqects for external aid, iccruitmcrt of staff, buying of equipment etc. The progress of research projects sponsored by the Central Board of Irrigation and Power has been satisfactory.
23.20 The major activities oi the General Water and Power Research Station are modelling, testing, basic research, and evolution of economic designs for ensuring safety and operational edicieney of river valley projects at their conception stage. Ti;c present applied and fundamental research activities are mainly centred around the disciplines of river engineering, reservoir and appurtenant structures, coastal and onshore engineering, ship hydro-dynamic.-, hydraulic machinery, stratified flows, foundations and structures, mathematical modelling and instrumentation.
23.21 The Central Soil and Materials Research Station has been conducting basic and applied research and providing advrce in the lie id of geo-meclian- ics and construction materials. The research station also renders consultancy services to various Departments' of the Central and State Governments, Electricity Boards, public sector undertakings etc. Field and laboratory investigations as also studies were carried out on 25 projects in soil' mechanics, and foundation engineering, 19 projects in rock mechanics, 24 projects in concrete technology, 10 projects ia ehemistary and sediment. Officers of the researcn station received advance technology training abroad in the field of concrete, rock fill and rock mechanics under the UNDP assistance.
23.22 The National Institute of Hydrology has identified the following 8 priority areas for research :
(i) hydrologic analysis, of stream flows in a basin;
(ii) water balance of river basins;
(iii) water shed models including those fer snow- fed basins and basins with limited data;
(iv) • method of operation of a system and reservoirs for multi-purpose use Tike irrigation, flood control and power:
(v) evolution of mathematical model for stormprecipitation for flood estimation;
(vi) evolution of methodologies for Hood estimation, forecasting and control:
(vii) methodology for ground water estimation and development; and
(viii) study of extreme storm: and floods and their implication in hvdroloeic synthesis.
The institute inis so iar earned out review oi literature. implementation and testing of computer programmes, collection of data, training of scientists, implementation in consultancy research projects for ground water modelling studies and Narmada Basin Flood studies.
23.23 The Central Board of irrigation and Power has sponsored research studies on the following major topics i.e. water studies and hydrology, hydraulics, irrigation drainage and reclamation, Hood control and river training, coastal engineering, tidal hydraulics, etc. Work on 22 projects was completed in 1981-82 and a no Che i 30 projects viere expected to be completed during 1982-83. Work would be continued on 60 on-going research projects in the current year.
Meterology
23.24 Under the India Met. Deptt. complete Meteorological Data Utilisation equipment was installed and the first cloud cover picture of earth was received from INSAT-IA satellite. Cyclone Warning Radars have been installed at Karaikal (Tamil Nadu). Design fabrication and supply of special instruments for the measurement of temperature, humidity, surface ozone etc. to the Second Indian Antarctica Expedition was undertaken. An equipment was installed at New Delhi for the reception of high resoluiion cloud pictures from TIROS-N series of polar oribiting satellite of the USA. The Indian Institute of Astrophysics completed fabrication of the major part of the components for the 234 cm optical telescope to be installed at Kavalur. A new fast photo electric recording system was designed and constructed Meteorological rocket pay loads were successfully flight tested for air worthiness upto 48 KM by the Indian Institute of Tropical Meteorology.
Industry and Minerals
23.25 The pace ot’ in-house research and development activities at the larger public sector undertakings has picked up. Many of these organisations now have fullfledged research anti development centres. Activities relating to upgradation of existing technologies are also in progress. Among some of the achievements mention may be made of the absorption of technology relating to the equipment for 210 and 500 MW power plants, fluidised bed boilers for utilising fow grade coals and improved combustion equipment all by BHEL, newer types of machine tools by HMT and CMTI, work in the field cf photovoltaies by BHEL and CEL etc. An important centre for development in welding processes has been established at Tiruchira- palli. A multi-institutional development project of importance for the future will be the High Voltage Direct Current Programme. In the area of electronics the country has' taken an importaut step in microelectronics with the commissioning of the semi-conductor complex. The base in the electronics industry has grown in the last few years at Chandigarh. Tire thrust areas in electronics for the future have been identified and specific proposals are being formulated welf in time for the Seventh Plan. These ielate to communications, power electronics, computers and information systems, fibre optic4, controls and special materials.
23.26 in conventional industries like textiles, jite, medium size electrical equipment and automobies, cooperative research organisations of the industry ike ATIRA, IJ1RA, ERDA, ARA I etc. have been actve.
23.27 An area identified for intensifying our efbrt is that relating to production engineering and appropriate automation.
23.28 The space programme has ensured incnas- ing participation of domestic industry by way of components and sub-systems of very high quality and reliability. The organisation has set up a consultaicy division to facilitate technology transfer to industr/.
23.29 Among the more important facilities cor research and development coming up at present m o tion may be made of the facilities for fertilizer te:h- nology and those of EIL, ONGC and HIL,
23.30 To improve linkage between the natioial laboratories and the larger public sector manufacturing enterprises, coordinating groups have been set up for reviewing progress of joint development projects.
23.31 The major programme taken up at IPCL’s R&D centre relates to the area of polymerisation which has helped in improving operational efficiency ot the plants. This centre will also take up programmes for different products like butyl rubber, r.ew polymer etc.
23.32 The chemical industry units like HOC have set up facilities for pilot plants for scale up studies, facilities for testing various catalysts, high pressure, hydrogenation etc. Among important processes deve- lopmed mention may be made of aniline regeneration catalyst, butenediol etc.
Steel
23.33 Research and Development activities in the steel sector have been largely concentrated on increased productivity in the steel plants, introducing new products and reducing cost of production. A number of projects have been taken to the stage of industrial application and for commercial upscaling. In the area of coal and coke encouraging resujts were attained in projects or. bcneficiation of coal, upgrading of washcry fines of Durgapur Steel Plant, indentifica- tion of optimum coal blends for Bhilai Steel Plant, and study on the possibilities of extraction of new coal chemicals cokeoven gases in Bhilai Steel Plan. These projects were designed to reduce consumption oE coal and improve productivity. In the area of raw materials and iron making, the production and use of superfluxed sinter composite, which has been used in L. D. converter as a partial substitute for lime and scrap, has been successfully de> eloped both at Rourkela and Bokaro Steel Plants. A demonstration plant to inject 4 tonnes of time dust per hour through tuyeres of blast furnace at the Durgapur Steel Plant is being set up following the success achieved at pilot plant stage in Kaiinga Iren Works, Barbil. Similarly encouraged bv the successful trend of trial results on

*27
xteri crnal desiliconisationj desulphurisation of hot nctaltal at Durgaphr Steel Plant, Bhilai Steel Plant is ■xpecoected to fry the technology soon. Productivity
• if bl; blast furance has been improved by adopting better ter techniques. Technology of producing high basic -sic sinter has been developed and tested at Bhilai Steel el Plant which has shown an increase in the pro- luctivctivity of Blast furnnce,
23 23.34 A project on oxygen-assisted electric are Uirancance of the Alloy Steel Plant has indicated reduction hi in power consumption by 60 KWHjt of liquid tecl cl and reduction in melt-down time by three
minumutes. Similarly a project for improvement in dephcphosphorisation, in 10 tonne electric arc furnace of A1 Alloy Steel Plant has been successfully completed. This 'is will enable production of low phosphorous steel.
23 23.35 RDCIS has successfully designed a cooling <yster>tem for the wire rod mill of Bhilai Steel Plant whichich reduces the scale loss by 2 per cent and also Hangings down the temperature from. 1000° to 850° eentijntigrade in 0.1 second.
23 23.36 In the area of product development, a mumber cr of projects have been successfully completed, rhesnesc are micro alloyed steel plantcs with sulphide 'haptape control for improved transvers ductility in Bhilatilai Steel Plant. With the introduction of the de- sulphlpliurisation at Rourkela Steel Plant production of high gh strength and high shelf energy pipeline steel for transnnsportation of oil and gas would be possible. Efforts tre be being made to produce extra deep drawing quality steel ;el for automobile application on the basis of the succcccessful development of boron-treated deep drawing steel :e1 in the country.
Yfindines and Minerals
22 23.37 During the Sixth Plan period 58 schemes wereere taken up: Geological Survey of India (11), Indiadian Bureau of Mines (7), Mineral Exploration Corporporation (3), Bharat Aluminium (2), Bharat Gold old Mines Ltd. (7), Hindustan Coper Ltd. (13), Hindindustan Zinc Ltd. (6), Indian School of Mines (4),4), Central Mining Research Station (2), Benaras Hindindu Univtersty (1), Indian Institute of Metals (1), and nd RRL, Bhubaneswar (1). These schemes related to application of goe-chemistry and geo-physics for rapiapid exploration as well as determination of depth contontinuity of ore deposits, faster drilling of holes, rapiapid development of mine openings, mine supports, groiround movement warning in mines, augmentation of if mineral beneficiation capability, establishment of benceneficiation and metallurgical techniques for improving ing the mineral and metal products and recovery of af associated minerals and metals, recovery of metal valualues from oceanic nodules and gold mine tailings (go!gold), application of leaching techniques for metal extrxtraction, and so on.
2 23.38 Most of these schemes have been success- full'ully completed and results adopted for regular pra- ctic-tice viz., recovery of tungsten mineral from tailings andtnd run-of-mine ore in the Bharat Gold Mines, re- cov'overv of selenium, tellurium, silver, gold in the
copper smelter plant, extraction cobalt from copper converter slag; long hole raising in mines: modification of steel supports for greater stability of mine openings: micro-seismic warning system in deep gold mines; etc. Semi-commercial pilot plant for beneficiation of low grade rock-phosphate has been set up in Rajasthan based on the process flow-sheet prepared by the Indian Bureau of Mines and detailed engineering provided by Engineers India Ltd. Successful refractory bricks, have been manufactured by Central Glass and Cermic Research Institute based on beneficiated kyanite concentrate produced in laboratory of Indian Bureau of Mines. High grade China clay from inferior grade feed has been produced in the Indian School of Mines on the samples from Ptirulia deposits.
23.39 Computerised data processing systems for mineral resources, their potential and evaluation and mineral productions as well as on rock mechanics have been initiated through suitable R&D schemes.
23.40 Research Studies conducted through the schemes of Mineral Development Board have established the possibility of using intered manganese ore fines for manufacturing of ferro-managanese ferromanganese slak as a carrier of managanese in replacement of direct manganese ore in the Blast furnace: the overburden of chronv.V; mires contains small quantities of nickel which could be concentrated by simple screening: chromite fines could be agglomerated and used for charge-chromc manufacture. The introduction of Inred process of iron making is under negotiation with a Swedish Company and samples are being sent for use of K.R. process (F.R. Germany) in iron making A few more schemes on conservation of minerals are under finalisation.
ELECTRONICS
23.41 The items which have already gone for production bv funding under the auspices of the Technology Development Council of the Deptt. of Electronics include specialised electronic materials, cock-pit voice recorders, solid state oscilloscope, defence grade passive components, UHF and microwave communication equipment etc. User evaluation and flight trials of Air route Surveillance Radar and user evaluation of precision approach radar taken ud under the auspices of the National Radar Council have been completed. Electronic Reserch & Development is carried out under the auspices of DOE, DAE, DOS, Ministry of Communication, Ministry of Defence and the Ministry of Education.
Energy
Petroleum
23.42 The Institute of Drilling Technology (IDT) has carried out a number of programmes in the area of development of drilling, techniques and technologies, viz. studies of the methods to imporve the effectiveness of oil spotting, chemical analysis of resinex and svnthesis of an equivalent chemical TDEX, preparation of oil well cement, development of turbulance inducers and high temperature retarders
t'ron; indigenous sources, and designing of mud systems for high temperature wells etc. The R&D projects handled by the Institute of Reservoir Studies (IRS) encompass the preparation of development plans and performance, analysis of oil and gas fields, selection and optimisation of enhanced oil recovery techniques; simulation studies of poor oil producers; calculation of artificial lift design parameters for weak producers and evolving suitable chemical treatment for field diluent disposal ctc. Experimental facilities are being rct up for Naphtha cracking. Delayed coker pilot plant is being established. Setting up of an R&D centre at Gurgacn of E IL has been recently approved. The R & D centre of the Indian Oil Corporation at Faridabad has developed a high efficiency Kerosene wick stove and LPG burner for domestic purposes. A Research & Development Laboratory has been ret in by Lubrizol Tndia Ltd. Feasibility report, for an Engine testing laboratory for the R&D centre was approved in 1982 and it is expected to be commissioned by 1985-86.
Coal
23.43 About 86 R&D schemes have been identified in the field of exploration, exploitation, beneficiation and utilisation of coal; of these 25 have been completed. The -'alicnt features of the results of investigations under the. R&T) r-voiects so for cx.npktsj are: declassification in one of the highly gassy seams was completed, and t e seam which has been abandoned is now being worked; strata investigations have resulted in predicting the roof behaviour in longwall faces: technology for inert gas infusion in fire areas has been established. A project on Hydraulic Mining with the assistance from FRG has been taken up. The trial of hydraulic mining is expected to start by this year end.
Power
23.44 Expert technical consultancy services from France was obtained for the Project “Establishment of 200 MVA High power testing station with synthetic testing facility”. Work on the feasibility studies has commenced. The Central Board of Irrigation and Power has taken up a project to identify problems faced in the State Electricity Boards and other utilities in providing uninterrupted power supply, satisfactory condition of voltage and frequency in the design, construction, operation and maintenance of power systems and to carry out systematic field studies to pin-point the problems and evolve suitable remedies. R&D work on High Voltage D.C. technology and Low calorific Value F\iel auxiliary injection in power boilers have been initiated.
Renewable Energy Sources
23.45 For details please see Chapter on “Energy”.
Telecommunication
23.46 Under Tndian Telephone Industries (ITI)4 CfTZ 1800 channel System has been cleared for field trials. 2.6 MHZ high reliability version, 12 MHZ 270 channel coaxial system, 24 channel UFT have been cleared for production and Engineering
model of fibre optics 8 MbilS system completed. A new’ version for a 3-channel open wire carrier system, a main stay of rural communication network in the country has been designed and cleared for production. A multi-channel VHF radio system which provides 7 spcech channels and 5 teleprinter channels has been developed. Prototype design of mcdirn eliminator, modernsplitter, circuit design of short haul Modem and Partial circuit design of 4800 BPS Modem transmitter have been completed by Hindustan Teleprinter. Telecommunication Research Centre has developed 12 VHZ Coaxial line terminals end dependent repeaters, group translating equipment fCP-7), PCM 30 channel multiplex, data modem 600|1200 BPS (Mark I I) , span line test Set, Digital Error Detector, PCM MUX Tester.
23.47 In addition to the above a great deal of telecommunication research is carried out under the Deptt. of Space and in the Ministry of Defence.
Education
23.48 The constraints and limitations in the present S&T efforts in respect of Science Teaching and Research in the University system are well-known. In the long term, these would hamper the growth of properly developed manpower intuits for the national S & T activities. In order to initiate corrective action and to ensure critical mini mu potential for growth, it is proposed to support selectively with some central grants-in-aid, some of the educationl institutions in well identified areas as recommended by Science Advisory Committee to the Cabinet (SACC) to build their infrastructural capabilities. A proivsion of Rs. 5 crores has been made for this purpose in the Central Plan 1983-84 of Education Sector; the programme would be undertaken on the gdvice of the SACC through the University Grants Commission where a special cell will be set up to provide the necessary supporting services. Financial support is made available by UGC and Ministry of Education to faculty members in the universities, University Centres for post-graduate studies, IIT’s to enable them to take up well defined research projects in pure and applied sciences as well as engineering and technological subjects. The research projects are basic and fundemen- tal in nature or of an applied nature related to the national R & D effort or in newer fields and inter disciplinary' areas of importance. In addition grants are also given by CSTR, Deptt. of Space, Deptt. of Atomic Energy and DST.
Health
23.4-9 A modified research strategy and plan of action have been developed in the area of medical research. Mention may be made of the Task Force approach, net work cf Regional Medical Research Centres, Integrated Research Information Systems etc. The allocation (Plan and Non-Plan) of ICMR has been stepped up from Rs. 10.4 crores in the Fourth Plan and Rs. 2.0 crores i^'the Fifth Plan to Rs. 65.00 crores in the Sixth Plan. Some of the major achievements are : development of methods for the biological control of disease transmitting insects, demonstration of an integrated control, including environ
129
mental control, for iilariasis and malaria, setting up i ; Toxicological Evaluation Committee for assessing iv',0 experimental leprosy vaccines developed by Can- xr Research Institute Bombay and AilMS, Ne w Delhi;
based on multi-centric studies, recommendation has been made lor large scale indigenous production anc U'c of Isaptent in India; setting up of National Can- c - Registry involving three hospital based registries and three population based registries; development of ;; comprehensive low cost technolog) for the mas? production of colour transparencies by Institute of Pathology, numerous studies for testing safety and effectiveness of long-acting injectable contraceptive etc. Two Regional Medical Research Centres have H'cn. established at Bhubaneswar and Port Blair to undertake research on regional health problems. A nc! work of 22 Human Reproduction Research Centre has been established in different part of the coun
try to work in close collaboration with the medical colleges to carry out clinical research on new and emerging contraceptive technology.
Outlays for S & T
23.50 A total picture of the S & T outlay, (both Plan and Non-Plan) under the S & T agencies (as presently defined) and Ministries tor the period 1980-83 year-wise is presented in the Annexure. From the Annexure it could be seen that in the case of the agencies, against a Plan outlay of Rs. 867.15 crores, the expected plan expenditure during 1980-84 N Rs. 678.95 crores (Eq. 78.2 per cent) whilst for the M.-jvstric' Departments the expected plan expenditure is Rs. 718.81 crores only against a Sixth Plan :uitla\ of R i, 1096.36 crores {Eq. 65.5 per cent).

A N N E X U R E 23.1
Mid-term Appraisal of Sixth Five Year Plan (1980-85)-- Progress o f S & T ExpcndUwclOutlays(Rs. crores)
Si. Department 1.980-85 1980-81 (Act.) 198l-S2(Act.)
N o .Plan Non-Plan Plan Non-plan Plan Non-Phn
'] 2 3 4 6 7 <
A . S & T Sector Agencies
!. A tom ic Energy (R & D ) 248.98 284.59 24.02 47.29 32.97 55 64
2. Space (S & T ) 245.80 146.92 28 5^ 29.29 46.16 29 53
3. D S T ............................................92.87 189.55 10.36 ' 1 24 14.41 31.24
4. Environment (S & T) . 42.00* 13.12 1.71 2.70 3.52 4 01
5. C S 1 R ..............................................189. 00(T) 245.61 28.10 39. 30 37.54 48 18
6 . Ocean Dev. • • 40.00 0 . 0 2 8.34 0 04
7. N ationa l Test House . 8 .50 3. ( j 0.43 0.71 0 . 6 8 0.82
S ub-To t a l ‘A ’ 867.15 883.35 93. 19 150.53 143.62 16). 46
B. Sectors— Agriculture & Irrigation
8 . IC A R ■340.00 190.00 42.31 34.00 47.92 38.37
9. F R I .......................................................1 2 . 0 0 1 . 2 2 1.51
10. I r r ig a t i o n ............................................20.45 14 .0 ) 1.52 2 .60 1 .64 2.77
] 1 . F ood .8 . 1 0 -.30 0.39 0.5-1 0.65 C. 69
12. 1M D & Institutes45.00 73.00 8.30 13.16 9.57 U. 37
T otal : Agriculture & Irrigation . 425.55 280.30 53.74 50.30 61.29 5C.20
Industries
13. Heavy Industry .57.51 1 0 0 . 0 0 6 . 2 2 22.42 6.54 2 :. 53
14. Industrial Development 1 8 . SOf 1 0 .00 4.17 0.51 4 '■ 8 ( .5 0
15. Commerce .3 2 .40(R) 7.20 4.87 1.38 4.74 1.33
16. Steel . ■ • • • ■7 9 .85(P) 5.50 10.34
17. Mines .16.16 ! .90 S .64
18. Chern. & Fert.26.03 3.50 0 .70 O.&O 3.79 0.70
19. Electronics32.34 3.00 3.86 0.49 5.49
Total— I ndustries 263.09 123.70 27.22 25.-10 37.22 2 :'. 06
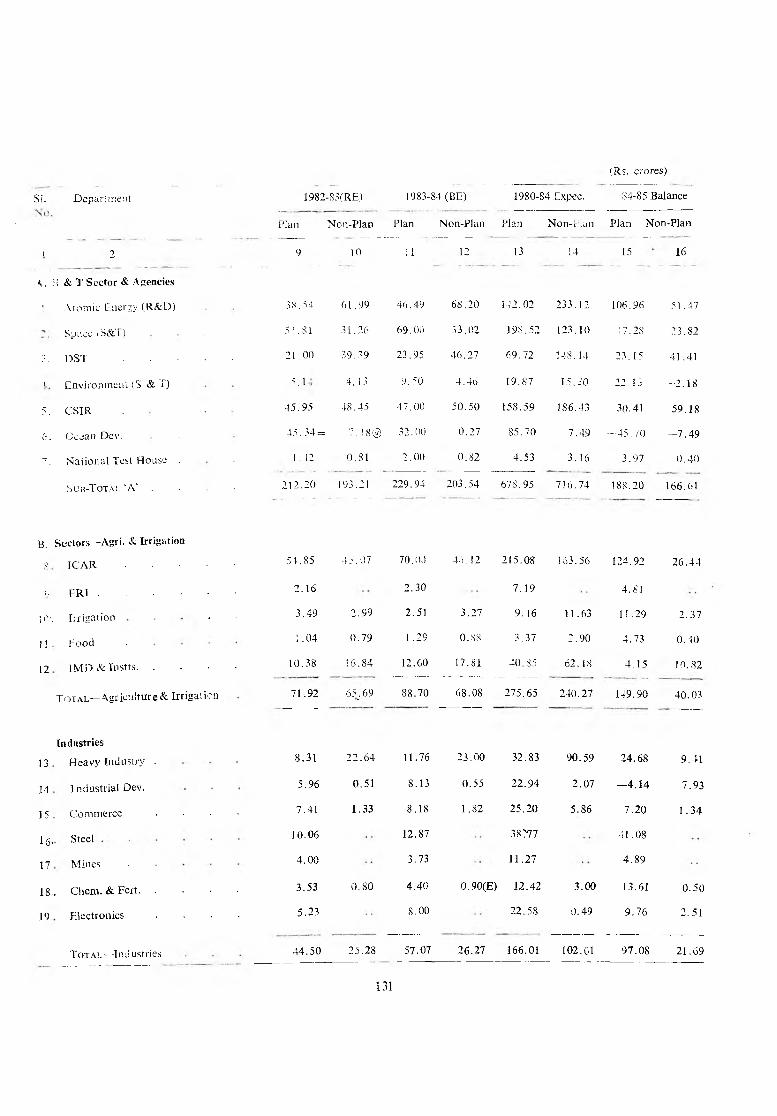
(Rs. crores)
Sf. Department 1982-S3CRE) 1983-84 (BE) 1980-84 Expec. 84-85 Balance
Plan Non-Plan Plan Non-Plan Plan Non-Pian Plan Non-Plan
i 2 9 10 i 1 12 13 14 15 16
A. S & T Sector & Agencies
! Atomic Energy (R&O) 38. 54 61.99 46.49 68.20 142.02 233.12 106.96 51 .47
Space tS & l) 54.81 31.26 69.00 33.02 198.52 123.10 47.28 23.82
j . DST . . . . . 21 00 39.39 23.95 46.27 69.72 148.14 23.15 41.41
i Environment (S & T) 5. I 4.13 9.50 4.46 19.87 15.30 22. 13 -2.18
5. CS1R . ■ 45.95 48.45 47.00 50.50 158.59 186.43 30.41 59.18
C . Ocean Dev. 45.34 = 7. !S@ 32.00 0.27 85.70 7.49 —45.70 —7.49
7 _ National Test House . ! .42 0.81 2.00 0.82 4.53 3.16 3.97 0.40
Sub-Totai. 'A ' . . ■ 212.20 193.21 229.94 203.54 678.95 716.74 188.20 166.61
B. Sectors—Agri. & Irrigation
y I C A R .........................................54.85 4 5.07 70.00 46. 12 215.08 !63.56 124.92 26.44
(. . E R T ...................................................2.16 2.30 7.19 4.81
!C-. Irrigation • 3.49 2.99 2.51 3.27 9 .16 11.63 11.29 2.37
!! Food . 1 .04 0.79 1 .29 0.88 3.37 2.90 4.73 0.40
12 1MD & Instts..................................... 10.38 16.84 12.60 17.81 40.85 62.18 4.15 10.82
T o t a l — Agriculture & Irrigation 71.92 65_.69 88.70 68.08 275.65 240.27 149.90 40.03
Industries
13 Heavy Industry . 8.31 22.64 11.76 23.00 32.83 90.59 24.68 9.41
14 I ndustrial Dev. 5.96 0.51 8.13 0.55 22.94 2.07 —4.14 7.93
15 Commerce . . . . 7.41 1.33 8.18 1.82 25.20 5.86 7.20 1.34
16. Steel 10.06 12.87 38^77 41.08
17 Mines . 4.00 3.73 11.27 4.89
18. . Chem. & Fert..................................... 3.53 0.80 4.40 0.90(E) 12.42 3.00 13.61 0.50
19 Electronics . . . . 5.23 S. 00 22.58 0.49 9.76 2.51
T o t a l — Industries 44.50 25.28 57.07 26.27 166.01 102.01 97.08 21.69
131

No.
i :
Energy
20. Power . . . .
21. Coal . . . .
22. Petroleum
23. New Lnert:;. S . 'u n .o .
Total Energy .
Transport & Oommimica lions
24. Communications
25. Information & Broadcasting
26. Shipping & Tpt. .
27. TCA--R& D Dtc.
28. Railways . . . .
To t al— Tpt. & Communications
Social Services
29. Mousing & Consts. Tech.
30. Labour . . . .
31. Education
32. IC M R . . . .
33. Kura! Dev.
3 '. Social Welfare
i’orAi.— S.vi'tl Scvi-'cs
i ' o v -S.vtor-r 5)
g r a n d t o t v . (/\-;-n,
Si . 1
Ncr.-Pi.-::'
19SG-S: (A c : . :
p;.:r Non-Pi.
(Rs. croresi
198;-82 ; Act.)
Flai Non-Pla*.
7 &
53. » i
IS .or
3 “ . j
0 . 61
5.09
10 3!
3 .03
4.98
H: 53
19.72
6. X)
2.5(i
9.75::
1.50 0. SO
30. w'.
71 .80
3.00
0.33
0.63
0.10
4 .05
8.07
0.2S
0.19
5 .94
14.4S
5. N5
0 10
o.so
0,05
0. so
9.;.]
0, ’<5
0..9
17.:7
4.00
1 .06
112.00
40.00
30.00
26.00
16.40
4.88
0.8S
0.33
22.49
6,25
06 .6 ' '
19:"‘
0.04
22.90
7,60
i .00
: i. i o
3! .64
156.7’
300 'y\
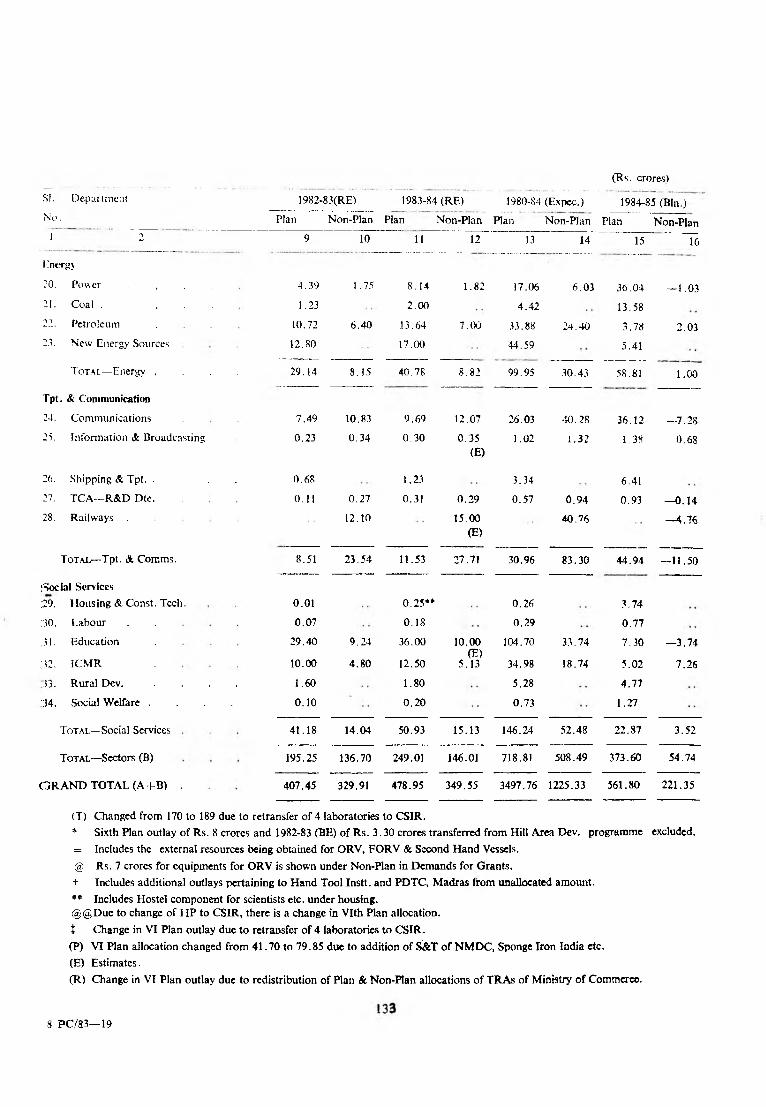
(Rs. crores)
SI. Department 1982-83(RE) 1983-84 (RE) 1980-84 (Expec.) 1984-85 (Bln.)
N o . Plan Non-Plan Plan Non-Plan Plan Non-Plan Plan Non-Plan
1 2 9 10 11 12 13 14 15 16
Knergy
20. Power . . . . 4.39 1 .75 8.14 1.82 17.06 6.03 36.04 — 1.03
21. C o a l .......................................... 1.23 2.00 4.42 13.58
22. Petroleum . 10.72 6.40 13.64 7.00 33.88 24.40 3.78 2.03
23. New Energy Sources 12.80 17.00 44.59 5.41
T o ta l .— Energy . . . . 29.14 8.15 40.78 8.82 99.95 30.43 58.81 1.00
Tpt. & Communication
24. Communications 7.49 10.83 9.69 12.07 26.03 40.28 36.12 —7.28
25, Information & Broadcasting 0.23 0.34 0.30 0.35
(E)
1.02 1.32 1,38 0.68
26. Shipping & Tpt. . . . . 0.68 1.23 3.34 6.41
27. TCA— R& D Dte. 0.11 0.27 0.31 0.29 0.57 0.94 0.93 —0.14
28. Railways . 12.10 15.00
(E)
40.76 - 4 .76
Total—Tpt. & Comms. 8.51 23.54 11.53 27.71 30.96 83.30 44.94 — 11.50
[Social Services
29. Housing & Const. Tech. 0.01 0.25** 0.26 3,74
;30. Labour , 0.07 0.18 0.29 0.77
.31. Education
32. IC M R
29.40
10.00
9.24
4.80
36.00
12.50
10.00
(E)5.13
104.70
34.98
33.74
18.74
7.30
5.02
— 3.74
7.26
33. Rural Dev. . . . . 1.60 1.80 5.28 4.77
'34. Social Welfare . . . . 0.10 0.20 0.73 1.27
T o t a l—Social Services 41.18 14.04 50.93 15.13 146.24 52.48 22.87 3.52
T o t a l— Sectors (B) 195.25 136.70 249.01 146.01 718.81 508.49 373.60 54.74
O R A N D TOTAL (A +B) . 407.45 329.91 478.95 349.55 3497.76 1225.33 561.80 221.35
(T) Changed from 170 to 189 due to retransfer of 4 laboratories to CSIR .
* Sixth Plan outlay o f Rs. 8 crores and 1982-83 (BE) of Rs. 3.30 crores transferred from Hill Area Dev. programme excluded.
= Includes the external resources being obtained for ORV, FORV & Second Hand Vessels.
@ Rs. 7 crores for equipments for O RV is shown under Non-Plan in Demands for Grants.
+ Includes additional outlays pertaining to Hand Tool Instt. and PDTC, Madras from unallocated amount.
** Includes Hostel component for scientists etc. under housing.
@@Due to change of I IP to CSIR , there is a change in V lth Plan allocation,
t Change in V I Plan outlay due to retransfer of 4 laboratories to CSIR .
(P) V I Han allocation changed from 41.70 to 79.85 due to addition of S&T o f N M D C , Sponge Iron India etc.
(E) Estimates.
(R) Change in V I Plan outlay due to redistribution o f Plan & Non-Plan allocations of TRAs of Ministry o f Commerce.
8 PC/83— 19
APPENDIXTABLES
135-135

CONTENTS OF TABLES
Pagis
Table I Saving and Investment : 1980-85 ................................................................................................ 139
Table n Investment and Outlay in the Public Sector Plan : 1980-85 ...................................... 139
Tabte nr Resources of the Public Sector Plan Outlay during the first three years of the Sixth Plan 139
Table IV Elasticity of Imports (goods only) with respect to Gross Domestic Product at market prices 139
137-138

T Vjl K
Periocd
1 979-SO
3 980-81
1981-82
1982-83
1980-85 (
1980-85 (
Revised)
Plan) .
S jv inv and Investment : 1980-85(Rs. crores)
At current pricesAt 1979-80 prices
Domestic Foreign Total Domestic Foreign Total
saving saving Investment saving saving Investment
24098 580 24678 24098 580 24678
28086 2400 30486 25150 1983 27133
33627 3650 37277 27442 1813 29255
35998 3300 39298 26234 1891 28125
195683 16160 211843 142581 9635 152216
149647 9063 158710. ---------- - ....... — ..........-•" " .............. -..........-
Note : E' stirutcs upto 1981-82 are based on the data available in National Accounts Statistics.
T a b l e II
Investment and Outlay in the Public Sector Plan : 1980-85
Peiriod
1979-80
19;80-81
\9'8 S2 -
19-82- 83 .
19'80-85 (Plan)
At current prices
(Rs. crores)
At 1979-80 prices
Investment
10490
12780
15690
18410
Outlay
1217714832
18211
21356
Investment
10490
11491
12305
13131
81000
Outlay
12177
13336
(428.5
15230
97500
T a b le i n
Resources of the Public Sector Plan Outlay during the first three yean of the Sixth Plan(Rs. crores)
1980-81 to 1982-83 Sixth Plan Percentage achievment
ItemAt constant At current At constant At current
(1979-80)
prices
prices prices prices
1 2 3 4 5 6
1. Balance from current revenue •
2. Contribution of public enterprises .
3. Draft on other private saving •
4. Market borrowing .........................................
5. External assistance ( n e t ) ..........................................
6. Deficit financing (including reserve withdrawals)
9917
6634
6986
8433
3840
7082
12638
856S
8215
11565
4795
8617
26930
18245
16896
19500
9929
6000
36.8
36.4
41.3
43.2
38.7
118.0
46.9
47.0
48.6
59.3
48.3
143.6
T o t a l . ............................................................... 42892 54399 97500 44.0 55.8
T a b le TV
Elasticity of Imports {goods only) with respect to Gross Domestic Product at market prices
Year
1974-75 to 1979-80
1979-80 to 1981-82
1979-80 to 1984-85
Ratio
1 53~1.121.20
139
NIEPA - DC
0748
a