Cardiometabolic effects of physical activity interventions for people with schizophrenia
Upload
independentCategory
view
0download
0
Müller-Riemenschneider et al. BMC Public Health 2013, 13:755http://www.biomedcentral.com/1471-2458/13/755
RESEARCH ARTICLE Open Access
Neighborhood walkability and cardiometabolic riskfactors in australian adults: an observational studyFalk Müller-Riemenschneider1,2*, Gavin Pereira3,4, Karen Villanueva4, Hayley Christian4, Matthew Knuiman5,Billie Giles-Corti6 and Fiona C Bull4
Abstract
Background: Studies repeatedly highlight associations between the built environment and physical activity,particularly walking. Fewer studies have examined associations with cardiometabolic risk factors, with associationswith obesity inconsistent and scarce evidence examining associations with other cardiometabolic risk factors. Weaim to investigate the association between neighborhood walkability and the prevalence of obesity, hypertension,hypercholesterolaemia, and type-2 diabetes mellitus.
Methods: Cross-sectional study of 5,970 adults in Western Australia. Walkability was measured objectively for a1,600 m and 800 m neighborhood buffer. Logistic regression was used to assess associations overall and by sex,adjusting for socio-demographic factors. Mediation by physical activity and sedentary behavior was investigated.
Results: Individuals living in high compared with less walkable areas were less likely to be obese (1,600 m OR: 0.84,95% CI: 0.7 to 1; 800 m OR: 0.75, 95% CI: 0.62 to 0.9) and had lower odds of type-2 diabetes mellitus at the 800 mbuffer (800 m OR: 0.69, 95% CI: 0.51 to 0.93). There was little evidence for an association between walkability andhypertension or hypercholesterolaemia. The only significant evidence of any difference in the associations in menand women was a stronger association with type-2 diabetes mellitus at the 800 m buffer in men. Associations withobesity and diabetes attenuated when additionally adjusting for physical activity and sedentary behavior but theoverall association with obesity remained significant at the 800 m buffer (800 m OR: 0.78, 95% CI: 0.64 to 0.96).
Conclusions: A protective association between neighborhood walkability and obesity was observed. Neighborhoodwalkability may also be protective of type-2 diabetes mellitus, particularly in men. No association with hypertensionor hypercholesterolaemia was found. This warrants further investigation. Findings contribute towards theaccumulating evidence that city planning and policy related strategies aimed at creating supportive environmentscould play an important role in the prevention of chronic diseases.
Keywords: Built environment, Walkability, Cardiometabolic risk factors
BackgroundChronic diseases such as cardiovascular disease (CVD)are the leading cause of death in most industrialized andmany lower income countries [1,2]. It is well establishedthat common modifiable risk factors, such as physicalinactivity, unhealthy diet, obesity, hypertension and type-2diabetes mellitus are responsible for the majority of
* Correspondence: [email protected] Swee Hock School of Public Health and Department of Medicine, YongLoo Lin School of Medicine, National University of Singapore, Block MD3, 16Medical Drive, Singapore 117597, Singapore2Institute for Social Medicine, Epidemiology and Health Economics - CharitéUniversity Medical Centre Berlin, Luisenstrasse 57, 10117 Berlin, GermanyFull list of author information is available at the end of the article
© 2013 Müller-Riemenschneider et al.; licenseeof the Creative Commons Attribution Licensedistribution, and reproduction in any medium
cardiovascular and chronic disease events [1,3]. However,the prevalence of these risk factors has increased in manypopulations in recent years [4-10]. This raises concernsabout the global impact on health systems if non-communicable disease rates continue to increase [1].To counter the increase in CVD risk factors, environ-
mental interventions have become increasingly recognizedas necessary and potentially efficacious approaches tosupport behavior change [11-13]. Characteristics of thebuilt environment include types of land use, populationand housing density, connectivity of the street network,destinations accessed in daily life for shopping, educa-tion, work, and recreation, as well as the presence and
BioMed Central Ltd. This is an Open Access article distributed under the terms(http://creativecommons.org/licenses/by/2.0), which permits unrestricted use,, provided the original work is properly cited.
Müller-Riemenschneider et al. BMC Public Health 2013, 13:755 Page 2 of 9http://www.biomedcentral.com/1471-2458/13/755
quality of parks and public open spaces [14]. A sub-stantial amount of research has linked many of thesebuilt environmental factors or composite measures ofthe built environment, such as walkability (residentialdensity, street connectivity and mix of land uses), tophysical activity behavior, including walking, cycling,active transportation or recreational physical activity[14-19]. Overall, adults in more supportive built envi-ronments, for example, pedestrian friendly areas withwell-connected streets, higher density and a mix ofland uses, are more likely to meet physical activity rec-ommendations [17].In addition, characteristics of the built environment may
also have an important influence on cardiometabolic riskfactors (CMRF), such as obesity, hypertension, hyperchol-esterolaemia, and type-2 diabetes mellitus, either directlyor mediated through their influence on physical activity.In a recent systematic review of 131 studies of the associ-ation between environmental factors and CMRF, a sub-stantial number of studies focused on measures of bodyweight. Findings indicate that features of the built envir-onment (e.g., residential density, degree of urbanization,street intersections) are associated favorably with bodyweight, body-mass index (BMI) or obesity prevalence [20].However, other reviews have concluded that these asso-ciations are inconsistent [14,15]. Moreover, other CMRF,including hypertension, hypercholesterolaemia, type-2diabetes mellitus and the metabolic syndrome have re-ceived considerably less attention. Few studies have investi-gated the association between blood pressure and builtenvironment features such as walkability, population dens-ity or greenness [20]. Nonetheless, the limited evidencesuggests that supportive built environments are associ-ated with favorable blood pressure levels or lowerprevalence of hypertension [21-23]. Only two studieshave investigated the influence of neighborhood re-sources or neighborhood housing conditions on type-2diabetes mellitus [24,25], and there appears to be nostudies examining associations between the built envir-onment and hypercholesterolaemia or the metabolicsyndrome [20].The aim of this study was to complement the existing
evidence by investigating the association between object-ively measured walkability of the neighborhood and theprevalence of CMRF (obesity, hypertension, hypercholes-terolaemia, and type-2 diabetes mellitus) in a large rep-resentative sample of adults in Perth, Western Australia.
MethodsStudy design and study populationThis was a cross-sectional study of adults (25+ years)[26,27]. Participants were included in the present study ifthey were residents of the Perth metropolitan area, partici-pated in the Western Australian Health and Wellbeing
Surveillance System (HWSS) survey between 2003 and2006, and had consented to data linkage. The HWSS is acomputer-assisted telephone interview based on a strati-fied random population sample administered by theDepartment of Health of Western Australia [28]. Thosewho consented to having their data linked to other health-related datasets were included in the study (5,970; 73%of 8,178 who completed the survey between 2003 and2006). The sample’s baseline characteristics differed slightlyfrom the non-linked population with the linked samplebeing somewhat older and with a higher prevalence ofobesity, hypertension, hypercholesterolaemia, and type-2 diabetes mellitus.Ethics approval was obtained from the Human Research
Ethics Committee of the Department of Health of WesternAustralia and The University of Western Australia (#2010/1).
OutcomesSelf-report of prior medically diagnosed or treated CMRFwas obtained from the HWSS survey. The outcomes in-vestigated in this study were obesity, hypertension, hyper-cholesterolaemia, and type-2 diabetes mellitus. Obesitywas assessed based on self-reported height and weight anddefined as a BMI ≥ 30 kg/m2. Participants were consid-ered to have hypertension, hypercholesterolaemia ortype-2 diabetes mellitus if they were previously diagnosedby a doctor, or if they were currently treated with medica-tion for any of these conditions.
WalkabilityThe built environment and its association with physicalactivity and other health related outcomes has been investi-gated using various methodological approaches, with differ-ent strengths and weaknesses [29]. In our study the builtenvironment was assessed objectively using GeographicalInformation Systems (GIS) software (ESRI ArcGIS v10).Similar to many previous studies we calculated a walkabilityindex to investigate the association between the built envir-onment and CMRF [30-33]. This offers opportunities forcomparison with the existing literature and to put our find-ings into perspective. The methodology of our study hasbeen described in detail elsewhere [26]. Briefly, we com-bined three environmental measures: 1) residential density(ratio of number of residential dwellings to residential areain hectares) [31]; 2) street connectivity (ratio of count ofthree or more way intersections to area in km2) [31];and 3) land use mix (calculated using an entropy formula(28) adapted from that originally used by Frank et al.(2005), which incorporates the proportion of area coveredby each land use type by the summed area for all land usetypes of interest divided by the number of land use clas-ses) [31,33]. These measures were calculated within tworoad network neighborhood buffers (i.e. service areas).A neighborhood buffer of 1,600 m was used because this
Müller-Riemenschneider et al. BMC Public Health 2013, 13:755 Page 3 of 9http://www.biomedcentral.com/1471-2458/13/755
distance represents approximately how far a participantcan walk from home at a moderate to vigorous intensitypace, within 15 minutes [34]. Other studies have usedsmaller buffer sizes to characterize the neighborhoodenvironment [29]. For that reason we additionally cal-culated walkability at a neighborhood buffer of 800 mreflecting the more immediate neighborhood environ-ment. The walkability index was calculated by summingthe z-scores for each component. Previous studies havefrequently divided walkability scores into quartiles orquintiles to investigate associations with relevant out-comes as compared to investigations of linear associa-tions with continuous measures [23,31,33]. In this studywe have compared participants living in areas with highwalkability (highest quartile) with those living in lesswalkable neighborhoods (other three quartiles). This wasdone to facilitate comparison of approach and results withother studies and also because Perth and other Australiancities do not have large variation in walkability andselecting out the top 25% preserves an adequate numberfor maintenance of statistical power and provides oppor-tunity to determine what is achievable if the walkabilityof all environments were increased to this level. Theclassification of walkability (high and less walkable, re-spectively) at 1,600 m and 800 m was the same in 4,797(80%) participants.
Statistical analysisAnalyses were conducted for the total sample, and stratifiedby sex. Descriptive analyses of participant characteristicsand the prevalence of CMRF are presented as percentages.Differences in the prevalence of CMRF between peopleliving in high compared with low walkable neighborhoodswere investigated using logistic regression models. Fourbinary outcomes were analyzed for the presence of each ofthe four CMRF separately. Models were fitted to estimatethe odds ratio comparing odds of the risk factor (in thehigh vs. less walkable neighborhoods). Models adjustedfor sex, age, education level, marital status and householdincome (Model A), with additional adjustment for physicalactivity and sedentary behavior (Model B). The impactof daily fruit and vegetable intake was explored in thecontext of Model B. These additional adjustments hadlittle impact on observed associations and results arenot presented separately. Comparison of the strengthsof association in men vs. women was conducted usingwalkability sex interaction terms. Levels of physical ac-tivity were assessed by self-report. Time spent in vigorousand moderate activities was combined. Sedentary behaviorwas also assessed by self-report and reflects the time spentwatching TV, playing video games or using the computer.All analyses were conducted separately for walkability at aneighborhood buffer of 1,600 m and 800 m.
ResultsStudy population and prevalence of cardiometabolicrisk factorsOverall, 2,509 participants were male (42%) and 3,461 werefemale (58%) (Table 1). Hypercholesterolaemia was themost prevalent CMRF (35%), followed by hypertension(32.6%), obesity (18.8%) and type-2 diabetes mellitus(7%). CMRF prevalence was similar in men and women.Nearly one quarter (23.8%) of participants reported twoor more CMRF.
Association between walkability and CMRFThe observed prevalence of obesity, hypertension andtype-2 diabetes was lower in high compared with lesswalkable areas at both the 1,600 m and 800 m neighbor-hood buffer (Tables 2 and 3). In contrast, the prevalenceof hypercholesterolaemia was higher in more walkableareas (1,600 m and 800 m neighborhood buffers).After adjusting for socio-demographic factors (Tables 2
and 3, model A), individuals living in high comparedwith less walkable areas were not as likely to be obese(1,600 m OR: 0.84, 95% CI: 0.7 to 1; 800 m OR: 0.75,95% CI: 0.62 to 0.9). Individuals in high walkable neigh-borhoods also had lower odds of type-2 diabetes mellitus.However, this relationship was only statistically significantat the 800 m neighborhood buffer (1,600 m OR: 0.95,95% CI: 0.72 to 1.25; 800 m OR: 0.69, 95% CI: 0.51 to0.93). There was little evidence of an association betweenwalkability and hypertension or hypercholesterolaemia.Whilst the estimated association between walkability and
obesity was stronger in men than women (Tables 2 and 3)the difference did not reach statistical significance (1,600 mOR: 0.75 for men vs. 0.89 for women, p-value=0.414;800 m OR: 0.73 for men vs. 0.76 for women, p-value=0.898).The estimated association between walkability and type-2diabetes mellitus was stronger in men than women at the800 m neighborhood buffer (OR: 0.53 for men vs. 0.88for women, p-value=0.083) but not at the 1,600 m buffer(OR 1.14 for men vs. 0.76 for women, p-value=0.204).No significant relationships between walkability and hyper-tension and hypercholesterolaemia were found for eithermen or women.The mediation effect of physical activity and sedentary
behavior on the relationship between walkability and CMRF(Table 2 and 3, model B) was investigated. After adjustingfor these factors, previously statistically significant associa-tions between walkability and obesity attenuated overall(1,600 m OR: 0.84 to 0.86; 800 m OR: 0.75 to 0.78), in men(1,600 m OR: 0.75 to 0.82; 800 m OR: 0.73 to 0.76) and inwomen (800 m OR: 0.76 to 0.80) and only the associationwith obesity overall at the 800 m neighborhood bufferremained significant (1,600 m p-value=0.139; 800 mp-value=0.018). Similarly, the significant associationsbetween walkability and type-2 diabetes mellitus at the
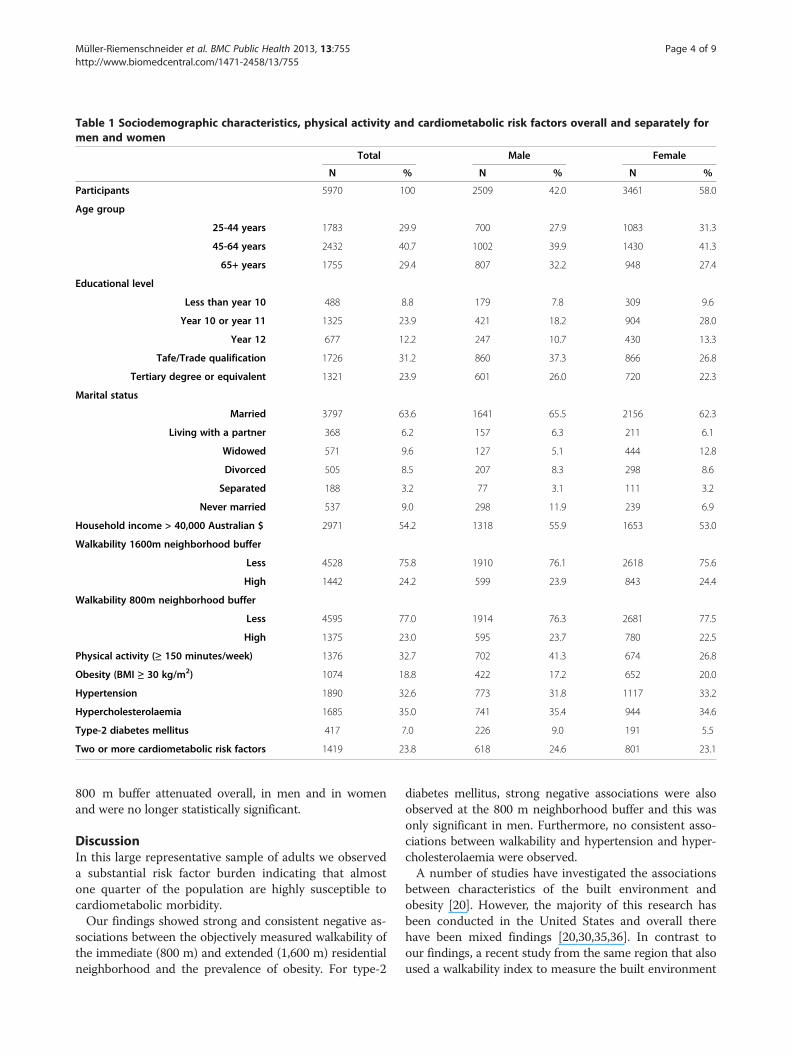
Table 1 Sociodemographic characteristics, physical activity and cardiometabolic risk factors overall and separately formen and women
Total Male Female
N % N % N %
Participants 5970 100 2509 42.0 3461 58.0
Age group
25-44 years 1783 29.9 700 27.9 1083 31.3
45-64 years 2432 40.7 1002 39.9 1430 41.3
65+ years 1755 29.4 807 32.2 948 27.4
Educational level
Less than year 10 488 8.8 179 7.8 309 9.6
Year 10 or year 11 1325 23.9 421 18.2 904 28.0
Year 12 677 12.2 247 10.7 430 13.3
Tafe/Trade qualification 1726 31.2 860 37.3 866 26.8
Tertiary degree or equivalent 1321 23.9 601 26.0 720 22.3
Marital status
Married 3797 63.6 1641 65.5 2156 62.3
Living with a partner 368 6.2 157 6.3 211 6.1
Widowed 571 9.6 127 5.1 444 12.8
Divorced 505 8.5 207 8.3 298 8.6
Separated 188 3.2 77 3.1 111 3.2
Never married 537 9.0 298 11.9 239 6.9
Household income > 40,000 Australian $ 2971 54.2 1318 55.9 1653 53.0
Walkability 1600m neighborhood buffer
Less 4528 75.8 1910 76.1 2618 75.6
High 1442 24.2 599 23.9 843 24.4
Walkability 800m neighborhood buffer
Less 4595 77.0 1914 76.3 2681 77.5
High 1375 23.0 595 23.7 780 22.5
Physical activity (≥ 150 minutes/week) 1376 32.7 702 41.3 674 26.8
Obesity (BMI ≥ 30 kg/m2) 1074 18.8 422 17.2 652 20.0
Hypertension 1890 32.6 773 31.8 1117 33.2
Hypercholesterolaemia 1685 35.0 741 35.4 944 34.6
Type-2 diabetes mellitus 417 7.0 226 9.0 191 5.5
Two or more cardiometabolic risk factors 1419 23.8 618 24.6 801 23.1
Müller-Riemenschneider et al. BMC Public Health 2013, 13:755 Page 4 of 9http://www.biomedcentral.com/1471-2458/13/755
800 m buffer attenuated overall, in men and in womenand were no longer statistically significant.
DiscussionIn this large representative sample of adults we observeda substantial risk factor burden indicating that almostone quarter of the population are highly susceptible tocardiometabolic morbidity.Our findings showed strong and consistent negative as-
sociations between the objectively measured walkability ofthe immediate (800 m) and extended (1,600 m) residentialneighborhood and the prevalence of obesity. For type-2
diabetes mellitus, strong negative associations were alsoobserved at the 800 m neighborhood buffer and this wasonly significant in men. Furthermore, no consistent asso-ciations between walkability and hypertension and hyper-cholesterolaemia were observed.A number of studies have investigated the associations
between characteristics of the built environment andobesity [20]. However, the majority of this research hasbeen conducted in the United States and overall therehave been mixed findings [20,30,35,36]. In contrast toour findings, a recent study from the same region that alsoused a walkability index to measure the built environment
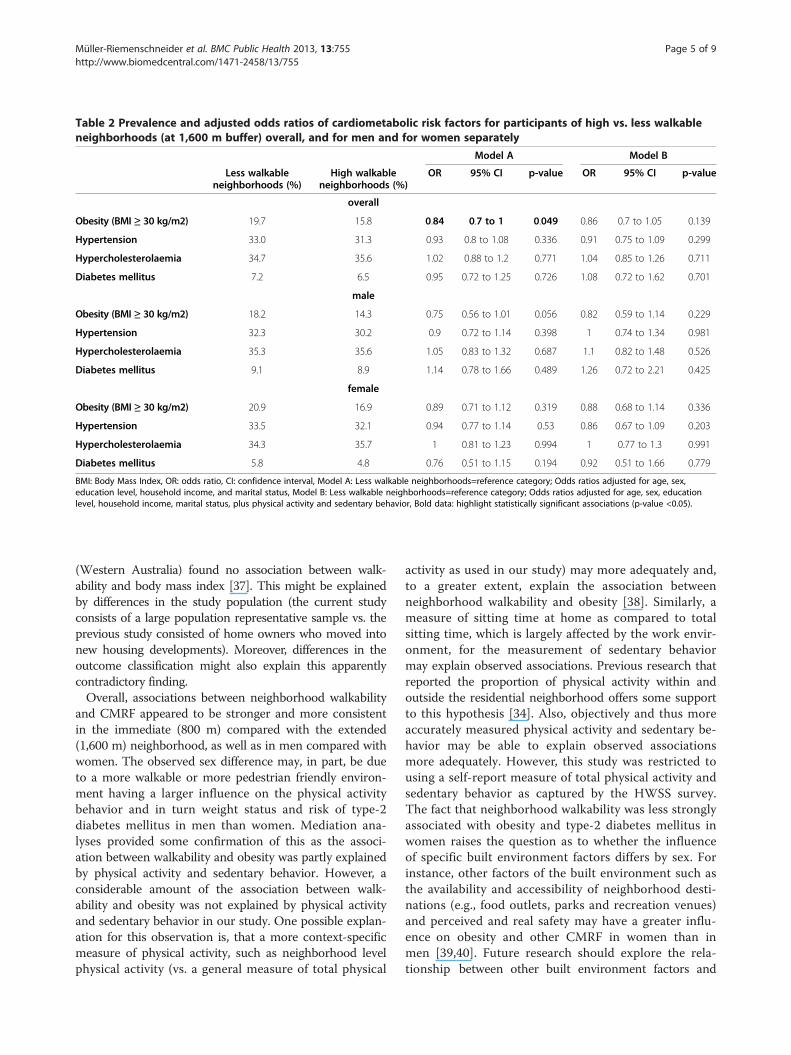
Table 2 Prevalence and adjusted odds ratios of cardiometabolic risk factors for participants of high vs. less walkableneighborhoods (at 1,600 m buffer) overall, and for men and for women separately
Model A Model B
Less walkableneighborhoods (%)
High walkableneighborhoods (%)
OR 95% CI p-value OR 95% CI p-value
overall
Obesity (BMI ≥ 30 kg/m2) 19.7 15.8 0.84 0.7 to 1 0.049 0.86 0.7 to 1.05 0.139
Hypertension 33.0 31.3 0.93 0.8 to 1.08 0.336 0.91 0.75 to 1.09 0.299
Hypercholesterolaemia 34.7 35.6 1.02 0.88 to 1.2 0.771 1.04 0.85 to 1.26 0.711
Diabetes mellitus 7.2 6.5 0.95 0.72 to 1.25 0.726 1.08 0.72 to 1.62 0.701
male
Obesity (BMI ≥ 30 kg/m2) 18.2 14.3 0.75 0.56 to 1.01 0.056 0.82 0.59 to 1.14 0.229
Hypertension 32.3 30.2 0.9 0.72 to 1.14 0.398 1 0.74 to 1.34 0.981
Hypercholesterolaemia 35.3 35.6 1.05 0.83 to 1.32 0.687 1.1 0.82 to 1.48 0.526
Diabetes mellitus 9.1 8.9 1.14 0.78 to 1.66 0.489 1.26 0.72 to 2.21 0.425
female
Obesity (BMI ≥ 30 kg/m2) 20.9 16.9 0.89 0.71 to 1.12 0.319 0.88 0.68 to 1.14 0.336
Hypertension 33.5 32.1 0.94 0.77 to 1.14 0.53 0.86 0.67 to 1.09 0.203
Hypercholesterolaemia 34.3 35.7 1 0.81 to 1.23 0.994 1 0.77 to 1.3 0.991
Diabetes mellitus 5.8 4.8 0.76 0.51 to 1.15 0.194 0.92 0.51 to 1.66 0.779
BMI: Body Mass Index, OR: odds ratio, CI: confidence interval, Model A: Less walkable neighborhoods=reference category; Odds ratios adjusted for age, sex,education level, household income, and marital status, Model B: Less walkable neighborhoods=reference category; Odds ratios adjusted for age, sex, educationlevel, household income, marital status, plus physical activity and sedentary behavior, Bold data: highlight statistically significant associations (p-value <0.05).
Müller-Riemenschneider et al. BMC Public Health 2013, 13:755 Page 5 of 9http://www.biomedcentral.com/1471-2458/13/755
(Western Australia) found no association between walk-ability and body mass index [37]. This might be explainedby differences in the study population (the current studyconsists of a large population representative sample vs. theprevious study consisted of home owners who moved intonew housing developments). Moreover, differences in theoutcome classification might also explain this apparentlycontradictory finding.Overall, associations between neighborhood walkability
and CMRF appeared to be stronger and more consistentin the immediate (800 m) compared with the extended(1,600 m) neighborhood, as well as in men compared withwomen. The observed sex difference may, in part, be dueto a more walkable or more pedestrian friendly environ-ment having a larger influence on the physical activitybehavior and in turn weight status and risk of type-2diabetes mellitus in men than women. Mediation ana-lyses provided some confirmation of this as the associ-ation between walkability and obesity was partly explainedby physical activity and sedentary behavior. However, aconsiderable amount of the association between walk-ability and obesity was not explained by physical activityand sedentary behavior in our study. One possible explan-ation for this observation is, that a more context-specificmeasure of physical activity, such as neighborhood levelphysical activity (vs. a general measure of total physical
activity as used in our study) may more adequately and,to a greater extent, explain the association betweenneighborhood walkability and obesity [38]. Similarly, ameasure of sitting time at home as compared to totalsitting time, which is largely affected by the work envir-onment, for the measurement of sedentary behaviormay explain observed associations. Previous research thatreported the proportion of physical activity within andoutside the residential neighborhood offers some supportto this hypothesis [34]. Also, objectively and thus moreaccurately measured physical activity and sedentary be-havior may be able to explain observed associationsmore adequately. However, this study was restricted tousing a self-report measure of total physical activity andsedentary behavior as captured by the HWSS survey.The fact that neighborhood walkability was less stronglyassociated with obesity and type-2 diabetes mellitus inwomen raises the question as to whether the influenceof specific built environment factors differs by sex. Forinstance, other factors of the built environment such asthe availability and accessibility of neighborhood desti-nations (e.g., food outlets, parks and recreation venues)and perceived and real safety may have a greater influ-ence on obesity and other CMRF in women than inmen [39,40]. Future research should explore the rela-tionship between other built environment factors and
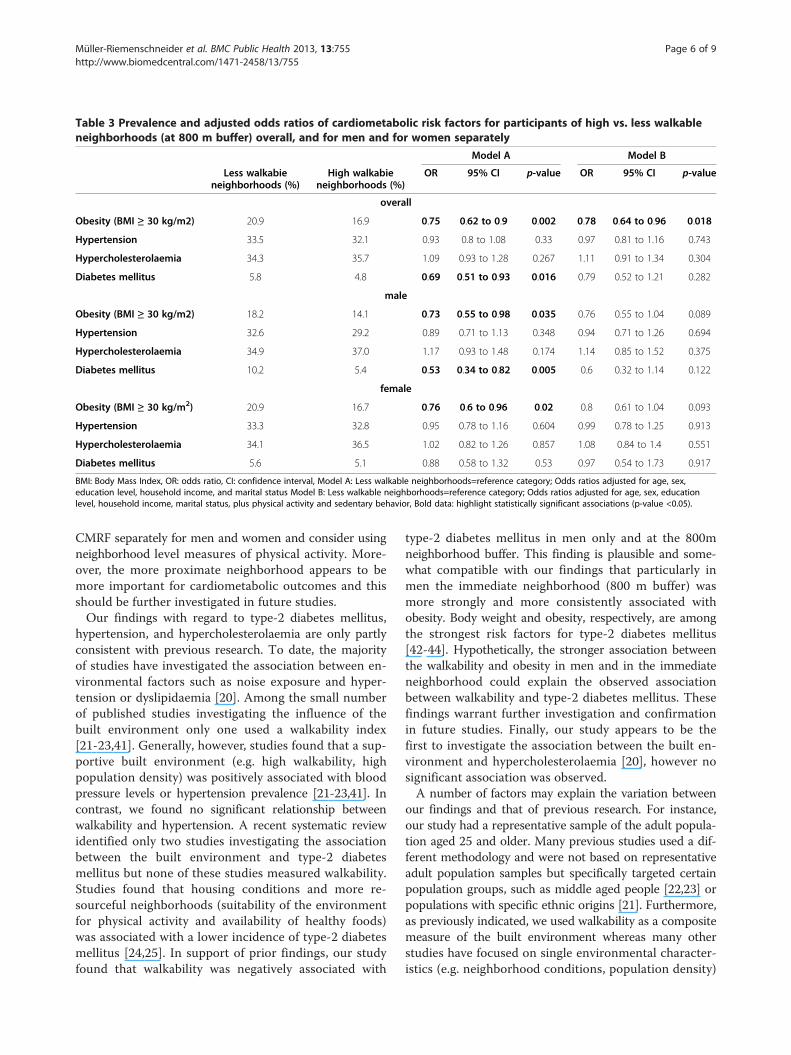
Table 3 Prevalence and adjusted odds ratios of cardiometabolic risk factors for participants of high vs. less walkableneighborhoods (at 800 m buffer) overall, and for men and for women separately
Model A Model B
Less walkabieneighborhoods (%)
High walkabieneighborhoods (%)
OR 95% CI p-value OR 95% CI p-value
overall
Obesity (BMI ≥ 30 kg/m2) 20.9 16.9 0.75 0.62 to 0.9 0.002 0.78 0.64 to 0.96 0.018
Hypertension 33.5 32.1 0.93 0.8 to 1.08 0.33 0.97 0.81 to 1.16 0.743
Hypercholesterolaemia 34.3 35.7 1.09 0.93 to 1.28 0.267 1.11 0.91 to 1.34 0.304
Diabetes mellitus 5.8 4.8 0.69 0.51 to 0.93 0.016 0.79 0.52 to 1.21 0.282
male
Obesity (BMI ≥ 30 kg/m2) 18.2 14.1 0.73 0.55 to 0.98 0.035 0.76 0.55 to 1.04 0.089
Hypertension 32.6 29.2 0.89 0.71 to 1.13 0.348 0.94 0.71 to 1.26 0.694
Hypercholesterolaemia 34.9 37.0 1.17 0.93 to 1.48 0.174 1.14 0.85 to 1.52 0.375
Diabetes mellitus 10.2 5.4 0.53 0.34 to 0.82 0.005 0.6 0.32 to 1.14 0.122
female
Obesity (BMI ≥ 30 kg/m2) 20.9 16.7 0.76 0.6 to 0.96 0.02 0.8 0.61 to 1.04 0.093
Hypertension 33.3 32.8 0.95 0.78 to 1.16 0.604 0.99 0.78 to 1.25 0.913
Hypercholesterolaemia 34.1 36.5 1.02 0.82 to 1.26 0.857 1.08 0.84 to 1.4 0.551
Diabetes mellitus 5.6 5.1 0.88 0.58 to 1.32 0.53 0.97 0.54 to 1.73 0.917
BMI: Body Mass Index, OR: odds ratio, CI: confidence interval, Model A: Less walkable neighborhoods=reference category; Odds ratios adjusted for age, sex,education level, household income, and marital status Model B: Less walkable neighborhoods=reference category; Odds ratios adjusted for age, sex, educationlevel, household income, marital status, plus physical activity and sedentary behavior, Bold data: highlight statistically significant associations (p-value <0.05).
Müller-Riemenschneider et al. BMC Public Health 2013, 13:755 Page 6 of 9http://www.biomedcentral.com/1471-2458/13/755
CMRF separately for men and women and consider usingneighborhood level measures of physical activity. More-over, the more proximate neighborhood appears to bemore important for cardiometabolic outcomes and thisshould be further investigated in future studies.Our findings with regard to type-2 diabetes mellitus,
hypertension, and hypercholesterolaemia are only partlyconsistent with previous research. To date, the majorityof studies have investigated the association between en-vironmental factors such as noise exposure and hyper-tension or dyslipidaemia [20]. Among the small numberof published studies investigating the influence of thebuilt environment only one used a walkability index[21-23,41]. Generally, however, studies found that a sup-portive built environment (e.g. high walkability, highpopulation density) was positively associated with bloodpressure levels or hypertension prevalence [21-23,41]. Incontrast, we found no significant relationship betweenwalkability and hypertension. A recent systematic reviewidentified only two studies investigating the associationbetween the built environment and type-2 diabetesmellitus but none of these studies measured walkability.Studies found that housing conditions and more re-sourceful neighborhoods (suitability of the environmentfor physical activity and availability of healthy foods)was associated with a lower incidence of type-2 diabetesmellitus [24,25]. In support of prior findings, our studyfound that walkability was negatively associated with
type-2 diabetes mellitus in men only and at the 800mneighborhood buffer. This finding is plausible and some-what compatible with our findings that particularly inmen the immediate neighborhood (800 m buffer) wasmore strongly and more consistently associated withobesity. Body weight and obesity, respectively, are amongthe strongest risk factors for type-2 diabetes mellitus[42-44]. Hypothetically, the stronger association betweenthe walkability and obesity in men and in the immediateneighborhood could explain the observed associationbetween walkability and type-2 diabetes mellitus. Thesefindings warrant further investigation and confirmationin future studies. Finally, our study appears to be thefirst to investigate the association between the built en-vironment and hypercholesterolaemia [20], however nosignificant association was observed.A number of factors may explain the variation between
our findings and that of previous research. For instance,our study had a representative sample of the adult popula-tion aged 25 and older. Many previous studies used a dif-ferent methodology and were not based on representativeadult population samples but specifically targeted certainpopulation groups, such as middle aged people [22,23] orpopulations with specific ethnic origins [21]. Furthermore,as previously indicated, we used walkability as a compositemeasure of the built environment whereas many otherstudies have focused on single environmental character-istics (e.g. neighborhood conditions, population density)
Müller-Riemenschneider et al. BMC Public Health 2013, 13:755 Page 7 of 9http://www.biomedcentral.com/1471-2458/13/755
[22,24]. Another potential factor could be the choice ofneighborhood buffers used. We investigated the immedi-ate and more extended neighborhood (800 m and 1,600 mneighborhood buffer) with associations being somewhatstronger at the 800 m neighborhood buffer. However, incontrast to our findings other studies have also reportedassociations between the built environment and type-2diabetes mellitus and hypertension at a neighborhood buf-fer of 1,600 m [25,41].A major strength of the current study is that it investi-
gated multiple CMRF within the same study population.In addition, our study was based on a representativepopulation sample with a high proportion of participantsgranting permission for data linkage. Furthermore, walkabilitywas measured using objective attributes of the built en-vironment. Nevertheless, when interpreting our findingsa number of limitations should be considered. First, des-pite their frequent use, limitations of composite measuresof the built environment (walkability index) have beenhighlighted [45][29]. Among others, these include theinability to identify specific relevant environmentalcomponents, the use of entropy scores that can be simi-lar for different walking environments, and the fact thata wide range of land uses is usually not captured inexisting walkability indices. On the other hand, using awalkability index could have the advantage of providingbetter estimates compared to individual and frequentlyinter-related environmental components [31]. In addition,focusing on a number of relevant environmental variablesis likely necessary and could have greater potential toimprove pedestrian friendliness of a neighborhood [31],Second, our study used self-reported outcome measureswhich could introduce measurement error. Future studiesinvestigating multiple CMRF should include objectivemeasures of CMRF’s. Third, although we used a com-posite measure of the built environment other potentiallyimportant built environment or neighborhood attributes(e.g., presence of food outlet destinations) were not con-sidered and may differ by sex (e.g., neighborhood safetyand crime). Fourth, this study had a cross-sectional design,which limits the ability to draw causal inferences. It shouldalso be acknowledged that we were not able to identifyfactors related to the choice of residential neighborhoodbecause the neighborhood and health data were linked byan independent government department. Adjustment forresidential preference was therefore not possible withinour study. However, we have longitudinal evidence thatthe influence of neighborhood selection might not belarge [46]. Nevertheless, future studies should attemptto consider this aspect when investigating associationsbetween the neighborhood environment and health re-lated outcomes.There is growing recognition that the global burden of
preventable chronic disease is so great, that if uncurbed
it could cripple health systems and undermine social andeconomic development [1]. Combating chronic diseasesis therefore said to require a whole-of-society multi-sector approach, including consideration being given tocity planning that support more active lifestyles such asdaily walking and cycling [47]. While the associationsobserved in this study are relatively modest, small shiftsacross whole populations can have a large impact on theburden of disease. Thus, these results highlight the im-portance of engaging city planners to create walkablepedestrian-friendly neighborhoods as one key strategyin tackling key CMRF.
ConclusionIn conclusion, we observed a strong protective associationbetween neighborhood walkability and obesity. Neighbor-hood walkability may also be protective of type-2 diabetesmellitus, particularly in men. Associations were partlyexplained by the physical activity and sedentary behav-ior of participants. No consistent associations betweenwalkability and hypertension or hypercholesterolaemiawere found. Our findings provide further evidence ofthe influence of the built environment on health. Cityplanning and policy-related strategies aimed at improv-ing the connectivity of the street network, mix of landuses and density of housing would enable the necessarysupportive environments for health-related behaviors andthe prevention of chronic diseases. Future studies shouldexamine other objectively measured attributes of the builtenvironment, examine the relationship between features ofthe built environment and objectively assessed CMRF sep-arately for men and women, and consider these relation-ships at other theoretically important neighborhood buffers.
Competing interestThe authors declare that they have no competing interests.
Authors’ contributionsFMR conducted the statistical analysis and drafted the manuscript. GP conceivedthe study and supported the statistical analysis. All authors were involved inredrafting of the manuscript, provided advice on re-analyses for successive drafts,and interpreted the results. All authors read and approved the final manuscript.
AcknowledgementsThe authors acknowledge Ms Sharyn Hickey and Mr Nicholas Middleton forthe calculation of GIS measures and Dr Sarah Joyce and the Data LinkageUnit from the Department of Health WA for provision of the health data. TheWestern Australian Health Promotion Foundation (Healthway) providedfunding for this project under grant #18922. HC is supported by a NationalHealth and Medical Research Council (NHMRC)/National Heart FoundationEarly Career Fellowship (#1036350). BGC is supported by a NHMRC PrincipalResearch Fellow Award (#1004900).
Author details1Saw Swee Hock School of Public Health and Department of Medicine, YongLoo Lin School of Medicine, National University of Singapore, Block MD3, 16Medical Drive, Singapore 117597, Singapore. 2Institute for Social Medicine,Epidemiology and Health Economics - Charité University Medical CentreBerlin, Luisenstrasse 57, 10117 Berlin, Germany. 3Yale School of Public Health,Center for Perinatal, Pediatric and Environmental Epidemiology, YaleUniversity, 60 College Street, New Haven, CT 06520-8034, USA. 4Centre for
Müller-Riemenschneider et al. BMC Public Health 2013, 13:755 Page 8 of 9http://www.biomedcentral.com/1471-2458/13/755
the Built Environment and Health, School of Population Health, TheUniversity of Western Australia, 35 Stirling Highway, Crawley, WA 6009,Australia. 5School of Population Health, The University of Western Australia,35 Stirling Highway, Crawley, WA 6009, Australia. 6McCaughey Centre,VicHealth Centre for Community Welbeing, Melbourne School of Populationand Global Health, University of Melbourne, Level 5, 207 Bouverie Street,Victoria 3010, Australia.
Received: 8 December 2012 Accepted: 28 June 2013Published: 15 August 2013
References1. United Nations General Assembly: Political declaration of the High-level
Meeting of the General Assembly on the Prevention and Control of Non-communicable Diseases. 2011. http://www.un.org/ga/search/view_doc.asp?symbol=A/66/L.1 (accessed June 30 2013).
2. Lopez AD, Mathers CD, Ezzati M, Jamison DT, Murray CJ: Global andregional burden of disease and risk factors, 2001: systematic analysis ofpopulation health data. Lancet 2006, 367:1747–1757.
3. Yusuf S, Hawken S, Ounpuu S, Dans T, Avezum A, Lanas F, McQueen M,Budaj A, Pais P, Varigos J, et al: Effect of potentially modifiable risk factorsassociated with myocardial infarction in 52 countries (the INTERHEARTstudy): case–control study. Lancet 2004, 364:937–952.
4. Passa P: Diabetes trends in Europe. Diabetes Metab Res Rev 2002,18(Suppl 3):S3–S8.
5. Hajjar I, Kotchen TA: Trends in prevalence, awareness, treatment, andcontrol of hypertension in the United States, 1988–2000. JAMA 2003,290:199–206.
6. Helmert U, Strube H: The development of obesity in Germany in theperiod from 1985 until 2000. Gesundheitswesen 2004, 66:409–415.
7. Galobardes B, Costanza MC, Bernstein MS, Delhumeau C, Morabia A: Trendsin risk factors for lifestyle-related diseases by socioeconomic position inGeneva, Switzerland, 1993–2000: health inequalities persist. Am J PublicHealth 2003, 93:1302–1309.
8. Stamatakis E, Ekelund U, Wareham NJ: Temporal trends in physical activityin England: the Health Survey for England 1991 to 2004. Prev Med 2007,45:416–423.
9. Drechsler K, Fikenzer S, Sechtem U, Blank E, Breithardt G, Zeymer U,Niebauer J: The Euro Heart Survey - Germany: diabetes mellitus remainsunrecognized in patients with coronary artery disease. Clin Res Cardiol2008, 97:364–370.
10. AIHW: Cardiovascular disease: Australian facts 2011. Cardiovascular diseaseseries no. 35. Cat. no. CVD 53. Canberra: AIHW; 2011.
11. Kumanyika SK, Obarzanek E, Stettler N, Bell R, Field AE, Fortmann SP,Franklin BA, Gillman MW, Lewis CE, Poston WC, et al: Population-basedprevention of obesity: the need for comprehensive promotion ofhealthful eating, physical activity, and energy balance: a scientificstatement from American Heart Association Council on Epidemiologyand Prevention, Interdisciplinary Committee for Prevention (formerly theexpert panel on population and prevention science). Circulation 2008,118:428–464.
12. Sallis JF, Bauman A, Pratt M: Environmental and policy interventions topromote physical activity. Am J Prev Med 1998, 15:379–397.
13. Kopelman P, Jebb SA, Butland B: Executive summary: Foresight ‘TacklingObesities: Future Choices’ project. Obes Rev 2007, 8(Suppl 1):vi–ix.
14. Sallis JF, Floyd MF, Rodriguez DA, Saelens BE: Role of built environments inphysical activity, obesity, and cardiovascular disease. Circulation 2012,125:729–737.
15. Durand CP, Andalib M, Dunton GF, Wolch J, Pentz MA: A systematic reviewof built environment factors related to physical activity and obesity risk:implications for smart growth urban planning. Obes Rev 2011, 12:e173–e182.
16. Ez Roux AV, Evenson KR, McGinn AP, Brown DG, Moore L, Brines S, Jacobs DR Jr:Availability of recreational resources and physical activity in adults. Am J PublicHealth 2007, 97:493–499.
17. Sallis JF, Bowles HR, Bauman A, Ainsworth BE, Bull FC, Craig CL, Sjostrom M,De BI, Lefevre J, Matsudo V, et al: Neighborhood environments andphysical activity among adults in 11 countries. Am J Prev Med 2009,36:484–490.
18. McCormack G, Giles-Corti B, Lange A, Smith T, Martin K, Pikora TJ: An updateof recent evidence of the relationship between objective and self-report
measures of the physical environment and physical activity behaviours.J Sci Med Sport 2004, 7:81–92.
19. Sallis JF, Saelens BE, Frank LD, Conway TL, Slymen DJ, Cain KL, Chapman JE,Kerr J: Neighborhood built environment and income: examining multiplehealth outcomes. Soc Sci Med 2009, 68:1285–1293.
20. Leal C, Chaix B: The influence of geographic life environments oncardiometabolic risk factors: a systematic review, a methodologicalassessment and a research agenda. Obes Rev 2011, 12:217–230.
21. Agyemang C, Van HC, Wendel-Vos W, Ujcic-Voortman JK, Lindeman E,Stronks K, Droomers M: Ethnic differences in the effect of environmentalstressors on blood pressure and hypertension in the Netherlands.BMC Publ Health 2007, 7:118.
22. Chaix B, Ducimetiere P, Lang T, Haas B, Montaye M, Ruidavets JB, Arveiler D,Amouyel P, Ferrieres J, Bingham A, et al: Residential environment andblood pressure in the PRIME Study: is the association mediated by bodymass index and waist circumference? J Hypertens 2008, 26:1078–1084.
23. Li F, Harmer P, Cardinal BJ, Vongjaturapat N: Built environment and changes inblood pressure in middle aged and older adults. Prev Med 2009, 48:237–241.
24. Schootman M, Andresen EM, Wolinsky FD, Malmstrom TK, Miller JP, Yan Y,Miller DK: The effect of adverse housing and neighborhood conditionson the development of diabetes mellitus among middle-aged AfricanAmericans. Am J Epidemiol 2007, 166:379–387.
25. Auchincloss AH, Ez Roux AV, Mujahid MS, Shen M, Bertoni AG, Carnethon MR:Neighborhood resources for physical activity and healthy foods andincidence of type 2 diabetes mellitus: the Multi-Ethnic study ofAtherosclerosis. Arch Intern Med 2009, 169:1698–1704.
26. Villanueva K, Pereira G, Knuiman M, Bull F, Wood L, Christian H, Foster S,Boruff BJ, Beesley B, Hickey S, et al: The impact of the built environmenton health across the life course: design of a cross-sectional data linkagestudy. BMJ Open 2013, 3(1): . doi:10.1136/bmjopen-2012-002482.
27. Pereira G, Foster S, Martin K, Christian H, Boruff BJ, Knuiman M, Giles-Corti B:The association between neighborhood greenness and cardiovasculardisease: an observational study. BMC Publ Health 2012, 12:466.
28. The WA Health and Wellbeing Surveillance System (WAHWSS): Design andMethodology Technical Paper, Volume 1. http://www.health.wa.gov.au/publications/documents/Technical%20paper%20no%201%20Design%20and%20Methodology.pdf.
29. Brownson RC, Hoehner CM, Day K, Forsyth A, Sallis JF: Measuring the builtenvironment for physical activity: state of the science. Am J Prev Med2009, 36:S99–S123.
30. Frank L, Kerr J, Saelens B, Sallis J, Glanz K, Chapman J: Food outlet visits,physical activity and body weight: variations by gender and race-ethnicity.Br J Sports Med 2009, 43:124–131.
31. Frank LD, Schmid TL, Sallis JF, Chapman J, Saelens BE: Linking objectivelymeasured physical activity with objectively measured urban form:findings from SMARTRAQ. Am J Prev Med 2005, 28:117–125.
32. Frank LD, Sallis JF, Conway TL, Chapman JE, Saelens BE, Bachman W: ManyPathways from Land Use to Health: Associations between NeighborhoodWalkability and Active Transportation, Body Mass Index, and Air Quality.J Am Plann Assoc 2006, 72:75–87.
33. Christian HE, Bull FC, Middleton NJ, Knuiman MW, Divitini ML, Hooper P,Amarasinghe A, Giles-Corti B: How important is the land use mix measurein understanding walking behaviour? Results from the RESIDE study.Int J Behav Nutr Phys Act 2011, 8:55.
34. Giles-Corti B, Knuiman M, Timperio A, Van NK, Pikora TJ, Bull FC, Shilton T,Bulsara M: Evaluation of the implementation of a state governmentcommunity design policy aimed at increasing local walking: designissues and baseline results from RESIDE, Perth Western Australia. Prev Med2008, 46:46–54.
35. Frank LD, Saelens BE, Powell KE, Chapman JE: Stepping towards causation:do built environments or neighborhood and travel preferences explainphysical activity, driving, and obesity? Soc Sci Med 2007, 65:1898–1914.
36. Papas MA, Alberg AJ, Ewing R, Helzlsouer KJ, Gary TL, Klassen AC: The builtenvironment and obesity. Epidemiol Rev 2007, 29:129–143.
37. Christian H, Giles-Corti B, Knuiman M, Timperio A, Foster S: The influence ofthe built environment, social environment and health behaviors onbody mass index. results from RESIDE. Prev Med 2011, 53:57–60.
38. Giles-Corti B, Timperio A, Cutt H, Pikora TJ, Bull FC, Knuiman M, Bulsara M,Van NK, Shilton T: Development of a reliable measure of walking withinand outside the local neighborhood: RESIDE’s Neighborhood PhysicalActivity Questionnaire. Prev Med 2006, 42:455–459.
Müller-Riemenschneider et al. BMC Public Health 2013, 13:755 Page 9 of 9http://www.biomedcentral.com/1471-2458/13/755
39. Foster S, Giles-Corti B: The built environment, neighborhood crime andconstrained physical activity: an exploration of inconsistent findings.Prev Med 2008, 47:241–251.
40. Foster S, Giles-Corti B, Knuiman M: Neighbourhood design and fear ofcrime: a social-ecological examination of the correlates of residents’ fearin new suburban housing developments. Health Place 2010, 16:1156–1165.
41. Mujahid MS, Ez Roux AV, Morenoff JD, Raghunathan TE, Cooper RS, Ni H,Shea S: Neighborhood characteristics and hypertension. Epidemiology2008, 19:590–598.
42. Chan JM, Rimm EB, Colditz GA, Stampfer MJ, Willett WC: Obesity, fatdistribution, and weight gain as risk factors for clinical diabetes in men.Diabetes Care 1994, 17:961–969.
43. Colditz GA, Willett WC, Rotnitzky A, Manson JE: Weight Gain as a RiskFactor for Clinical Diabetes Mellitus in Women. Ann Intern Med 1995,122:481–486.
44. Paulweber B, Valensi P, Lindstrom J, Lalic NM, Greaves CJ, McKee M,Kissimova-Skarbek K, Liatis S, Cosson E, Szendroedi J, et al: A Europeanevidence-based guideline for the prevention of type 2 diabetes. Horm MetabRes 2010, 42(Suppl 1):S3–S36.
45. Brown BB, Yamada I, Smith KR, Zick CD, Kowaleski-Jones L, Fan JX: Mixed landuse and walkability: Variations in land use measures and relationships withBMI, overweight, and obesity. Health Place 2009, 15:1130–1141.
46. Giles-Corti B, Bull F, Knuiman M, McCormack G, Van NK, Timperio A,Christian H, Foster S, Divitini M, Middleton N, et al: The influence of urbandesign on neighbourhood walking following residential relocation:longitudinal results from the RESIDE study. Soc Sci Med 2013, 77:20–30.
47. Rydin Y, Bleahu A, Davies M, Davila JD, Friel S, De GG, Groce N, Hallal PC,Hamilton I, Howden-Chapman P, et al: Shaping cities for health:complexity and the planning of urban environments in the 21st century.Lancet 2012, 379:2079–2108.
doi:10.1186/1471-2458-13-755Cite this article as: Müller-Riemenschneider et al.: Neighborhoodwalkability and cardiometabolic risk factors in australian adults: anobservational study. BMC Public Health 2013 13:755.
Submit your next manuscript to BioMed Centraland take full advantage of:
• Convenient online submission
• Thorough peer review
• No space constraints or color figure charges
• Immediate publication on acceptance
• Inclusion in PubMed, CAS, Scopus and Google Scholar
• Research which is freely available for redistribution
Submit your manuscript at www.biomedcentral.com/submit
Copyright © 2022 FDOKUMEN