Anthropometric cut points for identification of cardiometabolic risk factors in an urban Asian...
8
Anthropometric cut points for identification of cardiometabolic risk factors in an urban Asian Indian population Viswanathan Mohan a, 4 , Mohan Deepa a , Syed Farooq a , K.M. Venkat Narayan b , Manjula Datta c , Raj Deepa a a Madras Diabetes Research Foundation & Dr. Mohan’s Diabetes Specialities Centre, Gopalapuram, Chennai 600 086, India b Hubert Department of Global Health, The Rollins School of Public Health, Emory University, Atlanta, GA 30322, USA c Department of Epidemiology, The Tamil Nadu Dr. M.G.R. Medical University, Chennai 600 032, India Received 15 December 2006; accepted 12 February 2007 Abstract The aim of this study was to determine the anthropometric cut points for risk of cardiometabolic risk factors in an urban Asian Indian population. The Chennai Urban Rural Epidemiology Study representatively sampled 26 001 individuals aged 20 years or older and detailed measures were obtained in every 10th subject: 90.4% (2350/2600). An oral glucose tolerance test was performed in all individuals except self-reported diabetic subjects. Anthropometric measurements such as body mass index (BMI) and waist circumference (WC) were obtained and serum lipid estimations were done in all subjects. Sensitivity, specificity, and distance on receiver operating characteristic curve were used to determine the optimal cut points for BMI and WC with cardiometabolic risk factors. Maximum sensitivity and specificity of BMI for all cardiometabolic risk factors such as diabetes mellitus, prediabetes, hypertension, hypertriglyceridemia, hypercholesterolemia, and low high-density lipoprotein cholesterol ranged from 22.7 to 23.2 kg/m 2 for men and 22.7 to 23.8 kg/m 2 for women, and that of WC ranged from 86 to 88.2 cm for men and 81 to 83.8 cm for women. The optimal BMI cut point for identifying any 2 cardiometabolic risk factors was 23 kg/m 2 in both sexes, whereas that of WC was 87 cm for men and 82 cm for women. The study validates the World Health Organization Asia Pacific guidelines of BMI of 23 kg/m 2 for the designation of overweight; WC of 87 cm for men and 82 cm for women appear to be appropriate cut points to identify cardiometabolic risk factors including prediabetes in urban Asian Indians. D 2007 Elsevier Inc. All rights reserved. 1. Introduction Several epidemiologic studies have shown that South Asians have higher amounts of body fat at lower body mass index (BMI) and waist circumference (WC) than do Europeans, and this contributes to the higher prevalence of cardiovascular risk factors at lesser degrees of obesity [1-3]. South Asians also have greater predisposition to abdominal obesity and visceral fat [4-10]. This is attributed to the so-called bAsian Indian phenotypeQ characterized by increased WC despite lower body mass indices, increased visceral fat [3], and greater insulin resistance [11]. Thus, the application of the current World Health Organization (WHO) BMI cut points of 25 or higher to define overweight and 30 or higher for obesity will underestimate obesity- related risks in these populations [2]. Cut points for obesity as defined by the WHO [12] are based on BMI values derived from studies looking at the relationship between BMI and cardiovascular disease in Western populations [13,14]. Lower cut point values of BMI to define overweight ( z 23 kg/m 2 ) and obesity ( z 25 kg/m 2 ) and lower limits of WC to define abdominal obesity ( z 90 cm in men and z 80 cm in women) have recently been proposed for Asians by the WHO Asia Pacific guidelines [15]. It is necessary to validate these cut points in Asian populations. This study was undertaken to validate the cut points for generalized obesity (BMI) and abdominal obesity (WC) with individual cardiometabolic risk factors such as diabetes mellitus, prediabetes, hypertension, hyper- cholesterolemia, hypertriglyceridemia, and low high-density lipoprotein (HDL) cholesterol based on Asian Indians who have very high rates of type 2 diabetes mellitus [16] and premature coronary artery disease [17]. 0026-0495/$ – see front matter D 2007 Elsevier Inc. All rights reserved. doi:10.1016/j.metabol.2007.02.009 4 Corresponding author. Tel.: +91 44 2835 9048; fax: +91 44 2835 0935. E-mail address: [email protected] (V. Mohan). URL: http://www.drmohansdiabetes.com Metabolism Clinical and Experimental 56 (2007) 961 – 968 www.elsevier.com/locate/metabol
-
Upload
independent -
Category
Documents
-
view
3 -
download
0
Transcript of Anthropometric cut points for identification of cardiometabolic risk factors in an urban Asian...
www.elsevier.com/locate/metabol
Metabolism Clinical and E
Anthropometric cut points for identification of cardiometabolic risk factors
in an urban Asian Indian population
Viswanathan Mohana,4, Mohan Deepaa, Syed Farooqa, K.M. Venkat Narayanb,
Manjula Dattac, Raj Deepaa
aMadras Diabetes Research Foundation & Dr. Mohan’s Diabetes Specialities Centre, Gopalapuram, Chennai 600 086, IndiabHubert Department of Global Health, The Rollins School of Public Health, Emory University, Atlanta, GA 30322, USA
cDepartment of Epidemiology, The Tamil Nadu Dr. M.G.R. Medical University, Chennai 600 032, India
Received 15 December 2006; accepted 12 February 2007
Abstract
The aim of this study was to determine the anthropometric cut points for risk of cardiometabolic risk factors in an urban Asian Indian
population. The Chennai Urban Rural Epidemiology Study representatively sampled 26001 individuals aged 20 years or older and
detailed measures were obtained in every 10th subject: 90.4% (2350/2600). An oral glucose tolerance test was performed in all individuals
except self-reported diabetic subjects. Anthropometric measurements such as body mass index (BMI) and waist circumference (WC) were
obtained and serum lipid estimations were done in all subjects. Sensitivity, specificity, and distance on receiver operating characteristic
curve were used to determine the optimal cut points for BMI and WC with cardiometabolic risk factors. Maximum sensitivity and
specificity of BMI for all cardiometabolic risk factors such as diabetes mellitus, prediabetes, hypertension, hypertriglyceridemia,
hypercholesterolemia, and low high-density lipoprotein cholesterol ranged from 22.7 to 23.2 kg/m2 for men and 22.7 to 23.8 kg/m2 for
women, and that of WC ranged from 86 to 88.2 cm for men and 81 to 83.8 cm for women. The optimal BMI cut point for identifying any
2 cardiometabolic risk factors was 23 kg/m2 in both sexes, whereas that of WC was 87 cm for men and 82 cm for women. The study
validates the World Health Organization Asia Pacific guidelines of BMI of 23 kg/m2 for the designation of overweight; WC of 87 cm for
men and 82 cm for women appear to be appropriate cut points to identify cardiometabolic risk factors including prediabetes in urban
Asian Indians.
D 2007 Elsevier Inc. All rights reserved.
1. Introduction and 30 or higher for obesity will underestimate obesity-
Several epidemiologic studies have shown that South
Asians have higher amounts of body fat at lower body mass
index (BMI) and waist circumference (WC) than do
Europeans, and this contributes to the higher prevalence
of cardiovascular risk factors at lesser degrees of obesity
[1-3]. South Asians also have greater predisposition to
abdominal obesity and visceral fat [4-10]. This is attributed
to the so-called bAsian Indian phenotypeQ characterized by
increased WC despite lower body mass indices, increased
visceral fat [3], and greater insulin resistance [11]. Thus, the
application of the current World Health Organization
(WHO) BMI cut points of 25 or higher to define overweight
0026-0495/$ – see front matter D 2007 Elsevier Inc. All rights reserved.
doi:10.1016/j.metabol.2007.02.009
4 Corresponding author. Tel.: +91 44 2835 9048; fax: +91 44 2835
0935.
E-mail address: [email protected] (V. Mohan).
URL: http://www.drmohansdiabetes.com
related risks in these populations [2].
Cut points for obesity as defined by the WHO [12] are
based on BMI values derived from studies looking at the
relationship between BMI and cardiovascular disease in
Western populations [13,14]. Lower cut point values of BMI
to define overweight (z23 kg/m2) and obesity (z25 kg/m2)
and lower limits of WC to define abdominal obesity
(z90 cm in men and z80 cm in women) have recently
been proposed for Asians by the WHO Asia Pacific
guidelines [15]. It is necessary to validate these cut points
in Asian populations. This study was undertaken to validate
the cut points for generalized obesity (BMI) and abdominal
obesity (WC) with individual cardiometabolic risk factors
such as diabetes mellitus, prediabetes, hypertension, hyper-
cholesterolemia, hypertriglyceridemia, and low high-density
lipoprotein (HDL) cholesterol based on Asian Indians who
have very high rates of type 2 diabetes mellitus [16] and
premature coronary artery disease [17].
xperimental 56 (2007) 961–968

V. Mohan et al. / Metabolism Clinical and Experimental 56 (2007) 961–968962
2. Study design
The Chennai Urban Rural Epidemiology Study
(CURES) is a large cross-sectional study done on a
representative population of Chennai (formerly Madras)
city in southern India with a population of about 5
million people. The detailed study design of CURES is
described elsewhere [18] and the sampling frame is
shown on our Web site (http://www.drmohansdiabetes.-
com/mdrf/CURES.pdf).
Briefly, in phase 1 of the urban component on CURES,
26001 individuals (aged z20 years) were recruited based
on a systematic random sampling technique. A detailed
questionnaire was administered to all study subjects to
collect information regarding demographic, socioeconomic,
behavioral, and health status. A fasting capillary blood
sugar, blood pressure, and basic anthropometric measures
were done in all individuals.
Phase 2 of CURES deals with studies on the prevalence
of microvascular and macrovascular complications of
diabetes. Phases 1 and 2 are not discussed further in
this article.
In phase 3 of CURES, every 10th subject recruited in
phase 1 (n = 2600) was invited to our center for detailed
anthropometric measurements and biochemical tests. Of
these, 2350 participated in the present study (response
rate, 90.4%). This sample is thus representative of the
Chennai population.
All the study subjects underwent an oral glucose tolerance
test using 75 g glucose load, except self-reported diabetic
subjects, for whom fasting venous plasma glucose was
measured. After 8 hours of overnight fasting, the fasting
blood sample was taken for estimation of plasma glucose and
serum lipids with a Hitachi 912 Autoanalyser (Roche
Diagnostics, Mannheim, Germany) using kits supplied by
Boehringer Mannheim (Mannheim, Germany). Glycated
hemoglobin level was measured by the high-pressure liquid
chromatography method using the Variant machine (BIO-
RAD, Hercules, CA). Anthropometric measurements includ-
ing weight, height, and waist and hip measurements were
obtained using standardized techniques [18].
Height was measured with a tape to the nearest
centimeter. Subjects were requested to stand upright without
shoes with their back against the wall, heels together, and
eyes directed forward.
Weight was measured with a traditional spring balance
that was kept on a firm horizontal surface. Subjects were
asked to wear light clothing, and weight was recorded to the
nearest 0.5 kg.
Body mass index (BMI) was calculated by using the
formula weight (kg)/height (m)2.
Waist circumference was measured by using a non-
stretchable measuring tape. The subjects were asked to
stand erect in a relaxed position with both feet together
on a flat surface; one layer of clothing was accepted.
Waist girth was measured as the smallest horizontal girth
between the costal margins and the iliac crests at
minimal respiration.
Blood pressure was recorded in the sitting position in the
right arm to the nearest 2 mm Hg using the mercury
sphygmomanometer (Diamond Deluxe BP apparatus, Pune,
India). Two readings were taken 5 minutes apart and mean
of 2 was taken as the blood pressure.
The institutional ethical committee approval was obtained
and informed consent was obtained from all study subjects.
3. Definitions
3.1. Diabetes
Diagnosis of diabetes was based on WHO consulting
group criteria, ie, 2-hour postload (75 g glucose) plasma
glucose of 200 mg/dL or greater (z11.1 mmol/L) or self-
reported diabetic subjects under treatment by a physician [19].
3.2. Prediabetes
Prediabetes was diagnosed as the presence of impaired
glucose tolerance (IGT) and/or impaired fasting glucose
(IFG). IGT was diagnosed if the 2-hour plasma glucose was
140 mg/dL or greater (z7.8 mmol/L) and less than 200 mg/
dL (b11.1 mmol/L), and normal glucose tolerance (NGT)
if 2-hour plasma glucose was less than 140 mg/dL
(b7.8 mmol/L) [19]. IFG was diagnosed if the fasting
plasma glucose was 100 mg/dL or greater (z5.6 mmol/L)
and less than 126 mg/dL (b7.0 mmol/L) based on American
Diabetes Association definition [20].
3.3. Hypertension
Hypertension was diagnosed based on drug treatment for
hypertension or if the blood pressure was greater than 140/
90 mm Hg (Joint National Committee on Prevention,
Detection, Evaluation and Treatment of High Blood
Pressure criteria) [21].
3.4. Dyslipidemia
National Cholesterol Education Program guidelines [22]
were used for definition of dyslipidemia.
Hypercholesterolemia was diagnosed if serum cholesterol
levels were 200 mg/dL or greater (z5.2 mmol/L) or if
subjects were under drug treatment for hypercholesterolemia.
Hypertriglyceridemia was diagnosed if serum triglycer-
ide levels were 150 mg/dL or greater (z1.7 mmol/L) or
they were under drug treatment for hypertriglyceridemia.
Low HDL cholesterol was diagnosed if HDL cholesterol
levels were less than 40 mg/dL (b1.04 mmol/L) for men
and less than 50 mg/dL (b1.3 mmol/L) for women.
4. Statistical analysis
By varying the cut points of BMI and WC, sensitivity and
specificity were estimated for determining the presence or
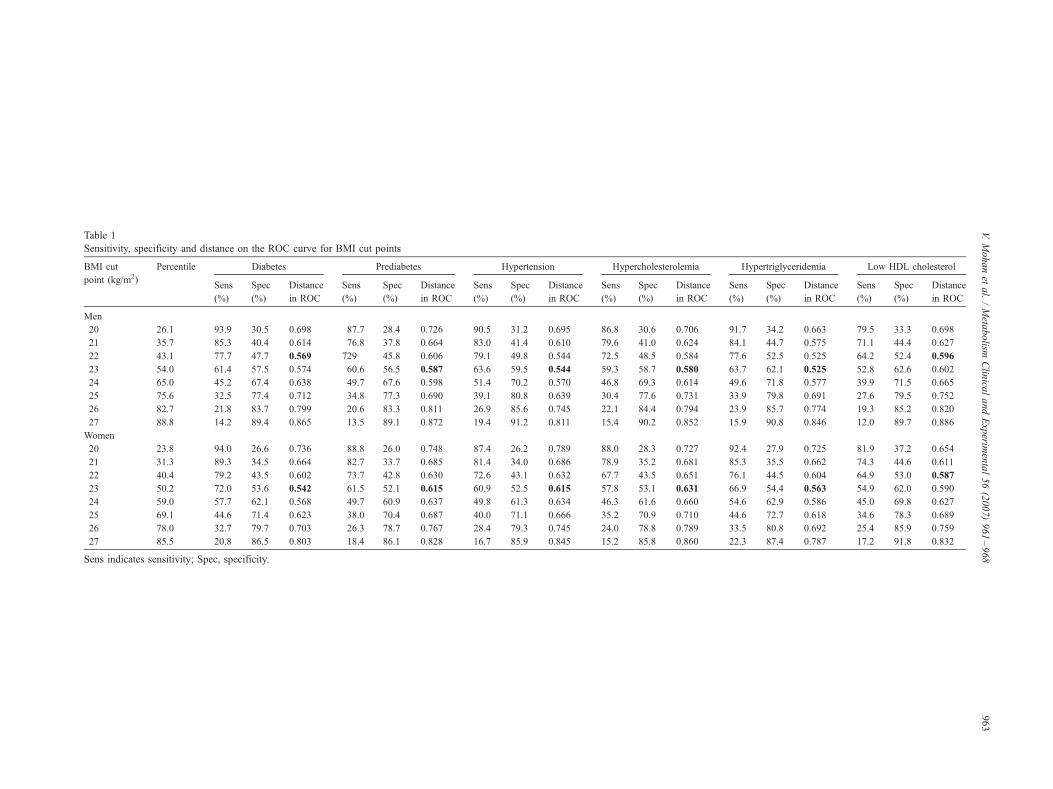
Table 1
Sensitivity, specificity and distance on the ROC curve for BMI cut points
BMI cut
point (kg/m2)
Percentile Diabetes Prediabetes Hypertension Hypercholesterolemia Hypertriglyceridemia Low HDL cholesterol
Sens
(%)
Spec
(%)
Distance
in ROC
Sens
(%)
Spec
(%)
Distance
in ROC
Sens
(%)
Spec
(%)
Distance
in ROC
Sens
(%)
Spec
(%)
Distance
in ROC
Sens
(%)
Spec
(%)
Distance
in ROC
Sens
(%)
Spec
(%)
Distance
in ROC
Men
20 26.1 93.9 30.5 0.698 87.7 28.4 0.726 90.5 31.2 0.695 86.8 30.6 0.706 91.7 34.2 0.663 79.5 33.3 0.698
21 35.7 85.3 40.4 0.614 76.8 37.8 0.664 83.0 41.4 0.610 79.6 41.0 0.624 84.1 44.7 0.575 71.1 44.4 0.627
22 43.1 77.7 47.7 0.569 729 45.8 0.606 79.1 49.8 0.544 72.5 48.5 0.584 77.6 52.5 0.525 64.2 52.4 0.596
23 54.0 61.4 57.5 0.574 60.6 56.5 0.587 63.6 59.5 0.544 59.3 58.7 0.580 63.7 62.1 0.525 52.8 62.6 0.602
24 65.0 45.2 67.4 0.638 49.7 67.6 0.598 51.4 70.2 0.570 46.8 69.3 0.614 49.6 71.8 0.577 39.9 71.5 0.665
25 75.6 32.5 77.4 0.712 34.8 77.3 0.690 39.1 80.8 0.639 30.4 77.6 0.731 33.9 79.8 0.691 27.6 79.5 0.752
26 82.7 21.8 83.7 0.799 20.6 83.3 0.811 26.9 85.6 0.745 22.1 84.4 0.794 23.9 85.7 0.774 19.3 85.2 0.820
27 88.8 14.2 89.4 0.865 13.5 89.1 0.872 19.4 91.2 0.811 15.4 90.2 0.852 15.9 90.8 0.846 12.0 89.7 0.886
Women
20 23.8 94.0 26.6 0.736 88.8 26.0 0.748 87.4 26.2 0.789 88.0 28.3 0.727 92.4 27.9 0.725 81.9 37.2 0.654
21 31.3 89.3 34.5 0.664 82.7 33.7 0.685 81.4 34.0 0.686 78.9 35.2 0.681 85.3 35.5 0.662 74.3 44.6 0.611
22 40.4 79.2 43.5 0.602 73.7 42.8 0.630 72.6 43.1 0.632 67.7 43.5 0.651 76.1 44.5 0.604 64.9 53.0 0.587
23 50.2 72.0 53.6 0.542 61.5 52.1 0.615 60.9 52.5 0.615 57.8 53.1 0.631 66.9 54.4 0.563 54.9 62.0 0.590
24 59.0 57.7 62.1 0.568 49.7 60.9 0.637 49.8 61.3 0.634 46.3 61.6 0.660 54.6 62.9 0.586 45.0 69.8 0.627
25 69.1 44.6 71.4 0.623 38.0 70.4 0.687 40.0 71.1 0.666 35.2 70.9 0.710 44.6 72.7 0.618 34.6 78.3 0.689
26 78.0 32.7 79.7 0.703 26.3 78.7 0.767 28.4 79.3 0.745 24.0 78.8 0.789 33.5 80.8 0.692 25.4 85.9 0.759
27 85.5 20.8 86.5 0.803 18.4 86.1 0.828 16.7 85.9 0.845 15.2 85.8 0.860 22.3 87.4 0.787 17.2 91.8 0.832
Sens indicates sensitivity; Spec, specificity.
V.Mohanet
al./Meta
bolism
Clin
icalandExperim
ental56(2007)961–968
963
V. Mohan et al. / Metabolism Clinical and Experimental 56 (2007) 961–968964
absence of the cardiometabolic risk factors such as diabetes,
prediabetes, hypertension, hypercholesterolemia, hypertri-
glyceridemia and low HDL cholesterol. Sensitivity was
defined by the proportion of subjects with a given risk factor
who where identified correctly by BMI or WC greater or
equal to the cut point. Specificity was defined by the
proportion of subjects without the risk factor who were
identified by BMI and WC below the cut point. The area
under the receiver operating characteristic (ROC) curves and
the 95% confidence intervals (CIs) were computed. The
distance on the ROC curve of each BMI and WC was
calculated as the square root of [(1 � sensitivity)2 + (1 �specificity)2]. The BMI or WC with the shortest distance on
the ROC curve was determined for each of the cardiometa-
bolic risk factors.
5. Results
Women had higher mean BMI than men (22.6 kg/m2
for men vs 23.1 kg/m2 for women; P = .007). The median
BMI for men was 22.8 kg/m2, and for women, 23 kg/m2.
The 25th, 50th, 75th, and 90th percentiles of BMI for men
and women were 19.9 and 20.2, 22.8 and 23, 25 and 25.7,
and 27.4 and 28 kg/m2, respectively. The mean WC value
was higher in men than in women (men: 85.4 cm vs
women: 81.7 cm, P b .001). The median WC for men and
women were 86.4 and 82 cm, respectively. The 25th, 50th,
75th, and 90th percentiles of WC for men and women
were 77.2 and 74, 86.4 and 82, 93.5 and 89, and 99.3 and
96.1 cm, respectively.
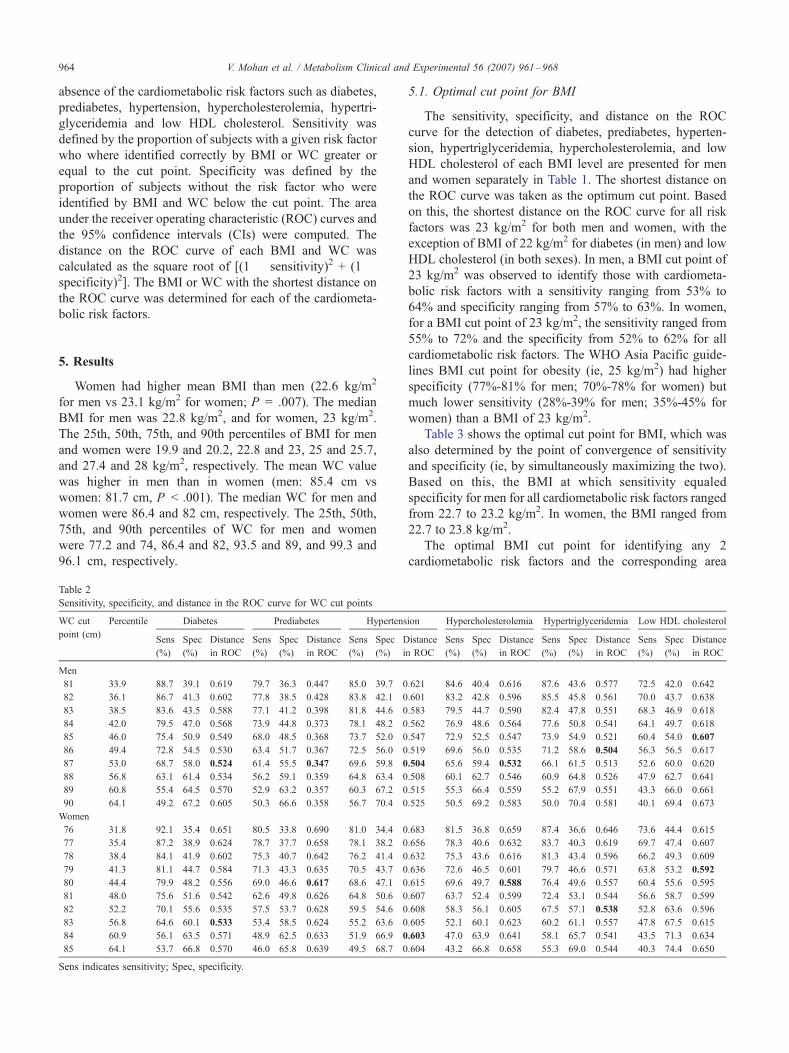
Table 2
Sensitivity, specificity, and distance in the ROC curve for WC cut points
WC cut
point (cm)
Percentile Diabetes Prediabetes Hypertens
Sens
(%)
Spec
(%)
Distance
in ROC
Sens
(%)
Spec
(%)
Distance
in ROC
Sens
(%)
Spec
(%)
D
i
Men
81 33.9 88.7 39.1 0.619 79.7 36.3 0.447 85.0 39.7 0
82 36.1 86.7 41.3 0.602 77.8 38.5 0.428 83.8 42.1 0
83 38.5 83.6 43.5 0.588 77.1 41.2 0.398 81.8 44.6 0
84 42.0 79.5 47.0 0.568 73.9 44.8 0.373 78.1 48.2 0
85 46.0 75.4 50.9 0.549 68.0 48.5 0.368 73.7 52.0 0
86 49.4 72.8 54.5 0.530 63.4 51.7 0.367 72.5 56.0 0
87 53.0 68.7 58.0 0.524 61.4 55.5 0.347 69.6 59.8 0
88 56.8 63.1 61.4 0.534 56.2 59.1 0.359 64.8 63.4 0
89 60.8 55.4 64.5 0.570 52.9 63.2 0.357 60.3 67.2 0
90 64.1 49.2 67.2 0.605 50.3 66.6 0.358 56.7 70.4 0
Women
76 31.8 92.1 35.4 0.651 80.5 33.8 0.690 81.0 34.4 0
77 35.4 87.2 38.9 0.624 78.7 37.7 0.658 78.1 38.2 0
78 38.4 84.1 41.9 0.602 75.3 40.7 0.642 76.2 41.4 0
79 41.3 81.1 44.7 0.584 71.3 43.3 0.635 70.5 43.7 0
80 44.4 79.9 48.2 0.556 69.0 46.6 0.617 68.6 47.1 0
81 48.0 75.6 51.6 0.542 62.6 49.8 0.626 64.8 50.6 0
82 52.2 70.1 55.6 0.535 57.5 53.7 0.628 59.5 54.6 0
83 56.8 64.6 60.1 0.533 53.4 58.5 0.624 55.2 63.6 0
84 60.9 56.1 63.5 0.571 48.9 62.5 0.633 51.9 66.9 0
85 64.1 53.7 66.8 0.570 46.0 65.8 0.639 49.5 68.7 0
Sens indicates sensitivity; Spec, specificity.
5.1. Optimal cut point for BMI
The sensitivity, specificity, and distance on the ROC
curve for the detection of diabetes, prediabetes, hyperten-
sion, hypertriglyceridemia, hypercholesterolemia, and low
HDL cholesterol of each BMI level are presented for men
and women separately in Table 1. The shortest distance on
the ROC curve was taken as the optimum cut point. Based
on this, the shortest distance on the ROC curve for all risk
factors was 23 kg/m2 for both men and women, with the
exception of BMI of 22 kg/m2 for diabetes (in men) and low
HDL cholesterol (in both sexes). In men, a BMI cut point of
23 kg/m2 was observed to identify those with cardiometa-
bolic risk factors with a sensitivity ranging from 53% to
64% and specificity ranging from 57% to 63%. In women,
for a BMI cut point of 23 kg/m2, the sensitivity ranged from
55% to 72% and the specificity from 52% to 62% for all
cardiometabolic risk factors. The WHO Asia Pacific guide-
lines BMI cut point for obesity (ie, 25 kg/m2) had higher
specificity (77%-81% for men; 70%-78% for women) but
much lower sensitivity (28%-39% for men; 35%-45% for
women) than a BMI of 23 kg/m2.
Table 3 shows the optimal cut point for BMI, which was
also determined by the point of convergence of sensitivity
and specificity (ie, by simultaneously maximizing the two).
Based on this, the BMI at which sensitivity equaled
specificity for men for all cardiometabolic risk factors ranged
from 22.7 to 23.2 kg/m2. In women, the BMI ranged from
22.7 to 23.8 kg/m2.
The optimal BMI cut point for identifying any 2
cardiometabolic risk factors and the corresponding area
ion Hypercholesterolemia Hypertriglyceridemia Low HDL cholesterol
istance
n ROC
Sens
(%)
Spec
(%)
Distance
in ROC
Sens
(%)
Spec
(%)
Distance
in ROC
Sens
(%)
Spec
(%)
Distance
in ROC
.621 84.6 40.4 0.616 87.6 43.6 0.577 72.5 42.0 0.642
.601 83.2 42.8 0.596 85.5 45.8 0.561 70.0 43.7 0.638
.583 79.5 44.7 0.590 82.4 47.8 0.551 68.3 46.9 0.618
.562 76.9 48.6 0.564 77.6 50.8 0.541 64.1 49.7 0.618
.547 72.9 52.5 0.547 73.9 54.9 0.521 60.4 54.0 0.607
.519 69.6 56.0 0.535 71.2 58.6 0.504 56.3 56.5 0.617
.504 65.6 59.4 0.532 66.1 61.5 0.513 52.6 60.0 0.620
.508 60.1 62.7 0.546 60.9 64.8 0.526 47.9 62.7 0.641
.515 55.3 66.4 0.559 55.2 67.9 0.551 43.3 66.0 0.661
.525 50.5 69.2 0.583 50.0 70.4 0.581 40.1 69.4 0.673
.683 81.5 36.8 0.659 87.4 36.6 0.646 73.6 44.4 0.615
.656 78.3 40.6 0.632 83.7 40.3 0.619 69.7 47.4 0.607
.632 75.3 43.6 0.616 81.3 43.4 0.596 66.2 49.3 0.609
.636 72.6 46.5 0.601 79.7 46.6 0.571 63.8 53.2 0.592
.615 69.6 49.7 0.588 76.4 49.6 0.557 60.4 55.6 0.595
.607 63.7 52.4 0.599 72.4 53.1 0.544 56.6 58.7 0.599
.608 58.3 56.1 0.605 67.5 57.1 0.538 52.8 63.6 0.596
.605 52.1 60.1 0.623 60.2 61.1 0.557 47.8 67.5 0.615
.603 47.0 63.9 0.641 58.1 65.7 0.541 43.5 71.3 0.634
.604 43.2 66.8 0.658 55.3 69.0 0.544 40.3 74.4 0.650
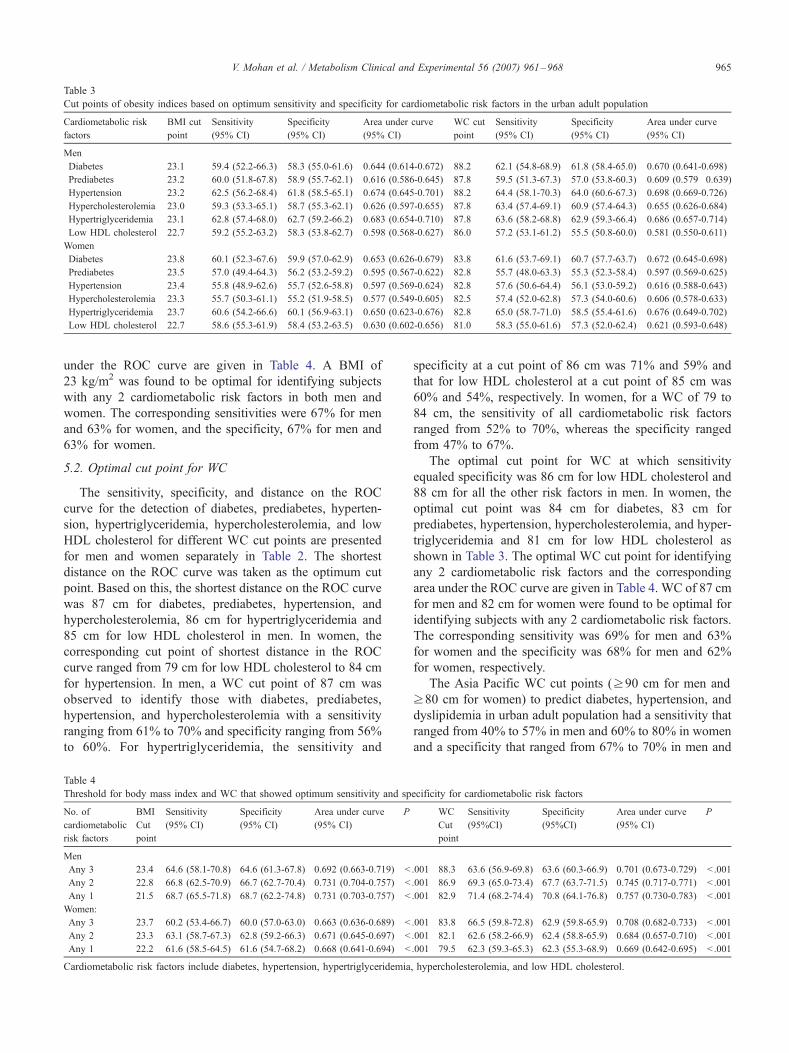
Table 3
Cut points of obesity indices based on optimum sensitivity and specificity for cardiometabolic risk factors in the urban adult population
Cardiometabolic risk
factors
BMI cut
point
Sensitivity
(95% CI)
Specificity
(95% CI)
Area under curve
(95% CI)
WC cut
point
Sensitivity
(95% CI)
Specificity
(95% CI)
Area under curve
(95% CI)
Men
Diabetes 23.1 59.4 (52.2-66.3) 58.3 (55.0-61.6) 0.644 (0.614-0.672) 88.2 62.1 (54.8-68.9) 61.8 (58.4-65.0) 0.670 (0.641-0.698)
Prediabetes 23.2 60.0 (51.8-67.8) 58.9 (55.7-62.1) 0.616 (0.586-0.645) 87.8 59.5 (51.3-67.3) 57.0 (53.8-60.3) 0.609 (0.579�0.639)Hypertension 23.2 62.5 (56.2-68.4) 61.8 (58.5-65.1) 0.674 (0.645-0.701) 88.2 64.4 (58.1-70.3) 64.0 (60.6-67.3) 0.698 (0.669-0.726)
Hypercholesterolemia 23.0 59.3 (53.3-65.1) 58.7 (55.3-62.1) 0.626 (0.597-0.655) 87.8 63.4 (57.4-69.1) 60.9 (57.4-64.3) 0.655 (0.626-0.684)
Hypertriglyceridemia 23.1 62.8 (57.4-68.0) 62.7 (59.2-66.2) 0.683 (0.654-0.710) 87.8 63.6 (58.2-68.8) 62.9 (59.3-66.4) 0.686 (0.657-0.714)
Low HDL cholesterol 22.7 59.2 (55.2-63.2) 58.3 (53.8-62.7) 0.598 (0.568-0.627) 86.0 57.2 (53.1-61.2) 55.5 (50.8-60.0) 0.581 (0.550-0.611)
Women
Diabetes 23.8 60.1 (52.3-67.6) 59.9 (57.0-62.9) 0.653 (0.626-0.679) 83.8 61.6 (53.7-69.1) 60.7 (57.7-63.7) 0.672 (0.645-0.698)
Prediabetes 23.5 57.0 (49.4-64.3) 56.2 (53.2-59.2) 0.595 (0.567-0.622) 82.8 55.7 (48.0-63.3) 55.3 (52.3-58.4) 0.597 (0.569-0.625)
Hypertension 23.4 55.8 (48.9-62.6) 55.7 (52.6-58.8) 0.597 (0.569-0.624) 82.8 57.6 (50.6-64.4) 56.1 (53.0-59.2) 0.616 (0.588-0.643)
Hypercholesterolemia 23.3 55.7 (50.3-61.1) 55.2 (51.9-58.5) 0.577 (0.549-0.605) 82.5 57.4 (52.0-62.8) 57.3 (54.0-60.6) 0.606 (0.578-0.633)
Hypertriglyceridemia 23.7 60.6 (54.2-66.6) 60.1 (56.9-63.1) 0.650 (0.623-0.676) 82.8 65.0 (58.7-71.0) 58.5 (55.4-61.6) 0.676 (0.649-0.702)
Low HDL cholesterol 22.7 58.6 (55.3-61.9) 58.4 (53.2-63.5) 0.630 (0.602-0.656) 81.0 58.3 (55.0-61.6) 57.3 (52.0-62.4) 0.621 (0.593-0.648)
V. Mohan et al. / Metabolism Clinical and Experimental 56 (2007) 961–968 965
under the ROC curve are given in Table 4. A BMI of
23 kg/m2 was found to be optimal for identifying subjects
with any 2 cardiometabolic risk factors in both men and
women. The corresponding sensitivities were 67% for men
and 63% for women, and the specificity, 67% for men and
63% for women.
5.2. Optimal cut point for WC
The sensitivity, specificity, and distance on the ROC
curve for the detection of diabetes, prediabetes, hyperten-
sion, hypertriglyceridemia, hypercholesterolemia, and low
HDL cholesterol for different WC cut points are presented
for men and women separately in Table 2. The shortest
distance on the ROC curve was taken as the optimum cut
point. Based on this, the shortest distance on the ROC curve
was 87 cm for diabetes, prediabetes, hypertension, and
hypercholesterolemia, 86 cm for hypertriglyceridemia and
85 cm for low HDL cholesterol in men. In women, the
corresponding cut point of shortest distance in the ROC
curve ranged from 79 cm for low HDL cholesterol to 84 cm
for hypertension. In men, a WC cut point of 87 cm was
observed to identify those with diabetes, prediabetes,
hypertension, and hypercholesterolemia with a sensitivity
ranging from 61% to 70% and specificity ranging from 56%
to 60%. For hypertriglyceridemia, the sensitivity and
Table 4
Threshold for body mass index and WC that showed optimum sensitivity and sp
No. of
cardiometabolic
risk factors
BMI
Cut
point
Sensitivity
(95% CI)
Specificity
(95% CI)
Area under curve
(95% CI)
P
Men
Any 3 23.4 64.6 (58.1-70.8) 64.6 (61.3-67.8) 0.692 (0.663-0.719) b
Any 2 22.8 66.8 (62.5-70.9) 66.7 (62.7-70.4) 0.731 (0.704-0.757) b
Any 1 21.5 68.7 (65.5-71.8) 68.7 (62.2-74.8) 0.731 (0.703-0.757) b
Women:
Any 3 23.7 60.2 (53.4-66.7) 60.0 (57.0-63.0) 0.663 (0.636-0.689) b
Any 2 23.3 63.1 (58.7-67.3) 62.8 (59.2-66.3) 0.671 (0.645-0.697) b
Any 1 22.2 61.6 (58.5-64.5) 61.6 (54.7-68.2) 0.668 (0.641-0.694) b
Cardiometabolic risk factors include diabetes, hypertension, hypertriglyceridemia
specificity at a cut point of 86 cm was 71% and 59% and
that for low HDL cholesterol at a cut point of 85 cm was
60% and 54%, respectively. In women, for a WC of 79 to
84 cm, the sensitivity of all cardiometabolic risk factors
ranged from 52% to 70%, whereas the specificity ranged
from 47% to 67%.
The optimal cut point for WC at which sensitivity
equaled specificity was 86 cm for low HDL cholesterol and
88 cm for all the other risk factors in men. In women, the
optimal cut point was 84 cm for diabetes, 83 cm for
prediabetes, hypertension, hypercholesterolemia, and hyper-
triglyceridemia and 81 cm for low HDL cholesterol as
shown in Table 3. The optimal WC cut point for identifying
any 2 cardiometabolic risk factors and the corresponding
area under the ROC curve are given in Table 4. WC of 87 cm
for men and 82 cm for women were found to be optimal for
identifying subjects with any 2 cardiometabolic risk factors.
The corresponding sensitivity was 69% for men and 63%
for women and the specificity was 68% for men and 62%
for women, respectively.
The Asia Pacific WC cut points (z90 cm for men and
z80 cm for women) to predict diabetes, hypertension, and
dyslipidemia in urban adult population had a sensitivity that
ranged from 40% to 57% in men and 60% to 80% in women
and a specificity that ranged from 67% to 70% in men and
ecificity for cardiometabolic risk factors
WC
Cut
point
Sensitivity
(95%CI)
Specificity
(95%CI)
Area under curve
(95% CI)
P
.001 88.3 63.6 (56.9-69.8) 63.6 (60.3-66.9) 0.701 (0.673-0.729) b .001
.001 86.9 69.3 (65.0-73.4) 67.7 (63.7-71.5) 0.745 (0.717-0.771) b .001
.001 82.9 71.4 (68.2-74.4) 70.8 (64.1-76.8) 0.757 (0.730-0.783) b .001
.001 83.8 66.5 (59.8-72.8) 62.9 (59.8-65.9) 0.708 (0.682-0.733) b .001
.001 82.1 62.6 (58.2-66.9) 62.4 (58.8-65.9) 0.684 (0.657-0.710) b .001
.001 79.5 62.3 (59.3-65.3) 62.3 (55.3-68.9) 0.669 (0.642-0.695) b .001
, hypercholesterolemia, and low HDL cholesterol.
V. Mohan et al. / Metabolism Clinical and Experimental 56 (2007) 961–968966
47% to 56% in women for identifying individual cardio-
metabolic risk factors (Table 2). Using the optimal cut
points observed in the present study (WC z87 cm for men
and z82 cm for women), we found the sensitivity ranged
from 53% to 70% in both men and women and the
specificity ranged from 56% to 62% in men and 54% to
64% in women for identifying individual cardiometabolic
risk factors.
6. Discussion
This study is the first to evaluate the new WHO Asia
Pacific cut points for BMI and WC in Asian Indians with
respect to cardiometabolic risk factors. It is also the first, to
our knowledge, to assess the new cut points in relation to
prediabetes (IGT/IFG) in an Asian population.
To determine an optimum cut point for obesity indices,
several criteria have been proposed in different studies, for
example, greatest sum of sensitivity and specificity,
equivalence of positive and negative predictive value, and
the shortest distance in the ROC curve [23-26]. Based on the
sensitivity, specificity, and ROC calculations, our data
suggest a BMI of 23 kg/m2 for the designation of
overweight and a WC of 87 cm for men and 82 cm for
women to be the most appropriate cut points to identify
cardiometabolic risk factors in urban Asian Indians.
The National Cholesterol Education Program Adult
Treatment Panel III WC cut point (z102 cm for men and
z88 cm for women) may be suitable for Europeans but not
for Asians. Even in the non-Asian populations, lowerWC cut
points have been reported for several populations including
Nigeria, Cameroon, Jamaica, St Lucia and Barbados [27],
Brazil [28], Mexico [29], and Iran [30]. The need for setting
lower cut points ofWC in Asians has been reported in several
Asian populations including Japanese [31], Malays [32],
Taiwanese [33], and Chinese [34]. The largeWHOMONICA
study conducted on 32978 subjects from 19 populations
came out with an observation that a substantial proportion of
those who would need health advice would be missed
according to the presently accepted bWesternQWC cut points
(action level 1: men, z 94 cm, and women, z 80 cm; action
level 2: men, z 102 cm, and women, z 88 cm) and
emphasized the need for population-specific WC cut points
[35]. A meta-analysis of data from 13 population-based
studies that included 239972 adults in China and Taiwan
showed that a BMI of 24 kg/m2 had the best sensitivity and
specificity for identification of cardiovascular risk factors,
and if this target is achieved it would prevent approximately
50% clustering of cardiovascular risk factors [34].
Several studies have examined appropriate cut points to
define overweight and obesity in Asian populations. The cut
points proposed in the present study to define generalized
(based on BMI) and abdominal obesity (based on WC) are
marginally lower than those recommended in the WHO
Asia Pacific guidelines, with the exception of WC for
women. Most studies have suggested a BMI cut point of
22 to 24 kg/m2 for men and women and a WC cut point
near 80 to 85 cm for men and 75 to 80 cm for women
[36-41]. The findings of the Working Group on Obesity in
China recommended a WC of 85 cm for men and 80 cm for
women as the optimal cut point [39]. Studies on a North
Indian population reported a WC of 78 cm in men and 72 cm
in women were optimal in identifying those with at least
one cardiometabolic risk factor [42]. A BMI of less than
22 kg/m2 has also been reported to be the bnormalQ BMI for
a North Indian population [43,44]. However, these studies
were carried out predominantly on a slum population
representing poorer socioeconomic status and this may
explain the lower figures. A study on the Pakistani
population reported a BMI of 21.2 and 22.1 kg/m2 in men
and 21.2 and 22.9 kg/m2 in women to be optimal for the
association with hypertension and diabetes, respectively,
and thus supports the use of a lower cut point of BMI
(23 kg/m2 or even lower) for identification of subjects with
hypertension and diabetes in Indo-Asian populations [45]. A
study on urban adult population from 6 cities in India [46]
had reported a BMI less than 23 kg/m2 and WC of 85 cm for
men and 80 cm for women as the optimal cut point values;
however, that study looked at only diabetes and used
capillary blood glucose for diagnosing diabetes. The present
study is based on a large representative population of a
metropolitan city, Chennai is representative of urban India
and uses venous plasma glucose samples. Finally, the study
is the first in India to evaluate the predictive performance of
BMI and WC for the risk of each of the metabolic
abnormalities including prediabetes and lipid abnormalities.
The present study illustrates the potential limitations of
applying uniform BMI and WC cut points to assess the
health risk of individuals globally. The cut points for WC
are likely to be population specific as there are clear
differences across ethnic populations in the relationship
among overall adiposity, abdominal obesity, and visceral fat
accumulation. The recent International Diabetes Federation
definition for metabolic syndrome [47] therefore quite
recently placed emphasis on developing criteria for central
obesity, which would be appropriate for a wide variety of
populations, and has come out with ethnic group-specific
cut points that are also consistent with the WHO recom-
mendations for Asian Indians [15]. These ethnic-specific
WC cut points were based on available data linking WC to
other components of the metabolic syndrome in different
populations. Moreover, the International Diabetes Federa-
tion and WHO labeled these recommendations as provi-
sional and called for their validation by additional clinical
and epidemiologic studies in different ethnic groups. Our
study reports cut points (WC z87 cm for men and z82 cm
for women) as the most appropriate for this urban south
Indian population. A recent meta-analysis [48] reported
better outcomes for cardiovascular and total mortality in
overweight and mildly obese subjects questioning the need
for trying to find cut points for obesity. However, the
authors themselves suggest that these findings could be
V. Mohan et al. / Metabolism Clinical and Experimental 56 (2007) 961–968 967
explained by the lack of discriminatory power of BMI to
differentiate between body fat and lean mass. It would be
worthwhile looking at the effect of WC with mortality and
to include non-European populations in future analysis.
The results are of great significance as they would be
largely applicable to other South Asian populations. This
study also evaluates the cut point of BMI and WC for
determining the risk of prediabetes for the first time in a
South Asian population. However, there are some limita-
tions of the study. First, it is done in an urban population,
which is relatively more affluent than rural areas where in
fact 70% of the Indian population lives. Second, being a
cross-sectional study, no cause or effect relationship with
cardiometabolic diseases can be drawn. Finally, the cut
points are based on cardiometabolic risk factors rather than
clinical end points or mortality data. Prospective studies are
needed to relate the BMI and WC cut points to the incidence
of diabetes, hypertension, dyslipidemia, and cardiovascular
disease events such as myocardial infarction or all-cause
mortality to throw more light on the relationship of obesity
to disease-related end points in South Asians.
Acknowledgments
We are grateful to the Chennai Willingdon Corporate
Foundation, Chennai, for the financial support provided for
the study. We thank the epidemiology team members for
conducting the CURES field studies. This is the 43rd
publication from CURES.
References
[1] Qiao Q, Hu G, Tuomilehto J, Nakagami T, Balkau B, Borch-Johnsen
K, et al. Age- and sex-specific prevalence of diabetes and impaired
glucose regulation in 11 Asian cohorts. Diabetes Care 2003;26:
1770-80.
[2] WHO expert consultation. Appropriate body-mass index for Asian
populations and its implications for policy and intervention strategies.
Lancet 2004;363:157-63.
[3] Raji A, Seely EW, Arky RA, Simonson DC. Body fat distribution and
insulin resistance in healthy Asian Indians and Caucasians. J Clin
Endocrinol Metab 2001;86:5366-71.
[4] Deurenberg-Yap M, Yian TB, Kai CS, Deurenberg P, van Staveren
WA. Manifestation of cardiovascular risk factors at low levels of body
mass index and waist-to-hip ratio in Singaporean Chinese. Asia Pac J
Clin Nutr 1999;8:177-83.
[5] Hsieh SD, Yoshinaga H, Muto T, Sakurai Y, Kosaka K. Health risks
among Japanese men with moderate body mass index. Int J Obes
Relat Metab Disord 2000;24:358-62.
[6] Wang J, Russell-Aulet M, Mazariegos M, Burastero S, Thornton JC,
Lichtman S, et al. Body fat by dual photon absorptiometry (DPA):
comparisons with traditional methods in Asians, Blacks and Cauca-
sians. Am J Hum Biol 1992;4:501 -10.
[7] Chowdury B, Lantz H, Sjostrom L. Computed tomography deter-
mined body composition in relation to cardiovascular risk factors in
Indian and matched Swedish males. Metabolism 1996;45:634 -44.
[8] Kamath SK, Hussain EA, Amin D, Mortillaro E, West B, Peterson CT,
et al. Cardiovascular disease risk factors in 2 distinct ethnic groups:
Indian and Pakistani compared with American premenopausal
women. Am J Clin Nutr 1999;69:621 -31.
[9] Misra A, Pandey RM, Devi JR, Sharma R, Vikram NK, Khanna N.
High prevalence of diabetes, obesity and dyslipidaemia in urban
slum population in northern India. Int J Obes Relat Metab Disord
2001;25:1722-9 [Erratum in: Int J Obes Relat Metab Disord. 2002
Sep; 26(9): 1281].
[10] Banerji MA, Faridi N, Alturi R, Chaiken RL, Lebovitz HE. Body
composition, visceral fat, leptin and insulin resistance in Asian Indian
men. J Clin Endocrinol Metab 1999;84:137 -44.
[11] Chandalia M, Abate N, Garg A, Stray-Gundersen J, Grundy SM.
Relationship between generalized and upper body obesity to insulin
resistance in Asian Indian men. J Clin Endocrinol Metab 1999;84:
2329-35.
[12] World Health Organization. Obesity: prevention and managing the
global epidemic. Report of a WHO consultation on obesity. Geneva7
WHO; 1998.
[13] Lew EA, Garfinkel L. Variations in mortality by weight among
750000 men and women. J Chronic Dis 1979;32:563 -76.
[14] WHO. Diet, nutrition and the prevention of chronic diseases. Report
of a WHO study group. TRS 797. Geneva7 WHO; 1990.
[15] World Health Organization. The Asia Pacific perspective. Redefining
obesity and its treatment. World Health Organization. International
Association for the study of Obesity and International Obesity Task
Force. Melbourne7 International Diabetes Institute; 2000.
[16] Wild S, Roglic G, Green A, Sicree R, King H. Global prevalence of
diabetes, estimates for the year 2000 and projections for 2030.
Diabetes Care 2004;27:1047-53.
[17] Anand SS, Yusuf S, Vuksan V, Devanesen S, Teo KK, Montague PA,
et al. Differences in risk factors, atherosclerosis, and cardiovascular
disease between ethnic groups in Canada: the Study of Health
Assessment and Risk in Ethnic groups (SHARE). Lancet 2000;356:
279 -84.
[18] Deepa M, Pradeepa R, Rema M, Anjana M, Deepa R, Shanthirani S,
et al. The Chennai Urban Rural Epidemiology Study (CURES)—
study design and methodology (urban component) (CURES-1).
J Assoc Physicians India 2003;51:863 -70.
[19] Alberti KG, Zimmet PZ. Definition diagnosis and classification of
diabetes mellitus and its complications. Part 1: Diagnosis and
classification of diabetes mellitus, provisional report of a WHO
Consultation. Diabet Med 1998;15:539-53.
[20] The American Diabetes Association. Diagnosis and classification of
diabetes mellitus. Diabetes Care 2004;27(Suppl 1):S5-S10.
[21] Joint National Committee. The seventh report of the Joint National
Committee on Prevention, Detection, Evaluation and Treatment of
High Blood Pressure (JNC-7). JAMA 2003;289:2560 -71.
[22] Executive summary of the third report of the National Cholesterol
Education Program (NCEP) Expert Panel on Detection, Evaluation
and Treatment of High Blood Cholesterol in Adults (Adult Treatment
Panel III). JAMA 2001;285:2486 -97.
[23] Ko GT, Chan JC, Cockram CS, Woo J. Prediction of hypertension,
diabetes, dyslipidaemia or albuminuria using simple anthropometric
indexes in Hong Kong Chinese. Int J Obes Relat Metab Disord 1999;
23:1136-42.
[24] Weng X, Liu Y, Ma J, Wang W, Yang G, Caballero B. Use of body
mass index to identify obesity-related metabolic disorders in the
Chinese population. Eur J Clin Nutr 2006;60:931 -7.
[25] Wildman RP, Gu D, Reynolds K, Duan X, He J. Appropriate body
mass index and waist circumference cutoffs for categorization of
overweight and central adiposity among Chinese adults. Am J Clin
Nutr 2004;80:1129-36.
[26] Zhu S, Wang Z, Heshka S, Heo M, Faith MS, Heymsfield SB. Waist
circumference and obesity-associated risk factors among whites in the
third National Health and Nutrition Examination Survey: clinical
action thresholds. Am J Clin Nutr 2002;76:743-9.
[27] Okosun IS, Rotimi CN, Forrester TE, Fraser H, Osotimehin B, Muna
WF, et al. Predictive value of abdominal obesity cut-off points for
hypertension in blacks from West African and Caribbean islands
nations. Int Obes Related Metab Disord 2002;24:180 -6.

V. Mohan et al. / Metabolism Clinical and Experimental 56 (2007) 961–968968
[28] Velasquez-Melendez G, Kac G, Valente JG, Tavares R, Silva CQ,
Garcia ES. Evaluation of waist circumference to predict general
obesity and arterial hypertension in women in Greater Metropolitan
Belo Horizonte Brazil. Cad Saude Publica 2002;18:765 -71.
[29] Berber A, Gomez-Santos R, Fanghanel G, Sanchez-Reyes L.
Anthropometric indexes in the prediction of type 2 diabetes mellitus,
hypertension and dyslipidaemia in a Mexican population. Int Obes
Relat Metab Disord 2001;25:1794-9.
[30] Mirmiran P, Esmaillzadeh A, Azizi F. Detection of cardiovascular risk
factors by anthropometric measures in Tehranian adults: receiver
operating characteristic (ROC) curve analysis. Eur J Clin Nutr 2004;
58:1110 -8.
[31] Ardern CI, Janssen I, Ross R, Katzmarzyk PT. Development of health-
related waist circumference thresholds within BMI categories. Obes
Res 2004;12:1094-103.
[32] Moy FM, Atiya AS. Waist circumference as a screening tool for
weight management: evaluation using receiver operating characteristic
curves for Malay subjects. Asia Pac J Public Health 2003;15:99 -104.
[33] Lin WY, Lee LT, Chen CY, Lo H, Hsia HH, Liu IL, et al. Optimal cut-
off values for obesity: using simple anthropometric indices to predict
cardiovascular risk factors in Taiwan. Int J Obes Relat Metab Disord
2002;26:1232-8.
[34] Bei-Fan Z. Predictive values of body mass index and waist circumfer-
ence for risk factors of certain related disease in Chinese adults: study
on optimal cut-off points of body mass index and waist circumference
in Chinese adults. Asia Pac J Clin Nutr 2002;11:S685-93.
[35] Molarius A, Seidell JC, Sans S, Tuomilehto J, Kuulasmaa K. Varying
sensitivity of waist action levels to identify subjects with overweight
or obesity in 19 populations of the WHO MONICA Project. J Clin
Epidemiol 1999;52:1213-24.
[36] Moon OR, Kim NS, Jang SM, Yoon TH, Kim SO. The relationship
between body mass index and the prevalence of obesity-related
diseases based on 1995 National Health Interview Survey in Korea.
Obes Rev 2002;3:191-6.
[37] Ito H, Nakasuga K, Ohshima A, Maruyama T, Kaji Y, Harada M, et al.
Detection of cardiovascular risk factors by indices of obesity obtained
from anthropometry and dual-energy X-ray absorptiometry in
Japanese individuals. Int J Obes Relat Metab Disord 2003;27:232-7.
[38] Pan WH, Flegal KM, Chang HY, Yeh WT, Yeh CJ, Lee WC. Body
mass index and obesity-related metabolic disorders in Taiwanese and
US whites and blacks: implications for definitions of overweight and
obesity for Asians. Am J Clin Nutr 2004;79:31 -9.
[39] Zhou BF. Cooperative Meta-Analysis Group of the Working Group on
Obesity in China. Predictive values of body mass index and waist
circumference for risk factors of certain related diseases in Chinese
adults—study on optimal cut-off points of body mass index and waist
circumference in Chinese adults. Biomed Environ Sci 2002;15:83 -96.
[40] Li G, Chen X, Jang Y, Wang J, Xing X, Yang W, et al. Obesity,
coronary heart disease risk factors and diabetes in Chinese: an
approach to the criteria of obesity in the Chinese population. Obes
Rev 2002;3:167-72.
[41] Deurenberg-Yap M, Chew SK, Deurenberg P. Elevated body fat
percentage and cardiovascular risk at low body mass index levels
among Singaporean Chinese, Malays and Indians. Obes Rev 2002;3:
209 -15.
[42] Misra A, Vikram NK, Gupta R, Pandey RM,Wasir JS, Gupta VP. Waist
circumference cutoff points and action levels for Asian Indians for
identification of abdominal obesity. Int J Obes (Lond) 2006;30:106-11.
[43] Singh RB, Bajaj S, Niaz MA, Rastogi SS, Moshiri M. Prevalence of
type 2 diabetes mellitus and risk of hypertension and coronary artery
disease in rural and urban population with low rates of obesity. Int J
Cardiol 1998;66:65 -72.
[44] Dudeja V, Misra A, Pandey RM, Devina G, Kumar G, Vikram NK.
BMI does not accurately predict overweight in Asian Indians in
northern India. Br J Nutr 2001;86:105 -12.
[45] Jafar TH, Chaturvedi N, Pappas G. Prevalence of overweight and
obesity and their association with hypertension and diabetes mellitus
in an Indo-Asian population. CMAJ 2006;175:1071 -7.
[46] Ramachandran A, Snehalatha C, Kapur A, Vijay V, Mohan V, Das AK,
et al, for the Diabetes Epidemiology Study Group in India (DESI).
High prevalence of diabetes and impaired glucose tolerance in India:
National Urban Diabetes Survey. Diabetologia 2001;44:1094-101.
[47] International Diabetes Federation. New IDF worldwide definition of
the metabolic syndrome. Press conference, 1st International Congress
on bPre-diabetesQ and the metabolic syndrome, Berlin, Germany, April
14, 2005 [www.idf.org].
[48] Romero-Corral A, Montori VM, Somers VK, Korinek J, Thomas RJ,
Allison TG, et al. Association of bodyweight with total mortality and
with cardiovascular events in coronary artery disease: a systematic
review of cohort studies. Lancet 2006;368:666-78.