bmi-the-park-hospital-consultant-directory.pdf - BMI Healthcare
Upload
khangminh22Category
view
0download
0
nutrients
Article
BMI, Alcohol Consumption and Gut Microbiome SpeciesRichness Are Related to Structural and FunctionalNeurological Abnormalities
Corinna Geisler 1,† , Jil Pankoke 1,†, Kristina Schlicht 1, Carina Knappe 1, Nathalie Rohmann 1,Katharina Hartmann 1, Ute Settgast 1, Kathrin Türk 1, Anna Katharina Seoudy 1,2, Andre Franke 3,Stefan Schreiber 2,3, Dominik M. Schulte 1,2 and Matthias Laudes 1,2,*
�����������������
Citation: Geisler, C.; Pankoke, J.;
Schlicht, K.; Knappe, C.; Rohmann,
N.; Hartmann, K.; Settgast, U.; Türk,
K.; Seoudy, A.K.; Franke, A.; et al.
BMI, Alcohol Consumption and Gut
Microbiome Species Richness Are
Related to Structural and Functional
Neurological Abnormalities.
Nutrients 2021, 13, 3743. https://
doi.org/10.3390/nu13113743
Academic Editor: Sonia de
Pascual-Teresa
Received: 6 October 2021
Accepted: 21 October 2021
Published: 23 October 2021
Publisher’s Note: MDPI stays neutral
with regard to jurisdictional claims in
published maps and institutional affil-
iations.
Copyright: © 2021 by the authors.
Licensee MDPI, Basel, Switzerland.
This article is an open access article
distributed under the terms and
conditions of the Creative Commons
Attribution (CC BY) license (https://
creativecommons.org/licenses/by/
4.0/).
1 Institute of Diabetes and Clinical Metabolic Research, University Hospital Schleswig-Holstein,24105 Kiel, Germany; [email protected] (C.G.); [email protected] (J.P.);[email protected] (K.S.); [email protected] (C.K.); [email protected] (N.R.);[email protected] (K.H.); [email protected] (U.S.); [email protected] (K.T.);[email protected] (A.K.S.); [email protected] (D.M.S.)
2 Division of Endocrinology, Diabetes and Clinical Nutrition, Department of Internal Medicine 1,University Hospital Schleswig-Holstein, Campus Kiel, 24105 Kiel, Germany; [email protected]
3 Institute of Clinical Molecular Biology, University Hospital Schleswig-Holstein and University of Kiel,24105 Kiel, Germany; [email protected]
* Correspondence: [email protected]; Tel.: +49-431-500-22217† These authors contributed equally to this work.
Abstract: Background: The incidence of neurological diseases is increasing throughout the world.The aim of the present study was to identify nutrition and microbiome factors related to structuraland functional neurological abnormalities to optimize future preventive strategies. Methods: Twohundred thirty-eight patients suffering from (1) structural (neurodegeneration) or (2) functional(epilepsy) neurological abnormalities or (3) chronic pain (migraine) and 612 healthy control subjectswere analyzed by validated 12-month food frequency questionnaire (FFQ) and 16S rRNA micro-biome sequencing (from stool samples). A binomial logistic regression model was applied for riskcalculation and functional pathway analysis to show which functional pathway could discriminatecases and healthy controls. Results: Detailed analysis of more than 60 macro- and micronutrientsrevealed no distinct significant difference between cases and controls, whereas BMI, insulin resistanceand metabolic inflammation in addition to alcohol consumption were major drivers of an overallneurological disease risk. The gut microbiome analysis showed decreased alpha diversity (Shannonindex: p = 9.1× 10⁻⁷) and species richness (p = 1.2 × 10⁻⁸) in the case group as well as signifi-cant differences in beta diversity between cases and controls (Bray–Curtis: p = 9.99 × 10⁻⁴; Jaccard:p = 9.99 × 10⁻⁴). The Shannon index showed a beneficial effect (OR = 0.59 (95%-CI (0.40, 0.87);p = 8 × 10⁻³). Cases were clearly discriminated from healthy controls by environmental informationprocessing, signal transduction, two component system and membrane transport as significantlydifferent functional pathways. Conclusions: In conclusion, our data indicate that an overall healthylifestyle, in contrast to supplementation of single micro- or macronutrients, is most likely to reduceoverall neurological abnormality risk and that the gut microbiome is an interesting target to developnovel preventive strategies.
Keywords: gut–brain axis; neurological health; gut microbiome; nutrition
1. Introduction
Neurological diseases are a leading cause of disability and death worldwide. Theburden of neurological diseases has increased over the past 25 years as a result of demo-graphic change [1]. Researchers assumed that the number of patients with neurological
Nutrients 2021, 13, 3743. https://doi.org/10.3390/nu13113743 https://www.mdpi.com/journal/nutrients

Nutrients 2021, 13, 3743 2 of 21
diseases will increase steadily in the coming years, underlining the importance of examin-ing lifestyle-associated factors for future development of targeted preventive strategies [2].
Modifiable lifestyle factors that cause a neurological disease are very diverse and notcompletely investigated. In particular, the influence of nutrition on the development andprogression of neurological diseases is a focus of current research [3]. In addition, theintestinal microbiome as an additional modifier of nutritional factors has received scientificattention in neuroscience as a relevant system that transmits nutritional signals into thehuman physiology in terms of a “nutrition-microbiome-host metabolic axis”. Indeed, espe-cially for neurodegenerative diseases, e.g., Parkinson’s disease (PD), researchers currentlyassume that the pathology starts in the gut by altering the intestinal autonomous nervoussystem [4,5].
In healthy subjects, the gut microbiome contributes to important physiological pro-cesses, such as protection against pathogens, activation of the immune system, digestion offood components and production of vitamins [6]. Furthermore, microbes have the ability toproduce different metabolites, such as short-chain fatty acids, neurotransmitters, immunemediators and hormones [7]. These metabolites reflect a bidirectional communication net-work, known as the “gut–brain axis”. The diversity of microbes and their metabolites arethus suspected to influence gut motility and permeability, immune function [8–10], brainneurochemistry and emotional behaviors [11,12]. Several studies deal with the influenceof microbes in the development and progression of neurological diseases, as well as themechanisms involved in the communication between the gut–brain axis.
Preventive effects of dietary components for neuroprotection are also in the currentfocus of research. It is suspected that omega-3 fatty acids and vitamin D control the synthe-sis of serotonin and influence the development and symptom relief of neuropsychiatricdisorders [13]. Dietary vitamin B3 (niacin) has been associated with both gut microbiomeabnormalities and neuronal dysfunction of the central nervous system. In patients with PD,the precursor nicotinamide riboside of coenzyme NAD (nicotinamide adenine dinucleotide)may be important for mitochondrial maintenance [14].
In the present study, we examined n = 612 healthy controls and n = 238 human subjectssuffering from different but common neurological disease groups: (1) structural neurolog-ical abnormalities (SNA; neurodegeneration), (2) functional neurological abnormalities(FNA; e.g., epilepsy) and (3) chronic pain (CP; e.g., migraine). The aim of the present studywas to identify nutritional and microbiome factors related to structural and functionalneurological abnormalities to optimize future preventive strategies. The reason not tofocus on a specific neuro-disease was due to our aim to identify common nutrition and/ormicrobiome factors to preserve neurological health in general, which might be targeted inthe future in preventive educational programs.
2. Materials and Methods2.1. Study Cohorts and Study Design
For the present investigation, a subpopulation was generated, based on the FoodChain Plus (FoCus) cohort, which has been previously reported [15,16]. Subjects wererecruited at the University Hospital Schleswig Holstein (UKSH), Campus Kiel (Germany).Within this project, a total of 2000 subjects were recruited from 2011 to 2015 and combinedto form the cohort. The subjects were randomly recruited by the regional registration officeand further via the obesity outpatient clinic of the Clinic for Internal Medicine I of theUKSH in Kiel. Five hundred subjects were classified as obese with a BMI over 30 kg/m2.The subjects underwent a medical phenotyping program that used a medical questionnaire,anthropometric measurements and analysis of markers in blood samples. Furthermore,stool samples for analysis were available, and a food frequency questionnaire (FFQ) wasused once to obtain information on nutritional behavior over a time period of 12 months.The FFQ was used twice in a subsample of 200 study subjects to evaluate the validity ofthe FFQ. Informed consent was obtained from all subjects involved in the study. Before itscommencement, the study was approved by the local ethics committee of the Department

Nutrients 2021, 13, 3743 3 of 21
of Medicine of Kiel University (A156-03, 28 July 2011) and was registered under the clinicaltrial number DRKS00005285 (Food Chain Plus (FoCus) cohort) at the German ClinicalTrials Register in Cologne.
The first 5-year follow-up was finished in 2020; 819 (57.5%) out of 1424 subjectscompleted the first follow-up, 514 subjects declined to re-participate, 44 subjects diedand 47 subjects were addressed unknown. In total, complete data sets of 735 subjectswere available after the first follow-up period. These data are not included in the presentanalysis.
2.2. Anthropometric Characteristics
Anthropometric data were assessed during clinical examination by the clinical staff.Weight was determined to the nearest 0.1 kg using a body composition monitor (TypeBC-418 MA, Tanita Corporation, Tokyo, Japan).
2.3. Medical Questionnaire
A medical questionnaire (version 1. 1 dated 18 July 2011) was presented to the subjects.As a result, a case–control study population was formed with a total of 850 subjects(575 women and 275 men) including 238 cases with neurological diseases (184 women and54 men) and 612 healthy controls (391 women and 221 men). The group of neurologicalcases was divided into four subgroups: (1) structural neurological abnormalities (SNA;neurodegeneration), (2) functional neurological abnormalities (FNA; epilepsy), (3) chronicpain (CP; migraine) and (4) others (these probands gave information on the presence ofneurological symptoms for which the diagnostic work-up was not completed at the timeof answering the medical questionnaire). Specific neurological diseases were ascertainedduring the medical questionnaire and additionally checked by typical medication intake ifthe participant reported “I have another neurological disease”.
2.4. Dietary Assessment
The recording of dietary behavior and nutrient intake was carried out by a self-completed, semi-quantitative dietary frequency questionnaire, according to the EuropeanProspective Investigation into Cancer and Nutrition (EPIC)-Potsdam protocol, and ana-lyzed by EPIC-soft as reported earlier [17,18]. The single nutrient intakes of the subcohortwere compared with the D-A-CH “Reference values for nutritional intake” used in Ger-many [19]. Main macronutrients (e.g., carbohydrates, fat and protein) were calculated asenergy percent (according to their energy density). Energy-adjusted intakes of all othernutrients were calculated by adding the mean nutrient intake to the residual derived fromthe regression analysis [20]. The data are presented in absolute values or percentages ofenergy (E%).
2.5. Biochemical Analyses
Blood samples were obtained by venipuncture after an overnight fast for biochem-ical analysis of metabolic and inflammatory markers. All markers were analyzed inthe central laboratory of the university hospital in Kiel: C-reactive protein (CRP) andlipoprotein-a by immunoturbidimetry (Roche/Hitachi cobas c systems; Roche Diagnos-tics GmbH, Mannheim, Germany), fasting glucose by glucose-hexokinase-ultraviolet test(Roche/Hitachi cobas c systems, Roche Diagnostics International GmbH, Mannheim, Ger-many), fasting insulin (ECLIA; Elecsys system; Roche Diagnostics International GmbH,Mannheim, Germany) as well as interleukin-6 (IL-6) by electrochemiluminescence im-munoassay (Elecsys® IL-6, cobas systems; Roche Diagnostics International GmbH,Mannheim, Germany) and triglycerides by enzymatic test (Roche/Hitachi cobas c systems,Roche Diagnostics International GmbH, Mannheim, Germany). Homeostatic model assess-ment for insulin resistance (HOMA-IR) was calculated (fasting glucose (mg/dL) × fastinginsulin (µU/mL)/405) to determine insulin sensitivity.

Nutrients 2021, 13, 3743 4 of 21
2.6. Analysis of the Intestinal Microbiome
Currently, the definition of the term microbiome is not actually standardized throughdifferent study designs. For our present work, we decided to use the term microbiomeas described and defined by Berg et al. [21]. Therefore, in our manuscript, microbiome isdefined as the characteristic microbial community of the gut.
For the purpose of gut microbiome analysis, stool samples were collected and storedat −80 ◦C until further processing. Laboratory work and quality control as well as normal-ization and taxonomic classification were performed by the Institute of Clinical MolecularBiology (IKMB), Kiel. As described in detail by Heinsen et al. [22], the microbiome analysiswas divided into sample preparation/extraction, sequencing, amplification, quality controland bioinformatic analysis.
2.7. DNA Extraction, 16S rDNA Sequencing and Quality Control
In order to identify bacteria within the proband gut microbiomes, DNA sequencingof the variable regions V1/V2 of bacterial 16S rRNA genes was performed as describedby Kozich et al. [23]. Here, bacterial DNA was automatically extracted using the QIAampDNA stool mini kit and the QIAcube technology from Qiagen (Hilden, Germany). Afterdefrosting, 200 mg from each stool sample were transferred to 0.70 mm Garnet Bead tubesfrom Dianova (Hamburg, Germany), then the tubes were each filled with 1.1 mL of stoollysis buffer (ASL). The SpeedMill PLUS technology (Analytik Jena, Jena, Germany) wasused for bead beating at 50 Hz for 45 s, and finally samples were heated to 95 ◦C for 5 minand prepared for sequencing following the manufacturer’s protocol. The variable regionsof interest were amplified in a dual-barcoding approach [24] using the primers 27F and338R in a polymerase chain reaction (PCR); the related products were normalized with theSequalPrep Normalization Plate Kit (Thermo Fischer Scientific, Waltham, MA, USA) andpooled equimolarly. Then, 16S rRNA gene sequencing was conducted using the IlluminaMiSeq technology (Illumina Inc., San Diego, CA, USA).
For controlling the quality of the sequencing products, further steps were performed.Demultiplexing based on 0 mismatches in the barcode sequences was carried out by allow-ing no mismatches; forward and reverse reads were merged using the FLASH software [25]with an allowed overlap of reads of 250 to 300 bp. Low-quality sequences were filteredout by excluding sequences with >5% nucleotides with quality score <30. Chimeras wereidentified with the program UCHIME [26] and were excluded from the data set.
2.8. Normalization and Taxonomic Classification
Sequences were clustered into operational taxonomic units (OTUs) with a sequenceidentity threshold of 97% using the program UPARSE [27], representing species level. TheSINTAX CLASSIFIER [28] was used to carry out the taxonomic assignment of OTUs. Intotal, six different taxonomic levels were analyzed: domain, phylum, class, order, familyand genus. For each sample, 10,000 sequences were randomly selected to form a taxon-by-sample abundance table.
2.9. Statistical Analysis of the Microbiome Data
Statistical calculations were performed using the program R (version 4.0.2 and 4.0.3; RCore Team (2021). R: A language and environment for statistical computing. R Foundationfor Statistical Computing, Vienna, Austria. URL https://www.R-project.org/.), RStudio(version 1.3.1093; RStudio Team (2020). RStudio: Integrated Development Environmentfor R. RStudio, PBC, Boston, MA, USA. URL http://www.rstudio.com/.) and the Rpackages “Microbiome” (version 1.12.0; Leo Lahti et al., microbiome R package. URL:http://microbiome.github.io) and “pyloseq” (version 1.34.0; phyloseq: An R packagefor reproducible interactive analysis and graphics of microbiome census data. Paul J.McMurdie and Susan Holmes (2013) PLoS ONE 8(4):e61217.). Species richness, alphadiversity, beta diversity and the core measurable microbiome (CMM) between cases andcontrols as well as subgroups were analyzed. Kruskal–Wallis test was used to identify

Nutrients 2021, 13, 3743 5 of 21
overall subgroup differences and Wilcoxon test was used to identify differences betweendisease subgroups and controls (as reference group). The CMM included all microbialtaxa at OTU level [29], which showed an average abundance of at least 0.5% of the totalbacteria within the groups. In addition, the CMM included only bacteria that were presentin more than 40% of the samples. Microbiome diversity was assessed by the use ofindices for alpha and beta diversity. OTU abundances in combination without and withmetric and factorial variables were used for modeling a multivariate Hurdle algorithm.Two-part Hurdle models were chosen in order to handle the excess number of zeros andoverdispersion in the data by evaluating zero and non-zero abundances independently. Weintegrated the following potential confounding factors in all analyses with confounders(medication intake, smoking habits, alcohol, dietary fiber, docosahexaenoic acid, vitaminB12, vitamin B3, vitamin D, BMI, age and sex). A Venn diagram was created using theR package “VennDiagram” (version 1.6.20; Hanbo Chen (2018). VennDiagram: GenerateHigh-Resolution Venn and Euler Plots. R package version 1.6.20. https://CRAN.R-project.org/package=VennDiagram) to calculate the distribution of OTUs in case and controlgroups. The prediction of functional profiles from 16S rRNA data was performed with the“Tax4Fun” R package (version 0.3.1) [30]. “Tax4Fun” predicts the functional capabilities ofmicrobial communities based on 16S datasets and is applicable to outputs obtained fromthe QIIME application [31] against the SILVA database (version 123) [32]. The “Tax4Fun”R package was embedded in the “microeco” (version 0.4.0) [33] R package, and lineardiscriminant analysis (LDA) scores were computed for features differentially abundantbetween healthy controls and neurologic cases using the Linear discriminant analysisEffect Size (LEfSe) method [34]. LEfSe is an algorithm for high-dimensional biomarkerdiscovery and explanation to identify genomic features e.g., pathways that can characterizethe differences between biological conditions.
3. Statistics
Statistical analysis of the data on nutritional behavior and medical history was per-formed using SPSS Statistic Version 22 (SPSS Inc., Chicago, IL, USA). Missing data forvariables were excluded by the “Pairwise deletion” function. The statistical significancelevel was set to p < 5 × 10⁻². For descriptive general characteristics, data were checkedfor normality by using the Kolmogorov–Smirnov test and are presented as means ± stan-dard deviations (normal distribution) or median and interquartile range (non-normaldistribution). Mann–Whitney U test was used to identify between-group differences. Forcategorical variables, a crosstabulation was generated, and the Chi-squared test was ap-plied using SPSS Statistic Version 22 (SPSS Inc., Chicago, Illinois, USA), R (version 4.0.2and 4.0.3; R Core Team (2021). R: A language and environment for statistical computing. RFoundation for Statistical Computing, Vienna, Austria. URL https://www.R-project.org/.)and RStudio (version 1.3.1093; RStudio Team (2020). RStudio: Integrated DevelopmentEnvironment for R. RStudio, PBC, Boston, MA, USA. URL http://www.rstudio.com/.)using the “finalfit” package (version 1.0.2; Ewen Harrison, Tom Drake and Riinu Ots(2020). finalfit: Quickly Create Elegant Regression Results Tables and Plots when Mod-elling. R package version 1.0.2. https://CRAN.R-project.org/package=finalfit). TheR package “Hmisc” (version 4.50; Frank E Harrell Jr, with contributions from CharlesDupont and many others. (2021). Hmisc: Harrell Miscellaneous. R package version 4.5-0.https://CRAN.R-project.org/package=Hmisc) was used to generate correlation matrices.There are numerous factors that influence the composition of the intestinal microbiome andthe gut–brain axis [7,13,14,35,36]. Thus, we integrated the following potential confoundersin all analyses with confounders (medication intake, smoking habits, alcohol, dietary fiber,docosahexaenoic acid, vitamin B12, vitamin B3, vitamin D, BMI, age and sex). Multivariatelogistic regression with analyses of odds ratio estimates were computed in R (version 4.0.2and 4.0.3; R Core Team (2021). R: A language and environment for statistical computing. RFoundation for Statistical Computing, Vienna, Austria. URL https://www.R-project.org/.)and RStudio (version 1.3.1093; RStudio Team (2020). RStudio: Integrated Development

Nutrients 2021, 13, 3743 6 of 21
Environment for R. RStudio, PBC, Boston, MA, USA. URL http://www.rstudio.com/.)using the “finalfit” package (version 1.0.2; Ewen Harrison, Tom Drake and Riinu Ots (2020).finalfit: Quickly Create Elegant Regression Results Tables and Plots when Modelling. Rpackage version 1.0.2. https://CRAN.R-project.org/package=finalfit). For logistic regres-sion analyses, some of the used variables were categorized: BMI subgroups were defined bygeneral WHO standards [37], sex (men/women), medication intake (no/yes) and smokinghabits (never, <3 month, former and current). Alcohol consumption was calculated asalcohol units per day (1 unit equal to 10 g alcohol), and all further phenotype and nutritiondata were continuous variables.
4. Results4.1. Characterization of Clinical Biochemistry and Anthropometric Data
The study population included 238 cases with different neurological diseases and612 healthy controls (for details, please see Table 1).
Table 1. Characterization of the FoCus subcohort according to laboratory analytical and anthropometric factors anddemographic data.
Cases (n = 238) Controls (n = 612) All Subjects (n = 850)
Women 184 (77.3%) a 391 (63.9%) 575 (67.6%)Men 54 (22.7%) a 221 (36.1%) 275 (32.4%)
Neurological diseasesSNA 15.1%
Parkinson’s disease 1 (0.4%)Tremor 7 (2.9%)
Restless leg 26 (10.9%)Multiple sclerosis 2 (0.8%)
FNA 11.3%Epilepsy 16 (6.7%)Anxiety 8 (3.4%)
Depression 2 (0.8%)Sleep disorder 1 (0.4%)
CP 62.2%Migraine 135 (56.7%)
Pain 12 (5.0%)Neuropathy 1 (0.4%)
Others 27 (11.3%)Age, year 48.49 (±13.41) 1 46.73 (±14.68) 47.23 (±14.34)
Weight, kg 100.10 (±33.06) * 84.82 (±26.66) 89.10 (±29.40)Height, cm 171.18 (±8.41) * 173.57 (±8.88) 173.90 (±8.81)
BMI, kg/m2 34.14 (±10.85) * 28.05 (±8.22) 29.76 (±9.43)UW 1.8% (4) 1.9% (11) 1.9% (15)NW 22.4% (50) a 44.5% (253) 38.3% (303)OW 17.0% (38) a 28.0% (159) 24.9% (197)OBI 17.0% (38) a 9.7% (55) 11.8% (93)OBII 11.2% (25) a 4.8% (27) 6.6% (52)OBIII 30.6% (68) a 11.1% (63) 16.6% (131)
Glucose, mg/dL 95.00 (88.00/105.00) *2 92.00 (87.00/99.00) 93 (87.00/101.00)Insulin, µU/mL 12.20 (7.30/22.65) * 8.50 (5.80/13.10) 9.30 (6.20/15.30)
HOMA-IR 2.93(1.61/5.79) * 1.99 (1.30/3.08) 2.13 (1.37/3.60)Triglyceride, mg/dL 119.00 (79.00/168.25) * 87.00 (66.00/125.00) 95.00 (68.75/139.00)
CRP, mg/L 2.60 (0.90/6.40) * 1.10 (0.90/2.80) 1.30 (0.90/3.70)IL-6, pg/mL 3.65 (2.10/5.43) * 2.60 (1.50/3.80) 2.80 (1.60/4.35)
Lipoprotein-a, mg/L 104.00 (95.00/245.00) * 95.00 (93.10/200.00) 95.00 (95.00/214.25)a Statistical significance between groups and gender were tested using chi-square test, (p < 5 × 10⁻²); 1 mean (±SD); 2 median (25th and75th percentiles); * statistical significance was tested using Mann–Whitney U test, (p < 5 × 10⁻²). SNA: structural neurological abnormalities;FNA: functional neurological abnormalities; CP: chronic pain; BMI: body mass index; UW: underweight (BMI < 18.50 kg/m2); NW: normalweight (BMI 18.50 to 24.99 kg/m2); OW: overweight (BMI 25.00 to 29.99 kg/m2); OBI: obesity class I (BMI 30.00 to 34.99 kg/m2); OBII:obesity class II (BMI 35.00 to 39.99 kg/m2); OBIII: obesity class III (BMI ≥ 40.00 kg/m2); HOMA-IR index: homeostasis model assessmentof insulin resistance; CRP: C-reactive protein; IL-6: interleukin-6.

Nutrients 2021, 13, 3743 7 of 21
In total, data of 575 (67.6%) women and 275 (32.4%) men were used for analysis.The overall mean age was 47.23 ± 14.34 years, and the groups were not significantlydifferent in age. The mean BMI was significantly higher in the cases than in the controls(p < 1 × 10⁻³). According to the guideline values for evaluating body weight in relationto height (BMI < 25 kg/m2), the mean BMI values of the cases and controls were abovethe limit of abdominal normal weight [37]. One third of the cases were morbidly obese(Table 1), whereas approx. 45.0% of the controls showed a normal weight. More controlswere overweight when compared to cases, but cases were more obese (Table 1). Amongcases, BMI was evenly distributed between different neurological abnormalities (datanot shown). Furthermore, cases were characterized by significantly higher levels of glu-cose (p < 1 × 10⁻³), insulin (p < 1 × 10⁻³), HOMA-IR index (p < 1 × 10⁻³), triglycerides(p < × 10−3), CRP (p < 1 × 10⁻³), IL-6 (p < 1 × 10⁻³) and lipoprotein-a levels (p < 1 × 10⁻³)compared to the controls (Table 1). Neurological cases showed a higher prevalence (19.1%;p < × 10−3) of diabetes (all types), high blood lipids (36.4%; p < 1 × 10⁻³), hypertension(55.3%; p < 1 × 10⁻³), inflammatory bowel disease (6.8%; p < 1 × 10⁻³) and inflammatorybowel syndrome (7.7%; p < 1 × 10⁻³).
4.2. Characterization of Micro- and Macronutrients
According to official recommendations, the protein intake should be 10–15% of thetotal energy requirement (E%) [19]. In our cohort, total protein intake of all subjects waswithin the range of the reference values (Table 2). There were no significant differencesbetween groups in total protein (Table 2) and amino acid intake (Table S1). The total studypopulation had a higher median total fat intake (Table 2) than recommended (referencevalue for total fat intake is 30 E% [19]). The intake of saturated and polyunsaturated fattyacids (ω-6 andω-3) was also above the reference values (7 E%, 2.5 E% and 0.5 E% [19,38])in cases and controls. In addition, there were significant differences between groups inintakes of polyunsaturated fatty acids (p < 1 × 10⁻²) and octadecadienoic acid/linoleicacid (p < 1 × 10⁻²) (Table 2). The results show that all subjects had an inadequate totalcarbohydrate intake below the recommendation of 55 E% [19] (Table 2). Furthermore,there was a significant difference between cases and controls regarding total carbohydrateintake (p < 2 × 10⁻²) (Table 2). Dietary fiber intake was below the recommendation of30 g/day in cases and controls [19] (Table 2). Both groups covered only 69% of the dailyrecommended dietary fiber intake, but cases and controls were not significantly different(Table 2). Alcohol intake of the entire study population was 2.2 E%, with higher alcoholconsumption in controls when compared to cases (p < 1 × 10⁻³) (Table 2), but both groupswere below the guideline values considered safe for health [19]. Salt intake was belowthe reference value of 6 g/day (Table 2) and not significantly different between cases andcontrols. The micronutrient intake showed that the median calcium intake was inadequateand below the reference value of 1000 mg/day (Table 2) [19]. This was also true for vitaminB9 (total folic acid) and vitamin B5 (pantothenic acid) [19]. Only vitamin D intake wassignificantly different between cases and controls (p < 5 × 10⁻²) (Table 2), but intake waswithin the recommendation (3–4 µg/day) of dietary vitamin D intake [19].

Nutrients 2021, 13, 3743 8 of 21
Table 2. Characterization of energy adjusted macro- and micronutrient intake between the groups.
Cases (n = 223) Controls (n = 568) All Subjects (n = 791)
Protein total, E% 14.52 (13.04/15.89) 1 14.38 (12.96/15.79) 14.42 (12.98/15.85)Essential amino acids, g/day 34.87 (28.48/41.37) 37.12 (33.60/41.43) 37.23 (33.65/41.29)
Arginine, g/day 4.17 (3.65/4.73) 4.09 (3.61/4.57) 4.11 (3.63/4.59)Cysteine, g/day 1.01 (0.92/1.10) 0.99 (0.91/1.09) 1.00 (0.91/1.09)
Tyrosine, g/d 2.70 (2.41/2.93) 2.67 (2.41/2.96) 2.68 (2.41/2.95)Methionine, g/d 1.60 (1.44/1.80) 1.61 (1.43/1.81) 1.61 (1.44/1.81)
Phenylalanine, g/d 3.18 (2.60/3.71) 3.31 (3.04/3.61) 3.33 (3.04/3.60)Tryptophan, g/day 0.86 (0.77/0.94) 0.86 (0.78/0.94) 0.86 (0.77/0.94)
Fat total, E% 42.05 (37.74/45.25) 41.29 (37.42/44.55) 41.43 (37.60/44.82)Saturated fatty acids, E% 36.86 (28.80/44.04) 37.74 (29.52/47.02) 37.22 (29.25/46.20)
Short-chain fatty acids, E% 0.81 (0.65/1.02) 0.86 (0.66/1.07) 0.84 (0.66/1.05)Medium-chain fatty acids, g/d 0.76 (0.65/0.90) 0.80 (0.66/0.92) 0.79 (0.66/0.91)
Long-chain fatty acids, E% 37.57 (33.92/40.43) 36.79 (33.36/39.89) 36.90 (33.58/40.03)Polyunsaturated fatty acids, E% 7.37 (5.93/8.47) * 7.04 (5.74/7.93) 6.86 (5.80/8.14)
Octadecadienoic acid/linoleic acid, (g/day) 14.28 (12.17/16.61) * 13.53 (11.54/15.74) 13.70 (11.70/16.02)Octadecatrienoic acid/linolenic acid, (g/day) 1.95 (1.79/2.28) 1.93 (1.76/2.25) 1.93 (1.77/2.26)
Eicosatetraenoic acid/arachidonic acid,(g/day) 0.18 (0.15/0.22) 0.18 (0.15/0.22) 0.18 (0.15/0.22)
Docosahexaenoic acid, (g/day) 0.18 (0.13/0.26) 0.20 (0.13/0.27) 0.19 (0.13/0.26)Monounsaturated fatty acids, E% 14.38 (13.00/16.02) 14.37 (12.86/15.75) 14.38 (12.91/15.79)
Carbohydrate total, E% 42.99 (38.98/46.98) * 41.46 (38.37/45.78) 41.79 (38.55/46.08)Monosaccharides, g/day 49.00 (37.77/62.00) 47.83 (35.91/59.79) 48.12 (36.50/60.34)
Fructose, g/day 26.33 (20.75/34.50) 25.47 (19.75/33.59) 25.63 (20.02/33.81)Galactose, g/day 4.23 (4.05/4.57) 4.20 (4.05/4.46) 4.21 (4.06/4.50)Glucose, g/day 21.85 (16.69/27.43) 21.46 (15.89/26.13) 21.57 (16.25/26.56)
Dietary fiber total, g/day 21.62 (18.91/26.47) 21.38 (18.67/25.22) 21.51 (18.75/25.55)Soluble fiber, g/day 7.14 (6.03/8.47) 6.94 (5.99/8.14) 6.96 (6.00/8.21)
Insoluble fiber, g/day 14.67 (12.69/17.61) 14.33 (12.52/16.97) 14.47 (12.55/17.22)Alcohol, E% 1.10 (0.42/2.80) * 2.56 (1.02/5.10) 2.18 (0.72/4.58)
Table salt, g/day 5.54 (4.93/6.08) 5.46 (4.97/5.99) 5.48 (4.96/6.03)Calcium, mg/day 865.60 (749.60/1016.90) 852.30 (737.10/989.50) 857.50 (740.50/995.90)
Vitamin B1 (thiamine), mg/day 1.76 (1.61/1.86) 1.73 (1.61/1.85) 1.74 (1.61/1.85)Vitamin B12 (cobalamin), µg/day 5.50 (4.40/6.40) 5.70 (4.50/6.70) 5.50 (4.40/6.70)Vitamin B2 (riboflavin), mg/day 1.51 (1.32/1.69) 1.48 (1.33/1.67) 1.49 (1.33/1.68)
Vitamin B3 (niacin), mg/day 14.21 (12.13/16.75) 14.77 (12.46/17.19) 14.64 (12.33/17.00)Vitamin B5 (pantothenic acid), mg/day 4.55 (3.79/5.45) 4.59 (3.81/5.63) 4.58 (3.80/5.54)
Vitamin B6 (pyridoxine), mg/day 1.55 (1.40/1.75) 1.56 (1.40/1.73) 1.55 (1.40/1.74)Vitamin B7 (biotin), µg/day 45.20 (40.30/49.80) 44.70 (39.90/50.50) 44.90 (40.00/50.50)
Vitamin B9 (free folic acid equivalent), µg/day 110.30 (94.80/130.70) 112.20 (95.30/125.70) 110.80 (95.20/126.50)Vitamin B9 (free folic acid), µg/day 87.60 (72.10/100.00) 84.60 (71.10/96.10) 84.30 (71.70/96.80)Vitamin B9 (total folic acid), µg/day 275.00 (248.90/312.40) 276.20 (249.90/305.50) 276.00 (249.80/308.30)Vitamin C (ascorbic acid), mg/day 123.37 (98.28/162.98) 118.09 (95.73/157.92) 119.25 (96.36/158.86)
Vitamin D (calciferols), µg/day 3.70 (2.70/4.90) * 4.40 (2.90/5.20) 3.90 (2.80/5.10)Vitamin E (tocopherol equivalent), mg/day 14.08 (11.61/15.80) 13.69 (12.28/15.23) 13.80 (12.36/15.39)
Vitamin K (phylloquinone), µg/day 314.50 (274.90/357.00) 305.30 (271.60/337.90) 306.80 (271.90/342.50)1 Median (25th and 75th percentiles); * statistical significance was tested using Mann–Whitney U test; (p < 5 × 10⁻²).

Nutrients 2021, 13, 3743 9 of 21
5. Neurological Cases and Microbiome
In total, data on the microbiome analysis of 688 subjects were available. These were223 cases and 465 controls. Disease subgroups were also used for microbiome analyses.
5.1. Core Measurable Microbiome (CMM)
A CMM of 186 operational taxonomic units (OTUs) was identified for controls and149 OTUs for cases. Merging both groups resulted in 191 OTUs. The merged OTUs forthe subgroups accounted for 375 OTUs in total. The CMM was assignable to five phyla:Actinobacteria, Bacteroidetes, Firmicutes, Proteobacteria, and Verrucomicrobia.
A Venn diagram (Figure S1) showed that there was an overlap of 144 OTUs of differ-ential abundance in cases and controls. Cases presented 5 OTUs (mainly Proteobacteria)that were solely observed in this group, whereas 42 OTUs were solely observed in healthycontrols (mainly Firmicutes).
We used hurdle models for further analysis of CMM differences between cases andcontrols and for the identification of potential marker species. A basic model withoutpotential confounding variables showed that 51 OTUs were significantly (p < 5 × 10⁻²)different between the cases and controls. The main phylum was Firmicutes (41 OTUs) andthe minor amounts were Bacteroidetes (6 OTUs) and Proteobacteria (4 OTUs). Cases showeda decreased (p < 5 × 10⁻²) count in all OTUs except three OTUs of Proteobacteria (family:Enterobacteriaceae). After adjustment for the number of OTUs (FDR correction) and potentialconfounders (medication intake, smoking habits, alcohol, dietary fiber, docosahexaenoicacid, vitamin B12, vitamin B3, vitamin D, BMI, age and sex), there were no longer significantdifferences observed between cases and controls in OTUs, either in the count or in thebinomial part of the hurdle model.
Hurdle models were also analyzed in the subgroups. Models both without and withpotential confounders showed no significant differences between subgroups in OTUs,either in the count or in the binomial part of the hurdle models.
5.2. Differences in Alpha Diversity between Neurological Cases and Healthy Controls
With respect to the alpha diversity measures, cases presented significantly lowerspecies richness (p = 1.2 × 10⁻⁸; Figure 1A), Shannon index (p = 9.1 × 10⁻⁷; Figure 1B) andhigher evenness (p = 6.3 × 10⁻⁸; Figure 1C), presenting a lower variation in abundancesbetween different taxa within the cases than controls.
Spearman correlation analyses showed that alpha diversity indices were correlatedto potential confounders (Figure 2). These confounders were subsequently included inlogistic regression models to evaluate their impact on the observed significant differencesin alpha diversity between cases and controls.
Species richness, Shannon index and evenness remained significantly different be-tween cases and controls (p = 1.95 × 10⁻⁴; p = 1.81 × 10⁻³ and p = 1.47 × 10⁻⁴) even afterusing an ANOVA with potential confounders (medication intake, smoking habits, alcohol,dietary fiber, docosahexaenoic acid, vitamin B12, vitamin B3, vitamin D, BMI, age and sex).

Nutrients 2021, 13, 3743 10 of 21Nutrients 2021, 13, x FOR PEER REVIEW 10 of 22
Figure 1. Alpha diversity and evenness differences between cases and controls displayed through three indices: (A) species richness, (B) Shannon index and (C) evenness (Pilou); (spot = outlier, Wil-coxon test; p < 5 × 10⁻²).
Spearman correlation analyses showed that alpha diversity indices were correlated to potential confounders (Figure 2). These confounders were subsequently included in
Figure 1. Alpha diversity and evenness differences between cases and controls displayed throughthree indices: (A) species richness, (B) Shannon index and (C) evenness (Pilou); (spot = outlier,Wilcoxon test; p < 5 × 10⁻²).

Nutrients 2021, 13, 3743 11 of 21
Nutrients 2021, 13, x FOR PEER REVIEW 11 of 22
logistic regression models to evaluate their impact on the observed significant differences in alpha diversity between cases and controls.
Figure 2. Spearman correlations between alpha diversity indices, phenotype, health and nutrition data of all subjects (* p < 5 × 10⁻², ** p <1 × 10⁻² and *** p < 1 × 10⁻³). Continuous variables: species richness (SpecRich), evenness, Shannon index (Shannon), age (in years), BMI (in kg/m2), fiber (g/day), docosahexaenoic acid (DHA, g/day), vitamin B12 (VB12, μg/day), vitamin B3 (VB3, mg/day), vitamin D (VD, μg/day) and alcohol (as percentage of energy) and categorial variables: medi-cation (intake: no (2)/yes (1)) and smoking habits (never (1), <3month (2), former (3) and current (4)) and sex (men (1)/women (2)).
Species richness, Shannon index and evenness remained significantly different be-tween cases and controls (p = 1.95 × 10⁻⁴; p = 1.81 × 10⁻³ and p = 1.47 × 10⁻⁴) even after using an ANOVA with potential confounders (medication intake, smoking habits, alcohol, die-tary fiber, docosahexaenoic acid, vitamin B12, vitamin B3, vitamin D, BMI, age and sex).
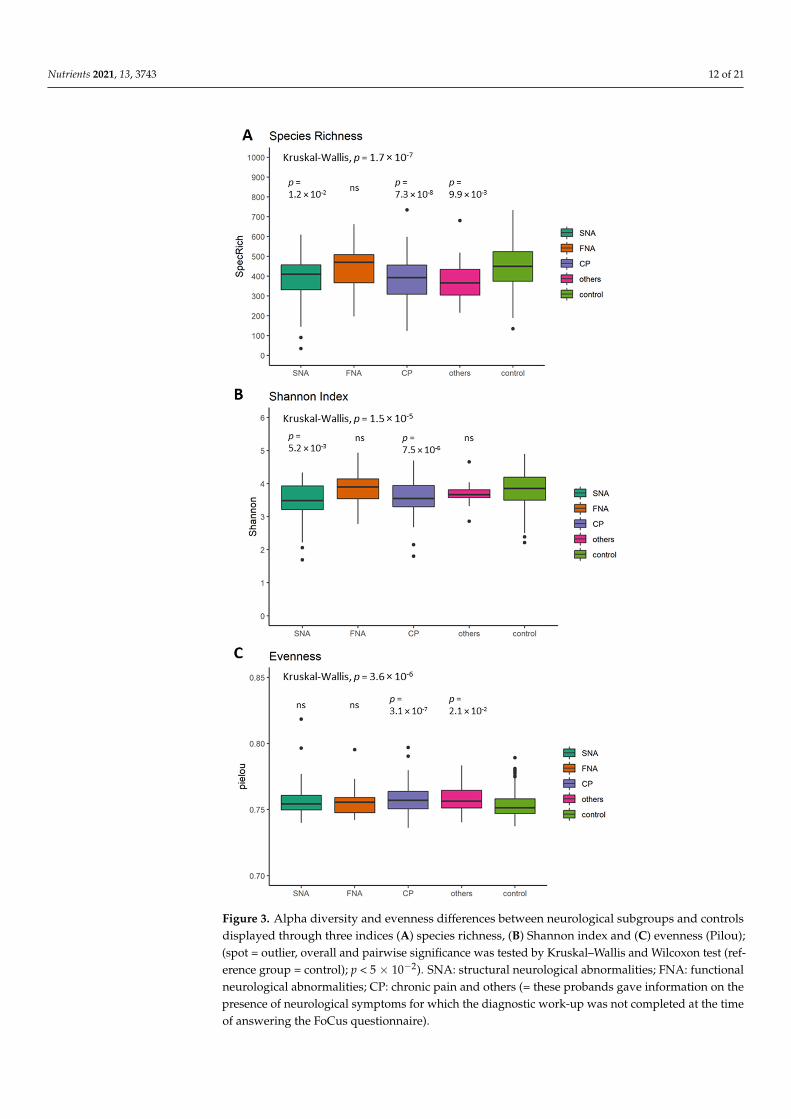
5.3. Differences in Alpha Diversity between Neurological Subgroups and Healthy Controls Alpha diversity in subgroups was overall significantly different in species richness
(p = 1.7 × 10⁻⁷; Figure 3A), Shannon index (p = 1.5 × 10⁻⁵; Figure 3B) and evenness (p = 3.6 × 10⁻⁶; Figure 3C). When compared to the reference group (= control), CP showed signifi-cantly lower species richness (p = 7.3 × 10⁻⁸; Figure 3A), Shannon index (p = 7.5 × 10⁻⁶; Figure 3B) and a higher evenness (p = 3.1 × 10⁻⁷; Figure 3C). Species richness, Shannon index and evenness remained significantly different between subgroups (p = 8.59 × 10⁻⁴; p = 1.25 × 10⁻³ and p = 2.04 × 10⁻⁵) after using an ANOVA with potential confounders (medication intake, smoking habits, alcohol, dietary fiber, docosahexaenoic acid, vitamin B12, vitamin B3, vitamin D, BMI, age and sex).
Figure 2. Spearman correlations between alpha diversity indices, phenotype, health and nutritiondata of all subjects (* p < 5 × 10⁻², ** p <1 × 10⁻² and *** p < 1 × 10⁻³). Continuous variables:species richness (SpecRich), evenness, Shannon index (Shannon), age (in years), BMI (in kg/m2),fiber (g/day), docosahexaenoic acid (DHA, g/day), vitamin B12 (VB12, µg/day), vitamin B3 (VB3,mg/day), vitamin D (VD, µg/day) and alcohol (as percentage of energy) and categorial variables:medication (intake: no (2)/yes (1)) and smoking habits (never (1), <3month (2), former (3) and current(4)) and sex (men (1)/women (2)).
5.3. Differences in Alpha Diversity between Neurological Subgroups and Healthy Controls
Alpha diversity in subgroups was overall significantly different in species rich-ness (p = 1.7 × 10⁻⁷; Figure 3A), Shannon index (p = 1.5 × 10⁻⁵; Figure 3B) and even-ness (p = 3.6 × 10⁻⁶; Figure 3C). When compared to the reference group (=control), CPshowed significantly lower species richness (p = 7.3 × 10⁻⁸; Figure 3A), Shannon index(p = 7.5 × 10⁻⁶; Figure 3B) and a higher evenness (p = 3.1 × 10⁻⁷; Figure 3C). Speciesrichness, Shannon index and evenness remained significantly different between subgroups(p = 8.59 × 10⁻⁴; p = 1.25 × 10⁻³ and p = 2.04 × 10⁻⁵) after using an ANOVA with potentialconfounders (medication intake, smoking habits, alcohol, dietary fiber, docosahexaenoicacid, vitamin B12, vitamin B3, vitamin D, BMI, age and sex).
Nutrients 2021, 13, 3743 12 of 21Nutrients 2021, 13, x FOR PEER REVIEW 12 of 22
Figure 3. Alpha diversity and evenness differences between neurological subgroups and controls displayed through three indices (A) species richness, (B) Shannon index and (C) evenness (Pilou); (spot = outlier, overall and pairwise significance was tested by Kruskal–Wallis and Wilcoxon test (reference group = control); p < 5 × 10⁻²). SNA: structural neurological abnormalities; FNA: functional neurological abnormalities; CP: chronic pain and others (= these probands gave information on the
Figure 3. Alpha diversity and evenness differences between neurological subgroups and controlsdisplayed through three indices (A) species richness, (B) Shannon index and (C) evenness (Pilou);(spot = outlier, overall and pairwise significance was tested by Kruskal–Wallis and Wilcoxon test (ref-erence group = control); p < 5 × 10⁻²). SNA: structural neurological abnormalities; FNA: functionalneurological abnormalities; CP: chronic pain and others (= these probands gave information on thepresence of neurological symptoms for which the diagnostic work-up was not completed at the timeof answering the FoCus questionnaire).

Nutrients 2021, 13, 3743 13 of 21
5.4. Difference in Beta Diversity between the Neurological Cases, their Subgroups andHealthy Controls
Figure 4 visualizes the beta diversity based on principal coordinate analysis (PCoA).Dissimilarity matrices were calculated for abundance of OTUs according to Bray–Curtis andfor presence/absence of OTUs according to Jaccard. To establish significance of differencesbetween the groups, a permutation analysis of variance (PerMANOVA) was performed.The analyses according to Bray–Curtis showed a significant difference in beta diversitybetween cases and controls (p = 9.99 × 10⁻⁴; r2 = 0.55%; Figure 4A) as well as for Jaccard(p = 9.99 × 10⁻⁴; r2 = 1.61%; Figure 4B). Using the neurological subgroups, Bray–Curtisand Jaccard analyses showed a significant difference in beta diversity between subgroups(p = 9.99 × 10⁻⁴; r2 = 1.05%; Figure 4C and p = 9.99 × 10⁻⁴; r2 = 2.25%; Figure 4D).
Nutrients 2021, 13, x FOR PEER REVIEW 13 of 22
presence of neurological symptoms for which the diagnostic work-up was not completed at the time of answering the FoCus questionnaire).
5.4. Difference in Beta Diversity between the Neurological Cases, Their Subgroups and Healthy Controls
Figure 4 visualizes the beta diversity based on principal coordinate analysis (PCoA). Dissimilarity matrices were calculated for abundance of OTUs according to Bray–Curtis and for presence/absence of OTUs according to Jaccard. To establish significance of dif-ferences between the groups, a permutation analysis of variance (PerMANOVA) was per-formed. The analyses according to Bray–Curtis showed a significant difference in beta diversity between cases and controls (p = 9.99 × 10⁻⁴; r2 = 0.55%; Figure 4A) as well as for Jaccard (p = 9.99 × 10⁻⁴; r2 = 1.61%; Figure 4B). Using the neurological subgroups, Bray–Curtis and Jaccard analyses showed a significant difference in beta diversity between sub-groups (p = 9.99 × 10⁻⁴; r2 = 1.05%; Figure 4C and p = 9.99 × 10⁻⁴; r2 = 2.25%; Figure 4D).
Figure 4. Differences between controls and cases in principal coordinate analysis (PCoA) without confounding factors in (A) Bray-Curtis and (B) Jaccard beta diversity and between neurological subgroups in (C) Bray–Curtis and (D) Jaccard beta diversity (permutation analysis of variance (PerMANOVA); all were significantly different with p < 5 × 10⁻²). SNA: structural neurological abnormalities; FNA: functional neurological abnormalities; CP: chronic pain and others (=these probands gave information on the presence of neurological symptoms for which the diagnostic work-up was not com-pleted at the time of answering the FoCus questionnaire).
In addition, the beta diversity of the intestinal microbiome was adjusted for different confounders by constrained ordination analysis. Differences in beta diversity between cases and controls were calculated and adjusted for medication intake, smoking habits, alcohol, dietary fiber, docosahexaenoic acid, vitamin B12, vitamin B3, vitamin D, BMI, age
Figure 4. Differences between controls and cases in principal coordinate analysis (PCoA) without confounding factors in(A) Bray-Curtis and (B) Jaccard beta diversity and between neurological subgroups in (C) Bray–Curtis and (D) Jaccardbeta diversity (permutation analysis of variance (PerMANOVA); all were significantly different with p < 5 × 10⁻²). SNA:structural neurological abnormalities; FNA: functional neurological abnormalities; CP: chronic pain and others (=theseprobands gave information on the presence of neurological symptoms for which the diagnostic work-up was not completedat the time of answering the FoCus questionnaire).

Nutrients 2021, 13, 3743 14 of 21
In addition, the beta diversity of the intestinal microbiome was adjusted for differentconfounders by constrained ordination analysis. Differences in beta diversity betweencases and controls were calculated and adjusted for medication intake, smoking habits,alcohol, dietary fiber, docosahexaenoic acid, vitamin B12, vitamin B3, vitamin D, BMI, ageand sex and group membership (cases/controls and respective subgroups). Bray–Curtisand Jaccard both showed significant differences in adjusted beta diversity between casesand controls as well as subgroups (see Tables 3 and 4).
Table 3. Bray–Curtis and Jaccard adjusted beta diversity between the neurological cases and healthy controls.
Bray–Curtis Jaccard
R2 p-Value Significance R2 p-Value Significance
Medication regularly 4.04 × 10⁻³ 9.99 × 10⁻⁴ *** 6.74 × 10⁻³ 9.99 × 10⁻⁴ ***Smoking habits 3.26 × 10⁻³ 9.99 × 10⁻⁴ *** 3.77 × 10⁻³ 9.99 × 10⁻⁴ ***
Alcohol 1.78 × 10⁻³ 1.47 × 10⁻¹ - 1.96 × 10⁻³ 1.28 × 10⁻¹ -Dietary fiber 3.44 × 10⁻³ 9.99 × 10⁻⁴ *** 3.35 × 10⁻³ 2.99 × 10⁻³ **
Docosahexaenoic acid 2.12 × 10⁻³ 3.10 × 10−2 * 2.20 × 10−3 8.19 × 10⁻² -Vitamin B12 2.57 × 10⁻³ 9.99 × 10⁻⁴ *** 2.77 × 10⁻³ 1.19 × 10⁻² *Vitamin B3 2.06 × 10⁻³ 3.99 × 10−2 * 2.12 × 10−3 1.08 × 10⁻¹ -Vitamin D 1.69 × 10⁻³ 2.01 × 10⁻¹ - 1.79 × 10⁻³ 2.00 × 10⁻¹ -
BMI 4.13 × 10⁻³ 9.99 × 10⁻⁴ *** 4.61 × 10⁻³ 9.99 × 10⁻⁴ ***Age 4.10 × 10⁻³ 9.99 × 10⁻⁴ *** 4.99 × 10⁻³ 9.99 × 10⁻⁴ ***Sex 2.63 × 10⁻³ 2.99 × 10⁻³ ** 2.42 × 10⁻³ 3.40 × 10⁻² *
Group membership 3.31 × 10⁻³ 9.99 × 10⁻⁴ *** 1.03 × 10⁻² 9.99 × 10⁻⁴ ***
Statistical significance was tested using permutation analysis of variance (PerMANOVA); (* p < 5 × 10⁻², ** p < 1 × 10⁻² and*** p < 1 × 10⁻³).
Table 4. Bray–Curtis and Jaccard adjusted beta diversity between the neurological subgroups and healthy controls.
Bray–Curtis Jaccard
R2 p-Value Significance R2 p-Value Significance
Medication regularly 3.95 × 10⁻³ 9.99 × 10⁻⁴ *** 5.99 × 10⁻³ 9.99 × 10⁻⁴ ***Smoking habits 3.26 × 10⁻³ 9.99 × 10⁻⁴ *** 3.69 × 10⁻³ 9.99 × 10⁻⁴ ***
Alcohol 1.76 × 10⁻³ 1.64 × 10⁻¹ - 1.82 × 10⁻³ 1.99 × 10⁻¹ -Dietary fiber 3.65 × 10⁻³ 9.99 × 10⁻⁴ *** 3.67 × 10⁻³ 1.99 × 10⁻³ **
Docosahexaenoic acid 2.10 × 10⁻³ 2.99 × 10−2 * 2.29 × 10−3 5.39 × 10⁻²
Vitamin B12 2.56 × 10⁻³ 3.99 × 10⁻³ ** 2.67 × 10⁻³ 2.49 × 10⁻² *Vitamin B3 2.16 × 10⁻³ 2.59 × 10−2 * 2.37 × 10−3 3.49 × 10⁻² *Vitamin D 1.69 × 10⁻³ 2.16 × 10⁻¹ - 1.74 × 10⁻³ 2.32 × 10⁻¹ -
BMI 4.29 × 10⁻³ 9.99 × 10⁻⁴ *** 4.79 × 10⁻³ 9.99 × 10⁻⁴ ***Age 4.07 × 10⁻³ 9.99 × 10⁻⁴ *** 4.92 × 10⁻³ 9.99 × 10⁻⁴ ***Sex 2.77 × 10⁻³ 1.99 × 10⁻³ ** 2.52 × 10⁻³ 3.29 × 10⁻² *
Group membership 8.09 × 10⁻³ 9.99 × 10⁻⁴ *** 1.71 × 10⁻² 9.99 × 10⁻⁴ ***
Statistical significance was tested using permutation analysis of variance (PerMANOVA); (* p < 5 × 10⁻², ** p < 1 × 10⁻² and*** p < 1 × 10⁻³).
5.5. Prediction of Functional Profiles
The Linear discriminant analysis Effect Size (LEfSe) algorithm, emphasizing bothstatistical and biological relevance, was used for biomarker discovery of functional profiles.The following results of the functional pathway analysis as assessed by LEfSe were basedon 16S rRNA sequencing; thus, the results should be understood as predictive results.According to LEfSe analysis, more than 2/3 of the functional profiles were associated withmetabolism in general and genetic information processing (Figure 5A). The linear discrimi-nant analysis (LDA) effect size method was applied to compare functional profiles betweencontrols (dark grey) and cases (light grey). The bar plot lists the significantly differentialmetabolic pathways based on effect size (LDA score (log 10) of 3). Enriched profiles in

Nutrients 2021, 13, 3743 15 of 21
controls (negative LDA score) included translation, metabolism of cofactors and vitamins,methane metabolism, energy metabolism as well as genetic information processing. Theenriched profiles in cases (positive LDA score) were environmental information processing,signal transduction, two component system and membrane transport. The results of theLDA scores are presented in Figure 5B.
Nutrients 2021, 13, x FOR PEER REVIEW 15 of 22
Docosahexaenoic acid 2.10 × 10⁻³ 2.99 × 10−2 * 2.29 × 10−3
5.39 × 10⁻²
Vitamin B12 2.56 × 10⁻³ 3.99 × 10⁻³ ** 2.67 × 10⁻³ 2.49 × 10⁻² *
Vitamin B3 2.16 × 10⁻³ 2.59 × 10−2 * 2.37 × 10−3 3.49 × 10⁻²
*
Vitamin D 1.69 × 10⁻³ 2.16 × 10⁻¹ - 1.74 × 10⁻³ 2.32 × 10⁻¹ -
BMI 4.29 × 10⁻³ 9.99 × 10⁻⁴ *** 4.79 × 10⁻³ 9.99 × 10⁻⁴ ***
Age 4.07 × 10⁻³ 9.99 × 10⁻⁴ *** 4.92 × 10⁻³ 9.99 × 10⁻⁴
***
Sex 2.77 × 10⁻³ 1.99 × 10⁻³ ** 2.52 × 10⁻³ 3.29 × 10⁻² *
Group member-ship 8.09 × 10⁻³ 9.99 × 10⁻⁴ *** 1.71 × 10⁻²
9.99 × 10⁻⁴ ***
Statistical significance was tested using permutation analysis of variance (PerMANOVA); (* p < 5 × 10⁻², ** p <1 × 10⁻² and *** p < 1 × 10⁻³).
5.5. Prediction of Functional Profiles The Linear discriminant analysis Effect Size (LEfSe) algorithm, emphasizing both sta-
tistical and biological relevance, was used for biomarker discovery of functional profiles. The following results of the functional pathway analysis as assessed by LEfSe were based on 16S rRNA sequencing; thus, the results should be understood as predictive results. According to LEfSe analysis, more than 2/3 of the functional profiles were associated with metabolism in general and genetic information processing (Figure 5A). The linear discri-minant analysis (LDA) effect size method was applied to compare functional profiles be-tween controls (dark grey) and cases (light grey). The bar plot lists the significantly differ-ential metabolic pathways based on effect size (LDA score (log 10) of 3). Enriched profiles in controls (negative LDA score) included translation, metabolism of cofactors and vita-mins, methane metabolism, energy metabolism as well as genetic information processing. The enriched profiles in cases (positive LDA score) were environmental information pro-cessing, signal transduction, two component system and membrane transport. The results of the LDA scores are presented in Figure 5B.
Figure 5. Results of the relative abundance (in %) of level 1 (A) functional pathways and (B) linear discriminant analysis (LDA) effect size (LEfSe) plot of functional pathways identified in the gut microbiomes of cases and controls. The threshold for the logarithmic discriminant analysis (LDA) score was 3 (p < 5 × 10⁻²). Figures and calculations were assessed by the “microeco” package (version 0.4.0) with the “Tax4Fun” package included in RStudio (version 0.3.1).
Figure 5. Results of the relative abundance (in %) of level 1 (A) functional pathways and (B) linear discriminant analysis(LDA) effect size (LEfSe) plot of functional pathways identified in the gut microbiomes of cases and controls. The thresholdfor the logarithmic discriminant analysis (LDA) score was 3 (p < 5 × 10⁻²). Figures and calculations were assessed by the“microeco” package (version 0.4.0) with the “Tax4Fun” package included in RStudio (version 0.3.1).
The LDA effect size method was also applied to compare functional profiles betweensubgroups. SNA was the only subgroup that showed significantly differential metabolicpathways based on effect size (LDA score (log 10) of 3), which were different from controls.Enriched profiles in SNA were lipid metabolism, infectious diseases, human diseases,carbohydrate metabolism, ABC transporter, membrane transport, two component system,signal transduction and environmental information processing (Figure S2).
5.6. Calculation of the Risk to Develop Neurological Diseases
A binomial logistic regression was performed to determine the effect of medicationintake, smoking habits, alcohol, dietary fiber, docosahexaenoic acid, vitamin B12, vitaminB3, vitamin D, BMI, age and sex and Shannon index as a marker of alpha diversity andrichness to predict the likelihood of contracting neurological diseases. All variables wereincluded in a multivariate logistic regression model, and the following variables contributedsignificantly as shown by Forest plot (Figure 6) in predicting neurological diseases. VitaminD and vitamin B12 were excluded from this Forest plot due to extreme odds ratios andcorresponding confidence intervals. The following variables entered the multivariatemodel: Shannon index (p = 8 × 10⁻³), obese BMI subgroups (OBI: p = 2 × 10⁻³; OBII:p = 4 × 10⁻³ and OBIII: p = 1 × 10⁻²), medication intake (p = 1 × 10⁻³) and increasedunits of alcohol consumption (p = 3 × 10⁻³). Shannon index had a beneficial effect andreduced the relative risk to develop a neurological disease by −41.0% as well as alcoholconsumption (−28.0%), whereas obesity (2.14- to 2.99-fold higher risk) and medicationintake (3.5-fold higher risk), as a marker for presence of non-neurological diseases, hadunbeneficial effects.

Nutrients 2021, 13, 3743 16 of 21
Nutrients 2021, 13, x FOR PEER REVIEW 16 of 22
The LDA effect size method was also applied to compare functional profiles between subgroups. SNA was the only subgroup that showed significantly differential metabolic pathways based on effect size (LDA score (log 10) of 3), which were different from con-trols. Enriched profiles in SNA were lipid metabolism, infectious diseases, human dis-eases, carbohydrate metabolism, ABC transporter, membrane transport, two component system, signal transduction and environmental information processing (Figure S2).
5.6. Calculation of the Risk to Develop Neurological Diseases A binomial logistic regression was performed to determine the effect of medication
intake, smoking habits, alcohol, dietary fiber, docosahexaenoic acid, vitamin B12, vitamin B3, vitamin D, BMI, age and sex and Shannon index as a marker of alpha diversity and richness to predict the likelihood of contracting neurological diseases. All variables were included in a multivariate logistic regression model, and the following variables contrib-uted significantly as shown by Forest plot (Figure 6) in predicting neurological diseases. Vitamin D and vitamin B12 were excluded from this Forest plot due to extreme odds ratios and corresponding confidence intervals. The following variables entered the multivariate model: Shannon index (p = 8 × 10⁻³), obese BMI subgroups (OBI: p = 2 × 10⁻³; OBII: p = 4 × 10⁻³ and OBIII: p = 1 × 10⁻²), medication intake (p = 1 × 10⁻³) and increased units of alcohol consumption (p = 3 × 10⁻³). Shannon index had a beneficial effect and reduced the relative risk to develop a neurological disease by −41.0% as well as alcohol consumption (−28.0%), whereas obesity (2.14- to 2.99-fold higher risk) and medication intake (3.5-fold higher risk), as a marker for presence of non-neurological diseases, had unbeneficial effects.
Figure 6. Forest plot showing the odds ratios with corresponding 95% confidence interval and p-values of variables usedin a multivariate regression model. Twelve variables were included in the calculation, but vitamin D and vitamin B12were excluded from this Forest plot due to their extreme odds ratios and corresponding confidence intervals. Referencecategory was the healthy control group. Figure and calculations were assessed by the “finalfit” package (version 1.0.2) for Rin RStudio (version 1.3.1093) with p < 5 × 10⁻². NW: normal weight (BMI 18.50 to 24.99 kg/m2); OW: overweight (BMI25.00 to 29.99 kg/m2); OBI: obesity class I (BMI 30.00 to 34.99 kg/m2); OBII: obesity class II (BMI 35.00 to 39.99 kg/m2);OBIII: obesity class III (BMI ≥ 40.00 kg/m2). Reference category was at all times the first category of the correspondingcategorical variable.
6. Discussion
The present study aimed to identify common nutritional and microbiome signaturesin structural and functional neurological abnormalities as well as chronic pain in orderto develop future targeted preventive strategies. By detailed examination of macro- andmicro-nutritional intake as well as 16S rRNA gut microbiome sequencing in a cohort of238 cases with different neurological abnormalities and 612 controls, we found that (1) BMI,(2) dietary alcohol consumption and (3) gut microbiome species richness and diversity arethe most relevant lifestyle modifiable factors contributing to the risk for the developmentof structural and functional neurological abnormalities. In addition, age was identifiedas the most, but not significantly important, non-modifiable factor. During the followingdiscussion, a wide range of references will be based on results in PD and AD patients due tothe fact that for migraine or epilepsy patients, the database-entered studies in these patients’groups are very rare in comparison to PD or AD (https://pubmed.ncbi.nlm.nih.gov/(accessed on 19 July 2021)).

Nutrients 2021, 13, 3743 17 of 21
Of interest in our cohort, we found that the average BMI was higher in the cases thanin the healthy controls, which was unexpected because particularly in PD patients, a higherrisk of developing malnutrition is reported even in early stages of the disease. On theother hand, obesity may also be promoted due to immobility and reduced total energyexpenditure in neurological diseases. Patients with neurological abnormalities such asPD, epilepsy or restless leg syndrome also suffer more frequently from sleep disorders,which are known to promote weight gain and loss of fat-free mass [39]. Furthermore, inaddition to BMI, our neurological cases were characterized by significantly higher levels ofglucose, fasting insulin and HOMA levels, indicating insulin resistance. In that respect, it isimportant to mention that patients with PD [40] or epilepsy often suffer from undiagnosedinsulin resistance or show a higher risk of developing type 2 diabetes [41], and that obesesubjects were affected by PD twice as often as those with normal weight [40], fitting withour results.
In the present analysis, the cases with neurological abnormalities were also character-ized by higher CRP, IL-6 levels and lipoprotein-a levels compared to the healthy controlgroup. Neuropathological and neuroradiological studies suggest that a common cause ofmany neurological diseases is thought to be neuroinflammation of the brain [42]. Infections,trauma, and/or toxins from food can promote neuroinflammatory processes. This activatesimmune cells such as microglia. As a result, cytokines and chemokines such as IL-1β, IL-6and TNF-α are released [43].
Patients with neurological diseases such as PD or migraine often suffer from abdomi-nal discomfort. Conversely, in a case–control study, the prevalence of headache was higherin patients with inflammatory bowel disease when compared to controls (46% vs. 7%), andanother study from Brazil showed that headache was the most common neurologic mani-festation in IBD patients with inflammatory bowel disease [44,45]. Unger et al. reportedthat a reduced number of short-chain fatty acids (SCFAs) and an altered composition of theintestinal microbiome in stool samples from PD patients were detectable [46]. A random-ized study showed that the Mediterranean diet had a particularly positive effect on thediversity of microbes producing SCFAs [47]. A high-fiber diet based on the Mediterraneandiet can thus positively influence the number of microbes and the production of SCFAs,thereby reducing abdominal discomfort. In that respect, it should be mentioned that dietaryfiber intake was below the recommendation of 30 g/day in our cohort, with no differencebetween cases and controls. Hence, low fiber intake, by promoting abdominal discomfort,might negatively affect the course of the disease in PD but is unlikely to be causative.
It is important to note that gut microbiota composition plays a major role in thegut–brain axis and is related to two mechanisms: indirect signaling and direct connectionwith the vagus nerve. Dysbiosis of the microbiome could alter the protective functions ofthe blood–brain barrier [48,49]. Thus, the composition of the intestinal microbiome wascompared on the basis of fecal samples obtained from cases with neurological disease andhealthy controls. In terms of alpha diversity, cases showed a lower Shannon index, as wellas a reduced species richness, compared to controls. There were also differences betweencases and controls in terms of beta diversity even when adjusted for different potentialconfounders, such as BMI. In a study using similar methods, independent researchersinvestigated to what extent the intestinal microbiome differed between PD patients anda healthy control group in northeastern China [50]. PD patients showed reduced speciesrichness and beta diversity, as well as reduced abundance of several taxa, compared tothe healthy control group [50], comparable to what we found in the present study. It hasto be mentioned that another study by Li et al. [51] showed a tendency of higher Chao1and Shannon index in the group with PD compared to the healthy control group, which isin contrast to our study. However, the study by Li et al. [51] was only related to PD andnot to different neurological diseases. Because we aimed to identify common factors innutrition and microbiome related to neurological abnormalities, we did not focus only onPD, which might explain the different findings. Mainly predictive results of functionalanalyses showed that cases with neurological abnormalities could be discriminated by

Nutrients 2021, 13, 3743 18 of 21
four functional pathways from healthy controls. These pathways included, e.g., adenosinetriphosphate (ATP)-binding cassette (ABC) transporters, phosphoenolpyruvate (PEP)-dependent phosphotransferase system (PTS) or different signaling pathways, e.g., nuclearfactor kappa-light-chain-enhancer of activated B cells (NF-κB), wingless/integrase 1 (wnt)or vascular endothelial growth factor (VEGF) signaling. Adenosine, for example, plays arole in different functions throughout the brain, e.g., metabolism, cell signaling, neuronalsignaling and inflammation [52], and it is also involved in migraine [53]. The signalingpathways are all known to be involved in neurological diseases, especially in migraine.NF-κB, for example, is a main player in regulating nerve function [54], and furthermore,the inflammatory NF-κB pathway is known to interact with wnt signaling [55], whereasVEGF is an important proinflammatory mediator, and an inhibition of signaling led to paindecrease [56]. Migraine is one of the most prevalent neurological diseases, and VEGF, forexample, stimulates nitric oxide synthase and therefore increases nitric oxide levels [57].Thus, the observed predictive functional pathways are in line with previous findings.
While in our study we were able to identify nutritional and microbiome factorsas potential indicators for neurological abnormalities, our study has some limitations toconsider. The EPIC 12-month FFQ used is suitable due to its high compliance and computerreadability, especially for the survey of larger samples, as in our FoCus study. However,its use is also associated with limitations. For correct answering, a very good memoryof the subjects is necessary. Furthermore, the response behavior is influenced by dietaryhabits and social trends. It cannot be excluded that under- and overreporting of foodhas occurred [58]. In addition, baseline data were obtained from the subjects by meansof self-completed questionnaires on lifestyle and medical issues. The data are based onself-reporting by the subjects and may therefore be subject to inaccuracy.
In summary, the results of our multivariate binomial logistic regression indicatethat especially obesity associated with insulin resistance and metabolic inflammation isrelated to structural and functional neurological abnormalities as well as chronic pain.We observed an obesity-driven higher risk to develop neurological abnormalities, e.g.,a higher BMI increased the relative risk up to 2.99-fold. This is in line with findingsthat obesity adversely affects the central nervous system and, in particular, cognitivefunction. Meta-analyses have shown a strong relationship between obesity and neurologicaldiseases [59]. There is also evidence that obesity doubles the risk of Alzheimer’s diseasein comparison to normal-weight subjects, and that obesity in midlife predicts greater riskof dementia in future [35,59–62]. Alcohol consumption showed a beneficial effect in ourlogistic regression model. This fits the widely accepted theory that light-to-moderatealcohol intake is beneficial, while excessive drinking increases the risk of dementia [63,64].On the other hand, one should keep in mind that a low alcohol consumption in subjectswith neurological diseases could be more the consequence than the cause of neurologicaldiseases. In our study population, 17.2% showed risky alcohol intake.
In conclusion, our data suggest that an overall healthy lifestyle might be more impor-tant in respect to developing preventive neurological strategies compared to single dietarycompounds, e.g., PUFA. In addition, the observed differences in alpha and beta diversityshowed that the gut microbiome might be used as a future preventive target through nondi-gestible food components (prebiotics) and the supplementation of bacteria (probiotics).
Supplementary Materials: The following are available online at https://www.mdpi.com/article/10.3390/nu13113743/s1, Figure S1: Venn diagram of OTU occurrence in cases and controls (overlap of144 OTUs, 5 OTUs (mainly Proteobacteria) and 42 OTUs (mainly Firmicutes) only observed in casesand controls). Figure S2: Linear discriminant analysis (LDA) effect size (LEfSe) plot of functionalpathways identified in the gut microbiome of subgroups and controls. The threshold for the LDAscore was 3 (p < 5 × 10⁻²). Figures and calculations were assessed by the “microeco” package(version 0.4.0) with the “Tax4Fun” package included in RStudio (version 0.3.1). SNA: structuralneurological abnormalities. Table S1: Supplemental characterization of energy adjusted macro- andmicronutrient intake between the groups.

Nutrients 2021, 13, 3743 19 of 21
Author Contributions: C.G., J.P. and M.L. wrote the manuscript. C.G., J.P., K.S., C.K., N.R., K.H.,D.M.S., A.K.S., A.F. and M.L. edited/reviewed the manuscript. K.T., U.S., A.F., S.S. and M.L. wereresponsible for research design, study management and performance. C.G., J.P, K.S., N.R. and C.K.performed statistical analyses. M.L. is the guarantor of this work and, as such, had full access to allthe data in the study and takes responsibility for the integrity of the data and the accuracy of the dataanalysis. All authors have read and agreed to the published version of the manuscript.
Funding: This work was supported by Bundesministerium für Bildung und Forschung (BMBF)FoCus—Food Chain Plus (0315539A), the Bundesanstalt für Landwirtschaft und Ernährung (BLE)and the JPI HDHL Initiative Biomarkers for Nutrition and Health (BIONUGUT: 2816ERA14E) as wellas the JPI HDHL Knowledge Platform INTIMIC (01EA1906A).
Institutional Review Board Statement: The study was conducted according to the guidelines of theDeclaration of Helsinki, and approved by the local ethics committee of the Department of Medicineof Kiel University (A156-03, 28 July 2011).
Informed Consent Statement: Informed consent was obtained from all subjects involved in the study.
Data Availability Statement: Data sharing is not applicable to this article.
Acknowledgments: The authors wish to thank the volunteers for their participation in this study.Anna Katharina Seoudy has been supported by the Else Kröner-Fresenius-Stiftung (EKFS) for the ElseKröner-Fresenius-Stiftung Research Training Group Kiel: Gut-Brain axis: relevance for inflammationmedicine and neurodegeneration.
Conflicts of Interest: All authors declare no conflict of interest.
References1. Deuschl, G.; Beghi, E.; Fazekas, F.; Varga, T.; Christoforidi, A.K.; Sipido, E.; Bassetti, C.L.; Vos, T.; Feigin, V.L. The Burden of
Neurological Diseases in Europe: An Analysis for the Global Burden of Disease Study 2017. Lancet Public Health 2020, 5, e551–e567.[CrossRef]
2. Feigin, V.L.; Nichols, E.; Alam, T.; Bannick, M.S.; Beghi, E.; Blake, N.; Culpepper, W.J.; Dorsey, E.R.; Elbaz, A.; Ellenbogen, R.G.;et al. Global, Regional, and National Burden of Neurological Disorders, 1990–2016: A Systematic Analysis for the Global Burdenof Disease Study 2016. Lancet Neurol. 2019, 18, 459–480. [CrossRef]
3. Leussink, V.I. Aspekte der Ernährung zur Prävention und Therapie Chronisch Neurologischer Erkrankungen. Der Nervenarzt2019, 90, 843–857. [CrossRef] [PubMed]
4. Buttó, L.F.; Haller, D. Dysbiosis in Intestinal Inflammation: Cause or Consequence. Int. J. Med Microbiol. 2016, 306, 302–309.[CrossRef] [PubMed]
5. Cryan, J.F.; O’Riordan, K.J.; Sandhu, K.; Peterson, V.; Dinan, T.G. The Gut Microbiome in Neurological Disorders. Lancet Neurol.2020, 19, 179–194. [CrossRef]
6. Rhee, S.H.; Pothoulakis, C.; Mayer, E.A. Principles and Clinical Implications of the Brain–Gut–Enteric Microbiota Axis. Nat. Rev.Gastroenterol. Hepatol. 2009, 6, 306–314. [CrossRef]
7. Kostic, A.; Xavier, R.J.; Gevers, D. The Microbiome in Inflammatory Bowel Disease: Current Status and the Future Ahead.Gastroenterology 2014, 146, 1489–1499. [CrossRef]
8. Geuking, M.B.; Köller, Y.; Rupp, S.; McCoy, K. The Interplay Between the Gut Microbiota and the Immune System. Gut Microbes2014, 5, 411–418. [CrossRef]
9. Quigley, E.M.M. Microflora Modulation of Motility. J. Neurogastroenterol. Motil. 2011, 17, 140–147. [CrossRef]10. Bravo, J.A.; Forsythe, P.; Chew, M.V.; Escaravage, E.; Savignac, H.M.; Dinan, T.G.; Bienenstock, J.; Cryan, J.F. Ingestion of
Lactobacillus Strain Regulates Emotional Behavior and Central GABA Receptor Expression in a Mouse Via the Vagus Nerve.Proc. Natl. Acad. Sci. USA 2011, 108, 16050–16055. [CrossRef]
11. Collins, S.M.; Surette, M.G.; Bercik, P. The Interplay Between the Intestinal Microbiota and the Brain. Nat. Rev. Genet. 2012, 10,735–742. [CrossRef] [PubMed]
12. Neufeld, K.-A.; Foster, J.A. Effects of Gut Microbiota on the Brain: Implications for Psychiatry. J. Psychiatry Neurosci. 2009, 34,230–231.
13. Patrick, R.P.; Ames, B.N. Vitamin D and the Omega-3 Fatty Acids Control Serotonin Synthesis and Action, part 2: Relevance forADHD, Bipolar Disorder, Schizophrenia, and Impulsive Behavior. FASEB J. 2015, 29, 2207–2222. [CrossRef] [PubMed]
14. Schöndorf, D.C.; Ivanyuk, D.; Baden, P.; Sanchez-Martinez, A.; De Cicco, S.; Yu, C.; Giunta, I.; Schwarz, L.K.; Di Napoli, G.;Panagiotakopoulou, V.; et al. The NAD+Precursor Nicotinamide Riboside Rescues Mitochondrial Defects and Neuronal Loss iniPSC and Fly Models of Parkinson’s Disease. Cell Rep. 2018, 23, 2976–2988. [CrossRef]
15. Müller, N.; Schulte, D.M.; Türk, K.; Freitag-Wolf, S.; Hampe, J.; Zeuner, R.; Schröder, J.O.; Gouni-Berthold, I.; Berthold, H.; Krone,W.; et al. IL-6 Blockade by Monoclonal Antibodies Inhibits Apolipoprotein (A) Expression and Lipoprotein (A) Synthesis inHumans. J. Lipid Res. 2015, 56, 1034–1042. [CrossRef] [PubMed]

Nutrients 2021, 13, 3743 20 of 21
16. Relling, I.; Akcay, G.; Fangmann, D.; Knappe, C.; Schulte, D.M.; Hartmann, K.; Müller, N.; Türk, K.; Dempfle, A.; Franke, A.; et al.Role of wnt5a in Metabolic Inflammation in Humans. J. Clin. Endocrinol. Metab. 2018, 103, 4253–4264. [CrossRef]
17. Kaaks, R.; Slimani, N.; Riboli, E. Pilot Phase Studies on the Accuracy of Dietary Intake Measurements in the EPIC Project:Overall Evaluation of Results. European Prospective Investigation into Cancer and Nutrition. Int. J. Epidemiol. 1997, 26, 26S–36S.[CrossRef]
18. Riboli, E.; Hunt, K.J.; Slimani, N.; Ferraria, P.; Norata, T.; Fahey, M.; Charrondierea, U.R.; Hemona, B.; Casagrandea, C.; Vignata, J.;et al. European Prospective Investigation into Cancer and Nutrition (EPIC): Study Populations and Data Collection. Public HealthNutr. 2002, 5, 1113–1124. [CrossRef]
19. Deutsche Gesellschaft für Ernährung, Ö.G.f.E. , Schweizerische Gesellschaft für Ernährungsforschung, Schweizerische Vereinigung fürErnährung. Referenzwerte für die Nährstoffzufuhr, 2nd ed.; Neuer Umschau Buchverlag: Neustadt an der Weinstraße, Germany,2019.
20. Willett, W.C.; Howe, G.R.; Kushi, L. Adjustment for Total Energy Intake in Epidemiologic Studies. Am. J. Clin. Nutr. 1997, 65,1220S–1228S. [CrossRef]
21. Berg, G.; Rybakova, D.; Fischer, D.; Cernava, T.; Vergès, M.-C.C.; Charles, T.; Chen, X.; Cocolin, L.; Eversole, K.; Corral, G.H.; et al.Microbiome Definition Re-Visited: Old Concepts and New Challenges. Microbiome 2020, 8, 1–22. [CrossRef]
22. Heinsen, F.-A.; Fangmann, D.; Müller, N.; Schulte, D.M.; Rühlemann, M.; Türk, K.; Settgast, U.; Lieb, W.; Baines, J.F.; Schreiber, S.;et al. Beneficial Effects of a Dietary Weight Loss Intervention on Human Gut Microbiome Diversity and Metabolism Are NotSustained during Weight Maintenance. Obes. Facts 2016, 9, 379–391. [CrossRef]
23. Kozich, J.J.; Westcott, S.L.; Baxter, N.; Highlander, S.; Schloss, P.D. Development of a Dual-Index Sequencing Strategy andCuration Pipeline for Analyzing Amplicon Sequence Data on the MiSeq Illumina Sequencing Platform. Appl. Environ. Microbiol.2013, 79, 5112–5120. [CrossRef]
24. Caporaso, J.G.; Lauber, C.L.; Walters, A.W.; Berg-Lyons, D.; Huntley, J.; Fierer, N.; Owens, S.; Betley, J.; Fraser, L.; Bauer, M.; et al.Ultra-High-Throughput Microbial Community Analysis on the Illumina HiSeq and MiSeq Platforms. ISME J. 2012, 6, 1621–1624.[CrossRef] [PubMed]
25. Magoc, T.; Salzberg, S. FLASH: Fast Length Adjustment of Short Reads to Improve Genome Assemblies. Bioinformatics 2011, 27,2957–2963. [CrossRef] [PubMed]
26. Edgar, R.C.; Haas, B.J.; Clemente, J.C.; Quince, C.; Knight, R. UCHIME Improves Sensitivity and Speed of Chimera Detection.Bioinformatics 2011, 27, 2194–2200. [CrossRef] [PubMed]
27. Edgar, R.C. UPARSE: Highly Accurate OTU Sequences from Microbial Amplicon Reads. Nat. Methods 2013, 10, 996–998.[CrossRef] [PubMed]
28. Edgar, R.C. SINTAX: A Simple Non-Bayesian Taxonomy Classifier for 16S and ITS Sequences. bioRxiv 2016, 074161. [CrossRef]29. Wang, J.; Kurilshikov, A.; Radjabzadeh, D.; Turpin, W.; Croitoru, K.; Bonder, M.J.; Jackson, M.; Medina-Gomez, C.; Frost, F.;
Homuth, G.; et al. Meta-Analysis of Human Genome-Microbiome Association Studies: The Mibiogen Consortium Initiative.Microbiome 2018, 6, 101. [CrossRef]
30. Aßhauer, K.P.; Wemheuer, B.; Daniel, R.; Meinicke, P. Tax4Fun: Predicting Functional Profiles from Metagenomic 16S rRNA data:Figure 1. Bioinformatics 2015, 31, 2882–2884. [CrossRef] [PubMed]
31. Caporaso, J.G.; Kuczynski, J.; Stombaugh, J.; Bittinger, K.; Bushman, F.; Costello, E.K.; Fierer, N.; Peña, A.G.; Goodrich, J.K.;Gordon, I.J.; et al. QIIME Allows Analysis of High-Throughput Community Sequencing Data. Nat. Methods 2010, 7, 335–336.[CrossRef]
32. Quast, C.; Pruesse, E.; Yilmaz, P.; Gerken, J.; Schweer, T.; Yarza, P.; Peplies, J.; Glöckner, F.O. The SILVA Ribosomal RNA GeneDatabase Project: Improved Data Processing and Web-Based Tools. Nucleic Acids Res. 2013, 41, D590–D596. [CrossRef]
33. Liu, C.; Cui, Y.; Li, X.; Yao, M. Microeco: An R Package for Data Mining in Microbial Community Ecology. FEMS Microbiol. Ecol.2021, 97, fiaa255. [CrossRef] [PubMed]
34. Segata, N.; Izard, J.; Waldron, L.; Gevers, D.; Miropolsky, L.; Garrett, W.S.; Huttenhower, C. Metagenomic Biomarker Discoveryand Explanation. Genome Biol. 2011, 12, R60. [CrossRef] [PubMed]
35. Cournot, M.; Marquie, J.C.; Ansiau, D.; Martinaud, C.; Fonds, H.; Ferrieres, J.; Ruidavets, J.B. Relation between Body Mass Indexand Cognitive Function in Healthy Middle-Aged Men and Women. Neurology 2006, 67, 1208–1214. [CrossRef] [PubMed]
36. Bhat, Z.F.; Morton, J.D.; Mason, S.; Bekhit, A.E.-D.A.; Bhat, H. Obesity and Neurological Disorders: Dietary Perspective of aGlobal Menace. Crit. Rev. Food Sci. Nutr. 2019, 59, 1294–1310. [CrossRef]
37. World Health Organisation. Body Mass Index. Available online: https://www.euro.who.int/en/health-topics/disease-prevention/nutrition/a-healthy-lifestyle/body-mass-index-bmi (accessed on 11 June 2020).
38. Deutsche Gesellschaft für Ernährung e. V. Available online: https://www.dge.de/wissenschaft/referenzwerte/fett/ (accessedon 1 October 2020).
39. Cedernaes, J.; Schönke, M.; Westholm, J.O.; Mi, J.; Chibalin, A.; Voisin, S.; Osler, M.; Vogel, H.; Hörnaeus, K.; Dickson, S.L.; et al.Acute Sleep Loss Results in Tissue-Specific Alterations in Genome-Wide DNA Methylation State and Metabolic Fuel Utilizationin Humans. Sci. Adv. 2018, 4, eaar8590. [CrossRef]
40. Hogg, E.; Athreya, K.; Basile, C.; Tan, E.E.; Kaminski, J.; Tagliati, M. High Prevalence of Undiagnosed Insulin Resistance inNon-Diabetic Subjects with Parkinson’s Disease. J. Park. Dis. 2018, 8, 259–265. [CrossRef]

Nutrients 2021, 13, 3743 21 of 21
41. Lu, C.-L.; Chang, Y.-H.; Sun, Y.; Li, C.-Y. A Population-Based Study of Epilepsy Incidence in Association with Type 2 Diabetesand Severe Hypoglycaemia. Diabetes Res. Clin. Pr. 2018, 140, 97–106. [CrossRef]
42. Pietrobon, D.; Moskowitz, M.A. Pathophysiology of Migraine. Annu. Rev. Physiol. 2013, 75, 365–391. [CrossRef]43. Frank-Cannon, T.C.; Alto, L.T.; McAlpine, F.E.; Tansey, M.G. Does Neuroinflammation Fan the Flame in Neurodegenerative
Diseases? Mol. Neurodegener. 2009, 4, 47. [CrossRef]44. Ben-Or, O.; Zelnik, N.; Shaoul, R.; Pacht, A.; Lerner, A. The Neurologic Profile of Children and Adolescents with Inflammatory
Bowel Disease. J. Child Neurol. 2015, 30, 551–557. [CrossRef] [PubMed]45. Oliveira, G.R.; Teles, B.C.; Brasil, F.; Souza, M.H.; Furtado, L.E.; De Castro-Costa, C.M.; Rola, F.H.; Braga, L.L.; Gondim, F.D.A.
Peripheral Neuropathy and Neurological Disorders in an Unselected Brazilian Population-Based Cohort of IBD Patients. Inflamm.Bowel Dis. 2008, 14, 389–395. [CrossRef] [PubMed]
46. Hu, X.; Wang, T.; Jin, F. Alzheimer’s Disease and Gut Microbiota. Sci. China Life Sci. 2016, 59, 1006–1023. [CrossRef] [PubMed]47. Ghosh, T.; Rampelli, S.; Jeffery, I.B.; Santoro, A.; Neto, M.C.; Capri, M.; Giampieri, E.; Jennings, A.; Candela, M.; Turroni, S.; et al.
Mediterranean Diet Intervention Alters the Gut Microbiome in Older People Reducing Frailty and Improving Health Status: TheNU-AGE 1-Year Dietary Intervention Across Five European Countries. Gut 2020, 69, 1218–1228. [CrossRef]
48. Braniste, V.; Al-Asmakh, M.; Kowal, C.; Anuar, F.; Abbaspour, A.; Tóth, M.; Korecka, A.; Bakocevic, N.; Ng, L.G.; Kundu, P.; et al.The Gut Microbiota Influences Blood-Brain Barrier Permeability in Mice. Sci. Transl. Med. 2014, 6, 263ra158. [CrossRef]
49. Spadoni, I.; Fornasa, G.; Rescigno, M. Organ-Specific Protection Mediated by Cooperation Between Vascular and EpithelialBarriers. Nat. Rev. Immunol. 2017, 17, 761–773. [CrossRef]
50. Li, C.; Cui, L.; Yang, Y.; Miao, J.; Zhao, X.; Zhang, J.; Cui, G.; Zhang, Y. Gut Microbiota Differs Between Parkinson’s DiseasePatients and Healthy Controls in Northeast China. Front. Mol. Neurosci. 2019, 12, 171. [CrossRef]
51. Li, Y.; Li, R.X.; Du, Y.T.; Xu, X.J.; Xue, Y.; Gao, D.; Gao, T.; Sheng, Z.; Zhang, L.Y.; Tuo, H.Z. Features of Gut Microbiota in Patientswith Idiopathic Parkinson’s Disease. Zhonghua Yi Xue Za Zhi 2020, 100, 1017–1022. [CrossRef]
52. Jacobson, K.; Gao, Z.-G. Adenosine Receptors as Therapeutic Targets. Nat. Rev. Drug Discov. 2006, 5, 247–264. [CrossRef]53. Sollevi, A. Adenosine for Pain Control. Acta Anaesthesiol. Scand. 1997, 41, 135–136. [CrossRef]54. Dresselhaus, E.C.; Meffert, M.K. Cellular Specificity of NF-κB Function in the Nervous System. Front. Immunol. 2019, 10, 1043.
[CrossRef] [PubMed]55. Ma, B.; Hottiger, M.O. Crosstalk between Wnt/β-Catenin and NF-κB Signaling Pathway during Inflammation. Front. Immunol.
2016, 7, 378. [CrossRef]56. Hamilton, J.L.; Nagao, M.; Levine, B.R.; Chen, D.; Olsen, B.R.; Im, H.-J. Targeting VEGF and Its Receptors for the Treatment of
Osteoarthritis and Associated Pain. J. Bone Miner. Res. 2016, 31, 911–924. [CrossRef]57. Bussolati, B.; Dunk, C.; Grohman, M.; Kontos, C.; Mason, J.; Ahmed, A. Vascular Endothelial Growth Factor Receptor-1 Modulates
Vascular Endothelial Growth Factor-Mediated Angiogenesis via Nitric Oxide. Am. J. Pathol. 2001, 159, 993–1008. [CrossRef]58. Straßburg, A. Ernährungserhebungen Methoden und Instrumente. In Ernährungs-Umschau; UMSCHAU ZEITSCHRIFTENVER-
LAG GmbH: Wiesbaden, Germany, 2010; pp. 422–430.59. Anstey, K.J.; Cherbuin, N.; Budge, M.; Young, J. Body Mass Index in Midlife and Late-Life as a Risk Factor for Dementia: A
Meta-Analysis of Prospective Studies. Obes. Rev. 2011, 12, e426–e437. [CrossRef]60. O’Brien, P.D.; Hinder, L.M.; Callaghan, B.C.; Feldman, E.L. Neurological Consequences of Obesity. Lancet Neurol. 2017, 16,
465–477. [CrossRef]61. Sabia, S.; Kivimaki, M.; Shipley, M.J.; Marmot, M.G.; Singh-Manoux, A. Body Mass Index Over the Adult Life Course and
Cognition in Late Midlife: The Whitehall II Cohort Study. Am. J. Clin. Nutr. 2009, 89, 601–607. [CrossRef]62. Dahl, A.K.; Hassing, L.B.; Fransson, E.; Gatz, M.; Reynolds, C.A.; Pedersen, N.L. Body Mass Index Across Midlife and Cognitive
Change in Late Life. Int. J. Obes. 2013, 37, 296–302. [CrossRef] [PubMed]63. Koch, M.; Fitzpatrick, A.L.; Rapp, S.R.; Nahin, R.L.; Williamson, J.D.; Lopez, O.L.; DeKosky, S.T.; Kuller, L.H.; Mackey, R.H.;
Mukamal, K.J.; et al. Alcohol Consumption and Risk of Dementia and Cognitive Decline Among Older Adults with or withoutMild Cognitive Impairment. JAMA Netw. Open 2019, 2, e1910319. [CrossRef] [PubMed]
64. Xu, G.; Liu, X.; Yin, Q.; Zhu, W.; Zhang, R.; Fan, X. Alcohol Consumption and Transition of Mild Cognitive Impairment toDementia. Psychiatry Clin. Neurosci. 2009, 63. [CrossRef] [PubMed]
Copyright © 2022 FDOKUMEN