How Tobacco & BMI Shape the Subgingival Microbiome
100
Smoking Thirties: How Tobacco & BMI Shape the Subgingival Microbiome Thesis Presented in Partial Fulfillment of the Requirements for the Degree Master of Science in the Graduate School of The Ohio State University By Najla Sani Kasabreh Graduate Program in Dentistry The Ohio State University 2019 Thesis Committee Dr. Purnima Kumar, Advisor Dr Dimitris Tatakis Dr Emmanouil Chatzakis Dr Shareef Dabdoub
-
Upload
khangminh22 -
Category
Documents
-
view
1 -
download
0
Transcript of How Tobacco & BMI Shape the Subgingival Microbiome

1
Smoking Thirties: How Tobacco & BMI Shape the Subgingival Microbiome
Thesis
Presented in Partial Fulfillment of the Requirements for the Degree Master of Science in
the Graduate School of The Ohio State University
By
Najla Sani Kasabreh
Graduate Program in Dentistry
The Ohio State University
2019
Thesis Committee
Dr. Purnima Kumar, Advisor
Dr Dimitris Tatakis
Dr Emmanouil Chatzakis
Dr Shareef Dabdoub

2
Copyrighted by
Najla Sani Kasabreh
2019

ii
Abstract
Background: 25% of Americans are obese, 20% are smokers and 9 million are obese
smokers. It has been demonstrated that both smokers and obese individuals demonstrate a
greater susceptibility for periodontitis, a bacterially-driven disease that leads to
destruction of tooth supporting structures and eventual tooth loss. While early research
attributed the link between obesity and periodontitis to the inflammatory effects of
adipocytes on subgingival host response, evidence is emerging that the etiology is a
multi-factorial. Our research group and others have previously demonstrated that
smoking promotes acquisition of periodontal pathogens within oral microbiome, and that
this dysbiotic shift contributes to increased risk for periodontitis. Therefore, we aimed to
test the hypothesis that both obesity and smoking increase the risk for periodontitis by
disrupting the oral microbiome, albeit in different ways.
Methods: 183 subjects were recruited following informed consent and divided into
groups based on body mass index and smoking status. Bacterial 16S rDNA genes were
sequenced from subgingival plaque samples. Sequence analyses were conducted using
QIIME and PhyloToAST. Metabolomic analysis was performed on saliva samples using
NMR spectroscopy. Levels of selected cytokines and adipokines in gingival crevicular
fluid were determined by multiplexed bead-based assay.

iii
Results: Linear Discriminant Analysis (LDA) showed significant group separation
between obese and normalweight individuals (p= 0.026, 0.009, 0.001 Adonis test of
weighted, unweighted UniFrac distances and Bray-Curtis Dissimilarity Index). 138
species were significantly different between obese and normalweight individuals. 73
species belonging to the genera Actinomyces, Alloprevotella, Capnocytophaga,
Cardiobacterium, Enterococcus, Fusobacterium, Gemella, Haemophilus, Kingella,
Leptotrichia, Neisseria, Streptococcus, TM7 and Treponema were lower in the obese
individuals ; 65 species of the genera Atopobium, Bacteroidetes, Dialister, Lactobacillus,
Prevotella, Selenomonas, Stomatobaculum, and Veillonellaceae were higher in
abundance. Network analysis revealed a highly connected hub anchored by ghrelin, GIP-
1, adipsin, glucagon and insulin in obese, but not normalweight subjects. These
adipokines emerged as discriminants of the subgingival environment in obese subjects.
LDA also revealed significant group separation between obese smokers and
normalweight nonsmokers (p =0.021,0,001, 0.001 Adonis test of weighted, unweighted
UniFrac distances and Bray Curtis Dissimilarity index). Obese smokers were enriched for
putative pathogens belonging to the genera Atopobium, Bacteroidaceae, Bifidobacterium,
Dialister, Lactobacillus, Mycoplasma, Prevotella, Treponema and Veillonellaceae.
Salivary metabolic profiles also differed significantly between obese smokers and
normalweight nonsmokers. Obese smokers presented with higher levels of lactatic acid
and lower levels of methanol compared to normalweight nonsmokers. Significant
correlations were observed between these metabolites and bacterial community networks.

iv
Conclusion: By overlaying untargeted metabolomics over an open-ended method for
bacterial characterization, we demonstrate that obesity and smoking impact the
subgingival microbiome in significant and distinct ways, leading to enrichment of
specific bacterial species, as well as the metabolites produced by them. We also provide
the first evidence that adipokines and cytokines play important roles in shaping this
ecosystem. When obesity intersects with smoking, the whole shift is greater than the sum
of the parts.

v
Dedication
Dedicated to my dad, my mum and my sisters (Nadine, Nora and Natalie) for their
tremendous love and support.

vi
Acknowledgments
I wish to thank Dr. Purnima Kumar for her unlimited guidance, unique
mentorship, huge support and her continuous encouragement through all the times.
I also wish to thank my committee members Dr. Dimitris Tatakis, Dr. Emmanouil
Chatzakis and Dr. Shareef Dabdoub for their contribution and guidance.
I also want to mention Dr. Khaled Altabtbaei, Dr. Shareef Dabdoub, Dr. Sukirth
Ganesm, Dr. Vinayak Joshi, Dr. Shweta Saraswat and Dr.Naveen Dasari who were very
generous to teach me how to perform clinical and laboratory steps, manipulation and data
analysis.
I would like to thank all the members of the Ohio State University Periodontology
department, Dr. Omar Karadsheh from the University of Jordan and Mr. Andrew Suzo
from the bariatric clinic. Without their assistance, Patient collection would have been
difficult.
Finally, I would like to thank my family, my friends and my faculty at University
of Jordan.

vii
Vita
2012 ... Obtained D.D.S.: University of Jordan
Publications
Hassona Y, Kasabreh N, Hammoudeh H, Scully C. Oral healthcare management in Bardet
Biedl syndrome. Spec Care Dentist. 2017 Jan;37(1):47–50.
Fields of Study
Major Field: Dentistry

viii
Table of Contents
Abstract ............................................................................................................................... ii Dedication ........................................................................................................................... v Acknowledgments .............................................................................................................. vi Vita .................................................................................................................................... vii List of Tables ...................................................................................................................... x List of Figures .................................................................................................................... xi Chapter 1. Introduction ....................................................................................................... 1
Obesity ............................................................................................................................ 1 Obesity and periodontal disease ...................................................................................... 4 Smoking .......................................................................................................................... 7 Smoking and periodontal disease .................................................................................... 7 Obesity, smoking and periodontal disease ...................................................................... 8
Specific Aims .................................................................................................................. 9 Chapter 2. Materials and Methods ................................................................................... 10
Subjects and site selection ............................................................................................ 10
Subgingival plaque collection ....................................................................................... 11 DNA isolation and sequencing ..................................................................................... 11 Comparative metataxonomic ........................................................................................ 11
NMR spectroscopy ........................................................................................................ 12 Inflammatory analysis ................................................................................................... 13
Chapter 3: Results ............................................................................................................. 14 Demographic ................................................................................................................. 14 BMI≥30 is a discriminant of the subgingival microbiome ........................................... 14 Subgingival microbiome is influenced by adipokine levels ......................................... 15 Men are from Mars, and women from Venus (unless they are obese) ......................... 16

ix
Smoking: an old story that still holds true .................................................................... 18 The subgingival microbiome at the intersection of BMI and smoking ........................ 20 Smoking thirties: Obese smokers present a distinct microbiome when compared to normalweight nonsmokers ............................................................................................ 23 Metabolic correlations explain microbial differences in BMI-smoking groups ........... 23
Chapter 4: Discussion ....................................................................................................... 26 Chapter 5: Summary and Conclusions .............................................................................. 34 Bibliography ..................................................................................................................... 36
Appendix A: Tables .......................................................................................................... 46 Appendix B: Figures ......................................................................................................... 79

x
List of Tables
Table 1 Demographic, biometric and clinical characteristics. .......................................... 46 Table 2 Ethnicity of individuals participating in the study. .............................................. 47 Table 3 Significant difference in adipokines and cytokines levels between BMI groups. 47 Table 4 Significant difference in metabolomic concentrations between BMI-smoking groups. ............................................................................................................................... 48 Table 5 Subgingival bacteria and metabolomes network in normalweight nonsmoker individuals. ........................................................................................................................ 48 Table 6 Subgingival bacteria and metabolomes network in normalweight smoker individuals. ........................................................................................................................ 49 Table 7 Subgingival bacteria and metabolomes network in overweight nonsmoker individuals. ........................................................................................................................ 64 Table 8 Subgingival bacteria and metabolomes network in overweight smoker individuals. ........................................................................................................................ 67 Table 9 Subgingival bacteria and metabolomes network in obese nonsmoker individuals............................................................................................................................................ 73 Table 10 Subgingival bacteria and metabolomes network in obese smoker individuals. 75

xi
List of Figures
Figure 1 Linear discriminant analysis, Shannon index and DESeq for BMI groups. ....... 79 Figure 2 Cytokine discriminants and Cytokine discriminants For BMI groups. Cytokine discriminants (2A) and Cytokine discriminants (2B) between normalweight (green), overweight (orange) and obese (yellow) individuals. ....................................................... 80 Figure 3 Co-occurrence networks of BMI groups. ........................................................... 80 Figure 4 Linear discriminant analysis, Shannon index and DESeq for BMI sub-grouped according gender. .............................................................................................................. 81 Figure 5 Linear discriminant analysis, Shannon index and DESeq for smoking groups. 82 Figure 6 Linear discriminant analysis, Shannon index and DESeq for smoking sub-grouped according gender. ................................................................................................ 83 Figure 7 Linear discriminant analysis, Shannon index and DESeq for BMI-smoking groups. ............................................................................................................................... 84 Figure 8 Representative NMR spectrum. .......................................................................... 85 Figure 9 Metabolic profile of the BMI-Smoking groups. ................................................. 85 Figure 10 Co-occurrence networks in normalweight nonsmoker and normalweight smoker individuals. ........................................................................................................... 86 Figure 11 Co-occurrence networks in overweight nonsmoker and overweight smoker individuals. ........................................................................................................................ 87 Figure 12 Co-occurrence networks in obese nonsmoker and obese smoker individuals. 88

1
Chapter 1. Introduction
One-fourth of Americans are obese, and one-fifth are smokers 1. Together, 81 million
American adults are either obese or smoke. Even more importantly, 9 million Americans
are obese smokers 1. Obesity and smoking are often listed as risk factors for many
chronic conditions and diseases both in the medical and oral fields 2 3 4 5 6 7. These two
factors are thought to share a common etiopathogenetic mechanism of chronic
inflammation, causing detrimental effects on tissues. While some of these effects are
reversible, others are not. Importantly, the reversible outcomes take a very long time to
return to baseline following elimination of these factors. Smoking is listed as risk factor
in the 2017 classification of periodontal disease 8, and obesity is classified as a metabolic
and endocrine disorder that affects the periodontal tissues 9 .
Obesity
Obesity, defined as an excess or abnormal accumulation of fat, is associated with
increased risk for many systemic diseases including hypertension, type II diabetes,
cardiovascular diseases and stroke 10 . One metric used to numerically quantify the level
of obesity is the body mass index (BMI); which is the result of the person’s weight in
kilograms divided by the square of his/her height in meters. Accordingly, a person with a

2
BMI of <18.5 is considered underweight, ≥ 18.5 and < 25 is normal, ≥ 25 and < 30 is
overweight and with a BMI of ≥ 30, the person is considered obese 11.
A systematic analysis for the Global Burden of Disease Study in 2010 revealed that
overweight and obesity caused approximately 3.4 million deaths, 3.9% of years of life
lost and 3.8% of disability adjusted life years 10 . Annually, the medical expenditure
attributable to obesity in the US ranges between $147 and 210 million 12.
Globally, the prevalence of overweight and obesity combined has risen by 27.5% for
adults between 1980 and 2013, increasing the number of individuals from 921 million in
1980 to 2.1 billion in 2013 13. The proportion of overweight and obese male adults has
increased from 28.8% in 1980 to 36.9% in 2013. For female adults, the proportion
increased from 29.8% to 38.0% 13.
In developed countries, males exhibit higher rates of overweight and obesity than
females; the peak was around the age 55 years in males, with 70.9 % overweight and 31.7
% obese. For females the peak was 60 years with 61.9 % overweight and 33.9% obese 13.
More than 50% of the obese individuals in the world live in 10 countries, 13% of which
are in the USA 13.
According to NHANES report in 2017 14, 39.8% of US adults are obese. Obesity was
higher among older adults (40-59) compared to younger adults (20-39) and there was no

3
difference in prevalence between females and males. Hispanic (47.0%) and non-Hispanic
black (46.8%) adults had the highest prevalence of obesity, followed by non-Hispanic
white adults (37.9%). The prevalence was the lowest among non-Hispanic Asian adults
(12.7%).
The cause of obesity is complex and unknown; there appear to be biologic, psychosocial,
and behavioral factors. Obesity has been linked to gut microbiota, epigenetics, increasing
maternal age, greater fecundity, sleep deprivation, endocrine disruptors, pharmaceutical
products, reduction in variability of ambient temperatures and intrauterine and
intergenerational effects 15.
Many pathogens have been reported to have adipogenic effects; Canine distemper virus
was the first virus to be reported to induce obesity in mice 16 which was confirmed by
subsequent studies. Chlamydia pneumoniae was the first microorganism linked to
increased BMI in humans 17. Rous-associated virus-7, Scrapie agent, Borna disease virus
and Adenoviruses (Avian adenovirus, SMAM-1, Adenovirus type 5,36 and 37) were
among the other pathogens to be related to obesity.
In addition, several studies have reported a relationship between obesity and gut
microbiota. It was reported that a decrease in Bacteroides and an increase in Firmicutes
was seen in obese mice 18. In their study, Backhed el al., 2004 19 found that
conventionalized germ free mice developed more body fat and insulin resistance, even

4
with lower food consumption. The microbiota contributed to a 2.3-fold increase in
hepatic triglyceride content, no change in cholesterol, increased synthesis of de novo fatty
acid and decreased expression of fasting-induced adipocyte factor (Fiaf). The authors
suggested that suppression of Fiaf by the gut microbiota led to an increase hepatic
lipogenesis and adipose tissue 19.
Preadipocytes are believed to function like macrophages 20 and adipocytes to secrete
many cytokines and chemokines such as tissue necrosis factor (TNF), leptin, interleukin
(IL)-1 21 and IL-6 22. Moreover, Vendrell el al., 2004 23 found elevated levels of plasma
(soluble) TNF receptors in obese patients.
Obesity and periodontal disease
Periodontists and researchers have been long trying to establish whether a correlation
exists between these chronic inflammatory diseases. It started in 1977 when Perlstein and
Bissada 24 tested the hypotheses: “Can hypertension and obesity be risk factors for
periodontal disease?” Normalweight and obese rats were fed with standard diet
containing 5% fat. Gingival irritation was produced using stainless steel wire that was
placed around the maxillary second molar. The other maxillary second molar was used
as a control. 7 weeks later, animals were killed, and specimens were prepared for
histologic examination. The answer to that question was that obesity does not induce
periodontal destruction, but periodontal inflammation and destruction was greater in the
presence of bacterial plaque.

5
The NHANES III report in 2014 25 showed that waist to hip ratio (WHR), BMI, fat-free
mass, and log sum of subcutaneous fat had significant correlations with periodontal
disease, suggesting that abnormal fat metabolism may be an important factor in the
pathogenesis of periodontal disease. Subsequently, many studies were conducted to
investigate more in this linkage. Epidemiological studies noticed an increase in
periodontal disease with an increase in obesity. For example, in a Jordanian population,
the prevalence of periodontal disease was found to be 14% among normalweight
individuals, 29.6% among overweight and 51.9% among obese individuals 26. Moreover,
it was found that the risk of experiencing an increase in attachment loss in 5 years was
36% higher in obese individuals compared to non-obese 27. Independent of other factors
such as gender, ethnicity, smoking status and dental plaque level; an odd ratio (OR) for
overweight/obesity of 1.12 per increase of 1 kg/m2 was found in periodontitis group. The
OR of periodontitis was 2.5 in overweight and 3 in obese 28.
The next step was to find an answer to these observations; why there is such an
association? How can the individuals’ increase in weight affect their oral health and how
does oral health affect the individuals’ weight? Answering this question is quite
complicated as general health and oral health have similar causal mechanisms and share
similar personal behaviors, socioeconomic and lifestyle factors. Some pointed to the fact
that obese individuals don’t take care of their general health and as an extension, will
subsequently not take care of their oral health; in fact, regular dental visits were found to

6
be lower among obese individuals when compared to non-obese individuals 29 30. After
adjustment of obesity risk factors, such as diet and energy intake, Saxlin et al 2011.,
concluded that the association between periodontitis and obesity is not influenced by
these factors 31. Ostberg et al., 2012 32 suggested inflammation (i.e. periodontitis) as a
possible factor.
More can be learnt about this relation through the obesity and gastrointestinal studies; the
microbiota can influence host adiposity through energy extraction and by affecting
metabolism. This will depend on the bacterial community composition. Gut bacteria can
initiate inflammation by inducing the production of TNF- 𝛼 and insulin resistance 33.
Another plausible mechanism is bacterial lipopolysaccharide (LPS). Saxlin et al 2011 31
suggested that LPS, endotoxins of gram-negative bacteria in the deepened periodontal
pockets might have an effect on obesity; they found an exposure-response among the
study population as more individuals with BMI≥30 had more teeth with deeper pocket
depth. Experimental studies had in fact linked endotoxemia to weight gain in mice
infused subcutaneously with LPS for 4 weeks but fed with a normal diet 34. This weight
gain was even similar to the weight gained by mice fed with higher fat diet for the same
period of time. Goodson et al., in 2009 suggested that this relation might be due to a shift
in the oral microbiota 35. In this study; it was suggested that this causal relation could be
attributed to ingestion of oral pathogens such as Selenomonas noxia.

7
Positive correlation between severity of periodontal attachment loss and BMI has been
identified in the literature 36 37 26 38 39 40 41 42 43. Subsequent studies described a 76%
higher prevalence of periodontal disease among young individuals with a BMI ≥30 with
an adjusted OR of 1.76 5. A systematic review and meta-analysis found about a 33%
increase in prevalence of obesity in individuals with periodontal disease, and a higher
mean attachment loss in obese individuals 44. Adipokine induced inflammation has been
proposed as the underlying etiopathogenic mechanism 45.
Smoking
A smoker is a person who smoked at least 100 cigarettes during his/her lifetime and is
currently smoking according to CDC guidelines 46. Smoking causes cancer,
cardiovascular disease, pulmonary diseases, immune diseases and stroke 7. Annually, the
medical expenditure attributable to smoking is $170 million 47. Worldwide, the
prevalence of daily tobacco smoking for males declined from 41.2% to 31.1% and for
females declined from 10.6 to 6.2% between 1980 and 2012 48 . In the U.S., 14% of the
adult population are smokers (15.8 % of males and 12.2% of females) 49.
Smoking and periodontal disease
The prevalence of periodontitis in smokers was about 4 times higher than in persons who
had never smoked; with about 41.9% of periodontitis cases in the U.S. adult population
being attributable to smok50. Current smokers had significantly more attachment loss,
missing teeth, deeper pockets and fewer sites exhibiting bleeding on probing than past or

8
never smokers 51. Classical papers have demonstrated that the effects of smoking are
associated with suppression of salivary and tissue neutrophil activity and increased levels
of IL-1ß 52.
Our long-standing research on tobacco has demonstrated that smoking promotes
acquisition of periodontal and oropharyngeal pathogens within the disease-naïve oral
microbiome. Smokers demonstrated higher abundances of anaerobes and lower levels of
aerobes when compared with nonsmokers. The subgingival microbiome of smokers was
enriched for periodontal and systemic pathogens Fusobacterium nucleatum, F.
naviforme, Filifactor alocis, Dialister microaerophilus, Desulfobulbus sp. clone R004,
Megasphaera sueciensis, M. geminatus, M. elsdenii, M. micronuciformis, Acinetobacter
johnsonii, A. guillouiae, A. schindleri, A. baumannii, A. haemolyticus, Pseudomonas
pseudoalcaligenes and Pseudoramibacter alactolyticus 5353. In addition, our lab found
that there were significantly lower levels of several health-compatible commensals, such
as: Streptococcus sanguinis, S. parasanguinis, S. oralis, Granulicatella elegans, G.
adiacens, Actinomyces viscosus, A. israelii, A. dentalis, Neisseria subflava and
Hemophilus parainfluenzae 53 .
Obesity, smoking and periodontal disease
Studies that examine the combined impact of both factors are scarce. Wood and Johnson
2008 54 found that smokers with a Periodontal Screening and Recording (PSR) code of 4
(indicating that they had severe periodontitis in at least one quadrant of their dentition)

9
had a significant risk of being obese or overweight. Classification and regression analysis
of 372 Japanese workers demonstrated that both pack-years and BMI exhibited clear
dose-response relationships with periodontitis 55.
Specific Aims
Based on a review of the literature and our own prior work, we hypothesized that both
smoking and BMI>25 will impact the subgingival microbial ecosystem. We tested this
hypothesis using the following aims:
Aim 1: To characterize the subgingival community of periodontally and systemically
healthy individuals who smoke, are obese or are obese smokers.
Aim 2: To stratify the salivary metabolic profiles of these individuals according to their
BMI and smoking status.
Aim 3: To assess the inflammatory burden imposed by the microbiome in obese,
overweight and normalweight individuals.

10
Chapter 2. Materials and Methods
Subjects and site selection
Approval for this study was obtained from the Office of Responsible Research Practices
at The Ohio State University (Protocol number: 2016H0438) and the study was
conducted in accordance with the approved guidelines. 183 subjects were recruited from
those visiting the Bariatric Surgery Clinics and College of Dentistry at The Ohio State
University and College of Dentistry at the University of Jordan and informed consent
obtained. Participants were divided into groups according to their smoking status (smoker
or nonsmoker) and their BMI status (normalweight, overweight or obese). Current
smokers were those who had smoked more than 100 cigarettes in their lifetime (CDC
guidelines). Nonsmokers were defined as those with a lifetime exposure of less than 100
cigarettes and not currently smoking. Normalweight were individuals with BMI<25,
overweight was 25≤BMI<30 and obesity was BMI ≥30. Inclusion criteria were
systemically (ASA I and ASA II) and periodontally healthy subjects (attachment loss ≤ 1,
less than 3 sites with 4mm of probe depths (PD), bleeding on probing (BOP) ≤ 20%,
who were 18 years or older with at least 20 natural teeth in their dentition. Exclusion
criteria for all groups included those who had had antibiotic therapy or professional
cleaning within the previous 3 months, required antibiotic coverage before dental

11
treatment, used immunosuppressant medications, bisphosphonates or steroids, reported a
history of controlled or uncontrolled diabetes or HIV or had fewer than 20 teeth in the
dentition.
Subgingival plaque collection
Comprehensive periodontal examination consisting of clinical attachment levels, plaque
index (PI), gingival index (GI), pocket depth (PD) and bleeding on probing was done on
all participants. Subgingival plaque samples were collected and pooled from 15 mesial
sites on tooth numbers 6,7,8,9,22,23 and 24 using sterile endodontic paper-points (Caulk-
Dentsply, Milford, DE, USA).
DNA isolation and sequencing
Bacterial DNA was isolated using a Qiagen DNA MiniAmp kit (Qiagen, Valencia, CA,
USA) according to instructions. Two regions of the 16S rRNA genes were sequenced as
previously described 56 . Analyses were conducted using the QIIME 57 and PhyloToAST
58. Sequences with an average quality score of 30 over a sliding window of 50bp and
length >200 bp were assigned a taxonomic identity by alignment to the HOMD database
59 using the Blastn algorithm at 99% identity.
Comparative metataxonomic
Both phylogenetic (UniFrac) and non-phylogenetic (Bray–Curtis) distance matrices were
utilized to estimate beta diversity. Linear discriminant analysis (LDA) was performed on

12
distance matrices and on variance-stabilized relative abundances of species-level OTUs.
Significance of clustering was interrogated using Adonis with 999 permutations. The
Bioconductor package for R, DESeq2, was used to test differences in OTU abundances,
and p-values were adjusted for multiple testing (FDR < 0.1, FDR-adjusted Wald Test).
FDR-corrected significance and overlapping pairwise Spearman’s ρ and Kendall-τ
correlations were used to create the graph structures using NetworkX and Gephi. A
correlation value of ≥0.75 and a p-value <0.05 were used.
NMR spectroscopy
Saliva was collected using a methodology described by Navazesh 60. Briefly, subjects
were asked to collect saliva in their mouth for 3 minutes and then continuously drool into
a tube for 3 minutes. This method allowed us to collect unstimulated saliva. NMR
spectroscopy was performed on 500 μl of saliva. Saliva samples were analyzed using the
first increment of NOESY pulse sequence with presaturation and the CPMG pulse
sequence. 1H NMR spectra were acquired at 298K using 128 scans and 64K data points.
2D NMR was applied on selected samples to confirm the identity of the specific
metabolites. All free induction decays (FIDs) were multiplied by a decaying exponential
function with a 1 Hz line broadening factor prior to Fourier transformation. The 1H NMR
spectra were corrected manually for phase and a polynomial fourth-order function was
applied for base-line correction in order to achieve accurate and reproducible
measurements upon integration of the signals of interest. Chemical shifts are reported in
ppm as referenced to TSP (δ = 0). All spectra were processed and analyzed using Topspin

13
3.2. Prior to statistical data analysis, each bucketed region was normalized to the total
sum of the spectral intensities to compensate for the overall concentration differences.
Inflammatory analysis
Gingival crevicular fluid (GCF) samples were collected and pooled from 6 distal sites on
tooth numbers 6,7,8,22,23 and 24 using sterile absorbing paper strips. Levels of
interferon (IFN)-γ, IL-1ß, IL2, IL-4, IL-5, IL-6, IL-10, IL-12 and (TNF)-α as well as
selected adipokines (resisitin, leptin, adipsin, ghrelin, gastro-inhibitory peptide (GIP),
adiponectin, C-peptide, plasminogen activator inhibitor 1 (PAI-1), glucagon like peptide
1 (GLP-1),visfatin, glucagon and insulin) in GCF were determined using a multiplexed
bead-based assay. Assays were carried out according to the manufacturer’s
recommendations using the MAGpix™ instrument (MiraiBio, Alameda, CA) and
concentrations were estimated from the standard curve using a five-parameter polynomial
equation using Xponent® software (Millipore, Corporation, Billerica, MA).

14
Chapter 3: Results
Demographic
183 individuals were included in the cross-sectional study (Table 1); 131 were
nonsmokers. 53 were normalweight (BMI average of 21.5), 54 overweight (BMI average
= 26.8) and 76 were obese (BMI average= 42.1). The age ranged from 19-63 (mean 32.1
years). Mean PI and GI were < 1 and mean PD was < 3 mm for all groups. 121
individuals were females. 22 were African American, 14 Asian, 105 Caucasian, 6
Hispanic and 35 were Middle Eastern (Table 2). 32.3 million sequences were generated.
They represented 579 species-level OTUs.
BMI≥30 is a discriminant of the subgingival microbiome
LDA showed significant group separation between obese and normalweight individuals
with a (p-value =0.026, 0.009, 0.001, Adonis test of weighted UniFrac, unweighted
UniFrac and Bray-Curtis respectively), but no differences could be identified between
either obese and overweight or overweight and normalweight individuals (p-value > 0.05,
Figure 1A). Alpha diversity (as measured by Shannon) was not significantly different
between the 3 groups (p-value > 0.05, Figure 1B). 138 species were significantly
different between obese and normalweight individuals (Figure 1C) , 73 were lower in the

15
obese individuals, notably species related to genera Actinomyces, Alloprevotella,
Capnocytophaga, Cardiobacterium, Enterococcus, Fusobacterium, Gemella,
Haemophilus, Kingella, Leptotrichia, Neisseria, Streptococcus, TM7 and Treponema and
65 species were higher, notably, Atopobium, Bacteroidetes, Dialister, Lactobacillus,
Prevotella, Selenomonas, Stomatobaculum, and Veillonellaceae; constituting 38.1% of
the species.
Subgingival microbiome is influenced by adipokine levels
Multivariate discriminant analysis (Tukey HSD, p-value < 0.05, Table 3) showed a
difference in adipokine and cytokine profiles among individuals based on BMI. Resitin,
leptin, adipsin, TNF- 𝛼,IL-6,andIL-10weresignificantlyhigher,whileGLP-1was
significantlylowerinobeseindividualscomparedtonormalweightindividual.
Higher concentrations of ghrelin, leptin, GIP, adipsin, glucagon and insulin characterized
the profiles of obese individuals, while elevated resistin, adiponectin, C-peptide PAI-1,
visfatin were characteristics of the overweight group. Elevated GLP-1 characterized the
normalweight group. All groups shared similar levels of cytokines such as IL-5, IL-12,
IL-2 and IFN-g, however, elevated TNF- 𝛼 and IL-6 characterized obese group, IL-10
was characteristic of overweight group and IL-4 discriminated the normalweight controls
(Figure 2A-B).
Network analysis revealed a robust, highly connected hub anchored by ghrelin, GIP,
glucagon, insulin, adipsin and IL-5 in obese individuals. Most for the significant

16
correlations for these molecules were with species in the genera Porphyromonas,
Capnocytophaga and Actinomyces. Similar hubs anchored by Ghrelin, GLP-1, C-Peptide
were observed in overweight individuals, Resistin correlated positively with subgingival
community in normalweight individuals (Figure 3 A-C). These adipokines also emerged
as discriminants of the subgingival environment in these individuals. Strong negative
correlations were seen between inflammatory cytokines and bacteria more often in
normalweight and overweight but not obese individuals, suggesting an uncoupled host-
bacterial equilibrium.
Men are from Mars, and women from Venus (unless they are obese)
Subgroup analysis by gender revealed that normalweight and overweight, but not obese,
women are microbially distinct from men in the same categories (p-value=0.001, 0.01
respectively, Adonis of Unweighted Unifrac, p-value=0.007, 0.005 respectively, Adonis
of Bray Curtis Dissimilarity distances), indicating that BMI outweighs gender as a
determinant of the microbiome once BMI is ≥ 30 (Figure 4A). Furthermore, females
exhibited significant group separation between obese and normalwieght and between
obese and overweight females (p-value = 0.019, 0.004, 0.001, Adonis test of weighted
UniFrac, unweighted UniFrac and Bray-Curtis respectively). Alpha diversity (as
measured by Shannon, Ace, Chao 1) was not significantly different once BMI was ≥ 30.
(p-value > 0.05 between obese groups, Figure 4B).

17
84 species out of 529 were significantly different between females and males in
normalweight category (Figure 4C). We noted 46 taxa that were significantly lower in
females, which belonged to genera Actinomyces, Fretibacterium, Peptostreptococcaceae
and Treponema. Species belonging to genera Capnocytophaga, Leptotrichia, Prevotella,
Rothia, Selenomonas, Streptococcus and TM7 were significantly higher contributing to
16.5% of the abundant species.
86 species out of 521 were significantly different between overweight females and males,
(Figure 4D). Overweight females demonstrated significantly lower levels of 42 species
belonging to genera Aggregatibacter, Alloprevotella, Prevotella and Treponema and
higher abundances of species belonging to genera Actinomyces, Capnocytophaga,
Corynebacterium, Haemophilus and Streptococcus contributing to 21.8% of the species.
Interestingly, species that were abundant in normalweight females were found in higher
abundances in overweight males. For example, species of the genera Eikenella,
Leptotrichia, SR1, Provotella, TM7, Actinomyces, Desulfobulbus, Haemophilus, and
Megasphaera were higher in normalweight females when compared to normalweight
males. However, they were higher in overweight males when compared to overweight
females.
Out of the 551 species, 135 were significantly different between normalweight and obese
females (Figure 4E), 70 species were significantly less in obese females, notably species
belonging to genera Alloprevotella, Capnocytophaga, Cardiobacterium, Fusobacterium,

18
Gemella, Leptotrichia, Neisseria, Peptostreptococcaceae and TM7. However, species
belonging to genera Actinomyces, Atopobium, Bifidobacterium, Dialister, Lactobacillus,
Mycoplasma, Prevotella, Selenomonas, Treponema and Veillonellaceae were higher in
this cohort constituting 8.1% of the abundant species.
Smoking: an old story that still holds true
Significant clustering was seen between smokers and nonsmokers as showed by LDA of
weighted UniFrac, unweighted UniFrac and Bray-Curtis with p= 0.001, 0.001, 0.001
respectively, Adonis test) (Figure 5A). Alpha diversity (as measured by Shannon) was
significantly different between the 2 groups (p<0.0001, 0.0003, 0.0008 respectively
(Figure 5B). 244 species were significantly different between nonsmokers and smokers
(Figure 5C); 84 species were lower in abundance in nonsmokers, these species belonged
to genera Bifidobacterium, Dialister, Fretibacterium, Lactobacillus, Mycoplasma,
Prevotella and Treponema. On the other hand, Actinobaculum, Actinomyces, Bergeyella,
Capnocytophaga, Cardiobacterium, Enterococcus, Fusobacterium, Gemella, GN02,
Granulicatella, Haemophilus, Kingella, Lachnospiraceae, Leptotrichia, Neisseria,
Oribacterium, Parvimonas, Porphyromonas, Propionibacterium, Rothia, Selenomonas,
SR1, Streptococcus, Tannerella and TM7 were significantly higher in nonsmokers.
Constituting to 57.6 % of the species.
LDA showed clustering between subgroups; which was significant between female
nonsmoker vs female smoker (weighted UniFrac, unweighted UniFrac and Bray-Curtis

19
with p= 0.005, 0.001, 0.001 respectively) and between male nonsmoker vs male smoker
(weighted UniFrac, unweighted UniFrac and Bray-Curtis with p= 0.032, 0.001, 0.001
respectively, (Figure 6A) . Alpha diversity (as measured by Shannon) was significantly
different between the male smokers and female nonsmokers and between male smokers
and male nonsmokers with p-value <0.00001 (Figure 6B).
From the 562 species between female nonsmoker and female smoker (Figure 6C), 146
were significantly different; 45 species were less in female nonsmoker group notably
species belonging to genera Bifidobacterium, Lactobacillus, Mycoplasma, Prevotella and
Selenomonas. Actinomyces, Aggregatibacter, Bergeyella, Capnocytophaga,
Cardiobacterium, Haemophilus, Leptotrichia, Neisseria, Rothia, SR1, Streptococcus,
Tannerella and TM7 were the species genera higher in female nonsmokers with a relative
abundance of 44.0 % in female nonsmokers.
Out of the 531 species between male nonsmoker and male smoker (Figure 6D), 192 were
significantly different; 58 species were less in male nonsmoker group notably species
belonging to genera Bacteroidaceae, Bifidobacterium, Lactobacillus, Prevotella,
Stomatobaculum and Treponema. Actinomyces, Aggregatibacter, Alloprevotella,
Campylobacter, Capnocytophaga, Cardiobacterium, Enterococcus, Fusobacterium,
Gemella, Granulicatella, Haemophilus, Kingella, Leptotrichia, Neisseria, Parvimonas,
Peptostreptococcaceae, Porphyromonas, Propionibacterium, Rothia, Selenomonas, SR1,

20
Streptococcus, TM7 and Veillonella were the species genera higher in male nonsmokers
with a relative abundance of 10.4% in male nonsmokers.
The subgingival microbiome at the intersection of BMI and smoking
LDA revealed significant group separation between the individuals when they were
grouped according to their BMI and smoking status (Figure 7A); for instance, weighted
UniFrac, unweighted UniFrac and Bray-Curtis were significant between normalweight
nonsmokers and smokers (p= 0.007, 0.001, 0.001 respectively), overweight nonsmokers
and smokers (p= 0.011, 0.002, 0.003 respectively), obese nonsmokers and smokers (p=
0.02, 0.001, 0.001 respectively), normalweight nonsmoker and obese nonsmokers (p=
0.072, 0.036, 0.002 respectively), normalweight smoker and obese smoker (p= 0.039,
0.033, 0.006 respectively), normalweight nonsmoker and obese smoker (p= 0.001, 0.001,
0.001 respectively), and normalweight smoker and obese nonsmoker (p= 0.021, 0.001,
0.001 respectively). Alpha diversity (as measured by Shannon, Ace, Chao 1) was
significantly different between obese smoker and nonsmoker, overweight smoker and
nonsmoker, and between obese smoker and normalweight nonsmoker, with p-value <0.05
(Figure 7B).
144 species out of 529 were significantly different between normalweight nonsmokers
and smokers. 54 species were less in normalweight nonsmoker, such as; Bacteroidetes,
Fretibacterium and Treponema. 90 species were higher, and they belonged to genera
Capnocytophaga, Cardiobacterium, Fusobacterium, Gemella, Leptotrichia, Neisseria,

21
Parvimonas, Propionibacterium, Rothia, Selenomonas, SR1, Streptococcus and TM7. The
relative abundance in normalweight nonsmoker was 51.8%, indicating that they were not
rare taxa, but dominant members of the community.
66 species out of 521 were significantly different between overweight nonsmokers and
smokers. 17 species were less in overweight nonsmoker, such as Leptotrichia,
Mitsuokella, Prevotella and Treponema. 49 species were higher, and they belonged to
genera Actinomyces, Bergeyella, Capnocytophaga, Haemophilus, Neisseria, Parvimonas,
Propionibacterium, Pseudomonas, Rothia and Streptococcus. The relative abundance of
these species in overweight nonsmoker was 27.0%.
183 species out of 550 were significantly different between obese nonsmokers and
smokers. 58 species were less in obese nonsmoker, such as Bifidobacterium,
Lactobacillus, Mycoplasma and Prevotella. 125 species were higher, and they belonged
to genera Actinomyces, Aggregatibacter, Capnocytophaga, Cardiobacterium,
Fretibacterium, Gemella, Granulicatella, Haemophilus, Lachnospiraceae, Leptotrichia,
Neisseria, Parvimonas, Peptostreptococcaceae, Porphyromonas, Propionibacterium,
Rothia, Selenomonas, Streptococcus, Tannerella, TM7 and Veillonella. The relative
abundance of these species in obese nonsmoker was 47.5%, indicating that they were not
rare taxa, but dominant members of the community.

22
116 species out of 551 were significantly different between normalweight and obese
nonsmokers. 58 species were less in normalweight nonsmoker, such as Actinomyces,
Atopobium, Dialister, Fretibacterium, Lachnoanaerobaculum, Megasphaera, Prevotella,
Selenomonas, Treponema and Veillonellaceae. 58 species were higher, and they belonged
to genera Alloprevotella, Capnocytophaga, Cardiobacterium, Enterococcus,
Fusobacterium, Haemophilus, Kingella, Leptotrichia, Neisseria and SR1. Relative
abundance in normalweight nonsmoker was 38.2% indicating that they were not rare
taxa, but dominant members of the community.
102 species out of 503 were significantly different between normalweight and obese
smokers. 53 species were less in normalweight smoker, such as Atopobium,
Bifidobacterium, Dialister, Lactobacillus, Parvimonas, Prevotella and Streptococcus. 48
species were higher, and they belonged to genera Aggregatibacter, Fretibacterium,
Leptotrichia, Neisseria, Tannerella, TM7 and Treponema. Relative abundance in
normalweight smoker was 20.7%.
104 species out of 542 were significantly different between normalweight smoker and
obese nonsmoker. 65 species were less in normalweight smoker, such as Actinomyces,
Leptotrichia, Parvimonas, Prevotella, Rothia, Selenomonas, Streptococcus and TM7. 39
species were higher, and they belonged to genera Neisseria and Treponema. Relative
abundance in normalweight smoker was 16.5%.
23
Smoking thirties: Obese smokers present a distinct microbiome when compared to normalweight nonsmokers
The differences revealed by alpha and beta diversity between normalweight nonsmoker
and obese smoker were driven by the levels of 233 species out of 535 (Figure 7C). Obese
smokers were enriched for putative pathogens belonging to the genera Atopobium,
Bacteroidaceae, Bifidobacterium, Dialister, Lactobacillus, Mycoplasma, Prevotella,
Treponema and Veillonellaceae. Species belonging to genera Actinomyces,
Aggregatibacter, Campylobacter, Capnocytophaga, Cardiobacterium, Eikenella,
Enterococcus, Fusobacterium, Gemella, Granulicatella, Haemophilus, Kingella,
Lachnospiraceae, Leptotrichia, Mycoplasma, Neisseria, Porphyromonas,
Propionibacterium, Selenomonas, SR1, Streptococcus, TM7 and Veillonella were higher
in normalweight nonsmokers. Relative abundance in normalweight nonsmoker was
67.4%.
Metabolic correlations explain microbial differences in BMI-smoking groups
NMR spectroscopy identified the metabolic profile of each individual (Figure 8). Linear
discriminant analysis showed differences in metabolic profiles were identified between
the 6 groups (Figure 9). 31 metabolites were identified in the saliva samples collected.
Formate, lactic acid, phenylalanine, and methanol were the metabolites found to be
significantly different between groups (Tukey HSD, p-value < 0.05, Table 4). Lactic acid
was significantly higher in obese smokers compared to normalwieght nonsmoker (p-
value =0.0401) and obese nonsmoker (p-value = 0.0192) while methanol was
significantly lower in obese smoker compared to normalweight nonsmoker (p-

24
value=0.0165). Phenylalanine was significantly higher in nonsmoker groups
(normalweight nonsmoker vs overweight smoker with p-value= 0.0067, obese nonsmoker
vs overweight smoker with p-value= 0.0065, and overweight nonsmoker vs overweight
smoker with p-value =0.0394). Formate was significantly higher in overweight smoker
compared to overweight nonsmoker (p-value = 0.0283) and normalweight nonsmoker (p-
value=0.0468).
Significant correlations were observed between these metabolites and bacterial
community networks (Figures 10-12). SCFA were undetectable in normalweight
nonsmokers (Figure 10A) but some amino acids correlated to some species with only 6
correlations (Campylobacter gracilis corelated negatively with Lysine, Bergeyella sp.
oral taxon 900 corelated negatively with Glycose, Streptococcus australis corelated
positively with Leucine, Streptococcus mitis corelated positively with Lysine and
Leptotrichia wadei corelated positively with Glutamine (Table 5). On the other hand,
472 significant correlations were identified in normalweight smokers with robust positive
hubs anchored by acetic acid, acetoin, alanine, butyrate, formate, fucose, galactose,
leucine, phenylalanine and tyrosine (Figure 10B); 53.8% were negative correlations
(Table 6). In overweight nonsmoker, 68 correlations were identified (Table 7), of which,
44.1% were negative. Positive correlations were anchored by Acetoin, aspartate, butyrate,
fucose, galactose, glutamine, histidine, leucine and proline (Figure 11A). 159
correlations were identified in overweight smokers (Table 8), of which, 44.7 % were
negative. Positive correlation was anchored by acetic acid, alanine, butyrate,

25
ethanolamine, fucose, galactose, glucose, glutamine, histidine, isoleucine, leucine, lysine,
methanol, propionate and valine. 38 correlation were identified in obese nonsmoker
group (Figure11B) with 52.8% being negative correlations (Table 9). Positive
correlations were anchored by alanine, aspartate, formate, fucose, galactose, leucine,
phenylalanine, propionate sugars polyols, ethyl propionate and proline (Figure 12A). In
obese smokers, 119 correlations were identified and 52.9 % were negative (Table 10).
Robust hubs were anchored by ethanolamine, formate, glucose, lactic acid, methanol,
propylene glycerol, succinic acid, ethyl propionate and proline (Figure 12B).

26
Chapter 4: Discussion
This study had 3 objectives; the first one was to investigate whether obesity poses a
potential risk factor for periodontal disease through its effects on the subgingival
microbiome. A metataxonomic approach was used to characterize the microbiome in
these individuals. The second objective was to identify a correlation between adipokines
levels and the subgingival bacterial community. The last objective was to identify the
effect of smoking and obesity on the subgingival community and to identify the
metabolic correlations between different bacterial taxonomies and metabolites present in
saliva.
There are several indices that can be used to quantify obesity; BMI, waist circumference
(WC), Hip conference (HC), waist to hip ratio (WHR) and body fat percentage (BF%).
These indices were tested to identify which one can be used to correlate between obesity
oral health. Morbidly and mortality studies proved similar significance when using these
indices 61 62. As an indicator for oral health, Ostberg et al., 2012 32 found that both
central and total obesity indices showed a significance, particularly for number of teeth
but not for numbers of carious lesions thus emphasizing careful consideration when
choosing an index. Saxlin et al., 2011 31 found an association between the number of
teeth with pocket depth ≥4mm when BMI, BF% and WC were used. Moreover, BMI,

27
WC, WHR and BF% were significantly associated with increased odds of periodontal
disease or were identified as risk indicator for periodontal disease by some authors 4 26.
Thus, we may conclude that using BMI as an index in our study allowed to identify an
association between obesity and periodontal health/disease.
Maciel et al., 2016 63 studied the influence of obesity on the subgingival community; they
reported that obese individuals with chronic periodontitis had higher levels of several
periodontal pathogens compared to normalweight individuals. These pathogens were
Aggregatibacter actinomycetemcomitans, Eubacterium nodatum, Fusobacterium
nucleatum ss vincentii, Parvimonas micra, Prevotella intermedia, Tannerella forsythia,
Prevotella melaninogenica and Treponema socranskii. The pathogens were present more
in deeper sites of the obese than normalweight individuals. In addition, the shallow
pockets of the obese individuals, whether they had chronic periodontitis or not, harbored
higher proportions of pathogens as compared to shallow pockets of normalweight
individuals. In our study, we noticed the presence of periodontal pathogens in obese,
smokers or obese smokers even though they were periodontally healthy.
The present investigation establishes associations between BMI and subgingival
microbial profiles and provides evidence that these are not simply explained by dietary
differences in obese and nonobese individuals. Although all individuals in this study had
healthy periodontium, the subgingival plaque composition of obese smokers was similar
to that of subjects with periodontal disease; some of these had correlations with SCFA or

28
with amino acids that can be used to form SCFA such as Olsenella uli 64 and
Pseudoramibacter alactolyticus 65 suggesting that this shift in the subgingival
microbiome is moving towards the dysbiosis seen in peridontontitis and risking a future
attachment changes.
With regard to adipokines; several studies have shown comparable concentrations of
different adipokines between obese and non-obese individuals such as adiponectin, leptin,
resistin, vaspin and adpisin IL-1𝛽 , IL-6,IL-8, IL-10 and TNF- 𝛼 66 67 68 69 70. However,
other studies have actually found that lipocaline-2 71 TNF- 𝛼 72 , IL-1𝛽 and IL-8 73
concentrations to be higher in obese individuals. Virto et al., in 2017 74 in an animal study
found a statistically significant difference between high fat diet rats versus normal diet
groups for IL-1𝛽 when periodontitis was induced. Insulin leptin, visfatin, and resistin
were significantly higher in obese rats with periodontitis. However, adiponectin levels
were lower in this group. Thanakakun et al., 2017 75 showed that leptin levels were higher
and adiponectin levels were lower in individuals with BMI ≥ 23.0. In our study, utilizing
multiplexed bead-based assay, we found highly connected hubs anchored by ghrelin,
leptin, adipsin, glucagon, insulin, GIP, IL-2, IL-6 and TNF- 𝛼 in obese individuals.
Adipokines can be produced by the adipose tissue. TNF- 𝛼 and IL-6 are also considered
proinflammatory adipokines. Circulating TNF- 𝛼 levels increase in obese individuals and
it is believed that this increase contributes to poor health due to production in C-reactive
peptide 76. TNF- 𝛼 inhibits adiponectin as well, an important anti-inflammatory
adipokine. Leptin, an adipokine that is secreted by adipocytes, enhances the proliferation

29
and activation of human circulating T lymphocytes and stimulation of cytokine
production, suppresses appetite, increases energy expenditure and increases glucose
uptake in muscle and adipose tissue. Ghrelin is a peptide hormone secreted by the
stomach and other tissues including teeth, salivary glands, immune cells and osteoblasts.
Ghrelin levels were found to be significantly increased in individuals with chronic
periodontitis 77. In our population, Ghrelin was found to be higher in the obese group as
well. Resistin, a hormone derived from adipocytes, plays a detrimental role in the
development of insulin resistance. Resistin levels were found to be higher in GCF
samples of overweight or obese individuals with periodontitis 78. In our study, resistin
characterized the adipokine profiles of overweight individuals. Adipsin, also known as
complement factor D initiates complement activation via the alternative pathway.
Schenkein in 1991 79 proposed that P. gingivalis protease is able to activate the
alternative pathway by mimicking complement factor D.
It has long been a question to whether gender is associated with periodontal disease or
not. It is known that the percentage of males with periodontal disease is greater than the
percentage of females. However, the mean attachment loss per year between males and
females 80 is not significantly different. Chaffee and Wetson 2010 44 found the association
between periodontal disease and obesity to be stronger in women, in nonsmokers, and in
younger individuals. Dalla Vecchia et al., 2005 81 observed a modification in the
association between obesity and periodontal disease due to gender; they concluded no
association between obesity and periodontitis in males while obese females had higher

30
likelihood of periodontitis than normalweight females. A five-year follow up of Dalla
Vechhia et al study, Gaio et al., 2016 27 revealed a significant progression of attachment
loss among obese females compared to normalweight females with 64% higher risk of
experiencing attachment loss progression. Again, this was not significant among males.
Suvan et al., 2015 28 found the odds ratio to have periodontitis to be ~ 2 in obese
compared to normalweight females and ~3 in obese nonsmoker females. Analysis
showed no such a significant correlation among males. Silva-Boghossian et al., 2018 82
found Porphyromonas gingivalis and Leptotrichia buccalis to be significantly higher in
obese females compared to normalweight. Our analysis revealed that Leptotrichia
buccalis is significantly lower in obese females while no significant difference was found
for Porphyromonas gingivalis. These observations may be explained by two factors: one
is the difference in methods for microbial characterization, and the other is that sub-group
analysis of our data based on males and females revealed that the subgingival
microbiome is significantly different between normalweight and obese females and such
difference was not noticeable between males. These species were again SCFA producing
such as Lactobacillus, Prevotella and Selenomonas. Another observation was that even
between the same BMI category, there was a difference in species levels. This difference
was no longer present once the individual was categorized as obese. Providing an
evidence that gender can be a determinant for subgingival bacteria but is outweighed by
obesity at BMI≥30.

31
SCFA are the products of the bacterial anaerobic fermentation. The glycolysis pathway
starts with glucose 6-phosphate and produces pyruvate and ATP; pyruvate can be
metabolized into lactate, acetate, ethanol, and formate. Streptococcus, Actinomyces, and
Lactobacillus are saccharolytic oral bacteria that share this pathway 83. Free fatty acids in
plasma were found to be higher in obese with periodontitis suggesting an association 74.
In the gut, most of these SCFA are beneficial; they can be a source of energy, they
regulate gene expression and recently, Louis et al 2014 84 pointed out that SCFA can also
regulate immune cell development and act as anti-inflammatory molecules. The story is
however different in the oral cavity. Niederman et al., (1996,1997) 85 86 cross-sectionally
examined human subjects with and without periodontal disease, both on subject and site
levels showing a significant correlation between SCFA and gingival inflammation.
Butyrate and propionate effect on the periodontium has been extensively studied in vitro;
They are believed to induce reactive oxygen production, suppress proliferation of
endothelial cells, gingival epithelial cells and fibroblasts proliferation, induce epithelia
cell apoptosis, inhibit leukocyte apoptosis and cytokines release 86 87 88 89 90 91. While in
the large intestine, butyrate and propionate act as an anticarcinogenic and anti-
inflammatory SCFA 92 93 94 95.
Lactic acid is an end product of the glycolytic cascade. Macfarlane and Gibson in 1995 96
have shown that lactate and acetate is produced by Actinomyces, Bacteroides, Eubacteria,

32
and Fusobacteria. Butyrate is produced by Eubacteria, Fusobacteria and Peptococci and
formate by Lactobacilli.
Propionate and butyrate can be produced from peptides and amino acids fermentation. In
vitro study revealed that propionate was formed form aspartate, alanine, threonine and
methionine and that butyrate was formed from glutamate, lysine, histidine, cysteine,
serine and methionine 97. Common sugar metabolic pathways are shared by periodontal
pathogens such as Fusobacterium and Prevotella, which can be utilized to produce SCFA
98. Fusobacterium was found in the gut to produce butyrate by utilizing lysine 99.
Veillonella species utilize lactate and oxaloacetate producing pyruvate and succinate,
respectively 100. Pyruvate is then converted into acetate and formate, and succinate into
propionate. Porphyromonas gingivalis utilize glutamate to produce butyrate and
propionate 101.The subgingival community is unique in how they can interact with each
other in a synergism and antagonism. This relationship is also evident when amino acids
are present or absent. For example, it was found that coaggregation between F. nucleatum
and P. gingivalis in the presence of galactose was reduced by 58% and by 46% in the
presence of lactose 102.
We thus provide the first evidence that subgingival adipokine and metabolites play
important roles in shaping this ecosystem in obese individuals. The significant
differences in their levels between normalweight and obese individuals were attributable

33
to some SCFA producing bacteria that were present in higher levels in obese, namely
Lactobacillus.

34
Chapter 5: Summary and Conclusions
In summary, by combining a metataxonomic approach with targeted proteomics and
untargeted metabolomics, we report the following:
1. BMI ≥30 is significantly associated with a dysbiotic subgingival microbiome.
2. These dysbiotic shifts correlate strongly with subgingival adipokine levels.
3. These dysbiotic shifts also correlate strongly with increased levels of pro-
inflammatory cytokines in the gingival crevicular fluid.
4. There are critical gender-based differences in the association between BMI and
microbial community assemblages, these differences mimic the epidemiology of
periodontitis in males and females.
5. Short chain fatty acids of bacterial origin were also evident at higher levels in obese
individuals and correlated with levels of bacteria known to produce SCFA.
6. Smoking is associated with a dysbiotic subgingival microbiome, however, the
community assemblages are different in smokers and obese individuals
7. Obese smokers have a microbiome that is substantially different from both
normalweight smokers and obese nonsmokers, indicating that when the two factors
intersect, the whole is greater than the sum of the parts.

35
These studies have important implications for clinical therapeutics and biomarker
discovery. To the best of our knowledge, this is the first study reporting on the divergent
effects of two pro-inflammatory influences on the subgingival microbiome, underscoring
the need for developing a personalized risk assessment strategy that assigns differential
weightage to each risk factor. It also underscores the importance of integrating microbial
community-level metrics into periodontal risk assessments, rather than targeting
individual species

36
Bibliography
1. Healton CG, Vallone D, McCausland KL, Xiao H, Green MP. Smoking, obesity,
and their co-occurrence in the United States: cross sectional analysis. BMJ. 2006 Jul 1;333(7557):25–6.
2. Eknoyan G. A History of Obesity, or How What Was Good Became Ugly and Then Bad. Advances in Chronic Kidney Disease. 2006 Oct;13(4):421–7.
3. Position Paper: Tobacco Use and the Periodontal Patient. Journal of Periodontology. 1999;70(11):1419–27.
4. Saito T, Shimazaki Y, Koga T, Tsuzuki M, Ohshima A. Relationship between Upper Body Obesity and Periodontitis. J Dent Res. 2001 Jul;80(7):1631–6.
5. Al-Zahrani MS, Bissada NF, Borawski EA. Obesity and periodontal disease in young, middle-aged, and older adults. Journal of periodontology. 2003;74(5):610–615.
6. Holt R. News and views. Diabetes, Obesity and Metabolism. 2003;5(5):354–8.
7. Pope CA, Burnett RT, Turner MC, Cohen A, Krewski D, Jerrett M, et al. Lung Cancer and Cardiovascular Disease Mortality Associated with Ambient Air Pollution and Cigarette Smoke: Shape of the Exposure–Response Relationships. Environ Health Perspect. 2011 Nov;119(11):1616–21.
8. Papapanou PN, Sanz M, Buduneli N, Dietrich T, Feres M, Fine DH, et al. Periodontitis: Consensus report of workgroup 2 of the 2017 World Workshop on the Classification of Periodontal and Peri-Implant Diseases and Conditions. J Periodontol. 2018 Jun;89 Suppl 1:S173–82.
9. Albandar JM, Susin C, Hughes FJ. Manifestations of systemic diseases and conditions that affect the periodontal attachment apparatus: Case definitions and diagnostic considerations. J Periodontol. 2018 Jun;89 Suppl 1:S183–203.
10. Lim SS, Vos T, Flaxman AD, Danaei G, Shibuya K, Adair-Rohani H, et al. A comparative risk assessment of burden of disease and injury attributable to 67 risk

37
factors and risk factor clusters in 21 regions, 1990-2010: a systematic analysis for the Global Burden of Disease Study 2010. Lancet. 2012 Dec 15;380(9859):2224–60.
11. WHO | Mean Body Mass Index (BMI) [Internet]. WHO. [cited 2019 Jul 4]. Available from: http://www.who.int/gho/ncd/risk_factors/bmi_text/en/
12. Finkelstein EA, Trogdon JG, Cohen JW, Dietz W. Annual medical spending attributable to obesity: payer-and service-specific estimates. Health Aff (Millwood). 2009 Oct;28(5):w822-831.
13. Ng M, Fleming T, Robinson M, Thomson B, Graetz N, Margono C, et al. Global, regional, and national prevalence of overweight and obesity in children and adults during 1980-2013: a systematic analysis for the Global Burden of Disease Study 2013. Lancet. 2014 Aug 30;384(9945):766–81.
14. Hales CM. Prevalence of Obesity Among Adults and Youth: United States, 2015–2016. 2017;(288):8.
15. McAllister EJ, Dhurandhar NV, Keith SW, Aronne LJ, Barger J, Baskin M, et al. Ten putative contributors to the obesity epidemic. Crit Rev Food Sci Nutr. 2009 Nov;49(10):868–913.
16. Lyons MJ, Faust IM, Hemmes RB, Buskirk DR, Hirsch J, Zabriskie JB. A virally induced obesity syndrome in mice. Science. 1982 Apr 2;216(4541):82–5.
17. Hogan RJ, Mathews SA, Mukhopadhyay S, Summersgill JT, Timms P. Chlamydial persistence: beyond the biphasic paradigm. Infect Immun. 2004 Apr;72(4):1843–55.
18. Ley RE, Bäckhed F, Turnbaugh P, Lozupone CA, Knight RD, Gordon JI. Obesity alters gut microbial ecology. Proceedings of the National Academy of Sciences. 2005;102(31):11070–11075.
19. Backhed F, Ding H, Wang T, Hooper LV, Koh GY, Nagy A, et al. The gut microbiota as an environmental factor that regulates fat storage. Proceedings of the National Academy of Sciences. 2004 Nov 2;101(44):15718–23.
20. Cousin B, Munoz O, André M, Fontanilles AM, Dani C, Cousin JL, et al. A role for preadipocytes as macrophage-like cells. The FASEB Journal. 1999;13(2):305–312.
21. Cottam DR, Schaefer PA, Shaftan GW, Velcu L, Angus LG. Effect of surgically-induced weight loss on leukocyte indicators of chronic inflammation in morbid obesity. Obesity surgery. 2002;12(3):335–342.
22. Fried SK, Bunkin DA, Greenberg AS. Omental and subcutaneous adipose tissues of obese subjects release interleukin-6: depot difference and regulation by
38
glucocorticoid. The Journal of Clinical Endocrinology & Metabolism. 1998;83(3):847–850.
23. Vendrell J, Broch M, Vilarrasa N, Molina A, Gómez JM, Gutiérrez C, et al. Resistin, adiponectin, ghrelin, leptin, and proinflammatory cytokines: relationships in obesity. Obesity research. 2004;12(6):962–971.
24. Perlstein MI, Bissada NF. Influence of obesity and hypertension on the severity of periodontitis in rats. Oral Surgery, Oral Medicine, Oral Pathology. 1977;43(5):707–719.
25. Muñoz‐Torres FJ, Jiménez MC, Rivas‐Tumanyan S, Joshipura KJ. Associations between measures of central adiposity and periodontitis among older adults. Community Dentistry and Oral Epidemiology. 2014;42(2):170–7.
26. Khader YS, Bawadi HA, Haroun TF, Alomari M, Tayyem RF. The association between periodontal disease and obesity among adults in Jordan. Journal of clinical periodontology. 2009;36(1):18–24.
27. Gaio EJ, Haas AN, Rösing CK, Oppermann RV, Albandar JM, Susin C. Effect of obesity on periodontal attachment loss progression: a 5-year population-based prospective study. J Clin Periodontol. 2016 Jul;43(7):557–65.
28. Suvan JE, Petrie A, Nibali L, Darbar U, Rakmanee T, Donos N, et al. Association between overweight/obesity and increased risk of periodontitis. Journal of Clinical Periodontology. 2015;42(8):733–9.
29. Forslund HB, Lindroos AK, Blomkvist K, Hakeberg M, Berggren U, Jontell M, et al. Number of teeth, body mass index, and dental anxiety in middle-aged Swedish women. Acta Odontologica Scandinavica. 2002 Jan;60(6):346–52.
30. Östberg A-L, Nyholm M, Gullberg B, Råstam L, Lindblad U. Tooth loss and obesity in a defined Swedish population. Scand J Public Health. 2009 Jun;37(4):427–33.
31. Saxlin T, Ylöstalo P, Suominen‐Taipale L, Männistö S, Knuuttila M. Association between periodontal infection and obesity: results of the Health 2000 Survey. Journal of Clinical Periodontology. 2011;38(3):236–42.
32. Östberg A-L, Bengtsson C, Lissner L, Hakeberg M. Oral health and obesity indicators. BMC Oral Health. 2012 Nov 20;12:50.
33. Hotamisligil GS, Peraldi P, Budavari A, Ellis R, al et. IRS-1-mediated inhibition of insulin receptor tyrosine kinase activity in TNF-alpha-and obesity-induced insulin resistance. Science; Washington. 1996 Feb 2;271(5249):665.
39
34. Cani PD, Amar J, Iglesias MA, Poggi M, Knauf C, Bastelica D, et al. Metabolic Endotoxemia Initiates Obesity and Insulin Resistance. Diabetes. 2007 Jul 1;56(7):1761–72.
35. Goodson JM, Groppo D, Halem S, Carpino E. Is Obesity an Oral Bacterial Disease? J Dent Res. 2009 Jun;88(6):519–23.
36. Genco RJ, Grossi SG, Ho A, Nishimura F, Murayama Y. A proposed model linking inflammation to obesity, diabetes, and periodontal infections. J Periodontol. 2005 Nov;76(11 Suppl):2075–84.
37. Han D-H, Lim S-Y, Sun B-C, Paek D-M, Kim H-D. Visceral fat area-defined obesity and periodontitis among koreans. Journal of clinical periodontology. 2010;37(2):172–179.
38. Gorman A, Kaye EK, Apovian C, Fung TT, Nunn M, Garcia RI. Overweight and obesity predict time to periodontal disease progression in men. Journal of clinical periodontology. 2012;39(2):107–114.
39. Jimenez M, Hu FB, Marino M, Li Y, Joshipura KJ. Prospective associations between measures of adiposity and periodontal disease. Obesity. 2012;20(8):1718–1725.
40. Suvan J, D’Aiuto F, Moles DR, Petrie A, Donos N. Association between overweight/obesity and periodontitis in adults. A systematic review. Obesity reviews. 2011;12(5):e381–e404.
41. Morita I, Okamoto Y, Yoshii S, Nakagaki H, Mizuno K, Sheiham A, et al. Five-year incidence of periodontal disease is related to body mass index. Journal of dental research. 2011;90(2):199–202.
42. Keller A, Rohde JF, Raymond K, Heitmann BL. Association between periodontal disease and overweight and obesity: a systematic review. Journal of periodontology. 2015;86(6):766–776.
43. Nascimento GG, Leite FR, Do LG, Peres KG, Correa MB, Demarco FF, et al. Is weight gain associated with the incidence of periodontitis? A systematic review and meta-analysis. Journal of clinical periodontology. 2015;42(6):495–505.
44. Chaffee BW, Weston SJ. Association between chronic periodontal disease and obesity: a systematic review and meta-analysis. Journal of periodontology. 2010;81(12):1708–1724.
45. Fantuzzi G. Adipose tissue, adipokines, and inflammation. J Allergy Clin Immunol. 2005 May;115(5):911–9; quiz 920.

40
46. CDC. Current Cigarette Smoking Among Adults in the United States [Internet]. Centers for Disease Control and Prevention. 2019 [cited 2019 Jul 5]. Available from: http://www.cdc.gov/tobacco/data_statistics/fact_sheets/adult_data/cig_smoking/index.htm
47. Control C for D, Prevention. National diabetes statistics report: estimates of diabetes and its burden in the United States, 2014. Atlanta, GA: US Department of Health and Human Services. 2014;2014.
48. Ng M, Freeman MK, Fleming TD, Robinson M, Dwyer-Lindgren L, Thomson B, et al. Smoking prevalence and cigarette consumption in 187 countries, 1980-2012. Jama. 2014;311(2):183–192.
49. Wang TW, Asman K, Gentzke AS, Cullen KA, Holder-Hayes E, Reyes-Guzman C, et al. Tobacco product use among adults—United States, 2017. Morbidity and Mortality Weekly Report. 2018;67(44):1225.
50. Tomar SL, Asma S. Smoking-attributable periodontitis in the United States: findings from NHANES III. Journal of periodontology. 2000;71(5):743–751.
51. Haffajee AD, Socransky SS. Relationship of cigarette smoking to the subgingival microbiota. Journal of clinical periodontology. 2001;28(5):377–388.
52. Page RC, Beck JD. Risk assessment for periodontal diseases. International Dental Journal. 1997;47(2):61–87.
53. Mason MR, Preshaw PM, Nagaraja HN, Dabdoub SM, Rahman A, Kumar PS. The subgingival microbiome of clinically healthy current and never smokers. The ISME journal. 2015;9(1):268.
54. Wood N, Johnson RB. The relationship between smoking history, periodontal screening and recording (PSR) codes and overweight/obesity in a Mississippi dental school population. Oral Health & Preventive Dentistry. 2008 Jan;6(1):67–74.
55. Nishida N, Tanaka M, Hayashi N, Nagata H, Takeshita T, Nakayama K, et al. Determination of smoking and obesity as periodontitis risks using the classification and regression tree method. Journal of periodontology. 2005;76(6):923–928.
56. Kumar PS, Brooker MR, Dowd SE, Camerlengo T. Target Region Selection Is a Critical Determinant of Community Fingerprints Generated by 16S Pyrosequencing. PLoS One [Internet]. 2011 Jun 29 [cited 2019 Jul 4];6(6). Available from: https://www.ncbi.nlm.nih.gov/pmc/articles/PMC3126800/

41
57. Caporaso JG, Kuczynski J, Stombaugh J, Bittinger K, Bushman FD, Costello EK, et al. QIIME allows analysis of high-throughput community sequencing data. Nat Methods. 2010 May;7(5):335–6.
58. Dabdoub SM, Fellows ML, Paropkari AD, Mason MR, Huja SS, Tsigarida AA, et al. PhyloToAST: Bioinformatics tools for species-level analysis and visualization of complex microbial datasets. Sci Rep [Internet]. 2016 Jun 30 [cited 2019 Jul 4];6. Available from: https://www.ncbi.nlm.nih.gov/pmc/articles/PMC4928119/
59. Chen T, Yu W-H, Izard J, Baranova OV, Lakshmanan A, Dewhirst FE. The Human Oral Microbiome Database: a web accessible resource for investigating oral microbe taxonomic and genomic information. Database (Oxford) [Internet]. 2010 Jul 6 [cited 2019 Jul 4];2010. Available from: https://www.ncbi.nlm.nih.gov/pmc/articles/PMC2911848/
60. Navazesh M. Methods for Collecting Saliva. Annals of the New York Academy of Sciences. 1993;694(1):72–7.
61. Molarius A, Seidell JC, Sans S, Tuomilehto J, Kuulasmaa K. Waist and hip circumferences, and waist-hip ratio in 19 populations of the WHO MONICA Project. International Journal Of Obesity And Related Metabolic Disorders: Journal Of The International Association For The Study Of Obesity. 1999 Feb;23(2):116–25.
62. Lindqvist P, Andersson K, Sundh V, Lissner L, Björkelund C, Bengtsson C. Concurrent and separate effects of body mass index and waist-to-hip ratio on 24-year mortality in the Population Study of Women in Gothenburg: Evidence of age-dependency. European Journal of Epidemiology. 2006 Nov 28;21(11):789–94.
63. Maciel SS, Feres M, Gonçalves TED, Zimmermann GS, da Silva HDP, Figueiredo LC, et al. Does obesity influence the subgingival microbiota composition in periodontal health and disease? Journal of Clinical Periodontology. 2016 Dec;43(12):1003–12.
64. Ai D, Huang R, Wen J, Li C, Zhu J, Xia LC. Integrated metagenomic data analysis demonstrates that a loss of diversity in oral microbiota is associated with periodontitis. BMC Genomics [Internet]. 2017 Jan [cited 2019 Jul 4];18(S1). Available from: http://bmcgenomics.biomedcentral.com/articles/10.1186/s12864-016-3254-5
65. Dabdoub SM, Ganesan SM, Kumar PS. Comparative metagenomics reveals taxonomically idiosyncratic yet functionally congruent communities in periodontitis. Scientific Reports [Internet]. 2016 Dec [cited 2019 Jul 4];6(1). Available from: http://www.nature.com/articles/srep38993

42
66. Duzagac E, Cifcibasi E, Erdem MG, Karabey V, Kasali K, Badur S, et al. Is obesity associated with healing after non-surgical periodontal therapy? A local vs. systemic evaluation. J Periodont Res. 2016 Oct;51(5):604–12.
67. Gonçalves TED, Zimmermann GS, Figueiredo LC, Souza M de C, Cruz DF da, Bastos MF, et al. Local and serum levels of adipokines in patients with obesity after periodontal therapy: one-year follow-up. Journal of Clinical Periodontology. 2015;42(5):431–9.
68. Pradeep AR, Karvekar S, Nagpal K, Patnaik K. Vaspin: a new adipokine correlating the levels of crevicular fluid and tear fluid in periodontitis and obesity. Journal of Investigative and Clinical Dentistry. 2016;7(3):232–8.
69. Patel S, Raju P. Gingival crevicular fluid and serum levels of resistin in obese and non-obese subjects with and without periodontitis and association with single nucleotide polymorphism at −420. J Indian Soc Periodontol. 2014;18(5):555.
70. Fadel HT, Pliaki A, Gronowitz E, Mårild S, Ramberg P, Dahlèn G, et al. Clinical and biological indicators of dental caries and periodontal disease in adolescents with or without obesity. Clin Oral Invest. 2014 Mar;18(2):359–68.
71. Pradeep AR, Nagpal K, Karvekar S, Patnaik K. Levels of lipocalin-2 in crevicular fluid and tear fluid in chronic periodontitis and obesity subjects. Journal of Investigative and Clinical Dentistry. 2016;7(4):376–82.
72. Zimmermann GS, Bastos MF, Gonçalves TED, Chambrone L, Duarte PM. Local and Circulating Levels of Adipocytokines in Obese and Normal Weight Individuals With Chronic Periodontitis. Journal of Periodontology. 2013;84(5):624–33.
73. Modéer T, Blomberg C, Wondimu B, Lindberg TY, Marcus C. Association between obesity and periodontal risk indicators in adolescents. International Journal of Pediatric Obesity. 2011 Jun;6(2–2):e264–70.
74. Virto L, Cano P, Jiménez-Ortega V, Fernández-Mateos P, González J, Esquifino AI, et al. Obesity and Periodontitis. An Experimental Study to Evaluate the Periodontal and Systemic Effects of the Co-Morbidity. Journal of Periodontology. 2017 Sep 15;1–15.
75. Thanakun S, Pornprasertsuk‐Damrongsri S, Izumi Y. Increased oral inflammation, leukocytes, and leptin, and lower adiponectin in overweight or obesity. Oral Diseases. 2017;23(7):956–65.
76. Berg AH, Scherer PE. Adipose Tissue, Inflammation, and Cardiovascular Disease. Circulation Research. 2005 May 13;96(9):939–49.

43
77. Yılmaz G, Kırzıoğlu FY, Doğuç DK, Koçak H, Orhan H. Ghrelin levels in chronic periodontitis patients. Odontology. 2014 Jan;102(1):59–67.
78. Suresh S, Mahendra J, Singh G, Pradeep A, Sundaravikram, Sekar H. Comparative Analysis of GCF Resistin Levels in Obese Subjects with and without Periodontal Disease. J Clin Diagn Res. 2016 May;10(5):ZC71–4.
79. Schenkein HA. Complement factor D̄-like activity of Porphyromonas gingivalis W83. Oral Microbiology and Immunology. 1991;6(4):216–20.
80. Needleman I, Garcia R, Gkranias N, Kirkwood KL, Kocher T, Iorio AD, et al. Mean annual attachment, bone level, and tooth loss: A systematic review. Journal of Periodontology. 2018 Jun;89:S120–39.
81. Vecchia CFD, Susin C, Rösing CK, Oppermann RV, Albandar JM. Overweight and Obesity as Risk Indicators for Periodontitis in Adults. Journal of Periodontology. 2005;76(10):1721–8.
82. Silva‐Boghossian CM, Cesário PC, Leão ATT, Colombo APV. Subgingival microbial profile of obese women with periodontal disease. Journal of Periodontology. 2018;89(2):186–94.
83. Takahashi N. Oral Microbiome Metabolism: From “Who Are They?” to “What Are They Doing?” J Dent Res. 2015 Dec;94(12):1628–37.
84. Louis P, Hold GL, Flint HJ. The gut microbiota, bacterial metabolites and colorectal cancer. Nature Reviews Microbiology. 2014 Oct;12(10):661–72.
85. Niederman R, Buyle‐Bodin Y, Lu B-Y, Naleway C, Robinson P, Kent R. The relationship of gingival crevicular fluid short chain carboxylic acid concentration to gingival inflammation. Journal of Clinical Periodontology. 1996;23(8):743–9.
86. Niederman R, Buyle-Bodin Y, Lu B-Y, Robinson P, Naleway C. Short-chain Carboxylic Acid Concentration in Human Gingival Crevicular Fluid. J Dent Res. 1997 Jan;76(1):575–9.
87. Chang P-C, Chien L-Y, Chong LY, Kuo Y-P, Hsiao J-K. Glycated matrix up-regulates inflammatory signaling similarly to Porphyromonas gingivalis lipopolysaccharide. Journal of periodontal research. 2013;48(2):184–193.
88. Tsuda H, Ochiai K, Suzuki N, Otsuka K. Butyrate, a bacterial metabolite, induces apoptosis and autophagic cell death in gingival epithelial cells. Journal of Periodontal Research. 2010;45(5):626–34.
89. Jeng J-H, Chan C-P, Ho Y-S, Lan W-H, Hsieh C-C, Chang M-C. Effects of Butyrate and Propionate on the Adhesion, Growth, Cell Cycle Kinetics, and Protein

44
Synthesis of Cultured Human Gingival Fibroblasts. Journal of Periodontology. 1999;70(12):1435–42.
90. Singer RE, Buckner BA. Butyrate and propionate: important components of toxic dental plaque extracts. Infect Immun. 1981 May;32(2):458–63.
91. Pöllänen MT, Salonen JI. Effect of short chain fatty acids on human gingival epithelial cell keratins in vitro. European Journal of Oral Sciences. 2000;108(6):523–9.
92. Hamer HM, Jonkers D, Venema K, Vanhoutvin S, Troost FJ, Brummer R-J. Review article: the role of butyrate on colonic function. Alimentary Pharmacology & Therapeutics. 2008;27(2):104–19.
93. Berni Canani R, Di Costanzo M, Leone L. The epigenetic effects of butyrate: potential therapeutic implications for clinical practice. Clin Epigenetics. 2012 Feb 27;4(1):4.
94. Hosseini E, Grootaert C, Verstraete W, Van de Wiele T. Propionate as a health-promoting microbial metabolite in the human gut: Nutrition Reviews® Vol. 69(5):245-258. Nutrition Reviews. 2011 May;69(5):245–58.
95. Vinolo MAR, Rodrigues HG, Nachbar RT, Curi R. Regulation of Inflammation by Short Chain Fatty Acids. Nutrients. 2011 Oct 14;3(10):858–76.
96. Macfarlane GT, Gibson G. Microbiological aspects of short chain fatty acid production in the large bowel. In: Cummings JH, Rombeau JL, Sakata T, editors. Physiological and Clinical Aspects of Short Chain Fatty Acid Metabolism [Internet]. Cambridge: Cambridge University Press; 1995 [cited 2019 Jul 4]. p. 87–105. Available from: http://centaur.reading.ac.uk/35495/
97. Smith EA, Macfarlane GT. Dissimilatory Amino Acid Metabolism in Human Colonic Bacteria. Anaerobe. 1997 Oct;3(5):327–37.
98. Takahashl N, Saito K, Schachtele CF, Yamada T. Acid tolerance and acid-neutralizing activity of Porphyromonas gingivalis, Prevotella intermedia and Fusobacterium nucleatum. Oral Microbiology and Immunology. 1997;12(6):323–8.
99. Anand S, Kaur H, Mande SS. Comparative In silico Analysis of Butyrate Production Pathways in Gut Commensals and Pathogens. Front Microbiol [Internet]. 2016 Dec 2 [cited 2019 Jul 4];7. Available from: https://www.ncbi.nlm.nih.gov/pmc/articles/PMC5133246/
100. Ng SKC, Hamilton IR. Lactate Metabolism by Veillonella parvula. Journal of Bacteriology. 1971 Mar 1;105(3):999–1005.

45
101. Takahashi N, Sato T, Yamada T. Metabolic Pathways for Cytotoxic End Product Formation from Glutamate- and Aspartate-Containing Peptides by Porphyromonas gingivalis. J Bacteriol. 2000 Sep;182(17):4704–10.
102. Park J, Shokeen B, Haake SK, Lux R. Characterization of Fusobacterium nucleatum ATCC 23726 adhesins involved in strain-specific attachment to Porphyromonas gingivalis. Int J Oral Sci. 2016 Sep;8(3):138–44.

46
Appendix A: Tables
Table 1 Demographic, biometric and clinical characteristics.
Control BMI <25
Overweight ≥ 𝟐𝟓, <30
Obese ≥ 𝟑𝟎
Total
Fisher's exact test
(n=53) (n= 54) (n= 76) (p-value)
Demographics
Mean age (years) 25.8 31.1 38 / /
Female (n) 37 35 49 121 0.0029*
Nonsmoker (n) 40 38 53 131 0.765
Biometric Characteristics
BMI (Mean) 21.5 26.8 42.1 / /
Clinical characteristics
Mean PI 0.14 0.46 0.37 / 0.9618
Mean GI 0.14 0.49 0.8 / 0.2997
Mean PD (mm) 2.15 2.15 2.35 /
* Significant p value PI=plaque index, GI=gingival index, PD=pocket depth

47
Table 2 Ethnicity of individuals participating in the study.
Ethnicity Total
African American 22
Asian 14 Caucasian 105 Hispanic 6 Middle eastern 35 Total 182
Table 3 Significant difference in adipokines and cytokines levels between BMI groups.
Cytokine Level - Level Difference Std Err Dif P-value Resistin Obese Normalweight 0.0807584 0.0235475 0.0033 Leptin Obese Normalweight 0.8370301 0.2658139 0.0074 TNFa Obese Normalweight 0.009696 0.0033212 0.0139 IL-6 Obese Normalweight 0.0327602 0.0131399 0.0411 IL-10 Obese Normalweight 0.1117162 0.0455926 0.0455 Adipsin Obese Normalweight 0.0387214 0.0158874 0.0469 GLP-1 Normalweight Obese 0.0700006 0.0288383 0.048

48
Table 4 Significant difference in metabolomic concentrations between BMI-smoking groups.
Metabolite Level - Level Difference Std Err Dif p-Value
Formate Overweight smoker
Overweight nonsmoker
0.0016779 0.0005401 0.0283281
Formate Overweight smoker
Normalweight nonsmoker
0.0014413 0.0004928 0.0468407
Lactic acid Obese smoker Obese nonsmoker
0.0284503 0.0087827 0.0192131
Lactic acid Obese smoker Normalweight nonsmoker
0.0249012 0.0083518 0.0401481
Methanol Normalweight nonsmoker
Obese smoker 0.0010662 0.0003240 0.0164726
Phenyl-alanine
Normalweight nonsmoker
Overweight smoker
0.0027836 0.0007786 0.00672778
Phenyl-alanine
Obese nonsmoker
Overweight smoker
0.0029342 0.0008187 0.00654446
Pheny-lalanine
Overweight nonsmoker
Overweight smoker
0.0025502 0.0008534 0.03941315
Table 5 Subgingival bacteria and metabolomes network in normalweight nonsmoker individuals.
Metabolite Taxonomy Correlation P-value
Lysine Campylobacter gracilis -0.654282536 8.78415E-05 Glycose Bergeyella sp. oral taxon 900 -0.640338561 0.000138281 Leucine Streptococcus australis 0.615681724 0.00029277 Lysine Streptococcus mitis 0.628921023 0.000197268 Glutamine Leptotrichia wadei 0.680685557 3.48284E-05

49
Table 6 Subgingival bacteria and metabolomes network in normalweight smoker individuals.
Metabolite Taxonomy Correlation P-value Acetic acid Aggregatibacter sp. oral taxon 898 -0.668588526 0.012476478 Acetic acid Parvimonas sp. oral taxon 110 -0.651528814 0.01584155 Acetic acid Lactococcus lactis -0.628970902 0.021283066 Acetic acid Actinomyces naeslundii -0.616065063 0.024960997 Acetic acid Prevotella sp. oral taxon 306 0.621717036 0.023296787 Acetic acid Shuttleworthia satelles 0.628970902 0.021283066 Acetic acid Actinomyces israelii 0.631868132 0.020516043 Acetic acid Oribacterium sinus 0.635867064 0.019491365 Acetic acid Prevotella salivae 0.679731668 0.010590347 Acetic acid Eggerthia catenaformis 0.731494203 0.004487683 Acetic acid Streptococcus salivarius 0.731775108 0.004464581 Acetic acid Johnsonella sp. oral taxon 166 0.751764017 0.003041751 Acetic acid Erysipelotrichaceae [G-1] sp. oral
taxon 904 0.801881618 0.00097669
Acetoin Prevotella sp. oral taxon 942 0.609349723 0.027050591 Acetoin Streptococcus mutans 0.609724736 0.026930616 Acetoin Lactobacillus gasseri 0.628970902 0.021283066 Acetoin Neisseria bacilliformis 0.635368813 0.019616911 Acetoin Prevotella sp. oral taxon 820 0.638999414 0.018715757 Acetoin Streptococcus tigurinus 0.67032967 0.01216622 Alanine Capnocytophaga sp. oral taxon 902 0.631868132 0.020516043 Alanine Lachnoanaerobaculum orale 0.646302241 0.016997058 Aspartate TM7 [G-3] sp. oral taxon 351 -0.704832551 0.007136094 Aspartate Streptococcus sp. oral taxon 066 -0.650220741 0.016125043 Aspartate Streptococcus oligofermentans -0.620879121 0.023538167 Aspartate TM7 [G-1] sp. oral taxon 347 0.615658601 0.025083971 Aspartate Fusobacterium nucleatum subsp.
vincentii 0.692307692 0.008730318
Butyrate SR1 [G-1] sp. oral taxon 345 -0.679719965 0.010592207 Butyrate Leptotrichia sp. oral taxon 879 -0.620235195 0.023724919 Butyrate Streptococcus gordonii 0.60989011 0.026877834 Butyrate Prevotella histicola 0.615384615 0.025167117 Butyrate Veillonella atypica 0.620879121 0.023538167 Butyrate Neisseria flavescens 0.632737875 0.020289849 Butyrate Fretibacterium sp. oral taxon 361 0.770558117 0.002051945 Butyrate Veillonella dispar 0.774725275 0.001871362

50
Butyrate Veillonella parvula 0.807692308 0.00083916 Butyrate Streptococcus tigurinus 0.818681319 0.000620988 Ethanol Veillonella rogosae -0.880330957 7.15568E-05 Ethanol Johnsonella ignava -0.852820614 0.000211317 Ethanol Actinomyces johnsonii -0.796703297 0.001113653 Ethanol Capnocytophaga gingivalis -0.741758242 0.003701314 Ethanol Streptococcus sp. oral taxon 056 -0.74040847 0.003798131 Ethanol Corynebacterium durum -0.703296703 0.00731857 Ethanol Propionibacterium sp. oral taxon
194 -0.695381715 0.008316154
Ethanol Neisseria flava -0.692886237 0.008651196 Ethanol Prevotella sp. oral taxon 475 -0.66693282 0.012777015 Ethanol Leptotrichia sp. oral taxon 212 -0.642857143 0.017792451 Ethanol Aggregatibacter paraphrophilus -0.626801743 0.021871129 Ethanol Fusobacterium nucleatum subsp.
polymorphum -0.626373626 0.021988602
Ethanol Streptococcus sp. oral taxon 064 -0.626373626 0.021988602 Ethanol Capnocytophaga sputigena -0.615384615 0.025167117 Ethanol Prevotella loescheii -0.613480635 0.025750543 Ethanol Propionibacterium acnes -0.610808263 0.026586175 Ethanol Neisseria sp. oral taxon 018 -0.609349723 0.027050591 Ethanol Porphyromonas sp. oral taxon 284 -0.607744082 0.027568723 Ethanol Cardiobacterium hominis -0.604395604 0.028672706 Ethanol Eikenella corrodens -0.604395604 0.028672706 Ethanol Lachnospiraceae [G-8] sp. oral
taxon 500 0.602219136 0.029407481
Ethanol Leptotrichia hofstadii 0.613269028 0.025815995 Ethanol Prevotella sp. oral taxon 526 0.621283499 0.023421447 Ethanol Mogibacterium timidum 0.627235807 0.0217525 Ethanol Fretibacterium sp. oral taxon 360 0.631868132 0.020516043 Ethanol Fretibacterium fastidiosum 0.637362637 0.019118114 Ethanol Olsenella sp. oral taxon 807 0.640893759 0.018258008 Ethanol Dialister invisus 0.664835165 0.013165576 Ethanol Prevotella oralis 0.738233164 0.003958271 Ethanolamine Ottowia sp. oral taxon 894 -0.824295696 0.000528367 Ethanolamine Selenomonas sp. oral taxon 892 -0.771759939 0.001998527 Ethanolamine Stenotrophomonas maltophilia -0.609349723 0.027050591 Ethanolamine Capnocytophaga sp. oral taxon 380 0.605634176 0.028260636 Ethanolamine Lactococcus lactis 0.628970902 0.021283066 Ethanolamine Fusobacterium sp. oral taxon 203 0.703296703 0.00731857

51
Ethyl Propionate and proline
Prevotella sp. oral taxon 317 -0.846153846 0.000266012
Ethyl Propionate and proline
Prevotella sp. oral taxon 315 -0.810663587 0.000774999
Ethyl Propionate and proline
Prevotella maculosa -0.708791209 0.006681784
Ethyl Propionate and proline
Oribacterium sp. oral taxon 078 -0.686813187 0.009509496
Ethyl Propionate and proline
Peptococcus sp. oral taxon 168 -0.674003389 0.01153074
Ethyl Propionate and proline
Selenomonas sp. oral taxon 134 -0.664835165 0.013165576
Ethyl Propionate and proline
Peptostreptococcaceae [XI][G-1] [Eubacterium] infirmum
-0.638672955 0.018795499
Ethyl Propionate and proline
Mitsuokella sp. oral taxon 521 -0.620205314 0.023733611
Ethyl Propionate and proline
Capnocytophaga sp. oral taxon 336 -0.618793975 0.024146872
Ethyl Propionate and proline
Actinomyces sp. oral taxon 897 -0.61623167 0.02491072
Ethyl Propionate and proline
Peptostreptococcaceae [XI][G-9] [Eubacterium] brachy
0.653846154 0.015348517
Formate GN02 [G-1] sp. oral taxon 872 -0.637540819 0.019074003 Formate Prevotella loescheii -0.627235807 0.0217525 Formate Treponema sp. oral taxon 517 0.61041309 0.026711418 Formate Dialister micraerophilus 0.620235195 0.023724919 Formate Prevotella sp. oral taxon 396 0.628970902 0.021283066 Formate Prevotella multiformis 0.639127822 0.018684461 Formate Bacteroidetes [G-3] sp. oral taxon
365 0.645100979 0.017271317
Formate Lachnoanaerobaculum sp. oral taxon 089
0.654661164 0.015177884
Formate Peptostreptococcaceae [XI][G-3] sp. oral taxon 495
0.657673687 0.014559509
Formate Prevotella dentalis 0.683888739 0.009945171 Formate Solobacterium moorei 0.708791209 0.006681784 Formate Treponema sp. oral taxon 246 0.734698337 0.004229568 Fucose Neisseria oralis 0.607301244 0.0277129 Fucose Porphyromonas pasteri 0.607978567 0.027492604 Fucose Eikenella sp. oral taxon 011 0.61306527 0.025879135 Fucose Bergeyella sp. oral taxon 907 0.616065063 0.024960997 Fucose SR1 [G-1] sp. oral taxon 875 0.620205314 0.023733611

52
Fucose GN02 [G-1] sp. oral taxon 871 0.620235195 0.023724919 Fucose Leptotrichia sp. oral taxon 217 0.627181508 0.021767314 Fucose Peptostreptococcaceae [XI][G-7]
[Eubacterium] yurii subsps. yurii & margaretiae
0.637362637 0.019118114
Fucose Neisseria flava 0.645100979 0.017271317 Fucose Porphyromonas sp. oral taxon 284 0.646418706 0.016970643 Fucose Leptotrichia sp. oral taxon 225 0.651943652 0.015752429 Fucose Cardiobacterium valvarum 0.653846154 0.015348517 Fucose Leptotrichia sp. oral taxon 212 0.659340659 0.014225579 Fucose Leptotrichia sp. oral taxon 392 0.662999252 0.013512902 Fucose Leptotrichia sp. oral taxon 219 0.667190565 0.012729875 Fucose Fusobacterium periodonticum 0.675824176 0.011225246 Fucose Lachnoanaerobaculum orale 0.679731668 0.010590347 Fucose Prevotella sp. oral taxon 472 0.701668168 0.00751593 Fucose TM7 [G-1] sp. oral taxon 346 0.71978022 0.005536116 Fucose Propionibacterium propionicum 0.741758242 0.003701314 Fucose Streptococcus dentisani 0.741758242 0.003701314 Galctose Prevotella sp. oral taxon 306 0.61041309 0.026711418 Galctose Neisseria flava 0.615235193 0.025212547 Galctose Bacteroides zoogleoformans 0.620235195 0.023724919 Galctose Prevotella veroralis 0.626373626 0.021988602 Galctose Cardiobacterium valvarum 0.631868132 0.020516043 Galctose Streptococcus salivarius 0.638239944 0.018901659 Galctose Scardovia wiggsiae 0.645264114 0.017233879 Galctose Streptococcus infantis 0.663020451 0.013508852 Galctose Selenomonas sputigena 0.664628859 0.013204266 Galctose Leptotrichia sp. oral taxon 223 0.693525766 0.008564371 Galctose Atopobium parvulum 0.745540199 0.003440183 Glucose Peptococcus sp. oral taxon 168 -0.701513731 0.007534855 Glucose Streptococcus sp. oral taxon 431 -0.638621643 0.018808056 Glucose Prevotella sp. oral taxon 315 -0.635159099 0.019669933 Glucose Peptostreptococcaceae [XI][G-9]
[Eubacterium] brachy 0.620879121 0.023538167
Glutamine Actinomyces radicidentis -0.736263736 0.004107709 Glutamine Johnsonella sp. oral taxon 166 -0.685984665 0.009631424 Glutamine Selenomonas sp. oral taxon 442 -0.67032967 0.01216622 Glutamine Lachnoanaerobaculum sp. oral
taxon 083 -0.644401025 0.01743264
Glutamine Treponema pectinovorum -0.642789647 0.017808307
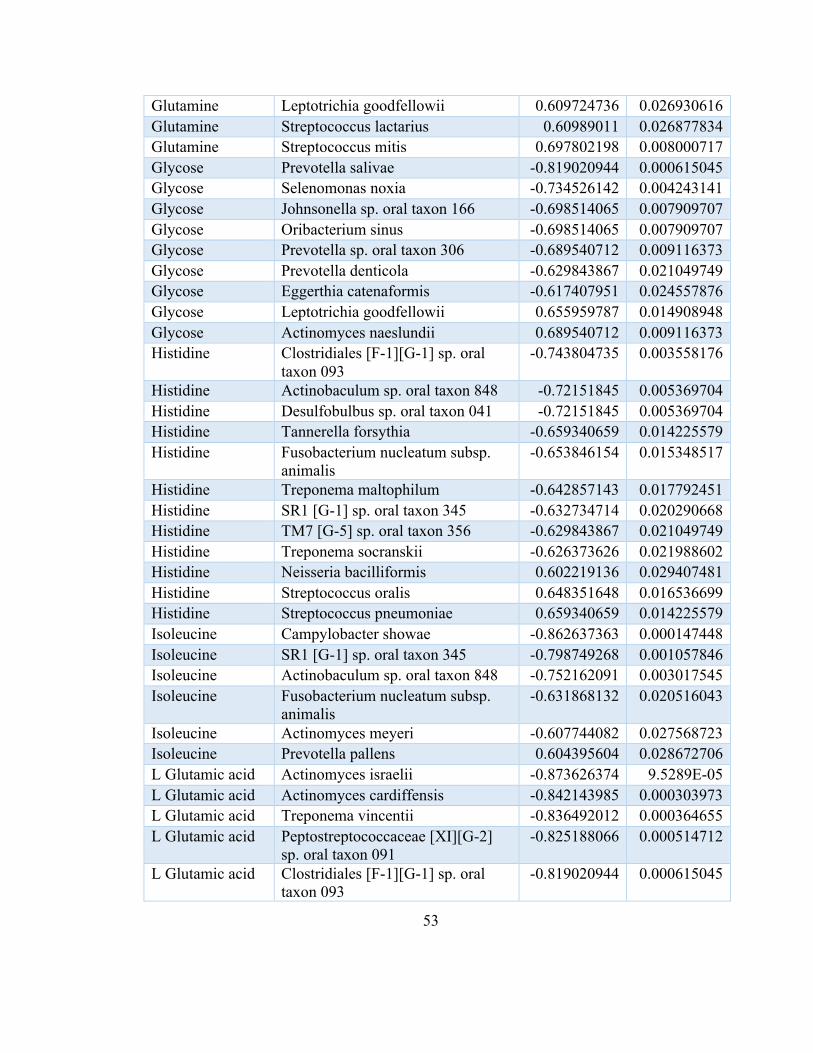
53
Glutamine Leptotrichia goodfellowii 0.609724736 0.026930616 Glutamine Streptococcus lactarius 0.60989011 0.026877834 Glutamine Streptococcus mitis 0.697802198 0.008000717 Glycose Prevotella salivae -0.819020944 0.000615045 Glycose Selenomonas noxia -0.734526142 0.004243141 Glycose Johnsonella sp. oral taxon 166 -0.698514065 0.007909707 Glycose Oribacterium sinus -0.698514065 0.007909707 Glycose Prevotella sp. oral taxon 306 -0.689540712 0.009116373 Glycose Prevotella denticola -0.629843867 0.021049749 Glycose Eggerthia catenaformis -0.617407951 0.024557876 Glycose Leptotrichia goodfellowii 0.655959787 0.014908948 Glycose Actinomyces naeslundii 0.689540712 0.009116373 Histidine Clostridiales [F-1][G-1] sp. oral
taxon 093 -0.743804735 0.003558176
Histidine Actinobaculum sp. oral taxon 848 -0.72151845 0.005369704 Histidine Desulfobulbus sp. oral taxon 041 -0.72151845 0.005369704 Histidine Tannerella forsythia -0.659340659 0.014225579 Histidine Fusobacterium nucleatum subsp.
animalis -0.653846154 0.015348517
Histidine Treponema maltophilum -0.642857143 0.017792451 Histidine SR1 [G-1] sp. oral taxon 345 -0.632734714 0.020290668 Histidine TM7 [G-5] sp. oral taxon 356 -0.629843867 0.021049749 Histidine Treponema socranskii -0.626373626 0.021988602 Histidine Neisseria bacilliformis 0.602219136 0.029407481 Histidine Streptococcus oralis 0.648351648 0.016536699 Histidine Streptococcus pneumoniae 0.659340659 0.014225579 Isoleucine Campylobacter showae -0.862637363 0.000147448 Isoleucine SR1 [G-1] sp. oral taxon 345 -0.798749268 0.001057846 Isoleucine Actinobaculum sp. oral taxon 848 -0.752162091 0.003017545 Isoleucine Fusobacterium nucleatum subsp.
animalis -0.631868132 0.020516043
Isoleucine Actinomyces meyeri -0.607744082 0.027568723 Isoleucine Prevotella pallens 0.604395604 0.028672706 L Glutamic acid Actinomyces israelii -0.873626374 9.5289E-05 L Glutamic acid Actinomyces cardiffensis -0.842143985 0.000303973 L Glutamic acid Treponema vincentii -0.836492012 0.000364655 L Glutamic acid Peptostreptococcaceae [XI][G-2]
sp. oral taxon 091 -0.825188066 0.000514712
L Glutamic acid Clostridiales [F-1][G-1] sp. oral taxon 093
-0.819020944 0.000615045

54
L Glutamic acid Peptostreptococcaceae [XI][G-6] [Eubacterium] nodatum
-0.802580173 0.000959279
L Glutamic acid Filifactor alocis -0.802197802 0.000968779 L Glutamic acid Desulfobulbus sp. oral taxon 041 -0.785591518 0.001458406 L Glutamic acid Veillonellaceae [G-1] sp. oral taxon
150 -0.779017414 0.001698588
L Glutamic acid Anaeroglobus geminatus -0.77854269 0.001717059 L Glutamic acid TM7 [G-5] sp. oral taxon 356 -0.767967522 0.002170877 L Glutamic acid Prevotella micans -0.753783382 0.002920496 L Glutamic acid Mogibacterium timidum -0.737277176 0.004030276 L Glutamic acid Fretibacterium sp. oral taxon 360 -0.730769231 0.004547734 L Glutamic acid Treponema sp. oral taxon 257 -0.718732665 0.0056383 L Glutamic acid Treponema denticola -0.718019936 0.005708648 L Glutamic acid Actinomyces radicidentis -0.708791209 0.006681784 L Glutamic acid Fretibacterium fastidiosum -0.708791209 0.006681784 L Glutamic acid Peptostreptococcaceae [XI][G-7]
sp. oral taxon 081 -0.699305148 0.007809499
L Glutamic acid Actinomyces meyeri -0.690618275 0.008964517 L Glutamic acid Treponema socranskii -0.67032967 0.01216622 L Glutamic acid Peptostreptococcaceae [XI][G-4]
sp. oral taxon 369 -0.665750286 0.012994983
L Glutamic acid Treponema maltophilum -0.664835165 0.013165576 L Glutamic acid Prevotella buccae -0.662993544 0.013513992 L Glutamic acid Alloprevotella tannerae -0.659340659 0.014225579 L Glutamic acid Mycoplasma faucium -0.651074136 0.015939663 L Glutamic acid Selenomonas sp. oral taxon 134 -0.648351648 0.016536699 L Glutamic acid Veillonellaceae [G-1] sp. oral taxon
148 -0.647290715 0.016773835
L Glutamic acid Prevotella denticola -0.646418706 0.016970643 L Glutamic acid Treponema sp. oral taxon 270 -0.645264114 0.017233879 L Glutamic acid Actinomyces sp. oral taxon 414 -0.640893759 0.018258008 L Glutamic acid Bacteroidetes [G-3] sp. oral taxon
280 -0.638672955 0.018795499
L Glutamic acid Atopobium rimae -0.638239944 0.018901659 L Glutamic acid Actinomyces sp. oral taxon 172 -0.635358553 0.019619502 L Glutamic acid Treponema sp. oral taxon 517 -0.633020982 0.020216623 L Glutamic acid Fretibacterium sp. oral taxon 362 -0.631868132 0.020516043 L Glutamic acid Dialister micraerophilus -0.628970902 0.021283066 L Glutamic acid Treponema medium -0.627235807 0.0217525 L Glutamic acid Treponema sp. oral taxon 247 -0.627181508 0.021767314

55
L Glutamic acid Peptostreptococcaceae [XI][G-4] sp. oral taxon 103
-0.626801743 0.021871129
L Glutamic acid Prevotella sp. oral taxon 300 -0.626373626 0.021988602 L Glutamic acid Prevotella sp. oral taxon 396 -0.620235195 0.023724919 L Glutamic acid TM7 [G-1] sp. oral taxon 349 -0.618982704 0.024091304 L Glutamic acid Prevotella salivae -0.615658601 0.025083971 L Glutamic acid Fusobacterium nucleatum subsp.
animalis -0.604395604 0.028672706
L Glutamic acid Treponema sp. oral taxon 237 -0.602476498 0.029319883 L Glutamic acid Streptococcus sanguinis 0.626373626 0.021988602 L Glutamic acid Actinomyces massiliensis 0.631868132 0.020516043 L Glutamic acid Streptococcus mitis 0.631868132 0.020516043 L Glutamic acid Streptococcus oralis 0.637362637 0.019118114 L Glutamic acid Streptococcus lactarius 0.659340659 0.014225579 L Glutamic acid Lautropia mirabilis 0.71978022 0.005536116 L Glutamic acid Aggregatibacter sp. oral taxon 898 0.729875807 0.004622587 L Glutamic acid Haemophilus sp. oral taxon 036 0.812025675 0.000746912 L Glutamic acid Actinomyces naeslundii 0.842143985 0.000303973 Lactic acid Actinomyces johnsonii -0.879120879 7.54456E-05 Lactic acid Veillonella rogosae -0.855571648 0.000191546 Lactic acid Capnocytophaga leadbetteri -0.774725275 0.001871362 Lactic acid Corynebacterium durum -0.752747253 0.002982233 Lactic acid Capnocytophaga gingivalis -0.747252747 0.003326741 Lactic acid Streptococcus sp. oral taxon 056 -0.734756497 0.004224991 Lactic acid Neisseria elongata -0.731775108 0.004464581 Lactic acid Cardiobacterium hominis -0.692307692 0.008730318 Lactic acid Neisseria meningitidis -0.677806555 0.010899646 Lactic acid Johnsonella ignava -0.674003389 0.01153074 Lactic acid Rothia aeria -0.64073067 0.018297085 Lactic acid Leptotrichia sp. oral taxon 212 -0.637362637 0.019118114 Lactic acid Streptococcus sp. oral taxon 423 -0.631868132 0.020516043 Lactic acid Aggregatibacter paraphrophilus -0.626801743 0.021871129 Lactic acid Alloprevotella sp. oral taxon 914 -0.624318921 0.022558931 Lactic acid Leptotrichia sp. oral taxon 392 -0.61623167 0.02491072 Lactic acid SR1 [G-1] sp. oral taxon 874 -0.615658601 0.025083971 Lactic acid Streptococcus sp. oral taxon 064 -0.615384615 0.025167117 Lactic acid Bergeyella sp. oral taxon 322 -0.60989011 0.026877834 Lactic acid Fusobacterium nucleatum subsp.
polymorphum -0.60989011 0.026877834
Lactic acid Prevotella pleuritidis 0.604395604 0.028672706

56
Lactic acid Dialister invisus 0.615384615 0.025167117 Lactic acid Fretibacterium fastidiosum 0.642857143 0.017792451 Leucine Prevotella intermedia -0.674003389 0.01153074 Leucine Capnocytophaga granulosa 0.615384615 0.025167117 Leucine Neisseria lactamica 0.623337664 0.022835136 Leucine Porphyromonas pasteri 0.635488909 0.019586595 Leucine Neisseria oralis 0.651873812 0.015767406 Leucine Kingella sp. oral taxon 012 0.683888739 0.009945171 Leucine Peptostreptococcaceae [XI][G-7]
[Eubacterium] yurii subsps. yurii & margaretiae
0.785714286 0.00145419
Lysine Megasphaera sp. oral taxon 123 -0.672584793 0.011773079 Lysine Fusobacterium nucleatum subsp.
vincentii -0.637362637 0.019118114
Lysine Streptococcus sp. oral taxon 431 0.601055664 0.02980589 Lysine Neisseria flava 0.615235193 0.025212547 Lysine Alloprevotella sp. oral taxon 308 0.618793975 0.024146872 Lysine Prevotella salivae 0.626801743 0.021871129 Lysine Prevotella histicola 0.637362637 0.019118114 Lysine Treponema sp. oral taxon 269 0.642131764 0.017963407 Lysine Actinomyces johnsonii 0.642857143 0.017792451 Lysine Leptotrichia sp. oral taxon 225 0.657468598 0.014600997 Lysine Selenomonas noxia 0.665750286 0.012994983 Lysine Prevotella melaninogenica 0.67032967 0.01216622 Lysine Streptococcus sp. oral taxon 056 0.678236766 0.01082994 Lysine Johnsonella ignava 0.682256491 0.010194832 Lysine Bergeyella sp. oral taxon 907 0.712148605 0.006314124 Lysine Prevotella sp. oral taxon 306 0.712148605 0.006314124 Lysine Veillonella rogosae 0.748281313 0.003260015 Methanol Prevotella sp. oral taxon 315 -0.752162091 0.003017545 Methanol Peptococcus sp. oral taxon 168 -0.751032347 0.003086636 Methanol Streptococcus constellatus -0.692307692 0.008730318 Methanol Streptococcus sp. oral taxon 431 -0.641511334 0.0181106 Methanol Prevotella sp. oral taxon 317 -0.631868132 0.020516043 Methanol Campylobacter gracilis -0.604395604 0.028672706 Methanol Propionibacterium propionicum 0.620879121 0.023538167 Methanol Fusobacterium periodonticum 0.714285714 0.006088305 Phenylalanine Fusobacterium nucleatum subsp.
animalis -0.714285714 0.006088305
Phenylalanine Tannerella forsythia -0.703296703 0.00731857

57
Phenylalanine Desulfobulbus sp. oral taxon 041 -0.702017952 0.007473202 Phenylalanine Campylobacter showae -0.697802198 0.008000717 Phenylalanine SR1 [G-1] sp. oral taxon 345 -0.685984665 0.009631424 Phenylalanine Filifactor alocis -0.675824176 0.011225246 Phenylalanine Treponema socranskii -0.626373626 0.021988602 Phenylalanine Tannerella sp. oral taxon 916 -0.618793975 0.024146872 Phenylalanine Capnocytophaga sputigena 0.60989011 0.026877834 Phenylalanine Catonella morbi 0.60989011 0.026877834 Phenylalanine Capnocytophaga sp. oral taxon 324 0.624318921 0.022558931 Phenylalanine Porphyromonas pasteri 0.624484772 0.022512492 Phenylalanine Gemella sanguinis 0.626373626 0.021988602 Phenylalanine Prevotella scopos 0.626373626 0.021988602 Phenylalanine TM7 [G-1] sp. oral taxon 952 0.626373626 0.021988602 Phenylalanine TM7 [G-4] sp. oral taxon 355 0.62706288 0.021799703 Phenylalanine Streptococcus gordonii 0.631868132 0.020516043 Phenylalanine Enterococcus italicus 0.633020982 0.020216623 Phenylalanine Veillonella sp. oral taxon 780 0.633020982 0.020216623 Phenylalanine Capnocytophaga sp. oral taxon 380 0.650220741 0.016125043 Phenylalanine Fusobacterium sp. oral taxon 203 0.653846154 0.015348517 Phenylalanine Neisseria oralis 0.682517453 0.010154601 Phenylalanine Granulicatella elegans 0.696011663 0.008233163 Phenylalanine Streptococcus pneumoniae 0.708791209 0.006681784 Phenylalanine Kingella sp. oral taxon 012 0.774320308 0.001888345 Proline Actinomyces radicidentis -0.785714286 0.00145419 Proline Treponema vincentii -0.746060443 0.003405409 Proline Actinomyces sp. oral taxon 172 -0.717100589 0.005800382 Proline Actinomyces cardiffensis -0.712148605 0.006314124 Proline Peptostreptococcaceae [XI][G-2]
sp. oral taxon 091 -0.700844659 0.007617265
Proline Actinomyces israelii -0.697802198 0.008000717 Proline Prevotella sp. oral taxon 301 -0.691228467 0.008879383 Proline TM7 [G-5] sp. oral taxon 356 -0.679568383 0.01061632 Proline Actinomyces sp. oral taxon 897 -0.66850132 0.012492173 Proline Johnsonella sp. oral taxon 166 -0.667190565 0.012729875 Proline Treponema sp. oral taxon 257 -0.651873812 0.015767406 Proline Prevotella salivae -0.632373314 0.020384433 Proline Selenomonas sp. oral taxon 442 -0.631868132 0.020516043 Proline Prevotella micans -0.624484772 0.022512492 Proline Treponema sp. oral taxon 230 -0.623337664 0.022835136

58
Proline Peptostreptococcaceae [XI][G-7] sp. oral taxon 081
-0.621283499 0.023421447
Proline Treponema denticola -0.618982704 0.024091304 Proline Clostridiales [F-1][G-1] sp. oral
taxon 093 -0.618444386 0.024250054
Proline Capnocytophaga granulosa -0.615384615 0.025167117 Proline Peptostreptococcaceae [XI][G-4]
sp. oral taxon 369 -0.610729601 0.026611071
Proline Veillonellaceae [G-1] sp. oral taxon 150
-0.607744082 0.027568723
Proline Alloprevotella tannerae -0.604395604 0.028672706 Proline Streptococcus lactarius 0.615384615 0.025167117 Proline Neisseria meningitidis 0.624118907 0.022615029 Proline Haemophilus parainfluenzae 0.642857143 0.017792451 Proline Lautropia mirabilis 0.659340659 0.014225579 Proline Haemophilus sp. oral taxon 908 0.660248217 0.014046214 Proline Actinomyces naeslundii 0.757364389 0.002714729 Proline Streptococcus mitis 0.758241758 0.002666079 Propionate Aggregatibacter sp. oral taxon 898 -0.791163089 0.001276439 Propionate Actinomyces naeslundii -0.746060443 0.003405409 Propionate Streptococcus oralis -0.664835165 0.013165576 Propionate Actinobaculum sp. oral taxon 183 -0.657468598 0.014600997 Propionate Lautropia mirabilis -0.642857143 0.017792451 Propionate Veillonella denticariosi -0.632737875 0.020289849 Propionate Haemophilus sp. oral taxon 036 -0.617407951 0.024557876 Propionate Neisseria bacilliformis -0.602219136 0.029407481 Propionate Filifactor alocis 0.631868132 0.020516043 Propionate Tannerella forsythia 0.631868132 0.020516043 Propionate Streptococcus salivarius 0.635488909 0.019586595 Propionate Treponema socranskii 0.637362637 0.019118114 Propionate Clostridiales [F-1][G-1] sp. oral
taxon 093 0.637944885 0.018974253
Propionate Johnsonella sp. oral taxon 166 0.651528814 0.01584155 Propionate Prevotella salivae 0.674160097 0.011504203 Propionate Desulfobulbus sp. oral taxon 041 0.710375308 0.006506327 Propionate Peptostreptococcaceae [XI][G-6]
[Eubacterium] nodatum 0.717800578 0.005730434
Propionate Erysipelotrichaceae [G-1] sp. oral taxon 904
0.739234616 0.003883912
Propionate Eggerthia catenaformis 0.771759939 0.001998527

59
Propionate Actinomyces israelii 0.78021978 0.001652501 Propylene glycerol
Prevotella loescheii -0.896837162 3.2688E-05
Propylene glycerol
Corynebacterium durum -0.879120879 7.54456E-05
Propylene glycerol
Actinomyces johnsonii -0.840659341 0.000319071
Propylene glycerol
Cardiobacterium hominis -0.82967033 0.000450286
Propylene glycerol
Porphyromonas sp. oral taxon 284 -0.82874193 0.000463075
Propylene glycerol
Capnocytophaga gingivalis -0.807692308 0.00083916
Propylene glycerol
Fusobacterium nucleatum subsp. polymorphum
-0.802197802 0.000968779
Propylene glycerol
Neisseria flava -0.800403067 0.001014364
Propylene glycerol
Veillonella rogosae -0.797799929 0.00108346
Propylene glycerol
Leptotrichia sp. oral taxon 212 -0.78021978 0.001652501
Propylene glycerol
Streptococcus sp. oral taxon 056 -0.768668335 0.002138186
Propylene glycerol
Streptococcus sp. oral taxon 064 -0.741758242 0.003701314
Propylene glycerol
Prevotella sp. oral taxon 472 -0.740342791 0.003802892
Propylene glycerol
Johnsonella ignava -0.737277176 0.004030276
Propylene glycerol
Capnocytophaga sputigena -0.736263736 0.004107709
Propylene glycerol
Propionibacterium acnes -0.707911116 0.006780817
Propylene glycerol
Propionibacterium propionicum -0.697802198 0.008000717
Propylene glycerol
Bergeyella sp. oral taxon 322 -0.675824176 0.011225246
Propylene glycerol
Selenomonas sp. oral taxon 937 -0.674043437 0.011523954
Propylene glycerol
Leptotrichia sp. oral taxon 392 -0.674003389 0.01153074
Propylene glycerol
Propionibacterium sp. oral taxon 194
-0.670322915 0.012167413

60
Propylene glycerol
SR1 [G-1] sp. oral taxon 875 -0.664058215 0.013311731
Propylene glycerol
SR1 [G-1] sp. oral taxon 874 -0.663016955 0.01350952
Propylene glycerol
Streptococcus sanguinis -0.659340659 0.014225579
Propylene glycerol
Alloprevotella sp. oral taxon 308 -0.657468598 0.014600997
Propylene glycerol
Actinomyces gerencseriae -0.653846154 0.015348517
Propylene glycerol
Gemella sanguinis -0.648351648 0.016536699
Propylene glycerol
Leptotrichia sp. oral taxon 219 -0.642131764 0.017963407
Propylene glycerol
Porphyromonas catoniae -0.640893759 0.018258008
Propylene glycerol
Fusobacterium periodonticum -0.637362637 0.019118114
Propylene glycerol
Aggregatibacter paraphrophilus -0.629587528 0.021118062
Propylene glycerol
Gemella morbillorum -0.620879121 0.023538167
Propylene glycerol
Lautropia mirabilis -0.60989011 0.026877834
Propylene glycerol
Neisseria sp. oral taxon 018 -0.609349723 0.027050591
Propylene glycerol
Prevotella nanceiensis -0.607744082 0.027568723
Propylene glycerol
Peptostreptococcaceae [XI][G-6] [Eubacterium] nodatum
0.61041309 0.026711418
Propylene glycerol
Peptostreptococcaceae [XI][G-4] sp. oral taxon 103
0.612872815 0.025938878
Propylene glycerol
Filifactor alocis 0.615384615 0.025167117
Propylene glycerol
Treponema sp. oral taxon 237 0.61623167 0.02491072
Propylene glycerol
Prevotella sp. oral taxon 396 0.620235195 0.023724919
Propylene glycerol
Fretibacterium sp. oral taxon 360 0.626373626 0.021988602
Propylene glycerol
Dialister micraerophilus 0.628970902 0.021283066

61
Propylene glycerol
Treponema sp. oral taxon 247 0.663020451 0.013508852
Propylene glycerol
Lachnospiraceae [G-8] sp. oral taxon 500
0.66851849 0.012489082
Propylene glycerol
Atopobium rimae 0.682256491 0.010194832
Propylene glycerol
Prevotella dentalis 0.700844659 0.007617265
Propylene glycerol
Olsenella sp. oral taxon 807 0.701668168 0.00751593
Propylene glycerol
Fretibacterium fastidiosum 0.703296703 0.00731857
Propylene glycerol
Megasphaera sp. oral taxon 123 0.712148605 0.006314124
Propylene glycerol
Treponema sp. oral taxon 517 0.717800578 0.005730434
Propylene glycerol
Dialister invisus 0.71978022 0.005536116
Succinic acid Campylobacter showae -0.620879121 0.023538167 Succinic acid SR1 [G-1] sp. oral taxon 345 -0.617072964 0.024657982 Succinic acid Neisseria bacilliformis 0.696143221 0.008215911 Sugars polyols TM7 [G-3] sp. oral taxon 351 -0.603288879 0.02904463 Sugars polyols Selenomonas sp. oral taxon 146 0.620235195 0.023724919 Sugars polyols Bulleidia extructa 0.621717036 0.023296787 Sugars polyols Fusobacterium nucleatum subsp.
vincentii 0.686813187 0.009509496
Tyrosine Desulfobulbus sp. oral taxon 041 -0.77166259 0.002002813 Tyrosine Treponema socranskii -0.747252747 0.003326741 Tyrosine Clostridiales [F-1][G-1] sp. oral
taxon 093 -0.738233164 0.003958271
Tyrosine Filifactor alocis -0.736263736 0.004107709 Tyrosine Actinomyces sp. oral taxon 172 -0.717100589 0.005800382 Tyrosine Peptostreptococcaceae [XI][G-6]
[Eubacterium] nodatum -0.689540712 0.009116373
Tyrosine Eggerthia catenaformis -0.684517511 0.009850245 Tyrosine Treponema denticola -0.682256491 0.010194832 Tyrosine Actinomyces sp. oral taxon 414 -0.635368813 0.019616911 Tyrosine Tannerella forsythia -0.631868132 0.020516043 Tyrosine Veillonellaceae [G-1] sp. oral taxon
150 -0.629843867 0.021049749
Tyrosine Erysipelotrichaceae [G-1] sp. oral taxon 904
-0.623337664 0.022835136
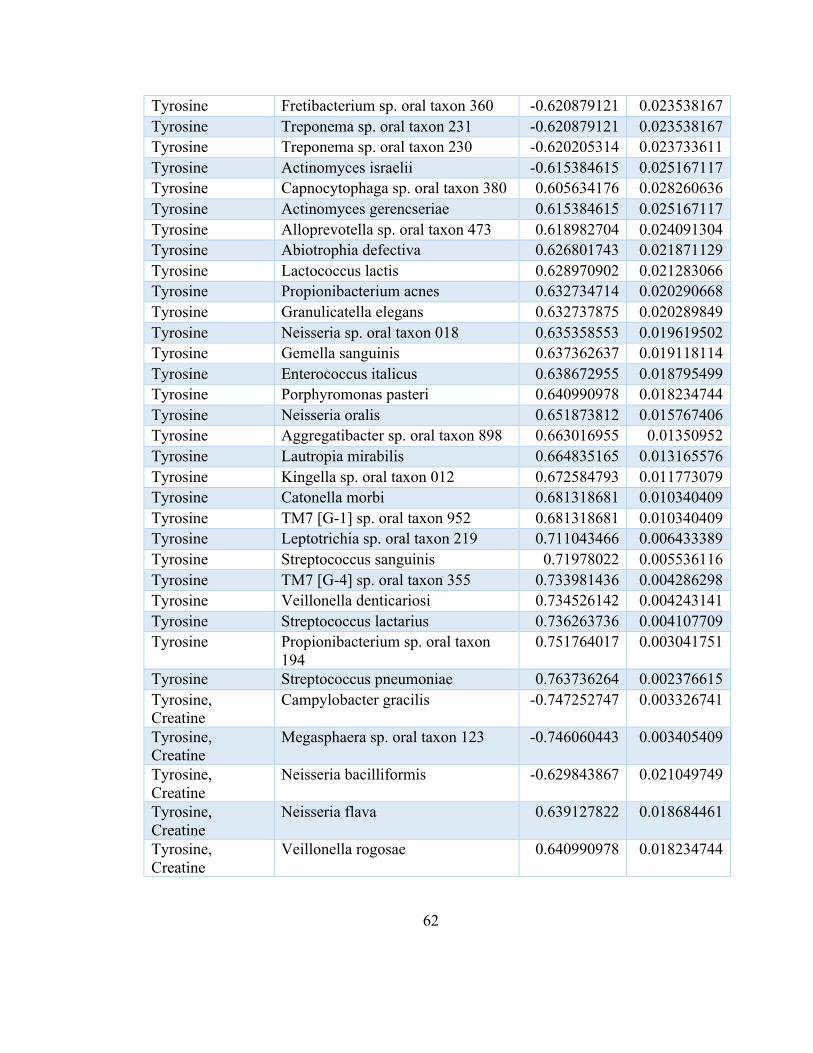
62
Tyrosine Fretibacterium sp. oral taxon 360 -0.620879121 0.023538167 Tyrosine Treponema sp. oral taxon 231 -0.620879121 0.023538167 Tyrosine Treponema sp. oral taxon 230 -0.620205314 0.023733611 Tyrosine Actinomyces israelii -0.615384615 0.025167117 Tyrosine Capnocytophaga sp. oral taxon 380 0.605634176 0.028260636 Tyrosine Actinomyces gerencseriae 0.615384615 0.025167117 Tyrosine Alloprevotella sp. oral taxon 473 0.618982704 0.024091304 Tyrosine Abiotrophia defectiva 0.626801743 0.021871129 Tyrosine Lactococcus lactis 0.628970902 0.021283066 Tyrosine Propionibacterium acnes 0.632734714 0.020290668 Tyrosine Granulicatella elegans 0.632737875 0.020289849 Tyrosine Neisseria sp. oral taxon 018 0.635358553 0.019619502 Tyrosine Gemella sanguinis 0.637362637 0.019118114 Tyrosine Enterococcus italicus 0.638672955 0.018795499 Tyrosine Porphyromonas pasteri 0.640990978 0.018234744 Tyrosine Neisseria oralis 0.651873812 0.015767406 Tyrosine Aggregatibacter sp. oral taxon 898 0.663016955 0.01350952 Tyrosine Lautropia mirabilis 0.664835165 0.013165576 Tyrosine Kingella sp. oral taxon 012 0.672584793 0.011773079 Tyrosine Catonella morbi 0.681318681 0.010340409 Tyrosine TM7 [G-1] sp. oral taxon 952 0.681318681 0.010340409 Tyrosine Leptotrichia sp. oral taxon 219 0.711043466 0.006433389 Tyrosine Streptococcus sanguinis 0.71978022 0.005536116 Tyrosine TM7 [G-4] sp. oral taxon 355 0.733981436 0.004286298 Tyrosine Veillonella denticariosi 0.734526142 0.004243141 Tyrosine Streptococcus lactarius 0.736263736 0.004107709 Tyrosine Propionibacterium sp. oral taxon
194 0.751764017 0.003041751
Tyrosine Streptococcus pneumoniae 0.763736264 0.002376615 Tyrosine, Creatine
Campylobacter gracilis -0.747252747 0.003326741
Tyrosine, Creatine
Megasphaera sp. oral taxon 123 -0.746060443 0.003405409
Tyrosine, Creatine
Neisseria bacilliformis -0.629843867 0.021049749
Tyrosine, Creatine
Neisseria flava 0.639127822 0.018684461
Tyrosine, Creatine
Veillonella rogosae 0.640990978 0.018234744

63
Tyrosine, Creatine
Johnsonella ignava 0.662999252 0.013512902
Tyrosine, Creatine
Fusobacterium nucleatum subsp. polymorphum
0.703296703 0.00731857
Valine Neisseria bacilliformis -0.651943652 0.015752429 Valine Streptococcus sp. oral taxon 058 -0.635368813 0.019616911 Valine Prevotella intermedia -0.632737875 0.020289849 Valine Tyrosine, Creatine 0.736263736 0.004107709 β-Glucose TM7 [G-3] sp. oral taxon 351 -0.848188324 0.000248251 β-Glucose Leptotrichia buccalis -0.774725275 0.001871362 β-Glucose Lachnoanaerobaculum saburreum -0.714285714 0.006088305 β-Glucose Streptococcus oligofermentans -0.708791209 0.006681784 β-Glucose Corynebacterium matruchotii -0.675824176 0.011225246 β-Glucose Streptococcus cristatus -0.664835165 0.013165576 β-Glucose Capnocytophaga sp. oral taxon 336 -0.635368813 0.019616911 β-Glucose Capnocytophaga sp. oral taxon 324 -0.618793975 0.024146872 β-Glucose Bacteroidetes [G-3] sp. oral taxon
365 0.609262036 0.0270787
β-Glucose Lachnospiraceae [G-7] sp. oral taxon 086
0.609262036 0.0270787
β-Glucose Selenomonas sp. oral taxon 146 0.620235195 0.023724919 β-Glucose Schlegelella aquatica 0.679568383 0.01061632 β-Glucose Parvimonas micra 0.692307692 0.008730318 β-Glucose Prevotella sp. oral taxon 304 0.698514065 0.007909707

64
Table 7 Subgingival bacteria and metabolomes network in overweight nonsmoker individuals.
Metabolite Taxonomy Correlation P-value B-Glucose Gemella sanguinis -0.6333333 0.00360264 Acetic acid Lachnoanaerobaculum
saburreum -0.6473684 0.00273199
Acetic acid Actinomyces dentalis -0.6361295 0.00341305 Acetoin Streptococcus sp. oral taxon 431 -0.60091 0.00650919 Acetoin Mycoplasma faucium 0.60390003 0.00617952 Acetoin Treponema lecithinolyticum 0.62457479 0.00425351 Acetoin Alloprevotella rava 0.64408911 0.0029179 Aspartate Neisseria flava 0.61369071 0.00519402 Aspartate Kluyvera ascorbata 0.62417604 0.0042853 Butyrate Stomatobaculum sp. oral taxon
097 0.60149826 0.00644322
Butyrate Corynebacterium mucifaciens 0.60898592 0.00565013 Butyrate Lachnoanaerobaculum
umeaense 0.6520221 0.00248508
Ethanol Granulicatella adiacens -0.7438596 0.00026109 Ethanol Capnocytophaga sp. oral taxon
334 -0.624176 0.0042853
Ethanol Actinomyces sp. oral taxon 448 -0.6145321 0.00511572 Ethanol Stomatobaculum sp. oral taxon
910 0.60014114 0.00659624
Ethanol Fusobacterium periodonticum 0.64414223 0.00291481 Ethanol Veillonellaceae [G-1] sp. oral
taxon 135 0.65747375 0.00221965
Ethanolamine Kingella oralis -0.6807018 0.00133707 Ethanolamine Campylobacter curvus 0.76286173 0.00014556 Formate Neisseria elongata -0.6315789 0.00372596 Fucose Kluyvera ascorbata 0.62693788 0.00406907 Fucose Neisseria flava 0.74174055 0.00027782 Galctose Neisseria flava 0.74079203 0.00028559 Glucose Veillonellaceae [G-1] sp. oral
taxon 135 -0.6620003 0.00201757
Glutamine Peptostreptococcaceae [XI][G-2] sp. oral taxon 091
0.62228167 0.004439
Glutamine Bacteroidetes [G-5] sp. oral taxon 505
0.62693788 0.00406907

65
Glutamine Johnsonella sp. oral taxon 166 0.62693788 0.00406907 Glutamine Treponema sp. oral taxon 269 0.62693788 0.00406907 Glutamine Bacteroidetes [G-3] sp. oral
taxon 365 0.64728914 0.00273636
Glutamine Veillonellaceae [G-1] sp. oral taxon 148
0.67146939 0.00164395
Glutamine Prevotella dentalis 0.68622696 0.00117749 Histidine Campylobacter curvus 0.61064338 0.00548585 Histidine Peptostreptococcaceae [XI][G-7]
[Eubacterium] yurii subsps. yurii & margaretiae
0.6211514 0.00453285
Histidine Capnocytophaga sp. oral taxon 338
0.62329516 0.00435622
Histidine Prevotella sp. oral taxon 317 0.70820542 0.00069088 Lactic acid TM7 [G-1] sp. oral taxon 352 -0.6998622 0.00085045 Lactic acid Actinomyces cardiffensis -0.635457 0.00345787 Lactic acid Leptotrichia hofstadii -0.6264378 0.00410754 Lactic acid Prevotella pallens -0.6116002 0.00539281 Lactic acid TM7 [G-1] sp. oral taxon 348 -0.6112101 0.00543058 Lactic acid Actinomyces lingnae [NVP] -0.6030254 0.00627451 Lactic acid TM7 [G-3] sp. oral taxon 351 -0.6014094 0.00645315 Leucine Kingella sp. oral taxon 012 0.61938181 0.00468304 Leucine Neisseria flava 0.6677562 0.00178291 Lysine Prevotella sp. oral taxon 306 -0.6117937 0.00537416 Proline Veillonellaceae [G-1] sp. oral
taxon 148 0.61735831 0.00485977
Proline Peptostreptococcaceae [XI][G-2] sp. oral taxon 091
0.66586166 0.00185749
Propionate Streptococcus gordonii -0.7508772 0.00021167 Propionate Capnocytophaga sp. oral taxon
324 -0.655537 0.00231111
Propionate Bacteroidetes [G-5] sp. oral taxon 511
-0.6136907 0.00519402
Propionate Treponema sp. oral taxon 237 -0.6136907 0.00519402 Succinic acid Neisseria flava -0.6611166 0.00205577 Succinic acid Kingella sp. oral taxon 012 -0.60136 0.00645868 Succinic acid Alloprevotella sp. oral taxon 473 0.70732784 0.00070638 Succinic acid Veillonella sp. oral taxon 780 0.73733379 0.00031553 Sugars polyols Atopobium sp. oral taxon 199 -0.6737562 0.00156295

66
Sugars polyols Tannerella forsythia -0.6389011 0.00323333 Sugars polyols Campylobacter sp. oral taxon
044 -0.6291831 0.00389997
Sugars polyols Prevotella pallens -0.6010554 0.00649283 Tyrosine Prevotella salivae -0.6371931 0.00334313 Tyrosine Campylobacter curvus 0.62657321 0.00409709 Tyrosine, Creatine Capnocytophaga sp. oral taxon
326 0.6000235 0.00660964
Tyrosine, Creatine Campylobacter curvus 0.78056154 8.04E-05 Valine Atopobium rimae -0.636244 0.00340546 Valine Prevotella loescheii -0.6353665 0.00346395 Valine Neisseria sicca 0.66081621 0.00206889 Valine Neisseria flava 0.76355644 0.00014234

67
Table 8 Subgingival bacteria and metabolomes network in overweight smoker individuals.
Metabolite Taxonomy Correlation P-value Acetic acid Veillonella denticariosi 0.60603766 0.01283105 Acetic acid Aggregatibacter segnis 0.62941177 0.00898809 Acetic acid Neisseria lactamica 0.64720556 0.00672549 Acetic acid Neisseria oralis 0.64783693 0.00665448 Acetic acid Pseudoramibacter alactolyticus 0.66513464 0.00492948 Acetic acid Prevotella oralis 0.6785401 0.00385611 Acetic acid Streptococcus dentisani 0.74172206 0.00100514 Acetoin Capnocytophaga haemolytica -0.6428628 0.00723043 Acetoin Stomatobaculum sp. oral taxon
910 -0.6079188 0.01248092
Acetoin Leptotrichia sp. oral taxon 463 0.60485249 0.01305557 Alanine Actinomyces johnsonii 0.60294118 0.01342413 Alanine Mogibacterium pumilum 0.66666957 0.00479567 Alanine Campylobacter gracilis 0.69117647 0.00302472 Alanine TM7 [G-5] sp. oral taxon 356 0.70075997 0.00249612 Alanine Lachnospiraceae [G-7] sp. oral
taxon 086 0.76341147 0.00057941
Aspartate Pseudoramibacter alactolyticus -0.7652624 0.00055136 Aspartate Streptococcus dentisani -0.7579104 0.00066978 Aspartate Aggregatibacter segnis -0.6382353 0.00780114 Aspartate Lachnospiraceae [G-8] sp. oral
taxon 500 -0.6236098 0.00984337
Aspartate Veillonella denticariosi -0.6090231 0.01227889 B-Glucose Streptococcus sp. oral taxon
056 -0.8037726 0.00017567
B-Glucose Lachnoanaerobaculum umeaense
-0.7490804 0.00083886
B-Glucose GN02 [G-1] sp. oral taxon 872 -0.7264158 0.00143797 B-Glucose Treponema sp. oral taxon 253 -0.6870959 0.00327558 B-Glucose Fusobacterium sp. oral taxon
203 -0.6647059 0.00496739
B-Glucose Johnsonella ignava -0.6514447 0.00626007 B-Glucose Streptococcus dentisani -0.6475351 0.00668835 B-Glucose Fusobacterium nucleatum
subsp. polymorphum -0.6382353 0.00780114

68
B-Glucose Treponema maltophilum -0.6004417 0.01391834 B-Glucose Actinomyces sp. oral taxon 180 0.60076677 0.01385326 Butyrate Bulleidia extructa 0.60603766 0.01283105 Butyrate Haemophilus sp. oral taxon 036 0.6256047 0.00954235 Butyrate Clostridiales [F-1][G-1] sp. oral
taxon 093 0.64496271 0.00698263
Butyrate Aggregatibacter sp. oral taxon 458
0.69016659 0.00308531
Ethanol Mogibacterium pumilum -0.8023634 0.00018395 Ethanol Lachnospiraceae [G-7] sp. oral
taxon 086 -0.7461326 0.00090253
Ethanol Ottowia sp. oral taxon 894 -0.7399464 0.00104906 Ethanol Actinomyces gerencseriae -0.6647059 0.00496739 Ethanol Mogibacterium diversum -0.6487427 0.00655365 Ethanol Campylobacter gracilis -0.6441176 0.00708152 Ethanol Fusobacterium naviforme -0.6411765 0.00743442 Ethanol Leptotrichia goodfellowii -0.6314638 0.00870008 Ethanol Actinomyces johnsonii -0.6176471 0.01078799 Ethanol Streptococcus intermedius -0.6176471 0.01078799 Ethanol Actinomyces sp. oral taxon 897 -0.6110433 0.01191594 Ethanol Prevotella shahii -0.6106221 0.01199091 Ethanol Shuttleworthia satelles -0.6079228 0.01248017 Ethanol Leptotrichia sp. oral taxon 223 0.6093115 0.01222655 Ethanolamine Prevotella sp. oral taxon 396 0.61049838 0.012013 Ethanolamine Fusobacterium periodonticum 0.62352941 0.00985565 Ethanolamine Alloprevotella tannerae 0.63235294 0.00857758 Ethanolamine Gemella sanguinis 0.64117647 0.00743442 Ethyl Propionate and proline
Actinomyces meyeri -0.6693291 0.00457071
Ethyl Propionate and proline
Streptococcus sp. oral taxon 431
-0.6505829 0.00635254
Ethyl Propionate and proline
Actinomyces timonensis -0.6235457 0.00985316
Ethyl Propionate and proline
Selenomonas sp. oral taxon 133 0.60076677 0.01385326
Ethyl Propionate and proline
Prevotella pleuritidis 0.62693551 0.00934562
Ethyl Propionate and proline
Treponema amylovorum 0.64010269 0.00756668

69
Formate Peptostreptococcaceae [XI][G-1] [Eubacterium] infirmum
-0.7404162 0.00103729
Formate Parvimonas sp. oral taxon 393 -0.674702 0.00414206 Formate Tannerella sp. oral taxon 286 -0.6509072 0.00631762 Formate Actinomyces massiliensis -0.6342901 0.00831542 Formate Dialister invisus -0.6147059 0.01127947 Formate Treponema amylovorum -0.6007668 0.01385326 Formate Pseudoramibacter alactolyticus 0.63295071 0.008496 Formate Actinomyces meyeri 0.66625883 0.00483119 Formate Streptococcus oralis 0.72352941 0.00153448 Fucose Neisseria oralis 0.6079228 0.01248017 Fucose Lachnospiraceae [G-8] sp. oral
taxon 500 0.61104334 0.01191594
Fucose Cardiobacterium hominis 0.6136867 0.01145383 Fucose Capnocytophaga sp. oral taxon
326 0.61947172 0.01049165
Fucose Prevotella oralis 0.67546978 0.00408354 Fucose Fusobacterium nucleatum
subsp. vincentii 0.67647059 0.00400825
Fucose Actinomyces sp. oral taxon 897 0.76184067 0.00060413 Galctose Actinomyces sp. oral taxon 897 0.62203898 0.01008562 Galctose Fusobacterium nucleatum
subsp. vincentii 0.62941177 0.00898809
Galctose Prevotella shahii 0.64012078 0.00756444 Galctose Erysipelotrichaceae [G-1] sp.
oral taxon 904 0.66871064 0.00462226
Galctose Prevotella oralis 0.68775105 0.00323422 Glucose Lachnospiraceae [G-7] sp. oral
taxon 086 0.60318931 0.01337582
Glucose Actinomyces gerencseriae 0.61470588 0.01127947 Glucose Campylobacter gracilis 0.68235294 0.00358797 Glucose TM7 [G-5] sp. oral taxon 356 0.73039041 0.00131322 Glutamine Oribacterium sinus -0.7215245 0.00160458 Glutamine Veillonellaceae [G-1] sp. oral
taxon 483 0.6256047 0.00954235
Glutamine Erysipelotrichaceae [G-1] sp. oral taxon 905
0.73233101 0.0012556
Glycose Prevotella oralis -0.755298 0.00071659 Glycose Actinomyces sp. oral taxon 897 -0.6817296 0.00363075

70
Glycose Selenomonas artemidis -0.6773729 0.00394134 Glycose Capnocytophaga sp. oral taxon
326 -0.6755192 0.0040798
Glycose Neisseria oralis -0.6263447 0.00943255 Glycose Veillonella denticariosi -0.6060377 0.01283105 Glycose Aggregatibacter sp. oral taxon
949 -0.6027706 0.01345742
Histidine Neisseria lactamica -0.6143623 0.01133802 Histidine SR1 [G-1] sp. oral taxon 875 0.60833728 0.01240405 Histidine Fusobacterium periodonticum 0.60882353 0.0123152 Isoleucine Lachnoanaerobaculum sp. oral
taxon 083 0.60157797 0.01369193
Isoleucine Fusobacterium periodonticum 0.63529412 0.00818207 Isoleucine Selenomonas sp. oral taxon 937 0.7093453 0.00208857 L Glutamic acid Neisseria lactamica -0.6104984 0.012013 Lactic acid Ottowia sp. oral taxon 894 -0.7583683 0.00066185 Leucine Prevotella oralis 0.64476661 0.00700548 Leucine Treponema sp. oral taxon 236 0.6488931 0.00653702 Leucine Actinobaculum sp. oral taxon
183 0.65487011 0.00590307
Leucine Peptostreptococcaceae [XI][G-1] [Eubacterium] sulci
0.66652513 0.00480814
Leucine Prevotella enoeca 0.66748118 0.0047261 Leucine Prevotella pleuritidis 0.67171661 0.00437605 Leucine Tannerella forsythia 0.68285523 0.0035538 Leucine Fusobacterium nucleatum
subsp. vincentii 0.72647059 0.00143618
Leucine Dialister pneumosintes 0.74816867 0.00085814 Lysine Prevotella oralis 0.62327439 0.0098947 Lysine Capnocytophaga sp. oral taxon
326 0.65192024 0.00620951
Lysine Actinomyces sp. oral taxon 897 0.84352256 4.03E-05 Methanol Actinomyces gerencseriae 0.61764706 0.01078799 Methanol Campylobacter curvus 0.62096469 0.01025399 Methanol Aggregatibacter sp. oral taxon
898 0.62693174 0.00934617
Methanol Campylobacter gracilis 0.66470588 0.00496739 Methanol Actinomyces sp. oral taxon 525 0.66764706 0.00471198 Methanol Shuttleworthia satelles 0.696962 0.00269584

71
Phenylalanine TM7 [G-1] sp. oral taxon 952 -0.7617647 0.00060534 Phenylalanine Veillonella dispar -0.6617647 0.00523375 Phenylalanine Streptococcus parasanguinis I -0.65 0.00641571 Propionate Selenomonas artemidis 0.61903456 0.01056206 Propionate Pseudoramibacter alactolyticus 0.63295071 0.008496 Propionate Lachnospiraceae [G-8] sp. oral
taxon 500 0.63303462 0.0084846
Propionate Streptococcus dentisani 0.6990436 0.00258484 Propionate Neisseria lactamica 0.70902818 0.00210259 Propionate Prevotella oralis 0.74608708 0.00090354 Propylene glycerol Ottowia sp. oral taxon 894 -0.7307355 0.00130281 Propylene glycerol Leptotrichia goodfellowii -0.7162873 0.00180005 Propylene glycerol Actinomyces johnsonii -0.6941176 0.00285371 Succinic acid Fusobacterium nucleatum
subsp. vincentii -0.8323529 6.33E-05
Succinic acid Catonella morbi -0.7088235 0.00211168 Succinic acid Fusobacterium naviforme -0.7088235 0.00211168 Succinic acid Cardiobacterium valvarum -0.6725693 0.00430817 Succinic acid Treponema maltophilum -0.61663 0.01095599 Succinic acid Prevotella shahii -0.6017725 0.01365345 Succinic acid Fusobacterium nucleatum
subsp. polymorphum -0.6 0.01400712
Sugars polyols Pseudoramibacter alactolyticus -0.7223505 0.00157539 Sugars polyols Streptococcus dentisani -0.6813836 0.00365467 Sugars polyols Veillonella denticariosi -0.6657458 0.00487585 Sugars polyols Streptococcus parasanguinis II -0.6202041 0.01037454 Tyrosine Selenomonas sp. oral taxon 137 -0.7608538 0.00062009 Tyrosine Leptotrichia hofstadii -0.6776874 0.00391822 Tyrosine Streptococcus parasanguinis I -0.6647059 0.00496739 Tyrosine Selenomonas noxia -0.6058824 0.0128603 Tyrosine Ruminococcaceae [G-1] sp. oral
taxon 075 -0.6047224 0.0130804
Tyrosine Erysipelotrichaceae [G-1] sp. oral taxon 905
0.60247438 0.01351536
Tyrosine, Creatine Tannerella forsythia 0.60191333 0.01362566 Tyrosine, Creatine Actinomyces sp. oral taxon 525 0.60882353 0.0123152 Tyrosine, Creatine Actinobaculum sp. oral taxon
183 0.66666957 0.00479567

72
Tyrosine, Creatine Prevotella oralis 0.73073549 0.00130281 Valine Prevotella pleuritidis 0.61200847 0.01174555 Valine Dialister pneumosintes 0.65186974 0.00621486 Valine Prevotella enoeca 0.67424048 0.00417756 Valine Actinobaculum sp. oral taxon
183 0.69026849 0.00307915
Valine Peptostreptococcaceae [XI][G-1] [Eubacterium] sulci
0.69550448 0.00277583
Valine Prevotella oralis 0.71845422 0.00171695 Valine Fusobacterium nucleatum
subsp. vincentii 0.77941177 0.00037168

73
Table 9 Subgingival bacteria and metabolomes network in obese nonsmoker individuals.
Metabolite Taxonomy Correlation P value Acetoin Bergeyella sp. oral taxon 900 -0.6447677 0.00089571 Acetoin Lachnospiraceae [G-8] sp. oral
taxon 500 -0.630563 0.00125732
Acetoin Capnocytophaga sp. oral taxon 332
-0.619272 0.00162751
Alanine Campylobacter showae 0.6027668 0.00233324 Alanine Selenomonas dianae 0.63533306 0.00112406 Alanine Lachnospiraceae [G-8] sp. oral
taxon 500 0.65299644 0.00073022
Alanine Selenomonas sp. oral taxon 138 0.76273865 2.32E-05 Aspartate Aggregatibacter aphrophilus 0.61783043 0.00168085 B-Glucose Prevotella intermedia -0.7029833 0.00018321 B-Glucose Veillonella rogosae -0.6627131 0.00056924 B-Glucose Selenomonas sp. oral taxon 937 -0.6449297 0.00089216 B-Glucose Lachnospiraceae [G-8] sp. oral
taxon 500 -0.6317756 0.00122223
Butyrate Bergeyella sp. oral taxon 900 -0.7295022 7.82E-05 Butyrate Capnocytophaga sp. oral taxon
332 -0.6878218 0.00028658
Ethanol Aggregatibacter paraphrophilus -0.7395517 5.52E-05 Ethanolamine TM7 [G-2] sp. oral taxon 350 -0.6715557 0.00045029 Ethanolamine Actinomyces cardiffensis -0.6523211 0.00074273 Ethyl Propionate and proline
Fusobacterium sp. oral taxon 203
0.61462451 0.00180484
Formate Actinomyces viscosus 0.61247949 0.00189206 Fucose Porphyromonas pasteri 0.61675317 0.00172168 Fucose Fretibacterium sp. oral taxon
360 0.62860298 0.00131586
Fucose Prevotella baroniae 0.69863868 0.00020884 Galctose Fretibacterium sp. oral taxon
360 0.63879103 0.00103518
Galctose Prevotella baroniae 0.67450899 0.00041567 Glutamine Dialister pneumosintes -0.6363689 0.00109678 Glutamine Eikenella sp. oral taxon 011 -0.6087358 0.00205288 Glycose Prevotella baroniae -0.7048114 0.00017327

74
Glycose Fretibacterium sp. oral taxon 360
-0.6224901 0.0015136
L Glutamic acid TM7 [G-2] sp. oral taxon 350 -0.6053296 0.00220913 Leucine Selenomonas dianae 0.61629311 0.00173937 Phenylalanine Capnocytophaga sputigena 0.62944664 0.00129038 Proline Alloprevotella sp. oral taxon
913 -0.6367534 0.00108679
Propionate Stomatobaculum sp. oral taxon 097
0.64157587 0.00096804
Propionate Streptococcus sp. oral taxon 057 0.64848395 0.00081737 Propylene glycerol Megasphaera sp. oral taxon 123 -0.6097422 0.00200855 Succinic acid Selenomonas dianae -0.6754172 0.0004055 Sugars polyols Selenomonas sp. oral taxon 137 0.63636364 0.00109691 Sugars polyols Selenomonas sputigena 0.70548024 0.00016976

75
Table 10 Subgingival bacteria and metabolomes network in obese smoker individuals.
Metabolite Taxonomy Correlation P-value Acetic acid Oribacterium asaccharolyticum -0.6508307 0.00632585 Acetoin Streptococcus gordonii -0.6294118 0.00898809 Acetoin Streptococcus sp. oral taxon 070 -0.6048525 0.01305557 Acetoin Selenomonas sp. oral taxon 937 0.60247438 0.01351536 Alanine Capnocytophaga sp. oral taxon
902 -0.7941183 0.00023919
Alanine Bergeyella sp. oral taxon 900 -0.6447666 0.00700548 Alanine Leptotrichia hongkongensis -0.6205882 0.01031352 Alanine TM7 [G-4] sp. oral taxon 355 0.62981795 0.00893049 Aspartate Corynebacterium durum -0.6843688 0.0034524 Aspartate Bacteroidetes [G-5] sp. oral taxon
511 0.62210387 0.01007552
B-Glucose Campylobacter showae -0.6235294 0.00985565 B-Glucose Streptococcus sp. oral taxon 423 -0.6029412 0.01342413 B-Glucose Veillonellaceae [G-1] sp. oral
taxon 148 0.63423373 0.00832296
B-Glucose Veillonellaceae [G-1] sp. oral taxon 483
0.65149179 0.00625505
B-Glucose Actinomyces cardiffensis 0.68099979 0.00368136 Butyrate Olsenella uli -0.6157935 0.01109571 Butyrate TM7 [G-1] sp. oral taxon 488 0.61697567 0.01089866 Ethanol Pseudoramibacter alactolyticus -0.7131065 0.00192793 Ethanol Porphyromonas uenonis -0.6773789 0.0039409 Ethanol Bacteroidetes [G-7] sp. oral taxon
911 -0.6047025 0.0130842
Ethanol Prevotella melaninogenica 0.69315692 0.00290869 Ethanolamine Staphylococcus epidermidis 0.61266115 0.01163141 Ethanolamine Lachnospiraceae [G-7] sp. oral
taxon 163 0.62692536 0.0093471
Ethyl Propionate and proline
Rothia dentocariosa 0.6740252 0.00419421
Ethyl Propionate and proline
Streptococcus salivarius 0.70640196 0.0022217
Formate Prevotella sp. oral taxon 313 0.62058824 0.01031352 Formate TM7 [G-3] sp. oral taxon 351 0.64169629 0.00737105 Formate Prevotella enoeca 0.67086083 0.00444505 Formate Lachnoanaerobaculum orale 0.68579857 0.00335876

76
Formate Stomatobaculum sp. oral taxon 910
0.68709595 0.00327558
Formate Ruminococcaceae [G-2] sp. oral taxon 085
0.86822749 1.30E-05
Fucose Actinomyces oris -0.6882353 0.00320391 Fucose Rothia dentocariosa -0.6622518 0.00518887 Fucose Selenomonas sp. oral taxon 138 0.60157797 0.01369193 Fucose Selenomonas infelix 0.60834664 0.01240233 Fucose Prevotella melaninogenica 0.72553368 0.00146692 Galctose Actinomyces oris -0.6647059 0.00496739 Galctose Rothia dentocariosa -0.6607802 0.00532543 Galctose Pseudomonas aeruginosa -0.6294118 0.00898809 Galctose Veillonella denticariosi -0.6117647 0.01178841 Galctose Oribacterium asaccharolyticum -0.6114948 0.01183601 Galctose Erysipelotrichaceae [G-1] sp. oral
taxon 904 0.64213379 0.00731806
Galctose Prevotella melaninogenica 0.70051527 0.00250862 Galctose Selenomonas sp. oral taxon 138 0.708037 0.00214692 Glucose Selenomonas artemidis -0.6911544 0.00302603 Glucose Bacteroidetes [G-3] sp. oral taxon
281 0.64286276 0.00723043
Glucose Streptococcus parasanguinis I 0.65 0.00641571 Glucose Actinomyces lingnae [NVP] 0.68944892 0.00312896 Glucose Propionibacterium acnes 0.69374258 0.00287507 Glucose Streptococcus parasanguinis II 0.69927844 0.00257255 Glucose Slackia exigua 0.70447056 0.00231274 Glutamine Streptococcus sp. oral taxon 070 -0.6754698 0.00408354 Histidine SR1 [G-1] sp. oral taxon 345 -0.6346054 0.00827336 Histidine Treponema sp. oral taxon 238 -0.6186467 0.01062483 Isoleucine SR1 [G-1] sp. oral taxon 345 -0.7744071 0.00042866 Isoleucine Treponema sp. oral taxon 238 -0.6544067 0.00595039 Isoleucine Centipeda periodontii -0.6312712 0.0087268 L Glutamic acid Streptococcus sp. oral taxon 070 -0.6079228 0.01248017 L Glutamic acid Prevotella sp. oral taxon 472 0.65781997 0.00560881 Lactic acid Alloprevotella sp. oral taxon 913 -0.6779724 0.00389737 Lactic acid Treponema sp. oral taxon 951 0.60277055 0.01345742 Lactic acid TM7 [G-1] sp. oral taxon 347 0.63418356 0.00832967 Lactic acid Streptococcus salivarius 0.69315692 0.00290869

77
Lactic acid Actinomyces cardiffensis 0.70465735 0.0023038 Leucine Prevotella shahii -0.70076 0.00249612 Leucine Leptotrichia buccalis -0.6518697 0.00621486 Leucine Lachnospiraceae [G-7] sp. oral
taxon 163 0.73169456 0.00127426
Leucine Dialister micraerophilus 0.7330785 0.00123396 Lysine Erysipelotrichaceae [G-1] sp. oral
taxon 905 -0.7021501 0.00242609
Lysine Treponema sp. oral taxon 951 -0.6993684 0.00256786 Lysine Prevotella sp. oral taxon 300 -0.6176471 0.01078799 Lysine Treponema socranskii -0.6147059 0.01127947 Lysine Fusobacterium sp. oral taxon 203 0.65 0.00641571 Lysine Prevotella loescheii 0.73451647 0.0011932 Methanol Schlegelella aquatica 0.60305225 0.01340249 Phenylalanine Veillonellaceae [G-1] sp. oral
taxon 155 -0.703723 0.00234878
Phenylalanine Centipeda periodontii -0.6725693 0.00430817 Phenylalanine Capnocytophaga sp. oral taxon
332 -0.6611678 0.00528918
Phenylalanine Prevotella nanceiensis -0.629893 0.00891988 Phenylalanine Treponema sp. oral taxon 242 -0.6169757 0.01089866 Phenylalanine Leptotrichia sp. oral taxon 225 -0.6017822 0.01365155 Phenylalanine Actinomyces sp. oral taxon 169 0.64140969 0.00740594 Proline Prevotella baroniae -0.6958668 0.00275576 Proline Streptococcus sp. oral taxon 070 -0.6846807 0.00343179 Proline Streptococcus gordonii -0.6205882 0.01031352 Propionate Olsenella uli -0.6806139 0.00370834 Propylene glycerol Treponema pectinovorum 0.61822621 0.01069322 Propylene glycerol Treponema sp. oral taxon 951 0.62402208 0.00978055 Propylene glycerol Prevotella multiformis 0.62579872 0.00951347 Propylene glycerol Selenomonas noxia 0.6429806 0.00721634 Propylene glycerol TM7 [G-1] sp. oral taxon 347 0.64324332 0.00718501 Propylene glycerol Treponema vincentii 0.64496271 0.00698263 Propylene glycerol Neisseria bacilliformis 0.64928316 0.00649407 Propylene glycerol Capnocytophaga sp. oral taxon
338 0.65144474 0.00626007
Propylene glycerol Leptotrichia sp. oral taxon 221 0.67230476 0.00432914 Propylene glycerol Mitsuokella sp. oral taxon 521 0.67737888 0.0039409

78
Propylene glycerol Veillonellaceae [G-1] sp. oral taxon 135
0.686442 0.0033173
Propylene glycerol Leptotrichia shahii 0.7075415 0.00216936 Propylene glycerol Treponema parvum 0.71877453 0.00170494 Succinic acid Lachnoanaerobaculum umeaense 0.63116363 0.00874175 Sugars polyols Corynebacterium durum -0.7404162 0.00103729 Sugars polyols Capnocytophaga leadbetteri -0.7088235 0.00211168 Sugars polyols Porphyromonas sp. oral taxon
284 -0.6902685 0.00307915
Sugars polyols Prevotella sp. oral taxon 472 -0.6755192 0.0040798 Sugars polyols Campylobacter showae -0.6352941 0.00818207 Sugars polyols Prevotella loescheii -0.634221 0.00832466 Sugars polyols Capnocytophaga sputigena -0.6133502 0.01151187 Tyrosine Streptococcus tigurinus -0.7352941 0.00117162 Tyrosine Prevotella baroniae -0.6063309 0.01277596 Tyrosine, Creatine Treponema sp. oral taxon 951 -0.7070962 0.00218969 Tyrosine, Creatine Erysipelotrichaceae [G-1] sp. oral
taxon 905 -0.6990084 0.00258668
Tyrosine, Creatine Prevotella multiformis -0.6615586 0.00525283 Tyrosine, Creatine Veillonellaceae [G-1] sp. oral
taxon 483 -0.6514918 0.00625505
Tyrosine, Creatine Veillonellaceae [G-1] sp. oral taxon 148
-0.6342337 0.00832296
Tyrosine, Creatine TM7 [G-1] sp. oral taxon 347 -0.6115341 0.01182905 Valine Prevotella shahii -0.6681665 0.00466799 Valine Olsenella sp. oral taxon 807 -0.659775 0.00542034 Valine Prevotella micans -0.6221039 0.01007552 Valine Dialister micraerophilus 0.70804655 0.00214649

79
Appendix B: Figures
Figure 1 Linear discriminant analysis, Shannon index and DESeq for BMI groups.
(A) Linear discriminant analysis of unweighted and weighted UniFrac and Bray-Curtis for normalweight (yellow), overweight (light purple) and obese (dark purple) individuals. (B) Shannon index of alpha diversity. (C) Deseq plot of the species that were different between obese and normalweight individuals. Each dot represents a species. Dots above the red line were more abundant in obese individuals.

80
Figure 2 Cytokine discriminants and Cytokine discriminants For BMI groups. Cytokine discriminants (2A) and Cytokine discriminants (2B) between normalweight (green), overweight (orange) and obese (yellow) individuals.
Figure 3 Co-occurrence networks of BMI groups.
Co-occurrence networks of normalweight group is shown in figure (3A), overweight in (3B) and obese group in (). Each network graph contains nodes (circles sized by relative abundance per group) and edges (lines). Nodes represent species-level OTU’s and adipokines; edges represent Spearman’s ρ. Edges are colored green for positive correlation and red for negative correlation. Only significant correlations (p < 0.05, t-test) with a coefficient of at least 0.75 are shown.

81
Figure 4 Linear discriminant analysis, Shannon index and DESeq for BMI sub-grouped according gender.
(A) Linear discriminant analysis of unweighted and weighted UniFrac and Bray-Curtis for normalweight, obese and obese individuals according to gender. (B) Shannon index of alpha diversity. (C) Deseq plot of the species that were different between Female normalweight and male normalweight (D) female and male overweight and (E) female obese and female normalweight. Each dot represents a species. Dots above the red line were more abundant in Female normalweight (C), female overweight (D) and female obese (E).

82
Figure 5 Linear discriminant analysis, Shannon index and DESeq for smoking groups.
(A) Linear discriminant analysis of unweighted and weighted UniFrac and Bray-Curtis for nonsmoker (green) and smoker (red) individuals. (B) Shannon index of alpha diversity. (C) Deseq plot of the species that were different. Each dot represents a species. Dots above the red line were more abundant in nonsmoker individuals.

83
Figure 6 Linear discriminant analysis, Shannon index and DESeq for smoking sub-grouped according gender.
(A) Linear discriminant analysis of unweighted and weighted UniFrac and Bray-Curtis for Smoking gender subgroups. (B) Shannon index of alpha diversity. (C) Deseq plot of the species that were different between female smoker and female nonsmoker and (D) male smoker and male nonsmoker. Dots above the red line were more abundant in female smoker (C) and male smoker (D)

84
Figure 7 Linear discriminant analysis, Shannon index and DESeq for BMI-smoking groups.
(A) Linear discriminant analysis of unweighted and weighted UniFrac and Bray-Curtis for individuals by BMI and smoking status. (B) Shannon index of alpha diversity. (C) Deseq plot of the species that were different between normalweight nonsmokers and obese smokers. Each dot represents a species. Dots above the red line were more abundant in normalweight nonsmoker individuals.

85
Figure 8 Representative NMR spectrum.
NMR spectroscopy of a representative sample showing the metabolomes identified in the saliva sample collected.
Figure 9 Metabolic profile of the BMI-Smoking groups.
Metabolic profile of the 6 groups, showing a distinct profile for obese smoker group compared to Normalweight nonsmoker individuals. the profiles also show similar profiles between normalweight smoker and obese nonsmoker.
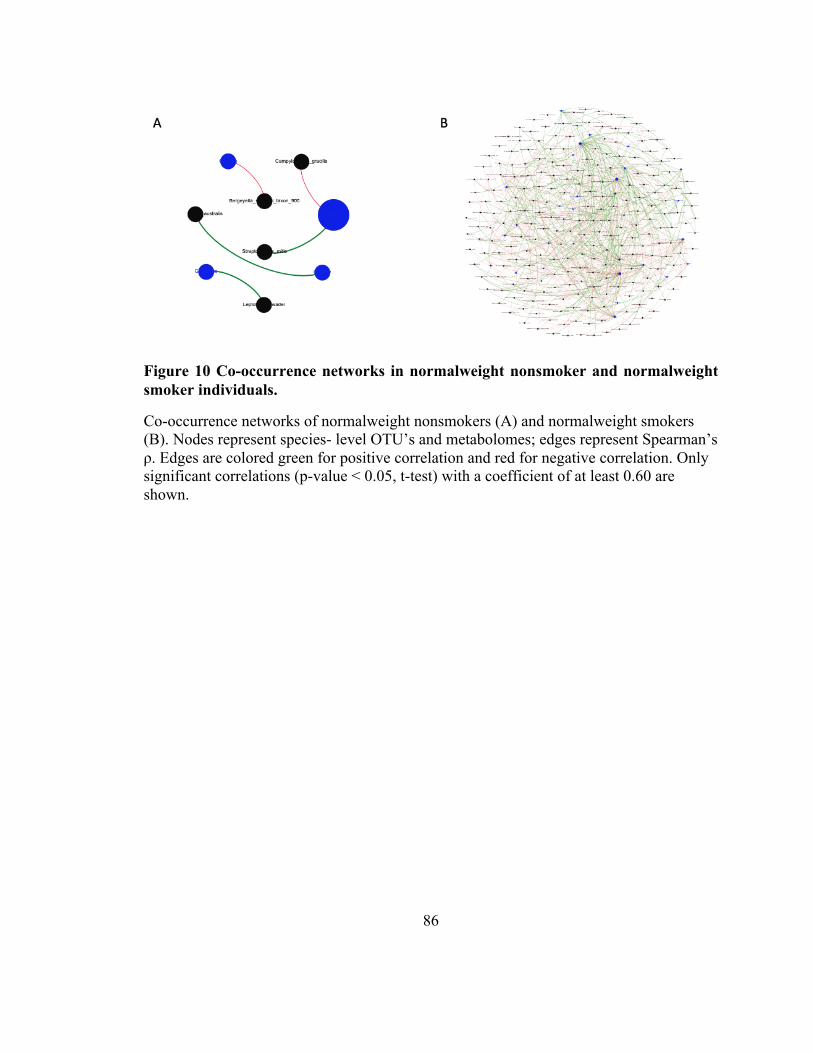
86
Figure 10 Co-occurrence networks in normalweight nonsmoker and normalweight smoker individuals.
Co-occurrence networks of normalweight nonsmokers (A) and normalweight smokers (B). Nodes represent species- level OTU’s and metabolomes; edges represent Spearman’s ρ. Edges are colored green for positive correlation and red for negative correlation. Only significant correlations (p-value < 0.05, t-test) with a coefficient of at least 0.60 are shown.

87
Figure 11 Co-occurrence networks in overweight nonsmoker and overweight smoker individuals.
Co-occurrence networks of overweight nonsmokers (A) and overweight smokers (B). Nodes represent species- level OTU’s and metabolomes; edges represent Spearman’s ρ. Edges are colored green for positive correlation and red for negative correlation. Only significant correlations (p-value < 0.05, t-test) with a coefficient of at least 0.60 are shown.

88
Figure 12 Co-occurrence networks in obese nonsmoker and obese smoker individuals.
Co-occurrence networks of obese nonsmokers (A) and obese smokers (B). Nodes represent species-level OUT’s and metabolomes. Edges represent Spearman’s ρ. Edges are colored green for positive correlation and red for negative correlation. Only significant correlations (p-value < 0.05, t-test) with a coefficient of a least 0.60 are shown.