Plants as bioreactors: Recent developments and emerging opportunities
Upload
khangminh22Category
view
4download
0
Plants 2021, 10, 2409. https://doi.org/10.3390/plants10112409 www.mdpi.com/journal/plants
Review
Plants Metabolome Study: Emerging Tools and Techniques
Manish Kumar Patel 1,*,†, Sonika Pandey 2,†, Manoj Kumar 3, Md Intesaful Haque 4, Sikander Pal 5
and Narendra Singh Yadav 6,*
1 Department of Postharvest Science of Fresh Produce, Agricultural Research Organization,
Volcani Center, Rishon LeZion 7505101, Israel 2 Independent Researcher, Civil Line, Fathepur 212601, India; [email protected] 3 Institute of Plant Sciences, Agricultural Research Organization, Volcani Center,
Rishon LeZion 7505101, Israel; [email protected] 4 Fruit Tree Science Department, Newe Ya’ar Research Center, Agriculture Research Organization,
Volcani Center, Ramat Yishay 3009500, Israel; [email protected] 5 Plant Physiology Laboratory, Department of Botany, University of Jammu, Jammu 180006, India;
[email protected] 6 Department of Biological Sciences, University of Lethbridge, Lethbridge, AB T1K 3M4, Canada
* Correspondence: [email protected] (M.K.P.); [email protected] (N.S.Y.)
† These authors have equally contributed: Manish Kumar Patel and Sonika Pandey.
Abstract: Metabolomics is now considered a wide-ranging, sensitive and practical approach to
acquire useful information on the composition of a metabolite pool present in any organism,
including plants. Investigating metabolomic regulation in plants is essential to understand their
adaptation, acclimation and defense responses to environmental stresses through the production of
numerous metabolites. Moreover, metabolomics can be easily applied for the phenotyping of
plants; and thus, it has great potential to be used in genome editing programs to develop superior
next-generation crops. This review describes the recent analytical tools and techniques available to
study plants metabolome, along with their significance of sample preparation using targeted and
non-targeted methods. Advanced analytical tools, like gas chromatography-mass spectrometry
(GC-MS), liquid chromatography mass-spectroscopy (LC-MS), capillary electrophoresis-mass
spectrometry (CE-MS), fourier transform ion cyclotron resonance-mass spectrometry (FTICR-MS)
matrix-assisted laser desorption/ionization (MALDI), ion mobility spectrometry (IMS) and nuclear
magnetic resonance (NMR) have speed up precise metabolic profiling in plants. Further, we
provide a complete overview of bioinformatics tools and plant metabolome database that can be
utilized to advance our knowledge to plant biology.
Keywords: analytical tools; data analysis; genetically modified crops; mass spectrometry;
metabolomics databases; metabolomics software tools; omics; plant biology
1. Metabolomics: Plant Biology Perspective
Metabolomics is one of the fastest developing and attractive disciplines of the omics
field, with huge potential and prospects in crop improvement programs. It is vital to
review the abiotic/biotic stress tolerances and metabolomics-assisted breeding of crop
plants [1]. Recent metabolomics platforms play a crucial role in exploring unknown
regulatory networks that control plant growth and development [1]. Further innovative
metabolomics application, called ecological metabolomics, deals with studying the
biochemical interactions among plants across different temporal and spatial networks
[2]. It describes the biochemical nature of various vital ecological phenomena, such as the
effects of parasite load, the incidence of disease, and infection. It also helps to decode the
potential impact of biotic and abiotic stresses on any critical biochemical process through
the detection of metabolites [1]. Modern metabolomics platforms are being exploited to
Citation: Patel, M.K.; Pandey, S.;
Kumar, M.; Haque, M.I.; Pal, S.,
Yadav N.S., Plants Metabolome
Study: Emerging Tools and
Techniques. Plants 2021, 10, 2409.
https://doi.org/10.3390/plants
10112409
Academic Editor: Atsushi
Fukushima, Jong Seong Kang and
Narendra Singh Yadav
Received: 7 July 2021
Accepted: 1 November 2021
Published: 8 November 2021
Publisher’s Note: MDPI stays
neutral with regard to jurisdictional
claims in published maps and
institutional affiliations.
Copyright: © 2021 by the authors.
Licensee MDPI, Basel, Switzerland.
This article is an open access article
distributed under the terms and
conditions of the Creative Commons
Attribution (CC BY) license
(http://creativecommons.org/licenses
/by/4.0/).

Plants 2021, 10, 2409 2 of 24
explain complex biological pathways and explore hidden regulatory networks
controlling crop growth and health.
The performance of metabolomics study relies on its methodologies and
instruments to comprehensively identify and measure each metabolite [3]. The
complexity of the various metabolic characteristics and molecular abundances makes
metabolomics a challenging task. Metabolomics or metabolite profiling terms are
alternatively used to define three types of approaches, such as untargeted metabolomics,
targeted metabolomics, and semi-targeted metabolomics [4,5]. Several integrated
technologies and methodologies such as mass spectrometry (MS) based methods,
including gas chromatography-mass spectrometry (GC-MS), liquid chromatography
mass-spectroscopy (LC-MS), capillary electrophoresis-mass spectrometry (CE-MS),
fourier transform ion cyclotron resonance-mass spectrometry (FTICR-MS)
matrix-assisted laser desorption/ionization (MALDI), ion mobility spectrometry (IMS)
and nuclear magnetic resonance (NMR) are used for large-scale analysis of highly
complex mixtures of plant extracts [6]. In fact, these analytical methods have shown their
potential in many plant species, including halophytes, medicinal plants, and food crops
such as Salicornia brachiata, Cuminum cyminum, Plantago ovata, Solanum lycopersicum, Oryza
sativa, Triticum aestivum, and Zea mays [7–14] (Table 1). In the last decade, a significant rise
in the use of integrated metabolomics analysis methods has been reported over
individual analytical platforms, as the latter does not provide holistic aspects of a plant
metabolome [3].
Since the beginning of the 21st century, major developments in various ‘omics’ fields,
such as genomics, transcriptomics, proteomics, metabolomics, and phenomics, have been
seen. The various omics platforms have an endless potential to enhance the current
understanding of complex biological pathways, allowing us to develop new approaches
for crops improvement [15]. Metabolomics is one of the most complex approaches among
other omics approaches and has received attention in agriculture science, especially for
plant selections in a molecular breeding program. Therefore, metabolomics is used to
acquire a vast amount of useful knowledge by accurate and high throughput peak
annotation through the snapshot of the plant metabolome for the novel genes and
pathways elucidation [16]. The combination of metabolomic integrated with
transcriptomic analysis was successfully used to find out several possible approaches
such as breeding and genome editing involved in activating metabolic pathways and
gene expression [17]. Nevertheless, plant metabolomics has become an effective tool for
exploring different aspects of system biology, greatly expanding our knowledge of the
metabolic and signaling pathways in plant growth, development, and response to stress
for improving the quality and yield of crops [18]. This review describes the plant
metabolome (primary and secondary metabolites), metabolomics in genetically modified
(GM) crops, including different analytical techniques, bioinformatics tools, and plant
metabolome database.
1.1. Primary Metabolites
Primary metabolites are essential for plant growth and development as they are
involved in various physiological and biochemical processes [15]. Primary metabolites
include different classes of metabolites such as sugars, fatty acids, and amino acids,
serving as vital functions such as osmolytes and osmoprotectants in plants under biotic
and abiotic stresses [4,19]. Lipidomics is the comprehensive analysis of lipids in a
biological system, including quantification and metabolic pathways. Alteration in lipid
metabolism and composition are linked to changes in plant growth, development, and
responses to a variety of environmental stressors [20]. Lipidomics can be divided into
shotgun and targeted analysis. Shotgun lipidomics identifies all lipid species in a sample
without prior knowledge of their composition, whereas targeted lipidomics analyzes a
specific group of lipids [21]. LC-MS has been used widely in both global and targeted
lipidomics [22–24]. Lipidomics is also utilized to understand better the function of genes

Plants 2021, 10, 2409 3 of 24
involved in lipid metabolism in transgenic plants and manipulate complex lipid
metabolism to produce long-chain fatty acids, especially omega-3 species in plants [25]. Yu et al. [26] utilized lipidomics analysis based on high-throughput and high-sensitivity
mass spectrometry to characterize membrane lipid responses, which also captures a
variety of oxidized lipids.
The nutritional markers α-linolenic acid and linoleic acid were detected in the leaves
of P. ovata [10]. Linoleic acid predominated in the husk of P. ovata, followed by oleic acid,
palmitic acid, stearic acid, and cis-11,14-eicosadienoic acid [10]. Seed fatty acid
composition analysis of the Paeonia rockii, P. potaninii, and P. lutea revealed that
α-linolenic acid was the most abundant, followed by oleic and linoleic acids [27].
According to the fatty acid content, all halophytes (non-succulent, succulent and shrubby
halophytes) are high in α-linolenic acid, followed by linolenic and palmitic acid [28]. Oil
and oleic acid content increased, while palmitic and linolenic acid content decreased
during seed development Jatropha curcas [29]. The total lipid and fatty acid levels were
strongly linked with the different developmental stages of the P. ovata fruit, according to
principal component analysis (PCA), and the heat map revealed the differential fatty acid
composition [9].
The highest content of threonine followed by glutamic acid, tyrosine, and aspartic
acid were quantified in Amaranthus hypochondriacus and it is notable that amino acids,
glutamic acid, and aspartic acid were among the main contributors [30]. The content of
histidine, isoleucine, leucine, threonine, and lysine in leaves was considerably higher
than in seeds and husks of P. ovata [10]. Glucose-6-phosphate, xylose, 2-piperidine
carboxylic acid, monoamidomalonic acid, tryptophan, phenylalanine, histidine and
carbodiimide were found to be key metabolites play a vital role in the plant metabolism
of Fritillaria thunbergii [31]. Furthermore, the amino acid profile of Cuminum cyminum
plants revealed that the levels of most amino acids (except asparagine) increased in
plants subjected to salinity stress when compared to control plants [8]. Under salinity
stress, two varieties of Cicer arietinum (Genesis 836 and Rupali) showed increased levels
of sugar alcohols, including galactitol, erythritol, arabitol, xylitol, mannitol, and inositol,
showing the importance of these metabolites in salt tolerance [32]. Nitric oxide-induced
accumulation of amino acids, sugars, polyols, organic acids, and but not fatty acids and
lipids in C. arietinum [33] (Table 1).
Table 1. Identification of key metabolites in various plant species using different analytical methods.
Plant Species Class Analytical Tools Key Metabolites Reference
Primary Metabolites
Plantago ovata Fatty
acids GC-MS α-linolenic acid, linoleic acid and palmitic acid [10]
P. ovata Fatty
acids GC-MS
Pentadecanoic acid, palmitic acid, heptadecanoic acid,
stearic acid, oleic acid, linoleic acid, γ-linolenic acid
and arachidic acid
[9]
Jatropha curcas Fatty
acids GC Oleic acid, palmitic acid and linolenic acid [29]
Paeonia rockii, P.
potaninii, and P.
lutea
Fatty
acids GC-MS α-linolenic acid, oleic acid and linoleic acid [27]
Cicer
arietinum
Fatty
acids GC-MS
Pentadecanoic acid, palmitic acid, palmitoleic acid,
stearic acid, oleic acid, linoleic acid, α-linolenic acid
and arachidic acid
[33]
P. ovata Amino
acids HPLC Isoleucine, threonine, leucine, histidine and lysine [10]
P. ovata Amino HPLC Aspartate, glutamine, glycine, alanine, arginine, [9]

Plants 2021, 10, 2409 4 of 24
acids serine, proline, isoleucine and methionine
Fritillaria
thunbergii
Amino
acids GC-MS Tryptophan, phenylalanine and histidine [31]
C.
arietinum
Amino
acids GC-MS
L-glutamic acid, L-tryptophan, phenylalanine,
glycine, serine, L-threonine, L-valine, L-ornithine and
L-proline
[33]
C.
arietinum
Sugars
and Sugar
alcohols
GC-MS Sucrose, cellobiose, galactose, methylgalactoside,
myo-inositol [33]
C.
arietinum
Sugar
alcohols GC-QqQ-MS
Galactitol, erythritol, arabitol, xylitol, mannitol and
inositol [32]
Secondary metabolites
Beta
vulgaris Terpenes HPLC-MS
Oleanolic acid, hederagenin, akebonoic acid and
gypsogenin [34]
Ocimum
gratissimum Terpenes GC-MS
m-chavicol, t-anethole, germacrene-D, naphthalene,
ledene, eucalyptol, azulene and comphore [35]
Mentha piperita Terpenes GC-MS Menthone, menthol, pulegone and menthofuran [36]
M.
arvensis Terpenes GLC
Menthol, isomenthone, L-methone and menthyl
acetate [37]
Achyranthes
bidentata Terpenes HPLC Oleanolic acid and ecdysterone [38]
Arabidopsis
thaliana Phenolics UHPLC-MS
Scopoletin, umbelliferone and esculetin, scopolin,
skimmin and esculin [39]
P. ovata Phenolics LC-MS Luteolin, quercetagetin, syringetin, kaempferol,
limocitrin, helilupolone and catechin [10]
P. ovata Phenolics LC-MS
Kaempferol
3-(2″,3″-diacetylrhamnoside)-7-rhamnoside and
apigenin 7-rhamnoside
[9]
P. ovata Alkaloids LC-MS Lunamarine, hordatine B and pinidine [10]
Dendrobium
Snowflake ‘Red
Star’
Alkaloids 1H and 2D NMR Dendrobine and nobilonine [40]
GC, gas chromatography; GC-MS, gas chromatography-mass spectrometry; GC-QqQ-MS, gas chromatography-triple
quadrupole-mass spectrometry; GLC, Gas liquid chromatography; HPLC, high-performance liquid chromatography;
HPLC-MS, high-performance liquid chromatography-mass spectrometry; LC-MS, liquid chromatography-mass
spectrometry; 1H-NMR, nuclear magnetic resonance; UHPLC-MS, ultra-high performance liquid chromatography-mass
spectrometry.
1.2. Secondary Metabolites
Secondary metabolites (SMs) play a crucial role in protecting plants against various
environmental stresses. It has been estimated that approximately 100,000 SMs have been
reported within different plant species and are classified into multiple groups,
nitrogen-containing compounds, terpenes, thiols, and phenolic compounds [41]. In
Scutellaria baicalensis, the major flavonoids are accumulated in the roots before the
full-bloom stage [42]. Two flavonoids, kaempferol
3-(2″,3″-diacetylrhamnoside)-7-rhamnoside and apigenin 7-rhamnoside were found in all
developmental stages of P. ovata [9]. The root of Achyranthes bidentata, oleanolic acid and
ecdysterone levels are increased during the vegetative growth than in reproductive
growth [38]. Nutraceutical flavonoids; luteolin, quercetagetin, syringetin, kaempferol,
limocitrin, helilupolone and catechin/epicatechin/pavetannin B2 and were identified in
leaf extract, whereas alkaloids, lunamarine and hordatine B were identified in the seed
extract and pinidine was detected in the husk extract [10]. The plant growth regulators

Plants 2021, 10, 2409 5 of 24
gibberellic acid (GA), indole -3-acetic acid (IAA) and 6-Benzylaminopurine (BAP) show
that the main terpenes (methyl chavicol and trans-anethole) and other terpenes
(eucalyptol and azulene) undergo certain changes depending on the type of the
treatment of plant growth regulators in O. gratissimum [35]. The application of growth
regulators enhances the production of essential oils (menthone, menthol, pulegone, and
menthofuran) in Mentha piperita, which is revealed to be rich in economically important
terpenes [36]. The foliar application of triacontanol significantly increased the amount of
active terpenes (menthol, L-methone, isomenthone, and menthyl acetate) in Mentha
arvensis [37]. Lin et al. [43] conducted a phytochemical screening of Pteris vittata and
identified four flavonoids: quercetin, kaempferol, kaempferol-3-O-D-glucopyranoside
and rutin [43]. Scoploletin, umbelliferone and esculetin, as well as their glycosides
scopolin, skimmin, and esculin were found in Arabidopsis thaliana [39] (Table 1).
2. Involvement of Metabolomics in Genetically Modified (GM) Crops
Metabolomic techniques are rapidly being used to analyze genetically modified
organisms (GMOs), allowing for a broader and deeper understanding of composition of
GMO than standard analytical methods. Metabolomics studies revealed that malic acid,
sorbitol, asparagine, and gluconic acid levels increased in O. sativa cultivated at different
time points. In addition, mannitol, sucrose, and glutamic acid had a significant increase
in transgenic rice grains as compared to non-genetically modified rice [44]. Metabolic
profiling was performed in Solanum tuberosum DREB1A transgenic lines rd29A::DREB1A
(D163 and D164), a 35S::DREB1A (35S-3) line, and non-transgenic [45]. Increased levels of
the glutathione metabolite, γ-aminobutyric acid (GABA), as well as accumulation of
β-cyanoalanine, a byproduct of ethylene biosynthesis, were observed in the DREB1A
transgenic lines [45] (Table 2).
Table 2. Identification of important metabolites in transgenic plants using different analytical tools.
Transgenic
Plants
Analytical
Techniques Key Metabolites References
Artemisia annua GC-TOF-MS Borneol, phytol, β-farnesene, germacrene D, artemisinic acid,
dihydroartemisinic acid, and artemisinin [46]
Lactuca
sativa NMR
Asparagine, glutamine, valine, isoleucine, α-chetoglutarate,
succinate, fumarate, malate, sucrose, and fructose [47]
Lycopersicon
esculentum GC-MS
γ-aminobutyric acid, histidine, proline, pyrrol-2-carboxylate,
galactitiol/sorbitol, glycerol, maltitol, 3-phosphoglyceric acid,
allantoin, homo-cystine, caffeate, gluconate, ribonate, lysine,
threonine, homo-serine, tyrosine, tryptophan, leucine, arginine
and valine
[48]
Nicotiana tabacum NMR
Chlorogenic acid, 4-O-caffeoylquinic acid, malic acid, threonine,
alanine, glycine, fructose, β-glucose, α-glucose, sucrose, fumaric
acid and salicylic acid
[49]
N. tabacum GC-MS
4-Aminobutanoic acid, asparagine, glutamine, glycine, leucine,
phenylalanine, proline, serine, threonine, tryptophan, chlorogenic
acid, quininic acid, threonic acid, citric acid, malic acid and
ethanolamine
[50]
Oryza sativa GC-MS
Glycerol-3-phosphate, citric acid, linoleic acid, oleic acid,
hexadecanoic acid, 2,3-dihydroxypropyl ester, sucrose,
9-octadecenoic acid, 2,3-dihydroxypropyl ester, sucrose, mannitol
and glutamic acid
[44]
O. sativa LC-MS
Tryptophan, phytosphingosine, palmitic acid,
5-hydroxy-2-octadenoic acid 9,10,13-trihydroxyoctadec-11-enoic
acid and ethanolamine
[51]

Plants 2021, 10, 2409 6 of 24
Populus GC-MS, HPLC
Caffeoyl and feruloyl conjugates, syringyl-to-guaiacyl ratio,
asparagine, glutamine, aspartic acid, γ-amino-butyric acid,
5-oxo-proline, salicylic acid-2-O-glucoside, 2, 5-dihydroxybenzoic
acid-5-O-glucoside, 2-methoxyhydroquinone-1-O-glucoside,
2-methoxyhydroquinone-4-O-glucoside, salicin, gallic acid, and
dihydroxybenzoic acid
[52]
Solanum
tuberosum LC-TOF-MS
Glutathione, γ-aminobutyric acid, β-cyanoalanine, 5-oxoproline,
sucrose, glucose-1-phosphate, glucose-6-phosphate,
fructose-6-phosphate, ethanolamine, adenosine, and guanosine
[45]
Triticum aestivum GC-MS Guanine and 4-hydroxycinnamic acid [53]
T. aestivum LC-MS
Aminoacyl-tRNA biosynthesis, phenylalanine, tyrosine,
tryptophan glyoxylic, tartaric acid, oxalic acids, sucrose, galactose,
mannitol, leucine, valine, glutamate, proline, pyridoxamine,
glutathione, arginine, citrulline, adenosine, hypoxanthine,
allantoin, and adenosine monophosphate
[54]
Zea mays 1H NMR Lactic acid, citric acid, lysine, arginine, glycine-betaine, raffinose,
trehalose, galactose, and adenine [55]
GC-MS, gas chromatography-mass spectrometry; GC-TOF-MS, gas chromatography-time of flight-mass spectrometry;
HPLC, high-performance liquid chromatography; LC-MS, liquid chromatography-mass spectrometry; LC-TOF-MS,
liquid chromatography-time of flight-mass spectrometry; 1H-NMR, nuclear magnetic resonance.
Metabolomic profiling also demonstrated that introduction of the cold and drought
regulatory-protein encoding CORA-like gene (SbCDR) from S. brachiata into tobacco could
enhance salt and drought tolerance by increasing the stress related metabolites such as
proline, threonine, valine, glyceric acid, fructose, 4-aminobutanoic acid, asparagine [50].
Overexpression of a native UGPase2 gene induced several metabolites related to amino
acid, phenolic glycosides such as asparagine, γ-amino-butyric acid, aspartic acid,
glutamine, 5-oxo-proline, 2-methoxyhydroquinone-1-O-glucoside,
2-methoxyhydroquinone-4-O-glucoside, salicylic acid-2-O-glucoside,
2,5-dihydroxybenzoic acid-5-O-glucoside, salicin in transgenic Populus lines [52].
Overexpression of GmDREB1 in T. aestivum substantially impacts numerous metabolic
pathways involved in the biosynthesis of amino acids [54]. Tryptophan, leucine
phenylalanine, valine, and tyrosine were significantly changed [54]. Some urea
cycle-related metabolites, such as adenosine, arginine, allantoin, citrulline, adenosine
monophosphate (AMP), hypoxanthine, and guanine, were significantly changed in the
transgenic T. aestivum line [54]. The combination of modern analytical methodologies and
bioinformatics tools in metabolomics provides extensive metabolites data that helps to
confirm the significant equivalency and incidence of unanticipated alterations caused by
genetic transformation (Table 2).
3. Significance of Sample Preparation in Plant Metabolites
In plant metabolomics study, plant samples are harvested, stored, metabolites
extraction and quantification, followed by data interpretation. Sample preparation is a
key step in plant metabolomics as it significantly changes the quantity of the metabolites.
Thus, considering all the factors, harvesting and storage of plant samples should be quick
as to reduce the changes of biochemical reaction in the plant cells [56]. Inappropriate
handling during the sample collection is the most likely source of bias in plant
metabolomic studies [57]. Sample harvesting, storage, and extract preparation should
ideally follow the Metabolomics Standards Initiative (MSI) to justify plant metabolomics
studies [58].
Plants 2021, 10, 2409 7 of 24
3.1. Sample Harvesting and Storage
Commonly, four major steps are involved in plant metabolomics; harvesting,
storage, extraction, and sample analysis (Figure 1). Plant sample harvesting must be
carried out with caution, as the metabolome of the plant is sensitive to enzymatic
reactions that can degrade different metabolites. In addition, metabolites vary with the
different development stages, plant age, and time of sample harvesting [6]. Mostly, 10–
100 mg of plant samples are required for each biological sample in metabolomics studies.
Usually, immediately after harvesting, the plant samples are snap-frozen in liquid
nitrogen to prevent metabolic changes. Similarly, various storage techniques, such as
freeze-drying, oven-drying, and air-drying, are essential for the processing of
metabolomics [57,59].
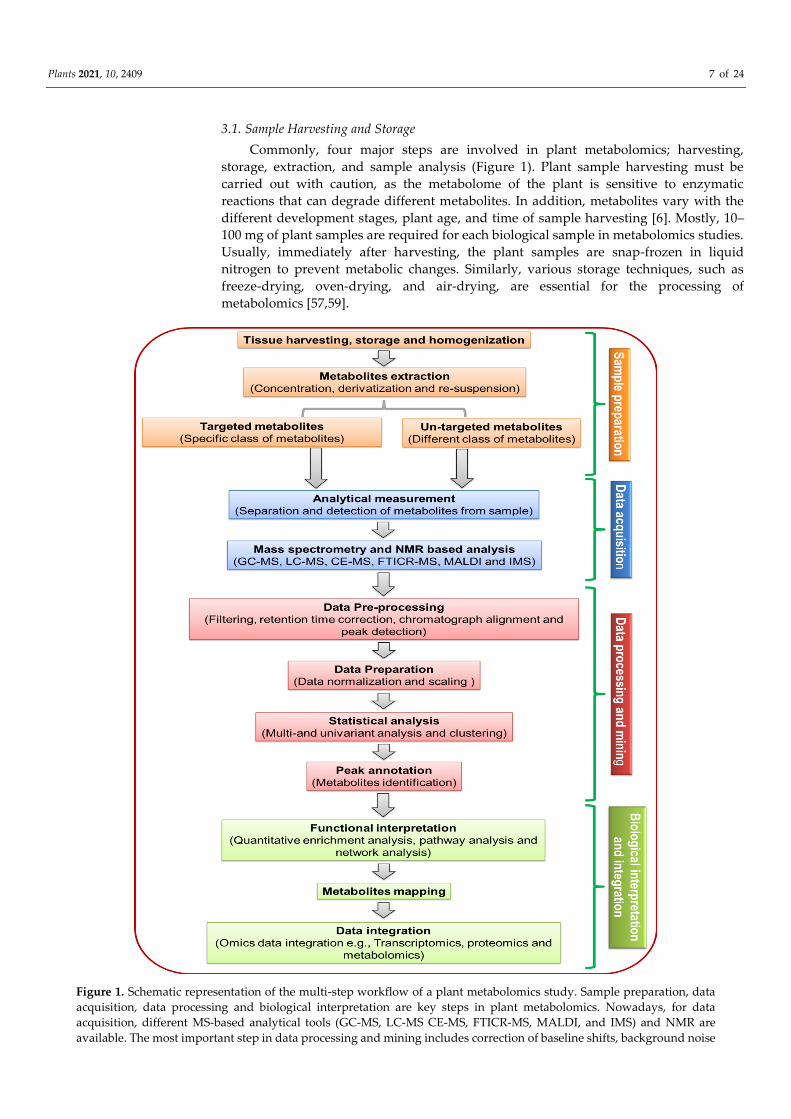
Figure 1. Schematic representation of the multi-step workflow of a plant metabolomics study. Sample preparation, data
acquisition, data processing and biological interpretation are key steps in plant metabolomics. Nowadays, for data
acquisition, different MS-based analytical tools (GC-MS, LC-MS CE-MS, FTICR-MS, MALDI, and IMS) and NMR are
available. The most important step in data processing and mining includes correction of baseline shifts, background noise

Plants 2021, 10, 2409 8 of 24
reduction, chromatograph alignment and peaks detection. Biological interpretation and integration include enrichment
analysis, networks, and pathways analysis for a comprehensive scope of the metabolome. GC-MS, gas
chromatography-mass spectrometry; IMS, ion mobility spectrometry; LC-MS, liquid chromatography
mass-spectroscopy; CE-MS, capillary electrophoresis-mass spectrometry; FTICR-MS, fourier transform ion cyclotron
resonance-mass spectrometry; MALDI, matrix-assisted laser desorption/ionization; NMR, nuclear magnetic resonance.
3.2. Sample Preparation
Sample preparation plays a key role in metabolomic study, as it includes the
extraction of metabolites using different extraction methods (Figure 1). Among the
extraction methods, quenching, mechanical and ultrasound extraction methods are
promising in the metabolomic analysis [60]. In addition, high quality, yield and chemical
versatility can be obtained by integrating ultrasound extraction method and mechanical
grinding [61]. Apart from extraction methods, the choice of solvents is also crucial, as a
single solvent cannot extract a variety of metabolites (e.g., polar or nonpolar). A wide
variety of metabolites can be isolated using a solvent system composed of chloroform:
methanol: water [62,63]. This solvent system is widely used for a wide variety of
metabolites such as polar compounds, nonpolar compounds, and hydrophilic
metabolites. Diverse solvent systems were reported for the plant metabolomics, such as extraction with pure methanol [64,65], the mixture of methanol: water [66], and
methanol: methyl-tert-butyl-ether: water [67]. A specific solvent gradient extraction
method was developed to recover almost all types of metabolites in a single protocol [68].
In addition, hot methanol (70% v/v) was used to extract phenolic compounds from
Brassica oleracea using ultra-high-performance liquid chromatography–diode array
detector–tandem mass spectrometry [69]. Various methods are used for sample
preparation, such as microwave-assisted extraction [70], ultrasound-assisted extraction
[71], Swiss rolling technique [72], and enzyme-assisted extraction [73].
Targeted metabolite identification and quantification are the primary approaches for
metabolomics investigation [74]. Sample preparation for target metabolites extracted
from plant components such as leaves, stems, roots, etc., includes enrichment for
metabolites of interest and removal of contaminants such as proteins and salts that
hamper the analysis. Targeted metabolomics-based quantification aims for enhanced
metabolite coverage by analyzing the selected metabolites [75]. The targeted metabolites
extracted using different extraction methods such as different proportion of organic
solvents [67], liquid–liquid extraction [75], and solid phase extraction method [76]. To
increase analytical reliability, single or multiple internal standards can be spiked into the
sample mixture during sample preparation [77]. In the final step of sample preparation
for LC-MS, the solvents were evaporated, followed by re-dissolving the sample with a
suitable solvent for LC-MS analysis [75]. Targeted metabolite quantification has been
considered as the key method because of its reliable quantification accuracy, sensitivity
and stability [78]. However, this method is typically confined to measuring a small
number of known pre-selected analysts and is incapable of detecting unknown and novel
metabolites. LC-multiple reaction monitoring (MRM)-MS approach has been employed
for targeted metabolomics quantification analysis due to its rapid scan speed and good
analytic stability [79]. New techniques have been developed to broaden the choices for
targeted metabolomics research, using high-resolution equipment such as parallel
reaction monitoring (PRM) [78]. In plant metabolomics, new extraction methods are also
developing day by day in line depending on the nature of the compounds and selection
of analytical systems.
4. Analytical Techniques Used for Plant Metabolome
Along with sample preparation, different MS-based analytical systems are available
for data acquisition. In plant metabolomics, single analytical tools cannot be used to
identify all the metabolites present in a sample; instead, a set of various techniques are
needed to provide the largest amount of metabolite coverage [1]. Various metabolomics

Plants 2021, 10, 2409 9 of 24
tools include MS-based techniques, namely GC-MS, LC-MS CE-MS, FTICR-MS MALDI,
IMS, and NMR for sensitive and specific qualitative and quantitative analyses of
metabolites (Figure 1) [6,80]. All seven mentioned analytical methods identifying
metabolites in plant tissue directly or indirectly have advantages and disadvantages
(Table 3). Also, the combination of analytical methods can be used to ensure the efficacy
of metabolite profiling.
Table 3. Advantages and disadvantages of common analytical techniques used in MS-based and NMR metabolomics.
Analytical Method Advantage Disadvantage
GC-MS
• Suitable for the identification of thermally stable and
volatile compounds
• Large commercial and public libraries
• Identification of low molecular weight metabolites
(~500 daltons)
• Sample pre-processing process and requires
derivatization
• Many metabolites are thermally unstable or
unsuitable for non-volatile compounds
LC-MS
• Easy sample preparation
• No derivatization
• Several separation modes are available
• Multiple MS detectors
• Large number of detectable metabolites
• Few commercial libraries
• Adduct ions are needed for metabolites detection
CE-MS
• Evaluating ionic metabolites based on the proportion
of charge and size ratio
• Fast and high-resolution of charged compounds
• No derivatization
• Low sensitivity and reproducibility
• Poor migration time and lack of reference
libraries
FTICR-MS • Mass resolving power
• Mass accuracy and dynamic range
• Expensive
• Lack of detection for non-ionizable compounds
• Slow MS/MS
MALDI-MSI
• Quantification by peak intensities
• Resolution up to 10 µm
• Direct on tissue identification by tandem–MS
fragmentation
• Mass range up to 20 kDa
• Unsuitable for higher molecular mass compound
• Expensive equipment to purchase
• Time consuming
• Limited by size of the metabolites
IMS
• Ion fragmentation with high versatility
• Gold standard CCS values
• High resolution; IMSn (Ion mobility spectrometry)
• Low ion mobility resolution
• Resolution depends on the number of passes
• Mass range depends on ion mobility resolution
NMR
• Precise quantification and reproducibility
• Simple steps of sample preparation
• Separation is not required.
• Provide detailed information about the structure of
known and undiscovered metabolite
• Acceptable with liquids and solids samples
• Expensive cost of instrument
• Low sensitivity
• Inadequate bioinformatics platform
• A large amount of sample is required.
• Spectral analysis is a tough and time-consuming
process.
4.1. Gas Chromatography-Mass Spectrometry (GC-MS)
GC-MS is an ideal technique for the identification and quantification of small
metabolites (~500 Daltons). These molecules include amino acids, fatty acids, hydroxyl
acids, alcohols, sugars, sterols, and amines, which are identified mostly using chemical
derivatization to make them volatile enough for gas chromatography [81]. Moreover,
different methods of derivatization, such as alkylation, acylation, methoximation,
trimethylsilylation, and silylation, can also be used. Two derivatization steps are
required for the extraction and identification of metabolites using GC-MS. The first step
requires the conversion of all the carbonyl groups using methoxyamine hydrochloride
into corresponding oximes. The seconnhd step is followed by a trimethylsilylation
reaction to increasing the volatility of the derivative metabolites using derivatizing
reagents such as N-Methyl-N-(trimethylsilyl) trifluoroacetamide (MSTFA) and
N,O-bis-(trimethylsilyl)-trifluoroacetamide (BSTFA) [82–84]. In this procedure, the
hydrogen is replaced from the -NH, -SH, -OH and -COOH of specific metabolites with

Plants 2021, 10, 2409 10 of 24
[-Si(CH3)3] and are converted into thermally stable, less polar and volatile trimethylsilyl
(TMS)-ether, TMS-ester, TMS-amine, or TMS-sulphide groups, respectively [83]. Also,
GC-MS is the preferable chromatographic technique for identifying low molecular
weight compounds that are either volatile or can be converted into volatile and thermally
stable metabolites by chemical derivatization prior to analysis [85]. The technique
includes primary metabolites such as sugars, fatty acids, amino acids, long-chain
alcohols, amines, organic acids, and sterols.
There are two major forms of ionization used in GC-MS that comprises of electron
ionization (EI) and chemical ionization (CI). Till now, the majority of GC-MS methods in
metabolomics utilize EI. GC with EI detector equipped with single quadrupole (Q) mass
analyzer is the oldest and most advanced analytical tool with robustness, high sensitivity,
resolution and reproducibility, but suffers from sluggish scanning speeds and also poor
mass accuracy (~50–200 ppm). Therefore, GC with a time-of-flight mass spectrometry
(TOF-MS) analyzer is more preferred for metabolic profiling as it provides higher mass
accuracy, faster acquisition times, and improved deconvolution for complex mixtures
[86]. Among all metabolomics techniques, GC-MS is one of the most standardized,
efficient, productive technique in plant metabolomics and it is considered a most
versatile platform for metabolites analysis [87]. In addition, GC-MS has the availability of
the huge number of well-established libraries of both commercial and in-house
metabolite databases [88–90]. Metabolite profiling is utilized as an essential tool for
screening of GM crops with regard to quality and health requirements and in
categorization to an investigation of potential changes in metabolic contents, e.g., T.
aestivum [53], O. sativa [44], and Z. mays [91].
4.2. Liquid Chromatography-Mass Spectrometry (LC-MS)
LC-MS is one of the most comprehensive analytical techniques in plant metabolome
research, which is used to measure a wide variety of complex metabolites. The LC-MS
approach is appropriate for high molecular weight (>500 kDa) plant metabolites,
heat-labile functional groups, chemically unstable functional groups, and
high-vapor-point. It does not require volatilization of the metabolites. LC-MS is also quite
effective techniques in profiling of SMs (e.g., alkaloids, phenolics, flavonoids and
terpenes), lipids (e.g., phospholipids, sphingolipids and glycerolipids) and sterols, and
steroids [19,24,92,93].
LC-MS can also be used with various ionization methods and depending on the
choice of specific separating columns based on the chemical characteristics of both mobile
and stationary phases [94]. Currently, reverse-phase columns such as C18 or C8 are the
most widely used columns for LC gradient separation. In reverse-phase separations,
organic solvent/aqueous mixed mobile phases are often used, such as water: acetonitrile
or water: methanol. Atmospheric pressure ionization (API) and electron spray ionization
(ESI) are the most widely used ionization tools for LC-MS [94,95]. ESI and API have
provided limited structural information of the compound because they introduce less
internal energy and produce only a few fragments [95]. Structural information is
typically obtained by number of fragments using collision-induced dissociation (CID) on
tandem MSn. Commonly, two tandem MSn analytical tool configurations are commonly
available with the LC-MS-based metabolite analysis: tandem-in-time and
tandem-in-space. The ion trap MS is used by tandem-in-time instruments, such as
quadruple ion traps (QIT-MS), FTICR-MS and orbitrap. The tandem-in-space tool
facilitates two sequential steps of mass spectrometric analysis (MS2); it includes two mass
analyzers separated by a collision cell [96,97]. Although LC-MS requires standard
reference compounds to identify and quantify SMs, this restricts the analysis of
metabolites that are not commercially available [98,99].

Plants 2021, 10, 2409 11 of 24
4.3. Capillary Electrophoresis-Mass Spectrometry (CE-MS)
CE-MS is a strong analytical technique for evaluating a large variety of ionic
metabolites based on the proportion of charge and size ratio [93]. It provides fast and
high-resolution of charged compounds from small injection volumes and enables the
metabolites characterization based on mass fragmentation [57]. The coverage of CE-MS
metabolites majorly overlaps with GC-MS, but requires no derivatization, thus this
technique save time and consumables. CE is performed in a fused silica capillary tube,
the ends of which are dipped in buffer solutions and across which high voltages (20–30
kV) are employed [84]. Furthermore, CE has low sensitivity and reproducibility, poor
migration time and lack of reference libraries; therefore, it is the least appropriate
platform for studying metabolites from complex plant samples [100,101]. However, CE
has some distinct rewards over other metabolomics tools; primarily the fact that it uses
low volume of separation, which is especially appropriate for the study of plant
metabolome [57,102].
4.4. Fourier Transform ion Cyclotron Resonance-Mass Spectrometry (FTICR-MS)
FTICR-MS provides the highest resolving power and mass accuracy among all kinds
of mass spectrometry [103]. Its specific analytical features have made FTICR an important
technique for proteomics and metabolomics. The ability of FTICR–MS to provide
ultimate high resolution and high mass accuracy data is now frequently used as part of
metabolomics procedures [84]. It’s also well compatible with multi-stage mass
spectrometry (MSn) analyzers. However, the instrument associated with a high magnetic
field, complex ion-ion interactions and high cost are major barriers to its widespread
application and use in plant metabolomics studies [56].
4.5. Matrix-Assisted Laser Desorption/Ionization (MALDI)
Recently, the applications of MALDI-Mass Spectrometry Imaging (MSI) and other
MSI tools use a non-target approach for the qualitative or quantitative imaging of a broad
variety of metabolites [104]. In plants, many studies have used MALDI-MSI to assess the
spatial distribution of lipids, sugars and other classes of metabolites from plant parts
such as flowers, leaves and roots [105,106]. In addition, MALDI-MSI has permitted the
simultaneous analysis of the distribution of many peptides and proteins actively from a
plant tissue section. This method involves coating a thin film of a matrix comprising
either sinapinic acid, α-Cyano-4-hydroxycinnamic acid (CHCA) and
2,5-dihdroxybenzoic acid (2,5-DHBA) on the tissue surface. At each stage, a laser beam is
inserted across the matrix-coated tissue to obtain a mass spectrum. For
protein/metabolites imaging, MALDI is the most used method of ionization, combined
with a wide variety of different mass analyzers, namely ToF, ToF-ToF, QqToF
(quadrupole time of flight), Fourier ICR transform (FT-ICR), and ion-trap (both linear
and spherical). All of these have their own merits and have previously been addressed
and reviewed [107]. Other different ionization techniques such as secondary ion mass
spectrometry (SIMS), desorption electrospray ionization (DESI) and laser ablation
electrospray ionization (LAESI) have been also investigated [108].
4.6. Ion Mobility Spectrometry (IMS)
Ion mobility spectrometry (IMS), which separates gas ions based on their
size-to-charge ratio, has become a robust separation method. IMS has been widely
employed in a variety of research fields ranging from environmental to pharmaceutical
applications [109–114]. The use of ion mobility has gained significance in bioanalysis due
to the potential improvement of the sensitivity and the ability of the technique to
distinguish highly related molecules based on conformational differences of molecules
[115]. The IMS-derived collision cross-section indicates the effective area for the
interaction between a particular ion and gas through which it travels [116]. Initially, IMS

Plants 2021, 10, 2409 12 of 24
was utilized largely as a stand-alone technique; however, in recent years, the IMS
coupling with MS (IMS-MS) has developed rapidly into a robust and extensively used
separation technique with applications in many fields across the biological sciences,
including the glycosciences [117]. IMS-MS developed quickly into a ready-to-use
technique that became commercially accessible, particularly for glycan analysis [118]. The
biological applications of IMS-MS for biomolecules include the analysis of
oligonucleotides carbohydrates, steroid, lipids, peptides, and proteins [119–123].
Furthermore, IMS-MS may be hyphenated with front-end liquid chromatography (LC)
separation to increase peak capacity and separation capabilities [123]. LC–IMS-MS
technique has numerous significant benefits over other technologies in terms of increased
peak capacity, isomer separation, and metabolite identification [123,124].
IMS-MS derived collision cross-section (CCS) value is high reproducible
characteristic of metabolite ion, allowing for metabolite identification [125]. Therefore,
the most essential aspect of metabolite identification in IMS-MS is the curation of the CCS
database. Many in silico CCS databases, such as LipidCCS [126], MetCCS [127], and
ISiCLE [128], have been curated and include over one million CCS values. Zhou et al.
[129] developed the ion mobility new CCS atlas, namely, AllCCS for metabolite
annotation using known or unknown chemical structures [129]. The AllCCS atlas
included a wide range of chemical structures with >5000 experimental CCS records and
~12 million predicted CCS values for >1.6 million chemical molecules [129]. McCullagh et
al. [130] used the TWCCSN2 library to screen the steviol glycosides in 55 food
commodities. Schroeder et al. [131] identified 146 plant natural compounds, 343 CCS
values, and 29 isomers annotated (various flavonoids and isoflavonoids) in Medicago
truncatula based on CCS, retention time, accurate mass, and molecular formula. The
combination of a large-scale CCS database and different MS/MS spectra will assist in the
discovery of new metabolites.
4.7. Nuclear Magnetic Resonance (NMR)
NMR is another popular analytical tool for investigating the varied metabolome in
plants, involving the structure, content, and purity of molecules in the sample. As a
result, metabolic profiling can provide qualitative and quantitative data from biological
extracts [132]. The basic principle of NMR-based metabolite identification is to capture
the radio frequency electromagnetic radiations emitted by atomic nuclei that have an odd
atomic number (1H) or an odd mass number (13C) when placed in a strong magnetic field.
Because there is no requirement for chromatographic separation or sample
derivatization, the use of NMR has grown dramatically in recent years [94,133,134].
Furthermore, easy sample preparation procedures and excellent repeatability,
non-destructive nature enables high throughput and quick analysis in NMR
metabolomics but has less sensitivity than MS [135,136]. NMR is pH sensitive, buffered
solutions are usually needed to keep the pH stable. A combination of methanol and
aqueous phosphate buffer (pH 6.0, 1:1 v/v) or ionic liquids such as
1-butyl-3-methylimidazolium chloride has been shown to be the most effective in
providing a comprehensive overview of both primary and secondary metabolites [137]. 1H NMR is quick and easy, it has been the leading metabolites profiling technique, but it
suffers from signal overlapping in the complex mixture of plant extracts during
metabolites profiling. However, other advanced 2D NMR-based techniques includes
two-dimensional (2D) 1H J-resolved NMR, heteronuclear single quantum coherence
spectroscopy (HSQC), heteronuclearmultiple quantum coherence (HMBC), total
correlation spectroscopy (TOCSY) and nuclear overhauser effect spectroscopy (NOESY)
[137]. High-resolution magic angle spinning (HRMAS)-NMR is particularly well suited
for solid lyophilized tissue without the need for chemical extraction, which is essential
for both MS and liquid state NMR practices [86]. The acquisition time for 2D NMR (2D
J-resolved spectroscopy) is around 20 min, whereas for one-dimensional (1D) NMR it is
approximately 1 min. However, due to the dispersion of the resonance peaks in a second

Plants 2021, 10, 2409 13 of 24
dimension, spectral overlapping can be reduced in 2D NMR J-resolved spectroscopy to
detect signals in crowded spectral regions [138]. Using advanced NMR, glycine-betaine,
citric acid, trehalose and ethanol levels were higher in Cry1Ab gene transformed maize
plants than non-transgenic maize plants showed [55]. Transgenic maize plants showed
lower levels of pyruvic, isobutyric, succinic, lactic, and fumaric acids than
non-transgenics [55]. During seed germination in chickpea, the exogenous uptake of
glucose in presence of nitric oxide donor was quantified by using 1H-NMR [33].
5. Metabolomic Data Processing, Annotation, Database and Bioinformatics Tools for
Plants METABOLOME Analysis
GC-MS, LC-MS CE-MS, FTICR-MS MALDI, IMS and NMR are perhaps the most
important techniques within the context of natural product discovery. Metabolomics
generate a huge amount of metabolic data using wide range of analytical instruments.
During the last decade, different software tools (web-based programs) have been
designed for metabolomics raw data processing, data mining, data assessment, data
interpretation, and statistical analysis as well as mathematical modelling of metabolomic
networks (Figure 1).
5.1. Data Processing and Annotation
Several software programs are available for in silico data analysis of a large quantity
of spectrum data of metabolites generated by various analytical instruments. The
web-based programs were used for raw data processing, mining, and integration of
metabolites. In general, acquired data is processed for the correction of baseline shifts,
background noise reduction, peak detection and alignment, and finally, deconvolution of
mass spectra (Figure 1, Table 4). Many bioinformatic tools are designed for the data
pre-processing, including XCMS (https://xcmsonline.scripps.edu, accessed on 29 June
2021), METLIN (http://metlin.scripps.edu, accessed on 29 June 2021) AMDIS (Automated
Mass Spectral Deconvolution and Identification System), MeltDB, MetaboAnalys,
MetAlign, MZmine 2, and AnalyzerPro for different analytical techniques (Table 1).
XCMS is an online bioinformatics platform that facilitates the direct uploading of raw
data and assists the user in data processing and statistical analysis [139]. For LC-MS
experiments, XCMS has been developed for programmed data transfer that has reduced
data processing time and improved the effectiveness of an online system [140]. METLIN
is another online database, which has been used in various studies related to plant
metabolic profiling of stress response. It is useful for plant metabolic profiling of specific
metabolites, and it is not time-consuming for data processing, mining, and annotation
[141].
MeltDB (https://meltdb.cebitec.uni-bielefeld.de, accessed on 29 June 2021) is an
important web-based platform used for data assessment, processing, and statistical
analysis in plant metabolomics [142]. In addition, MetaboAnalyst online platform also
includes a flexible enrichment analysis tool including some topological and visualization
possibilities [143]. Global natural product social molecular networking (GNPS;
http://gnps.ucsd.edu, accessed on 29 June 2021) is web-based mass spectrometry
(MS/MS) for processing and annotation of metabolites [144]. GNPS assists with the
identification and discovery of metabolites throughout the data, from data
acquisition/analysis to post-publication [144]. Finally, the MZmine 2 is a publicly
accessible data processing module that supports high-resolution spectral analysis.
MZmine 2 is suitable for both targeted and non-targeted metabolomic studies, and it is
well suited for processing large batches of data [145]. Various computational web-based,
statistical and online bioinformatics tools are commonly used for data analysis in plant
metabolomics (Table 4).

Plants 2021, 10, 2409 14 of 24
Table 4. Available/accessible bioinformatics and statistical tools for metabolite identification.
Database
Name Website (URL, Accessed on 29 June 2021) Data Input
Major
Function
Referen
ce
ADAP http://www.du-lab.org/software.htm/ GC/TOF-M
S
Data
processin
g
[146]
AllCSS http://allccs.zhulab.cn/ DTIM-MS
TWIM-MS
Metabolite
prediction
and
annotatio
n
[129]
AMDIS http://www.amdis.net/ GC-MS
Data
processin
g
[147]
BinBase
http://fiehnlab.ucdavis.edu/db
or
https://fiehnlab.ucdavis.edu/projects/binbase-setup
GC-MS
Metabolite
annotatio
n
[148]
FiehnLib
http://fiehnlab.ucdavis.edu/db
or
https://fiehnlab.ucdavis.edu/projects/fiehnlib
GC-qTOF-
MS
Metabolic
profiling [149]
GMDB https://jcggdb.jp/rcmg/glycodb/Ms_ResultSearch MALDI-T
OF
Metabolite
annotatio
n
[150]
GNPS https://gnps.ucsd.edu/ProteoSAFe/static/gnps-splash.jsp GC-MS-EI
LC-MS
Data
processin
g,
visualizati
on and
metabolite
annotatio
n
[144]
KEGG http://www.genome.jp/kegg/ -- Metabolic
models [151]
KNApSAcK http://kanaya.naist.jp/KNApSAcK/ FT/ICR-MS Metabolite
database [152]
MarVis http://marvis.gobics.de/ LC-MS
Metabolite
annotatio
n
[153]
MassBase http://webs2.kazusa.or.jp/massbase/ MS
Metabolite
annotatio
n
[154]
MAVEN https://maven.apache.org/ LC-MS
Data
processin
g
[155]
MeltDB 2.0 https://meltdb.cebitec.uni-bielefeld.de GC-MS &
LC-MS
Data
processin
g
[142]
MetaboAnal
yst www.metaboanalyst.ca/
GC-MS &
LC-MS
Statistical
analysis [156]
Metabolome
Express https://www.metabolome-express.org GC-MS
Data
processin
g,
visualizati
on and
statistical
analysis
[157]

Plants 2021, 10, 2409 15 of 24
MetaboSear
ch http://omics.georgetown.edu/metabosearch.html MS
Data
annotatio
n
[158]
Metabox https://github.com/kwanjeeraw/metabox MS Analysis
workflow [159]
MetAlign www.metalign.nl GC-MS &
LC-MS
Data
processin
g &
Statistical
analysis
[160]
metaP-serve
r http://metabolomics.helmholtz-muenchen.de/metap2/ LC-MS/MS
Data
analysis [161]
MetAssign http://mzmatch.sourceforge.net/ LC-MS
Data
annotatio
n
[162]
MetFrag https://ipb-halle.github.io/MetFrag/ MS
Metabolite
annotatio
n
[163]
MET-IDEA http://bioinfo.noble.org/gateway/index.php?option=com_wrapper&Itemid=57 GC-MS &
LC-MS
Data
processin
g
[164]
MetiTree http://www.metitree.nl/ MS
Data
annotatio
n
[165]
METLIN https://metlin.scripps.edu/ LC-MS &
MS/MS
Metabolite
annotatio
n
[141]
MMCD
http://mmcd.nmrfam.wisc.edu/
or
https://www.g6g-softwaredirectory.com/bio/metabolomics/dbs-kbs/20670-Univ-Madiso
n-WI-MMCD.php
MS
Metabolite
annotatio
n
[166]
Molfind http://metabolomics.pharm.uconn.edu/Software.html HPLC/MS
Metabolite
annotatio
n
[167]
Mzcloud https://www.mzcloud.org/ MS/MS &
MSn
Metabolite
annotatio
n
[168]
MZedDB http://maltese.dbs.aber.ac.uk:8888/hrmet/index.html MS
Data
annotatio
n
[169]
MZmine2 http://mzmine.github.io/ LC-MS
Data
processin
g
[145]
NIST
http://www.nist.gov/srd/nist1a.cfm
or
https://www.nist.gov/srd/nist-standard-reference-database-1a
GC-MS,
LC-MS &
MS/MS
Metabolite
annotatio
n
[170]
PRIMe http://prime.psc.riken.jp/
GC-MS,
LC-MS &
CE-MS
Metabolite
annotatio
n
[171]
XCMS https://xcmsonline.scripps.edu
GC-MS,
LC-MS &
MS2
Data
processin
g
[139]
CE-MS, capillary electrophoresis-mass spectrometry; DTIM-MS, drift tube ion mobility–mass spectrometry; EI,
electrospray ionization; FTICR-MS, fourier transform ion cyclotron resonance-mass spectrometry; GC-TOF-MS, gas
chromatography-time of flight-mass spectrometry; GC-MS, gas chromatography-mass spectrometry; HPLC,

Plants 2021, 10, 2409 16 of 24
high-performance liquid chromatography; LC-MS, liquid chromatography-mass spectrometry; MALDI-TOF,
matrix-assisted laser desorption/ionization- time of flight; TWIM-MS, traveling wave ion mobility–mass spectrometry.
5.2. Network Analysis
The basic goal of pathway analysis is to combine biochemical information with
collected metabolomics data to recognize metabolite patterns that match with metabolic
pathways [172]. It is possible to consider metabolic pathways as groups of metabolites
that share a common biological process and are related by one or more enzymatic
reactions. A broad set of metabolic pathways are covered by comprehensive metabolic
pathway databases, such as the KEGG database [173], MetaCyc [174], AraCyc [175] and
the small molecule pathway database (SMPDB) [176] (Table 5). A number of software,
such as, metabolite set enrichment analysis (MSEA), MPEA, IMPaLA, MBRole,
VANTED, MetaboAnalyst, Paintomics, ProMeTra, Metscape2, and MetaMapRR can
perform statistical and other metabolite enrichment analyses (Table 5). MSEA methods
can be methodically distinguished into over-representation (ORA), single-sample
profiling (SSP) and quantitative enrichment (QEA) analysis [177]. Metscape2 [178], which
is an add-on to the common Cytoscape software [179] that allows data on metabolites,
genes, and pathways to be displayed in the scope of metabolic networks. In addition,
platform-independent online resources such as Paintomics [180], ProMeTra [181] and
MetaMapRR [182] are also accessible.
Table 5. Database for metabolite enrichment analysis and pathway visualization.
Database Website (URL, Accessed on 29 June 2021) References
AraCyc https://www.plantcyc.org/typeofpublication/aracyc [175]
Cytoscape http://www.cytoscape.org/ [183]
IMPaLA http://impala.molgen.mpg.de [184]
iPath http://pathways.embl.de/ [185]
KEGG http://www.genome.jp/kegg/ [173]
MapMan http://mapman.gabipd.org/web/guest/mapman [186]
MBRole http://csbg.cnb.csic.es/mbrole/ [187]
Metabolonote http://metabolonote.kazusa.or.jp/ [188]
MetaCrop http://metacrop.ipk-gatersleben.de [189]
MetaCyc http://www.metacyc.org [174]
MetPA http://metpa.metabolomics.ca/MetPA/ [190]
MPEA http://ekhidna.biocenter.helsinki.fi/poxo/mpea/ [191]
MSEA
http://www.msea.ca.
or
http://www.metaboanalyst.ca
[177]
Pathcase http://nashua.case.edu/PathwaysMAW/Web/ [192]
PathwayExplorer http://genome.tugraz.at/pathwayexplorer/pathwayexplorer_d
escription.shtml [193]
SMPDB http://www.smpdb.ca [176]
VANTED https://immersive-nalytics.infotech.monash.edu/vanted/ [194]
WikiPathways http://wikipathways.org [195]
6. Conclusions
Metabolomics has achieved a prominent role in plant science research. It has wide
applications ranging from investigating the stress-specific metabolites for different
climatic stresses, evaluating candidate metabolic gene functions to analyzing the
biological mechanism in plant cells, and dissecting the genotype-phenotype relationship
in response to the various biotic and abiotic stresses. This review provides an overview of
different sample collection, harvesting methods, storage, and sample preparation in the
plant metabolomics experiments. Furthermore, the most widely used analytical tools in
metabolomics for agriculture research viz. GC-MS, LC-MS, CE-MS, FTICR-MS, MALDI,

Plants 2021, 10, 2409 17 of 24
IMS, and NMR with new development in their applications. In addition, we discussed
computational software and database employed for metabolomics data processing in
plant science. The integration of comprehensive bioinformatics tools with omics
strategies professionally dissects novel metabolic networks for crop improvement.
Metabolomics has excelled classical approach for novel metabolites discovery and
simultaneously explores the complexity and enormous chemical diversity of metabolites
in any crop plant. The integration of metabolomics with other “omics” technologies, e.g.,
genomics, transcriptomics, proteomics, can deliver novel insights into crop plants’
genetic regulations in the context of their cellular function and metabolic network. The
complete elucidation of physio-biochemical and molecular mechanisms underlying plant
developmental and stress-responsive biology primarily depends on the comprehensive
investigations using omics techniques that make metabolomics more applicable in
agriculture sciences. Metabolomics has tremendous potential in plant research, as
metabolites are more appropriate to the plant phenotype than DNAs, RNAs, or proteins.
Therefore, studies in this field will effort on both ways, one is the systematic study of the
biochemical and genetic mechanisms of metabolic variations in crop plants using both
targeted and non-targeted methods; other is metabolomic platform can be used for
metabolic profiling of genome-edited plants using CRISPR/Cas9 system for risk
evaluation and regulatory affairs related with genetically modified crops [196]. Thus, we
can say metabolomics will be able to contribute a lot to agriculture science, such as crop
breeding and genome editing for crop improvement, better grain yield, and elucidating
their unknown and novel metabolic pathways.
Author Contributions: Conceptualization, M.K.P. and N.S.Y.; writing—original draft preparation,
M.K.P. and S.P. (Sonika Pandey); writing—review and editing, M.K.P., S.P. (Sonika Pandey), M.K.,
M.I.H., S.P. (Sikander Pal) and N.S.Y.; supervision, M.K.P. and N.S.Y.; project administration,
M.K.P.; funding acquisition, N.S.Y. All authors have read and agreed to the published version of
the manuscript.
Funding: This research received no external funding and the APC was funded by MDPI to N.S.Y.
Institutional Review Board Statement: Not applicable.
Informed Consent Statement: Not applicable.
Data Availability Statement: All data included in the main text.
Conflicts of Interest: The authors declare no conflict of interest.
References
1. Razzaq, A.; Sadia, B.; Raza, A.; Khalid Hameed, M.; Saleem, F. Metabolomics: A way forward for crop improvement.
Metabolites 2019, 9, 303.
2. Peters, K.; Worrich, A.; Weinhold, A.; Alka, O.; Balcke, G.; Birkemeyer, C.; Bruelheide, H.; Calf, O.W.; Dietz, S.; Dührkop, K.; et
al. Current challenges in plant eco-metabolomics. Int. J. Mol. Sci. 2018, 19, 1385.
3. Hong, J.; Yang, L.; Zhang, D.; Shi, J. Plant Metabolomics: An indispensable system biology tool for plant science. Int. J. Mol. Sci.
2016, 17, 767.
4. Shulaev, V.; Cortes, D.; Miller, G.; Mittler, R. Metabolomics for plant stress response. Physiol Plant. 2008, 132, 199–208.
5. Piasecka, A.; Kachlicki, P.; Stobiecki, M. Analytical methods for detection of plant metabolomes changes in response to biotic
and abiotic stresses. Int. J. Mol. Sci. 2019, 20, 379.
6. Patel, M.K.; Mishra, A.; Jha, B. Untargeted metabolomics of halophytes. In Marine Omics: Principles and Applications; Kim, S.,
Ed.; CRC Press: Boca Raton, FL, USA, 2016; pp. 309–325.
7. Mishra, A.; Patel, M.K.; Jha, B. Non–targeted metabolomics and scavenging activity of reactive oxygen species reveal the
potential of Salicornia brachiata as a functional food. J. Funct. Foods 2015, 13, 21–31.
8. Pandey, S.; Patel, M.K.; Mishra, A.; Jha, B. Physio-biochemical composition and untargeted metabolomics of cumin (Cuminum
cyminum L.) make it promising functional food and help in mitigating salinity stress. PLoS ONE 2015, 10, e0144469.
9. Patel, M.K.; Mishra, A.; Jaiswar, S.; Jha, B. Metabolic profiling and scavenging activities of developing circumscissile fruit of
psyllium (Plantago ovata Forssk.) reveal variation in primary and secondary metabolites. BMC Plant Biol. 2020, 20, 116.
10. Patel, M.K.; Mishra, A.; Jha, B. Non-targeted metabolite profiling and scavenging activity unveil the nutraceutical potential of
psyllium (Plantago ovata Forsk). Front. Plant Sci. 2016, 7, 431.

Plants 2021, 10, 2409 18 of 24
11. Bénard, C.; Bernillon, S.; Biais, B.; Osorio, S.; Maucourt, M.; Ballias, P.; Deborde, C.; Colombié, S.; Cabasson, C.; Jacob, D. Metabolomic
profiling in tomato reveals diel compositional changes in fruit affected by source–sink relationships. J. Exp. Bot. 2015, 66, 3391–3404.
12. Xie, Z.; Wang, C.; Zhu, S.; Wang, W.; Xu, J.; Zhao, X. Characterizing the metabolites related to rice salt tolerance with
introgression lines exhibiting contrasting performances in response to saline conditions. Plant Growth Regul. 2020, 92, 157–167.
13. Francki, M.G.; Hayton, S.; Gummer, J.; Rawlinson, C.; Trengove, R.D. Metabolomic profiling and genomic analysis of wheat
aneuploid lines to identify genes controlling biochemical pathways in mature grain. Plant Biotechnol. J. 2016, 14, 649–660.
14. Rao, J.; Cheng, F.; Hu, C.; Quan, S.; Lin, H.; Wang, J.; Chen, G.; Zhao, X.; Alexander, D.; Guo, L. Metabolic map of mature maize
kernels. Metabolomics 2014, 10, 775–787.
15. Kumar, R.; Bohra, A.; Pandey, A.K.; Pandey, M.K.; Kumar, A. Metabolomics for plant improvement: Status and prospects.
Front. Plant Sci. 2017, 8, 1302.
16. Tohge, T.; De Souza, L.P.; Fernie, A.R. Genome-enabled plant metabolomics. J. Chromatogr. B 2014, 966, 7–20.
17. Xu, J.; Chen, Z.; Wang, F.; Jia, W.; Xu, Z. Combined transcriptomic and metabolomic analyses uncover rearranged gene
expression and metabolite metabolism in tobacco during cold acclimation. Sci. Rep. 2020, 10, 1–13.
18. Hamany Djande, C.Y.; Pretorius, C.; Tugizimana, F.; Piater, L.A.; Dubery, I.A. Metabolomics: A tool for cultivar phenotyping
and investigation of grain crops. Agronomy 2020, 10, 831.
19. Patel, M.K.; Kumar, M.; Li, W.; Luo, Y.; Burritt, D.J.; Alkan, N.; Tran, L.-S.P. Enhancing salt tolerance of plants: From metabolic
reprogramming to exogenous chemical treatments and molecular approaches. Cells 2020, 9, 2492.
20. Rupasinghe, T.W.; Roessner, U. Extraction of plant lipids for LC-MS-based untargeted plant lipidomics. Plant Metab. 2018, 1778, 125–
135.
21. Shulaev, V.; Chapman, K.D. Plant lipidomics at the crossroads: From technology to biology driven science. BBA––Mol. Cell. Biol.
Lipids 2017, 1862, 786–791.
22. Kofeler, H.C.; Fauland, A.; Rechberger, G.N.; Trötzmüller, M. Mass spectrometry based lipidomics: An overview of
technological platforms. Metabolites 2012, 2, 19–38.
23. Ni, Z.; Milic, I.; Fedorova, M. Identification of carbonylated lipids from different phospholipid classes by shotgun and LC-MS
lipidomics. Anal. Bioanal. Chem. 2015, 407, 5161–5173.
24. Okazaki, Y.; Kamide, Y.; Hirai, M.Y.; Saito, K. Plant lipidomics based on hydrophilic interaction chromatography coupled to
ion trap time-of-flight mass spectrometry. Metabolomics 2013, 9, 121–131.
25. Abbadi, A.; Domergue, F.; Bauer, J.; Napier, J.A.; Welti, R.; Za ̈hringer, U.; Cirpus, P.; Heinz, E. Biosynthesis of very-long-chain
polyunsaturated fatty acids in transgenic oilseeds: Constraints on their accumulation. Plant Cell 2004, 16, 2734–2748.
26. Yu, D.; Boughton, B.A.; Hill, C.B.; Feussner, I.; Roessner, U.; Rupasinghe, T.W. Insights into oxidized lipid modification in
barley roots as an adaptation mechanism to salinity stress. Front. Plant Sci. 2020, 11, 1.
27. Zhang, Q.Y.; Yu, R.; Xie, L.H.; Rahman, M.M.; Kilaru, A.; Niu, L.X.; Zhang, Y.L. Fatty acid and associated gene expression
analyses of three tree peony species reveal key genes for α-linolenic acid synthesis in seeds. Front. Plant Sci. 2018, 9, 106.
28. Patel, M.K.; Pandey, S.; Brahmbhatt, H.R.; Mishra, A.; Jha, B. Lipid content and fatty acid profile of selected halophytic plants
reveal a promising source of renewable energy. Biomass Bioenergy 2019, 124, 25–32.
29. Sinha, P.; Islam, M.A.; Negi, M.S.; Tripathi, S.B. Changes in oil content and fatty acid composition in Jatropha curcas during seed
development. Ind. Crops. Prod. 2015, 77, 508–510.
30. Nimbalkar, M.S.; Pai, S.R.; Pawar, N.V.; Oulkar, D.; Dixit, G.B. Free amino acid profiling in grain Amaranth using LC–MS/MS.
Food Chem. 2012, 134, 2565–2569.
31. Cui, M.C.; Chen, S.J.; Wang, H.H.; Li, Z.H.; Chen, H.J.; Chen, Y.; Zhou, H.B.; Li, X.; Chen, J.W. Metabolic profiling investigation
of Fritillaria thunbergii Miq. by gas chromatography–mass spectrometry. J. Food Drug Anal. 2018, 26, 337–347.
32. Dias, D.A.; Hill, C.B.; Jayasinghe, N.S.; Atieno, J.; Sutton, T.; Roessner, U. Quantitative profiling of polar primary metabolites of
two chickpea cultivars with contrasting responses to salinity. J. Chromatogr. B. 2015, 1000, 1–13.
33. Pandey, S.; Kumari, A.; Shree, M.; Kumar, V.; Singh, P.; Bharadwaj, C.; Loake, G.J.; Parida, S.K.; Masakapalli, S.K.; Gupta, K.J.
Nitric oxide accelerates germination via the regulation of respiration in chickpea. J. Exp. Bot. 2019, 70, 4539–4555.
34. Mikołajczyk-Bator, K.; Błaszczyk, A.; Czyżniejewski, M.; Kachlicki, P. Characterization and identification of triterpene
saponins in the roots of red beets (Beta vulgaris L.) using two HPLC–MS systems. Food Chem. 2016, 192, 979–990.
35. Hazzoumi, Z.; Moustakime, Y.; Joutei, K.A. Effect of gibberellic acid (GA), indole acetic acid (IAA) and benzylaminopurine
(BAP) on the synthesis of essential oils and the isomerization of methyl chavicol and trans-anethole in Ocimum gratissimum L.
SpringerPlus 2014, 3, 321–327.
36. Santoro, M.V.; Nievas, F.; Zygadlo, J.; Giordano, W.; Banchio, E. Effects of growth regulators on biomass and the production of
secondary metabolites in peppermint (Mentha piperita) micropropagated in vitro. Am. J. Plant Sci. 2013, 4, 49.
37. Naeem, M.; Khan, M.M.A.; Idrees, M.; Aftab, T. Triacontanol-mediated regulation of growth yield, physiological activities and
active constituents of Mentha arvensis L. Plant Growth Regul. 2011, 65, 195–206.
38. Li, J.T.; Hu, Z.H. Accumulation and dynamic trends of triterpenoid saponin in vegetative organ of Achyranthus bidentata. J.
Integr. Plant Biol. 2009, 51, 122–129.
39. Perkowska, I.; Siwinska, J.; Olry, A.; Grosjean, J.; Hehn, A.; Bourgaud, F.; Lojkowska, E.; Ihnatowicz, A. Identification and
quantification of coumarins by UHPLC-MS in Arabidopsis thaliana natural populations. Molecules 2021, 26, 1804.
40. Morita, H.; Fujiwara, M.; Yoshida, N.; Kobayashi, J. New picrotoxin-type and dendrobine-type sesquiterpenoids from
Dendrobium snowflake ‘Red Star’. Tetrahedron 2000, 56, 5801–5805.

Plants 2021, 10, 2409 19 of 24
41. Zagorchev, L.; Seal, C.E.; Kranner, I.; Odjakova, M. A central role for thiols in plant tolerance to abiotic stress. Int. J. Mol. Sci.
2013, 14, 7405–7432.
42. Xu, J.; Yu, Y.; Shi, R.; Xie, G.; Zhu, Y.; Wu, G.; Qin, M. Organ-specific metabolic shifts of flavonoids in Scutellaria baicalensis at
different growth and development stages. Molecules 2018, 23, 428.
43. Lin, Lj.; Huang, Xb.; Lv, Zc. Isolation and identification of flavonoids components from Pteris vittata L. SpringerPlus 2016, 5, 1649.
44. Zhou, J.; Ma, C.; Xu, H.; Yuan, K.; Lu, X.; Zhu, Z.; Wu, Y.; Xu, G. Metabolic profiling of transgenic rice with cryIAc and sck
genes: An evaluation of unintended effects at metabolic level by using GC-FID and GC–MS. J. Chromatogr. B. 2009, 877, 725–
732.
45. Iwaki, T.; Guo, L.; Ryals, J.A.; Yasuda, S.; Shimazaki, T.; Kikuchi, A.; Watanabe, K.N.; Kasuga, M.; Yamaguchi-Shinozaki, K.;
Ogawa, T.; et al. Metabolic profiling of transgenic potato tubers expressing Arabidopsis dehydration response element-binding
protein 1A (DREB1A). J. Agric. Food Chem. 2013, 61, 893–900.
46. Ma, C.; Wang, H.; Lu, X.; Wang, H.; Xu, G.; Liu, B. Terpenoid metabolic profiling analysis of transgenic Artemisia annua L. by
comprehensive two-dimensional gas chromatography time-of-flight mass spectrometry. Metabolomics 2009, 5, 497–506.
47. Sobolev, A.P.; Testone, G.; Santoro, F.; Nicolodi, C.; Iannelli, M.A.; Amato, M.E.; Ianniello, A.; Brosio, E.; Giannino, D.;
Mannina, L. Quality traits of conventional and transgenic lettuce (Lactuca sativa L.) at harvesting by NMR metabolic profiling. J.
Agric. Food Chem. 2010, 58, 6928–6936.
48. Roessner-Tunali, U.; Hegemann, B.; Lytovchenko, A.; Carrari, F.; Bruedigam, C.; Granot, D.; Fernie, A.R. Metabolic profiling of
transgenic tomato plants overexpressing hexokinase reveals that the influence of hexose phosphorylation diminishes during
fruit development. Plant Physiol. 2003, 133, 84–99.
49. Choi, H.K.; Choi, Y.H.; Verberne, M.; Lefeber, A.W.; Erkelens, C.; Verpoorte, R. Metabolic fingerprinting of wild type and
transgenic tobacco plants by 1H NMR and multivariate analysis technique. Phytochemistry 2004, 65, 857–864.
50. Jha, R.K.; Patel, J.; Patel, M.K.; Mishra, A.; Jha, B. Introgression of a novel cold and drought regulatory-protein encoding
CORA-like gene, SbCDR, induced osmotic tolerance in transgenic tobacco. Physiol. Plant 2021, 172, 1170–1188.
51. Chang, Y.; Zhao, C.; Zhu, Z.; Wu, Z.; Zhou, J.; Zhao, Y.; Lu, X.; Xu, G. Metabolic profiling based on LC/MS to evaluate
unintended effects of transgenic rice with cry1Ac and sck genes. Plant Mol. Biol. 2012, 78, 477–487.
52. Payyavula, R.S.; Tschaplinski, T.J.; Jawdy, S.S.; Sykes, R.W.; Tuskan, G.A.; Kalluri, U.C. Metabolic profiling reveals altered
sugar and secondary metabolism in response to UGPase overexpression in Populus. BMC Plant Boil. 2014, 14, 1–14.
53. Stamova, B.S.; Roessner, U.; Suren, S.; Laudencia-Chingcuanco, D.; Bacic, A.; Beckles, D.M. Metabolic profiling of transgenic
wheat over-expressing the high-molecular-weight Dx5 glutenin subunit. Metabolomics 2009, 5, 239–252.
54. Niu, F.; Jiang, Q.; Sun, X.; Hu, Z.; Wang, L.; Zhang, H. Metabolic profiling of DREB-overexpressing transgenic wheat seeds by
liquid chromatography–mass spectrometry. Crop J. 2020, 8, 1025–1036.
55. Piccioni, F.; Capitani, D.; Zolla, L.; Mannina, L. NMR metabolic profiling of transgenic maize with the Cry1A(b) gene. J. Agric.
Food Chem. 2020, 57, 6041–6049.
56. Tanna, B.; Mishra, A. Metabolomics of seaweeds: Tools and techniques. In Plant Metabolites and Regulation Under Environmental
Stress; Ahmad, P., Ahanger, M.A., Singh, V.P., Tripathi, D.K., Alam, P., Alyemeni, M.N., Eds.; Academic Press: Cambridge,
MA, USA, 2018; pp. 37–52.
57. Salem, M.A.; Perez de Souza, L.; Serag, A.; Fernie, A.R.; Farag, M.A.; Ezzat, S.M.; Alseekh, S. Metabolomics in the context of
plant natural products research: From sample preparation to metabolite analysis. Metabolites 2020, 10, 37.
58. Sumner, L.W.; Amberg, A.; Barrett, D.; Beale, M.H.; Beger, R.; Daykin, C.A.; Fan, T.W.M.; Fiehn, O.; Goodacre, R.; Griffin, J .L.;
et al. Proposed minimum reporting standards for chemical analysis Chemical Analysis Working Group (CAWG)
Metabolomics Standards Initiative (MSI). Metabolomics 2007, 3, 211–221.
59. Harbourne, N.; Marete, E.; Jacquier, J.C.; O’Riordan, D. Effect of drying methods on the phenolic constituents of meadowsweet
(Filipendula ulmaria) and willow (Salix alba). LWT––Food Sci. Technol. 2009, 42, 1468–1473.
60. Parida, A.K.; Panda, A.; Rangani, J. Metabolomics-guided elucidation of abiotic stress tolerance mechanisms in plants. In Plant
Metabolites and Regulation Under Environmental Stress; Ahmad, P., Ahanger, M.A., Singh, V.P., Tripathi, D.K., Alam, P.,
Alyemeni, M.N., Eds.; Academic Press: Cambridge, MA, USA, 2018; pp. 89–131.
61. Gong, Z.G.; Hu, J.; Wu, X.; Xu, Y.J. The recent developments in sample preparation for mass spectrometry-based
metabolomics. Crit. Rev. Anal. Chem. 2017, 8347, 1–7.
62. Silva-Navas, J.; Moreno-Risueno, M.A.; Manzano, C. Flavonols mediate root phototropism and growth through regulation of
proliferation-to differentiation transition. Plant Cell 2016, 28, 1372–1387.
63. Corrales, A.R.; Carrillo, L.; Lasierra, P. Multifaceted role of cycling DOF factor 3 (CDF3) in the regulation of flowering time and
abiotic stress responses in Arabidopsis. Plant Cell Environ. 2017, 40, 748–764.
64. Sánchez-Parra, B.; Frerigmann, H.; Pérez Alonso,M.-M. Characterization of four bifunctional plant
IAM/PAM-amidohydrolases capable of contributing to auxin biosynthesis. Plants 2014, 3, 324–347.
65. Lehmann, T.; Janowitz, T.; Sánchez-Parra, B. Arabidopsis NITRILASE 1 contributes to the regulation of root growth and
development through modulation of auxin biosynthesis in seedlings. Front. Plant Sci. 2017, 8, 36.
66. T’Kindt, R.; Morreel, K.; Deforce, D. Joint GC–MS and LC–MS platforms for comprehensive plant metabolomics: Repeatability
and sample pre-treatment. J. Chromatogr. B 2009, 877, 3572–3580.
67. Giavalisco, P.; Li, Y.; Matthes, A. Elemental formula annotation of polar and lipophilic metabolites using (13) C, (15) N and (34)
S isotope labelling, in combination with high-resolution mass spectrometry. Plant J. 2011, 68, 364–376.

Plants 2021, 10, 2409 20 of 24
68. Yuliana, N.D.; Khatib, A.; Verpoorte, R.; Choi, Y.H. Comprehensive extraction method integrated with NMR metabolomics: A
new bioactivity screening method for plants, adenosine a1 receptor binding compounds in Orthosiphon stamineus, Benth. Anal.
Chem. 2011, 83, 6902–6906.
69. Gratacós-Cubarsí, M.; Ribas-Agustí, A.; García-Regueiro, J.A.; Castellari, M. Simultaneous evaluation of intact glucosinolates
and phenolic compounds by UPLC-DAD-MS/MS in Brassica oleracea L. var. botrytis. Food Chem. 2010, 121, 257–263.
70. Teo, C.C.; Chong, W.P.K.; Ho, Y.S. Development and application of microwave-assisted extraction technique in biological
sample preparation for small molecule analysis. Metabolomics 2013, 9, 1109–1128.
71. Altemimi, A.; Watson, D.G.; Choudhary, R.; Dasari, M.R.; Lightfoot, D.A. Ultrasound assisted extraction of phenolic
compounds from peaches and pumpkins. PLoS ONE 2016, 11, e0148758.
72. Velickovic, D.; Chu, R.K.; Myers, G.L.; Ahkami, A.H.; Anderton, C.R. An approach for visualizing the spatial metabolome of an
entire plant root system inspired by the swiss-rolling technique. J. Mass Spectrom. 2020, 55, 4363.
73. Zuorro, A.; Lavecchia, R.; Medici, F.; Piga, L. Enzyme-assisted production of tomato seed oil enriched with lycopene from
tomato pomace. Food Bioprocess Tech. 2013, 6, 3499–3509.
74. Zhou, J.; Yin, Y. Strategies for large-scale targeted metabolomics quantification by liquid chromatography-mass spectrometry.
Analyst 2016, 141, 6362–6373.
75. Cajka, T.; Fiehn, O. Toward merging untargeted and targeted methods in mass spectrometry-based metabolomics and
lipidomics. Anal. Chem. 2016, 88, 524–545.
76. Bojko, B.; Reyes-Garcés, N.; Bessonneau, V.; Goryński, K.; Mousavi, F.; Silva, E.A.S.; Pawliszyn, J. Solid-phase microextraction
in metabolomics. Trends Analyt. Chem. 2014, 61, 168–180.
77. Ciccimaro, E.; Blair, I.A. Stable-isotope dilution LC–MS for quantitative biomarker analysis. Bioanalysis 2010, 2, 311–341.
78. Zhou, J.; Liu, H.; Liu, Y.; Liu, J.; Zhao, X.; Yin, Y. Development and evaluation of a parallel reaction monitoring strategy for
large-scale targeted metabolomics quantification. Anal. Chem. 2016, 88, 4478.
79. Guo, B.; Chen, B.; Liu, A.; Zhu, W.; Yao, S. Liquid chromatography-mass spectrometric multiple reaction monitoring-based
strategies for expanding targeted profiling towards quantitative metabolomics. Curr. Drug Metab. 2012, 13, 1226–1243.
80. Bianchi, F.; Ilag, L.; Termopoli, V.; Mendez, L. Advances in MS-based analytical methods: Innovations and future trends. J.
Anal. Methods Chem. 2018, 2018, 1–2.
81. Fiehn, O. Metabolomics by gas chromatography–mass spectrometry: Combined targeted and untargeted profiling. Curr.
Protoc. Mol. Biol. 2016, 114, 1–32.
82. Kopka, J. Current challenges and developments in GC–MS based metabolite profiling technology. J. Biotechnol. 2006, 124, 312–322.
83. Harvey, D.J.; Vouros, P. Mass spectrometric fragmentation of trimethylsilyl and related alkylsilyl derivatives. Mass Spectrom.
Rev. 2020, 39, 105–211.
84. Jorge, T.F.; Rodrigues, J.A.; Caldana, C.; Schmidt, R.; Van Dongen, J.T.; Thomas-Oates, J.; António, C. Mass spectrometry-based
plant metabolomics: Metabolite responses to abiotic stress. Mass Spectrom. Rev. 2016, 35, 620–649.
85. Hall, R.D. Plant metabolomics: From holistic hope, to hype, to hot topic. New Phytol. 2006, 169, 453–468.
86. Kumar, M.; Kuzhiumparambil, U.; Pernice, M.; Jiang, Z.; Ralph, P.J. Metabolomics: An emerging frontier of systems biology in
marine macrophytes. Algal Res. 2016, 16, 76–92.
87. Tsugawa, H.; Tsujimoto, Y.; Arita, M.; Bamba, T.; Fukusaki, E.; Fiehn, O. GC/MS based metabolomics: Development of a data mining
system for metabolite identification by using soft independent modeling of class analogy (simca). BMC Bioinform. 2011, 12, 131–131.
88. Koek, M.M.; Jellema, R.H.; Van der Greef, J.; Tas, A.C.; Hankemeier, T. Quantitative metabolomics based on gas
chromatography mass spectrometry: Status and perspectives. Metabolomics 2011, 7, 307–328.
89. Mastrangelo, A.; Ferrarini, A.; Rey-Stolle, F.; García, A.; Barbas, C. From sample treatment to biomarker discovery: A tutorial
for untargeted metabolomics based on GC-(EI)-Q-MS. Anal. Chim. Acta 2015, 900, 21–35.
90. Beale, D.J.; Pinu, F.R.; Kouremenos, K.A.; Poojary, M.M.; Narayana, V.K.; Boughton, B.A.; Dias, D.A. Review of recent
developments in GC–MS approaches to metabolomics-based research. Metabolomics 2018, 14, 1–31.
91. Sissener, N.H.; Hemre, G.-I.; Lall, S.P.; Sagstad, A.; Petersen, K.; Williams, J.; Rohloff, J.; Sanden, M. Are apparent negative
effects of feeding genetically modified MON810 maize to Atlantic salmon, Salmo salar caused by confounding factors? Br. J.
Nutr. 2011, 106, 42–56.
92. Matsuda, F.; Hirai, M.Y.; Sasaki, E.; Akiyama, K.; Yonekura-Sakakibara, K.; Provart, N.J.; Sakurai, T.; Shimada, Y.; Saito, K.
AtMetExpress development: A phytochemical atlas of Arabidopsis development. Plant Physiol. 2010, 152, 566–578.
93. Obata, T.; Fernie, A.R. The use of metabolomics to dissect plant responses to abiotic stresses. Cell Mol. Life Sci. 2012, 69, 3225–3243.
94. Okazaki, Y.; Saito, K. Recent advances of metabolomics in plant biotechnology. Plant Biotechnol. Rep. 2012, 6, 1–15.
95. Holčapek, M.; Jirásko, R.; Lísa, M. Recent developments in liquid chromatography–mass spectrometry and related techniques.
J. Chromatogr. 2012, 1259, 3–15.
96. Allwood, J.W.; Goodacre, R. An introduction to liquid chromatography–mass spectrometry instrumentation applied in plant
metabolomic analyses. Phytochem. Anal. 2010, 21, 33–47.
97. Schiffmann, C.; Hansen, R.; Baumann, S.; Kublik, A.; Nielsen, P.H.; Adrian, L.; Von Bergen, M.; Jehmlich, N.; Seifert, J.
Comparison of targeted peptide quantification assays for reductive dehalogenases by selective reaction monitoring (SRM) and
precursor reaction monitoring (PRM). Anal. Bioanal. Chem. 2014, 406, 283–291.
98. Last, R.L.; Jones, A.D.; Shachar-Hill, Y. Towards the plant metabolome and beyond. Nat. Rev. Mol. Cell Biol. 2007, 8, 167–174.
99. Alseekh, S.; Fernie, A.R. Metabolomics 20 years on: What have we learned and what hurdles remain? Plant J. 2018, 94, 933–942.

Plants 2021, 10, 2409 21 of 24
100. Soga, T.; Imaizumi, M. Capillary electrophoresis method for the analysis of inorganic anions, organic acids, amino acids,
nucleotides, carbohydrates and other anionic compounds. Electrophoresis 2001, 22, 3418–3425.
101. Williams, B.J.; Cameron, C.J.; Workman, R.; Broeckling, C.D.; Sumner, L.W.; Smith, J.T. Amino acid profiling in plant cell
cultures: An inter-laboratory comparison of CE-MS and GC-MS. Electrophoresis 2007, 28, 1371–1379.
102. Ren, J.L.; Zhang, A.H.; Kong, L.; Wang, X.J. Advances in mass spectrometry-based metabolomics for investigation of
metabolites. RSC Adv. 2018, 8, 22335–22350.
103. Nikolaev, E.N.; Kostyukevich, Y.I.; Vladimirov, G.N. Fourier transform ion cyclotron resonance (FTICR) mass spectrometry:
Theory and simulations. Mass Spectrom. Rev. 2016, 35, 219–258.
104. Baker, T.C.; Han, J.; Borchers, C.H. Recent advancements in matrix-assisted laser desorption/ionization mass spectrometry
imaging. Curr. Opin. Biotechnol. 2017, 43, 62–69.
105. Cha, S.; Zhang, H.; Ilarslan, H.I.; Wurtele, E.S.; Brachova, L.; Nikolau, B.J.; Yeung, E.S. Direct profiling and imaging of plant
metabolites in intact tissues by using colloidal graphite-assisted laser desorption ionization mass spectrometry. Plant J. 2008, 55, 348–
360.
106. Jun, J.H.; Song, Z.; Liu, Z.; Nikolau, B.J.; Yeung, E.S.; Lee, Y.J. High-spatial and high-mass resolution imaging of surface metabolites
of Arabidopsis thaliana by laser desorption-ionization mass spectrometry using colloidal silver. Anal. Chem. 2010, 82, 3255–3265.
107. Goodwin, R.J.; Pennington, S.R.; Pitt, A.R. Protein and peptides in pictures: Imaging with MALDI mass spectrometry.
Proteomics 2008, 8, 3785–3800.
108. Lee, Y.J.; Perdian, D.C.; Song, Z.; Yeung, E.S.; Nikolau, B.J. Use of mass spectrometry for imaging metabolites in plants. Plant J.
2012, 70, 81–95.
109. Kathirvel, S.; Gayatri Ramya, M.; Rajesh, A. An overview on the benefits and applications of high performance ion mobility
spectrometer in pharmaceutical arena-focus on current research. World J. Pharm. Pharm. Sci. 2017, 6, 402–406.
110. Hernandez-Mesa, M.; Escourrou, A.; Monteau, F.; Le Bizec, B.; Dervilly-Pinel, G. Current applications and perspectives of ion
mobility spectrometry to answer chemical food safety issues. Trends Anal. Chem. 2017, 94, 39–53.
111. Campuzano, I.D.G.; Lippens, J.L. Ion mobility in the pharmaceutical industry: An established biophysical technique or still
niche? Curr. Opin. Chem. Biol. 2018, 42, 147–159.
112. Burnum-Johnson, K.E.; Zheng, X.; Dodds, J.N.; Ash, J.; Fourches, D.; Nicora, C.D.; Wendler, J.P.; Metz, T.O.; Waters, K.M.;
Jansson, J.K.; et al. Ion mobility spectrometry and the omics: Distinguishing isomers, molecular classes and contaminant ions in
complex samples. Trends Anal. Chem. 2019, 116, 292–299.
113. Odenkirk, M.T.; Baker, E.S. Utilizing drift tube ion mobility spectrometry for the evaluation of metabolites and xenobiotics.
Methods Mol. Biol. 2020, 2084, 35–54.
114. Armenta, S.; Esteve-Turrillas, F.A.; Alcala, M. Analysis of hazardous chemicals by “stand alone” drift tube ion mobility
spectrometry: A review. Anal. Methods 2020, 12, 1163–1181.
115. Garcia, X.; Sabaté, M.D.M.; Aubets, J.; Jansat, J.M.; Sentellas, S. Ion mobility–mass spectrometry for bioanalysis. Separations 2021, 8, 33.
116. May, J.C.; Morris, C.B.; McLean, J.A. Ion mobility collision cross section compendium. Anal. Chem. 2017, 89, 1032–1044.
117. Mu, Y.; Schulz, B.L.; Ferro, V. Applications of ion mobility-mass spectrometry in carbohydrate chemistry and glycobiology.
Molecules 2018, 23, 2557.
118. Hofmann, J.; Pagel, K. Glycan analysis by ion mobility-mass spectrometry. Angew. Chem. Int. Ed. 2017, 56, 8342–8349.
119. Li, H.; Bendiak, B.; Kaplan, K.; Davis, E.; Siems,W.F.; Hill, H.H. Evaluation of ion mobility-mass spectrometry for determining the
isomeric heterogeneity of oligosaccharide-alditols derived from bovine submaxillary mucin. Int. J. Mass Spectrom. 2013, 352, 9–18.
120. Ahonen, L.; Fasciotti, M.; Gennäs, G.B.A.; Kotiaho, T.; Daroda, R.J.; Eberlin, M.; Kostiainen, R. Separation of steroid isomers by
ion mobility mass spectrometry. J. Chromatogr. A. 2013, 1310, 133–137.
121. Clowers, B.H.; Dwivedi, P.; Steiner,W.E.; Hill, H.H.; Bendiak, B. Separation of sodiated isobaric disaccharides and
trisaccharides using electrospray ionization-atmospheric pressure ion mobility-time of flight mass spectrometry. J. Am. Soc.
Mass Spectrom. 2005, 16, 660–669.
122. Struwe, W.B.; Benesch, J.L.; Harvey, D.J.; Pagel, K. Collision cross sections of high-mannose N-glycans in commonly observed
adduct states–identification of gas-phase conformers unique to [M-H]- ions. Analyst 2015, 140, 6799–6803.
123. Lapthorn, C.; Pullen, F.; Chowdhry, BZ. Ion mobility spectrometry-mass spectrometry (IMS-MS) of small molecules:
Separating and assigning structures to ions. Mass Spectrom Rev. 2013, 32, 43–71.
124. Lanucara, F.; Holman, SW.; Gray, C.J.; Eyers, C.E. The power of ion mobility-mass spectrometry for structural characterization
and the study of conformational dynamics. Nat. Chem. 2014, 6, 281.
125. Luo, M.D.; Zhou, Z.W.; Zhu, Z.J. The application of ion mobility-mass spectrometry in untargeted metabolomics: From
separation to identification. J. Anal. Test. 2020, 4, 163–174.
126. Zhou, Z.; Tu, J.; Xiong, X.; Shen, X.; Zhu, Z.J. LipidCCS: Prediction of collision cross-section values for lipids with high
precision to support ion mobility–mass spectrometry-based lipidomics. Anal. Chem. 2017, 89, 9559–9566.
127. Zhou, Z.; Xiong, X.; Zhu, Z.J. MetCCS Predictor: A web server for predicting collision cross-section values of metabolite in
metabolomics. Bioinformatics 2017, 33, 2235–2237.
128. Colby, S.M.; Thomas, D.G.; Nuñez, J.R.; Baxter, D.J. Glaesemann, K.R.; Brown, J.M.; Pirrung, M.A.; Govind, N.; Teeguarden,
J.G.; Metz, T.O.; et al. ISiCLE: A quantum chemistry pipeline for establishing in silico collision cross section libraries. Anal.
Chem. 2019, 91, 4346–4356.

Plants 2021, 10, 2409 22 of 24
129. Zhou, Z.; Luo, M.; Chen, X.; Yin, Y.; Xiong, X.; Wang, R.; Zhu, Z.J. Ion mobility collision cross-section atlas for known and
unknown metabolite annotation in untargeted metabolomics. Nat. Commun. 2020, 11, 1–13.
130. McCullagh, M.; Douce, D.; Van Hoeck, E.; Goscinny, S. Exploring the complexity of steviol glycosides analysis using ion
mobility mass spectrometry. Anal. Chem. 2018, 90, 4585–4595.
131. Schroeder, M.; Meyer, S.W.; Heyman, H.M.; Barsch, A.; Sumner, L.W. Generation of a collision cross section library for
multi-dimensional plant metabolomics using UHPLC-trapped ion mobility-MS/MS. Metabolites 2019, 10, 13.
132. Kim, H.K.; Choi, Y.H.; Verpoorte, R. NMR-based metabolomic analysis of plants. Nat. Proto. 2010, 5, 536–549.
133. Foroutan, A.; Goldansaz, S.A.; Lipfert, M.; Wishart, D.S. Protocols for NMR analysis in livestock metabolomics. In
Metabolomics; Humana, New York, 2019; pp. 311–324.
134. Ward, J.L.; Baker, J.M.; Beale, M.H. Recent applications of NMR spectroscopy in plant metabolomics. FEBS J. 2007, 274, 1126–1131.
135. Emwas, A.H.M. The strengths and weaknesses of NMR spectroscopy and mass spectrometry with particular focus on
metabolomics research. Methods Mol. Biol. 2015, 1277, 161–193.
136. Deborde, C.; Moing, A.; Roch, L.; Jacob, D.; Rolin, D.; Giraudeau, P. Plant metabolism as studied by NMR spectroscopy. Prog.
Nucl. Magn. Reson. Spectrosc. 2017, 102, 61–97.
137. Kim, H.K.; Choi, Y.H.; Verpoorte, R. NMR-based plant metabolomics: Where do we stand, where do we go? Trends Biotechnol.
2011, 29, 267–275.
138. Viant, M.R. Improved methods for the acquisition and interpretation of NMR metabolomic data. Biochem. Biophys. Res.
Commun. 2003, 310, 943–948.
139. Tautenhahn, R.; Patti, G.J.; Rinehart, D.; Siuzdak, G. XCMS Online: A web-based platform to process untargeted metabolomic
data. Anal. Chem. 2012, 84, 5035–5039.
140. Montenegro-Burke, J.R.; Aisporna, A.E.; Benton, H.P.; Rinehart, D.; Fang, M.; Huan, T.;Warth, B.; Forsberg, E.; Abe, B.T.; Ivanisevic, J.
Data streaming for metabolomics: Accelerating data processing and analysis from days to minutes. Anal. Chem. 2017, 89, 1254–1259.
141. Smith, C.A.; O’Maille, G.; Want, E.J.; Qin, C.; Trauger, S.A.; Brandon, T.R.; Custodio, D.E.; Abagyan, R.; Siuzdak, G. METLIN:
A metabolite mass spectral database. Ther. Drug Monit. 2005, 27, 747–751.
142. Kessler, N.; Neuweger, H.; Bonte, A.; Langenkämper, G.; Niehaus, K.; Nattkemper, T.W.; Goesmann, A. MeltDB 2.0–advances
of the metabolomics software system. Bioinformatics 2013, 29, 2452–2459.
143. Xia, J.; Wishart, D.S. Using MetaboAnalyst 3.0 for comprehensive metabolomics data analysis. Curr. Protoc. Bioinform. 2016, 55, 14–10.
144. Wang, M.; Carver, J.J.; Phelan, V.V.; Sanchez, L.M.; Garg, N.; Peng, Y.; Nguyen, D.D.; Watrous, J.; Kapono, C.A.;
Luzzatto-Knaan, T.; et al. Sharing and community curation of mass spectrometry data with Global Natural Products Social
Molecular Networking. Nat. Biotechnol. 2016, 34, 828–837.
145. Pluskal, T.; Castillo, S.; Villar-Briones, A.; Orešič, M. MZmine 2: Modular framework for processing, visualizing, and analyzing
mass spectrometry-based molecular profile data. BMC Bioinform. 2010, 11, 1–11.
146. Jiang, W.; Qiu, Y.; Ni, Y.; Su, M.; Jia, W.; Du, X. An automated data analysis pipeline for GC−TOF−MS metabonomics studies. J.
Proteome Res. 2010, 9, 5974–5981.
147. Behrends, V.; Tredwell, G.D.; Bundy, J.G. A software complement to AMDIS for processing GC-MS metabolomic data. Anal.
Biochem. 2011, 415, 206–208.
148. Skogerson, K.; Wohlgemuth, G.; Barupal, D.K.; Fiehn, O. The volatile compound BinBase mass spectral database. BMC
Bioinform. 2011, 12, 1–15.
149. Kind, T.; Wohlgemuth, G.; Lee, D.Y.; Lu, Y.; Palazoglu, M.; Shahbaz, S.; Fiehn, O. FiehnLib: Mass spectral and retention index
libraries for metabolomics based on quadrupole and time-of-flight gas chromatography/mass spectrometry. Anal. Chem. 2009, 81,
10038–10048.
150. Kameyama, A.; Kikuchi, N.; Nakaya, S.; Ito, H.; Sato, T.; Shikanai, T.; Takahashi, Y.; Takahashi, K.; Narimatsu, H. A strategy for
identification of oligosaccharide structures using observational multistage mass spectral library. Anal. Chem. 2005, 77, 4719–4725.
151. Aoki, K.F.; Kanehisa, M. Using the KEGG database resource. Curr. Protoc. Bioinform. 2005, 11, 1–12.
152. Shinbo, Y.; Nakamura, Y.; Altaf-Ul-Amin, M.; Asahi, H.; Kurokawa, K.; Arita, M.; Saito, K.; Ohta, D.; Shibata, D.; Kanaya, S.
KNApSAcK: A comprehensive species-metabolite relationship database. In Plant Metabolomics; Saito, K., Richard, A.D.,
Willmitzer, L., Eds.; Springer: Berlin/Heidelberg, Germany, 2006; pp. 165–181.
153. Kaever, A.; Landesfeind, M.; Feussner, K.; Mosblech, A.; Heilmann, I.; Morgenstern, B.; Feussner, I.; Meinicke, P.
MarVis-Pathway: Integrative and exploratory pathway analysis of non-targeted metabolomics data. Metabolomics 2015, 11,
764–777.
154. Ara, T.; Sakurai, N.; Suzuki, H.; Aoki, K.; Saito, K.; Shibata, D. MassBase: A large-scaled depository of mass spectrometry
datasets for metabolome analysis. Plant Biotechnol. 2021, 38, 167–171.
155. Clasquin, M.F.; Melamud, E.; Rabinowitz, J.D. LC-MS data processing with MAVEN: A metabolomic analysis and
visualization engine. Curr. Protoc. Bioinform. 2012, 37, 1–23.
156. Xia, J.; Psychogios, N.; Young, N.; Wishart, D.S. MetaboAnalyst: A web server for metabolomic data analysis and
interpretation. Nucleic Acids Res. 2009, 37, 652–660.
157. Carroll, A.J.; Badger, M.R.; Millar, A.H. The Metabolome Express Project: Enabling web-based processing, analysis and
transparent dissemination of GC/MS metabolomics datasets. BMC Bioinform. 2010, 11, 1–13.
158. Zhou, B.; Wang, J.; Ressom, H.W. MetaboSearch: Tool for mass-based metabolite identification using multiple databases. PLoS
ONE 2012, 7, e40096.

Plants 2021, 10, 2409 23 of 24
159. Wanichthanarak, K.; Fan, S.; Grapov, D.; Barupal, D.K.; Fiehn, O. Metabox: A toolbox for metabolomic data analysis,
interpretation and integrative exploration. PLoS ONE 2017, 12, e0171046.
160. Lommen, A.; Kools, H.J. MetAlign 3.0: Performance enhancement by efficient use of advances in computer hardware.
Metabolomics 2012, 8, 719–726.
161. Kastenmüller, G.; Römisch-Margl, W.; Wägele, B.; Altmaier, E.; Suhre, K. MetaP-server: A web-based metabolomics data
analysis tool. BioMed Res. Int. 2010, 2011, 1–7.
162. Daly, R.; Rogers, S.; Wandy, J.; Jankevics, A.; Burgess, K.E.; Breitling, R. MetAssign: Probabilistic annotation of metabolites
from LC–MS data using a Bayesian clustering approach. Bioinformatics 2014, 30, 2764–2771.
163. Ruttkies, C.; Schymanski, E.L.; Wolf, S.; Hollender, J.; Neumann, S. MetFrag relaunched: Incorporating strategies beyond in
silico fragmentation. J. Cheminform. 2016, 8, 3.
164. Lei, Z.; Li, H.; Chang, J.; Zhao, P.X.; Sumner, L.W. MET-IDEA version 2.06; Improved efficiency and additional functions for
mass spectrometry-based metabolomics data processing. Metabolomics 2012, 8, 105–110.
165. Rojas-Chertó, M.; Van Vliet, M.; Peironcely, J.E.; Van Doorn, R.; Kooyman, M.; Te Beek, T.; Van Driel, M.A.; Hankemeier, T.;
Reijmers, T. MetiTree: A web application to organize and process high-resolution multi-stage mass spectrometry metabolomics
data. Bioinformatics 2012, 28, 2707–2709.
166. Cui, Q.; Lewis, I.A.; Hegeman, A.D.; Anderson, M.E.; Li, J.; Schulte, C.F.; Westler, W.M.; Eghbalnia, H.R.; Sussman, M.R.;
Markley, J.L. Metabolite identification via the madison metabolomics consortium database. Nat. Biotechnol. 2008, 26, 162.
167. Menikarachchi, L.C.; Cawley, S.; Hill, D.W.; Hall, L.M.; Hall, L.; Lai, S.; Wilder, J.; Grant, D.F. MolFind: A software package
enabling HPLC/MS-based identification of unknown chemical structures. Anal. Chem. 2012, 84, 9388–9394.
168. Mistrik, R.; Lutisan, J.; Huang, Y.; Suchy, M.; Wang, J.; Raab, M. mzCloud: A key conceptual shift to understand ’Who’s Who’
in untargeted metabolomics. In Proceedings of the Metabolomics Society 2013 Conference, Glasgow, UK, 1–13 July 2013; pp. 1–
4.
169. Draper, J.; Enot, D.P.; Parker, D.; Beckmann, M.; Snowdon, S.; Lin, W.; Zubair, H. Metabolite signal identification in accurate
mass metabolomics data with MZedDB, an interactive m/z annotation tool utilising predicted ionisation behaviour ‘rules’.
BMC Bioinform. 2009, 10, 1–16.
170. Rumble Jr, J.R.; Bickham, D.M.; Powell, C.J. The NIST x-ray photoelectron spectroscopy database. Surf. Interface Anal. 1992, 19,
241–246.
171. Sakurai, T.; Yamada, Y.; Sawada, Y.; Matsuda, F.; Akiyama, K.; Shinozaki, K.; Hirai, M.Y.; Saito, K. PRIMe update: Innovative
content for plant metabolomics and integration of gene expression and metabolite accumulation. Plant Cell Physiol. 2013, 54, e5.
172. Pérez-Alonso, M.M.; Carrasco-Loba, V.; Pollmann, S. Advances in plant metabolomics. Annu. Plant. Rev. Online 2018, 1, 557–
588.
173. Kanehisa, M.; Furumichi, M.; Tanabe, M. KEGG: New perspectives on genomes, pathways, diseases and drugs. Nucleic Acids
Res. 2017, 45, 353–361.
174. Caspi, R.; Foerster, H.; Fulcher, C.A. The MetaCyc database of metabolic pathways and enzymes and the BioCyc collection of
pathway/genome databases. Nucleic Acids Res. 2008, 36, 623–631.
175. Mueller, L.A.; Zhang, P.; Rhee, S.Y. AraCyc: A biochemical pathway database for Arabidopsis. Plant Physiol. 2003, 132, 453–460.
176. Jewison, T.; Su, Y.; Disfany, F.M. SMPDB 2.0: Big improvements to the small molecule pathway database. Nucleic Acids Res.
2014, 42, 478–484.
177. Xia, J.; Wishart, D.S. MSEA: A web-based tool to identify biologically meaningful patterns in quantitative metabolomic data.
Nucleic Acids Res. 2010, 38, 71–77.
178. Karnovsky, A.; Weymouth, T.; Hull, T. Metscape 2 bioinformatics tool for the analysis and visualization of metabolomics and
gene expression data. Bioinformatics 2012, 28, 373–380.
179. Kohl, M.; Wiese, S.; Warscheid, B. Cytoscape: Software for visualization and analysis of biological networks. Methods Mol. Biol.
2011, 696, 291–303.
180. Garcia-Alcalde, F.; Garcia-Lopez, F.; Dopazo, J. Paintomics: A web based tool for the joint visualization of transcriptomics and
metabolomics data. Bioinformatics 2011, 27, 137–139.
181. Neuweger, H.; Persicke, M.; Albaum, S.P. Visualizing post genomics data-sets on customized pathway maps by
ProMeTra-aeration-dependent gene expression and metabolism of Corynebacterium glutamicum as an example. BMC Syst. Biol.
2009, 3, 82.
182. Grapov, D.; Wanichthanarak, K.; Fiehn, O. MetaMapR: Pathway independent metabolomic network analysis incorporating
unknowns. Bioinformatics 2015, 31, 2757–2760.
183. Smoot, M.E.; Ono, K.; Ruscheinski, J.; Wang, P.L.; Ideker, T. Cytoscape 2.8: New features for data integration and network
visualization. Bioinformatics 2011, 27, 431–432.
184. Kamburov, A.; Cavill, R.; Ebbels, T.M.; Herwig, R.; Keun, H.C. Integrated pathway-level analysis of transcriptomics and
metabolomics data with IMPaLA. Bioinformatics 2011, 27, 2917–2918.
185. Letunic, I.; Yamada, T.; Kanehisa, M.; Bork, P. iPath: Interactive exploration of biochemical pathways and networks. Trends
Biochem. Sci. 2008, 33, 101–103.
186. Thimm, O.; Bläsing, O.; Gibon, Y.; Nagel, A.; Meyer, S.; Krüger, P.; Selbig, J.; Müller, L.A.; Rhee, S.Y.; Stitt, M. MAPMAN: A
user-driven tool to display genomics data sets onto diagrams of metabolic pathways and other biological processes. Plant J.
2004, 37, 914–939.

Plants 2021, 10, 2409 24 of 24
187. Chagoyen, M.; Pazos, F. MBRole: Enrichment analysis of metabolomic data. Bioinformatics 2011, 27, 730–731.
188. Ara, T.; Enomoto, M.; Arita, M.; Ikeda, C.; Kera, K.; Yamada, M.; Nishioka, T.; Ikeda, T.; Nihei, Y.; Shibata, D.; et al.
Metabolonote: A wiki-based database for managing hierarchical metadata of metabolome analyses. Front. Bioeng. Biotechnol.
2015, 3, 38.
189. Schreiber, F.; Colmsee, C.; Czauderna, T.; Grafahrend-Belau, E.; Hartmann, A.; Junker, A.; Junker, B.H.; Klapperstück, M.; Scholz, U.;
Weise, S. MetaCrop 2.0: Managing and exploring information about crop plant metabolism. Nucleic Acids Res. 2012, 40, 1173–1177.
190. Xia, J.; Wishart, D.S. MetPA: A web-based metabolomics tool for pathway analysis and visualization. Bioinformatics 2010, 26,
2342–2344.
191. Kankainen, M.; Gopalacharyulu, P.; Holm, L.; Orešič, M. MPEA—Metabolite pathway enrichment analysis. Bioinformatics 2011,
27, 1878–1879.
192. Elliott, B.; Kirac, M.; Cakmak, A.; Yavas, G.; Mayes, S.; Cheng, E.; Wang, Y.; Gupta, C.; Ozsoyoglu, G.; Meral Ozsoyoglu, Z.
PathCase: Pathways database system. Bioinformatics 2008, 24, 2526–2533.
193. Mlecnik, B.; Scheideler, M.; Hackl, H.; Hartler, J.; Sanchez-Cabo, F.; Trajanoski, Z. PathwayExplorer: Web service for
visualizing high-throughput expression data on biological pathways. Nucleic Acids Res. 2005, 33, 633–637.
194. Junker, B.H.; Klukas, C.; Schreiber, F. VANTED: A system for advanced data analysis and visualization in the context of
biological networks. BMC Bioinform. 2006, 7, 1–13.
195. Kelder, T.; Van Iersel, M.P.; Hanspers, K. WikiPathways: Building research communities on biological pathways. Nucleic Acids Res.
2012, 40, 1301–1307.
196. Razzaq, A.; Saleem, F.; Kanwal, M.; Mustafa, G.; Yousaf, S.; Imran Arshad, H.M.; Hameed, M.K.; Khan, M.S.; Joyia, F.A.
Modern trends in plant genome editing: An inclusive review of the CRISPR/Cas9 toolbox. Int. J. Mol. Sci. 2019, 20, 4045.
Copyright © 2022 FDOKUMEN