Biofuels and WTO: An Emerging Biofuels and WTO: An Emerging Biofuels and WTO: An Emerging Biofuels...
20
Biofuels and WTO: An Emerging Biofuels and WTO: An Emerging Biofuels and WTO: An Emerging Biofuels and WTO: An Emerging Biofuels and WTO: An Emerging Context Context Context Context Context R S Deshpande * Abstract: Biofuels are strongly emerging as partial substitutes for fossil fuel and this has an economic as well as environmental angle. Sooner or later, the trade angle of the biofuel sector is likely to feature in international discussions and at that time, we may have to look into the arguments that focus on trade that is associated with environmental issues. At Doha, in the Ministerial meeting under Para 51, the issue emerged though indirectly, but the literature emerging from developed countries suggests that the arguments will surface on four counts. First, it will feature in the market access context from the point of view of the net exportable countries. Second, the support measures to the farmers will get into the discussions especially in the context of comparison between developed and developing countries. These steps will provide an opportunity to some of the developed countries to push their sizeable farm subsidies under the non-actionable group putting forth the biofuel front. That will have a bearing on the Hong Kong agreement. Third, the debate may emerge in the context of technical barriers to trade as the technologies are well developed by a few countries. Lastly, the biofuel sector may also cause a flutter in the context of the neglected interface between environmental agreements (Kyoto Protocol) and WTO. This paper is only indicative of the forthcoming arguments as the use rates of biofuels are still quite low but raises a few intriguing questions. Introduction Introduction Introduction Introduction Introduction Biofuels are preferred the world over as partial substitutes to traditional fossil fuels on two major counts. First, this is a renewable fuel with least environmental externalities. Second, it is economically viable and associated with strong income transfer effects. Biofuels are now set to become the most acceptable substitute owing to the environmental advantages and economic acceptance. A number of questions are however, raised in this context. Biofuels save on the traditional fossil fuels and this will have a bearing on the trade sector. It is known that most developed and developing countries spend a huge amount of RIS Research and Information System for Developing Countries www.ris.org.in/abdr.html Asian Biotechnology and Development Review Vol. 8 No. 2, pp 77-96 © 2006, RIS. All rights reserved Printed in India * Professor, Agricultural Development and Rural Transformation Centre, Institute for Social and Economic Change, Bangalore. E-mail [email protected]
-
Upload
independent -
Category
Documents
-
view
0 -
download
0
Transcript of Biofuels and WTO: An Emerging Biofuels and WTO: An Emerging Biofuels and WTO: An Emerging Biofuels...
Biofuels and WTO: An EmergingBiofuels and WTO: An EmergingBiofuels and WTO: An EmergingBiofuels and WTO: An EmergingBiofuels and WTO: An EmergingContextContextContextContextContextR S Deshpande*
Abstract: Biofuels are strongly emerging as partial substitutes for fossilfuel and this has an economic as well as environmental angle. Sooner orlater, the trade angle of the biofuel sector is likely to feature in internationaldiscussions and at that time, we may have to look into the argumentsthat focus on trade that is associated with environmental issues. At Doha,in the Ministerial meeting under Para 51, the issue emerged thoughindirectly, but the literature emerging from developed countries suggeststhat the arguments will surface on four counts. First, it will feature in themarket access context from the point of view of the net exportablecountries. Second, the support measures to the farmers will get into thediscussions especially in the context of comparison between developedand developing countries. These steps will provide an opportunity tosome of the developed countries to push their sizeable farm subsidiesunder the non-actionable group putting forth the biofuel front. That willhave a bearing on the Hong Kong agreement. Third, the debate mayemerge in the context of technical barriers to trade as the technologies arewell developed by a few countries. Lastly, the biofuel sector may alsocause a flutter in the context of the neglected interface betweenenvironmental agreements (Kyoto Protocol) and WTO. This paper is onlyindicative of the forthcoming arguments as the use rates of biofuels arestill quite low but raises a few intriguing questions.
IntroductionIntroductionIntroductionIntroductionIntroduction
Biofuels are preferred the world over as partial substitutes to traditionalfossil fuels on two major counts. First, this is a renewable fuel withleast environmental externalities. Second, it is economically viable andassociated with strong income transfer effects. Biofuels are now set tobecome the most acceptable substitute owing to the environmentaladvantages and economic acceptance. A number of questions arehowever, raised in this context. Biofuels save on the traditional fossilfuels and this will have a bearing on the trade sector. It is known thatmost developed and developing countries spend a huge amount of
RISResearch and Information Systemfor Developing Countries
www.ris.org.in/abdr.html
Asian Biotechnology and Development ReviewVol. 8 No. 2, pp 77-96
© 2006, RIS. All rights reservedPrinted in India
* Professor, Agricultural Development and Rural Transformation Centre, Institutefor Social and Economic Change, Bangalore. E-mail [email protected]

78 Asian Biotechnology and Development Review
foreign exchange on oil imports. Therefore, these countries would liketo introduce the use of biofuels aggressively by cutting down the costof production and subsidizing the same. The effect of these measureswill impact aggregate trade, trade related issues therefore will come intoplay. It is now a well-accepted fact that biofuels have lowerenvironmental externalities and are acceptable on well-acknowledgedenvironmental standards. That brings in the issue of internationalenvironmental agreements and the increased use by environmentallyconscious countries. Increased production and use of biofuels will beprovided with incentives in the production sector and that will fetchin agreements on the aggregate measure of support. This paper is anattempt to discuss some of these issues keeping the Indian context atthe core of the discussion. We are quite aware of the limitations of thedata, of the literature in the Indian context and of the present low userates. In such a situation some of these are distant consequences, butraising the issues on this platform is yet essential.
Biofuels and Energy UseBiofuels and Energy UseBiofuels and Energy UseBiofuels and Energy UseBiofuels and Energy Use
Biodiesel is one of the main components of biofuels. It was introducedin a few countries around World War II, to power vehicles and theinterest was renewed in the recent past. Presently it is partially replacingthe traditional fuel. Biofuel is an ester-based fuel oxygenate derivedfrom renewable bio-resources such as Pongemia Pennata, Jatropha curcas,soybean, mustard, rapeseed, peanuts, other vegetable oils, and animalwaste like beef tallow (Francis, George et al. 2005). It can be used inpure form but not advised due to the problem of Polymerisation(vegetable oils contain triglycerides that end up in high oil gumminessresulting in the formation of long saturated carbon chains) andtherefore, is largely blended with petroleum diesel (petrodiesel) for usein compression-ignition (diesel) engines.1 The rationale of blendingbiofuels with the fossil fuel rests on a few counts namely: (i) ethanoland biodiesel are less damaging from the environmental point of viewdue to the composition of the emission; (ii) it provides energy securityin rural areas; (iii) it has a strong employment and income generatingeffect; (iv) the plants are soil enriching and help in arresting soildegradation; (v) its introduction answers the global concern about thegreenhouse effects, and (vi) it reduces the dependence on huge oilimports and saves foreign exchange as well as reduces dependence onthe oil exporting countries.2
79
Geothermal, wind, solar
0%
Petroleum34%
Natural Gas7%
Hydro6%Nuclear
2%
Coal51%
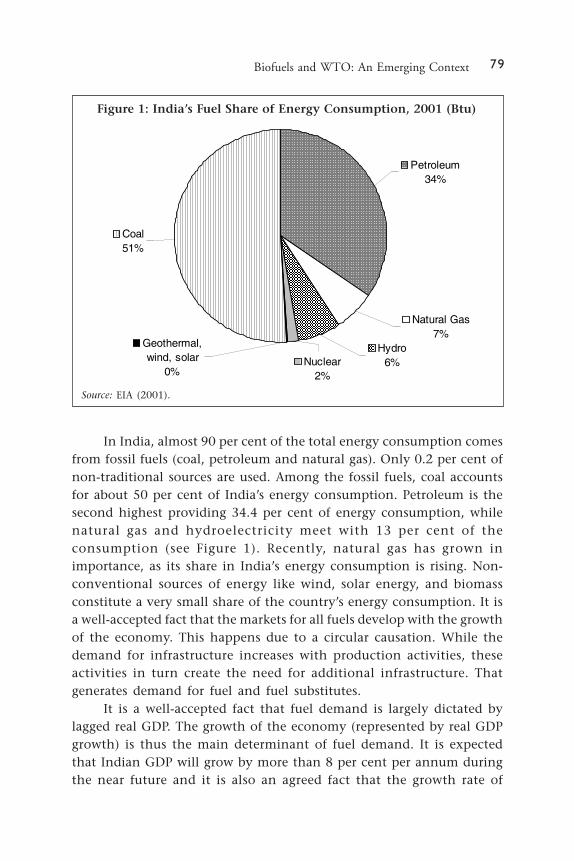
In India, almost 90 per cent of the total energy consumption comesfrom fossil fuels (coal, petroleum and natural gas). Only 0.2 per cent ofnon-traditional sources are used. Among the fossil fuels, coal accountsfor about 50 per cent of India’s energy consumption. Petroleum is thesecond highest providing 34.4 per cent of energy consumption, whilenatural gas and hydroelectricity meet with 13 per cent of theconsumption (see Figure 1). Recently, natural gas has grown inimportance, as its share in India’s energy consumption is rising. Non-conventional sources of energy like wind, solar energy, and biomassconstitute a very small share of the country’s energy consumption. It isa well-accepted fact that the markets for all fuels develop with the growthof the economy. This happens due to a circular causation. While thedemand for infrastructure increases with production activities, theseactivities in turn create the need for additional infrastructure. Thatgenerates demand for fuel and fuel substitutes.
It is a well-accepted fact that fuel demand is largely dictated bylagged real GDP. The growth of the economy (represented by real GDPgrowth) is thus the main determinant of fuel demand. It is expectedthat Indian GDP will grow by more than 8 per cent per annum duringthe near future and it is also an agreed fact that the growth rate of
Figure 1: India’s Fuel Share of Energy Consumption, 2001 (Btu)
Biofuels and WTO: An Emerging Context
Source: EIA (2001).
80 Asian Biotechnology and Development Review
demand for fuels in any country will be above half of that of GrossDomestic Product (GDP) growth. Our energy demand is thereforeexpected to grow at more than 5 per cent per annum owing to anincrease in urbanization, standard of living, and expanding population.In India, the elasticity of fuel demand was 3.06 in the First Plan andpeaked at 5.11 during the Third Plan. It came down to 1.65 in theeighties, but during the nineties, an elasticity of around 1.5 is projectedin the near future (TERI Report on Market assessment for fuel cells in India).The market for biofuels will develop out of three important conditions.First, it is the shortage and price of the fossil fuels that will make itnecessary to shift to an alternative. Second, the pollution created bythe increased density of vehicles using traditional fossil fuels will makeit obligatory to search for alternatives. Third, biofuels will automaticallylead to more vegetation and use of forest, non-forest products apartfrom bringing in proper usage of waste lands.
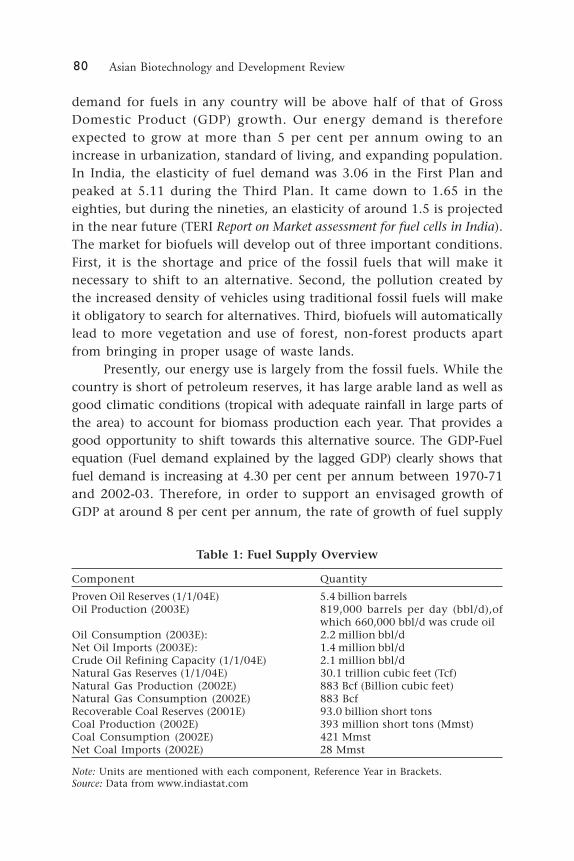
Presently, our energy use is largely from the fossil fuels. While thecountry is short of petroleum reserves, it has large arable land as well asgood climatic conditions (tropical with adequate rainfall in large parts ofthe area) to account for biomass production each year. That provides agood opportunity to shift towards this alternative source. The GDP-Fuelequation (Fuel demand explained by the lagged GDP) clearly shows thatfuel demand is increasing at 4.30 per cent per annum between 1970-71and 2002-03. Therefore, in order to support an envisaged growth ofGDP at around 8 per cent per annum, the rate of growth of fuel supply
Table 1: Fuel Supply Overview
Component Quantity
Proven Oil Reserves (1/1/04E) 5.4 billion barrelsOil Production (2003E) 819,000 barrels per day (bbl/d),of
which 660,000 bbl/d was crude oilOil Consumption (2003E): 2.2 million bbl/dNet Oil Imports (2003E): 1.4 million bbl/dCrude Oil Refining Capacity (1/1/04E) 2.1 million bbl/dNatural Gas Reserves (1/1/04E) 30.1 trillion cubic feet (Tcf)Natural Gas Production (2002E) 883 Bcf (Billion cubic feet)Natural Gas Consumption (2002E) 883 BcfRecoverable Coal Reserves (2001E) 93.0 billion short tonsCoal Production (2002E) 393 million short tons (Mmst)Coal Consumption (2002E) 421 MmstNet Coal Imports (2002E) 28 Mmst
Note: Units are mentioned with each component, Reference Year in Brackets.Source: Data from www.indiastat.com

81
needs to be about 5 per cent annually. If experience is any indicationof the fact that the present supply will not be able to meet the futuredemand of fuel by the year 2011-12. India may face severe fuel shortages,affecting all user sections such as transport, communication, as well asagriculture. But markets have still not developed for biofuels and theprocess is quite slow compared to the potential.
Biofuels and Emerging MarketsBiofuels and Emerging MarketsBiofuels and Emerging MarketsBiofuels and Emerging MarketsBiofuels and Emerging Markets
Among the well-established biofuels, ethanol is produced mainly fromcane or molasses, generally a bi-product of the sugar industry, and thusis a renewable resource. It can also be produced from starch, potatoesand even wood. Similarly, oil is usable as biofuels and could be extractedfrom other oilseeds but as the demand for edible oil outpaces its supply,it is economically not viable to use edible oil for production of bio-diesel. Alternatively, there are a few tree species, which produce seedsrich in fuel oil. Of these, some promising tree species are Jatropha curcas(Ratanjyot, Chandrajyot), Simerouba Glauca and Pongamia pinnata(‘honge’or ‘Karanja’), which are well established in India’s climaticconditions. These are largely grown on cultivable wastelands, ondegraded forest areas and could also be cultivated as a plantation aswell as grown on the sides of railway tracks, roads and bunds ofirrigation canals. Among various combinations of blended biodiesel,the most common combination is B-15 (15 per cent biodiesel with 85per cent petro-diesel). B-15 has been designated as an alternative fuel.But as the biodiesel industry is still in an infant stage and assaying intofull-fledged manufacturing processes, there are various compositionsbeing used in actual practice. Several industries and commercialestablishments such as hotels, hospitals and restaurants are alreadyusing some form of the alternative fuel and as such are potentialcustomers for such fuels.
The demand for biofuels mainly emanates from vehicles thatinclude all transportation vehicles. In India, the density of vehicleshas been growing at a very rapid rate. The growth has been phenomenalduring the nineties (see Figure 2). The increase in motor vehicles isphenomenal in the case of cars, jeeps, taxis and trucks. We can also seethis from the growth rates of motor vehicles in the country (see Table2). The demand for biofuels will be largely from buses and transportvehicles that are growing at 2.23 and 2.06 per cent per annum. Therefore,we can expect the biofuel sector to grow initially at above 8 per cent per
Biofuels and WTO: An Emerging Context

82 Asian Biotechnology and Development Review
annum and to settle down in the neighbourhood of a 5 per cent growthrate per annum in the long run.
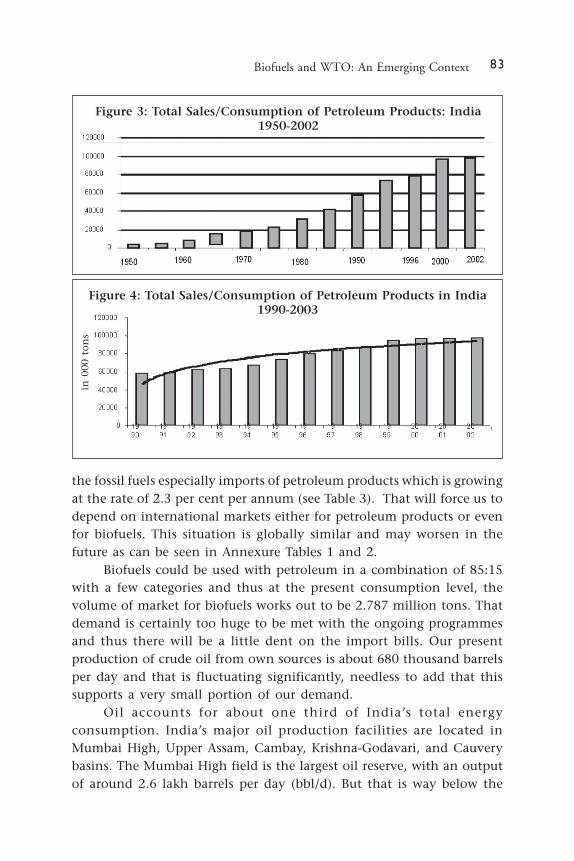
Increase in the density of motor vehicles could be visualized infive distinct phases. The first phase marks initial slow growth up to 1985-86, followed by the second phase that ended at 1990-91. The third phasebegan in 1990-91 and provides actually three distinct periods in that spanof 12 years. What we can see from Figure 2 is the sharp growth after 1995.That culminated into a high incremental demand for petroleum productsduring nineties (see Figures 3 and 4). It can be seen from the table thatincrease in the consumption of petroleum products during the ninetieshas been phenomenally high. The change is substantial in Consumptionof Liquid Petroleum Gas, Petrol Coke, High Speed Diesel Oil, Napthaand Motor Gasolene. In India, we may have to continue to depend on
Table 2: Percentage Increase and the Growth Rate of the Types ofVehicles: 1980-81 to 2002-03
Types of Vehicles Average % In]crease Growth Rate (in 000 numbers) (1990-91 to
1980-81 to 1990-91 to 2002-031989-90 2002-03
Two Wheelers 6572.70 27325.31 315.74 2.37Cars, Jeeps & Taxis 1811.20 5037.38 178.12 2.59Buses 225.90 495.23 119.23 2.23Trucks 878.40 2256.15 156.85 2.06Others 1474.10 4290.31 191.05 2.26Total 10962.30 39404.38 259.45 2.36
Source: Data from www.indiastat.com
Figure 2: All Types of Registered Motor Vehicles in India
83
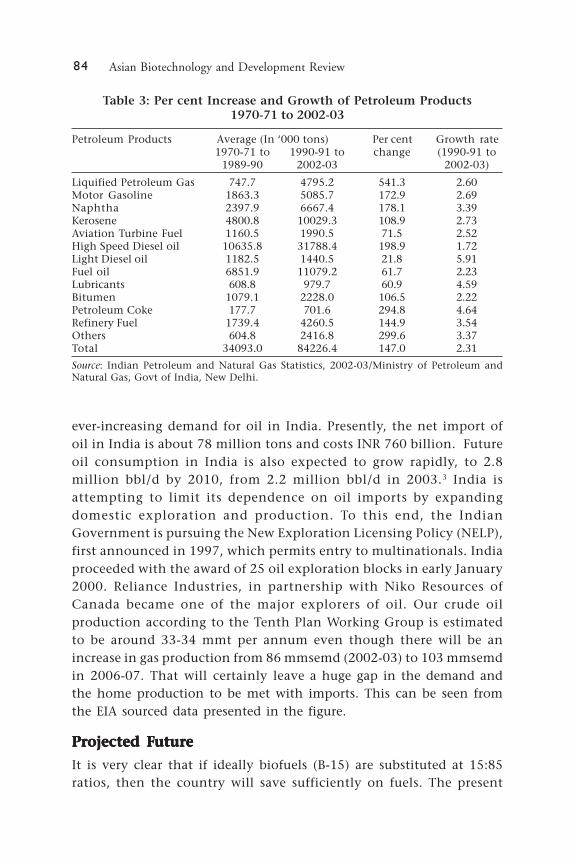
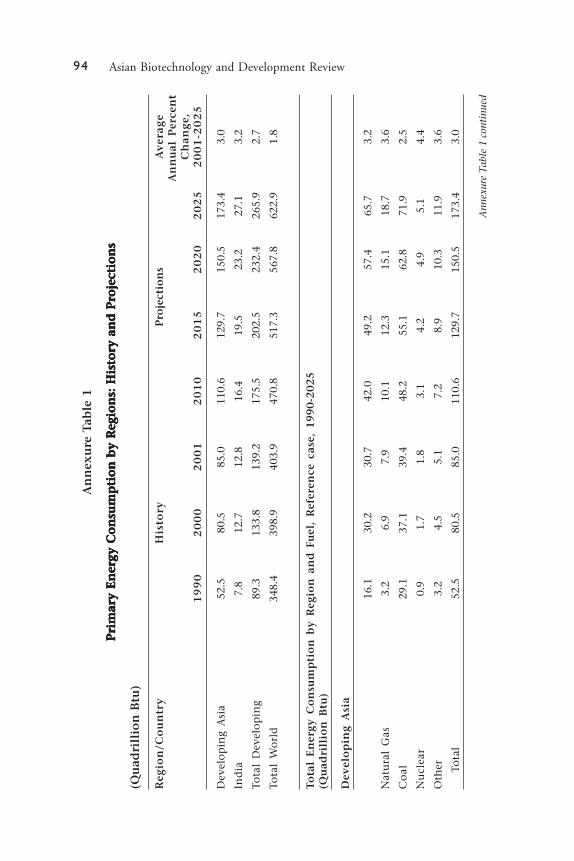
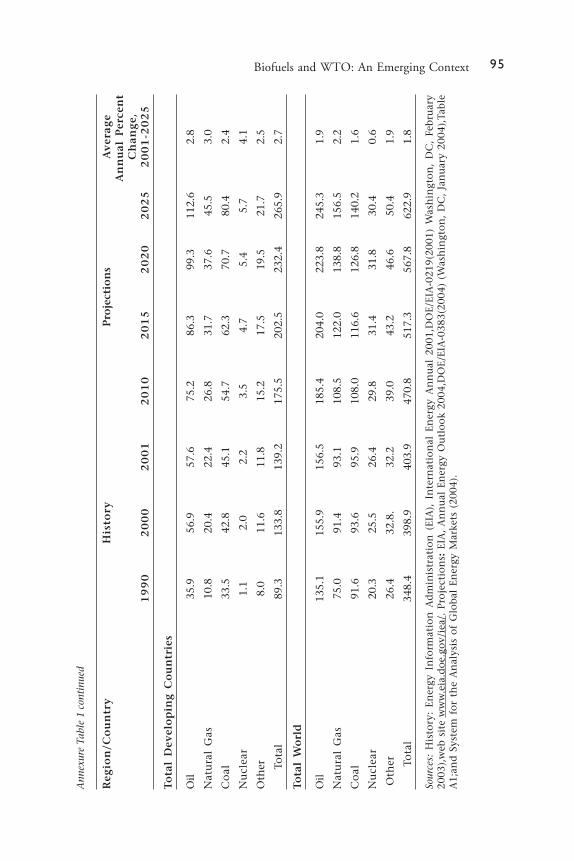
the fossil fuels especially imports of petroleum products which is growingat the rate of 2.3 per cent per annum (see Table 3). That will force us todepend on international markets either for petroleum products or evenfor biofuels. This situation is globally similar and may worsen in thefuture as can be seen in Annexure Tables 1 and 2.
Biofuels could be used with petroleum in a combination of 85:15with a few categories and thus at the present consumption level, thevolume of market for biofuels works out to be 2.787 million tons. Thatdemand is certainly too huge to be met with the ongoing programmesand thus there will be a little dent on the import bills. Our presentproduction of crude oil from own sources is about 680 thousand barrelsper day and that is fluctuating significantly, needless to add that thissupports a very small portion of our demand.
Oil accounts for about one third of India’s total energyconsumption. India’s major oil production facilities are located inMumbai High, Upper Assam, Cambay, Krishna-Godavari, and Cauverybasins. The Mumbai High field is the largest oil reserve, with an outputof around 2.6 lakh barrels per day (bbl/d). But that is way below the
Figure 3: Total Sales/Consumption of Petroleum Products: India1950-2002
Figure 4: Total Sales/Consumption of Petroleum Products in India1990-2003
in 0
00 t
on
s
Biofuels and WTO: An Emerging Context
84 Asian Biotechnology and Development Review
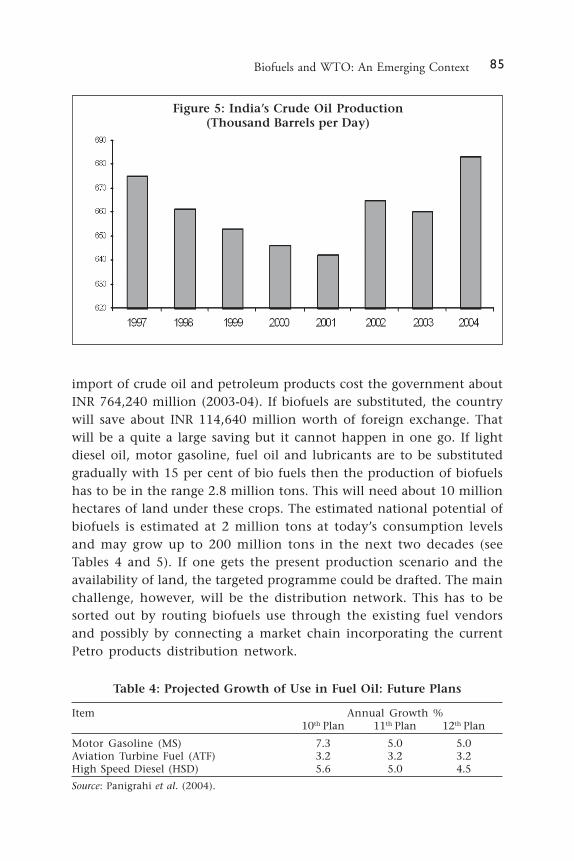
ever-increasing demand for oil in India. Presently, the net import ofoil in India is about 78 million tons and costs INR 760 billion. Futureoil consumption in India is also expected to grow rapidly, to 2.8million bbl/d by 2010, from 2.2 million bbl/d in 2003.3 India isattempting to limit its dependence on oil imports by expandingdomestic exploration and production. To this end, the IndianGovernment is pursuing the New Exploration Licensing Policy (NELP),first announced in 1997, which permits entry to multinationals. Indiaproceeded with the award of 25 oil exploration blocks in early January2000. Reliance Industries, in partnership with Niko Resources ofCanada became one of the major explorers of oil. Our crude oilproduction according to the Tenth Plan Working Group is estimatedto be around 33-34 mmt per annum even though there will be anincrease in gas production from 86 mmsemd (2002-03) to 103 mmsemdin 2006-07. That will certainly leave a huge gap in the demand andthe home production to be met with imports. This can be seen fromthe EIA sourced data presented in the figure.
Projected FutureProjected FutureProjected FutureProjected FutureProjected Future
It is very clear that if ideally biofuels (B-15) are substituted at 15:85ratios, then the country will save sufficiently on fuels. The present
Table 3: Per cent Increase and Growth of Petroleum Products1970-71 to 2002-03
Petroleum Products Average (In ‘000 tons) Per cent Growth rate1970-71 to 1990-91 to change (1990-91 to
1989-90 2002-03 2002-03)
Liquified Petroleum Gas 747.7 4795.2 541.3 2.60Motor Gasoline 1863.3 5085.7 172.9 2.69Naphtha 2397.9 6667.4 178.1 3.39Kerosene 4800.8 10029.3 108.9 2.73Aviation Turbine Fuel 1160.5 1990.5 71.5 2.52High Speed Diesel oil 10635.8 31788.4 198.9 1.72Light Diesel oil 1182.5 1440.5 21.8 5.91Fuel oil 6851.9 11079.2 61.7 2.23Lubricants 608.8 979.7 60.9 4.59Bitumen 1079.1 2228.0 106.5 2.22Petroleum Coke 177.7 701.6 294.8 4.64Refinery Fuel 1739.4 4260.5 144.9 3.54Others 604.8 2416.8 299.6 3.37Total 34093.0 84226.4 147.0 2.31
Source: Indian Petroleum and Natural Gas Statistics, 2002-03/Ministry of Petroleum andNatural Gas, Govt of India, New Delhi.
85
import of crude oil and petroleum products cost the government aboutINR 764,240 million (2003-04). If biofuels are substituted, the countrywill save about INR 114,640 million worth of foreign exchange. Thatwill be a quite a large saving but it cannot happen in one go. If lightdiesel oil, motor gasoline, fuel oil and lubricants are to be substitutedgradually with 15 per cent of bio fuels then the production of biofuelshas to be in the range 2.8 million tons. This will need about 10 millionhectares of land under these crops. The estimated national potential ofbiofuels is estimated at 2 million tons at today’s consumption levelsand may grow up to 200 million tons in the next two decades (seeTables 4 and 5). If one gets the present production scenario and theavailability of land, the targeted programme could be drafted. The mainchallenge, however, will be the distribution network. This has to besorted out by routing biofuels use through the existing fuel vendorsand possibly by connecting a market chain incorporating the currentPetro products distribution network.
Figure 5: India’s Crude Oil Production(Thousand Barrels per Day)
Table 4: Projected Growth of Use in Fuel Oil: Future Plans
Item Annual Growth %10th Plan 11th Plan 12th Plan
Motor Gasoline (MS) 7.3 5.0 5.0Aviation Turbine Fuel (ATF) 3.2 3.2 3.2High Speed Diesel (HSD) 5.6 5.0 4.5
Source: Panigrahi et al. (2004).
Biofuels and WTO: An Emerging Context
86 Asian Biotechnology and Development Review
International AgreementsInternational AgreementsInternational AgreementsInternational AgreementsInternational Agreements
One of the main issues that surfaces here for discussion is the role thatbiofuels will play in the context of international agreements. TheCartagena Protocol on Biosafety, which is commonly called as theBiosafety Protocol (BSP), is a multilateral environmental agreement thatentered into force on 11 September 2003 after 50 countries ratified it.By 28 July 2004 there were 105 parties agreeing to the discipline of theCartagena Protocol on Biosafety (BSP) (Canada signed the BSP but neverratified it and the US was never a party to it). The BSP explicitly allowscountries to use the Precautionary Principle and allows countries to blockproducts that have used unacceptable technology anywhere in itsproduction. Therefore, the BSP will not be having any direct consequencesfor the biofuel sector. However, the part of the agreement that concernson environmental quality may have to be considered here as having aclear bearing. Biofuels have implications for producers as well as theusers of biofuels. For the producers it will be a question relating tofinding markets and sustaining them, whereas the net importer mayhave to accept the quality and demand generated elsewhere. The Kyotoprotocol, however, will have a clear bearing on the biofuel sector andwill boost demand for biofuels. The Kyoto Protocol requires that
Table 5: Projected Fuel Requirements and Domestic Supply
Item Projection in thousand MT Domestic supply %2002-02 2006-07 2011-12 2016-17 10th Plan 11th Plan 12th Plan
MS 7070 10067 12848 16398 22.2 Lower than 10th
ATF 2299 2691 3150 3687 22.2 Plan projectionHSD 39815 52324 66905 83575 22.2 If foreign JV is ignoredNG 81.33 179 313 47.9
Source: Panigrahi et al. (2004).
Figure 6: Net Import Value of Crude Oil in India

87
developed countries must reduce their greenhouse gas emissions by atleast 5 per cent from the 1990 levels during the commitment period2008-12. That would become obligatory and will certainly feature inthe coming negotiations. In addition to these, the general disciplineof trade and tariff will also operate in this context.
TTTTTrade and Forrade and Forrade and Forrade and Forrade and Foreign Exchangeeign Exchangeeign Exchangeeign Exchangeeign Exchange
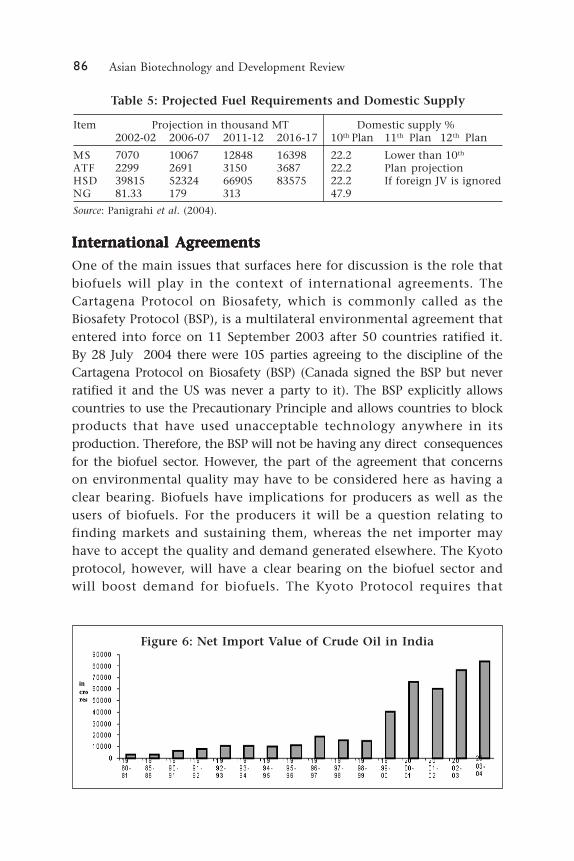
Biofuels will enter the trade discipline not only as a commodity but asa category which will have significant economic and environmentalimplications. It is well known that oil prices and oil imports significantlyinfluence the macro-economic parameters in developed as well as thedeveloping world. The sensitivity of macro-economic parameters ofdeveloping countries to oil stocks is more critical. Among the macroeconomic aspects, Balance of Trade is quite an important determinantof countries trade performance. India had an adverse Trade Balanceduring the last three decades and a large share of this was contributedto by the oil sector. India has to depend largely on import of crude oiland such imports increased sharply during the nineties. The total importof the quantity of crude oil was 20,699 thousand m tons in 1990-91which increased to 90,434 thousand tons in 2003-04 (see Figure 6). Theforeign exchange spent on this trade was INR 61 billion in 1990-91 andthat increased to INR 835 billion in 2003-04.
It becomes obvious that the oil sector is quite crucial for the tradebalance (see Figure 7). The relationship between the aggregate trade
Figure 7: Trends in the Balance of Trade andValue of Net Oil Import
Biofuels and WTO: An Emerging Context
88 Asian Biotechnology and Development Review
balance and value of net imports of oil sector is quite strong and thecorrelation works out to be 0.84 (significant at 1 per cent level ofsignificance). In this context, the substitution of biofuels will influencetrade balance though not substantially, at least by 15 per cent if oneexcludes the spill over effects.
The transport sector remains the most problematic sector as thesearch for an economical alternative to petroleum-based fuel has beenunsuccessful so far. Hence petro-based fuels will continue to dominatethe transport sector in the foreseeable future but their consumptioncan be minimized by implementation of the bio-fuels programmeexpeditiously.
Global Policy Environment and WTOGlobal Policy Environment and WTOGlobal Policy Environment and WTOGlobal Policy Environment and WTOGlobal Policy Environment and WTO
Biofuels have not been discussed in any global policy environmentexplicitly. However, there are sufficient leads that indicate the possibilityof biofuels emerging on the scene sooner or later. In the global policyenvironment, bio-fuels are pertinent from three distinct perspectives.First, as discussed above it may be considered in the context ofenvironmental agreements, due to its dependence on the biomass,reduction of harmful emissions and the impact on the forest use. It isfeared that the utility of certain species may lead to their overexploitation but at the same time its positive effect on green-housegases will also be weighted. Second, the emission standards in the caseof biofuels also features as an important point for discussion. It is statedin an official Report of the India’s Planning Commission that theemission standards are globally accepted and that may boost the use ofbiofuels.4 Third, since biofuels will be largely substituting the fossilfuels the trade angle enters into picture. This will bring in argumentsabout the support to the industry as well as the tariff discipline. Thatalso provokes discussion of the policy in the WTO forum.
Biodiesel is now a tradable commodity with significant economicand environmental implications. It gets included in environmentalgoods and services. Bio-diesel is one component of biofuels and achemical compound (an ester) that can be made from vegetable oilsand animal fats. Bio-diesel can be used in its pure form or mixed withtraditional fuels. Biofuels have a significant impact on the emissionlevels and these reduce the harmful gases to a large extent. These positiveimplications on environment brings biodiesel into the internationaldebate. In the Kyoto Protocol, it is stated that the developed countries
89
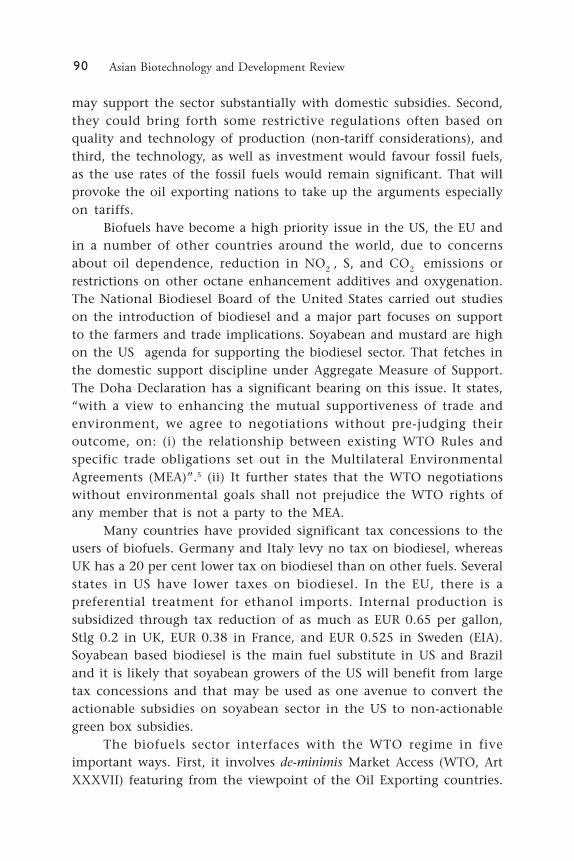
should reduce their emission levels. The CO2; NO2; and SO2 emissionstandards are agreed upon and that would become obligatory (see Table6). Many of these countries have already passed specific legislationestablishing voluntary or mandatory replacement of fossil fuels bybiofuels. Importing biofuels from other, mainly developing countries,could help them reach their targets. However, many biofuel exportingcountries still face technical trade barriers. To prevent asymmetrybetween trade liberalization objectives and Kyoto Protocol reductiontargets, new approaches and policy space are warranted in order toensure that trade liberalization efforts and policies in implementingthe Kyoto Protocol become truly and mutually supportive. Even thoughthis belongs to environmental standards, it will certainly feature in thecoming WTO negotiations. The main pollutants emitted in thecombustion of fossil fuels are carbon, sulphur, and nitrogen oxides,along with suspended particles.
As a secondary pollutant, ozone is formed in the troposphere frominteraction among hydrocarbons, nitrogen oxides and sunlight. Thesehave significant impact on human health. Therefore, biofuels arejustified on health and environmental grounds. As the developingcountries use a lower amount of fossil fuels, the pollution levels arealso quite low here; pressure may therefore be mounted, on the developedworld.
The experience of many countries including Brazil show thatbiofuels could be produced at a low cost and the cost of productiondecreases over the years. Therefore, developing countries could takeadvantage of biofuels by producing for the purpose of trade.Notwithstanding all the advantages, biofuels are likely to face significanttrade barriers from developed countries. First, the developed countriesare almost fully dependent on indigenous producers and therefore,
Table 6: Emission Reduction due to use of Biofules
Emission Reduction (%)
CO 67HCHydrocarbons 30PM Particulate matter 68SOOT 50PAH 85CO2 100NO2 2-6S 8-100
Source: CETESB, 2004.
Biofuels and WTO: An Emerging Context
90 Asian Biotechnology and Development Review
may support the sector substantially with domestic subsidies. Second,they could bring forth some restrictive regulations often based onquality and technology of production (non-tariff considerations), andthird, the technology, as well as investment would favour fossil fuels,as the use rates of the fossil fuels would remain significant. That willprovoke the oil exporting nations to take up the arguments especiallyon tariffs.
Biofuels have become a high priority issue in the US, the EU andin a number of other countries around the world, due to concernsabout oil dependence, reduction in NO2 , S, and CO2 emissions orrestrictions on other octane enhancement additives and oxygenation.The National Biodiesel Board of the United States carried out studieson the introduction of biodiesel and a major part focuses on supportto the farmers and trade implications. Soyabean and mustard are highon the US agenda for supporting the biodiesel sector. That fetches inthe domestic support discipline under Aggregate Measure of Support.The Doha Declaration has a significant bearing on this issue. It states,“with a view to enhancing the mutual supportiveness of trade andenvironment, we agree to negotiations without pre-judging theiroutcome, on: (i) the relationship between existing WTO Rules andspecific trade obligations set out in the Multilateral EnvironmentalAgreements (MEA)”.5 (ii) It further states that the WTO negotiationswithout environmental goals shall not prejudice the WTO rights ofany member that is not a party to the MEA.
Many countries have provided significant tax concessions to theusers of biofuels. Germany and Italy levy no tax on biodiesel, whereasUK has a 20 per cent lower tax on biodiesel than on other fuels. Severalstates in US have lower taxes on biodiesel. In the EU, there is apreferential treatment for ethanol imports. Internal production issubsidized through tax reduction of as much as EUR 0.65 per gallon,Stlg 0.2 in UK, EUR 0.38 in France, and EUR 0.525 in Sweden (EIA).Soyabean based biodiesel is the main fuel substitute in US and Braziland it is likely that soyabean growers of the US will benefit from largetax concessions and that may be used as one avenue to convert theactionable subsidies on soyabean sector in the US to non-actionablegreen box subsidies.
The biofuels sector interfaces with the WTO regime in fiveimportant ways. First, it involves de-minimis Market Access (WTO, ArtXXXVII) featuring from the viewpoint of the Oil Exporting countries.

91
The international market for fossil fuels is well organized and any large-scale intervention in this situation is likely to be strongly resented. Butprobably that is a distant possibility due to the lower limits in theprovision as well as the size of trade. Therefore, this issue may notcome up for discussion in the immediate future, at least under thisprovision. The second issue arises from the Domestic Support angle,and here there is a possibility that trade in fuels may get restricted dueto the possible generous support to the biofuels sector. The aggrievedcountries may consider these as trade distorting support mechanismsand therefore these supports have to be classified into non-actionablegroups or ‘Green Box’ with the help of the environmental sustainabilityargument. The developed countries may pick up this argument wellbefore the developing countries could think about it. Nathanael in theReport on Growing Energy prepared recently, clearly indicates that theUS should take advantage of the environmental angle to push thesubsidies provided to farmers under non-actionable group.6 Third, fromthe Sanitary and Phyto-Sanitary agreement point of view, acceptablestandards of these biofuels have to be fixed before it gets into the tradediscipline. These have to be internationally agreed standards. It isconceived by many that biofuels will be produced under the small-scalesector and if that happens then these standards will have toaccommodate the conditions prevailing in the production system. Thefourth issue crops up from the IPR regime of the WTO. Here the productpatents have to be viewed before embarking on large-scale productionof the product, if the production process as well as the product is goingto be standardized. Last, the environmental angle and carbon tradingarguments may enter in to the picture. The world community isdiscussing the Kyoto protocol and the emission discipline incorporatedin it is the carbon trading argument. The protocol has set bindingtargets for reductions of emissions that each developed country has tocommit and to endevour for such reductions. The protocol also providesinstitutions such as Clean Development Mechanism, JointImplementation System and Emission Trading to promote activities formitigating harmful impacts and deal with the impact of climatic change.These are likely to interface with the WTO discipline when the interestedcountries insist on the same. As such the Kyoto protocol has all thatmaterial needed for the trade regulation with environmental standardsand that is the central point of the WTO discipline. Canada in 1999suggested the setting up of a working group on biotechnology to find
Biofuels and WTO: An Emerging Context
92 Asian Biotechnology and Development Review
out the adequacy and effectiveness of the existing WTO rules as well asthe capacity of the member countries to implement these rules.7 If thegroup is established it may have to consider all these aspects.
A significant development is that the Doha declaration paysattention to the issue though indirectly by stating that,
“With a view to enhancing the mutual supportiveness oftrade and environment, we agree to negotiations, withoutprejudging their outcome, on: (i) the relationship betweenexisting WTO rules and specific trade obligations set out inMultilateral Environmental Agreements (MEAs). Thenegotiations shall be limited in scope to the applicability ofsuch existing WTO rules as among parties to the MEA inquestion. The negotiations shall not prejudice the WTO rightsof any Member that is not a party to the MEA in question;(ii) procedures for regular information exchange betweenMEA Secretariats and the relevant WTO committees, and thecriteria for the granting of observer status; (iii) the reductionor, as appropriate, elimination of tariff and non-tariff barriersto environmental goods and services”.8
Finally, biofuels have a great promise with its positiveenvironmental implications and with the present low use rates it is notfeaturing in the international agreements boldly. Sooner or later itwill, however, feature prominently on environmental as well as tradenegotiations significantly. Technology as well as the quality aspectswill also emerge significantly during these arguments. We may have towait and watch as India has miles to go before we meet even the basicdemand.
EndnotesEndnotesEndnotesEndnotesEndnotes1 EIA, 2001.2 Panigrahi et al., 2004, Govt of India, 2003, and Kumar, Senthil et al. 2003.3 Tiwari, 2002.4 GoI, Planning Commission, 2003.5 WTO, 2001.6 Nathanael et al., Dec 2004.7 WTO, WT/GC/3/359/, 12th October, 1999.8 World Trade Organization, Ministerial Declaration, 2001.
ReferencesReferencesReferencesReferencesReferencesCETESDB. 2004. Report of the Saopaulo State Environment Agency. Saupaulo Brazil.EIA. 2001. “International Energy Annual 2001”, DOE / EIA-0219, Energy Information
Administration, Washington, DC.
93
EIA. 2003. Energy Information Administration, February 2003. www.eia.doe.gov/iea/EIA. 2004. “Annual Energy Outlook: 2004”, DOE/EIA-0383, Energy Information
Administration, Washington,DC, January.Francis, George, Raphael Edinger and Klaus Becker. 2005. “A Concept for Simultaneous
Wasteland Reclamation, Fuel Production, and Socio-Economic Development inDegraded Areas in India: Need, Potential and Perspectives of Jatropha Plantations”.Natural Resources Forum, Vol 29, pp12-24.
Government of India. 2005. Information from Various Ministries and PlanningCommission, www.indiaimage.nic.in.
Government of India. 2003. Report of the Committee of Development of Bio Fuel: PlanningCommission, Govt of India, New Delhi.
Kumar, Senthil, M. A. Ramesh and B. Nagalingam. 2003. “An Experimental Comparisonof Methods to Use Methanol and Jatropha Oil in Compression Ignition Engine”.Biomass & Energy, Vol 25, pp 309-18.
MoF. 2005. Economic Survey, Government of India, Ministry of Finance, New Delhi.Nathanael Greene and others. 2004. “Growing Energy: How Biofuels can help End
America’s Oil Dependence”, Natural Resource Defence Council, New York.Panigrahi, Srikanta, K. 2004. “Introduction of Biofuels in India”, Planning Commission,
Government of India, New Delhi.Panigrahi, Srikanta K. J. Mohan Reddy and P. Narendras. 2004. “Energy Security,
Environmental Benefits and Carbon Trading potentials of Biofuels in India”. APaper presented at the International Conference on Biofuels, Perspectives andProspects, September 16-17, New Delhi.
Tiwari, D.N. 2002. “Biofuels for India: Ethanol and Biodiesels”. Keynote address atInternational Conference on Biofuels-Driving India’s future, 7-9 November, NewDelhi.
World Trade Organization. 2001. Ministerial Declaration, Ministerial Conference,Fourth Session, Doha, 9-14 November and WT/MIN (01)/DEC/1, 20 November.www.worldenergy.org/wec-geis/focus/wssd/goldemberg.pdf
Biofuels and WTO: An Emerging Context
94 Asian Biotechnology and Development Review
An
nex
ure
Tab
le 1
Pri
mar
y E
ner
gy C
on
sum
pti
on
by
Reg
ion
s: H
isto
ry a
nd
Pro
ject
ion
sP
rim
ary
En
ergy
Co
nsu
mp
tio
n b
y R
egio
ns:
His
tory
an
d P
roje
ctio
ns
Pri
mar
y E
ner
gy C
on
sum
pti
on
by
Reg
ion
s: H
isto
ry a
nd
Pro
ject
ion
sP
rim
ary
En
ergy
Co
nsu
mp
tio
n b
y R
egio
ns:
His
tory
an
d P
roje
ctio
ns
Pri
mar
y E
ner
gy C
on
sum
pti
on
by
Reg
ion
s: H
isto
ry a
nd
Pro
ject
ion
s
(Qu
adri
llio
n B
tu)
Reg
ion
/Co
un
try
His
tory
Pro
ject
ion
sA
ver
ag
eA
nn
ual
Per
cen
tC
ha
ng
e,1
99
02
00
02
00
12
01
02
01
52
02
02
02
52
00
1-2
02
5
Dev
elo
pin
g A
sia
52.5
80.5
85.0
110.
612
9.7
150.
517
3.4
3.0
Ind
ia7.
812
.712
.816
.419
.523
.227
.13.
2
Tota
l D
evel
op
ing
89.3
133.
813
9.2
175.
520
2.5
232.
426
5.9
2.7
Tota
l W
orl
d34
8.4
398.
940
3.9
470.
851
7.3
567.
862
2.9
1.8
To
tal
En
ergy
Co
nsu
mp
tio
n b
y R
egio
n a
nd
Fu
el,
Ref
eren
ce c
ase,
19
90
-20
25
(Qu
adri
llio
n B
tu)
Dev
elo
pin
g A
sia
16.1
30.2
30.7
42.0
49.2
57.4
65.7
3.2
Nat
ura
l G
as3.
26.
97.
910
.112
.315
.118
.73.
6
Co
al29
.137
.139
.448
.255
.162
.871
.92.
5
Nu
clea
r0.
91.
71.
83.
14.
24.
95.
14.
4
Oth
er3.
24.
55.
17.
28.
910
.311
.93.
6
To
tal
52.5
80.5
85.0
110.
612
9.7
150.
517
3.4
3.0
Ann
exur
e Ta
ble
1 co
ntin
ued
95
Reg
ion
/Co
un
try
His
tory
Pro
ject
ion
sA
ver
ag
eA
nn
ual
Per
cen
tC
ha
ng
e,1
99
02
00
02
00
12
01
02
01
52
02
02
02
52
00
1-2
02
5
To
tal
Dev
elo
pin
g C
ou
ntr
ies
Oil
35.9
56.9
57.6
75.2
86.3
99.3
112.
62.
8
Nat
ura
l G
as10
.820
.422
.426
.831
.737
.645
.53.
0
Co
al33
.542
.845
.154
.762
.370
.780
.42.
4
Nu
clea
r1.
12.
02.
23.
54.
75.
45.
74.
1
Oth
er8.
011
.611
.815
.217
.519
.521
.72.
5
To
tal
89.3
133.
813
9.2
175.
520
2.5
232.
426
5.9
2.7
Tota
l W
orl
d
Oil
135.
115
5.9
156.
518
5.4
204.
022
3.8
245.
31.
9
Nat
ura
l G
as75
.091
.493
.110
8.5
122.
013
8.8
156.
52.
2
Co
al91
.693
.695
.910
8.0
116.
612
6.8
140.
21.
6
Nu
clea
r20
.325
.526
.429
.831
.431
.830
.40.
6
Oth
er26
.432
.8.
32.2
39.0
43.2
46.6
50.4
1.9
T
ota
l34
8.4
398.
940
3.9
470.
851
7.3
567.
862
2.9
1.8
Sour
ces:
His
tory
: En
ergy
In
form
atio
n A
dm
inis
trat
ion
(EI
A),
In
tern
atio
nal
En
ergy
An
nu
al 2
001,
DO
E/EI
A-0
219(
2001
) W
ash
ingt
on
, D
C,
Feb
ruar
y20
03),
web
sit
e w
ww
.eia
.do
e.go
v/ie
a/.
Pro
ject
ion
s: E
IA,
An
nu
al E
ner
gy O
utl
oo
k 20
04,D
OE/
EIA
-038
3(20
04)
(Was
hin
gto
n,
DC
, Ja
nu
ary
2004
),Ta
ble
A1;
and
Sys
tem
fo
r th
e A
nal
ysis
of
Glo
bal
En
ergy
Mar
kets
(20
04).
Ann
exur
e Ta
ble
1 co
ntin
ued
Biofuels and WTO: An Emerging Context

96 Asian Biotechnology and Development ReviewA
nn
exu
rA
nn
exu
rA
nn
exu
rA
nn
exu
rA
nn
exu
r e Te T
e T
e T
e T a
ble
2:
Oil
Co
nsu
mp
tio
n b
y R
egio
ns:
His
tor
able
2:
Oil
Co
nsu
mp
tio
n b
y R
egio
ns:
His
tor
able
2:
Oil
Co
nsu
mp
tio
n b
y R
egio
ns:
His
tor
able
2:
Oil
Co
nsu
mp
tio
n b
y R
egio
ns:
His
tor
able
2:
Oil
Co
nsu
mp
tio
n b
y R
egio
ns:
His
tor y
an
d P
ry
an
d P
ry
an
d P
ry
an
d P
ry
an
d P
r oje
ctio
ns
oje
ctio
ns
oje
ctio
ns
oje
ctio
ns
oje
ctio
ns
(M
illi
on
Bar
rels
per
Day
)
Reg
ion
/Co
un
try
His
tory
Pro
ject
ion
sA
ver
age
ann
ual
Per
cen
t C
han
ge,
19
90
20
00
20
01
20
10
20
15
20
20
20
25
20
01
-20
25
Dev
elo
pin
g A
sia
7.6
14.5
14.8
20.2
23.7
27.6
31.6
3.2
Ind
ia1.
22.
12.
12.
83.
54.
45.
33.
9To
tal
Dev
elo
pin
g17
.327
.627
.936
.441
.848
.154
.52.
8To
tal
Wo
rld
66.1
76.9
77.1
91.4
100.
511
0.3
120.
91.
9N
atu
ral
Gas
Co
nsu
mp
tio
n b
y R
egio
n,
Ref
erN
atu
ral
Gas
Co
nsu
mp
tio
n b
y R
egio
n,
Ref
erN
atu
ral
Gas
Co
nsu
mp
tio
n b
y R
egio
n,
Ref
erN
atu
ral
Gas
Co
nsu
mp
tio
n b
y R
egio
n,
Ref
erN
atu
ral
Gas
Co
nsu
mp
tio
n b
y R
egio
n,
Ref
eren
ce C
ase,
19
90
-20
25
ence
Cas
e,1
99
0-2
02
5en
ce C
ase,
19
90
-20
25
ence
Cas
e,1
99
0-2
02
5en
ce C
ase,
19
90
-20
25
(T
rill
ion
Cu
bic
Fee
t)
Dev
elo
pin
g C
ou
ntr
ies
Dev
elo
pin
g A
sia
3.0
6.6
7.5
9.5
11.6
14.1
17.4
3.5
Ind
ia0.
40.
80.
81.
21.
62.
02.
54.
8To
tal
Dev
elo
pin
g10
.119
.321
.225
.229
.835
.342
.62.
9To
tal
Wo
rld
73.4
88.7
90.3
105.
111
8.1
134.
215
1.1
2.2
Co
al C
on
sum
pti
on
by
Reg
ion
, R
efer
Co
al C
on
sum
pti
on
by
Reg
ion
, R
efer
Co
al C
on
sum
pti
on
by
Reg
ion
, R
efer
Co
al C
on
sum
pti
on
by
Reg
ion
, R
efer
Co
al C
on
sum
pti
on
by
Reg
ion
, R
efer
ence
Cas
e,1
99
0-2
02
5
ence
Cas
e,1
99
0-2
02
5
ence
Cas
e,1
99
0-2
02
5
ence
Cas
e,1
99
0-2
02
5
ence
Cas
e,1
99
0-2
02
5
(Mil
lio
n S
ho
rt T
on
s)
Dev
elo
pin
g A
sia
1,59
01,
959
2,08
42,
553
2,92
83,
343
3,83
42.
6In
dia
242
359
360
430
484
543
611
2.2
Tota
l D
evel
op
ing
1,83
52.
275
2,40
12,
918
3,33
03,
780
4,30
32.
5To
tal
Wo
rld
5,30
75,
115
5,26
35,
881
6,33
56,
862
7,57
41.
5N
ucl
ear
En
erg
y c
on
sum
pti
on
by
Reg
ion
, R
efer
ence
Cas
e,1
99
0-2
02
5(B
illi
on
Kil
ow
att
ho
urs
)
Dev
elo
pin
g A
sia
8817
117
829
940
647
349
74.
4In
dia
614
1846
5566
665.
5To
tal
Dev
elo
pin
g10
519
520
933
945
551
854
94.
1To
tal
Wo
rld
1,90
52,
434
2,25
12,
838
2,99
43,
032
2,90
60.
6
Sour
ces:
His
tory
: En
ergy
In
form
atio
n A
dm
inis
trat
ion
(EI
A),
Inte
rnat
ion
al E
ner
gy A
nn
ual
200
1,D
OE/
EIA
-021
9(20
01)
Was
hin
gto
n,
DC
,Fe
bru
ary
2003
),w
eb s
ite
ww
w.e
ia.d
oe.
gov/
iea/
. Pr
oje
ctio
ns:
EIA
, A
nn
ual
En
ergy
Ou
tlo
ok
2004
,DO
E/EI
A-0
383(
2004
) (W
ash
ingt
on
, D
C,
Jan
uar
y 20
04),
Tab
le A
1;an
d S
yste
m f
or
the
An
alys
is o
f G
lob
al E
ner
gy M
arke
ts (
2004
).