Solid biofuels residential energy consumption model - NET
36
1 | P a g e Solid biofuels residential energy consumption model Concept note March 2022 Authors: ADAM Zakia 1 –Statistics Manager ODOU Thierry 2 – Associated consultant BETANCOURT Maria – Energy Analyst Intern 1 [email protected] 2 [email protected]
-
Upload
khangminh22 -
Category
Documents
-
view
3 -
download
0
Transcript of Solid biofuels residential energy consumption model - NET

1 | P a g e
Solid biofuels residential energy consumption model
Concept note
March 2022
Authors:
ADAM Zakia 1 –Statistics Manager
ODOU Thierry 2 – Associated consultant
BETANCOURT Maria – Energy Analyst Intern

2 | P a g e
Table of contents
Introduction ........................................................................................................................... 3
The Sustainable Development Goals (SDG) ......................................................................... 7
Drivers of biomass demand ................................................................................................... 8
Harmonisation of variables and conversion of units ............................................................... 9
Variables considered for performing a comprehensive model ............................................. 11
Data challenges .................................................................................................................. 11
Model scope ........................................................................................................................ 12
Methodology........................................................................................................................ 12
Modules .............................................................................................................................. 16
Running the model .............................................................................................................. 19
References .......................................................................................................................... 29
Key definitions ..................................................................................................................... 31
Annexes .............................................................................................................................. 32
Model output ................................................................................................................ 32
Household specific consumption per fuel type of references countries ......................... 36

Introduction The present concept note focuses on the production of reliable and accurate data for solid biofuels in a set of Sub-Saharan African countries. The African continent accounts for the consumption for about 50% of the solid biofuels consumed worldwide, having 82% of its population relying on it for heating and cooking. In Sub-Saharan Africa alone, roughly 95% of the population depends on solid biofuels in the form of fuelwood, charcoal and residues. Therefore, having accurate data sets to measure solid biofuel’s share of the energy mix is key to developing policies and assessing sustainability goals. However, the continent suffers from a systematic lack of data, with the reported data often not harmonized across countries and collected from outdated surveys. In general, the IEA collects data primarily from statistical releases from national administrations and uses secondary sources and estimations to complement IEA data where official data are not available. Robust or recent energy demand data are hard to find, and in many cases, the level of detail is not sufficient to give a clear picture of energy consumption.
of Figure 1: Percentage of developing world relying on solid biofuels (average 2012 – 2013) Source: The World Bank, 2014)
The International Energy Agency (IEA) is implementing a 4-year program co-funded by the European Commission titled “An Affordable and Sustainable Energy System for Sub-Saharan Africa”. The programme aims to improve energy data management and long-term energy planning in 10 countries: Benin, Democratic Republic of Congo (DRC), Ethiopia, Ghana, Kenya, Nigeria, Rwanda, Senegal, Uganda and Zambia. The activities under the program include capacity development to reinforce in-country capabilities in energy information management, energy modelling, as well as measuring progress towards SDG-7, NDCs and other energy policy goals.
The programme activities also include a strong push for energy data improvement at the country level by cooperating directly with country administrations, identifying new data sources and particularly developing estimation tools for residential solid biofuels consumption.

Solid biofuels remain the main source of energy for cooking purposes in Africa and are estimated to cover up to 90% of the energy mix in some African countries. We found three main categories used in the African continent, being wood (or the so-called fuelwood or firewood), charcoal and residues from the agricultural sector. Its demand has been growing along with the population, and it is expected to keep growing. Urbanisation is a phenomenon that has been taking place also and has been displacing fuelwood to be replaced with charcoal in urban areas. Thus, these fuels are still crucial in the energy mix in the country, and understanding the demand is essential to promote the energy transition. In Table 1, a rough panorama of the country is outlined (IEA, 2021a).
Table 1: Biomass and waste share in the 10 selected Sub-Saharan African countries
Biomass and waste share in total energy supply (TES) for selected Sub-Saharan countries, 2018
Selected country Biomass share in total primary energy supply
Benin 51.60% DRC 94.70% Ethiopia 91.60% Ghana 39% Kenya 64.70% Nigeria 74.80% Rwanda 74.40% Senegal 45.10% Uganda 91.20% Zambia 70.30%
Additionally, most of the energy mix is used for residential purposes. This is a result of low-income developing countries, in which the industry accounts for a little portion of the total energy demand. Moreover, the aforementioned countries consumed up to 90% of the energy at a residential level, in which 80% of the energy expenditure is burnt to satisfy the cooking demand (Garba & Bellingham, 2021).

Figure 2: Share population relying on different fuels, 2015 Source: (IEA, 2015)
The extended use of biomass to satisfy the energy needs in such countries has triggered a set of concerns in terms of health and environmental issues:
1. Indoor air pollution: Household air pollution (HAP) is the second most common cause of disability and the third one in avoidable deaths. The EPA has determined that the standardised use of solid biomass in burning processes for cooking and heating purposes release large amounts of pollutants, like particulate matter (PM), nitrogen oxides (NOx), carbon monoxide (CO), sulphur dioxide (SO2), lead, mercury, and other 187 hazardous air pollutants (Partnership for Policy Integrity, 2011).

Figure 3: WHO's an estimation of top 10 causes DALY and avoidable deaths in Sub-Saharan Africa Source: (The World Bank, 2014)
2. Environmental effects: Deforestation and increase in GHG emission is also a strong consequence of the traditional use of biomass. Africa is one of the biggest producers of charcoal, accounting for 64% of its production worldwide (UNEP, 2019). Charcoal is the most common fuel derived from fuelwood. Therefore, as the urban population and income grow, so does the demand for charcoal. Additionally, most of the production of charcoal in Africa is carried out using traditional stoves and inefficient technologies (Lambe et al., 2015).
3. Gender issues: in most of the Sub-Saharan African countries, biomass collection is a task that falls on women. On the one hand, the total extra time that encompasses collecting and cooking hours mean women have fewer available hours for education and other productive activities. On the other hand, there is a big issue related to physical safety in conflict zones and extreme geographical locations (Lambe et al., 2015).
4. Economic: Additionally, the use of biomass brings some economic losses linked to the man labour hours spent in biomass collection and extra time of cooking with traditional devices and fuels. According to a World Bank study (2014), more than 40 million worker years are wasted each year on fuelwood gathering and slow biomass cooking (UNEP, 2019).

Figure 4: Economic losses and opportunity costs associated with solid biofuel dependence in Sub-Saharan Africa in 2010 Source: (Lambe et al., 2015).
The Sustainable Development Goals (SDG) Data on solid biofuels are crucial to assess the completion of National Determined Contribution (NDCs) and the progress on the Sustainable Development Goals (SDGs).
The collection of solid biofuels data will enable the African countries to track the policies in place, the efforts made by each country to comply with international agreements such as the Paris agreement and to track the sustainable initiatives and policies implemented. However, the data is not readily available, there are not reachable new studies and countries have not included a comprehensive methodology. This has led different organisations such as the IEA to estimate these quantities using only macro-economic trends like GDP and population.
Clean cooking is associated with a set of sustainable development goals, as it is entangled in a set of social, economic variables. The SDG7, related to the access to clean energies is the goal with a higher relation with this matter. In fact, in the sustainable development scenario, the goal for 2030 is to accomplish a 100% share in clean cooking fuel access3.
Hence, different initiatives are promoting the adoption of modern fuels. The most common transitioning fuels are kerosene (an intermediate fuel) and LPG (a modern fuel). The standards could also be achieved using improved cookstoves (ICS), devices with higher efficiencies and lower-emitting rates (WHO et al., 2018).
3 It is worthy to mention that clean fuels are defined in terms of air quality guideline defined by the WHO. This means, the term is related to indoor pollution, and not in terms of GHG (WHO et al., 2018).

Drivers of biomass demand • Population growth: in developing countries where the residential energy demand is
satisfied using solid biofuels, the increase of the population derives from a correlated growth of these fuels’ demand.
• Urbanisation: Predominant rural countries tend to have a higher share of solid biomass in the energy matrix. Conversely, in the Sub-Saharan African countries, the urbanisation phenomena have a positive effect on the charcoal demand, triggering an increase in the biofuels demand.
• Income growth: the spread and user adoption of technologies are highly dependable on the income of the demanding households. This concept is defined in the literature as the energy ladder. The energy ladder theory postulates that as income increases, households shift from traditional biomass and other solid fuels to more modern and efficient cooking fuels such as kerosene, LPG, and electricity. Therefore, the energy ladder has solid biofuels, such as fuelwood and charcoal at the bottom, nonliquid fuels such as gas and oil in the middle, and electricity at the top (Alinaitwe, 2021).
Figure 5: Energy ladder Source: (The International Agency for Research on Cancer, 2010)
• Education level: awareness of the harmful effect and alternative fuels are crucial to
change fuels choices in developing countries. Additionally, a decrease in the time used in fuelwood collection means an increase in available hours, deriving in higher education enrolment rates, especially for women.

Harmonisation of variables and conversion of units
One of the main issues on the solid biofuels’ reported data is the units and definition in which the data are published and reported.
• Net Calorific Value (NCV): the “net” energy content, which excludes the energy lost to produce water vapour during combustion (IEA, 2021b). This value is used then, for converting reported amounts from physical to energy units. To guarantee harmonisation, all the fuels must be in energy units, on a net basis instead of a gross one. It is highly dependable on a different set of parameters. The most important variable is humidity, which is inversely proportional to its calorific value. Additionally, the humidity on fuelwood is dependable on a set of different factors such as storage time, size of the collected matter and the different species. Finally, the NCV is correlated with seasonal variations of humidity in tropical countries, correlating with charcoal demand (Atteridge et al., 2013).
• Improved Cooking Stoves (ICS) efficiencies: the penetration of improved cooking stoves have an effect in reducing the demand input energy, as it has roughly twice the efficiency of a traditional device (The International Agency for Research on Cancer, 2010).
Table 2:Typical efficiencies of cooking fuels

Since the socio-cultural variables act like barriers in the fuel switching, it is quite relevant to get data about the real penetration of the stoves in the African countries. Some studies reveal most of the Sub-Saharan countries continue with a high prevalence of traditional cooking stoves.
Figure 6: Primary fuels used for cooking in selected Sub-Saharan countries in the Stated Policies Scenario and
Africa Case, 2018 and 2040

Variables considered for performing a comprehensive model
Defining key variables that are crucial to determine the demand in developing countries.
Figure 7: Key variables in the demand for biofuels
Data challenges
A comprehensive model will take into account the set of variables aforementioned. This however presents a great challenge in terms of the availability of the data. To create a strong framework suitable for the whole set of selected countries, some of the variables have been taken out as there are not enough reliable sources. Hence, the model is a good start to verify and get reliable data, but also propose a challenge to the national institutions amongst the countries to collect more on-field information and get better accuracy.
• Population size • Urbanisation indicators • Health indicators • Well - being indicators
Demographic variables
• Deforestation rate • Climate variables • Available and used plant species
Geographical variables
• ICS efficiency and penetration rate • Wood to charcoal tranformation kilns • Emissions generated by devices
Technology variables
• Income indicators • Transitioning fuels price, production and imports • Subsidies • Energy intensity
Economic variables
• Non - energy uses of residual crops • Non - energy uses of animal waste • Cooking preferences • Cooking reliance in different fuels
Social variables

Model scope
This user-friendly model can help national energy officials and statisticians and IEA data managers to estimate the solids biofuel consumption at a household level in the 14 selected Sub-Saharan African countries. It is important to emphasize that our aim is not to replace official data with the estimations from the model. Primary data collection should remain the priority for countries and this tool should serve as a check and could be used as a tool to enable discussions on the data.
• The model aims to verify and estimate the solid biofuel residential demand for each country to improve the data quality.
• The final interface is user-friendly and developed in a very common environment. To avoid technical complications, the model has been developed on Microsoft Excel and programmed in Visual Basic.
• The model enables users to assess the impact of policies, goals and international agreements, creating scenarios.
Methodology
The underlying estimation model adopted is based on a hybrid approach combining top-down and bottom-up methodologies to take advantage of available data and modelling limitations.
The primary determining factor in estimating solid biofuels residential energy consumption is demographic nature characteristics, in particular, the population and the number of households disaggregated in urban and rural areas (Farzaneh, 2019).
Therefore, on one hand, the top-down approach is used to select the predictors that drive specific consumption per fuel type and demography characteristic setting (Urban/rural). In that regard, various indicators are collected from diverse sources including but not limited to the IEA (International Energy Agency) databases, the World Bank Sustainable Development Indicators4, the World Urbanization Prospects 20185, World Health Organization indicators6, the United Nations Global SDG Indicators Database and others official databases and literature. Specifically, the goal at the end of the top-down is to derive indicators that explain Urban/rural household consumption for firewood and charcoal in the region.
In prediction modelling, interest is often to determine the most important predictors that should be included in a reduced, parsimonious model. This can be achieved by performing variable selection, in which optimal predictors are identified based on statistical characteristics such as importance or accuracy (Jaime Lynn Speisera, Michael E. Millerb, Janet Toozec, 2020).
More than hundreds (100) of variables have been gathered. To reduce dimensionality and to find the most important variables that drive household-specific consumption per fuel type, three advanced features selection methods (BORUTA, Random Forest, xgboost method) are used.
4 https://databank.worldbank.org/source/world-development-indicators 5 https://population.un.org/wup/ 6 https://www.who.int/data/gho/data/indicators

Boruta is a feature ranking and selection algorithm based on random forests algorithm. The algorithm is designed as a wrapper around a Random Forest classification algorithm. It iteratively removes the features which are proved by a statistical test to be less relevant than random probes (Kursa & Rudnicki, 2010).
XGBoost provides the best score for every element, shows the significance of each element to prepare the model, and creates another tree with gradient direction (Satapathy et al., 2019; Wang, 2019). Random forests (RF) are a collection of classification and regression trees which are simple models using binary splits on predictor variables to determine outcome predictions (BREIMAN, 2001; Jaime Lynn Speisera, Michael E. Millerb, Janet Toozec, 2020). RF provides the best score for each feature, shows the importance of each feature to train the model, and generates a new tree by maximizing the label purity within these subsets. This statistical significance of identifiers can de directly used for feature selection (Satapathy et al., 2019).
A combination of the results of these methods has been adopted to have a good confidence level. This step is critical in the modelling process to avoid redundant features as we are in the situation of high dimensionality space and to build high performing model. A subset of the top 10 variables has been selected in each case.
Beforehand, a country is selected as a proxy to drive the feature selection procedure. Countries such as Angola, South Africa, Botswana, Senegal and Morocco were selected based on the progress they made in access to clean cooking fuel and quality of data (not estimated and later evaluated. Average household consumption for charcoal and firewood are computed using country data from IEA databases on solid biofuel consumption for charcoal and firewood, and demography data as follows:
𝑄 =𝐸
𝑁𝐻 ∗ 𝑃𝑜𝑝 ∗ 𝑁𝐶𝑉 ∗
1
365
In which Esolid biofuel is the total energy supply in the residential sector per type of fuel, NH is the number of households, Pop for the population and NCV is the Net Calorific Value.
The units mass per household generated from this calculation is then compared with acceptable household biofuels consumption across the continent. This range are determined by gathering information from literature and report. Angola is later selected as a reference country among others since the average urban/rural household consumption computed stands within the acceptable average range. The comparison table is annexed to the concept note (Household specific consumption per fuel type of references countries Table 3).
Furthermore, a multi-linear regression (MLR) predictive model is fit with data from the country of proxy and all the 14 most significant predictors derived above. To have an optimised size of model with fewer variables, a quality criterion is applied to select the small predictors possible that leads to the best Adjusted R-Squared. The Adjusted R-Squared helps penalise for additional predictors and can decrease with added predictors. One model is then determined for each household’s charcoal/firewood consumption in urban/rural areas. Model coefficients and accuracy are shown in the annexe (Model output).
The chart below describes the steps explained above.

Figure 8: Pre-analysis: Top-down approach steps
At the end of this process, four models (equations) is developed providing the unit mass estimation of household consumption per fuel type (firewood and charcoal) and areas (Urban or Rural). The pre-analysis study is done in R software which source code can be provided from this link. Model equations and coefficients are in the annexe.
This estimation is then populated on the entire national population knowing the demography data representing the bottom-up approach. The consideration of technical and technological values (efficiency of stoves and net calorific values) are taken into account to compute the energy consumption per end-uses and fuel type used. The energy consumption per end-uses and fuel type is computed as follow:
𝑬𝟎 = ∑ 𝒊 ∑ (𝑵𝑯 ∗ % 𝑵𝑯𝒊 ∗ 𝑬𝑭𝒖𝒆𝒍𝒊𝒋𝒋 ) and NH= 𝑷𝒐𝒑
𝜽 ,
𝑬𝟎 = ∑ ∑ 𝒋𝒊 ∑ 𝒌 ∑ (𝑵𝑯 ∗ % 𝑺𝑯𝒊 ∗ 𝑬𝒖𝒔𝒆𝒊𝒋𝒌𝒍𝒍 ) and NH= 𝑷𝒐𝒑
𝜽 ,
Where NH is total number of households, SHi is the share of household type (%), EFuel is the energy consumption for each type of fuel and per household type (TJ /Household). θ refers to the average household size (person/household), i refer to demographical nature (urban or rural
Descriptive data
•Input data from various databases
Dimesionnality reduction
•Combined feature selection methods to reduce the number of variables ( BORUTA, Random Forest, xgboost method)
•10 significant predictors are selected
Model selection
•The best subset out of 14 variables achieving the best Adjusted R2 is selected for each model
•One model is derived for each average household consumption of firewood and charcoal in rural or Urban areas
Elasticity Constant
•Multiple linear Regression perform for each model
• Intercept and slopes determine
Estimation Models for household unit mass consumption per fuel type and
areas

area), j refers to the type of solid fuels: firewood, charcoal, agriculture residues. Euse refers to the energy consumption per end-uses where k refers to the type of end-uses (heating, cooling, lighting) and l refers to the type of stoves technology.
𝑬𝑭𝒖𝒆𝒍𝒊𝒋 = 𝑵𝑪𝑽𝒋 ∗ 𝑸𝒊𝒋 , where Q is the mass units need per fuel (Kg/year) and NCV in MJ/Kg
𝑬𝒖𝒔𝒆𝒊𝒋𝒌𝒍 = 𝑵𝑪𝑽𝒋 ∗ 𝑸𝒊𝒋𝒌𝒍 , where Q is the mass units need per fuel, end-uses and per
technology (Kg/end-uses/technology/year).
The conceptual framework below summarizes the modelling approach. The modelling process of the Solid biofuels (SBE) Model overview is illustrated as follows:

Figure 9: Model concept note
Modules
The model has been conceived to be an Excel worksheet file, in which the user can add the relevant inputs to get personalised and accurate results. It is separated into several worksheets to facilitate ease of navigation. These worksheets can be accessed from the landing page (‘’Control Board” Worksheet).
Figure 10: Model landing page
Pre analysis Elasticity constant
Selection of variables
Calibration of the model
Input
module Socio - economic
data Technical data System data
SBE - Model
Output module
Energy demand per end-uses Energy demand per type of fuel Emissions
Development module
General settings Initial assumptions
Scenario inputs

Most important sheets are visible to users and the table hereafter summarises their content. The sheets are grouped into Inputs, outputs and General Information. The worksheet colour difference represents the type of information or analysis performed in each sheet.
Table 3: Model general worksheet description
Model Worksheet Description
General information
INTRO Provide baseline information about the context of the project, objectives, short introduction to the modelling approach, data collected and person of contact for further information.
NOTES Inform user about model version history and update and orientation on colour code used in the model.
Pre-computed values
Entry cells
References Informs on the different sources of data and links to access the database and institution that provide it.
Model outputs and display
Control Board The landing page of the model with a control board with several buttons to access the different features and modules of the model.
Dashboard Help user to have a quick view of certain descriptive parameters trend about a country and compare various countries.
EmissionsHealth Provides an estimate of the emission by greenhouses gases and fuel type using energy consumption estimated in the “Compute” worksheet.
This calculation is based on default emission factors by fuel type for stationary combustion in the residential per unit of mass/TJ.
Reference emission factors and sources are provided in the “Default Param” worksheet where users set entry parameters.
Report A summary of the analysis computed in the “Compute” worksheet with key graph showing historical consumption, future projection and emissions.
Export to pdf feature provided for printing purposes to support communication materials.
Model Inputs
Default Param It encompasses default parameters and assumptions considered in the model including the Net Calorific Value

(NCV), emission factors, share of the end-uses activities of total consumption, conversion unit, and model Intercept and slopes coefficients.
Limited access is given to the user in modifying some entries.
• NCV: a value for fuelwood of moisture of 20% (on a wet basis) is assumed, as the IRENA guideline proposes, low moisture charcoal with a value of approximately 33.33 GJ/tonne (IRENA, 2019). The residues are assumed to be from herbaceous crops, Miscanthus spp. With moisture of 15% following the same guidelines.
• Share of agricultural residues: 5% of firewood and charcoal consumption. This number can be modified to have a more accurate estimation.
• Share of household biofuels consumption per end-uses: the percentage used for the main three activities (cooking, heating and lighting) is derived from different sources and literature. The source is provided next to each row.
• Emissions factors: following the IPCC guideline and in coherence with the IEA emissions team, a set of factors are fixed to calculate the total emissions. References for these factors are provided and users can update these values.
Demography_World Provides demography dataset derived from the 2018 revision of World Urbanization Prospects7, which contains the latest estimates of the urban and rural populations from 1950 to 2018 and projections to 2050. These estimates can be updated by the user for the country of estimation and as new information is available. The model uses this estimate for the estimation at the country level and per area of the demand.
database_raw Access to the entire database of the model expects the demography separated and concatenated by column as published by primary sources per year and country.
model_fit Contains a subset of the “database_raw” worksheet with the most significant predictors derived from the pre-analysis where feature selection analysis is performed. The model runs majorly using data in this worksheet.
Model Run
Compute It is the core of the excel model and where all the computations are made given user inputs. For an initial start, the user can select the desired country, output unit and run the model. Historical estimation of solid biofuels consumption
7 World Urbanization Prospects - Population Division - United Nations. (1950–2050). [Dataset]. https://population.un.org/wup/

at the national level per fuel type and end-uses and future projection based on various scenarios can be performed. Scenarios include the Sustainable Development Scenario (SDS)8 and Stated Policies Scenario (STEPS)9.
The user can adjust several variables to perform some sensitivity analysis and to study future demand as well as compare two countries or to a base scenario.
Future_dat Excel worksheet which contains sensitivity variables for the future projection.
Running the model
Users can get started with the model from the “control board” worksheet and click directly on the button “Get started” which lead to the “Compute” worksheet.
Figure 11: Control board and get started
Before that users can adjust default parameters by clicking in “View Default Parameters” from the control board or directly going to the “Default Param” worksheet. The calorific values constant, the share of agricultural residues, emission factors and end-uses share percentage can be updated to suit user requirements before getting started.
8 https://www.iea.org/reports/world-energy-model/sustainable-development-scenario-sds 9 https://www.iea.org/reports/world-energy-model/stated-policies-scenario-steps

Figure 12: Default parameters worksheet
Historical estimation of solid biofuels consumption per fuel type and end-uses
Once redirected to the “Compute” worksheet, the user can choose a country of modelling from the drop-down menu as well as choosing outputs energy unit.
Figure 13: Model starting point

The model does not perform any calculation if the country is not indicated otherwise it will prompt a message to invite to choose a country.
Figure 14: Message prompt in case of no country indicated
The model calculation is performed in Visual Basic for Applications (VBA) language and any user actions trigger some macros that run in the background. The code is written in a way to permits rapid computation.
The model is designed to compute directly the historical estimation of the solid biofuels by end-uses and fuel type. Based on the country selected the model runs on background and display values in cells. It takes a few seconds to calibrate and provide the estimation depending on the speed of the computer.
Figure 15: Historical solid biofuels consumption per fuel type output of the model
It provides firstly residential energy consumption per fuel type in rural and urban areas in unit mass (tonne/year) from 2000 to 2015 and later the energy consumption using NCV set in “Default Param” worksheet and others default parameters. At the same time, it computes as

well the consumption per end -uses in particular cooking, heating and lighting as shown in the figure below.
Figure 16: Historical solid biofuels consumption per end-uses - output of the model
Projection analysis
Next to the chart of the residential consumption per end-uses on the left-hand side, a button is available to initiate the Projection analysis.
Figure 17: Starting the projection analysis
This section of the model helps the user to project future consumption based on a set of variables and trends in the next decades 2020, 2030, 2040 and 2050. For each set of variables, the user can play with a set scenario that generates future estimates by 2050 on which the model will run to provide future estimates. Hereafter the presentation of each type of scenario is available in the drop-down list of variables.

Table 4: Scenario description
Figure 18: Scenario settings - screenshot
Given the user choice of scenario, the future values are predicted and filled in the cells automatically and stored in the “future_dat” worksheet from ROW1 to ROW15. The user can manually update each row that suits best for the analysis.
Figure 19: Scenario setting time series generation in Future_dat worksheet
Scenario Description
User-defined This option allows the user to set values in between decades that suit the requirement of the particular exercise or progress expected for the country of analysis.
However, in this option, the user must pay attention to the values set for the variables with the asterisk sign (*). For these variables, the values for each decade represents the growth rate to be observed this decade and the previous one and not the annual growth rate in between these decades.
STEPS Future pathway of the variable by 2050 following the Stated Policies Scenario (STEPS) of the IEA.
SDS Future pathway of the variable by 2050 following the Sustainable Development Scenario (SDS) of the IEA.
Linear The future pathway of the variable by 2050 is based on linear forecast using Excel FORECAST.ETS function calculates or predicts a future value based on existing (historical) values. Historical values of variables here are in the “model_fit” or “database_raw” worksheet.

After all the setting is done, the button helps to run the projection and outputs will be generated as in the figure below. Firstly, it shows the unit mass consumption followed by the energy consumption in energy unit preference selected at the beginning of the exercise and then a graphic showing the trend per fuel type.
Figure 20: Model projection output
This process can be iterated as many times as possible by the user.
Comparison analysis
Under this section, the user can perform as in the projection analysis a long-term forecast. In addition, this functionality allows to compare two countries or compare the same country with an improved scenario by changing the several options in the scenario drop-down list per variable.
The button comparative analysis is at the left of the projection graph.

Figure 21: Starting comparative analysis
As it is a new analysis the user needs to select the country of comparison and optionally provide a name for this analysis or choose the same country to compare two scenarios. Once the selection is completed, the projection tab is displayed with the variables and scenario to be performed.
Figure 22: Set comparative analysis scenario and compute analysis
Like the projection analysis, the user can set the scenarios for each variable. Given the user choice of scenario, the future values are predicted and filled in the cells automatically and stored in the “future_dat” worksheet from ROW18 to ROW32. The user can manually update each row that suits best for the analysis.
Then the user can compute the analysis with the next button on the right-hand of the settings tab (highlighted red in the figure above) will launch in the background a macro and display a graph to show the output.
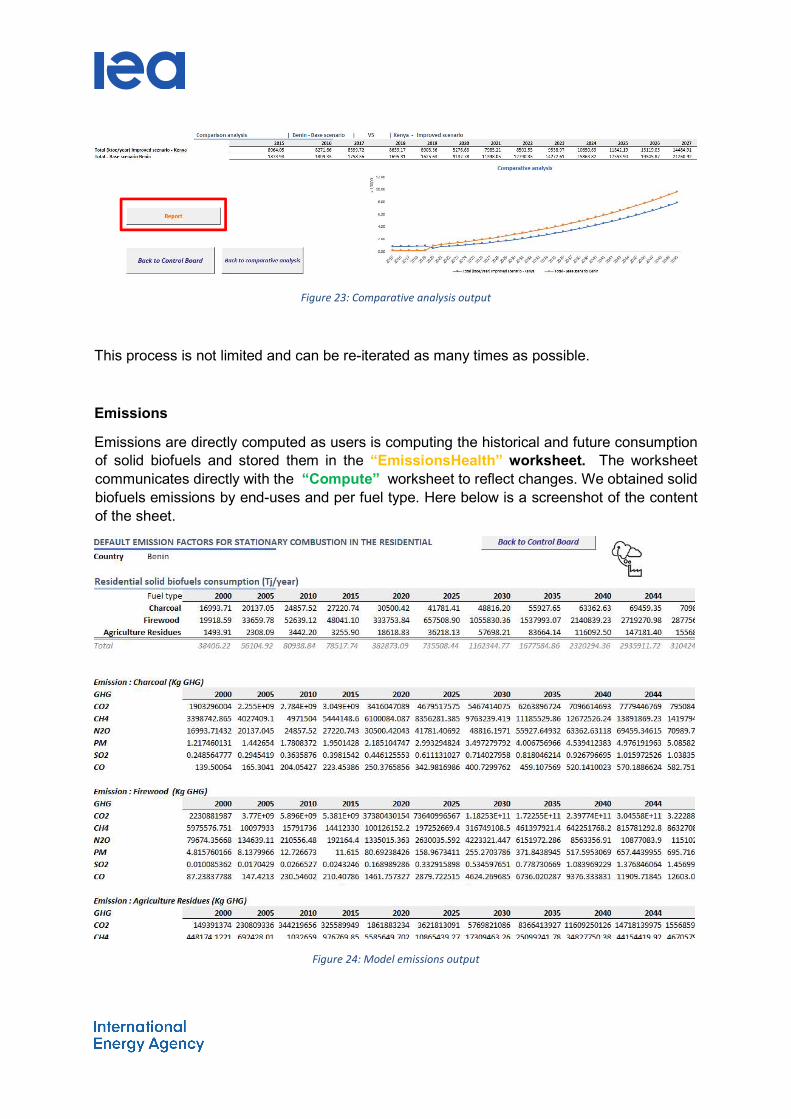
Figure 23: Comparative analysis output
This process is not limited and can be re-iterated as many times as possible.
Emissions
Emissions are directly computed as users is computing the historical and future consumption of solid biofuels and stored them in the “EmissionsHealth” worksheet. The worksheet communicates directly with the “Compute” worksheet to reflect changes. We obtained solid biofuels emissions by end-uses and per fuel type. Here below is a screenshot of the content of the sheet.
Figure 24: Model emissions output

Dashboard
The dashboard shows the trend of several variables and provided with time and country slicer for additional comparison and displays.
Figure 25: Dashboard screenshot
Print report
All the graphs generated as part of the different analyses are copied to the “report” worksheet to help the modeller export this to pdf format for different purposes.

Figure 26: Report screenshot

References
AFREC. (n.d.). AFREC | The African Energy Commission. Retrieved September 7, 2021, from https://au-afrec.org/about.php
Alinaitwe, G. (2021, June). HOUSEHOLD ENERGY DEMAND IN UGANDA: ESTIMATION AND POLICY RELEVANCE. Energy, COVID, and Climate Change,
Atteridge, A., Heneen, M., & Senyagwa, J. (2013). Transforming Household Energy Practices Among Charcoal Users in Lusaka, Zambia: a User-Centred Approach.
BREIMAN, L. (2001). Random forests. In Random Forests. https://doi.org/10.1201/9780429469275-8
EkouevI, K., & Tuntivate, V. (2012). Household Energy Access for Cooking and Heating (World Bank Studies). world bank publications.
Farzaneh, H. (2019). Energy Systems Modeling. In Energy Systems Modeling. https://doi.org/10.1007/978-981-13-6221-7
Garba, I., & Bellingham, R. (2021). Energy poverty: Estimating the impact of solid cooking fuels on GDP per capita in developing countries - Case of sub-Saharan Africa. Energy. Published. https://doi.org/10.1016/j.energy.2021.119770
IEA. (n.d.). Mission - About. Retrieved September 7, 2021, from https://www.iea.org/about/mission
IEA. (2015). Share of population relying on different cooking fuels in selected countries, 2015 – Charts – Data & Statistics. https://www.iea.org/data-and-statistics/charts/share-of-population-relying-on-different-cooking-fuels-in-selected-countries-2015 IEA. (2019). Africa Energy Outlook 2019. https://iea.blob.core.windows.net/assets/2f7b6170-d616-4dd7-a7ca-a65a3a332fc1/Africa_Energy_Outlook_2019.pdf
IEA. (2021a). World energy balances 2021 Edition Database [Dataset].
IEA. (2021b). World energy balances 2021 Edition Database documentation. http://wds.iea.org/wds/pdf/WORLDBAL_Documentation.pdf
IRENA. (2019). SOLID BIOMASS SUPPLY FOR HEAT AND POWER TECHNOLOGY BRIEF. IRENA. https://www.irena.org/-/media/Files/IRENA/Agency/Publication/2019/Jan/IRENA_Solid_biomass_supply_2019.pdf
Jaime Lynn Speisera, Michael E. Millerb, Janet Toozec, E. I. (2020). A Comparison of Random Forest Variable Selection Methods for Classification. 336, 93–101. https://doi.org/10.1016/j.eswa.2019.05.028.A
Krajnc, N. (2015). Wood Fuels Handbook. Food and agricultural organization of the United Nations.
Kursa, M. B., & Rudnicki, W. R. (2010). Feature selection with the boruta package. Journal of Statistical Software, 36(11), 1–13. https://doi.org/10.18637/jss.v036.i11
Lambe, F., Jürisoo, M., Wanjiru, H., & Senyagwa, J. (2015). Bringing clean, safe, affordable cooking energy to households across Africa: an agenda for action. Stockolm Evironment Institute.

http://newclimateeconomy.report/workingpapers/wp-content/uploads/sites/5/2016/04/NCE-SEI-2015-Transforming-household-energy-sub-Saharan-Africa.pdf
Partnership for Policy Integrity. (2011, April). Air pollution from biomass energy. https://www.pfpi.net/air-pollution-2
Satapathy, S. C., Raju, K. S., & Editors, M. N. F. (2019). Advances in Computational and Bio-Engineering (Vol. 1).
The International Agency for Research on Cancer. (2010). Household Use of Solid Fuels and High Temperature Frying (IARC Monographs on the Evaluation of the Carcinogenic Risks to Humans, 95) (Illustrated ed.). World Health Organization.
The World Bank. (2014, November). Clean and Improved Cooking in Sub-Saharan Africa. The World Bank. https://documents1.worldbank.org/curated/en/164241468178757464/pdf/98664-REVISED-WP-P146621-PUBLIC-Box393185B.pdf
UNEP. (2019). Review of Woodfuel Biomass Production and Utilization in Africa [E-book]. United Nations Environment Programme.
Wang, J. (2019). An ensemble feature selection method for high-dimensional data based on sort aggregation. 7(2), 32–39. https://doi.org/10.1080/21642583.2019.1620658
WHO, IEA, GACC, UNDP, & World Bank. (2018). POLICY BRIEF #2 ACHIEVING UNIVERSAL ACCESS TO CLEAN AND MODERN COOKING FUELS AND TECHNOLOGIES. https://sustainabledevelopment.un.org/content/documents/17465PB_2_Draft.pdf
World Urbanization Prospects - Population Division - United Nations. (1950–2050). [Dataset]. https://population.un.org/wup

Key definitions A set of definitions have been used based on the IEA guidelines to keep the same framework used by the organisation.
• Solid biofuels: Solid biofuels, using the IEA conceptual framework, is defined as the sum of primary solid biofuels and charcoal. Overall, primary solid biofuels refer to any plant matter used directly as fuel or converted into other forms before combustion. (IEA, 2021)
• Charcoal: solid biofuels residual of distillation and pyrolysis of wood and other vegetal material (IEA, 2021). This fuel is selected instead of fuelwood as it has a higher energy density than the former one. Charcoal in Africa is produced mostly by traditional kilns whose efficiency is rated from 8-15%. (UNEP, 2019).
• Total energy supply (TES): the final energy flow a country can use for its demand and transformation processes.
𝑇𝐸𝑆 = 𝑇𝑜𝑡𝑎𝑙 𝑒𝑛𝑒𝑟𝑔𝑦 𝑝𝑟𝑜𝑑𝑢𝑐𝑡𝑖𝑜𝑛 − 𝐸𝑥𝑝𝑜𝑟𝑡 + 𝐼𝑚𝑝𝑜𝑟𝑡𝑠 − 𝐼𝑛𝑡𝑒𝑟𝑛𝑎𝑡𝑖𝑜𝑛𝑎𝑙 𝑏𝑢𝑛𝑘𝑒𝑟𝑠 ±
𝑆𝑡𝑜𝑐𝑘 𝑐ℎ𝑎𝑛𝑔𝑒𝑠 • Total final energy consumption (TFEC): the quantity used in the different energy demand
sectors, subtracting the final non-energy use in a country. For biofuels, the non-energy uses are excluded from the general balances, thus its final calculation requires exclusively the fuel demand for energy purposes at industrial, electricity and heat production, and the other uses among which it is expressed the residential flow.
• Residential consumption: refers to the quantity consumed at the household level, excluding transport fuels usage. The quantity also reflects the energy consumed by the home office and a diffe of productive activities made at a household level.

Annexes Model output
Charcoal Rural
Residuals:
Min 1Q Median 3Q Max
-0.0139915 -0.0044373 0.0005825 0.0041291 0.0130937
Coefficients :
Estimate Std. Error t value Pr(>|t|)
(Intercept) 0.037259 0.313054 0.119 0.907407
Access to clean fuels and technologies for cooking (% of the population)
0.021699 0.006124 3.543 0.004608 **
Energy intensity level of primary energy (MJ/$2011 PPP GDP)
0.03392 0.005757 5.892 0.000104 ***
Population growth (annual %) 0.260735 0.047286 5.514 0.000182 ***
Rural Average Household -0.079152
0.121683 -0.65 0.528736
Signif. codes: 0 ‘***’ 0.001 ‘**’ 0.01 ‘*’ 0.05 ‘.’ 0.1 ‘ ’ 1
Residual standard error: 0.007547 on 11 degrees of freedom
Multiple R-squared: 0.9868, Adjusted R-squared: 0.982
F-statistic: 205.2 on 4 and 11 DF, p-value: 2.989e-10

Charcoal Urban
Residuals:
Min 1Q Median 3Q Max
-0.0033386 -0.0020692 -0.0003354 0.0014815 0.0047662
Coefficients :
Estimate Std. Error t value Pr(>|t|)
(Intercept) 0.464768 0.627726 0.74 0.480221
Access to clean fuels and technologies for cooking (% of the population)
-0.059542
0.002555 -23.305 1.22E-08 ***
Age dependency ratio (% of working-age population)
0.02042 0.005254 3.887 0.004632 **
Arable land (%land area) -0.047362
0.013796 -3.433 0.008914 **
Energy intensity level of primary energy (MJ/$2011 PPP GDP)
-0.011672
0.003413 -3.419 0.009095 **
Urban Average Household 0.401832 0.058334 6.888 0.000126 ***
GDP growth (annual %) -0.300612
0.041637 -7.22 9.07E-05 ***
GDP per capita growth (annual %) 0.310514 0.043127 7.2 9.24E-05 ***
Signif. codes: 0 ‘***’ 0.001 ‘**’ 0.01 ‘*’ 0.05 ‘.’ 0.1 ‘ ’ 1
Residual standard error: 0.003467 on 8 degrees of freedom
Multiple R-squared: 0.9998, Adjusted R-squared: 0.9997
F-statistic: 7616 on 7 and 8 DF, p-value: 1.188e-14

Firewood Rural
Residuals:
Min 1Q Median 3Q Max
-0.0063204 -0.0015644 -0.0001158 0.0017436 0.0041330
Coefficients:
Estimate Std. Error t value Pr(>|t|)
(Intercept) 0.144087 0.157018 0.918 0.3785
Access to clean fuels and technologies
for cooking (% of population)
0.0311 0.004119 7.55 1.13E-05 ***
Life expectancy at birth, total (years) -0.02344 0.003431 -6.831 2.84E-05 ***
Population growth (annual %) 0.054189 0.01688 3.21 0.0083 **
Rural Average Household 0.867303 0.05316 16.315 4.69E-09 ***
Signif. codes: 0 ‘***’ 0.001 ‘**’ 0.01 ‘*’ 0.05 ‘.’ 0.1 ‘ ’ 1
Residual standard error: 0.003201 on 11 degrees of freedom
Multiple R-squared: 0.9997, Adjusted R-squared: 0.9996
F-statistic: 9025 on 4 and 11 DF, p-value: < 2.2e-16

Firewood Urban
Residuals:
Min 1Q Median 3Q Max
-0.0082421 -0.0040443 -0.0009956 0.0027975 0.0174716
Estimate Std. Error t value Pr(>|t|)
(Intercept) 1.86963 1.63947 1.14 0.291637
Life.expectancy.at.birth..female..years. -10.6311 0.47705 -22.285 9.26E-08 ***
Life.expectancy.at.birth..total..years. 10.94896 0.49723 22.02 1.01E-07 ***
Arable.land....of.land.area. -0.10078 0.03733 -2.699 0.03067 *
Age.dependency.ratio....of.working.age.population. 0.04689 0.0161 2.913 0.022579 *
Urban_Average_Household 1.01622 0.16249 6.254 0.000423 ***
Population.growth..annual... 1.51765 0.5142 2.951 0.021362 *
GDP.growth..annual... -0.90543 0.44448 -2.037 0.081062 .
GDP.per.capita.growth..annual... 0.93547 0.46043 2.032 0.081703 .
Signif. codes: 0 ‘***’ 0.001 ‘**’ 0.01 ‘*’ 0.05 ‘.’ 0.1 ‘ ’ 1
Residual standard error: 0.009733 on 7 degrees of freedom
Multiple R-squared: 0.9999, Adjusted R-squared: 0.9998
F-statistic: 1.105e+04 on 8 and 7 DF, p-value: 1.186e-13

Household specific consumption per fuel type of references countries Table 3: Average household consumption per fuel type of references countries
Variables Country sd mean min max African literature Acceptable range
Rural Average household woodtec Angola 0.15 5.43 5.12 5.57 [5.14 - 8.59]
Rural Average household woodtec Botswana 1.81 24.46 23.58 28.92 [5.14 - 8.59]
Rural Average household woodtec Morocco 0.87 3.13 2.34 4.85 [5.14 - 8.59]
Rural Average household woodtec Senegal 2.31 9.22 6.66 12.70 [5.14 - 8.59]
Rural Average household woodtec South Africa 1.92 7.91 5.85 12.89 [5.14 - 8.59]
Urban Average household woodtec Angola 0.88 4.41 3.09 6.08 [2.6 - 5.88]
Urban Average household woodtec Botswana 5.16 16.90 10.68 26.19 [2.6 - 5.88]
Urban Average household woodtec Morocco 0.59 2.08 1.51 3.26 [2.6 - 5.88]
Urban Average household woodtec Senegal 2.19 10.63 8.49 15.36 [2.6 - 5.88]
Urban Average household woodtec South Africa 1.65 4.13 2.33 8.23 [2.6 - 5.88]
Rural Average household charcoal Angola 0.05 1.58 1.43 1.62 [0.01 - 1.35]
Rural Average household charcoal Botswana 0.17 1.35 1.09 1.59 [0.01 - 1.35]
Rural Average household charcoal Morocco 0.00 0.02 0.02 0.02 [0.01 - 1.35]
Rural Average household charcoal Senegal 0.62 1.85 0.68 2.68 [0.01 - 1.35]
Rural Average household charcoal South Africa 0.11 0.57 0.43 0.75 [0.01 - 1.35]
Urban Average household charcoal Angola 0.25 1.28 0.90 1.70 [0.64 - 3.14]
Urban Average household charcoal Botswana 0.11 0.89 0.72 1.02 [0.64 - 3.14]
Urban Average household charcoal Morocco 0.00 0.01 0.01 0.01 [0.64 - 3.14]
Urban Average household charcoal Senegal 0.86 2.23 0.65 3.24 [0.64 - 3.14]
South Africa 0.10 0.29 0.17 0.48 [0.64 - 3.14]
Urban Average household charcoal