Sustainability of Alternative Land Uses Comparing Biofuels ...
355
Sustainability of Alternative Land Uses Comparing Biofuels and Food Crops in Thailand Pairote Nualnoom Thesis submitted for the degree of Doctor of Philosophy Centre for Environmental Strategy Faculty of Engineering and Physical Sciences University of Surrey October 2014
-
Upload
khangminh22 -
Category
Documents
-
view
1 -
download
0
Transcript of Sustainability of Alternative Land Uses Comparing Biofuels ...

Sustainability of Alternative Land Uses
Comparing Biofuels and Food Crops
in Thailand
Pairote Nualnoom
Thesis submitted for the degree of Doctor of Philosophy
Centre for Environmental Strategy
Faculty of Engineering and Physical Sciences
University of Surrey
October 2014

ProQuest Number: 27696244
All rights reserved
INFORMATION TO ALL USERS The qua lity of this reproduction is d e p e n d e n t upon the qua lity of the copy subm itted.
In the unlikely e ve n t that the au tho r did not send a co m p le te m anuscrip t and there are missing pages, these will be no ted . Also, if m ateria l had to be rem oved,
a no te will ind ica te the de le tion .
uestProQuest 27696244
Published by ProQuest LLO (2019). C opyrigh t of the Dissertation is held by the Author.
All rights reserved.This work is protected aga inst unauthorized copying under Title 17, United States C o de
M icroform Edition © ProQuest LLO.
ProQuest LLO.789 East Eisenhower Parkway
P.Q. Box 1346 Ann Arbor, Ml 4 81 06 - 1346

ABSTRACT
The conflict of land use between food and energy security purposes has become an
important issue since biofuel has been promoted as alternative energy. However,
understanding of the dynamics of land use derived from the advent of biofuel crops is mostly
based on extrapolations using computer simulations. In order to gain a better understanding,
this research aims to comprehend the dynamics of land use via the implications of the
perspectives, motivations and behaviours of local landowners and the government, and the
impacts of land use change on the relevant stakeholders. The dynamics of land use are
explored in the context of an oil palm based-biodiesel development in Thailand where the
advent of oil palm has caused the loss of paddy areas.
A sequential mixed-method strategy, including in-depth interviews and a
questionnaire survey with 10 and 180 landowners respectively, indicates that the probability
that the landowner switched traditional land for oil palm cultivation is affected by the
household characteristics (age and education of the head of household, number of
household farming labourers, amount and source of income, land size and land right).
Moreover, the results indicate that success of switching land to oil palm cultivation was
determined by several factors influencing willingness (factors relevant to outcome
expectation and social networks and connections) and capacity to change (factors relevant
to finance, labour, capital, land rights and transportation).
The results regarding impacts of land use switching from analysis of secondary data
from the input-output national accounts of Thailand reveal that switching paddy areas to oil
palm cultivation would clearly provide better financial contributions to all stakeholders in the
supply chain and to the whole economy. However, the impact of switching land use from
rubber to oil palm would benefit some stakeholders (input providers and transporters at the
crop farming stage and input providers and entrepreneurs at the industrial processing
stage), while the farmers and other stakeholders would lose.
In order to explore the policy makers’ perspectives on the issue of land competition
between paddy and oil palm, in-depth interviews with three policy makers in the biofuel
policy-making process were undertaken, as well as a literature review of secondary data.

The key findings indicate that, even though the issue of loss of paddy areas used to be of
serious concern to policy makers at the beginning phase of developing the biofuel project,
they no longer took official interest in it after launching the project. The results also reveal
that the substitution of oil palm in some paddy areas was readily accepted because
switching to oil palm was seen to contribute to a better livelihood for farmers and also
alleviates the fiscal encumbrance of assisting paddy farmers. In addition, the inertia in
dealing with losses of paddy areas also reflected the traditions of the civil service system in
that civil servants actively respond to the current needs of the political sector whereas
policies which are not paid serious attention by the political sector, like the losses of paddy,
are temporarily ignored.

ACKNOWLEDGEMENTS
I would like to express my deep gratitude to Dr Walter Wehrmeyer and Professor
Stephen Morse, my research supervisors, for their continuous intellectual guidance,
enthusiastic encouragement and useful critiques in forming and navigating this thesis from
beginning to end. I would also like to thank Dr Jacquetta Lee, the examiner on my
confirmation, for her constructive and methodological suggestions in re-formulating the
project.
In the field, my deep appreciation goes to Mr Sanon Sontamino and Mr Bamrung
Nooduang for their advice and support in coordinating with the key informants and
questionnaire respondents and facilitating the interviews and questionnaire survey.
I am indebted to the Energy Conservation Promotion Fund (ENGON Fund) of the
Royal Thai Government, Thailand, for providing full financial support throughout the course
of study. I extend my thanks to Walailak University and my bosses. Dr Gosah Arya, Mrs
Suwatjana Pengjun, Associate Professor Dr Somnuk Aujirapongpan, Dr Rungrawee
Jitpakdee and Dr Neeranat Rakangtong for their great support.
I am grateful to friends in Thailand and the members of staff at the Walailak
Management School for their friendship and encouragement throughout my years of
isolation. I also wish to extend my warmest thanks to friends in the UK for their friendliness
and cheerfulness.
Finally, my deepest thought goes to my father, Mr Prim Nualnoom, who is gone
forever but who inspired me for lifelong learning. I am thankful and indebted to my mother,
brother and sister for their support and encouragement throughout my study.

IV
STATEMENT OF ORIGINALITY
This thesis and the work to which it refers are the results of my own efforts. Any
ideas, data, images or text resulting from the work of others (whether published or
unpublished) are fully identified as such within the work and attributed to their originator in
the text, bibliography or in footnotes. This thesis has not been submitted in whole or in part
for any other academic degree or professional qualification. I agree that the University has
the right to submit my work to the plagiarism detection service TurnitinUK for originality
checks. Whether or not drafts have been so-assessed, the University reserves the right to
require an electronic version of the final document (as submitted) for assessment as above.

TABLE OF CONTENTS
ABSTRACT........................................................................................................................................ i
ACKNOWLEDGEMENTS............................................................................................................... iii
STATEMENT OF ORIGINALITY...................................................................................................iv
TABLE OF CONTENTS..................................................................................................................v
LIST OF TABLES............................................................................................................................ ix
LIST OF FIGURES.........................................................................................................................xii
LIST OF ACRONYMS AND ABBREVIATIONS........................................................................ xiv
CHAPTER 1 INTRODUCTION.......................................................................................................1
1.1 Research background and motivation............................................................................ 1
1.2 Research objectives and research questions................................................................4
1.3 Significance of the study.................................................................................................. 5
1.4 Structure of the thesis...................................................................................................... 6
CHAPTER 2 CONTEXT OF THAILAND...................................................................................... 8
2.1 Introduction........................................................................................................................ 8
2.2 Geography and land characteristics............................................................................... 8
2.3 Policy and agricultural development in Thailand..........................................................11
2.4 Land use change and relevant consequences of economic development...............13
2.5 Biofuel development in Thailand...................................................................................23
2.6 Background of the main crops considered in the thesis............................................. 41
2.7 Processing of oil palm for biodiesel and co-products.................... 44
2.8 Conclusions.................................................................................................................... 46
CHAPTER 3 RESEARCH METHODOLOGY............................................................................ 48
3.1 Introduction......................................................................................................................48
3.2 Research objectives and questions.............................................................................. 48
3.3 Research paradigms...................................................................................................... 50
3.3.1 Positivism, constructivism and pragmatism........................................................50
3.3.2 Justification for the research paradigms.............................................................52
3.4 Research approaches and analysis method................................................................53
3.4.1 Quantitative and qualitative approach................................................................ 53
3.4.2 Justification for the research approaches.................................................... 54

VI
3.5 Data collection................................................................................................................ 55
3.5.1 Primary and secondary da ta .................................................................................55
3.5.2 Justification for the research data collection.........................................................57
3.5.3 Sample selection.....................................................................................................58
3.5.4 Sample s ize ............................................................................................................ 63
3.6 Research design.............................................................................................................65
3.6.1 Conceptual framework............................................................................................65
3.6.2 Questionnaire design and data collection procedure............................................ 69
3.6.3 Interview strategy.....................................................................................................79
3.6.4 Approach for qualitative analysis........................................................................... 81
3.6.5 Approach for quantitative analysis................................................ 83
3.7 Conclusions....................................................................................................................87
CHAPTER 4 QUALITATIVE ANALYSIS OF FACTORS INFLUENCING LAND USE CHANGE.........................................................................................................................................90
4.1 Introduction..................................................................................................................... 90
4.2 Livelihood assets.............................................................................................................91
4.3 Vulnerability Context.................................................................................................... 119
4.4 Policy and institutional context....................................................................................126
4.5 Land use strategies.......................................................................................................133
4.5.1 Continuing paddy production...................................................................... 133
4.5.2 Switching paddy to oil palm production...............................................................136
4.5.3 Continuing to abandon land ..................................................................................138
4.5.4 Switching abandoned areas to oil palm production............................................ 140
4.5.5 Continuing rubber production............................................................................... 141
4.5.6 Switching rubber to oil palm production....................................... 142
4.6 Conclusions...................................................................................................................143
CHAPTER 5 QUANTITATIVE ANALYSIS OF FACTORS INFLUENCING LAND USE CHANGE.......................................................................................................................................147
5.1 Introduction.................................................................................................................... 147
5.2 HHs’ current land use and combinations of land use............................................... 148
5.3 Tracking of land use change....................................................................................... 150
5.4 HH profile variables and their influence on the decision to grow oil palm...............157
5.5 Quantitative analysis of factors influencing land use change.................................... 165

VII
5.5.1 Factors influencing land owners to continue paddy cultivation...................... 168
5.5.2 Factors influencing land owners to switch paddy to oil palm cultivation........173
5.5.3 Factors influencing land owners to continue rubber cultivation...................... 177
5.5.4 Factors influencing land owners to switch rubber to oil palm cultivation.......180
5.5.5 Factors influencing land owners to continue to leave areas abandoned........ 183
5.5.6 Factors influencing land owners to switch abandoned areas to oil palmcultivation.............................................................................................................................. 187
5.6 Conclusions: Factors influencing land use decisions................................................ 192
5.7 Conclusions................................................................................................................... 194
CHAPTER 6 FINANCIAL IMPACTS OF LAND USE SWITCHING ON STAKEHOLDERS 197
6.1 Introduction.................................................................................................................... 197
6.2 Operational and financial performance of crop cultivations and forward linkageindustries.................................................................................................................................. 199
6.2.1 Paddy and rice milling sector ......................................................................... 199
6.2.2 Rubber and rubber sheet and block rubber sector............................................ 203
6.2.3 Oil palm and coconut and palm oil sector.......................................................... 207
6.3 Value chain and contributions to stakeholders......................................................... 212
6.4 Impacts of land use switching on stakeholders..........................................................226
6.4.1 Switching land from paddy to oil palm ................................................................226
6.4.2 Switching land from rubber to oil palm................................................................227
6.5 Conclusion.....................................................................................................................228
CHAPTER 7 ANALYSIS OF POLICY IMPLEMENTATION AND LOSS OF PADDY AREAS ........................................................................................................................................ 232
7.1 Introduction....................................................................................................................232
7.2 Rationale for establishing the biodiesel development policy....................................232
7.3 Loss of paddy area as a policy issue..........................................................................234
7.4 Success of oil palm promotion, loss of paddy area and perception of policy makers ........................................................................................................................................242
7.5 Perspectives of policy makers towards current loss of paddy area........................ 248
7.6 Capacity of government to deal with loss of paddy area in the future.....................258
7.7 Conclusions.................................................................................................................. 262
CHAPTER 8 DISCUSSION AND CONCLUSIONS..................................................................264
8.1 Introduction....................................................................................................................264

VIII
8.2 Limitations of the Research..........................................................................................264
8.3 Summary and discussions of overall findings............................................................265
8.3.1 Research objective 1.............................................................................................266
8.3.2 Research objective 2 .............................................................................................270
8.3.3 Research objective 3.............................................................................................270
8.4 Research contributions................................................................................................ 273
8.5 Policy recommendations..............................................................................................274
8.6 Future research recommendations..............................................................................276
REFFERENCES......................................................................................................................... 279
APPENDIX 1 QUESTIONNAIRE FOR HOUSEHOLDS’ CHARACTERISTICS SURVEY .300
APPENDIX 2 QUESTIONNAIRE FOR FACTORS INFLUENCING LAND USE DECISION .......................................................................................................................................................317
APPENDIX 3 INVITATION LETTER AND INTERVIEW QUESTION....................................336

IX
LIST OF TABLES
Table 2.1 Goals of thel 5-year of ADEP...................................................................................... 32Table 3.1 Summary of the key respondent profile in the study of determinants of land usechange............................................................................................................................................ 62Table 3.2 Summary of sample size of questionnaire respondents.......................................... 65Table 3.3 Factors and criteria determining land use change to oil palm..................................73Table 3.4 The 9-point comparison scale of classical A H P ........................................................76Table 3.5 The 2-point comparison scale of T- A H P .................................................................. 76Table 3.6 The pairwise comparison reciprocal matrix............................................................... 77Table 3.7 The normalized scores................................................................................................ 78Table 3.8 The average values......................................................................................................78Table 3.9 Summary of the selected philosophical and methodological approaches..............89Table 4.1 Overview of land use strategy of the interviewed households................................ 90Table 4.2 Composition of the ten HHs selected in Chianyai and Prasaeng........................... 92Table 4.3 Current occupation of young people by age.............................................................. 94Table 4.4 Current occupation by education................................................................................96Table 4.5 Current residence by main occupation.......................................................................96Table 4.6 Land ownership and uses..........................................................................................100Table 4.7 Social activities and group membership...................................................................104Table 4.8 Religious practices and ceremonies, annual festivals and other relevantceremonies...................................................................................................................................105Table 4.9 Institutions and groups in Chianyai and Prasaeng................................................. 108Table 4.10 Valuation of productive assets................................................................................I l lTable 4.11 HHs’ income, expenditure and balance.................................................................114Table 4.12 HH debt and saving..................................................................................................118Table 4.13 Factors influencing land use change: evidence from livelihood s tudy............... 144Table 5.1 Combinations of land use strategies........................................................................ 148Table 5.2 Numbers of OP growers and non-growers applying different combinations of landuses..................................................................................................................... 149Table 5.3 Size and share of current use of land occupied by OP growers and NOP growers....................................................................................................................................................... 151Table 5.4 Combinations of land use strategies........................................................................ 155Table 5.5 Initial land use before rotating to current use .......................................................... 156Table 5.6 Change of land use from the latest initial land use to present land use............... 156Table 5.7 Basic household characteristics of OP growers and NOP growers......................161Table 5.8 The frequencies of factors influencing HHs’ land use strategies.......................... 166Table 5.9 The priority weights, ranks and influences for factors influencing HHs’ land usestrategies......................................................................................................................................167Table 5.10 The statistically significant mean weight differences between factors influencing HHs to continue paddy cultivation............................................................................................. 170

Table 5.11 The statistically significant mean weight differences between the predominantlypaddy and abandoned areas of factors influencing HHs to continue paddy cultivation 172Table 5.12 Factors influencing HHs to continue paddy cultivation........................................ 172Table 5.13 The statistically significant mean weight differences between factors influencingHHs to switch paddy to oil palm cultivation...............................................................................175Table 5.14 The statistically significant mean weight differences between the predominantly paddy and abandoned areas of factors influencing HHs to switch from paddy to oil palmcultivation......................................................................................................................................176Table 5.15 Factors influencing HHs to switch from paddy to oil palm cultivation................. 176Table 5.16 The statistically significant mean weight differences between factors influencingHHs to continue rubber cultivation............................................................................................. 178Table 5.17 Factors influencing HHs to continue rubber cultivation........................................180Table 5.18 The statistically significant mean weight differences between factors influencingHHs to switch rubber area to oil palm cultivation.....................................................................182Table 5.19 Factors influencing HHs to switch rubber area to oil palm cultivation................ 183Table 5.20 The statistically significant mean weight differences between factors influencingHHs to continue to leave area abandoned................................................................................185Table 5.21 The statistically significant mean weight differences between the predominantly paddy and abandoned areas of factors influencing HHs to continue to leave land abandoned....................................................................................................................................................... 187Table 5.22 Factors influencing HHs to continue to leave land abandoned........................... 187Table 5.23 The statistically significant mean weight differences between factors influencingHHs to switch abandoned area to oil palm cultivation............................................................. 190Table 5.24 The statistically significant mean weight differences between the predominantly paddy, rubber and abandoned areas of factors influencing HHs to switch abandoned land tooil palm cultivation....................................................................................................................... 191Table 5.25 Factors influencing HHs to switch abandoned land to oil palm cultivation........ 191Table 5.26 Factors influencing land use decisions..................................................................192Table 5.27 HH characteristics influencing decision to cultivate oil palm................................195Table 6.1 Land use, crop price, supply, input expenditure and pattern of sales of the paddysector............................................................................................................................................ 200Table 6.2 Supply, input expenditure and pattern of sales of the rice milling sector.............202Table 6.3 Land use, crop price, supply, input expenditure and pattern of sales of the rubbersector.......................................................................................................... 204Table 6.4 Supply, input expenditure and pattern of sales of the rubber sheet and blockrubber sector................................................................................................................................ 206Table 6.5 Land use, crop price, supply, input expenditure and pattern of sales of the oil palmsector............................................................................................................................................ 208Table 6.6 Supply, input expenditure and pattern of sales of the coconut and palm oil sector 210Table 6.7 Stakeholders and categories of expenditure they receive.....................................213Table 6.8 Value of production throughout the supply chains created by stakeholders....... 215

XI
Table 6.9 Change and percentage change in financial performances caused by land use switching on the stakeholders....................................................................................................230

XII
LIST OF FIGURES
Figure 1.1 Thesis overview............................................................................................................. 7Figure 2.1 Geography of Thailand................................................................................................. 9Figure 2.2 Forest area in Thailand............................................................................................... 14Figure 2.3 Forest area change between 1973 and 1998..........................................................14Figure 2.4 Harvest area of agricultural products........................................................................ 16Figure 2.5 Agricultural land use....................................................................................................16Figure 2.6 Average prices of rubber sheet, oil palm and paddy rice ....................................... 18Figure 2.7 Expansion of land use by region for rubber and paddy rice ...................................19Figure 2.8 Price of selected types of paddy rice ........................................................................20Figure 2.9 Abandoned areas by region in 2008/2009............................................................... 21Figure 2.10 Situation of land use in Thailand 2008/2009..........................................................22Figure 2.11 Gross domestic product by sector (at 1988 prices)...............................................24Figure 2.12 Share of gross domestic product by sector............................................................24Figure 2.13 Share of population in agricultural sector............................................................... 25Figure 2.14 Commercial primary energy consumption..............................................................25Figure 2.15 Share of commercial primary energy consumption by sector in 2010 .............26Figure 2.16 Share of final energy consumption by sector in 2010........................................... 27Figure 2.17 Share of final modern energy consumption by energy type in 2010................... 27Figure 2.18 Energy consumption, energy import (net) and crude oil import...........................28Figure 2.19 Emission of CO2 by economic sector......................................................................29Figure 2.20 Biodiesel development plan for 2008-2022............................................................33Figure 2.21 Cultivation areas of paddy rice, natural rubber and oil palm in 2012.................. 35Figure 2.22 Oil palm cultivation area in different regions of Thailand...................................... 36Figure 2.23 Annual expansion of cultivation area of oil palm ................................................... 37Figure 2.24 Land use in the Pak Phanang River Basin............................................................. 39Figure 2.25 Area of paddy rice, natural rubber and oil palm in Thailand................................ 40Figure 2.26 Paddy rice field.......................................................................................................... 42Figure 2.27 Rubber tree and latex tapping.................................................................................43Figure 2.28 Oil palm tree.............................................................................................................. 44Figure 2.29 Palm biodiesel production system ......................................................................... 45Figure 3.1 Location of the study area..........................................................................................60Figure 3.2 Traditional conceptual framework for ecosystem studies....................................... 67Figure 3.3 Conceptual framework for long-term investigations of social-ecological systems.......................................................................................................................................................... 67Figure 3.4 The components of the sustainable livelihood framework...................................... 69Figure 4.1 Annual rainfall in Nakhon Si Thammarat province................................................ 120Figure 4.2 Price of unmilled paddy, rubber sheet and fresh fruit of oil palm between 1987and 2012.......................................................................................................................................123Figure 4.3 Price of unmilled paddy and fresh fruit of oil palm between 1987 and 2012...... 123Figure 4.4 Annual income, cost and net income of paddy, rubber and oil palm cultivation. 125

XIII
Figure 4.5 Annual net income of paddy, rubber and oil palm cultivation.............................. 126Figure 4.6 Transportation, oil palm planting area, collection centre and palm oil crushing millin Nakhon Si Thammarat............................................................................................................ 128Figure 5.1 Comparison of the priority weights for the factors influencing land owners tocontinue paddy cultivation or switch paddy to oil palm cultivation......................................... 171Figure 5.2 Comparison of the priority weights for the factors influencing land owners tocontinue rubber cultivation or switch rubber to oil palm cultivation........................................ 179Figure 5.3 Comparison of the priority weights for the factors influencing land owners tocontinue to leave land abandoned or switch abandoned areas to oil palm cultivation........186Figure 6.1 Common geographic flows of crop output from the three alternative land uses 198Figure 6.2 Impacts of land use change on the stakeholders..................................................231Figure 7.1 Area under paddy, oil palm and rubber cultivation................................................245Figure 7.2 Area of paddy cultivation in Thailand by regions................................................... 245Figure 7.3 Milled rice exports of the 5 biggest exporting countries........................................ 249Figure 7.4 Total paddy output and export of paddy of Thailand............................................ 249Figure 8.1 Factors influencing land use decisions.................................................................. 267

XIV
LIST OF ACRONYMS AND ABBREVIATIONS
ADB Asian Development Bank
AEDP Alternative Energy Development Plan
AHP Analytic Hierarchy Process
CBDP Committee on Biofuel Development and Promotion
CPO Crude Palm Oil
DEDE Department of Alternative Energy Development and Efficiency, Ministry of
Energy, Thailand
DFID Department for International Development
DMR Department of Mineral Resources, Ministry of Natural Resources and
Environment, Thailand
DOA Department of Agriculture, Ministry of Agriculture and Cooperatives of
Thailand
EPPO Energy Policy & Planning Office, Ministry of Energy, Thailand
FAO Food and Agriculture Organization of the United Nations
FAOSTAT Statistics Division of Food and Agriculture Organization of the United Nations
FFB Oil Palm Fresh Fruit Bunches
Ha Hectare
HH Household
HHH Household Head
KTOE Kilotonne of Crude Oil Equivalent
LDD Land Development Department, Ministry of Agriculture and Cooperatives,
Thailand
LUC Land Use Change
NCB Nuffield Council on Bioethics
OAE Office of Agricultural Economics
OITNP Office of Internal Trade of Nakhon Si Thammarat province
ON CARP Office of Natural Calamity and Agricultural Risk Prevention
ONESDB Office of the National Economic and Social Development Board, Thailand
MAC Ministry of Agriculture and Cooperatives, Thailand
MOE Ministry of Energy, Thailand

XV
NESDP National Economic and Social Development Plan
ORRAF Office of Rubber Replanting Aid Fund
RFA Renewable Fuels Agency
RTG Royal Thai Government
SOPRC Surat Thani Oil Palm Research Center
SL Sustainable Livelihood
T-AHP Ternary Analytic Hierarchy Process
UNESAP United Nations Economic and Social Commission for Asia and the Pacific
USDA United States Department of Agriculture
USEPA US Environmental Protection Agency

CHAPTER 1
INTRODUCTION
1.1 Research background and motivation
Land use has played an important role within national development strategies. In the
long history of development, land use changes have appeared worldwide. Some of this
change is the result of explicit government policy adapted to be consistent with different
pressures. Every country attempts to utilize their resources to enhance national capacity
and provide well-being for their populations. However, rapid development requires more
resources than nature provides. Agricultural land has been expanded to produce and supply
enough food to support economic prosperity. Moreover, land has been used to support rapid
industrial development and urbanization that need land as a base for infrastructure for
instant accommodation and transportation systems that are dependent on land.
Since the last century, land has become a scarce resource because of increasing
world population and its variety of uses. A doubling in global food demand projected for the
next 50 years causes concern regarding food security (Tilman et al., 2002). Although
technologies of agriculture and food production are being developed, a dramatic increase in
demand for products that use land as a primary input has resulted in global land use
competition. In fact, land not only supports food production systems, but is required to be
utilized for other purposes. One contribution of land use is to provide agricultural products
for producing renewable energy.
Biofuel is one agricultural-based alternative to fossil fuel promoted worldwide.
Growing attention is paid to ethanol and biodiesel regarding their potential to contribute to
the attainment of a number of important policy goals. They can contribute to national energy
security for an oil importing country and reduce CO2 emissions from the transport sector
(Smith et al., 2010; Woods et al., 2010). Moreover, biofuel production can offer options to
support rural development strategies by providing business opportunities in the energy and

agricultural sectors. Based on these potential benefits, several governments have set
targets to increase the biofuel share in the national energy matrix. In addition, expansions of
land use for cultivating biofuel feedstock are promoted and a large amount of liquid biofuels
are demanded to promote success of these policies (Murphy et al., 2011). However,
sustaining these targets may be a challenge mainly because of land scarcity and the
concerns relevant to its consequences.
The food versus fuel controversy (Bafes and Haniotis, 2010) and indirect land-use
change effects (Searchinger et al., 2008; Wiegmann et al., 2008) are considered to be
important issues following the increase in demand for biomass as the material of biofuel
production (Dauber et al., 2012). These issues are serious because, with scarcity of land,
switching land use from food to biofuel crop cultivation can decrease food supply and then
increase the price of food commodities that seriously impacts on food affordability and
starvation for food-insecure and poor people (Johansson and Azar, 2007; Naylor et al.,
2007). In addition, increased commodity prices could influence some land use choices
elsewhere, such as forest and pasture, to be changed into agricultural land which ultimately
causes substantial increase in the amount of CO2 emissions (Fargione et al., 2008;
Searchinger et al., 2008) and other additional concerns such as biodiversity loss, and
pressure on local water resources (Yeh and Witcover, 2010).
However, some ideas have been suggested to overcome the conflicts. For example,
integrating food and biofuel feedstock farming has been proposed to solve both local food
shortages and gain higher income for the poorest people in the world (Fresco, 2007). In
addition, food and biofuel crop farming areas should be segregated by continuing food
production on established and productive areas whereas dedicated biofuel crops may be
grown on areas which are not used in either conservation or agricultural production (RFA,
2008).
Although the above suggestions may support local food security and/or prevent
substitution of biofuel feedstock on land allocated for food production, accomplishing these
suggestions to attain global food security is challenging. This is because it is dependent on
the concerns and intentions of each country, especially of food exporting countries where
the food crop exports are important economically. Generally, with different socio-economic
situations, production systems and natural resources, it appears that expectations regarding

contribution of land use, especially for food crop production, tend to differ across countries.
While arable lands and potential arable lands, especially in countries with scarcity of arable
land, are conserved and/or developed for food crop cultivation to maintain their own food
security, some arable lands traditionally used for food crop cultivation, especially in
countries with a large area of arable land, are allowed to be switched to alternative crops or
other purposes if the alternative ways are expected to be able to provide more favourable
returns. This implies that global land for food provision is designated differently across
countries to fulfil their own national targets. Thus the impacts on global land use and food
security are an integration of local changes at the nation state scale. Based on these
implications, it is interesting to consider how global land use would be changed after the
advent of biofuel crops which might provide other valuable opportunities for countries with a
large area of arable land. This is because this change would significantly influence global
food supply.
In order to be able to assess the potential impact on global food security, it is
necessary to understand the dynamics of lands which are allocated for or have potential for
food production, after the advent of biofuel crops especially in food exporting countries.
Many researchers have tried to examine the dynamics of land use (LUC) caused by biofuel
expansion, for example Hiederer et al. (2010), Al-Riffai et al. (2010), USEPA (2010), Tyner
et al. (2010), Wise et al. (2009), Bauen et al. (2010), Fritsche et al. (2010), Tipper et al.
(2009) and Warner et al. (2013). However, these studies are mostly based on LUG
modelling approaches relying on computer simulations or extrapolations of historic data to
evaluate total LUG, whereas LUG studies based on observing perspectives, motivations and
behaviours of local land owners and the government are relatively few. Moreover, published
research on perspectives of local land owners and the government relevant to decisions
about cultivating biofuel crops is limited to a small study by Amatayakul and Azar (2008)
which explores factors influencing HHs’ decisions regarding cultivating eucalyptus, a fuel-
wood crop, in Thailand. Given these gaps in knowledge, there is an urgent need for more
research to be done so as to enhance understanding of land uses issues. In order to
comprehend the dynamics of land use incentivised by biofuel crop expansion via landowner
and government perspectives, three independent areas of study were identified:
(a) the impact on stakeholders if land is switched from traditional use to biofuel crop
cultivation

(b) the factors influencing decisions over land use switching
(c) the government’s perspective on loss of food area caused by biofuel crop
expansion and how government deals with that loss.
This research approached investigation of these issues using a case study of
expansion of oil palm cultivating areas supporting the palm oil based biodiesel development
policy in Thailand. As a lead paddy rice exporting country in the world market, most arable
areas of Thailand have been used for paddy cultivation for a long time. However, these
areas are also considered as a potential area suitable for oil palm cultivation. Even though
there have been no supports from the government, some paddy areas were switched to oil
palm cultivation especially after oil palm cultivation was promoted to provide sufficient
material for the biodiesel industry. Based on these contexts, competition of land use
between paddy and oil palm in Thailand can be used to comprehend sustainability of land
uses by looking at local land use changes on the nation state scale.
1.2 Research objectives and research questions
In order to increase understanding of the dynamics of land use, this research is
formulated to pursue the intention to investigate impacts of land use switching on the
stakeholders, perspectives of landowners in deciding to switch their land and of the
government in promoting biofuel crop cultivation and losing food areas. To achieve these
goals, three explicit research objectives and ten relevant questions are as follows:
1) To explore factors influencing land use change
This objective is achieved by pursuing three research questions:
Q1. How are farmers’ livelihoods currently constructed?
Q2. What are the important aspects of livelihood at present?
Q3. What are the drivers influencing the willingness of farmers to switch land use
from traditional to biofuel crops?

2) To assess the impacts of land use change derived from the biofuel development
policy
This objective is achieved by pursuing three research questions:
Q4. What are the current systems (production, processing, marketing, etc) of
each alternative land use?
05. Who are the stakeholders in these systems?
06. What are the impacts of land use change on the stakeholders?
3) To assess the effectiveness of policy implementation in land use change
This objective is achieved by pursuing four research questions:
07. What is the current situation in terms of the unintended consequence of
paddy rice being substituted by oil palm?
08. Did the policy makers know about this unintended consequence?
09. How did policy makers try to adapt to this unintended consequences?
010. In the event that they knew but did not adapt, what caused the inertia?
1.3 Significance of the study
The contribution to knowledge made by this research is to demonstrate the holistic
perspectives of the dynamics of land use that have been gained from landowners and policy
makers, which provide a better understanding of the dynamics of land use. These holistic
perspectives should provide important information for developing countries promoting oil
palm cultivation and prevent substitution of oil palm in food areas which is an unintended
effect of oil palm promotion. In addition, the research should provide information for
international organisations to ensure a basic understanding of the perspectives of important
stakeholders in promoting renewable development and dealing with global food security.

1.4 Structure of the thesis
This thesis is organized into eight chapters as presented in Figure 1.1, below.
Chapter 1 outlines the research background and motivation, research objectives and
research questions, significance of the study, and structure of the thesis
Chapter 2 reviews the context of Thailand as the background of the study. This
includes geography, policy and agricultural development, land use change and relevant
consequences of economic development and biofuel development in Thailand.
Chapter 3 presents the overall research design and a justification for the research
methods chosen. These include research objectives and questions, the philosophical and
methodological aspects, and the research design.
Chapter 4 and 5 present the findings regarding factors influencing land use change.
The results of the quantitative and qualitative studies are presented separately in Chapters 4
and 5 respectively. Chapter 4 provides a comprehensive picture of the views from the in-
depth interviews with the landowners. In Chapter 5, the findings from the quantitative study
are given.
Chapter 6 presents the research results relevant to the financial impacts of land use
switching on stakeholders.
Chapter 7 presents the results from the analysis of policy implementation and
effectiveness of dealing with loss of paddy areas caused by promotion of oil palm cultivation.
Chapter 8 presents a summary and discussions of the overall findings. In addition,
research contributions, policy recommendations, limitations of the study and future research
recommendations are identified.

Objective 2Objective 1 Objective 3
Findings
Chapter 8
Conclusion and discussion
Chapter 3
Research methodology
Oil palm plantationChapter 2
Contexts of Thailand
Chapter 1
Introduction
Chapter 4
Qualitative
Analysis of Factors
Influencing Land
Use Change
Chapter 6
Financial Impacts of
Land Use Switching
Chapter 5
Quantitative
Analysis of Factors
Influencing Land
Use Change
Chapter 7
Analysis of Policy
Implementation and
Loss of Paddy
Areas
Figure 1.1 Thesis overview

CHAPTER 2
CONTEXT OF THAILAND
2.1 Introduction
This chapter provides background information about Thailand that is
necessary to look at with regard to the research questions. With the interest of the
research being dynamics of land use for food production influenced by biofuel crops,
basic information about land resources, development and changes in agricultural
land use and the advent of biofuel crops as an alternative land use substituting food
areas are provided. In doing so, the contexts of Thailand shown in this chapter are
divided into four main sections: geography and land characteristics; policy and
agricultural development; land use change and relevant consequences of economic
development; and biofuel development in Thailand.
2.2 Geography and land characteristics
Thailand is located in Southeast Asia with a total area of about 51.36 million
hectares. In terms of land area, Thailand is a medium size country and shares
borders with four other countries: Myanmar to the north and west, Laos to the north
and northeast, Cambodia to the southeast and Malaysia to the south. According to
administrative and statistical contexts based on geographical features as well as
human cultural patterns, Thailand can be divided into four regions, namely the
Northern Region, the Central Plain Region, the Northeastern Region and the
Southern Region of Thailand.
(1) The Northern Region
Northern region of Thailand is geographically characterised by multiple
mountain ranges, which lie in a north/south direction. These high mountains are
incised by steep river valleys and upland areas. A series of rivers, including the Nan,
Ping, Wang and Yom, originate from these mountain ranges and then unite in the
lowlands to form the Chao Phraya Watershed in the central plain of the country, while
some rivers in the northeast of the region like the Kok and Ing are drained by rivers
flowing into the Mekong Basin. Traditionally, river valleys and upland areas between

IWUfUtORJIfÛflMUIIBJÜlStTminU OUUll-lS«««»»« u z w o
«u^nhïvnUMn
a. Geological map b. Topographie Map
Figure 2.1 Geography of Thailand
Source: a. DMR (2003)
b. Adapted from Sadalmelik (2007)
Note: Descriptions of geological colours in Figure 2.1 a.1. Fluvial deposits accumulated in flood plain, alluvium, terrace and colluvium; pebble, sand and
clay.2. Coastal deposits accumulated in beach, mangrove swamp, marsh and lagoon: pebble, sand, clay
and silt3. Sedimentary rock and semiconsolidated sedimentary rock: mudstone and shale, inserted by
lignite4. Sedimentary rock: sandstone and siltstone inserted by conglomerate, shale and mudstone5. Sedimentary rock; most of shale mixed with other kinds of sedimentary rock6. Sedimentary rock: most of limestone mixed with dolomite and other kinds of sedimentary rock7. Metamorphic rock: marble, gneiss and schist8. Extrusive igneous rock; basalt9. Intrusive igneous rock: granite, rhyolite, igneous rock mixed with metamorphic rock, and gabbro10. Volcanic rock: rhyolite, andésite and volcanic ash stone.

10
the ranges make possible land utilization for agricultural purposes including wet-rice
farming in the valleys and crop cultivation in the uplands.
(2) The Central Plain Region
The Central Plain is a region covering the broad alluvial plain of the Chao
Phraya River Basin. The plain originated from the accumulation of sediment from the
rivers flowing across the plain to the Gulf of Thailand located next to the southern
border of the region. The sediment accumulated in the plain is not only from rivers
originating in the northern region of country but also from the mountain ranges at the
eastern and western borders of the plain. Therefore, the plain consists of the major
rivers including mainly the Chao Phraya River, with the Mae Klong and Sakae Krang
in the west, as well as the Pa Sak, Lop Bun, Bang Pakong and so on in the east.
Geographically, the complex river system and fertile plain provide the ideal conditions
to support wet-rice agriculture in this region.
(3) The Northeast Region
This region consists mainly of the Khorat Plateau which rises distinctly from
the Central Plain region. The plateau tilts from the mountain range in the west of the
region down towards the Mekong River. A series of rivers originate in the mountain
ranges in the west before uniting into the two main rivers of the region: the Mun and
Chi Rivers which ultimately flow into the Mekong River. Traditionally, with its poor
soils, this region is not favourable for agriculture. However, sticky rice, the staple food
of the region which requires flooded, poorly drained paddy fields, thrives where the
fields can be flooded from nearby streams, rivers and ponds.
(4) The Southern Region
Southern region is located on a peninsula of which the western part has
steeper coasts, while river plains dominate on the eastern side. The middle part of
the region consists of several mountain ranges where the rivers of the region
originate. There are many small rivers, a few of medium length and two large ones,
the Tapi and Pattani. Their extensive deltas have been generated by the
accumulation of sediment which these rivers have carried from their headwater
areas. The river basins on the coastal plain along the shore are most impressive in
the east of the region. These consist of the Pattani River Basin in Pattani province.

11
Tapi River Basin in Surat Thani province and Pak Phanang River Basin in Nakhon Si
Thammarat province. Geographically, fertile plain basins are used for wet-rice
cultivation whereas upland areas are used for fruit trees and tree crops.
2.3 Policy and agricultural development in Thailand
Land use change in Thailand may be traced through history. The policies
relevant to agricultural development are considered to be powerful drivers of land use
change because Thailand has depended significantly on the agricultural sector which
needs land as a primary resource. According to political, institutional, demographic,
economic and technological factors, agricultural policy has been launched for the
survival of the country and has ultimately caused land use change. Three stages of
agricultural development can be recognized: firstly, small-scale subsistence farming
(pre-1855); secondly, commercially-oriented farming (1855-1960); and finally,
modern agricultural farming (post-1960)
(1) Small-scale subsistence farming (pre-1855)
Up until around the middle of the eighteenth century, agriculture in Thailand
was in small scale of subsistence farming especially in the rural sector. Crop
cultivation was determined directly for satisfying the basic needs of the family.
Excess supply over family consumption was for barter exchange to gain other
products. Moreover, rice became the tribute to the local elite. In this era, land was
abundant and land rights could be obtained by usufruct by which the holders could
have the right to use as long as they want to use it and/or there is no reclamation by
the government (UNESAP, 2002).
(2) Commercially-oriented farming (1855-1960)
The turning point accelerating the growth of commercially-oriented farming in
Thailand was the expansion of colonialism around the late eighteenth to early
nineteenth century. To maintain national independence, Siam (the name of Thailand
at that time) had to sign imposed treaties with western countries to liberalize foreign
trade. Although they were claimed to be unequal bilateral contracts, Siam was not in
position to negotiate.

12
The Bowring Treaty^ and several treaties imposed by the British and other
western countries gradually changed the rice production and trading system in
Thailand. The rice market was opened to export to British colonial states. This led to
the agricultural system becoming gradually integrated into the global market. In order
to enhance the commercial system, the state began to impose tax on land to
encourage farmers to produce a surplus for trading (UNESAP, 2002). Moreover there
was investment in large public infrastructure such as roads and canals especially in
the Chao Phraya River delta so that large areas of uncultivated land could be put
under paddy production (Siamwalla and Setboonsarng, 1991).
However agricultural commercialization was slow. Commercial farming
occurred mostly in the areas accessible by transport especially in the central plain
and near seacoasts such as in the Pak Phanang River Basin in the south. The
increase in rice production for commercial purposes was derived from land
expansion and underutilized family-labour use, with no change in production
technology. In this period rice was still the principal commercial crop, and was
exported mainly to British colonial countries in Southeast Asia, especially Malaysia
and Singapore (UNESAP, 2002).
(3) Modern agricultural farming (post-1960)
After the Second World War, world trade expanded rapidly especially in
agricultural raw materials. Many cash crops were promoted in Thailand for cultivating
in the accessible upland areas not appropriate for paddy farming. A huge growth of
farming areas occurred in this era together with the expansion of the export market
for agricultural crops, like maize, kenaf, sugar cane and cassava. Modern farm inputs
were promoted to enhance farm productivity under the brand of the Green Revolution
(UNESAP, 2002).
The introduction of modern agricultural technologies influenced Thailand to
become dependent on foreign assistance especially from the World Bank. Massive
capital was required to invest in infrastructure projects such as irrigation systems and
in the promotion of modern farming technologies to enhance farming productivity.
However, in order to obtain such assistances, several conditions were required by
the name given to the “Treaty of Friendship and Commerce between the British Empire and the
Kingdom of Siam” signed in 1855

13
the World Bank. One was the establishment of mid-term national economic
development plans (UNESAP, 2002).
According to the strategies of the First National Economic Development Plan
1961-1966, agriculture was set to play a dual role supporting the development. On
one hand, the agricultural sector was to continue to be a source of export income to
support the import of capital goods. On the other hand, the agricultural sector had to
provide cheap food sources to support the progress of national urbanization and
industrialization. Therefore, the objectives of agricultural policy in this period were to
enhance farming productivity to increase exports and to keep the agricultural
products’ prices low. These strategies influenced farmers to expand their farming
land and intensify their production for the revenue. The Green Revolution gradually
took place with substantial use of high technologies such as fertilizers, pesticides and
farm mechanisation especially tractors (UNESAP, 2002).
2.4 Land use change and relevant consequences of economic development
(1) Deforestation
In the past, Thailand was densely covered by forests, especially outside the
lower Central Plain where the forest had been depleted to expand agricultural area.
Clearing by slashing and burning was utilised by farmers to make forest areas
available and suitable for paddy cultivation. In the early 1900s, 38.5 million hectares
of forest covered most of Thailand (75% of total land area) (Phelinas, 2001).
However, these forests had been reduced to about 27 million hectares (53% of total
land area) in 1961 and about 13 million hectares (25% of total land area) in 1998
(see Figure 2.2) (Ongsomwang, 2006).
Although deforestation occurred in all regions in the past, it is difficult to
estimate the area for paddy cultivation responsible for decreases of forest area.
Generally, the area under paddy cultivation expanded rapidly before the pre-World
War II period in the central plain region which was not intensively forested. However,
many areas for paddy and other agricultural crops expanded after the World War II
period especially in initially wooded areas. Considering overall depletion in the
country, the highest deforestation rate occurred in the Northeast, partly because of
agricultural area expansion (Phelinas, 2001) not only for paddy but also for field
crops promoted largely by the government (see Figure 2.3).

14
Millions Ha.
25
20
CslN-
Figure 2.2 Forest area in Thailand
Sources: Data from Ongsomwang (2006)
î' %
a. Forest area in 1973
W
b. Forest area in 1998
Figure 2.3 Forest area change between 1973 and 1998
Sources: Ongsomwang (2006)
Note: Deforestation is in the red areas

15
(2) Change of agricultural land
According to the specific policies of the government to clear more land for
agricultural production, a vast amount of land is available for paddy farming and
paddy is widely grown in all regions. Moreover, the introduction of several field crops
to cultivate in the available upland areas significantly diversified the range of
economic crops. With an import-substitution industrialization strategy after
implementing the first national economic development plan in 1961, agricultural land
was expanded significantly both in terms of paddy area and other field crops. Overall
trends in harvest areas of significant economic crops were positive. The harvest area
of paddy almost doubled from 1961 to 2009, while the harvest area of cassava, sugar
cane and maize gradually increased (see Figure 2.4).
Up to the late 1980s, about 41 % (21 million hectares) of the total land area
was under farming to produce agricultural goods for domestic consumption and
export. Among the large number of crops of economic significance, paddy rice was
the most important covering about half of the country's cultivated area. Other major
field crops were cassava, maize, sugar cane, oil crops and perennial trees such as
natural rubber, fruit trees, covering the rest of the area (see Figure 2.5).
(3) Dynamics of change of agricultural land
However, after the 1980s the use of agricultural land changed significantly.
The area of agricultural land under fruit tree and tree crops increased whereas the
area under paddy and field crops decreased. Socio-economic, technological and
climatic conditions are considered to be the cause of abandonment or the change of
use of land to perennial trees.
While agricultural land use increased tremendously as a result of national
policy to increase the export of agricultural products for income generation, many
unsuitable and unproductive lands were used for paddy and field crop production.
These crops have labour intensive production processes and farmers satisfied their
agricultural outputs by using family-labour, which was not utilized or utilized for other
activities, with the technology available at that time. However, after the Green
Revolution in Thailand, production technologies changed dramatically. With the
advance of technological development and a decrease in the availability of
agricultural labour because of the trend of labourers moving to the industrial sector

16
Millions Ha.
12.00
10.00
Rice, paddy;.00
Cassava6.00 Sugar cane
Maize4.00
2.00
0.001- 00 m h- 05 T-CD CD CO CD CD N -05 (J ) C35 (0 ) (35 CD
CO en CD t -CO 00 00 CX5 C55CD CD CD D 05
CO m D D CD CD D CD D CD CD
T - 00 ID N CD O O O O O O O O O O CN CM C\J CNJ CN
Figure 2.4 Harvest area of agricultural products
Source: FAOSTAT (2012)
Note: According to FAOSTAT definition, some harvest areas might be counted many times if the crop under consideration is harvested more than once during the year as a consequence of successive cropping (i.e. the same crop is sown or planted more than once in the same field during the year)
Millions Ha.14.00
12.00
10.00
8.00
6.00
4.00
2.00
0.00CO N 00 O ) OCO CO CO CO O )G) O O) G) § 8
CMCDTj-mCDNCOCDo o o o o o o oo o o o o o o o
• Paddy land
• Under field crop
• Under fru it trees and tree crops
■ others
Figure 2.5 Agricultural land use
Source: Unpublished data, OAE (2012a)

17
and a national birth control policy, the structure of production was changed from
labour intensive to capital intensive. Farming became dependent on technology
transfers with high yielding varieties of seeds and chemicals such as pesticides,
insecticides and fertilizers being applied intensively. Although the Green Revolution
greatly improved land productivity, it forced farmers to buy costly inputs which
ultimately increased the cost of production.
Moreover paddy and field crops are extremely dependent on climatic
conditions. These crops need suitable physical and climatic factors, e.g. sufficient
water and fertile soil, for growing. As the irrigation system covers only some parts of
the agricultural area, most areas are left to depend on rain. Therefore, it is difficult for
farmers to predict their output and profitability for each crop they produce. With
market mechanism, this situation has led farmers to prefer to switch their land to
perennial trees, which are more tolerant of climatic conditions and require less labour
in the production process, or abandon their unproductive land.
1 ) Land switching
In respect of land switching among perennial trees, natural rubber is most
popular. With strong support from the government, and price incentives, land for
rubber cultivation has expanded dramatically. The expansion has not only substituted
paddy and field crop areas but also other perennial tree areas, especially fruit trees.
With their main mission being to administer and implement a scheme to replant and
plant rubber on new areas, the Office of the Rubber Replanting Aid Fund (ORRAF)
supports smallholders in suitable areas with assistance for inputs and cash before
the trees come into production. Moreover, a major cause of the expansion of rubber
area is also due to price increases (see Figure 2.6) driven by increasing demand for
natural rubber, speculation in futures markets and higher prices of synthetic rubber.
Although considered to be suitable for planting in the south, rubber land use has
expanded in all regions of the country especially in the northeast (Figure 2.7a).
2) Land abandonment
In terms of land abandonment, in Thailand most occurs in unfavourable
geographic areas: infertile land e.g. acid soil, saline soil, shallow soil, soil with high
proportion of rock; areas liable to flood in the rainy season; areas prone to drought.
Moreover, abandonment is also caused by socio-economic factors such as

18
insufficiency of labour in the agricultural sector and concentration of land property
rights especially land being occupied by capitalists for non-agricultural purposes
(ONCARP, 2006). However, these areas might be replanted if incentives were
available.
With new market incentives and a new set of government schemes to
develop paddy production and farmer livelihood, abandoned paddy areas are being
replanted especially in the northeast region. After jasmine rice (Mom Mali rice) which
thrives in the northeast became popular worldwide, its price increased more than the
price of normal white rice generally grown in all regions (see Figure 2.8). Moreover, a
new pricing scheme which was introduced by the government to boost the incomes
of farmers and help alleviate rural poverty by rice price and farmers’ income
guarantees is a factor enhancing paddy replanting. This subsidy programme will
compensate farmers if market prices are less than a fixed benchmark offered by the
government.
Baht/Tonne
140,000 -1
120,000
100,000Rice80,000Rubber
60,000Oil Palm
40,000
20,000
Figure 2.6 Average prices of rubber sheet, oil palm and paddy rice
Sources: Unpublished data, OAE (2012b)
Note: Price of rubber refers to rubber sheet
1 B ah f approximately equals 0.02 Pound
Currency unit of Thailand; Approximate exchange rate: 1 Baht equals 0.02 Pound

19
Millions Ha.
2.00
1.50South
North1.00
Central
Northeast
0.50
0.00
CM CM
a. Rubber
Millions Ha.7
6
5
4
3
2
1
0§<33
§(33 i o
oo
s So
CDOOCOOo
oo
'South
-North
■Central
■Northeast
b. Paddy
Figure 2.7 Expansion of land use by region for rubber and paddy rice
Sources: Unpublished data, OAE (2012a)

20
Although these factors can motivate farmers to replant paddy rice in
abandoned areas in the northeast and the north, it is ineffective in the central region
and the south (see Figure 2.7b). The new market incentive and new set of
government schemes cannot effectively motivate farmers in the south to replant
paddy because of the constraints of land and climatic conditions that differ from the
northeast. Therefore, farmers in the south are left to cultivate low quality paddy with
moderate cost but a lower return. Moreover, severe irregular climate in the south
tends to affect the yield of sensitive crops like paddy. In production year 2008/2009,
about 1.3 million hectares of potential paddy area were still abandoned. Most
abandoned paddy area is in the south, accounting for 45% of total abandoned paddy
area, or 6% of the total potential paddy area of the region, whereas the northeast,
which has the most paddy area, has 23% of the total abandoned paddy area or 0.6%
of the total potential paddy area of the region (see Figure 2.9 and 2.10).
Baht/Tonne16,000
14,000
12,000
10,000
1,000- - Unmilled
White Rice 5%6,000
Unmilled Jasmine Rice
4,000
2,000
Figure 2.8 Price of selected types of paddy rice
Source: Unpublished data, OAE (2012f)

21
Northeast23%
South45%
North
Central24%
Figure 2.9 Abandoned areas by region in 2008/2009
Source: Data from LDD (2012c)

22
X t
iio^ iJ is jrnw Inu
fl W.fl. 2551/52
Types of Use Area 1Rai 1 % !
Cofmijnity and bu<*ding area i$.niaw 4.71g g Community and ouidmg IS.I1I4M inAgncuRural area 171.SJ5A*» -AS:
Aoandoned paddy a'sa 0.41Paddy a aa 7W.M.W 1*9Fed crop in*Pe-enn a Diant 10 ilFruit t'-ee .4.»!Rotated fed cmo .4Aai.mFsne’yp.ace l/»4.r‘rj ttU 1Otne'agncuitJ'e lA'J.W 09 1
Forest area n.vira,i.M .»fO*tai.w}Ju
Forest waitmg for restoreton t«.i4tA}rWater .resource area KKJî.r« Î.7J
1 g g Water sourceOtnerarea iwnjMJ .4.74
g g .Abandoned areaH Fdodpam ijayw 0.9 1
Ctnere (mine etc.) on 1Total of Country loom 1
iiV a i H n e n » « « m » o r i U H H i i m i l t n H W
V^s*f nîUHwwinâvitumn^a : imii: Muinnmo#mi i*i imo mwi HMiui luminixii >«ai>iniiiija/iminini k i>«> Idd c^.th
Figure 2.10 Situation of land use in Thailand 2008/2009
Source: Adapted from LDD (2010)
Note: 1 Hectare = 6.25 Rai

23
(4) Economie development and its consequences
After implementing the first national economic development plans, the
economy of Thailand changed gradually. The agricultural sector was dominated by a
western approach to policy planning, and depended on technology from the Green
Revolution. After the sixth national plan (1987-1991), the national economy
expanded at an extreme rate (see Figure 2.11). The expansion of the economy was
due to the success of the government in developing the industrial and service
sectors. The economy of Thailand has continued to expand. Although the economy
declined in 1998 when the economic crisis hit the country, it recovered and has
continued to grow until now (Suthinarakorn and Traimongkolkul, 2002).
In contrast with economic growth, natural resources were rapidly depleted
and there was disappointing progress in Income re-distribution (Krongkaew, 1985). In
1951, agriculture accounted for just below 40% of the total GDP of the country. At the
same time, the share of manufacturing was only 14%. However, during the past 50
years, the ratio of agricultural products in the total GDP has been reducing
continuously. In 2009, agricultural products contributed less than 10% of the total,
whereas manufactures provided a 40% share (see Figure 2.12). Up to now, the
majority of workers are still utilised in the agricultural sector although it has been
continuously losing labour participants to other sectors, especially over the last 20
years (see Figure 2.13). Based on this and the reducing amount of returns to the
agricultural sector, deterioration in quality of life in the agricultural sector became
more evident.
2.5 Biofuel development in Thaiiand
(1) Energy situation in Thailand
For its primary commercial energy supply, Thailand is dependent mainly on
the fossil fuels, especially petroleum products and natural gas, with petroleum’s
share dropping from the first to the second rank since 2007 (See Figure 2.14). In
2010, the total consumption of primary commercial energy was about 90,000
kilotonne of crude oil equivalent (ktoe). The primary commercial energy sources
comprise natural gas, which is the largest source accounting for about 44% the total
supply, petroleum products accounting for 37% of the total energy source, and coal

24
and lignite, which are used mainly for electrical generation and in the heavy industrial
sector, and share about 17% of the total supply (See Figure 2.15).
Millions Baht4 ,500,000
4 ,000,000 ■
3 ,500,000 ■
3 ,000,000 •
2 ,500,000 -
2 ,000,000 -
1,500,000 -
1,000,000 -
500,000 -
■ o ther
□W holesa le and Retail Trade
□Transportation and Communication
■Manufacturing
□Agriculture
Figure 2.11 Gross domestic product by sector (at 1988 prices)
Source: Data from NESDB (2012)
% of G DP
2>3*ï ■
a*i
mother
□ VVhotei-ste a ra Retail Trade
□ Traraoortatb r ar :
■ V aru so tL rirg
□ Agrbulture
r - a o œ oTi M in m
Figure 2.12 Share of gross domestic product by sector
Source: Data from NESDB (2012)

25
-v V V V
■ Total economically active population | Total economically active population in agriculture Share economically active population in agricu^ure
Figure 2.13 Share of population in agricultural sector
Source: Leturque and Wiggins (2011 )
Thousands TKOE45
40
35
30
25
20
15
10
5
0CO h - 00 O) O t -00 00 00 00 O) O)CD CD 05 CD (33 C35 I
CM CMCM
■ Hydro Power ■ Coal & Lignite ■ Natural Gas ■ Petroluem
Figure 2.14 Commercial primary energy consumption
Source: Data from EPPO (2011)

26
Hydro Power _ 2%
Coal & Lignite 17% ^
Pereoluem37%
Natural Gas 44%
Figure 2.15 Share of commercial primary energy consumption by sector in 2010
Source: Data from EPPO (2011 )
The majority of final commercial energy consumption is mostly due to industry
and transport that together consume more than half of the total energy supply (See
Figure 2.16). Final energy demand is met by petroleum products, electricity, coal,
and natural gas. Petroleum products, mostly utilized in industry and transport,
account for 55% of total final energy demand. Electricity, consumed by households,
businesses and industry, accounts for 22% of total final energy demand (See Figure
2.18).
Thailand imported about 55 % of its total final energy consumption in 2011.
Although domestic production increased during the past, energy imports also grew
with crude oil accounting for the largest share of imports. Imports of crude oil
increased significantly and peaked in 2004 at about 82% of total net energy imports,
but then slightly increased and have since remained at about 75-80% (see Figure
2.18). In terms of value, in 2010 the overall value of imported energy was
considerable, accounting for 16.3 % of the total imports of the economy, and 9.4 % of
GDP. Moreover crude oil imports account for 79 % of the total value of energy
imports. The value of natural gas imports accounted for the second largest share, at
9 %, while that of imported petroleum products held a share of 7 %.

27
Agriculture5% 1 —
/ Residential & \ Industry \Commercial \ 37% \
23%
XTransportation J35%
Figure 2 .16 Share of final energy consumption by sector in 2 010
Source: Data from EPPO (20 11 )
Natural CoalLignite
\ i o % 13% \
Electricity \22% \
Petroleum /Product /
55% /
Figure 2.17 Share of final modern energy consumption by energy type in 2010
Source: Data from EPPO (2011)

28
Thousands KTOE100
90
— ■Commercial primary energy consumption
Commercial primary energy import (Net)
40 Commercial primary crude oil import
CDCOO)
oO)O)CM T f 05 O) CT) 05
00§
ooo so §oCD
s §ooo
Figure 2.18 Energy consumption, energy import (net) and crude oil import
Sources: Data from EPPO (2011)
In terms of air pollution emitted by the energy sector in Thailand, the amount
of air pollution from CO2 emissions has increased dramatically in every energy sector
over the past 20 years. The most emissions are from the power generation sector.
CO2 emissions in the power generation and industry sectors are mainly from
coal/lignite and natural gas while the emissions from petroleum products have
decreased. In contrast to the two first sectors, CO2 emissions in the transportation
and other sectors are mainly from petroleum products especially in transportation
that uses about two thirds of petroleum products in the economic sector. The
emission trend in the transportation sector increased constantly until declining in
1998 when the economic crisis hit the country. However, after 2000, trends in
emission were upward again (see Figure 2.19)
(2) Background of Thailand’s biodiesel development policy
In the last decade, the Royal Thai Government (RTG) has consistently
promoted efficiency in the country’s energy management as well as a reduction of
Thailand’s dependence on imported energy. The RTG has set biofuel, ethanol and
biodiesel, as priority alternative energy sources in its national plan. Measures
undertaken to achieve this goal include monitoring and regulating the pricing of
alternative energy, research and development support, and public awareness
campaigns (Preechajarn et al., 2007).

<JiOJ 29
£
.9£
o 12 ( j• #
Ih%i- \h \h \
:::t-%h \h \h \
d1 § s g I Ï § s
0)c0)O)
oCL
LU
o"i I I g g go ë
(DCO"cô20EEoo
-2 "Oo C0 00O ËE ao 3c Oo "Cü CD
o 0 0o -0 0CO 4—>co
4—#
oO
C0
■D
'o 00o
Q .CO
cg 0
c 0 Om 0 Cs^
h-d
ELU OCLCDC"30
O ) Û_ >LU OCvj OE ï3 3 BCD O oLL CO z

30
Thailand has a great potential for alternative energy, especially agricultural
crop based energy, and current government policy is to encourage the use of biofuel
energy. In Thailand, ethanol is produced from feedstock of sugar molasses and
tapioca products. Potential raw materials for biodiesel production are palm oil,
jatropha, used cooking oil and animal fat oil. However, biodiesel from palm oil has
been considered one of the most promising renewable resources for transportation
fuel in Thailand and its use has been enforced by the Ministry of Energy (MOE) as a
mandatory measure to substitute conventional diesel fuel (Papong et al., 2010)
Thailand has declared an Alternative Energy Development Plan (AEDP) for
2008-2022. This plan demonstrates the direction of alternative energy development
in the country. Several alternative energies such as solar, wind, biogas and biofuels
are included in the plan to obtain national energy security. Due to most alternative
energy sources being derived from agricultural products that are relevant to much of
the Thai population, the AEDP is integrated into strategies for supporting national
sustainable development. Benefits expected from the AEDP are not specific only to
energy security but also to other economic, social and environmental matters. Output
and outcome of the AEDP (2008 - 2022) are identified as shown below (DEDE,
2009):
“ (1) Economic aspect
Currency saving on energy import
Increase investment of private sector
Create dean and new Jobs.
Opportunity to earn from Carbon Credit trading.
Delay the construction of new fossil fuel power plant
Create Country's incomes by exporting biofueis, renewable energy
technologies (gasification, biogas fermentation system).
(2) Social aspect
• Migration mitigation due to Job creation in rural areas.
• Extra income to farmers.
• Improve quality of life for Thai people.

31
(3) Environmental aspect
• Low Carbon Society to mitigate the global warming. ”
The potential outputs and outcomes of the AEDP could enhance the
efficiency of the National Economic and Social Development Plan (NESDP) in many
ways. Considered as a national master plan, the 11th NESDP (2012-2016) has set
principles, visions, missions, objectives, targets and strategies as a guideline for
national development. The missions and strategies of the NESDP are shown below
(ONESDB, 2012)
“ Missions (p.9)
1. To promote better income distribution, and fair, harmony and
democratic society in order for people to achieve better quality of life
2. To create socio-economic security through strengthening production
of goods and services based on knowledge, creativity and
environmental friendliness, improving social protection for better coverage, and ensuring food and energy security
3. To strengthen resilience to changes and crises and develop human resources
Strategies (p.10-14)
1. Promoting the just society
2. Developing human resources to promote lifelong learning society
3. Balance of food and energy security
4. Stable economy based on knowledge and enabling factors
5. Linkages of economic and security in the regions
6. Sustainable management of natural resources and environment”
(3) Goals and mechanism for biodiesel promotion
The AEDP aims to increase the share of alternative energy in final energy
demand to 20.3% by 2022 (DEDE, 2007). The AEDP estimated biofuel production
potential of 7.20 million litre per day (ML/d) will comprise 3 ML/d of ethanol and 4.20

32
ML/d of biodiesel (B100^) (see Table 2.1). According to the plan, existing B100
production capacity must be increased from 1.56 ML/d to 3.0 ML/d, 3.64 ML/d and
4.50 ML/d in the periods 2008-2011, 2012-2016 and 2017-2022 respectively (Table
2 .1).
Table 2.1 Goals of the l 5-year of ADEP.
Potential
(ML/d)
Existing
(ML/d)
2008-2011 2012-2016 2017-2022
(ML/d) ktoe (ML/d) ktoe (ML/d) ktoe
Ethanol 3.00 1.24 3.0 805 6.20 1,685 9.00 2,447
Biodiesel (B100) 4.20 1.56 3.0 950 3.64 1,145 4.50 1,415
Total 7.20 2.80 6.0 1,755 9.84 2,831 13.50 3,862
Source: DEDE(2007), status April, 2010.
In order to accomplish the goal, the MOE was asked to cooperate with the
Ministry of Agriculture and Cooperatives (MAC) and the Ministry of Commerce to
establish a mechanism in order to ensure sufficient raw material supplies at
reasonable prices (Preechajarn, 2008). In 2005, Thailand began a campaign to
promote biodiesel production and consumption to ease its reliance on fossil fuels.
Initial production of biodiesel was insignificant until February 1, 2008, when the
Government adopted a 15-year policy, called the Biodiesel Development Plan for
2008-2022, requiring mandatory production of B2" biodiesel while B5^ biodiesel
production would be available for voluntary use in 2008. Moreover the plan indicates
that mandatory B5 production would have been set to begin in 2011 and BIO®
biodiesel (BIO) production would also be available for use on a voluntary basis
(Preechajarn and Prasertsri, 2011 ) (see Figure 2.20).
B100 refer 100% biodiesel, while blending biodiesel x% with petroleum diesel 100-x% is labeled Bxfor example 5% biodiesel blended with 95% petroleum diesel is labeled B5 and 2% biodiesel blended with 98% petroleum diesel is labelled B24
B2 refers to 2% biodiesel blended with 98% petroleum diesel
B5 refers to 5% biodiesel blended with 95% petroleum diesel
BIO refers to 10% biodiesel blended with 90% petroleum diesel

COCO
33
N-i
N-
XI
\ i
CMCM
CM
OCM
CO
fü Cos.o0
S VoT
1 - co
CDCinCD
CD
If)
CO
CM
I I
1 !lifo %=0> = a: $
o>o
§
liflla 6 CO
■g
■§
o
I I
o
1100 CL
JSCuo
■co
_a;aI?
■g
i f !
ÛdH
CMCMO
00ooCM
c_ r o
CL
"c0EQ .O
g0
■D■000
ygCOoCMCM
E3D )
LL
CDOO
LUQLUQ
S3O
(f)

34
In order to realize the targets, the RTG needed to raise palm oil production to
meet the demand, and the co-operation group from the MAC and the MOE, called
the “Committee on Biofuel Development and Promotion” (CBDP), planned to
encourage oil palm area expansion by 400,000 hectares in 5 years (from 2008-2012)
or by 80,000 hectares per year. The target area for oil palm promotion was
concentrated on abandoned areas and unproductive non-food areas. Moreover, the
government attempted to increase fresh palm productivity from 19 to 22 tons/hectare,
and to raise the crushing rate of crude palm oil from 17 to 18.5 % by 2012. In order to
accomplish the plan, participating oil palm farmers were provided with low-interest
loans by the government via the Bank for Agriculture and Agricultural Co-operative
(Preechajarn et al., 2008).
(4) Biodiesel development and oil palm land use expansion
In order to increase oil palm land, the target lands are identified carefully.
Basically, land chosen for expanding or substituting initial crops by oil palm must
avoid competition of land use for food cultivation. Therefore the promotion of land
use expansion focuses on abandoned land and non-food cultivation land especially
unproductive natural rubber areas (Chuanraktham, 2005). According to Figure 2.21,
it can be clearly seen that oil palm should not be promoted in the northeast, central
and northern regions because the large areas in these regions are used for paddy
cultivation. Promoting oil palm in the southern region seems to be more suitable than
other region not only because there is small size of paddy areas but also there are
large areas of rubber areas and some of them are unproductive.
Based on climatic and geographic conditions, promotion of oil palm land
expansion was initially intensive in the south of country. Figure 2.22 shows that just
below 90 % of oil palm land is in the south and about 10% is in the central region
whereas cultivation in the north and northeast are in the introduction stage.
Before implementing the CBDP plan to expand oil palm area in 2008, the
RGT had launched an oil palm industrial strategy in 2004. According to the strategy,
the cabinet proposed a plan to cultivate oil palm in abandoned paddy areas (a
common basin or plain which in the past was used for paddy cultivation but now is
not used. It is normally flooded in the rainy season and covered by weeds and
grasses in the dry season (LDD, 2012b)), and abandoned fields (an area previously

35
. a
mm#2- zl i t * :
:#
O Mm
DIDO II
.. ^ 'w . / T .# #
■S'P
03
203
E03Q .
Ô
0JDJD3
2•iZ> »■a"D03
CL
CM
oCM
COQ.
_ O
CO •“
T 3CCO
0JDX5213roc
8■ 3
"OTOroQ .
O
CMc\i230 3
CO01IT )
CM (O
O
& L
LU<O
S3OCO
2
0X

36
Thousands Ha.
700
600
Total500
' South400Central
300Northeast
200 North
100
Figure 2.22 Oil palm cultivation area in different regions of Thailand
Source: Unpublished data, GAE (2012a)
used to plant crops for several decades and now degraded that crop cultivation is not
feasible and covered by grass, weeds and small tree (LDD, 2012b)) and to substitute rubber
cultivated in unsuitable areas, with the targets 142,080 hectares, 24,960 hectares and
73,920 hectares respectively (Chuanraktham, 2005). After launching the strategy in 2004,
annual expansion of land use for oil palm production at the end of 2004 (55,777 hectares)
and 2005 (54,813 hectares) increased significantly if compared to the annual expansion of
earlier years. However, annual expansion decreased significantly at the end of 2006 (33,445
hectares) and 2007 (38,906 hectares).
With implementation of the CBDP plan to encourage oil palm area expansion, oil
palm land was increased significantly in 2008 by an annual expansion of 76,131 hectares,
just below the target. However, increasing palm area to meet demand for biodiesel
production has been challenging. Although expansion of oil palm area in 2008 approached
the annual target, the annual expansions of later years were well below target. The
expansions in 2009 and 2010 were 34,168 and 29,958 hectares respectively which were
less than half the targets for those years (see Figure 2.23).

37
Thousands Ha.
80 1
oooIT)OO
COOO
§oCDOO
OO
00
8O )o oo
o
■ North
■ Northeast
■ Central
■ South
Figure 2.23 Annual expansion of cultivation area of oil palm
Source: Unpublished data, OAE (2012a)
The attempt to expand palm cultivation area was limited by a scarcity of suitable land
for palm plantation and disadvantage in competition with rubber plantations which are more
economically attractive. As a result, the actual increase in oil palm cultivation areas was far
below the planned 80,000 hectares per year. In addition, palm yields are affected adversely
by irregular climate that tended to be more severe in the later years of the plan period
(Preechajarn and Prasertsri, 2011).
(5) The challenge of land expansion for oil palm cultivation
Although promotion of oil palm in rubber plantation areas has not generally been
successful, there has been a significant substitution of oil palm in natural rubber areas in
Surat Thani province^; the province having the largest area of both natural rubber and oil
palm in Thailand. Moreover, there has been success of oil palm promotion in abandoned
paddy areas and significant expansion also to arable paddy areas mostly in the South.
According to the biofuel development plan, the intended target is abandoned paddy
areas, not arable paddy areas. In 1998 the government launched a pilot project for a
Data from telephone Interviewing of an officer of Suratthani Oil Palm Research Center (27 Jan 2012) and a
committee member of association of oil palm farmers of Surat Thani province (31 Jan 2012).

38
feasibility study of oil palm planting in abandoned paddy fields in the Pak Phanang River
Basin® encompassing most areas of Nakhon Si Thamarat province in the south of Thailand.
After the study showed it was possible to cultivate oil palm in these areas, its growth was
promoted in other abandoned paddy areas (SOPRC, 2004).
However, there has been unintended expansion of oil palm into paddy rice areas. Oil
palm cultivation has substituted paddy rice significantly in arable areas. Figure 2.24 shows
the conversion of land use in this basin. In 2000, there was no significant appearance of oil
palm cultivated in the basin. However, oil palm planting area had increased dramatically by
2009. Most oil palm cultivation appeared in abandoned paddy areas. However, there have
been significant expansions of oil palm to substitute arable paddy fields.
Although the overall paddy rice cultivation area in Thailand is quite constant (Figure
2.25-a), the paddy rice area in the south has declined whereas natural rubber and oil palm
cultivation areas have expanded significantly. Figure 2.25-b. shows an approximately two
thirds decrease in paddy rice area in the south of Thailand; it was just below 600,000
hectares in 1998 but became 200,000 hectares in 2010. With the financial attractiveness of
natural rubber planting, some paddy rice areas were converted to the cultivation of natural
rubber. However some areas continue to be used for rice production and some are
abandoned because of limitation of landscape conditions for switching to planting rubber.
Pak Phanang River Basin was seen as the rice bowl of southern Thailand covering 307,561 hectares and encompassing most of Nakhon Si Thamarat province, and some parts of Phatthalung and Songkhia provinces.

39
Hi“ ' ,1
J h î l LI I I I I
J r .
Î
1
11 I I
il,III!I l l l I
i l l
O)ooCNJ_c0CO3■Ocro
ooo(N
003■Qcro
0
OooCNC
0E
00■a0it000Ü0
JZto
•o003
O!c
000
_c 000 000 O0 O)> ciz 0
ED)C o0c0 ax: 0CL ,—0 0CL 04 CN
oi0 O£S 01%
_C00
QQ_ i
3O)Ll
3 E cT3c o 00 4=
0— I 0 c0 0
0404
2
o
0Ü
■D
3 3 aCO O o
LL C/D z

40
8002
9002
2002
0002
(üX
o o o o
■DC
_ÇD
'cDHE03OCO
8002
9002
2002
0002
raX■DC%
| o
0661.
8861.o o o o o o o
■ 01.02
8002
2002
9661.
I I
C3O0
1 OCD
E3C/)■D
l 9661.
ECD
EECD
s z I—CÔco
CDZü
■oc_CD
'cD
CDQ .
"DCCD
0n2
23CDCCDO'C"O■00Q .
LOCNJCN
E3O)
004
O
LU<O
B0-o■00X:0
3D .C3
S3O
C/3

41
2.6 Background of the main crops considered in the thesis
As mentioned above, this study relates to three main crops including 1 ) paddy rice
and 2) rubber tree as the traditional crops, and 3) oil palm as the alternative crop. Some
general information about these crops is provided below.
1. Paddy rice
Paddy rice, Oryza sativa, is commonly known as Asian rice. The cultivated paddy
rice is an annual grass giving edible starchy cereal grain. The plant can reach a height of up
to 1.2 metres. The leaves are long and flattened. The fruit or grain is produced by spikelets
in the plant’s panicle. Generally paddy rice is grown on submerged land in various places
such as river basins and coastal plains in tropical, semitropical, and temperate regions. The
land beds are prepared before sowing the seed. Seedlings 25 to 50 days old are
transplanted to a field. During the growing season, the field are enclosed by levees and
submerged under 5 to 10 centimetres of water (see Figure 2.26)(Encyclopaedia Britannica,
2014b).
The harvested rice kernel is enclosed by a husk. The husk and bran layers of the
kernel are usually removed by milling. Rice which is milled to remove only the husk is called
brown rice while rice which has the bran removed as well is called white rice. In white rice
the nutrients are greatly diminished. There are several by-products of harvesting and milling
including bran and rice polish, broken rice, husks and straws. Bran and rice polish are for
livestock feed and oil production. Broken rice is for brewing and rice flour manufacturing.
Husks are used in the fertilizer and chemical industries and also for fuel and packing
material. Finally, the straw is used in various ways such as for livestock feed and livestock
bedding.

42
f.-'
m m # # *" :
Figure 2.26 Paddy rice field
Sources:Encyclopaedia Britannica (2014b)
2. Rubber tree
Rubber tree, Hevea brasiliensis, is a tropical tree giving latex widely used in
downstream industries. In the wild, the tree grows to about 30 metres in height. It has soft
wood and bark, high, branching limbs, and a large area of bark. The latex that oozes from
any incisions made by harvesters across the latex vessels in tree bark contains about 30
percent rubber (see Figure 2.27). The latex can be coagulated and processed into solid
industrial products like tyres and can also be concentrated for producing dipped goods like
surgical gloves (Encyclopaedia Britannica, 2014c).

43
Figure 2.27 Rubber tree and latex tapping
Sources: Encyclopaedia Britannica (2014c)
3. Oil palm
Oil palm, Elaeis guineensis, is an ornamental tree in many subtropical areas which is
primarily cultivated as a source of oil. Generally, mature oil palm can reach about 20-30
metres in height. The leaves are pinnate and reach between three to five metres in length. It
has many tiny flowers in dense clusters on short branches which develop into a large cluster
of oval fruits containing 500-2,000 fruits with an individual weight of 3-30 grams (see Figure
2.28) (Moll, 1987).
The oily and fleshy pericarp of the fruit is steamed and then pressed to recover the
palm oil. The kernels of the fruit which are also rich in oil are also pressed in mechanical
screw presses to recover palm-kernel oil. The latter oil is chemically quite different from the
oil from the pericarp flesh. Palm oil is used in various industries such as being a food
ingredient or being used in processing food, making soap candles, and lubricating greases,
and processing tinplate and coating iron plates (Encyclopaedia Britannica, 2014a).

44
Figure 2.28 Oil palm tree
Sources: Author’s survey
2.7 Processing of oil palm for biodiesel and co-products
Oil palm biodiesel production is relevant to three production systems including 1) oil
palm for feedstock provision, 2) palm oil milling and 3) palm biodiesel production as shown
in Figure 2.29. After harvested oil palm fresh fruit bunches (FFB) arrive at the mill, crude
palm oil (CPO) production can be run. This process consists of several steps including: (1)
loading of FFB into the mill; (2) FFB Sterilization; (3) bunch threshing to separate the fruit
from the bunches; (4) fruit digestion; (5) crude palm oil extraction to release fluid palm oil
from oil mash and separation of decanter cake; (6) nut/fibre separation; and (7) nut cracking
to produce palm kernel oil and palm kernel extract (Silalertruksa and Gheewala, 2012).
There are several co-products derived from palm oil milling. Palm oil from both
pericarp and kernel are the main products which are used in downstream industries. Other
products gained from this process are 1) empty fruit bunches used, for instance, for
dumping or mulching in plantations and/or as biomass fuel for in-house steam and power
generation, 2) palm oil mill effluent and wastewater used, for instance, for generating
biogas, 3) fibre used for steam and power production, 4) shell used for solid biomass fuel
and/or steam and power production, 5) decanter cake used for fertilizer production, and 6)
palm kernel extract used for livestock feed.

45
In order to produce biodiesel, the main process to convert CPO to biodiesel is called
transestérification. CPO is firstly filtered and pre-processed to remove water and
contaminants. Then a catalyst, such as sodium hydroxide (NaOH), is dissolved in methanol
and then mixed with pre-processed CPO. The outputs from the process include palm methyl
ester (biodiesel), glycerol and wastewater (Silalertruksa and Gheewala, 2012).
Solid biomass fuel
Steam and power production
Glycerol
Fertilizer
Dumping
Biogas
Palm kernel oil
Biodiesel (B100)
Palm kernel extract
Crude palm oil (CPO)
Palm oil milling
Palm biodiesel production
Oil palm plantation
Methanol, Sodium hydroxide.
Water
Decanter cake
Palm oil mill effluent
Empty fruit bunches
Kernel
Shell
Fibre
Figure 2.29 Palm biodiesel production system
Source: Adapted from Silalertruksa and Gheewala (2012)

46
2.8 Conclusions
According to the literature review, biofuel has been promoted dramatically in
Thailand to cope with the challenges of national development. As is usual in energy-
importing countries, energy security is considered to be the first priority of biofuel
development (ADB, 2009; Preechajarn and Prasertsri 2010; Kumar et al., 2013). Moreover,
as a member of international society, global climate change and food security are issues
that have to be considered. However, opportunity for economic development especially in
terms of poverty alleviation in the agricultural sector is a contribution that should not be
neglected.
Although there are plentiful agricultural areas for supporting the biofuel development
project, the biofuel development policy of Thailand is framed similarly to international
approaches that avoid promoting biofuel crops in arable food land but instead promote them
in abandoned agricultural areas and unproductive non-food areas. However, success of
directing biofuel crops to be grown on intended areas is challenged. Although there has
been success in directing oil palm to abandoned paddy areas, directing it to unproductive
non-food areas like natural rubber land has been unsuccessful, whereas there have been
seriously rapid expansions of biofuel crops to substitute food areas like paddy areas.
Implementing biofuel development policy in Thailand is thus being challenged.
Although the substitution of oil palm in paddy areas took place mostly in the south of
Thailand where the paddy area is less productive than in other regions, the success of
cultivation of oil palm in this area will show explicit evidence of production feasibility that
influences other farmers both in the same region and in other regions to switch their paddy
land to oil palm cultivation. The possibility that oil palm will expand to substitute paddy areas
can be supported by experience of geographic and climatic conditions. Geographically, the
success of the pilot project of cultivating oil palm in abandoned paddy areas has shown
evidence that oil palm can survive and give satisfactory product in this geographic condition.
Climatically, oil palm is more tolerant than paddy rice. Although paddy can be totally
destroyed by severe climatic variations, oil palm can survive throughout the same disasters
although output in the following period will temporarily decrease.

47
Due to these phenomena, land use management to maintain a balance of food and
energy security can be complex especially when oil palm replaces not only in abandoned
paddy areas but also arable paddy areas. On one hand, switching land use from arable
paddy land to oil palm might gain higher income and job creation for the rural sector as well
as enhanced energy security at national level, but on the other hand, the land use change
might cause worry about food security. Although there is clear evidence that shows dramatic
substitution of oil palm to paddy areas in the last decade and strong conditions that can
motivate farmers to switch their arable paddy land to oil palm cultivation in the future, there
is lack of understanding of the dynamics of these phenomena.
This research is an attempt to increase comprehension of sustainability of land use
change incentivised by biofuel development policy. As described in the background of case
study, this research will primarily focus on the motivations as to why implementing policy in
unproductive natural rubber areas (intended areas) is only partially successful and why it is
successful in arable paddy areas which are unintended areas and risk causing conflict
between food and fuel.
In order to accomplish the research aims, exploring the stakeholder perspectives and
relevant impacts of land use based on contexts of Thailand should provide a variety of
valuable information about dynamics of land use. A better understanding of the dynamics
should be obtained by the combination of results which are able to describe the success of
land use change and diagnose its failure. In addition, suggestions for enhancing the
sustainability of biofuel development policy based on the experiences of a food exporting
and developing country like Thailand will also be proposed.

48
CHAPTERS
RESEARCH METHODOLOGY
3.1 Introduction
The overall research design and justification for the research methods chosen are
presented in this chapter. Firstly the research objectives and questions are stated.
Secondly, the philosophical and methodological aspects are presented including research
paradigms, research approaches and the methods of data collection and analysis. Finally,
the research design is discussed.
3.2 Research objectives and questions
The aim of this research is to explore the dynamics of agricultural land use in
Thailand. This study is concerned with analyzing the conflict between land use for paddy
and oil palm derived from launching a biofuel development project in the context of Thailand.
As mentioned in the introduction, this thesis comprises three independent studies covering
the areas of 1) factors influencing land use change, 2) impacts of land use switching, and 3)
analysis of policy implementation and loss of paddy areas. In order to comprehend the
dynamics and sustainability of land use, three specific objectives were set according to the
three areas of study. The objectives are as follows:
1) To explore factors influencing land use change
This objective is achieved by pursuing three research questions:
Q1. How are farmers’ livelihoods currently constructed?
02. What are the important aspects of livelihood at present?
03. What are the drivers influencing the willingness of farmers to switch land use
from traditional to biofuel crops?

49
2) To assess the impacts of land use change derived from the biofuel development
policy
This objective is achieved by pursuing three research questions:
04. What are the current systems (production, processing, marketing, etc) of
each alternative land use?
05. Who are the stakeholders in these systems?
06. What are the impacts of land use change on the stakeholders?
3) To assess the effectiveness of policy implementation in land use change
This objective is achieved by pursuing four research questions:
07. What is the current situation in terms of the unintended consequence of
paddy rice being substituted by oil palm?
08. Did the policy makers know about this unintended consequence?
09. How did policy makers try to adapt to this unintended consequences?
010. In the event that they knew but did not adapt, what caused the inertia?
In order to obtain answers, the specific questions in each research objective were
used to help develop the research design.
For objective 1, questions 01 and 02 were to explore the factors influencing land
use decision via the implications of HHs' behaviour in adopting various land use strategies
for dealing with the circumstances that they faced. 03 was aimed at pointing out the exact
factors determining whether the HHs decide to switch their land to cultivate oil palm. As
mentioned in the chapter describing the context of Thailand, this research intended to
explore factors influencing the decision of HHs in three traditional areas: paddy areas,
rubber areas and abandoned areas. Thus, this study attempts to find out what are the exact
factors influencing HHs’ decisions about whether to switch their land from traditional uses to

50
oil palm. With this intention, the potential factors were interpreted from the implications of
HHs’ behaviour in adopting various land use strategies, and then six sets of these exact
factors were identified according to six subcategories of land use strategy consisting of: 1)
continuing paddy cultivation; 2) switching from paddy to oil palm cultivation; 3) continuing
rubber cultivation; 4) switching from rubber to oil palm cultivation; 5) continuing leaving land
abandoned and 6) switching abandoned area to oil palm cultivation.
For objective 2, questions Q4 to 06 were to identify the comparable contributions of
paddy, rubber and oil palm which were of interest to the HHs and the government as
information in the decision to adopt or support oil palm cultivation. In order to explore more
specific impacts, questions 04 and 05 were intended to identify where the impact occurs
and who is affected by switching traditional crops like paddy and rubber to an alternative
crop like oil palm.
In terms of objective 3, 07 to 09 were to investigate insight perspectives regarding
whether the policy makers are concerned about the substitution of oil palm in paddy areas
and how the policy makers deal with this unintended consequence. Finally, 010 was
introduced to explore the causes of inertia in the event that the policy makers knew about
the substitutions but did not adapt.
The findings from 01 to 010 were used in integration with each other to advance
understanding of the dynamics of land use which is important information in comprehending
the sustainability of alternative land use in the context of the conflict between land use for
food and fuel.
3.3 Research paradigms
3.3.1 Positivism, constructivism and pragmatism
A discussion of research paradigms (also called by different names such as research
worldview, research philosophy and research methodologies) is necessary in order to
ensure that the research design and methods are consistent with the research questions
(Blaikie, 2009). The basic beliefs and pertinent methodology of three main classic
paradigms relating to this research are discussed. The relevant paradigms consist of the
positivism paradigm (other terms used are objectivist or quantitative), the constructivism

51
paradigm (other terms used are the interpretive or qualitative) and the pragmatism
paradigm, which refers to mixed-methods (Corbetta, 2003; Clark and Creswell, 2008;
Denzin and Lincoln, 2011).
Positivism and constructivism are two predominating philosophical positions which
offer polarized ways of tackling a phenomenon. While the positivist approach implies that
the world is independent of the researcher and the researchers have to observe the object
in a neutral way (Patton, 2002; Ritchie and Lewis, 2003; Porta and Keating, 2008; Saunders
and Lewis, 2012), the constructivist approach suggests that researchers are integrated in
the world in which they live and work, and researchers are able to use both the participant’s
and the researcher’s understanding (or interpretation) to explain a phenomenon (Grotty,
1998; Ritchie and Lewis, 2003; Gilbert, 2008).
Based on these beliefs, the way that data is collected and analysed is extremely
different for the two opposing approaches. On one hand, positivist researchers take what
they see as a realist stance towards data which is objective and measurable by an index of
what actually exists (Gilbert, 2008). Positivism tends to produce numerical data which are
analysed by using a range of statistical techniques. In addition, large samples are used so
as to present essential features of a reality, and generalise these features from a sample to
a population (Collis and Hussey, 2003).
On the other hand, constructivist or interpretivist researchers argue that social
realities are a composition constructed socially and differently by the individuals who
participate in them (Hughes and Sharrock, 1997). Constructivism assumes that reality is
subjective and dependent on the individual’s mind. Thus, interpretations are adopted by the
researcher in looking for complexity of individuals’ views rather than focusing on narrowing
meaning into a few categories or ideas (Gilbert, 2008; Creswell, 2009) In this approach,
researchers use small samples and evaluate their views in detail to gain understanding of
the views of many people (Kasi, 2009).
Lastly, the pragmatism paradigm is suggested as an alternative point of view for
interpreting the world when undertaking research by a single paradigm cannot give the
entire picture of reality. Pragmatism is not committed to any one system of philosophy and
reality but is flexible, with the researcher focusing on the research problem and choosing an

52
appropriate method to understand the problems (Johnson and Onwuegbuzie, 2004;
Creswell, 2009; Saunders and Lewis, 2012). In this way, the best or appropriate methods,
techniques and procedures of research can be freely chosen by researchers in order to
meet their needs and purposes as discussed above (Creswell, 2009; Tashakkori and
Teddlie, 2010).
3.3.2 Justification for the research paradigms
As this research aims to investigate (1) factors influencing land use decision, (2)
impacts of land use switching along the supply chain both upstream and downstream of
crop cultivation, and (3) perspectives of policy makers in dealing with loss of paddy areas,
the researcher believes that some objectives can be quantitatively measured and the
analysis results can be generalised from a sample to a population. However, for some
objectives, quantitative results cannot or are not enough to provide meaningful insights
when looking at the complexity of individual or institutional views. As stated by Crossan
(2003), the exploration and examination of human behaviours such as feelings, perceptions
and attitudes are beyond the scope of positivism. Thus it is necessary for the researcher to
interact with the research environment to comprehend the extant phenomena. In view of
this, pragmatist view was adopted for this research to allow the researcher to be flexible in
choosing the appropriate philosophy, strategy and method needed to address the different
research questions.
For objective 1, investigating factors influencing land use decisions, both
philosophical views of positivism and interpretivism were considered suitable. For the
research objective to explore the factors influencing land use decision via the implications of
HHs’ behaviour, an interpretivist view was necessary for a survey to comprehend their
decision mechanism as this is subjective rather than measurable. In addition, this objective
also intended to find out the exact factors influencing land use change. For this, the positivist
view was considered beneficial, using a quantitative approach with statistical techniques to
get a clearer view of hypothesis testing.
In respect of objective 2, investigating impacts of land use switching along the supply
chain both upstream and downstream of crop cultivation, the positivism paradigm was
considered suitable. There is a set of raw numerical data collected by the government linked

53
to the supply chain of the crops examined by this research. Therefore exploring where the
impact occurs and who is affected by switching traditional crops like paddy and rubber to an
alternative crop like oil palm, can be done by drawing conclusions from this existing
numerical data without need for the researcher to interact with the research environment.
In case of objective 3, investigating perspectives of policy makers in dealing with loss
of paddy areas, the interpretivism paradigm was considered suitable. Due to the actual
perspectives behind the policy makers’ decisions being subjective rather than measurable,
the qualitative approach was considered to be appropriate for revealing their feelings,
perceptions and attitudes which is beyond the scope of positivism.
3.4 Research approaches and analysis method
3.4.1 Quantitative and qualitative approach
The research approaches can be classified into two categories according to how
data is collected and analysed. These categories are the quantitative approach and the
qualitative approach. The quantitative approach concentrates on numerical measurement
which is based on an objective view of phenomena (Collis and Hussey, 2003; Creswell,
2009). Qualitative research, on the contrary, is more subjective. It aims at examining and
reflecting perceptions to get an in-depth understanding of phenomena (Collis and Hussey,
2003). Based on this, it seems that the quantitative approach is often associated with
positivism, whereas the qualitative approach is associated with interpretivism (Neuman,
2011).
Due to the fact that each method has its limitations, one approach is often mixed with
another in a complex situation where a broader and complementary view of the issue is
concerned. Based on this, it seems that the mixed method is often associated with the
pragmatism paradigm. The mixed method can be used in three strategic ways: concurrent,
sequential, and transformative mixed methods (Creswell, 2009). While the concurrent mixed
method conducts quantitative and qualitative methods independently at the same time to
answer a single research question, the sequential mixed method uses one method to
expand on the findings of the other. In the transformative mixed method, data from different

54
methods are integrated and transformed when the analysis and interpretation are
processed.
Triangulation, which involves using different approaches, methods and techniques in
the same study, can be used in order to gain greater validity and reliability of findings, (Collis
and Hussey, 2003). Bryman and Bell (2011) proposed that using triangulation in research
can improve confidence in results, cross-check two sets of findings from different methods,
seek convergence of findings and counterbalance between weaknesses and strengths of
various methods. Indeed, triangulation can be adopted at different levels and to address
different aspects of the research process. For example, as mentioned above, both
quantitative and qualitative approaches can be adopted in the same study (methodological
triangulation) and/or data can be collected at different times or from different sources (data
triangulation), to cross-check the findings from different methods or sources of data
(Easterby-Smith et al., 2002).
3.4.2 Justification for the research approaches
Based on different research paradigms according to the research objectives (section
3.3.2), the quantitative and qualitative approaches were introduced independently as
individual methods and sequentially as a mixed method to answer the research questions.
For objective 1, as the pragmatism paradigm was adopted as the research paradigm,
the mixed method was introduced to answer the research questions. The mixed method has
been widely applied in the field of land use and LUC (Cheong et al., 2012). Some examples
are field interviews being adopted to better understand land-cover change seen in satellite
imagery (Lambin and Meyfroidt, 2010), and quantitative HH and community surveys
together with qualitative ethnographic methods being applied to comprehend HHs migration,
deforestation and shift of agricultural frontiers (Carr, 2008) and so on.
In order to investigate factors influencing land use decision, the research was divided
into two sequential studies. Firstly, a qualitative approach was employed to gain an in-depth
understanding of land use behaviour of HHs and the meaning of that behaviour as the
drivers of land use change. Sequentially, a quantitative approach was used to verify
potential factors derived from the first stage. The advantage of this quantitative approach is

55
that a large amount of numerical data could be statistically analysed to reveal and verify
connections between the potential factors and land use decision.
In respect of objective 2, given the fact that pragmatism was adopted as the research
paradigm, a quantitative approach was introduced to answer the research questions. This
quantitative approach was used to provide a variety of descriptive statistics identifying where
the impacts occur and who is affected by switching traditional crops to oil palm.
In the case of objective 3, interpretivism was considered suitable as the research
paradigm, and a qualitative approach was hence introduced to answer the research
questions. Based on exploring perceptions and attitudes of policy makers, this approach
could provide an in-depth understanding of the current losses of paddy areas and a detailed
description of that loss.
In addition, data triangulation was adopted for obtaining greater validity and reliability
of findings. In the qualitative approach of the mixed method of objective 1, numerical
characteristics of HHs were gathered to triangulate the qualitative findings. Moreover,
secondary data reviews were conducted concurrently with the qualitative approach as an
alternative data source to cross-check and support the qualitative findings especially where
respondents were not willing to reveal their point of view.
3.5 Data collection
3.5.1 Primary and secondary data
In the process of data collection, the information on variables of interest are gathered
and measured in an established systematic fashion as the material for the researcher to
answer stated research questions, test hypotheses and evaluate outcomes. The data can
be collected from various sources generally classified into two major categories: primary
data and secondary data. “The primary data are those, which are collected afresh and for first time and thus happen to be original in character. The secondary data, on the other hand, are those which have been collected by someone else and which have already been passed through statistical process” {Kothah, 2004).

56
Primary data can be collected using several methods which can generally be divided
into two categories: experiments and surveys. Experiments are methods for collecting data
from controlled groups under a controlled environment which is commonly suitable for
scientific studies. A survey is most commonly adopted in social sciences. It can be
conducted by different methods including questionnaires, interviews and observation. Firstly,
the questionnaire is the most commonly used survey method. A series of either open-ended
or closed-ended questions are used for the purpose of gathering information from
respondents. Secondly, an interview is a conversation in which questions are asked by the
interviewer to elicit in-depth facts or statements from the interviewee. In the interview
process, what the interviewer can gain is not only the facts or statements that the
interviewee says, but also the body language, expressions and other reactions which enable
the interviewer to draw conclusions easily. Finally, observation involves collection of data
about what is done as seen by the observing person in a natural setting or in an artificially
created environment.
Secondary data is used in situations where getting information from primary data
sources is difficult but where getting information from secondary sources is easier and
possible. In some cases, the research might be confined to secondary data because primary
data does not exist and/or primary data is present but the respondents are not willing to
reveal it. Secondary data can commonly be collected from various sources broadly classified
into two categories: published and unpublished sources. In terms of published sources,
there are a variety of sources, both printed and electronic, including books, journals,
periodicals, magazines, newspapers, general websites and weblogs. In respect of
unpublished sources, data can be collected from unpublished personal records (such as
diaries and letters), government records (such as census data, population statistics and
other statistics) and private sector records (such as NGO's survey data and other private
company records).
However, it is often risky to use secondary data because they may lack suitability or
adequacy in the context of the problem which the researcher wants to study (Kothari, 2004).
Thus, before using it, already available data should be considered to have the following
characteristics: (1) Reliability: by checking reliability of data collectors, sources of data,
collection methods and the time the data was collected, bias of the compiler, level of
accuracy that was desired and achieved in the data collection, (2) Suitability: by scrutinising

57
whether the definitions of terms and units of secondary data are similar to or consistent with
the object, scope and nature of the present enquiry, and (3) Adequacy: by confirming that
secondary data are neither narrower nor wider in scope than the area of the enquiry for
which are to be used (Kothari, 2004).
3.5.2 Justification for the research data collection
Given that a wide range of research paradigms and research approaches was
adopted in this research (section 3.3.2 and 3.4.2), both primary data and secondary data
were used to answer the research questions.
Primary data is used to accomplish the research objectives 1 and 3. In-depth
interviews were conducted to elicit facts and statements from interviewees. Interview is
considered an appropriate method for collecting data about, for instance, opinions,
experiences, sensitive issues or privileged information (Denscombe, 2010). Open-ended
questions allowed the HHs and policymakers to express their perspectives, opinions,
experiences and practices regarding land use decision and losses of paddy areas
respectively. In addition, a questionnaire survey was adopted to gather quantitative data
from farmers’ HHs. Two questionnaire surveys were used with two groups of HH
respondents. The first questionnaire survey was conducted with a large sample in order to
explore factors influencing land use decision using quantitative analysis. The second
questionnaire survey was conducted with farmers’ HHs to gain more standardised numerical
data to enable description and comparison of their HHs’ characteristics using qualitative
analysis.
Secondary data were mainly used to answer the questions relating to research
objective 2. The input-output tables of paddy, rubber and oil palm production and their
relevant forward linkage industries were used to investigate where the impact occurs and
who is affected by switching paddy and rubber to oil palm. Analysis of these data was able
to reveal the overall impacts of land use switching because the tables consist of the flow of
goods and services in the economy and the components of gross value added, industry
inputs and outputs, product supply and demand, and the details that can link the relationship
between producers, consumers, and marketing facilitators in each sector of the economy.
These data were considered suitable in the context of the problem which the researcher

58
wants to study. The reliability of data was strengthen by the fact that the data were collected
and processed under supervision of a government organisation and also because the
details of collecting methods and time that data was collected were provided. In terms of
suitability of data, as mentioned above, terms and units of secondary data are consistent
with the object and scope being studied in this research. In respect of adequacy, the scope
of the data which were collected at national level is similar to the scope of this study which is
intended to investigate the impact of land use switching at the national level.
In addition, other secondary data were also used to support and/or cross-check
qualitative analysis. These secondary data are derived from published and unpublished
sources which were provided by the government organisation. They include the vulnerability
contexts (including trends, shocks and seasonality), and the institutional and political
environment which influence HHs’ land use decision. In addition, data concerning some
issues relevant to policy implementation and evaluation, that the respondents were not
comfortable to reveal in the in-depth interviews, could also be collected from published
journals or relevant documents.
3.5.3 Sample selection
As investigation of a particular matter among the entire population is considered to
be very expensive and time consuming, research tends to determine a reduced number of
respondents from the total number of the target population to represent the population under
investigation (Denscombe, 2010). Therefore, justification of sample selection is necessary in
cases where the researcher is unable to gather data from the entire population. Sampling
methods can be divided into two main types: probability and non-probability sampling. In
probability sampling, individuals are selected at random from the population and every
individual element has a known non-zero probability of being selected for the sample (Arber,
2001). However, sometimes probability sampling might not be appropriate to a study with a
specific purpose or in a particular subject. In this situation, non-probability sampling, which is
based on the subject of study, is considered to be a more suitable alternative sampling
technique (Saunders et al., 2009).
In non-probability sampling, there are several forms of sampling which can be
applied to select the sample purposively, efficiently, and economically (Churchill and

59
lacobucci, 2005). Non-probability sampling can be divided into two broad types; accidental
and purposive (Trochim, 2005). Accidental or convenience sampling is a method in which
subjects are selected based on convenient access to the sampling population (Kumar,
2011). This method is based on the assumption that the target population is homogeneous.
Each individual is similar in characteristics to the whole population (Hair et al., 2006).
Purposive or judgemental sampling is used according to the researcher’s judgement as to
who can provide the best information to achieve the research objectives (Kumar, 2011). This
type of sampling is used for choosing some cases of a particular type appropriately to what
the research is interested in (Blaikie, 2009). Purposive sampling is useful to comprehend a
phenomenon or develop knowledge about something about which little is known (Kumar,
2011). Moreover, other methods, which can be considered as subcategories of purposive
sampling, can also be employed to ensure that selected samples are sufficiently
representative of the population in the study. For example, quota sampling might be applied
to more specific groups or types of people. Snowball sampling might also be used to
diversify the sample or specify respondents who are hard to access (Trochim, 2005).
For the sampling process, Churchill and lacobucci (2005) suggested six stages
consisting of 1) defining the population, 2) identifying the sample frame, 3) selecting the
sampling technique, 4) determining the sample size, 5) choosing the elements to be
included and 6) collecting the data from the designated elements.
(1) Defining the population
The sources of data used for answering the research questions for this research
involved two groups of populations: farmer HHs and policy makers. The scope of the
population of farmer HHs was specific to the HHs who occupied abandoned and/or paddy
and/or rubber lands and/or the HHs who had switched those lands for oil palm cultivation. In
terms of policy makers, the scope of this population was specific to the policy makers who
were involved with biofuel development.
(2) Identifying the sample frame
For the sample frame, a list frame of policy makers was set to the members of
committees of the Thailand Oil Palm Board (TOPB). In the case of the sample frame of the

60
HHs, because a list frame of the total members of the HHs was not available, an area frame
was set instead. The area frame was set to HHs in the Chianyai and Chalermprakiet districts
of Nakhon Si Thammarat province and the Ranote and Sathingpra districts of Songkhia
province, where land was traditionally used for paddy cultivation but some, at the time of the
study, had been left abandoned and/or switched to oil palm cultivation, and HHs in the
Prasaeng and Bannaderm districts of Surat Thani province where most land was used for
rubber cultivation and/or left abandoned but some, at the time of the study, had been
switched to oil palm cultivation. The location of the study area is shown in Figure 3.1.
Chaloem Phra Kiat
,Chian Yai
iRanot
lathingPhra
^ r a t Thani
i X i ^akhon Si Thammarat
s ^ o n g k h la
Figure 3.1 Location of the study area
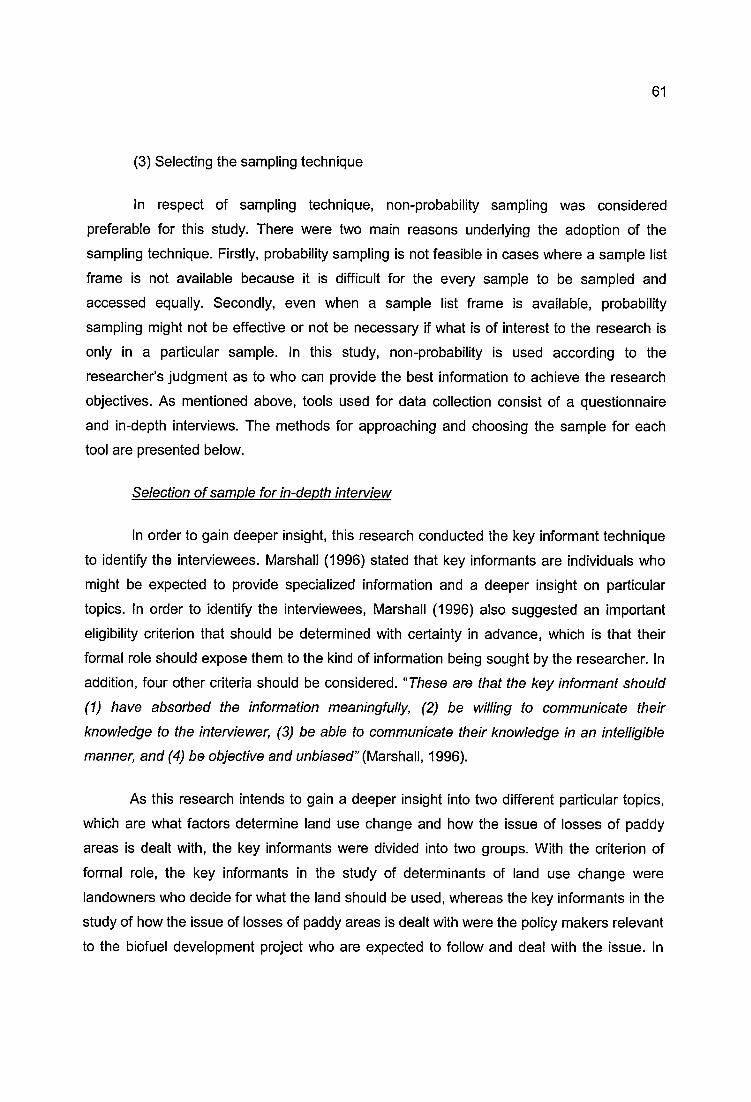
61
(3) Selecting the sampling technique
In respect of sampling technique, non-probability sampling was considered
preferable for this study. There were two main reasons underlying the adoption of the
sampling technique. Firstly, probability sampling is not feasible in cases where a sample list
frame is not available because it is difficult for the every sample to be sampled and
accessed equally. Secondly, even when a sample list frame is available, probability
sampling might not be effective or not be necessary if what is of interest to the research is
only in a particular sample. In this study, non-probability is used according to the
researcher’s judgment as to who can provide the best information to achieve the research
objectives. As mentioned above, tools used for data collection consist of a questionnaire
and in-depth interviews. The methods for approaching and choosing the sample for each
tool are presented below.
Selection of sample for in-depth interview
In order to gain deeper insight, this research conducted the key informant technique
to identify the interviewees. Marshall (1996) stated that key informants are individuals who
might be expected to provide specialized information and a deeper insight on particular
topics. In order to identify the interviewees, Marshall (1996) also suggested an important
eligibility criterion that should be determined with certainty in advance, which is that their
formal role should expose them to the kind of information being sought by the researcher. In
addition, four other criteria should be considered. “These are that the key informant should (1) have absorbed the Information meaningfully, (2) be willing to communicate their knowledge to the interviewer, (3) be abie to communicate their knowledge in an intelligible manner, and (4) be objective and unbiased” {MarshaW, 1996).
As this research intends to gain a deeper insight into two different particular topics,
which are what factors determine land use change and how the issue of losses of paddy
areas is dealt with, the key informants were divided into two groups. With the criterion of
formal role, the key informants in the study of determinants of land use change were
landowners who decide for what the land should be used, whereas the key informants in the
study of how the issue of losses of paddy areas is dealt with were the policy makers relevant
to the biofuel development project who are expected to follow and deal with the issue. In

62
order to obtain these key informants, purposive sampling along with snowball sampling was
adopted.
In the case of the landowners, participants were selected by using inclusion criteria,
which were specific for each group of six subcategories of land use strategies, consisting of:
1) continuing paddy cultivation; 2) switching from paddy to oil palm cultivation; 3) continuing
rubber cultivation; 4) switching from rubber to oil palm cultivation; 5) continuing to leave land
abandoned; and 6) switching abandoned area to oil palm cultivation. A summary of the key
respondent profile is shown in Table 3.1. In terms of the policy makers, participants were
selected on the basis of one participant from each of the organisations that play an
important role in biofuel development. Three participants from three professional areas were
interviewed in this study. The professional areas were agricultural economics, energy policy,
and alternative energy.
Table 3.1 Summary of the key respondent profile in the study of determinants of land use
change
interviewees
Category of land use strategiesAbandoned land based Paddy land based Rubber land based
Continueabandon
Switch to oil palm
Switch to rubber
Switch to other crop
Continuepaddy
Switch to oil palm
Switch to livestock
Continuerubber
Switch to oil palm
1 / / / /2 / / / /3 / / /4 /5 /6 / /7 / / /8 / / /9 / /10 / /
Selection of sample for the questionnaire survey
In order to investigate factors influencing land use change, data for statistical
analysis were derived from the purposive groups of farmers including farmers who still
cultivated paddy, natural rubber and/or left land abandoned, as well as farmers who
changed their paddy land, natural rubber and/or abandoned land to cultivate oil palm. In
order to obtain these samples, firstly, agriculture offices of the districts in the sample frame
were approached and asked to suggest the community head of sub-district where HHs

63
consistent with the sample frame were available. For the questionnaire survey, accidental or
convenience sampling was conducted. Farmers were interviewed at random at the main
centres of each community. The selection of farmers interviewed at each centre was based
on their availability and willingness to respond to the questionnaire. A total of 180 farmers
were interviewed for the field survey.
3.5.4 Sample size
Sample size determination is an important issue in empirical study because it is a
factor affecting the statistical power in making inferences about a population from a sample.
With regard to using quantitative analysis of differences in HH characteristics between oil
palm growers and non-growers and differences between priority weights of each factor in
each category of land use strategy, the sample size should be pre-determined in order to
achieve a desired level of statistical power. However there is no consensus on the minimum
sample size for analysis. Normally, determining the sample size depends on the balancing
of several important criteria: “(1) achieving research objectives, (2) providing accurate estimates of sampling variability, (3) being feasibiiity and (4) maximizing economy (i.e., achieving research objectives for the minimum cosfj” (Dattalo, 2008). However, for a sample
size based on the result of simulation studies involving the central limit theorem, it is
suggested that the sampling distribution will always be normal if the sample size is 30 or
greater (Schumacker, 2014). This sample size is widely used in parametric tests in which
the assumption of normal distribution of the population is required.
However, in this research, the assumption of the normal distribution of the population
is violated because the researcher does not know the shape of the underlying distribution of
the population. In this situation, alternative techniques available for analysing non-normally
distributed data known as non-parametric statistical tests were adopted instead. One
advantage of non-parametric statistical tests is that they can be used appropriately when the
sample size is small. Based on this advantage, the sample size expected for non-parametric
statistical tests can be less than those of parametric statistical tests. Thus, a sample size of
less than 30 can be acceptable for each non-parametric statistical test in this study.
However, even though non-parametric methods are most appropriate when the sample
sizes are small, too small a sample size might result in tests not being meaningful (Hill and
Lewicki, 2007). In order to have a sample size big enough for various analyses of

64
differences in priority weights of factors influencing land use change both between each
factor in each category of land use strategy and between areas with different predominant
use, this study pre-determined the sample size at 60 HHs in each predominant land uses or
30 HHs in each districts. By doing so, the researcher was allowed to divide the sample in
each district into subgroups for analysis of the difference between them without limitation of
subsample size.
Quota sampling was conducted to gain the sample size in each land use strategy.
According to the area frame comprising six districts in three provinces, it was intended to
collect 30 respondents from each district. It was planned to collect respondents continuing
paddy cultivation and/or switching from paddy to oil palm cultivation in the predominantly
paddy areas including the Chianyai districts of Nakhon Si Thammarat province and the
Ranote districts of Songkhia province. It was planned to collect respondents continuing
rubber cultivation and/or switching from rubber to oil palm cultivation in the predominantly
rubber areas including Prasaeng and Bannaderm districts of Surat Thani province, and
respondents continuing to leave land abandoned and/or switching abandoned area to oil
palm cultivation from the predominantly abandoned areas including Chalermprakiet districts
of Nakhon Si Thammarat province and Sathingpra districts of Songkhia province.
However, the results from the field survey found that most respondents have
adopted more than one land use strategy. Therefore the totals of HHs in most land use
strategy categories were more than the pre-determined sample size (see details in Table
3.2). However, in the case of switching rubber to oil palm, the sample size was 18 HHs
which is less than the pre-determined sample size. This is because it was found that most
land recently under oil palm cultivation was switched from abandoned areas. Even though
the sample size was less than the pre-determined sample size, it is acceptable in this study
because is the data are analysed with non-parametric statistical tests which is considered
appropriate when the sample size is small.

65
Table 3.2 Summary of sample size of questionnaire respondents
study areas/ Districts
Samplesize
Category of land use strategies
Continuingpaddy
cultivation
Switching paddy to oil palm
cultivation
Continuingrubber
cultivation
Switching rubber to oil
palm cultivation
Continuingleaving
landabandon
Switching abandon area
to oil palm cultivation
Predominantly paddy area
Chianyai 30 21 18 - - 3 9Ranote 30 26 15 - - - -
Predominantly rubber area
Prasaeng 30 - - 29 12 - 15Bannaderm 30 - - 29 6 - 14
Predominantly abandon area
Chalermprakiet 30 1 8 - 4 22Sathingpra 30 19 1 - - 30 2
Total 180 67 42 58 18 37 62
3.6 Research design
3.6.1 Conceptual framework
In order to set a logical structure and delimit the scope of the study, a conceptual
framework is required for the research design. Basically, a conceptual framework is based
on previous studies and theories that exist in the literature (Collis and Hussey, 2003). In this
research, a conceptual framework was required in the subject area of factors influencing
land use change to provide a logical structure and delimit the scope of factors influencing
land use change.
In the subject of land use dynamics, land use changes are typically attributed to
broadly defined aggregate driving forces. Several theories have been developed to explain
land use patterns and land-cover changes either directly and explicitly or indirectly and
implicitly (Briassoulis, 2000). Based on criteria the traditional theories, factors influencing
land use change are roughly classified into three main categories: urban and regional
economic factors, sociological and political economy factors, and nature-society or human-
nature factors (Briassoulis, 2000).

66
A few conceptual frameworks have been developed to explain the dynamics of land
use. In traditional conceptual framework for ecosystem studies (Figure 3.2, below), land use
change was seen as a result of human activity and ecological drivers (such as geologic
setting, climate and its variation, patterns of primary productivity, hydrologie processes, and
other biogeophysical factors) (Redman et al., 2004). Another conceptual framework is for
long-term investigations of social-ecological systems (Figure 3.3, below) which was adapted
by incorporating a range of missing feedback mechanisms in the traditional framework to
enhance understanding of the overall dynamics of social-ecological systems. Based on this
integrated framework, land use change is a result of interaction of the interface of the
system's social and ecological components which is strongly interdependent with social and
ecological patterns and processes. The ecological patterns and processes include primary
production, populations, organic matter, nutrients and disturbances. The proposed social
patterns and processes include demography, technological change, economic growth,
political and social institution, culture and information. In addition, social and ecological
patterns and processes are also determined by external political and economic conditions
and external biogeophysical conditions (Redman et al., 2004).
Recently, empirical studies generally attribute the causes of land use change to five
major driving forces: socioeconomic, political, cultural, technological and natural forces
(such as Lambin et al., 2001; Bürgi and Turner, 2002; Lambin et al., 2003; Bürgi et al., 2004;
Schneeberger et al., 2007; Hersperger and Bürgi, 2009; Bosselmann, 2012). In respect of
determinants of adopting and/or switching tree cultivation, these driving forces are common
components of the conceptual framework. However, the numbers of types of driving forces
and the variables in the framework varied and were adapted to be consistent with the
contexts of the studies. Moreover, HH characteristics were also introduced as additional
factors in the framework for studying land use decision at HH level (such as Pichon, 1996;
Shively, 1999; Rosenqvist et al., 2000; Caviglia-Harris, 2005; Pan and Bilsborrow, 2005;
Roy Chowdhury, 2006; Pacheco, 2009; Roy Chowdhury, 2010).

67
Human ActivitiesEcosystem
Dynamics
Biogeophysical
Drivers
Figure 3.2 Traditional conceptual framework for ecosystem studies
Source: Adapted from Redman et al. (2004)
HumanComponents
EcologicalComponent:
External Political and Economic Conditions
External Biogeophysical Conditions
• Land use
• Land cover
• Production
• Consumption
• Disposal
Interactions
Social
• Demography
• Technology
• Economy
• Institution
• Culture
• Information
Patterns andProcesses
• Primary
production
• Populations
• Organic matter
• Nutrients
• Disturbance
Ecological Patterns andProcesses
Figure 3.3 Conceptual framework for long-term investigations of social-ecological systems.
Source: Redman et al. (2004)

68
The above literatures provided a list of reasonable variables for constructing
conceptual frameworks to gain a better understanding of the dynamics of land use in various
sites and situations. Even though these variables could be adopted as a guideline for
constructing the framework of this study, the intention of this study demanded a systematic
framework which is able to explain the HHs’ behaviour in deciding whether or not to cultivate
the tree in question, oil palm. The conceptual framework considered to be most suitable for
the intention of this research is the sustainable livelihood (SL) framework as shown in Figure
3.4, below.
Basically, the SL framework provides an approach explaining how rural HHs deal
with their constraints and opportunities in constructing their lives (DFID, 1999). The
framework consists of three interrelated components which influence livelihood strategies
adopted by HHs in pursuit of their desired livelihood outcomes. These components are: (1)
the HH asset (human, natural, financial, physical and social assets) that they have access to
and use, (2) the vulnerability context (including trends, shocks and seasonality), and (3) the
institutional and political environment. As discussed by Chambers and Conway (1992), Ellis
(1998), and Adato and Meinzen-Dick (2002), the livelihood outcomes expected by the HHs
are income, security, well-being, and other productive and reproductive goals (Jansen et al.,
2006). The SL framework is considered as a holistic and systematic approach for explaining
HHs’ decisions for pursuing their expected outcomes. The framework presents not only the
causes influencing decisions, but also the effects (outcomes) of decisions which would
feedback to influence the HH assets which is a cause determining the decision. Moreover,
the framework also encompasses interactions between three components which dominate
strategies set by the HHs.
In essence, the SL framework has been engaged in the field of land use studies. The
literature review of McCusker and Carr (2006) indicated that there are several land use
studies that referenced livelihood concepts. Adopting SL as the framework would benefit this
study; even though it was not developed directly for explaining the dynamics of land use, the
implication of land use strategies adopted by HHs in pursuit of their expected outcomes
would throw light on some factors that affect land use change. With the systematic structure
of the framework, investigating the factors by assessing causes and effects of HHs’ land use
strategies would provide the factors in the context of a holistic view. Moreover, the findings

69
VulnerabilityContextShocks
SeasonalityTrends
Changes
influence
PoliciesInstitutionsProcesses
LivelihoodStrategies
A
LivelihoodOutcomes
Figure 3.4 The components of the sustainable livelihood framework.
Source: Adapted from DFID (1999)
Note: H = Human Capital N = Natural Capital F = Financial Capital P = Physical Capital 8 = Social Capital
based on the interrelation between HH assets, the vulnerability context and the institutional
and political environment could provide policy implications useful to policymakers and
relevant stakeholders.
3.6.2 Questionnaire design and data collection procedure
The first step in designing a questionnaire is to define its objectives. Gillham (2008)
suggested that a questionnaire should have a clear purpose, a well-focused topic, and
should ensure representative coverage of the population. Two questionnaires were used in
this study. The first questionnaire was for finding facts and descriptive numeric information
of HHs’ characteristics as complementary data supporting and cross-checking qualitative
findings of factors influencing land use decisions. This questionnaire was used with HHs
who were the key informants in the in-depth interviews. The second questionnaire was used
for exploring the relationship between HHs’ characteristics and decisions of HHs regarding
whether they cultivate oil palm, and for finding the factors which were thought by HHs to be

70
the determinants in adopting a specific land use strategy. The second questionnaire was
conducted with a large number of HHs for the quantitative study.
Questionnaire design
The questionnaire was developed from the literature review, and from theory relevant
to research models (Buckingham and Saunders, 2004). Based on the literature review, the
SL Framework and previous studies helped to identify the factors related to HHs’ land use
decisions. In this survey, both closed- and open-ended questions were used. However, most
of them were closed-ended questions whereas open-ended questions were additionally
used only in the second questionnaire. In the first questionnaire, closed-ended questions
were considered to be enough because further meaning for the items could be obtained by
the in-depth interview which is the main tool of data collection. However, in the second
questionnaire, open-ended questions were considered necessary because the
questionnaire required the respondents to identify all the factors influencing land use
decisions. Even though a list of factors resulting from the qualitative analysis were provided
as potential factors for the respondents to choose, there might be some factors which were
not included in the list. Using open-ended questions would allow the HHs to be free in
identifying the factors according their experience.
In terms of structure, the questionnaires comprised three main sections. The details
of the questionnaires are attached in Appendix 1 and 2. In the first section, factual data
regarding the HHs’ background and personal information were obtained through closed-
ended questions with a multiple choice tick-box list. For section two, data relevant to land
uses and land use changes were obtained through closed questions regarding a specific
piece of information. The third section contains questions to elicit the main data that each
questionnaire is designed to reveal. In the first questionnaire, data about the HHs’ assets
relevant to HHs’ land use decisions were obtained through closed questions regarding a
specific piece of information.
In the case of the third section of the second questionnaire, the questions were
designed to obtain data for identifying exact factors influencing HHs’ land use decisions in
adopting specific land use strategies. Due to the list of potential factors being provided,
respondents could basically be asked to give a simple and concrete yes or no answer as to

71
whether each factor influenced their decision. However, even though the frequency of the
answers could prove whether each factor influenced their decisions, it might be argued that
this question forces the respondents to take a stand on a particular extreme answer (yes or
no) which does not allow them to respond with a degree of agreement reflecting how much
each factor influences their decision. In order to avoid this limitation, a Likert scale, with a
five (or seven) point ordinal rating scale developed to measure attitudes could alternatively
be used to allow the individual to express their degree of agreement or disagreement with a
particular statement (Likert, 1932). However, it is argued that the answers according to
ordinal rating scales might be distorted for several reasons. Respondents may respond
towards the middle of the scale but avoid using extreme response categories (central
tendency bias) (Heery and Noon, 2008). In addition, respondents may tend to agree with all
the questions giving a positive connotation (acquiescence bias) (Watson, 1992). Last but not
least, there is the tendency for respondents to try to answer questions in a manner to
portray themselves or their organization that would be viewed favourably by others (social
desirability bias) (Specter, 2004).
In order to prevent such distortion especially from a central tendency bias and to
obtain data for identifying what factors influence the decisions and the different level of
importance each factor plays in the decisions, the questionnaire in this study was designed
to ask the respondents to identify the factors influencing their decisions and rank these
factors according to their importance. Therefore in the third section of the second
questionnaire, the factors influencing HHs’ land use decisions in adopting specific land use
strategies were obtained through closed-ended questions with a multiple choice tick-box list
and through open-ended questions in the case there are some factors which were not
included in the list of closed-ended questions. In addition, the relative importance of chosen
factors was obtained through closed questions with a numerical ranking of importance given
by the HHs.
Survey method
This study used face-to-face interviews to conduct the survey. According to Dialsingh
(2008), the advantages of a face-to-face interview is that the presence of the interviewer
allows interviewees to either clarify answers or ask for clarification for some of the items on
the questionnaire. In addition, Sutter (2003) indicated that the interviewers can detect and

72
correct obvious inconsistencies that result from simple errors or misunderstandings. Finally,
a face-to-face interview helps to get a good response rate and reduce incomplete
responses. In this study, 10 of the first questionnaires and 180 of the second questionnaires
were completed.
List of factors influencing land use decision for questionnaire survey
A list of factors was drawn up for the questionnaire for quantitative analysis asking
the HHs what were the factors influencing their land use decisions. These factors were
derived from results of the qualitative analysis in Chapter 4 and an additional factor
indicated by respondents from the field survey. This additional factor is skill and knowledge
of the farming labourers of the HH. The wide range of factors is shown in Table 3.3. The
factors were classified into six groups including one group of expected outcomes of land use
and five groups of HH assets and relevant contexts. In addition, the table also shows more
details of criteria to classify whether each factor influences change of land use to oil palm or
not. Based on these factors, the HHs were asked to choose the factors which influence
them to adopt a specific land use strategy and then rank the chosen factors according to
their importance from the most to the least important.
Due to several factors from various aspects were identified as determinants of land
use decision, it seems that there are some overlaps among some of the factors. The
overlapping factors are: 1) capacity of HH labour and skill/knowledge; 2) water supply and
irrigation; 3) trend of price and price stability; and 4) policy of price, government subsidy and
disaster assistance. Even though these factors share some aspects, there are some
different details which should be separated into different factors instead of combined
together. In the first group, even though both factors are relevant to the condition of HHs
labour, capacity of HH labour is relevant to physical capacity or physical strength whereas
skill and knowledge refers to theoretical information and practical application necessary for
successful performance. In the second group both factors are relevant to water, but while
water supply refers to the amount of water from any source which could influence the
success of crop cultivation, irrigation refers to capacity to control and balance the water
supply to be suitable for the cultivation. In the third group, both factors are relevant to the
change of price. However, the differences are that trend of price is a factor influencing the

73
Table 3.3 Factors and criteria determining land use change to oil palm
Factors CodeThe factor would influence land use change to oil palm if respondent stated or agreed that:
The factor would not influence land use change to oil palm if respondent stated or agreed that:
Expected outcomes of land use
Profit F1 Using land for cultivating oil palm is profitable or more profitable than traditional use
Using land for current use is more profitable than cultivating oil palm
Lump sum income
F2 Using land for cultivating oil palm could provide lump sum income or more lump sum income than traditional use
Using land for current use could provide more lump sum income than cultivating oil palm
Continuousincome
F3 Using land for cultivating oil palm could provide continuous income or more continuous income than traditional use
Using land for current use could provide more continuous income than cultivating oil palm
Ownconsumption
F4 Cultivating oil palm is for own consumption
Cultivating current crop is for own consumption
Financial factorsSaving for investment
F5 HH has enough savings for investing in oil palm cultivation
The HH does not have enough savings for investing in oil palm cultivation
Credit for investment
F6 It is easy for HH to access credit for investing in oil palm cultivation
It is difficult for HH to access credit for investing in oil palm cultivation
Price stability F7 Oil palm price is stable or more stable than price of tradition crop
Current crop price is stable or more stable than price of oil palm
Trend of price F8 Oil palm price has increased or increased more than price of traditional crop
Traditional crop’ price has increased or increased more than price of oil palm
Policy of price F9 Price policy of oil palm is favourable or more favourable than the policy of traditional crop
Price policy of current crop is favourable or more favourable than the policy of oil palm
Governmentsubsidy
F10 Subsidies or assistances in cultivating oil palm is favourable or more favourable than the subsidies or assistances of traditional crop
Subsidies or assistances in cultivating current crop is favourable or more favourable than the subsidies or assistances of oil palm
Natural resource factors
Land topography F11 Land topography is suitable or more suitable for cultivating oil palm than traditional crop
Land topography is suitable or more suitable for cultivating current crop than oil palm
Water supply F12 Water supply is suitable or more suitable for cultivating oil palm than cultivating traditional crop
Water supply is suitable or more suitable for cultivating current crop than oil palm
Diseases/pests F13 Oil palm is resistant to or more resistant to diseases or pests than traditional crops
Oil palm is not resistant to or less resistant to diseases or pests than traditional crops

Table 3.3 (Continue)
74
Factors CodeThe factor would influence land use change to oil palm if respondent stated or agreed that:
The factor would not influence land use change to oil palm if respondent stated or agreed that:
Flooding F14 Oil palm is tolerant or more tolerant against flooding than traditional crop
Oil palm is not tolerant or less tolerant against flooding than current crop
Disasterassistance
F15 Disaster assistances for oil palm is favourable or more favourable than the subsidies or assistances of traditional crop
Disaster assistances for current crop is favourable or more favourable than the subsidies or assistances of oil palm
Human factorsCapacity of HH labour
F16 The HH has enough labour for oil palm cultivation
The HH does not has enough labour for oil palm cultivation
Skill/Knowledge F17 The labour of HH has skill and knowledge to cultivate oil palm
The labour of HH does not have skill and knowledge for cultivating oil palm
Accessibility of employed labour
F18 It is easy for HH to hire labour for oil palm cultivation
It is difficult for HH to hire labour for oil palm cultivation
Physical factorsTransportation F19 It is easy to access the plot site
and/or transport oil palm from plot site to the market
It is difficult to access the plot site and/or transport oil palm from plot site to the market
Tools and equipment
F20 HH’s tools and equipment are suitable for oil palm cultivation
HH’s tools and equipment are not suitable for oil palm cultivation or HH lacks tools and equipment for oil palm cultivation.
Irrigation F21 Irrigation system is suitable or more suitable for cultivating oil palm than cultivating traditional crop
Irrigation system is suitable or more suitable for cultivating current crop than cultivating oil palm
Land rights F22 Switching land to cultivate oil palm is not limited by land right
Switching land to cultivate oil palm is limited by land right
Social factorsNetworks and connections
F23 Networks and connections make HH prefer to cultivate oil palm
Lack of networks and connections to make HH prefer to cultivate oil palm
Farmerinstitutions
F24 Benefits expected to gain from farmer institutions of oil palm is favourable or more favourable than the benefits from the institutions of traditional crop
Benefits expected to gain from farmer institutions of oil palm is not favourable or less favourable than the benefits from the institutions of current crop

75
revenue from cultivation whereas price stability refers to security of revenue influenced by
price fluctuation. Last but not least, policy of price, government subsidy and disaster
assistance are relevant to government support for the farmers’ well-being but in different
contexts. Policy of price concerns intervention in market price, government subsidy is for
encouraging crop cultivation, while disaster assistance is to alleviate the HHs’ difficulties
after serious disaster.
Data preparation for inferential statistics
The concept of Analytic Hierarchy Process (AHP) was employed to convert the
ranking of factors rated by HHs to numerical values that can be processed and compared to
one another in a rational and consistent way. AHP is a multiple criteria decision-making tool
for organizing and analyzing complex decisions involving the comparison of decision items
which are difficult to quantify (Saaty, 1980). By the process, the numerical weight or priority
of each element is computed using raw data derived from pairwise comparison questions,
together with the law of reciprocal comparison, score normalization and the average of
normalized scores.
Classically, in pairwise comparison questions, respondents are asked to assess the
importance of one item against another on a 9-point scale which is used to represent the
intensity of judgement. According to Saaty (1980), the value “9” denotes “absolute
importance”, whereas the value “ 1 ” represents “equal importance” as shown in detail in
Table 3.4. The number of the pairwise comparison questions can be calculated by using the
equations; N = n(n-1)/2 where N is the number of the pairwise comparison questions and n
= the number of the alternative elements (Encheva, 2010a). Even though AHP is considered
to be a very useful tool, large numbers of alternative items results in difficulty in applying
AHP. A larger amount of pairwise comparisons and many-point scales of the intensity of
judgement can cause invalidity of measurement. In order to deal with these problems, binary
and ternary AHP have been proposed with the advantage that they do not require a larger
scale of values representing the intensity of judgement (Jensen, 1986; Takahashi, 1990).

76
Table 3.4 The 9-point comparison scale of classical AHP
Scale Definition
1 Equal importance
3 Moderate importance
5 Strong importance
7 Very strong importance
9 Absolute importance
2, 4, 6 , 8 Intermediate values between the adjacent scale values
Based on the ideas of Takahashi (1990), it is difficult for human beings to present the
intensity of judgement of pairwise comparison by using many-point scales as suggested by
classic AHP, but they can easily compare one to another and it is easy to say that “A is
better than B” or “A is worse than B". In this situation, unlike classical AHP which employs 1
to 9 scales, only two scales, 1 and 0, are enough to represent the preference or judgment.
Their meanings are as shown in Table 3.5. Similarly to classical AHP, the value “1”
represents “equal importance”, however all ratings of “more importance” are denoted by 0 ,
which is an integer such that 0 > 1. For the value of intensity of judgement (0), this research
followed the study of Encheva (2010b) by setting value of 0 to be equal 2.
Table 3.5 The 2-point comparison scale of T- AHP
Scale Definition
1 Equal importance
0 More importance
In this study. Ternary Analytic Hierarchy Process (T-AHP) was adopted instead of
the classical AHP of Saaty (1980) since there are so many alternative items for the decision
maker to consider. With 24 factors to compare, classical AHP would require the HHs to
judge 276 pairwise comparisons with the 9-point scale to represent the intensity of
judgement. Adopting T-AHP could help, at least, to reduce the time and effort by using the
2-point scale instead of the 9-point scale in pairwise comparison judgements.
In order to adequately and easily meet the main requirement that the HHs should
present a pairwise comparison between the factors, the questionnaire of this study was
designed to ask the HHs to rank the factors according to their importance. Firstly, the HHs

77
were asked to choose the factors that they consider to be the factors influencing their
decision in a specific land use strategy. By doing this, it can be interpreted that the chosen
factors were more important than those which are not chosen, and that the importance
among the factors which are not chosen are equal. In addition, the HHs were asked to rank
the chosen factors according to their importance. By doing this, all factors can be compared
to each other and, thus, pairwise comparison judgements can be quantified.
Based on the ranking of each factor derived from the questionnaire survey, the
notations ay are the pairwise comparison scores used in a matrix comparison. If factor i is
more important than factor j, a is denoted by 0. If factor i is less important than factor j, ay is
denoted by 1/0. In addition, if the importance of factor i and factor j is equal, ay is denoted by
1 .
For example, it is assumed that there are five factors, Fi to F5 , potentially influencing
the decision to adopt a land use strategy and a HH indicated that his/her decision was
influenced by three factors including Fi, F2 and Fsand the order of their importance from the
most to the least is F2 , Fi and F3 respectively. According to this information, the factors
chosen by the HH (Fi, F2 and F3 ) would be more important than those which were not
chosen (F4 and F5). In addition, the importance among factors which were not chosen (F4
and F5) is the same. The pairwise comparison scores will be derived in the form of a
pairwise comparison reciprocal matrix, as shown in Table 3.6, where 0 = 2.
Table 3.6 The pairwise comparison reciprocal matrix
Factor 1 Factor 2 Factor 3 Factor 4 Factor 5
Factor 1 1 1 / 2 2 2 2
Factor 2 2 1 2 2 2
Factor 3 1 / 2 1 / 2 1 2 2
Factor 4 1 / 2 1 / 2 1 / 2 1 1
Factor 5 1 / 2 1 / 2 1 / 2 1 1
The next step is score normalization. In order to normalize these pairwise
comparison scores, the sum of each column was computed and then the scores in each
column are divided by the corresponding column total. For example, the sum of the column
of factor 3 is 2+2+1+(1/2)+(1/2) = 6 , so the normalized score of cells a i3 and a2s = 2/6 =

78
0.33, the normalized score of 0 3 3 = 1/6 = 0.17, and the normalized score of 0 4 3 and as3 =
0.50/6 = 0.08. The normalized scores are shown in Table 3.7.
Table 3.7 The normalized scores
Factor 1 Factor 2 Factor 3 Factor 4 Factor 5
Factor 1 0 . 2 2 0.17 0.33 0.25 0.25
Factor 2 0.44 0.33 0.33 0.25 0.25
Factor 3 0 . 1 1 0.17 0.17 0.25 0.25
Factor 4 0 . 1 1 0.17 0.08 0.13 0.13
Factor 5 0 . 1 1 0.17 0.08 0.13 0.13
The final step is to compute the average values of each row in the Table 3.7, and
use these values as the preference weights for each factor. For example, a preference
weight for factor 2 = (0.44+0.33+0.33+0.25+0.25)/5=0.32 (32%). The average values are
shown in Table 3.8. The average values of each row represent stakeholder priority
preferences towards the factors. It should be noted that the average values of the factors
which were not chosen (F4 and F5) are the same. Based on this, these two values would be
identical when comparing two related samples (such as Wilcoxon signed-ranks test which
was used in this study). This situation means that the null hypothesis would not be able to
be rejected as shown by some of the results of the test in Table 5.10, 5.13, 5.16, 5.18, 5.20
and 5.23).
Table 3.8 The average values
The average values
Factor 1 0.24
Factor 2 0.32
Factor 3 0.19
Factor 4 0 . 1 2
Factor 5 0 . 1 2
Total 1 . 0 0
Finally, in classic AHP, Saaty (1980) suggested it is necessary to measure how
consistent the judgements are in pairwise comparison. For example, one respondent judges
that factor A is more important than factor B and factor B is more important than criteria C. If

79
this respondent makes consistent decisions, criteria A should be judged to be more
important than C. However, not all respondents might make consistent decisions. However,
it seems that this issue is of less concern in using T-AHP. This is because one of the main
advantages of T-AHP is that it significantly reduces conflicts in pairwise comparison
(Takeda, 2001). In this current study, the data collection process which is designed to ask
the HHs to rank the factors according to their importance should ensure that the pairwise
comparisons of each respondent are consistent.
3.6.3 Interview strategy
In order to gain a deeper insight into particular issues, semi-structured in-depth
interviews were chosen as the data collection method. As suggested by Ritchie et al. (2003),
in-depth interviewing is useful in investigating the depth of detail from the interviewee and is
considered a highly efficient method to get rich, empirical data and a deeper understanding
of the phenomena being studied. The nature of the interviews enables the interviewers to
access a level of depth and complexity in individual’s attitudes and values (Silverman,
2011). The semi-structured interview is regarded as a highly efficient way of providing
reliable, comparable qualitative data. An interview guide, including instructions and a set of
open-ended questions based on the topic areas which the researcher intends to study, is
used as a checklist to make sure all the issues have been covered in the conversation. In
addition, the open-ended nature of the questions allows both the interviewer and
respondents to discuss certain topics in more detail (Sommer and Sommer, 2002). As with
the structured interview, this method ensures that all respondents are questioned with the
expectation of providing the same type of interview data (Robson et al., 2001).
In preparation for the interviews, the interviewees were contacted before the
interviews were conducted. The research project and the purposes of the research were
introduced and consent to participation was requested. After receiving their consents, the
interview questions were given to the interviewees either in formal letters requesting co
operation for the policy makers or in face-to-face communication for the landowners. This
posting and communicating was done before conducting the interviews in order to ensure
that the respondents are able to pre-consider and understand the questions.

8 0
The interviews were conducted according to a list of open-ended questions which
was prepared as a guide for the researcher to investigate the topics from the different points
of view of the respondents. As mentioned in section 3.5.2, the interviews were conducted in
this research with the expectation of comprehending the reasons driving land use change
from the perspectives of both landowners and policy makers. In terms of the landowners’
perspective, this study intends to discover the factors influencing land use change via the
implications of HHs behaviour in adopting various land use strategies for dealing with the
circumstances that they faced. Based on the SL framework adopted as the conceptual
framework of this study, a list of the principal interview questions is as presented below:
How are farmers’ livelihoods currently constructed?
What are the important aspects to livelihood at present?
What are the drivers influencing the willingness of farmers to switch land
use from traditional crops to biofuel crops?
In respect of the policy makers’ perspective, this research intends to investigate
whether the policy makers are interested in or worried about the substitution of oil palm in
paddy areas and how the policy makers deal with this unintended consequence. In order to
understand that, a list of the principal interview questions is as presented below:
What is the current situation of the unintended consequence that paddy rice
was substituted by oil palm?
Did the policy makers know about the unintended consequences?
How did policy makers try to adapt to the unintended consequences?
In the event that they knew but did not adapt, what has caused the inertia?
In order to ensure that the interviews were conducted to the same standard, a certain
protocol in questioning was implemented with all respondents. Each question was asked by
starting with broad and general views first and then going to more specific views according
to the interviewee’s point of view. Even though some structure or wording of interview
questions might be changed to be consistent with the responses of interviewees at the time.

81
the contents, meanings and levels of detail of each question were still similar to the original
questions.
The interview questions were conducted in Thai. The interviews of landowners and
policy makers were conducted in June 2012 and July 2012 respectively. The discussions
during the in-depth interviews were audio recorded to enable the researcher to transcribe
them later. Before using the audio recorder, the interviewees were asked whether they had
any objections about the recording. The result was that all respondents permitted its use.
In order to ensure that the data derived from the interview would not be distorted in
the transcription and interpretation process, the points of view and answers of the
respondents to each question were summarised and restated by the researcher during
discussion of each question and before the end of the interview. By doing this, the
respondents could confirm their points of view and answers, correct some points which were
misunderstood by the interviewer, and/or delimit their points of views if there were some
sensitivity issues.
3.6.4 Approach for qualitative analysis
The qualitative data analysis depends on many factors such as the researcher’s
paradigms, the purpose of the study and the characteristics of the research participants
(Snape and Spencer, 2003). It is argued by many scholars that there is no one way which
has clearly agreed procedures, for doing qualitative data analysis, unlike quantitative data
analysis which has standard statistical procedures (Spencer et al., 2003). Some scholars
suggest that qualitative data analysis is often considered to be an art form that requires an
intuitive approach (Miles and Huberman, 1994)
In fact, with the nature of qualitative data consisting of the vast amounts of data that
are often generated in qualitative research, a well-predefined procedure is required to
prevent confusion in data analysis. In this study, the data were analysed using thematic
framework analysis. In order to answer the research questions, the tasks of the analysis
process are frequently involved with categorising, theorising, explaining, exploring and
mapping the data to summarise and synthesise for drawing conclusions. In this research,
the analysis is based on the suggestions of Ritchie and Spencer (1994) that the analysis

82
approach involves a systematic process of sifting, charting and sorting material according to
key issues and themes. As proposed by Ritchie and Spencer (1994), there are five key
stages of framework as detailed below;
Firstly, the researcher should become familiar with the collected data in order to gain
an overview of all the data and key themes. Dey (1993) also suggested that immersion in
reading transcripts, listening to audio recordings and reading observational material could
help the researcher to become familiar with the data. In respect of transcription, the
researcher decided not to employ precise transcriptions which are time-consuming and
produce much textual data. The transcriptions in this study concentrate only on the audio
recording which is directly relevant to the research question. Due to the interviews being
conducted in Thai, all of the transcripts were in the Thai language without being translated
into English to avoid translation errors, and to retain participants' expressions, words and
key terms. However, translation into English was needed to provide some selected quotes
as evidence of the findings supporting data analysis.
Secondly, the researcher developed an initial thematic framework which could be
applied consistently to the transcripts for getting a sense of the data. In order to do that,
codes were developed in a systematic way to condense large data sets into smaller units. A
specific code in terms of a short piece of data helps in developing, transforming and re-
conceptualising the entire picture of the data to provide more possibilities for analysis.
The third stage is the indexing or labelling stage. The initial thematic framework or
index was systematically applied to the data in textual form. A cyclical process was used to
recheck the indexing or labelling until concrete themes had been developed.
The fourth stage is the charting stage. The indexed or labelled data was revisited
and rearranged from the original context by clustering and charting together according to
their connections to get the appropriate thematic reference.
Finally, the mapping and interpretation of the data were conducted. The text
segments within each chart were examined and interpreted as a whole. In order to find out
the results of the qualitative analysis, the text segments were compared and contrasted to
reveal the patterns and relationships across the cases. By mapping and describing key

83
dimensions of the patterns and relationships, the frame of the findings emerged. These
findings would be used as a basic structure to present the findings of the qualitative
analysis.
3.6.5 Approach for quantitative analysis
In the study of human behaviour, quantitative analysis is adopted as the systematic
empirical tool to investigate social phenomena via statistical, mathematical or numerical data
(Given, 2008). To accomplish the different objectives of quantitative analysis, numerical and
statistical procedures are required. Generally, statistical procedures can be classified into
two broad categories: descriptive statistics and inferential statistics. In this study, both
descriptive and inferential statistics were used as discussed in detail below.
Descriptive statistics
Descriptive statistics are the statistical procedures that are used to describe the main
features of a collection of information that is being studied (Mann, 2004). In order to
describe a data set, the measures that are commonly used are measures of central
tendency (mean, median, and mode) and measures of variability (the standard deviation or
variance, frequency distributions, and the minimum and maximum values of the variables).
In this study, descriptive statistics were applied, having regard to their
appropriateness to the nature of the data, to provide a complete picture of the data. The
descriptive statistics were used to describe the features of various data including (1 ) general
information about HHs’ characteristic relevant to land use decision, (2) HHs’ land uses, (3)
basic information of factors influencing HHs’ land use strategies, and (4) the financial
information in the value chain of intended crop productions and their relevant forward
linkage industries, and financial impacts of land use switching on the relevant stakeholders.
inferential statistics
Inferential statistics are distinguished from descriptive statistics in terms of the aims
of their analysis. While descriptive statistics aim to learn only main features of a data set,
inferential statistics use that data to learn about the main features of the population that a
set of data is thought to represent. “Inferential statistics is concerned with making

84
predictions or inférences about a population from observations and analyses of a sample. In order to address whether a sample can generalize the larger population, tests of significance are required to provide the probability that the results of the analysis could have occurred by chance when the null hypothesis are set” (Frankfort-Nachmias and Leon-
Guerrero, 2011).
There are two types of statistical tests, parametric tests and non-parametric tests,
which are distinguished by whether or not assumptions about the parameters of a
population were made. On one hand, parametric tests generally refer to the techniques
which study population parameters by making inferences from a sample. They rely on
several assumptions such as “the sample has been randomly selected from the population it represents and the distribution of data in the population has a known underlying distribution” (Kantor and Kershaw, 2010). Frequently, using parametric methods, e.g. t-test, z-test and
the AN OVA, can be most powerful in rejecting the null hypothesis when it is incorrect.
However, some errors, such as Type I errors (the incorrect rejection of a true null
hypothesis), might occur as a consequence of applying parametric tests if some
assumptions are not true (McClave et al., 2008).
Alternatively, there are a number of methods available for analysing data which
require fewer assumptions (Kantor and Kershaw, 2010). These are known as non-
parametric statistical tests. In essence, these methods are independent from the distribution
of the sampled population because they focus on the rank order of observations or the
location of the probability distribution of the population rather than the measurements of
specific parameters of the population (McClave et al., 2008). The examples of non-
parametric tests are: the Mann-Whitney U test, the Wald-Wolfowitz runs test, and the
Kolmogorov-Smirnov two-sample test for testing differences between independent groups;
Wilcoxon signed-ranks test, McNemar's Chi-square test, Friedman's two-way analysis of
variance and Cochran Q test for testing differences between dependent groups; and
correlation coefficient of Spearman R and Kendall Tau, coefficient Gamma, the Chi-square
test, the Phi coefficient, and the Fisher exact test for testing relationships between variables
(Hill and Lewicki, 2007).
Logistic regression is a parametric method widely adopted for verifying factors
influencing land use change (such as by Gobin et al., 2002; Anjichi et al., 2007; Amatayakul

85
and Azar, 2008; Sarker et al., 2009; Boundeth et al., 2012; Xu et al., 2013). However it was
rejected for this study because many categories of dependent variables (land use
strategies) and various independent variables (potential factors influencing land use change)
required massive sample sizes for validity of the model. In logistic regression analysis,
although there is no universally accepted standard on the recommended sample size
(Stoltzfus, 2011), a few guidelines to determine a minimum sample size to be used in a
study have been suggested. Based on simulation studies, a “ rule of thumb” is employed to
determine minimum sample size for logistic regression analysis. The rule states that for
every independent variable, there should be at least 1 0 samples for each binary category
(Peduzzi et al., 1996; Agresti, 2007). Some statisticians recommend that the ratio should
increase to 2 0 samples per individual variable because the higher ratio tends to more
validity of the model (Feinstein, 1996). However, the issue of appropriate ratio has not been
definitively settled, and some would argue that less than 1 0 samples per independent
variable may be suitable for certain research contexts (Hosmer and Lemeshow, 2000).
According to this study, dependent variables can be categorised into six cases
consisting of: 1 ) continuing paddy cultivation; 2 ) switching from paddy to oil palm cultivation;
3) continuing rubber cultivation; 4) switching from rubber to oil palm cultivation; 5) continuing
leaving land abandoned; and 6 ) switching abandoned area to oil palm cultivation and the
probability of each case is determined by 24 independent variables which were derived from
qualitative analysis. Based on the rule of thumb, the minimum sample size to be used in the
study would be 1,440 including 240 samples of each case. In order to deal with the
disadvantage of logistic regression of demanding so large a sample size, non-parametric
statistics were adopted instead because this approach requires a smaller sample size.
According to the type of data derived from the field survey and the intention of the
study to find out exact factors influencing land use decisions, inferential statistics were used
in this study for testing (1) the relationships between HH characteristics and the likelihood of
cultivating oil palm, (2 ) differences between priority weights of each factor in each category
of land use strategy, and (3) differences of priority weights of each factor between areas
with different predominant uses. As discussed previously in section 3.5.4, the assumption of
a distribution of the population was not made because the researcher does not know the
shape of the underlying distribution of the population. Therefore, analysis methods used in
this research were non-parametric statistics. To be specific, three non-parametric methods.

86
the Chi-square test, the Wilcoxon signed-ranks test and the Mann-Whitney U test, were
employed in this research. The objectives, hypotheses statements and critical regions for
hypothesis testing of each method are given below:
(1) The Chi-square test for testing relationships between HH characteristics and the
likelihood of cultivating oil palm. The relationships can be evaluated by the following
hypothesis:
HO: The HHs are not significantly different in a specific HH characteristic
H1: The HHs are significantly different in a specific HH characteristic
HO would be rejected if the actual chi-square was bigger than the critical value in the
table.
(2) The Wilcoxon signed-ranks test for testing differences between priority weights of
each factor in each category of land use strategy to find out exact factors influencing HHs’
decision in adopting a specific land use strategy. Based on priority weights derived from
AHP, the Wilcoxon signed-ranks test would firstly classify the factors into two groups. These
include: 1) Non-influence factors which are the factors that were not mentioned by the
respondents, or the factors that were mentioned by the respondents but of which the priority
weight was not statistically significantly different from the weight of factors not mentioned by
the respondents; and 2) Influence factors which are the factors that were mentioned by
respondents, and of which the priority weight was statistically significantly different from the
weight of factors not mentioned by the respondents. Among influence factors, the Wilcoxon
signed-ranks test would also classify them into to sub-groups including: normal-influence
factors and dominant-influence factors. The dominant-influence factors were the factors in
the group of very-high-ranked factors for which the priority weights might not be statistically
significantly different among them but were statistically significantly different from other
lower-ranked factors. The differences can be evaluated by the following hypothesis:
HO: There is no difference between weights of factors i and j
H1 : There is difference between weights of factors i and j

87
HO would be rejected if the actual Z-value is less than the negative value of the
critical value of Z from the table or larger than the positive value of the critical value of Z
from the table.
(3) The Mann-Whitney U test was adopted for testing differences between priority
weights of each factor between areas with different predominant uses. This testing intends
to point out whether the influence of a factor in selective land use strategy is different among
land use categories. The differences can be evaluated by the following hypothesis;
HO: There is no difference between the median of each factor between the areas
with different predominant uses
H1 : There is difference between the median of each factor between the areas
with different predominant uses
HO would be rejected if the actual Z-value is less than the negative value of the
critical value of Z from the table or larger than the positive value of the critical value of Z
from the table.
3.7 Conclusions
This chapter discussed the theoretical aspect of research methodology to provide an
overview of methodologies used in the research. To achieve the different research
objectives, this research was separated into three individual studies. The research objective
and research questions of each study were stated clearly and the research designs of each
study were justified according to the purpose of each question. Positivism, interpretivism
and pragmatism were adopted as the research philosophy according to the different
philosophical aspects that the research questions aim to investigate. In addition, different
research approaches and methods, and methods of data analysis were chosen to be
suitable for the different aspects of the research questions. The details of the philosophical
and methodological aspects that were adopted for this research were summarised in Table
3.9.
In study 1, pragmatism paradigm was adopted. The study was divided into two parts
with a combination of quantitative and qualitative approaches. It started with a qualitative

8 8
approach and then probed statistically by using a quantitative approach in order to
investigate critically the factors influencing land use change. Semi-structured interviews with
10 HHs and a survey questionnaire with 180 HHs were conducted to collect data at different
levels to find out the factors from the real context of HHs’ decisions.
In study 2, positivism was adopted as the research philosophy. The study used
quantitative approaches in order to investigate the financial impacts of land use switching
from paddy and rubber to oil palm. Secondary data of the input-output national accounts of
Thailand were employed to reveal factual and comprehensive information regarding the
financial contribution gained by the stakeholders in the value chain and the financial impacts
affecting the stakeholders if paddy and rubber areas were switched to oil palm.
Finally, the study 3 relied on the interpretivism paradigm. A qualitative approach was
employed in order to gain insight into whether the policy makers are interested in or worried
about the substitution of oil palm in paddy areas and how the policy makers deal with this
unintended consequence. Semi-structured interviews with three policy makers were used to
explore their views on the topic of land use competition between food and biofuel crops.

89
CO>%■D03
(/}%cg■■3Ii
c01 c <DE_0)Q.EI 'oQ.
0
gro■50w=J■Ocro
gIro3o
O .E
0
ac
112 W
E003
0c0
I0EI 'oQ.00
0coww.2OQ.c2 W0) 0ÎË 2"3 0
oEoc8 ^ - .ÜE Ô3 Q-
O)3■3 0 0
P0C0
c
< LU <
CN
■g-
03
8
•502Q.Q.0
SO)oo■ao
3eT3C0
S!cQ.OWO
IEQ."O
00w0
o
0EE303a>CO0
"O3œ
01 0 Q.E
iio
0w3■oc_0D)Co§3
■§a20
1
g30In'0 x:
1I
•oI 0 •O 0 D)
■ C 0
Ü0w3•oc0
0
1qEp
I 'oQ.C0ECL0
1■DE•IES’
ic03o
0O)c0
■5
Ic03o
?103o
E.P■o20D.
2sI
Ü02a.CL0
003
•DO
3
iI
■D
0TDC8003
20cc0
1 3 D-
I303
13 I
ë £w 0c
8
0
i
0E:ÜL-'0E0
.E
0c0
Û
83g"cÜ0
0CoI*—*0c3B-3
s3Q.
_C0
83_g"c■50
wTIo00
&0c0
wXX
I30 W1Q
sc0Q.O■■C0X
TOCça0
oi 2c3
80

90
CHAPTER 4
QUALITATIVE ANALYSIS OF FACTORS INFLUENCING
LAND USE CHANGE
4.1 Introduction
This chapter shows the research outcomes relevant to the livelihood study and
factors influencing land use change. As mentioned previously in Chapter 3, the results were
derived from interviews with 10 HHs (six in Chianyai and four in Prasaeng) whose land use
strategies are shown in Table 4.1. Land use strategies were mainly classified into three
categories according to initial uses of land before switching to current uses. These
categories are abandoned land base, paddy land base, and rubber land base. In addition,
land use in each category was also classified according to what the land is currently used
for. Sizes of land use in each strategy were also provided. The HHs in Chianyai are referred
to as interviewees C l to C6 , and respondents in Prasaeng as PI to P4.
Table 4.1 Overview of land use strategy of the interviewed householdsUnit; H
HHsAbandoned land based Paddy land based Rubber land based
TotalContinueabandon
Switch to oil palm
Switch to rubber
Switch to other crop
Continuepaddy
Switch to oil palm
Switch to livestock
Continuerubber
Switch to oil palm
C1 12.8(70%)
1.6#% )
1.6#% )
2.4(13T6)
18.4(100%)
C2 2.56(15%)
0.64(4%)
13.12(77%)
0.64(4%)
16.96(100%)
C3 64(51%)
56.48(45%)
5.76#% )
126.24(100%)
C4 12.16(100%)
12.16(100%)
C5 7.52(100%)
7.52(100%)
C6 5.44(65%)
2.88(35%)
8.32(100%)
P1 9.6(45%)
9.92(47%)
1.6(8%)
21.12(100%)
P2 6.88(53%)
3.2(25%)
2.88(22%)
12.96(100%)
P3 7.04(63%)
4.16(37%)
11.2(100%)
P4 2.72(44%)
3.52(56%)
6.24(100%)
ectare

91
Based on the SL framework, the chapter firstly describes livelihood assets (human,
natural, social, physical and financial) and then presents the vulnerability, and policy and
institutional contexts. Finally, the chapter discusses land use strategy and points out factors
influencing land use change.
4.2 Livelihood assets
This section presents the assets influencing household livelihood. As mentioned
previously in the methodology chapter, the five principal assets important to livelihood
include human, natural, social, physical and financial assets. Findings from the field study
are shown below.
(1) Human asset: the households
Human capital is important in a household because it provides labour for activities in
which the HH engages. Various dimensions of human capital of the HHs in Chianyai and
Prasaeng are shown in Table 4.2, where HH size, members, education, age, occupation
and labour force are provided.
In terms of HH composition, the average HH size of HHs surveyed was 4.9 while the
range is three to seven people. The Chianyai HH C l and the Prasaeng HH P4 were the
smallest of the ten HHs surveyed. They comprised three of people; two adults and a child.
The biggest household was in Prasaeng (P3). This comprised seven people. Three of these
were adults whereas the rest were two elderly people and two children.
The most common form of HH in the sample is the nuclear family, consisting of the
couple and their children. Among the ten households, six households contain a married
couple and their children (C2, C3, C4, P I, P2 and P4), two households contain a married
couple, their children and a child’s spouse (C5 and P3), one household contains a married
couple, their children and parents (C6 ), and one household contains a married couple and
their adopted child (C1). In addition, there are grandchildren in three families (C5, P2 and
P3).

3)C0S0
"3C0
■g,C.0jeu_ç"3
I00Ww
XXcB0
co
oQ .Eo
OCNJ
_0
ü
co
CD
CD
CD
lO
lO
CO
CVJ
CM
CM
CM
ü
CM
00
00
CM
00
ID
00
CM
CM
CM
CM
ID
00
CM
CM
00
CM
00
lO
CM
CM
CM CM
00
00
CM
00
CM
CM
CM
00
CM
lO
00
CD
LO
LO
ID
CM
I
92
ICO
ECO
00
•oCDO)COCDC1CO
2
I3
■DCO
<
CD•OC3EU)CO
ICO
■oc
_ço'cD
■oCDC
E"D
CDsz
< c o■■cfCL 20CD >>
H ^5 1C3) en
1 i
0CD
1Eg"0c
ICO

"O03C4-"Co
ü
CNj
0Sif
ü
CM
CM
CO
CO
CM
CM
CO
CO
CM
lO
in
lO
CM
CO
CM
CM
CO
93

94
In the case of education, levels of formal schooling varied amongst members and
households. The new generation of HH members tends to have a higher level of education
than their parents because the constitution of Thailand has increased the minimum of
mandatory years' school attendance and a free basic education is now guaranteed. The
most common level of education of household heads (HHHs) and their spouse is primary.
However, there is one HHH who has no education (C5) while some HHHs are educated to
undergraduate level (C1, C2 and P4).
Generally, the HHHs value the education of their offspring. They strongly believe that
higher education will assist their children in gaining better employment opportunities in the
future. This value is based on their expectation that their children should not follow in their
footsteps into farming. In order for their children to succeed in education, the HHs send
them to school and attempt to generate enough income to support their children’s education.
Every HHH prefers to support their children to achieve as high a level of education
as possible. For instance, one HHH who achieved a very high level of education (C2)
obviously educated his children at least to the same level as themselves. HHHs who have
low levels of education (C3, P2 and P3) supported their children to complete undergraduate
level and some postgraduate level. The attempt of HHs with school-aged children to
educate their children is clearly confirmed by the data in Table 4.3, which shows that most
school-aged children are sent to school, college or university whereas only a few of them
have terminated their education and started working.
Table 4.3 Current occupation of young people by age
Age Current occupationTotal(years old) In School Working
7-12 5 0 513-18 4 2 619-25 3 0 3
Considering labour and occupation, the amount and quality of HH labour available
are important factors which enable a HH to pursue different livelihood strategies and
achieve their livelihood objectives. However, the amount and quality vary according to
household size, age, education levels, health status etc. Normally, the main labour force of
HHs is mature adults while children and young adults being in school are excluded from HH

95
labour. Although they could help with some activities, most of the HHs expected them to
focus on studying. This situation influences the young members to get out of the HH
occupation because they would not be familiar with or tied to the agricultural occupation of
their own HH. Alternative jobs that they can get after educational success would attract them
away from returning to continue with an agricultural occupation in the land they will inherit.
Moreover, there are other groups of members who are too young to work and lack the
capacity to be part of a HH’s labour force. They include babies (P3), disabled people (P2) or
those too old to work (C6 , one of 90 years of age).
The composition of occupations varied within each HH. In every HH, there is at least
one full-time farmer except HH C1 which has its own business so the on-farm job has
become their part-time occupation. The range of number of farmers in each HH is one to
four people. Although farming is an important affair for each HH, most HHs conversely give
priority to allocating their labour to off-farm occupations if possible. HH members who have
high education (C2, P2 and P3) are expected to work in off-farm occupations because this
gives a better opportunity for the HH to earn an income which is constant throughout the
year. Moreover, HH members who are not very educated but have the opportunity to work in
an off-farm job (C5, C6 and P1) were supported by the HH to work in off-farm occupations
for the same reasons.
This fact can be confirmed by the figures in Table 4.4 which show that most
members with low education level are in on-farm occupations whereas most members with
high education level are in off-farm occupations. Moreover, the figures in Table 4.5 show a
tendency to labour movement. All members with on-farm occupations will stay at home
whereas most members with off-farm occupations will live away from home. This situation
confirms the tendency in the community that the number in farming labour decreases after
the education level of HH members increases.
However, there is one HH which goes against this trend. In HH C3 which occupies a
very large HH farm (126.24 ha) the HHH called his two sons who have graduated at
postgraduate level back home and assigned them to manage and work the HH farm. The
sons accepted the offer from their parents after a short time working in off-farm occupations.
The reason behind their decision was that the salary that they obtained was less than the
returns that they could get from farming their own farm.

96
Table 4.4 Current occupation by education
Educational level passed Main occupationTotalOn-farm Off-farm
None 2 0 2
Primary 1 0 2 1 2
Secondary 4 2 6
Undergraduate 4 7 1 1
Postgraduate 2 1 3
Note: the numbers exclude students, children and disabled people
Table 4.5 Current residence by main occupation
Main occupation Current residenceAt home Away
On-farm 2 2 0
Off-farm 4 8
Note: the numbers exclude students, children and disabled people
In terms of human assets, several HHs reported that the availability of labour force is
an important factor influencing their land use strategy. In Chianyai, HHs who have enough
labour and high capacity to work (C4, C5 and C6 ) confirmed that they are able to and would
continue cultivating paddy as long as the cultivation gives a satisfactory return. However,
HHs who lack enough labour and have low capacity to cultivate paddy on their land changed
their land use strategy to activities which require less labour-intensive in farm management:
HH C1, C2, and C3 preferred to abandon lands which have potential for paddy cultivation
and have switched some or all paddy-occupied areas to oil palm. Although there were other
factors influencing land switching from paddy to oil palm, the HHs confirmed that their
elderly age and lack of a new generation to inherit the paddy cultivation were the main
factors influencing their change in land use strategy.
In Prasaeng, the labour force of HHs is a factor influencing land use decisions. HHs
with enough labour to manage all their own lands (P3 and P4) reported that they preferred
to cultivate rubber instead of oil palm because it required less labour power than oil palm.
The HH labourers, although elderly, could work harvesting latex in a rubber plot. However
this capacity could not apply in oil palm cultivation because it requires strong labourers to
deal with hard work such as harvesting bunches of fresh fruit sometimes from very high
palm trees and carrying the heavy bunches to a truck. Moreover, using a HH’s own labour in

97
a rubber plot could reduce the expenditure on hiring labour approximately 40 to 60 percent
of farm revenue.
In conclusion, the availability of HHs’ farming labour is dependent on HH size, age,
education levels and health status. Even though it is considered that farming is the main
occupation of HHs, there is a tendency for the number of household members in farming
labour to decrease. Most HHs give priority, especially for the new generation with higher
education levels, to allocating their labour to off-farm occupations whereas on-farm
occupations are left to the adult and/or elderly members with low education levels. Due to
the decline of HHs’ farming labour, HHs tend to chose less labour intensive crops and/or
those requiring less farming management. For this reason, rubber cultivation is continued
without substitution by oil palm even though it may be unproductive, whereas paddy areas
tend to be switched to oil palm.
(2) Natural assets: land and farming
Table 4.1 indicates that there are various sizes of land occupied by HHs. One HH
(C3) holds a very large area while three of them are quite small land owners (C5, C6 and
P4). According to Table 4.6, in Chianyai, HH 03 has the most land (126.24 ha) and the HHH
owns the land whereas HH 05 occupies the smallest land (7.52 ha) of which about half is
rented. In Prasaeng, HH PI occupies the largest area (21.12 ha) of which about one third is
allocated by a government organisation for the HH to use. HH P4 occupies the smallest land
(6.24 ha.) all of which owned by the HH.
The pattern of land rights is an important point of difference between HHs in
Prasaeng and Chianyai: All HHs in Prasaeng (except P3) occupy only their own land
whereas some HHs (04, 05 and 06) in Chianyai have both owned land and rented land.
Normally, HHs prefer to use their own land if they can manage it and if the land gives them a
satisfactory return which is worth more than leaving the land abandoned or renting it out.
The HHs in Prasaeng reported that the high price of rubber was the main factor influencing
them at present not to abandon or rent out their land. Moreover, rubber and oil palm farming
are not too difficult for the HHs to manage because they can hire labour to work instead of
themselves if they lack the capacity to work. This situation is quite different from in Chianyai,
where some areas were not used by their owners. Several HHs in Chianyai considered that

98
the return from paddy cultivation is unsatisfactory and paddy farming is very difficult to
manage. Renting the lands out to earn some rent is better than continuing cultivation or
leaving the land abandoned. The HHs reported that rented lands are mostly owned by
landlords who lack the capacity to cultivate crops by themselves. They normally are too old
or have migrated far away from the plot sites. However, the rental lands are normally used
for paddy cultivation because rental contracts cover short periods of time. Most rental
contracts are informal and rentals are within kinship network or to a familiar person. The
permission is considered year by year and landlords can cancel contracts when they want.
Cultivating paddy was adopted for rental areas because it makes farmers more flexible to
stop cultivation within the contract duration. Oil palm cultivation is not consistent with the
conditions of these contracts because oil palm is expected to be cultivated and harvested in
long period (nearly 20 to 25 years) and it takes a long time till giving the first output (three to
four years). Therefore using rental areas for oil palm cultivation is not feasible because the
farmers might not get the expected return from investment or lose all money that they
invested if they cultivated oil palm and their contracts were cancelled before the payback
period.
In terms of land use, each HH employs their land in different ways (see details in
Table 4.6). Some HHs (C3, C4, C5 and P4) cultivate only one crop whereas others choose
various crops to cultivate in their area (HHs C1, C2, C6 , P1, P2 and P3). Some HHs leave
their land abandoned (C1 and C2) while some HHs use their land for raising prawns (C3)
and goats (C2). In terms of change of land from traditional to current use, it can be seen
from Table 4.1 that there is a variety of land use strategies adopted by the HHs. In the case
of abandoned land base, it can be clearly seen that there is a HH leaving most of its own
land continually abandoned (C5) while four HHs switched all of the abandoned area to
cultivate oil palm (C l, 03, PI and P2). In terms of paddy land base, some HHs continually
grow paddy without switching to oil palm (04 and 05), some of them partially substituted oil
palm in some paddy areas (06), while some of them switched large areas to grow oil palm
(02 and 03). Looking at rubber land base, all HHs maintain the land for growing rubber;
however most of them switched some area to cultivate oil palm (P I, P2 and P3). The
reasons why the HHs applied different land use strategies will be discussed in the section
on land use strategies.

99
The lands occupied by HHs are almost entirely arable. However, land characteristics
are different depending on their location. In Chianyai, the topography and geography of the
area makes it mostly suitable for paddy cultivation. All HHs in Chianyai reported that the
land characteristics have allowed them to cultivate paddy since their ancestor’s generation.
However, the effectiveness of cultivation also depends on the local geography. The HHs
agreed that the level of lands near the river and branch canal is too low to control water
when flooding (C1 ). Conversely, the level of lands far from the river and branch canal is too
high to irrigate in the drought season (C2). Because of this characteristic, the owners (C1
and C2) have tended to abandon these areas.
Although most of the arable areas in Chianyai are suitable for paddy cultivation, oil
palm has recently been considered to be another crop that can be productive in this area.
Oil palm production has become popular among farmers in the last five years and its
cultivation has been significantly extended in abandoned areas and paddy areas. The HHs
who cultivated oil palm (C1, C2, C3 and C6 ) stated that oil palm cultivation is suitable in
Chianyai because of the local geography and potential water supply. They also agreed that
the local geography is a factors supporting irrigation system construction to store enough
water for use in oil palm plots. Although the land is normally flooded in the rainy season and
lacks water in the drought season, the land can be adjusted to be suitable for oil palm by
digging soil from land allocated for drainage ditches and filling up the planting bed to raise
the land level. This construction allows oil palm to be cultivated at a high enough level to be
secure from flooding while drainage ditches help to store water used in plot in the drought
season.
As in Chianyai, differences in land characteristics are a factor influencing the
selection of plants to be cultivated in Prasaeng. Topography and geography in Prasaeng
consists of multiple upland and lowland areas. In the past, upland areas were employed for
cultivating perennial plants like rubber and fruit trees whereas lowland areas were used for
paddy rice cultivation (P1, P2, P3 and P4). Although there is no paddy cultivation in
Prasaeng at the present time, the characteristics of lowland areas still limit farmers to
cultivating only plants which have shallow and fibrous root systems. This condition makes
cultivating oil palm in these areas more suitable because oil palm can grow in shallow soil
only 50 centimetres deep if nutrients and water are well supplied (Corley and Tinker, 2003)

2%0X
8w3■OC0
■oc
5CDTj-_0.Q0
ü
CM
CM
CM
CM
CO
CM
CD CD
100
Ui
T3C0
Oc
"O0•D2
■D
X50
■q .
8O•OC_00
0
•o
1o0TDC0
C0
1 c 02 Ot3■DÇ
ï

101
while rubber needs deeper soil where the minimum soil depth is 1 0 0 centimetres
(Krishnakumar and Potty, 1992). All HHs said that cultivating plants which have deep tap
roots like rubber is not productive because the high level of ground water stunts growth of
the root system and the tree. Because of this, land used for paddy cultivation in the past was
left abandoned after paddy became unpopular in the area. However, these areas were
finally switched to oil palm after the oil palm price increased enough to give farmers
satisfactory returns on investment.
Moreover, HH P2 reported that land characteristics also limit crop cultivation in
upland areas. Although the highland area is suitable for various perennial trees, crop
cultivation in some areas faced serious diseases caused by local geography. From the
experience of HH P2, the HHH reported that the HH had faced serious occurrences of both
white root disease [Rigidoporus lignosus (Klotzsch) Imazeki] and red root disease
[Ganoderma pseudoferreum (Wakef) Over & Steinm]. These diseases are considered to be
devastating root diseases of the rubber tree. The white disease can damage rubber trees on
the root system at any stage of growth after the trees are one year old or more while the red
disease is often found in rubber with a large trunk and roots in the tapping stage. These
problems are severe and untreatable. The HHs reported that it is difficult to detect the
symptoms of disease when a tree is first infected because the damage begins underground.
They usually know that the tree has been attacked only after the leaves change from green
to yellow and the amount of latex decreases. Although uprooting and burning the morbid
tree and/or applying fungicide could destroy the disease if these actions are taken early
enough, the HHs reported that this is often not effective because they usually discovered the
disease too late. Moreover, the HHs reported that although replanted rubber trees do grow
in the early stages, they are eventually destroyed by the disease because it remains in the
soil. The HH therefore has to switch land use from rubber to oil palm to escape these
diseases.
In summary, land conditions are important determinants of the way in which the land
is used. In terms of land rights, rented lands tend to be limited only to cultivating traditional
crops like paddy whereas there is more flexibility for switching to alternative crops like oil
palm on lands used by the owner. In terms of land topography, it can clearly be seen that
soil conditions and water supply are important determinants of which crops are suitable in
an area. Traditionally, specific crops are chosen for cultivation to take advantage of land

102
topography. However, with the strengths of oil palm, such as being tolerant against flooding
and growing well in shallow soil, it tended to be adopted by the HHs to be cultivated instead
of traditional crops in cases where the output of traditional crops was not productive and/or
was limited by topographic conditions.
(3) Social assets
Social networks are an important aspect influencing land use strategy adopted by
HHs in Chianyai and Prasseng. Many forms of social networks and connections become
instruments both in the spread of agricultural information, innovation and technology and in
financial assistance support.
A summary of social activities and group membership are shown in Table 4.7. In
terms of informal social activities, all HHs reported that they had opportunities to participate
in various activities: visiting relatives, religious activity and local festivals. Rooted in rural
village communities, the social capital of HHs in Chianyai and Prasseng was mainly gained
from relationships among kinship and other networks within and across communities.
Culturally, religious practices and cultural-based festivals help to maintain people’s
connections especially for HH’s belonging to the same village but nevertheless with
distances of about one to two kilometers between them. Although it is difficult for people to
connect with others living far away (maybe one or two kilometres), religious practices are
mostly held in the temple which is considered as the centre of the village and is the place for
people to meet each other. Moreover, there are other ceremonies and festivals held in the
village that also give the people the chance to see each other. Religious ceremonies,
festivals, and ceremonies relevant to way of life which take place throughout the year (see
details in Table 4.8) enable the HHs to strengthen relationships with each other.
All HHs agreed that familiarity made it easier for them to share ideas and learn from
each other. In the context of an agrarian society, land use strategy is an important issue that
they discuss. This includes the situation and problems of each alternative land use.
Moreover, the conversations were extended to techniques used in the plot, price, marketing
and relevant policies. All HHs confirmed that they could get more information about
alternative crops like oil palm from these activities. For several HHs (C l, 02, 03, 06, P I, P2

103
and P3), they eventually changed their land to cultivating oil palm because of the
suggestions and best practices from relatives and friends.
Visiting relatives living in remote communities and meeting with other HHs in various
activities offers a valuable opportunity for HHs to share and learn about the livelihood of
their kinship group in different contexts. Most HHs in Chianyai and Prasseng normally visit
their relatives approximately twelve times a year. Some HHs (C2 and C3) reported that they
could get inspiration about livelihood strategy and bring this to apply in their HH. In the
context of land use strategy, the HHs C2 and C3 stated that they were impressed by the
advantages of oil palm cultivation while visiting their relatives in remote areas. This
influenced them to bring oil palm trees to try to grow at their home and finally to expand the
cultivation plot for commercial purposes.
In the case of formal meetings, these are held by community leaders or government
organizations to deliver government policy and knowledge to HHs and collect the opinions
and needs of HHs in response to the government. Community meetings are commonly held
once a month at the centre of the village. Meetings with government organizations might be
held both in the village and at the organization’s office. All village members are invited to
participate in community meetings whereas selected village members, who are often either
formal or informal community leaders, are invited for meetings with the government
organisation. These meetings normally provide opportunity for participants who have
interest in specific issues to contact the government organisations for more details. The
selected village members who frequently participated in these meetings (C2, C3 and P I)
reported that they were informed about government agricultural policy and about the action
plans that the regional organisation would implement. Moreover, they agreed that the
meeting allowed them to gain personal connection with experts in the government
organisation for guidance about crop production. HH C3 reported that academic facts
provided by the expert in the government organization made the HH confident that
cultivating oil palm in paddy areas is possible. HHs C2 and PI also reported that training
about farm management, such as fertilizer application, made the farmers confident that
cultivating oil palm with scientific knowledge would result in effective output. Based on these
circumstances, all HHs said that the confidence they got from this guidance influenced them
to expand area for oil palm cultivation.

E0
.QE0EQ .32O )"Oc0
8
ü0
0'üoCON
0SUH
U
E•üo
î
T3CD)
0O<n0 1—
.t; 0> 0
>«o0 0
en0 00 Eo 4—>n H -en u
0 0F S iL
Bb3
_c S
CO
CM
CM
CM
CM
CM
CO
CM
CM
If i
CM
in
lO
lO
CO
CM
CO
TJC0
CD
O
.2 ¥ü (0 0 CO
i lë 3 s “0 S i
11
CM
CM
CM
CM
CM
CM
CM
CO
lO
CM
CM
CM
CM
OCM
lO
CO
CM
lO
OCO
lO
c0Ec0>oO)
£enc
io4—>
CDC
C0 00 O)
o
Q .32O)0
! fQ . O )
O
104
CM
CO
CM
CO
CM CM
CM CM
T>0W0
S i"cDCg0CL38o
■a0en0
S i0ooCO

Bc0 E 2
81i0
x :0■ocCDCO51CD3CCCD
8c0 E2
8•ocCD
§1CO3g
I00
0)SiCD
C0
1 0 wX20‘b1Û
w0g wü . 22 ' cQ .w3
0E2
.0 0B} ü
■30 c
X 0
11B
b
Bsz"3"33
m
o o
wz sc0E>>
S i•320>0■30EE0
. cQ0 3
03 ) 4-*
_c B" cB
y0
0 E3 )0 3
CDC B■30 ü
en
IIm m
II
l un iI I I
"3
2 ®£ |c g
3 )_C! c01w
f" 3"33CÛ0
3 )C
1OE0EE
88c
0
o.E-g
IICÛ O
Co E
CD C 3
CD X :I -
CO
il '
0 0. 3 x:
•33 ) " 33 3
CÛ000 X :
E4—><4—
0 0E 3 )E 30 '0ü 0
80G
3 •30 3
000 "3JO00 E
3B 0sz■3■3
Z_3)
3 "3CÛ 0
ro
£coE
CDC
_3
"cD
S
"2CfZ0“0. 3■3■3 B3CÛ 3
CD0 0
33 ) B3 0
■■g ê0 G.
i3
EE 8g 00
E8 E3 00 3
00 00 33 -t—»0
. 1G)23
■3 0■3 ü3 .2CÛ ■3
3—3
IO3 )Ç"cç
'S ’.Q0
3 )
!Ç "O 0 -3g 3 ^ CÛ■ffi milDû
COE
CDC
_3
CDX :I -
êcooE3 )
_Ç"c0
0
C
- E 'E 2 B
■3B - 2 0
0 E 0 3
■3 c 0
2
üco B i-
c Q . 0 - O i_
§
lîi0 - 0 0îii0 1 - g) g o_____O) o
l l ' p
c o E
0 c3
m'I-0 0
I
3 )CTOC00
3 )C
?0E
8ci0w.0owsz■3■33CÛ
1
üg
i i 0 >»
i Z
U1 1 CD G
.Q E B 0
8 B 0 -2
IIB O )
IICÛ o 0 o
i| :II
0
i îfc X iS;§0 p .
II
3 .ûci■3 00 üf i1 w— E
ililCÛ £
< 1
I■3ü
10Q .W
0Q .CD
00
0E•3G .■3C0
I
.23
3 )3 0•33■3 ■q .0 03.0 g'3 CD32 0
3
1 B
B 04-*ü
0 0M— G .0 2E 203 3 )
3E3 ■g-
G .20G . 00 >0G . . 2
g 0
B03
E G h -
<LO
I
<CO
IIU)co
CD
ilIi3 )Co£2
5
105

03CC8
0 0
03f
IIê -o
l ï0 0 ü £
300C0
8
ê£
f3> »
I
I0
3O3
g23I -
D) C
I E
1 06
3O305323I -
3OE2
8
2033
C
8E
ICD3O "
i
■gCD
C
8E
CD
£c
8ECDCCD£c
8ECDjC
88sza.
ICD
SZ
c
i§CD
8ECD
SZ
•sCD
üEQ .CD
■O
i"O
i■8ICD3CCCD
fOECDCD
CD
“
g

107
In terms of formal groups, a summary of membership and details of social groups in
Chianyai and Prasaeng mentioned by HHs are shown in Table 4.7 and 4.8 respectively. The
nature of the group that HHs participate in can be classified into three main types: financial
based, occupational based and social based.
The significant formal group both in Chianyai and Prasaeng is the financial based
group. There are three main types of groups mentioned by the HHs. These are village and
urban community fund, agricultural cooperative and saving cooperative (see details in Table
4.9). Every HH (except C l) is a member of at least one local financial group. The HHs
reported that these groups facilitated access to the credit used for household liquidity and
investment. Several HHs agreed that most money used for circulating fund in farming (C4,
C5 and C6 ) was derived from local financial institutions whereas some HHs used money
from this source to keep for unexpected urgent future needs in farming and business (P2
and P4). Among the financial institutions, the village and urban community fund is most
popular. HHs C4, C5, C6 , P2 and P4 have become members of the community fund in order
to be eligible to get credit from the fund. All members of the fund suggested that the
popularity of the fund is due to its having the cheapest interest rate (about 2 to 6 per cent
depending on the regulations of each fund). However, each member obtained a small credit
from the fund because the fund supported by the government (one million Baht) was shared
by several borrowers. Some HHs (C5 and C6 ) reported that credit from the fund (30,000 to
40,000 Baht) was not enough for use in farming which required double or triple the amount
of credit provided by the fund.
In order to get enough money to use for household liquidity and farming, the HHs
agreed that becoming a member of other local financial institutions could make them eligible
to get credit in difficult times. However, these institutions set higher interest rates than the
village fund. The range of interest rates reported by HHs using these credits was 7 to 24 per
cent depending on the regulations of the institution and their collateral. However, using
credit from these institutions is popular because the process of credit operation is less
complex than in other financial institutions like banks. Most financial groups normally require
only a personal guarantee which the borrowers would usually obtain by grouping together
with others and making a cross guarantee between them. Although the interest rate is
higher than the rate of commercial banks, the HHs preferred to use the services of local
financial groups because of the ease of credit access.

108
Table 4.9 Institutions and groups in Chianyai and Prasaeng
Group name Focus of the groupVillage and urban community fund
The objective of the fund is to enable people to have access to low cost money to develop and create new occupations. The people in the village can apply to be members. The members can get a loan if the loan application is approved by the committee. The money used in the fund was supported by the government depositing one million Baht in the fund. In addition, the money in the fund can be derived from members’ deposits and outsourced loans.
Agriculturalcooperative
The objectives of the cooperative are to 1 ) promote members' thrift, 2) provide loans, 3) provide agricultural inputs and daily necessities, 4) promote appropriate farm practices and technology and 5) support members to obtain higher prices and fairness by marketing products together
Saving cooperative The objectives of the cooperative are to promote savings among members and provide loan funds for productive investment. The cooperative normally offers the members two types of savings; share and deposit. There are currently three types of loans available: emergency loans, ordinary loans and special loans.
Communityenterprise
The enterprise is a group of people (at least seven people) gathering in order to produce goods and services by using resources in the community for generating income and self-sufficiency.
Animal raising group The objectives of the group are to 1) promote appropriate farm practices and technology and 2 ) create a network to support marketing
Provincial oil palm farmers association
The objectives of the association are mainly to promote appropriate farm practices and technology, and maintain benefit and fairness for the members.
Elderly club The objectives of the club are to promote physical and mental health and create a network among the elderly.
Monasterycommittee
The objectives of the committee are to plan, organize and support the monastery affairs and use monastery properties
Educational institution committee
The objectives of the committee are to advise and support affairs of the institution
Some HHs reported that they are members of occupation based institutions. The
institutions mentioned by the HHs are agricultural cooperative, community enterprise, animal
raising group and provincial oil palm farmers association. Similar to the occupation based
groups, there are a few social based groups which the HHs applied to join. These consisted
of a club for the elderly, monastery committee and educational institution committee. It can
be clearly seen that the occupational and social based institutions are not popular. This is
because the HHs thought that they could gain benefits expected from these groups from

109
informal networks. For example, they can improve their production by learning from their
friends or kinship network. Moreover, they could gain the connection with others by
participating in informal meetings with other HHs on many occasions.
To sum up, social networks and connections are an important determinant
influencing land use change. The HHs have opportunity to share and learn innovation,
technology, best practice and government policy via various forms of both formal and
informal networks and connections. Information gained from these social activities is likely to
make the HHs confident and make it easy to decide to change their land use to oil palm.
(4) Physical assets
Although access to land and natural resources and sufficient labour are obviously
important for HHs in an agrarian society, it is difficult for HHs to gain maximum income if
they lack physical assets. Physical assets play an important role in influencing success of
land use because they can enable HHs to reduce the limitations of land condition and to
increase their capacity to generate income both inside and outside agriculture. Physical
assets might be used as direct tools in agricultural production, sources of income from rent
or paid employment, or collateral for HHs to maintain liquidity. In this study, physical assets
can be divided into five categories: house, agricultural tools, transport, processing and
livestock. A summary of the total value of capital assets in these five categories is shown in
Table 4.10.
The most outstanding point in the table is the very high value of assets for C3
compared with the other HHs in Chiayai and Prasaeng. It is not surprising because the HHH
of C3 is a professional entrepreneur. He owns a vast area of land for oil palm and prawn
production and his businesses are well managed so it is easy to see how his wealth has
been accumulated. The poorest HH of all the ten is C6 whose combined assets are less
than 450,000 Baht which is only a fraction of the assets of the wealthiest (approximately 25
million Baht).
Several HHs said that the wealth of HHs is an important factor influencing their
capacity to change their land use to the way they prefer. In Chianyai, HHs with a high value
of assets (C2 and C3) reported that it is not difficult for them to switch their abandoned

110
and/or paddy areas to oil palm cultivation because their owned assets are able to facilitate
them in obtaining money for investing in oil palm. Conversely, HHs with a low value of
assets (05 and 06) reported that it is very difficult for them to switch paddy area to oil palm
by using money from owned assets. The HH 06 who changed some paddy area to oil palm
confirmed that one way to gain large amounts of money to invest in oil palm is by borrowing
money using personal assets and land as a guarantee.
Land owned by the HHs is an asset which reflects the wealth of HHs. The HHs with a
larger area are obviously wealthier than the HHs with less land. However, it is difficult to
evaluate the value of lands because their prices are dependent on various factors. These
include the location, geography and the assets constructed or crops grown on the lands.
Because of this complexity, it is difficult for the HHs to report the exact value of their lands.
In order to obtain the real value, real estate agents or experts are required for this task. With
the limitation of this study, valuation of every piece of land of all the HHs was impossible.
Therefore this study has to exclude the value of land from the physical asset. However, the
wealth relevant to the land can be interpreted from the amount of land owned by HHs. All
HHs agreed that land is an important asset used as collateral for accessing credit or
obtaining loans. All HHs (except C3 and C4) reported that the loans that they got from the
financial institution have been approved because of using land as collateral.
In terms of capital assets supporting agricultural production, it can be clearly seen
that every farming HH (except C l) has agricultural equipment. The value of assets varies
and is dependent on the amount of land a HH has and the return that the HH expects from
investment. HH 03 clearly has the highest agricultural equipment value whereas HH 01 has
no investment in equipment. Looking at the value of agricultural equipment per unit of
occupied area, it can be seen that HH 04 invested very much in each unit of land. HH 04
stated that the owned capital assets influenced the land use strategy that the HH chose. The
HHH reported that the high investment in tools and equipment influenced the HH to continue
to cultivate paddy because using this equipment enabled the HH to reduce the cost of
production and provide extra income for the HH when this equipment was used for
employment.

TOCD
"cID
ISCD
■-S3•DO
OC0
%3
1O
XJ
u
CO
N
CO
§O)
CO
CO00
lOI::lO
CO
o'
s
111
co%Ü2Q .CDTJO)cU—ic3
8œ
I03
!cg3u
03
I0O )
§
1
03
Iroc
: go
T3O
0Q .> ,CroJOo0
1 £&
■O
"OofE0c
co■S
gCD
c0
• e£Q .0
"DT3.2JO3E3
8003
10O
■O =oII 0
.5 )
I ^Bc
Id

112
In the case of transport, every farming HH has transport although the value varies
according to the wealth of the HH. However, the value of transport might not reflect the
sense that they can be employed to generate income. Most transport is used for making life
of the owner more comfortable. In terms of processing, most HHs do not invest in this,
especially in Chianyai. This reflects the fact that farming output will be sold without more
processing. This is different from in Prasaeng where HHs invested in machines to transform
rubber latex into rubber sheet. Although this process can add value to the rubber, it is not
currently popular because the transformation gives only a small margin. It is not worth the
additional labour and time spent on the process, therefore most of the machines are
unused.
Livestock is another asset that can generate income for HHs. Every farming HH
(except C l, PI and P2) has livestock. HH C3 clearly has much more livestock than the
others. Farming livestock is considered the main investment of the HHs C2 and C3 whereas
farming livestock of the other HHs is an option when they have free time from their main
occupation. HHs C2 and C3 reported that using some land for raising livestock could make
the HH able to gain extra income. Profit gained from livestock production (especially in the
case of C3) also made the HHs more secure in terms of income diversification and gave
them more flexibility to spend this income in the way that they prefer. HH C3 confirmed that
success in switching a vast area from paddy and abandon to oil palm was the result of
having sufficient money to invest of which the main source was income from the sale of
prawns.
In summary, physical assets are an important determinant influencing land use
decisions. Physical assets as well as owned land can be used as collateral for HHs to get
loans from financial institutions to invest in crop production. This enables HHs to be more
flexible in switching the land without worrying about their HH cash flow. However, the high
investment made in tools and equipment for cultivating specific crops, especially paddy,
influenced HHs to prefer to continue to use land for that crop rather than switching to others.
This is because the HHs are able to reduce the cost of cultivation and to generate extra
income when their tools and equipment are used for employment.

113
(5) Financial assets
Financial capital is an important asset relevant to financial resources used by a HH
to achieve the HH’s objectives. Table 4.11 is a summary of HH flows of money including
income and expenditure presented as absolute amounts and a percentage of the total.
Moreover the HH balances (income - expenditure) are also shown.
In terms of HH budget, the income of most HHs in Chianyai and Prasaeng (except
HH 01, 02 and P2) was mainly derived from crop sales which represented between 61 and
85% of total income. The rest was largely from paid employment and the sale of livestock.
For other HHs, the main income of 01 is derived from their own business (about 95%)
whereas the main income of 02 and P2 is derived from paid employment (59% and 62%
respectively).
Regarding crop sales, some HHs relied on only one crop while others are diversified
and so derive income from various crops. In Chianyai, three HHs (04, 05 and 06) are
dominated by only paddy crop sales (56 to 85% of total income) and HH 03 relied mostly on
oil palm sales (67% of total income) whereas two HHs gain income from two crops: paddy
and oil palm for HH 02 and oil palm and other for HH 01. In Prasaeng, three HHs (P I, P2
and P3) diversified their source of income from both rubber and oil palm whereas one HH
(P4) relied only on rubber.
Paid employment is also significant in many HHs. It comprised 14 to 59% of total
income for four Chianyai HHs (02, 04, 05 and 06) and 17 to 62% of total income for three
Prasaeng HHs (PI, P2 and P3). Sale of livestock is very significant for HH 03 for which it
accounted for 33% of income and is of little significance (1 to 8 %) for three HHs (02, 06 and
P3).
Expenditure of most HHs in Chianyai and Prasaeng (except HH 01 and 06) was
mainly for farm labour and tools which comprised between 17 and 83% of total expenditure.
Expenditure for labour and tools is particularly high for 03 because of investment in large
areas of oil palm and prawn production. However, expenditure is quite low for 06, P3 and
P4 because they mostly use HH labour for crop production.

S Iro00
sC00
■DC00
■Oc0
t0E8W
XX
0
Ü
O
Iir
oLU
o O Oo o O(D o OCO o COO CN
114
m

115
03C
'Co
ü
"4"0
roa:
o m

116
Comparing all the HHs, the percentage spent on food (2 to 36%), clothes (about 1 to
4%), community fees (1 to 8 %) and transport (3 to 30%) varies quite widely. Expenditure for
food is very high for HH 03 (360,000 Baht) and 02 (200,000 Baht) because 03 has to
provide food for many labourers working in his plots and three HH members of 02 live and
work in the city where the cost of food is very high. Expenditure for education varies
according to the number of HH members of school age and their level of study. The
expenditure of HH PI is very high because two children are studying at undergraduate level.
Expenditure for health is quite high for some HHs: P2 has to spend money for heath care of
a disabled daughter, while 01 and P4 both have to pay for periodic health checks to monitor
a chronic disease of a HH member. Expenditure for house and maintenance is significant for
three HHs especially 02 as their children rent accommodation to live in the city. For HH 01
and P4, a lot of expenditure is for their own businesses that accounted for 6 8 and 48% of
total expenditure. This expenditure is very high because a tremendous amount of money is
needed to invest in and run their businesses.
Expenditure for debt payment is an item which concerned all HHs (except 03) and
comprised between 1 and 51% of total expenditure. These expenditures vary according to
the amount of debt and capacity of HHs to pay. Very much of the expenditure of HH 02 and
quite a lot of the expenditure of HHs 01 and PI are used for this payment because of the
huge amount of borrowed money which requires the HHs to pay a lot of principal and
interest. However, due to their capacity to pay, the HHs could afford that. For HHs who lack
the capacity to pay or want to maintain the money for their own liquidity, they choose to pay
only the interest (C4, C5, P3 and P4) or the interest with some of the principal (C6 and P2).
The difference between income and expenditure indicates that the balance of
budgets is varied and there is a wide range between them. HH C3 has the largest balance
which is nearly 50 times that of C6 , the HH with the smallest balance. Although, in the years
when this survey took place, all HHs have a positive balance, many HHs reported that they
have to borrow more money to maintain HH liquidity and run their farming and/or own
business. This illustrates that the balance that the HHs gained is not sufficient for HH
spending needs. Borrowing is common for all the respondents except C3. Although HHs
reported that they have some savings to draw on in hard times, they still need to borrow
money for use in different ways (see Table 4.12). The HHs with small balances (C5 and C6 )
suggest the balance that they obtain each year is not enough to invest in farming in the next

117
crop season and/or for their living expenditure. Therefore, they have to borrow money to
tune the balance of the HH. However, debt in many HHs is used for other purposes. HH C l
and PI borrowed money for house construction, HH P4 used his credit for liquidity in his
own business, HH 04 and P2 invested the borrowed money in agricultural tools whereas
HHs 02 and 06 used credit for investing in oil palm production. Although the objective of
borrowing is identified when the application form for borrowing is submitted, several HHs
reported that the money sometime was used for other urgent objectives. The examples are
for paying initial debt, health care and children’s education.
In the agrarian context, the budget balance is an important financial source for investing in
crop cultivation. In this study, all HHs confirmed that their budget balance was an important
factor influencing the success of land use switching. Several HHs who continue to cultivate
paddy (C4, C5 and C6 ) reported that their budget balance was normally enough for the
cultivation of the next crop, so they would not worry about financial problems if they continue
to cultivate paddy. However, they would face financial difficulty if they switched paddy
cultivation to oil palm by using money from the budget balance. A few reasons were
mentioned for this difficulty. Firstly, their low balance was not enough for investing in oil palm
cultivation because HHs have to spend a lot of money especially for land preparation and
baby oil palm trees. Secondly, the HHs might lack liquidity if switching from paddy to oil palm
because they have to wait for a long time to harvest the output. While paddy can be
harvested within three or four months, oil palm normally starts giving output approximately
30 months after planting in the plot and it does not give full output until it is five years old
(DOA, 2008). In this situation, cultivating oil palm without enough money to invest could
make HHs suffer because their income would be reduced for several years while waiting for
the income from oil palm.
Conversely, HHs with a high budget balance (02, and 03) confirmed that their
budget balance facilitated them to switch land from abandoned and/or paddy area to oil
palm. The HHs agreed that most of the money for investing in oil palm derives from their
savings which were accumulated from the HH’s balance. Nonetheless, they also reported
that the profit gained from harvesting the first plot of oil palm becomes an important financial
source for investing into new plot(s). According to this situation, HHs who have a low budget

2
a!
o!
CDo
o
o
o
o
o
ooo
goooo"M-
OOoo"00
oooo“o
oooo'
oooooco
O)
Icros0)■oXXCN
0)
E-0
1 O).(0
.o s
eu00
3EEosccoc
II
ooo
<N
ooog
118
i lo CD o
osoo
o8os
soo
oooo"oo
o8sN-
ooosoCD
Q .3o
8
I

119
balance but want to switch paddy areas to oil palm (C6 is an example of this case) have to
borrow enough money for investment especially in land preparation. Moreover, the HH has
to maintain liquidity. HH C6 reported that switching could be done in some of their own land
because the HH needs to use the rest and more rental land to cultivate paddy in order to
gain a sufficient lump sum and sufficient regular income to maintain the liquidity of the HH.
In conclusion, HHs’ cash flow is an important determinant in land use switching. Due
to the fact that oil palm cultivation requires much money to invest especially in land
preparation and farmers have to wait for a long time until harvest, savings and capacity to
access credit are very helpful in starting oil palm cultivation. This makes HHs without
enough liquidity still continue cultivation of traditional crops especially paddy.
4.3 Vulnerability Context
With regard to the vulnerability context, several external environments have a direct
impact on HH livelihood. They are outside HH control although some are slightly predictable.
In this study, the main vulnerabilities reported as factors influencing HH livelihood are
flooding and price trends.
(1) Flooding
Flooding is a serious problem for farming. The success of farming is not only
dependent on land quality but also on water. Uncontrollable water supply might limit the
potential of using land for crop cultivation. Too much or too little water supply from rainfall is
raised by all HHs as a serious issue for paddy farming in Chianyai. Based on annual rainfall
statistics in Figure 4.1, it can be clearly seen that rainfall is a primary cause of variation of
water supply. Annual rainfall was extremely high in some years (2006, 2007 and 2009)
whereas it was extremely low in other years (1981, 1985 and 1992). Flooding is seen as a
big problem for Chianyai HHs because it occurs more frequently than drought. With its
geophysical plain landscape, the Chianyai area becomes a collecting area for the large
volume of water caused by the monsoon bringing rainfall between September and
December. Although the Pakpanang river finally flows to the Gulf of Thailand, the monsoon,
which often brings heavy storms, raises the sea level too high, making it nearly impossible
for water to drain to the sea.

120
All Chianyai HHs, both those who used to and those who currently grow paddy,
consistently said that unpredictable rainfall and uncontrollable water supply causes them to
face livelihood hardship. Due to low tolerance of flooding and drought, the longer paddy is
flooded or lacks water, the greater the damage the HHs experience. In the case of oil palm
cultivation, HHs who switched paddy to oil palm agreed that uncontrollable flooding was one
of the main reasons influencing them to switch the land use. The physical characteristics of
oil palm tree means that it is more tolerant against flooding than paddy. Although flooding
can be a serious problem when oil palm is young and would be likely to have a negative
effect on palm oil production, mature trees are tolerant of and able to withstand temporary
flooding (Lee and Ong, 2006).
Year2011
2009
2007
2005■ JA N
2003 ■ FEB
1999
1997
1995
2001 ■ M A R
■ A P R
■ M A Y
■ JU N
■ JU L
1993 B A U G
1991 ■ SEP
B O C T
B N O V
■ B DEC
1989
1987
1985
1983
1981
1979 _________ __________ __________ Rainfall
0 500 1,000 1,500 2,000 2,500 3,000 3,500 (m illim eter)
Figure 4.1 Annual rainfall in Nakhon Si Thammarat province
Sources: Unpublished data of meteorological department of Thailand, OAE (2012d)

121
HHs continuing with paddy cultivation suggested that uncontrollable flooding is an
extremely serious problem. Although considered to be beneficial when it provides a suitable
amount of water and occurs at the right time, flooding can totally damage a crop if it comes
with a massive amount of water and occurs at times when crops are still growing. Moreover,
the level of damage from flooding is dependent on which production period is affected by
flooding. Flooding at the beginning causes less loss than flooding near the end of the
growing period. HHs would lose only the seed cost at the early period but much more
accumulated costs would be lost if flooding occurs towards the end of production. In order to
avoid these risks, several HHs preferred to switch their paddy land to oil palm because
flooding would cause less damage to oil palm than to paddy, as oil palm trees can survive
after flooding. Although the output would be temporarily decreased, the tree could be
restored to be productive again.
In Prasaeng, flooding was also mentioned as a factor influencing land use strategy
especially in lowland areas. In terms of topography and geography, lowland areas store
water in the rainy season. In the past, although these areas were used for paddy rice
cultivation, it was abandoned after paddy cultivation became unpopular. Several HHs
reported that low and flooding areas are not suitable for cultivating rubber. Although the
main reason was soil condition, flooding for a long time in this area would limit and destroy
root systems and finally cause rubber trees to die. All HHs agreed that oil palm is possible in
this area because the soil condition is suitable and flooding could be beneficial for trees
which want a lot of water like oil palm.
(2) Price trend
Although HHs prefer to gain maximum profit from cultivation, allocating land for
growing crops to gain this outcome is not easy because there are many factors which are
difficult to predict. One of them is the price which the HHs wili get when the crops are
harvested. Due to uncertainty of the price, all HHs said that they have to predict the trend in
price and they also agreed that price trends in the past are a main factor influencing their
decision of land use. They reported that the crop with a high price is welcomed by HHs
because it makes it possible to gain more profitability and finally improve their livelihood.
From this situation, it can be clearly seen that price and its trend are important factors
determining strategies which HHs apply to their land.

122
All HHs in Prasaeng reported that the trend of rubber price was an important factor
influencing them to continue rubber cultivation. They agreed that the growth of the rubber
price makes it more popular than other crops. The trends in the market price of paddy,
rubber and oil palm in Figure 4.2 and 4.3 clearly show that the rubber price was quite stable
before 2001, apart from a slight peak in 1995. After 2001, the rubber price increased
dramatically. Although there was a bit of a drop in 2009, the price then peaked in 2011
before dropping significantly in 2 0 1 2 .
In the last ten years, the dramatic rate of price increase made rubber production
more profitable. Compared to oil palm and paddy, the net income of rubber attracted
farmers to pay more attention to rubber. According to income, cost and net income shown in
Figures 4.4 and 4.5, the increasing rubber price made net income of rubber increase
dramatically even though there was a drop in 2009. The difference is very explicit when
compared to paddy net income especially after 2001. In the case of oil palm, there was not
much difference in net income between oil palm and rubber before 2005. This was a reason
why oil palm used to be as popular as rubber. However, this situation changed after rubber
started to give a much higher net income than oil palm. This difference made rubber more
popular than oil palm and became the most important factor influencing HHs in Prasaeng to
give priority of land use for rubber cultivation.
In addition, high net income derived from high price influenced farmers to change
their land use plan. All farmers in Prasaeng stated that the high price influenced them to
delay felling old rubber trees for replanting new ones. Although farmers were able to gain
less output, harvesting latex from old rubber trees favoured the farmers because they could
gain a worthwhile net income from the high price. However, when the trees no longer
produced enough latex, they finally felled the old rubber trees to start a new rotation and the
land continued to be used for rubber cultivation.
In the case of paddy, the overall trend in price shows an increase. Before 1995 the
price was quite low. However, after that, the price increased significantly until 1998 before
continually dropping until 2001. After 2001, the price increased continually. Although there
was a significant drop between 2009 and 2010, the price then peaked in 2011 before a
significant fall in 2012. The price of paddy was a factor influencing farmers’ decisions about
land use. The low price forced farmers to look for other jobs to gain enough money for their

123
Price(Baht/tonne)
140,000 1
120,000 -
100,000 -
80,000 -
60,000 -
40,000 -
20,000 -
I LOO) COoR
COO)O) O) §oO)Ioo o
•Paddy
•Rubber
•Palm
Figure 4.2 Price of unmilled paddy, rubber sheet and fresh fruit of oil palm between 1987 and 2 0 1 2
Source: Unpublished data, OAE (2012b)
Note: Price of 2012 derived from average price of January 2012 to September 2012
Price(Baht/tonne)
12,000
10,000
1,000
6,000
4,000
2,000
I iinG )O) I
COooinoo
O)oooo o
•Paddy
•Palm
Figure 4.3 Price of unmilled paddy and fresh fruit of oil palm between 1987 and 2012
Source: Unpublished data, OAE (2012b)
Note: Price of 2012 derived from average price of January 2012 to September 2012

124
HHs. In the past, some paddy areas both in Chianyai and Prasaeng were abandoned or
rented out because paddy production was not profitable. This situation is confirmed by the
overall net income of paddy (see Figures 4.4 and 4.5) which shows that the farmers
generally gain a small net income and sometime make a loss from paddy cultivation.
However, some HHs reported that they could make a large net income from paddy
cultivation. This is because they could reduce the cultivation cost by using their own labour,
tools and equipment and taking advantage of irrigation systems that facilitate them to
cultivate paddy twice or three times a year. In addition, government policy in the last five
years made several farmers in Chianyai confident to continue cultivating paddy. This is
because the policy forced the paddy price to be increased. Moreover, financial assistance
was made available if paddy was destroyed by natural disasters.
Oil palm was considered to be the crop giving the lowest price among the three
crops. Although the overall trend in the oil palm price was increasing, it lacks attraction to
farmers who succeed in rubber cultivation. In the situation when the rubber price went very
high, oil palm might be chosen to be cultivated only where the land characteristic is not
suitable for growing rubber. In the same way, the oil palm price is not much important factor
influencing farmers to adopt oil palm to grow in paddy areas. Due to significant increase in
paddy price, HHs who want to gain lump sum revenue from the higher price still continue to
cultivate paddy. Switching paddy to oil palm could not be adopted by the these HHs
because the low price of oil palm would give HHs a small income at each time of harvesting
which sometimes would not be enough for maintaining the liquidity of HHs.
However, there is a financial advantage to oil palm compared to paddy cultivation.
More frequent income from oil palm harvesting (every 14 to 16 days) was mentioned by
several HHs as an important factor influencing them to switch from paddy and/or abandoned
area to oil palm. Although it would provide less lump sum income than paddy, oil palm is
attractive to some HHs because it could provide continuous income and help HHs to escape
the risk from uncontrollable flooding. Moreover, it is also a good alternative for HHs who lack
the capacity for paddy farming as a result of becoming elderly. However, the HHs reported
that they have to cultivate on a large scale because oil palm has a low price. The larger
scale of cultivation enabled HHs to have more output to compensate for the low price to gain
the necessary income.

125
Baht/Hectare200,000 1
150,000Paddy income
Paddy cost
Paddy net return
100,000
50,000
CN(50,000) -J
a. Paddy
Baht/Hectare200,000 1
150,000Rubber income
100,000 Rubber cost
Rubber net return50,000
(50,000) J
b. Rubber
Baht/Hectare200,000
150,000
100,000
50,000
(50,000) J
'Palm income
■Palm cost
■Palm net return
c. Oil Palm
Figure 4.4 Annual income, cost and net income of paddy, rubber and oil palm cultivation
Source: Unpublished data, OAE (2012c)

126
Baht/Hactare
130,000 1
110,000 -
90,000 -
' Paddy net return
■■■ Rubber net return70,000 -
Palm net return50,000 -
30,000 -
Year10,000 -
-10,000 J
Figure 4.5 Annual net income of paddy, rubber and oil palm cultivation
Source: Unpublished data, OAE (2012c)
To sum up, vulnerability contexts have played an important role in land use
decisions. Climatic variation results in oil palm, which is more tolerant against flooding, being
adopted for cultivation instead of paddy. In addition, the dramatic increase of the price of
rubber and increasing paddy prices supported by government intervention motivated the
HHs to continue rubber and paddy cultivation without switching to oil palm.
4.4 Policy and institutional context
Although land use decisions are influenced primarily by HH’s assets and vulnerability
context, they also depend on the policy and institutional context which could limit the
environmental damage and support the capacity of HHs to utilise land in the way that the
HHs prefer. The relevant policies and institutions have been summarised in Chapter 2. The
policy and institutional context mentioned by the HHs in this study are infrastructure
development, government assistance and farmers’ institutions.

127
(1) Infrastructure development
The types of infrastructure mentioned by the HHs as factors influencing land use
decisions are transportation and irrigation systems. These systems are very important
because they facilitate the transport of the input and output of farming, and provide sufficient
water supply for cultivation.
1 . 1 Transportation development
Transport and roads were mentioned as an important factor enabling farmers to
switch their land use. HHs agreed that lack of transport and roads were an obstacle to land
switching. It is necessary to have roads to make the fields accessible by vehicles for
transporting machinery to them and the output from the fields to market.
Transportation was mentioned as a key factor that allows HHs to choose which crops
to cultivate, especially when deciding whether the HHs should change their land to oil palm
production. Transport is very important in oil palm cultivation because harvesting of oil palm
is frequent and the fresh oil palm bunches are heavy. Lack of transportation can cause
farmers to face difficulties. In Chianyai, for example, HH 05 cannot switch paddy to oil palm
because the land is blocked by the land of others. Without permission from neighbouring
land owners to construct a road passing through their lands which they are presumably not
willing to give this, it is impossible to change the land to plant oil palm.
In terms of distance between plot and market, HHs in Prasaeng reported that they
preferred to grow oil palm because there are oil palm crushing mills located near their plot
sites that make it easy for farmers to transport fresh palm bunches to sell at the mills. In
Chianyai, oil palm was not popular initially, because of the difficulty of transporting the fresh
bunches the factory was too far away. However, after developing public roads both intra-
and inter-district, and constructing oil palm bunch collection centres and palm oil crushing
mills near the plot, some farmers (C2 and C3) started oil palm cultivation because they could
afford the transport cost and still gain sufficient margin thanks to decreasing transportation
costs. The relationship between transportation and the popularity of oil palm cultivation in
Chianyai can be clearly seen in Figure 4.6. There are several oil palm bunch collection

128
WXrOTI
tOOO-TE i
100 15VE I
99xnrt «•■«S’Crt loo-otrt lOO'IStTE
Figure 4.6 Transportation, oil palm planting area, collection centre and palm oil crushing mill
in Nakhon Si Thammarat
Sources: Transportation data from LDD (2009b),
Oil palm planting area from LDD (2009a), and
Palm oil crushing mill from OITNP (2012)

129
centres in the study area at the present time. The HHs reported that this situation is different
from the past because the centres were located far away from Chianyai district. However,
after the centres were constructed nearer their plots, the HHs were able to cultivate oil palm.
1.2 Irrigation development
In the case of irrigation systems, it is necessary for HHs to have the right amount of
water at the right time for use in their plot sites especially for paddy that needs to be flooded
throughout most of its period of growth. In the past, the area of the Pak Phanang river basin
covering the Chianyai area had faced problems with water supply, especially the serious
impact of flooding in the rainy season and fresh water shortage in the drought season.
These problems resulted in low productivity, poverty and labour migration. In order to deal
with the problems, an irrigation development project was launched by the government.
Several floodgates were constructed to block branch canals to store water for the drought
season. In addition, several drainage canals were dug to drain excess water in the rainy
season to the sea.
These investments made paddy cultivation more productive because the problems
caused by water supply were alleviated. These developments have particularly helped
farmers who have plot areas in the irrigation system to cultivate more than once a year.
Several HHs could take advantage of this and continue to cultivate paddy without changing
to alternative crops. However, some HHs thought that the developed irrigation system
provides strong infrastructure support for oil palm cultivation. The HHs switching their paddy
and abandoned areas to oil palm cultivation reported that it is necessary to have plenty of
water supply for oil palm cultivation. The oil palm plot in irrigated areas could gain an
advantage by irrigating their plots with water from the river and branch canal.
(2) Government assistance
2.1 Natural disaster assistance
As mentioned previously, HHs are vulnerable to natural disasters especially flooding
which causes them to lose most or all of the output from cultivation. Regarding disasters in
paddy cultivation, the government launched a financial assistance scheme to alleviate the
damage from flooding by providing compensation for famers so they could replant the crops.

130
Although it cannot cover the total value of losing output, several HHs (C4, C5 and C6 )
reported that compensation could help them to start cultivation immediately after the
flooding has gone. This money could help HHs to have better liquidity for replanting because
the compensation is normally enough for the cost of seed, fertilizer and land preparation. All
HHs said that this compensation is a factor determining their decision to continue cultivating
paddy.
2.2 Financial support
Liquidity of HHs for replanting crops in new rotation (i.e. replacing old stock) is a
problem of concern to the government especially for crops which mean that famers have to
wait for a long time for the first harvest, like rubber (six to seven years). Because of the
special characteristics of the market for rubber product which is mainly for export, the
government, through ORRAF, established a relief fund by accumulating a fee charged from
rubber exporters and use it for supporting rubber farmers especially in replanting. All HHs
who cultivate rubber agreed that they prefer this support. They also reported that they will
continue cultivating rubber as long as possible because they can gain financial support from
ORRAF every time they replant rubber.
However, the flexibility of the fund facilitated HHs who were not successful in rubber
cultivation to change to oil palm. HHs who switched their land from rubber to oil palm
reported that changing conditions of the relief fund made them easy to change their land
uses. According to the relief fund’s conditions, the fund originally supported only rubber
farmers who would like to replant rubber, whereas switching land use from rubber to other
crops was not eligible to receive support from the fund. Based on this condition, farmers
who grew rubber in unproductive areas mostly persisted in replanting rubber because they
could gain assistance for replanting. However, after the condition was changed to cover the
assistance for land switching from rubber to oil palm, some rubber farmers did not hesitate
to switch their land to oil palm. The farmers reported that the support from the fund was
enough to invest in oil palm so they could finance the cost of this. Although this was the last
time for the land to obtain support from the fund, because land used for cultivating other
crops is not eligible for the support from the fund, the farmers also stated that they preferred
this choice because the land characteristics were more suitable for oil palm than rubber.

131
2.3 Price guarantee
As mentioned previously, paddy production is an important agricultural sector in
Thailand’s economy because it is relevant to a large share of the population. However, most
paddy farmers are facing poverty due to low prices and lack of capacity to negotiate in the
market. In order to increase the quality of life of paddy farmers, the government has
launched a policy to intervene in the market to maintain a high price. The policy influences
the overall paddy price to increase continually. Several HHs agreed that the policy launched
by the government influenced their decision to continue paddy cultivation. Although the low
quality of their paddy makes it nearly impossible for farmers to obtain a guaranteed price,
they still favour the policy because they could gain more income from the increase in the
overall price.
(3) Farmers’ institutions
Farmer institutions were reported as an important factor influencing alternative land
use. In this study, there are two farmer institutions mentioned by HHs as a driver
determining their land use decisions. These are an agricultural cooperative and an oil palm
farmers association.
In the case of farmers’ institution supporting paddy cultivation, the agricultural
cooperative seems to be the institution which could make a major contribution to paddy
farmers. This is because the agricultural cooperative was established to strengthen the
farmers in many ways (see details in Table 4.9). However, accomplishing these objectives is
not easy especially in complex groups. Two HHs in Chianyai (02 and 03) reported that they
are quite disappointed by the performance of the agricultural cooperative. Although the
cooperative had a good performance in some objectives, they were considered to have
failed in the important objective of enabling members to get higher prices. According to the
principles of the agricultural cooperative, it should enable members to market products
together in order to obtain higher prices. However, the cooperative could not help the
members to wait and market together. This is because all farmers harvest their paddy crops
at the same time and they have a high moisture content which causes damage if they are
stored for a long time. Moreover, for the cooperative to collect a large quantity of paddy
products and wait for a higher price is very difficult because it requires a drying system and

132
storage space. Although government subsidized the cooperative in investing in a drying
system and storage, it could not support the large amount of products from all members.
The cooperative could collect only some paddy which is not enough to gain power in setting
a higher price than the price offered by private mills.
HHs believe that this circumstance means paddy farmers lack an institution for
gathering and cooperating with other paddy farmers, and resulted in them having little or no
power to negotiate for their benefit. Although there are many paddy farmers, lack of well-
organized and professional institutions would mean that most negotiations were dependent
on the decisions of millers who play an important role in pricing. HH C2 said that the farmers
who remain members of the agricultural cooperative are people who expected to gain other
benefits (such as credit) instead of a high price of paddy which the cooperative should
contribute to members. HH C2 and C3 also agreed that lack of an institution to negotiate a
fair price for farmers is a factor influencing the HHs to change their land to other uses such
as oil palm cultivation and animal production.
In terms of farmers’ institution supporting oil palm cultivation, the Oil Palm Farmers
Association was mentioned by the HHs as a factor influencing their land use strategy.
Regarding the markets for both oil palm and palm oil, the HHs (C2, C3 and P I) believe that
the association seems to have potential in maintaining benefit and fairness for the members.
This is because palm oil is mainly produced for using in the country. Although palm oil
crushing mills have their own oil palm plantation, the fresh oil palm output is not enough for
their demand. Therefore the mills have to buy enough oil palm from farmers to fill the
capacity of the mills. The HHs believe this situation makes the mills compete for buying oil
palm used in the mills and the oil palm farmers could gain the benefit if the association is
well organized in negotiations.
As a farmer would gain benefit from performance of the association, the HHs also
believe that the committee of the association is made up of professional farmers who have
invested in large areas of oil palm cultivation and expect valuable profits. Therefore, the
operation of the association under these professional committees could achieve the
objectives of the association. Moreover, HH PI in Prasaeng, a member of Surat Thani oil
palm farmers’ association, believed that cooperation between the provincial associations
would strengthen the association at national level to be powerful in negotiations with

133
relevant organizations in order to maintain fair benefit especially in favourable prices for oil
palm farmers.
Based on these situations, some HHs in Chianyai (02 and 03), who changed their
land to oil palm, stated that institutions of oil palm farmers have more power to negotiate in
the market than of paddy farmers and it makes sense to stop cultivating paddy for
commercial purpose. In addition, one HH in Prasaeng (P I) agreed that the potential of the
association made them confident in switching unproductive rubber area to oil palm
cultivation.
In summary, land use decisions were dependent on policy and institutional contexts.
The HHs choose crops to cultivate with regard to the advantages they can get from
infrastructure and the assistance provide by the government. HHs decide to continue paddy
cultivation because of advantages of having an irrigation system, natural disaster assistance
and output price guarantee. Continuing rubber cultivation was supported by financial support
whereas switching to oil palm cultivation was facilitated by transportation development and
financial support. In addition, farmers’ institutions are an important factor influencing land
use decisions. The confidence that the farmer association could maintain fair benefit to
farmers was mentioned as a factor supporting switching to oil palm.
4.5 Land use strategies
This section presents various patterns of land use strategies that could be identified
from the above analysis. According to livelihood assets, vulnerability context, and policy and
institutional context, HHs adopted the most appropriate strategy for their land. Six land use
strategies relevant to this study cover: continuing paddy production; switching paddy to oil
palm production; continuing abandoned land; switching abandoned area to oil palm
production; continuing rubber production; and switching rubber to oil palm production.
4.5.1 Continuing paddy production
All HHs in Chianyai have direct traditional experience with paddy cultivation.
However, some of them have totally or partly changed their land from paddy to other uses.
The common characteristic of HHs continuing paddy cultivation is those having low
balances (income over expenditure). The HHs mostly rely on revenue from paddy

134
cultivation. Four HHs, (C2, C4, C5 and C6), are applying this strategy. Three HHs, (C4, C5
and C6), mainly concentrate on utilizing most land for paddy cultivation (65-100%) whereas
C2 use a small area for paddy production (4%). Their revenue gained from paddy from each
crop production was normally spent on the new crop production and for sustaining the HH
while waiting for new revenue from the next production. The balance was very low
especially in HHs C5 and C6.
Lack of long term liquidity is a major constraint making it impossible for many HHs to
switch their land to oil palm. Normally oil palm requires about two to three years before the
first output will be harvested and full production is obtained after six years. Therefore it is
necessary for HHs to have much money for investing and maintaining HH liquidity while
waiting for output. For HHs with low balances, it is difficult to secure a sustainable livelihood
in the long waiting period if they change paddy land to cultivate oil palm. Therefore they
have to stay in the same production system to sustain their livelihood. Continuing paddy
production is suitable for the HHs in this group because they can gain lump sum income in
the short run and they can get advantages from irrigation systems, short-term financial
credit, government policy and assistance and keeping output for their own consumption.
(1 ) Short-term lump sum income for HHs’ liquidity
Land is allocated for paddy cultivation because it can be harvested in a shorter time
and it can provide lump sum income. Several HHs (04, 05 and 06) strongly agreed that
these advantages allow HHs to have enough liquidity for their expenditure. In order to gain
more income, these HHs rented paddy areas of others to cultivate. This strategy is applied
based on the logic that the more the area, the more output will be provided, which means
the more revenue that HHs can gain. Renting area for paddy cultivation is popular among
paddy farmers because the rental cost is very cheap compared with the income that farmers
can obtain.
(2) Irrigation supporting paddy cultivation
Farmers in areas with an irrigation system can gain advantage in paddy cultivation
because they are able to increase the number of times of cultivation in each year. With the
system provided by the government, some HHs in Chianyai (C4, C5 and C6) can cultivate

135
paddy twice or up to three times a year. This situation favours the HHs because the more
times that paddy is grown means the more revenue that farmers can gain.
(3) Short-term financial credit for reinvestment
Although some HHs (C5 and C6) have low balances, they can gather money for
growing paddy continually. It is not difficult for HHs to borrow money from a financial group
because they are members of various groups and have the right as members to borrow
money. Moreover, the loans given to farmers are short term (about one to three months) so
it is easy for the group to provide them with the loan. HHs normally employ the loan in crop
production and the debt will be paid after the rice output is sold. Moreover, HHs can receive
credit from fertilizer sellers who allow farmers to pay after the paddy is cultivated. However,
the price is normally higher than buying with cash but it is a good choice for farmers with
cash flow problems.
(4) Government policy and assistance for HHs security
Although climatic variation and price fluctuation make paddy farmers suffer, policy
and assistance launched by the government enables HHs to cope with these vulnerabilities.
HHs with low budget balances (C5 and C6) reported that the policies such as revenue
guarantee for paddy farmers, paddy price guarantee and financial assistance for paddy
farmers affected by flooding, influenced them to continue to cultivate paddy. These policies
were considered to be beneficial for them because they can gain a price higher than the
market price by price guarantee or have more stable revenue via the revenue guarantee
policy. Moreover, financial assistance for paddy farmers affected by flooding provides some
money at least for investing in new production. The high crop price of paddy does not attract
only HHs with low balance but also one with a high balance (C4). The HHH reported that he
prefers to continue to cultivate paddy because he wants to gain benefit from the high price.
However, the government policy and assistance could not convince the other HHs who have
high balances (C l, 02 and 03). These HHs argued that the policies were not effective
especially in guaranteeing paddy price. Although the policies raised the paddy price, the
price that farmers gained was not high enough. Considering the risk from climatic variation,
paddy cultivation could not provide a favourable return for them. So they preferred to leave

136
the land abandoned (C l and C2) or switch to cultivate oil palm (C l, C2 and C3) instead of
continuing paddy cultivation.
(5) Own consumption
A respondent mentioned that cultivating paddy for household consumption
influenced the HH (C2) to continue paddy production. Specific local kinds of paddy were
chosen to grow consistent with farmer preference. However, cultivating paddy for household
consumption was not popular in other paddy HHs (C4, C5 and C6) as currently, they
cultivate paddy mainly for trading. Paddy rice for household consumption was bought in the
market. They stated that they do not prefer to eat the kind of paddy that they cultivate. This
is because it is very hard to chew and not tasty. However, the kind of paddy that they prefer
(Hom Mali) could not be cultivated effectively in their area because the texture and
fragrance of output are not as good as when it is cultivated in the original region (the
northeast of Thailand). Moreover, storage of paddy for their own consumptions is
demanding. The HHs have to have a barn for storing enough paddy for a year’s
consumption and have to transport it to a mill for removing the husk. Several HHs agreed
that it is too difficult for them to store paddy for their own consumption. They thought that
buying milled rice from the market was more convenient and enjoy with enabled them to
enjoy a higher quality of rice.
4.5.2 Switching paddy to oil palm production
After nearly twenty years since oil palm was introduced in Chianyai, oil palm has
become popular among HHs in the areas. Some HHs were interested in oil palm (02 and
03) for a long time before it was commercially cultivated in Chianyai. This interest was
derived from learning from the relatives they visited. However, commercial cultivation took
place after there were markets near the planting site which allow farmers to gain more profit
because of a decrease in transportation cost.
There are three HHs, (02, 03 and 05), applying this strategy. The common
characteristic of HHs switching paddy area to oil palm is that they have a high balance of
HH budget. They have various sources of income especially from the off-agrarian sector
(02) and/or high savings (02, 03) and/or gain huge profit from agricultural production (03).
This characteristic is almost essential for HHs adopting this strategy because the HHs need

137
to have sufficient resources for using while waiting for oil palm output. However, there is one
HH (C6) lacking sufficient budget for switching but trying to cultivate oil palm. This HH has to
borrow money from the bank for investment and rent more paddy area to cultivate paddy in
order to gain sufficient liquidity while waiting output from oil palm.
The most important motivations influencing HHs to switch land from paddy is to gain
continuing stable income in the long term. Although the oil palm price is quite low, switching
paddy to oil palm makes it possible for HHs to accomplish their objective with the
advantages of oil palm compared to paddy. They include oil palm being more tolerant
against climatic variation, more stable in price and less labour intensive.
(1 ) More tolerant against climatic variation
Natural shocks are one obvious factor that influences several farmers to switch their
land use especially from paddy to oil palm production. Climatically, paddy rice is less
tolerant than oil palm. Disasters from flooding and drought were reported as a shock in
paddy production. HHs 01, 02 and 03 pointed out that both too much and too little water
could totally destroyed paddy rice whereas oil palm could survive the same disaster
although the output in the subsequent time would be temporarily decreased. With bad
experiences from serious climatic variations, they changed their land use from paddy rice to
oil palm. Although the government has launched the policy of financial aid for farmers who
were affected by natural disasters, the HHs still reject continuing with paddy rice cultivation
because financial aid could not be comparable with their loss especially losses in the pre
harvesting period.
(2) More stable price
Respondents said that the seasonality of price can influence land switching
especially from paddy to oil palm. HHs C l, 02 and 03 reported that over supply and hurry to
sell paddy in the harvesting season influence farmers to accept low prices. Although several
policies were launched to make the paddy price higher and more stable, the HHs argue that
the policies were not effective because the price was finally set by the miller. Normally, after
harvesting paddy products have a high moisture content. This condition allowed the millers
to offer a price which is lower than the policy price to farmers. Being in a position where they

138
cannot bargain with the millers, paddy farmers normally obtained a price much lower than
their expectation. This situation influences paddy farmers to change their land to oil palm as
its price was considered to be more stable than the paddy price.
(3) Lack of capacity of HH labour
In the case of switching land from paddy to oil palm, HHs C l, C2 and C3 reported
that reduced capacity to work due to old age and lack of a new generation to inherit the
production was a crucial factor influencing them to change their paddy land for oil palm
cultivation. Although paddy production tends to be capital intensive as high technologies
have been adopted to substitute labour in most processes, the labour which is required for
paddy fields throughout the production period tend to not significantly decrease. With the
nature of paddy, which is sensitive and vulnerable to climatic variation and pest, it still needs
attentive care from the HH in controlling water and pest regulation as well as the technology
applications. Based on this situation, farmers have to spend time in their paddy fields
throughout the growth period or until the output was harvested. This situation differs from oil
palm. The more tolerant against climatic variation and the pest requires less afford of the HH
in looking after oil palm field. In addition, due to uses of labour in oil palm fields are
predetermined and periodic, it is easy to employ labour to work especially instead of the
owners.
4.5.3 Continuing to abandon land
Abandoned land is a strategy for HHs in Chianyai. There are two HHs, (01 and 02),
that are applying this strategy. Most of the lands that have been abandoned used to be used
for paddy cultivation in the past. Therefore, the reasons why the HHs abandon the land are
mostly the same as reasons why farmers stop cultivating paddy and/or change to oil palm.
The important reason is that they have high balances of HH budget from other sources of
income that provide enough money worth more than paddy cultivation. Additionally, they
might lack the capacity to work the farm and face problems with land characteristics.
(1 ) Have a high HH budget balance.
It is clear that HHs in this group (01 and 02) have high balances of HH budget and
have much income derived from off-farm sources. From this situation, they think that the

139
current work and land use can sustain their lives. In the case of C l, their own business is
the main occupation of the HH whereas land is considered to be an optional way for gaining
income. In the case of 02, the HH gains most revenue from paid employment. Although
another important source of revenue is derived from land use, some lands are left without
cultivation. The HHs are fine having income from current sources because they can provide
enough liquidity for the HHs. Using the rest of their lands is not necessary at the moment.
However they have plans to use these lands in the future. The lands are expected to be
used for paddy cultivation to gain more income for the HHs. The plan will be implemented if
HHs have more savings for investment (01) and have enough free time to devote to the
lands which will be expanded for oil palm cultivation (01 and 02).
(2) Lack of capacity for work
Lack of capacity for work is a factor that HHs mentioned as a constraint of further
land use. It can be clearly seen from the same characteristic of HH 01 and 02 that farming
labour is not enough for cultivating their own land. In HH 01, there are three members. Two
of them work mainly in a trading business whereas the other HH member is in school.
Moreover living far away from the plot site makes it more difficult for them to use the land.
So, farming is just optional work for this HH. For HH 02, although there are five members,
three children are highly educated and work currently far away from home whereas the wife
works as government employee, so the husband is left to work in the field. This situation
makes it difficult for the workers to cultivate all their own land. In order to cope with this
situation, the priority of land use is set. The fertile lands were firstly used whereas lands
unsuitable for farming are left and waiting to be used in the future.
(3) Unsuitable topography
Topography is mentioned as a factor influencing the decision for some land to be
abandoned. The HHs who occupied abandoned land reported that the topography of these
lands is not suitable for cultivation. In case of HH C l, their abandoned land is located in a
very low area and is easily flooded in the rainy season. The HH has plans to use this land
for oil palm cultivation. However the HH has to invest a lot of money in land preparation and
although the HH has a high budget balance, it is not enough for investment in the entire
area. Land at a suitable level was utilized first while the rest was abandoned and is waiting

140
for use when the HH has enough money to invest. For HH C2, the abandoned land is
located at a very high level far away from the irrigation system. Cultivating either paddy or oil
palm is not possible in this area because of the difficulty of bringing water to the plot when
lacking water in the drought season.
4.5.4 Switching abandoned areas to oil palm production
There are two HHs (C l and C3) in Chianyai who switched abandoned areas to oil
palm production. The most important motivations influencing HHs to switch abandoned land
to the cultivation of oil palm is to gain continuing additional income in the long term.
Basically, HHs who apply this strategy have high savings. Most of their money is deposited
in banks and financial institutions which give low returns from the interest. Due to low
returns, HHs try to invest in business to gain more return. Investing in crop cultivation is an
alternative way that interests them because they have abandoned areas. However, the
potential crop to cultivate is a factor finally influencing the HHs’ decisions. At the time that
paddy cultivation was the only way to use land, the HHs hesitated to use the land for
cultivation because they worried about inevitable problems caused by flooding and low
prices.
(1) Investing for additional income in the long run
The HHs agreed that land should not be abandoned if there is a way to use it for
gaining additional sustainable income. HH C3 bought the abandoned land when the HH
gained profits from prawn cultivation and the price of abandoned land was very cheap. After
buying it, the HH held the land for many years without cultivating any crops. However, after
the HH became confident that oil palm can be cultivated in paddy area and the oil palm
crushing mills were constructed near the plot, the HH did not hesitate to cultivate a vast area
of oil palm. Oil palm was chosen to be cultivated instead of paddy or other crops because of
its tolerance against climatic variations and its more stable price that can provide stable
additional income for the HH.
In case of HH 01, the abandoned area occupied by the HH was originally used for
paddy cultivation. The plots were initially switched for shrimp farming. However, after the HH
had much loss in the shrimp industry because of a disease outbreak, the land was left
abandoned. The land has never been reused for paddy cultivation because of worries about

141
climatic and price variations. After three years of abandonment, the HH needed to gain
benefit from the land. A large amount of money was invested for perennial plants. Pine and
oil palm were chosen for cultivation because of their tolerance to the climate. Now, the HH
realizes that oil palm cultivation is feasible to provide additional income for the HH in the
long term. Therefore, the HH is trying to collect money and has a plan to invest in oil palm
again when there is enough money.
4.5.5 Continuing rubber production
Rubber cultivation is popular in Prasaeng. All of the interviewees in Prasang apply
this strategy. The important motivations influencing HHs to continue cultivating rubber are to
gain high income, government assistance and the easy of hiring labour.
(1 ) High margin from high price
Profitability of land use is one obvious factor that determined the activity that farmers
or land owners preferred. All HHs stated that they preferred to cultivate rubber if possible.
This is because the prices of its product (latex or rubber sheet) have increased continually in
the last ten years and stood at a high price so the farmers could gain high profits from its
cultivation. Moreover, the farmers agreed that selling the rubber tree wood at the end of
each rotation will give them a huge lump sum revenue. However, the price of latex and
rubber sheet decreased dramatically in 2012. Although income was decreased according to
the low price, rubber farmers had no thoughts of changing their land use because they still
obtain profit although it was decreased.
Moreover, although land is considered to be unsuitable for rubber, one respondent
(P4) rejected changing their land to cultivate oil palm. The HH preferred to invest in
improving low land and preventing white root disease instead of switching to oil palm. The
reason which farmers reported for non-switching were higher profitability of rubber
production.
(2) Ease of labour hire
Labour availability was mentioned as a factor influencing farmers to continue to
cultivate rubber even though the soil is not suitable. HHs P3 and P4 reported that one

142
reason that makes the HH continue to cultivate rubber in unproductive areas is the difficulty
of hiring labour to work in oil palm plots especially in the harvesting period. Although there
are labourers available to be hired, the employment might not be attractive because the
wage rate for oil palm labour is comparatively low while the work, especially in harvesting, is
considered to be harder than for rubber production.
It is easy to employ labour for rubber production because of the conditions of
employment and the motivation of the wages. Labour was normally employed to work every
day, long term, and assigned to work in all activities in the plot including weed control,
fertilizer application and harvesting as well as transforming rubber from latex to rubber
sheet. In the case of latex harvesting, the wages paid to a labourer was dependent on the
quantity of rubber latex harvested and its price. The labourer normally obtained 40-50% of
the value of the rubber that they harvested. With the high price of rubber, labour therefore
preferred to work in rubber rather than in oil palm plots.
(3) Government assistance for replanting
Assistance for inputs and cash subsidized by ORRAF was reported to be an
important factor influencing the farmers to replant rubber. ORRAF normally supports
smallholders in suitable areas with assistance for inputs and cash before the trees come into
production. The farmers can gain assistance when they cut unproductive rubber trees and
start a new crop rotation. It can be guaranteed that they would continually obtain aid from
the fund as long as they still continue to cultivate rubber.
4.5.6 Switching rubber to oil palm production
Because of the profitability of rubber cultivation, all farmers said that they preferred to
cultivate rubber if possible. However, some land might not support this. Switching rubber to
oil palm production is a strategy that HHs apply when their lands were uncultivable and
unproductive for rubber cultivation. This strategy was adopted by most of the HHs in
Prasaeng (except P4) with the expectation of generating more income by utilizing
unproductive land for rubber and taking advantage of government support.
(1 ) Unproductive land for rubber

143
The substitution of rubber by oil palm is based on the serious problems related to
land condition. When rubber faces white root disease and/or red root disease, land
switching will happen rapidly because infected rubber trees cannot drip latex and tend to
die. In the case of rubber in unproductive areas and without root disease, switching will
occur slowly because farmers still gain the income from tapping the latex and the value
added of the bigger wood although unproductive. The rubber will be switched to oil palm
when the rubber trees are big enough for the farmers to be able to gain a good price for the
timber.
(2) Government assistance for switching
In case of farmers switching from rubber area to oil palm, they mentioned that the
changing of government policy made it easy for them to change the use of their lands.
Although it is necessary to use much money for investing in oil palm, switching rubber to oil
palm is recently not as difficult as in the past because farmers can now gain assistance from
ORRAF. After the policy of ORRAF was revised to extend assistance to cover land switching
from rubber to other crop like oil palm, it made it easier for farmers who used to continue to
replant rubber in unproductive areas to switch their land to oil palm. Some rubber farmers
reported that they did not hesitate to switch their land to oil palm after the policy changed.
4.6 Conclusions
The cases that were demonstrated in this chapter represent an overall mechanism in
decision making of the farmers in Chianyai and Prasaeng in adopting strategies of
alternative land use. The findings suggest that several factors are important and these are
shown in Table 4.13.
In terms of expected outcomes of land uses, it can be seen that the HHs prefer to
obtain a return consistent with the HHs’ financial status. Maximum profit is the ideal outcome
that all HHs seek. Other types of outcome are lump sum income and continuous income.
The first income was sought by HHs who need to circulate their liquidity whereas the second
was sought by the HHs who need to have more security of income. Moreover, the findings
also show non-money return for land use in which HH continues cultivating paddy for the
HH’s own consumption.

144
Table 4.13 Factors influencing land use change: evidence from livelihood study
Aspects Outcome Asset Vulnerabilitycontext
Policy and institutional context
Financial - Profit- Lump sum
income- Continuous
income- Own
consumption
- Saving for investment
- Credit for investment
- Trend of price- Price stability
- Policy of price- Government
subsidy
Naturalresource
- Topography- Water supply
- Disease and pest
- Flooding
- Disaster assistance
Human - Capacity of HH labour
- Accessibility of employed labour
Physical - Tools and equipment
- Land rights
- Transportation development
- Irrigation development
Social - Networks and connections
- Farmer institutions
Regarding the capacity to manage the land in the way that HHs preferred, the
findings showed that it is dependent on HH assets and resilience to deal with vulnerability
contexts, and policy and constitutional contexts. Several factors influencing HHs’ success in
directing land use were found and shown as follows:
Financial factors: Price trend and availability of financial sources were important
factors determining which crops could be cultivated. It is clear that the HHs used their land
in the way consistent with price trends and market intervention and government assistance.
The dramatic increase in rubber prices and replanting assistance influenced rubber to be
popular in Prasaeng whereas price intervention and disaster assistance from the
government made paddy still popular in Chianyai. In addition, savings and capacity to
access credit are important determinants in the success of land use switching. This is
because they were very helpful in starting crop cultivation especially for crops which require
much money to invest and a long wait until harvest like oil palm.

145
Natural resource factors: Soil conditions, water supply, climatic condition and
disaster government assistance are important determinants identifying which crops are
suitable in an area. In Prasaeng, although all HHs preferred to use as much land as possible
to cultivate rubber, the shallow nature of some land and the appearance of diseases in the
soil forced them to switch from rubber to oil palm. In Chianyai, while most lands that have
easy access to enough water supply were continually used for paddy, the damage caused
to paddy by uncontrollable flooding finally influenced some paddy lands to be switched to oil
palm which is tolerant against flooding. However, some HHs continued to cultivate paddy
without worrying about flooding because they preferred to rely on the disaster assistance
support from the government. In addition, land right is another factor obstructing land
switching. It can be clearly seen in the case of rented land for paddy in Chianyai and land
owned by government but allocated for farmers to cultivate rubber.
Human resource factors: The availability of both HH labour and employed labour are
important determinants of choosing crops for HHs to cultivate. In Chianyai, paddy areas
tended to be switched to oil palm because it requires less labour intensive in farm
management. This trend was consistent with the decline of HHs’ labour because of the shift
to an elderly population and migration of new generations to the city for studies and work. In
addition, the difficulty in employing labour in Prasaeng made some HHs continue to use
their land for rubber although it was unproductive.
Physical factors: The number of HHs’ tools and equipment and public infrastructure
have played an important role supporting the success of land use. The HHs’ use of their
tools and equipment helps them to reduce the cost of cultivation and to generate extra
income. Moreover, the HHs’ wealth derived from physical assets enables them to be more
flexible in switching the land without worry about the HHs’ liquidity. In terms of public
infrastructure, irrigation development enabled HHs to choose to cultivate paddy because of
enough water supply and being able to have several crops each year. In addition,
transportation development enabled some HHs to cultivate oil palm because of convenience
and reduced transportation cost.
Social factors: Social networks and connections were very important in influencing
land use change. Many forms of networks and connections have become an instrument to
give opportunity for HHs to share and learn innovation, technology, best practice and

146
government policy. This has clearly made HHs more interested in alternative crops,
especially oil palm, and more confident that switching land to cultivate oil palm would return
better financial outcomes.

147
CHAPTER 5
QUANTITATIVE ANALYSIS OF FACTORS INFLUENCING
LAND USE CHANGE
5.1 Introduction
This chapter presents the results on the factors influencing farmers’ decisions as to
whether to cultivate oil palm trees or not. As mentioned previously in the methodology
chapter, the results were derived from a questionnaire-based survey with 180 households
(HHs). The purpose of the study was to gain an understanding as to why oil palm cultivation
is adopted successfully in intended areas like abandoned areas and unintended area like
paddy areas while not successfully in other intended areas like rubber areas. The survey
was conducted with HHs in three areas with different predominant land uses. These are ‘the
predominantly paddy area’ in Chianyai and Ranote, ‘the predominantly rubber area’ in
Prasaeng and Bannaderm, and ‘the predominantly abandoned area’ in Chalermprakiet and
Sathingpra, as shown in Table 5.1.
In Table 5.1 the HHs are classified into various subcategories by two additional
conditions: whether the HHs cultivate oil palm or not; and what land use strategies have
been adopted by the HHs. Based on the condition whether the HHs cultivate oil palm or not,
the HHs in each area category were classified into two subcategories: oil palm grower (OP
Grower) and non-oil palm grower (NOP Grower). In total there were 119 HHs and 61
respectively. Moreover, HHs were also classified into six subcategories based on six land
use strategies consisting of: 1) continuing paddy cultivation; 2) switching from paddy to oil
palm cultivation; 3) continuing rubber cultivation; 4) switching from rubber to oil palm
cultivation; 5) continuing leaving land abandoned; and 6) switching abandoned area to oil
palm cultivation. Due to there being several land use strategies adopted by each HH, it is
necessary to note that Table 5.1 excludes some land use strategies which were not of
interest to this study. Therefore the table presents only combinations of the land use
strategies being studied, as mentioned above. Some overall details about using land for
other purposes and other land use strategies were discussed in sections 5.2 and 5.3. In

148
addition, as HHs might have adopted more than one land use strategy, it should be also
mentioned that the total of HHs in each land use strategy might not equal the sample size.
This chapter firstly describes current land use, combinations of land use and tracks
the pattern of land use change. Secondly, the chapter presents the results of quantitative
analysis of differences in HH characteristics between oil palm growers and non-growers.
Finally, the chapter presents the results of factors influencing farmers’ decisions in each
category of land use strategy.
Table 5.1 Combinations of land use strategies
Landcategories/
Districts
Samplesize
Oil palm grower categories Land use strategies
OPgrower
NOPgrower
Continuingpaddy
cultivation
Switching paddy to oil palm
cultivation
Continuingrubber
cultivation
Switching rubber to oil palm
cultivation
Continuingleaving
landabandon
Switching abandon area
to oil palm cultivation
Predominantly paddy area
Chianyai 30 24 6 21 18 - - 3 9Ranote 30 15 15 26 15 - - - -
Predominantly rubber area
Prasaeng 30 27 3 - - 29 12 - 15Bannaderm 30 20 10 - - 29 6 - 14
Predominantly anandoned area
Chalermprakiet 30 30 - 1 8 - - 4 22Sathingpra 30 3 27 19 1 - - 30 2
Total 180 119 61 67 42 58 18 37 62
Note: Each HH might adopted more than one land use strategy
5.2 HHs’ current land use and combinations of land use
Table 5.2 shows the combinations of land uses of respondents in each area.
Regarding size and share of current land uses, Table 5.3 shows the frequencies and means
of land use of OP growers and NOP growers in each category. For the means of size and
share of land use, the table does not present only the overall mean of land use but also the
conditional means of land use excluding the HHs who do not apply the type of land use
being considered. The results indicate that the respondents have allocated their land in

149
different ways. Some of them use all of their land only for one purpose while the others
allocate their land to several purposes.
Table 5.2 shows clearly that land uses of OP growers in every area are more
diversified than those of NOP growers. One reason that could explain this situation is, as the
results show in Table 5.3, the size of areas occupy by the farmers. It is clear that farmers
who occupy more land tend to diversity their land more than those with smaller lands. The
difference is very significant in the rubber areas category where the group of farmers with
more diversification of land use (NOP growers) occupy on average 7.31 Ha of land, which is
three times the land area of farmers with less diversification (OP growers) (2.42 Ha).
Table 5.2 Numbers of OP growers and non-growers applying different combinations of land
uses
Unit: Number of HHs
Combinations of land uses
Predominantly paddy area
Predominantly rubber area
Predominantly abandoned area
OP grower (n=39)
NOP grower (n=21)
OP grower (n=47)
NOP grower (n=13)
OP grower (n=33)
NOP grower (n=27)
Paddy only - 20 - -
Rubber only - - - 13 - -
Abandoned only - - - - - 11Oil palm only 12 - 2 - 21 -
Paddy and abandoned - - - - - 16
Paddy and oil palm 24 - - - 1 -
Paddy and others - 1 - - - -
Rubber and oil palm - - 45 - - -
Oil palm and abandoned 1 - - - 4 -
Oil palm and other - - - - 4 -
Paddy, oil palm and abandoned 2 - - - 3 -
In terms of combinations of land use. Table 5.2 and 5.3 show that all or nearly all of
NOP growers use all of their land only for one purpose, for paddy cultivation in the
predominantly paddy areas (95% of NOP growers), and for rubber cultivation in the
predominantly rubber areas (100% of NOP growers). The average size of paddy areas of
NOP growers in the predominantly paddy areas and of rubber areas of those in the
predominantly rubber areas is 4.85 Ha and 2.42 Ha respectively. For the predominantly
abandoned areas, even though some lands were left abandoned, the rest of the land is only
for paddy cultivation (100% of NOP growers, with an average size 0.89 Ha). In the case of

150
OP growers, Table 5.2 points out clearly that land uses especially in the predominantly
paddy and rubber areas were diversified by allocating some land to oil palm cultivation. The
combinations of land uses of paddy and oil palm, and of rubber and oil palm are the main
trends in the predominantly paddy (62% of OP growers) and rubber (96% of OP growers)
areas respectively. The average sizes of areas of paddy and oil palm of OP growers in the
predominantly paddy areas are 3.25 and 3.77 Ha respectively and of rubber and oil palm of
those in the predominantly rubber areas are 4.09 and 3.22 Ha respectively. However, it
seems that land uses of some OP growers especially in the predominantly paddy areas
(33% of OP growers) tend to be concentrated only on oil palm. Similar to this concentration,
even though their land uses were more diversified than NOP growers, OP growers in the
predominantly abandoned areas tend to use their land only for oil palm cultivation (64% of
OP growers) while the rest is for paddy cultivation, other purpose and leaving abandoned.
The average size of oil palm area of NOP growers in this category is 3.11 Ha.
5.3 Tracking of land use change
Tables 5.4 to 5.6 shows the information on land uses and their changes for the
respondents in each area category. For the criteria to consider whether the land use have
been changed or not, the land is identified to be changed if the present use is different from
the latest initial use. On the other hand, the land is identified to not be changed if the present
use is similar to the latest initial use. The results show that most OP growers have tended to
switch some of their land to oil palm, while all or most NOP growers continue to use their
land in the same way or leave it abandoned.
In Table 5.4, it can be seen that all or most of NOP growers in the predominantly
paddy (95%) and rubber (100%) areas continue to use all land for paddy cultivation or
rubber cultivation, as they did initially. In contrast, most NOP growers in the predominantly
abandoned areas continue to use some lands for paddy cultivation, as they did initially and
leave some lands, which used to be used for paddy cultivation, abandoned (59%), while the
rest of the NOP growers leave all lands, which used to be used for paddy cultivation,
abandoned (41%).

151
Table 5.3 Size and share of current use of land occupied by OP growers and NOP growers
Land uses
Predominantly paddy area
Predominantly rubber area
Predominantly abandoned area
OP grower (N=39)
NOP grower (N=21)
OP grower (N=47)
NOP grower (N=13)
OP grower (N=33)
NOP grower (N=27)
N % n % n % n % n % n %Paddy cultivation
Size of paddy area0.00 Ha 13 33 - - 47 100 13 100 29 88 11 410.01-1.00 Ha 1 3 1 5 - - - - - - 8 3-1.01-2.00 Ha 5 13 3 14 - - - - 1 3 4 152.01-3.00 Ha 3 8 4 19 - - - - 3 9 1 43.01-5.00 Ha 9 23 5 24 - - - - - - 3 11More than 5 Ha 8 21 8 38 - - - - - - - -
Total 39 100 21 100 47 100 13 100 33 100 27 100Mean of paddy area size of all HHs
3.25 Ha (n=39)
4.85 Ha (n=21)
0.00 Ha (n=47)
0.00 Ha (n=13)
0.26 Ha (n=33)
0.89 Ha (n=27)
Share of paddy area as % of total area
0.00% 14 36 - - 47 100 13 100 29 88 11 410.01-25.00% 9 23 - - - - - - 2 6 6 2225.01-50.00% 9 23 - - - - - - 2 6 6 2250.01-75.00% - - - - - - - - - - - -
75.01-99.99% 7 18 1 5 - - - - - - 4 15100% - - 20 95 - - - - - - - -
Total 39 100 21 100 47 100 13 100 33 100 27 100Mean of the share of all HHs
46%(n=39)
100%(n=21)
0%(n=47)
0%(n=13)
7%(n=33)
51%(n=27)
Rubber cultivationSize of paddy area
0.00 Ha 39 100 21 100 2 4 - - 33 100 27 1000.01-1.00 Ha - - - - 2 4 2 15 - - - -
1.01-2.00 Ha - - - - 13 28 4 31 - - - -
2.01-3.00 Ha - - - - 6 13 4 31 - - - -
3.01-5.00 Ha - - - - 13 28 2 15 - - - -
More than 5 Ha - - - - 11 23 1 8 - - - -
Total 39 100 21 100 47 100 13 100 33 100 27 100Mean of rubber area size of all HHs
0.00 Ha (n=39)
0.00 Ha (n=21)
4.09 Ha (n=47)
2.42 Ha (n=13)
0.00 Ha (n=33)
0.00 Ha (n=27)
Share of rubber area as % of total area
0.00% 39 100 21 100 2 4 - - 33 100 27 1000.01-25.00% - - - - 16 34 - - - - - -
25.01-50.00% - - - - 16 34 - - - - - -
50.01-75.00% - - - - - - - - - - - -
75.01-99.99% - - - - 13 28 - - - - - -
100% - - - - - - 13 100 - - - -
Total 39 100 21 100 47 100 13 100 33 100 27 100Mean of the share of all HHs
0%(n=39)
0%(n=21)
56%(n=47)
100%(n=13)
0%(n=33)
0%(n=27)

Table 5.3 (continue)
152
Land uses
Predominantly paddy area
Predominantly rubber area
Predominantly abandoned area
OP grower (N=39)
NOP grower (N=21)
OP grower (N=47)
NOP grower (N=13)
OP grower (N=33)
NOP grower (N=27)
N % n % n % n % n % n %Leaving abandoned
Size of abandoned areaOHa 36 92 21 100 47 100 13 100 26 79 - -
0.01-1.00 Ha 1 3 - - - - - - 2 6 19 701.01-2.00 Ha 1 3 - - - - - - 1 3 8 30More than 2 Ha 1 3 - - - - - - 4 12 - -
Total 39 100 21 100 47 100 13 100 33 100 27 100Mean of abandoned area size of all HHs
0.11 Ha (n=39)
0.00 Ha (n=21)
0.00 Ha (n=47)
0.00 Ha (n=13)
0.48 Ha (n=33)
0.87 Ha (n=27)
Share of abandoned area as % of total area
0.00% 36 92 21 100 47 100 13 100 26 79 - -
0.01-25.00% 2 5 - - - - - - 2 6 4 1525.01-50.00% 1 3 - - - - ■ - - 4 12 6 2250.01-75.00% - - - - - - - - 1 3 6 2275.01-99.99% - - - - - - - - - - - -
100% - - - - - - - - - - 11 41Total 39 100 21 100 47 100 13 100 33 100 27 100Mean of the share of all HHs
2%(n=39)
0%(n=21)
0%(n=47)
0%(n=13)
12%(n=33)
49%(n=27)
Oil palm cultivationSize of oil palm area
0.00 Ha - - 21 100 - - 13 100 - - 27 1000.01-1.00 Ha 5 13 - - 15 32 - - 7 21 - -
1.01-2.00 Ha 9 23 - - 12 26 - - 10 30 - -
2.01-3.00 Ha 4 10 - - 3 6 - - 4 12 - -
3.01-5.00 Ha 11 28 - - 11 23 - - 6 18 - -
More than 5 Ha 10 26 - - 6 13 - - 6 18 - -
Total 39 100 21 100 47 100 13 100 33 100 27 100Mean of oil palm area size of all HHs
3.77 Ha (n=39)
0.00 Ha (n=21)
3.22 Ha (n=47)
0.00 Ha (n=13)
3.11 Ha (n=33)
0.00 Ha (n=27)
Share of oil palm area as % of total area
0.00% - - 21 100 ■ - - 13 100 - - 27 1000.01-25.00% 20 52 - - 32 68 - - 5 15 - -
25.01-50.00% 6 15 - - 10 21 - - 5 15 - -
50.01-75.00% - - - - - - - - - - - -
75.01-99.99% 1 3 - - 3 6 - - 2 6 - -
100% 12 31 - - 2 4 - - 21 64 - -
Total 39 100 21 100 47 100 13 100 33 100 27 100Mean of the share of all HHs
53%(n=39)
0%(n=21)
44%(n=47)
0%(n=13)
79%(n=33)
0%(n=27)

Table 5.3 (continue)
153
Land uses
Predominantly paddy area
Predominantly rubber area
Predominantly abandoned area
OP grower (N=39)
NOP grower (N=21)
OP grower (N=47)
NOP grower (N=13)
OP grower (N=33)
NOP grower (N=27)
N % n % n % n % n % n %Using for other purposes
Size of the other area0.00 Ha 39 100 20 95 47 100 13 100 29 88 27 1000.01-1.00 Ha - - 1 5 - - - - 2 6 - -
1.01-2.00 Ha - - - - - - - - 2 6 - -
More than 2 Ha - - - - - - - - - - - -
Total 39 100 21 100 47 100 13 100 33 100 27 100Mean of the other area size of all HHs
0.00 Ha (n=39)
0.01 Ha (n=21)
0.00 Ha (n=47)
0.00 Ha (n=13)
0.09 Ha (n=33)
0.00 Ha (n=27)
Using for other purposes (continue)
Share of area with other purposes as % of total area
0.00% 39 100 20 95 47 100 13 100 29 88 27 1000.01-25.00% - - 1 5 - - - - 2 6 - -
25.01-50.00% - - - - - - - - 1 3 - -
50.01-75.00% - - - - - - - - 1 3 - -
75.01-99.99% - - - - - - - - - - - -
100% - - - - - - - - - - - -
Total 39 100 21 100 47 100 13 100 33 100 27 100Mean of the share of all HHs
0%(n=39)
0%(n=21)
0%(n=47)
0%(n=13)
2%(n=33)
0%(n=27)
Mean of total area size of all HHs
7.13 Ha (n=39)
4.86 Ha (n=21)
7.31 Ha (n=47)
2.42 Ha (n=13)
3.94 Ha (n=33)
1.76 Ha (n=27)

154
For OP growers especially in the predominantly paddy and rubber areas, Table 5.4
indicates that they continue to use some or all land(s) in the same way as their initial uses
and switched some of them and/or abandoned and other land for oil palm cultivation. In
order to diversify their land use, most OP growers in the predominantly paddy area switched
some paddy areas and/or all abandoned areas to oil palm cultivation. Similarly, NOP
growers in the predominantly rubber area switched some rubber areas and/or all abandoned
areas to oil palm cultivation. However, it can be seen that some OP growers in the
predominantly paddy rubber areas tend to concentrate only on oil palm cultivation. They
switched all rubber or paddy and/or abandoned areas to only oil palm cultivation. Similarly,
this pattern of switching was very widely adopted by OP growers in the predominantly
abandoned areas. They switched all or most of their areas to oil palm while maybe leaving
some of them abandoned.
According to initial land uses and how they have now changed as shown in Table 5.5
and Table 5.6, it can be seen that each land use has changed differently from initial to
present uses. The significant change was in abandoned areas and areas that used to be
used for other purposes. All of them were switched to oil palm cultivation except some
abandoned areas in the predominantly abandoned area which were switched to other
purposes. Plots initially used for paddy cultivation were commonly changed in the
predominantly abandoned areas. Most of it was left abandoned (36%) and switched to oil
palm cultivation (34%) while some continues to be used for paddy cultivation (30%).
However, it seems that plots initially used for paddy cultivation in the predominantly paddy
area were changed less than those in the predominantly abandoned area. Most of them
continue to be used for paddy cultivation (64%) while some of them were switched to oil
palm cultivation (34%) and the rest were abandoned and used for other purposes. For plot
initially used for rubber cultivation, it can be clearly seen that it is changed less than the
others. Most of the plot continues to be used for rubber cultivation (74%) while the rest was
switched to oil palm cultivation.

155
Table 5.4 Combinations of land use strategies
Unit: Num ber of HHs
Combinations of land usesPredominantly
paddy areaPredominantly
rubber areaPredominantly
abandoned areaGrower(n=39)
Non-grower(n=21)
Grower(n=47)
Non-grower(n=13)
Grower(n=33)
Non-grower(n=27)
Continuing ail land for same usesPaddy=>Paddy - 20 - - - -Rubber=>Rubber - - - 13 - -
Total - 20 - 13 - -% - 95 - 100 - -
Continuing some land for same uses and switching some land to different uses
Paddy=>Paddy and Paddy=>Oil Palm 19 - - - - -Paddy=>Paddy and Paddy=>Other - 1 - - - -Paddy=>Paddy and Abandoned=>Oil Palm 2 - - - 1 -Paddy=>Paddy and Paddy=>Abandoned - - - - - 16Paddy=>Paddy, Paddy=>Oil Palm and Abandoned=>Oil Palm
1 - - - - -
Paddy=>Paddy, Paddy=>Oil Palm and Other=>Oil Palm
1 - - - - -
Paddy=>Paddy, Abandoned=>Oil Palm and Other=>Oil Palm
1 - - - - -
Paddy=>Paddy, Paddy=>Oil Palm and Paddy=>Abandoned
1 - - 1 -
Rubber=>Rubber and Rubber=>Oil Palm - - 15 - - -Rubber=>Rubber and Abandoned=>Oil Palm - - 29 - - -Paddy=>Paddy, Paddy=>Abandoned and Abandoned=>Oil Palm
1 - - - 2 -
Rubber=>Rubber, Rubber=>Oil Palm and Other=>Oil Palm
- - 1 - - -
Total 26 1 45 - 4 16% 67 5 96 - 12 59
Switching all land to different usesPaddy=>Abandoned - - - - - 11Paddy=>Oil Palm 9 - - - 7 -Rubber=>Oil Palm - - 2 - - -Abandoned=>Oii Palm 2 - - - 14 -Paddy=>Oil Palm and Abandoned=>Oil Palm 1 - - - - -Paddy=>Oil Palm and Paddy=>Abandoned - - - - 1 -Paddy=>Abandoned and Abandoned=>Oil Palm 1 - - - 3 -Abandoned=>Oil Palm and Abandoned=>Other - - - - 4 -
Total 13 - 2 - 29 11% 33 - 4 - 88 41

156
Table 5.5 Initial land use before rotating to current use
Area categories
Initial land usePaddy Rubber Abandon Other Total
Area(Ha) % Area
(Ha) % Area(Ha) % Area
(Ha) % Area(Ha) %
Predominantly paddy area
2,218 93 - 146 6 13 12,377
100
Predominantly rubber area
- - 1,891 81 407 17 48 22,346
100
Predominantly abandoned area
678 61 - 429 39 - -1,107
100
Table 5.6 Change of land use from the latest initial land use to present land use
Categories of areas / Initial
land use
Present land usePaddy Rub ber Oil Palm Abandon Other Total
Area(Ha) % Area
(Ha) % Area(Ha) % Area
(Ha) % Area(Ha) % Area
(Ha) %
Predominantly paddy area
Paddy 1,429 64 - - 761 34 27 1 1 - 2,218 100Abandoned - - - - 146 100 - - - - 146 100Others - - - - 13 100 - - - - 13 100
Predominantly rubber area
Rubber - - 1,399 74 492 26 - - - - 1,891 100Abandoned - - - - 407 100 - - - - 407 100Others - - - - 48 100 - - - - 48 100
Predominantly abandoned area
Paddy 204 30 - - 230 34 244 36 - - 678 100Abandoned - - - - 411 96 - - 18 4 429 100

157
5.4 HH profile variables and their influence on the decision to grow oil palm
Table 5.7 shows a cross-tabulation between the two HH categories, oil palm grower
and non-grower, and a set of HH profile variables and the results of chi-square analysis. The
details of these results are as follows.
1. Age of Head of Household (HHH)
Younger HHHs were more likely to show an interest in cultivating oil palm than older
ones in all areas. Chi -square analysis points out that there is statistically significant
difference in HHH’s age between the OP grower and NOP grower HHs in the predominantly
abandoned area where HHHs who are younger than 61 years old were more likely (P<0.05;
Table 5.6) to be OP growers (72%) than NOP growers (48%). However, there are no
statistically significant differences in HHH’s age between the OP grower and NOP grower
HHs in the case of predominantly paddy and rubber areas. Even though, there is quite a
difference in the case of paddy where HHHs who are younger than 61 years old were more
likely to be OP growers (72%) than NOP growers (48%) but this difference is not statistically
significant at the 0.05 level.
2. Number of years farmers have lived in their present location
The willingness to cultivate oil palm did not differ by the number of years that farmers
have lived there. Although the table tends to indicate differences in the number of years
between OP growers and NOP growers, chi-square analysis indicates that there are no
statistically significant differences in the numbers of years between them in every area.
However, there is quite a difference in the number of years in the predominantly abandoned
area. The tendency is that HHs living in their present location less than 61 years were more
likely to be OP growers (82%) than NOP growers (52%) but this difference is not statistically
significant at the 0.05 level.
3. HHHs’ education
Higher willingness to cultivate oil palm was associated with higher educational level
in the predominantly paddy area. Although the table tends to indicate similarity in HHH’s
education between OP growers and NOP growers in all areas, chi-square analysis indicates

158
that HHHs who completed higher education were more likely to be OP growers than NOP
growers. In the case of predominantly paddy area, HHHs who completed education higher
than high school were more likely (P<0.05; Table 5.6) to be OP growers (41%) than NOP
growers (14%). In the case of predominantly rubber and abandoned areas, although there
are no statistically significant differences in HHH’s education between the OP growers and
NOP growers, there is quite a difference in the case of rubber where HHHs who completed
education higher than high school were more likely to be OP growers (55%) than NOP
growers (31%) but this difference is not statistically significant at the 0.05 level.
4. Number of family members
Even though there seems to be a relationship between willingness to cultivate oil
palm and the number of family members. Chi-square analysis indicates that there are no
statistically significant relationships between them. Interestingly, even though, this
relationship is significant in predominantly rubber area which HHs who have less than five
members were more likely to be OP growers (81%) than NOP growers (46%), it should be
noted that one of the expected values is quite small (3.47) violating the expected count
assumption which requires the expected counts to all be at least 5. In cases like this, the
small expected values could invalidate the chi-square test by inflating the test statistic and
making the results look more significant than they really are.
5. Number of farming labourers of HHs
HHs with larger numbers of farming labourers were more likely to cultivate oil palm
than HHs with smaller numbers of the labourers. Chi-square analysis confirms this tendency
with the statistical evidence found in the predominantly abandoned area that HHs who have
more than one farm labourer were more likely (P<0.05; Table 5.6) to be OP growers (78%)
than NOP growers (48%). However, this difference was not found in category of paddy and
rubber areas.
6. Annual income of HHs
Greater willingness to cultivate oil palm was associated with higher annual income of
HHs. Although the table tends to indicate differences in annual income of HHs between OP
growers and NOP growers in every area, chi-square analysis shows that there are

159
statistically significant differences in income only in the case of paddy and abandoned
areas. In terms of the predominantly paddy area, HHs with more than 200,000 Baht of
annual income were more likely to be OP growers (67%) than NOP growers (33%). This
difference is statistically significant at the 0.05 level. In the predominantly abandoned area,
HHs with more than 200,000 Baht of annual income were more likely (P<0.001; Table 5.6)
to be OP growers (55%) than NOP growers (15%).
7. Source of main income
The willingness to cultivate oil palm differed by sources of income. Although the table
tends to indicate similarity in sources of main income of HHs between OP growers and NOP
growers in every area, chi-square analysis shows that there is statistically significant
difference in sources of main income in the case of predominantly abandoned area. HHs
who get their main income from the sale of crops were more likely (P<0.05; Table 5.6) to be
OP growers (82%) than NOP growers (56%).
8. Total land area
Higher willingness to cultivate oil palm was associated with higher larger total land
area. The differences in size of total area under occupation by OP grower and NOP grower
HHs presented in the table are confirmed by the results of chi-square analysis, especially
the differences in the case of predominantly rubber and abandoned areas. HHs in the case
of rubber area who occupy a total area of over four Ha were more likely (P<0.01 ; Table 5.6)
to be OP growers (62%) than NOP growers (15%). For predominantly abandoned area, HHs
who occupy a total area of over two Ha were more likely (P<0.05; Table 5.6) to be OP
growers (72%) than NOP growers (33%). In the case of predominantly paddy area, although
it seems that HHs who occupy a total area of over five Ha were more likely to be OP
growers (64%) than NOP growers (38%), this difference is not statistically significant at the
0.05 level.
9. Owned land area
There are positively significant relationships between willingness to cultivate oil palm
and size of HHs’ owned land. Chi-square analysis in every area points out clearly that there
are the differences in size of HHs’ owned area of OP growers and NOP growers. In the case

160
of predominantly paddy area, HHs who own an area of over three Ha were more likely
(P<0.01; Table 5.6) to be OP growers (72%) than NOP growers (33%). For predominantly
rubber area, HHs who own an area of over four Ha were more likely (P<0.01; Table 5.6) to
be OP growers (62%) than NOP growers (15%). In the case of predominantly abandoned
area, HHs who own an area of over two Ha were more likely (P<0.01; Table 5.6) to be OP
growers (64%) than NOP growers (30%).
10. Ratio of owned land area
There is significant evidence in the predominantly paddy area to suggest that higher
willingness to cultivate oil palm was associated with a higher ratio of owned area. Chi-
square analysis indicates clearly that there is statistically significant difference in the ratio of
owned area to total area between OP growers and NOP grower. HHs who owned more than
50% of the land they work were more likely (P<0.01; Table 5.6) to be OP growers (85%)
than NOP growers (52%). However, this difference is not found the case of predominantly
rubber and abandoned areas.
11. Rental land area
Even though there is no statistically significant evidence, it seems that there is a
negative relationship between willingness to cultivate oil palm and size of HHs’ rental land
area. This is quite significant in the case of predominantly paddy areas. HHs who owned
rental area of less than two Ha were more likely to be OP growers (76%) than NOP growers
(52%). However, this difference is not statistically significant at the 0.05 level.
12. Ratio of rental land area
In contrast to the influence of size of HHs’ rental land area, the negative relationship
between willingness to cultivate oil palm and ratio of rental area to total area is statistically
significant. Chi-square analysis indicates that there is clear difference of the ratio of rental
area to total area between OP grower and NOP grower HHs in the predominantly paddy
area. HHs with less than 25.01% rental land were more likely to be OP growers (72%) than
NOP growers (43%). This difference is statistically significant at the 0.05 level. However this
difference is not found in the categories of predominantly rubber and abandoned areas.

161
Table 5.7 Basic household characteristics of OP growers and NOP growers
Predominantly paddy area Predominantly rubber area Predominantly abandoned areaHH characteristics OP grower
(n=39)NOP grower
(n=21)OP grower
(n=47)NOP grower
(n=13)OP grower
(n=33)NOP grower
(n=27)Age of HHH (years)
Less than 41 4 1 13 3 16 241-50 11 7 11 3 5 551-60 13 2 14 2 6 761-70 6 5 8 2 3 9More than 70 5 6 1 3 3 4
Chi-square analysisCross-tabulation for < 61 years: < 61 years: < 51 years: < 51 years: < 61 years: < 61 years:analysis 28 HHs (72%) 10 HHs (48%) 24 HHs (51%) 6 HHs (46%) 27 HHs (82%) 14 HHs (52%)
>= 61 years: >= 61 years: >= 51 years: >= 51 years: >= 61 years: >= 61 years:11 HHs (28%) 11 HHs (52%) 23 HHs (49%) 7 HHs (54%) 6 HHs (18%) 13 HHs (48%)
Pearson Chi-Square 3.436 0.098 6.163Sig. (2-tailed) .064"* 754"* .013*
The number of years HH have lived there (years)
Less than 21 9 2 9 2 1 121-30 2 1 4 2 1 431-40 7 4 16 2 15 341-50 8 6 5 5 5 951-60 8 2 6 - 7 3More than 60 5 6 7 2 4 7
Chi-square analysisCross-tabulation for < 41 years: <41 years: < 41 years: < 41 years: < 41 years: < 41 years:analysis 18 HHs (46%) 7 HHs (33%) 29 HHs (62%) 6 HHs (46%) 17 HHs (52%) 8 HHs (30%)
>= 41 years: >= 41 years: >= 41 years: >= 41 years: >= 41 years: >= 41 years:21 HHs (54%) 14 HHs (67%) 18 HHs (38%) 7 HHs (54%) 16 HHs (48%) 19 HHs (70%)
Pearson Chi-Square 0.923 1.013 2.926Sig. (2-tailed) .337'"^ .314"* .087 "*
Education of HHHsNo education 1 - 1 - - -
Primary school 22 18 20 9 23 19High school 8 2 21 4 9 6Undergraduate 8 - 5 - 1 2Postgraduate - 1 - - - -
Chi-square analysisCross-tabulation for < High school: < High school: < High school: < High school: < High school: < High school:analysis 23 HHs (59%) 18 HHs (86%) 21 HHs (45%) 9 HHs (69%) 23 HHs (70%) 19 HHs (70%)
>= High school: >= High school: >= High school: >= High school: >= High school: >= High school:16 HHs (41%) 3 HHs (14%) 26 HHs (55%) 4 HHs (31%) 10 HHs (30%) 8 HHs (30%)
Pearson Chi-Square 4.510 2.455 0.003Sig. (2-tailed) .034* .117"* .955"*
Number of family members
1-2 8 3 6 - 5 63-4 16 10 32 6 18 125-6 11 6 9 5 7 67-8 4 2 - 2 1 1More than 8 - - - - 2 2
Chi-square analysisCross-tabulation for < 5 persons: < 5 persons: < 5 persons: < 5 persons: < 5 persons: < 5 persons:analysis 24 HHs (62%) 13 HHs (62%) 38 HHs (81%) 6 HHs (46%) 23 HHs (70%) 18 HHs (67%)
>= 5 persons: >= 5 persons: >= 5 persons: >= 5 persons: >= 5 persons: >= 5 persons:15 HHs (38%) 8 HHs (38%) 9 HHs (19%) 7 HHs (54%) 10 HHs (30%) 9 HHs (33%)
Pearson Chi-Square .001 6.269" 0.063Sig. (2-tailed) .978"* .012" .802"*

162
Table 5.7 (Continued)
HH characteristicsP redom in antly padd y a re a P redom in antly rubb er a re a Predominantly abandoned areaOP grower
(n=39)NOP grower
(n=21)OP grower
(n=47)NOP grower
(n=13)OP grower
(n=33)NOP grower
(n=27)Number of household farming labourers
1 9 6 6 3 7 142 22 13 26 4 22 123 8 1 11 3 4 1More than 3 - 1 4 3 - -
Chi-square analysisCross-tabulation for analysis
=1 person:9 HHs (23%)
=1 person:6 HHs (29%)
<= 2 persons: 32 HHs (68% )
<= 2 persons: 7 HHs (54% )
=1 person:7 HHs (21% )
=1 person:14 HHs (52% )
> 1 person:30 HHs (77% )
> 1 person:15 HHs (71% )
>2 persons:15 HHs (32% )
>2 persons: 6 HHs (46%)
> 1 person:26 HHs (78%)
> 1 person:13 HHs (48% )
Pearson Chi-Squar 0.220 0.908" 6.128Sig. (2-tailed) .639"* .341" .013*
Annual income of HH (Baht)
Less than 100,001 2 4 2 - 1 2100,001-200,000 11 10 5 2 14 21200,001-300,000 15 3 14 6 16 3300,001-400,000 3 2 16 1 2 1400,001-500,000 2 1 - 2 - -
More than 500,000 6 1 10 2 - -
Chi-square analysisCross-tabulation for analysis
<200,001 Baht: 13 HHs (33% )
<200,001 Baht: 14 HHs (67% )
<300,001 Baht: 21 HHs (45% )
<300,001 Baht: 8 HHs (62%)
<200,001 Baht: 15 HHs (45% )
<200,001 Baht: 23 HHs (85% )
>=200,001 Baht: 26 HHs (67%)
>=200,001 Baht: 7 HHs (33% )
>=300,001 Baht: 26 HHs (55%)
>=300,001 Baht: 5 HHs (38% )
>=200,001 Baht: 18 HHs (55% )
>=200,001 Baht: 4 HHs (15% )
Pearson Chi-Squai 6.128 1.159 10.094Sig. (2-tailed) .013* .28 2"* .001**
Source of main income
Sale of crops 35 21 45 13 27 15Own business 2 - 2 - 3 1Paid employment 1 - - - 3 8Remittance 1 - - - - 2Other - - - - - 1
Chi-square analysisCross-tabulation for analysis
Sale of crops: 35 HHs (90% )
Sale of crops: 21 HHs (100% )
Sale of crops: 45 HHs (96% )
Sale of crops: 13 HHs (100% )
Sale of crops: 27 HHs (82% )
Sale of crops: 15 HHs (56% )
Non-sale of crops:4 HHs (10%)
Non-sale of crops:0 HHs (0%)
Non-sale of crops:2 HHs (4%)
Non-sale of crops:0 HHs (0%)
Non-sale of crops:6 HHs (18%)
Non-sale of crops:12 HHs (44% )
Pearson Chi-Squar 2.308^ 0.572^ 4.877Sig. (2-tailed) ^ 2 s r .449^ .027*
Total land area (Ha.)Less than 1.00 - - - - 2 61.00-2.00 5 4 3 6 9 122.01-3.00 2 4 4 4 4 53.01-4.00 3 3 11 1 6 14.01-5.00 4 2 7 1 4 35.01-7.00 8 2 6 1 5 -
7.01-10.00 11 4 7 - 1 -
More than 10 6 2 9 - 2 -
Chi-square analysisCross-tabulation for analysis
<= 5 Ha:14 HHs (36%)
<= 5 Ha:13 HHs (62%)
<= 4 Ha:18 HHs (38%)
<= 4 Ha:11 HHs (85%)
<= 2 Ha:11 HHs (33%)
<= 2 Ha:18 HHs (67% )
> 5 Ha:25 HHs (64%)
> 5 Ha:8 HHs (38%)
> 4 Ha:29 HHs (62% )
> 4 Ha:2 HHs (15%)
> 2 Ha:22 HHs (67% )
> 2 Ha:9 HHs (33% )
Pearson Chi-Squar 3.730 8.748 6.607Sig. (2-tailed) .053 "* .003** .010*

163
Table 5.7 (Continued)
H H characteristicsPredominantly paddy area Predominantly rubber area Predominantly abandoned areaOP grower
(n=39)NOP grower
(n=21)OP grower
(n=47)NOP grower
(n=13)OP grower
(n=33)NOP grower
(n=27)Area owned (Ha.)
Less than 1.00 1 5 1 2 4 111.00-2.00 6 5 2 4 8 82.01-3.00 4 4 4 4 4 43.01-4.00 4 4 11 1 5 14.01-5.00 4 - 7 1 4 35.01-6.00 5 1 4 1 3 -
6.01-8.00 8 2 4 - 2 -
More than 8 7 - 14 - 3 -
Chi-square analysisCross-tabulation for analysis
<= 3 Ha:11 HHs (28%)
<= 3 Ha:14 HHs (67% )
<= 4 Ha:18 HHs (38% )
<= 4 Ha:11 HHs (85%)
<= 2 Ha:12 HHs (36% )
<= 2 Ha:19 HHs (70% )
> 3 Ha:28 HHs (72% )
> 3 Ha:7 HHs (33%)
> 4 Ha:29 HHs (62% )
> 4 Ha:2 HHs (15%)
> 2 Ha:21 HHs (64%)
> 2 Ha:8 HHs (30% )
Chi-square 8.308 8.748 6.877Sig. (2-tailed) .004** .003** .009**
Area owned/total land area (%)
0.00 - 3 - - - -
0.01-25.00 2 4 - - - -
25.01-50.00 4 3 - - 1 -
50.01-75.00 7 4 - - - 275.01-99.99 4 - - - - -
100 22 7 47 13 32 25Chi-square analysis
Cross-tabulation for analysis
<= 50:6 HHs (15% )
<= 50:10 HHs (48% )
<100:1 HH (3% )
<100:2 HHs (7% )
> 50:33 HHs (85%)
> 5 0 :11 HHs (52%)
=100:32 HHs (97% )
=100:25 HHs (93% )
Pearson Chi- Square 7.253 NA 0.599^Sig. (2-tailed) .007** NS .439*
Rental area (Ha.)0.00 23 9 47 13 32 250.01-1.00 1 1 - - - 21.01-2.00 6 1 - - - -
2.01-3.00 5 4 - - 1 -
More than 3 4 6 - - - -
Chi-square analysisCross-tabulation for analysis
<= 2 Ha:30 HHs (76%)
<= 2 Ha:11 HHs (52%)
= 0 Ha:32 HHs (97% )
= 0 Ha:25 HHs (93% )
> 2 Ha:9 HHs (23%)
> 2 Ha:10 HHs (48%)
> 0 Ha:1 HH (3%)
> 0 Ha:2 HHs (7%)
Pearson Chi- Square 3.799 NA 0 .5 99*Sig. (2-taiied) .051 "* NS .439*

Table 5.7 (Continued)
164
HH characteristicsPredominantly paddy area Predominantly rubber area Predominantly abandoned areaOP grower
(n=39)NOP grower
(n=21)OP grower
(n=47)NOP grower
(n=13)OP grower
(n=33)NOP grower
(n=27)Rental area/total land area (%)
0.00 23 9 47 13 32 250.01-25.00 5 - - - - -25.01-50.00 7 5 - - - 250.01-75.00 3 2 - - 1 -75.01-99.99 1 3 - - - -100 - 2 - - - -
Chi-square analysisCross-tabulation for analysis
<= 25:28 HHs (72%)
<= 25:9 HHs (43%)
=0:32 HHs (97%)
=0:25 HHs (93%)
>25:11 HHs (28%)
>25:12 HHs (57%)
>0:1 HH (3%)
>0:2 HHs (7%)
Pearson Chi- Square 4.835 NA 0.599*Siq. (2-tailed) .028* NS .439*
Note: NA = No statistics are computed because data is a constant.
NS = not significant at the 5% probability level (P)
* = significant at the 5% probability level
** = significant at the 1 % probability level
*** = significant at the 0.1% probability level
1/ = Invalid statistic because one cell of cross-tabulation for Chi-square analysis has expected
count less than 5
2/ = Invalid statistic because two cells of cross-tabulation for Chi-square analysis have
expected count less than 5

165
5.5 Quantitative analysis of factors influencing land use change
Quantitative methods were used in this study to find out the priority of factors
influencing change of land use to oil palm cultivation. The potential factors used for analysis
in this study were derived from the qualitative analysis in Chapter 4 and an additional factor
indicated by respondents from the field survey. The wide range of factors and more details
of criteria to classify whether each factor influences change of land use to oil palm or not are
shown in Table 3.3 in the methodology chapter. As mentioned in that chapter, these factors
have been taken in isolation by comparing with others to find out the important
considerations that farmers take into account when they decide about land use. Thus results
presented in this chapter are individual statistics of each factor including their frequency,
priority weight and rank, while the interaction effects formed by these factors were not
included in this study.
According to data from the field survey. Table 5.8 reports which factors influencing
HHs’ decisions to adopt land use strategies were mentioned by respondents, and how
frequently they were mentioned. In addition, the priority weights (derived from Ternary AHP
technique) and the ranks for factors influencing HHs’ decisions to adopt land use strategies
are shown in Table 5.9. Nonetheless, the comparisons of mean weights between each pair
of factors by the Wilcoxon signed-ranks test in each land use strategy are presented in
Tables 5.10, 5.13, 5.16, 5.18, 5.20 and 5.23. Finally, in each land use strategy, the
comparisons (by Mann-Whitney U Test) of mean weights of factors between different area
categories (if applicable) are shown in Table 5.11, 5.14, 5.21 and 5.24.

î(/)<DCO=3•ocro'coXXO)cuc0)3
<4—c
■ §.to
9ocCD3cr
.20JCI -00inonro
55 m f2 R O CM - 8 g ■ 00CM g CD 8 8 in
1 05 in in CO- h- in■M- 8 8 - ■M- 8 g g 05ro ÜCD E05 ro .5 CLÜ '5
CM 8 g CO- N CM CM- CM 8 g m
1CM ■ CM in CM ■ CM in N CO CM ■ ' CO ■
N o ■- - 8 ■ ' - ■"Oc § ■ CO ■ g 8 8 ■O)1 o 1 8 ■ CO ■ 8 CO CO •S -p ■ ■ ■ ■ CM CO •M- •
CDC c£ CM Tj* ■ ■ ■ CM Tf CO ■
o - CN ■ CO ■ CO TJ- - ■'5O c 55 N 8 g CO 5 8 CO8 8 8 CO8 8 co 8 8 8
P 1 CO in o - CO Tj- - in 1 m- CO- in
! 1 CM CO CO- Tf CM- - ■ m- CO- CMm
1 1 1 CM - - CO - ■N- ' ' ■ ■ ■ -- ■ - ■ - ' ■ ■ ■ ■ -
0 55 g CO CM o 05 8 CO8 § CM
i.g 1 R COCM - CO 5 mCMCO 8
I IIf) • ■ CM - CO 8 CM 8
r (TCM 1 N - ■ CO • N • - ■- h- CNJ- - - - ■ ■ ' - ■
Ôo c 55 o s CM 8 o CM COin CM8 m s CMCM 8 8 g §
p 1 - ■M" in COCM- 'TTCM 8 - in CM 8 8
11 ■CO- in CO in in CM ■N CM 8 - CO CM 8 CDCO
■H R1 CM ■CO CO- ■ CO ■ ■Tf ■ CM ■CM ' ■ ■ -- ■M-CM - ' • in • - CO ■ CO ■ ■ ' ■ -
55 CD5 S CO - CO- g 8 ■ ■8 8 CO in COg 8
1,§ 1 g CM - 05- 8 CO ■ ■8 ? CM o CM8 CO
I I ■CO 8 - ■ in - COCM ■ • 8 8 CM o CM8i “O £ CM - CO CO ■ ■ CO ' CMCO ' • • 8 • ■ ■- CM
- CO 8 - ■- ■- ■ 1 - ■ ■ ■ CM ■ • ■ ■ ' 05
iiTJ
3
£
0"OcTO*o%
10
11
01.E1(0Q.E£
01.5
§io
11g8
1 1
1
a05
1
c
a1Ü
1
1
1*6"Oc
8E0 &1
>.13(0C<DEEI(D
I
1z
ÈEg5■DC£
><0.CL8
1 Q
051ê
8
Q
E
1cTOEI
1XXo
fÜ
0f11s
11*0t!o
l l< a
1aIâgg
113•oc0«g
1-g•D!
E
1
1w
18TJCCÜ•Ë1z
g
0§£
166
1D)Cc2
■5SCD
i t
0JC
ro08c03
1 0
85c.2)wCMO)clit;c0
O)
Q.0
•o0Co4—>c0EjSc0■ac0Q.
£C0E1sz(/)
TO20■g'wc8«
I ! 0 JO 0
CO)ccX
o
"2£0
w0"O20•g'wc8.52
■§a00
883
1
0
c.2)w
CMACO)cc2■DC0
0 a .
1j=CO)
■Dc80W0
w0TO20■g'(/)c8W
( N • -
a.0
a '■Co
8x:.2)x:2oE

2
!w0w3■ocro"wXX3)C"oc03
12Ü.0
■oc0
c2i 2
§0
Cl0
x :h-O)in0n
i s
IIO) 0
w
11 •5
I IO)
-i’l
ti0.3O) oi l.■B §j w
g 'l
pÜ g>q
0oCaOTW0
D)C 0)TO wO 0O .22X O I I
c0Eo.'oCJ0TOc0 .ga 0o D)o "C1 -
w
O)
CO
5a
l l<D Ü
£■§
i |
l i
f I?g|IIIO) 0
c o
og 8-
l l !I l i lIII!I I I !o
l l
f i i
' l l l l™ S--B P
0 g
E I 1 ■■£i l l !T 0 S
o c Ü a>0 OTi . 0 £9 0
11II
Q
liiillilII "II
167

168
5.5.1 Factors influencing land owners to continue paddy cultivation
Considering the overall priority weights, although there are 16 factors mentioned by
respondents as motivation influencing them to maintain paddy cultivation (see Table 5.8),
there are only ten factors whose means are statistically significantly different from the means
of factors not mentioned by respondents (see Table 5.10). Among the mentioned factors,
own consumption, capacity of HH labour, lump sum income, and land topography are in the
group of factors with the highest priority, statistically significantly higher than other factors
(see Table 5.9 and Table 5.10).
In terms of differences in the priority weights of factor whose means are statistically
significantly different from the means of factors not mentioned by respondents between area
category, the results show that the respondents in the predominantly paddy area considered
the factors lump sum income and land topography more important than the respondents in
the predominantly abandoned area, while the respondents in the predominantly abandoned
area considered the factors own consumption, capacity of HH labour, transportation and
policy of price more important than the respondents in the predominantly paddy area (see
Figure 5.1a and Table 5.11).
In summary, it can be clearly seen that the decision to continue paddy cultivation
was dominated by several factors including to gain lump sum income, to obtain paddy for
own consumption, suitability of land topography and sufficient capacity of HH labour. Other
factors, even though not dominant, influencing the decision are irrigation and sufficiency of
water supply, transportation, land right condition and satisfaction with price policy and
disaster assistance (see Table 5.12).
The findings indicate that the decision to continue paddy cultivation is because,
firstly, it could provide more lump sum income than cultivating oil palm and HHs could obtain
paddy for their own consumption. It can be clearly seen that there is a strong expectation of
HHs in the predominantly paddy area for gaining lump sum income while that of HHs in the
predominantly abandoned area is for obtaining paddy for own consumption. Secondly,
paddy cultivation is adopted to take advantage of natural resources and their relevant
infrastructure. These are suitability of land topography, sufficiency of water supply and

169
having an irrigation system. There is very clear evidence for the case of suitability of land
topography which is very important to HHs in the predominantly paddy area. Thirdly, the
decision to continue paddy cultivation is based on sufficiency of capacity of HHs labour and
this is especially relevant in the case of cultivating for own consumption in the predominantly
abandoned area.
Fourthly, it can be seen that the decision is also determined by satisfaction with
policy in supporting paddy cultivation. These are price policy, which is very relevant in the
case of abandon areas, and disaster assistance. Price policy would make HHs able to gain
satisfied satisfactory price while disaster assistance could make HHs confident in paddy
because they could get some assistances if paddy is destroyed by a disaster like flooding.
Fifthly, there are two factors, transportation and land rights, which are considered to be
barriers in switching paddy areas to oil palm cultivation. These are difficulties in transporting
oil palm product to market which is very relevant in the predominantly abandoned area and
lack of rights in directing what land should be used for which makes land use switching
impossible. Last but not least, it is noticeable that financial factors are not very important in
the decision to cultivate paddy especially regarding investing in crop production. It would
appear that paddy cultivation makes it easy for HHs to circulate liquidity in production.
Paddy cultivation provides enough income, some of which can be invested in the next round
of cultivation without using HH’s savings or credit.

c0
13ü>»"O•30Q.03C
'C
8
WXX3)c0c03
M—_c2
■§ac000jO
§i.0
j=.2)icsEC
0‘c.2)«
81 «4—<
i0
x :Ho
LO0
x>
,5
g
§ i l
s i i i l
g i%i l i l
1 i l i l i l i l
s i%i'i i i i'i i l
s i i i i i l i l i l i l
s i i i l i%i l i l i l i l
5 il:■7 P
ii:T 9 II ii:
T 9 i l i l i iT 9
i iT 9
5 f i i lT P
ii:T 9
ii:T 9
ii:T 9
ii:T 9
i iT 9
i iT 9
i iT 9
5 i | i l 3%II i l f l i i l
5 s s'■ X i l f i s | * % f l f l i l f l i l
5 8 %,TS5|■■ P i l # II II Ig i l Ig | g 9 g 9 g
S II % ! l f i %T 9 II f i Sg
T 9%T 9
38T 9
38T 9 f l
S II i l■ 7 °
§8(N q f l i l
qi lc s i q
i lc ^ q
i l i ic ^ q
i i i l i i ikc ^ 9
S SS. •a> f i II Iî2
c MP Siq i l @8
w qi lCN q
i lw q
i lC j i q
i iC N q
i iq
i iq
i | II
0
og°iSV 0 II i l II II II i lc? q II i l i l i l i l i l II II
0 Rg' Mr? I l i l II i l II i l
81: 8II II II II II II II II
0 38 fs i l I? I i i l i l i l P 88 II f l II f l f l II f l f l0 f î i l i l
V ° i l i l II II f i ï§ II f l f l f l f l f i f l f l f lS
? î
8S î -
II I i f i f i f i f l i l II f l i l i l i l II i l i l i l II i lS II
SîTo II i l f i i l i i i l R :
Si i l i l i l i l i l i l i l i l i l0
gz71 i i §LiSi l i l f i i l i l i l f i II l l :L
“ ? § i l i l î l î l î l î l î l î l5 i l V # i l i i I i l | i l i i f i II i l II i l
81i l
T :S|
T î
8T :
8T :Si
T î
8T î
SiT î
îl îi i
s
I f■51
g
I it»s
f?1:i s
s
JI ig
l l11g
IsI iOJ d II
| ig
c Ç
IIi iw
?
IilÉdS
; !E
IIgéÈêNX
t lëêcoX
| f
f i
I iS
f iI ii nX
iCDE
I sIIM
S
l lcdX
: § f
MIIdX 1
IIb wg
î#gl ê
Ipîmg
î lI Iè
170OX N
11
CD CD
c m
; ë)CD
i l0 0>
X I0 iS
i lg s
g N02 3
1 1
0 ü
ilIIîlI I
I IPP0 g
. i f
g m 8 ^
OCDOVX
■OCroodVX
lOo?X
mro■8
0X :
co
§ c X O) 0 mü 0ro £ 0
o cE "
(N

171
7 % -
5 % -
4 % -
3 %F 3 F 4 F5 F 7 F8 F 9 F 1 0 F11 F 1 2 F 1 3 F 1 4 F 1 5 F 1 6 F1
■ P redom inan tly paddy a rea (n = 4 7 ) ■ P redom inan tly a b ando ned a rea (n = 2 0 )
F 1 8 F 1 9 F 2 0 F21 F 2 2 F 2 3 F 2 4
A v e ra g e o f all land o w ners (n = 6 7 )
a. continuing paddy cultivation
7 %
6% -
5 % -
4 %
3 %F2 F 1 0 F11 F 1 2 F 1 3 F 1 4 F 1 5 F 1 6 F 1 7 F 1 8 F 1 9 F 2 0 F21 F 2 2 F 2 3 F 2 4
■ P redom inan tly paddy a rea (n = 3 3 ) ■ P redom inan tly a bando ned a re a (n = 9 ) ■ A v era g e o f all land o w ners (n = 4 2 )
b. switching to oil palm cultivation
Figure 5.1 Comparison of the priority weights for the factors influencing land owners to
continue paddy cultivation or switch paddy to oil palm cultivationNote; 1) F1=Profit
F5=Saving for investment F9=Policy of price F13=Diseases/pests F17=Skili/Knowledge F21=lrrigation
F2=Lump sum income F6=Credit for investment F10=Government subsidy F14=Flooding
F3=Continuous income F7=Price stability F11=Land topography F15=Disaster assistance
F18=Accessibility of employed labour F19=Transportation F20=Tools and equipment F22=Land rights F23=Networks and connections F24=Farmer institutions
2) The average of all land owners was calculated by adding the set of numbers up and dividing by the total number of landowners.
F4=0wn consumption F8=Trend of price F12=Water supply F16=Capacity of FIH labour

172
Table 5.11 The statistically significant mean weight differences between the predominantly
paddy and abandoned areas of factors influencing HHs to continue paddy cultivation
Overallrank
FactorsMean weight (%) Mann-
WhitneyStatistic
Sig.(2-tailed)Predominantly
paddy areaPredominantly
abandoned area1 Own consumption 6.07 7.74 85.5 .000***2 Capacity of HH labour 5.63 7.36 101.5 .000***3 Lump sum income 6.55 4.70 277 .008**4 Land topography 6.14 3.89 203 .000***5 Irrigation 5.01 3.69 360.5 .131""'6 Land rights 4.86 3.92 417.5 .469""'7 Disaster assistance 4.56 4.18 409 .401""'8 Water supply 4.66 3.69 443.5 .715""'9 Transportation 3.54 5.03 111.5 .000***10 Policy of price 3.93 4.08 240.5 .002**
Note: 1) With Mann-Whitney U test, the null hypothesis (HO) is that “there is no difference between the median
of factor between the case studies"; reject HO if the actual Z-value is less than the negative value of
the critical value of Z from the table or larger than the positive value of the critical value of Z from the
table
2) NS = not significant at the 5% probability level (P), * P<0.05, **P<0.01 and ***P<0.001
Table 5.12 Factors influencing HHs to continue paddy cultivation
Aspects Outcome Asset Vulnerabilitycontext
Policy and institutional context
Financial - Lump sum income
- Own consumption
- Policy of price
Naturalresource
- Topography- Water supply
- Disaster assistance
Human - Capacity of HH labour ^
Physical - Land rights - Transportation- Irrigation
Social
Note: (D) = Dominant-influence factors

173
5.5.2 Factors influencing land owners to switch paddy to oil palm cultivation
Similar to the case of continuing paddy cultivation, although there are 18 factors
mentioned by respondents (see Table 5.8), there are only 12 factors for which the means of
overall priority weights are statistically significantly different from the means of factors not
mentioned by respondents (see Table 5.13). Among the mentioned factors, continuous
income is given as the highest priority statistically significant higher than other factors. The
next priorities are given to a group of factors consisting of networks and connections, saving
for investment and capacity of HH labour which is statistically significant higher than the rest
factors (see Table 5.9 and Table 5.13).
In terms of differences in the priority weights of factor whose means are statistically
significantly different from the means of factors not mentioned by respondents between area
category, the results show that the respondents in the predominantly paddy area considered
the factors saving for investment and tools and equipment more important than the
respondents in the predominantly abandoned area, while the respondents in the
predominantly abandoned area considered flooding more important than the respondents in
the predominantly paddy area (see Figure 5.1b and Table 5.14).
In conclusion, the analysis reveals the dominant factors influencing the decision in
switching paddy to oil palm cultivation. These are to gain continuous income, sufficiency of
saving for investment, capacity of HHs’ labour and networks and connections. The analysis
also points out other factors, even though not dominant, including government subsidy, land
topography, flooding, accessibility of employed labour, transportation, tools and equipment
and land rights (see Table 5.15).
Taken together, these findings suggest that the decision to switch paddy to oil palm
cultivation is associated with, firstly, expectation of continuous income. Secondly, it can be
seen that switching to cultivate oil palm became possible because of sufficiency of saving
for investment especially in the predominantly paddy area and because of government
subsidy. It should be noted that there is evidence that paddy areas were lost even though
the government had the intention to not subsidize oil palm cultivation in paddy areas.
However, this mistake may have occurred because it is difficult to identify for large areas
whether they are abandoned areas which are the target or paddy areas. Some areas might

174
be abandoned because they were unprofitable for paddy cultivation for commercial
purposes. However some HHs might continue to cultivate paddy in these areas for their own
consumption.
Thirdly, natural resource conditions of in some of these areas are more suitable for
cultivating oil palm than paddy. This is because paddy is not productive in some land
topography and is less tolerant to the flooding. The concerns about flooding are very
significant in the predominantly abandoned area. Fourthly, the decision to switch areas is
based on the consideration that the HHs have capacity of labour and/or are able to employ
the labour for dealing with farming. Fifthly, it can be clearly seen that transportation and land
rights are important factors determining whether switching paddy to oil palm cultivation
would succeed.
The results point out that it is easy to access the plot site and/or transport oil palm
from plot site to the market, and switching land to cultivate oil palm is not limited by land
rights. Furthermore, the decision to switch paddy to oil palm was associated with tools and
equipment. It suggests that HHs’ tools and equipment are suitable or can be adapted to be
suitable for oil palm cultivation. Finally, it can be clearly seen that networks and connections
are very important in the decision to cultivate oil palm. It is reported that learning best
practice from oil palm growers makes HHs prefer to cultivate oil palm.

EccQ.ÔO
•O"OccQ.szü■l<0o(0XXO)cocCDg
Eoüco
M—
cCDCDJ(DJZi(0(DüC0)o
ï Ë■ox:. 5 )CD
CCD(DEcCDüit=cD)(0
CDü
1iScoCD.C1-co C
olOCD
. iXi,(D 3ü
S
g i î
g i l i î
g i î i î i î
g l î i î i î i î
S l î l î i î i î i î
s l lT q
IIT qIIV q
l lvq IIvq
i lV q
Eh-z58 i lT qII i lT qi lvq i lvq i lV q
Erz rz i l
vqi lvq
i lT q
i lvq
i lvq
i lV q
E l î II i l II i l i l i l i l
E # # l î l î II II II î l î l
E II Si5§ i II II f i f i §1
vq f iE
COz Ozi II i l P p P P P
E §K • qs | I lT qII II i l i l P p P P P
E 8K •■ q î%î lvq f i i s |
vq %T qvq3%vq
3gV q
i lvq
S f i Sg ' qi l i l %vq i i i l i l i l i lco qi | i l i l i l i l
§ 88 ' qf i i l f î I i i l 82cq82cqi l i l i | i l i l i i i lE i l i l
CNJ5? n k35 i l i l | i ;&co qco qI Ico qi l i i l i i i l
'■ q% II î l i i(Nqi l # i l q| i l 8|CO qII i lco qi l i l i lco q85coqi iS feg '■ q88' 't i s i i II CN qi l II II i l sL
98 i l i l II # II II IIE 82cgq
2*08&i II II II i liS l l II ?l i l i l
f§ # i l i l ?l II f i IIS II
g:i g5 II II II i l i l II II II II II p p p II II II
2 II II ToII i l i l i l l l II II i l II i l II i l II i l i l i l i l i l i lE l§ II Sic? qII
21Tq II i l
8*S§Tq i l II
2î2| II i l 5:
Si i i l II -1Si 21
t=îSi
î=î5§
t::s§
1
1
f i
g1s
iQ-S
S
i lg 6
g
I
#Pg
l îI IIs
E
c ^
II
E
Ii| i
É
Jd5
1:
E
1-iS-g
I II»N5
i lcos
II
E
1si
iLO5
1:
5gcd5
N5
1w«cdE
i l<0 f<jI io>5
t |P
§
f li
1
IIg
îlI f
I I
of
i
oX N ü O
f s
Ê Sî lco 0
g ?i |E 5
II"sa
cn:5
IIi o 0 mX) JH
ili lg N't-CO oi §1 1
v> o
ilHiilî0 CD£ 5
175
cI Iî5 0
■g 5
o (0
î ! g :
oo?û.
?
LOO?Q.
IP
LO0
CsscO)
E "o CO
CM

176
Table 5.14 The statistically significant mean weight differences between the predominantly
paddy and abandoned areas of factors influencing HHs to switch from paddy to oil palm
cultivation
Overallrank Factors
Mean weight (%) Mann-WhitneyStatistic
Sig.(2-tailed)Predominantly
paddy areaPredominantly
abandoned area1 Continuous income 7.11 7.08 128.5 .537""^2 Networks and connections 6.26 6.42 130 .568"“3 Saving for investment 6.72 4.52 49 .002**4 Capacity of HH labour 5.75 5.90 142 .842^''5 Land rights 4.85 4.85 138.5 .758^^6 Flooding 3.98 6.94 24 .000***7 Land topography 4.64 4.25 113 .269""’8 Transportation 4.17 4.53 130 .562"*9 Tools and equipment 4.26 3.62 85 .048*10 Profit 3.76 3.81 134 .648"*11 Government subsidy 3.77 3.72 133.5 .636"*12 Accessibility of employed
labour3.76 3.60 140.5 .802"*
Note: 1) With Mann-Whitney U test, the null hypothesis (HO) is that “there is no difference between the median
of factor between the case studies"; reject HO if the actual Z-value is less than the negative value of
the critical value of Z from the table or larger than the positive value of the critical value of Z from the
table
2) NS = not significant at the 5% probability level (P), * P<0.05, **P<0.01 and ***P<0.001
Table 5.15 Factors influencing HHs to switch from paddy to oil palm cultivation
Aspects Outcome Asset Vulnerability context Policy and institutional context
Financial - Continuous income
- Saving for investment
- Government subsidy
Naturalresource
- Topography - Disease and pest
Human - Capacity of HH labour^ ^
- Accessibility of employed labour
Physical - Tools and equipment
- Land rights
- Transportation
Social - Networks and connections
Note: (D) = Dominant-influence factors

177
5.5.3 Factors influencing land owners to continue rubber cultivation
Similar to above land use strategies, there are 12 factors mentioned by respondents
(see Table 5.8). However, there are only eight factors for which the means of overall priority
weights are statistically significantly different from the means of factors not mentioned by
respondents (see Table 5.16). Among these mentioned factors, land topography is
distinctively given as the highest priority, statistically significantly higher than other factors.
The next priorities are given to a group of factors consisting of transportation, profit and
capacity of HH labour, which are statistically significantly higher than the remaining factors
(see Table 5.9 and Table 5.16)
To summarize, it can be clearly seen that continuing rubber cultivation was
influenced by dominant factors including to maximize profit, suitability of land topography,
sufficient of capacity of HH labour and transportation. Other factors, even though not
dominant, influencing the decision are lump sum income, government subsidy, accessibility
of employed labour and tools and equipment (see Table 5.17).
The findings indicate that the decision to continue rubber cultivation is associated
significantly with, firstly, land topography which was rated as the highest priority. Secondly,
the motivation of continuing rubber cultivation is mostly for gaining maximum profit from land
use and also lump sum income from selling wood before rotating to a new round of
production. Thirdly, it is reported that the decision to continue rubber cultivation is
dependent on labour conditions. Evidently, the HHs could get advantages of sufficiency of
HHs’ labour and ease of employing the labour. Fourthly, continuing rubber cultivation gains
the continual benefit from government subsidy in providing financial assistance to invest in a
new round of cultivation. Fifthly, regarding barriers to switching rubber to oil palm, it is
reported that switching is impossible because of difficulties in transporting oil palm product
to market. Finally, another barrier is that the HHs’ tools and equipment are not suitable or
adapted to be suitable for oil palm cultivation.

c0 %*—"
13O
203C
'C8
wXXD)C
"oc03
1
gc000sa
§it t
jCD)
î
SEc
85c.2)w
s1I0
(D
LO0sa0
s
2 i l
2 I I i l
2 l l l l i l
2 i l l l l l i l
S i l i l l l l l i l
E i l i l l l l l l l i l
E I I i l i l l l I I i l i l
E l l I I I I I I I I I I I I I I
E i l i l i l I I i l i l I I I I i l
E i l i l i l i l i l i l i l i l l l i l
E I I l | i i I I I I I I i l I 'I l l I I i l
E l lv q I I
V ql lV q
I Iv q
l lvq
I IV q
I Ivq
l lV q
l lV q l lV q l l
V q I I
E i % i l i li l
i l f i i l i l i l i l i l
E R8'■ ^ # I I i l i l i l i l i l f i i l i l i l% i l
2 qRV q I I i l i l i l i l i l i l i l i l i l i l i l
2 I I ^ 8 I I I I Ü i l i l i? I I i i I I i l l i I I I I
E I I I io UT5 ^8 I I
Sâ I I Si si si s§ 8 kqq si si si s§
2 i l I I Si 8% 3 8q q ;?5 i l i i l I I I I q q q q I Iq q I Iq q i l i
2Oz8 8. q %
i l i l8 L
I I i lI Iqq i l i l i i i l i l I Iq q i l l iq q
E i lSîSi i l
$2î1# I I i l i l I I i l # I i i i i l I I i l i l f i
2 § 8 ' q r i I I i l°LTq i l i l i l I I ?i i l i l I i i i i l i l i i i i f l
2 8 8 i l i l I I i l I IS!n .
-Lf 8 I I I I i i
Sîs:
g î2 §
gî21 i l i l i l i l
g î2# i l
gî5 8
E!ïîs ° i l sL
9§”LS#I I I I I I i l
g:1#
g;2 1 i l i l
s iS i
§ î 8 : gîi l
g:^ 8
g: gî gîi l
gî
1 1I g
5
o %
11| æ
2
1
2
i lQ-mS
l lS6| «
2
I f
l îg gg
I I
f iE
l iI is
f i
|s2
I
I IMdS
Iîwl’
E
! l§élitcsi5
i l
I IcoE
f lM
E
IlOX
1CDX
i l
l i
5
I I
I IcdS
îigl êdX
I s
§
i if i t
Ë'
I
pssi
I II tg
IIi en0 CO
1
178oX N ü O
0'S
c u 0 0
g f11
>
IQ .0
0
1
î
ü
ii•oo
0 £ % o0 £ X sa0 iS
0 £ Eê
- SU) o
- ^ 1
:S1« ü
il| jî l0 0 £ £
I I- %0
OO
?
"g0
o
tLOo
?
sa
ILO0am
E -
g g c
c N £ co — . Q O )
P
1 ^ 1 > 0 SZ s z
§£•55o c
E " p co

179
F1 F2 F3 F4 F5 F6 F7 F8 F9 F10 F11 F12 F13 F14 FIS F16 F17 F18 F19 F20 F21 F22 F23 F24
■ Predominantly rubber area (n=58)
a. continuing rubber cultivation
7%
6%
5%
4%
3% M1 1 1 1 1Fl F2 F3 F4 F5 F6 F7 F8 F9 F10 F11 F12 F13 F14 F15 F16 F17 F18 F19 F20 F21 F22 F23 F24
■ Predominantly rubber area (n=18)
b. switching to oil palm cultivation
Figure 5.2 Comparison of the priority weights for the factors influencing land owners to
continue rubber cultivation or switch rubber to oil palm cultivationNote: F1=Profit
F5=Saving for investment F9=Policy of price F13=Diseases/pests F17=Skill/Knowledge F21=lrrigation
F2=Lump sum income F3=Continuous income F4=0wn consumptionF6=Credit for investment F7=Price stability F8=Trend of priceF10=Government subsidy Fl 1=Land topography F12=Water supplyF14=Flooding F15=Disaster assistance F16=Capacity of HH labourF18=Accessibility of employed labour F19=Transportation F20=Tools and equipment F22=Land rights F23=Networks and connections F24=Farmer institutions

180
Table 5.17 Factors influencing HHs to continue rubber cultivationAspects Outcome Asset Vulnerability context Policy and
institutional contextFinancial - Profit
- Lump sum income- Government
subsidyNaturalresource
- Topography
Human - Capacity of HH labour ^
- Accessibility of employed labour
Physical - Tools and equipment
- Transportation
Social
Note: (D) = Dominant factors
5.5.4 Factors influencing land owners to switch rubber to oil palm cultivation
Although there are 17 factors mentioned by respondents (see Table 5.8), there are
only eleven factors for which the means of overall priority weights are statistically
significantly different from the means of factors not mentioned by respondents (see Table
5.18). Among the mentioned factors, land topography is given as the highest priority,
statistically significantly higher than other factors, while the remaining factors were not
distinctively different from other factors mentioned by the respondents (see Table 5.9 and
Table 5.18).
To conclude, the analysis highlights land topography as a dominant factor influencing
the decision to switch rubber to oil palm cultivation. The analysis also indicates other factors,
even though not dominant, influencing the land use change including continuous income,
saving for investment, government subsidy, diseases/pests, flooding, capacity of HH labour,
transportation, land rights, networks and connections, and farmer institutions (see Table
5.19).
The evidence from the analysis suggests that the decision to switch rubber to oil
palm cultivation is, firstly, because of land characteristics where HHs reported that the
topography is not suitable for rubber cultivation. Other factors relevant to land topography
which influence the decision of HHs to switch land use are flooding and disease and pests.
Based on the views of HHs both in the case of continuing rubber cultivation and switching

181
rubber to oil palm, it is evident that land topography is a crucial factor in the decision. HHs
would maintain lands for continuing rubber cultivation as much as possible unless the
topography is not suitable for rubber cultivation. Secondly, in terms of financial conditions, it
can be seen that continuous income provided by oil palm cultivation could motivate HHs to
cultivate oil palm. In addition, switching land is possible because of sufficiency of HHs’
saving for investment and government subsidy, especially in switching unproductive rubber
areas to oil palm cultivation.
Thirdly, it is also reported that switching is possible because the HHs consider that
there is sufficiency of HHs’ labour for oil palm farming. Fourthly, it is also reported that
switching is possible because there is no difficulty in transporting oil palm product to market.
Fifthly, land rights are an important factor facilitating land use switching. It is reported that
switching is possible because HHs have the right to decide what land should be used for.
Last but not least, social contexts were mentioned as the factor that makes it easy for HHs
to decide to cultivate oil palm. These are networks and connections which facilitate HHs to
be motivated to switch via learning about advantages and best practice of oil cultivation from
oil palm growers and the optimistic view that farmer institutions of oil palm could provide
more favourable benefits than the benefits from the farmer institutions of rubber.

E0CL
ÔO
0E00
.Qsa3
SZü.-tiWO
wXXO )coc03
s—Ç
woü0u—C00i0
saw0üc005È■D
X :.O)0c00Ec0üÎ4—'cO )'w
"0üw
sw0
X :h-00 c
oLO U-»0 >sa
,0 3\ - ü
22 ii2 iiiî2 i%iîiî2 i%iîiîiîE i'iiii'ii'iigE ilili%iîiîiîE il
v qilV q
ilV q
ilV q #IIII
E F^ZiiIIIIIIilV q IIIIIIE fiF^Z il
v qilv q
ilV qilV q
ilv q
ilv q
ilV q
E F^ZïâlzF^ZiiilV qilV q
ilV q
ilV q
ilv q
ilv q
ilv q
E jz_IIq § %%IIilil%ililE IIrz§ S
'
F^Z
i ?
si?8 fiIIilIIillîlîlî
E ii IIIlilililililililililE %
V q
|i' q II#%fi ##ililililsc ^ q
2 %fisi' T g
si' T g II##ililililIIIIilRRq q
2 fl%îlsiili Sii 8%v “ ililIIIIIIIIil
E #IIIIsi?si ”,• inîlîlîlIIilIIililililIIII
2 % fiIIilv qilv q IIililIIi l
^ qi l
V = ! IIilIIIIIIIIII2 f e w
' f e ilII!lililIIIId q IIililIIilIIililIIilS !nTfeil3%v q IIS 02II8S
v i ?lI I iiS * q
q ^ ilS 5q q
S 5q q
S 5q q
S ^
q q
s b
q q
sq q
S 5q q
sc ç i q
2 69■•O) il#%
v q i 8 k ilîn 00S =ilg kilIkq qikq q
ikq q
isq q
isq q
ilq q
ilqIICNJ q
ik(NJ q
ikq q
2 *1fsIIii58q q iiRiq q ilihw q
;&q q
ilq q ililIsq q
Ikq q
R&co q
IIIIililIIE ii IIIIsiililIIliq q
2kq q
iiq q
îkq q
^5q q il^5 ilikq q ilikq q iiIkq q ilikq q
i P1(7E!■212
lifis
Jy2
iffig
ilI'IE
12lio - V1 R2
iE
!ihE
Hli5ilCO5|i
q :
t ?
pi sw
S
liM i lco'
E
liF^
E
iIcdE
11liG)
E
IIèSi ig
i■5î%ilili
fifigII85
2
182
X Nü O
■ I l
0 0
i l0 ra
ilII0 £i o 0 £
• î î
IfO N
«+- CD O 0 O
1 1
W ü
illîili r0 0 5 £*-■ c
oodVCL
"O c 0o? CL
= îin o? CL
lO0
0! | _
Il Ic N £ c
I l I fp u§ £ | w^ 4= Z
IZ

183
Table 5.19 Factors influencing HHs to switch rubber area to oil palm cultivation
Aspects Outcome Asset Vulnerability context Policy and institutional context
Financial - Continuous income - Saving for investment
- Government subsidy
Naturalresource
- Topography - Disease and pest- Flooding
Human - Capacity of HH labour
Physical - Land rights - TransportationSocial - Networks and
connections- Farmer institutions
Note: (D) = Dominant-influence factors
5.5.5 Factors influencing land owners to continue to leave areas abandoned
Different from land use strategies presented above, the means of overall priority
weights of all of five factors mentioned factors (see Table 5.8) were statistically significantly
different from the means of factors not mentioned by respondents (see Table 5.20). Among
the factors, saving for investment is distinctively given as the highest priority and this is
statistically significantly. The next priorities are given to a group of factors consisting of
capacity of HH labour, networks and connections, transportation and government subsidy,
which are statistically significantly higher than the rest of the factors (see Table 5.9 and
Table 5.20).
In terms of differences in the priority weights of factor whose means are statistically
significantly different from the means of factors not mentioned by respondents between area
category, the results show that the priority weights of these factors between the respondents
in the predominantly abandoned and paddy areas were not statistically significantly different
(see Figure 5.3a and Table 5.21).
To summarize, it can be clearly seen that the decision to continue leaving areas
abandoned was influenced by five dominant factors including saving for investment,
government subsidy, capacity of HH labour, transportation, networks and connections while
other factors were not mentioned as factors influencing the decision (see Table 5.22).

184
Taken together, the results indicate that the decision to continue to leave areas
abandoned is primarily because of a lack of savings for investment and government
subsidy. With raising these factors as the barriers to land switching, it can be interpreted that
the HHs are likely to switch their land to oil palm cultivation if they have enough money or
were subsidized by the government. Secondly, difficulty in switching abandoned areas to oil
palm cultivation is because of lack of HH labour capacity. Thirdly, location of land was
mentioned as a barrier to switching because of plots being far away from home and difficulty
in transporting oil palm product to market. Finally, it is reported that lack of motivation to
cultivate oil palm is associated with being unfamiliar with oil palm because of a lack of
network connections between oil palm growers.

w
D )C0 c CD 3
1 Î2
§ac0
1§C2
■ a
D )
I
iEc
Oh =cO )
Î
Î0
J =I -oCNi r i
_ 0
a:
" D0Co
■Oc0
0
> -OE :c S -S” 1 i:■> .5 d.ra1
i §
l i
IIj i j p
g
To Tq
11
§ §
9 q
T q
§ §
r§§ §
9 q
§ §
I I
i §
S i
9 q
T o
i ' lja ra
T o
§1
S i I l l s
I I
I I
3i
9 0
T o
II
I I
I I
8§ i l
I I
I I
l i
9 q
T o
I f§.
I I
I I
I I
I I
si
9 q
T o
1 1 I I
l l l l l î
I I
I I
ili|8r s i i
I I
s i
9 q
9 q
T o
I I
I I
S 'a
I I
s i
9 q
9 q
T o
I I
I I I
I I
I I
n i l
I I
S t
9 q
9 q
I I
nil
i i l i i
nilI I
m i l
I I
I I
I I
3 1
9 q
9 q
T o T o
l | 8
I I
I I
I I I I 11
I I
I I
q o
I I
9 o
9 8
| § S 8 8
I I
I I
8 8r i l l
n i l
1 1 I I
i l l 111
I I
I I
I I
n i l
r i r i i i
a s l l l
I I
3i
9 q
9 q
? l
I I
I I
I I
I I
I I
I I
3i
9 q
I I
isQ W
8
n i l
S8
I I
l l l l l l
s | l
I I
I I
I I
= s
I I I
I I
3i
El
9 q
T o
I I
q p s#l|I I
S os l l
I Is%
I I I I
I I
S oS8S
I I
l l l i
I I
si
9 8
El
I I
III I
I I
I I
i s
I I
I I
I I
8 Ü
S8S8
I I
I I r
I I
l l l l l l
nilI I
9 q
« I
T o T o
I I
II
II
S o
I I
I I
I I
I I
I I
si
9 q
II
9 8
O W
185
ro

186
8%
7 % -
6% -
5 % -
4 % -
3%F4 F 6 F7 F 1 0 F11 F 1 2 F 1 3 F 1 4 F 1 5 F 1 6 F 1 7 F 1 8 F 1 9 F 2 0 F21 F 2 2 F 2 3 F 2 4
■ P re d o m in an tly paddy a rea (n = 3 ) P redom inan tly ab an d o n ed a re a (n = 3 4 ) ■ A v era g e o f all land o w ners (n = 3 7 )
a. continuing abandon the areas
7 % -
6% -
5 % -
4 % -
3%F 9 F 1 0 F11 F 1 2 F 1 3 F 1 4 F 1 5 F 1 6 F 1 7 F 1 8 F 1 9 F 2 0 F21 F 2 2 F 2 3 F 2 4
P redom inan tly A v e ra g e o fab an d o n ed a re a (n = 2 4 ) " all land ow ers (n = 6 2 )
P redom inan tly rubber a rea (n = 2 9 )
P redom inantly p addy a rea (n = 9 )
b. switching to oil palm cultivation
Figure 5.3 Comparison of the priority weights for the factors influencing land owners to
continue to leave land abandoned or switch abandoned areas to oil palm cultivationNote; 1) F1=Profit
F5=Saving for investment F9=Policy of price F13=Diseases/pests F17=Skili/Knowledge F21=lrrigation
F2=Lump sum income F6=Credit for investment F10=Government subsidy F14=Flooding
F3=Continuous income F7=Price stability F11=Land topography F15=Disaster assistance
F18=Accessibility of employed labour F19=Transportation F20=Tools and equipment F22=Land rights F23=Networks and connections F24=Farmer institutions
2) The average of all land owners was calculated by adding the set of numbers up and dividing by the total number of landowners.
F4=0wn consumption F8=Trend of price F12=Water supply F16=Capacity of HH labour

187
Table 5.21 The statistically significant mean weight differences between the predominantly
paddy and abandoned areas of factors influencing HHs to continue to leave land abandoned
Overallrank
Factors Mean weight (%) Mann-WhitneyStatistic
Sig.(2-tailed)Predominantly
paddy areaPredominantly
abandoned area1 Saving for investment 6.67 6.48 28.5 .2 o r ''2 Capacity of HH labour 4.00 6.07 27 .170""'3 Networks and connections 4.00 5.57 33 .302""'4 Transportation 5.33 5.41 40.5 .551""'5 Government subsidy 4.00 4.49 25.5 .145""'
Note: 1) With Mann-Whitney U test, the null hypothesis (HO) Is that “there Is no difference between the median
of factor between the case studies”; reject HO If the actual Z-value Is less than the negative value of
the critical value of Z from the table or larger than the positive value of the critical value of Z from the
table
2) NS = not significant at the 5% probability level (P), * P<0.05, **P<0.01 and ***P<0.001
Table 5.22 Factors influencing HHs to continue to leave land abandoned
Aspects Outcome Asset Vulnerability context Policy and institutional context
Financial - Saving for investment
- Government subsidy
NaturalresourceHuman - Capacity of HH
labour ^Physical - TransportationSocial - Networks and
connections
Note: (D) = Dominant-influence factors
5.5.6 Factors influencing land owners to switch abandoned areas to oil palm cultivation
Although there are 16 factors mentioned by respondents (see Table 5.8), there are
only 14 factors for which the means of overall priority weights are statistically significantly
different from the means of factors not mentioned by respondents. Among the factors, the
highest priorities are given to a group of factors consisting of networks and connections,
land topography, continuous income and saving for investment, while the remaining factors

188
were not distinctively different from other factors mentioned by the respondents (see Table
5.9 and Table 5.23).
In terms of differences in the priority weights of factor whose means are statistically
significantly different from the means of factors not mentioned by respondents between area
category, the results show that the respondents in the predominantly paddy area considered
transportation more important than the respondents in the predominantly abandoned area,
continuous income and capacity of HH labour more important than the respondents in the
predominantly rubber area, and tools and equipment more important than the respondents
in both the abandoned and rubber area case studies. In addition, the respondents in the
predominantly abandoned area considered land topography more important than the
respondents in the predominantly paddy area, capacity of HH labour and credit for
investment more important than the respondents in the predominantly rubber area, and
flooding more important than the respondents in both the paddy and rubber areas case
studies. Nonetheless, the respondents in the predominantly rubber area considered farmer
institutions and tools and equipment more important than the respondents in the
predominantly abandoned area and land topography and flooding more important than the
respondents in both the predominantly paddy and abandoned areas (see Figure 5.3b and
Table 5.24).
To conclude, the analysis points outs four dominant factors influencing the decision
to cultivate oil palm in abandoned areas including to gain continuous income, saving for
investment, land topography and networks and connections. Other factors, even though not
dominant, influencing the decision are to gain profit, credit for investment, government
subsidy, flooding, capacity of HH labour, accessibility of employed labour, tools and
equipment, land rights, transportation and farmer institutions (see Table 5.25).
The results indicate that success in switching abandoned areas to oil palm cultivation
is significantly derived, firstly, from connections and networks with oil palm growers. It can
be clearly seen that the HHs could get motivation via learning about advantages and best
practice of oil palm cultivation from oil palm growers. Secondly, cultivating oil palm is
associated with the ability of oil palm to survive in areas that are not suitable for other crops,
paddy and rubber. It is clear from the evidence that oil palm was chosen to cultivate with the

189
reasons of suitability of land topography especially in the predominantly rubber area and
capacity to tolerate flooding in predominantly abandoned area.
Thirdly, in terms of financial conditions, the results show that willingness to cultivate
oil palm is derived from expectation in outcome of land use. Similar to switching to cultivate
oil palm from paddy and rubber areas, HHs expected the continuous income from land use
which is very clear in the predominantly paddy area. However, the HHs reported that they
also expected maximum profit from land use. Interestingly, it can be interpreted that
cultivating oil palm in abandoned areas might be the only way for the HHs to gain the profit
from use of this land. In addition, the results indicate that switching abandoned areas to oil
palm is possible because of sufficiency of saving for investment and government subsidy,
which is similar to the case of switching from paddy and rubber, and sufficiency of credit for
investment. Mentioning sufficiency of credit for investment, especially in the predominantly
abandoned area, might imply that the return of cultivating oil palm is profitable and deserves
the investment.
Fourthly, similar to the switching from paddy areas, the results show that the decision
to cultivate oil palm is because of HHs having enough HH labour especially in the
predominantly paddy and abandoned areas and because of HHs being able to employ
labour for farming. Fifthly, there are some physical factors influencing willingness to cultivate
oil palm. It is reported that the decision to cultivate oil palm is because of transportation
especially in the predominantly paddy area, as HHs need to be able easily to transport oil
palm products to the market. In addition, HHs especially in the predominantly paddy area
mentioned that their tools and equipment are suitable or can be adapted to be suitable for oil
palm cultivation. Sixthly, similar to the switching from both paddy and rubber areas, it is
reported that switching is possible because of land rights that facilitate HHs to cultivate oil
palm when they want. Finally, similar to the switching from rubber areas, the decision to
cultivate oil palm is based on the expectation that oil palm farmer institutions would provide
more favourable benefits for them.

0
2
1CD
•OCDCo•ocCD
• §
o
co5
( / )%XD)C0c(D31 Î2
■ §
cCDCD
CD.Q
§Ië
O)î
IEc0
k = c D)
■(/)
8
%
1CDsz
\ -
Rcri_ 0)
jQ3 ECDQ.
8
8 i l
8 i l i l
8 i l i l i l
8 i l i l i l i l
5 i l i l i l i l i l
£ i l i l i l i l i l
£ il. i l i l i l i l i l i l
£ § ! =T P V P I I i l
T Pi lT P
i lT P
i l7 P
i lT P
£ % § ! =V P
%T P
il:T P
i lT P
i l■7 P
i lT P
i lT P
i lT P
£ # I I i l I I I I I I 88C V P i l I I I I
£ R s I I 5 I i l I I #1 i l i l i l I I i l
£ 8 %C 4 P ?l I I ifecpI I i l i l<N qi l
9 P i l I i
£ 8 R' p%
8 ^T P
8h6° I I
s ®C ^ P i l c ^ P
^ ®9 P c ^ P i l 9 P
^ ®9 P
£% I I I I
S CO
? = n» pifeS I I I si
(N q I I i l I I< N p
I I( N p
8$ 2
i l # i l 58op q I I i l i l i l I I l l I I I I I I
8 % i l i l I I | i I I i l I I I I I I I I I I ? l I I I I
£ ï l ! l i I I I I i l I I I Iî li 8 I I i l I I I I I I I I I I
8 i lT M I I i l i l I I I I i l I I si i l i l i l i l i l i l i l i l i l
8 î %° î%T P i l I I # i l I I I I I I l i I I i l i l I I I I i l i l i l i l
£ iS î
r i I I i l i l l l i l"1Si I I
”lSi
”lS| I I
”LS:”LS: “1S| i l
"13s
8 i l là<? q I I I I i l I I i l i l i l I I i l
81S#i l i l i l i l i l I I I I I I
8 §Ssi i l I I i lsiT p i I I
Ï 2 î
?§i l i l i l °LSi I I i l I I i l I I I I I I I I
£ r$si
I I §8i l i l5 î
I I I I i l i lS î si
9§I I§198
ni• f S
al9 8
i l9 8
: i9 8
ni9 8 I I
SI9 8 i i
1I I£
I fmlif8
II11É
15
A
8
g#-26I I8
IIQ-S8
c
l l
8
h
éJ£
t f
11 o w
£
I I
CNÎS
Icri
5
clw
sɣ
î i
I Ii6S
IIg gCO
S
1£
f iCO£
I Ilêg£
u f
f iimi
IIb w
g
1g f
1§
■ilk§
I IIsi
190oX N
ü O■ Is
Ê Sf l(Q 0
"c .22 5 .5 ^ 2 sm
c. . g
o
fi0 mJ ° 0 0) . a
S-îË ^i■D
Opc>VX
■ocrooc5VX
LOo?
.Qro• §
lO0sz
N 0 h=c.Q O)ro3 B ‘w0 0 00 £ c0 E II
0 c/3S: 4= zCM

191
Table 5.24 The statistically significant mean weight differences between the predominantly
paddy, rubber and abandoned areas of factors influencing HHs to switch abandoned land to
oil palm cultivation
Overallrank Factors
Mean weight (%)Differences between predominantly paddy and abandoned areas
Differences between predominantly paddy
and rubber areas
Differences between predominantly rubber and abandoned areas
Paddyareas
Rubberareas
Abandonareas
Mann-WhitneyStatistic
Sig.(2-taiied)
Mann-WhitneyStatistic
Sig.(2-taiied)
Mann-WhitneyStatistic
Sig.(2-taiied)
1 Networks and connections 6.54 6.26 6.65 95 .598 ® 102 .327 "s 290.5 .303"s
2 Land topography 4.04 7.61 5.79 58.5 .043* 8.5 .000*** 104.5 .000***3 Continuous income 6.64 5.84 6.28 78 .224 59 .014* 250.5 .081 "*4 Saving for investment 5.82 6.34 5.48 75 .180"» 123 796"* 187.5 .004"*5 Flooding 4.76 4.51 6.56 29.5 .001** 106 .393"* 174.5 .002**6 Land rights 4.05 5.39 5.46 60 .051 77 .065"* 337 .843"*7 Capacity of HH labour 5.88 4.25 5.12 64 .074 50.5 .006** 237.5 .047*8 Transportation 4.85 4.71 4.07 56.5 .035* 112 .521 "* 250.5 .078"*9 Accessibility of
employed labour4.04 4.39 3.57 83 .295"^ 125 .848"* 265 .131 ''*
10 Profit 4.35 3.49 4.22 88.5 .420"^ 81 .081 "* 275 .181 "*11 Government subsidy 3.82 3.54 3.83 2.0 .373"» 103.5 .851 "* 100.5 .288"*12 Farmer institutions 3.35 4.09 3.27 77 .191 109.5 .463"* 226.5 .027*13 Credit for investment 4.21 3.38 3.76 4.7 .095"^ 74 .160"* 69.5 .031*14 Tools and equipment 4.17 3.42 3.27 11.2 .004** 28.5 .001** 48 .004**
Note: 1 ) With Mann-Whitney U test, the null hypothesis (HO) is that “there is no difference between the median
of factor between the case studies"; reject HO if the actual Z-value is less than the negative value of
the critical value of Z from the table or larger than the positive value of the critical value of Z from the
table
2) NS = not significant at the 5% probability level (P), * P<0.05, **P<0.01 and ***P<0.001
Table 5.25 Factors influencing HHs to switch abandoned land to oil palm cultivation
Aspects Outcome Asset Vulnerabilitycontext
Policy and institutional context
Financial - Profit- Continuous income
(D)
- Saving for investment
- Credit for investment
- Government subsidy
Naturalresource
- Topography - Flooding
Human - Capacity of HH labour
- Accessibility of employed labour
Physical - Tools and equipment
- Land rights
- Transportation
Social - Networks and connections
- Farmer institutions
Note: (D) = Dominant-influence factors

192
5.6 Conclusions: Factors influencing land use decisions
In summary, the quantitative analysis described above points out a variety of factors
influencing HHs to adopt land use strategies. With the priority weights and statistical
evidence, the findings suggest a ranking by importance of the factors influencing their
decisions, as summarized below;
Table 5.26 Factors influencing land use decisions
Land use strategiesFactors Continuing same use for: Switching to oil palm from:
Paddy Rubber Abandon Paddy Rubber AbandonExpected outcomes of land use
Profit - / - - - /Lump sum income / / - - -
Continuous income - - / / /Own consumption / - -
Financial factorsSaving for investment - / / / /Credit for investment - -
Policy of price / - -
Government subsidy / / / / /Natural resource factors
Land topography / / - / / /Water supply / - -
Diseases/pests - - /Flooding - - / / /Disaster assistance / - -
Human factorsCapacity of HH labour / / / / / /Accessibility of employed labour / - /
Physical factorsTransportation / / / / / /Tools and equipment / - /Irrigation / - -
Land rights / - - / / /Social factors
Networks and connections - - / / / /Farmer institutions - - - - / /
Note: / = Factors which influenced land use decisions
- = Factors which did not influence land use decisions
Expected outcomes of land uses: The expected outcomes of profit, lump sum
income, continuous income and own consumption are dominant factors influencing
decisions about land use. Profit from rubber and oil palm cultivation was important for

193
respondents deciding to continue rubber cultivation and for respondents deciding to switch
abandoned areas to oil palm cultivation respectively. Lump sum income from paddy and
rubber cultivation was also important for influencing respondents to continue paddy and
rubber cultivation and not to switch to oil palm. Continuous income is important in
influencing respondents to switch paddy, rubber and abandoned areas to cultivate oil palm.
In addition, cultivating paddy for their own consumption was important for respondents in
deciding to continue to cultivate paddy and not to switch to oil palm.
Financial factors: Saving for investing is a dominant factor influencing decisions in
land use in the paddy and abandoned areas. Saving for investing in oil palm was important
for allowing respondents to switch paddy, rubber and abandoned areas to oil palm.
Regarding other factors, capacity to access credit was important for respondents’ decisions
to switch abandoned areas to oil palm cultivation, and the policy of paddy price was
important for respondents to continue to cultivate paddy and not to switch to oil palm. In
terms of government subsidies, the subsidy for oil palm cultivation was important for
respondents to switch paddy, rubber and abandoned areas to oil palm cultivation, whereas
the subsidy for rubber cultivation was important for respondents to continue to cultivate
rubber and lack of subsidy for oil palm cultivation was important to make it difficult for
respondents to switch abandoned areas to oil palm.
Natural resource factors: Land topography is a factor influencing decisions in land
use in all areas. It was important in influencing respondents to switch paddy, rubber and
abandoned areas to cultivate oil palm. However, it also was important for respondents to
continue to cultivate paddy and rubber and not switch to oil palm. For other factors, water
supply was important for respondents to continue paddy cultivation. Disease and pest, was
an important factor in influencing respondents to switch rubber area to oil palm cultivation. In
addition, flooding was also important for respondents’ deciding to switch paddy, rubber and
abandoned areas to cultivate oil palm. However, disaster assistance also influenced
respondents to continue to cultivate paddy and not switch to oil palm.
Human factors: Capacity of HH labour was a dominant factor influencing decisions in
land use in all areas. It was important for respondents to continue to use land in the
traditional way in paddy, rubber and abandoned areas and also important for respondents to
switch paddy, rubber and abandoned areas to oil palm. Moreover, accessibility of employed

194
labour was also important for respondents to continue rubber cultivation and for respondents
to switch paddy and abandoned areas to oil palm.
Physical factors: Transportation was a dominant factor influencing decisions in land
use especially in the rubber and abandoned areas. It was important for respondents to
continue to use land in the traditional way in paddy, rubber and abandoned areas and for
respondents deciding to switch paddy, rubber and abandoned areas to oil palm. Tools and
equipment was an important factor for respondents deciding to continue rubber cultivation
and for respondents deciding to switch paddy and abandoned areas to cultivate oil palm.
Irrigation was important for respondents to continue paddy cultivation. In addition, land right
was also an important factor for land use decisions, both for respondents deciding to switch
paddy, rubber and abandoned areas to oil palm and for respondents deciding to continue
paddy cultivation.
Social factors: Networks and connections was a dominant factor influencing
decisions in land use especially in the paddy and abandoned areas. It was important for
land use decisions especially for respondents deciding to switch paddy, rubber and
abandoned areas to oil palm. However, they were also important for respondents deciding
to continue to leave areas abandoned. Farmer institution is an important factor in
respondents’ decisions to switch rubber and abandoned areas to oil palm.
5.7 Conclusions
This study explores HH characteristics and motivations determining farmers’
decisions as to whether to cultivate oil palm trees or not. The results show that, while there
are some similarities among the basic HH characteristics of OP growers and NOP growers,
several HH characteristics of OP growers and NOP growers are statistically significantly
different. These are: education of HHH, annual income of HH, size of owned area,
percentage of owned area and percentage of rental area in the predominantly paddy area;
total land area and size of owned area in the predominantly rubber area; and, age of HHH,
number of HH farming labourers, annual HH income, source of main income, total land area,
size of owned area and percentage of owned area in the predominantly abandoned area.
The results suggest a combination of factors that increases the likelihood of cultivating oil
palm in each area including:

195
Table 5.27 HH characteristics influencing decision to cultivate oil palm
Factors Predominantly paddy area
Predominantly rubber area
Predominantly abandoned area
Age of HHH - - Younger HHHEducation of HHHs Higher educational level
of HHH- -
Number of HH farming labourers
- - Larger number of HH farming labourers
Annual income of HH Larger annual HH income
- Larger annual HH income
Source of main income - - Having main income from the sale of crops
Total land area - Larger total land area Larger total land areaArea owned Larger size of owned
areaLarger size of owned area
Larger size of owned area
Ratio of owned area to total land area
Higher percentage of owned area
- Higher percentage of owned area
Ratio of rental area to total land area
Lower percentage of rental area
- -
For the motives which influence farmers’ decision to cultivate or not cultivate oil palm
trees, the results indicated that there are several factors influencing the decision and these
differ depending on types of land use strategies. These factors are:
- expected outcomes of land uses including profit, lump sum income, continuous
income and own consumption;
- financial factors including saving for investing, policy of price and government
subsidy;
- natural resource factors including land topography, water supply, diseases/pests,
flooding and disaster assistance;
- human factors including capacity of HH labour and accessibility of employed
labour; physical factors including transportation, tools and equipment, irrigation
and land rights; and
- social factors including networks and connections and farmer institutions.
For the combinations of factors influencing decision of farmers in each type of land
use strategies shown in table as below:
For decisions not to cultivate oil palm trees, the study results suggested that
continuing paddy cultivation is mainly influenced by expectation to cultivate paddy for own
consumption and gaining lump sum income, capacity of HH labour, and suitability of land

196
topography, while continuing rubber cultivation is mainly influenced by expectation to profit
from rubber cultivation, suitability of land topography, limitation or difficulty of transportation
and capacity of HH labour, and continuing to leave land abandoned is mainly influenced by
lack of saving for oil palm investment, capacity of HH labour, networks and connections,
limitation or difficulty of transportation and inaccessibility to government subsidy.
In the case of decisions to switch land to the cultivation of oil palm trees, the results
show that switching in paddy areas is mainly influenced by expectation of continuous
income from oil palm cultivation, networks and connections, sufficiency of saving for
investment and capacity of HH labour, while switching in rubber areas is mainly influenced
by unsuitability of land topography for rubber cultivation, and switching in abandoned areas
is mainly influenced by expectation of continuous income from oil palm cultivation, networks
and connections, land topography and sufficiency of saving for investment.

197
CHAPTER 6
FINANCIAL IMPACTS OF LAND USE SWITCHING ON
STAKEHOLDERS
6.1 Introduction
This chapter presents the research results regarding to the financial impacts of land
use switching on stakeholders. As mentioned previously in the chapter on methodology, the
results were derived from the input-output national accounts of Thailand, which provide the
flow of goods and services in the economy and the components of gross value added,
industry inputs and outputs, product supply and demand and detail the relationship between
producers, consumers, and marketing facilitators in each sector of the economy. The study
focuses on finding out the economic transactions and relevant stakeholders in the supply
chains of three alternative land uses and their relevant forward linkage industries. These
supply chains are: the chain of land use for paddy cultivation throughout the rice milling
industry, the chain of land use for rubber cultivation throughout the rubber sheet and block
rubber industry and the chain of land use for oil palm cultivation throughout the coconut and
palm oil industry (see Figure 6.1). In terms of the chain of land use for oil palm cultivation,
even though this study is interested particularly in the palm oil industry, this industry is not
reported separately because it is included in the coconut and palm oil sector. Even though it
is not possible to separate out palm oil from the sector, it makes sense to use the coconut
and palm oil sector as the forward linkage industry of oil palm cultivation because most of
the oil palm supply (88 to 96% of value of the total supply) is sold as an intermediate input
for this forward linkage sector.
Due to the analysis in this chapter mostly relating to the financial data from different
years (1995, 2000 and 2005), it is important to note that the financial values are presented
in real terms (i.e allowing for inflation). The inflation adjustments are made by using the CPI
and assuming 2005 as the base year. In addition, due to the data having come from
different sources, there are some discrepancies which are not an unusual feature of macro-

198
Clû
•a
X2TJ
XiX2
Q.
"O
" O•aQ. Cd
0X2jQ3
Q.
Q.T3
O 3roQ.
w3TJCroi1I000
3B-30 Q.
10
1
Q.2D)O0O)COEEoüCD
23O)

199
economic data (Bourguignon et al., 2008). Even though there are discrepancies, it is
necessary to provide data from different sources as the basic statistics to describe the
change in the intended financial values.
This chapter firstly describes the operational and financial performance of crop
cultivations and their forward linkage processors. Secondly, the chapter describes the value
created in the supply chains of land use, from crop farming to industrial processing stage,
and their contributions to stakeholders. Finally, the chapter discusses the financial impacts
on stakeholders caused by switching land use from paddy and rubber to oil palm.
6.2 Operational and financial performance of crop cultivations and forward linkage industries
6.2.1 Paddy and rice milling sector
Both the area under paddy cultivation and paddy harvesting area (please note that
some paddy rice is often not harvested; hence the distinction between the areas under
paddy cultivation and the areas of paddy that were harvested) have increased continually.
The harvesting area has increased from 8,847,833 Ha in 1995 to 9,714,667 and 10,041,952
Ha in 2000 and 2005 respectively. The supply of paddy is mainly from domestic production
which accounts for 95 to 100% of the total supply while 1 to 5% in some years is from stock
with only a very small amount being imported (Table 6.1). The value of domestic production
decreased slightly from 1995 (133 billion Baht) to 2000 (129 billion Baht) while it increased
dramatically to 184 billion Baht in 2005. It can be seen that the increase of the value of
supply is derived from the increased paddy price and expansion of cultivation area resulting
in an increase in the quantity of supply. The main cause of the decrease in value in 2000,
was from a decrease in the price. This is because the value of supply decreased while the
supply quantity increased.
For production in the paddy sector, data in the table indicates that the majority of the
value of the paddy sector (43 to 67%) is accounted for by the operating surplus finally paid
to farmers. Although it accounts for the largest proportion, its value tended to decrease. The
value stood at 89 billion Baht in 1995 but fell significantly to 56 billion Baht in 2000 before

200
Table 6.1 Land use, crop price, supply, input expenditure and pattern of sales of the paddysector
Year 1995 2000 2005Value % Value % Value %
AreasLand under paddy cultivation (Ha) 9,873,754 10,501,713 10,669,987Harvesting area (Ha) 8,847,833 9,714,667 10,041,952
OutputTotal output (Tonne) 20,678,616 24,944,112 29,774,455Average output (kg./ Ha of harvesting area) 2,337 2,568 2,965
Paddy price (Baht per tonne) 5,587 5,382 6,607Total supply (Thousand Baht)^'
Domestic production 132,788,724 100 129,283,233 95 183,942,110 99Imports 0 0 43 0 16 0Stock 0 0 6,154,748 5 1,041,279 1Total 132,788,724 100 135,438,023 100 184,983,405 100
Input expenditure (Thousand Baht)Intermediate input
Fertilizer and pesticides 10,275,992 8 20,134,122 16 34,415,352 19Paddy 6,272,873 5 4,484,424 3 7,163,171 4Agricultural services 9,614,887 7 9,641,046 7 5,291,893 3Petroleum refineries 184,384 0 1,566,157 1 4,718,488 3Banking services 2,921,986 2 1,906,916 1 4,506,998 2Cutlery and hand tools 305,734 0 854,724 1 2,307,741 1Other 1,245,046 1 772,516 1 1,013,977 1
Total 30,820,904 23 39,359,903 30 59,417,620 32Depreciation 2,604,835 2 2,617,701 2 4,474,449 2Indirect taxes less subsidies 350,467 0 12,607 0 454 0Wages and salaries 9,987,088 8 30,795,806 24 40,639,420 22Operating surplus 89,025,430 67 56,497,215 44 79,410,167 43Total 132,788,724 100 129,283,233 100 183,942,110 100
Pattern of sales (Thousand Baht)Intermediate input" '
Rice milling 117,117,977 88 126,943,832 94 170,983,473 92Paddy 6,271,197 5 4,483,241 3 7,161,486 4Poultry and its products 2,327,924 2 1,452,775 1 2,110,694 1Cattle and buffalo 1,220,903 1 1,067,632 1 1,920,864 1Other 2,672,662 2 1,291,133 1 2,578,992 1Total 129,610,663 98 135,238,613 100 184,755,509 100
Private consumption expenditure 86,856 0 83,882 0 115,347 0Government consumption expenditure 113,830 0 115,398 0 112,549 0Gross domestic fixed capital formation 0 0 0 0 0 0Increase in stock 2,977,370 2 0 0 0 0Export 6 0 130 0 0 0Total 132,788,724 100 135,438,023 100 184,983,405 100
Source:1/ Office of Agricultural Economics (CAE). The price is presented in real value. The inflation adjustments
for the price are made by using the CPI and assuming 2005 as the base year
2/ Author’s calculation based on Input-Output table 1995, 2000 and 2005, derived from the Office of the
National Economic Development Board (NEDS). The table is presented in real value. The inflation
adjustments are made by using the CPI and assuming 2005 as the base year
3/ Input expenditures are from national Input-Output table categories

201
rising to 79 billion Baht in 2005. The second highest share of expenditure (23 to 32%) is for
intermediate inputs of which the value tended to increase dramatically. The value which was
31 billion Baht in 1995 increased significantly in 2000 (39 billion Baht) and become nearly
double in 2005 (59 billion Baht). Among intermediate inputs, it can be clearly seen that
fertilizer and pesticides account for the majority (8 to i 9% of the paddy sector value) and
their shares and values have tended to increase significantly. Their values were
approximately double and triple from 1995 (10 billion Baht) to 2000 (20 billion Baht) and
2005 (34 billion Baht) respectively. For the remaining significant expenditure, 8 to 24% of
the value of the paddy sector is for wages and salaries. Their value has tended to increase
dramatically. The value was approximately triple and four times from 1995 (10 billion Baht)
to 2000 (31 billion Baht) and 2005 (41 billion Baht) respectively.
The pattern of sales from the sector indicates that most of the paddy supply is sold
as an intermediate input for the forward linkage sector (98 to 100% of the value of the total
supply). This value has increased continually from 130 billion Baht in 1995 to 135 and 184
billion Baht in 2000 and 2005 respectively. The rest of the paddy is accounted for by private
consumption by households and private non-profit organizations, government consumption
and that kept as stock. Regarding selling paddy as an intermediate input, the pattern shows
the importance of sales to the rice milling sector, which accounts for 88 to 94% of the value
of total paddy supply. Similar to the trend in sales of all crops as intermediate input , its
value increased continually from 117 billion Baht in 1995 to 127 and 171 billion Baht in 2000
and 2005 respectively (Table 6.1).
For the rice milling sector, supply is mainly from domestic production (85 to 100%)
while 9 to 14% in some years is from stock, with again only a very small amount being
imported (Table 6.2). In domestic production, most of the value of the rice milling sector (82
to 87%) is paid for intermediate input of which the value has tended to increase continually.
The value which was 127 billion Baht in 1995 increased significantly to 136 and 190 billion
Baht in 2000 and 2005 respectively. Among intermediate inputs, it can be clearly seen that
paddy accounts for the majority (78 to 83% of the rice milling sector value). Although its
share tended to decrease slightly, its value increased continually from 121 billion Baht in
1995 to 131 and 176 billion Baht in 2000 and 2005 respectively. For the remaining

202
Table 6.2 Supply, input expenditure and pattern of sales of the rice milling sector
Year 1995 2000 2005Value % Value % Value %
Total supply (Thousand Baht)Domestic production 145,980,568 85 165,957,382 90 224,892,858 100Imports 254,001 0 294,573 0 44,341 0Stock 24,731,089 14 17,205,103 9 0 0Total 170,965,658 100 183,457,059 100 224,937,199 100
Input expenditure (Thousand Baht)intermediate input
Paddy 120,550,475 83 130,739,960 79 176,378,589 78Electricity 954,187 1 1,507,451 1 7,722,060 3Banking services 2,995,132 2 659,094 0 1,325,347 1industrial machinery 683,668 0 599,387 0 965,846 0Petroleum refineries 189,073 0 345,573 0 764,262 0Insurance services 1,064,587 1 579,196 0 647,779 0Other 1,045,616 1 1,533,089 1 2,656,805 1Total 127,482,738 87 135,963,750 82 190,460,688 85
Depreciation 941,163 1 1,205,907 1 1,687,662 1Indirect taxes less subsidies 786,234 1 593,571 0 443,765 0Wages and salaries 7,330,616 5 12,041,142 7 14,395,706 6Operating surplus 9,439,816 6 16,153,013 10 17,905,037 8Total 145,980,568 100 165,957,382 100 224,892,858 100
Pattern of sales (Thousand Baht)Intermediate transactions 32,658,861 19 26,103,420 14 43,109,126 19Private consumption expenditure 76,045,726 44 89,492,927 49 88,288,124 39Government consumption expenditure 8,553 0 537,698 0 7,960 0Gross domestic fixed capital formation 0 0 0 0 0 0Increase in stock 0 0 0 0 7,390,321 3Export 62,252,518 36 67,323,013 37 86,141,668 38Total 170,965,658 100 183,457,059 100 224,937,199 100
Source: Author’s calculation based on Input-Output table1995, 2000 and 2005, derived from the
Office of the National Economic Development Board (NEDB). The table is presented in real
value. The inflation adjustments are made by using the CPI and assuming 2005 as the base
year
Note: 1/ Input expenditures are from national Input-Output table categories
expenditure, 6 to 10% is for wages and salaries and 5 to 7% is accounted for by the
operating surplus finally paid to rice milling entrepreneurs. The value of expenditure for
wages and salaries increased significantly from 7 billion Baht in 1995 to 12 billion Baht in
2000 and became double (14 billion Baht) in 2005. Similar to the trend in expenditure for
wages and salaries, the value of operating surplus increased significantly from 9 billion Baht
in 1995 to 16 billion Baht in 2000 and became double (18 billion Baht) in 2005.
203
The pattern of sales from the sector indicates that most of the supply of the rice
milling sector is sold for private consumption (39 to 49% of value of total supply) followed by
export (36 to 38%) and the forward linkage sector (14 to 19%). The value of sales for private
consumption increased significantly from 76 billion Baht in 1995 to 89 billion Baht in 2000
however it decreased slightly to 88 billion Baht in 2005. The value of sales for export
increased continually from 62 billion Baht in 1995 to 67 and 86 billion Baht in 2000 and 2005
respectively. The value of sales for the forward linkage sector increased significantly from 33
billion Baht in 1995 to 43 billion Baht in 2005 even though it decreased to 26 billion Baht in
2000.
6.2.2 Rubber and rubber sheet and block rubber sector
Similar to the trend in the paddy sector, the area under rubber cultivation and rubber
harvesting area (as with paddy rice some of the cultivated area of rubber was not harvested)
have increased continually. Harvesting area has increased from 1,276,359 Ha in 1995 to
1,462,076 and 1,691,099 Ha in 2000 and 2005 respectively. For the supply of rubber, it is
mainly from domestic production which accounts for 94 to 100% of the value of total supply
while 6% in 2000 is from stock and a very small amount is imported (Table 6.3).
The value of domestic production, which stood at 79 billion Baht in 1995, decreased
significantly in 2000 (50 billion Baht) before increasing dramatically in 2005 (160 billion
Baht). Compared to 1995, the differences in values of the sector in 2000 and 2005 reflect
the influence of the rubber sheet price in the value of the sector. Assuming 2005 as the base
year, the real price of rubber sheet, which stood at 42,925 Baht/tonne in 1995, dropped
dramatically to 24,102 in 2000 and then increased significantly to 53,570 Baht/tonne in 2005
(Author’s calculation based on nominal price collected by Office of Agricultural Economic
and deflated by CPI).
For production in the rubber sector, data in the table indicates that the majority of the
value of the rubber sector (62 to 63%) is accounted for by the operating surplus finally paid
to farmers, while 17 to 18% of the value of the rubber sector is paid in wages and salaries.
15 to 17% of total expenditure is for intermediate inputs, of which fertilizer and pesticides
account for the majority (7 to 9% of the value of the rubber sector).
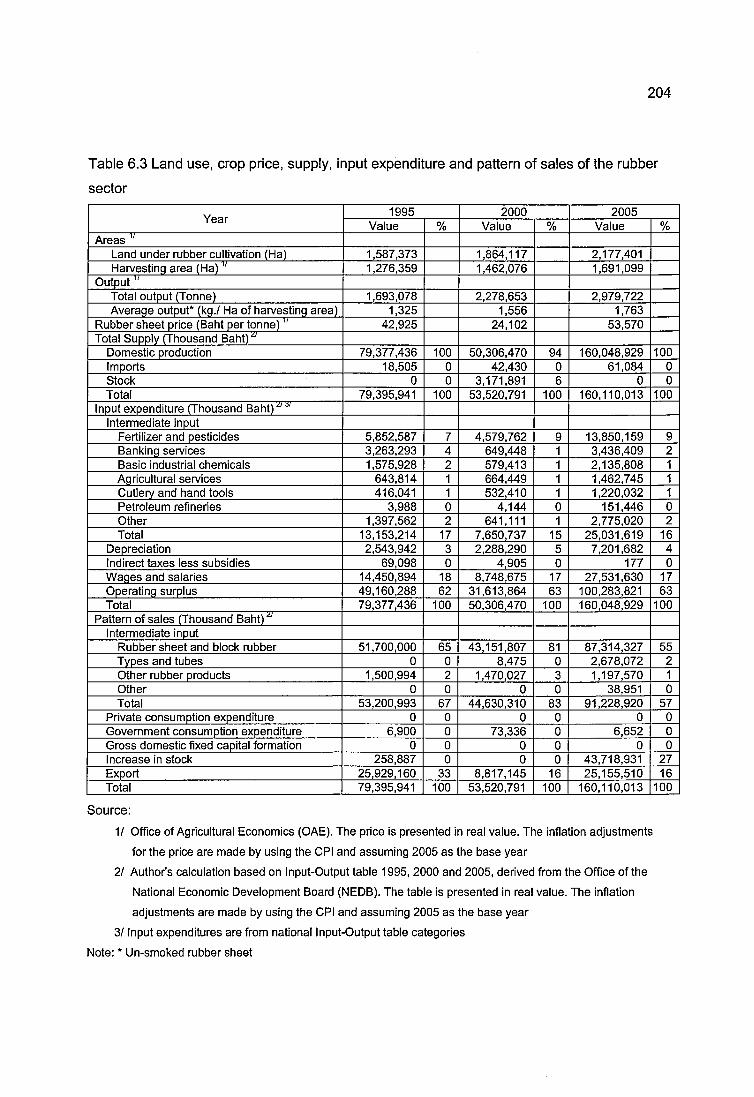
204
Table 6.3 Land use, crop price, supply, input expenditure and pattern of sales of the rubbersector
Year 1995 2000 2005Value % Value % Value %
AreasLand under rubber cultivation (Ha) 1,587,373 1,864,117 2,177,401Harvesting area (Ha) " 1,276,359 1,462,076 1,691,099
OutputTotal output (Tonne) 1,693,078 2,278,653 2,979,722Average output* (kg./ Ha of harvesting area) 1,325 1,556 1,763
Rubber sheet price (Baht per tonne) 42,925 24,102 53,570Total Supply (Thousand Baht)
Domestic production 79,377,436 100 50,306,470 94 160,048,929 100Imports 18,505 0 42,430 0 61,084 0Stock 0 0 3,171,891 6 0 0Total 79,395,941 100 53,520,791 100 160,110,013 100
Input expenditure (Thousand Baht)'^'*'Intermediate input
Fertilizer and pesticides 5,852,587 7 4,579,762 9 13,850,159 9Banking services 3,263,293 4 649,448 1 3,436,409 2Basic industrial chemicals 1,575,928 2 579,413 1 2,135,808 1Agricultural services 643,814 1 664,449 1 1,462,745 1Cutlery and hand tools 416,041 1 532,410 1 1,220,032 1Petroleum refineries 3,988 0 4,144 0 151,446 0Other 1,397,562 2 641,111 1 2,775,020 2Total 13,153,214 17 7,650,737 15 25,031,619 16
Depreciation 2,543,942 3 2,288,290 5 7,201,682 4Indirect taxes less subsidies 69,098 0 4,905 0 177 0Wages and salaries 14,450,894 18 8,748,675 17 27,531,630 17Operating surplus 49,160,288 62 31,613,864 63 100,283,821 63Total 79,377,436 100 50,306,470 100 160,048,929 100
Pattern of sales (Thousand Baht)Intermediate input
Rubber sheet and block rubber 51,700,000 65 43,151,807 81 87,314,327 55Types and tubes 0 0 8,475 0 2,678,072 2Other rubber products 1,500,994 2 1,470,027 3 1,197,570 1Other 0 0 0 0 38,951 0Total 53,200,993 67 44,630,310 83 91,228,920 57
Private consumption expenditure 0 0 0 0 0 0Government consumption expenditure 6,900 0 73,336 0 6,652 0Gross domestic fixed capital formation 0 0 0 0 0 0Increase in stock 258,887 0 0 0 43,718,931 27Export 25,929,160 33 8,817,145 16 25,155,510 16Total 79,395,941 100 53,520,791 100 160,110,013 100
Source:1/ Office of Agricultural Economics (CAE). The price is presented in real value. The inflation adjustments
for the price are made by using the CPI and assuming 2005 as the base year
2/ Author’s calculation based on Input-Output table 1995, 2000 and 2005, derived from the Office of the
National Economic Development Board (NEDB). The table is presented in real value. The inflation
adjustments are made by using the CPI and assuming 2005 as the base year
3/ Input expenditures are from national Input-Output table categories
Note: * Un-smoked rubber sheet

205
Similar to the trend in supply, the value of expenditure for operating surplus, and
wages and salaries were closely related to the price of rubber sheet. Based on this
relationship, their values decreased significantly from 1995 (49 billion Baht for operating
surplus and 14 billion Baht for wages and salaries) to 2000 (28 billion Baht for operating
surplus and 9 billion Baht for wages and salaries); however the values increased
dramatically to nearly triple in 2005 (100 billion Baht for operating surplus and 32 billion Baht
for wages and salaries). In the case of expenditure for intermediate inputs, although this
expenditure was not directly related to the rubber sheet price, it seemed that the change of
the price influenced the value of expenditure invested in the sector. It can be clearly seen
that the value, which stood at 13 billion Baht in 1995, decreased significantly in 2000 (8
billion Baht) before increasing dramatically in 2005 (25 billion Baht). However, there are
some items in this expenditure for which the value increased continually even though the
rubber sheet price decreased. These include agricultural services, cutlery and hand tools,
and petroleum refineries. Similarly, the value of expenditure for fertilizer and pesticides,
which accounts for the majority of intermediate inputs (7 to 9% of the value of the rubber
sector), increased significantly in 2005 even though it decreased slightly in 2000.
The pattern of sales from the sector indicates that most of the rubber supply is sold
as an intermediate input for the forward linkage sector (57 to 83% of the value of the total
supply) while 16 to 33% is for export and the rest is sold to the government and kept as the
stock. Regarding selling rubber as an intermediate input, the pattern shows the importance
of sales to the rubber sheet and block rubber sector, which accounts for 65 to 81% of the
value of total rubber supply (Table 6.3). Similarly to the trend in supply, the value of sale for
overall intermediate input decreased significantly from 52 billion Baht in 1995 to 43 billion
Baht in 2000, however the value increased dramatically to 87 billion Baht in 2005. The value
of export sales decreased slightly from 26 billion Baht in 1995 to 25 billion Baht in 2005 even
though the values decreased dramatically to 9 billion Baht in 2000.
For the rubber sheet and block rubber sector, supply is mainly from domestic
production (99%) while 1% is imported (Table 6.4). In domestic production, most of the
value of the rubber sheet and block rubber sector (77 to 91%) is paid for intermediate input
of which the expenditure for the rubber sector is the majority (65 to 81% of the value of
rubber sheet and block rubber sector). For the trend in value of expenditure for the rubber

206
Table 6.4 Supply, input expenditure and pattern of sales of the rubber sheet and blockrubber sector
Year 1995 2000 2005Value % Value % Value %
Total supply (Thousand Baht)Domestic production 70,298,453 99 69,878,076 99 134,453,635 99Imports 689,408 1 781,839 1 1,659,863 1Stock 0 0 0 0 0 0Total 70,987,862 100 70,659,915 100 136,113,498 100
Input expenditure (Thousand Baht)Intermediate input
Rubber 57,425,030 82 46,147,032 66 95,982,406 71Basic industrial chemicals 1,747,987 2 3,441,408 5 8,457,928 6Petroleum refineries 265,058 0 616,374 1 1,717,639 1Banking services 1,881,592 3 437,467 1 1,528,523 1Electricity 198,803 0 642,726 1 1,425,058 1Rubber sheet and block rubber 304,491 0 736,298 1 1,338,824 1Other 1,845,497 3 2,072,791 3 4,085,352 3Total 63,668,459 91 54,094,096 77 114,535,730 85
Depreciation 1,499,511 2 2,805,304 4 3,723,361 3Indirect taxes less subsidies 545,909 1 749,869 1 575,854 0Wages and salaries 3,179,679 5 5,269,599 8 7,357,014 5Operating surplus 1,404,895 2 6,959,207 10 8,261,676 6Total 70,298,453 100 69,878,076 100 134,453,635 100
Pattern of sales (Thousand Baht)Intermediate transactions 27,278,327 38 25,825,061 37 25,251,857 19Private consumption expenditure 0 0 0 0 0 0Government consumption expenditure 0 0 0 0 0 0Gross domestic fixed capital formation 0 0 0 0 0 0Increase in stock 1,963,994 3 604,105 1 13,078,831 10Export 41,745,540 59 44,230,749 63 97,782,810 72Total 70,987,862 100 70,659,915 100 136,113,498 100
Source: Author’s calculation based on Input-Output tablet 995, 2000 and 2005, derived from the Office of the
National Economic Development Board (NEDB). The table is presented in real value. The inflation
adjustments are made by using the CPI and assuming 2005 as the base year
Note: 1/ Input expenditures are from national Input-Output table categories
sector, it can be clearly seen that the value was closely related to the rubber price. The
value, which was 57 billion Baht in 1995, decreased significantly to 46 billion Baht in 2000
before increasing dramatically to 96 billion Baht in 2005. This trend was different from that of
other intermediate inputs which increased continually except expenditure for banking
services which tended to decrease, especially in 2000. For the remaining expenditure, 5 to
8% is for wages and salaries and 2 to 10% is accounted for by the operating surplus. Unlike
those in the farming stage, the value of expenditure for wages and salaries, and operating
surplus increased continually. In the case of wages and salaries, it increased from 3 billion

207
Baht in 1995 to 5 and 7 billion Baht in 2000 and 2005 respectively. The operating surplus
increased from 1 billion Baht in 1995 to 7 and 8 billion Baht in 2000 and 2005 respectively.
The pattern of sales from the sector indicates that most of the supply of rubber sheet
and block rubber is sold for export (59 to 72% of the value of the total supply) followed by for
the forward linkage sector (19 to 38%) and for keeping in stock (1 to 10%). The value of
exports increased slightly from 42 billion Baht in 1995 to 44 billion Baht in 2000 before
increasing dramatically to 98 billion Baht in 2005. The value of sales for the forward linkage
sector tended to decrease continually from 27 billion Baht in 1995 to 26 and 25 billion Baht
in 2000 and 2005 respectively.
6.2.3 Oil palm and coconut and palm oil sector
Similar to the trend in the paddy and rubber sectors, the area under oil palm
cultivation and oil palm harvesting area (some oil palm was not harvested) have increased
continually. The harvesting area increased from 153,422 Ha in 1995 to 230,053 and
324,193 Ha in 2000 and 2005 respectively. For the supply of oil palm is mainly from
domestic production. It accounts for 98 to 100% of the value of the total supply, while 1 to
2% in some years is imported (Table 6.5). The value of domestic production increased
continually. There was a slight increase from 6 billion Baht in 1995 to 8 billion Baht 2000 and
it became triple at 19 billion Baht in 2005. It can be seen that expansion of harvesting area
influenced significantly the increase in the value. This is because even though the price
tended to decreased from 1995 (2,821 Baht per tonne) to 2000 (1,858 Baht per tonne) and
2005 (2,760 Baht per tonne), the values of supply increased continually.
In the phase of agricultural production, data in the table indicates that the majority of
the value of the oil palm sector (40 to 57%) is accounted for by the operating surplus finally
paid to farmers, while 29 to 34% is expended for intermediate inputs where fertilizer and
pesticides are the majority (15 to 27% of the value of oil palm sector) and their shares have
tended to increase significantly. For the remaining expenditure, 13 to 17% of the value of oil
palm sector is for wages and salaries. In terms of operating surplus, even though its share
tended to decreased, the value tended to increased. Its value increased from 4 billion Baht
in 1995 to 8 billion Baht 2005 even though there is a little drop to 3 billion Baht in 2005. In

208
Table 6.5 Land use, crop price, supply, input expenditure and pattern of sales of the oil palmsector
Year 1995 2000 2005Value % Value % Value %
AreasLand under oil palm cultivation (Ha) 178,939 265,590 439,692Harvesting area (Ha) 153,422 230,053 324,193
OutputTotal output (Tonne) 2,254,098 3,342,923 5,002,670Average output (kg./ Ha of harvesting area) 14,694 14,531 15,431
Oil palm price (Baht per tonne) 2,821 1,858 2,760Total Supply (Thousand Baht)'"
Domestic production 6,362,827 100 7,724,488 98 19,206,280 99Imports 3,987 0 133,664 2 230,176 1Stock 0 0 0 0 0 0Total 6,366,814 100 7,858,152 100 19,436,456 100
Input expenditure (Thousand Baht)'"'*'Intermediate input
Fertilizer and pesticides 941,096 15 1,830,352 24 5,202,182 27Cutlery and hand tools 228,689 4 358,871 5 985,723 5Petroleum refineries 164,145 3 246,261 3 874,178 5Agricultural services 155,257 2 175,781 2 438,636 2Banking services 199,583 3 183,401 2 357,138 2Oil palm 73,527 1 75,849 1 201,805 1Other 90,594 1 91,974 1 164,432 1Total 1,852,892 29 2,962,489 38 8,224,094 43
Depreciation 77,446 1 39,396 1 123,067 1Indirect taxes less subsidies 3,251 0 753 0 27 0Wages and salaries 827,335 13 1,326,854 17 3,088,575 16Operating surplus 3,601,903 57 3,394,996 44 7,770,517 40Total 6,362,827 100 7,724,488 100 19,206,280 100
Pattern of sales (Thousand Baht) Intermediate input
Coconut and palm oil 5,838,030 92 6,931,166 88 18,585,826 96Oil palm 71,959 1 71,865 1 191,899 1Total 5,909,990 93 7,003,031 89 18,777,725 97
Private consumption expenditure 182,071 3 152,247 2 378,549 2Government consumption expenditure 0 0 0 0 0 0Gross domestic fixed capital formation 0 0 0 0 0 0Increase in stock 0 0 0 0 0 0Export 274,753 4 702,874 9 280,182 1Total 6,366,814 100 7,858,152 100 19,436,456 100
Source:1/ Office of Agricultural Economics (CAE). The price is presented in real value. The inflation adjustments
for the price are made by using the CPI and assuming 2005 as the base year
2/ Author’s calculation based on Input-Output tablet 995, 2000 and 2005, derived from the Office of the
National Economic Development Board (NEDB). The table is presented in real value. The inflation
adjustments are made by using the CPI and assuming 2005 as the base year
3/ Input expenditures are from national Input-Output table categories

209
the case of expenditure for intermediate inputs, it can be clearly seen that both share and
value increased continually. The value increased slightly from 2 billion Baht in 1995 to 3
billion Baht 2000 before becoming more than four times in 2005 (8 billion Baht). In this case,
it can be clearly seen the influence of fertilizer and pesticides which play an important role in
the expenditure. Their share and value increased significantly. The values doubled from 1
billion Baht in 1995 to 2 billion Baht 2000 and become more than five times in 2005 (5 billion
Baht). For the expenditure of wages and salaries, the value increased slightly from 0.8
billion Baht in 1995 to 1.3 billion Baht 2000 before becoming nearly three times in 2005 (3
billion Baht).
For agricultural output distribution, most of the oil palm supply is sold as an
intermediate input for the forward linkage sector (89 to 97% of value of the total supply). Its
value increased continually from 6 billion Baht in 1995 to 7 and 19 billion Baht in 2000 and
2005 respectively. For the rest oil palm, 1 to 9% is for export and 2 to 3% is sold for private
consumption. Regarding selling oil palm as an intermediate input, the pattern shows the
importance of sales to the coconut and palm oil sector, which accounts for 88 to 96% of the
value of total oil palm supply (table 6.5).
In terms of feedstock feeding the industrial sector, supply is mainly from domestic
production (93 to 97%) while 3 to 7% is imported (Table 6.6). In domestic production, most
of the value of coconut and palm oil sector (69 to 84%) is paid for intermediate input of
which the value tended to increase continually. The value which was 9 billion Baht in 1995
increased significantly to 18 and 31 billion Baht in 2000 and 2005 respectively. Among
intermediate inputs, it can be clearly seen that expenditure for oil palm accounts for the
majority (34 to 57% of the value of the coconut and palm oil sector) and its value increased
continually. The value, which stood at 7 billion Baht in 1995, increased slightly to 8 billion
Baht in 2000 before becoming triple at 21 billion Baht in 2005. For the remaining
expenditure, 11 to 25% of expenditure in the sector is accounted for by the operating
surplus and 3 to 4% is for wages and salaries. The value of expenditure for operating
surplus increased slightly from 3 billion Baht in 1995 to 5 billion Baht in 2000 before
dropping slightly to 4 billion Baht in 2005. The value of wages and salaries increased
continually from 0.4 billion Baht in 1995 to 0.9 and 1.3 billion Baht in 2000 and 2005
respectively.

210
Table 6.6 Supply, input expenditure and pattern of sales of the coconut and palm oil sector
Year 1995 2000 2005Value % Value % Value %
Total supply (Thousand Baht)Domestic production 12,649,784 93 23,812,864 97 37,019,129 95Imports 987,340 7 751,630 3 1,761,120 5Stock 0 0 0 0 0 0Total 13,637,125 100 24,564,494 100 38,780,249 100
Input expenditure (Thousand Baht) 0 0Intermediate input 0 0
Oil palm 6,744,241 53 7,986,422 34 21,209,631 57Coconut and palm oil 0 0 6,624,049 28 5,788,377 16Basic industrial chemicals 68,583 1 202,093 1 804,205 2Coconut 446,443 4 388,929 2 730,858 2Other 1,453,429 11 2,370,856 10 2,514,681 7Total 8,712,698 69 17,572,350 74 31,047,752 84
Depreciation 141,148 1 306,441 1 304,547 1Indirect taxes less subsidies 196,315 2 197,116 1 147,368 0Wages and salaries 420,705 3 995,476 4 1,336,323 4Operating surplus 3,178,919 25 4,741,481 20 4,183,139 11Total 12,649,784 100 23,812,864 100 37,019,129 100
Pattern of sales (Thousand Baht) 0 0Intermediate transactions 7,408,443 54 13,563,350 55 12,119,268 31Private consumption expenditure 5,378,729 39 7,664,444 31 20,937,469 54Government consumption expenditure 0 0 0 0 0 0Gross domestic fixed capital formation 0 0 0 0 0 0Increase in stock 316,290 2 1,555,245 6 1,758,622 5Export 533,664 4 1,781,454 7 3,964,890 10Total 13,637,125 100 24,564,494 100 38,780,249 100
Source: Author’s calculation based on Input-Output table 1995, 2000 and 2005, derived from the Office of the
National Economic Development Board (NEDB). The table is presented in real value. The inflation
adjustments are made by using the CPI and assuming 2005 as the base year
Note: 1/ Input expenditures are from national Input-Output table categories
The pattern of sales from the sector indicates that most of the supply of coconut and
palm oil is sold to the forward linkage sector (31 to 55%) and for private consumption (31 to
54%). The remaining supply is sold for export (4 to 10%) and for keeping in stock (2 to 6%).
The value of sales for the forward linkage sector increased significantly from 7 billion Baht in
1995 to 14 billion Baht in 2000 before decreasing slightly to 12 billion Baht in 2005.The
value of sales for private consumption tended to increase slightly from 5 billion Baht in 1995
to 8 billion Baht in 2000 before increasing dramatically to 21 billion Baht in 2005.
In terms of the proportion of palm oil in Thailand that went to biodiesel production,
data in the input-output national accounts in 1995, 2000 and 2005 reported that only a very

211
small proportion (less than 0.02% of total value of the coconut and palm oil used for
intermediate input in downstream industries) was for the petroleum products sector.
However, the proportion of palm oil that goes to biodiesel increased significantly after
launching the biodiesel development project in 2008. In 2012, 28% of palm oil was used for
biodiesel production while most palm oil was still for vegetable oil (42%), other food
industries (17%) and soap (7%) (Kasikorn Research Center, 2012).
In summary, the value of supply of paddy, rubber and oil palm derived from domestic
production increased continually except for the value of rubber supply which decreased
significantly in 2000. It can be clearly seen that significant increases in the values were
derived from expansion of harvesting areas. Even though there were some drops in output
prices in some years, expansion of harvesting areas contributed most to increasing the
value of supply of all the crops. In terms of contribution of crop farming to the economy, it
can be clearly seen that most of the crop output from farming is for use as raw material in a
forward linkage industry. Their values would be added to in the industrial process and then
they would be sold to the final user.
At the crop farming stage, the value created in crop cultivation is mostly used for
operating surplus, accounting for approximately 50% of the value of each sector (especially
in the rubber sector where its share was more than 60%) followed by intermediate input
expenditure, and wages and salaries. Regarding the expenditure for intermediate input, it
can be clearly seen that fertilizer and pesticides have played an important role in the
expenditure; their shares and values tended to increased continually in every sector
especially in the oil palm sector for which the range of shares was from 15 to 27%.
In the forward linkage industry, contrary to the sector in farming stage, the value
created is mostly paid for intermediate input, accounting for more than 69% of each sector
(especially in the rice milling sector where its share was more than 82%), while expenditure
for other items is not very significant. Regarding expenditure for intermediate input, it can be
clearly seen that crops from the farming stage have played an important role in the
expenditure; their shares and values tended to increase continually in every sector,
especially in the rice milling sector for which the share was more than 78%. In terms of
expenditure for other items, although the share is not significant in every sector, it can be

212
seen that there is significant expenditure for operating surplus in the case of the coconut
and palm oil sector, for which the range of shares was from 11 to 25%.
The output for the forward linkage industry was sold to different destinations
according to the nature of the products. The product from rice milling, which is the main food
of Thai people, was sold mostly for domestic consumption. In addition, it also is a raw
material of the food industry and normally there was excess supply over domestic demand.
Therefore the rest was sold for export and to the forward linkage industry. Similarly to
product from rice milling, the main product of coconut and palm oil sector is vegetable oil
which is used in the country. The output was sold mostly for domestic consumption and for
their forward linkage industry while the rest, which was a small amount, was for export.
Unlike products from the rice milling and coconut and palm oil sector, output from the rubber
sheet and block rubber sector, which is not a foodstuff and needs to be transformed in
higher industries, was sold for the forward linkage industry mostly by exporting and some for
the domestic industry. The rest was kept for the stock.
6.3 Value chain and contributions to stakeholders
This section presents the financial value created in each supply chain and the
contributions to stakeholders. The stakeholders in this study were divided into two groups:
stakeholders in crop farming and stakeholders in the industrial processing stage. The
stakeholders in each stage are input providers, entrepreneurs (called farmers in the crop
farming stage), labourers, wholesalers, retailers (only in the industrial processing stage) and
transporters. In this study, the values of expenditures in each sector were used to find out
the value created and gained by each stakeholder. Based on money movement in the
business, the money which is paid for crop or output production would be gained by those
who receive it. According to this movement, each category of expenditures could be
matched with stakeholders who receive payment as shown in Table 6.7.
The values of the financial contribution to each stakeholder shown in this section are
the value per hectare (Ha) of land used for cultivating crops provided for the forward linkage
industries. These include the value of domestic crops contributing to the stakeholders at the
crop farming stage and at the industrial processing stage. However, the nature of data in the
input-output table, especially at the stage of selling output from industrial production to final

213
demand, was reported on a macro scale which does not classify how much of the output
derived was from domestically produced crop. Even though crops used for producing the
output were mostly domestically produced, there are also outputs from import and/or stock
which are not derived from crop cultivated domestically or in the years being considered.
Thus in order to reflect the reality of land use performance it was necessary to allocate the
data in the table to reflect the value of the outputs derived from crops cultivated
domestically.
Table 6.7 Stakeholders and categories of expenditure they receive
Stakeholders Categories of expenditure that stakeholders receive
Input providers Intermediate inputLabourers Wages and salariesEntrepreneurs Operating surplusWholesalers Wholesale marginsRetailers Retail trade marginsTransporters Transportation costsOther Depreciation and
Indirect taxes less subsidies
Based on the input-output table, two underlying assumptions which were considered
in constructing the table, namely homogeneity and proportionality, are adopted as a
guideline to construct the allocation factors. The assumptions are that the products of the
industry are homogeneous or perfect substitutes and inputs are used in strictly fixed
proportions which result in a proportional increase or decrease in the level of output. These
assumptions mean that the allocation factor could be determined as a constant ratio which
is the percentage of value of the industrial output from domestic production out of the total
value of industrial output. Therefore, the allocation factor for the exact value of the industrial
outputs derived from crops from domestic production being considered (AFO) was
calculated from AFO = DVO / TVO, where DVO is the value of the industrial output derived
from domestic production, and TVO is the value of total supply of industrial outputs.
In addition, another allocation factor is needed for the study. This is for identifying the
amount of land used for cultivating crops for forward linkage industries. Based on the nature
of each supply chain, crops from the farming stage are not only for their intended forward
industries but also for other purposes such as for other forward industries, exporting and
keeping in stock. This means that the crop sold from the farming stage to intended forward

214
industries is not derived from all crop production areas. Therefore, it was necessary to
identify the exact size of land devoted to crop cultivation feeding intended forward industries.
Based on the input-output table mentioned above, the allocation factor for obtaining the
exact size (AFJ was calculated from AFl = FVc / TVc, where FVc is the value of crop
feeding the intended forward industries, and TVc is the value of total supply of crop
cultivated domestically.
Table 6.8 shows the value of production throughout the supply chains. The figures
show that using land for rubber cultivation could create the highest total value per Ha
(75,309 to 189,077 Baht per Ha), followed by using land for oil palm (107,174 to 130,685
Baht per Ha) and paddy cultivation (20,094 to 27,577 Baht per Ha) respectively, except in
2000 when land use for oil palm created higher value than rubber. Compared to the value of
oil palm, the value from using land for rubber is dramatically more than oil palm except in
2000, while the value from using land for paddy is significantly less than oil palm in every
year of study; the total values of oil palm in each year are about three to six times the value
of paddy.
In terms of value created in the crop farming and industrial processing stages, the
table indicates that the value of rubber was also more than oil palm and paddy in both the
crop farming and industrial processing stages, except in 2000 when the values of oil palm
were more than rubber in both stages. Regarding the difference of share of value between
the crop farming and industrial processing stages, the table shows that the values of paddy
(68 to 73%) and rubber (49 to 60%) were created in the crop farming stage while the value
of oil palm (55 to 70%) was mostly created in the industrial processing stage, except in 2005
(47%).
Considering the share of value gained by the stakeholders, financial performances in
each supply chain of land use are as follows:
Paddy and rice milling sector. Table 6.8 indicates that the value of using land for
paddy cultivation is mostly gained by stakeholders in the crop farming stage. The farmers
could gain the most value (29 to 47%) followed by input providers (16 to 21%) for crop
farming and farm labourers (5 to 16%). The remaining value is mainly gained by rice milling
entrepreneurs (6 to 8%), retailers of milled rice (6 to 7%), mill labourers (4 to 6%), input

roI0Q.
0CO
0]00 szjg1
•O
IÜwÇ
'ro
■5Q.Q .3W0
3Osz§>o
§ÿ3■oo
003
100CD0
JZl
1b
sRPI* CMl§CO
ifg-ifCDrtgli
CO PIpo 2IpCD mCM
g _CD. 00 in qCM
CMq SCD O) CM li
| g S §CM
8 EOÎ
imisO) SCO
o CO o CO li
COIsisCO ^ P3 m
CO|ECO
E E
01M’ f e oCM C .
in3?o o "^ |iIs|ill pll in
o ^O CD CO 00
CO. CO
o
CD m CM
is-CO m CM llJro ^ f e o
CM lgin ^E is
CMN O llIs8 S
CM ^ CM
O)%s00q8gm
%EPiV I ’ |lPPifP ggS ll
CO
CMPCM CDg q
q s3 2 .
| g CM w
CO
03 lâCM
CD95CO
in85CM
CD8 2 .
C5 CO CO ^
l gCM
8 ^
CMsgO)
95CD
3 ^ q , E
sq SCM
1
1Pi* |gSjCO
gf§ - pP %
8 -q S
? kIsg q |îli
|g |g|âII03
CO ^ CO. g CO
CO ^
q . E
0585 o
q s .h-
in
q SCO
i s
8 -
CD»sCD
IsOoR
Pi* in
NCM (O
2IÎl l l lCO
(Og mCO 3 .
£2CO C ' |i £2g oCM03
00
CO
CO
i - lCD
| lÎ !
|g CO
R Ein
i s03
CO
CM
CO M-85CD
sg■M-
C33SEin
In |sCMSgCM
!28 gCM
030303
w
in|gN8 m
CM ^ Pl iCO
l iCD
l iCD
CO
| l
CMPl lCO
CO
q c M|2i fgoq S M q
CM11l g 5$CM
8 oCDI*CO85
03
3 — q E s.s
CM
oEEin85CO
oS _ £ |sis
CM
Tf
5 509SCM
■è'T3i r
03ORPI’ S - S | i | i l l | l
in
| l |gCM
l lCM
:-gCM i t
CO
SS-CM
:3sCM
q 8R -
l g i - s| l II |£CD 1®|gCO|EO)
8 2 . q t ^CD .8S85
1ill |i | l | l
12|i CD§1 CDPC3Î
| l l l |ii-i| ê |i ° s l§s£° E Ss|s|s8 2 .
8 -q t . i s » £
g P I 'lgIf03
| § pCOp CD|§|g!2|lllll
CM5 sCM
5 0T . ORP
|g I?CO ^
gs8:-g85 RSI gE O) ^ 82;o
q S gSCMgs8 2 s£
1O)
fi%II 1 i
§£
22
iE
1
1
1
o
5
_ gs %S 8 &
1 1 ^
%
i t
221 121
HI
03
1
E
22CD1
111 0
5
O )c
3CL
_C
E£~s-a
12 m
roa.T 3cTOTO
JZJZ2>s
■o■oTO
fWc0
■•G3
1 Q .Ô )C
I1E2
■O
ITO•D
3Q .C
"D
I
215
ITOCL
oETOCL
■oCTO
5C
88
■OcTOTOJOJZ215oJOT 3CTOTOTOSZCO
TOJOJO3

216
providers for milling production (3 to 5%), wholesalers of milled rice (2 to 3%) and
transporters of milled rice (2 to 3%). The wholesalers and transporters of paddy after
harvesting gained a small share of value, about 1 to 2%.
Rubber and rubber sheet and block rubber sector. The table shows that the
prominent stakeholders gaining most value in the chain are farmers (29 to 33%) and
wholesalers of rubber sheet and block rubber (16 to 21%). Other stakeholders who gained
some value are farm labourers (8 to 10%), input providers for rubber sheet and block rubber
production (7 to 11%), and input providers for crop farming (7 to 9%). The last group of
rubber sheet and block rubber stakeholders, gaining less value, are entrepreneurs of
production (1 to 7%), production labourers (3 to 6%), wholesalers of rubber from the farm (3
to 5%), transporters from industrial stage (3 to 4%), retailers (2 to 4%), and transporters of
rubber from the farm (1%).
Oil palm and coconut and palm oil: The table indicates that the prominent
stakeholders gaining most value in the chain are input providers and producers both in the
farming and industrial processing stages. These are input providers for coconut and palm oil
production (13 to 36%), farmers (11 to 22%), coconut and palm oil entrepreneurs (10 to
21%) and input providers for farming (11 to 20%). Other stakeholders who gained some
value are coconut and palm oil wholesalers (4 to 9%), farm labourers (4 to 7%), retailers of
coconut and palm oil (3 to 6%) and coconut and palm oil processing labourers (3 to 4%).
The last groups of stakeholders gaining less value are wholesalers of oil palm from the farm
(2 to 3%), transporters of oil palm from the farm (2 to 3%), and transporters of processed
coconut and palm oil (1%).
Based on financial performance, trends in value of each land use category and
differences in value between land use categories reflect the nature of crop cultivation,
transportation, output transformation and market mechanisms influencing stakeholders
relevant to each land use strategy as shown below:
1 ) Stakeholders in crop farming stage
1.1 Input providers

217
Table 6.8 shows that input providers who supply goods and services for the oil palm
sector could gain more benefit (12,077 to 25,368 Baht per Ha) than those who supply the
paddy (3,483 to 5,917 Baht per Ha) and rubber sectors (5,233 to 14,802 Baht per Ha).
Based on values presented in Tables 6.1, 6.2 and 6.3, it can be clearly seen that
stakeholders who provide fertilizer and pesticides gained more benefit than other input
providers and their benefits tended to be not affected by price decreases especially in the
case of the paddy and oil palm sectors. According to the trend of prices of all crops dropping
in 2000, it can be seen that the values gained by input providers were not adversely affected
in the case of paddy and oil palm sectors but were in the rubber sector.
For the paddy and oil palm sectors, it seems that the decrease of price did not
decrease expenditure per Ha of input provision. This is because fertilizer and pesticides
which share a major proportion of expenditure for input provision are important inputs to
cultivation. Although the farmers could save expenditure on some inputs, it is impossible to
save on the cost of fertilizer and pesticides by reducing them because it would immediately
cause a decrease in output and eventually a decrease in income. Thus it makes sense for
the farmers to use fertilizer and pesticides to maintain high productivity because it would be
worse if both price and output per Ha decreased simultaneously.
In the case of rubber, it can be clearly seen that the farmers decreased expenditure
for input provision while the price decreased. Although decrease of fertilizer and pesticides
could cause decrease in output, the impact tends to occur in the longer run than for paddy
and oil palm. This is because the root system of rubber can reach the nutrients in a deeper
and wider area, and so survive and give latex even though less than when fertilizer is used.
When the price decreased, causing famers not to have enough money to buy fertilizer, it
made sense for them to delay using fertilizer until they have enough money or the output of
rubber starts to decrease significantly. Based on this context, reduction in the rubber price
could decrease the benefit gained by input providers to the crop farming stage of rubber
cultivation.
1.2 Farmers
Table 6.8 shows that farmers cultivating rubber could gain more benefit (21,623 to
59,301 Baht per Ha) than those cultivating paddy (5,816 to 10,062 Baht per Ha) and oil palm

218
(14,757 to 23,969 Baht per Ha). Based on price and average output presented in Tables
6.1, 6.2 and 6.3, it can be clearly seen that benefits gained by farmers especially in the case
of rubber and oil palm cultivation are significantly related to the output price. The figures
show that even though there were continual increases in average output per harvesting
area, the benefit gained by the farmers cultivating rubber and oil palm could not increase
unless there were rises in output price. The trend of benefit from paddy cultivation is quite
different from those of rubber and oil palm. Although the trend of price and the average
output of paddy is similar to those of rubber and oil palm farmers, the value of benefits is still
less than the value in 1995 while those of rubber and oil palm farmers are greater than the
value in 1995.
1.3 Labourers
Table 6.8 shows labourers in the rubber sector could gain more benefit (5,984 to
16,280 Baht per Ha) than those in the paddy (1,129 to 4,047 Baht per Ha) and oil palm
sectors (5,393 to 9,527 Baht per Ha). For the trend of benefits gained by labourers, it can be
seen that those in the paddy and oil palm sectors increased continually while the benefit in
the rubber sector tends to depend on the rubber price which influenced the value to drop in
2000. The difference in the above trend seems to be the result of the nature of wage
negotiation. For the paddy and oil palm sectors, the increase of benefit gained by labourers
seems to be caused by continual increases in wages. Normally the jobs that require labour
are land preparation, fertilizer application, pest control and harvesting, for which the labourer
would be paid on a per job basis. A set price for doing a task might be paid in terms of daily
remuneration or remuneration per unit of area. Although the wages of labourers in the
farming sector were not set officially, the minimum official wage, declared by the government
and increased continually, seems to be the leading factor dominating wages in the farming
sector. With high potential for labourers to reject jobs in the farming sector and/or migrate
from agricultural to the industrial sector, the wages for labourers in farming sectors have to
be competitive with the industrial sector. Based on the same of amount of labour required
for a unit of cultivating area, continual increase in wages could contribute to labourers in the
paddy and oil palm sectors gaining increasing financial returns. In the case of the rubber
sector, although some employment is paid as daily remuneration or remuneration per unit of
area as in the paddy and oil palm sectors, the remuneration for the main employment of this
sector, latex harvesting, is set as a proportion of the value that the labourers can harvest.

219
Normally, the remuneration for the labourers is approximately 40 to 60% of the value of the
latex that they harvest. Based on this context, it can be clearly seen that the reduction in the
rubber price in 2000 caused a dramatic decrease in the benefit gained by the labourers.
Notably, even though the value gained by rubber labourers was dramatically reduced in
2000, its value is still higher than the value gained by paddy and oil palm labourers.
1.4 Wholesalers
Table 6.8 shows that wholesalers in the rubber sector tended to gain more benefit
(2,007 to 8,363 Baht per Ha) than those in the paddy (297 to 432 Baht per Ha) and oil palm
sectors (2,704 to 4,425 Baht per Ha). For the trends in the margin gained by the
wholesalers, it can be clearly seen that the margin decreased significantly in 2000 before
increasing dramatically in 2005. This trend reflected the nature of benefit gained by
wholesalers which normally depend on volume of trade. Based on the cumulative value (in
Table 6.8) created by stakeholders (input providers, labourers and farmers) before
wholesalers which is the volume of cost of trades that wholesalers dealt with, it can be
clearly seen that the cumulative value of each sector decreased significantly from 1995 to
2000 (from 14,999 to 13,335 Baht per Ha for paddy, from 65,976 to 34,846 Baht per Ha for
rubber and from 44,433 to 36,106 Baht per Ha for oil palm). From this, it can also be clearly
seen that the margin gained by wholesalers decreased significantly following the reduction
of the cumulative value even though the percentage change of value added created by
wholesalers in 1995 (2 to 3%) is more than in 2000 (6 to 10%).
1.5 Transporters
Table 6.8 shows transporters in the oil palm sector tended to gain more benefit
(2,414 to 3,951 Baht per Ha) than those in the paddy (101 to 146 Baht per Ha) and rubber
sectors (381 to 1,054 Baht per Ha). The difference in margin gained by transporters of oil
palm compared to paddy and rubber reflected the nature of the transportation business in
which the revenue depends on the weight of products and the distance they are transported.
Based on average output presented in Tables 6.1, 6.2 and 6.3, it can be clearly seen that
the weight per Ha of oil palm output (14,531 to 15,431 tonne per Ha) is significantly more
than those of paddy (2,337 to 2,965 tonne per Ha) and rubber (1,325 to 1,763 tonne per
Ha), with the weight of oil palm being approximately five times that of paddy and ten times

220
that of rubber. In terms of trend, it seems that the margin for transporters tended to relate to
the trend in prices. It can be clearly seen that the decrease of price in 2000 caused a
reduction in margins especially in the rubber sector. Even though there are many factors
influencing the margin such as economy or diseconomy of scale of transportation, cost of
transportation and capacity in negotiation for marking up the margin according to increase or
decrease in demand for the crops, the factor that has potential to influence the margin in the
rubber sector decreased significantly; this is the loss of weight of rubber due to crop
transforming. Normally the farmers have choices about how to sell rubber output after
harvesting. They can sell latex immediately or transform it to dried un-smoked rubber before
selling. Normally, the weight of latex is more than the dried rubber such as un-smoked
rubber sheet; this is because the water in the latex would be removed. This transforming
would decrease the weight of product about 65 to 75% while the dried product is
comparatively expensive compared with latex. Generally, when the rubber price is low the
farmers prefer to sell output as dried products because they want to gain income from the
higher price. Based on this context, reduction in price could decrease the margin gained by
transporters via the loss of weight in product that needs less transportation. However, the
context of transformation could not be applied in the case of paddy and oil palm because the
farmers have no choice to transform so the outputs are sold immediately.
2) Stakeholders in industrial processing stages
2.1 Input providers
Table 6.8 shows that input providers who supply goods and services for the coconut
and palm oil sector could gain more benefit (13,991 to 46,488 Baht per Ha) than those
supplying the rice milling (548 to 1,509 Baht per Ha) and rubber sheet and block rubber
sectors (7,510 to 20,110 Baht per Ha). Based on the nature of each industry, complexity of
the production process in the coconut and palm oil sectors seem to be an important factor
influencing the cost more than the others. While the processes for rice milling, rubber sheet
and block rubber seem more simple because the activities are mostly relevant to storage of
the input from the farming stage and slightly transforming the input into final product, the
production process of the coconut and palm oil sector is more complex because
transforming the input to final products requires several sub-processes. These processes
are that the fresh oil palm is firstly transformed to crude palm oil in crushing mills and then

221
refined in refinery plants. These complexities together with relevant additional input and
investment in the business infrastructure, explain why the input providers in the coconut and
palm oil sector could gain more benefit than the others.
2.2 Labourers
Table 6.8 shows that labourers in the rubber sheet and block rubber sector could
gain more benefit (3,825 to 7,974 Baht per Ha) than those in the rice milling (939 to 1,542
Baht per Ha) and coconut and palm oil sectors (2,990 to 4,828 Baht per Ha). The values of
benefit gained by labourers in the rubber sheet and block rubber sector which is more than
other sectors reflects the nature of the production process which tends be more labour
intensive than the others. Normally labourers in the processes of the rice milling and
coconut and palm oil sectors are employed mostly to carry the input and final product,
control the machines, while transforming input to final products is the job of the machines.
These contexts are quite different from employment in the rubber sheet and block rubber
sector especially regarding transforming latex to smoked rubber sheet. Even though there
are machines to facilitate the production, the processing tends to be labour intensive
because the whole process needs labourers to deal with it, even though machines are also
used.
2.3 Entrepreneurs
Table 6.8 shows that entrepreneurs in the coconut and palm oil sector could gain
more benefit (13,354 to 22,994 Baht per Ha) than those in the rice milling (1,210 to 1,918
Baht per Ha) and rubber sheet and block rubber sectors (1,690 to 8,955 Baht per Ha). Not
only in terms of total value as mentioned above can entrepreneurs in the coconut and palm
oil sector gain more than other entrepreneurs, but also in terms of ability to mark up margin
from the overall cost that they pay (including cost of crops from the farming stage, and
additional inputs and labourers in the industrial processing stage). They could mark up the
margin 13 to 35% of the cost while entrepreneurs in the rice milling and rubber sheet and
block rubber sectors could mark up only 7 to 11% and 2 to 12% respectively.
Even though complexities in processing are a primary factor that could explain why
entrepreneurs in the coconut and palm oil sector can achieve more margin, the significant

222
factor seems to be the nature of the market structure, which governs how much
entrepreneurs can influence the market price. In terms of setting prices of products from the
rice milling sector, it is difficult for entrepreneurs to mark the price up much. This is because
rice is a main food for Thai people. More margin gained by entrepreneurs would mean a
more expensive price that customers have to pay. Based on the structure of the market, in
which there are many rice millers located widespread across the country, an entrepreneur
increasing the price to gain more margin would not sell the products if the others remained
at the same price. This is because customers could buy the product from other millers.
Nonetheless, although there is a national association of rice millers that could dominate the
price in the market, increasing the price of products is not easy because the rice price is
controlled by the government. Increasing the price without proper reason would not be
approved by the government. In the case of setting the price of products from the rubber
sheet and block rubber sector, it is not easy for entrepreneurs to add mark up to gain more
margin. This is because products from this sector have undergone only basic transformation
and all of them are sold to their forward industries to produce final products. With most
rubber sheet and block rubber being for export, entrepreneurs in this sector seem to have to
accept the price set in world market. Thus it is difficult for them to mark up the price to gain
more margin from product transformation. In the case of the coconut and palm oil sector, it
seems that entrepreneurs tend to have more power than the entrepreneurs of others sectors
in setting price to gain more margin. Although the price of the main output of this sector,
edible palm oil, is controlled by the government and it is difficult for them to mark it up to
gain more margin, oil palm is perishable and cannot be kept for long before being sold
because it is easily spoiled and this means the entrepreneurs have more power to lower the
price of oil palm from farmers. However, due to the final product price being controlled by
the government and not changed much over time, if the entrepreneurs could not lower the
price of oil palm, the margin gained by them would decrease. It can be clearly seen from the
relationship between oil palm price and the margin gained by entrepreneurs that the
reduction in oil palm price, for example from 1995 to 2000 (see Table 6.5) could increase
the margin while an increase in oil palm price, for example from 2000 to 2005 (see Table
6.5) meant the entrepreneurs gained less margin.

223
2.4 Wholesalers
Table 6.8 shows that wholesalers in the rubber sheet and block rubber sector could
gain more benefit (15,455 to 30,886 Baht per Ha) than those in the rice milling (502 to 879
Baht per Ha) and coconut and palm oil sectors (5,472 to 9,537 Baht per Ha). It can be
clearly seen that the margin gained by wholesalers in the rubber sheet and block rubber
sector is significantly more than wholesalers of other sectors. The important factors that
make wholesalers in the rubber sheet and block rubber sector able to gain high margin are
the huge volume of trades and their ability to mark up the price. Compared to the rice milling
sector, it can be clearly seen that the volume of trades by wholesalers in the rubber sheet
and block rubber sector (52,883 to 141,077 Baht per Ha) was three to six times the volume
of wholesalers’ trades in the rice milling sector (17,209 to 23,864 Baht per Ha) and
wholesalers in the rubber sheet and block rubber sector could mark up 20 to 30% of the
volume of trade while those of the rice milling sector could mark up only 3 to 4%. In
comparison with the coconut and palm oil sector, even though the volume of trades of both
sectors was not very different (87,490 to 116,648 Baht per Ha for coconut and palm oil
sector), the wholesalers in this sector could mark up just 8 to 9% of the value of trade which
is significantly less than ability of those in rubber sheet and block rubber sector (20 to 30%).
It seems that wholesalers in rubber sheet and block rubber sector are the stakeholders
having most power in dominating market. It can be clearly seen that the margins created by
wholesalers were significantly greater than the margin of entrepreneurs; those of
wholesalers were about three to fifteen times the margin of the entrepreneurs. These
contexts reflect the nature of the rubber sheet and block rubber market where most output is
for exporting and is managed by wholesalers. Usually, it is not easy to be wholesalers in
rubber sheet and block rubber sector because it requires huge start up and operation costs
for stocking rubber sheet and block rubber. With the difficulties in entering this business,
wholesalers who have been in the market do not have many competitors and tend to have
agreements among themselves to increase their profit by reducing competition. Based on
this context, it is easy for them to set the price for buying rubber sheet and block rubber from
producers. With high power in buying, the price offered to the producers is the remainder of
the world market price after deducting wholesalers’ operation cost and the margin that they
want to gain. With these conditions, it makes wholesalers able to maintain high margins for
their business.

224
2.5 Retailers
Table 6.8 shows that retailers in the coconut and palm oil sector seemed to gain
more benefit (3,548 to 6,184 Baht per Ha) than those in the rice milling sector (1,362 to
1,979 Baht per Ha) and rubber sheet and block rubber sector (1,484 to 6,916 Baht per Ha).
In the case of margins gained by retailers in the rubber sheet and block rubber sector, it
should be noted that it is not a business delivering products to final customers but totally for
delivering the products to traders who keep the product in stock waiting to sell at a suitable
time in the next year. In terms of the trend in margin gained by retailers, it can be clearly
seen that the margin in the rice milling sector increased continually while the margin in the
coconut and palm oil sector decreased continually. For the rubber sheet and block rubber
sector, the margins decreased significantly in 2000 before increasing dramatically in 2005,
depending on the volume of sales of products for keeping in stock. In terms of the value of
margin gained by retailers compared with entrepreneurs, it can be clearly seen that retailers
in the rice milling sector could gain margins approximately equal to the entrepreneurs while
retailers in the coconut and palm oil sector could gain significantly less than the
entrepreneurs. This context reflects the importance of retailers in the rice milling sector to
the rice market. It seems that the rice market tends to be competitive because there are a lot
of producers and customers and the prices are set by the market. Based on these contexts,
the retailers seem to have more power to negotiate with producers to gain high margins
because they are close to buyers and can easily choose which rice brands to sell in their
shop or store. For the entrepreneurs, they seem to be responding to this market condition.
This is because it would difficult for them to deliver products to customers without using
retailers. Contrary to the rice milling sector, it seems that retailers in the coconut and palm
oil sector have less power to negotiate with producers. This is because, even though there
are many customers, as in the rice milling sector, there are far fewer producers in the
coconut and palm oil sector than in the rice milling sector, especially in final processes like
refinery plants. With less ability to negotiate, it made the proportion of margin of retailers
compared with entrepreneurs in the coconut and palm oil sector less than in the rice milling
sector.

225
2.6 Transporters
Table 6.8 shows that transporters in the rubber sheet and block rubber sector could
gain more benefit (2,652 to 5,537 Baht per Ha) than those of rice milling sector (619 to 626
Baht per Ha) and coconut and palm oil sector (944 to 1,564 Baht per Ha). Similar to
transportation at the farming stage, it seems that weights of carried products and distance
transported were important factors influencing benefits gained by transporters. Regarding
weights of final products, with industrial processing the weights of all crops were normally
decreased. However the loses are different depending on the process of transformation for
each crop. The losses in weights of paddy and rubber seemed to be less than the loses of
oil palm. This is because paddy and rubber crops mostly only lose moisture while waiting
and during the process of transformation, while oil palm loses not only moisture but also
empty bunches, fibre, shell and other waste products occurring in the processing. Crude
palm oil, the main product of the coconut and palm oil sector, is about 18-22% of the weight
of fresh oil palm fruit. With such a dramatic loss of weight, it seems that the weight of palm
oil which is derived from fresh oil palm is significantly lower. Based on this context, the
benefits gained by oil palm transporters which were dramatically higher than those in other
sectors at crop farming stage, are less than those in the rubber product sector at industrial
processing stage. However, the benefits are still higher than those for transporters of paddy
product at industrial processing stage.
In comparison with the margin gained by transporters after crop harvesting, it can be
clearly seen that margin gained by transporters after industrial processing of rice milling
sector and rubber sheet and block rubber sector were more, while the margin in the coconut
and palm oil sector was less than those of transporters after crop harvesting. These
contexts reflect the nature of transportation in the sense that the output from the rice milling
and rubber sheet and block rubber sectors were transported further than crop transportation
from farms to industrial plants. This is because, even though weights of the products were
lost in the process of industrial transformation, the transportation cost gained by transporters
after industrial processing tended to increase. Clearly, in the rice milling sector, rice which
was mostly transformed in the central and northeast region has to be delivered to customers
all around the country, while rubber products from the rubber sheet and block rubber sector
which was mostly transformed in the south and east region have to be delivered to domestic
forward linkage industries and to ports for exporting. It can be clearly seen that these

226
transportations were longer than transportation after crop farming to industrial plants which
were mostly close to farming sites. In the case of the coconut and palm oil sector where the
margin for transporters after industrial processing was less than those of transporters after
crop farming, it can be clearly seen that the lower transportation cost after industrial
processing resulted from dramatic lose of weight in the industrial process from which the
weight of crude palm oil obtained is about 18-22% of the fresh oil palm fruit weight. Even
though there are other by-products from the extraction process of oil palm, such as empty
bunches, fibre, shell and other waste products, the product which is transported to
customers is palm oil while by-products are mostly used as a source of energy in the factory.
6.4 Impacts of land use switching on stakeholders
Based on the figures of the value gained by each stakeholder in the supply chain of
each of the different alternative land uses, the difference of value gained by each
stakeholder between each land use could point out the financial impacts which would
happen if the land was switched from paddy or rubber to oil palm. The financial impacts of
land use switching to oil palm are shown below.
6.4.1 Switching land from paddy to oil palm
The Table 6.9 points out that most of the stakeholders in the chain would gain benefit
if they switched land use from paddy to oil palm. Input providers and producers in both crop
farming and industrial processing stages seem to gain more benefit than other stakeholders
(see Figure 6.2). Switching land from paddy to oil palm cultivation could contribute to input
providers and entrepreneurs in the industrial processing stage gaining more, ranging from
13,103 to 45,941 and from 11,436 to 21,385 Baht per Ha respectively while farmers and
input providers in crop the farming stage would gain more, ranging from 8,942 to 16,061 and
from 8,594 to 19,451 Baht per Ha respectively. Other stakeholders in the industrial
processing stage would also gain more contributions: ranging from 4,593 to 9,036 Baht per
Ha for wholesalers, from 1,569 to 4,821 Baht per Ha for retailers, from 2,051 to 3,565 Baht
per Ha for labourers, from 318 to 943 Baht per Ha for transporters and from 1,214 to 2,253
Baht per Ha for others. Most other stakeholders in the crop farming stage, similar to other
stakeholders, also gain more benefit: ranging from 2,598 to 5,480 Baht per Ha for labourers.

227
from 2,406 to 3,993 Baht per Ha for wholesalers, and from 2,313 to 3,805 Baht per Ha for
transporters.
Considering the percentage change in value caused by land use switching, the table
points out the different magnitude of change of value gained by each stakeholder.
Transporters and wholesalers in the crop farming stage, and input providers, wholesalers,
entrepreneurs in the industrial processing stage seem to gain huge change. The value that
they gain from land switching would increase ranging from 2,299 to 2,605%, from 809 to
971%, from 1475 to 8,389%, from 522 to 1,802%, and from 596 to 1,768% respectively. For
other stakeholders, although the magnitude of gain is less than for the stakeholders
mentioned above, the values gained from new land use are significantly increased: ranging
from 218 to 329% for input providers in the crop farming stage, from 82 to 378% for
labourers in crop farming stage, from 133 to 203% for farmers, from 79 to 354% for retailers
in the industrial processing stage, from 177 to 282% for labourers in industrial processing
stage, and from 51 to 152% for transporters in the industrial processing stage.
6.4.2 Switching land from rubber to oil palm
Table 6.9 indicates that while some stakeholders in the chain could gain benefit if
switching land use from rubber to oil palm, some stakeholders could lose (see Figure 6.2).
The stakeholders who gain a positive contribution from land use switching are input
providers and transporters in the crop farming stage, and input providers and entrepreneurs
in the industrial processing stage. Clearly, the stakeholders in the industrial processing
stage could get more benefit than the stakeholders in the crop farming stage. Input
providers and entrepreneurs in the industrial processing stage would gain more, ranging
from 6,481 to 40,151 Baht per Ha and from 4,399 to 20,905 Baht per Ha respectively, while
input providers and transporters in the crop farming stage would gain more, ranging from
1,772 to 10,566 Baht per Ha and from 1,901 to 2,919 Baht per Ha respectively. For retailers
in the industrial processing stage, although they made a loss in 2005, they gained more
benefit in 1995 and 2000 (3,822 to 3,942 Baht per Ha respectively)
The stakeholders who lost from land use switching are farmers, labourers and
wholesalers in the crop farming stage and wholesalers, transporters, and labourers in
industrial processing stage. Clearly, the farmers and wholesalers in the industrial processing

228
stage would lose more than the others. They lost 6,865 to 35,332 Baht per Ha and 7,086 to
25,414 Baht per Ha respectively. For labourers in the crop farming stage and transporters in
the industrial processing stage, although their loses are significantly less than the
stakeholders mentioned before, they also lost in every year of the study (216 to 6,753 Baht
per Ha and 1,209 to 4,594 Baht per Ha respectively). For wholesalers in the crop farming
stage and labourers in the industrial processing stage, although they gained positive benefit
in 2000, they lost in 1995 and 2005. Their loses are 2,346 to 3,938 Baht per Ha, and 835 to
3,708 Baht per Ha respectively.
Considering the percentage change in value caused by land use switching, the table
points out the percentage change is not as much as the percentage in the case of land
switching from paddy to oil palm. For stakeholders gaining a positive contribution from land
switching, the ranges of percentage in increase of the value of entrepreneurs and input
providers in the industrial processing stage and transporters and input providers in the crop
farming stage are from 49 to 1237%, from 56 to 634%, from 180 to 533% and from 17 to
146% respectively. For retailers in the industrial processing stage, the percentages in 1995
and 2000 are 162% and 266% respectively. Regarding stakeholders losing from land
switching, transporters and wholesalers in the industrial processing stage, and labourers
and farmers in the crop farming stage would lose ranging from 46 to 83%, from 46 to 82%,
from 4 to 52% and from 32 to 60% respectively. For wholesalers in the crop farming stage
and labourers in industrial processing stage losing in 1995 and 2005, the percentages are:
40 and 47%; and 22 and 47%.
6.5 Conclusion
This study explores the systems of alternative land use and the impacts on
stakeholders caused by land use change from paddy and rubber to oil palm cultivation. The
results show that, although land was used for different cultivations, there are several
similarities among alternative land uses. These are that most crop output of land use is for
raw material in a forward linkage industry. Their values would be added to in the industrial
process and then sold to the final user. In the crop farming stage, the value created in crop
cultivation is mostly used for operating surplus followed by intermediate input expenditure,
mostly for fertilizer and pesticides, and wages and salaries. In the forward linkage industry,
the value created is mostly paid for intermediate input, which is mostly for the crops from the

229
farming stage while the expenditure for other items is not very significant except in case of
the coconut and palm oil sector where there is significant expenditure for operating surplus.
For the output from the forward linkage industry, some is sold as the raw material for their
forward linkage industry while the rest is for domestic consumption (output from rice milling
and the coconut and palm oil sector) and for export (output from rice milling and the rubber
sheet and block rubber sector).
In terms of the value created in each supply chain, using land for rubber cultivation
could create the highest total value per Ha, followed by using land for oil palm and paddy
cultivation respectively, except in 2000 that land use for oil palm could create higher value
than rubber. For stakeholders who gain benefit from value created by each land use, the
identify the prominent stakeholders as: farmers, labourers and input providers in the crop
farming stage in cases of using land for paddy cultivation; farmers, labourers, input
providers in the crop farming stage, and wholesalers in the industrial processing stage in
cases of using land for rubber cultivation; and, farmers, input providers in the crop farming
stage, entrepreneurs, and input providers in the industrial processing stage in cases of using
land for oil palm cultivation.
Regarding impacts of land use switching to stakeholders, the results show that most
stakeholders in the chain would gain benefit in the case of switching land use from paddy to
oil palm, while farmers, labourers and wholesalers in the crop farming stage and
wholesalers, transporters, and labourers in industrial processing stage would lose in the
case of switching land use from rubber to oil palm. The stakeholders who gain more distinct
benefit than the others in the chain are: input providers and producers, both in the crop
farming and industrial processing stage in the case of switching land use from paddy to oil
palm; and input providers and entrepreneurs in the industrial processing stage in the case of
switching land use from rubber to oil palm. The stakeholders who would lose notably more
than others in the chain are: the farmers in the crop farming stage and wholesalers in the
industrial processing stage in the case of switching land use from rubber to oil palm.

230
Table 6.9 Change and percentage change in financial performances caused by land use
switching on the stakeholders
Unit: Baht per Ha
Switching paddy to oil palm Switching rubber to oil palm
Stakeholders 1995 2000 2005 1995 2000 2005Value Value Value Value Value Value
(% change) (% change) (% change) (% change) (% change) (% change)Crop farming stage
Inputproviders 8,594
(247)8,826(218)
19,451(329)
1,772(17)
7,645(146)
10,566(71)
Labourers 4,264 2,598 5,480 -5,929 -216 -6,753(378) (82) (135) (-52) (-4) (-41)
Farmers 13,415 8,942 16,061 -15,039 -6,865 -35,332(133) (154) (203) (-39) (-32) (-60)
Wholesalers 3,161 2,406 3,993 -2,346 697 -3,938(971) (809) (925) (-40) (35) (-47)
Transporters 2,840(2482)
2,313(2299)
3,805(2605)
1,901(180)
2,033(533)
2,919(283)
Others 192 -96 -66 -1,521 -1,394 -3,879(57) ta e ) (-15) (-74) (-89) (-91)
Total 32,466 24,989 48,724 -21,163 1,899 -36,418(210) (182) (258) (-31) (5) (-35)
Industrialprocessingstage
Inputproviders* 13,103
(1475)45,941(8389)
29,899(1982)
6,481(86)
40,151(634)
11,297(56)
Labourers 2,051 3,565 2,724 -835 626 -3,708(218) (282) (177) (-22) (15) (-47)
Entrepreneurs 21,385(1768)
21,301(1258)
11,436(596)
20,905(1237)
17,445(314)
4,399(49)
Wholesalers 9,036 7,795 4,593 -15,056 -7,086 -25,414(1802) (1357) (522) (-61) (-46) (-82)
Retailers 4,821 3,923 1,569 3,822 3,942 -3,368(354) (261) (79) (162) (266) (-49)
Transporters 943(152)
824(133)
318(51)
-2,450(-61)
-1,209(-46)
-4,594(-83)
Others 2,177 2,253 1,214 -62 -393 -3,217(984) (1195) (532) (-3) (-14) (-69)
Total 53,517 85,602 51,753 12,805 53,477 -24,605(932) (1340) (596) (28) (139) (-29)
Total 85,983 110,591 100,477 -8,358 55,376 -61,023(406) (550) (364) (-7) (74) F32)
Note
Excludes input derived from its own farming-production sector (paddy, rubber and oil palm were
excluded from input of sector of rice milling, rubber sheet and block rubber, and coconut and palm
oil respectively)

231
- .......
BH J9d }nea
E0;go
.c0
g0
co0O )c0.cÜ003
" OcjO‘o0Ü0Q.E
CNCD
23O )
LL

232
CHAPTER 7
ANALYSIS OF POLICY IMPLEMENTATION AND
LOSS OF PADDY AREAS
7.1 Introduction
This chapter analyses the review of policy implementation and effectiveness of
dealing with loss of paddy areas caused by promotion of oil palm cultivation. As mentioned
previously in Chapter 3, semi-structured interviews were conducted to explore policy
makers’ perspectives towards rationale for establishing the biodiesel development policy,
awareness about unintended impact in terms of the loss of paddy areas and capacity of
government to deal with this loss. The results were derived from in-depth interviews with
three government officials from organisations which are closely relevant to the biodiesel
development policy both in terms of the policy design and land use change monitoring. Their
professional areas are agricultural economics, energy policy and alternative energy. The
respondents are referred to as interviewees No.1 to No.3 respectively.
This chapter first discusses the rationale and disadvantages of the biodiesel
development policy. Then, the chapter presents the interviewees’ views regarding the
switching of paddy areas to oil palm and discusses the potential for dealing with loss of
paddy area.
7.2 Rationale for establishing the biodiesel development policy
There are several contexts within Thailand that support biodiesel promotion being
accepted as a policy. As mentioned previously in Chapter 2, Thailand is a fossil energy net
importer which has to spend a lot of money on fuel imports and has the capacity to cultivate
oil palm for providing material for biodiesel production. Moreover, scientific evidence has
reported that fossil fuels cause serious problems in terms of global warming (No.2). Hence,
the promotion of oil palm cultivation to produce biodiesel for substitution for fossil diesel
could be beneficial for the country in several ways. Increasing the share of biodiesel in the

233
national energy matrix could reduce fossil diesel imports and eventually save money spent
on fuel imports. Moreover, less use of fossil diesel would means less impact on global
warming.
Although there are several positive contributions that can be derived from promoting
biodiesel, successful implementation of the policy is challenging, especially in terms of the
budget to support the policy and acceptance by energy users. One respondent (No.2) said:
“It Is Impossible for biodiesel to compete with fossil diesel In the market This Is because the cost of biodiesel production Is more than the cost of fossil fuel. Moreover, It Is necessary to adapt technologies such as the machinery to be compatible with biodiesel. ... In order to accomplish Implementing this policy, It Is necessary for the government to spend a lot of money to subsidize the biodiesel price so that It Is equal to or less than the fossil fuel price In order to Increase demand for biodiesel. Moreover the government needs to make the user confident about the effectiveness of biodiesel and Its compatibility with machinery...”
Due to the expected contributions of the biodiesel policy, although it is difficult and
expensive to promote use of biodiesel, the policy has been supported by the politicians
since the policy was launched. Every government continually pursues the policy without
questioning the financial worthiness of the policy. It seems that the main expected
contributions of the policy, and of the government’s continued support for it, are not
profitability but mainly non-financial returns which could increase the popularity of the
government.
As mentioned previously in Chapter 2, all respondents suggested that the benefits
expected from biofuel development not only focus on promoting energy security but on other
contributions especially saving currency from importing energy, improving the quality of life
for Thai people and establishing a low carbon society to mitigate global warming. All
respondents agreed that pursuing the policy might satisfy people in several ways. Firstly,
setting this policy to increase the share of alternative energy could show vision on the part of
the government in making the country more independent in the energy sector. Secondly,
biodiesel is considered to be environmentally friendly. Supporting the use of biodiesel could

234
promote the government’s image in terms of environmental awareness, which is consistent
with global trends and the expectations of environmentalists. Finally, reallocating money
from importing fossil fuel to subsidising biodiesel, which can be produced in the country,
could show cleverness by the government in maintaining benefit for the country. Another
contribution derived from the strategic plan of biodiesel development that satisfies the
people is the attempt by the government to promote oil palm as an alternative crop in
several areas in order to produce sufficient oil palm as a material for biodiesel production.
This could show that the government is attempting in earnest to improve the quality of life for
farmers.
The respondents’ point of view shows that there are several factors which suggest
that adopting biodiesel development makes sense, but politics is the factor that has played
the most important role in supporting and pursuing biodiesel development. Although this
policy could not provide explicit financial returns (No.3), the expenditure budget for this
policy could be beneficial for the government in terms of popularity and acceptance from
both international and internal sectors.
7.3 Loss of paddy area as a policy issue
In the context of biodiesel development, for which palm oil is considered to have the
highest potential for use as a material in commercial production (No.3), sufficiency of oil
palm crop is an important factor influencing success of the policy. Before launching the palm
oil based biodiesel development policy, Thailand was able to cultivate approximately enough
oil palm for producing edible palm oil and by-products for domestic consumption. However,
dramatic additional oil palm crops used for supporting the policy demanded the preparation
of an action plan by policy makers to ensure sufficiency of raw material supplies (No.1). All
respondents stated that accomplishing this requirement was seen as challenging from the
outset because supporting oil palm cultivation could cause land use competition. One
respondent (No.1) said:
“The land was normally allocated to cultivate a variety of crops supporting the economy. Under current land use patterns, It can be guaranteed that the supply of crops can maintain market equilibrium by meeting the demand for both domestic consumption and export. Support

235
for cultivating new crops like oil palm in vast areas should be planned carefully because it might affect the equilibrium of the market causing shortage of supply and increase in the price of crops which are s are substituted...”
In order to prevent these impacts, several strategies to meet the target of oil palm
supply were employed. The Committee on Biofuel Development and Promotion (OBDP), a
cooperation between the MAE and the MOE, was established to plan and promote oil palm
provision. On the one hand, OBDP promotes palm provision without disturbing the balance
of land use by seeking to increase fresh palm productivity and to increase the crushing rate
of crude palm oil. On the other hand, OBDP promotes the expansion of oil palm growing
area. With an expansion target of 400,000 hectares of new area within 5 years (from 2008-
2012) or 80,000 hectares per year, land suitable for promoting the cultivation of oil palm was
carefully identified to avoid or minimize the substitution of oil palm for productive traditional
crops. Abandoned areas and unproductive areas for traditional crops were chosen for oil
palm provision.
However, using these areas for oil palm cultivation is seemed impossible. This is
because the productivity on these lands could not provide satisfied profit. As mentioned
previously in the chapter 2, most abandoned land is in unfavourable geographic areas:
infertile land e.g. acid soil, saline soil, shallow soil, soil with a high proportion of rock; areas
liable to flooding in the rainy season; drought areas. In addition, abandonment is also
caused by socio-economic factors, such as insufficiency of labour in the agricultural sector
and land property rights especially where land may be owned by capitalists for non-
agricultural purposes. However, these areas might be replanted if incentives are available.
In order to achieve the plan, the government would promote oil palm cultivation by providing
low-interest loans and/or supporting land preparation and production inputs for participating
oil palm farmers (No.1).
With respect to maintaining the initial balance of land use, it is evident that policy
makers avoid promoting oil palm cultivation in land effectively used for cultivating traditional
crops. Therefore, the promotion areas include abandoned areas and unproductive areas for
traditional crops. In order to be successful in cultivating oil palm, identifying the potential
area has to take into consideration feasibility according to the natural resources and climatic

236
conditions as well. In terms of soil quality, although the target areas - abandoned and
unproductive areas - are mostly poor quality, all respondents thought that is not a major
problem because land could be prepared to be suitable for oil palm cultivation by using
agricultural technologies for soil improvement such as nutrient enrichment by applying
organic and inorganic fertilizers and soil pH amendment by constructing high planting beds,
installing drainage ditches and using additional chemicals. However, the factor that
concerned policy makers very much in identifying the potential areas is climatic conditions.
With the nature of oil palm, which needs a lot of water, the policy makers came to the
conclusion that the regions which are suitable for oil palm are in the south and the east of
the country, which have high levels of rainfall, as well as some areas in the northeast near
the Mae Khong river (No.1).
Although selection of land for oil palm was made to minimise impact on existing crop
production in order to maintain output consistent with market demands, the policy makers
were expecting that there would be some areas which might potentially be greatly affected
by oil palm promotion, especially traditional areas of rubber and paddy. This is because
these areas are located near the abandoned and unproductive areas and the success of oil
palm cultivation in promoted areas might motivate land owners to switch the productive
areas to oil palm. In the view of policy makers, all respondents stated that it was difficult for
rubber to be substituted by oil palm because the price of rubber at that time was very high.
Moreover cultivating rubber gave the expectation of long term revenue. Once planted,
rubber can give output that can be harvested for nearly 30 years. Switching rubber areas to
oil palm before the end of the rotation period does not make sense because they would lose
income which could be got from harvesting rubber. In addition, they have to wait a long time
until the oil palm gives any output because it might take three to five years depending on the
varieties of oil palm. Although the price of rubber and oil palm influences the switching of
land use from rubber to oil palm and from oil palm to rubber, depending on which price
offered the better return, a significant increase in rubber price has attracted farmers to
cultivate rubber as much as possible. In this context, the significant financial incentive of the
high price could motivate farmers to continue to cultivate rubber to obtain the better return
on land use (No.1).
While it seems there is no need to worry about rubber areas and rubber supply to the
market, substitution of paddy areas by oil palm is of concern to the policy makers. As

237
mentioned previously, it is possible for land owners to switch productive areas to cultivate oil
palm if oil palm cultivation is successful and gives satisfactory returns to the owners. This
issue is more serious in paddy than in rubber because switching from paddy areas is easier
than from rubber. Due to the short period spent for each round of paddy production, paddy
farmers have more flexibility to decide about their land use. Moreover, land preparation in
the case of switching from paddy is easier than from rubber. With the level areas of paddy
fields, land can be prepared for oil palm immediately. However, land preparation in the case
of rubber takes much longer because it is necessary to cut the trees down and remove their
roots before starting the preparation. In this situation, a decision to switch land use from
paddy to oil palm is easier than from rubber or other perennial plants. Switching land from
paddy to oil palm can be done immediately after the paddy has been harvested.
All respondents agreed that loss of paddy areas concerned policy makers because a
decrease in paddy area would cause problems regarding national food security in the long
term. For example:
“Paddy is very important for Thailand as a main food for the people. Loss of paddy areas would mean a decrease in rice suppiy. Based on market mechanisms, a decrease in rice supply would increase the rice price and finally the cost of living. This point is very serious because an increase in rice price would finally make rice unaffordable for some people, especially the poor. ... Continuing paddy cultivation could be beneficial for food security of the country overali and especially for paddy farmer HHs. Although some paddy farmers recently have grown paddy only for selling and buy good quality rice for eating, continuing to cuitivate paddy could guarantee that they would have rice to eat. When loss of paddy areas makes the paddy price too expensive, the HHs could return to eating their own rice although its taste might not be satisfactory. ...”
(No.1).
Moreover, all respondents also mentioned the difficulty of managing rice supply
when paddy areas decrease dramatically. If most paddy areas were switched to other
purposes and the remaining paddy areas were clustered in some fertile areas, the paddy
supply which could be provided by these areas would be fragile. This is because all or most

238
of these areas might be simultaneously threatened by unpredictable and uncontrollable
factors such as climatic variations. Although paddy cultivation requires quite a short period
(three to four months), short term rice shortages would cause several problems not only in
terms of increased paddy price and cost of living as mentioned above, but also social unrest
such as robbery. In order to maintain food security in the long run, it is necessary to keep
current paddy areas in paddy cultivation as much as possible in order to maintain sufficient
food supply with affordable and stable prices.
Loss of paddy areas influenced by oil palm substitution is an important issue
especially in the phase of policy planning. It can be clearly seen the organization
responsible for planning oil palm cultivation to support biodiesel production has an explicit
policy to avoid disturbance of food production areas. The food crop where there is most
concern about substitution by oil palm is paddy. One respondent (No.1) noted:
“Paddy is very important for the Thai economy. The land suitable for paddy must be conserved only for paddy cultivation. ... Promoting oii palm cultivation should not disturb the paddy areas because loss of paddy areas means decreased food security in the iong term.... Although it is possible to cultivate oii palm in plain areas iike paddy areas, the policy makers decided to inhibit promoting oii palm in this area. ... This principle was used when identifying the land suitable for promoting oii palm and was a reason why oil palm is promoted in the south and east instead of in the central, north and northeast regions, where the main arable areas are occupied by paddy”.
Although the southern and eastern regions of Thailand are promoted for oil palm
cultivation, it does not mean all areas would be supported by the policy. Areas which have
high potential for paddy cultivation are still excluded from the promotion plan.
”ln order to identify the boundary of areas for oil palm, productive paddy areas will be marked on the map, which means oil palm would not be promoted to Intrude into these areas” (No.1).

239
It is clear that the MAE, which is responsible for both controlling national agricultural
land use and promoting the area for oil palm cultivation, gives priority of land use for food
production especially paddy. However, some farmers and regional agricultural officers
argued about this principle. As noted by one respondent (No.1), this can be seen from the
attempts of a group of farmers in Rangsit Plain to cultivate oil palm even though their lands
are in the areas set for paddy cultivation. Another example is an attempt by regional
agricultural officers to propose that the government should promote oil palm in the
Pakpanang river basin despite this area being designated for paddy cultivation. They
thought that promotion areas should not be limited only to areas as set by the government
and that oil palm should be promoted as an alternative crop for farmers to escape
repetitious problems such as flooding and unsatisfactory return from paddy cultivation even
though the lands are considered productive for paddy. Therefore, there were some attempts
to propose and/or recommend that the government should promote oil palm cultivation in
paddy areas especially as a development project for land use revision by government
agencies and groups of farmers. However, it seems that the proposal and request could not
convince the Ministry. The Ministry continued to insist on preventing paddy areas being
substituted by oil palm. The government would not approve financial assistance for the
projects unless there was proof that the promotion would not affect productive paddy areas.
The insistence is evident from government response to proposals and requests to approve
oil palm promotion in important paddy areas.
The first case is the paddy area in the Pakphanang river basin in the southern
region. Based on the success of a pilot oil palm cultivation project in the basin, there were
reports from regional agricultural officers and agricultural specialists to confirm that oil palm
can be cultivated in all areas of the basin. With the vast area of the basin, cultivating oil palm
in this area could make an important contribution to the biodiesel development policy.
Moreover, due to high tolerance of oil palm against climate variation, cultivating oil palm
instead of paddy in this area could be beneficial to farmers in terms of risk reduction from
vulnerability contexts especially flooding which can destroy paddy. However this idea was
not approved. One respondent (No.1) reported:
“Although oil palm has high potential to be cultivated in the basin, cultivating it in all areas was not suitable. The Ministry insisted that the areas which could grow paddy productively should be prevented from

240
growing oil palm. Similar to previous area identifications, oil palm was
allowed to be promoted only in areas unsuitabie for paddy cultivation, including abandoned unproductive paddy areas and other areas that have conditions unsuitabie for paddy, such as acid so// and being liable to flooding....”.
Another case mentioned by the respondent (No.1) is Rangsit Plain in the central
region of Thailand. Because of fertile soil and an irrigation system that has been provided,
the respondent (No.1) reported that this area is set by the government as a strategic area
for paddy cultivation. However, several land owners have adapted their land and switched to
cultivate alternative crops such as vegetables and fruit, especially oranges. Although these
cultivations were profitable especially in the initial period, they were not sustainable because
of several factors. As is common in general crop cultivation, all respondents said that one
important problem was the vulnerability context, such as pests, diseases and flooding, which
destroy crops. Moreover there are other problems involving market conditions, such as
oversupply of output and decrease in price which eventually made the cultivation
unprofitable. Although the farmers gave up on vegetables and fruit, they preferred not to
return to cultivating paddy. The main reason is that returning to paddy would make them
face the same problems as when growing vegetables and fruits. Moreover, it is difficult to
revert lands once adapted for vegetables and fruits to land for paddy cultivation. Due to
these conditions, at the time of the study, most of these areas were abandoned. However,
respondent (No.1) also reported that some farmers tried to seek new crops to grow in their
land. By learning from best practice as well as trial and error, some land owners finally found
that oil palm has high potential for cultivation in abandoned areas. This is because it was
profitable, provided continual income and made land owners less vulnerable to risk from
pests, diseases and flooding.
The respondent (No.1) also reported that the success of cultivation motivates
farmers to expand the area of oil palm cultivation and influences other farmers to start
cultivating oil palm in their own areas. However investing in oil palm for a large area requires
a lot of money which they cannot afford. There was an idea to request the Ministry to
declare all areas in Rangsit Plain as a promotion area for oil palm cultivation, which would
enable them to obtain credit at low cost. The result was that the idea was not approved by
Thailand Oil Palm Board (TOPB) because of worries about oil palm substitution in current

241
paddy areas. Although the whole Rangsit Plain was not declared, TOPB said it would
support oil palm cultivation if the farmers could prove that their areas were abandoned after
switching to other crops and difficult to revert to cultivate paddy.
“Promoting oil palm in Rangsit Plain will be considered case by case. If farmers want to receive support from the government, they will have to prove that the land is abandoned area in a condition difficult to switch to cuitivating paddy. ... Promotion areas were not identified on a large scale, like district or province level, because TOPB want to support only abandoned areas whereas paddy areas are conserved for food production” {1 0 .^).
After TOPB resolved to support oil palm cultivation in abandoned areas of Rangsit
Plain in 2011, several land owners registered on the programme for receiving support from
the government. According to a meeting report of TOPB, the first group of registered land
owners, including 105 landowners with about 912 hectares of abandoned areas, was
approved by the Ministry by the end of 2011. Due to several advantages of oil palm
compared to traditional crops, the success of oil palm cultivation by pioneers in Rangsit
Plain influenced land owners to register for the programme and the numbers were
increasing continually up to the time that the interviews took place.
In conclusion, loss of paddy areas caused by expansion of oil palm cultivation is an
issue of concern to policy maker, especially in the process of identifying potential areas to
promote oil palm. Land chosen for promoting oil palm was mainly in abandoned areas and
unproductive agricultural areas while the areas with high potential to cultivate paddy are
strictly conserved for paddy cultivation. Although there were attempts to propose or
recommend that the government promote oil palm cultivation in other areas, the government
insists on rejecting such promotion if it causes the expansion of oil palm in areas which have
high potential to cultivate paddy.

242
7.4 Success of oil palm promotion, loss of paddy area and perception of policy
makers
With support and incentive from the government, the amount of land occupied by oil
palm continually increases, providing output for biodiesel production as set in the
development plan. According to the promotion plan of oil palm cultivation, the government
target is to expand land under oil palm cultivation by 400,000 hectares from 2008-2012. Due
to oil palm having a lower net return than rubber at the beginning of the period of promotion,
it was difficult to convince land owners to start cultivating oil palm in target areas. Although
the promotion was not completely successful, the increase of oil palm areas tends to provide
sufficient output as material for biodiesel production
However, increasing oil palm area is not only pushed by government support but
also from personal interest of land owners. In this situation, directing oil palm to be cultivated
in suitable areas set by the policy becomes a more difficult task because some part of the
expansion of oil palm areas is not under government control.
“With the conditions of the promotion package supporting only oil palm cultivation of land owners in the target areas, the government could direct expansion of oil palm to the areas which do not cause the loss of paddy
area Therefore the government do not worry about expansion in this
case.... However the expansion which is concerning the government is the cases where land owners could cultivate oil palm without receiving support from the government because it is possible this may result In loss of paddy area. Due to the government having no real power in prohibiting oil palm cultivation... and there is no need for land owners to ask permission from the government before cuitivating oii palm..., the land owners therefore have complete freedom to use their land to cultivate oil palm whenever they want. Based on these circumstances, it is impossible for government to prohibit land owners from cultivating oil palm in productive paddy areas” fNo.1).
All respondents agreed that although the conditions of financial support from
government are intended to limit expansion of oil palm in paddy area, it seems to be

243
effective only in the case of farmers who prefer to cultivate oil palm but lack the money or
capacity to access credit to invest in oil palm and/or farmers who have capacity to invest but
they prefer to not switch their land unless they obtain support from the government.
However there are several farmers who are both willing and able to switch by using their
own money or obtainable credit. Based on freedom in land use, all respondents agreed that
the personal interest of these farmers in cultivating oil palm becomes the factor challenging
success in preventing unintended expansion of oil palm in paddy areas because the
government has no power to prevent them doing so.
In addition, all respondents said that it would be difficult to prohibit substitution of oil
palm in paddy areas if land owners want to switch their paddy lands for cultivating oil palm.
Although the policy makers knew about this inevitable impact, all respondents confirmed
that it is still necessary to promote expansion of oil palm areas to obtain enough oil palm for
running the policy. This is because the amount of oil palm area before implementing the
policy was too little to supply enough material for biodiesel production as set by the
government. Moreover, increasing palm oil supply only by developing fresh palm
productivity and increasing the crushing rate of crude palm oil might not be effective in
practice because it depends on the cooperation of oil palm farmers in changing farm
management and/or the variety of oil palm cultivated. Without farmers’ cooperation, the
policy might not be successful. Therefore to promote sufficient expansion of oil palm to meet
the target of oil palm supply, the government has to be aware of the necessity of a trade-off
between increased oil palm supply and loss of paddy areas substituted by oil palm. In
addition, it can be clear why the government does not compromise regarding promoting oil
palm cultivation in productive paddy areas as mentioned above.
Although the policy makers were aware that the substitution in paddy areas could
happen, it seems that there was no plan to deal with this substitution set in advance. One
respondent (No.2) reported that the policy was implemented without formal evaluation of
unintended impacts it may cause. Loss of paddy areas substituted by oil palm is just a
concern but there is no further action plan prepared for dealing with this impact which might
appear in the future. He said:
“Currently the process (in dealing with unintended impacts) is similar to
operational research...While the policy goes on, if there were problems.

244
unintended impacts or limitations in pursuing the policy, we would find a way to solve them.... Solving the unintended impacts would be conducted only if and when the impacts happen. ” (No.2)
Although substitution of oil palm in paddy areas was considered an important issue
while identifying areas for promoting oil palm, it seems this issue was disregarded after the
policy had been implemented. This is because there is no consideration about loss of paddy
areas (No.1, No.2 and No.3) although the government did think this would happen and there
are some signals indicating that the loss was occurring. In terms of a mechanism to track the
loss of paddy area caused by expansion of oil palm area, there is no organization assigned
specifically by the government to monitor the substitution of oil palm in paddy areas.
Although, there is an organization under the MAC that carries out surveys and reports about
the annual land use for a variety of crops, the survey is just to monitor land use at macro
level and it is not specifically designed to investigate the substitution oil palm in paddy
areas. The data are collected by the regional office of agricultural economics, then reported
to and collated by the head office. The objective of the annual land use report is to provide
statistics for monitoring the national land use situation and supporting policy making and
development planning in the agricultural sector.
According to the overall trend of land use data collected by the organization under
the MAC, although there was no net loss of paddy areas, there is some evidence indicating
that paddy areas were being reduced. Overall trends in Figure 7.1 show an increase of oil
palm areas without a decrease of paddy area. Areas under paddy cultivation have expanded
continually and increased dramatically after 2008 when the government launched the policy
to guarantee farmers’ income for paddy price. Although the overall paddy area has
expanded continually especially in the northeast and the east, there is evidence of land use
competition between oil palm and paddy at a regional level especially in the south and the
central areas (see Figure 7.2). All respondents said that these situations were expected to
occur. Although this evidence was shown in annual reports prepared by the office of
agricultural economics, it has not been reported officially to the board related to biodiesel
development, such as TOPB, and is not on the agenda for policy makers to consider (No.1,
No.2 and No.3). One respondent (No.2) said:

245
Million Ha.
12
10
8Paddy
■ ■■ '■ Oil Palm6
Rubber4
2
Iooo so i I
00oooo
Figure 7.1 Area under paddy, oil palm and rubber cultivation
Source: Unpublished data, OAE (2012a)
Note: Paddy areas means areas under in-season paddy cultivation
Million Ha.12
10Country
8 — —North
Northeast6
Central4South
2
Ii I G )O)CO
8inooI
COO)O)O)oo
oo o
Figure 7.2 Area of paddy cultivation in Thailand by regions
Source Unpublished data, OAE (2012a)
Note: Areas under in-season paddy cultivation

246
“Currently, land loss Is still only a serious Issue to be concerned about but not to be considered, because there is no official report of the loss in the relevant board. Without an official report, the process of consideration cannot be started. ... As a process of board working, the organisation which is directly responsible for the issue has to report the issue and raise it on the agenda for the committee to consider. However, in the case of loss of paddy area, there is no formal report and also no consideration about that. ... According to this situation, it couid be interpreted that land use competition between paddy and oii palm has not yet happened or it might happen but is not serious enough to raise as an issue for consideration”.
All respondents agreed that although loss of paddy areas concerns several policy
makers, this issue might not be urgent enough to raise for consideration. One respondent
(No.1) said:
“Although loss of paddy area is an important issue which must be followed up, bringing this issue to the agenda to be considered as policy needs to wait for a suitable time. Currently, government has several policies to accomplish; both the policy which is used in a campaign for election and urgent policy according to the national situation. ... Estabiishing the tools for preventing or dealing with loss of paddy area in the context of our country is not easy, because it is relevant to several stakeholders such as farmers, land owners, consumers, relevant industries and government agencies. ...It is necessary for the government to pay full attention to the issue. Aithough it needs to prepare for dealing with the problems derived from loss of paddy area. It seems that loss of paddy land Is not an urgent problem if compared with other problems that the government Intends to address”.
Although it seems that loss of paddy areas is not an issue perceived to be urgent for
the government at this time (respondents noted that the government has many other
pressing issues to consider), all respondents stated that it would become urgent in the future
but it might take a long time until the losses were significant. One respondent (No.3) said:

247
“It might take a long time for significant loss of paddy area to occur.
However, when that time comes, it would cause dramatic impact in terms of national food security. The shortage of paddy supply would increase paddy price and, eventually, negatively affect the quality of life of the population. That situation would Influence the government to raise the loss of paddy areas urgently on the national agenda and this would be the time to adapt the policy for maintaining national food security”.
In this context, it can be seen that there are some problems in the process of policy
evaluation especially after the policy has been implemented. Although there is concern at
the policy making level about loss of paddy area, following up whether losses occur in the
field is ignored. Normally, if negative impacts were identified and were serious in dealing
with, concentrating in these impacts have to be taken not only the policy making level but
also throughout the process of implementation. In other words, taking action only by
identifying supporting areas and controlling financial assistance by policy makers seems not
enough in the context of the policy implementation. This is because the stakeholders who
cause loss of paddy areas are not only the policy makers but also a huge number of farmers
living nationwide. Following up this unintended impact occurring in the field is a key point
with which the policy makers have to concern themselves. Therefore it does not make sense
for the policy makers to claim that the loss of paddy areas is taken seriously by allusions to
carefulness in identifying oil palm promotion areas and strict financial support only for
farmers in these promotion areas.
Although it is possible for policy makers to argue that it is necessary to wait a period
of time until loss of paddy area has occurred, six years after official implementation of the
policy seems long enough to call into question the earnestness of the policy makers in
dealing with unintended impacts. It is evident that the policy makers never took action about
this issue. Clearly, statistics of loss of paddy area have never been reviewed by the policy
makers although these statistics are continually gathered by civil servants of the
organization under them. Based on this evidence, it can be seen that awareness of policy
makers about loss of paddy area is considered enough to justify implementing the biodiesel
development policy. At least it could reduce the pressure of criticism from international
organizations or critics who are concerned about global food security. However in the

248
perspective of policy makers, awareness alone is not enough; they should also deal with the
issue.
7.5 Perspectives of policy makers towards current loss of paddy area
Although policy makers are concerned about food security caused by substitution of
oil palm in paddy areas, the respondents agreed that inertia in actively dealing with the loss
of paddy areas results from the fact that the substitution might be acceptable for several
reasons.
(1 ) Paddy supply compared with domestic consumption needs
Although there is a worry about scarcity of paddy for feeding the world population,
this issue seems far from the context of Thailand. With suitable natural resources, Thailand
has been a leader country exporting paddy rice in the world market for a long time, although
it became the third, after India and Vietnam, in 2012/13 and the second after India, in
2013/14 (See Figure 7.3). According to Figure 7.4, it is clear that the paddy output of
Thailand has increased steadily in recent years, with approximately 25 to 30 percent of total
output being for export. Although there is a reduction of export in 2012, it does not mean
there was a decrease of paddy output. The reduction was caused by market intervention for
guaranteeing the paddy price; the government stocks a vast amount of paddy bought from
farmers and waits for a suitable time to sell. This market intervention resulted in the
decrease of paddy rice export. In this situation, all respondents strongly agreed that it is
unlikely that Thailand would face problems of shortage of rice supply because the excess
paddy production over what is needed for domestic use should guarantee this security.
However, all respondents thought that an excess of supply is not very good for the
country especially as it lacks the capacity to control the market. Although Thailand is a
leading paddy exporter, the country is not in a position to negotiate in the world paddy
market. As a price taker, the country has to accept the world market price, which is
considered low if compared with what the farmers invest. This situation results in the farmers
getting low incomes and staying poor. In the last decade, several governments have
attempted to deal with the excess supply of paddy to enhance the quality of life for farmers.
The policy launched by the government is to intervene in the domestic market to increase

249
Million Tonne
12
10
8
6
4
2
0o j CO
•Thailand•Vietnam
• India• Pakistan •USA
Figure 7.3 Milled rice exports of the 5 biggest exporting countries
Source: Data from USDA (2014)
Million Tonne
4 5
4 0
CT><J>G)OOO gO
COoo
LOoo
§o
COooO)oo
CN8 o
•Total Output •Export
Figure 7.4 Total paddy output and export of paddy of Thailand
Source: Unpublished data, (OAE, 2013)
Note: Total paddy output refers to quantity of unmilled paddy
Export refers to quantity of milled paddy rice

250
the price; in effect they buy rice so as to prevent the price from dropping. Although this
policy could satisfy the farmers, an excess of supply potentially causes a serious fiscal
encumbrance. When it comes to this situation, it is clear that conserving all paddy areas for
the reason of food security might not make sense if the country finally has to pay much
money to solve the problem of price caused by an excess of supply. With this situation, the
respondents (No.2 and 3) strongly agreed that conserving paddy areas should be flexible. It
should not be strict that all paddy areas have to be conserved.
All respondents said that the fiscal balance would be better if excess supply of paddy
is decreased because it could reduce the budget used for intervening in the paddy market.
In order to alleviate the fiscal problem caused by the excess supply, it is acceptable for the
government to ignore the substitution of paddy by oil palm especially in less productive
paddy areas or in the regions that were not set as paddy cultivation areas in the national
strategic plan.
(2) Substitutions occurring in acceptable areas
At the regional level, identifying land use for cultivating economic crops is based on
physical characteristics of the regions of the country. In terms of oil palm, although the policy
makers have identified several regions that are suitable for its cultivation, the south is
considered the best region and is set as the main region for oil palm cultivation.
Strategically, if the government would like to promote the south as the main base of oil palm
cultivation, oil palm should be strongly promoted in the target region and it should be
acceptable if oil palm replaces other crops, even in some paddy areas, as long as the
substitution does not affect national food security. Although this strategy is in contrast to
guidelines of oil palm promotion and some policy makers insist on conserving all current
paddy areas only for paddy cultivation, some of them thought that it is possible to allow
some paddy areas to switch to oil palm if cultivating paddy is not profitable. As one
respondent (No.1) noted:
“At the time that policy makers have to identify supporting areas for oii paim cultivation, it is difficult to draw a line between suitable and unsuitable areas. Therefore, some unproductive paddy areas might be

251
excluded whereas some productive paddy areas might be included In the support areas. For instance, although the Pakphanang river basin was considered as the best area for paddy cultivation, it does not mean every piece of land in the area could be cultivated for paddy effectively”.
While one respondent (No.1) could accept the substitution only in some specific
areas, like unproductive paddy area, the other two thought that substitution of oil palm in
both unproductive and productive paddy areas might be acceptable if the rest of the paddy
area could cultivate enough paddy for domestic consumption and/or export. A respondent
(No.3) said:
“According to macro agricultural land use of the country, if ail regions are exactly used as in the plan, paddy product cultivated by the central, north and northeast regions is enough for the Thai population and to have excess suppiy for export. In this situation, there is nothing to worry about if there was a loss of paddy area in some regions iike the south or east because excess supply of paddy from other regions could be transported to sell in every region of country ... Therefore it might be acceptable for paddy areas In the some regions to be switched to oil palm or other crops if the alternative land use provides a better return than from paddy”.
(3) Alternative for better farmers' livelihood
Although the government has attempted to minimize substitution of oil palm in paddy
areas to maintain national food security in the long term, there are several contributions that
policy makers expect from oil palm cultivation. As mentioned in Chapter 2, promoting oil
palm cultivation is not only for using the crop as a material in biodiesel production but also
for an alternative way to develop farmers’ livelihood. In this situation, expansion of oil palm
in paddy areas therefore is a dilemma challenging the policy makers. On one hand,
substitution means a reduction in food security in the long term. On the other hand,
changing paddy cultivation to oil palm can bring some benefits to farmers.
Although food security is an issue which concerns policy makers, it is about the
impact which might occur in the long term which is far from the current context of Thailand

252
itself. Since Thailand can currently produce enough paddy for domestic consumption and
has a lot of excess supply for export, there is no need for the policy makers to worry about
the food security of domestic consumption. While food security is not such a serious issue at
this time, all respondents suggested that there are several problems in paddy cultivation
faced by the farmers, especially vulnerability of production, its market and eventually
farmers’ livelihood. According to its different nature compared with paddy, oil palm has some
advantages enabling farmers to overcome problems in paddy cultivation. One respondent
(No.2) said:
“Naturally, paddy is very vulnerable climatic variation, both drought and flooding. Paddy farmers would lose production if they faced serious climatic variation. However this problem would disappear or be alleviated if the farmers switch crop from paddy to oil palm because it is more tolerant against climatic variation than paddy. ... Oil palm is also suitable in unproductive paddy areas because oil palm is productive in most soil conditions if it is well prepared.... Moreover oil palm cultivation is suitable for households that have problems about labour. Because labour used for maintenance and harvesting in oil palm is predetermined and periodic, it is easy for farmers to manage the labour. ...Continuous income from oii palm harvesting is an advantage that would help farmers cultivating paddy once a year, especially In unproductive areas. This is because oii palm would give a better return than paddy. . . . I f switching paddy areas to cuitivate oil palm could bring about wellbeing of farmers, it does not make sense for them to endure failure of paddy cultivation”.
Clearly, improving farmers’ livelihood is the main aim that the government expects
from promoting oil palm cultivation. It seems that the government gives more priority for this
contribution than to increasing the share of biodiesel in the national energy matrix which is
set as the principal target of oil palm promotion. All respondents reported that the objective
of increasing the share of palm oil (B100) as an ingredient of biodiesel in the national energy
matrix is not fixed but is flexible depending on palm oil supply. This is because the
government sets priority for the use of palm oil for domestic consumption, including in
households and food and non-food industries. Palm oil allowed for biodiesel production is
the remainder after domestic consumption and the percentage of palm oil (B100) blend in

253
biodiesel would be regulated by the government to be consistent with this remainder supply.
Moreover, all respondents also reported that the MOE is prompt in decreasing the ratio to
the minimum standard if there is a shortage of oil palm.
The flexibility in determining the ratio of B100 blend in biodiesel reflects that the
government seems to ignore an objective of the biofuel development policy being to produce
biodiesel for increasing energy security. This is because if the government aims to
accomplish this objective by setting a high share of biodiesel in the national energy matrix,
the government could import palm oil for biodiesel production when there is a shortage of oil
palm. However the government never adopted this choice for providing palm oil to the
biodiesel industry. Oil palm is allowed to be imported only when the domestic shortage
tends to seriously affect HH consumption and the industries necessary for daily life which
use palm oil as a material.
The decision made in this manner not only reflects lack of joined up thinking
regarding the objective about increasing energy security, but also seems to show the
intention of the government to support farmers in the country. Actually, the government have
to subsidise biodiesel production for making the biodiesel price competitive with fossil diesel.
All respondents agreed that this subsidy makes sense because the country could save
money from fossil diesel imports and this money could eventually be returned to farmers
who cultivate oil palm. Although the government have to spend a lot of money, this subsidy
would be worthwhile as long as palm oil used for biodiesel production is derived from
domestic production. Therefore willingness of government to subsidise biodiesel production
by using only oil palm derived from domestic production is evidence that the government is
expecting the final contribution of the policy to be developing the livelihood of farmers more
than increasing energy security.
All respondents accepted that oil palm could not support biodiesel production
sufficiently in the long term because of the limited availability of arable land. Therefore,
Thailand could not expect to cultivate sufficient oil palm for biodiesel production over the
longer term. Hence it is necessary to wait for technological developments to provide
alternatives as input in biodiesel production. The current policy of supporting oil palm
cultivation is, it seems, just to maintain a balance of oil palm in the domestic market and for

254
using as a material for biodiesel production until the advent of alternative oils that can be
commercially used for substituting palm oil.
From these points, it can be seen that the contribution that policy makers expected
mostly from the expansion of palm is to enhance farmers’ livelihood while the main objective
of increasing the share of biodiesel to increase energy security is ignored. Therefore the
target of farmers’ livelihood improvement is an ideal that is difficult for the policy makers to
reject and it might be acceptable for the policy makers to have oil palm expansion in paddy
areas if this could contribute better to the livelihood of farmers.
(4) Lack of political awareness
Although the factors mentioned above tend to encourage inertia in following up
current loss of paddy areas, all respondents thought that these factors might be less
significant compared with political considerations. As generally known in democratic
systems, the government which is comprised of a majority of the representatives would
administer national affairs according to the policies stated in the parliament. In order to
satisfy the people after winning an election, the policies are normally derived from the
populist campaigns declared while promoting the election and the government normally tries
to implement these policies immediately. Based on this model, it seems the government
mostly concentrates on these policies and mobilizes human and financial resources to
accomplish them. Because the policy of maintaining food areas was not included in the
populist policies, all respondents agreed that the loss of paddy areas is not of immediate
concern to the government, although it is an unintended problem which is expected to occur.
An example of a populist policy in the agricultural sector at the time that the interviews took
place is the price guarantee of paddy (Jermsittiparsert et al., 2012). Although this policy is
expensive, trying to accomplish this policy seems to make sense in terms of the political
context, because it appears to show the government as being honest in doing what they
said they would do during the election, which could maintain the popularity of the
government in the long term.
Political considerations have not only played an important role in determining the
policy but also in screening problems and/or issues for the government to deal with.
Although most policies are mainly determined by the political party who won the election.

255
there are other problems and/or issues which are not included in the policy package used
during the election. It is necessary for the government to respond to them. However, there
are a lot of problems and/or issues and it is impossible for the government to deal with all of
them. Therefore, it is necessary for the government to screen them and set their priorities.
All respondents mentioned that the problems and/or issues chosen by the government in
this case are mostly dependent on public interest and these problems and/or issues have a
direct and serious impact on the people, for example natural disasters, increase in price of
goods and services and seasonality of price of agricultural products.
Although there is some evidence about loss of paddy areas which could affect food
security in the long term, all respondents said that this issue is not significant enough to
concern the government because the evidence is not explicit and the issue is not of public
concern. This issue seems to be perceived mostly by officials at policy level because it was
mentioned several times while the policy was planned. Another group of people aware of
this issue is academics who are interested in the issue of food security and worry that loss of
paddy areas could finally impact on food security. However all respondents mentioned that
the number of these people is not enough to have significant influence to raise questions
about this unintended impact. All respondents mentioned that the loss of paddy area has not
become a public issue. This is not because it has been hidden by policy makers or
government but because this issue is still not significant enough to attract public attention.
Moreover, the respondents reported that the priority of policy set by the government
is a factor that allows the loss of paddy areas to be ignored. It seems that the policy priority
becomes the signal that informs the organisations under the government about what they
should focus on. In order to respond to government policies, all respondents agreed that the
officers in the organisations have to focus on and actively report on the situation and
progress of some issues, while other issues are ignored because they lack interest from the
political sector. This is why loss of paddy areas is not proposed for government
consideration. All respondents agreed that it is hopeless to propose this issue to the
government because it is not urgent and not directly relevant to the focus of the government.
It can be concluded from previous section that various perspectives of policy makers
are an important factor causing the issue of loss of paddy areas to be ignored. Firstly,
shortage of paddy for domestic consumption, which is considered as the most serious

256
impact of loss of paddy areas, is unlikely to occur in the near future. This is because a huge
excess of paddy supply over domestic consumption needs makes the policy makers
confident that Thailand will not face problems of food security. Secondly, this excess causes
the country continually to face the fiscal encumbrance of intervening in the domestic market
to increase the price. Finally, losses of paddy areas occur in acceptable areas, such as
abandoned and/or unproductive areas, and have potential to enhance the livelihood of
farmers. Based on these contexts, it makes sense for the policy makers to ignore the losses
of paddy areas because these losses could of benefit to the country. The substitution of oil
palm in paddy areas does not contribute only to the fiscal balance, which would be better if
the excess supply of paddy was decreased, but also to the livelihood of farmers, which
would be better with the capacity of oil palm to be more tolerant to vulnerable climatic
variation than paddy and to provide continuous income.
In terms of the political context, the issue of paddy losses was kept back without
being proposed to the government to consider because the policy makers thought that this
issue would not convince the government to take an interest. Although this point of view is
not appropriate in the context of evaluating public policy because it reflects the sluggishness
of policy makers in dealing with the loss of paddy areas, in the author’s opinion the
traditional civil service system and limitation in patterns of control and evaluation in the
progress of government policy tend to make this point of view commonly acceptable in the
bureaucracy of Thailand.
The bureaucracy in Thailand has been considered an important point of power and
influence in governing the country (Painter, 2005). It is rooted in the system that gave
priority to personnel based on patronage and dependence which in turn gives precedence to
deference and loyalty more than merit (Samudavanija, 1987; Boyle, 1998), and it therefore
makes the political sector able to dominate the civil service system. This is because, with the
regulations which require the prime minister or minister to submit nominations for higher
level executive positions, the heads of ministries and departmental level government
agencies (Civil Service Act B.E. 2551, 2008), the political sector could appoint to the higher
level executive positions civil servants who do not disagree or argue with government policy
and are ready to adopt and implement the government policy almost without question.
Based on these contexts, the civil servants tend to adapt their services to be consistent with
the needs of the political sector and simply do the Government's bidding. Normally, the

257
government, especially at the time that this research took place, would identify goals and
indices of success of populist policies and urgent policies and assign government
organizations to accomplish them. In order to respond to the political sector, it can be seen
that the policies which were approved and paid serious attention by the government would
be actively responded to by the officers, while the policies or issues which were not paid
attention to by political officials received little response or were temporarily ignored.
In addition, according to political contexts of the country in the past, discontinuity of
the governments which were frequently changing and inadequacy of governments in
following up success of policy implementation meant that control and evaluation of policy
implementation were not seriously conducted. The means of controlling and evaluating the
progress of government policy by going on a tour of inspection and/or assigning the
organisation doing summary reports about progress of policy implementation meant that
policy implementation reports tended not to present as much details as could have been
included (Nimpanich, 2011). Based on these contexts, it can be interpreted that only
important issues of interest to the government would be chosen for reporting while other
issues are not reported as it would be assumed that the government may not be interested
in them.
From overall contexts mentioned above, it can clearly be seen that the failure of
attempts to conserve paddy areas to maintain food security, once identified as an important
issue to be dealt with, was caused by the failure in duty especially of civil servants and
resulted from the current civil service system. Actually it makes sense that politicians would
not be interested in non-urgent issues but only in populist policies and urgent policies to
maintain their political popularity. Thus while it can be argued that the duty of civil servants
is to raise important issues, even if politicians may not be interested in them, the situation in
Thailand does not facilitate this. The attitude of civil servants tends to mean that they are
perfectly comfortable just doing the bidding of the politicians without raising any questions.
Arguably this is a significant weakness in the system that allows these sorts of 'failed
interventions' to occur and for the country's resources to be mismanaged.

258
7.6 Capacity of government to deal with loss of paddy area in the future
(1 ) Current policy tools
As mentioned previously, the government knew that it is difficult to prohibit
substitution of oil palm in paddy areas. Therefore, in the process of planning and
implementing the policy for providing enough oil palm supply for biodiesel production, the
government has attempted to prevent loss of paddy areas by at least two schemes:
promoting oil palm specific areas and regulating the percentage of palm oil blended in
biodiesel. However, the respondents thought that these schemes could not effectively
prevent the substitution of paddy area by oil palm. All respondents said that this scheme
might be effective only for accelerating land expansion in promotion areas but not for
prohibiting the expansion in monitoring areas like paddy areas.
All respondents agreed that the most significant current scheme that helps to prohibit
or decelerate the expansion oil palm substitution in paddy areas is the paddy price
guarantee policy launched by the government. Although, the purpose of the policy is
primarily to increase paddy price in order to eventually enhance farmers’ livelihood, it is
considered as a powerful tool to conserve paddy areas because guaranteed price motivates
farmers to cultivate paddy as they gain a better return. It is clearly seen that the price could
motivate farmers to continue paddy cultivation especially in the north and northeast regions.
Although this policy is considered as a good measure to conserve paddy areas, the
origin of the policy is not for conserving paddy area but for satisfying paddy farmers, which
is the largest group of farmers in Thailand. Because the policy is the basis of the campaign
of the political party that last won an election and uses a lot of money to run, all respondents
believe that this policy might not be sustainable. One respondent (No.3) said:
“Although the success of this (paddy price guarantee) policy couid represent an attempt to accompiish government commitment whiie promoting the election campaign and couid satisfy the paddy farmers, spending a lot of money supporting the policy would cause fiscal problems. In terms of policy management, there are many problems especially in selling paddy stock bought by the government from the

259
farmers. The budget used for buying paddy at a guaranteed price is expected to be returned by selling paddy stock and to be used for a new round of the price guarantee. However, the government currently faces a problem in selling the paddy. This situation results in the government having lack of liquidity for the next round of policy implementation and tends to create public debt in order to obtain more money to be used in the policy. ... Without effectiveness in the price guarantee policy, dramatic oversupply of paddy output would make it difficult for the government to continue the policy buying paddy in at the guaranteed price in the next round”.
Clearly, the government has no tools in place to prevent oil palm substitution in
paddy areas which could cause problems about food security in the long terms. The
schemes which were employed are mostly for promoting land expansion of oil palm areas in
short terms but not for decelerating or prohibiting the substitution of oil palm in paddy area.
Although there is a potential scheme to deal with the substitution such as a paddy price
guarantee, there are questions about fiscal problems, liquidity and effectiveness of policy
implementation which affect the policy sustainability.
(2) Potential policy tools
Respondents thought that an effective way of protecting paddy areas from oil palm
substitution is to designate areas for specific crops and seriously enforce implementation. In
order for this zoning to succeed, the protection of paddy land should be a legal matter and
the government would have to create sufficient incentive for support of the zoning.
As mentioned previously in this chapter, Thailand has designated overall land use for
each crop according to the suitable physical characteristics of each region. However, this is
only a policy guideline of agricultural development, which lacks the legal power needed to
enforce the zoning. In this situation, it is almost impossible to accomplish the result as set in
the zoning plan because land owners in Thailand can use their land in any way that they
want unless their uses are illegal. In order for zoning to succeed, the respondent (No.1) said
that the government should establish a law to enforce zoning or an incentive mechanism.

260
such as price intervention, extra assistance and subsidy, to motivate land owners to use
their land in a way consistent with the zoning plan.
As mentioned previously in this chapter, it is unlikely that the government will
establish a law to enforce crop zoning at the present time because it is not on the
government’s urgent agenda and there is not much worry about paddy loss at the present
time. In this situation, when crop zoning could not be implemented by law enforcement, one
thing that the government should do at this time is to set up an incentive system to motivate
land owners to cultivate specific crops according to the zoning plan. However, establishing
incentives is not easy.
According to the policy makers’ view on crop area identification, chosen crops are
mainly based on soil characteristics and natural resources, which are more or less static,
while crops are chosen by land owners based on several factors especially economic
conditions which are generally dynamic. Without the capacity to control dynamic factors to
satisfy the target land owners, it is difficult to be successful in directing identified crops to the
target areas. From experience of loss of paddy in the south, it is clear that setting paddy
zones without establishing additional effective incentives could not conserve all paddy
areas. Although there is an incentive like the paddy price guarantee policy applied while
promoting oil palm cultivation, it is not enough to motivate all paddy farmers to continue
cultivating paddy. Some farmers preferred to switch their paddy areas to cultivate oil palm
even though they did not receive support or assistance from the government. In order to
motivate land owners to cultivate crops as set in the zoning plan, all respondents stated that
effective economic incentives must be employed.
One respondent (No.1) reported that zoning by using economic incentives is not new
in Thailand because these incentives have been employed to support crop zoning in several
cases. One example is for stopping the production of sea prawn in paddy fields by providing
financial assistance for prawn farmers to change their land use in a way that does not affect
paddy cultivation. Moreover, there are several projects of irrigation development to enable
farmers to have enough water for cultivation and more times of cultivation in each year. Last
but not least, the government promoted sugar cane cultivation by supporting private sector
investment in sugar factories with the expectation that the factories would create demand for

261
sugar cane to feed the production process which would eventually motivate agricultural land
around the factory to be used for sugar cane cultivation.
Although the economic incentives were successful in several cases, the respondents
mentioned that accomplishing zoning might be limited by insufficient fund for
implementation. In the case of paddy area zoning, it can clearly be seen from the
experience of the policy of paddy prices guarantee that it is very difficult to use price
incentive to conserve a vast area for paddy cultivation. This is because it requires a lot of
money to intervene in the market. Moreover, policy management of price guarantee is so
complex. Ineffectiveness of management of the buying and selling of paddy tends to cause
fiscal encumbrance. Rooted in populist policy, the government spent a huge amount of
money (about 270 billion baht in 2012) for paddy purchases under the mortgage scheme. In
order to favour the farmers, the government declared it would buy paddy at a high price
(15,000 baht a tonne for ordinary rice and 20,000 baht a tonne for Hom Mali fragrant grains
in 2012) (Bangkok Post, 2012).
Due to these very high prices, which are about double the normal market prices, the
government stood to lose if paddy in stock was sold on the world market. Although the
government chose to store the grain while waiting to sell to reduce losses, this way might
not work because the rice quality drops if the grains are kept for too long which means they
might eventually fetch much lower prices. Moreover, the huge stockpile brought about
serious problems when warehouse space was needed to store new paddy to be bought
under the scheme from the next harvest (Bangkok Post, 2012). In this situation, the
government was forced to sell paddy at a cheap price. Losses from paddy sales recently
caused problems with the liquidity of the budget used in the policy. The government was
questioned about the sustainability of the policy and forced to revise the policy. Although the
government insisted on continuing the policy because it is populist policy, the guaranteed
price of paddy was clearly seen to be revised and has tended to decrease. In this situation,
the price incentive which used to motivate some farmers to continue paddy cultivation might
not be effective any more if guaranteed price was reduced significantly.
Finally, implementing paddy zoning tends to require the government to change policy
about financial assistance in a way that does not satisfy some groups of people. In order to
implement zoning effectively, the government should assist only farmers who cultivate crops

262
consistent with the zoning. However, in the past the government neglected to implement this
strategy. It can be clearly seen that when disaster caused a loss of crops, the government
normally assisted land owners without considering whether the crops that the farmers grew
were the crops recommend by the zoning plan. It seems that this approach in the past
satisfied the people. However, revising policy in order to be stricter in supporting paddy
zoning is sensitive in terms of politic popularity. The government might not change the policy
to the way that effectively supports paddy zoning if it results in a decrease in popularity of
the government.
7.7 Conclusions
Clearly, loss of paddy substituted by oil palm cultivation is an issue of concern to
policy makers especially in the phase of identifying areas for promoting oil palm cultivation.
Oil palm was strictly promoted mainly for abandoned and unproductive agricultural areas to
make sure that it would not disturb paddy areas. Although preventing loss of paddy area is
of serious concern when identifying promotion areas, there is no interest in following up loss
of paddy area caused by expansion of oil palm. There is no report or consideration about
the substitution made by the board of policy makers responsible for biodiesel development
although there is explicit evidence of loss of paddy area caused by oil palm substitution. The
inertia in following up loss of paddy is derived from the fact that the loss is not considered an
urgent issue for the government.
Moreover, there are some perspectives that make policy makers think that the
current loss of paddy areas is acceptable. Firstly, the loss does not have a seriously
negative influence on having sufficient paddy supply for domestic use. Secondly, the loss
does not occur in crucial areas or regions mainly set for paddy cultivation. Finally, cultivating
oil palm could contribute benefits that enable farmers to have a better livelihood. However
the policy makers thought that this inertia would be overcome if there are significant losses
of paddy areas especially in strategic areas, as it tends to cause shortage of supply and
eventually increase in price. This situation would influence the government to raise the loss
of paddy areas as an urgent issue on the national agenda and this would be the time to
adapt the policy for maintaining national food security.

263
In terms of potential tools used for coping with substitution, it appears that there is no
official scheme employed directly for prohibiting substitution. The schemes which were
applied in biodiesel development policy are mostly for accelerating land expansion of oil
palm areas but not for enforcing or motivating land owners to stop cultivating oil palm in
paddy areas. Zoning of paddy and oil palm is a potential tool hopefully expected to conserve
paddy areas from oil palm substitution. However, the zoning seems to be very difficult to
enforce. This is because there is no law to enforce crop zoning, too much money is needed
to pay for establishing economic incentives, and assistance or subsidies offered by the
government are indifferent to whether farmers follow the zoning or not.

264
CHAPTER 8
DISCUSSION AND CONCLUSIONS
8.1 Introduction
This chapter presents discussion of the overall research findings of the study. Firstly,
the limitations of research are provided. Secondly, the research objectives are restated, the
findings are reviewed and a discussion about how the findings answer the research
questions is provided. Thirdly, the contributions of the research are discussed and policy
implications are suggested. Finally, recommendations for future research are identified.
8.2 Limitations of the Research
The research was designed and conducted with an attempt to minimise situations
that might influence the reliability and validity of the research findings. However, it is
acknowledged that a number of important limitations were encountered along the research
journey as identified below:
The first limitation relates to the quantitative analysis used for investigating factors
that influence land use decisions. Clearly it is relatively straightforward to determine what
the important considerations are that farmers take into account when they decide about land
use. However, what is less readily apparent is how farmers weigh up all the competing
factors in order to come to a decision. Although the results of this chapter could not be
interpreted to explain this weighing up process which is a complex interplay between the
discrete factors and changes over time and of circumstances, this study has considered it
and conducted qualitative analysis, as shown in the results presented in Chapter 5, to fill this
gap. However what is still lacking is the empirical evidence for explaining land use decision
behaviour such as what constitutes willingness and capacity to undertake change and the
trade-offs between them.
The second limitation lies in using aggregated secondary data for analysing the
impact of land use switching from paddy and rubber to oil palm. It could be argued that the
problem with using highly aggregated data is the potential for missing out local and

265
individual impacts which could vary significantly within the country. The local geographies
that are favourable for oil palm, rubber and paddy rice do vary a great deal within Thailand
as shown in Chapter 2. Given the nature of aggregated data that provide overall
characteristics without looking at individual variation, the results of this chapter seem to
show only differences and trends from stakeholder to stakeholder but not among the
individuals within each stakeholder group, and the latter may be highly significant.
Finally, the analysis of policy implementation was limited to the information that the
research obtained from three interviewees. Even though the results from these interviews
could confirm the secondary data from the literature review and provide in-depth
perspectives about policy setting and implementation, some deeper information was not
available from the interviews. All the policy makers interviewed for this research were civil
servants, and they tended to be uneasy about expressing personal opinions which might
reflect negatively on others. With this limitation, the researcher regrets not including some
specific questions in the interviews. To compensate, the research adopted additional
secondary data to explain some critical points of the policy makers’ explanations where their
personal points of view were not provided.
8.3 Summary and discussions of overall findings
Promoting biofuel as an alternative energy source can cause conflict between food
and fuel, and food security and loss of food areas have become a concern since the advent
of biofuel development. Even though there are attempts to examine the dynamic of LUC,
these studies are mostly based on LUC modelling approaches relying on computer
simulations. Studies of LUC based on observing perspectives, motivations and behaviours
of local land owners and public sector officials, who directly determine land use switching,
have not been widely conducted. In order to throw light on some issues that affect global
food security, this research aimed to investigate the dynamics of land use via the
perspectives of landowners and the public sector of a food exporting country contributing to
global food security.
The research aims have been broken down into three specific objectives. The
following sections review and discuss the findings of the research in relation to these
research objectives.

266
8.3.1 Research objective 1
To explore factors influencing land use change’
The in-depth interviews showed that the HHs’ decisions in adopting land use
strategies depended on their assets and resilience to deal with vulnerability contexts, and
the policy and constitutional contexts. According to literature reviews, the interviews and the
survey, thirty three factors were identified as factors influencing land use change. The
results from interviews, which were confirmed by the quantitative results, indicated that the
HHs with different land use strategies varied in their HH characteristics. Moreover, success
of switching land to oil palm cultivation was determined by several factors which were
classified into two categories: willingness-related factors and capacity-related factors. The
influence of HH characteristics, willingness-related factors and capacity-related factors on
the decision process and the success of switching are summarized in Figure 8.1 and
discussed below.
Firstly, differences were identified between HHs who switch all or some of their land
to oil palm cultivation and HHs who maintain traditional use of their land. The findings
revealed that the decision as to whether to switch the land to oil palm was found to be
heavily influenced by variables related to the HHs characteristics (age, education, number of
HH farming labourers, income, sources of income, land size, area owned, and ratio of
owned and rental area to total land area). This is consistent with the previous studies of land
use decisions which showed decisions were affected by HH demographics and educational
level (Caviglia-Harris, 2005; Pan and Bilsborrow, 2005), HH income (Roy Chowdhury, 2006;
Pacheco, 2009), farm size (Shively, 1999; Rosenqvist et al., 2000) and land ownership type
(Pichon, 1996; Roy Chowdhury, 2010).
Secondly, the empirical findings indicated that difference in outcome expectation and
social networks and connections were willingness-related factors which determined whether
the HHs preferred to cultivate oil palm. In respect of expectation of land use outcomes, the
results indicated that the HHs commonly allocated their land to cultivate crops for meeting
their needs in food and income from sale of tree products. Rubber cultivation was continued
because it could provide higher profit than other alternative cultivation while paddy

267
ra
a219■5XX
% Em w «CO g ™ 5
< S 1 s I I< ( / ) ! - <
S' ^ ■&■ to" M gœ #.5Q) CO
DÏ (/)t b CD
WVVvVvW
(00)E m
0 CÜ 0)30 1■0 E .5
%CD £u0> "3Q. u £X05 I 2
CLX iZX
f-ÔO
E E ;
0 0 3
illIII
w CO 20 0 0
III
1 1 1 i HCO TO
IICD 05
II_C0 O
i’i 1 °§ l î l III
05 g g .g .E ,E
Si-Q CO ? 0
E E E
0 0 0
CO CO 0 0 0gg H i0 0 3 3 3
|!l î ^
c c o05 05 -5
00 IJ- 2 -
•§ ■§ E to CO o
u . L L Q
CO in
" 1 1 1 Ç0 Ç0 CO

268
cultivation satisfied the HHs because it provide paddy rice for HH consumption and lump
sum income to underpin household liquidity. Clearly, continuous income and higher profit
than from alternative cultivation were expected from switching to oil palm cultivation. This
finding corroborates the law of rent of Ricardo (1821), which suggested that decisions
regarding land use are influenced by the economic return of outputs produced from the land.
Moreover, it is also in line with Godoy (1992), Emtage and Suh (2004) and Ndayambaje et
al. (2012) who indicated that economic returns were the determinants of land use change. In
addition, further findings revealed that the HHs also took into consideration the relevant
factors, which could affect whether they obtain the highest expected outcomes. These
additional factors were productivity factors (land topography, water supply, flooding and
disease and pests), price factors (price trend, price stability, and price policy), and
assistance factors (disaster assistance and government subsidy). These findings supported
previous scholars who suggested that farmers are concerned with economic returns.
Furthermore, this findings is also consistent with the idea of Geist and Lambin (2002),
suggesting that land conditions influencing productivity (e.g. soil quality, topography,
droughts and floods) were the dominants of land use change.
In respect of social networks and connections, the findings showed that learning
about successes and advantages of oil palm cultivation via a variety of social
communications could motivate HHs to be interested in cultivating oil palm. These results
match those observed in the study of Jager et al. (2000) which suggested that farmers may
repeat production or imitate best practice of others to use their limited resources efficiently.
Imitation is a method adopted by land managers in situations where they have various
options to choose between (Pomp and Burger, 1995). Nonetheless, the exchange of
information between individuals is important in influencing the success of decisions to adopt
innovations (Berger, 2001).
Finally, the results indicated that capacity-related factors determined whether the
HHs succeeded in switching to oil palm cultivation. These factors were roughly classified
into five groups relevant to finance, labour, capital, land rights and transportation. Financial
factors are the strongest determinants making land use switching successful. This is in line
with earlier reports (such as Skutsch, 1983; Hill, 1986; Murray, 1987; McGaughey and
Gregersen, 1988; Arnold and Falconer, 1989; Brown, 2000; Cossalter and Pye-Smith, 2003;
Whiteman, 2003; Bull et al., 2006) suggesting that financial conditions, such as HH savings.

269
credit and/or government subsidy could support HHs in switching land use successfully. In
terms of capacity of labour and capital, the findings of the current study are consistent with
those of Mekonnen (1998) Patel et al. (1995) and Dewees (1993) who suggested capacity
of labour and capital as the factors considered by HHs in deciding commercial tree
cultivation. In the case of land rights, the findings indicated that lack of absolute land use
rights made switching traditional crops to oil palm cultivation impossible. This finding
corroborates the ideas of Lele and Stone (1989) and Rasul and Thapa (2003), who
suggested that insecure land tenure was the factor restricting farmers to traditional land use
practices. Finally, consistent with previous studies (Serneels and Lambin, 2001; Blackman
et al., 2008; Blackman et al., 2012), the findings indicate that difficulty of access to the plots
is an important factor influencing the land to be used for traditional crops or left abandoned.
Even though several factors were found to be the determinants of whether switching
to oil palm cultivation was successful, one unanticipated finding was the appearance of
willingness and capacity to undertake change which play an important role in determining
the success of switching to oil palm cultivation. This finding is in line with studies of McCuaig
and Manning (1982), Manning (1972) and Mandale (1984) that mentioned these conditions
as the determinants of land use change. The empirical results of the studies of Manning
(1972) and Mandale (1984) revealed that the nature and pace of land use change were
dependent on the landowners’ ability or willingness to undertake changes. Moreover,
consistent with the decision process for rural land use change revealed by McCuaig and
Manning (1982), this study confirmed that both willingness and capacity to undertake
change are simultaneously required as the prerequisite conditions of successful land use
switching.
In addition, the findings from the qualitative analysis suggested that willingness to
undertake change is a necessary condition for starting the decision process while capacity
to undertake change is a sufficient condition which determines whether the land use
switching is successful. Without the willingness, several plots were retained for traditional
uses, whereas the HHs with the willingness but lacking the capacity could not succeed in
switching. The findings of the current study indicate clearly that solely either the willingness
or the capacity could not guarantee success of land use switching. The switching would be
successful only if the willingness and capacity occurred simultaneously. This finding was

270
interesting because it provides contextual insight explaining why some HHs could not
succeed in oil palm cultivation even though they have the willingness or capacity to change.
8.3.2 Research objective 2
To assess impacts of land use change derived from biofuel development policy’
The findings from the secondary data analysis highlighted that switching paddy areas
to oil palm cultivation would provide better contribution to the economy. Evidently the value
(per Ha) from using land for oil palm is significantly highter than from using land for paddy. In
terms of contribution to stakeholders, the findings revealed that switching paddy to oil palm
cultivation would contribute most to stakeholders in both the crop farming and industrial
processing stages (farmers, entrepreneurs, labourers, input providers, transporters, retailers
and wholesalers). This results supports the ideas of NCB (2011) that investing in biofuel
crops could contribute to economic development particularly for developing countries.
Biofuel crop cultivation could create new jobs and provide new sources of income for
farmers.
However, the impact of switching land use from rubber to oil palm is different. The
findings revealed that the value (per Ha) from using land for oil palm is mostly less than from
using land for rubber. Moreover, while switching would benefit some stakeholders, others
would lose. The results indicated that stakeholders who would clearly gain are input
providers and transporters in the crop farming stage and input providers and entrepreneurs
in the industrial processing stage. On the other hand, stakeholders who would lose are
farmers, labourers and wholesalers in the crop farming stage and wholesalers, transporters,
and labourers in the industrial processing stage. This confirms the report of Preechajarn and
Prasertsri (2011) that the more economically attractive rubber limited the promotion of oil
palm cultivation in rubber areas.
8.3.3 Research objective 3
To assess the effectiveness of policy implementation in land use change’
The secondary data collected by government organisations and empirical data from
the field survey showed that there has been competition between food and biofuel crops at a

271
regional level in Thailand. This result is consistent with the findings of Rathmann et al.
(2010) that biofuel production from agricultural crops can cause land use competition
between crops. One key point revealed from the study is that the extent of loss of paddy
areas has never been officially known and tracked by the policy makers after launching the
policy, even though this issue used to be of serious concern to the policy makers. In the light
of this ignorance, the findings revealed that what the government intended by proposing
attempts to conserve paddy areas seemed to be to make the biodiesel development project
reasonable for approval in the context of Thailand where paddy areas are vulnerable to be
substituted by oil palm. Moreover, the ignorance implied that what really favoured the
government were benefits contributed by oil palm cultivation.
The cause of ignorance might be explained by the nature of the public sector that
has a role in coping with tensions between competing ideological positions and desires of
the government, as discussed in Bevir et al. (2003) and Sandel (2009), and the acceptance
that the public sector has a role in promoting security as well as wellbeing, and balancing
economic, environmental and social objectives (Moxey et al., 2009). The findings pointed
out clearly that there was a dilemma challenging the government. While the responsibility to
conserve paddy areas for food security was ideally expected by the international community,
the capacity of oil palm cultivation to contribute better farmer livelihood with less fiscal
encumbrance is difficult for the government to ignore. Based on these contexts, it would
make sense for the government to be flexible about land use by allowing oil palm to
substitute some paddy areas to gain more overall benefit.
However, it is evident that the current level of substitution could not cause food
insecurity of Thailand because the dramatic excess in supply of paddy over domestic
consumption guarantees national food security in the long term. Based on this context, there
is no need for the government to worry about the loss of paddy areas. Therefore,
substituting oil palm in some paddy areas was easily acceptable because switching to oil
palm could contribute to a better livelihood for farmers and alleviate the fiscal encumbrance
of assisting paddy farmers. This rationale was interesting because it not only provides
contextual insight showing conflicts between the outcomes of concern to the Thai
government and what is expected by international society, but also it is consistent with the
ideas of Fresco (2007) who indicated that government perspective is an important factor
influencing effectiveness in preventing competition between food and biofuel crops

272
especially in developing countries. While competition between food and biofuel crops in
developed countries can easily be prevented by strong government policy, prevention in
poor countries could be more difficult because the government might lack the willingness to
ensure that certain crops are available at reasonable prices (Fresco, 2007).
Nonetheless, the inertia in dealing with losses of paddy areas also reflected the
effectiveness of the civil service system in responding to government policy. Consistent with
the findings of Anazodo et al. (2012) and Bayo (2012) which indicated that the civil service
in developing countries remains inefficient and lacks enthusiasm in carrying out some
government policies, the findings indicated that lack of interest on the part of politicians also
caused lethargy and a lack of motivation of civil servants in tracking the losses and reporting
to the government. Evidently, there were no official reports of the losses to the government
and no additional schemes developed for directly prohibiting substitution of oil palm in paddy
areas. The only biodiesel development policy schemes which were applied were mostly for
accelerating land expansion of oil palm areas but not for enforcing or motivating land owners
to stop cultivating oil palm in paddy areas.
Even though there is no additional scheme to prohibit substitution of oil palm in
paddy areas, the findings revealed there is an accidental factor derived from paddy market
intervention by the government to maintain high paddy prices in order to enhance the quality
of paddy farmers’ livelihood. Clearly, the findings showed that increasing income from the
price intervention influenced the farmers to be willing to continue paddy cultivation.
However, the findings indicated that it is difficult for the government to pursue this
intervention in the long term because the government was questioned about the
sustainability of the policy and forced to revise it. Eventually, the result revealed that the
market mechanism might be the only factor which could influence the inertia to be
overcome. In line with the ideas of Fresco (2007), strong government policy is still needed to
prevent competition between food and biofuel crops. The government would raise the loss
of paddy areas as an urgent issue to deal with if significant losses of paddy areas tended to
cause serious shortage of supply and eventually increase the price making paddy rice very
expensive.

273
8.4 Research contributions
In the field of sustainability of land use, many studies have investigated the extent to
which expansion of biofuel cultivation can cause food security risks. However, very few
studies have sought to understand what influences land use switching from food crop to
biofuel crop cultivation in the unique context of a developing country which has a dramatic
excess supply of food over domestic consumption for exporting. This research can be
considered to contribute to the body of knowledge in the sustainability of land use literature
and also provide a foundation for future research in the field.
One of the most important methodological contributions is that the advantages of the
structured technique of the T-AHP were employed to identify factors influencing complex
decisions about land use change. Based on mathematics and psychology, the T-AHP
converts the pair-wise comparisons of the factors evaluated by the respondents to numerical
weights which can be compared to one another in a rational and consistent way. The T-AHP
allows the entire range of the potential factors to be put in the same model by using a small
sample size. However, doing it like this might be considered impossible in other quantitative
models such as logistic regression analysis which requires a large sample size. Moreover,
using the T-APH process reduces measurement bias. The numerical weights of factors are
converted from a series of judgments based on pair-wise comparisons of the factors instead
of being weighted by respondents which might be distorted by central tendency,
acquiescence and/or social desirability bias. Due to the fact that AHP has not been used in
identifying factors influencing land use change, this research provides an alternative
methodology underpinning further investigation in the field.
In addition, this research confirmed the practical validation of the SL framework in
study of the dynamics of land use. Even though the SL framework was widely employed in
explaining land use change, it was mostly used as a guideline or checklist to scope and
identify the possible variables for building empirical models with only some elements of
framework chosen according to the hypothesis and data availability. To date, this whole
framework has not been empirically validated in the field of land use change. Based on the
findings from both the qualitative and quantitative analyses in this present study, decisions
in adopting various land use strategies which were determined by the connections, linkages

274
and trades-off between the various elements confirms the practical use of the SL framework
in the field.
Finally, this research contributes to the body of knowledge in the dynamic of land use
literature and provides useful information that could engender success in maintaining food
security on a domestic and global scale. This research gives a better understanding of
contextual and situational insights about the current dynamic of land use determined by land
owners and the public sector of a developing country which is a leading food exporter. This
is very important information for both developing countries and international organisations in
establishing the mechanism or schemes to deal with global food security, because the
implications of this information could ensure basic understanding of the perspectives of
important stakeholders at every level before implementing such mechanisms or schemes.
8.5 Policy recommendations
The results of this research are valuable, especially for the government and
international organisations, in determining strategies for balancing alternative land use for
food and biofuel production. The policy recommendations for the Thai government and
international organisations are outlined below.
(1) Recommendations for the Thai Government
1) The results provide evidence that there have been losses of paddy areas which
were substituted by oil palm cultivation. However, the issue was not known about by the
government. After six years of official implementation of the biofuel development project,
there is no monitoring of these losses by the government. Therefore, in order to follow up
the unintended impacts and solve the resultant problems effectively in time, this study
suggests the government should conduct monitoring of land use after project
implementation.
2) This research indicated that inertia in dealing with the losses of paddy areas may
be caused by the civil service system in which civil servants tend to adapt their services to
be consistent with the needs of the political sector and simply do the Government's bidding
without too many questions. As revealed by the research findings, dealing with the losses of
paddy was not paid serious attention by the government. Therefore, it was temporarily

275
ignored by the civil servants. Even though the losses could have been detected from annual
reports prepared by OAE, they were not reported officially to the government due to their not
being considered important by the government. Based on these contexts, this research
suggests that the mechanism in following and dealing with the impacts of the government
policy should be reviewed and reformed in order to guarantee that the impacts are
continually monitored and considered by policy makers. In addition, the mechanism should
be strengthened to prevent some sorts of government interventions which cause the
country's resources to be mismanaged.
3) This study shows that the losses of paddy areas are mostly recognised at policy
making level while they seem not significant enough to attract public attention, especially
from the farmers. As revealed from the research findings, even though there are some
farmers who still conserve some areas for cultivating paddy for their own consumption,
others switch all paddy areas to oil palm cultivation or leave the land abandoned and buy
paddy rice from the market for consumption. Due to paddy being an important basic food for
Thais and because it is difficult and costly to revert oil palm plots back to paddy cultivation,
the farmers should be informed and be aware about issues of food security before they
decide. Therefore, this research recommends that the government should undertake public
relations activities to inform the people, especially farmers, about the points that should be
considered.
4) The research found that the most significant current scheme that helps to
decelerate the substitution of oil palm in paddy areas is the paddy price guarantee policy
launched by the government. However, this scheme is questioned regarding fiscal
problems, liquidity and effectiveness of policy implementation. Due to these questions, it is
possible that this scheme might not be continued in the long term. As indicated by the
research findings, the higher income from paddy cultivation is an important factor influencing
farmers to continue paddy cultivation. Therefore, it would be difficult to prohibit substitution if
the paddy price guarantee policy were cancelled. This research suggests that the
government should prepare additional schemes to substitute for the paddy price guarantee
policy. Moreover, it is suggested that additional schemes should include financial incentive
to compensate for the economic losses caused by the cancellation of the paddy price
guarantee policy. Otherwise, farmers who have high capacity to change might change their
minds and switch their land to oil palm cultivation.

276
(2) Recommendations for international organisations
The research found that food security is generally of concern to food exporting
countries. However, the earnestness of a country in conserving areas for food production is
dependent on national conditions. In the context of the case study, it seems that conserving
paddy areas was not emphasized by the Thai government. This is because losses of some
paddy areas would not impact the country’s food security. Moreover, it does not make sense
to conserve whole paddy areas by spending a large national budget to assist or subsidize
paddy cultivation for maintaining global food security. According to the target of agricultural
development which is mainly to enhance the livelihood of farmers, cultivating oil palm
instead of paddy is acceptable because the farmers’ livelihood can be improved with less
fiscal encumbrance in the long term.
Based on this situation, it is evident that food security might be reduced by lack of
motivation for the potential providers especially food exporters. Clearly, the recent market
situation rewards only paddy grain, while food security is not taken into account. Considered
as a public good, food security could benefit many people around the world and it is
impossible to restrict consumption to only those paying for this benefit. In this situation, there
can be no market mechanism for rewarding food security providers, and so food security
tends not to be adequately addressed by the market. Based on these contexts, this research
suggests that the international organisations concerned with food security should establish a
market mechanism to be used to control areas for food production by providing economic
incentives for achieving food security targets.
8.6 Future research recommendations
Even though the research aim and objectives have been achieved, further research
is needed to expand the findings and to provide more conclusive answers. The directions for
further research are suggested as follows.
1) Due to a lack of empirical evidence for explaining land use decision making such
as what constitutes willingness and capacity to undertake change and the trade-offs

277
between them, it is suggested that further research should be carried out employing a
structural equation modelling (SEM) technique to test the more complicated hypotheses
about land use decisions. SEM provides better understanding in complex phenomena
involving multiple variables. In addition, it is also able to construct latent variables, variables
that are not directly observed but are estimated in the model from other observe variables,
which allow the estimation of structural relations of observable variables and additional
latent variables to be more accurate (Schumacker and Lomax, 2010).
2) Even though impacts of land use switching on stakeholders were derived from the
analysis of aggregated data, what is still absent are differences and trends among the
individuals within each stakeholder group which could vary significantly within the country.
Based on this limitation, it is suggested that further research should employ disaggregated
data to reveal the local and individual impacts. Instead of aggregated data, disaggregated
data could be collected to provide the impacts by specific subgroups of stakeholders. In
doing so, the sampling frame should be set to cover all subgroups of stakeholders in order
to ensure that data from the stakeholders with different profiles were collected and analysed
in the same model. By doing this, the models could reflect the local conditions and thus be
more suitable for exploring differences amongst stakeholders.
3) Due to the fact that all the policy makers interviewed for this research were civil
servants and some deeper information was not available from the interviews, it is suggested
that further research should include a wider range of policy makers in the study in order to
obtain various and all-round points of view regarding criticising the policy. In doing so,
sample size should be increased in terms of both numbers and types of respondents to gain
more discourse and follow up on points that they raised. Thus, the sample should not be
limited only to civil servants but politicians, representatives of NGOs and other stakeholders
should also be included.
In addition, there are some areas related to issues of dynamics of land use and
conflicts between land use for food and biofuel production to be explored. In this respect,
further research in the following areas is suggested:
1) In order to comprehend global food security, similar studies need to be done in
other countries especially of food exporting countries who supply food for the global market.

278
In addition, it would be useful to conduct a similar study for other food crops which play an
important role in the global food market and are potentially substituted by biofuel crops.
2) In order to gain better understanding of the government’s perspective on loss of
food area caused by biofuel crop expansion and how government deals with that loss,
further research is needed to look in greater depth at the relationships between civil
servants and politicians influencing the effectiveness of following and dealing with the
impact of government policy.

279
REFFERENCES
Adato, M. and Meinzen-Dick, R. S. (2002) Assessing the Impact of Agricultural Research on Poverty Using the Sustainable Livelihoods Framework, International Food Policy Research Institute.
ADB (2009) An Overview and Strategic Framework forBlofuels Development. GreaterMekong Subregion-Status and Potential for the Development of Biofuels and Rural Renewable Energy. Mandaluyong City: Asian Development Bank. Available at: http://www.adb.orq/sites/default/files/pub/2009/biofuel-development-strateqic- framework-qms.pdf. (Accessed 15 April 2012).
Agresti, A. (2007) An Introduction to Categorical Data Analysis, NJ: Wiley.
Al-Riffai, P., Dimaranan, B. and Laborde, D. (2010) Global Trade and Environmental Impact Study of the EU Blofuels Mandate. Washington, DC: International Food Policy Institute. Available at:http://trade.ec.europa.eu/doclib/docs/2010/march/tradoc 145954.pdf (Accessed: 1 January 2014).
Amatayakul, W. and Azar, C. (2008) Determinants and land-use patterns of commercial cultivation of a fuel-wood crop in Thailand. Energy for Sustainable Development, 12(1), pp. 22-32.
Anazodo, R. O., Okoye, J. C. and Chukwuemeka, E. E. O. (2012) Civil Service Reforms in Nigeria: The Journey so far in Service Delivery. Journal of Political Studies, 19(2), pp. 1-19.
Anjichi, V. E., Mauyo, L. W. and Kipsat, M. J. (2007) The Effect of Socio-Economic Factors on a Farmer’s Decision to Adopt Farm Soil Conservation Measures. An Application of Multivariate Logistic Analysis in Butere/Mumias District, Kenya, in Bationo, A., Waswa, B., Kihara, J. and Kimetu, J., (eds.) Advances In Integrated Soil Fertility Management In sub-Saharan Africa: Challenges and Opportunities: Springer Netherlands, pp. 915-920.
Arber, S. (2001) Designing samples, in Gilbert, N., (ed.) Researching Social Life,London: Sage Publications.
Arnold, J. E. M. and Falconer, J. E. (1989) Household Food Security and Forestry: An Analysis of Socio-Economic Issues, FAQ, Italy, Rome.

280
Bafes, J. and Haniotis, T. (2010) Placing the 2006/08 Commodity Price Boom IntoPerspective, Policy Research Working Paper 5371, The World Bank Development Prospects Group. Available at: http://www-wds.worldbank.orq/servletAA/DSContentServerAA/DSP/IB/2010/07/21/000158349 20 100721110120/Rendered/PDF/WPS5371.pdf (Accessed: 12 January 2014).
Bangkok Post (2012) Rice scheme needs rethink. Bangkok Post (19 July 2012) Available at: http://m. banakokpost. com/oplnlon/303168 (Accessed: 1 May 2013).
Bauen, A., Chudziak, C., Vad, K. and Watson, P. (2010) A Causal Descriptive Approach to Modeling the GHG Emissions Associated with the Indirect Land Use Impacts of Blofuels. London: E4tech. Available at: http://www.apere.Org/doc/1010 e4tech.pdf (Accessed: 2 January 2014).
Bayo, O. A. (2012) Federal civil service reform in Nigeria: The case of democraticcentralism. Journal of Radix International Educational and Research Consortium, 1(10), pp. 1-45.
Berger, T. (2001) Agent-based spatial models applied to agriculture: a simulation tool for technology diffusion, resource use changes and policy analysis. Agricultural Economics, 25(2-3), pp. 245-260.
Bevir, M., Rhodes, R. A. W. and Weller, P. (2003) Traditions of governance: interpreting the changing role of the public sector. Public Administration, 81(1), pp. 1-17.
Blackman, A., Albers, H. J., Âvalos-Sartorio, B. and Murphy, L. C. (2008) Land Cover in a Managed Forest Ecosystem: Mexican Shade Coffee. American Journal of Agricultural Economics, 90(1), pp. 216-231.
Blackman, A., Âvalos-Sartorio, B. and Chow, J. (2012) Land cover change in agroforestry: Shade coffee in El Salvador. Land Economics, 88(1), pp. 75-101.
Blaikie, N. (2009) Designing Social Research, 2nd ed., Cambridge: Polity Press.
Bosselmann, A. S. (2012) Mediating factors of land use change among coffee farmers in a biological corridor. Ecological Economics, 80(0), pp. 79-88.
Boundeth, S., Nanseki, T., Takeuchi, S. and SATHO, T. (2012) Land Use Change and Its Determinant Factors In Northern Laos: Spatial and Socio-economic Analysis, 2012.

281
Bourguignon, F., Bussoio, M. and da Silva, L. A. P. (2008) The Impact of Macroeconomic Policies on Poverty and Income Distribution: Macro-mlcro Evaluation Techniques and Tools, Palgrave Macmillan.
Boyle, J. (1998) Cultural influences on implementing environmental impact assessment:insights from Thailand, Indonesia, and Malaysia. Environmental Impact Assessment Review, 18(2), pp. 95-116.
Briassoulis, H. (2000) Analysis of Land Use Change: Theoretical and Modeling Approaches, The Web Book of Regional Science, Scott Loveridge, ed. Regional Research Institute, West Virginia University, USA. Available at:htto://www.rri.wvu.edu/WebBoolVBriassoulis/contents.htm (Accessed: 2 May 2013).
Brown, C. (2000) The global outlook for future wood supply from forest plantations. Working Paper No: GFPOS/WP/03, FAQ Forestry Policy and Planning Division, FAQ, Italy, Rome.
Bryman, A. and Bell, E. (2011) Business Research Methods, 3rd ed., Oxford: Oxford University Press.
Buckingham, A. and Saunders, P. (2004) The Survey Methods Workbook: From Design to Analysis, Cambridge: Polity Press.
Bull, G. Q., Bazett, M., Schwab, O., Nilsson, S., White, A. and Maginnis, S. (2006) Industrial forest plantation subsidies: Impacts and implications. Forest Policy and Economics, 9(1), pp. 13-31.
Bürgi, M., Hersperger, A. M. and Schneeberger, N. (2004) Driving forces of landscape change-current and new directions. Landscape Ecology, 19(8), pp. 857-868.
Bürgi, M. and Turner, M. G. (2002) Factors and processes shaping land cover and land cover changes along the Wisconsin River. Ecosystems, 5(2), pp. 184-201.
Carr, D. L. (2008) Migration to the Maya Biosphere Reserve, Guatemala: Why place matters. Human Organization, 67(1), pp. 37-48.
Caviglia-Harris, J. L. (2005) Cattle Accumulation and Land Use Intensification byHouseholds in the Brazilian Amazon. Agricultural and Resource Economics Review, 34(2), pp. 145-162.

282
Chambers, R. and Conway, G. (1992) Sustainable Rural Livelihoods: Practical Concepts for the 21st Century, Institute of Development Studies, University of Sussex.
Cheong, S.-M., Brown, D. G., Kok, K. and Lopez-Carr, D. (2012) Mixed methods in land change research; towards integration. Transactions of the Institute of British Geographers, 37(1), pp. 8-12.
Chuanraktham, W. (2005) Innovation "oil palm" from food industry to alternative energy of Thailand, in Engineering Today, pp. Available at:http://www.enaineerinqtodav.net/maqazine/articledetail.asD?arid=3066&pid=301 (Accessed: 3 January 2012) (in Thai).
Churchill, G. A. and lacobucci, D. (2005) Marketing research: methodological foundations, 9th ed., Ohio: Thomson South-Western Publishers.
Civil Service Act B.E. 2551 (2008),in Royal Thai Government Gazette, Vol. 125, No. 22n, pp. 1-51 (25 January 2008).
Clark, V. L. P. and Creswell, J. W. (2008) The Mixed Methods Reader, London: SAGE Publications.
Collis, J. and Hussey, R. (2003) Business research: A practical guide for undergraduate and postgraduate students, 2nd ed.. New York: Palgrave Macmillan.
Corbetta, P. (2003) Social Research: Theory, Methods and Techniques, London: SAGE Publications.
Corley, R. H. V. and Tinker, P. B. (2003) The Oil Palm, 4 ed., Oxford: Blackwell Science Ltd.
Cossalter, C. and Pye-Smith, C. (2003) Fast-wood forestry: myths and realities, Bogor Barat: Center for International Forestry Research.
Creswell, J. W. (2009) Research Design: Qualitative, Quantitative, and Mixed Methods Approaches, Thousand Oaks, CA: SAGE Publications.
Crossan, F. (2003) Research philosophy: towards an understanding. Nurse Researcher, 11(1), pp. 46-55.
Crotty, M. (1998) The Foundations of Social Research: Meaning and Perspective In the Research Process, London: SAGE Publications.

283
Dattalo, P. (2008) Determining Sample Size : Balancing Power, Precision, and Practicality, Oxford: Oxford University Press.
Dauber, J., Brown, 0., Fernando, A. L., Finnan, J., Krasuska, E., Ponitka, J., Styles, D., Thran, D., Van Groenigen, K. J., Weih, M. and Zah, R. (2012) Bioenergy from “surplus” land: environmental and socio-economic implications. BloRlsk, 7(0), pp. 5- 50.
DEDE (2007) The 15-year Alternative Energy Development Plan (AEDP), Bangkok: Department of Alternative Energy Development and Efficiency. Available at: http://www.dede.qo.th/dede/fileadmin/upload/nov50/mar52/REDP present.pdf (Accessed: 3 January 2012).
DEDE (2009) National Blofuels Policy, Deployment and Plans -Thailand, Bangkok: Department of Alternative Energy Development and Efficiency. Available at: http://www.iea.orq/work/2009/banqkok/1 4 Nilkuha.pdf (Accessed: 3 January 2012).
Denscombe, M. (2010) The Good Research Guide: For Small-Scale Social Research Projects: for small-scale social research projects. Maidenhead: McGraw-Hill Education.
Denzin, N. K. and Lincoln, Y. S. (2011) The SAGE Handbook of Qualitative Research, Thousand Oaks, CA: SAGE Publications.
Dewees, P. A. (1993) Trees, land, and labor. World Bank environment paper; no. 4., World Bank environment paper; no. 4. Washington, DC: World Bank. Available at: http://documents.worldbank.orq/curated/en/1993/12/5044256/trees-land-labor (Accessed: 27 December 2013).
Dey, I. (1993) Qualitative Data Analysis: A User-friendly Guide for Social Scientists, London: Routledge.
DFID (1999) Sustainable livelihoods guidance sheets, London: Department for International Development. Available at: http://www.ennonline.net/resources/667 (Accessed: 30 January 2014).
Dialsingh, I. (2008) Face-to-Face Interviewing, in Lavrakas, P. J., (ed.) Encyclopedia of Survey Research Methods,Thousand Oaks, CA: Sage Publications, Inc. pp. 260- 262.

284
DMR (2003) Geological map of Thailand, Department of Mineral Resources, Ministry of Natural Resources and Environment of Thailand.
DOA (2008) The Oil Palm, Bangkok: Department of Agriculture. Available at:http://it.doa.qo.th/vichakan/news.php?newsid=12 (Accessed: 30 April 2013)(in Thai)
Easterby-Smith, M., Thorpe, R. and Lowe, A. (2002) Management Research: An Introduction, London: SAGE Publications.
Ellis, F. (1998) Household strategies and rural livelihood diversification. The Journal of Development Studies, 35(1), pp. 1-38.
Emtage, N. and Suh, J. (2004) Socio-economic factors affecting smallholder tree planting and management intentions in Leyte Province, Philippines. Small-scale Forest Economics, Management and Policy, 3(2), pp. 257-270.
Encheva, S. (2010a) On Reducing the Number of Existing Cycles in Connected Graphs Obtained from Comparison Matrices. WSEAS Transactions on Business and Economics, 7(2), pp. 126-135.
Encheva, S. (2010b) Ordinal representation of ranking. In Paper Presented to theProceedings of the 12th WSEAS international conference on Mathematical methods, computational techniques and intelligent systems, Sousse, Tunisia.
Encyclopaedia Britannica (2014a) Oil Palm, Encyclopedia Britannica Online. Available at: http://qlobal.britannica.com/EBchecked/topic/426205/oil-palm (Accessed: 9 September 2014).
Encyclopaedia Britannica (2014b) Rice, Encyclopedia Britannica Online. Available at:http://qlobal.britannica.com/EBchecked/topic/502259/rice (Accessed: 9 September 2014).
Encyclopaedia Britannica (2014c) Rubber Tree, Encyclopedia Britannica Online. Available at: http://qlobal.britannica.com/EBchecked/topic/442351/rubber-tree (Accessed: 9 September 2014).
EPPO (2011) Energy Statistics of Thailand 2011. Energy Policy and Planning Office, Ministry of energy of Thailand.

285
FAOSTAT (2012) Harvest area of agricultural products, The Statistics Division of Food And Agriculture Organization of The United Nations. Available at: http://faostat.fao.org (Accessed: 15 February 2012).
Fargione, J., Flill, J., Tilman, D., Polasky, S. and Flawthorne, P. (2008) Land Clearing and the Biofuel Carbon Debt. Science, 9(5867), pp. 1235-1238.
Feinstein, A. R. (1996) Multivariable Analysis: An Introduction, New Haven, CT: Yale University Press.
Frankfort-Nachmias, C. and Leon-Guerrero, A. (2011) Social Statistics fora Diverse Society, Thousand Oaks, CA: Pine Forge Press.
Fresco, L. O. (2007) Biomass, food & sustainability: Is there a dilemma? Amsterdam: University of Amsterdam. Available at:http://www.louiseofresco.com/pdf/Publicaties/2007%20Updated%20Version%20Bio mass food and sustainabilitv.pdf (Accessed: 2 January 2014).
Fritsche, U. R., Hennenberg, K. and Hünecke, K. (2010) The ILUC factor as a Means to Hedge Risks of GHG Emissions from Indirect Land Use Change. Darmstadt: Oeko Institute. Available at: http://www.oeko.de/oekodoc/1030/2010-082-en.pdf (Accessed: 2 January 2014).
Geist, H. J. and Lambin, E. F. (2002) Proximate Causes and Underlying Driving Forces of Tropical Deforestation: Tropical forests are disappearing as the result of many pressures, both local and regional, acting in various combinations in different geographical locations. BioScience, 52(2), pp. 143-150.
Gilbert, N. (2008) Researching Social Life, London: SAGE Publications.
Gillham, B. (2008) Developing a Questionnaire, London: Continuum.
Given, L. M. (2008) The Sage Encyclopedia of Qualitative Research Methods: A-L ; Vol. 2, M-Z Index, London: SAGE Publications.
Gobin, A., Campling, P. and Feyen, J. (2002) Logistic modelling to derive agricultural land use determinants: A case study from southeastern Nigeria. Agriculture, Ecosystems & Environment, 89(3), pp. 213-228.
Godoy, R. A. (1992) Determinants of Smallholder Commercial Tree Cultivation. World Development, 20(5), pp. 713-725.

286
Hair, J. F., Black, W. C., Babin, B. J., Anderson, R. E. and Tatham, R. L. (2006) Multivariate data analysis, New Jersey, 6th ed., Pearson Prentice Hall.
Heery, E. and Noon, M. (2008) A Dictionary of Human Resource Management, Oxford: Oxford University Press.
Hersperger, A. M. and Bürgi, M. (2009) Going beyond landscape change description: Quantifying the importance of driving forces of landscape change in a Central Europe case study. Land Use Policy, 26(3), pp. 640-648.
Hiederer, R., Ramos, F., Capitani, C., Koeble, R., Blujdea, V., Gomez, O., Mulligan, D. and Marelli, L. (2010) Biofuels: A New Methodology to Estimate GHG Emissions from Global Land Use Change—A Methodology Involving Spatial Allocation of Agricultural Land Demand and Estimation ofC02 and N20 Emissions, Ispra: European Commission Joint Research Centre. Available at:http://eusoils.irc.ec.europa.eu/esdb archive/eusoils docs/other/EUR24483.pdf (Accessed: 1 January 2014).
Hill, P. (1986) Development Economics on Trial. The Anthropological Case fora Prosecution, Cambridge: Cambridge University Press.
Hill, T. and Lewicki, P. (2007) Statistics: Methods and Applications, Oklahoma: StatSoft, Inc.
Hosmer, D. W. and Lemeshow, S. L. [2000) Applied Logistic Regression, Hoboken, NJ: Wiley-lnterscience.
Hughes, J. A. and Sharrock, W. W. W. (1997) The Philosophy of Social Research, London: Longman Publishing.
Jager, W., Janssen, M. A., De Vries, H. J. M., De G reef, J. and VIek, C. A. J. (2000)Behaviour in commons dilemmas: Homo economicus and Homo psychologicus in an ecological-economic model. Ecological Economics, 35(3), pp. 357-379.
Jansen, H. G. P., Damon, A., Rodriguez, A., Pender, J. and Schipper, R. (2006)Determinants of income earning strategies and sustainable land use practices in hillside communities in Honduras. Agricultural Systems, 88, pp. 92-110.
Jensen, R. E. (1986) Comparison of consensus methods for priority ranking problems. Decision Sciences, 17{2), pp. 195-211.
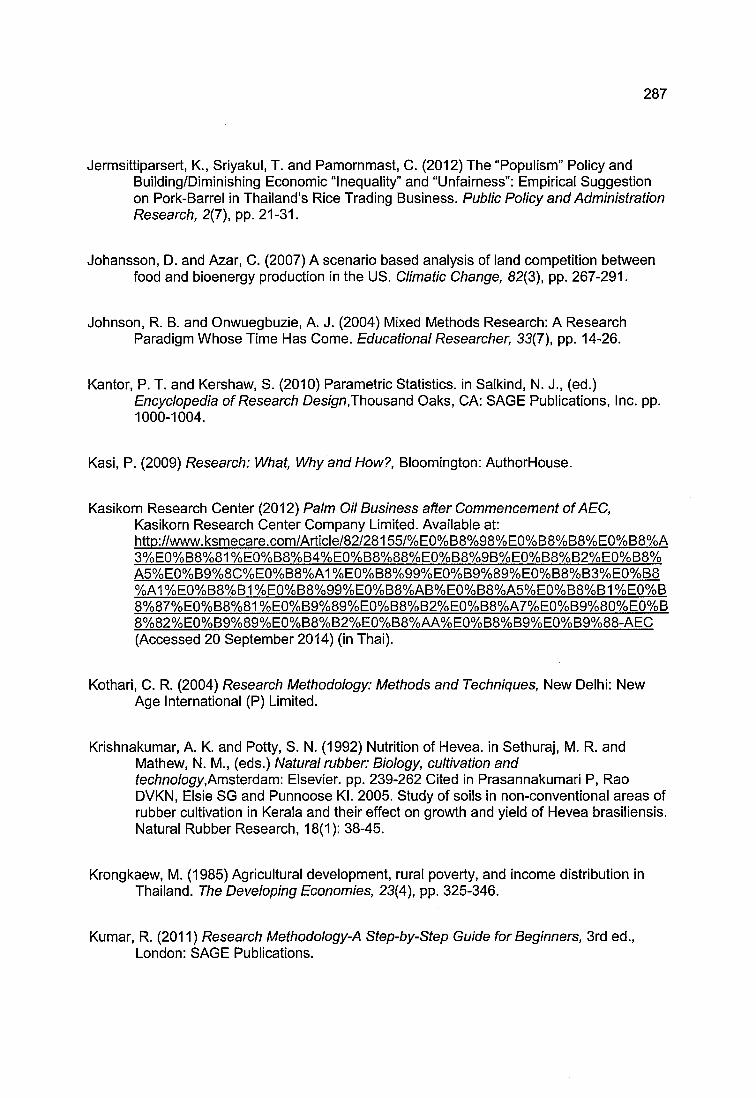
287
Jermsittiparsert, K., Sriyakul, T. and Pamornmast, C. (2012) The “Populism” Policy andBuilding/Diminishing Economic “Inequality” and “Unfairness”: Empirical Suggestion on Pork-Barrel in Thailand’s Rice Trading Business. Public Policy and Administration Research, 2(7), pp. 21-31.
Johansson, D. and Azar, C. (2007) A scenario based analysis of land competition between food and bioenergy production in the US. Climatic Change, 82(3), pp. 267-291.
Johnson, R. B. and Onwuegbuzie, A. J. (2004) Mixed Methods Research: A Research Paradigm Whose Time Has Come. Educational Researcher, 33(7), pp. 14-26.
Kantor, P. T. and Kershaw, S. (2010) Parametric Statistics, in Salkind, N. J., (ed.)Encyclopedia of Research Design,Thousand Oaks, CA: SAGE Publications, Inc. pp. 1000-1004.
Kasi, P. (2009) Research: What, Why and How?, Bloomington: AuthorHouse.
Kasikorn Research Center (2012) Palm Oil Business after Commencement ofAEC,Kasikorn Research Center Company Limited. Available at:http://www.ksmecare.com/Article/82/28155/%E0%B8%98%E0%B8%B8%E0%B8%A3%E0%B8%81%E0%B8%B4%E0%B8%88%E0%B8%9B%E0%B8%B2%E0%B8%A5%E0%B9%8C%E0%B8%A1%E0%B8%99%E0%B9%89%E0%B8%B3%E0%B8%A1%E07oB8%B1%E0%B8%99%E0%B8%AB%E0%B8%A57oE0%B8%B1%E0%B87o877oE07oB87o817oE07oB97o897oE07oB87oB27oE07oB87oA77oE07oB97o807oE07oB87o827oE07oB97o897oE07oB87oB27oE07oB87oAA7oE07oB87oB97oE07oB97o88-AEC(Accessed 20 September 2014) (in Thai).
Kothari, C. R. (2004) Research Methodology: Methods and Techniques, New Delhi: New Age International (P) Limited.
Krishnakumar, A. K. and Potty, S. N. (1992) Nutrition of Hevea. in Sethuraj, M. R. and Mathew, N. M., (eds.) Natural rubber: Biology, cultivation and technoiogy,Amsierdam\ Elsevier, pp. 239-262 Cited in Prasannakumari P, Rao DVKN, Elsie SG and Punnoose Kl. 2005. Study of soils in non-conventional areas of rubber cultivation in Kerala and their effect on growth and yield of Hevea brasiliensis. Natural Rubber Research, 18(1): 38-45.
Krongkaew, M. (1985) Agricultural development, rural poverty, and income distribution in Thailand. The Developing Economies, 23(4), pp. 325-346.
Kumar, R. (2011) Research Methodoiogy-A Step-by-Step Guide for Beginners, 3rd ed., London: SAGE Publications.

288
Kumar, S., Salam, P. A., Shrestha, P. and Ackom, E. K. (2013) An Assessment of Thailand’s Biofuel Development. Sustainability, 5(4), pp. 1577-1597.
Lambin, E. P., Geist, H. J. and Lepers, E. (2003) Dynamics of land-use and land-cover change in tropical regions. Annual Review of Environment and Resources, 28, pp. 205-241.
Lambin, E. F. and Meyfroidt, P. (2010) Land use transitions: Socio-ecological feedback versus socio-economic change. Land Use Policy, 27(2), pp. 108-118.
Lambin, E. F., Turner, B. L., Geist, H. J., Agbola, S. B., Angelsen, A., Bruce, J. W., Coomes, O. T., Dirzo, R., Fischer, G., Folke, 0., George, P. S., Flomewood, K., Imbernon, J., Leemans, R., Li, X., Moran, E. F., Mortimore, M., Ramakrishnan, P. S., Richards, J. F., Skânes, H., Steffen, W., Stone, G. D., Svedin, U., Veldkamp, T. A., Vogel, C. and Xu, J. (2001) The causes of land-use and land-cover change: Moving beyond the myths. Global Environmental Change, 11 (4), pp. 261-269.
LDD (2009a) Map of oil palm planting area Land Development Department, Ministry ofAgriculture and Cooperatives of Thailand. Unpublished data (Accessed 20 February2013).
LDD (2009b) Transportation map of Nakhon Si Thammarat province. Land DevelopmentDepartment, Ministry of Agriculture and Cooperatives of Thailand. Unpublished data (Accessed 20 February 2013).
LDD (2010) Situation of land use in Thailand 2008/2009, Land Development Department, Ministry of Agriculture and Cooperatives of Thailand. Available at: http://olp101.ldd.ao.th/luse1/pdf/thailand51 52.pdf (Accessed: 1 March 2012).
LDD (2012a) Land use in the Pak Phanang River Basin, Land Development Department,Ministry of Agriculture and Cooperatives of Thailand. Unpublished data (Accessed 13 February 2012).
LDD (2012b) Survey and classification of abandoned areas in Thailand, Land Development Department, Ministry of Agriculture and Cooperatives of Thailand. Available at: http://irw101.ldd.qo.th/data/data abandon.html (Accessed: 1 February 2012).
LDD (2012c) Type of land use in Thailand of year 2008/2009, Land DevelopmentDepartment, Ministry of Agriculture and Cooperatives of Thailand. Available at: http://olp101.ldd.qo.th/luse1/luse product51-52.htm (Accessed: 22 February 2012).

289
Lee, W. K., Ir and Ong, B. K. (2006) The unseen flood: Waterlogging in large oil palm plantations, in JURUTERA: The monthly bulletin of the institution of engineers, Malaysia (Buletin Bulanan IJM), Selango: PRO Press Paper Product (M) SDN. BHD. pp. 28, 30-31.
Lele, U. and Stone, S. (1989) Population pressure, the environment and agricultural intensification: variations on the Boserup hypothesis. Managing agricultural development in Africa discussion paper 4, World Bank, Washington, DC, USA.
Leturque, H. and Wiggins, S. (2011) Thailand’s progress in agriculture: Transition and sustained productivity growth, available at:http://www.developmentproqress.org/sites/default/files/thailand report - master.pdf (Accessed: 20 February 2012).
Likert, R. (1932) A technique for the measurement of attitudes. Archives of Psychology, 22, pp. 5-55.
Mandale, M. (1984) Marginal Land Utilization and Potential, Kent County, New Brunswick, Working Paper 31, Land Use Policy and Research Branch, Lands Directorate, Environment Canada, Ottawa.
Mann, P. S. (2004) introductory Statistics, New Jersey: John Wiley & Sons.
Manning, E. W. (1972) The Changing Land Use of a Diversified Agricultural Region: The Heretaunga Plains of New Zealand. Unpublished Doctor of Philosophy in Geography, Victoria University of Wellington, Wellington, New Zealand.
Marshall, M. (1996) The key informant technique. Family Practice, V3(1), pp. 92-97.
McClave, J. T., Benson, P. G. and Sincich, T. (2008) Statistics for business and economics. New Jersey: Pearson Prentice Hall.
McCuaig, J. D. and Manning, E. W. (1982) Agricultural land-use change in Canada :process and consequences Land use in Canada series ; no. 21. Lands Directorate, Environment Canada, Ottawa.
McCusker, B. and Carr, E. R. (2006) The co-production of livelihoods and land use change: Case studies from South Africa and Ghana. Geoforum, 37(5), pp. 790-804.

290
McGaughey, S. E. and Gregersen, H. (1988) Investment Policies and FinancingMechanisms for Sustainable Forestry Development, Inter-American Development Bank, Washington, DC
Mekonnen, A. (1998) Rural energy and afforestation: case studies from Ethiopia.Unpublished PhD Thesis, Department of Economics, University of Gothenburg.
Miles, M. B. and Huberman, A. M. (1994) Qualitative Data Analysis: An Expanded Sourcebook, Thousand Oaks, CA: SAGE Publications.
Moll, H. A. J. (1987) The Economics of OH Palm, Wageningen: Centre for Agricultural Publishing and Document (Pudoc).
Moxey, A., Robinson, R. and Swales, V. (2009) The Role of the Public Sector in Realising the Benefits of Scotland’s Rural Land. Rural Land Use Study Project 3. A Pareto Consulting report, Scottish Government. Available at: www.scotland.qov.uk/socialresearch (Accessed: 25 January 2014).
Murphy, R., Woods, J., Black, M. and McManus, M. (2011) Global developments in thecompetition for land from biofuels. Food Policy, 36, Supplement 1{0), pp. S52-S61.
Murray, G. (1987) The domestication of wood in Haiti: A case study on applied evolution, in Wulff, R. and Fiske, S., (eds.) Anthropological Praxis: Translating Knowledge into Action,Boulder, CO: Westview Press, pp. 46-73.
Naylor, R. L., Liska, A., Burke, M., Falcon, W. P., Gaskell, J., Rozelle, S. and Cassman, K. (2007) The Ripple Effect: Biofuels, Food Security, and the Environment.Environment, 49(9), pp. 30-43.
NCB (2011) Biofueis: Ethical issues, London: Nuffield Council on Bioethics. Available at:http://www.nuffieldbioethics.orq/sites/default/files/Biofuels ethical issues FULL%20 REPORT O.pdf (Accessed: 10 January 2012).
Ndayambaje, J. D., Heijman, W. J. M. and Mohren, G. M. J. (2012) Household Determinants of Tree Planting on Farms in Rural Rwanda. Smaii-scaie Forest Economics, Management and Policy, 17(4), pp. 477-508.
NESDB (2012) Gross domestic product by sector (at 1988 prices). Office of the National Economic and Social Development Board of Thailand. Available at: http://www.nesdb.qo.th (Accessed: 15 February 2012).

291
Neuman, W. L. (2011) Social Research Methods: Qualitative and Quantitative Approaches, Boston: Allyn & Bacon.
Nimpanich, J. (2011) Policy implementation: the View in the Perspective of Political Science, Politics and Public Administration, Administration and Case Study of Thailand., Bangkok: Chulalongkorn University Press (in Thai).
OAE (2012a) Agricultural land use of Thailand. Bangkok: Office of Agricultural Economics. Unpublished data (Accessed: 10 December 2012).
OAE (2012b) Agricultural Products' Price. Bangkok: Office of Agricultural Economics.Available at: http://www.oae.qo.th/oae report/price/price month.oho (Accessed: 10 December 2012).
OAE (2012c) Annual income, cost and net income of selected agricultural production. Bangkok: Office of Agricultural Economics. Unpublished data (Accessed: 10 December 2012).
OAE (2012d) Annual rainfall in Nakhon Si Thammarat Province. Bangkok: Office of Agricultural Economics. Unpublished data (Accessed: 10 December 2012).
OAE (2012e) Basic information of Agricultural Economics of Thailand in 2012. Bangkok: Office of Agricultural Economics. Available at:http://www.oae.qo.th/download/download iournal/commoditv55.pdf (Accessed: 3 January 2014).
OAE (2012f) Price of seieced paddy rice. Bangkok: Office of Agricultural Economics. Unpublished data (Accessed: 10 December 2012).
OAE (2013) Total paddy output and export of paddy. Bangkok: Office of Agricultural Economics. Unpublished data (Accessed: 12 May 2013).
OITNP (2012) List and locations of Entrepreneurs of OH Palm Collection Centre and Palm OH Crushing Mill in Nakhon Si Thammarat, Office of Internal Trade of Nakhon Si Thammarat province. Available at:http://www.dit.qo.th/uploadnew54/NakhonSiThammarat/rte/lan-ta-plam.htm (Accessed: 1 March 2013).
ONCARP (2006) Data of abandoned area, Bangkok: Office of Natural Calamity and Agricultural Risk Prevention. Available at:

292
http://irw101 .Idd.qo.th/data/data abandon.html (Accessed: 20 February 2012) (in Thai).
ONESDB (2012) Summary of the Eleventh National Economic and Social Development Plan (2012-2016), Bangkok: Office of the National Economic and Social Development Board. Available at:http://www.nesdb.qo.th/Portals/0/news/academic/Executive%20Summarv%20of%20 11th%20Plan.pdf (Accessed: 3 February 2012).
Ongsomwang, S. (2006) Forest Cover Assessment in Thailand. In Paper Presented to the Land Use and Land Cover Change Research in Thailand, Bangkok, Thailand.
Pacheco, P. (2009) Smallholder Livelihoods, Wealth and Deforestation in the Eastern Amazon. Human Ecology, 37(1), pp. 27-41.
Painter, M. (2005) Managerial Reform and Political Control: the Case of Thaksin and the Thai Bureaucracy, Paper presented at the SCANCOR-SOG/IPSA Workshop on Autonomization of the State, April 1-2, 2005, Stanford University, Palo Alto, CA.
Pan, W. K. Y. and Bilsborrow, R. E. (2005) The use of a multilevel statistical model toanalyze factors influencing land use: a study of the Ecuadorian Amazon. Global and Planetary Change, 47(2-4), pp. 232-252.
Papong, S., Chom-ln, T., Noksa-nga, S. and Malakul, P. (2010) Life cycle energy efficiency and potentials of biodiesel production from palm oil in Thailand. Energy Policy, 38(1), pp. 226-233.
Patel, S. H., Pinckney, T. C. and Jaeger, W. K. (1995) Smallholder wood production and population pressure in East Africa: evidence of an environmental Kuznets curve? Land Economics, 77(4), pp. 516-530.
Patton, M. Q. (2002) Qualitative Research & Evaluation Methods, Thousand Oaks, CA: SAGE Publications.
Peduzzi, P., Concato, J., Kemper, E., Holford, T. R. and Feinstein, A. R. (1996) A simulation study of the number of events per variable in logistic regression analysis. J Clin Epidemiol, 49(12), pp. 1373-9.
Phelinas, P. M. (2001) Sustainability of Rice Production in Thailand, New York: Nova Science Publishers Inc.

293
Pichôn, F. (1996) Land-Use Strategies in the Amazon Frontier: Farm-Level Evidence from Ecuador. Human Organization, 55(4), pp. 416-424.
Pomp, M. and Burger, K. (1995) Innovation and imitation: Adoption of cocoa by Indonesian smallholders. Worid Development, 23(3), pp. 423-431.
Porta, D. D. and Keating, M. (2008) Approaches and Methodologies in the Social Sciences: A Pluralist Perspective, Cambridge: Cambridge University Press.
Preechajarn, S. (2008) New Policy Framework Promoting Biofuei Use: GAIN (Global Agriculture Information Network) Report No. TH8058.
Preechajarn, S. and Prasertsri, P. (2010) Thailand Biofueis Annual 2010. GAIN (Global Agriculture Information Network) Report No. TFI0098.
Preechajarn, S. and Prasertsri, P. (2011) Thailand Biofueis Annual 2011. GAIN (Global Agriculture Information Network) Report No. TFI1088.
Preechajarn, S., Prasertsri, P. and Kunasirirat, M. (2007) Thailand bio-fueis annual 2007: GAIN (Global Agriculture Information Network) Report No. TFI7070.
Preechajarn, S., Prasertsri, P. and Kunasirirat, M. (2008) Thailand Bio-fueis Annual 2008: GAIN (Global Agriculture Information Network) Report No. TFI8083.
Rasul, G. and Thapa, G. B. (2003) Shifting cultivation in the mountains of South and Southeast Asia: Regional patterns and factors influencing the change. Land Degradation and Development, 74(5), pp. 495-508.
Rathmann, R., Szklo, A. and Schaeffer, R. (2010) Land use competition for production of food and liquid biofueis: An analysis of the arguments in the current debate. Renewable Energy, 35(1), pp. 14-22.
Redman, C. L., Grove, J. M. and Kuby, L. FI. (2004) Integrating Social Science into theLong-Term Ecological Research (LTER) Network: Social Dimensions of Ecological Change and Ecological Dimensions of Social Change. Ecosystems, 7(2), pp. 161- 171.
RFA (2008) The Gallagher Review of the indirect effects of biofueis production. East Sussex: Renewable Fuels Agency. Available at:http://www.unido.org/fileadmin/user media/UNIDO Fleader Site/Subsites/Green Ind

294
ustrv Asia Conference Maanila /GC13/Gallagher Report.pdf (Accessed: 29 January 2012).
Ricardo, D. (1821) On the Principles of Political Economy and Taxation, The Web Book of Library of Economics and Liberty, Liberty Fund, Inc., Available at: http://www.econlib.org/librarv/Ricardo/ricPCover.html (Accessed: 20 February 2014).
Ritchie, J. and Lewis, J. (2003) Qualitative Research Practice: A Guide for Social Science Students and Researchers, London: SAGE Publications.
Ritchie, J., Lewis, J. and Elam, G. (2003) Designing and selecting samples, in Ritchie, J. and Lewis, J., (eds.) Qualitative research practice. A guide for social science students and researchers,Lon6on: SAGE Publications, pp. 77-108.
Ritchie, J. and Spencer, L. (1994) Qualitative data analysis for applied policy research, in Bryman, A. and Burgess, R. G., (eds.) Analyzing Qualitative Dafa,London:Routledge. pp. 173-194.
Robson, L. S., Shannon, H. S., Goldenhar, L. M. and Hale, A. R. (2001) Guide to Evaluating the Effectiveness of Strategies for Preventing Work Injuries, Ohio: National Institute for Occupational Safety and Health, Available at:http://www.cdc.gov/niosh/docs/2001-119/pdfs/2001-119.pdf (Accessed: 15 March 2014).
Rosenqvist, H., Roos, A., Ling, E. and Hektor, B. (2000) Willow growers in Sweden.Biomass and Bioenergy, 78(2), pp. 137-145.
Roy Chowdhury, R. (2006) Landscape change in the Calakmul Biosphere Reserve, Mexico: Modeling the driving forces of smallholder deforestation in land parcels. Applied Geography, 26(2), pp. 129-152.
Roy Chowdhury, R. (2010) Differentiation and concordance in smallholder land usestrategies in southern Mexico's conservation frontier. Proceedings of the National Academy of Sciences of the United of America, 707(13), pp. 5780-5785.
Saaty, T. L. (1980) The Analytic Hierarchy Process: Planning, Priority Setting, Resource Allocation, New York: McGraw-Hill.

295
Sadalmelik (2007) Thailand Topography, Available at:http://en.wikipedia.Org/wiki/File:Thailand Topoqraphv.png (Accessed: 15 January 2012).
Samudavanija, C. (1987) Government and Politics of Thailand, in Xuto, S., (ed.) The Bureaucracy,Singapore'. Oxford University Press, pp. 75-107.
Markets and Morals (2009) Directed by Sandel, M. BBC Reith Lectures, June 2009.Available at: http://www.bbc.co.uk/programmes/b00kt7sh (Accessed: 14 February2014).
Barker, M. A., Itohara, Y. and Floque, M. (2009) Determinants of adoption decisions: The case of organic farming (OF) in Bangladesh. Extension Farming Systems Journal, 5(2), pp. 39-46.
Saunders, M. and Lewis, P. (2012) Doing Research in Business and Management: An Essential Guide to Pianning Your Project, Flarlow: Financial Times Prentice Hall.
Saunders, M., Lewis, P. and Thornhill, A. (2009) Research Methods for Business Students, Harlow: Financial Times Prentice Hall.
Schneeberger, N., Bürgi, M., Hersperger, A. M. and Ewald, K. C. (2007) Driving forces and rates of landscape change as a promising combination for landscape change research-An application on the northern fringe of the Swiss Alps. Land Use Policy, 24(2), pp. 349-361.
Schumacker, R. E. (2014) Learning Statistics Using R, Thousand Oaks, CA: SAGE Publications.
Schumacker, R. E. and Lomax, R. G. (2010) A Beginner's Guide to Structural Equation Modeling, 3rd ed., New York: Routledge.
Searchinger, T., Heimlich, R., Houghton, R. A., Dong, F., Elobeid, A., Fabiosa, J., Tokgoz, S., Hayes, D. and Yu, T.-H. (2008) Use of U.S. Croplands for Biofueis Increases Greenhouse Gases Through Emissions from Land-Use Change. Science, 379(5867), pp. 1238-1240.
Serneels, S. and Lambin, E. F. (2001) Proximate causes of land-use change in NarokDistrict, Kenya: a spatial statistical model. Agriculture, Ecosystems & Environment, 85(1-3), pp. 65-81.

296
Shively, G. E. (1999) Prices and Tree Planting on Hillside Farms in Palawan. World Development, 27(6), pp. 937-949.
Siamwalla, A. and Setboonsarng, S. (1991) Thailand, in Krueger, A., Schiff, M. and Vawdés, A., (eds.) The Polifical Economy of Agricultural Pricing Policy: THE WORLD BANK, The Johns Hopkins University Press, Available at:http://www.unescap.orq/rural/doc/oa/oa-bqrd.htm (Accessed: 20 February 2012).
Silalertruksa, T. and Gheewala, S. H. (2012) Environmental sustainability assessment of palm biodiesel production in Thailand. Energy, 43(1), pp. 306-314.
Silverman, D. (2011) Interpreting qualitative data: a guide to the principles of qualitative research. Thousand Oaks, CA: SAGE Publications.
Skutsch, M. M. (1983) Why People Don't Plant Trees? The Socio-Economic Impact ofExisting Woodfuei Programs: Village Case Studies, Tanzania, Discussion Paper D - 73P, Energy in Developing Countries Series, Resources for the Future, Washington, DC
Smith, P., Gregory, P. J., van Vuuren, D., Obersteiner, M., Havlik, P., Rounsevell, M.,Woods, J., Stehfest, E. and Bellarby, J. (2010) Competition for land. Philosophical Transactions of the Royal Society B: Biological Sciences, 365(1554), pp. 2941-2957.
Snape, D. and Spencer, L. (2003) The foundations of qualitative research, in Ritchie, J. and Lewis, J., (eds.) Qualitative Research Practice: A Guide for Sociai Science Students and Researchers,Lon6on: SAGE Publications, pp. 1-23.
Sommer, R. and Sommer, B. B. (2002) A practical guide to behavioral research: tools and techniques, Oxford: Oxford University Press.
SOPRC (2004) Feasibility study of oil palm planting in abandoned paddy field in Pak Phanang River Basin Surat Thani Oil Palm Research Center. Available at: http://it.doa.qo.th/palm/proiect.html (Accessed: 3 January 2012) (in Thai).
Specter, P. E. (2004) Social Desirability Bias, in Lewis-Beck, M. S., Bryman, A. and Liao, T. F., (eds.) The SAGE Encyclopedia of Social Science Research Methods,Thousandi Oaks, CA: Sage Publications, Inc. pp. 1045-1046.
Spencer, L., Ritchie, J., Lewis, J. and Dillon, L. (2003) Quality in qualitative evaluation: A framework for assessing research evidence, London: National Centre for Social Research, Government Chief Social Researcher’s Office, UK.

297
Stoltzfus, J. C. (2011) Logistic regression: a brief primer. Acad Emerg Med, 78(10), pp. 1099-104.
Suthinarakorn, W. and Traimongkolkul, P. (2002) Toward Sustainable Development in Agriculture: A Reflection on the Learning Experiences of NGOs in Thailand. KASETSART JOURNAL: SOCIAL SCIENCES, 023(2), pp. 131-138.
Sutter, C. (2003) Sustainability Check Up for CDM Projects: How to Assess the Sustainability of International Projects Under the Kyoto Protocol, Berlin: Wissenschaftlicher Verlag Berlin.
Takahashi, I. (1990) AHP Applied to Binary and Ternary Comparisons. Journal of Operations Research Society of Japan, 33(3), pp. 199-206.
Takeda, E. (2001) A method for multiple pseudo-criteria decision problems. Computers & Operations Research, 28(14), pp. 1427-1439.
Tashakkori, A. and Teddlie, C. (2010) SAGE Handbook of Mixed Methods in Social & Behavioral Research, Thousand Oaks, CA: SAGE Publications.
Tilman, D., Cassman, K. G., Matson, P. A., Naylor, R. and Polasky, S. (2002) Agricultural sustainability and intensive production practices. Nature, 478(6898), pp. 671-677.
Tipper, R., Hutchison, C. and Brander, M. (2009) A Practical Approach for Policies toAddress GHG Emissions from Indirect Land Use Change Associated with Biofueis Edinburgh: Ecometrica.
Trochim, W. (2005) The Research Methods Knowledge Base, Ohio, Atomic Dog Publishing.
Tyner, W. E., Taheripour, P., Zhuang, Q., Birur, D. and Baldos, U. (2010) Land UseChanges and Consequent C02 Emissions Due to US Corn Ethanol Production: A Comprehensive Analysis. West Lafayette, IN: Purdue University, Department of Agricultural Economics. Available at:https://www.qtap.aqecon.Durdue.edu/resources/download/5200.pdf (Accessed: 2 January 2014).
UNESAP (2002) Organic agriculture and rural poverty alleviation: potential and bestpractices in Asia, Bangkok: United Nations Economic and Social Commission for Asia and the Pacific. Available at: http://www.unescap.orq/rural/doc/oa/oa-bqrd.htm (Accessed: 20 February 2012).

298
USDA (2014) Data Set of Grain, in,USA: United States Department of Agriculture. Available at: http://apps.fas.usda.qov/psdonline/psdDownload.aspx (Accessed 20 May 2014).
USEPA (2010) Renewable Fuel Standard Program (RFS2) Regulatory Impact Analysis, Washington, DC: US Environmental Protection Agency. Available at: http://www.epa.qov/otaq/renewablefuels/420r10006.pdf (Accessed: 2 January 2014).
Warner, E., Inman, D., Kunstman, B., Bush, B., Vimmerstedt, L , Peterson, S., Macknick, J. and Zhang, Y. (2013) Modeling biofuel expansion effects on land use change dynamics. Environmental Research Letters, 8(January-March 2013 ), pp. 1-10.
Watson, D. (1992) Correcting for Acquiescent Response Bias in the Absence of a Balanced Scale: An Application to Class Consciousness. Sociological Methods & Research, 27(1), pp. 52-88.
Whiteman, A. (2003) Money doesn't grow on trees: A perspective on prospects for making forestry pay. Unasylva, 54(212), pp. 3-10.
Wiegmann, K., Hennenberg, K. J. and Fritsche, U. R. (2008) Degraded Land andSustainable Bioenergy Feedstock Production, Issue Paper of the Joint International Workshop on High Nature Value Criteria and Potential for Sustainable Use of Degraded Lands, Paris. Oeko-lnstitut (Darmstadt), Available at: http://np- net.pbworks.com/f/OEKO.+RSB.+UNEP+et+al+(2008)+Deqraded+land+and+sustain able+bioenerqv+feedstock+production.pdf (Accessed: 15 January 2014).
Wise, M., Calvin, K., Thomson, A., Clarke, L., Bond-Lamberty, B., Sands, R., Smith, S. J., Janetos, A. and Edmonds, J. (2009) Implications of Limiting C02 Concentrations for Land Use and Energy. Science, 324(5931), pp. 1183-1186.
Woods, J., Williams, A., Hughes, J. K., Black, M. and Murphy, R. (2010) Energy and thefood system. Philosophical Transactions of the Royal Society B: Biological Sciences, 365(1554), pp. 2991-3006.
Xu, Y., McNamara, P., Wu, Y. and Dong, Y. (2013) An econometric analysis of changes in arable land utilization using multinomial logit model in Pinggu district, Beijing, China. J Environ Manage, 128, pp. 324-34.
Yeh, S. and Witcover, J. (2010) Indirect Land-Use Change from Biofueis: RecentDevelopments In Modeling and Policy Landscapes. Washington, DC: International Food & Agricultural Trade Policy Council. Available at:

299
http://www.aqritrade.orq/events/documentsA^eh Witcover iLUCfromBiofuels.pdf (Accessed: 2 January 2014).

300
APPENDIX 1
QUESTIONNAIRE FOR HOUSEHOLDS' CHARACTERISTICS SURVEY
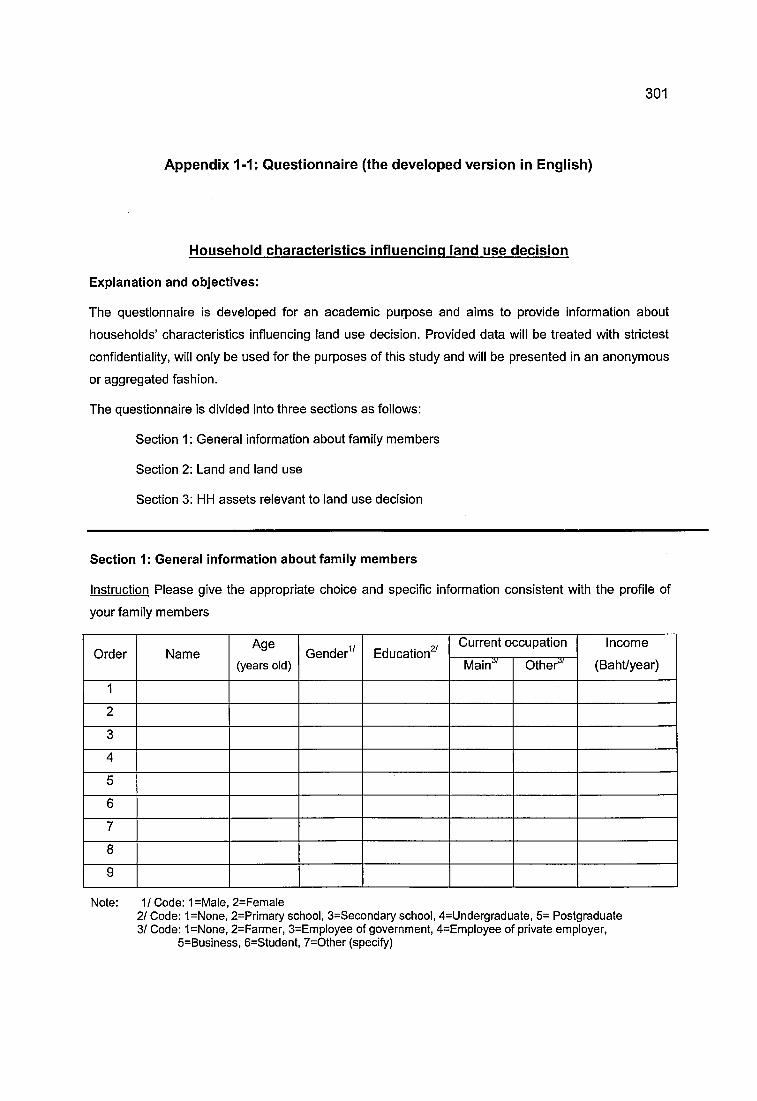
301
Appendix 1-1: Questionnaire (the developed version in English)
Household characteristics influencing land use decision
Explanation and objectives:
The questionnaire is developed for an academic purpose and aims to provide information about
households’ characteristics influencing land use decision. Provided data will be treated with strictest
confidentiality, will only be used for the purposes of this study and will be presented in an anonymous
or aggregated fashion.
The questionnaire is divided into three sections as follows:
Section 1 : General information about family members
Section 2: Land and land use
Section 3: HH assets relevant to land use decision
Section 1 : General information about family members
Instruction Please give the appropriate choice and specific information consistent with the profile of
your family members
Order NameAge
(years old)Gender^^ Education^^
Current occupation Income
(Baht/year)Main"*' Other^'
1
2
3
4
5
6
7
8
9
Note: 1/ Code: 1=Male, 2=FemaIe2/ Code: 1=None, 2=Primary school, 3=Secondary school, 4=Undergraduate, 5= Postgraduate 3/ Code: 1=None, 2=Farmer, 3=Employee of government, 4=Employee of private employer,
5=Business, 6=Student, 7=0ther (specify)

302
Section 2: Land and iand uses
Instruction Please give the appropriate choice and specific information consistent with lands occupied
by the HH, their uses and changes
PlotNo.
Size(Rai)
Landownership^^ Transportation^ Irrigation^'
Land use Currentuser®'Current" ' Traditional" '
1
2
3
4
5
6
7
8
9
10
11
Note:1/ Code: 1=0wned, 2=Rented, 3=0ther (specify)2/ Code: 1=Accessible by road, 2=lnaccessible by road 3/ Code: 1=Located Inside Irrigation area, 2=Located outside Irrigation area 4/ Code: 1=Paddy, 2=Rubber, 3=011 palm, 4=0ther crops (specify), 5=Llvestock, 6=Flshery,
7=Abandoned,8=0ther (specify)
5/ Code: 1=HH member, 2=Rented out, 3=Kln, 4=0ther (specify)

303
Section 3: HH assets reievant to land use decision
3.1 HH physicai assets
Instruction Please give the appropriate choice and specific information consistent with the physical
assets owned by the HH
3.1.1 Agricultural tools and equipment
Order Items Number Purpose of
usage^'
Original
value
(Baht)
How long they
have been used
(years)
Useful
life time
(Years)
Salvage
value
(Baht)
1
2
3
4
5
6
7
8
9
10
Note: 1/ Code: 1=Paddy, 2=Rubber, 3=0il palm, 4=0ther crops (specify), 5=Livestock, 6=Flshery, 7=Abandoned,8=0ther (specify)
3.1.2 Factories, tools and equipment for crop processing
Order Items Number Purpose of usage^'
Originalvalue(Baht)
How long they have been used
(years)
Useful life time (Years)
Salvagevalue(Baht)
1
2
3
4
5
Note: 1/ Code: 1=Paddy, 2=Rubber, 3=011 palm, 4=0ther crops (specify), 5=L!vestock, 6=Flshery, 7=Abandoned, 8=0ther (specify)

304
3.1.3 Vehicles
Order Items Number Purpose of Usage^'
Originalvalue(Baht)
How long they have been used
(years)
Useful life time (Years)
Salvagevalue(Baht)
1
2
3
4
5
Note: 1/ Code: 1=Business communication, 2=!nput/output transportation, 3=Personal purpose, 4=0ther crops (specify)
3.1.4 Livestock and fishery
Order Items Amount Unit price (Baht)
Total value (Baht)
1
2
3
4
3.1.5 Other HH properties and businesses
Order Items Current value (Baht)1 House
2
3
4
5

305
3.2 Income and expenditure
Instruction Please give the appropriate choice and specific information consistent with HH income
and expenditure
3.2.1 Income
Order List of items Annual income (Baht)
Incomes from crop sales
1 Paddy
2 Oil palm
3 Rubber
4 Other crops (specify)
Income from livestock and fishery sale
5
6
7
Others
8 Paid employment
9 Business
10 Other (specify)
11 Other (specify)
12 Other (specify)

306
3.2.2 HH expenditure
Order List of items Annual expenditure (Baht)
Crop cultivation cost
1 Paddy
2 Oil palm
3 Rubber
4 Other crops (specify)
Livestock and fishery sale
5 Other (specify)
6 Other (specify)
7 Other (specify)
Others
8 Food
9 Education
10 Health
11 Clothing
12 House and maintenance
13 Transport
14 Community fee
15 Business
16 Debt payment
17 Other (specify)
18 Other (specify)
19 Other (specify)

3.2.3 HH debt
307
Order Credit sourcesBorrowing
purpose
Amount
(Baht)
Interest rate
(7o per year)
3.2.4 HH saving
Order Financial institution Saving purposeAmount
(Baht)
Interest rate
(% per year)

308
3.3 Social activities and group membership
Instruction Please give the appropriate choice and specific information consistent with HH social
activities and membership of groups
3.3.1 Informal societal activities
Order Activities Number of days to participate
1 Visiting relative
2 Religious activity
3 Local festival
4 Other (specify)
5 Other (specify)
3.3.2 Formal societal activities
Order Activities Number of days to participate
1 Community meeting
2 Meeting with government organizations
3 Other (specify)
4 Other (specify)
3.3.3 Membership of formal group
Order Social activities and group
membership
Roles Purpose of participation
1
2
3
4
5

309
Appendix 1-2: Questionnaire (the distributed version in Thai)
1.19 j:
iLiJijaaijn'i}JwnhmwaHiJ7rnaum‘3Î9üi^ji'ïïnm‘îTaüflii3nviJJiLjtuinïâTr39âhuîurflV3i!au 'nàjwaçianiTO«âulî!rn‘5l'D''n«u aua'î)a.3riiunai.i]ufm5jâija.îa n i ? i l TUawwwni ?%u ^a’iiaj^^HauawlaHmaûniaua'îTayalwmwîiijLTin'uu
uuumjJil'ïrnaiJrJü 3 çiau
çiauïi 1 'iTa^a-ni'lilua-aafitlawi.iatHuifn
aau 2 iTaya'n^uuarni'sHiJsrîo'ïi'umu
çiau-rl 3 fawaâhymrflfiifawmüi'ïra.amjni'îwm'ulalwnn-ïH-nwu
giDUYi 1 ïauR>iitiJ'îiajaf3i?a wsraunf n
n^miimw i^onvi^aïu'aijainuinïjawi^n'lmiaiia'n
aiwiiii •fi'aaiu(fl)
1/ aifwiJ^ iTu ri£j1«(u n ii/3 )
^ 3.'v isn
3!?B4
123456789
1/5MS; 1=Î31ÊJ, 2=11t3o
2 /w s; 1=11)3,2=U%aijmtn, 3=)jnuw^ntn, 4=iJ?tiji]npi1,5=3/ws; 1=133,2=ina^iTîi\3=pri<)iîBwü')u.nu‘nî!m?, 4=gnii iia^MmmiwQn%it, 5=%?n9«hitm.
6=uhflnwn, 7=au«) (?:u)

310
mawn 2 ‘auamuuarm'îHiJ'îïTü'iîu'n^u
n^miiâsj iiiSsnvifaiirajJainü^nijîiflwutirni'îlïïiJîrTümiâuiiajfifsi^au
uila411
TOIfl(1:)
éïtiTUrmiigam'snuuiflij^ ïïail-srmw fTl'fiiJ'îrTüïTi
aviîi
12345e78g
10
11
v.jnêjw :1/
2/
3/
4/
5/
I=iflui9'i<iia4,2=vt\, 3=au (?nj) îwk; i=3n w w ih & , 2=’l5jSîiiivii'ihw
1 =0 1*1 2=aÿuanrafiîitiii%mu?Mk: 2=Ên4mn. 3=ih^nÛ3iJu, 4=i%au«) pru), 5=tla4fla'î. 6=i)%u.3,7=n fi4,
8=au®3 CîTiJ)2=«i'É3,3=îirifi, 4=au«) pnj)
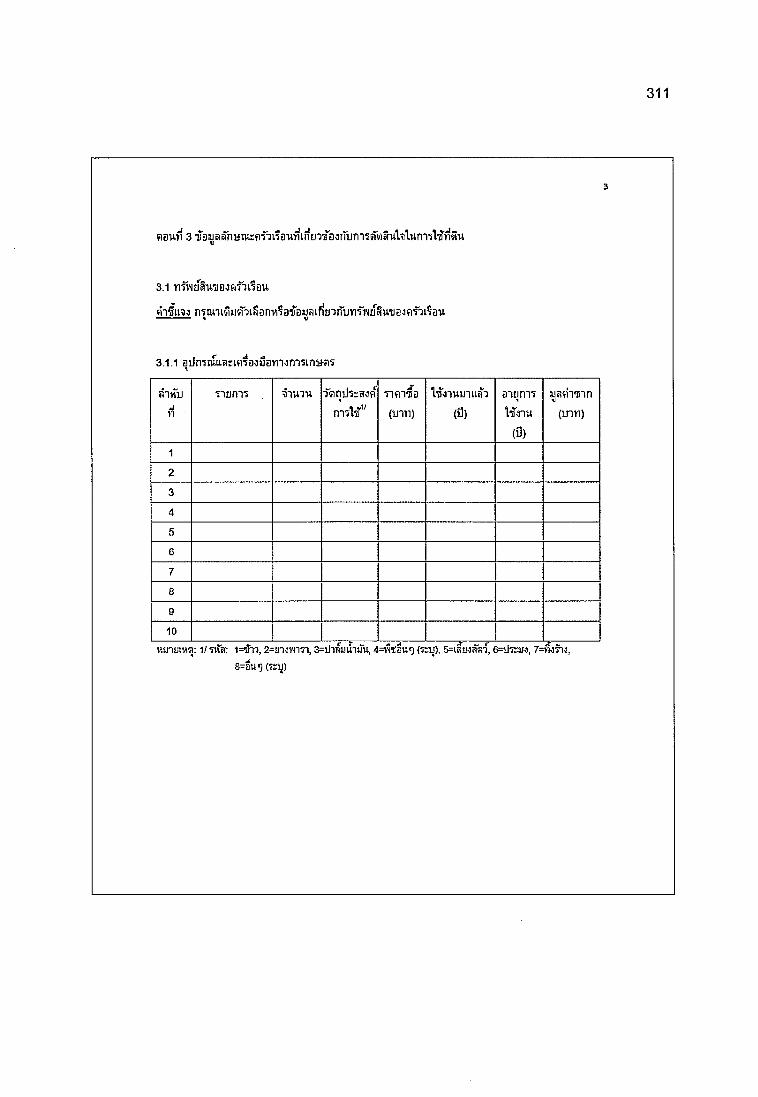
311
çiaw 3 iTaîJîî^nymrafiifawi.nüi^ajmjniîà'çiauMunitH'niu
n‘îruiiSîjr3iSanvi^aiirajjaidiniTijmwü§uiia-3afiitfaTi
3.1.1 aiJn'îîuuarifi^ajuam^m inHÇi^
âimj11
Tiom? 9iinu 'TçiniJ's-sjfi TifiWa(uni)
H^iiiîjnLiai(fl)
aium?H^nu
(fl)
yaçÎTBin(uni)
12345678910
v.unâJivi ; 1/ i= ^n , 2=£n.awn?i, 3=ihsîJÛiuu, 4=vvfau^ {•ïtv], 5=i#U4#'), 6=ii5rw^. 7=M4fi4,8=au<5 (%ij)

312
3.1.2 T‘5J4imia?aiJn?mifi a4SaT.itm?Li.ij5'5iJ auài myçi?
âimjn
Tiomi 9TWTW rifinfa(uin)
Huiuài(fl)
aiom?
(3)(uin)
1 12 13 14 I5 1
iiîriÊJivi ; 1/ i= fr i, 2=£n-5vnn, 3=3im jûnm, 4=i%su«] (?:u), 5=iaii4a?ii, 6=iJ«w^, 7=w fi4,8=au“)
3.1.3 ülUVJniUr
âifTu11
Titinn 9nniu(uni)
Huntai(3)
aiynidïJ3U (3)
wafinmn(uni)
12345
■Hwnaivig: i/7wk; i=3?tîiau'B?n?. 2=iiuii' 39^£3fn^Wfl?iuatWs5Mi?i. 4=au*] (tcu)
3.1.4 iJfiâçi'fuariJ-îïUJ
awmiil Tiunn in tn t na'içiaviû'iÊi(uni)
uafinnj(uni)
1234
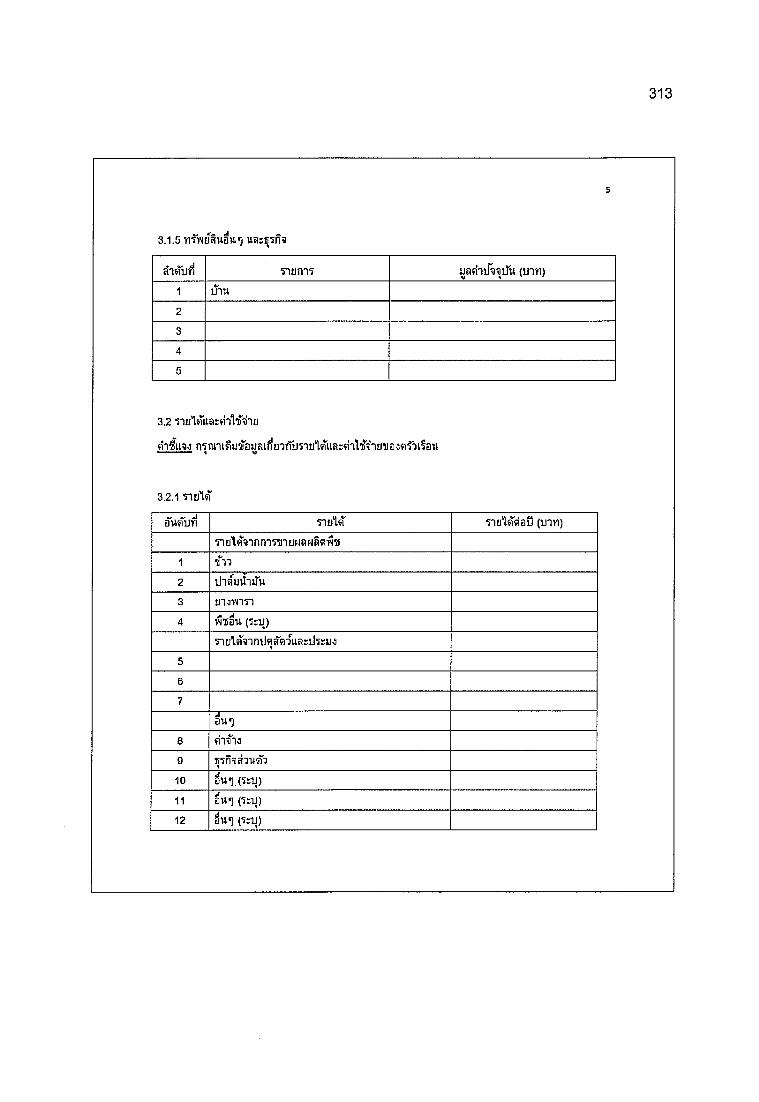
313
3.1.5 nfviîfSuBU*) uars?n9
âiCutI Tiuni? uafinRi^iTu (uni)
1 IJIU
2
3
4
5
3.2 n u lm a rfiiH iiD
011194 n‘îmni^uiirauamü9fTmiü'lwuarfiiHi-iü'îia-3fif3Llau
3.2.1 n u la
awçiuyi Tiu'kT Tio'l^çiafl (uni)
TiüÏMinnTMnwNaMâfiM^12 iJisuitiiTu
3 üi-ayn-ïT4 (%ij)
567
aw*)89 F?nîiântà71011 au*] (i:U)12 au*] (?:U)

314
3.2.2
âiÀïi-n T lu n n fliH iin o ç ia fl (u in )
iuïlUni^HSÇÎll'H j
1 r n 1
2 i l ia w iln ju i
3 ïü i jm 'n i
4 (?:U)
‘îiEj’ls î in iIf la ç ifu .a t il ' ity j j
5 1
6
7
au*]
8 a iM i i
9 n i i# n u i 1
10
11 la a m
12 -nadan%
13
14 w 'iH i'u irm a .jtts j
15
10
î î î l 9
làTâïiVluiu
17 au*] (% u)
18 ^u«] ( i r u j
19 au*] (n iJ )

315
3.2.3 ViU^U
7
OrderilU T W
(u n i)
açiTiçianiuL)
(% çiad)
1
2
3
4
5
6
7
8
9
3.2.4 n n a a u
amiJUTn'Jww % o il% a 4 9 h n a a wi i w n t
(u n i)
àViTiçianiîjE)
(% çiafl)
1
2
3
4
5
6
7
8
9

316
3.3 n ïH 'îîu rm à jf ii ja a tn m .d u a jJ ifn n R u
nm'ii^jJiTaijamtJimjn^n'ï'ïmnjàjfijjuarm'îLiluainfnnay
3.3.1 fïîin îî3 jiii4^ ja u r)1 jjL Î]u 'H 'ijm “ï
auauYi T iü n n i i u i u ( it t /3 )
1 m 'ïiüüjjntnçi
2 n ^ n ^ u n u F n a u i
3 in p in iay ia jtiu
4 au«] (% u)
5 iv. (?:u)
3.3.2 f in r i î^ u m jà ja u ru d u m jm 's
auftUYi T iy n n ilW lW (TW/fl)
1
2 n m J îr îu n u i ’iû iüJ'i'U 'însm 'î
3 au*] ( î r i j )
4 aw*) (?=iJ)
3.3.3 m 'ïiîlw H in S m ia jn à u u L Îlu n ijm 's
àw m jii nan ifîu /này u i iu n i
1
2
3
4
5

317
APPENDIX 2
QUESTIONNAIRE FOR FACTORS INFLUENCING LAND USE DECISION
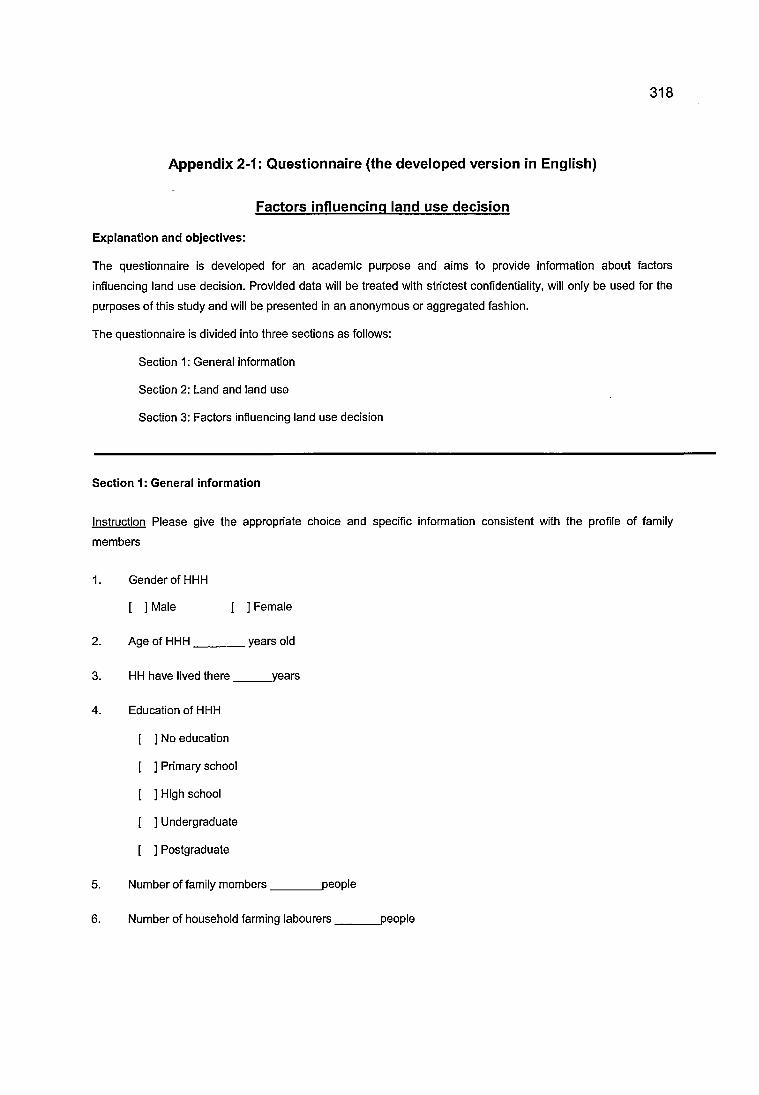
318
Appendix 2-1; Questionnaire (the developed version In English)
Factors Influencing land use decision
Explanation and objectives:
The questionnaire is developed for an academic purpose and aims to provide information about factors
influencing land use decision. Provided data will be treated with strictest confidentiality, will only be used for the
purposes of this study and will be presented in an anonymous or aggregated fashion.
The questionnaire is divided into three sections as follows:
Section 1 : General information
Section 2: Land and land use
Section 3: Factors influencing land use decision
Section 1: General Information
Instruction Please give the appropriate choice and specific information consistent with the profile of family
members
Gender of HHH
[ ] Male [ ] Female
Age of HHH________ years old
HH have lived there years
Education of HHH
] No education
] Primary school
] High school
] Undergraduate
] Postgraduate
Number of family members_____ people
Number of household farming labourers _people

319
7. Annual Income of HH
[ ] Less than 100,001 Baht
[ ] 100,001-200,000 Baht
[ ] 200,001-300,000 Baht
[ ] 300,001-400,000 Baht
[ ] 400,001-500,000 Baht
[ ] More than 500,000 Baht
8. Source of main income
[ ] Sale of agricultural products
[ ] Own business
[ ] Paid employment
[ ] Remittance
[ ] Other (specify)___________
9. Source of other income
[ ] Sale of agricultural products
[ ] Own business
[ ] Paid employment
[ ] Remittance
[ ] Other (specify)___________

320
Section 2: Land and land uses
Instruction Please give the appropriate choice and specific information consistent with lands occupied by the HH,
their uses and changes
PlotNo.
Size(Rai) Land ownership^^ Transportation^ Irrigation^'
Land use Currentuser®'Current'*' Traditional'*'
Note:1/ Code: 1=0wned, 2=Rented, 3=0ther (specify)2/ Code: 1=Accessib!e by road, 2=lnaccessible by road3/ Code: 1=Located inside irrigation area, 2 = Located outside irrigation area4 / Code: 1=Paddy, 2=Rubber, 3=0 il palm, 4=0 ther crops (specify),
5=Livestock, 6=Fishery, 7=Abandoned, 8=0ther (specify)5/ Code: 1=HH member, 2=Rented out, 3=Kin, 4=0ther (specify)

321
Section 3: Factors influencing land use decision
Instruction Please Identify the factors which influence you to adopt the following land use strategies and then
rank the chosen factors according to their importance from the most to the least important.
3.1 Continuing paddy cultivation
No. List of factorsIs the factor influencing land use decision? Priority
rankingYes No
Exoected outcom es o f land use
1 Profit
2 Lump sum income
3 Continuous income
4 Own consumption
Financial factors
5 Saving for investment
6 Credit for investment
7 Price stability
8 Trend of price
9 Policy of price
10 Government subsidy
Natural resource factors
11 Land topography
12 W ater supply
13 Diseases/pests
14 Flooding
15 Disaster assistance
Hum an factors
16 Capacity of HH labour
17 Skill/knowledge
18 Accessibility of employed labour
Physical factors
19 Transportation
20 Tools and equipment
21 Irrigation
22 Land rights
Social factors
23 Networks and connections
24 Farmer institutions
25 Other (specify)

322
3.2 Switching from paddy to oil palm cultivation
No. List of factorsIs the factor influencing land use decision? Priority
rankingYes No
Exoected outcom es o f land use
1 Profit
2 Lump sum income
3 Continuous income
4 Own consumption
Financial factors
5 Saving for investment
6 Credit for investment
7 Price stability
8 Trend of price
9 Policy of price
10 Government subsidy
Natural resource factors
11 Land topography
12 W ater supply
13 Diseases/pests
14 Flooding
15 Disaster assistance
Hum an factors
16 Capacity of HH labour
17 Skill/knowledge
18 Accessibility of employed labour
Physical factors
19 Transportation
20 Tools and equipment
21 Irrigation
22 Land rights
Social factors
23 Networks and connections
24 Farmer institutions
25 Other (specify)

323
3.3 Continuing rubber cultivation
No. List of factorsIs the factor influencing land use decision? Priority
rankingYes No
Exoected outcom es o f land use
1 Profit
2 Lump sum income
3 Continuous income
4 Own consumption
Financial factors
5 Saving for investment
6 Credit for investment
7 Price stability
8 Trend of price
9 Policy of price
10 Government subsidy
Natural resource factors
11 Land topography
12 W ater supply
13 Diseases/pests
14 Flooding
15 Disaster assistance
Hum an factors
16 Capacity of HH labour
17 Skill/knowledge
18 Accessibility of employed labour
Physical factors
19 Transportation
20 Tools and equipment
21 Irrigation
22 Land rights
Social factors
23 Networks and connections
24 Farmer institutions
25 Other (specify)

324
3.4 Switching from rubber to oil palm cultivation
No. List of factorsIs the factor influencing land use decision? Priority
rankingYes No
Exoected outcomes of land use
1 Profit
2 Lump sum income
3 Continuous income
4 Own consumption
Financial factors
5 Saving for investment
6 Credit for investment
7 Price stability
8 Trend of price
9 Policy of price
10 Government subsidy
Natural resource factors
11 Land topography
12 W ater supply
13 Diseases/pests
14 Flooding
15 Disaster assistance
Human factors
16 Capacity of HH labour
17 Skill/knowledge
18 Accessibility of employed labour
Physical factors
19 Transportation
20 Tools and equipment
21 Irrigation
22 Land rights
Social factors
23 Networks and connections
24 Farmer institutions
25 Other (specify)

325
3.5 Continuing leaving land abandoned
No. List of factorsIs the factor influencing land use decision? Priority
rankingYes No
Expected outcomes of land use
1 Profit
2 Lump sum income
3 Continuous income
4 Own consumption
Financial factors
5 Saving for investment
6 Credit for investment
7 Price stability
8 Trend of price
9 Policy of price
10 Government subsidy
Natural resource factors
11 Land topography
12 W ater supply
13 Diseases/pests
14 Flooding
15 Disaster assistance
Human factors
16 Capacity of HH labour
17 Skill/knowledge
18 Accessibility of employed labour
Physical factors
19 Transportation
20 Tools and equipment
21 Irrigation
22 Land rights
Social factors
23 Networks and connections
24 Farmer institutions
25 Other (specify)

326
3.6 Switching abandoned area to oil palm cultivation
No. List of factorsIs the factor influencing land use decision? Priority
rankingYes No
Expected outcom es o f land use
1 Profit
2 Lump sum income
3 Continuous income
4 Own consumption
Financial factors
5 Saving for investment
6 Credit for investment
7 Price stability
8 Trend of price
9 Policy of price
10 Government subsidy
Natural resource factors
11 Land topography
12 W ater supply
13 Diseases/pests
14 Flooding
15 Disaster assistance
Hum an factors
16 Capacity of HH labour
17 Skill/knowledge
18 Accessibility of employed labour
Physical factors
19 Transportation
20 Tools and equipment
21 Irrigation
22 Land rights
Social factors
23 Networks and connections
24 Farmer institutions
25 Other (specify)

327
Appendix 2-2: Questionnaire (the distributed version in Thai)
uuuaaumuû^fltirf‘rtL>1aim]'îrriaiirii5Î9üi'3<iîîînrin‘ïTaüfliTLliviîJitjT.wn'i‘îâiîi9]l99üuà-3Haçia mîàçîâwlîinnd'Du^u.'jrawa'îiajYiiunaiîIwai'iîjàiiajaçi m?wifawaïij1f9:1uwn'i??tiJ^a'!ia4Nl'M
HI HI H HI H HI
auawf aHm BÛT Lïma'ia uatwrinvi'ïT umiuu
tiiju m îjil'îrn a u riü 3 gaw
îiaitu 1 faua#]ïiJ
çiawu 2 lü'aua-n^uuarnnîlïiJ'srTijmi^u
lawn 3 ilaâü-nâ.JHariamîîTaâutal.wni'sHmm
mawnl îTaîjaïrs'liJ
n'îwii^u#3i^Dnvi1aTü'Buaif{üqniJîiui3n'l'U.a‘îaiia'57
1. LviPTua^MiMwiafii^aw
I ] uia [ ] v m2. a'lUTiaJTTnwunafai^au_______ 33. a f iifa w a n â £ ja ü lu u a d i]9 9 îru jjiu a '3 iîlw n a n fl
[ ] 'lijf l [ ] ilizn w H n m [ j sTfouMnHi/iJiu.
[ ] iJIninjiçil/ïJia [ ] a^ni'iiJlwnj'içi?
5. iiw n w a ijiW w a f]L ? B W _________ aw
6. â iw 'jw asj'iS n n iîlw u îJJ 'iw aiw in uart'î aw
7. n a 'là a a fl '^ a ^ a f îi la w
I ] wayrrin 100,001 u n i [ ] 100,001-200,000 u in
[ ] 200,001-300,000 in n [ ] 300.001-400,000 in n
[ ] 400,001-500,000 in n [ ] u in n i i 500,000 u in
8. Liwâ^no'lawàh[ ] inoHawâam'ïinua'î [ ]
[ ] fuûUTioolw aa [ ] Other (specify)_______________________

328
9. uwEij'nü'la'ïaj
[ ] niüNaNâamiinua?
[ ] fuuu'êiaiviaa
[ ] s?n9aiwm
[ ] Other (specify)
flavtvla uauauwwuatnisli^iJîcîüîJiîuwu
âi&94 n?miiâuâiiaanw1afauainuiniinwwita:m?lfij'5:'Iü?fimMWiia4aiit1aw
u i J a j
■n
1IW 19
( M )
a t in irn i'în a1/
9*534n i?9w w ifiu^
n i î W i J î ï I ü ï w
i T i ^ u V 'd A !
d m
1
2
3
4
5
6
7
8
9
10
11
v.uiÈJiViîi;w m : i= i2u t9 iD a4,2= iîi. 3=au (?nj)
2/?%k: I=5îiwui'5iw4.2='lîjâtiuutîhw3 /w s ; 1 =a ü1wi%9i93mj%Ynw. 2=aûwantii?i^iwj'):mw
4/^wk: i= r i i . 2=tn4vnTi. 3=ihM )ûim i, 4 = % & g (%u). 6=ü%u4,7=94*514,
8=au»3 CKU)5/?Mk i=R inffi\waîaiJfiw , 2=wrài, 3=aifi, 4=ati«] (%iJ)

329
91^11941) 94Sïij'3')il99bîia'lijuà4Hîiçiam'S99§wl9m5H‘n9UviÇa'liJ uar2) 94L?ü4âi9U9iiuâi9i:yiJa4il99ü'nâ4Ha9ams99K‘wl99'inîJina9'liJwaüiia9
3.1 lâ'^SwivîaiJanÿi'îaEiixjrfai^ao
n riEimTîîa9Ei«ialilHe?a Ha«B mVlBtiêitvilQ’tH
ffiflUBnwSnfinjUNS liJfjHa
Hîiâ«^fim«ii'Î4’B3îim7ÎsfiâM
1 fin’l l
2 nü'l^fiLflutôuîTa'U
3 Tsa’l riJlBLTlËi
4 fn'îHriEHSfliwafn'njîInfinajfifji'îa'u
iTa%Âhimn?i3w
5 wuaoamafiniajru
6 miiaiŸianiiEnnu
7 ifffiEnrnifiiBJinfn
8 imnTituTinn
9 WTamai^EmonmjuniHENÊm
10 TniWwuafivinintmBnTiarXiJBUtianriTOjnE
ifa^EièninTïTiiEnniSTïHBnw
11 EliKTarfiîîdiïmft/ àhwoüm
12 liiniaWn
13 TifittErfi/.T/îï
14 linilnu
15 mTtin üir.SasQnfîinEîiiîE'.â 5i.TjiviiI?i
ïïaàHHhirn'ïTiEnTiTMMtfJ
16 îlnaiannuBnîniaîiajii'Nin'Ufl'îniÎEU
17 fiTiuînTm*
18 finumsnTOlnnnTinn'iiJinu
tfa^BHnwnnannvi
19 miauunnu
20 iflianjjauarBijfiiEÏ
21 îa ih ïim u
22 flTÎUKIllITlîlU
23 LaîaihauazniiîiaiiaÊaani
24 KinùUtaiif.wiiTni
25 EU«) (Tru)

330
91&941) 94-3rijiiil99b9ali)wéïowaçiam599§wl9ni5H’n9Uvi?a'liJ ua:: 2) 94Llü4âi9UfliiwâimiiiJa4il99£if!à4wa«iamï9«âw'l99inîJiria«'liJwaüua9
3.1 tgfiSmw3iJanjiT3adi4^ai4ao
v l TlEim iïïïB BflolîlSsia Ha«Q m iK H lnlii milBTiS ww^olù
»Ha lu'ÜHa
1 fh’li2 na’l ruaiiiîuîTan3 Tia\^ïlEmE44 îniHrisnÊfflLviaînTuîIîifiiiajnfiiiQH
iTa'BBèniifniww
5 wuaESJiîlafnraj-nu
6 BWKBi?iam:B4ii%7 laüirîfnis’iiaiTifin8 uinHuTian9 ■ u l a i n a m n a i f f a n m j n a i H a H s n
10 miliîûuaîiïiwviîEOTîsrliJEUuaifi^n sÏïa ï BHTK1TÏTI BiniSnWBIM
11 àfimrîiîJ-JTrm?!/ anaatrfiu12 ilîinîu-ûn13 TîRaarÀsîr/ïï14 i m i n j j
15 r n i i i n B i v . É a ï s i ' ^ n s î i m i f î r i . T B ï î a i
llaàBRn-HITÏTI BlîllJIHHd'
16 finaiflTijJEniniaîiajuîinuafinE'u
17 f l T U J Î I Î f l l i :
18 fiTHimmialun-TTinminiiiTa'SBmnfnamii
19 miauunauB20 ifliaijjauarBiJnitC
21 îaihrm u22 îiTîiiEiiima'u
ÏÏaBBB'Tttâ'jflM
23 iftiatnauarfniSiailaaaani24 RanüUtaitr.HflTni25 E U * i

331
3 .2
11 n t i m iîT îîB M Q tü û ïlo H a w Q fn iw fllH Î'a fn ilB ïiS iiT ilIf llH
«NE llif jH E
HaàViffîiHnB 'H 'M 'ainfn'îlBTiâH
1 f t i l i
2 T ia ’l^ tu flu iâu ^ an
3 naW fiïlEL îlBa
4 T n iR N B H B m iM am iu iD im iia in f]L ian
iT a iB À in m iw w
5 wuBBiiLHEfniaar.u
6 fo iiiia i^ a m iE a n u
7 la t îa ifn is 'i ia jT in
5 u io H u n a n
9 •uTain'rfwnaioEJn^uTifliHBFiSfl
10 m iW w u aîiïi'u iiv iîe fiTssrluB uu in fify iriE
A ^B À n w n îŸ iB n n iS T R H n m
11 E aB Slr/lS lJ lïiT lf!/ à fîH E tîiU
12 iR n iüW n
13 TîfiaB ïB7,ÎV Îï
14 ■ûnilniî
15 m ii!o u iiiÉ a tG a % u iB n iÆ in a n a T i#
J 'a îB fiTK Ti-îT iann iM H sJ
16 fha“iflT iiisn in7aE aJU îiTO tflf3 i7E U
17 f i n u M f i i f t
18 f i T i u n n i a l u m i i n i i i i n u
tfo*8BflTVHnBfn«
19 m if l j jw a u
20 iftia iS a u a ïB iJ n ia î
21 Tsaihrinu
22 nîTBÊrniiiçni
ÏÏa^BBTK^OflH
23 iflîa îh a u a rm iîîa îla â s a rr î
24 fra n û u T a jir .y flîn i
25 ËU1 (1:11)

332
3 .3
J'aaB9ÎQtlJRîJaHa«Qm7BHÊH‘ltlrtTïlBîiR14Tl^BlH11
UNE lu '» HE
HsaVi^riBnBiiTjannfnilBTiRW
1 fh’l i
2 T1BMlu3liÛUîf911
3 TiaMiîïlEiîÎBJ
4 miHfJBHBfflmafniuilnfniajfi'hilBii
îkl'BBflhltfnTW H
5 wuEBi'iiiEfniaJiin
6 BnwamamiBiiiu
7 laflaifni’niajTifn
S uinT'Ijjnan
9 iiTamaihnai&imiTiinFiBFiBm
10 miWûuaEviiiitrâBnnirliJBUuinfi'fens
nTa^HRnnTi™ annisTJuinS
11 B“nym:fiîl'Ji:iiifî/ àhyaüâu
12 ilîinîuiïn
13 TîfiaBrRïiîYÎï
14 Wnilnu
15 mTîinaLiiÊQss4'rëm E om iÊ fiîr£ iv iij«
TÏD'BBfiTmTïTI BiniWwW
16 fllB4n m iie n in7EÎJ9JUÎ44T U flf3l7ËM
17 fiT iutliny:
IB finjJBnsnîîilumTfniaunu
Ja'BBflTwinafnn
19 m ifljjinflij
20 tfiiaiijELiarBiJniBS
21 îBiJirmu
22 nnuKiiimEU
A fB Â h w A m M
23 la îafnauE rm iÜ E ilaB aarn
24 frîrajUrajinHfiini
25 EU*] (iriJ)

333
3 . 4 n i ' ï i i J a y u n  U Ê i i a w i î i t i J i l m n h M H T ^
i l n t ifn îiT a & m a 'lU u t la H a m B m im â H 'la m iïÿ n  'u y iQ lw
îîièuBnîi^BîM«NE tliÜ H E
Haan^nfriRii'MiinTifrTïlîmSM
1 f h l i
2 n i f l^ iS u w u f T a u
3
4 m 'îH H B r tB f l iv îa î r i iu î In f l i ia jn f i i la 'u
ifa'BBftTumTSw
5 w u B E M m a m îB J im
6 a m ia iM a m iB i i iu
7 la î î s r î / n i f l ia in f n
8 im n litiJ T ia n
9 u T a rn a în n a m E n m jT in iF ia H â a
10 m ili î i i îu a i i ï i 'u u v i is a n îs r X i j f r t tu r i r i 'w u i a
iJa^B«ninTniEnni5n«mS
11 B fiy m z n â d iz iT iR / à n w a ü â u
12 l i î s n s i i în
13 l î f ia a r f i î i r A ï
14 W nila iî
15 n iT i ia B ii is a i ia i iT U iE a it i i in a a B 'f j i j i
iTa^B flnW TÏT Ï B 1 fl7 M H » rf
16 f n a i f lm a n u T î a î ia j u i jn i i f l f i t Î E U
17 B T iu t lm y :
18 a n jja r iL n ia 'lu m i< 'M a 7 4 n u
ïïî^BfiTwmBmn
19 fn m u u in u
20 la ïa iÛ B im rB iJ a ia l
21 •B a ih s m u
22 f iT ï u s i i ï î i fm
ÎTa^B«TuàÔfiH
23 if i ia t la u a s fn ia a f la a a a r n
24 K n u U t a i i n y u m i
25 EU*) ( i r iJ )

334
M nsimTiTa'àBsialilSsJoHawBfnîWflâHÎiim'ïtBfii'ttiilalH
élRUBnW^RfllSna l}iûHa
1 M l
2 rîîiWï1i3T4wuiTaTi
3 Tja'iÆniiElîlEU
4 fnTHFJEFJBfliwam'njItnniiajfi'niîan
Ai9Qmhwfn?î3w
5 wuaai'iiiBfnTajim
6 gwiamam^EciTu
7 imErîfnisTiajrifn
8 timT'Iunm
9 nTainafîinaifîîJ'jaiiTifnHflHâfl
10 mTliîwuaiiïiuiivtîaaTîgrliiBuurifi^iB
tfaàQHnwTi'în EnnTsrîJisnS
11 sfiKiurfiSiJt^mfr/ anHatriu
12 iBinîUTÎT
13 TîfiaarflfiTOî:
14 TllllQU
15 m'îiî'3 EJirJat
Ja^Qfl'nuTi'ïTiinnTMHsd’
16 î’nà'^flinueninTJtîja-JtiîJJTuafiiÎBU
17 finu'ï'vrnie
IS finufnsnîîil.'ssmitioiîjnu
îfaàEiflTKmtimH19 fnîfluuaau
20 iaî3JÎJBll9=BlJfl'5îlî21 n a ih n m
22 riTiiiKiiTiiîni
23 tfilaï'iüuaïmîîî ailaâasn:
24 fraiiJwt'SJif.afiTnT
25 £u*i (%ij)

335
3 .6
M T i a m iiTaâE i9ÎQ liJûî{jHafflflfn7ffl«âH ÎB fn‘ïlBT5«ivw ^fllij
t îiflu a n w ^ fia !û n a li iÛ H a
KaàVt^îi m B T iT ja in fm lB T i « H
1 fh ï:
2 ■ n îi\^ ïîi9 îiH U îîa n
3 TSa’lfTÎftBl.îlB-3
4 fniHHEHÊfliwam'îUîlnniiainfjiîBH
îTaâB ftium T ÎÔ H
5 uuaaumBfnTEJi™
6 trumaiMamiEoiiu
7 larÉîînmi'niBJnfn
8 uinTiîuTim
9 ■uTamaf4inaiffEj'3aunfnnaF)Sfl
10 Tnili^wwaBvt’u-uviîamîsrlijauuinn^iJiE
i f a à B # i im ‘fT i0 i î i ‘î5 7 T « in «
11 EfisiiiïfiîîîJîrmR/ anamrfiu
12 ilîinîuiÏT
13 TîfsasrÀKTOï
14 Tlailajj
15 mTsiQ a m s s îs jftu n s a iÆ if ï afTawJ?!
ïïaâBRninTïTn Bifi'îWMwd’
16 îT ia 'ia 'n u fnu iTE îia j r a - n n a f i lteu
17
18 finiitns.nîri'lum'rfiJi'Hnu
i fa à B f ln u m a m ïi
19 frnauuiau
20 lEîaiîîatiarBijfiTEÎ
21 îa ih îvnu
22 fiTîJjenimfni
23 lalaiî'iauarmîîiîiîiSKQanT
24 EînijiitajmasiTnî
25 EU*] ( : :u )

336
APPENDIX 3
INVITATION LETTER AND INTERVIEW QUESTION

337
w 'H iiT ia 'iBO 'jBE ianm u w a l a il a k u n iv e r s itywwJÎsrmTii L’2t « ■4f,-_q' tj iu>j'* f p > iiv'iv™>niM%ï7i?n-r! 80161
'c<-ir<nYi a V rji', 4 mi, n ?%:' aa» I>Tærn r. '-%7 jmm t’ ir.av w. ,avr,'.f*i.ro.?v n-ji:?ra w 1 j -mm 5) m- TivsInîVi
.IWMij' V. 1C430";'v’a # / i r Û 229® Üi’44, O 224» 093G V a ? T î 0 2238 Ù248 E-,t.hü v . j 1 * * 8 .t.. h <: I).
unaTiitnasi aptmntirj biob r.lvitnjî s.vifnEna Vfi?* E6EEDE1T ctoAiPO
'a t^ /f iru 'i 'ju bees:
lias t£itbayrabWinüinijnîîr\)TanTïfiTvvBWR(fiTiJuacihî!iJUMan-5tYiii]a4i3Æanoriiliiiaîio«
m. riT5H à suas a-i uiâun-'sl'olilaM ibbti inilaajniauu
nwu
FniM uafA w bw w m ju a a ^ a ^ a U i K p l a f i i Im u
Bi^3j?AwaSn’sa«gE*«iaR6l!Pjaisn a m i Environmental Strategy tu Unlvers.ly c f Surrey il'st.virtav'saB
manim iBfini^aùtiayif’jB îiaiTiuiflDP-îiaâuniiB î'riTÎTffl iiaii n%vitn<MaMTu üwte^invniioîie miLWUUBMM'N lâ a rm slvrin . rrjû^nvi.tniuvmmiio'vaEaaswnwrnjtwsiiLjijefrbTwprTrvnni&niliivTfj
{Î4ia%jnaTit \jaamiTWLTÎDHfl?ithuu.BO riâ;B-2:j-3a<B,Gfuei; r5Horiai*_3twuiJa4MSuvinmiii\janTiaaiôu 4iJÎiUariUim.4aimlmumBuiBAmiâiiium9BuemüMn%uiwaimyuBPBfawimrtl%üj%wa'-iEtYiw93ülimaa
ŸiirüTB04 \)fin'ifciâp>aacà5ia5iina5l€'.uloSiTOi»ip\hâi.''Ja3Jii
iiîaVJfna^3?aaTJiiîf«ii,îurii*«?ii5it€i)itftwniwuîi'lT ?c*t0ft33üo-4tPEisiAvwfriÿirth ayr'nbW>i3ulv'J‘5siaui,n9~ruriEKij')un-in“viuRBnBUiaanlisiiit)Manîs'»nr!ia4ir'[î)U3UTiifüTîie4t^ur4t!ftây uasa4L?Ê:,n'i?l«luIo«iticiî3in\j')âiini'^j3'wTfitiS\JtisiPUPicnul'iimEàîj/i'iWiîrniJi€ra'-.5rau\Ji;'iB';!) i^ jiim E a jr'w ijw 'ltiTa 'ivh îana i « W jA R rw iw oair'^ iu rtytu îir7imi]ÆaTtM vi <r ninr-ifiu bitctÆr
nan (»a;.c>3-iEd;.oo u."
^irtEriJii3i«althfffifl"*sa.ilvinTTiJatJ.rY-4!rHUr)sn)Biieirwtsî:ftuiîijeü')4g^Lii tu larmaC
ïQuap-sfntuvuaa
!S.f I2 _(8191% R5. qmnnM)
YnmofimâiunlTir-n^nn 3âuSvijiMaTrjB5nni\j?îjjvi îMa4îÎ9'ià üàîntÿîû
('■nïn3Bin'~Sî?imî hlluy.'rnanagemcnt.v/u.ac.th Email. vvm stawu.ac.th
î i f FSOOinEÜ Im llD Û Wl?1pj Iv tlA vn i o d * Æ;<fV>ûiÆ:tMl. nn<t artbter»®. n rtd t-b c ib n w t
n r d t ïw ïte b o b Email: npa rc>teîPwu.dL.Ü»
VJMS I The Best Innovative School of Manaeemenr ip The South of "hailandW M ^

338
nfimîJiiîiîiTJîumuwan^tviu'üowkuTtjiiife^E^mjmîwüinasKd^iElîin'^l'èMaâi'îjfiEin'iJnpyiIimj
b. Hfin5tr.uŸTbjw\JîtJmnw^awmii3iiîîÎ4^inni‘5Riiüu'uÎEiinevi3JStbvinfl El. çhTOaviloMangitirl^ijnnTRP.wiwnirüEi^iîji’Hiri'd'oa'îijTEj-uiLwoïbiii cc. (?aî5îiMl3vranpvvA‘alTjniiiwn'S£33KBnî£Vîu>fe7î 'ü‘5K{f4fnEinmT«iÆtJultnjnES
Qïil'ïTjna £. Wirmj-ulETUTU
Tj'SKH n nnmimiîJVuÏEAJicJOE.ni’l'sïïn t>. lumwîiîinn^RTîEiN 'KanTîîviijYiltmsiJîrîiîMSiinmi&hm'uuItAJia q^uni^miinTslumi
mi'ûum'3V3\jii‘}yiiT'j\jiLi ^'SJjwnTiurA^assalswtjKanTiiMij^infii'Jcth^lti
d. Wiq^tUKiiPTÿÎNTu:!! iiiJiîj"^y-je3fiw ïniy,im ii“ inD'3’üa3niJiiîti’uigmisKH?iuîi£:«i3i<iïîJ
nntilnATjTEwisîasjiniin&rûnîTulwuniîij'niaiioijtîïtwiiwansïiTijîia ijIuxiTtr/iinrj'jaJiv'j ni'3^)ynafitJWO3iilimfjTimij3\iJu‘kiufi'nwilan 'n')Tj‘iîTil0'lii
a. \}in%a n . y n n S n i:û iim ;a ili% im w in a i']i% T iiy ::^ ii04n n K M ::im :iiin (n % 3m j
iilïnjiunnti«a'auaî;£i4LaîijmîVMQp!;ga3iniJiaijtjninif.U‘3i;^u2a3iîiwyinLQmj ilitiRumnmi9üi3W"i4
siTunTïnmiàVin'i'ï h ttp://m 3n3g cm cntm 1.ac.th Email: wTnsGv/u.ec.th
^R?iOEnsn7É Uiaijll c&’sî-dlcLbcndlcnW, ovJÆ-bdbbooï, on>£-bdbbb(i j"Lmani O rtl-bn ibbob Email: npairote3'V‘ni.ac.lh \ / \ / K ^ ^— i ^
\WiS 1 The Best innovative School of f.tanagenrierit In Ttie South o f Tl’iailand ' " 4 ' .