Sustainability of Alternative Land Uses Comparing Biofuels ...
Upload
khangminh22Category
view
0download
0
IEA Bioenergy Task 39
December 2019
Implementation Agendas:
Compare-and-Contrast Transport Biofuels Policies
(2019-2021 Update)
IEA Bioenergy: Task 39
February 2022

ii
Implementation Agendas:
Compare-and-Contrast Transport Biofuels Policies
(2019-2021 Update)
Mahmood Ebadian and Jack Saddler, University of British Columbia, Canada James D. McMillan, National Renewable Energy Laboratory, USA
Edited by
IEA Bioenergy: Task 39
February 2022
Copyright © 2022 IEA Bioenergy. All rights Reserved
ISBN# 979-12-80907-06-6
Published by IEA Bioenergy
The IEA Bioenergy Technology Collaboration Programme (TCP) is organised under the auspices of the International Energy Agency (IEA) but is functionally and legally autonomous.
Views, findings and publications of the IEA Bioenergy TCP do not necessarily represent the views or policies of the IEA Secretariat or its individual member countries
The IEA Bioenergy Technology Collaboration Programme (TCP) is organised under the auspices of the International Energy Agency (IEA) but is functionally and legally autonomous.
Views, findings and publications of the IEA Bioenergy TCP do not necessarily represent the views or policies
of the IEA Secretariat or its individual member countries.

IEA Bioenergy Task 39 - Implementation Agendas: 2019-2021 Triennium Update iii
Preface
The International Energy Agency’s Bioenergy Technology Collaboration Programme (IEA Bioenergy TCP),
Task 39 (Transport Biofuels) (i.e., IEA Bioenergy Task 39) has been evaluating the effectiveness of
technology-push and market-pull policies to encourage the production and use of transport biofuels in
member countries since 2007. This evaluation has been a central part of a regular report, entitled
“Implementation Agendas- compare and contrast policies used to develop biofuels markets”, (abbreviated
to the “Implementation Agendas” report). The Implementation Agendas report is a collective effort
between the Task 39’s member countries. It summarises each country’s current biofuels policies, assesses
the market penetration of biofuels and, more importantly, compares-and-contrasts the relative success
of the various policies used to promote transport biofuels development and use. The information discussed
in the Implementation Agendas report is based on the data collected via a questionnaire sent to each
Task 39 country representative in 2020. The collective responses were compiled and used to update the
country specific chapters. A copy of the questionnaire is provided in Appendix B.
This latest update describes the ongoing developments in biofuels markets and policies since the last
report was published in February 2020 (click here). A summary of the updated additions to the report
include:
• Additional country chapters for India, Norway and Ireland, the countries that joined Task 39 in the 2019-
2021 triennium
• Historical GHG emissions inventory data and the contribution that the transport sector made to the
national GHG emission inventory of each member country
• Historical biofuel developments and the related GHG emissions policies in each member country
• Existing and emerging sustainability certification schemes for transport biofuels and feedstocks
• Compliance costs of biofuel policies (e.g. $/tCO2, $/GJ)
• Historical biofuels and feedstocks imports and exports
• Co-processing trials/demonstrations at oil refineries
It should be noted that most of the information was provided by member countries in 2020. Thus, it may
not reflect more recent market and policy developments.

IEA Bioenergy Task 39 - Implementation Agendas: 2019-2021 Triennium Update iv
Acknowledgements
The Task 39 country representatives who contributed to this report are listed below, including their
country and institutional affiliations. We thank the country representatives of IEA Bioenergy Task 39 for
their participation in completing the questionnaires and engaging in insightful discussions.
Country Country Representative Institution Australia Steve Rogers Licella
Austria Dina Bacovsky, Andrea Sonnleitner BEST – Bioenergy and Sustainable Technologies GmbH
Brazil Glaucia Mendes Souza et al. (Please see Brazil Chapter for the full list of authors)
University of São Paulo and FAPESP Bioenergy Research Program BIOEN
Canada Jack Saddler1, Mahmood Ebadian1, Oshada Mendis, Oriana Vanderfleet 2
1University of British Columbia; 2Natural Resources Canada
Denmark Sune Tjalfe Thomsen University of Copenhagen
European Commission
Adrian O’Connell, Nicolae Scarlat Joint Research Centre, European Commission
Germany Franziska Mueller-Langer and Gabriel Costa de Paiva 3, Nicolaus Dahmen4
3Deutsches Biomasseforschungszentrum; 4Karlsruhe Institute of Technology
India Ravi P Gupta, S K Puri, SSV Ramakumar Indian Oil Corporation Limited
Ireland Adrian O’Connell5, Shane Malone6
5European Commission Joint Research Centre, 6Byrne Ó Cléirigh Consulting
Japan Yuta Shibahara
New Energy and Industrial Technology Development Organization (NEDO)
The Netherlands K.W. Kwant, T. Gerlagh, T.P. Sinnige Netherlands Enterprise Agency
New Zealand Paul Bennett Scion
Norway Odd Jarle Skjelhaugen and Svein Jarle
Horn7, Mats Nordum8, Einar Gotaas,
Drivkraft Norge AND Duncan Akporiaye9
7 Norwegian University of Life
Sciences; 8 Norwegian Environment
Agency; 9 SINTEF Industry
South Korea Jin Suk Lee Korea Institute of Energy Research
Sweden Tomas Ekbom and Cecilia Higa Swedish Bioenergy Association
USA Jim McMillan National Renewable Energy Laboratory

IEA Bioenergy Task 39 - Implementation Agendas: 2019-2021 Triennium Update v
Executive Summary
IEA Bioenergy Task 39 has been assessing the measures taken by its member countries to develop or stimulate their respective biofuels sectors since 2007, with the particular focus on biofuel policies. The overall goal of this assessment was to determine the extent to which policies had been effective in encouraging the production and use of transport biofuels. Task 39’s member countries represent a diverse range of regions, biofuels producers and consumers and include some of the key biofuel producing countries and regions in the world (e.g., US, Brazil, the European Union (EU)). This frequent assessment has been a central part of Task 39’s commitment to facilitate the commercialisation of low-carbon intensive transport biofuels. The increasing global production and use of biofuels plus the growing numbers of national and regional policies that support the development of biofuels markets to decarbonize the transport sector have been key components of the sector growth. Five updates of the report have been published by Task 39 in the past including 2007, 2009, 2014, 2017 and 2019. This recent update describes ongoing developments in the biofuels sector and the successful policies used by member countries to facilitate the production and use of low-carbon-intensive biofuels. The main “takeaway” messages from the 2019-2021 triennium update are: Biofuels continue to be a central component of national strategies focussed on decarbonising the transport sector
The transport sector continues to be the area with the lowest share of renewables with the oil and petroleum sector providing the vast majority the world’s transportation fuels. Oil and petroleum products constituted 96.7% of this fuel (including 0.8% non-renewable electricity), with only small amounts supplied by biofuels (3.0%) and renewable electricity (0.3%). Consequently, the transportation sector accounted for nearly one-quarter of global energy-related greenhouse gas emissions in 2019. Despite the relatively minor contribution of renewables, biofuels continue to be a central component of most counties’ transportation decarbonization strategies with biofuels primarily used in the road transportation. The road transportation accounts for about 77% of the transportation sector’s global energy use. Globally, biofuels production continues to increase
Global production of transport biofuels has continued to increase, from about 64 million tonnes oil equivalent (Mtoe) in 2010 (~110 billion liters) to about 92 Mtoe in 2019 (~158 billion liters). Biofuels production grew at an average annual rate of 4% over the past decade. The highest annual growth rate was observed in the Asia-Pacific region, which grew at an annual rate of 16% over the period 2010-2019. The Americas and Europe continued to have the highest shares of biofuels production. In 2019, North America, South and Central America and Europe had a global share of 39.4%, 28% and 16.1%, respectively. “Conventional” biofuels (i.e. ethanol/biodiesel) continue to dominate the market but the production and use of drop-in biofuels (i.e. renewable diesel) has been growing rapidly
The main biofuels produced globally are ethanol and biodiesel (fatty acid methyl ester or FAME fuels). Biofuels produced by treating animal and vegetable oils and fats with hydrogen (known as hydrotreated vegetable oil (HVO)/hydrotreated esters and fatty acids (HEFA) biofuels/renewable diesel/“green” diesel) have experienced a significant growth in the last decade. It should be noted that there is a growing contribution from biomethane in some countries such as the US, Sweden and Germany. It is estimated that 69% of biofuel production (in volume terms) was ethanol, 26% was FAME biodiesel and 5% was HVO/HEFA fuels in 2020. Although the use of biomethane as a transport fuel is growing, it contributed less than 1% of total biofuel use. HVO/HEFA fuels production has increased from about 265 million liters in 2007 to over 7,500 million liters in 2020; an average annual growth of 41%. Biofuel policies have, and will continue to play, an essential role in the growth of biofuels market
The steady growth of biofuels production and use has been catalysed by “enabling” biofuel policies. The policies have taken several forms, including blending mandates, excise tax reduction/exemption,

IEA Bioenergy Task 39 - Implementation Agendas: 2019-2021 Triennium Update vi
renewable or low carbon fuel standards, fiscal incentives, public financing, etc. These policies have been applied at different stages of the biofuels production and consumption chain, with most of the policies either technology-push or market-pull types of policies. Technology-push policies typically help drive early-stage technology development such as research and development (R&D), demonstration and commercialization of biofuels. They have been primarily used to help reduce the cost/risk of research and development, and help take early-stage technologies through the financial “valley of death” that exists between initial development and commercialization. In a complementary fashion, market-pull policies have been primarily used to support relatively mature technologies and create a demand for biofuels, such as “conventional” biofuels (i.e., ethanol and biodiesel) and drop-in biofuels (i.e., HVO/HEFA fuels and biomethane). Biofuel blending mandates remain one of the most widely adopted mechanisms for increasing biofuels use in the transport sector
Blending mandates have helped establish biofuels markets in many countries, primarily by shielding biofuels from low oil prices and facilitating the market entry. In addition to blending mandates for conventional biofuels, the US and some EU member countries, including Austria, Denmark, Germany, Sweden and Netherlands have developed or are developing blending mandates for advanced biofuels. However, blending mandates alone have not been able to grow or even maintain some biofuel markets. The reasons why mandates have not worked well in some jurisdictions are varied and include a lack of feedstock (e.g., South Korea), high feedstock costs due to competing uses (e.g., Australia), shortage of infrastructure and food security and sustainability concerns such as indirect land use changes (ILUC) (e.g., Japan). While biofuel mandates have been shown to reduce transport sector’s GHG emissions, mandated biofuel obligations are typically based on a biofuel volume or energy content rather than its decarbonisation potential. In other words, biofuel mandates alone have not always provided sufficiently strong incentives to spur producers to continue the innovation to reduce the carbon intensity of the biofuels they produce. However, this market-pull policy will continue to be one of the primary policy tools in the short-to-mid term for the production/use of transport biofuels. Low carbon fuel standard (LCFS) and the GHG emission quotas have proven to be a successful policy instrument to decarbonize the transportation sector by encouraging the reduction of carbon intensity of all renewable fuels, especially advanced biofuels
LCFS types of policies, which are currently in place in the US states of California and Oregon (and recently in the state of Washington) and the Canadian province of British Columbia, incentivize the reduction in carbon intensity of transportation fuels including fossil fuels and biofuels (all fuels), rather than mandating defined volumes or blending levels. As well as encouraging on-going more efficient production of conventional biofuels, LCFS-based policies have also stimulated the development and production of lower carbon intensity drop-in and advanced biofuels by increasing their market values. Under LCFS-type policies, fuels that can be produced at a lower carbon intensity compared to their petroleum-based counterparts (gasoline and diesel) generate higher carbon credits. This translates into higher market values for these fuels. In contrast to biofuels blending mandates, LCFS policies do not have minimum GHG emission reduction requirements for specific fuel categories. In recent years, Canada and Brazil have been developing national LCFS-type policies to encourage the production and use of low carbon fuels. Although not LCFS, Germany and Sweden have also implemented GHG emission quota obligations for biofuels use in their transport sectors. Despite the predominance of market-pull policies, technology-push policies have been successfully used to encourage research, development and demonstration (RD&D), particularly for advanced biofuels
Technology-push policies impact the development and deployment of advanced biofuels and their supply chains, especially in countries that have established biofuel markets such as Brazil, the US, Canada, Austria, Denmark, Germany and Sweden. In all these countries, demonstration, pre-commercial and commercial advanced biofuels facilities have been developed. In other countries, the various types of funding programs have contributed to the production of advanced biofuels including cellulosic ethanol, Fischer–Tropsch synthetic fuels and other drop-in biofuels (e.g., biojet) at pilot and demonstration scales.

IEA Bioenergy Task 39 - Implementation Agendas: 2019-2021 Triennium Update vii
In addition to de-risking advanced biofuel production pathways, financial schemes and incentives have also been used to improve infrastructure (e.g., end-use fuel switching), feedstock production and supply chains and to address sustainability concerns that slow acceptance among users as new technologies and systems are introduced. The countries that have achieved the most success in growing the production and use of transport biofuels have used a mixture of market-pull and technology-push policies
It is apparent that a balanced distribution of policy efforts between demand-pull and technology-push has proven most successful in fostering development and deployment of biofuels production technologies and the growth of biofuels markets in member countries such as the US, Brazil, Sweden, Germany and Canada. A combination of technology-push and demand-pull policies will both be needed to increase the rate of introduction and diffusion of advanced biofuel technologies. Although technology-push policies have been shown to generate innovation in advanced biofuels, the growth in demand induced by market-pull policies such as LCFS tends to increase public and private investment in more mature technologies that provide significant GHG reductions. In the vast majority of member countries, biofuel policies have enhanced biofuels market growth
An on-going increase in production and use of biofuels as blending mandates gradually have increased over time is evident in the US, Brazil, Sweden, Canada, Japan, the Netherlands, and South Korea. It is also apparent that for periods when blending mandates did not change, biofuels production and use remained fairly flat. For example, this is seen in Austria, Denmark, and Germany. In countries such as New Zealand and Australia where there is no national biofuels blending mandate, there is a sporadic production of ethanol and biodiesel and the biofuels industry has not been able to establish a stable market. Lack of market development due to the absence of blending mandate is also observed for biodiesel in Japan and ethanol in South Korea. There are several uncertainties that need to be addressed to enhance the effectiveness of policies in creating a stable environment for the increased production and use of biofuels
A variety of factors have contributed to the slow growth of biofuels markets in some of member countries such as India, Norway, New Zealand and Australia. The primary factor is the uncertainty about future biofuels policy. Other important factors include low non-compliance costs, local and reginal competing use of feedstocks, the nature of future funding and incentive programs as well as possible unforeseen impediments to global trade such as tariffs, and also future availability and cost of sustainably certified feedstocks, food security and the slow rate of commercialisation of advanced biofuels. The low cost of fossil fuel (including the subsidies) and the lack of commitment to stop the investments in fossil industry have also contributed to the further growth of biofuels markets in member countries. To date, most of the policies used to promote transport decarbonisation have focused on increasing the use of biofuels in road transport
Policies to promote renewable energy in the transport sector have been focusing primarily on road transport, which accounts for the vast majority of energy use in transport, with aviation and shipping seeing less attention despite being large energy consumers and carbon emitters. The aviation and shipping sectors (where electrification is more challenging) are under increasing pressure to reduce their carbon and sulphur emissions. The government and industry efforts are increasing to reduce the GHG emissions from aviation and shipping industries. The Netherlands, Norway, Sweden and the US have had policies in place for several years aimed at promoting production of alternative jet fuel. Aviation is included in the EU's Emission Trading Scheme (ETS). The EU’s revised RED (REDII) encourages the production and use of sustainable biofuels, particularly for the aviation and shipping sectors by “double-counting” (using a multiplier of 1.2) in their possible contribution towards the region’s renewable transport target. Regulators need to create frameworks that mandate the use of low carbon fuels and incentivize the production of biofuels for use in the aviation and shipping sectors. Although regulators at the regional, national and international levels are developing policies to support the development of biojet/SAF,

IEA Bioenergy Task 39 - Implementation Agendas: 2019-2021 Triennium Update viii
considerably less regulatory effort has been invested in trying to encourage the development of biofuels in the shipping sector. Continuing efforts to enhance the production and use of drop-in biofuels to decarbonize the long-distance transport sectors
Globally, it is estimated that over 7.5 billion liters of renewable diesel are produced by 8 companies in 11 facilities located in the US, Europe and Singapore. These fuels are increasing used to decarbonise the long-distance transport sector with the vast majority of the drop‐in biofuels that are currently produced made via the upgrading of lipids/oleochemicals. Of the Task 39 member countries, currently, HEFA fuels are only produced in the US and the Netherlands. However, these fuels have been used by several member countries to meet their blending mandates and the GHG emission reduction goals. The growth in drop-in biofuels production is expected to grow significantly, with increasing pressure to decarbonize the long-distance transport sectors such as trucking, aviation and marine. However, due to the higher production cost of HEFA fuels as compared to FAME biodiesel, these fuels are mainly sold in markets such as California and British Columbia. In these jurisdictions, policies such as the Low Carbon Fuel Standard have incentivized biofuels based on their carbon intensity. In other countries, supporting policies based on GHG emission reductions such as in Germany and Sweden are in play. Low-carbon intensive fuels can also be produced by co-processing biogenic feeds in existing oil refineries
Approximately 40 refineries around the world have implemented or are assessing the potential to co-process biogenic feedstocks at blend levels ranging from 2-30 vol%. Some oil refineries, such as Preem in Sweden, are well advanced in producing and marketing co-processed fuels. In addition to Sweden, low carbon intensive, co-processed fuels have been produced in Brazil, the US, Canada and Norway. In British Columbia (BC) Part 3 agreements within the LCFS have been successfully used to “encourage” BC’s oil refineries, to use co-processing as one way of reducing the carbon intensity of their processes and products. Similarly, California’s LCFS has encouraged US oil refineries to produce low-carbon fuels via co-processing. The co-processing pathway is in the process of being approved by the US EPA to generate RINs under the Renewable Fuel Standard (RFS) program. Despite considerable progress being made in the technical aspects of advanced biofuels production, the right policies will be needed to expand commercialization
The production of so-called “advanced” biofuels from cellulosic feedstocks has been slow to commercialise. Currently, the majority of cellulosic ethanol (1.5G and 2G) is produced in the US, Brazil and the EU. Biomethane has been mainly produced in the US and the EU (Sweden and Germany). The US is currently the largest market as biomethane is included in the “cellulosic biofuels” category of the RFS2 program. Commercialisation of thermally-based biofuels processes, which include hydrothermal liquefaction, pyrolysis and gasification, is also making progress. A number of pilot, demonstration and pre-commercial advanced biofuels plants in some member countries such as Australia, Austria, Canada, Denmark, India, Germany and Sweden have produced biofuels from biomass feedstocks such as agricultural/forest residues and the organic portion of municipal solid waste (MSW). EU policy support for advanced biofuels and the increasing number of quota policies announced by member states is anticipated to increase their commercial development. Sustainability requirements are being increasingly incorporated into biofuel policies
Life Cycle Assessment (LCA) of GHG emissions is the predominant method used to assess the sustainability of many renewable fuel pathways. The LCFS type of policies that have incentivized reductions in carbon intensity should lead to more stable and larger markets for low carbon intensity fuels. Consequently they should promote the increased production and use of biofuels, particularly in sectors such as aviation and marine, where there are limited alternatives. Austria, Denmark, the Netherlands and the US have introduced specific mandates for these biofuels as well as providing direct financial incentives. However, ensuring “sustainability” remains a priority with the EU’s REDII prohibiting the growth of potential biofuel feedstocks in areas that already contain high carbon stocks (i.e., wetlands or forests) or have high

IEA Bioenergy Task 39 - Implementation Agendas: 2019-2021 Triennium Update ix
biodiversity (e.g., primary forests or grasslands). The Canadian Clean Fuel Standard (CFS) (coming into force in December 2022) will require the consideration of additional sustainability criteria beyond LCA. This will include land use change, biodiversity, the riparian and protected zones for the use of agricultural and forest biomass in the production of advanced biofuels. In Brazil, the RenovaBio program will address indirect land use concerns (iLUC) by adopting eligibility criteria for agricultural based feedstock. This will include protection of natural vegetation, compliance with national Forest Codes (riparian areas, minimum share of native vegetation per farm, GIS delimitation of proprieties among other), and compliance with agricultural zoning for palm oil.

IEA Bioenergy Task 39 - Implementation Agendas: 2019-2021 Triennium Update x
Table of Contents Preface ............................................................................................. iii Acknowledgements .............................................................................. iv
Executive Summary ............................................................................... v
1. Introduction ................................................................................. 18 1.1. Global production of transport biofuels ..................................................... 18
1.2. Biofuel policies .................................................................................. 20
1.3. The methodology used to evaluate the effectiveness of biofuel policies .............. 21
Sources .................................................................................................... 22
2. Compare-and-contrast transport biofuel policies in member countries ......... 23 2.1. Policy landscape on a global scale ........................................................... 24
2.2. Main drivers for biofuels policy development in Task 39 member countries ........... 25
2.3. Biofuel policies in Task 39’s member countries ............................................ 25
2.3.1. Biofuel blending mandates ............................................................... 25
2.3.2. Fuel excise tax reductions/exemptions/credits ...................................... 26
2.3.3. Low carbon fuel standard ................................................................ 37
2.3.4. Technology-push biofuels policies ...................................................... 39
2.3.5. Biofuel policies to encourage the decarbonisation of aviation and shipping sectors 40
2.3.6. Biofuels production and use in member countries ................................... 41
2.3.7. Sustainability requirements in biofuels policies...................................... 55
2.4. Conclusion and Policy Implications ........................................................... 56
Sources .................................................................................................... 60
Appendix A- Country Chapters ............................................................... 63
1. Australia ...................................................................................... 64 1.1. Introduction ...................................................................................... 65
1.2. Main drivers for biofuels policy ............................................................... 69
1.3. Biofuels policy ................................................................................... 71
1.3.1. Biofuels obligations ....................................................................... 75
1.3.2. Excise duty reductions .................................................................... 76
1.3.3. Fiscal Incentives ........................................................................... 77
1.3.4. Investment subsidies ...................................................................... 77
1.3.5. Other measures stimulating biofuels implementation .............................. 77
1.4. Promotion of advanced biofuels .............................................................. 78
1.5. Market development and policy effectiveness .............................................. 78
1.6. Co-processing at oil refineries ................................................................ 84
Sources .................................................................................................... 85

IEA Bioenergy Task 39 - Implementation Agendas: 2019-2021 Triennium Update xi
2. Austria ........................................................................................ 86 2.1. Introduction ...................................................................................... 87
2.2. Main drivers for biofuels policy ............................................................... 89
2.3. Biofuels policy ................................................................................... 90
2.3.1. Biofuels obligations ....................................................................... 90
2.3.2. Excise duty reductions .................................................................... 92
2.3.3. Fiscal incentives ........................................................................... 92
2.3.4. Investment subsidies ...................................................................... 92
2.3.5. Other measures used to stimulate the production and use of biofuels ........... 93
2.4. Promotion of advanced biofuels .............................................................. 93
2.5. Market development and policy effectiveness .............................................. 95
2.6. Co-processing at oil refineries ................................................................ 99
2.7. Conclusions ..................................................................................... 100
Sources ................................................................................................... 100
3. Brazil ........................................................................................ 102 3.1. Introduction ..................................................................................... 103
3.2. Main drivers for biofuel policy ............................................................... 104
3.3. Biofuels policy .................................................................................. 105
3.3.1. Biofuels obligations ...................................................................... 109
3.3.2. Excise duty reductions ................................................................... 111
3.3.3. Fiscal incentives .......................................................................... 112
3.3.4. Other measures used to stimulate the production and use of biofuels .......... 112
3.4. Promotion of advanced biofuels ............................................................. 115
3.5. Market development and policy effectiveness ............................................. 117
3.6. Co-processing at oil refineries ............................................................... 119
3.7. Conclusions ..................................................................................... 120
Sources ................................................................................................... 120
4. Canada ...................................................................................... 123 4.1. Introduction ..................................................................................... 124
4.2. Main drivers for biofuels policy .............................................................. 127
4.3. Biofuels policy .................................................................................. 128
4.3.1. Biofuels obligations ...................................................................... 128
4.3.2. Carbon Pricing ............................................................................ 131
4.3.3. Excise duty reductions ................................................................... 134
4.3.4. Fiscal incentives and Investment subsidies ........................................... 134
4.3.5. Other measures stimulating the implementation of biofuels ..................... 136
4.4. Promotion of advanced biofuels ............................................................. 137

IEA Bioenergy Task 39 - Implementation Agendas: 2019-2021 Triennium Update xii
4.5. Market development and policy effectiveness ............................................. 139
4.5.1. Biofuels consumption in Canada ....................................................... 139
4.5.2. Biofuels production in Canada ......................................................... 143
4.6. Coprocessing .................................................................................... 144
Sources ................................................................................................... 144
5. Denmark .................................................................................... 146
5.1. Introduction ..................................................................................... 147
5.2. Main drivers for biofuels policy .............................................................. 149
5.3. Biofuels policy .................................................................................. 149
5.3.1. Biofuels obligations ...................................................................... 149
5.3.2. Excise duty reductions ................................................................... 150
5.3.3. Fiscal incentives .......................................................................... 150
5.3.4. Investment subsidies ..................................................................... 150
5.4. Promotion of advanced biofuels ............................................................. 151
5.5. Market development and policy effectiveness ............................................. 152
5.6. Coprocessing at oil refineries ................................................................ 154
5.7. Conclusions ..................................................................................... 154
Sources ................................................................................................... 154
6. European Union ........................................................................... 156 6.1. Introduction ..................................................................................... 157
6.2. Policies driving the production and use of biofuels in the EU ........................... 160
6.2.1. RED II ....................................................................................... 160
6.2.2. Sustainability criteria in RED II ......................................................... 161
6.2.3. Advanced biofuels ........................................................................ 162
6.2.4. Novel transport fuels in the EU policy ................................................ 163
6.2.5. Caps and multipliers in RED II .......................................................... 164
6.2.6. Flexibility in the implementation of RED II in member states .................... 165
6.2.7. Translation and implementation of RED II ............................................ 165
6.3. Advances and challenges in biofuels technologies ........................................ 166
6.3.1. Biochemical conversion routes ......................................................... 166
6.3.2. Thermochemical conversion routes .................................................... 167
6.3.3. Oleochemical conversion routes ....................................................... 168
6.3.4. Co-processing ............................................................................. 169
6.3.5. Broad indicator of funding by technology routes .................................... 170
6.4. Conclusions ..................................................................................... 170
Sources ................................................................................................... 171
7. Germany .................................................................................... 173

IEA Bioenergy Task 39 - Implementation Agendas: 2019-2021 Triennium Update xiii
7.1. Introduction ..................................................................................... 174
7.2. Main drivers for biofuels policy .............................................................. 174
7.3. Biofuels policy .................................................................................. 174
7.3.1. Biofuels obligations ...................................................................... 176
7.3.2. Excise duty reductions ................................................................... 177
7.3.3. Fiscal incentives .......................................................................... 177
7.3.4. Investment subsidies ..................................................................... 177
7.4. Promotion of advanced biofuels ............................................................. 177
7.5. Market development and policy effectiveness ............................................. 181
7.6. Conclusions ..................................................................................... 185
Sources ................................................................................................... 185
8. India ......................................................................................... 189 8.1. Introduction ..................................................................................... 190
8.2. Main drivers for biofuels policy .............................................................. 194
8.3. Biofuel Policy ................................................................................... 195
8.3.1. Biofuels obligations ...................................................................... 196
8.3.2. Excise duty reductions ................................................................... 198
8.3.3. Fiscal incentives and investment subsidies ........................................... 198
8.3.4. Other measures stimulating the implementation of biofuels ..................... 200
8.4. Promotion of advanced biofuels ............................................................. 200
8.5. Market development and policy effectiveness ............................................. 203
8.6. Conclusions ..................................................................................... 207
Sources ................................................................................................... 207
9. Ireland ...................................................................................... 210 9.1. Introduction ..................................................................................... 211
9.2. Main drivers for biofuels policy .............................................................. 212
9.3. Up-to 2020 ...................................................................................... 212
9.4. Post-2020 ........................................................................................ 213
9.5. Biofuels policy .................................................................................. 213
9.5.1. Biofuels obligations ...................................................................... 213
9.5.2. Excise duty reductions ................................................................... 214
9.5.3. Fiscal incentives .......................................................................... 214
9.6. Market development and policy effectiveness ............................................. 215
Sources ................................................................................................... 216
10. Japan ........................................................................................ 217
10.1. Introduction ..................................................................................... 218
10.2. Main drivers for biofuels policy .............................................................. 219

IEA Bioenergy Task 39 - Implementation Agendas: 2019-2021 Triennium Update xiv
10.3. Biofuels Policy .................................................................................. 219
10.3.1. Biofuels targets ........................................................................... 219
10.3.2. Excise duty reductions ................................................................... 221
10.3.3. Incentives, subsidies and other measures to promote biofuels ................... 221
10.3.4. Other measures stimulating the implementation of biofuels ..................... 223
10.4. Promotion of advanced biofuels ............................................................. 223
10.5. Market development and policy effectiveness ............................................. 225
10.6. Co-processing at oil refineires ............................................................... 228
Sources ................................................................................................... 229
11. Netherlands ................................................................................ 231 11.1. Introduction ..................................................................................... 232
11.2. Main drivers for biofuels policy .............................................................. 233
11.3. Biofuels policy .................................................................................. 234
11.3.1. Biofuels obligations ...................................................................... 236
11.3.2. Excise duty reductions ................................................................... 238
11.3.3. Fiscal incentives .......................................................................... 239
11.3.4. Investment subsidies ..................................................................... 239
11.3.5. Other measures stimulating the implementation of biofuels ..................... 239
11.4. Promotion of advanced biofuels ............................................................. 239
11.5. Market development and policy effectiveness ............................................. 239
11.6. Co-processing in refineries ................................................................... 242
11.7. Conclusions ..................................................................................... 242
Sources ................................................................................................... 243
12. New Zealand ............................................................................... 244 12.1. Introduction ..................................................................................... 245
12.2. Main drivers for biofuels policy .............................................................. 246
12.3. Biofuels policy .................................................................................. 246
12.4. Biofuels obligations ............................................................................ 246
12.4.1. Excise duty reductions ................................................................... 247
12.4.2. Fiscal incentives .......................................................................... 247
12.4.3. Investment subsidies ..................................................................... 247
12.4.4. Other measures stimulating the implementation of biofuels ..................... 247
12.5. Promotion of advanced biofuels ............................................................. 247
12.6. Market development and policy effectiveness ............................................. 247
12.7. Conclusions ..................................................................................... 249
Sources ................................................................................................... 249
13. Norway ...................................................................................... 251
IEA Bioenergy Task 39 - Implementation Agendas: 2019-2021 Triennium Update xv
13.1. Introduction ..................................................................................... 252
13.2. Main drivers for biofuels policy .............................................................. 253
13.3. Biofuel policy ................................................................................... 254
13.3.1. Biofuels obligations ...................................................................... 256
13.3.2. Fiscal incentives .......................................................................... 258
13.3.3. Other measures stimulating the implementation of biofuels ..................... 258
13.3.4. Some other ongoing biofuels -related R&D-projects ................................ 259
13.4. Market development and policy effectiveness ............................................. 260
13.4.1. Advanced biofuels production .......................................................... 263
13.4.2. Biofuel feedstocks ........................................................................ 263
13.4.3. Forest based biofuel production plants in Norway .................................. 264
13.5. Coprocessing at oil refineries ................................................................ 266
13.6. Conclusions ..................................................................................... 266
Sources ................................................................................................... 267
14. South Korea ................................................................................ 268 14.1. Introduction ..................................................................................... 269
14.2. Main drivers for biofuels policy .............................................................. 270
14.3. Biofuels policy .................................................................................. 271
14.3.1. Biofuels targets ........................................................................... 271
14.3.2. Excise duty reductions ................................................................... 271
14.3.3. Fiscal Incentives .......................................................................... 271
14.3.4. Investment subsidies ..................................................................... 272
14.3.5. Other measures stimulating the implementation of biofuels ..................... 272
14.4. Promotion of advanced biofuels ............................................................. 272
14.5. Market development and policy effectiveness ............................................. 272
14.6. Coprocessing at oil refineries ................................................................ 274
14.7. Conclusions ..................................................................................... 274
Sources ................................................................................................... 274
15. Sweden ..................................................................................... 276 15.1. Introduction ..................................................................................... 277
15.2. Main drivers for biofuels policy .............................................................. 280
15.3. Biofuels policy .................................................................................. 280
15.3.1. Biofuels obligations ...................................................................... 281
15.3.2. Excise duty reductions ................................................................... 283
15.3.3. Fiscal incentives .......................................................................... 283
15.3.4. Investment subsidies ..................................................................... 283
15.3.5. Other measures stimulating the implementation of biofuels ..................... 283

IEA Bioenergy Task 39 - Implementation Agendas: 2019-2021 Triennium Update xvi
15.4. Promotion of advanced biofuels ............................................................. 284
15.5. Market development and policy effectiveness ............................................. 286
15.6. Coprocessing at oil refineries ................................................................ 288
15.7. Conclusions ..................................................................................... 289
Sources ................................................................................................... 289
16. United States .............................................................................. 290
16.1. Introduction ..................................................................................... 291
16.2. Main drivers for biofuels policy .............................................................. 292
16.3. Biofuels policy .................................................................................. 292
16.3.1. Biofuel obligations ....................................................................... 293
16.3.2. Excise duty reductions ................................................................... 297
16.3.3. Fiscal incentives and investment subsidies ........................................... 297
16.3.4. Other measures stimulating the implementation of biofuels ..................... 297
16.4. Promotion of advanced biofuels ............................................................. 298
16.5. Market development and policy effectiveness ............................................. 301
Sources ................................................................................................... 304
Appendix B- Questionnaire .................................................................. 307

IEA Bioenergy Task 39 - Implementation Agendas: 2019-2021 Triennium Update xvii
This page left intentionally blank

Introduction
IEA Bioenergy Task 39 - Implementation Agendas: 2019-2021 Triennium Update 18
1. Introduction
1.1. Global production of transport biofuels
Energy for the transport sector accounted for around one-third (32%) of the world’s total final energy consumption in 2017 (REN21, 2020). The transport sector remains the sector with the lowest share of renewables, as oil and petroleum products continue to meet nearly all global transport energy needs. In 2017, the vast majority (96.7%) of global transport energy needs were met by oil and petroleum products (including 0.8% non-renewable electricity), with a small share met by biofuels (3.0%) and renewable electricity (0.3%) (see Figure 1.1). The sector as a whole accounted for nearly one-quarter of the world’s energy-related greenhouse gas emissions in 2019 (REN21, 2020).
Figure 1.1. Renewable share of total final energy consumption in Transport in 2017 (REN21, 2020)
Despite the small contribution of renewables, biofuels continue to be the central component of the methods used to decarbonize the transport sector. Biofuels have been primarily used in road transportation which accounts for about 77% of the energy use by the transport sector (see Figure 1.2).
Figure 1.2. Energy demand split by transport sector in 2019 (Barclays Equity Research, 2021)
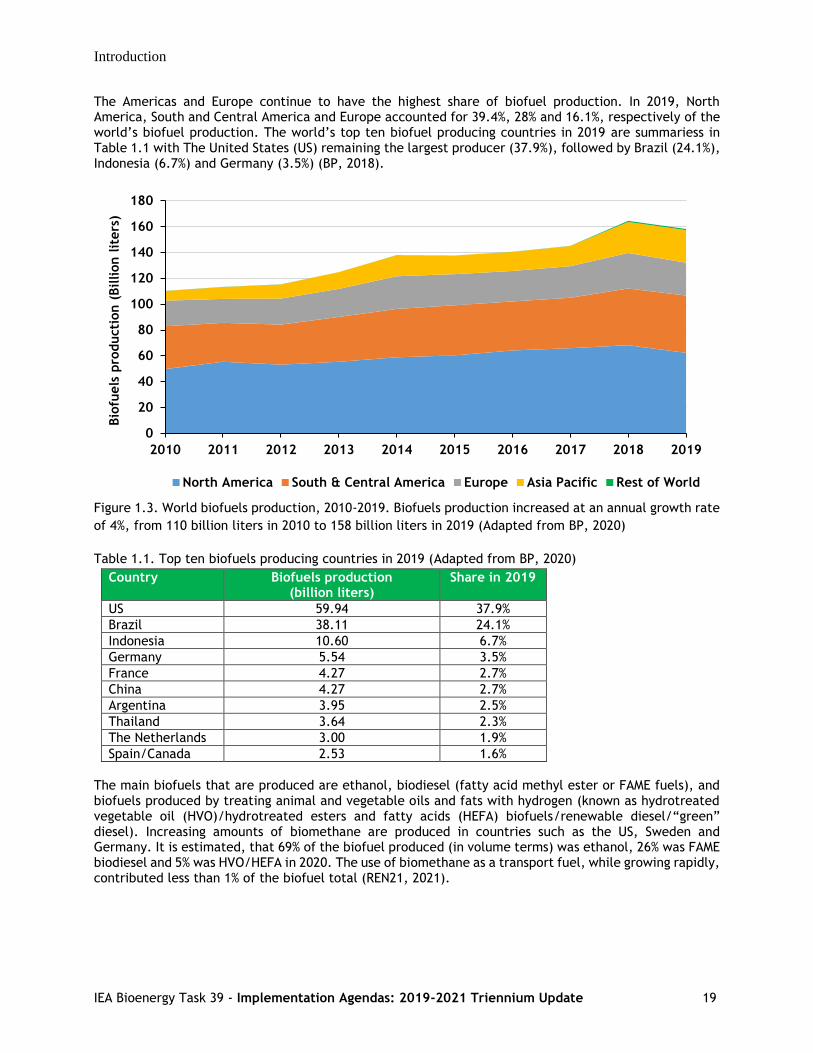
Globally, biofuel production has increased over the last decade, from about 64 million tonnes oil equivalent (Mtoe) produced in 2010 (~110 billion liters) to about 92 Mtoe in 2019 (~158 billion liters) (see Figure 1.3). Biofuel production grew at an average annual rate of 4% over the past decade. The highest annual growth rate was observed in the Asia-Pacific region, which grew at an annual rate of 16% over the period 2010-2019 (BP, 2020).
Introduction
IEA Bioenergy Task 39 - Implementation Agendas: 2019-2021 Triennium Update 19
The Americas and Europe continue to have the highest share of biofuel production. In 2019, North America, South and Central America and Europe accounted for 39.4%, 28% and 16.1%, respectively of the world’s biofuel production. The world’s top ten biofuel producing countries in 2019 are summariess in Table 1.1 with The United States (US) remaining the largest producer (37.9%), followed by Brazil (24.1%), Indonesia (6.7%) and Germany (3.5%) (BP, 2018).
Figure 1.3. World biofuels production, 2010-2019. Biofuels production increased at an annual growth rate
of 4%, from 110 billion liters in 2010 to 158 billion liters in 2019 (Adapted from BP, 2020)
Table 1.1. Top ten biofuels producing countries in 2019 (Adapted from BP, 2020)
Country Biofuels production (billion liters)
Share in 2019
US 59.94 37.9%
Brazil 38.11 24.1%
Indonesia 10.60 6.7%
Germany 5.54 3.5%
France 4.27 2.7%
China 4.27 2.7%
Argentina 3.95 2.5%
Thailand 3.64 2.3%
The Netherlands 3.00 1.9%
Spain/Canada 2.53 1.6%
The main biofuels that are produced are ethanol, biodiesel (fatty acid methyl ester or FAME fuels), and biofuels produced by treating animal and vegetable oils and fats with hydrogen (known as hydrotreated vegetable oil (HVO)/hydrotreated esters and fatty acids (HEFA) biofuels/renewable diesel/“green” diesel). Increasing amounts of biomethane are produced in countries such as the US, Sweden and Germany. It is estimated, that 69% of the biofuel produced (in volume terms) was ethanol, 26% was FAME biodiesel and 5% was HVO/HEFA in 2020. The use of biomethane as a transport fuel, while growing rapidly, contributed less than 1% of the biofuel total (REN21, 2021).
0
20
40
60
80
100
120
140
160
180
2010 2011 2012 2013 2014 2015 2016 2017 2018 2019
Bio
fuels
pro
ducti
on (
Billion l
iters
)
North America South & Central America Europe Asia Pacific Rest of World
Introduction
IEA Bioenergy Task 39 - Implementation Agendas: 2019-2021 Triennium Update 20
1.2. Biofuel policies
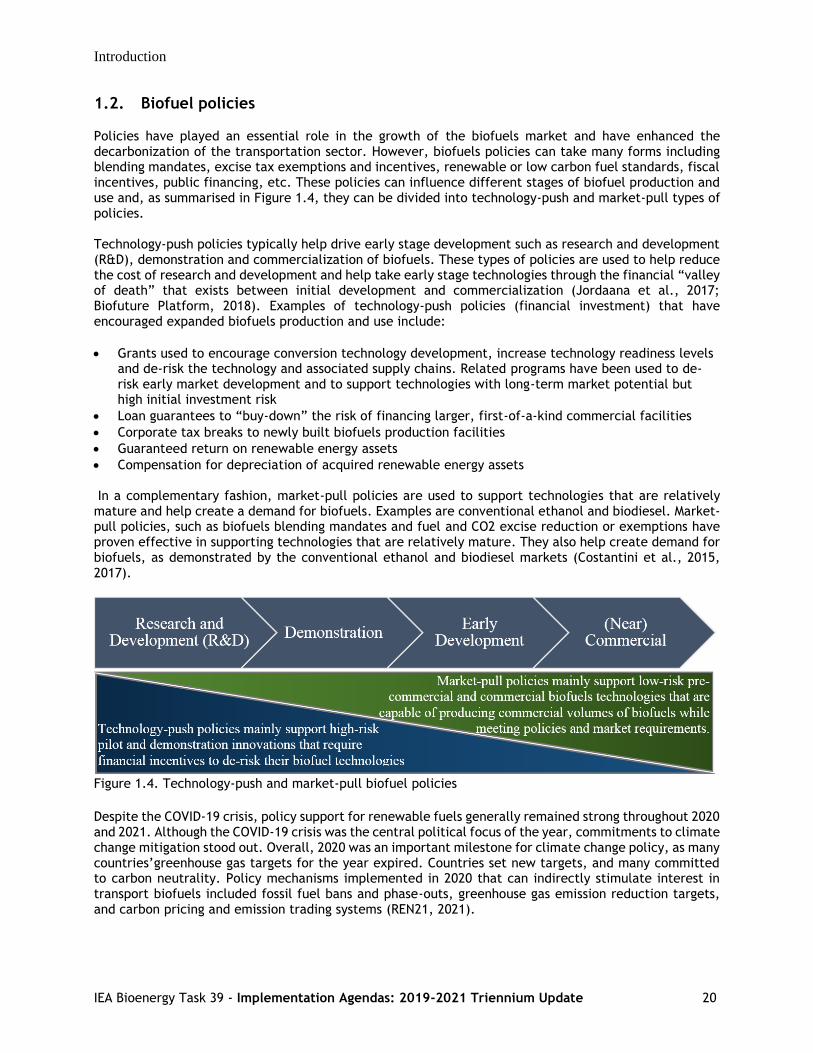
Policies have played an essential role in the growth of the biofuels market and have enhanced the decarbonization of the transportation sector. However, biofuels policies can take many forms including blending mandates, excise tax exemptions and incentives, renewable or low carbon fuel standards, fiscal incentives, public financing, etc. These policies can influence different stages of biofuel production and use and, as summarised in Figure 1.4, they can be divided into technology-push and market-pull types of policies. Technology-push policies typically help drive early stage development such as research and development (R&D), demonstration and commercialization of biofuels. These types of policies are used to help reduce the cost of research and development and help take early stage technologies through the financial “valley of death” that exists between initial development and commercialization (Jordaana et al., 2017; Biofuture Platform, 2018). Examples of technology-push policies (financial investment) that have encouraged expanded biofuels production and use include:
• Grants used to encourage conversion technology development, increase technology readiness levels and de-risk the technology and associated supply chains. Related programs have been used to de-risk early market development and to support technologies with long-term market potential but high initial investment risk
• Loan guarantees to “buy-down” the risk of financing larger, first-of-a-kind commercial facilities
• Corporate tax breaks to newly built biofuels production facilities
• Guaranteed return on renewable energy assets
• Compensation for depreciation of acquired renewable energy assets In a complementary fashion, market-pull policies are used to support technologies that are relatively mature and help create a demand for biofuels. Examples are conventional ethanol and biodiesel. Market-pull policies, such as biofuels blending mandates and fuel and CO2 excise reduction or exemptions have proven effective in supporting technologies that are relatively mature. They also help create demand for biofuels, as demonstrated by the conventional ethanol and biodiesel markets (Costantini et al., 2015, 2017).
Figure 1.4. Technology-push and market-pull biofuel policies
Despite the COVID-19 crisis, policy support for renewable fuels generally remained strong throughout 2020 and 2021. Although the COVID-19 crisis was the central political focus of the year, commitments to climate change mitigation stood out. Overall, 2020 was an important milestone for climate change policy, as many countries’greenhouse gas targets for the year expired. Countries set new targets, and many committed to carbon neutrality. Policy mechanisms implemented in 2020 that can indirectly stimulate interest in transport biofuels included fossil fuel bans and phase-outs, greenhouse gas emission reduction targets, and carbon pricing and emission trading systems (REN21, 2021).

Introduction
IEA Bioenergy Task 39 - Implementation Agendas: 2019-2021 Triennium Update 21
IEA Bioenergy Task 39 has been evaluating the effectiveness of technology-push and market-pull policies in encouraging the production and use of biofuels in member countries including major biofuels producers and users since 2007. This evaluation has been a central part of Task 39’s commitment to facilitate the commercialisation of low-carbon intensive transport biofuels. The report reviews the existing technology-push and market-pull biofuel policies used by the IEA Bioenergy Task 39 member countries to help develop their respective biofuels markets. These countries represent a diverse sample of regions and biofuels producers and consumers and include some of the key producing countries worldwide (e.g., the US, Brazil, the European Union (EU) and Canada). The implementation agendas report covers four main topics: • Compare and contrast developments in transport biofuels production and use in member countries • Focus on biofuel policies and the extent to which these biofuels policies have been effective • Assess the measures taken by member countries to develop or stimulate their respective biofuels
sectors, including incentives and investment in research, development and commercialization • Provide an update on the current status of biofuel sustainability assessments and related discussions
that factor into policy development
The new additions to the update report in the 2019-2021 triennium include: • Additional country chapters for India, Norway and Ireland, the countries that joined Task 39 in the 2019-
2021 triennium • Historical GHG emissions inventory data and the contribution that the transport sector made to the
national GHG emission inventory of each member country • Historical biofuel developments and the related GHG emissions policies in each member country • Existing and emerging sustainability certification schemes for transport biofuels and feedstocks • Compliance costs of biofuel policies (e.g. $/tCO2, $/GJ) • Historical biofuels and feedstocks imports and exports • Co-processing trials/demonstrations at oil refineries
1.3. The methodology used to evaluate the effectiveness of biofuel policies
The implementation agendas report follows a three-step approach to collect and compile biofuels policies and market data from member countries. The initial step involved developing the questionnaire (see Appendix B) that was sent to Task 39 representatives. Member countries/regions included Australia, Austria, Brazil, Canada, Denmark, The European Union (EU), Germany, India, Ireland, Japan, the Netherlands, New Zealand, Norway, South Korea, Sweden and the US. As indicated in Table 1.1, five of these countries, including the US, Brazil, Germany, the Netherlands and Canada are among the top ten biofuels producers globally. Altogether, these countries contributed about two-thirds of the world’s biofuels production in 2019. In summary, the Task 39 member countries represent a diverse set of regions and biofuels producers and consumers and provide a sound basis for gaining an international perspective regarding the impact of biofuel policies on market development. The questionnaire contained three main sections that first asked respondents to identify the main drivers for production and use of transport biofuels in their respective countries. Second, what legislation and incentives were used to encourage production and use of these biofuels (e.g., renewable fuel standards, financial incentives, etc.). Third, what volume of biofuels – both “conventional” and “advanced” biofuels – were produced and used over 2010-2020, and what was their respective market share in the transport sector. Information was also collected on recent and ongoing advanced biofuels projects, including the company/technology developer, project status (i.e., closed, operational or planned), conversion technology (e.g., anaerobic digestion, fermentation, fast pyrolysis, hydrothermal liquefaction, Fischer–Tropsch, etc.) and size (pilot, demonstration, pre-commercial or commercial). The completed questionnaires were then collected and compiled to assess progress in developing and increasing transport biofuels production/use in each country.

Introduction
IEA Bioenergy Task 39 - Implementation Agendas: 2019-2021 Triennium Update 22
In the last step, historical biofuels production and consumption trends over 2010-2020 were used to evaluate the effectiveness of biofuels policies, mainly market-pull policies, to support the development of biofuels markets. In addition, the collected information, on recent and ongoing advanced biofuels projects in each country, was used to assess the impact of technology-push policies on the development and deployment of advanced biofuels technologies. Finally, the biofuels policies that were used in each country were compared and contrasted and their strengths and weaknesses for stimulating biofuels production and use evaluated. The results of biofuels policies comparison and contrast are discussed in the next chapter of this report. The remainder of the report is structured as follows. First, the biofuel policies that were used by each member country were evaluated, with their strengths-and-limitations in stimulating biofuels production and consumption discussed. The biofuels production and use trends over the period of 2010-2020 are also presented to evaluate the effectiveness of biofuel policies in creating a stable environment for the increased production and use of biofuels. Then, Appendix A provides an update on biofuels policy and market development for each member country (country chapters). This is based on the data collected and the information available in the completed questionnaires. Finally, Appendix B provides a copy of the questionnaire.
Sources
Barclays Equity Research, 2021. Biofuels 2.0 – A critical bridge to net zero. BioFuture Platform, 2018. Creating the Biofuture: A report on the state of the low carbon bioeconomy. http://biofutureplatform.org/wp-content/uploads/2018/11/Biofuture-Platform-Report-2018.pdf British Petroleum (BP), 2020. Statistical review of world energy. https://www.bp.com/content/dam/bp/business-sites/en/global/corporate/pdfs/energy-economics/statistical-review/bp-stats-review-2020-full-report.pdf Costantini, V., Crespi, F., Martini, C., Pennacchio, L., 2015. Demand-pull and technology-push public support for eco-innovation: The case of the biofuels sector. Research Policy, 44, 577-595. Costantini V., Crespi F., Palma A., 2017. Characterizing the policy mix and its impact on eco-innovation: a patent analysis of energy-efficient technologies, Research Policy, 46 (4), 799-819. Jordaana, S.M., Romo-Rabagob, E., McLearyb , R., Reidyb , L., Nazaric , J., Herremansb, I.M., 2017. The role of energy technology innovation in reducing greenhouse gas emissions: A case study of Canada. Renewable and Sustainable Energy Reviews, 78, 1397–1409. REN21, 2020. Renewables 2020- Global Status Report. https://www.ren21.net/gsr-2020/chapters/chapter_01/chapter_01/#post REN21, 2020. Renewables 2021- Global Status Report. https://www.ren21.net/wp-content/uploads/2019/05/GSR2021_Full_Report.pdf
Compare-and-contrast transport biofuel policies in member countries
IEA Bioenergy Task 39 - Implementation Agendas: 2019-2021 Triennium Update 23
2. Compare-and-contrast transport biofuel policies in member countries
Summary • Despite a trend towards greater electrification of road transport, biofuels (mainly ethanol and
biodiesel) account for more than 90% of renewable energy in the transport sector and remain central to many national and sub-national renewable transport policy frameworks.
• The issues of energy security, rural development and job creation were identified as the main drivers behind the initial development of biofuels policies in member countries. More recently, policies that try to foster mitigation of climate change, such as reducing the carbon intensity of the transport fuels, have become an increasing focus in biofuels-related policy development.
• In the vast majority of member countries, biofuel policies have enhanced biofuels market growth.
• Biofuel blending mandates remain one of the most widely adopted mechanisms for increasing biofuels use in the transport sector. However, biofuel mandates alone have not always provided sufficiently strong incentives to spur producers to continue to innovate and reduce the carbon intensity of the biofuels they produce.
• Fuel excise tax reduction/exemption/credit-based policies have mainly been used to make the production of biofuels economically competitive with fossil fuels in the short-to-mid-term. However, as biofuel production is becoming more cost efficient and if the price of oil gradually rises, the fuel excise reduction/exemption incentive is either modified or lifted.
• As well as encouraging on-going more efficient production of conventional biofuels, LCFS-based policies have also stimulated the development and production of lower carbon intensity drop-in and advanced biofuels by increasing their market values.
• As LCFS type policies become more common in increasing numbers of jurisdictions, the carbon intensity of current and emerging biofuels is expected to decrease.
• Despite the predominance of market-pull policies, technology-push policies have been successfully used to encourage research, development and demonstration, particularly for advanced biofuels.
• A combination of technology-push and demand-pull policies will both be needed to increase the rate of introduction and diffusion of advanced biofuel technologies. The countries that have achieved the most success in growing the production and use of transport biofuels have used a mixture of market-pull and technology-push policies.
• Most of the policies that have been used to promote renewable energy for transport have primarily focussed on road transport at a national level. Other important transport sectors such as aviation and shipping have received considerably less policy attention despite being significant energy consumers and carbon emitters.
• Regulators need to create a framework that mandates the use of low carbon fuels and incentivize production of biofuels for use in the aviation and shipping sectors.
• Despite considerable progress being made in the technical aspects of advanced biofuels production, it is widely recognized that the right policies will be needed to help expand commercialization.
• Sustainability requirements are increasingly being incorporated into biofuels policies, with LCFS-type policies that incentivize reductions in carbon intensity and assure sustainability increasingly being used

Compare-and-contrast transport biofuel policies in member countries
IEA Bioenergy Task 39 - Implementation Agendas: 2019-2021 Triennium Update 24
2.1. Policy landscape on a global scale
Although the global transport sector has the second highest share of total final energy consumption, it remains the sector with the lowest penetration of renewables and continues to rely heavily on fossil fuels (IEA, 2019). Although the adoption of renewable energy policies for transport has not been as rapid as in the power sector, policy makers increasingly are exploring expanding the use of renewables in the transport sector as a means to improve local air pollution and meet greenhouse gas emissions targets (SLOCAT Partnership on Sustainable, 2018). Policies that support the production and use of liquid and gaseous biofuels for transport are the most common type of direct renewable energy policy in the sector, and biofuels continue to make the largest contribution of renewable energy to transport. Most biofuels policy have targeted light-duty vehicles (REN21, 2021). Despite a trend towards greater electrification of road transport, biofuels (mainly ethanol and biodiesel) account for more than 90% of renewable energy in the transport sector and remain central to many national and sub-national renewable transport policy frameworks (IEA, 2019). Policies supporting the production or use of biofuels include blending mandates, financial incentives, public procurement, and support for fuelling and blending infrastructure and advanced biofuels. Biofuels continued to receive policy attention as a means to foster wider use of renewables in the sector, to support energy security and economic development, and because biofuels can be used in existing internal combustion engine vehicles (IRENA, IEA and REN21, 2019). Biofuel blending mandates remained the most widely used policies for ensuring renewable content in road transport. Overall, 65 countries had blending mandates as of the end of 2020. The bulk of mandates continue to come from the EU. Fourteen countries in the Americas have mandates or targets in place or under consideration, 12 in Asia Pacific, 11 in Africa and the Indian Ocean and 4 from non-EU countries of Europe (BiofuelsDigest, 2020). While no new countries added biofuel blending mandates during 2020, some that already had a policy either added new mandates or targets or strengthened existing ones. Early in 2020, Brazil increased its minimum biodiesel blend from 11% to 12%. Belgium increased its biofuel blending mandate from 8.5% to 9.55%, while Cyprus raised its mandate from 5% to 7.3%. Indonesia increased its biofuel blending mandate to 30%, up from 20%. At the sub-national level, in Canada, Ontario and Manitoba provinces raised their ethanol blending mandate (Ontario from 5% to 10% and Manitoba from 8.5% to 9.25%) (REN21, 2021). By the end of 2020, 11 countries (and the EU) had targets in place for its own definition of “advanced biofuels” (up from 10 countries in 2019), and 17 countries had mandates in place for advanced biofuels. Only one new country, Latvia, adopted an advanced biofuels target in 2020: the country’s national energy and climate plan (NECP) included a target of 3.5% advanced biofuels and biogas in the transport sector’s final energy consumption by 2030 (REN21, 2021). Figure 2.1 depicts national and sub-national renewable transport mandates, as of end-2019.
Figure 2.1. National and sub-national renewable transport mandates, as of end-2019 (Source: REN21
Policy Database, REN21, 2021)

Compare-and-contrast transport biofuel policies in member countries
IEA Bioenergy Task 39 - Implementation Agendas: 2019-2021 Triennium Update 25
In this chapter, biofuels policies developed and implemented in IEA Bioenergy Task 39’s member countries are summarized and compared and contrasted to evaluate their effectiveness in spurring the production and use of biofuels to decarbonise the transport sector. This assessment is based on information obtained from IEA Bioenergy Task 39’s 16 member countries through a questionnaire (see Appendix B) and Country Chapters (see Appendix A), as well as recent relevant publications. More details on the methodology used in this report to evaluate the effectiveness of biofuel policies in IEA Bioenergy Task 39’s member countries are discussed in Chapter 1.
2.2. Main drivers for biofuels policy development in Task 39 member countries
The issues of energy security, rural development and job creation were identified as the main drivers behind the initial development of biofuels policies in member countries. More recently, policies that try to foster mitigation of climate change, such as reducing the carbon intensity of the transport fuels, have become an increasing focus in biofuels-related policy development. Energy security and rural development have been the primary drivers for developing policies in countries such as the US, Brazil, and India where substantial commercial production of feedstocks such as corn, oilseeds and sugarcane are produced annually. In other countries like EU member states and Canada, decarbonization of transport sector and climate change mitigation has been the primary driver, and to a lesser degree rural development. In Japan, where there is little availability of affordable feedstocks for biofuel production as well as large concerns about security of food supply, GHG emission reduction has been the main driver for using biofuels. In South Korea, becoming a leader in the development and deployment of clean energy technologies, including green technology development like biofuels, and making this a new growth engine to improve the quality of life, has influenced the development of biofuels policies. In New Zealand and Australia, all of the main drivers for global growth of biofuels, i.e., environmental benefits, rural economic development and security of fuel supply have been important for pushing policy to support more biofuels production and use.
2.3. Biofuel policies in Task 39’s member countries
As discussed in Country Chapters (see Appendix A), Task 39’s member countries have developed and implemented many forms of biofuel policies to encourage the production and use of biofuels to decarbonise the transport sector, in particular road transportation. As indicated in Table 1.1 in Chapter 1, five of Task 39’s member countries, including the US, Brazil, Germany, the Netherlands and Canada are among the top ten biofuels producing countries globally. Altogether, these countries contributed about two-thirds of the world’s biofuels production in 2019. Most of member countries have used a combination of market-pull and technology-push policies to propel the production and use of biofuels at different stages of technology and market development. Table 2.1 summarizes the technology-push and market-pull policies used by member countries. The technology-push policies provide direct funding to the technology development at the pilot, demonstration and pre-commercialization scales to de-risk the technology development and deployment. In a complementary fashion, market-pull policies helped increase market penetration and the cost-competitiveness of biofuels. Market-pull policies usually support biofuels that are proven and follow close-to-the-market technology pathways.
2.3.1. Biofuel blending mandates
As indicated in Table 2.1, biofuel blending mandates have been the most widely adopted policies used to increase renewable fuel use in the transport sector. Biofuels blending mandates typically require minimum blending of either ethanol in gasoline or diesel biofuels (FAME biodiesel and renewable diesel) in diesel, with blending levels usually based on volume. In North America, biofuels mandates are typically implemented at both the national/federal and state/provincial levels. In addition to blending mandates for conventional biofuels, the US, Austria, Denmark, Sweden, and the Netherlands, have developed or are developing blending mandates for “advanced” biofuels, although the definition of advanced biofuels

Compare-and-contrast transport biofuel policies in member countries
IEA Bioenergy Task 39 - Implementation Agendas: 2019-2021 Triennium Update 26
is diffenret among regions. Table 2.2 shows the production capacity and use of biofuels in member countries with blending mandates. As shown from Figure 2.3 to Figure 2.17, blending mandates have helped establish biofuels markets in many countries, primarily by shielding biofuels from low oil prices and facilitating the market entry. However, blending mandates alone have not been able to grow or even maintain some biofuel markets. The reasons why mandates have not worked well in some jurisdictions are varied and include a lack of feedstock (e.g., South Korea), high feedstock costs due to competing uses (e.g., Australia), shortage of infrastructure and food security and sustainability concerns such as indirect land use changes (ILUC) (e.g., Japan). While biofuel mandates have been shown to reduce transport sector GHG emissions, mandated biofuel obligations are typically based on a biofuel’s volume or energy content rather than its decarbonisation potential. In other words, biofuel mandates alone have not always provided sufficiently strong incentives to spur producers to continue to innovate to reduce the carbon intensity of the biofuels they produce.
2.3.2. Fuel excise tax reductions/exemptions/credits
Other policies that have been successfully used to support increased biofuel production and use include fuel excise tax reductions or exemptions. Fuel excise tax reduction/exemption/credit-based policies have mainly been used to make the production of biofuels economically competitive with fossil fuels in the short-to-mid-term. These types of policies have been used in countries including Australia, Austria, Brazil, Denmark, Ireland, Japan, New Zealand, Norway, Sweden and the US. In particular, tax incentives have been successfully used to spur biofuel production and reduce biofuel prices at the pumps in the US, Brazil and Sweden. In the US, blenders tax credits for biodiesel and renewable diesel have enabled biodiesel and renewable diesel facilities to produce a price-competitive biofuels that can be blended with diesel in the US market. However, fuel excise reduction/exemption-based policies alone have not led to biofuels market growth, with countries like Australia and New Zealand achieving only small levels of biofuels production and use despite the availability of such tax incentives. In these two countries, there are no national mandates for biofuels blending. Tax incentives and subsidies have also been used in countries such as the US, Norway and India to encourage greater production of potential biomass feedstocks such as dedicated energy crops (e.g., switchgrass, carinata or willow) and their supply chains to provide sufficient feedstocks to support future production of advanced biofuels. It was also hoped that this type of policy might stimulate the development of entire biofuel supply chains, from feedstock cultivation through to biofuel production and end use, making it more likely that future usage and emissions reductions targets will be achieved. However, among farmers and crop growers, the uptake rate for starting to cultivate dedicated energy crops has been low due to slow progress demonstrating economically advanced biofuel production technologies, and thus little market pull for using such energy crops for biofuels production. Fuel excise reduction/exemption/credit incentives are often reduced or eliminated as biofuels production matures and becomes more cost competitive. For example, the biodiesel excise tax in Australia has been increasing since 2016 however it will be eliminated once the biodiesel price reaches 50% of the fossil diesel price. Similarly, Australia’s ethanol excise tax has increased since its introduction and is capped at a lower price than biodiesel due to ethanol’s lower energy content. Although South Korea originally used tax exemptions to encourage biodiesel development, this policy was revisited in 2015 and replaced by a biodiesel blending mandate as the original policy had resulted in a $200 million tax deficit for the government. Sweden’s initial full tax exemption for biofuels was also quickly changed due to EU concerns that it unfairly subsided some fuels such as ethanol (E85) and Rapeseed Methyl Esters (RME or FAME biodiesel).

Compare-and-contrast transport biofuel policies in member countries
IEA Bioenergy Task 39 - Implementation Agendas: 2019-2021 Triennium Update 27
Table 2.1. Summary of biofuel policies and their effectiveness on the biofuels markets in Task 39’s member countries
Country Market-pull policies Technology push policies Effectiveness of the biofuel policies
Australia Biofuels mandates - Biofuels are not currently included in any
National Renewables Policy and whilst there is a federal biofuels incentive scheme, there is no federal biofuels policy and this is left to the States.
- New South Wales (NSW): 5% biodiesel and 6% ethanol (volume)
- Queensland: 0.5% biodiesel and 4% ethanol (volume)
- There are currently no policies or incentives in place to promote aviation or marine biofuels.
- Currently, there are no specific policies promoting the use of advanced biofuels and there is limited production of advanced biofuels in Australia
Fuel excise tax reduction/exemption - Producer grant scheme (fuel excise reduction) for ethanol and biodiesel
- Development of a A$ one billion bioeconomy in Queensland
- Rebate on R&D expenses - Grants for R&D programs and early
stage commercialisation - A$ 10 billion fund designed to facilitate
and increase flows of finance into the clean energy sector
- A$ 200 million bioenergy fund
- NSW mandate despite being in place since 2007 is ineffective as the mandate is not enforced due to lack of feedstock and biofuels supply
- In Queensland, the launch of the mandate was accompanied by a successful advertising campaign explaining the benefits of using ethanol
- The current production of ethanol and biodiesel in Australia constitutes only about 1% of the overall national consumption of petrol and diesel.
- Development of a few pilot and demonstration-scale advanced biofuels technologies
Austria Biofuels mandates - 6.3% biodiesel, 3.4% ethanol and 5.75%
biofuels (energy content) - 0.2% advanced biofuels target by 2022 (energy content) (REDII)
Fuel excise tax reduction/exemption - Tax concessions for fuels with a biofuel
share of at least 4.4% (energy content) - Pure biofuels exempted from mineral oil tax Other policies - Reduced license fees, tax credits for purchase of flex-fuel vehicles or natural gas vehicles for biofuels consumers - There are no specific policies promoting aviation and marine biofuels in the country. However, there is the intention to promote aviation biofuels.
- Currently, financial supports and funding is mainly available for electromobility, not for other alternative fuel vehicles.
- Funding available for purchasing CNG driven cars; for the construction of plants producing sustainable liquid or gaseous fuels from non-food feedstock
- € 9 million under the Mobility for the Future program
- The energetic substitution of biofuels consumed in road transport in Austria was 6.25% in 2018.
- On average, since 2006 production and use of ethanol have increased at an annual rate of 11% and 5%, respectively
- On average, since 2006 production and use of biodiesel have increased at an annual rate of 60% and 21%, respectively
- Since 2010, blending mandates have not changed and production and use of biofuels have not changed significantly.
- Biofuel produced from feedstocks with low carbon intensity in Austria find better markets in countries such as

Compare-and-contrast transport biofuel policies in member countries
IEA Bioenergy Task 39 - Implementation Agendas: 2019-2021 Triennium Update 28
Germany and Sweden where a GHG reduction quota is obligatory
- Several R&D projects on advanced biofuels have been developed at pilot and demonstration scales although only one is currently operational.
Country Market-pull policies Technology push policies Effectiveness of the biofuel policies
Brazil Biofuels mandates - 27% ethanol and 12% biodiesel (volume in 2020) - 100% hydrous ethanol is also marketed in
all gas stations in Brazil. Fuel excise tax reduction/exemption - Tax incentives for biofuel producers,
blenders and users including ethanol-flex fuel vehicles and ethanol fuel and federal tax exemptions and incentives for biodiesel production
- There are no carbon tax or emission trading (cap-and-trade) schemes in Brazil
Tariff on imported ethanol - Allowing 750 million liters of ethanol to
enter duty free, with any volume above this being subject to a 20% tariff in 2020
- Fixed 14% import tariff applied to biodiesel, and the import tariff for petroleum oils containing biodiesel up to and including B30 is zero
Fiscal incentives - Regional Producer Subsidy for sugarcane
producers Low Carbon Fuel Standard - Ongoing development/implementation of RenovaBio, a national LCFS-type policy
- Specific credit lines for the sugar, ethanol, and bioenergy industries to fund investments in sugarcane production, expansion of industrial production capacity for sugar and ethanol, cogeneration, logistics, and multimodal transportation
- Financial incentives for feedstock development and to renew crop plantings
- Financial instruments to encourage the production of advanced biofuels: a) credit in special financing lines; b) equity participation; c) non-reimbursable funds for cooperative projects between companies and the R&D institution; and d) non-refundable economic support (grants) for companies, defined depending on the case (amount, technological risk, involved institutions, etc.)
- In addition to conventional biofuels, these programs promote the production of advanced and drop-in biofuels for long-distance transport sectors such as aviation
- On average, since 2010 production of ethanol and biodiesel has increased at an annual rate of 3% and 11%, respectively
- On average, since 2010 use of ethanol and biodiesel has increased at an annual rate of 5% and 11%, respectively
- Two commercial and one demonstration cellulosic ethanol plants
- Trials carried out on co-processing vegetable oils (soy oil) with petroleum feedstocks in refinery hydro-processors in Petrobras petroleum refineries
Canada Biofuels mandates - Federal mandates: 5% ethanol and 2% biodiesel (volume)
- Five provinces (British Columbia, Alberta, Saskatchewan, Manitoba and Ontario) have established a blending requirement of 5%
- Various types of federal and provincial government supports provided for biofuels, spanning across all stages of the biorefining process (e.g. grants and low-interest loans, accelerated
- Biofuel production capacity has grown significantly over the last decade. Ethanol production has been nearly constant since 2011, edging up from 1,700 million liters in 2011 to 1,750 million liters in 2018. Canadian

Compare-and-contrast transport biofuel policies in member countries
IEA Bioenergy Task 39 - Implementation Agendas: 2019-2021 Triennium Update 29
to 10% for ethanol and 2% to 4% for biodiesel (volume)
Low Carbon Fuel Standard - British Columbia’s Low Carbon Fuel
Standard - Ongoing development of Clean Fuel
Standard, a national LCFS-type policy Other policies - Federal Greenhouse Gas Pollution Pricing - British Columbia Carbon Tax and Quebec’s cap-and-trade carbon exchange program
depreciation, grants for storage and distribution infrastructure)
- A $CAD 2 billion Low Carbon Economy Fund supports projects that will generate clean growth and reduce GHG emissions towards meeting or exceeding commitments under the Paris Agreement
- In 2021, the federal government introduced further supports for zero emission technologies and fuels in its 2021 fiscal budget: - An additional $5 billion in funding for the Net Zero Accelerator under the Strategic Innovation Fund - $67 million to implement the Clean Fuels Standard - Commitment on government procurement of sustainable aviation fuel and sustainable marine fuel - Preferential tax treatment (50% income tax reduction) for producers of zero emission fuels, including green hydrogen
biodiesel production capacity has trended upward but not dramatically.
- The volume of ethanol consumed annually has increased from roughly 1,700 million litres in 2010 to 3,034 million litres in 2018.
- The volume of biodiesel consumed annually has also increased substantially since 2010, rising from roughly 123 million litres in 2010 to 368 million litres in 2018.
- Renewable diesel is blended into diesel in similar volumes as biodiesel, with consumption calculated at 343 million liters in 2018 but there is no commercial production of renewable diesel in Canada
- Three commercial advanced biofuels facilities
- Several R&D projects on advanced biofuels have been developed at pilot and demonstration scales
- Trials carried out on co-processing of lipid feedstocks with petroleum feedstocks in one oil refinery
Country Market-pull policies Technology push policies Effectiveness of the biofuel policies
Denmark Biofuels mandates - 5.75% biofuels (both ethanol and biodiesel) (volume)
- 0.15% for advanced biofuels by 2020. In 2021, the mandate is planned to be increased to 0.75 %. Fuel excise tax reduction/exemption - CO2 excise exemptions for biofuels. There is a CO2 tax of 0.42 €/L of gasoline and 0.58 €/L of diesel, with decreased tax on biofuel blends.
- There are funding programs for R&D but no separate programs for biofuels
- Energy research funding has been decreasing in recent years, but since 2019 funding has yet again been increasing with the most significant funding agencies being the Innovation Fund Denmark
- Allocation of funds to promote production of advanced biofuels. Specific conditions have not yet been negotiated, however funding around € 2.6 million annually is expected to be made available for years 2019-2025
- The use of bioethanol and biodiesel was 4.5% of total road transport in 2019.
- The annual production of biodiesel has fairly remained constant since 2010.
- There is no production of ethanol in Denmark
- Several R&D projects on advanced biofuels have been developed at pilot and demonstration scales
- There is a large support for biogas production and use in Denmark. The biogas production has increased by 40-45% during 2016- 2017, compared to

Compare-and-contrast transport biofuel policies in member countries
IEA Bioenergy Task 39 - Implementation Agendas: 2019-2021 Triennium Update 30
- In 2020, the government granted one billion dkk (134 million €) more for green research - in addition to what is being granted normally
2015 due to economical favorable conditions.
Country Market-pull policies Technology push policies Effectiveness of the biofuel policies
Germany Biofuels mandates - 6.25% biofuels as energy based quota from 2010-2014
- GHG mitigation quota of 3.5%, 4% and 6% in the fuel mix for the entire fuel sector from 2015, 2017 and 2020 onwards, respectively.
Fuel excise tax reduction/exemption - There is no tax relief for FAME biodiesel,
HVO/HEFA fuels, vegetable oils and ethanol
- The fuel tax for CNG and biomethane is € 0.0139/kWh until 2023
Other policies - A carbon tax is indirectly applied via CO2
tax for passenger cars - There are no specific policies promoting
aviation biofuels.
- No financial incentives are available for advanced /new biofuels, making it quite difficult to enter the fuel market, even with the GHG quota.
- However, there are funding programs for RD&D that are addressing advanced fuels and- to a minor extent - also biofuels. In general, there has been a decrease in funded projects related to biofuels.
- There are various funding programs for R&D&D with emphasis on the use of diversified raw materials for various synthetic fuels and fuels components, decentralized-centralized concepts along value chains, promoting Germany’s role as technology developer, and integration of renewable fuels based on biomass and electricity into the energy transition.
- The topic of so-called PtX (ie., PtG or PtL fuels or chemicals, also called electrofuels) is gaining an increasing interest, especially in context of the German energy transition and increasing shares of renewable electricity.
- Current policies do not support an increase in production capacities for biofuels or advanced biofuels in Germany as the market development shows.
- On average, since 2007 total production and use of ethanol has increased at an annual rate of 7% and 10%, respectively
- The annual production of biodiesel has fairly remained constant since 2007
- Several R&D projects on advanced biofuels have been developed at pilot and demonstration scales.
- Despite the target for advanced biofuels and the ongoing debate about EU RED II, for Germany, it is likely that due to the higher GHG reduction quota of 70% fuel specific GHG mitigation potential on average, the amount of biofuels could slightly increase but will be limited by blending levels with fossil fuels (e.g., B7, E10 etc.). The framework for increasing use of biomethane as transport fuel remains uncertain.
India Biofuels mandates - 5% ethanol blending in gasoline is
mandatory and the obligated parties can add ethanol in gasoline up to 10%.
- Biodiesel blending is not mandatory in India yet.
Fuel excise tax reduction/exemption
- Financial support for feedstock development and improved biofuel production technology, with a major focus on cellulosic (so-called second generation) ethanol.
- Promoting cutting edge research and innovation in biofuels production and use for the last eight years through
- India’s biofuels market is relatively nascent, despite having a zero excise duty and a zero VAT on biofuels in 5 states since 2007
- In 2019, an estimated 3 billion liters (all time record) of ethanol was produced, 55% higher than in 2017

Compare-and-contrast transport biofuel policies in member countries
IEA Bioenergy Task 39 - Implementation Agendas: 2019-2021 Triennium Update 31
- No excise tax exemption/reductions for ethanol and biodiesel
- A recent change in tax regimes threatens to make biodiesel substantially more expensive than regular diesel, as it envisages an additional 12% Goods and Services Tax (GST) on biodiesel.
Other policies - In 2018, a new “National Policy on
Biofuels” was announced that expanded the scope of feedstocks to be used for biofuel production and targeted achieving 20% ethanol blending in petrol and 5% biodiesel blending in diesel by 2030.
- Import of biofuels is not allowed in India. Export policy of biofuels was revised in 2018 from free to restricted as per the national policy on biofuels 2018.
- Aviation biofuels are covered in the National policy on Biofuels. However, there is no specific policy for marine biofuels.
- Joint ventures and foreign investments in the biofuel sector are encouraged
- There are no market-based policies in India such as Low Carbon Fuel Standard, Carbon tax and Emissions Trading (cap-and-trade) to encourage the production and use of biofuels.
Department of Biotechnology, Center of Excellence, fellowships, training and international collaboration.
- Over US $30 million investment in biofuel R&D and cellulosic ethanol technology
- India has currently combined annual production capacity of 650 million liters of biodiesel per year but the actual use was 82.1 million liters in 2019.
- There are two operational advanced biofuel facilities; one pilot and one demonstration plant - with a combined production capacity of 1.75 million liters per year.
Country Market-pull policies Technology push policies Effectiveness of the biofuel policies
Ireland Biofuels mandates - The EU’s RED is one of the main drivers for
current biofuels policy in Ireland. - To help Ireland meet the renewable energy
transport target of the RED, 12.359% (by volume) of the gasoline and diesel placed on the road transport market in Ireland must be produced from renewable sources, e.g. bioethanol and biodiesel. The
- By a considerable margin, biofuel is the dominant source of renewable energy in transport in Ireland. Biodiesel in particular is relied upon because the road transport market is dominated by a diesel fleet, and, to a lesser extent, because Ireland’s fuel suppliers continue to supply E5 to the gasoline fleet and have not moved to supply E10.

Compare-and-contrast transport biofuel policies in member countries
IEA Bioenergy Task 39 - Implementation Agendas: 2019-2021 Triennium Update 32
obligation was increased to this level for 2020, having previously been 11.111%.
- In March 2021, the Irish government published the new “Climate Action and Low Carbon Development
Carbon excise tax reduction/exemption - The carbon tax was introduced in Ireland in
2010 and was based on a charge of €10 per tonne of CO2 emitted. It has increased steadily over the years and was increased to €33.50 per tonne in Ireland’s most recent national budget. Biofuels, which are counted as having zero tailpipe emissions, are not liable for the carbon component of the mineral oil tax.
Other policies - Awarding certificates for biofuel that has been demonstrated to be sustainable. One certificate is awarded for every litre of sustainable biofuel and two certificates are awarded where it can be demonstrated that the biofuel was manufactured from a waste or residue.
- In the transport sector, more than 98% of the renewable energy consumed came from biofuels; almost 88% was biodiesel and 10% biogasoline (i.e. bioethanol).
-There has been a relatively consistent growth in the use of liquid biofuels, in particular biodiesel, in the Irish road transport sector
- Ireland continues to rely heavily on imports, importing 82% of the liquid biofuels it uses in transport
Country Market-pull policies Technology push policies Effectiveness of the biofuel policies
Japan Biofuels mandates - 824 million liter bioethanol mandate
(volume); no blending mandate for biodiesel
- Introducing 10 million liters (crude oil equivalent) of second generation biofuels (volume)
Other policies - No diesel oil delivery tax for B100 - A special tax incentive for the consumption
of ethanol until March 2022 - Import of bio-ETBE encouraged through a zero tariff - The Government plans to introduce biojet fuel for commercial flights within 2021
- Support the establishment of biofuel manufacturing technology and tax breaks and financial assistance to biofuel producers and farmers producing feedstock
- Several programs and incentives to encourage the use of biofuels
- A major focus of research projects is on cellulosic and algal feedstocks and conversion technologies to produce biofuels at commercial scale in a sustainable way
- Limited production capacity of ethanol/ETBE
- In 2019, Japan imported 823 million liters of ethanol for transportation, consisting of 817 million liters of ethanol imported as ETBE and 61 million liters of ethanol to be used for domestic ETBE production. - Ethanol is largely imported from Brazil - Japan’s biodiesel market is extremely limited, meeting just 0.04% of national on-road transportation demand for diesel fuel, and there is no renewable diesel market

Compare-and-contrast transport biofuel policies in member countries
IEA Bioenergy Task 39 - Implementation Agendas: 2019-2021 Triennium Update 33
- As the demand for biodiesel in Japan is very limited, biodiesel plays virtually no role in meeting the biofuels use goal.
- Biofuels continue to be supported in Japan, but with a focus on next generation technologies based on feedstocks that do not compete with food, and the development of algal-based biofuels.
- Few ongoing pilot-scale advanced biofuels projects
Country Market-pull policies Technology push policies Effectiveness of the biofuel policies
Netherlands Biofuels mandates - There is 16.4% biofuels mandate (both
ethanol and biodiesel) mainly for road transport in energy content in 2020.
- A sub-target for the use of advanced biofuels at 1.0% level in 2020 (including double counting)
- National implementation of the RED2 will be effective from 2022, the current regulation will be extended for 2021 with a mandate level of 17.5% and a sub-target for advanced bioduels of 0.6%.
- An mandate for SAF in aviation is in preparation, until then an opt-in system for aviation biofuels can be used to generate tradable units, as a contribution to the mandate for road transport
Other policies - There is no excise duty reduction for
biofuels in the Netherlands. - Tax incentives for investment in renewable
energy projects - No financial incentives (e.g. subsidies,
credits, incentives) are provided for biofuel uptake. The blending of biofuels is encouraged with the quota obligation for fuel suppliers. Support of production of
- Investment in the expansion of refueling pump infrastructure for alternative fuels including biofuels
- On average, since 2006 total production and use of ethanol have increased at an annual rate of 30% and 30%, respectively
- On average, since 2006 total production and use of biodiesel have increased at an annual rate of 62% and 90%, respectively
- An increasing portion of the biofuels on the Dutch transport market is produced from waste streams; in 2019 the share of these feedstocks rose to 81%, with used cooking oil accounting for a share of 55%. It is attractive to use waste based biofuels because their energy content may be counted twice to achieving the targets.
- There is one renewable diesel (HVO) plant operated by Neste with an annual capacity around 1 Mton (1.2 billion liters) and one BioMCN plant producing 440 kton biomethanol
- Most subsidies and funding programs support the development and deployment of renewable gas production and refueling pumps for natural gas, and high biofuels blending rates of E85, HVO100 and B30.

Compare-and-contrast transport biofuel policies in member countries
IEA Bioenergy Task 39 - Implementation Agendas: 2019-2021 Triennium Update 34
advanced biofuels for the Dutch market, is currently work in progress.
Country Market-pull policies Technology push policies Effectiveness of the biofuel policies
New Zealand
Biofuels mandates - No mandate on biofuel use or any biofuel
volume obligations Fuel excise tax reduction/exemption - Fuel excise exemption for ethanol
(including imported ethanol) - No excise exemption for biodiesel or other
biofuels Other policies - Emissions trading scheme - There are currently no specific policies
promoting advanced biofuels deployment - There are no investment subsidies supporting biofuel deployment.
- A limited amount of government funds to support the development and deployment of biofuels markets
- Due to a lack of policy support, biofuels production in New Zealand has been very limited - Sporadic production of ethanol and biodiesel due to the lack of biofuel mandates
- No production of advanced biofuels at demonstration or pre-commercial scales
- Work is also underway to define best options to meet Paris GHG reduction targets such as buying international credits, emissions reductions and forest plantations.
Norway Biofuels mandates - The 2021 blending mandate is 24.5 % for
biodiesel, aiming for 40% in 2030. The blending obligation for bioethanol in gasoline has been 4% since 2017.
- Mandatory blend-in of 0.5% biofuel in jet fuel started in 2018 (first worldwide).
- The National Climate Plan 2021-2030, approved by the Norwegian Parliament April 14th 2021, prolongs the blend-in mandate as the primary tool for biofuels till 2030.
CO2 excise tax reduction/exemption - No CO2 tax for biofuels; The total tax for biodiesel is about 30% lower than for fossil diesel, and about 60% lower for bioethanol compared to gasoline.
- There are public grants available for developing biofuel supply chains and production plants.
- Norwegian domestic production of biofuels is low and constitutes about 1% of the consumption.
- The voluntary biofuel consumption above the blending mandate for road transportation was about 4% of total fuel consumption in 2019.
- There is a growing commercial interest for utilizing forest residues as feedstock for biofuels. Two plants are in progress for pilot stage.
- Norway has 40 operating biogas plants for processing of municipal, food and industrial organic wastes and the number is growing. Of these, 10 plants produce biogas for transportation, mainly for buses and trucks.
South Korea Biofuels mandates - The only biofuels with blending mandate is
biodiesel currently at 3% (B3) - There are no market based- mechanisms
such as Low Carbon Fuel Standard (LCFS),
- Funding programs are available to support R&D for projects such as ethanol and biodiesel from algae; however, there is no financial
- The share of biofuels for transport is modest at 2.5%.
- On average, since 2007 production and use of biodiesel have increased at an
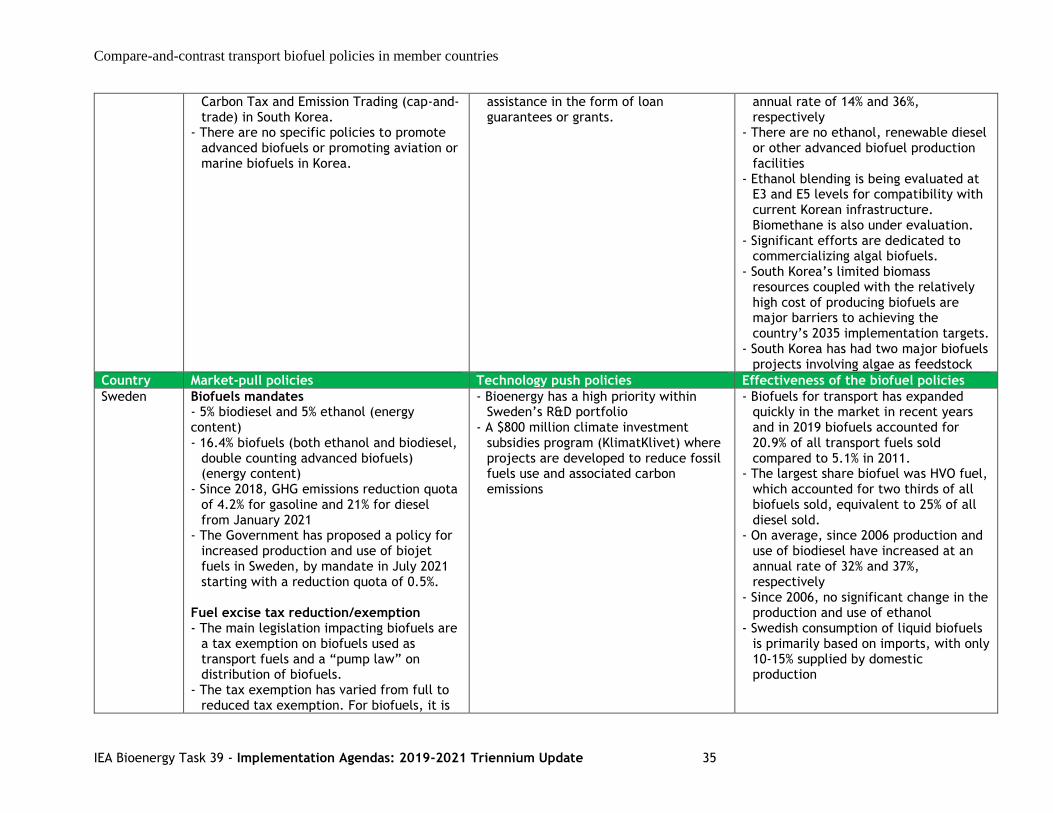
Compare-and-contrast transport biofuel policies in member countries
IEA Bioenergy Task 39 - Implementation Agendas: 2019-2021 Triennium Update 35
Carbon Tax and Emission Trading (cap-and-trade) in South Korea.
- There are no specific policies to promote advanced biofuels or promoting aviation or marine biofuels in Korea.
assistance in the form of loan guarantees or grants.
annual rate of 14% and 36%, respectively
- There are no ethanol, renewable diesel or other advanced biofuel production facilities
- Ethanol blending is being evaluated at E3 and E5 levels for compatibility with current Korean infrastructure. Biomethane is also under evaluation.
- Significant efforts are dedicated to commercializing algal biofuels.
- South Korea’s limited biomass resources coupled with the relatively high cost of producing biofuels are major barriers to achieving the country’s 2035 implementation targets.
- South Korea has had two major biofuels projects involving algae as feedstock
Country Market-pull policies Technology push policies Effectiveness of the biofuel policies
Sweden Biofuels mandates - 5% biodiesel and 5% ethanol (energy content) - 16.4% biofuels (both ethanol and biodiesel,
double counting advanced biofuels) (energy content)
- Since 2018, GHG emissions reduction quota of 4.2% for gasoline and 21% for diesel from January 2021
- The Government has proposed a policy for increased production and use of biojet fuels in Sweden, by mandate in July 2021 starting with a reduction quota of 0.5%.
Fuel excise tax reduction/exemption - The main legislation impacting biofuels are
a tax exemption on biofuels used as transport fuels and a “pump law” on distribution of biofuels.
- The tax exemption has varied from full to reduced tax exemption. For biofuels, it is
- Bioenergy has a high priority within Sweden’s R&D portfolio
- A $800 million climate investment subsidies program (KlimatKlivet) where projects are developed to reduce fossil fuels use and associated carbon emissions
- Biofuels for transport has expanded quickly in the market in recent years and in 2019 biofuels accounted for 20.9% of all transport fuels sold compared to 5.1% in 2011.
- The largest share biofuel was HVO fuel, which accounted for two thirds of all biofuels sold, equivalent to 25% of all diesel sold.
- On average, since 2006 production and use of biodiesel have increased at an annual rate of 32% and 37%, respectively
- Since 2006, no significant change in the production and use of ethanol
- Swedish consumption of liquid biofuels is primarily based on imports, with only 10-15% supplied by domestic production

Compare-and-contrast transport biofuel policies in member countries
IEA Bioenergy Task 39 - Implementation Agendas: 2019-2021 Triennium Update 36
until December 2021 and for bio-CNG, until December 2029. However, since January 2018, all biofuels are fully exempted from the fuel tax.
Other policies - The “pump law” mandates fuel retailers
that have a fuel turnover above 1500 m3 per month to offer at least one fuel with a greater than 50% biofuel blend, meaning at least one pump dedicated to biofuels.
- Carbon tax - As of April 2021, car buyers can receive a maximum SEK 70,000 bonus for certain more fuel efficient vehicles, or conversely be penalized for vehicles emitting more than 95 gCO2/km
- Numerous R&D projects on advanced biofuels have been developed at pilot and demonstration scales
- Several commercial and demonstration co-processing projects at Swedish oil refineries.
Country Market-pull policies Technology push policies Effectiveness of the biofuel policies
The US Biofuels mandates - Volume targets for biofuels including
conventional corn-based ethanol and advanced, cellulosic and diesel biofuels: 36 billion gallons per year (BGY) by 2022 including 15 BGY of conventional corn starch-based ethanol and 21 BGY of advanced, cellulosic and biodiesel biofuels (i.e., 16 BGY of cellulosic biofuels, 4 BGY of advanced biofuels, and 1 BGY of biomass-based biodiesel)
Fuel excise tax reduction/exemption
- Blenders tax credit for biodiesel and renewable diesel
Other policies - California and Oregon ’s Low-Carbon Fuel
Standard (LCFS) (and recently in the state of Washington)
- California’s cap and trade program
- Loan guarantee programs intended to buy down the risk of constructing first of a kind scaled up commercial facilities.
- Federal and States administer a wide variety of programs aimed at encouraging greater production and use of bioproducts and biofuels and the development of biomass supply chains
- Over the past decade, the biofuels mandate has effectively propelled increased production and use of biofuels in the US, primarily more conventional ethanol and FAME biodiesel
- The US remains the largest producer of ethanol in the world (58%), followed by Brazil (26%) and EU (5%)
- Diesel biofuels production reached about 2.5 billion gallons in 2017 as compared to 215 million gallons in 2010
- In California, the volume of low carbon fuels consumed increased from 1,152 million gasoline gallon equivalent (GGE) in 2011 to 2,314 GGE in 2019, (more than double increase) over the period of 2011-2019.
- Large number of pilot, demonstration and commercial advanced biofuels projects (e.g. 1.5 and 2G ethanol plants, renewable diesel, biojet, etc.)
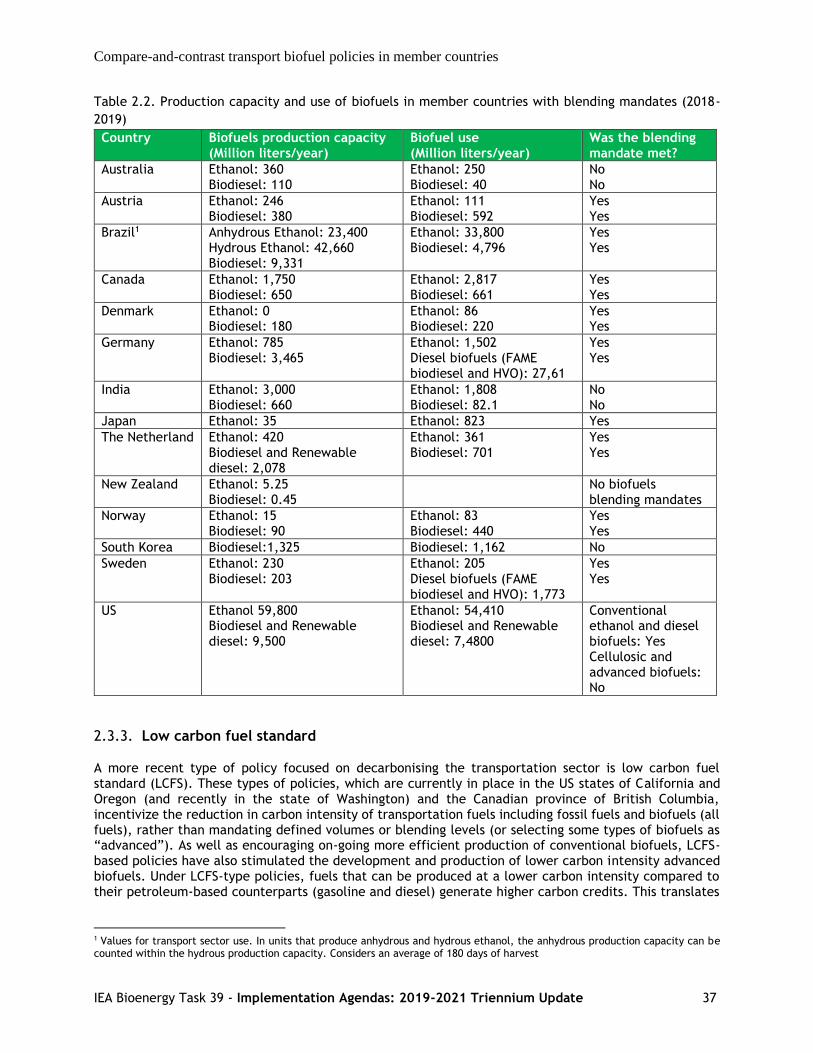
Compare-and-contrast transport biofuel policies in member countries
IEA Bioenergy Task 39 - Implementation Agendas: 2019-2021 Triennium Update 37
Table 2.2. Production capacity and use of biofuels in member countries with blending mandates (2018-
2019)
Country Biofuels production capacity (Million liters/year)
Biofuel use (Million liters/year)
Was the blending mandate met?
Australia Ethanol: 360 Biodiesel: 110
Ethanol: 250 Biodiesel: 40
No No
Austria Ethanol: 246 Biodiesel: 380
Ethanol: 111 Biodiesel: 592
Yes Yes
Brazil1 Anhydrous Ethanol: 23,400 Hydrous Ethanol: 42,660 Biodiesel: 9,331
Ethanol: 33,800 Biodiesel: 4,796
Yes Yes
Canada Ethanol: 1,750 Biodiesel: 650
Ethanol: 2,817 Biodiesel: 661
Yes Yes
Denmark Ethanol: 0 Biodiesel: 180
Ethanol: 86 Biodiesel: 220
Yes Yes
Germany Ethanol: 785 Biodiesel: 3,465
Ethanol: 1,502 Diesel biofuels (FAME biodiesel and HVO): 27,61
Yes Yes
India Ethanol: 3,000 Biodiesel: 660
Ethanol: 1,808 Biodiesel: 82.1
No No
Japan Ethanol: 35 Ethanol: 823 Yes
The Netherland Ethanol: 420 Biodiesel and Renewable diesel: 2,078
Ethanol: 361 Biodiesel: 701
Yes Yes
New Zealand Ethanol: 5.25 Biodiesel: 0.45
No biofuels blending mandates
Norway Ethanol: 15 Biodiesel: 90
Ethanol: 83 Biodiesel: 440
Yes Yes
South Korea Biodiesel:1,325 Biodiesel: 1,162 No
Sweden Ethanol: 230 Biodiesel: 203
Ethanol: 205 Diesel biofuels (FAME biodiesel and HVO): 1,773
Yes Yes
US Ethanol 59,800 Biodiesel and Renewable diesel: 9,500
Ethanol: 54,410 Biodiesel and Renewable diesel: 7,4800
Conventional ethanol and diesel biofuels: Yes Cellulosic and advanced biofuels: No
2.3.3. Low carbon fuel standard
A more recent type of policy focused on decarbonising the transportation sector is low carbon fuel standard (LCFS). These types of policies, which are currently in place in the US states of California and Oregon (and recently in the state of Washington) and the Canadian province of British Columbia, incentivize the reduction in carbon intensity of transportation fuels including fossil fuels and biofuels (all fuels), rather than mandating defined volumes or blending levels (or selecting some types of biofuels as “advanced”). As well as encouraging on-going more efficient production of conventional biofuels, LCFS-based policies have also stimulated the development and production of lower carbon intensity advanced biofuels. Under LCFS-type policies, fuels that can be produced at a lower carbon intensity compared to their petroleum-based counterparts (gasoline and diesel) generate higher carbon credits. This translates
1 Values for transport sector use. In units that produce anhydrous and hydrous ethanol, the anhydrous production capacity can be counted within the hydrous production capacity. Considers an average of 180 days of harvest

Compare-and-contrast transport biofuel policies in member countries
IEA Bioenergy Task 39 - Implementation Agendas: 2019-2021 Triennium Update 38
into higher market values for these fuels. Although not LCFS, Germany and Sweden have also implemented GHG reduction-based quota obligations for biofuels use in their transport sectors. In contrast to biofuels blending mandates, LCFS policies do not have minimum GHG emission reduction requirements for specific fuel categories. LCFS policies are fuel-agnostic, with credits or deficits generated based on the carbon intensity (CI) of the particular fuel. The carbon intensity of a fuel is estimated in gCO2e/MJ using LCA and represents the GHG emissions emitted across the full life cycle of fuel from feedstock acquisition to production, use, and final disposition. In recent years, Canada and Brazil have been developing national LCFS-type policies to encourage the production and use of low carbon fuels. Partly based on its commitment at the Paris COP21 meeting, in 2017, the Canadian government released its Regulatory Framework on the Clean Fuel Standard (CFS), describing how Canada will transition from volumetric-based requirements towards a carbon intensity-based approach. Around the same time, Brazil established its RenovaBio program to create a regulatory framework that will revitalize its biofuels sector by encouraging further energy efficiency gains in biofuels production and use. The RenovaBio regulations came into force in 2020 using market-based incentives, i.e., issuing GHG emissions reduction certificates, provisionally named “CBIO”. Both Brazil’s RenovaBio and Canada’s CFS are discussed in more details in Chapters 3 and 4 in Appendix A, respectively. A clear benefit of LCFS policies is that they reward efficiency and encourage on-going innovation in biofuels production aimed at further reducing the carbon intensity of the overall process. Some of the approaches used to decrease the GHG emissions of biofuels include:
• Development of “bolt-on” technologies which enable existing corn-ethanol dry mills in the US to convert corn kernel fibre coproduct into cellulosic ethanol (California Air Resources Board, 2017 and 2018).
• Reusing or selling the carbon dioxide (CO2) produced by ethanol fermentation instead of treating the CO2 co-product stream as a waste (State CO2-EOR Deployment Work Group, 2017).
• Using carbon capture and sequestration to capture the carbon dioxide released in ethanol production and store it underground
• Transitioning away from using fossil fuel-based energy sources such as coal and natural gas to using heat and/or electricity from renewable sources such as hydroelectricity, biogas/renewable natural gas or agricultural and forest biomass in the biofuels production processes
• For existing renewable diesel (HVO/HEFA) facilities, using a green source of hydrogen can reduce the carbon intensity of the resulting biofuels. For hydrogen-related emissions, renewable diesel facilities vary in the efficiency of hydrogen recovery from off-gasses and re-use in the hydrotreating unit. Currently, existing renewable diesel facilities use hydrogen derived from methane-steam reforming.
• One of the primary sources of GHG emissions of biofuels is those associated with the upstream feedstock-related emissions (O’Connell et al., 2019).The biomass industry is making considerable progress in reducing the cost of biomass production and logistics. These include cheaper crop establishment, harvesting, collection and transportation by increasing the efficiency of logistics operations which result in a reduction in energy consumption and the associated GHG emissions.
As LCFS type policies become more common in increasing numbers of jurisdictions, the carbon intensity of current and emerging biofuels is expected to decrease. As well as reducing the carbon intensity of bioethanol and biodiesel production, LCFS policies have helped to stimulate the production of so-called “drop-in biofuels” such as HVO/HEFA fuels/renewbale diesel derived from used cooking oils, animal fats or tall oil, as the credits generated using these lower carbon intensive biofuels can make their production more economically viable. However, due to higher production costs compared to conventional FAME biodiesel, HVO/HEFA fuels are mainly sold in specific markets. These include California and British Columbia, where LCFS policies incentivize biofuel production based on the biofuel’s carbon intensity, or Germany and Sweden, where other supporting policies based on GHG emission reductions are in place.

Compare-and-contrast transport biofuel policies in member countries
IEA Bioenergy Task 39 - Implementation Agendas: 2019-2021 Triennium Update 39
The impact that policies such as an LCFS can have on market development is indicated in Figure 2.2, which summarizes the volume of low carbon fuels consumed in California from 2011 to 2019. The volume of low carbon fuels consumed in California increased from 1,152 million gasoline gallon equivalent (GGE) in 2011 to 2,314 GGE in 2019, (more than double increase) over the period of 2011-2019.
Figure 2.2. Alternative low-carbon fuel volumes used in California (California Air Resources Board, 2019)
Overall, although market-pull policies have been used successfully, to be fully effective they need to remain in place over many years. The implementation of market-pull policies often requires governments to pick winners in advance (i.e., at a very early development stage) and this increases the risk that, although initially promising, these technologies may prove inferior in the longer run.
2.3.4. Technology-push biofuels policies
Despite the predominance of market-pull policies, technology-push policies have been successfully used to encourage research, development and demonstration (RD&D), particularly for advanced biofuels. As jurisdictions such as the EU have put a limit on the production and/or use of conventional/food crop-based biofuels and because of the higher market value of drop-in and advanced biofuels in places such as California and British Columbia due to their LCFS-type policies, the production of lower carbon biomass-based advanced biofuels has been further encouraged in these regions. However, commercialization of biofuels from innovative tecnhnologies has been slow. They are either not available or not cost competitive with starch or sugar-based biofuels. As Table 2.3 shows, technology-push policies impact the development and deployment of advanced biofuels and their supply chains, especially in countries that have established biofuel markets such as Brazil, the US, Canada, Austria, Denmark, Germany and Sweden. In all these countries, demonstration, pre-commercial and commercial advanced biofuels facilities have been developed. In other countries, the various types of funding programs have contributed to the production of advanced biofuels including cellulosic ethanol, Fischer–Tropsch synthetic fuels and other drop-in biofuels (e.g., biojet) at pilot and demonstration scales. As detailed in Table 2.1 and summarized in Table 2.3, in addition to de-risking advanced biofuel production, financial schemes and incentives have also been used to improve infrastructure, feedstock production and supply chains and to address sustainability concerns that slow acceptance among users as new technologies and systems are introduced. Ideally, these policies also foster an improved
0
500
1,000
1,500
2,000
2,500
2011 2012 2013 2014 2015 2016 2017 2018 2019
Fuel
Volu
me (
Millo
n G
GE)
Ethanol Biodiesel Renewable Diesel Fossil Natural Gas Biomethane Electricity

Compare-and-contrast transport biofuel policies in member countries
IEA Bioenergy Task 39 - Implementation Agendas: 2019-2021 Triennium Update 40
understanding by energy and transport sector decision makers to enable more effective integrated planning and policy design. Table 2.3. Technology-push policies used by member countries to develop biofuels markets
Grants for conversion technology development to increase technology readiness levels and to de-risk technology and supply chain development. Various grants and financial programs intended to de-risk early market development and initial commercialisation for technologies with strong long-term market potential but high investment risk
Australia, Austria, Brazil, Canada, Germany, South Korea, Sweden, US, China, India, Norway
Loan guarantees and credit lines to buy down the financial risk of constructing first-of-a-kind larger-scale commercial facilities
US and Brazil
Rebates and tax incentives on bioenergy R&D expenses Australia
Rebates and bonuses to car buyers for the purchase of certain vehicles such as flex-fuel vehicles (FFVs) and other rebates such as reduced license fees and tax credits
Austria, Brazil, Sweden
Fiscal incentives and subsidies (e.g., reduced property tax, corporate tax, renewable energy depreciation on assists)
Brazil, Japan
Financial incentives for feedstock development and logistics Brazil, US, India, Norway, Japan
Grants for storage and distribution infrastructure Canada, The Netherlands, Sweden
A combination of technology-push and demand-pull policies will both be needed to increase the rate of introduction and diffusion of advanced biofuel technologies. Although technology-push policies have been shown to generate innovation in advanced biofuels, the growth in demand induced by market-pull policies such as LCFS tends to increase public and private investment in more mature technologies.
2.3.5. Biofuel policies to encourage the decarbonisation of aviation and shipping sectors
Most of the policies that have been used to promote renewable energy for transport have primarily focussed on road transport at a national level. Other important transport sectors such as aviation and shipping have received considerably less policy attention despite being significant energy consumers and carbon emitters. Both sectors are under increasing pressure to reduce their carbon and sulfur emissions. The government and industry efforts are increasing to reduce the GHG emissions from aviation and shipping industries, where electrification is much more challenging. The aviation has adopted a number of targets, including a 50% reduction in net aviation CO2 emissions by 2050 (compared to 2005 levels) despite few direct support policies that target the use of renewable fuels in the aviation sector (International Air Transport Association (IATA), 2017). The revised RED (REDII) encourages the production and use of sustainable biofuels, particularly for the aviation and shipping sectors by “double-counting” (using a multiplier of 1.2) in their possible contribution towards the region’s renewable transport target (International Council on Clean Transportation (ICCT), 2018). The Netherlands, Norway, Sweden and the US have had policies in place for several years aimed at promoting production of alternative jet fuel. To date, seven alternative jet fuel production pathways and two coprocessing pathways had been certified for blending with traditional petroleum jet fuels, based on the ASTM D7566 specification (van Dyk and Saddler, 2021). Shipping mainly uses “heavy” fossil fuels that contain sulphur and heavy metals and, in parallel with aviation, will likely prove to be one of the hardest transport sectors to decarbonise. Apart from technological challenges, the type of renewable biofuels that will be used in shipping faces numerous barriers, such as the large price gap between renewable and conventional fuels and very limited regulations, particularly regarding the GHG emissions attributes of maritime fuels. International shipping is regulated by the International Maritime Organisation (IMO). Since the Paris agreement (which did not include international shipping), the IMO has developed reduction strategies for GHG emissions and other air pollutants. In 2016, the IMO agreed to a 0.5% cap on sulphur in its fuels by 2020 (International Maritime

Compare-and-contrast transport biofuel policies in member countries
IEA Bioenergy Task 39 - Implementation Agendas: 2019-2021 Triennium Update 41
Organisation (IMO), 2016). In 2018, the IMO reached an agreement on an “initial strategy” to reduce CO2
emissions from shipping. The initial strategy identifies measures that could indirectly support the GHG reduction efforts. One of these measures concerns the use of zero-carbon or fossil-free fuels for the shipping sector and the development of robust lifecycle GHG/carbon intensity guidelines for alternative fuels (The Maritime Executive, 2018).
2.3.6. Biofuels production and use in member countries
Figure 2.3 to Figure 2.17 show the biofuels production and use trends for the 11-year period of 2010-2020 in member countries; no figures are included for countries that did not produce or use significant volumes of biofuels during this period or where production and use data remain only partially verified or not available for that period. In addition, these figures show the trends of biofuels blending mandates which help to assess the effectiveness of the blending mandates on the production and use trends. The impacts of other policies on the biofuels markets and the development and deployment of advanced biofuels are summarized in Table 2.1.
Figure 2.3. Biofuels production and use in Australia (2010-2019)
0
100
200
300
400
500
600
2010 2011 2012 2013 2014 2015 2016 2017 2018 2019
Million lit
ers
(M
L)
FAME biodiesel- Production Conventional ethanol- Production
FAME biodiesel- Use Conventional ethanol- Use

Compare-and-contrast transport biofuel policies in member countries
IEA Bioenergy Task 39 - Implementation Agendas: 2019-2021 Triennium Update 42
Figure 2.4. Biofuels production and use in Austria (2010-2018)
Figure 2.5. Biofuels production and use in the transport sector in Brazil (2010-2019)
0
1
2
3
4
5
6
7
0
100
200
300
400
500
600
700
800
900
2010 2011 2012 2013 2014 2015 2016 2017 2018
Ble
ndin
g m
andate
s (%
)
Million lit
ers
(M
L)
FAME biodiesel- Production
Conventional ethanol- Production
Diesel biofuels (FAME biodiesel and renewable diesel)- Use
Conventional ethanol and and bio-ethyl tert-butyl ether (BioETBE)- Use
Ethanol Blending mandate
Biodiesel blending mandate
0
5
10
15
20
25
30
0
5,000
10,000
15,000
20,000
25,000
30,000
35,000
40,000
2010 2011 2012 2013 2014 2015 2016 2017 2018 2019
Ble
ndin
g m
andate
s (%
)
Million lit
ers
(M
L)
Conventional ethanol- Use FAME biodiesel- Use
Ethanol blending mandate Biodiesel blending mandate

Compare-and-contrast transport biofuel policies in member countries
IEA Bioenergy Task 39 - Implementation Agendas: 2019-2021 Triennium Update 43
Figure 2.6. Biofuels production and use in Canada (2010-2019)
Figure 2.7. Biofuels production and use in Denmark (2010-2019)
0
1
2
3
4
5
6
7
8
0
500
1,000
1,500
2,000
2,500
3,000
3,500
2010 2011 2012 2013 2014 2015 2016 2017 2018 2019
Renew
able
fuel conte
nt
(%)
Million lit
ers
(M
L)
Diesel biofuels (FAME biodiesel and renewable diesel)- Use
Conventional ethanol- Use
Renewable fuel content by fuel pool- Ethanol
Renewable fuel content by fuel pool- diesel biofuels
0
1
2
3
4
5
6
7
0
50
100
150
200
250
2010 2011 2012 2013 2014 2015 2016 2017 2018 2019
Ble
ndin
g m
andate
(%
)
Million lit
ers
(M
L)
FAME biodiesel- Production Biofuels mandate (ethanol and biodiesel)

Compare-and-contrast transport biofuel policies in member countries
IEA Bioenergy Task 39 - Implementation Agendas: 2019-2021 Triennium Update 44
Figure 2.8. Biofuels production and use in Germany (2010-2018)
Figure 2.9. Biofuels production and use in India (2014-2019)
0.00
1.00
2.00
3.00
4.00
5.00
6.00
7.00
0
500
1,000
1,500
2,000
2,500
3,000
3,500
4,000
2010 2011 2012 2013 2014 2015 2016 2017 2018
Ble
ndin
g m
andate
(%
)
Million lit
ers
(M
L)
FAME biodiesel- Production
Conventional ethanol and bio-ethyl tert-butyl ether (BioETBE)- Production
Diesel biofuels (FAME Biodiesel and Renewable Diesel)- Use
Conventional ethanol and BioETBE- Use
Biofuels mandate (ethanol and biodiesel)
GHG reduction quota
0
100
200
300
400
500
600
700
800
900
2014 2015 2016 2017 2018 2019
Million lit
ers
(M
L)
FAME biodiesel- Use Conventional ethanol- Use

Compare-and-contrast transport biofuel policies in member countries
IEA Bioenergy Task 39 - Implementation Agendas: 2019-2021 Triennium Update 45
Figure 2.10. Biofuels production and use in Ireland (2005-2018)
Figure 2.11. Biofuels production and use in Japan (2010-2018)
0
100
200
300
400
500
600
700
800
900
0
100
200
300
400
500
600
700
800
900
2010 2011 2012 2013 2014 2015 2016 2017 2018
Ble
ndin
g v
olu
me (
ML)
Million lit
ers
(M
L)
FAME biodiesel- Production
Conventional and cellulosic ethanol- Production
FAME biodiesel- Use
Conventional and cellulosic ethanol- Use
Biofuels mandate-ethanol

Compare-and-contrast transport biofuel policies in member countries
IEA Bioenergy Task 39 - Implementation Agendas: 2019-2021 Triennium Update 46
Figure 2.12. Biofuels production and use in the Netherlands (2010-2020)
Figure 2.13. Biofuels production and use in New Zeland (2010-2018)
0
2
4
6
8
10
12
14
0
500
1000
1500
2000
2500
2010 2011 2012 2013 2014 2015 2016 2017 2018 2019 2020
Ble
ndin
g m
andate
(%
)
Million lit
ers
(M
L)
Diesel biofuels (FAME biodiesel and renewable diesel)- Production
Conventional ethanol- Production
FAME biodiesel- Use
Conventional ethanol- Use
Biofuels mandate (ethanol and biodiesel)
0
1
2
3
4
5
6
2010 2011 2012 2013 2014 2015 2016 2017 2018
Million lit
ers
(M
L)
FAME biodiesel- Production Conventional ethanol- Production

Compare-and-contrast transport biofuel policies in member countries
IEA Bioenergy Task 39 - Implementation Agendas: 2019-2021 Triennium Update 47
Figure 2.14. Biofuels production and use in Norway (2016-2020)
Figure 2.15. Biofuels production and use in South Korea (2010-2019)
0
5
10
15
20
25
0
100
200
300
400
500
600
700
2016 2017 2018 2019 2020
Ble
ndin
g m
andate
(%
)
Million lit
ers
(M
L)
FAME biodiesel- Production
Conventional and cellulosic ethanol- Production
Diesel biofuels (FAME biodiesel and renewable diesel)- Use
Conventional and cellulosic ethanol- Use
Biofuels blending mandate
0
0.5
1
1.5
2
2.5
3
3.5
0
200
400
600
800
1000
1200
1400
2010 2013 2015 2017 2019
Ble
ndin
g m
andate
(%
)
Million lit
ers
(M
L)
FAME biodiesel- Production Conventional ethanol- Production
FAME biodiesel- Use Conventional ethanol- Use
Biodiesel blending mandate

Compare-and-contrast transport biofuel policies in member countries
IEA Bioenergy Task 39 - Implementation Agendas: 2019-2021 Triennium Update 48
Figure 2.16. Biofuels production and use in Sweden (2010-2017)
Figure 2.17. Biofuels production and use in the US (2006-2017)
As shown in Figure 2.3 to Figure 2.17, in the vast majority of member countries, biofuel policies have enhanced biofuels market growth. An on-going increase in production and use of biofuels as blending mandates gradually have been increased over time is evident in Brazil, Canada, Japan, the Netherlands, South Korea, Sweden and the US. It is also apparent that for periods when blending mandates did not change, biofuels production and use remained fairly flat. For example, this is seen in Austria, Denmark, and Germany. In countries such as New Zealand and Australia where there is no national biofuels blending
0
1
2
3
4
5
6
0
200
400
600
800
1000
1200
1400
1600
1800
2000
2010 2011 2012 2013 2014 2015 2016 2017
Ble
ndin
g m
andate
(%
)
Million lit
ers
(M
L)
Diesel biofuels (FAME biodiesel and renewable diesel)- Production
Conventional and cellulosic ethanol- Production
Diesel biofuels (FAME biodiesel and renewable diesel)- Use
Conventional and cellulosic ethanol- Use
Ethanol blending mandate
Biodiesel blending mandate
0
10000
20000
30000
40000
50000
60000
70000
80000
90000
100000
0
10000
20000
30000
40000
50000
60000
70000
2006 2007 2008 2009 2010 2011 2012 2013 2014 2015 2016 2017
Volu
me m
andate
(M
L)
Million lit
ers
(M
L)
Diesel biofuels (FAME Biodiesel and Renewable Diesel)- Production
Conventional and cellulosic ethanol- Production
FAME biodiesel- Use
Conventional and cellulosic Ethanol- Production
Total renewable fuel- volume mandate

Compare-and-contrast transport biofuel policies in member countries
IEA Bioenergy Task 39 - Implementation Agendas: 2019-2021 Triennium Update 49
mandate, there is a sporadic production of ethanol and biodiesel and the biofuels industry has not been able to establish a stable market. Lack of market development due to the absence of blending mandate is also observed for biodiesel in Japan and ethanol in South Korea. In Australia, although the state of New South Wales (NSW) has mandated the use of biofuels, the blending mandate has been ineffectual as the Government grants the liable party (fuel distributors) exemptions due to a supposed lack of supply although many biofuel plants have been idled due to lack of demand. A review of biofuels production and use trends also reveals that biofuels market growth was not geographically or temporally uniform. Member countries indicated that a variety of factors, especially uncertainty about future policy impact the effectiveness of policies in creating a stable environment for the increased production and use of biofuels. Other important factors include non-compliance costs, the nature of future funding and incentive programs as well as possible unforeseen impediments to global trade such as tariffs, and also future availability and cost of sustainably certified feedstocks. In Japan, concerns over food security when using feedstocks such as corn (grain) has hindered further expansion of conventional biofuels production and use in this country. Lack of access to commercial quantities of affordable feedstock has been one of the main barriers to developing and implementing biofuels policies in countries such as New Zealand, Australia, Japan and South Korea. Sustainability of particular feedstocks such as palm oil and used cooking oil especially has been a concern among EU’s member states desiring to increase their production and use of biofuels. In Denmark, use of biomass for bioenergy (i.e., heat and power) has been given a priority over biofuels for transport. In the US, the slow rate of commercialisation of advanced biofuels since the inception of Renewable Fuel Standard in 2005, coupled with the fact that advanced biofuels, at this stage of development and in the current market and policy environment, remain non-cost-competitive with starch or sugar-based biofuels, has resulted in a reduction in future volume mandates for advanced, cellulosic and biodiesel biofuels over time. Although conventional biofuels (i.e., sugar/starch-based ethanol and FAME biodiesel) comprised most of the biofuels market share in member countries, worldwide efforts continue to assess the potential production and use of so-called drop-in and other advanced biofuels. The growth of advanced biofuels has been led by HVO/HEFA fuels/renewable diesel, followed by ethanol from cellulosic materials such as corn fibre, and by fuels from thermochemical gasification- or pyrolysis-based processes. HVO/HEFA fuels are increasing being used to decarbonise the long-distance transport sector, trucking in particular. Most of the drop‐in biofuels that are currently produced are made via the “conventional” route, based on the upgrading of lipids/oleochemicals. Globally, it has been estimated that over 7.5 billion liters of renewable diesel are produced by 8 companies in 11 facilities located in the US, Europe and Singapore. As shown in Figure 2.18, HVO/HEFA fuels production has experienced significant growth from about 265 million liters (ML) in 2007 to over 7,500 ML in 2020; an average annual growth of 41%. Among member countries, HVO/HEFA fuels has been produced only in the US and the Netherlands but it has been used by several member countries to meet their blending mandates and the GHG emission reduction goals in the transport sector including Germany, Sweden, the US, and Canada.

Compare-and-contrast transport biofuel policies in member countries
IEA Bioenergy Task 39 - Implementation Agendas: 2019-2021 Triennium Update 50
Figure 2.18. Global growth of HVO/HEFA fuels/renewable diesel production capacity since 2007 (Preem,
2018; CBSCI, 2019; (S&T)2 Consultants, 2020)
The growth in drop-in biofuels production capacity is anticipated to continue significantly with the increasing pressure to decarbonize long-distance transport sectors such as trucking, aviation and marine. Drop-in biofuels are shovel-ready solutions to decarbonize these sectors without the need to invest in downstream distribution systems and vehicle engines. Figure 2.19 shows regional projection of HVO/HEFA fuels production capacity by 2025 (Greenea, 2021).
Figure 2.19. Regional projection of HVO/HEFA fuels/renewable diesel production capacity by 2025
(Adapted from Greenea, 2021)
265 265530
2,094
3,3743,374
3,980
4,4934,784
5,0265,026
5,520
6,902
7,540
0
1,000
2,000
3,000
4,000
5,000
6,000
7,000
8,000
2007 2008 2009 2010 2011 2012 2013 2014 2015 2016 2017 2018 2019 2020
Million L
iters

Compare-and-contrast transport biofuel policies in member countries
IEA Bioenergy Task 39 - Implementation Agendas: 2019-2021 Triennium Update 51
Due to the higher production cost of HVO/HEFA fuels as compared to FAME biodiesel, these fuels are mainly sold in markets such as California and British Columbia where Low Carbon Fuel Standard policies incentivize biofuels based on their carbon intensity, or where other supporting policies based on GHG emission reductions such as in Germany and Sweden are in play. Figure 2.20 shows the average market value of cellulosic ethanol and renewable diesel compared to other fuels in the US in 2019. Supporting policies such as California’s LCFS, Federal Renewable Fuel Standard (RFS) and the biodiesel/renewable diesel income tax credit have made the US, and California in particular, a very attractive market in which to sell drop-in biofuels and advanced biofuels.
Figure 2.20. Average market value of cellulosic ethanol and renewable diesel compared to other fuels in
California in 2019 (Lane, 2020)
In addition to the renewable diesel, sustainable aviation fuel (SAF)/biojet is expected to experience a fast growth by 2030. In 2019, only two companies produced significant volumes of SAF/biojet including World Energy in the US and Neste in the Netherlands, both using hydrotreatment of lipids technology, producing about 140 million liters (van Dyk and Saddler, 2021). Both facilities have the capacity to increase biojet production with the right market conditions. Currently, a majority of their biorefinery capacity is used to produce renewable diesel, motivated by attractive profit margins in the California market. Construction of additional facilities for biojet/SAF production is underway or planned globally. This is based on hydrotreated lipids and other technologies such as gasification and Fischer-Tropsch, and alcohol-to-jet (ATJ). With the planned Biojet/SAF facilities, production capacity can potentially increase to about 3,500 million liters by 2025 (Figure 2.21).

Compare-and-contrast transport biofuel policies in member countries
IEA Bioenergy Task 39 - Implementation Agendas: 2019-2021 Triennium Update 52
Figure 2.21. Biojet/SAF Production Capacity Growth: 2020-2025 (ArgusMedia, 2020; van Dyk and Saddler,
2021)
For Biojet/SAF to take off, regulators need to create a framework that mandates their use and incentivizes production of biofuels for use in aviation. The ICAO previously tried and failed to implement a global SAF blending mandate. However, regulators at the regional, national, and local level are starting to develop policies to support the penetration of biojet including: 2020 – Norway mandate of 0.5% SAF 2030 – Norway mandate increases to 30% 2021 – Sweden proposal for 0.8% emissions reduction obligation for domestic jet fuel 2030 – Sweden mandate for 27% reduction in emissions 2035 – Finland targets 30% SAF in aviation Aviation is included in the EU's Emission Trading Scheme (ETS). Biojet/SAF made from non-crop feedstock can also be used to meet the targets under the EU Renewable Energy Directive (RED I until 2020; RED II for 2020-2030). In the US, SAF can be used to meet the advanced biofuel targets under the Renewable Fuel Standard (RFS), a federal mandate for the road transport sector. In California, the Air Resources Board (CARB) has approved a pathway that allows the voluntary use of hydroprocessed esters and fatty acids (HEFA) under its Low Carbon Fuel Standard (LCFS). This cap-and-trade system targets a 7.5% decline in the carbon intensity of its transport fuel emissions from 2010 levels by 2020 (-20% by 2030). In addition to the production of conventional and drop-in biofuels in stand-alone facilities, another low-carbon fuel pathway is co-processed fuels produced in the existing oil refineries. Co-processing is the insertion of bio-based intermediates (biogenic feedstocks) into existing refinery processing units. As shown in Figure 2.22, co-processing is not a single pathway to produce low carbon intensive fuels, a variety of insertion points are possible including Fluid Catalytic Cracker (FCC), Hydrotreater, Hydrocracker.
220 269
1,874
2,442
3,3483,518
0
500
1,000
1,500
2,000
2,500
3,000
3,500
4,000
2020 2021F 2022F 2023F 2024F 2025F
Million L
iters

Compare-and-contrast transport biofuel policies in member countries
IEA Bioenergy Task 39 - Implementation Agendas: 2019-2021 Triennium Update 53
Figure 2.22. Insertion point of co-processing at oil refineries (van Dyk et al., 2019)
Low-carbon-intensive (CI) lipid feedstocks such as used cooking oil, tallow and tall oil can be readily integrated into existing petroleum infrastructure (van Dyk et al., 2019). This provides an opportunity to use existing oil refineries to co-process biogenic feedstocks in the short-to-mid-term, complemented by biomass-derived-biocrudes in the mid-to-longer-term to produce commercial volumes of low CI fuels. Approximately 40 refineries around the world have implemented or are assessing the potential to co-process biogenic feedstocks at blend levels ranging from 2-30 vol%. Some oil refineries, such as Preem in Sweden, are well advanced in producing and marketing co-processed fuels (Ecofys, 2017, Ebadian, et al., 2019, van Dyk et al. 2019). Preem has been marketing “Preem Evolution Diesel” since 2011 with this drop-in fuel having a 20% renewable content, primarily based on Tall Oil feedstocks. More recently used cooking oil and animal fats have also been added to the biogenic feedstock stream to provide a low-carbon fuel that is marketed as Evolution Diesel+ (IEA Bioenergy, 2018). About 50% of the renewable content of Evolution Diesel+ comes from rapeseed methyl ester (RME) and the remainder mostly from Hydrated Vegetable Oil (HVO). In June 2021, Preem carried out the production of renewable petrol from sawdust at its refinery in Lysekil. Work has now started to process 50,000 tons of pyrolysis oil at the plant. The renewable raw material will be delivered from the Swedish company Pyrocell2. In addition to Sweden, low carbon intensive fuels via co-processing has been produced in Brazil, the US, Canada and Norway. In the province of British Columbia (BC) in Canada, as part of the Province’s overall low carbon fuels standard (LCFS) strategy, components such as Part 3 Agreements have been successfully used to “encourage” industries such as BC’s oil refineries, to consider co-processing as one way of reducing the carbon intensity of their processes and products. Similarly, California’s LCFS has encouraged two oil refineries in the US to produce low-carbon fuels via co-processing. Co-processing pathway has also being approved by the US EPA to generate RINs under RFS program (D5 RINs (advanced biofuel)) ((S&T)2 Consultants, 2020). The potential advantages of following a co-processing approach as compared to building or reconfiguring a stand-alone biofuel plant are:
• The ability to leverage existing oil refining infrastructure to produce low-carbon-intensive drop-in fuels
• A relatively less capital-intensive way to encourage oil refineries to produce, distribute and market low-carbon-intensive fuels
• Lower upfront investment costs compared to building stand-alone biorefineries
2 http://www.biomassmagazine.com/articles/18093/preems-refinery-in-lysekil-begins-producing-renewable-gasoline

Compare-and-contrast transport biofuel policies in member countries
IEA Bioenergy Task 39 - Implementation Agendas: 2019-2021 Triennium Update 54
• A variety of insertion points within the refinery are possible (e.g. Fluid Catalytic Cracker (FCC), Hydrotreater, etc.), thus readily incorporated into most refinery configurations
• Improving the properties of the finished fuels, e.g. lower sulfur content
Although the co-processing rate or the volumetric ratio of biogenic feed to crude oil will be a key factor in defining the economics and technical challenges of co-processing, low rates (up to 10%) should be able to be implemented with minimum technical challenges. The production of advanced biofuels from cellulosic feedstocks, including cellulosic ethanol has, so far, only been demonstrated at a relatively small scale due to the slower than forecast progress in scale up and commercial deployment. The majority of existing capacity is for cellulosic ethanol (1.5G and 2G), produced in the US, Brazil and EU due to supporting policies. In addition to blending mandates for conventional biofuels, some EU member states, including Austria, Denmark, the Netherlands and Italy, have developed or are developing blending mandates for advanced biofuels. Global production capacity for advanced biofuels at the end of 2015 was estimated to be 850 million liters per year (Araújo et al., 2017; IRENA, 2016). Planned capacity expansions add about 1.5 million liters of new capacity per year, with initiatives underway in Brazil, China, Canada, France, the Netherlands, Sweden, the United Kingdom, and the US (Araújo et al., 2017; IRENA, 2016). While the majority of existing capacity is for cellulosic ethanol, this advanced biofuel has so far only been produced in relatively small volumes. Ethanol production from corn fiber (Generation 1.5) has become an area of active R&D and commercialization in the US since 2014, when the EPA classified corn kernel fiber as a crop residue (Seven corn ethanol plants approved to produce cellulosic ethanol from corn kernel fiber). In 2017, five corn ethanol plants, with a combined capacity of nearly 2 billion litres (500 million gallons), were approved by the US Environmental Protection Agency (EPA) to generate Renewable Identification Numbers (RINs) credits under RFS2 program (REN21, 2018). Although only 38 million litres of US RFS2 eligible cellulosic ethanol was produced in 2018, the amount of so-called “generation one-point-five (1.5 Gen)” ethanol produced from corn kernel fibre in conventional corn ethanol plants is expanding. In 2017, five corn ethanol plants, with a combined capacity of nearly 2 billion litres (500 million gallons), were approved by the US Environmental Protection Agency (EPA) to generate Renewable Identification Numbers (RINs3) credits under RFS2 program (REN21, 2018). A number of pilot, demonstration and pre-commercial advanced biofuels plants in other member countries such as Australia, Austria, Brazil, Canada, Denmark, India, Germany and Sweden are also producing or have produced “advanced” biofuels from biomass feedstocks ranging from agricultural and forest residues and the cellulosic portion of municipal waste streams. Commercialisation of thermally-based processes for producing biofuels including hydrothermal liquefaction, pyrolysis and gasification is also advancing. Enerkem in Canada adapted its commercial-scale gasification plant in Edmonton, Alberta, which processes 300 tonnes per day of sorted municipal wastes, to produce ethanol instead of methanol, and this fuel qualifies as cellulosic ethanol under the US RFS2. Additional plants based on this technology are under development in the Netherlands and China (ChemEurope.Com, 2018; REN21, 2018). In addition, Ensyn in Canada has been providing pyrolysis oils from its Ontario-based production plant to US customers for space heating and cooling applications, with this fuel also qualifying as a cellulosic biofuel under the US RFS2 program (Ensyn, 2018). In Norway, a first-of-its-kind demonstration plant is being developed based on hydrothermal liquefaction technology. The company Steeper Energy (Denmark and Canada) is licensing its proprietary Hydrofaction technology to Silva Green Fuel, a Norwegian-Swedish joint venture (Biofuels International, 2017). Licella (Australia) is in a joint venture with the forestry company, Canfor (Canada), to produce and upgrade bio-crude
3 “Renewable Identification Numbers” (RINs) are saleable regulatory credits that represent a quantity of qualifying
renewable fuel. To qualify as a renewable fuel under the US RFS program, a fuel should be produced from an
approved feedstock through an approved pathway.

Compare-and-contrast transport biofuel policies in member countries
IEA Bioenergy Task 39 - Implementation Agendas: 2019-2021 Triennium Update 55
produced by a hydrothermal liquefaction process in the Canadian province of British Columbia, and previously announced plans to build a plant in Australia. Biomethane has been mainly produced in the US and the EU. The largest market for biomethane is the US and its production has been stimulated since 2015 when biomethane began to be included in the cellulosic biofuels category of the RFS2 program. US biomethane consumption grew nearly six-fold between 2014 and 2016, then increased another 15% in 2017 to 17.4 PJ (EPA, 2017a; REN21, 2018). The other globally significant market for biomethane is Europe where consumption increased 12% between 2015 and 2016, to 6.1 PJ. Production and use in the EU were concentrated in Sweden (4.7 PJ), where producing biomethane from food wastes is encouraged as part of a comprehensive waste reduction policy, and where use of biomethane as a transport fuel is prioritised over its use for electricity production or for injection into gas grids. In 2016, Germany (1.3 PJ) was Europe’s second largest user of biomethane for transport (IEA Bioenergy Task 37, 2017; REN21, 2018). A list of current facilities that produce advanced biofuels at pilot and demonstration scales can be found at the IEA Bioenergy Task 39’s large-scale demonstration plants website: https://demoplants.best-research.eu/. Despite considerable progress being made in the technical aspects of advanced biofuels production, it is widely recognized that the right policies will be needed to help expand commercialization. For example, the Brazilian initiated Biofuture Platform, a 20-member country collaboration, has highlighted the importance of the right policies enhancing low-carbon biofuel production and use. EU policy support for advanced biofuels and the increasing number of quota policies announced by member states is also anticipated to catalyze commercial development (BioFuture Platform, 2018).
2.3.7. Sustainability requirements in biofuels policies
Sustainability requirements are increasingly being incorporated into biofuels policies. Life Cycle Assessment (LCA) of GHG emissions is currently the predominant method used to assess the sustainability of many renewable fuel pathways, including biofuel blending mandates. To become eligible, biofuels producers and suppliers typically have to “petition” to be a supplier of a fuel via an approved fuel pathway. A fuel pathway is usually a combination of three components that include feedstock, production process, and fuel type, and an assessment of the fuel’s lifecycle GHG emissions will determine which fuel pathways can qualify. For example, the EU REDII requires a respective 50% and 60% minimum GHG reduction in 2017 and 2018, compared to fossil fuels. This policy also prohibits growing potential biofuel feedstocks in areas that already contain high carbon stocks (i.e., wetlands or forests) or have high biodiversity (e.g., primary forests or grasslands). The EU’s RED II provides default GHG emission values and calculation rules for liquid biofuels in Annex V and for solid and gaseous biomass for power and heat production in Annex VI. The current default values will be revised and updated when technological developments make it necessary. Producers have the option to either use default GHG intensity values provided in RED II or to calculate actual values for their respective production pathways (Lonza, L. and O'Connell, A., 2018) with the REDII GHG savings thresholds for renewable fuels summarized in Table 2.4. Table 2.4: Greenhouse gas emissions savings thresholds in RED II (Lonza, L. and O'Connell, A., 2018)
Plant operation start date Transport biofuels
Renewable transport fuels of non-biological origin
Electricity, heating and cooling
Before October 2015 50% - -
After October 2015 60% - -
After January 2021 65% 70% 70%
After January 2026 65% 70% 80%

Compare-and-contrast transport biofuel policies in member countries
IEA Bioenergy Task 39 - Implementation Agendas: 2019-2021 Triennium Update 56
Similarly, the US’s renewable fuel standard (RFS2) has a minimum GHG reduction requirement with all feedstock-to-biofuel pathways requiring approval by the US Environmental Protection Agency (EPA) before credits can be generated. The US EPA’s RFS program covers the four categories of renewable fuels mandated under this program and their minimum GHG reduction requirement is summarized in Table 2.5. A list of approved pathways for renewable fuels and completed pathway assessments under the US EPA’s RFS program can also be found at https://www.epa.gov/renewable-fuel-standard-program/approved-pathways-renewable-fuel.
Table 2.5. Renewable fuel categories under the RFS program (US EPA, 2017b; Gottumukkala and Hayes,
2018)
Category Code Minimum GHG emissions reduction
requirment1
Description
Cellulosic Biofuel D3 60% Renewable fuels made from cellulose, renewable gasoline, biogas-derived CNG and LNG
Cellulosic Diesel D7 60% Cellulosic diesel, jet fuel and heating oil
Advanced Biofuels D5 50% Renewable fuels other than ethanol derived from corn starch (sugar cane ethanol), biogas from other waste digesters, etc.
Biomass-Derived Diesel
D4 50% Renewable fuels that meet the definition of either biodiesel or non-ester renewable diesel.
Renewable Fuel D6 20% Renewable fuels produced from corn starch or any other qualifying renewable biomass
1 compared to the petroleum baseline In some cases, sustainability concerns have led to revisions of existing policies. For example, the clean energy and emissions reduction goals proposed by the European Commission include a ramp down in the use of conventional biofuels for transport and an increasing role for advanced biofuels and other low-carbon alternatives, such as renewable electricity (IRENA, IEA and REN21, 2018). In RED II, within its 14% transport GHG emissions reduction target, there is a dedicated sub-target for advanced biofuels produced from specified feedstocks, as listed in Part A of its Annex IX. Advanced biofuels must supply a minimum of 0.2% of transport energy by 2022, 1% by 2025, and at least 3.5% by 2030 (European Commission, 2019). Member countries such as Austria, Denmark, the Netherlands and the US have addressed sustainability concerns by introducing specific mandates for more sustainable advanced biofuels as well as providing direct financial incentives. For example, the US, through its federal level RFS2, and California, through its state level LCFS, support the development of advanced biofuels by valuing them higher than conventional biofuels in trading mechanisms. Countries such as Australia support the development of advanced biofuels through research and development grants. The under-developed federal Clean Fuel Standard (CFS) regulations (coming into force in December 2022) will require the consideration of additional sustainability criteria beyond LCA such as land use change and biodiversity, the riparian and protected zones for the use of agricultural and forest biomass in the production of advanced biofuels.
2.4. Conclusion and Policy Implications
Policies have been and will continue to be essential if we are to foster the growth of biofuels to decarbonise transport, particularly long-distance transport. Various types of policies have and continue to be successfully used, including blending mandates, excise tax reductions or exemptions, renewable or low carbon fuel standards, as well as a variety of fiscal incentives and public financing mechanisms. These policies have been applied to stimulate different stages of the biofuels production and consumption supply chain.

Compare-and-contrast transport biofuel policies in member countries
IEA Bioenergy Task 39 - Implementation Agendas: 2019-2021 Triennium Update 57
Biofuel blending mandates or obligations remain the primary biofuels policy tool that has been used by most of member countries and they have been used successfully to establish and grow biofuels markets. However, historically, these obligations have been based on the volume or energy content of the biofuel, rather than its decarbonisation potential. Consequently, this has not maximised the potential to reduce the carbon intensity of the biofuel. In contrast, more recent policies, such as LCFS, are spurring development and production of lower carbon intensity fuels, both conventional and advanced biofuels. As a result, several jurisdictions such as California, Oregon, Washington and British Columbia, Canada and Brazil, have shifted their policy focus from mandating blending levels to establishing LCFS to further lower the carbon intensity of their transportation fuels. Biofuels production and consumption data for the 11-year period of 2010-2020 showed that in most of member countries, biofuels policies played an important role in developing and growing regional and national biofuels markets. Based on information collected from member countries, existing biofuels policies have a range of strengths and limitations, as summarized in Table 2.6. Thus, a mixture of market-pull and technology-push policy instruments is typically used to try to establish or grow current biofuels markets, to enable some of member countries to meet their ambitious GHG emissions reduction goals and fulfill their commitments to the Paris Agreement. Member countries that have achieved the most success in growing their production and use of biofuels have used a mixture of market-pull and technology-push policies. To date, most of the policies used to promote transport decarbonisation have focused on increasing the use of biofuels in cars-and-trucks at a national level (road transportation). Other key transport sectors such as aviation and shipping have drawn considerably less policy attention despite being significant energy consumers and carbon/GHG emitters. Both sectors are under increasing pressure to reduce their carbon and sulfur emissions. The government and industry efforts are increasing to reduce the GHG emissions from aviation and shipping industries, where electrification is much more challenging. While transport biofuels production and use has more than doubled over the last decade, progress in expanding biofuels production remains well below the levels needed to significantly decarbonise transport; as of 2017, over 96.7% of transport sector energy was derived from petroleum products. The levels of biofuels required depend on the future demand for petroleum products, including transport fuels, as well as GHG emissions reduction goals, the carbon intensity of biofuels and the adoption rate of alternatives to biofuels such as electrification. While policies have been essential in promoting the on-going growth of biofuels, they have not been sufficient to drive the level of development needed. Several factors continue to impact the effectiveness of biofuels policies, including: relatively low petroleum and fossil fuel prices; uncertainty about future policy and funding programs to support conventional and advanced biofuels; inconsistent regulation in the global trade of biofuels; and continuing concerns related to food security, land use change and overall sustainability and access to secure supply of affordable feedstocks. However, sustainability requirements are increasingly being incorporated into biofuels policies, with LCFS-type policies that incentivize reductions in carbon intensity and assure sustainability increasingly being used. These types of policies should lead to more stable and larger markets for low carbon intensity fuels, promoting the greater production and use of biofuels, particularly in sectors such as aviation and marine, where alternatives to using biofuels to achieve decarbonization targets remain elusive.

Compare-and-contrast transport biofuel policies in member countries
IEA Bioenergy Task 39 - Implementation Agendas: 2019-2021 Triennium Update 58
Table 2.6. Strengths and limitations of existing biofuels policies used in member countries
Policy instrument Strengths Limitations
Biofuel blending mandates - Effective for developing a biofuel market at early stages
- Effective in establishing biofuels markets and in shielding biofuels from low oil prices
- Greater certainty of increased development - Broadly effective to support technologies that are
relatively mature, as they create a demand for biofuels, which is typically met with commercial conversion technologies such as conventional ethanol or biodiesel
- Need to balance costs of infrastructure while demand is low in early stages
- Need suitable governance to ensure compliance - Not necessarily so useful in expanding
/maintaining markets - Not necessarily successful for meeting GHG
reduction targets - Limited in their capacity to pull early-stage
technologies into the market, since these are often not yet fully commercially viable, or are typically more expensive to be produced commercially - struggling to compete against first generation conventional biofuels
Excise duty reductions/exemptions/credits
- Increases the competitiveness of biofuels with fossil fuels, especially at early stages of development, if fossil and renewable fuels are taxed differently
- Mainly used to make the production of biofuels economically competitive with fossil fuels in the short-to-mid term
- Can be also considered for the production of biomass such as dedicated biomass crops (e.g., switchgrass, carinata, willow) in order to ensure sufficient feedstocks for production of conventional and advanced biofuels and ultimately achievement of mandates for use
- Broadly effective to support technologies that are relatively mature, as they create a demand for biofuels, which is typically met with commercial conversion technologies such as conventional ethanol or biodiesel
- As fuel excise rates vary, this may not be a strong enough driver to foster the biofuels market as a stand-alone policy
- Limited in their capacity to pull early-stage technologies into the market, since these are often not commercially viable, or are typically more expensive to be produced commercially - struggling to compete against first generation conventional biofuels
Low carbon fuel standard (LCFS) - Technology neutral - Favours technologies able to offer the most significant
decarbonisation relative to cost - Spurs the development and production of more life
cycle efficient advanced biofuels - Encourages conventional biofuels producers to lower
their carbon footprint, e.g., by transitioning away
- Unlikely to simulate demand for higher cost, less-developed technologies with long-term potential
- Determining life cycle emissions is complex and time consuming and requiring big data collection

Compare-and-contrast transport biofuel policies in member countries
IEA Bioenergy Task 39 - Implementation Agendas: 2019-2021 Triennium Update 59
from fossil fuel-based energy and making better use of their by-products such as CO2
- Results of life cycle analysis depend on system boundaries, allocation methods and other assumptions and are subject to debate
- Need suitable governance to ensure compliance - Need suitable verification process to measure
the carbon intensity of biofuels produced from different feedstock-conversion technology pathways
Research, development and demonstration funding and financial de-risking measures, mainly for advanced biofuels and power-to-X technologies
- Necessary to support early market technology development and initial commercial projects with longer-term market potential but high investment risk
- Successful in de-risking technology and catalysing private investment for subsequent stages, somewhat sparing public budgets as technologies advance into commercial stages
- Financial risks associated with potential project failures
Sustainability requirements - Propel the production and use of advanced lower carbon intensity biofuels using non-food crop feedstocks such as municipal solid waste (MSW), used cooking oil, and agricultural and forest residues
- Could constrain further production of conventional biofuels from food crops, even for cases where there is little potential for detrimental indirect land use changes
- Could make waste production profitable, which is not in line with overall waste reduction initiatives and polices

Compare-and-contrast transport biofuel policies in member countries
IEA Bioenergy Task 39 - Implementation Agendas: 2019-2021 Triennium Update 60
Sources
Araújo, K., Mahajan, D., Kerr, R., and Silva, M., 2017. Global Biofuels at the Crossroads: An Overview of Technical, Policy, and Investment Complexities in the Sustainability of Biofuel Development. Agriculture 7, 32.
ArgusMedia, 2020. Demand for SAF continues to increase. https://view.argusmedia.com/rs/584-BUW-606/images/Argus%20SAF%20Global%20Capacity%20Map%20-%20Nov%202020.pdf
BiofuelDigest, 2018. The Digest’s 2018 Visual Guide to the economics, politics of renewable fuels. http://www.biofuelsdigest.com/bdigest/2018/03/15/the-digests-2018-visual-guide-to-the-economics-politics-of-renewable-fuels/
BiofuelsDigest, 2020. From Americas to EU, Asia, Africa, Who’s Got What?: The Digest’s 2020 Multi-Slide Guide to Biofuel Mandates Around the World 2020. https://www.biofuelsdigest.com/bdigest/2020/09/11/from-americas-to-eu-asia-africa-whos-got-what-the-digests-2020-multi-slide-guide-to-biofuel-mandates-around-the-world-2020/
Biofuels International, 2017. $76.8 million advanced biofuel demonstration plant coming to Norway. https://biofuelsnews.com/display_news/13274/768_million_advanced_biofuel_demonstration_plant_coming/
BioFuture Platform, 2018. Creating the Biofuture: A report on the state of the low carbon bioeconomy. http://biofutureplatform.org/wp-content/uploads/2018/11/Biofuture-Platform-Report-2018.pdf
California Air Resources Board, 2017. California LCFS Tier 2 Fuel Pathway Application: Corn Kernel Fiber Cellulosic Ethanol Pathway for Mid America Agri Products/Wheatland, LLC Using Natural Gas and Electricity as Process Energy. GREET modeling technical support document. https://ww3.arb.ca.gov/fuels/lcfs/fuelpathways/comments/tier2/t2n-1263_report.pdf.
California Air Resources Board, 2018. Lifecycle Emissions of POET Biorefining – Emmetsburg Corn Kernel Fiber Cellulosic Ethanol with CA-GREET2.0 https://ww3.arb.ca.gov/fuels/lcfs/fuelpathways/comments/tier2/t2n-1266_report.pdf.
California Air Resources Board, 2019. Data dashboard. https://www.arb.ca.gov/fuels/lcfs/dashboard/dashboard.htm
Canada’s Biojet Supply Chain Initiative (CBSCI), 2019. HEFA production and feedstock selection. https://cbsci.ca/wp-content/uploads/CBSCI-HEFA-Production-and-Freedstock-Selection-single-page.pdf
ChemEurope.Com, 2018. Initial funding to kick off waste-to-chemistry project in Rotterdam. http://www.chemeurope.com/en/news/1153539/initial-funding-to-kick-off-waste-to-chemistry-project-inrotterdam.html
Ebadian, M., Saddler, J., McMillan, M., 2019. IEA Bioenergy Task 39 Newsletter#52. http://task39.sites.olt.ubc.ca/files/2019/08/IEA-Bioenergy-Task-39-Newsletter-Issue-52-1.pdf
EC (European Commission), 2018. Sustainability Criteria, https://ec.europa.eu/energy/en/topics/renewable-energy/biofuels/sustainability-criteria.
Ecofys, 2017. Crude tall oil low ILUC risk assessment: Comparing global supply and demand. https://www.upmbiofuels.com/siteassets/documents/other-publications/ecofys-crude-tall-oil-low-iluc-risk-assessment-report.pdf
Ensyn, 2018. Ensyn’s first dedicated fuels facility. http://www.ensyn.com/ontario.html.
US Environmental Protection Agency (EPA), 2017a. RIN generation and renewable fuel volume production by fuel type from January 2017. https://www.epa.gov/fuels-registration-reporting-andcompliance-help/spreadsheet-rin-generation-and-renewable-fuel-0
EPA, 2017b.Renewable Fuel Standard Program: Overview for Renewable Fuel Standard. https://www.epa.gov/renewable-fuel-standard-program/overview-renewable-fuel-standard.

Compare-and-contrast transport biofuel policies in member countries
IEA Bioenergy Task 39 - Implementation Agendas: 2019-2021 Triennium Update 61
Gottumukkala, L.D., and Hayes, D., 2018. Introduction to RINs. Retrieved from https://www.celignis.com/RINs-credits.php
Greenea, 2021. The Year 2021 Which investments will see the light in the biofuel industry?. https://www.greenea.com/wp-content/uploads/2021/01/Greenea-Horizon-2030-Which-investments-will-see-the-light-in-the-biofuel-industry-1.pdf
IEA Bioenergy, 2018. SunPine tall oil diesel, Sweden: biofuel as enabler of the bioeconomy. Available at: https://www.ieabioenergy.com/wp-content/uploads/2018/02/6-Sunpine-TallOilDiesel_SE_Final.pdf.
IEA, World Energy Balances and Statistics, op. cit. note 31; IRENA, IEA and REN21, op. cit. note 1, p. 39; IRENA, “Running on renewables: Transforming transportation through renewable technologies Running on Renewables: Transforming Transportation Through Renewable Technologies (irena.org);
IEA, 2019. Renewables 2019: Transport, Transport – Renewables 2019 – Analysis - IEA.
IEA Bioenergy Task 37, 2017. Country Reports 2017. http://task37.ieabioenergy.com/countryreports.html
International Air Transport Association (IATA), 2017. Climate Change: three target and four pillars. https://www.iata.org/policy/environment/Pages/climate-change.aspx.
International Council on Clean Transportation (ICCT), 2018. Advanced Biofuel policies in select EU members states: 2018 Update.
International Maritime Organisation (IMO), 2016. The 2020 global sulphur limit. http://www.imo.org/en/MediaCentre/HotTopics/GHG/Documents/2020%20sulphur%20limit%20FAQ%202019.pdf
International Renewable Energy Agency (IRENA), 2016. Project Inventory, Advanced Liquid Biofuels;
REN21, 2018. Renewables 2018 global status report. http://www.ren21.net/wp-content/uploads/2018/06/17-8652_GSR2018_FullReport_web_-1.pdf
IRENA, IEA and REN21, 2018. Renewable Energy Policies in a Time of Transition. IRENA, OECD/ IEA and REN21, http://www.ren21.net/wp-content/uploads/2018/04/17- 8622_Policy_FullReport_web_FINAL.pdf
IRENA, IEA and REN21, 2019, op. cit. note 1, p. 45; IEA, “Does security of supply drive key biofuel markets in Asia?” Does security of supply drive key biofuel markets in Asia? – Analysis - IEA
Lane, J., 2020. It's the Summer of Renewable Diesel - but will the craze continue? What are the techs, the players, the strategic rationales, the competitive edge? DigestConnect, BiofuelsDigest Magazine.
Lonza, L. and O'Connell, A., 2018. Biofuels Production and Consumption in the European Union (EU): Status, Advances and Challenges. IEA Bioenergy Task 39 Newsletter, December 2018. http://task39.sites.olt.ubc.ca/files/2018/12/IEA-Bioenergy-Task-39-Newsletter-Issue-50-Final-Draft-1.pdf
O’Connell, A., Kousoulidou, M., Lonza, L., Weindorf, W., 2019. Considerations on GHG emissions and energy balances of promising aviation biofuel pathways. Renewable and Sustainable Energy Reviews, 101, 504-515.
Preem, 2018. Preem Evolution Diesel Plus. https://www.preem.se/privat/drivmedel/produktkatalog-privat/produkter/diesel/preem-evolution-diesel-plus/
REN21, 2018. Renewables 2018 global status report. http://www.ren21.net/gsr-2018/
REN21, 2021. Renewables 2021- Global status report. https://www.ren21.net/wp-content/uploads/2019/05/GSR2021_Full_Report.pdf
SLOCAT Partnership on Sustainable, Low Carbon Transport (SLOCAT), Transport and Climate Change 2018 Global Status Report (Shanghai: 2018), p. 1, https://slocat.net/tcc-gsr

Compare-and-contrast transport biofuel policies in member countries
IEA Bioenergy Task 39 - Implementation Agendas: 2019-2021 Triennium Update 62
State CO2-EOR Deployment Work Group, 2017. Capturing and Utilizing CO2 from Ethanol: Adding Economic Value and Jobs to Rural Economies and Communities While Reducing Emissions. http://www.kgs.ku.edu/PRS/ICKan/2018/March/WhitePaper_EthanolCO2Capture_Dec2017_Final2.pdf
(S&T)2 Consultants, 2020. Renewable Diesel. Virtual Webinar.
The Maritime Executive, 2018. IMO Agrees to CO2 Emissions Target. https://www.maritime-executive.com/article/imo-agrees-to-co2-emissions-target
van Dyk, S., Su, J., McMillan, J.D., Saddler, J., 2020. Drop-in biofuels- The key role that co-processing will play in its production. http://task39.sites.olt.ubc.ca/files/2019/02/Task-39-Drop-in-Biofuels-Full-Report-January-2019.pdf
van Dyk, S. Saddler, J., 2021. Progress in Commercialization of Biojet /Sustainable Aviation Fuels (SAF): Technologies, potential and challenges. http://task39.sites.olt.ubc.ca/files/2021/06/IEA-Bioenergy-Task-39-Progress-in-the-commercialisation-of-biojet-fuels-May-2021.pdf

Appendix A- Country Chapters
IEA Bioenergy Task 39 - Implementation Agendas: 2019-2021 Triennium Update 63
Appendix A- Country Chapters
Appendix A provides the update on biofuels policy and market development for each member country based on the collected data and information from the completed questionnaires.

Australia
IEA Bioenergy Task 39 - Implementation Agendas: 2019-2021 Triennium Update 64
1. Australia
Steve Rogers, Licella
Summary • Australia’s emissions have declined 16.7% since the peak in the year to June 2007. In the year to
March 2020, emissions per capita and the emissions of the economy were at their lowest levels in 30 years but remain the highest per capita in the OECD countries.
• The transport sector is responsible for 18.9% of national emissions and continues to increase.
• Biofuels are not currently included in any National Renewables Policy and whilst there is a federal biofuels incentive scheme, there is no federal biofuels policy and this is left to the States.
• So far, only two states have biofuels mandates, Queensland and New South Wales (NSW). The biofuels mandates in Queensland are 0.5% biodiesel and 4% ethanol, and 5% biodiesel and 6% ethanol (volume basis) in NSW. The NSW biofuels mandate, despite being in place since 2007, is ineffective as it is not enforced.
• The Producer Grant Scheme to reduce fuel excise for ethanol and biodiesel was revised in 2016. For biodiesel, excise increments year on year until it reaches 50% of the fossil diesel excise. Ethanol excise is capped at a lower price relative to biodiesel due to its lower energy content.
• The current production of ethanol and biodiesel in Australia constitutes only about 1% of the overall national consumption of petrol and diesel.
• The Australian Government introduced a carbon pricing scheme or “carbon tax” through the Clean Energy Act 2011. However, the initiative faced significant challenges from the opposition and the public, as it resulted in increased energy prices for both households and industry and was finally repealed in 2014.
• There are no advanced biofuels mandates and there is no production and only limited use of HVO/HEFA fuels.
• Exxon-Mobil refinery in Melbourne and BP refinery in Perth have announced their closure and conversion to import terminals.
• The Australian Government provides grants for R&D programmes in the area of renewable energy technologies, and invests in related R&D and early stage commercialisation.

Australia
IEA Bioenergy Task 39 - Implementation Agendas: 2019-2021 Triennium Update 65
1.1. Introduction
In Australia, federal energy policy is a political minefield and has been the downfall of numerous party leaders and Prime Ministers over the past ten years4. During this time, Australia has changed Prime Ministers six times. The very challenging federal electoral term of only three years, along with strong vested interests in fossil fuels, has made it impossible to get any long term energy policy in place to extend the federal Renewable Energy Target (RET). The RET was originally established in 2001 and subsequently extended in 2011 to deliver 45,000 gigawatt-hours of renewable electricity by 2020 as part of the Labour governments Clean Energy Future Package that also introduced a price on carbon as well as established the Clean Energy Finance Corporation (CEFC) and ARENA – The Australian Renewable Energy Agency. The Liberal opposition led by Tony Abbott had the reform of the carbon tax as a cornerstone policy and following Abbott’s election, the Labour government’s Clean Energy Future Package was dismantled in 2014; however, the CEFC and ARENA have remained despite Abbott trying to remove them. The latest federal attempt to link to policy Australia’s Paris GHG reduction obligations of 26% reduction on 2005 levels through the National Energy Guarantee (NEG) has been dumped following the removal of the latest Prime Minister Malcolm Turnbull. Turnbull has lost his leadership twice now over climate policy and has now resigned from politics. Currently, Australia produces about 2.4% of total world energy and is a major supplier of energy to world markets, exporting more than three-quarters of its energy output, worth nearly $A 80 billion. Australia is the world’s largest exporter of coal which accounts for more than half of Australia’s energy exports and is worth more than $A 40 billion. Additionally, Australia is one of the world’s largest exporters of uranium, and is ranked sixth in terms of liquefied gas (LNG) exports. In contrast, more than half of Australia’s liquid fuel needs are imported. Australia is the world’s twentieth largest consumer of energy and fifteenth in terms of per capita energy use. Australia’s primary energy consumption is dominated by coal (around 40%), oil (34%) and gas (22%). Coal accounts for about 75% of Australia’s electricity generation, followed by gas (16%), hydro (5%) and wind (around 2%) (see Figure 1.1 and Figure 1.2). 2
Figure 1.1. Australia’s Primary Energy Consumption
40%
34%
22%
4%
Coal Oil Gas Other
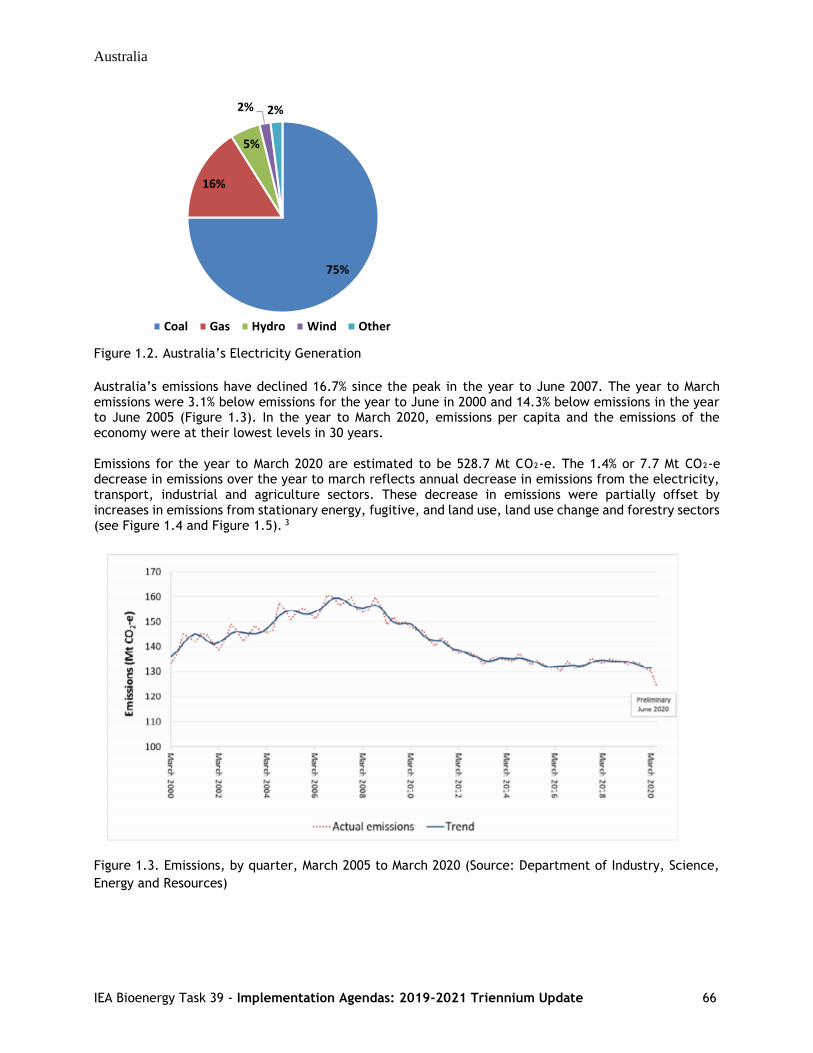
Australia
IEA Bioenergy Task 39 - Implementation Agendas: 2019-2021 Triennium Update 66
Figure 1.2. Australia’s Electricity Generation
Australia’s emissions have declined 16.7% since the peak in the year to June 2007. The year to March emissions were 3.1% below emissions for the year to June in 2000 and 14.3% below emissions in the year to June 2005 (Figure 1.3). In the year to March 2020, emissions per capita and the emissions of the economy were at their lowest levels in 30 years. Emissions for the year to March 2020 are estimated to be 528.7 Mt CO₂-e. The 1.4% or 7.7 Mt CO₂-e decrease in emissions over the year to march reflects annual decrease in emissions from the electricity, transport, industrial and agriculture sectors. These decrease in emissions were partially offset by increases in emissions from stationary energy, fugitive, and land use, land use change and forestry sectors (see Figure 1.4 and Figure 1.5). 3
Figure 1.3. Emissions, by quarter, March 2005 to March 2020 (Source: Department of Industry, Science,
Energy and Resources)
75%
16%
5%
2% 2%
Coal Gas Hydro Wind Other

Australia
IEA Bioenergy Task 39 - Implementation Agendas: 2019-2021 Triennium Update 67
Figure 1.4. Percentage change in emissions, by sector, since year to March 2020 (Source: Department of Industry, Science, Energy and Resources)
Figure 1.5. Share of total emissions, by sector, for the year to March 2020 (Source: Department of Industry, Science, Energy and Resources)
Australia’s geography necessitates its heavy reliance on air travel, long-distance road freight and rail and marine freight. In Australia, transport is responsible for 18.9% of national emissions.4 Electrification is expected to have a significant impact on the light vehicle transport sector in the long term (2050+) but
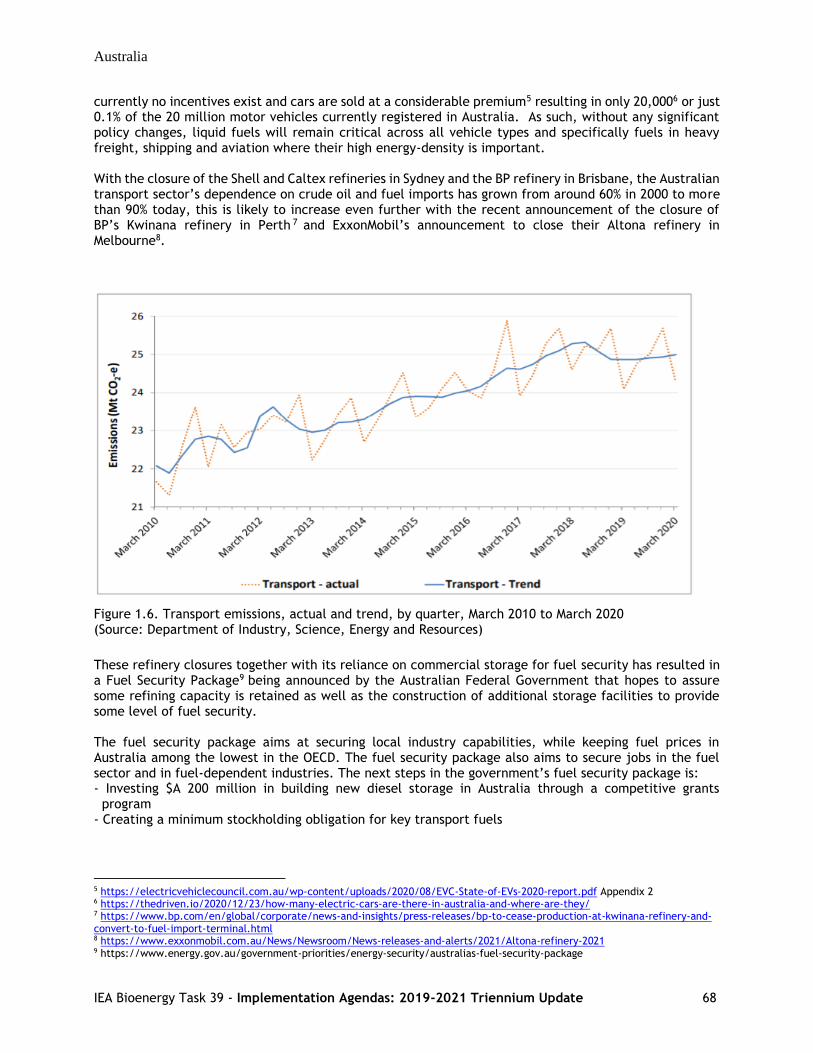
Australia
IEA Bioenergy Task 39 - Implementation Agendas: 2019-2021 Triennium Update 68
currently no incentives exist and cars are sold at a considerable premium5 resulting in only 20,0006 or just 0.1% of the 20 million motor vehicles currently registered in Australia. As such, without any significant policy changes, liquid fuels will remain critical across all vehicle types and specifically fuels in heavy freight, shipping and aviation where their high energy-density is important. With the closure of the Shell and Caltex refineries in Sydney and the BP refinery in Brisbane, the Australian transport sector’s dependence on crude oil and fuel imports has grown from around 60% in 2000 to more than 90% today, this is likely to increase even further with the recent announcement of the closure of BP’s Kwinana refinery in Perth 7 and ExxonMobil’s announcement to close their Altona refinery in Melbourne8.
Figure 1.6. Transport emissions, actual and trend, by quarter, March 2010 to March 2020 (Source: Department of Industry, Science, Energy and Resources)
These refinery closures together with its reliance on commercial storage for fuel security has resulted in a Fuel Security Package9 being announced by the Australian Federal Government that hopes to assure some refining capacity is retained as well as the construction of additional storage facilities to provide some level of fuel security. The fuel security package aims at securing local industry capabilities, while keeping fuel prices in Australia among the lowest in the OECD. The fuel security package also aims to secure jobs in the fuel sector and in fuel-dependent industries. The next steps in the government’s fuel security package is: - Investing $A 200 million in building new diesel storage in Australia through a competitive grants program - Creating a minimum stockholding obligation for key transport fuels
5 https://electricvehiclecouncil.com.au/wp-content/uploads/2020/08/EVC-State-of-EVs-2020-report.pdf Appendix 2 6 https://thedriven.io/2020/12/23/how-many-electric-cars-are-there-in-australia-and-where-are-they/ 7 https://www.bp.com/en/global/corporate/news-and-insights/press-releases/bp-to-cease-production-at-kwinana-refinery-and-convert-to-fuel-import-terminal.html 8 https://www.exxonmobil.com.au/News/Newsroom/News-releases-and-alerts/2021/Altona-refinery-2021 9 https://www.energy.gov.au/government-priorities/energy-security/australias-fuel-security-package

Australia
IEA Bioenergy Task 39 - Implementation Agendas: 2019-2021 Triennium Update 69
- Developing a long-term income stream to refineries that value their contribution to national security and sovereign capability
- Modernising Australia’s current suite of liquid fuel legislation to support a more effective government response in the event of market disruptions.5
Figure 1.7. Consumption of primary liquid fuels, actual and trend, by quarter, March 2010 to March 2020
(Source: Department of Industry, Science, Energy and Resources)
1.2. Main drivers for biofuels policy
Four of the six States and the two Territory governments have made commitments to renewable energies for electricity; however, there are no national renewable fuels targets, with only the States of New South Wales (NSW) and Queensland having any mandates (Table 1.1).
Table 1.1. Renewable energy (electricity) and biofuel mandates in Australian States and Territories
State/Territory Target Target Date
Net Zero Emission Target
Current % Renewable Energy
Biodiesel mandate (%)
Ethanol Mandate (%)
ACT 100% 2020 2050 22
SA 50% 2050 47
VIC 40% 2025 2050 12
Queensland 50% 2030 2050 7 0.5 4
NSW No target
2050 17 5 (achieving 0.1)
6 (achieving 2.5)
Tasmania 100% 2022 2050 92
WA No target
No 7
Northern Territory
50% 2030 No 2
National 26% 2030
Unfortunately, the NSW mandate is ineffectual as the Government grants the liable party (fuel distributors) exemptions due to a supposed lack of supply although many biofuel plants have been idled due to lack of demand (see Section 4 below). Understandably investors are scared to invest in new plants

Australia
IEA Bioenergy Task 39 - Implementation Agendas: 2019-2021 Triennium Update 70
due to this, which results in the policy being ineffective. As a consequence, GHG emissions from transport have increased by 22% since 2005 and now account for 18.9% of total emissions, up from 14% in 2005 (See Figure 1.4, Figure 1.5 and Figure 1.6).6 For a volume fuel retailer to meet the six percent ethanol mandate, at least 60% of petrol sold would need to be E10. This goal was not achieved by volume fuel retailers as demonstrated in Figure 1.8 and . Overall, only 25% of fuel sales were E10 from the period of 2018/2019.
Figure 1.8. E10 Sales since July 2010
(Source: IPART, Ethanol Market Monitoring 2018/19 Final Report, December 2019)
Table 1.2. Biofuels results achieved by volume fuel retailers, 1 January – 31 March 2020
(Source: FairTrading NSW)
With the fragmented State policies the federal Liberal/National Coalition party hasn’t to date shown any interest in enhancing any biofuels policy although in 2020 they commissioned Deloittes to undertake a Bioenergy Roadmap. This is anticipated to be released in early 2021. The existing ethanol policy was found in a 2015 report from the Federal Audit Office to be ineffectual and to have benefited one company significantly.

Australia
IEA Bioenergy Task 39 - Implementation Agendas: 2019-2021 Triennium Update 71
Excerpt of findings from the Auditor General’s report into the federal ethanol incentive program:
1.3. Biofuels policy
As outlined in Figure 1.9, biofuels are currently not included in any National Renewables Policy and whilst there is a federal biofuels incentive scheme, there is no federal biofuels policy and this is left to the States. So far, only two states Queensland and New South Wales (NSW) have mandates but unfortunately the NSW mandate, despite being in place since 2007 is ineffective as outlined above.

Australia
IEA Bioenergy Task 39 - Implementation Agendas: 2019-2021 Triennium Update 72
Figure 1.9. Timeline of Australian policies and commissioned reports on biofuels
(Source: ResearchGate)
Table 1.3 and Figure 1.10 display the sales of petroleum products in Australia.

Australia
IEA Bioenergy Task 39 - Implementation Agendas: 2019-2021 Triennium Update 73
Table 1.3. Sales of petroleum products by type 2018-2019 (ML) (Source: Australian Petroleum Statistics - Issue 282, 2020)
Figure 1.10. Australian Petroleum Statistics (Energy.gov.au)
(https://www.energy.gov.au/sites/default/files/Australian%20Petroleum%20Statistics%20-
20Issue%20282%20January%202020_0.pdf)
Petroleum Product Fuel Type % Sales Amount (ML)
LPG Automotive Use 1% 608.2
Non-Automotive Use 2.47% 1496.3
Automotive Gasoline
Regular (<95 RON) 16.26% 9882.1
Premium (95-97 RON) 3.62% 2195.4
Premium (98+ RON) 5.08% 3077.9
Ethanol-Blended Fuel 4.02% 2435.0
Aviation Turbine Fuel Domestic 5.68% 3445.6
International 9.87% 5988.6
Misc.
Aviation Gasoline 0.11% 66.9
Diesel Oil 48.24% 29255.1
Fuel Oil 1.67% 1012.6
Lubricating Oils & Greases 0.55% 332.6
Other Products 1.43% 865.8
Total: 60,662.1
Sales of petroleum Products by Type 2018-2019 (ML)
LPG (Automotive Use)
LPG (Non-Automotive Use)
Regular (<95 RON)
Premium (95-97 RON)
Premium (98+ RON)
Ethanol-blended fuel
Aviation Turbine Fuel (Domestic)
Aviation Turbine Fuel (International)
Aviation Gasoline
Diesel Oil
Fuel Oil
Lubricating Oils & Greases
Other Products

Australia
IEA Bioenergy Task 39 - Implementation Agendas: 2019-2021 Triennium Update 74
Figure 1.11. State Biofuel Mandates in Australia
The Queensland mandate was introduced in January 2017 as part of its Bio-Futures Package, which is a very positive initiative that has garnered widespread interest from other countries interested in the enormous potential of Queensland’s biomass resources. The launch of the mandate was accompanied by a successful advertising campaign explaining the benefits of using ethanol. There was also an App developed to allow drivers to determine if ethanol could safely be used in their cars.8 Australia has natural advantages for producing bioenergy, including expertise in agricultural science, an established agricultural economy and an abundance of natural resources. With the right policies, Australia has enormous potential to significantly increase supply and demand of biofuels, even in a scenario with significant electrification of transport and mining demand. Aviation, marine and heavy vehicles have few or no alternatives to using liquid fuels. The largest increase in liquid fuel demand in Australia over the long term is expected to be in aviation fuel. In the 2040 scenario by Climate Works Australia partially illustrated in Figure 1.12, advanced/drop-in biofuels make up an increasing share of biofuels supply as they become more cost-competitive, since such biofuels face fewer barriers to entry such as the need for engine modifications at high biofuel blend rates. ARENA anticipates that in the longer term advanced/drop-in biofuels will have a substantially larger share of the Australian biofuels market than ethanol and FAME biodiesel.

Australia
IEA Bioenergy Task 39 - Implementation Agendas: 2019-2021 Triennium Update 75
Figure 1.12. Energy supply projections – non-electricity
(Source: ClimateWorks Australia)
1.3.1. Biofuels obligations
As outlined above, biofuels are currently not included in any National Renewables Policy and whilst there is a federal biofuels incentive scheme, there is no federal biofuels policy and this is left to the States. So far, only two states have mandates including Queensland and New South Wales (NSW) (Table 1.4) but unfortunately the NSW mandate despite being in place since 2007 is ineffective as the mandate is not enforced due to lack of supply. Table 1.4. Current biofuels mandates in Australia
STATE Biodiesel Mandate Ethanol Mandate
NSW 5.0% (achieving 0.1%) 6% (achieving 2.5%)
QLD 0.5% 4%
The current production of ethanol and biodiesel in Australia constitutes only about 1% of the overall national consumption of petrol and diesel. Concerns have been expressed about possible petrol engine damage by ethanol and fuel distributors round down the octane of 10% ethanol blended fuels from 94.8% to show an octane of 94 at the pump. Despite most Australian vehicles being able to use a blend of 10% of ethanol with petrol without modification; this is a sufficient deterrent to stop them using the ethanol blended fuels, despite the cleaner burning properties. Overall there is a lack of understanding of different fuel types by the majority of consumers enabling the fuel retailers, through their marketing efforts, to increase sales of their higher margin, higher octane (98) fuels. While biofuels have been justified as extending supplies of liquid transport fuels, their use is complementary to other technologies aimed at improving fuel efficiency. Significant changes in social attitudes to vehicles, particularly in urban areas, are needed if congestion and air pollution are to be reduced. Many other technologies have been demonstrated but need to be reduced in cost to be commercially viable.9 The use of stronger, lighter vehicle materials reduces weight and thus fuel consumption and emissions of GHGs. The industry rule is that a 10% weight reduction gives a 5% increase in fuel efficiency, but the use of composite materials across the vehicle can increase this to 10%. The benefits of weight reduction can be further realised if coupled to a hybrid or electric vehicle. Current hybrid vehicles can reduce petrol consumption by about a third. As highlighted above though, there are currently no incentives or policies to incent the use of more efficient less GHG producing vehicles.

Australia
IEA Bioenergy Task 39 - Implementation Agendas: 2019-2021 Triennium Update 76
The Queensland Government has set a state target to reach zero net emissions by 2050. Along with the interim target for at least a 30% reduction in emissions on 2005 levels by 2030, this target is a critical first step to drive the investment and action needed to transition Queensland economy to a zero emissions future. https://www.qld.gov.au/environment/climate/climate-change/response/greenhouse-emissions#:~:text=Along%20with%20the%20interim%20target,to%20a%20zero%20emissions%20future There is no LCFS or similar fuel efficiency standard. Light and Heavy vehicles in Australia have to comply with regulations based around Euro V resulting in current noxious emissions standards now trailing most other developed countries including the EU, US, Canada, Japan and South Korea 10. Consultation is currently underway looking to mandate the implementation of Euro 6d11 from July 2027. There are currently no policies or incentives in place to promote aviation or marine biofuels.
1.3.2. Excise duty reductions
The Producer Grant Scheme whereby the producer of ethanol or biodiesel was provided with a grant equivalent to the excise amount (see Figure 1.13) was stopped in June 2015, with excise being removed on these two commodities. Going forward, excise for these biofuels increments up year on year. For biodiesel, this occurs until the biodiesel excise reaches 50% of the fossil diesel excise. Ethanol excise is however capped at a lower price relative to biodiesel due to its lower energy content.
Figure 1.13. Fuel excise changes (assumed 2.5% CPI indexation)
Disappointingly, in the excise adjustments, no provision was made for renewable diesel (which was in the earlier scheme) as it was deemed not required as none was being produced at commercial scale. Bioenergy Australia is currently working to try to have renewable diesel again included in excise benefits. https://www.statedevelopment.qld.gov.au/industry-development/biofutures.html The Australian Government introduced a carbon pricing scheme or “carbon tax” through the Clean Energy Act 2011. The initiative was intended to control emissions in the country, as well as support the growth of the economy through the development of clean energy technologies. It was supervised by the newly-created Climate Change Authority and the Clean Energy Regulator. However, although it did achieve a reduction in the country’s carbon emissions, the initiative faced significant challenges from the opposition
10 P33 of footnote 8 11 https://www.infrastructure.gov.au/vehicles/environment/forum/files/light-vehicle-emission-standards-for-cleaner-air.pdf

Australia
IEA Bioenergy Task 39 - Implementation Agendas: 2019-2021 Triennium Update 77
and the public, as it resulted in increased energy prices for both households and industry and was finally repealed in 2014. https://www.centreforpublicimpact.org/case-study/carbon-tax-australia/#:~:text=The%20Australian%20government%20introduced%20a,development%20of%20clean%20energy%20technologies
1.3.3. Fiscal Incentives
Not available
1.3.4. Investment subsidies
Queensland is by far the most prominent state in terms of promoting the use of biofuels. In 2016, it launched its Bio-futures program that aims to develop a $1 billion bioeconomy. Various Queensland State programs are in place to help support this. (https://www.statedevelopment.qld.gov.au/industry-development/biofutures.html.)
1.3.5. Other measures stimulating biofuels implementation
The Australian Renewable Energy Agency (ARENA) was established in 2011 to improve the competitiveness of renewable energy technologies and to increase the supply of renewable energy. It provides grants for R&D programmes in the area of renewable energy technologies, and it invests in related R&D and early stage commercialisation. It has invested in and continues to support the Australian bioenergy sector through co-funding grants; see https://arena.gov.au/about/what-is-renewable-energy/bioenergy/ Australia has a very positive R&D arrangement were companies with a turnover of less than $20 million per annum are able to get a rebate of 43.5% on R&D expenses. https://www.ato.gov.au/Business/Research-and-development-tax-incentive/. The Australian Renewable Energy Agency (ARENA) was established in 2011 to improve the competitiveness of renewable energy technologies and to increase the supply of renewable energy. It provides grants for R&D programmes in the area of renewable energy technologies, and it invests in related R&D and early stage commercialisation. It has invested in and continues to support the Australian bioenergy sector through co-funding grants; see https://arena.gov.au/about/what-is-renewable-energy/bioenergy/ The CEFC is also a $ A 100 million cornerstone investor in a $ A 200 million bioenergy fund that is run by the specialist investment organisation Foresight Group, which has invested in multiple bioenergy projects in the UK: http://www.foresightgroup.eu/institutional/our-business/infrastructure/australian-bioenergy-fund-abf/
Despite all the above incentives and funding opportunities, biofuels development and commercial
deployment face a number of significant barriers including:
• Lack of consistent policy causing geo-political risk
• Australia is a high cost economy and this impacts the cost of feedstocks, including aggregation, and
feedstocks also often have alternative, higher value uses
• Lack of fuel distribution infrastructure, and conflict with the business models of existing oil
companies

Australia
IEA Bioenergy Task 39 - Implementation Agendas: 2019-2021 Triennium Update 78
• Inadequate or lack of biorefining capacity (in Australia) to produce refined, drop-in biofuels suitable
for end users
• Low levels of consumer/investor knowledge and acceptance of bioenergy/biofuels
• Fragmented biofuels supply chains
ARENA’s investment in biofuels demonstration projects, and in some cases in research and development, has the potential to address these barriers and improve the competitiveness and supply of biofuels in the long term, as well as helping Australia capitalise on its natural advantages in producing biofuels.
1.4. Promotion of advanced biofuels
Currently, there are no specific policies promoting the sale of advanced biofuels and there is limited production of advanced biofuels in Australia. However, Australia has been one of the world leaders in development of advanced biofuels technologies due to its significant R&D tax credit outlined above and support from ARENA. As a consequence, Australia is home to the world’s largest Hydrothermal Liquefaction (HTL) pilot plant at Licella’s Somersby facility in NSW. This is one of three pilot plants at the site and is capable of processing 10,000 tonne per year of feedstock slurry. Work at this site has enabled the development of two commercial projects in Canada and the UK. A domestic waste lube oil refiner, Southern Oil, is looking to leverage its refining capability at its 2 facilities in Wagga Wagga and Gladstone and has announced plans for a 200 million liters (ML) advanced biofuels plant at its Gladstone facility in Queensland. Work on HTL treatment of algae and biosolids was undertaken by Muradel at their Wyalla facility in South Australia. Cellulosic ethanol development is also being assisted by ARENA through its support of Ethtec who aim to construct a $30 million purpose built pilot-scale facility in the Hunter Valley in NSW. The facility is targeting a range of non-food lignocellulosic biomass waste plant matter including sugarcane bagasse, forestry residues and cotton gin trash known. Curtin University has also received support for their research work on gasification and pyrolysis of mallee feedstocks. Gasification R&D projects also have been conducted on the production of advanced biofuels from algae and lignocellulosic biomass. https://arena.gov.au/projects/?project-value-start=0&project-value-end=500000000&technology=bioenergy https://www.licella.com.au/facilities/ https://www.licella.com.au/projects/ http://www.sor.com.au/ http://www.sor.com.au/northern-oil-advanced-biofuels-pilot-plant https://arena.gov.au/projects/advancing-marine-microalgae-biofuel-to-commercialisation/ https://arena.gov.au/projects/advanced-biomass-gasification-technology/
1.5. Market development and policy effectiveness
As can be seen from Figure 1.14, Table 1.5, Table 1.6 and Table 1.7 and the findings of the Auditor General, biofuel development has been ineffective with consumption actually declining and actual use being just over 1% of liquid fuels used.

Australia
IEA Bioenergy Task 39 - Implementation Agendas: 2019-2021 Triennium Update 79
Figure 1.14. Australian transport energy consumption, by major fuel type, 2004-2019 (Source: Department
of Industry, Science, Energy and Resources (2020) Australian Energy Statistics Table F)

Australia
IEA Bioenergy Task 39 - Implementation Agendas: 2019-2021 Triennium Update 80
Table 1.5- Australian renewable energy consumption, by fuel type, 2018-2019
(Source: Australian Energy Update 2019)

Australia
IEA Bioenergy Task 39 - Implementation Agendas: 2019-2021 Triennium Update 81
Table 1.6. The Australian Ethanol Industry (ML)
(Source: USDA Foreign Agricultural Service, Australia Biofuels Annual November 2019)

Australia
IEA Bioenergy Task 39 - Implementation Agendas: 2019-2021 Triennium Update 82
Table 1.7. The Australian Biodiesel Industry (ML)
(Source: USDA Foreign Agricultural Service, Australia Biofuels Annual November 2019)
Despite significant investment and subsidies over the years, Australia’s Biofuels industry is at its lowest output in a decade with only the Manildra and Wilmar ethanol plants producing anywhere close to their capacities and the United plant being idled in July 2020. Whilst there are three bio-diesel plants still operational (March 2021) they are all operating at significantly reduced capacity with two of the three plants being operated as adjacent businesses, Biodiesel Industries with a used cooking oil collections business and Just Biodiesel adjacent to a meat works. Most production is targeted at the incented export markets of California and Europe where the prices possible justify the costs of production. With the bio-diesel feedstocks of tallow and Used Cooking Oil (UCO) currently (March 2021) costing (A$1,100-A$1,200 a tonne) ~15% more than the equivalent finished fossil diesel (A$1.1 vs A$0.95 a litre), it is clear that the domestic bio-diesel industry cannot currently compete against the non-renewable fossil equivalents. List of operating and closed biofuels plants are shown in Table 1.8 and Table 1.9.

Australia
IEA Bioenergy Task 39 - Implementation Agendas: 2019-2021 Triennium Update 83
Table 1.8. Operating Commercial Biofuels Plants in Australia
Name of company Location Type Feedstock Production Capacity (ML/year)
Production (ML/year)
Manildra Group Bomaderry NSW Ethanol Waste Starch 300 300
Wilmar Sucrogen Sarina Queensland
Ethanol Sugarcane 60 60
Biodiesel Industries Australia
Maitland Biodiesel Used Cooking Oil, Vegetable Oil
20 1
Ecotech Biodiesel Narangba Queensland
Biodiesel Tallow, Usede Cooking Oil
30 5
Just Biodiesel Barnawartha
Barnarwatha Vic Biodiesel Vegetable Oil, Tallow, Used Cooking Oil
50-60 20
Source CEFC Figure 1.8– updated March 21 https://www.cefc.com.au/media/402280/biofuels-and-transport-an-australian-opportunity-november-2019.pdf

Australia
IEA Bioenergy Task 39 - Implementation Agendas: 2019-2021 Triennium Update 84
Table 1.9. Closed or idled plants in Australia
1.6. Co-processing at oil refineries
Currently, there are four operational refineries in Australia (see Figure 1.15 and Table 1.10); however, two (Mobil & BP) have recently announced that they will close their refining operations and convert to import terminals. Ampol is currently reviewing whether it too will convert its operations at Lytton to an import terminal. If this is the case it would leave just one operational refinery in Australia being Viva’s in Geelong. Currently, no co-processing is occurring in any of these plants.
Figure 1.15. Map of oil refineries in Australia
Name of company Status (planned; operational;
closed)
Type Feedstock Production Capacity (ML/year)
United Petroleum
Dalby BioRefinery
Idled July 2020 Bioethanol Sorghum 80
ARfuels Barnawatha Closed 2016 Biodiesel Tallow, Used Cooking Oil
60
ARfuels Largs Bay Closed 2016 Biodiesel Tallow, Used Cooking Oil
45
ARfuels Picton Closed 2016 Biodiesel Tallow,
Used Cooking Oil
45
Macquarie Oil Not producing bio-fuels
Biodiesel Poppy Seed Oil, Waste Vegetable Oil
15
Neutral Fuels Closed Biodiesel Used Cooking Oils Unknown
Smorgon Fuels – Biomax Plant
Closed Biodiesel Tallow, Juncea Oil, Canola Oil
15-100
Territory Biofuels Closed 2009 Biodiesel RBD Palm Oil, Tallow, Used Cooking Oil
140

Australia
IEA Bioenergy Task 39 - Implementation Agendas: 2019-2021 Triennium Update 85
Table 1.10. Oil refineries in Australia and their capacities
Location Company Capacity (ML)
Melbourne – Altona Mobil 5000
Brisbane – Lytton Ampol 6500
Victoria – Geelong Viva Energy 7500
Western Australia – Kwinana
BP 8600
Sources
1.http://www.abc.net.au/news/2018-08-23/climate-change-policy-a-brief-history-of-seven-killings/10152616 2. https://www.ga.gov.au/scientific-topics/energy/basics#:~:text=Australia%20produces%20about%202.4%20per,world's%20largest%20exporter%20of%20coal. 3. https://www.industry.gov.au/sites/default/files/2020-08/nggi-quarterly-update-march-2020.pdf 4. https://arena.gov.au/assets/2019/11/biofuels-and-transport-an-australian-opportunity.pdf 5.https://www.energy.gov.au/government-priorities/energy-security/australias-fuel-security-package 6.https://www.abc.net.au/news/2019-07-02/renewable-energy-targets-may-not-be-met-by-all-states/11267824 7.https://www.fairtrading.nsw.gov.au/__data/assets/pdf_file/0005/381488/Biofuels_results_4Q_2017.pdf 8.https://www.dnrme.qld.gov.au/__data/assets/pdf_file/0008/1445129/biofuels-discussion-paper.pdf 9.https://www.atse.org.au/wp-content/uploads/2019/01/30-50-technological-implications-australia-population-2050-report.pdf 10.https://royalsociety.org/~/media/royal_society_content/policy/publications/2008/7980.pdf
Austria
IEA Bioenergy Task 39 - Implementation Agendas: 2019-2021 Triennium Update 86
2. Austria
Dina Bacovsky, Andrea Sonnleitner, BEST – Bioenergy and Sustainable Technologies GmbH
Summary • The main part of the total GHG emissions in Austria comes from the energy sector with a contribution of
69%. The main GHG contributor to the energy sector is the transport sector with 24 Mt CO2eq which corresponds to 45% of emissions in the energy sector or 31% of total national emissions.
• The primary policy instrument that encouarges the production and use of transport biofuels is biofuel blending mandate. The biofuel volume obligation includes at least 3.4% ethanol and 6.3% biodiesel on an energy content bases. The carbon intensity or emissions of biofuels are not currently taken into account.
• Tax concessions are granted for fuels with a biofuel share of at least 4.4% (by energy content). However, to be eligible, the fuel must also be sulphur-free (less than 10 mg sulphur per kg of fuel). Since January 2000, the use of neat or pure biofuels as fuels has been exempted from mineral oil tax.
• The energetic substitution of biofuels consumed in road transport in Austria in 2018 was 6.25%. Of these, 85% were Biodiesel, 11% Bioethanol and Bio-ETBE and 4% HVO (all by energy content).
• To promote the production and consumption of advanced biofuels, the revised RED (RED II) targets will be implemented (0.2% target by 2022) in Austria.
• There are no specific policies promoting aviation and marine biofuels in the country. However, there is the intention to promote aviation biofuels. The COVID-19 induced rescue deal for the Austrian Airlines company is said to include conditions to reduce the airline's environmental impact.
• Austria’s sustainability assessments are based on RED and EU frameworks. All companies along the biofuel production chain have to be in charge of a certification either from a system authorized from the European Commission (EC) or a national or bilateral acknowledged system to be registered in the national monitoring system, elNa.
• In Austria, one large bioethanol production facility and seven FAME (biodiesel) production facilities were operating in 2018. Other fuels, which are produced in smaller production facilities with no relevant values available, are pure plant oils and biomethane. Currently, there is no domestic commercial production of advanced biofuels, HVO or HEFA in Austria, but since January 2021 one facility for the production of ethanol from brown liquor is operational at a pulp mill.
• Biofuel produced from feedstocks with low carbon intensity in Austria find better markets in countries such as Germany and Sweden where a GHG reduction quota is obligatory. Therefore, there is an active export of biodiesel produced in Austria from waste materials.
• In 2016, OMV, the only oil refinery company in Austria, successfully conducted the first field trial of co-processing using rapeseed oil and obtained certification in accordance with the REDcert standard, an EU-recognized system for the certification of sustainable biomass.

Austria
IEA Bioenergy Task 39 - Implementation Agendas: 2019-2021 Triennium Update 87
2.1. Introduction
The total primary energy supply (TPES) in Austria was 33.8 million tonnes of oil equivalent (Mtoe) in the year 2018. Renewable energy accounts for about 34% of Austria’s total primary energy supply, most of it in the form of biofuels, combustible waste and hydropower, around 35% of Austria’s energy needs are produced domestically. The TPES is the national production plus imports minus exports. The TFC Total final consumption is the TPES minus transformation and other losses. As shown in Figure 2.1, energy supply and demand in Austria for the year 2018. National production comes to 12 Mtoe with the main part coming from renewables. The end energy consumption can be divided into 3 sectors – manufacturing industry, transport and others including private and public applications as well as agricultural energy use. The share of the transport sector in total final energy consumption is 36%.
Figure 2.1. Energy supply and demand in Austria, 2018. (data from Statistics Austria 2020)
TPES Total Primary energy supply; TFC Total final consumption
The total greenhouse gas emissions in Austria amounted to 79 Mt CO2eq in the year 2018 (UBA, 2019) (see Figure 2.2). This figure is calculated without Land Use, Land Use Change and Forestry – LULUCF. Compared to the base year of 1990, GHG emissions in Austria increased by 0.7% and compared to the previous year (2017) decreased by 3.7%.
Manufactoring Industry
Transport
Others
0
5
10
15
20
25
30
35
40
Nationalproduction
TPES Total finalconsumption
Total finalconsumption by
sector
Mtoe Total energy balance Austria 2018
Others
Transport
Manufactoring Industry
Heat
Electricity
Waste
Renewables
Natural Gas
Oil
Coal

Austria
IEA Bioenergy Task 39 - Implementation Agendas: 2019-2021 Triennium Update 88
Figure 2.2. GHG emission trends in total and for transport (kt CO2eq) for Austria
The main part of the total GHG emissions in Austria comes from the energy sector with a contribution of 69%. The origin of 99% of these emissions is fuel combustion. The most important sub-category of the energy sector is the transport sector with 24 Mt CO2eq which corresponds to 45% of emissions in the energy sector or 31 % of total national emissions (see Figure 2.3).
Figure 2.3. Emissions per sector (Mt CO2eq) in Austria 2018
The Austrian transport sector showed a sharp rise in GHG emissions since 1990 with 14,000 ktCO2eq in 2019 and 24,500 ktCO2eq in 2018, a rise of 75% . The reason was mainly the increased annual mileage in freight and passenger transport. In addition, the fuel export increased considerably since 1990, caused by lower fuel prices in Austria compared to neighbouring countries. In the years from 2005 until 2012 the
0
10,000
20,000
30,000
40,000
50,000
60,000
70,000
80,000
90,000
100,000
1990(Baseyear)
2000 2005 2006 2007 2008 2009 2010 2011 2012 2013 2014 2015 2016 2017 2018
GHG emission in total and for transport (kt CO2eq), Austria
Total Emissions/Removals without LULUCF Transport
16
7
1
10
11
24
90
55
Industrial Processes and product use Agriculture
Waste Energy - Energy Industries
Energy - Manufacturing industries and construction Energy - Transport
Energy - Other Sectors Energy - Fugitive emissions from fuels

Austria
IEA Bioenergy Task 39 - Implementation Agendas: 2019-2021 Triennium Update 89
GHG emissions were slightly decreasing due to the rising amounts of biofuels and the improved fuel consumption in newer vehicles.
2.2. Main drivers for biofuels policy
The main driver for biofuels production in Austria is EU legislation for the promotion of renewable energy. The rationale behind the EU legislation is a combination of concerns regarding energy supply security, the need for climate change mitigation, and the wish for rural development and job creation. While rural development and job creation were the main drivers in the beginning, the importance of climate change mitigation has increased and is reflected by ongoing discussions on the greenhouse gas emission benefits of biofuels. The EU has established a legal framework concerning transport fuels. These include the Renewable Energy Directive (RED) 2009/28/EC on the promotion and use of energy from renewable sources and the Fuel Quality Directive (FQD) 2009/30/EC. The RED has set a goal of 20% final energy consumption from renewable sources by 2020, and a specific sub-target of 10% share of renewable energy in the transportation sector by 2020; the FQD requires a minimum 6% reduction in GHGs per energy unit of transport fuel by 2020. Both directives include sustainability criteria for biofuels, requiring at least 35% savings in GHG emissions as compared to fossil fuels by 2013. This requirement increased to at least 50% by 2017, and 60% by 2018 for biofuels produced by new facilities. These EU Directives are binding for all member states and have been implemented into the respective national laws. Post 2020 targets for renewable energy are a minimum of 27% of final energy consumption in the EU as a whole by 2030. In December 2018, the revised Renewable Energy Directive (RED II) 2018/2001/EU entered into force, and new targets and also sub-targets for the transport sector have been defined. In RED II, the overall EU target for renewable sources share by 2030 has been raised to 32% in gross final energy consumption. For the transport sector, the overall goal is to reach 14% renewable energy by 2030; advanced biofuels may be double-counted for reaching this target, and renewable electricity used in vehicles may be quadruple-counted. Advanced biofuels should contribute a minimum share of 0.2 % of biofuels by 2022, 1% by 2025, and 3.5 % by 2030. The contribution of conventional biofuels is capped at 7% or lower, depending on the level of current consumption in the respective member state. In Austria, further legislation, transposing the new RED II Directive into national law needs to be created and will constitute the framework targets beyond 2020. The amendment of the respective laws is planned for June 2021. The national targets and objectives in the Integrated National Energy and Climate Plan for Austria (2019) could be divided into 5 dimensions: decarbonisation, energy efficiency, security of energy supply, internal energy market, and research, innovation and competitiveness. Beside the objectives of the European climate and energy policy framework, Austria defined some specific targets for the years 2021-2030 in NECP:
• Reduction of GHG emissions (non-ETS) by 36% compared to 2005
• GHG contribution in transport sector: -7.2 million t CO2 equivalent compared to 2016 (total
contribution)
• Increase the share of renewable energy in gross final energy consumption of energy to 46-50%,
and source 100% of electricity consumption from renewables (nationally/balanced)
• Increase the share of renewable energy in transport in 2030 to at least 14% by using biofuels and
increasing the share of e-mobility

Austria
IEA Bioenergy Task 39 - Implementation Agendas: 2019-2021 Triennium Update 90
2.3. Biofuels policy
The main legislations that have impacted the biofuels production and use in Austria include:
• EU Renewable Energy Directive (RED) 2009/28/EC
• EU Renewable Energy Directive (RED II) 2018/2001/EU
• EU Fuel Quality Directive (FQD) 2009/30/EC
• EU ILUC Directive 2015/1513/EU
• Fuel Ordinance – Kraftstoffverordnung 2012 BGBl. II Nr. 398/2012 idF BGBl. II Nr. 86/2018
• Sustainability Ordinance – Nachhaltigkeitsverordnung BGBl. II Nr. 157/2014
• Ordinance on Agricultural Feedstocks for Biofuels - Landwirtschaftliche Ausgangsstoffe für
Biokraftstoffe und flüssige Biobrennstoffe BGBl. II 250/2010
• Mineral Oil Tax Law - Mineralölsteuergesetz 1995 BGBl. I Nr. 630/1994 idF BGBl. I Nr. 104/2018
• Bioethanol Blending Order - Bioethanolgemischverordnung BGBl. II Nr. 378/2005 idF BGBl. II Nr.
63/2016
• Regulation on Emissions at Type Approval, Reg No. 715/2007
• Regulation on Emission Performance of Cars, Reg. No 443/2009; Reg. No 333/2014
Figure 2.4 shows the timeline of the biofuel policies that have been introduced in Austria to encourage the production and use of biofuels in the country since 1995. Biofuel blending mandate has been the key policy instrument in Austria to support the development and deployment of transport biofuels markets. There are no market-based mechanisms such as Low Carbon Fuel Standard (LCFS) or Emissions Trading (cap-and-trade) in the country. To promote the production and use of advanced biofuels, the targets mentioned in the revised RED will be implemented (0.2% target by 2022). There are no specific policies promoting aviation and marine biofuels in the country. However, there is the intention to promote aviation biofuels, the COVID-19 induced rescue deal for the Austrian Airlines company is said to include conditions to reduce the airline's environmental impact.
Figure 2.4. Timline of biofuel policies development in Asutria to encourage the production and use of
biofuels
2.3.1. Biofuels obligations
On 4 November 2004, the EU Biofuel Directive 2003/30/EC was transposed into Austrian national law with an amendment to the Fuel Ordinance of 1999. This amendment stipulates that all companies putting fuels on the market (e.g. OMV, the Austrian mineral oil company) must, from October 2005, replace 2.5% of the total energy quantity by biofuels. From 2007, this percentage was increased to 4.3%, and in 2008 the target of 5.75%, as stipulated in the Directive, should be achieved. The EU Renewable Energy Directive (RED) 2009/28/EC and the Fuel Quality Directive (FQD) 2009/30/EC were transposed into Austrian national law by again amending the Fuel Ordinance in 2009, 2012, 2014, 2017 and 2018. The Fuel Ordinance stipulates:
1995 Mineral Tax
Law
1999 Fuel Ordinance
1999
2005 Bioethanol Blending
Order
2009 (EU) Renewable
Energy Directive
2009 (EU) Fuel
Quality Directive
2010 Ordinance
on Agricultural Feedstocks for Biofuels
2012 Fuel Ordinance
2012
2014 Sustainabili
ty Ordinance
2015 (EU) ILUC
Directive
2018 (EU) Renewable
Energy Directive II

Austria
IEA Bioenergy Task 39 - Implementation Agendas: 2019-2021 Triennium Update 91
• From 2010, 5.75% (by energy content) of all Otto and Diesel fuels should be biofuels or other
renewable fuels.
• The greenhouse gas emissions of all fuels supplied to the transport sector have to be reduced by 6%
by 31 December 2020.
• Fuels can only be counted towards these targets if they fulfill the sustainability criteria (same
thresholds and requirements as in RED and FQD). Any feedstock produced in Austria must comply
with EU regulations. Imported feedstocks or biofuels must be certified by another Member State or
a voluntary scheme approved by the EC or Austrian control bodies.
The Austrian regulation defines values as % by energy content. These values can be fulfilled by adding 5% by volume of ethanol to gasoline and 7% by volume of biodiesel to diesel. Table 2.1 shows biofuels obligations/mandates by energy content. Table 2.1 Biofuel obligations/mandates (% by energy content) since 2010
Year Ethanol Biodiesel Advanced fuels
2010 3,4 6,3
2011 3,4 6,3
2012 3,4 6,3
2013 3,4 6,3
2014 3,4 6,3
2015 3,4 6,3
2016 3,4 6,3
2017 3,4 6,3
2018 3,4 6,3
2019 3,4 6,3
2020 3,4 6,3 0,5*
2020+ n.a. n.a. n.a.
*With the implementation of RED II into national law this value will be changed As shown in Table 2.1, the current mandates or biofuel volume obligations in Austria include:
• At least 3.4% of ethanol to be added to gasoline
• At least 6.3% of biodiesel to be added to diesel The carbon intensity or emissions of biofuels are not
currently taken into account
Prior to the most recent developments, the “Fuels Ordinance” of 2012 defined technical specifications for motor fuels as well as substitution regulations for biofuels primarily with regard to environmental performance aspects. As of December 2012, biodiesel was specifically defined as FAME (fatty acid methyl ester). FAME can be used as a blending component up to an amount of 7% (by volume) of the total diesel fuel. The biodiesel has to be produced exclusively from vegetable oils. Austria’s sustainability assessments are based on RED and EU frameworks. The new EU RED and FQD directives are challenging. Ongoing Indirect Land Use Change (ILUC) and overall sustainability concerns are leading to a de-emphasis of conventional and advanced biofuels.

Austria
IEA Bioenergy Task 39 - Implementation Agendas: 2019-2021 Triennium Update 92
In Austria, all companies along the biofuel production chain have to be in charge of a certification either from a system authorized from the European Commission (EC) or a national or bilateral acknowledged system to be registered in the national monitoring system, elNa. The following certification systems are used by Austrian producers:
• 2BSvs
• AACS (AMA)
• BLE
• ISCC DE
• ISCC EU
• Red Cert
• Red Cert EU
• Slovakian National System
RED and FQD biofuel sustainability criteria are being implemented into Austrian law by two separate ordinances. The cultivation of feedstock is regulated by an ordinance on agricultural feedstocks for biofuels and bioliquids, while the fuel mandate that came into force in 2011 governs the certification of commercialized biofuels. Double counting of GHG savings made by biofuels produced from wastes, residues, non-food cellulosic material and lignocellulosic material will be assessed on a case-by-case basis. To enter the biofuels market in Austria, the biofuel producers and importers have to register with elNa. Biofuel specifications have to match the existing standards for Diesel or Otto fuels. The production chain has to comply with the sustainability criteria, and this has to be certified. If the obligated parties such as fuel suppliers do not comply with their quota obligations, they have to pay 43 €/GJ for lack of substitution of fossil petrol and 19 €/GJ for lack of substitution of fossil diesel as non-compliance penalty. In case of not achieving the goals for GHG emission reduction (6 % until end of 2020), a non-compliance cost of 15 €/ tonne CO2 equivalent has to be payed by the obligated parties such as fuel suppliers and biofuel producers.
2.3.2. Excise duty reductions
In 1999, an amendment of the Austrian tax law stipulated that there would be no tax on biodiesel and ethanol to a certain limit. Blends more than 5% in gasoline were taxed at the full amount. The “Austrian Decree on Transportation Fuels” allows blending up to 7% biodiesel with fossil diesel. Also, if the biodiesel is produced in small-scale plants and it is exclusively used by farms themselves, it is free of mineral oil tax. Together with the amendment to the Fuels Ordinance in 2004, the Mineral Oil Act has been revised (Mineral Oil Tax Law, BGBl. I Nr 180/2004). Accordingly, tax concessions are now granted for fuels with a biofuel share of at least 4.4% (by energy content). However, to be able to benefit from these tax concessions, the fuel must also be sulphur-free (less than 10 mg sulphur per kg of fuel). The use of pure biofuels as fuel has been exempted from mineral oil tax since January 2000. The Bioethanol Blending Order that entered into force in October 2007 allows refunding of the mineral oil duty for E75 blends.
2.3.3. Fiscal incentives
There is no fiscal incentives for transportation biofuels in Austria.
2.3.4. Investment subsidies
Currently, financial supports and funding is mainly available for electromobility, not for other alternative fuel vehicles. But there are some financial incentives available for sustainable mobility:

Austria
IEA Bioenergy Task 39 - Implementation Agendas: 2019-2021 Triennium Update 93
• Some solitary incentives in some federal states are available for purchasing CNG driven cars. These incentives are in the range from 0-1000€, sometimes in kind of fuel voucher. However, there are no tax incentives on the fuel.
• There is funding available for the construction of plants for the production of sustainable liquid or gaseous fuels which have non-food feedstock. This would be for biomethane, syngas or advanced biofuel production. The grant is up to 20% of the investment cost. Other investment subsidies include
• There is funding available for Research and Development: € 9 million under the Mobility for the Future program
2.3.5. Other measures used to stimulate the production and use of biofuels
National funding is provided through the Austrian Research Promotion Agency FFG. Owners and providers of funds for the research programs are the Austrian Ministry for Transport, Innovation and Technology (bmvit) and the Federal Ministry of Science, Research and Economy (bmwfw). National R&D funding programs include instruments that are open to all fields of research (to fund fundamental research, applied research and build-up of research infrastructure) and thematic calls (such as the New Energies 2020 program and the IEA Research Cooperation). EU funding is available through the Horizon 2020 program. The ERA-NET scheme provides a platform to coordinate research funding programs between several EU member states. Transnational projects are created and each partner is funded through national funds.
2.4. Promotion of advanced biofuels
The Austrian government is funding a variety of R&D projects on advanced biofuels and has also developed several advanced biofuels pilot or demonstration plants although only one is currently operational (Table 2.2). AustroCel Hallein`s production capacity is 30 million litres of 2G ethanol, corresponding to 0.17% (energy) of total transport fuel consumption in Austria. Table 2.2. Advanced biofuel producers in Austria
Name of company Status (planned; operational; closed)
Technology Production capacity
(L/year)
Bio SNG Güssing closed
gasification of wood chips and subsequent methanation for the production of biomethane
100 000
BEST Bioenergy and Sustainable Technologies
idle
synthesis of FT-liquids from syngas from the gasification of wood chips
50 000
AustroCel Hallein operational
fermentation of brown liquor at the pulp mill for the production of ethanol
30 000 000
The funded R&D projects are dealing with a wide range of different topics and types of advanced biofuels, for example biomass gasification and synthesis to FT-diesel, mixed alcohols, conversion of algal biomass, lignocellulosic biogas and lignocellulosic ethanol. Major research projects spanning a range of Technology Readiness Levels (TRLs) include:

Austria
IEA Bioenergy Task 39 - Implementation Agendas: 2019-2021 Triennium Update 94
• Vienna / Güssing Gasifier: BEST Bioenergy and Sustainable Technologies plans to install gasifier
applying high-temperature gasification in a dual-fluidised bed reactor for the production of
synthesis gas (CO, H2), followed by downstream processing to gases, liquids and chemicals (e.g.
methanation, Fischer-Tropsch synthesis, …). TRL is 4-7, depending on the feedstock used. Check
https://best-
research.eu/content/en/competence_areas/fluidized_bed_conversion_systems/gasapplications for
details.
• bioCRACK + bioBOOST: BDI is further developing its technologies for the pyrolysis of solid biomass
within the FCC of a fossil refinery, and subsequent upgrading of the pyrolysis oil. TRL is 6. Check
https://www.bdi-bioenergy.com/en-bdi_biolife_science-396.html for details.
• Winddiesel: Repotec, Güssing Energy Technologies and Vienna University of Technology are jointly
investigating this power-to-liquid technology. Hydrogen, derived from electrolysis with renewable
electricity, is added to syngas from biomass gasification and then converted to FT-liquids. TRL is 6-
7. Check www.winddiesel.at for details.
• Heat-to-Fuel: This is an EU-funded project. Three Austrian entities (BEST Bioenergy and Sustainable
Technologies, Güssing Energy Technologies and Vienna University of Technology) and 11 other
partners from another six European countries cooperate to upgrade alternative, residual biomass
feedstocks and convert excess heat to liquid fuels in a combined gasification, Fischer Tropsch and
Aqueous Phase Reforming plant. TR is 3-6. Check http://www.heattofuel.eu for more details.
• TORERO: This is an EU-funded project in which 5 partners, including the Austrian research
organisation Joanneum Research cooperate. Torero will demonstrate a technology concept for
producing bioethanol from a wood waste feedstock, fully integrated in a large-scale, industrially
functional steel mill: (1) Wood waste is converted to biocoal by torrefaction, (2) the produced
biocoal replaces fossil powdered coal in a steel mill blast furnace, (3), carbon monoxide in blast
furnace exhaust fumes is microbially fermented to bioethanol. Check http://www.torero.eu for
details.
• CO2-free logistics: Starting in May 2018, DB/Schenker, Fronius, HyCentA, and Energieinstitut Linz
will jointly work to demonstrate the production of hydrogen through a high pressure PEM
electrolyzer and the utilization of this hydrogen in fuel cell-powered fork lift trucks. TRL is 8.
• Reformer Steam Iron Cycle: OMV, AVL and University of Technology Graz are jointly developing a
process for the decentralized production of renewable hydrogen via reforming of biobased
feedstocks in combination with chemical looping of iron based oxygen carriers. The underlying
process is called the Reformer Steam Iron Cycle (RESC), which has been patented recently by the
research group. TRL is 3.
• OSCYME: AEE Intec is investigating a new reactor concept for carrying out enzymatic hydrolysis of
lignocellulosic feedstocks. The goal of this project is to develop a continuous enzymatic hydrolysis
process using a plug-flow reactor for the first time with substantial effects on conversion rates and
reduction in enzyme addition. The newly developed reactor shall be the basis for a hydrolysis
reactor concept eventually applicable in the biobased industry, chemical industry, biodiesel
production or pulp and paper industry to save energy, resources and time. Check http://www.aee-
intec.at/index.php?seitenName=projekteDetail&projekteId=212&lang=en for more details.
• BeCool: The International Institute for Applied Systems Analysis (Austria) develops with two other
partners logistic modelling and integrated assessment of the value chain in the project BECOOL –
Brazil-EU Cooperation for Development of Advanced Lignocellulosic Biofuels. BECOOL is a Horizon
2020 project that strengthens the cooperation between Brazil and Europe for development of
advanced biofuels from lignocellulosic biomass and sustainable agricultural value chains.
http://www.becoolproject.eu/

Austria
IEA Bioenergy Task 39 - Implementation Agendas: 2019-2021 Triennium Update 95
• REWOFUEL: The project REWOFUEL aims to demonstrate the performance, reliability,
environmental and socio-economic sustainability of transforming residual wood to bio- Isobutene
(bio-IBN) by fermentation and its further conversion into biofuels. The Austrian Partner Energy
Institute JKU is in charge of process assessments, economic assessments and LCA.
http://rewofuel.eu/
• Waste2Road: The project Waste2Road Biofuels from Waste to Road transport aims to develop cost-
effective biofuels from a range of low-cost biogenic residues and waste fractions. The invested
technologies are fast pyrolysis, hydrothermal liquefaction, co-fluid catalytic cracking, hydrotreating
and co-hydrotreating. The project should bring the technologies from current TRL 3-4 to TRL 5. The
Austrian partner is the oil refinery company OMV. https://www.sintef.no/projectweb/waste2road/
• LignoFlag: Commercial flagship plant for bioethanol production involving a bio-based value chain
built on lignocellulosic feedstock: The LIGNOFLAG project demonstrates an integrated and whole
value chain-oriented approach to drive forth the bio-based production of ethanol as sustainable
transport fuel or chemical building block. The core part of the project is the first-of-a-kind
commercial flagship plant for lignocellulosic feedstock to ethanol conversion. The Austrian partner
Energy Institute at the JKU is in charge of LCA and assessments. https://www.lignoflag-project.eu/
• Innovation Liquid Energy: The Austrian IWO works with AVL List on a pilot project named
Innovation Liquid Energy. The aim is the construction of a Power-to-Liquid plant with the goal of
converting hydrogen and carbon dioxide to synthetical fuels. https://iwo-austria.at/innovation-
fluessige-energie/
2.5. Market development and policy effectiveness
Austria has targets mandating the blending of biofuels, introduced by BGBl. II Nr. 398/2012. In 2015, the overall biofuels target was a minimum 5.75% biofuel in transport fuel (by energy content). In addition, there were separate targets (by energy content) of at least 3.4% biofuel in petrol and at least 6.3% biofuel in diesel (see Table 2.1). The growth and stabilization of ethanol and biodiesel production is summarized in Table 2.3, with consumption trends shown in Table 2.4.

Austria
IEA Bioenergy Task 39 - Implementation Agendas: 2019-2021 Triennium Update 96
Table 2.3. Transport biofuels actual production (million L (ML)/year) in Austria
Year Biodiesel
(FAME
Bioethanol
(conventional)
Renewable
diesel (from lipids)
Cellulosic
ethanol
Biogas as
transportation fuel
Other
advanced biofuels
2006 137 0 - - - -
2007 270 15 - - - -
2008 280 90 - - - -
2009 362 177 - - - -
2010 378 202 - - - -
2011 348 220 - - - -
2012 297 220 - - - -
2013 243 226 - - - -
2014 327 234 - - - -
2015 381 226 - - - -
2016 345 228 - - - -
2017 331 239 - - - -
2018 322 254 - - - -
Table 2.4 shows the transport fuel consumption in Austria. The energetic substitution of biofuels consumed in road transport in Austria in 2018 was 6,25%. Of these, 85% were Biodiesel, 11% Bioethanol and Bio-ETBE and 4% HVO (all by energy content). Table 2.4. Summary of transport fuel consumption (ML) in Austria
Year Gasoline Diesel
fuels Biodiesel
Bioethanol
(+ETBE)
Pure
Plant oil HVO Biogas
2006 2 677 7 353 371 - 11 - -
2007 2 643 7 522 415 26 20 - -
2008 2 466 7 276 455 73 21 - -
2009 2 476 7 111 585 86 19 - -
2010 2 447 7 440 562 107 19 - -
2011 2 359 7 246 568 100 18 - -
2012 2 305 7 281 559 108 18 - 0,7
2013 2 239 7 703 553 87 19 15 1,0
2014 2 183 7 581 646 94 17 53 0,8
2015 2 204 7 738 682 109 18 102 0,6
2016 2 201 8 062 572 108 17 66 0,4
2017 2 176 8 298 523 106 17 31 0,3
2018 2 229 8 350 569 111 0 23 0,4
*From 2009 onwards (and phasing in since 2007) all gasoline contains around 5 % by volume of Bioethanol or Bio-ETBE ** From 2006 onwards (and phasing in since 2005) almost all diesel fuels contain around 7 % by volume of Biodiesel

Austria
IEA Bioenergy Task 39 - Implementation Agendas: 2019-2021 Triennium Update 97
In Austria, one large bioethanol production facility and seven smaller FAME (biodiesel) production facilities were operating in 2018, and in 2021 another production facility producing ethanol from brown liquor started operation. Other fuels, which are produced in smaller production facilities with no relevant values available, are pure plant oils and biomethane. The conventional bioethanol plant has a a capacity of 246 ML/a located in Pischelsdorf (Table 2.5). In 2018, 254 ML of ethanol was produced in Austria, lower than the amount of biodiesel production. The Pischelsdorf plant at this level of production is capable of displacing 1/3 of Austria’s soy protein imports through DDGS co-production. This plant’s GHG emission reductions of 50% have been certified by Joanneum Research. While Austria’s E10 ethanol demand could be met by the production capacity of a single plant, i.e., the AGRANA ethanol plant in Pischelsdorf, plans for E10 have been cancelled in 2012 and E5 remains the typical ethanol blend. The new government program stipulates the introduction of E10 in the Austrian market but without a fixed date. The other bioethanol plant produces advanced ethanol from brown liquor at the pulp mill of AustroCel Hallein in Hallein. The capacity is 30 ML/a. The ethanol production is fully integrated into the mill that produces dissolving pulp for textile applications as the major product. Currently the facility represents Austria´s only production facility for advanced ethanol. Table 2.5. Bioethanol production plants in Austria
Company City Capacity [ML/a]
AGRANA Bioethanol GmbH Pischelsdorf 246
AustroCel Hallein GmbH Hallein 30
According to the Austrian biofuels register elNa, seven companies are registered in 2020 as biodiesel producers. Biodiesel is the main biofuel produced in Austria. Biodiesel production capacity in Austria is ~ 380 ML/year from 7 production facilities (Table 2.6). Production reached its peak in 2015 with nearly 381 ML of biodiesel produced, with production falling to 322 ML in 2018. Total biodiesel consumption in 2018 was 569 ML. Table 2.6. Austrian biodiesel producers
Company City Capacity [ML/a]
Biodiesel Süd GmbH Bleiburg 22
Münzer Bioindustrie GmbH Wien 157
HPF Biokraft Hirtl GmbH Fehring 5
Abid Biotreibstoffe GmbH Hohenau 56
Biodiesel Kärnten GmbH Arnoldstein 56
Münzer Paltental Gaishorn am See 67
Bioraffinerie Mureck GmbH Mureck 17
Total capacity 380
Pure plant oil (PPO) was used in recent years directly as fuel, in particular by agricultural vehicles and road freight transport at a nearly constant level of about 17-20 ML. The estimation of the amount of plant oil used in transport is difficult, since production volumes can not be distinguished regarding intended purpose. The consumption of PPO dropped sharply 2018 to less than 2 percent of the previous year. Reasons for the decrease of PPO used in agricultural sector is the low fossil diesel price and the rising age and the disrepair of modified tractors.

Austria
IEA Bioenergy Task 39 - Implementation Agendas: 2019-2021 Triennium Update 98
Biogas produced in Austria is mainly used on site for heat and power production, with an estimated production of 100-630 Mm3 of biogas per year. Beside the direct conversion into electricity processed biogas is fed into the national gas grid. Efforts are also being made to introduce “Bio-CNG” into the transport fuel market, but the number of CNG fuel capable vehicles must still be increased. At 4 biogas plants in Austria, the processed biogas is used as biomethane for refueling vehicles. In 2018 274 tonnes of biomethane were used in the transport sector. There is no national HVO or HEFA producer in Austria.
Austria is a net importer of feedstocks for biofuel production. Austria is not self-sufficient in terms of vegetable oils in general (not only for biodiesel production) and UCO for biodiesel production. Feedstock for ethanol production is partly imported, as Austria is a small country and the production facility is close to the Czech border and close to a Danube port. Figure 2.5 shows feedstock that are used for the production of biodiesel and bioethanol in Austria and the biodiesel and ethanol imported to Austria.
In the year 2018, in total 691.000 tonnes of biofuels were imported, in comparison to the previous year this is a plus of 32 %. In total, 496.500 tonnes of biofuels were exported in the year 2018 (see Table 2.7).
Table 2.7. Imports and exports of biofuels in Austria
Year Biodiesel Bioethanol HVO
Import
(M liter/year)
Export
(M liter/year)
Import
(M liter/year)
Export
(M liter/year)
Import
(M liter/year)
Export
(M liter/year)
2014 425 n.a. 57 n.a. 58 n.a.
2015 559 267 74 195 104 7
2016 501 335 100 227 148 9
2017 482 122 73 198 46 12
2018 657 355 100 222 35 9
Biofuel produced from feedstocks with low carbon intensity find better markets in countries such as Germany and Sweden where a GHG reduction quota is obligatory. Therefore, there is a lively export of biodiesel produced in Austria from waste materials.

Austria
IEA Bioenergy Task 39 - Implementation Agendas: 2019-2021 Triennium Update 99
Figure 2.5. Feedstock of biodiesel and bioethanol produced in Austria and Feedstock of biodiesel and
ethanol imported to Austria (Federal Ministry of sustainability and tourism (2019a)
The feedstock for FAME production in Austria are 45% used cooking oil, 36 % rapeseed, 9 % animal fat, 6 % fatty acid, 3 % soy and 1 % sunflower. The imported biodiesel is made of 90 % rapeseed, 5 % soy, 2 % UCO, 2 % palm oil and 1 % sunflower. Ethanol produced in Austria is made mainly of corn and wheat (47 % and 40 %, respectively) and 7 % starch residue and 6 % triticale. The imported ethanol is made mainly of corn (78 %), followed by sugar beet and wheat (7 % each), rye (6 %) and triticale (1%).
The imported HVO is made of 99 % palm oil and 1 % sunflower. According to RED II palm oil has a high ILUC risk and also the public opinion towards palm oil is not positive, since it is suspected that most of the palm oil is not produced sustainably.
2.6. Co-processing at oil refineries
In Austria, there is one single oil refinery – the company OMV operates a refinery in Schwechat close to Vienna and its airport. This refinery was built in 1958 and it became operative in 1960. The Schwechat
45%
6%
36%
3%
1% 9%
FAME Feedstock
UCO
fatty Acid
rapeseed
soy
sunflower
animal grease
palm oil
47%
7%6%
40%
EtOH Feedstock
corn
starch residues
triticale
wheat
rye
sugar beet
2%
90%
5%1% 2%
FAME Feedstock Imports
UCO
fatty Acid
rapeseed
soy
sunflower
animal grease
palm oil
79%
1%
7%
6% 7%
EtOH Feedstock Imports
corn
starch residues
triticale
wheat
rye
sugar beet

Austria
IEA Bioenergy Task 39 - Implementation Agendas: 2019-2021 Triennium Update 100
Refinery is one of the most modern and one of the largest refineries in Europe. Crude oil and semi-finished products are distilled and refined; high-quality mineral oil products and petrochemical raw materials are produced. The processing capacity of the plant is 9.6 Mio tonnes of crude oil per year or about 190,000 barrels/day of crude oil can be processed. The location of the OMV oil refinery is shown in Figure 2.6.
Figure 2.6. OMV oil refinery in Austria
OMV uses new technologies to increase the quality and stability of fuels with biogenic components through what is known as co-processing. Co-processing involves introducing biogenic feedstock already during the fuel refining process. In 2016 and 2017, OMV successfully conducted the first field trials of co-processing using vegetable oils and obtained certification in accordance with the REDcert standard. The field trials lasted for several weeks with a co-processing rate of about 5% to 10%. The liquid biomass feed which can be for example rapeseed oil, sunflower oil or used cooking oil,is co-hydrotreated together with gasoil, producing a high-value fuel. OMV plans to implement co-processing at large scale, and by 2025, the company aims to co-process approximately 200,000 t of sustainable feedstock per year, depending on future legislation. In current national legislation, the biogenic content of fuels resulting from co-processing can be accounted for. However, there are no policies specifically supporting co-processing at oil refineries.
2.7. Conclusions
In Austria the biofuel policies – implementing the respective EU Directives - led to a relatively stable production and use of biofuels in the country since 2005. The biofuel blending obligation leads to the use of biofuels in the common diesel and petrol fuels, but there are virtually no dedicated vehicles for higher blends of biofuels, thus it will be hard to reach higher substitution levels. Apart from the biofuel blending obligation there are no attempts to further increase the biofuel use in the Austrian transport sector.
Sources
BEST Bioenergy and Sustainable Technologies GmbH, Gas applications https://best-research.eu/content/en/competence_areas/fluidized_bed_conversion_systems/gasapplications Biokraftstoff & Nachhaltigkeit http://www.umweltbundesamt.at/elna Bundesgesetzblatt für die Republik Österreich, 3. Dezember 2012, 398. Verordnung: Kraftstoffverordnung 2012, Austrian Fuels Ordinance 2012, (BGBl. II, Nr 398/2012) - Verordnung des Bundesministers für Land -und Forstwirtschaft, Umwelt und Wasserwirtschaft über die Qualität von Kraftstoffen und die nachhaltige Verwendung von Biokraftstoffen (Kraftstoffverordnung 2012)

Austria
IEA Bioenergy Task 39 - Implementation Agendas: 2019-2021 Triennium Update 101
http://www.umweltbundesamt.at/fileadmin/site/umweltthemen/verkehr/3_kraftstoffe/elna/KVO_2012.pdf European Research Area https://ec.europa.eu/info/research-and-innovation/strategy/era_en Federal Ministry of sustainability and tourism (2019a). Biofuels in the transport sector in Austria 2019 https://www.bmlrt.gv.at/umwelt/luft-laerm-verkehr/biokraftstoffbericht.html Federal Ministry of sustainability and tourism (2019b). Integrated National Energy and Climate Plan for Austria 2021-2030 https://ec.europa.eu/energy/sites/ener/files/documents/at_final_necp_main_en.pdf Horizon 2020 Program https://ec.europa.eu/programmes/horizon2020/ IEA 2020. Data and Statistics https://www.iea.org/data-and-statistics?country=AUSTRIA&fuel=Energy%20supply&indicator=Total%20primary%20energy%20supply%20(TPES)%20by%20source IEA Bioenergy Task 39 (2019). Implementation Agendas: 2018-2019 Update http://task39.sites.olt.ubc.ca/files/2020/02/IEA-Bioenergy-Task-39-Implementation-Agendas-Final-Draft-Feb-4-2020.pdf IEA Bioenergy, 2018. Austria- 2018 Update- Bioenergy policies and status of implementation https://www.ieabioenergy.com/wp-content/uploads/2018/10/CountryReport2018_Austria_final.pdf OMV – Coprocessing (2020) https://omv.online-report.eu/en/sustainability-report/2019/focus-areas/innovation/biogenic-oil-co-processing.html Statistics Austria (2020). Overall energy balance 2018 https://www.statistik.at/web_en/statistics/EnergyEnvironmentInnovationMobility/energy_environment/energy/energy_balances/index.html UBA (2020). AUSTRIA'S ANNUAL GREENHOUSE GAS INVENTORY 1990–2018 https://www.umweltbundesamt.at/fileadmin/site/publikationen/rep0711.pdf www.ffg.at
Brazil
IEA Bioenergy Task 39 - Implementation Agendas: 2019-2021 Triennium Update 102
3. Brazil
Glaucia Mendes Souza (University of São Paulo and FAPESP Bioenergy Research Program BIOEN) Angela Oliveira da Costa (Energy Research Office, EPE) Clarissa Maria Forecchi Gloria (Ministry of Foreign Relations, MRE) Giovani Vitória Machado (Energy Research Office, EPE) Heloisa Borges Bastos Esteves (Energy Research Office, EPE) Leonidas Bially Olegario dos Santos (Energy Research Office, EPE) Luiz Augusto Horta Nogueira (UNICAMP and FAPESP Bioenergy Research Program BIOEN) Marlon Arraes Jardim Leal (Ministry of Mines and Energy, MME) Miguel Ivan Lacerda de Oliveira (Ministry of Mines and Energy) Nicholas Islongo Canabarro (University of São Paulo and FAPESP Bioenergy Research Programa BIOEN) Rachel Martins Henriques (Energy Research Office, EPE) Rafael Barros Araujo (Energy Research Office, EPE) Renato Domith Godinho (Ministry of Foreign Relations, MRE) Rubens Maciel Filho (UNICAMP and FAPESP Bioenergy Research Program BIOEN) Thiago Vasconcellos Barral Ferreira (Energy Research Office, EPE)
Summary • In 2017, Brazil launched RenovaBio (Law 13,576/2017), a state policy recognizing the strategic role
of all types of biofuels in Brazil’s energy matrix, both for energy security and for mitigation of greenhouse gas emissions. This new law is effective from 2020 and have a global target of carbon intensity reduction, established in 95.5 million CBIOs in 2029 (1 CBIO = 1 ton CO2eq).
• RenovaBio provides a market-based incentive by issuing GHG emissions reduction certificates, named “CBIO”. The program does not include the creation of carbon taxes or any kind of subsidy to biofuels.
• Sustainability criteria have been considered in the Renovabio policy. Eligible producers will have to go through a certification process (life cycle analysis), in which an inspecting firm evaluates aspects related to the production/import of biofuels, in accordance with the Resolution No. 758/2018.
• With RenovaBio, the government plans to increase annual ethanol production from the current 30 billion liters to around 50 billion liters by 2030, and also to increase biodiesel production from 4 billion liters to 13 billion liters over the same period.
• The mandatory blend levels for ethanol and biodiesel are currently 27% (E27) and 12% (B12), respectively. 100% hydrated ethanol (a.k.a. “hydrous ethanol”) is also marketed in all gas stations in Brazil.
• There are tax incentives for biofuel producers, blenders and users, including tax incentives for ethanol-flex fuel vehicles and for ethanol fuel and there are federal tax exemptions and incentives for biodiesel production.
• There are several science and technology funds that support continued innovation in the production and use of low carbon biofuels.

Brazil
IEA Bioenergy Task 39 - Implementation Agendas: 2019-2021 Triennium Update 103
3.1. Introduction
In 2019, the Brazilian energy supply (total energy available in the country) reached 294.0 million tonnes equivalent (Mtoe), registering an increase of 2.0% compared to the previous year (EPE, 2020a). The country has a significant portion of its internal energy supply from renewable sources, which corresponded to 46% in 2019. Public policies adopted by Federal Government over the years, associated with the country's natural conditions, have enabled Brazil to present a great diversity of renewable sources in its energy matrix. Such a variety comprises liquid biofuels, predominantly ethanol and biodiesel; solid biofuels, the most relevant being sugarcane bagasse and gaseous, with a still incipient participation of biogas. The latest though experienced a growth of over 100% in the last 3 years (https://www.biomassabioenergia.com.br/). It can also be observed that sugarcane derivatives (18%) are the second main source in the internal energy supply, behind oil and its derivatives (34.4%) (EPE, 2020a). At this year, the final energy consumption was 259.4 MToe, in which sugarcane derivatives has a relevant share in several sectors of the economic activity: in the transport sector, they provide 20.6% of the energy consumed (22.2% for road transport) and in industrial, 16.7% (in the food and beverage segment, 68.4%) (EPE, 2020a). Ethanol (straight and blended with gasoline, E27) is used in Otto cycle engines and bagasse is an energy source for steam production in the manufacture of ethanol and sugar. In addition, sugarcane biomass is used to generate electricity, part of which is consumed in the plants and part is injected into the National Interconnected System - SIN. Figure 3.1 shows the contribution of different energy sources to the final energy consumption.
Figure 3.1. Contribution of different energy sources consumption in Brazil
The final energy consumption in the transport sector was 84.8 MToe in 2019, and represents 32.7% of the total energy consumption in Brazil (EPE, 2020a). For road transport, the amount consumed was 78.9 Mtoe, 30.4% of the total (EPE, 2020a). Brazil presents itself as a case of success in regards to the demand for biofuels in the transport sector. Its participation increased from 20.3% in 2009 to 25.1% in 2019. The share of biodiesel increased from 1.7% to 4.7% of the final energy consumption of the vehicle matrix in the period (EPE, 2020a). In 2005, greenhouse gas (GHG) emissions in Brazil were 2,352 Mt CO2eq, with the Forest and Land Use sector as the main emitter with 64.7% of the total (considering net emissions from forests and land use). At the time, the energy and transport sector registered 313 MtCO2eq (13.3%). In a recent survey, GHG emissions fell to 1,305 MtCO2eq in 2016, with the Forest and Land Use sector (22.3%) being the main responsible for this fall. In the same year, the energy and transport sector emitted 422.5 MtCO2eq (32.4% of total) (MCTI, 2018). Figure 3.2 shows the historical GHC emissions in Brazil since 1990.

Brazil
IEA Bioenergy Task 39 - Implementation Agendas: 2019-2021 Triennium Update 104
Figure 3.2. Historical GHC emissions in Brazil since 1990
In 2018, total anthropogenic emissions associated with Brazilian energy matrix reached 416.1 MtCO2-eq. The main contributor to the GHG emissions in energy production and consumption are the transport and industrial sectors, which accounted for 46.3% and 18.8% of total emissions, respectively (EPE, 2019b).
3.2. Main drivers for biofuel policy
There are several benefits from the use of biofuels in the Brazilian national matrix, which can be observed in the economic, social and environmental spheres. Considering liquid biofuels, since Brazilian production of gasoline and diesel is not sufficient to meet domestic demand, the consumption of ethanol and biodiesel acts favorably in order to reduce the risks related to the instability of the world market and to increase security of energy supply. The absence of these biofuels could result in an increase in imports of fossil analogues, affecting Brazil's trade balance.
The most evident social impacts of using biofuels are related to the creation of jobs and income, whether in the agricultural phase of their production, or in the industrial stage, including the countryside. In the case of biodiesel, a stand out initiative is the Social Fuel Seal (Selo Combustível Social), which benefits small farmers with family farming insertion to the biofuel production process. Indirectly, jobs are also generated in the industry of cultivation implements, agricultural machinery business and services with much trading occurring in rural areas of the country. Besides, it is possible to identify positive impacts on infrastructure, improvements in motorways and railways, in the food production and in the life quality of people living in the neighbouring areas. The environmental benefits of biofuels are due to the lower generation of air pollutants, liquid effluents and solid waste compared to fossil fuels.
The official document driving Brazil’s national policy framework for renewable energy today is its Nationally Determined Contribution (NDC) towards achieving the objective of the United Nations framework convention on climate change. This document, announced in December 2015 during the Paris Conference (COP 21), forecasts the Brazilian energy trends expected in future years and provides background for the main energy planning document. The Ten Year’s Energy Plan (PDE), is elaborated by Brazil’s Energy Research Agency (EPE) and published every year by the Ministry of Mines and Energy. In addition, all policies, measures and actions to implement Brazil’s NDC are carried out under the National Policy on Climate Change (Law 12,187/2009), the Law on the Protection of Native Forests (Law 12,651/2012, hereinafter referred to as the Forest Code), the Law on the National System of Conservation Units (Law 9,985/2000) as well as related legislation following established processes. The Brazilian

Brazil
IEA Bioenergy Task 39 - Implementation Agendas: 2019-2021 Triennium Update 105
government is committed to implement its NDC with full respect to human rights, in particular the rights of vulnerable communities, including indigenous populations, traditional communities and workers in affected sectors, and to also promote gender-responsive measures.
As a result of COP 21, Brazil committed to reduce its domestic GHG emissions to 37% by 2025 and 43% by 2030, both based on 2005 levels. With regard to energy production and use, the country also intends to adopt further measures that are consistent with the 2°C maximum temperature rise goal, in particular:
• Increase the share of sustainable bioenergy in the Brazilian energy matrix to approximately 18% by 2030, by expanding biofuel consumption, increasing ethanol supply - including a greater proportion of advanced biofuels, cellulosic ethanol in the gasoline fuel mix and more biodiesel in the diesel mix;
• Achieve an estimated 45% share of renewables in the energy matrix by 2030;
• Obtain at least a 66% share of hydropower in electricity generation by 2030, not considering self-produced electricity;
• Expand the use of renewable energy sources other than hydropower in the total energy mix to 28-33% by 2030;
• Expand the use of non-fossil energy sources domestically, increasing the share of renewables (other than hydropower) in the power supply to at least 23% by 2030, by increasing the share of wind, biomass, and solar energy; and achieve 10% efficiency gains in the electricity sector by 2030.
On the biofuels use side, in 2017 Brazil launched RenovaBio (Law 13,576/2017), a state policy recognizing the strategic role of all types of biofuels in Brazil’s energy matrix, both for energy security and for mitigation of greenhouse gas emissions. This new law is effective from 2020 and have a global target of carbon intensity reduction, established in 95.5 million CBIOs in 2029 (1 CBIO = 1 ton CO2eq)12. Due to COVID-19 Pandemic impacts, a proposal to revise the goals for 2020, as well as its extension until 2030, have been through a public consultation process (MME, 2020). According to the proposal, the total CBIO to be marketed in 2020 totals 14.53 million and, for 2030, totals 90.67 million. RenovaBio provides a market-based incentive by issuing GHG emissions reduction certificates, named “CBIO”. The program does not include the creation of carbon taxes or any kind of subsidy to biofuels. The Policy includes the creation of CBIO issued by biofuel producers, traded on the stock exchange and the fuel distributors are obliged to acquire a quantity of this credit, established in a resolution. The framework of the Rota 2030 program – Law 13,755/2018 - was approved by the Brazilian federal government in December 2018 (BRASIL, 2018) to foster efficiency and safety in vehicles produced in Brazil. Specific measures have been put forward to promote ethanol and biodiesel as solutions to meet progressively stringent vehicle emissions regulations
3.3. Biofuels policy
In 1931, the Brazilian government implemented a compulsory blend of at least 5% anhydrous ethanol in gasoline, aimed at reducing dependence on imported petroleum and absorbing excess production of the sugar industry. In 1975, in response to the impacts of the oil shocks during the 1970s, the Brazilian government created the Proálcool program, increasing the ethanol blending level up to 25% in gasoline (E25) and also introducing hydrous ethanol (“E100”, approximately 95% ethanol and 5% water) for use in dedicated vehicles. The use of ethanol-dedicated vehicles was eventually phased out and replaced by mandatory blends of ethanol in gasoline, starting with E10. The ethanol content in Brazilian gasoline has varied over successive decades and is currently 27%. For over 80 years, all Brazilian cars have been using blends of ethanol and gasoline with good performance and without any remarkable problems (BNDES, 2008). The second phase of expansion took place because of a new market opportunity. In 2003, flex-fuel cars were launched, offering to drivers the option of using both gasoline (containing 20–27% anhydrous ethanol) and hydrous ethanol, at any blend. As a result, the consumption of hydrous ethanol in Brazil’s domestic market made a comeback, creating new opportunities for expanding the sugarcane industry in Brazil, as well as the possibility of exporting more ethanol to meet the world’s fuel demand. During 2003–2008, the
12

Brazil
IEA Bioenergy Task 39 - Implementation Agendas: 2019-2021 Triennium Update 106
Brazilian sugarcane industry expanded rapidly, with many new and more efficient sugar-ethanol mills commissioned (SCOPE, 2015a) and several of them exporting energy to the grid. As of 2008, the sector has experienced great difficulties due to the petroleum crisis and the rise in the dollar, which has considerably increased their debts that were tied to this currency, and leaded to a consolidation phase within the industry. Thus, the production increase of 1,8% between 2008 and 2017. In 2019, ethanol production was 36 billion liters and the share of ethanol in the fuel mix used by light vehicles (Otto Cycle - in gasoline equivalent) reached 54.8%, the highest in history. Brazil’s biodiesel program started in 1980 with the PRO-OLEO (Plan for the Production of Vegetable Oils for Energy Purposes) initiative. A blend level of 30% vegetable oils or derivatives in fossil diesel was mandated and, in the long run, a total substitution. The proposed technological alternative for the production of biofuels was the transesterification of vegetable oils. The main motivation was the oil crisis and the sharp increase in the prices of fuels it caused. After the fall in international oil prices in 1986, the PRO-OLEO program was abandoned. At the end of the 20th century, several studies were carried out by inter-ministerial commissions in partnership with universities and research centers, and in 2002 ethanolysis of vegetable oils was chosen as the main route to initiate a substitution program for petroleum diesel, the PROBIODIESEL program. As Brazil is a large ethanol producer, ethanolysis was chosen as the production route instead of methanolysis. The National Program for Production and Use of Biodiesel – PNPB – was created in 2005 to further stimulate energy, economic and social objectives as well as fostering feedstock production by small farmers. This program evolved gradually, with soybean oil and tallow proving to be the most relevant feedstocks for production, adopting transesterification process with methanol. There was also the objective of reducing dependence on mineral diesel. This program mandated a substitution of B5 by 2005 and has a schedule to reach B15 in 2023. In 2020, the mandated blending level for biodiesel is B12. The normative acts regarding the specification of biodiesel are as follows: ANP Resolution No. 798/2019 - amends ANP Resolution No. 45/2014, which establishes the biodiesel quality specifications, to determine the mandatory addition of biodiesel with antioxidant and establishes a new specification limit for the oxidation stability characteristic; ANP Resolution No. 30/2016 - establishes the specification of diesel oil BX to B30, in an authoritative nature, under the terms of items I, II and III of art. 1 of CNPE Resolution No. 03, of September 21, 2015; ANP Resolution No. 45/2014 - establishes the biodiesel specification contained in ANP Technical Regulation No. 3/2014 and the quality control obligations to be met by the various economic agents that sell the product throughout the national territory. Under the RENOVABIO Program biofuels production will be certified through life cycle analysis (LCA) with issuance of GHG emissions reduction certificates, named CBIO (an acronym for “Credito de Descarbonizacao” – Decarbonization Credit), to producers that can be traded in the stock market and purchased by fuel distributers. One CBIO corresponds to a reduction of one ton of carbon dioxide equivalent (CO2eq) in comparison to fossil fuel emissions. With RenovaBio, the government plans to increase ethanol and biodiesel production (MME, 2020). Figure 3.3 shows the governance structure for RenovaBio.

Brazil
IEA Bioenergy Task 39 - Implementation Agendas: 2019-2021 Triennium Update 107
Figure 3.3. RenovaBio’s governance structure
In 2019, MME, through resolution CNPE nº 12/2019, called for studies to support the formulation of measures aimed at promoting free competition in the supply of fuels, other petroleum products and biofuels. In 2020, ANP approved the start of a public hearing on the specification of green diesel, a renewable fuel for diesel cycle combustion engines, produced by hydrogenation of renewable raw materials, such as vegetable and animal fats, sugarcane, alcohol and biomass. The new fuel will be added to diesel of fossil origin, which currently has mandatory 12% biodiesel. The new biofuel consists predominantly of paraffinic hydrocarbons, having properties similar to diesel from fossil sources and differs from biodiesel, which is a mixture of fatty acid esters with similar properties. The regulation of green diesel may also make feasible the production and commercialization of aviation biokerosene, already regulated by ANP Resolution No. 778, of 2019, since the production of biofuels in the context of biorefinery generates different bioproducts in the same process. The initiative is the result of the ANP carrying out an analysis of the regulatory impact brought about by the insertion of this new biofuel in the Brazilian market, as well as studies of the international specifications of green diesel sold internationally. Table 3.1 summarizes the development of biofuels policies and the industry in Brazil since 1920s. Table 3.1. Development of biofuels policies and the industry in Brazil since 1920s.
Year Landmark
1920s Studies and tests with ethanol/gasoline mixtures and ethanol use demonstration programs.
1931 Mandatory addition of 5% ethanol to gasoline of foreign origin.
1938 Mandatory addition of 5% ethanol to all national gasoline.
1969 Creation of the Copersucar Technology Center (CTC)
1971 Launch of the National Sugarcane Improvement Plan (Planalsucar)
1975 Launch of the National Alcohol Program (Proálcool), initially determining the mandatory use of the addition of 10% ethanol to gasoline, progressively increased up to 20% in 1980.
1978 Goldemberg et al. publish Energy Balance for Ethyl Alcohol Production from Crops, Science, 1978, evidencing the advantages of sugarcane for bioenergy production.
1979 Introduction of light vehicles to pure hydrated ethanol (96% ethanol).
1979 The nutrient cycle is now widely adopted in sugarcane cultivation through fertigation with vinasse.
1985 Loss of competitiveness of sugarcane ethanol and reduction of the use of hydrated ethanol, maintaining the addition of ethanol to gasoline.
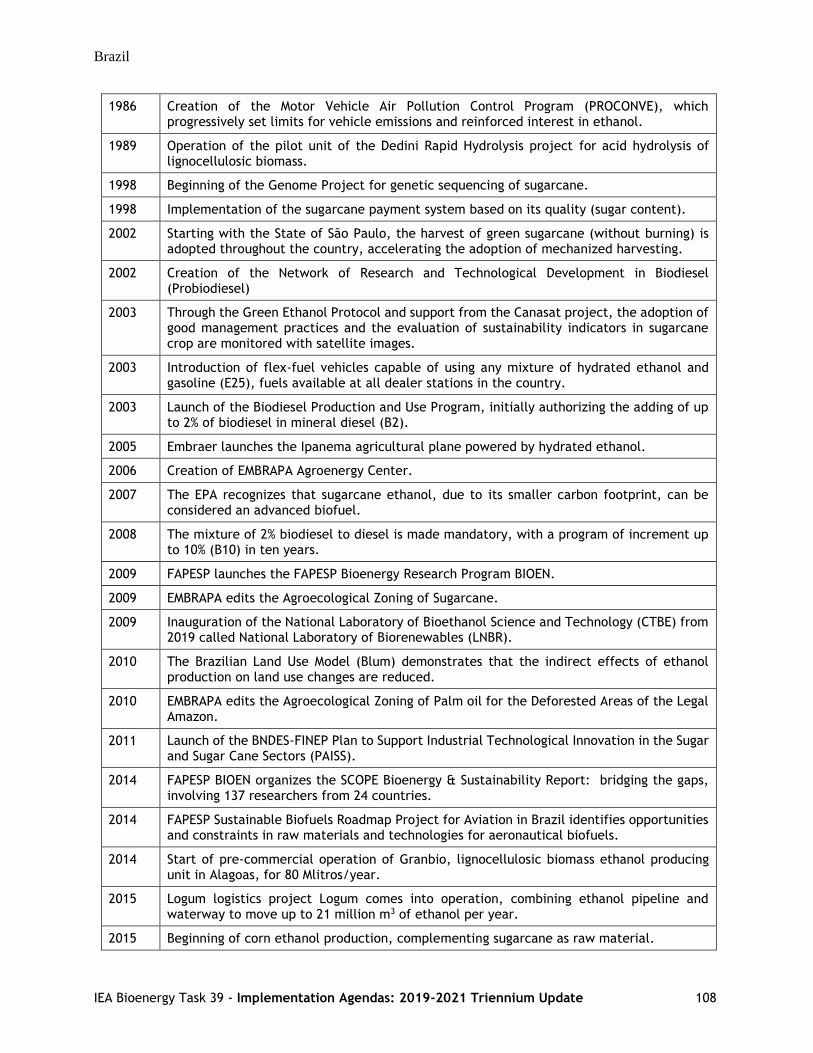
Brazil
IEA Bioenergy Task 39 - Implementation Agendas: 2019-2021 Triennium Update 108
1986 Creation of the Motor Vehicle Air Pollution Control Program (PROCONVE), which progressively set limits for vehicle emissions and reinforced interest in ethanol.
1989 Operation of the pilot unit of the Dedini Rapid Hydrolysis project for acid hydrolysis of lignocellulosic biomass.
1998 Beginning of the Genome Project for genetic sequencing of sugarcane.
1998 Implementation of the sugarcane payment system based on its quality (sugar content).
2002 Starting with the State of São Paulo, the harvest of green sugarcane (without burning) is adopted throughout the country, accelerating the adoption of mechanized harvesting.
2002 Creation of the Network of Research and Technological Development in Biodiesel (Probiodiesel)
2003 Through the Green Ethanol Protocol and support from the Canasat project, the adoption of good management practices and the evaluation of sustainability indicators in sugarcane crop are monitored with satellite images.
2003 Introduction of flex-fuel vehicles capable of using any mixture of hydrated ethanol and gasoline (E25), fuels available at all dealer stations in the country.
2003 Launch of the Biodiesel Production and Use Program, initially authorizing the adding of up to 2% of biodiesel in mineral diesel (B2).
2005 Embraer launches the Ipanema agricultural plane powered by hydrated ethanol.
2006 Creation of EMBRAPA Agroenergy Center.
2007 The EPA recognizes that sugarcane ethanol, due to its smaller carbon footprint, can be considered an advanced biofuel.
2008 The mixture of 2% biodiesel to diesel is made mandatory, with a program of increment up to 10% (B10) in ten years.
2009 FAPESP launches the FAPESP Bioenergy Research Program BIOEN.
2009 EMBRAPA edits the Agroecological Zoning of Sugarcane.
2009 Inauguration of the National Laboratory of Bioethanol Science and Technology (CTBE) from 2019 called National Laboratory of Biorenewables (LNBR).
2010 The Brazilian Land Use Model (Blum) demonstrates that the indirect effects of ethanol production on land use changes are reduced.
2010 EMBRAPA edits the Agroecological Zoning of Palm oil for the Deforested Areas of the Legal Amazon.
2011 Launch of the BNDES-FINEP Plan to Support Industrial Technological Innovation in the Sugar and Sugar Cane Sectors (PAISS).
2014 FAPESP BIOEN organizes the SCOPE Bioenergy & Sustainability Report: bridging the gaps, involving 137 researchers from 24 countries.
2014 FAPESP Sustainable Biofuels Roadmap Project for Aviation in Brazil identifies opportunities and constraints in raw materials and technologies for aeronautical biofuels.
2014 Start of pre-commercial operation of Granbio, lignocellulosic biomass ethanol producing unit in Alagoas, for 80 Mlitros/year.
2015 Logum logistics project Logum comes into operation, combining ethanol pipeline and waterway to move up to 21 million m3 of ethanol per year.
2015 Beginning of corn ethanol production, complementing sugarcane as raw material.

Brazil
IEA Bioenergy Task 39 - Implementation Agendas: 2019-2021 Triennium Update 109
2015 Introduction of varieties of sugarcane with high energy productivity.
2015 Start of pre-commercial operation of raizen lignocellulosic biomass ethanol producing unit in São Paulo, for 40 Mlitros/year lignocellulosic ethanol
2015 Authorization of the use of higher levels of biodiesel (B20 in captive fleet; B30 in river transport; B30 and agricultural and industrial use), by the National Agency of Petroleum, Natural Gas and Biofuels (ANP).
2016 Regulation of the production and use of biokerosene (biojet fuel) by the ANP, in line with ICAO recommendations.
2017 Launch of the National Biofuels Policy (RenovaBio), valuing the environmental externalities of biofuels, through the issuance of Certified Decarbonization Credit (CBIO).
2017 Specification of biomethane (produced from biogas) by ANP.
2018 The FAPESP LACAf Project identifies and evaluates the potential for sugarcane bioenergy production in Latin America and Africa.
2019 Review and consolidation of the specification of vehicular fuels (anhydrous and hydrated ethanol, gasoline and diesel) by ANP.
2019 Genome sequence of a commercial sugarcane cultivar is completed.
2020 In all gas dealer stations in the country one can find hydrated ethanol, gasoline with anhydrous ethanol (E27) and diesel with biodiesel (B12).
2020 Start of the commercialization of CBIO's.
2020 The SUCRE Project, developed by LNBR, concludes the evaluation of the potential and conditioning factors of the use of straw (tips and leaves) of sugarcane harvested without burning.
3.3.1. Biofuels obligations
National Policy for Biofuels - RENOVABIO (link)
‐ National Biofuels Policy, instituted by Law No 13,576/2017, whose objective is to expand the production of biofuels in Brazil, based on predictability, environmental, economic and social sustainability, and compatibility with the market growth. Biofuels play an important role through this policy to reduce carbon intensity in the transport sector.
‐ The policy program is based on strategic axes: 1) decarbonization goals; 2) biofuel production certification; and 3) decarbonization credit (CBIO).
‐ Art. 7 - The national mandatory annual targets will be broken down into individual ones, applied to all fuel distributors, proportional to their respective market share in the sales of fossil fuels from the previous year.
Anhydrous Mandatory Blend in Gasoline
‐ Created by Federal Decree19,717/1931, makes the addition of anhydrous ethanol to gasoline consumed in Brazil mandatory.
‐ Law 13,033/2014 increased the anhydrous ethanol mandatory blend limit in gasoline from 18% (by volume) up to 27.5%.
The current mandatory blending level is 27% (E27). 100% ethanol (hydrous ethanol) is also marketed in all gas stations in Brazil. Figure 3.4 shows the historical ethanol blending mandate in Brazil since 1931.

Brazil
IEA Bioenergy Task 39 - Implementation Agendas: 2019-2021 Triennium Update 110
Figure 3.4. Historical Ethanol blending mandate in Brazil. Source: EPE, 201613
National Program for Production and Use of Biodiesel – PNPB
‐ Created by Law 11,097/2005 to stimulate energy, economic and social objectives as well as more feedstock production by small farmers.
The current mandatory blending level is 12%. Figure 3.5 shows the historical biodiesel blending mandate in Brazil since 2005.
Figure 3.5. Historical biodiesel blending mandate in Brazil. Source: EPE (2020) and MAPA (2020)14
13 https://epe.gov.br/sites-pt/publicacoes-dados-abertos/publicacoes/PublicacoesArquivos/publicacao-
398/An%C3%A1lise%20de%20Conjuntura%20dos%20Biocombust%C3%ADveis1%20-%20Ano%202015.pdf 14
https://www.epe.gov.br/sites-pt/publicacoes-dados- abertos/publicacoes/PublicacoesArquivos/publicacao-
467/NT_Combustiveis_renovaveis_em_%20motores_ciclo_Diesel.pdf

Brazil
IEA Bioenergy Task 39 - Implementation Agendas: 2019-2021 Triennium Update 111
Nationally Determined Contribution (NDC)
‐ Increase the share of sustainable bioenergy in the Brazilian energy matrix to approximately 18% by 2030, by expanding biofuel consumption, increasing ethanol supply - including a greater proportion of advanced biofuels, cellulosic ethanol in the gasoline fuel mix and more biodiesel in the diesel mix
Federal Decree 9,888/2019 (link) ‐ Provides for the definition of national mandatory annual targets for the reduction of greenhouse gas
emissions in transport sector, effective beginning in 2020.
‐ This reduction targets are the basis for the decarbonization goals of the RENOVABIO program. National Energy Policy Council – CNPE Resolution No. 15/2019 ‐ Sets national mandatory targets to reduce GHG emissions in fuel sales. Sustainability criteria have been considered in the Renovabio policy (link)
‐ Certification of biofuels production: eligible producers will have to go through a certification process (life cycle analysis), in which an inspecting firm evaluates aspects related to the production/import of biofuels, in accordance with the Resolution No. 758/2018 (link).
‐ By June18, 2020, there are 216 certified producer plants for CBIO generation. These units will be able to sign agreements with Serpro – Federal Data Processing Service – for invoice registration of certified biofuel volumes and effectively start issuing their CBIOs (ANP, 2020a).
The non-compliance penalty is included for the obligated parties in the the Renovabio policy (link):
‐ Art. 9. Failure to meet the individual target will subject the fuel distributor to a fine, proportional to the amount of not complied Decarbonization Credit, without prejudice to others administrative and pecuniary sanctions in this Law and Law No. 9,847, of 26 October 1999.
‐ The referred fine may vary, under the terms of the regulation, between R$ 50 million and R$ 100 million.
‐ RANP791/2019, Art. 11 (Link): When the fine in art. 9 of Law No. 13,576, of 2017, does not correspond to the obtained advantage of non-compliance with the target obligation, a temporary, total or partial suspension of the distributor's facilities operation will be applied, under the terms of item I of art. 8 of Law No. 9,847, of 1999.
3.3.2. Excise duty reductions
There are tax incentives for biofuel producers, blenders and users including:
• Tax incentives for ethanol-flex fuel vehicles: Tax incentives have played an important role in supporting ethanol consumption since the introduction of flex-fuel cars. Regardless of the engine power, the tax burden as a share of the suggested retail price is usually lower for flex-fuel vehicles than for gasoline only powered vehicles.
• Tax incentives for ethanol fuel: Brazil has a complex tax system including several taxes at the federal, state, and municipal level. Depending on the economic and financial strategies pursued by policymakers, the federal government can provide incentives for gasoline and/or ethanol at the pump. Currently, the federal government provides preferential treatment for ethanol compared to gasoline under both its Contribution for Intervention in Economic Domain (CIDE) – Law No. 10,336/2001 (link) and Contribution to Social Integration/Contribution for Financing Social Security (PIS/COFINS) programs. In addition, the governments of several Brazilian states provide differential treatment for ethanol by using different state taxes for circulation of goods and services (ICMS) for ethanol and gasoline.
• The federal government sets federal tax exemptions and incentives for biodiesel, according to the nature of the raw material, size of the producer and region of production, in order to encourage the production of biodiesel and to promote social inclusion.
There are no carbon tax or emission trading (cap-and-trade) schemes in Brazil.

Brazil
IEA Bioenergy Task 39 - Implementation Agendas: 2019-2021 Triennium Update 112
3.3.3. Fiscal incentives
The “Regional Producer Subsidy” is the only direct subsidy paid by the government of Brazil. The program was created decades ago to provide support for sugarcane producers from the north- northeastern states to balance their cost of production with those of the more developed growing areas in center-south Brazil. Throughout the years, the federal government has tailored this program to the evolving reality of the sugarcane industry. In addition to being located in states covered by the program, there are other eligibility conditions for granting this subsidy such as being an independent sugarcane producer (not integrated to sugar-ethanol mills), not producing more than the annual limit of 10 thousand tons by crop, and that the amount of the subsidy cannot be higher than the average price of sugarcane in the region. In August 2017, the Brazilian government put a tariff in place for ethanol imports, allowing 600 million liters to enter duty free, with any volume above this being subject to a 20% tariff. This followed a March 2017 request by Brazilian ethanol producers to place a tariff on imported ethanol. Producers claim the pace of imports jeopardizes domestic ethanol production, especially in northeastern Brazil where import volumes have risen significantly due to competitively priced imported corn ethanol. The United States remains the top supplier of ethanol to Brazil. According to the Secretariat of Foreign Trade, the import tariff applied to biodiesel (NCM 3826.00.00) is fixed at 14%, and the import tariff for petroleum oils containing biodiesel up to and including B30 (NCM 2710.20) is zero. Resolution CAMEX No 72/2017 state (link):
‐ Exemption of import duties over ethanol, based on RES 125/2016, is restricted to a limited annual volume of 1.2 billion litres.
‐ On August 31, 2019, Ordinance No. 547 was published, which extends the validity of the import quota exemption for an additional period of 12 months, as of its publication, and changes the total annual volumes covered by the exemption to 750 million liters (link).
3.3.4. Other measures used to stimulate the production and use of biofuels
There are several science and technology funds such as BNDES, FINEP, FAPESP, and CNPq that support the production and use of biofuels. The National Bank for Social and Economic Development (BNDES) provides specific credit lines for the sugar, ethanol, and bioenergy industries to fund investments in sugarcane production, expansion of industrial production capacity for sugar and ethanol, cogeneration, logistics, and multimodal transportation. BNDES reports that in 2016 a total of $R 2.02 billion was released to finance the sugarcane/sugar/ethanol/energy cogeneration industry, down $R 743 million compared to 2015, due to financial difficulties faced by the sector. There are also financial incentives for feedstock development and to renew crop plantings from BNDES:
Line 1: New varieties, especially those focused on border region production environments; more suitable for agricultural mechanization; and/or producing higher amounts of biomass and/or total recoverable sugar (TRS) with emphasis on transgenic improvement;
Line 2: Machines and implements for planting and/or harvesting, as well as for the collection of straw and/or waste, with emphasis on expanding the use of precision farming techniques;
Line 3: Integrated production management, planning and control systems; Line 4: Agile and efficient propagation techniques for seedlings and innovative biotechnological devices
for planting; and Line 5: Adaptation of industrial systems for energy crops compatible and/or complementary with the
agro-industrial system for ethanol production from sugarcane. Line 6: Financial incentives for feedstock development from BNDES PAISS grants.
In June 2017, the Ministry of Agriculture, Livestock and Supply announced the Brazilian Agricultural Crop and Livestock Plan for 2017-2018. A total of $R 190.25 billion (around $US 50 billion) will be released to fund agricultural and livestock programs, including Prorenova for sugar and PAISS for ethanol. This

Brazil
IEA Bioenergy Task 39 - Implementation Agendas: 2019-2021 Triennium Update 113
represents a 3% reduction over the previous crop plan. A total of $R 1.5 billion should be available to finance the Prorenova program for 2017-2018. Prorenova is a credit line to finance the renewal and/or expansion of sugarcane fields, which is intended to prioritize the use of new sugarcane varieties. The Prorenova credit line’s annual interest rate is comprised of the “long term interest rate” (TJLP) plus 3.7%, with payment due within 96 months of contracting the finance. In addition to conventional/well established biofuel routes, these programs promote the production of lignocellulosic and drop-in biofuels for long-distance transport sectors such as aviation. Producers of these biofuels can enter the market once they have been authorized as a biofuels producer by the National Agency of Petroleum, Natural Gas and Biofuels (ANP). The financial instruments offered by PAISS include: a) credit in special financing lines; b) equity participation; c) non-reimbursable funds for cooperative projects between companies and the R&D institution; and d) non-refundable economic support (grants) for companies, defined depending on the case (amount, technological risk, involved institutions, etc). After the call for tenders and a sequence of thorough screening steps to select the projects, Industrial PAISS granted about $US 625 million in financing lines, leveraging investments of $US 1.7 billion, to be deployed between 2011 to 2014 (BNDES, 2011), while Agricultural PAISS made available $US 630 million for projects over the period 2014-2018 (BNDES, 2015; CGEE sobre 2G Sugarcane Bioenergy & Biochemicals, pg 88). Table 3.2 lists the government investments in R&D. Another measure is Ordinances MME 252/2019 (link) and MME 348/2019 (link) that regulate the process of framing priority projects in the oil, natural gas and biofuels sectors for the issuance of incentive debentures. The funding for R&D is provided through Plano Conjunto BNDES-Finep de apoio à inovação tecnológica industrial dos setores sucroenergético e sucroquímico – BNDES PAISS (link).
‐ thematic line 2 – new products of sugarcane:
• Development of new products directly obtained from sugarcane biomass through biotechnological processes;
• Integration and scheduling of processes for the production of new products directly obtained from sugarcane biomass.
Table 3.2 and Table 3.3 summarize the funding agencies and major programs that support the development of biofuels in Brazil, respectively.

Brazil
IEA Bioenergy Task 39 - Implementation Agendas: 2019-2021 Triennium Update 114
Table 3.2. Funding agencies that support the development of biofuels in Brazil
Agency Program
BNDES (link) The National Bank for Economic and Social Development (Banco Nacional de Desenvolvimento Econômico e Social – BNDES) is a development bank structured as a federal public company associated with the Ministry of Development, Industry, and Trade of Brazil. The stated goal is to provide long-term financing for endeavors that contribute to the country's development. Here are some financed programs associated with bioenergy and sustainability:
• BNDES ABC Program;
• BNDES-PAISS (with FINEP) (see below);
• BNDES-PRORENOVA;
• Credit lines to sugarcane industry
CNPq (link) The Brazilian National Council for Scientific and Technological Development (Conselho Nacional de Desenvolvimento Científico e Tecnológico – CNPq) is an organization of the Brazilian federal government under the Ministry of Science and Technology, dedicated to the promotion of scientific and technological research and to the formation of human resources for research in the country.
CTC (link) The Sugarcane Technology Center (Centro de Tecnologia Canavieira – CTC) is a research institute that focuses on development for the Brazilian ethanol industry. The Company is engaged in the development of new varieties and technologies in the production of sugar cane and ethanol including: genetic improvement (new varieties), biotechnology and second-generation biofuels.
EMBRAPA (link) The Brazilian Agricultural Research Corporation (Empresa Brasileira de Pesquisa Agropecuária – EMBRAPA) is a state-owned research corporation affiliated with the Brazilian Ministry of Agriculture, dedicated to developing technologies, knowledge and technical-scientific information aimed at Brazilian agriculture, including livestock.
FAPESP (link) BIOEN (link)
The São Paulo Research Foundation (Fundação de Amparo à Pesquisa do Estado de São Paulo – FAPESP) is a public foundation located in São Paulo, Brazil, with the aim of providing grants, funds and programs to support research, education and innovation of private and public institutions and companies. FAPESP has a dedicated Program for Bioenergy Research, BIOEN. BIOEN aims to integrate comprehensive research on sugarcane and other plants that can be used as biofuel sources, thus assuring Brazil’s position among the leaders in the area of Bioenergy. Research includes biomass improvement, production and processing, biofuels production, biorefineries, engines, sustainability and impacts.
FINEP (link) The Financier of Studies and Projects (Financiadora de Estudos e Projetos – FINEP), is a Brazilian public company, linked to the Ministry of Science and Technology and Innovation, that promotes science, technology and innovation in companies, universities, technological institutes and other public or private institutions, headquartered in Rio de Janeiro.
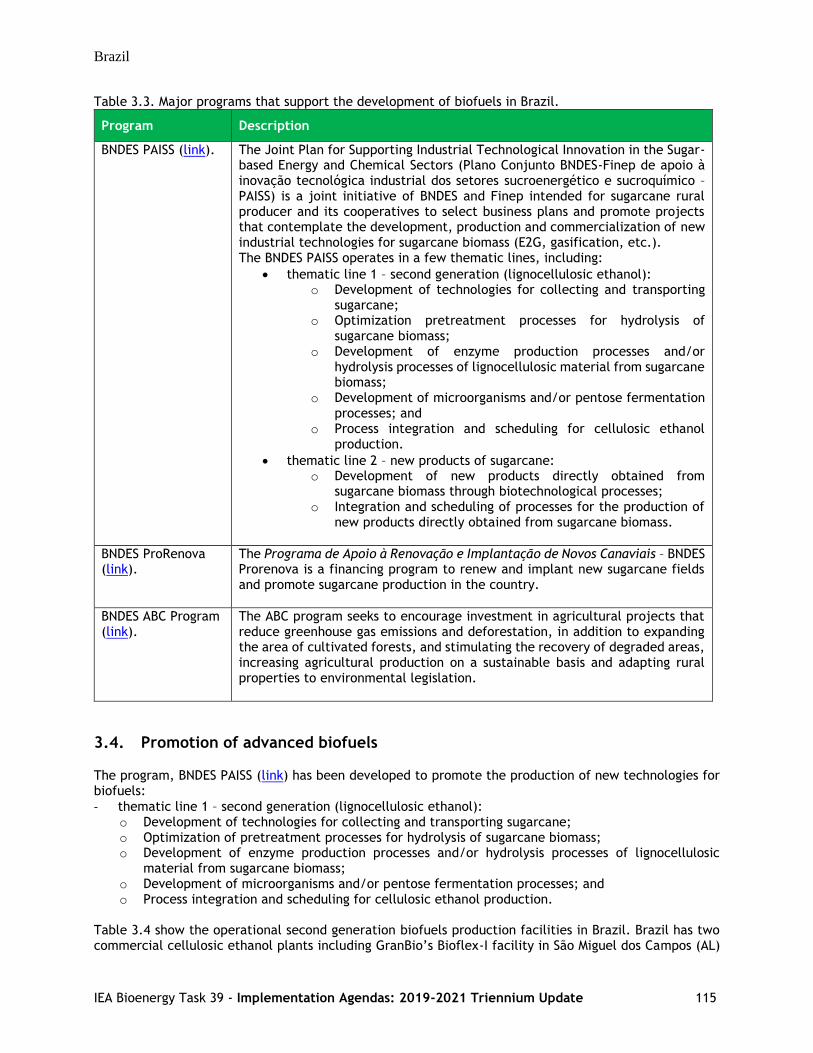
Brazil
IEA Bioenergy Task 39 - Implementation Agendas: 2019-2021 Triennium Update 115
Table 3.3. Major programs that support the development of biofuels in Brazil.
Program Description
BNDES PAISS (link). The Joint Plan for Supporting Industrial Technological Innovation in the Sugar-based Energy and Chemical Sectors (Plano Conjunto BNDES-Finep de apoio à inovação tecnológica industrial dos setores sucroenergético e sucroquímico – PAISS) is a joint initiative of BNDES and Finep intended for sugarcane rural producer and its cooperatives to select business plans and promote projects that contemplate the development, production and commercialization of new industrial technologies for sugarcane biomass (E2G, gasification, etc.). The BNDES PAISS operates in a few thematic lines, including:
• thematic line 1 – second generation (lignocellulosic ethanol): o Development of technologies for collecting and transporting
sugarcane; o Optimization pretreatment processes for hydrolysis of
sugarcane biomass; o Development of enzyme production processes and/or
hydrolysis processes of lignocellulosic material from sugarcane biomass;
o Development of microorganisms and/or pentose fermentation processes; and
o Process integration and scheduling for cellulosic ethanol production.
• thematic line 2 – new products of sugarcane: o Development of new products directly obtained from
sugarcane biomass through biotechnological processes; o Integration and scheduling of processes for the production of
new products directly obtained from sugarcane biomass.
BNDES ProRenova (link).
The Programa de Apoio à Renovação e Implantação de Novos Canaviais – BNDES Prorenova is a financing program to renew and implant new sugarcane fields and promote sugarcane production in the country.
BNDES ABC Program (link).
The ABC program seeks to encourage investment in agricultural projects that reduce greenhouse gas emissions and deforestation, in addition to expanding the area of cultivated forests, and stimulating the recovery of degraded areas, increasing agricultural production on a sustainable basis and adapting rural properties to environmental legislation.
3.4. Promotion of advanced biofuels
The program, BNDES PAISS (link) has been developed to promote the production of new technologies for biofuels:
‐ thematic line 1 – second generation (lignocellulosic ethanol): o Development of technologies for collecting and transporting sugarcane; o Optimization of pretreatment processes for hydrolysis of sugarcane biomass; o Development of enzyme production processes and/or hydrolysis processes of lignocellulosic
material from sugarcane biomass; o Development of microorganisms and/or pentose fermentation processes; and o Process integration and scheduling for cellulosic ethanol production.
Table 3.4 show the operational second generation biofuels production facilities in Brazil. Brazil has two commercial cellulosic ethanol plants including GranBio’s Bioflex-I facility in São Miguel dos Campos (AL)

Brazil
IEA Bioenergy Task 39 - Implementation Agendas: 2019-2021 Triennium Update 116
that has a nominal annual production capacity of 60 million liters, and the Raízen plant in Piracicaba (SP) that has an annual capacity of 42 million liters. In addition, there is an experimental plant in the Canavieira Technology Center (CTC) in Piracicaba (SP) that has an annual capacity of 3 million liters. The commercial plants are debugging technical problems mainly in the pre-treatment and lignin filtration stages and these two plants still operate below their nominal design capacities (GranBio, 2017; Raízen, 2018). ). By 2024, Raízen plans to build seven more cellulosic ethanol plants (https://www.raizen.com.br/pt/energia-do-futuro-tecnologia-em-energia-renovavel/etanol-de-segunda-geracao). At this year, Raízen inaugurated your first biogas plant, one of the largest biogas plants in the world based in Guariba (São Paulo, Brazil) and with 21 MW of installed capacity. This biogas plant will be used to produce 138 MWh/year from vinasse (during the harvest) and filter cake (off season). Table 3.4. Biofuel production from innovative conversion processes in Brazil
Name of company Status
(planned; operational; closed)
Technology Production capacity (ML/year)
GranBio Bioflex-I Operational E2G – BioFlex® (AVAP® e
GreenPower+®)
60 million litres/year
Raízen - Costa Pinto Operational E2G – Iogen Corporation
42 million litres/year
CTC Operational E2G 3 million litres/year
GNR Fortaleza Valorização de Biogás ltda.
Operational Biogas (biomethane)
110.000 Nm³/d
Biojet has been considered in the Renovabio policy– RANP758/2018, Annex I (link)
‐ Certification of biofuels production: aviation/jet biofuels (paraffinic kerosene, obtained from hydro processing of fatty acids and esters – process SPK-HEFA) are within the scope of the policy but there is no relevant commercial production of jet biofuels yet.
Brazil is also signatory of COP21 and is engaged in CORSIA Initiative. To develop green jet fuel, the International Civil Aviation Organization (ICAO/UN) and major airlines established an emissions reduction agreement known as CORSIA (Carbon Offsetting and Reduction Scheme for International Aviation), which sets out from 2020 a path to carbon neutral growth of the aviation industry. In addition to emission compensation instruments and energy efficiency promotion (spanning technical/aircraft, systemic/operational management and airport infrastructure), CORSIA also promotes the use of drop-in aviation biofuels, which should be produced by processes certified by ASTM International (American Society for Testing and Materials International). The Brazilian market regulation has been updated to allow the use of such biofuels in aviation. It is worth emphasizing that there are still industrial and economic challenges for biojet fuel production to be cost competitive in Brazil and worldwide with aviation kerosene of fossil origin. ProQR, a program of the Brazilian Federal Government, through the Ministry of Science, Technology, Innovations and Communications (MCTIC), articulated with the German government, aims to develop alternative fuel projects without climatic impacts for aviation. The expectation is that, in up to three years from 2020, the first pilot plant for the production of sustainable kerosene for aviation, should be implemented in Ceará (GOVERNO DO CEARÁ, 2020). Another initiative is the trials carried out on co-processing vegetable oils with petroleum feedstocks in refinery hydro-processors at a level 10% by volume in two Petrobras petroleum refineries (Gabriel Passos-REGAP in Minas Gerais and REPAR in Paraná). Plans were made for processing of vegetable oil in other
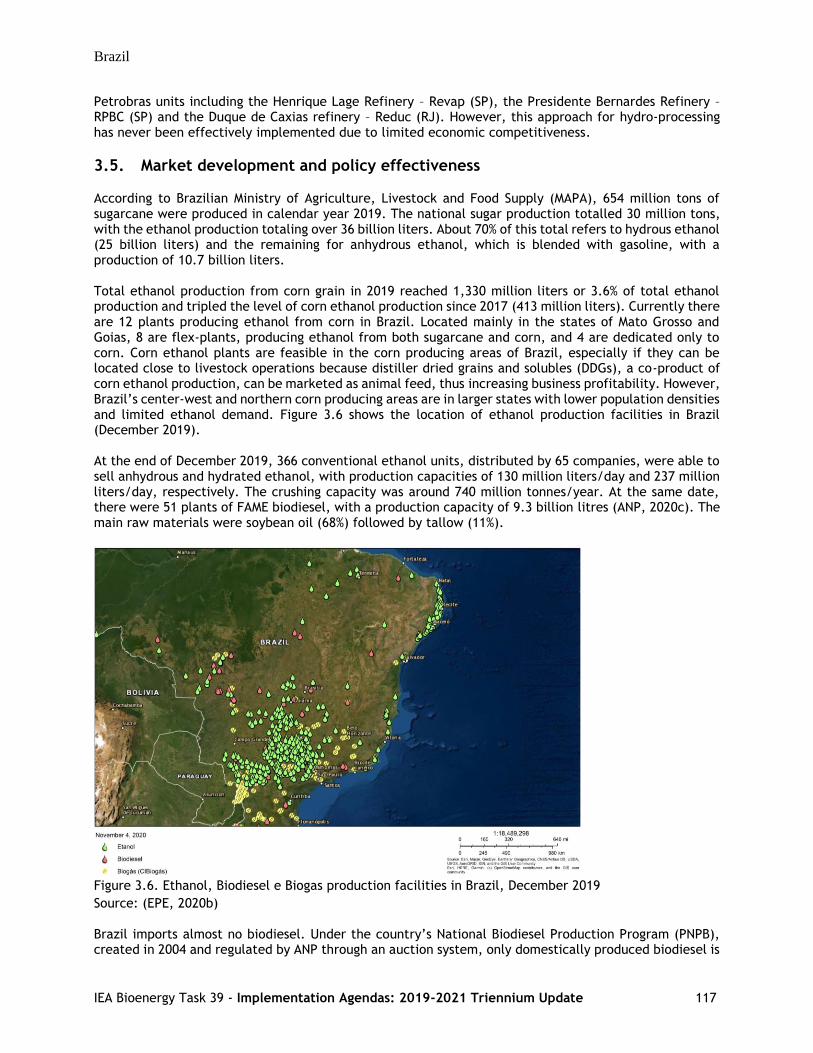
Brazil
IEA Bioenergy Task 39 - Implementation Agendas: 2019-2021 Triennium Update 117
Petrobras units including the Henrique Lage Refinery – Revap (SP), the Presidente Bernardes Refinery – RPBC (SP) and the Duque de Caxias refinery – Reduc (RJ). However, this approach for hydro-processing has never been effectively implemented due to limited economic competitiveness.
3.5. Market development and policy effectiveness
According to Brazilian Ministry of Agriculture, Livestock and Food Supply (MAPA), 654 million tons of sugarcane were produced in calendar year 2019. The national sugar production totalled 30 million tons, with the ethanol production totaling over 36 billion liters. About 70% of this total refers to hydrous ethanol (25 billion liters) and the remaining for anhydrous ethanol, which is blended with gasoline, with a production of 10.7 billion liters. Total ethanol production from corn grain in 2019 reached 1,330 million liters or 3.6% of total ethanol production and tripled the level of corn ethanol production since 2017 (413 million liters). Currently there are 12 plants producing ethanol from corn in Brazil. Located mainly in the states of Mato Grosso and Goias, 8 are flex-plants, producing ethanol from both sugarcane and corn, and 4 are dedicated only to corn. Corn ethanol plants are feasible in the corn producing areas of Brazil, especially if they can be located close to livestock operations because distiller dried grains and solubles (DDGs), a co-product of corn ethanol production, can be marketed as animal feed, thus increasing business profitability. However, Brazil’s center-west and northern corn producing areas are in larger states with lower population densities and limited ethanol demand. Figure 3.6 shows the location of ethanol production facilities in Brazil (December 2019). At the end of December 2019, 366 conventional ethanol units, distributed by 65 companies, were able to sell anhydrous and hydrated ethanol, with production capacities of 130 million liters/day and 237 million liters/day, respectively. The crushing capacity was around 740 million tonnes/year. At the same date, there were 51 plants of FAME biodiesel, with a production capacity of 9.3 billion litres (ANP, 2020c). The main raw materials were soybean oil (68%) followed by tallow (11%).
Figure 3.6. Ethanol, Biodiesel e Biogas production facilities in Brazil, December 2019
Source: (EPE, 2020b) Brazil imports almost no biodiesel. Under the country’s National Biodiesel Production Program (PNPB), created in 2004 and regulated by ANP through an auction system, only domestically produced biodiesel is

Brazil
IEA Bioenergy Task 39 - Implementation Agendas: 2019-2021 Triennium Update 118
eligible for the auction. Businesses involving heavy duty vehicle fleets like long haul trucks, buses, rail transportation and agricultural machinery are allowed to use higher blends than those specified by current legislation and could potentially import biodiesel, however in practice they do not do so as the price of the imported product is not competitive with domestically produced biodiesel. Table 3.5 shows the actual production of transport biofuels in Brazil since 2010. The volumes of imported and exported ethanol and biodiesel are shown in Table 3.6. Table 3.5. Actual production of biofuels in Brazil in the period of 2010-2019
Production ML/year Production Capacity (ML/day)
Year Biodiesel (FAME)
Anhydrous ethanol
(conventional)
Hydrous ethanol (conventional)
Biodiesel (FAME)
Anhydrous ethanol
(conventional)
Hydrous ethanol (conventional)
2010 2,386.4 8,356.7 19,567.2 16.21
2011 2,672.8 9,049.6 13,865.9 18.81
2012 2,717.5 9,563.6 13,913.1 20.57
2013 2,917.5 12,004.7 15,602.9 21.96 104 205
2014 3,419.8 12,229.8 16,295.8 21.16 106 206
2015 3,937.3 11,564.6 18,684.6 20.37 116 213
2016 3,801.3 11,727.3 16,549.1 20.48 120 219
2017 4,291.3 11,695.2 15,998.5 21.21 128 237
2018 5,350.0 9,505.2 23,692.8 23.72 126 233
2019 5,923.9 10,608.0 24,548.1 25.92 130 237
Source: (EPE, 2020a) (ANP, 2020c)
Table 3.6. Import and export of ethanol and biodiesel over the period of 2010-2018
Year Transport Biofuel
Ethanol Biodiesel
Import (M liter/year) Export (M liter/year) Export (1.000 tonnes/ year)
2010 1,900.2 75.6
2011 1,964.0 1,137.0
2012 3,055.3 553.9
2013 2,916.6 131.7 34.3
2014 1,397.9 452.0 35.3
2015 1,867.2 512.9 10.4
2016 1,789.0 832.1
2017 1,380.2 1,825.6 0.1
2018 1,689.2 1,775.3 0.1
2019 1,983.8 1,457.6 0.3
Table 3.7 shows historical fuel consumption in Brazil over the period 2010-2019.

Brazil
IEA Bioenergy Task 39 - Implementation Agendas: 2019-2021 Triennium Update 119
Table 3.7. Summary of transport fuel consumption (ML)
Year Automotive Gasoline*
Diesel fuels
Aviation gasoline (Avgas)
Aviation kerosene
Fuel oil Natural gas
Biodiesel Anhydrous ethanol
Hydrous ethanol
2010 22,759.6 38,259.3 69.6 3,878.3 1,006.8 2,007.6 1,889.2 7,097.0 16,163.0
2011 27,062.1 40,323.8 70.4 4,341.7 1,027.6 1,972.0 2,045.5 8,435.4 12,216.3
2012 31,758.2 42,655.0 76.3 4,576.2 980.3 1,941.8 2,201.7 7,759.4 11,299.3
2013 31,679.2 45,359.5 76.3 4,389.8 1,000.0 1,872.0 2,326.2 9,686.0 13,170.0
2014 33,353.0 45,677.5 76.2 4,441.1 1,040.3 1,811.5 2,694.1 11,015.7 13,972.4
2015 30,203.7 43,246.7 63.7 4,390.9 1,007.0 1,764.5 3,153.7 10,940.1 18,788.7
2016 31,403.9 41,833.6 57.2 4,018.8 905.7 1,810.4 3,119.7 11,100.3 15,594.0
2017 32,229.2 41,627.3 51.4 4,009.3 966.5 1,971.0 3,476.9 12,071.6 14,514.3
2018 27,996.8 41,184.0 48.5 4,121.0 1,019.7 2,211.7 4,386.0 10,214.3 20,123.8
2019 27,860.5 41,969.5 43.1 4,032.8 1,023.0 2,284.6 4,796.1 10,553.6 23,246.9
* Not blended. Source: (EPE, 2020a)
3.6. Co-processing at oil refineries
In 2019, the installed capacity of 17 oil refineries in Brazil was 383.3 million liters/day. There is also a 7,800 t/day crude shale processing plant (ANP, 2020d). The location of the oil refineries are shown in Figure 3.7.
Figure 3.7. Oil refineries facilities in Brazil, December 2019 (Source: (EPE, 2020b))
However, this approach for hydroconverting has never been effectively implemented due to limited economic competitiveness. On 11th July 2020, Petrobras concluded tests at industrial scale for the production of HBIO, at Presidente Getúlio Vargas Refinery (Repar), in Araucária - Paraná. There, 2 million liters of soy oil were processed, which resulted in the production of about 40 million liters of this fuel. In August 2020, Petrobras submitted a contribution to the public consultation, carried out by the National Petroleum Agency, which regulates the specification and obligations regarding the quality control for commercialization of “green diesel”. Petrobras argued that diesel produced from the co-processing of vegetable oil with traditional oil refineries, known as HBIO, should be classified as “green diesel”, which is considered in RenovaBio.

Brazil
IEA Bioenergy Task 39 - Implementation Agendas: 2019-2021 Triennium Update 120
3.7. Conclusions
In light of the public policies adopted for biofuels in Brazil, Proalcool and PNPB were precursors for the insertion of ethanol and biodiesel in the fuel market. In addition, other policies, including financial and tax incentives, have enabled the development of new industrial, agricultural and automotive technologies that generate employment and income. Besides all the natural climate and soil conditions and land abundance, which create very positive conditions for biofuels production, the key success factors have been the economic and financial sustainability of biofuels market, government support, issuing laws and regulations, tax incentives and market design aspects which stimulate the development and deployment of biofuels market (EPE, 2015). It must be noted also the synergy with energy and food production. Brazil may consider some challenges to improve biofuels market. The country should expand convergence between RenovaBio, Proconve and Rota 2030, instruments that work towards a more efficient, cleaner, more reliable and economically sustainable transport market deployment. Additionally, it is essential to integrate biomass conversion processes into biofuels, chemical inputs, materials, food, feed and energy by supporting the development and dissemination of biorefineries its also important. Finally, there are still actions to be taken to disseminate and develop new biofuels such as regulation, technological development and price competitiveness in relation to fossil substitutes. (EPE, 2020c)
Sources
ANP. (2020a). RenovaBio. Agência Nacional do Petróleo, Gás Natural e Biocombustíveis, Rio de Janeiro. Retrieved Junho 6, 2020, from http://www.anp.gov.br/producao-de-biocombustiveis/renovabio
ANP. (2020b). Efficient Production or Import Biofuels Certificates. National Agency of Petroleum, Natural Gas and Biofuels, Rio de Janeiro. Retrieved 06 22, 2020, from http://www.anp.gov.br/producao-de-biocombustiveis/renovabio/certificados-producao-importacao-eficiente
ANP. (2020c). Produção e fornecimento de biocombustíveis. Agência Nacional do Petróleo, Gás Natural e Biocombustíveis, Rio de Janeiro. Retrieved 6 22, 2020, from http://www.anp.gov.br/producao-de-biocombustiveis/etanol
ANP. (2020d). Oil, Natural Gas and Biofuels Statistical Yearbook 2020. http://www.anp.gov.br/publicacoes/anuario-estatistico/statistical-yearbook-2020. BiodieselBR. (2006). H-BIO: O novo diesel da Petrobras.BiodieselBR. Retrieved 6 22, 2020, from
https://www.biodieselbr.com/destaques/2006/h-bio-novo-diesel-petrobras
BNDES. (2008). Sugarcane-Based Bioethanol. Energy for Sustainable Development (1sd ed.). (L. A. Nogueira, Ed.) Rio de Janeiro, Rio de Janeiro, Brazil: Banco Nacional de Desenvolvimento Econômico e Social. Retrieved from https://web.bndes.gov.br/bib/jspui/bitstream/1408/6305/1/2008_Sugarcane-based%20bioethanol_energy%20for%20sustainable_P.pdf
BNDES. (2020). Plano Conjunto BNDES-Finep de apoio à inovação tecnológica industrial dos setores sucroenergético e sucroquímico - PAISS. Banco Nacional de Desenvolvimento Econômico e Social, Rio de Janeiro. Retrieved Junho 3, 2020, from https://www.bndes.gov.br/wps/portal/site/home/financiamento/plano-inova-empresa/plano-conjunto-bndes-finep-apoio-inovacao-tecnologica-industrial-setores-sucroenergetico-sucroquimico-paiss/plano-conjunto-bndes-finep-apoio-inovacao-tecnologica-industrial-se

Brazil
IEA Bioenergy Task 39 - Implementation Agendas: 2019-2021 Triennium Update 121
BRASIL. (2018). Law 13.755/2018 - Establishes mandatory requirements for the sale of vehicles in Brazil; institutes the Rota 2030 Program - Mobility and Logistics.Diário Oficial da União , Brasília. Retrieved 6 22, 2020, from http://www.planalto.gov.br/ccivil_03/_ato2015-2018/2018/lei/L13755.htm
EPE. (2015). Analysis of Biofuels’ Current Outlook – Year 2015. Energy Research Office, Rio de Janeiro. https://www.epe.gov.br/pt/publicacoes-dados-abertos/publicacoes/analise-conjunta-dos-biocombustiveis-2015. EPE. (2018). Panorama do refino e da petroquímica no Brasil. Empresa de Pesquisa Energética, Rio de
Janeiro. Retrieved 6 22, 2020, from https://epe.gov.br/sites-pt/publicacoes-dados-abertos/publicacoes/PublicacoesArquivos/publicacao-/topico-412/NT%20Refino%20e%20Petroqu%C3%ADmica_2018.11.01.pdf
EPE. (2019a). Análise de Conjuntura dos Biocombustíveis - Ano base 2018. Empresa de Pesquisa Energética, Diretoria de Estudos do Petróleo, Gás e Biocombustíveis, Rio de Janeiro. Retrieved Junho 2, 2020, from http://www.epe.gov.br/pt/publicacoes-dados-abertos/publicacoes/analise-de-conjuntura-dos-biocombustiveis
EPE. (2019b). Plano Decenal de Expansão de Energia 2029. Empresa de Pesquisa Energética, Rio de Janeiro. Retrieved 6 18, 2020, from https://www.epe.gov.br/pt/publicacoes-dados-abertos/publicacoes/plano-decenal-de-expansao-de-energia-2029
EPE. (2020a). Balanço Energético Nacional 2020. Ano-base 2019. Empresa de Pesquisa Energética, Diretoria de Estudos Econômico-Energéticos e Ambientais, Rio de Janeiro. Retrieved Junho 7, 2020, from https://www.epe.gov.br/pt/publicacoes-dados-abertos/publicacoes/balanco-energetico-nacional-ben
EPE. (2020b). WEBMAP EPE. Empresa de Pesquisa Energética, Rio de Janeiro. Retrieved 6 22, 2020, from https://gisepeprd.epe.gov.br/webmapepe/
EPE. (2020c). National Energy Plan 2050. Energy Research Office, Rio de Janeiro. https://www.epe.gov.br/pt/publicacoes-dados-abertos/publicacoes/Plano-Nacional-de-Enegia-2050 GOVERNO DO CEARÁ. (2020). Ceará deve produzir combustível sustentável para aviação. Governo do
Ceará, Fortaleza. Retrieved 6 22, 2020, from https://www.ceara.gov.br/2020/02/07/seminario-discute-producao-de-combustiveis-alternativos-para-aviacao-no-ceara/
MAPA. (2020). Cronologia da concentração etanol anidro - gasolina no brasil. Ministério da Agricultura, Pecuária e Abastecimento Secretaria de Produção e Agroenergia, Brasília. Retrieved 6 22, 2020, from https://www.gov.br/agricultura/pt-br/assuntos/sustentabilidade/agroenergia/arquivos/cronologia-da-mistura-carburante-etanol-anidro-gasolina-no-brasil.pdf
MCTI. (2018). Sistema de Registro Nacional de Emissões - Sirene. Ministério de Ciência, Tecnologia e Inovação, Brasília. Retrieved 06 22, 2020, from https://sirene.mctic.gov.br/portal/opencms/
MME. (2020). RenovaBio. Ministério das Minas e Energia, Secretaria de Petróleo, Gás Natural e Biocombustíveis. Retrieved Junho 7, 2020, from http://www.mme.gov.br/web/guest/secretarias/petroleo-gas-natural-e-biocombustiveis/acoes-e-programas/programas/renovabio
NOVACANA. (2020). Dados Estatísticos. NovaCana, Curitiba. Retrieved Junho 3, 2020, from https://www.novacana.com/
SCOPE. (2015a). Case Studies. In Bioenergy & Sustainability: bridging the gaps (Vol. 72). (G. M. Souza, Ed.) Paris, France: Scope. Retrieved from http://bioenfapesp.org/scopebioenergy/images/chapters/bioen-scope_chapter14.pdf

Brazil
IEA Bioenergy Task 39 - Implementation Agendas: 2019-2021 Triennium Update 122
SCOPE. (2015b). Perspectives on Bioenergy; in Bioenergy & Sustainability: bridging the gaps (Vol. 72). (G. M. Souza, Ed.) Paris, France: Scope. Retrieved from http://bioenfapesp.org/scopebioenergy/images/chapters/bioen-scope_chapter08.pdf
UDOP. (2020). RenovaBio: Sobe para 141 o número de unidades certificadas para a emissão de CBios. União Nacional da Bioenergia, Araçatuba/SP - Brazil. Retrieved Junho 9, 2020, from https://www.udop.com.br/noticia/2020/04/30/renovabio-sobe-para-141-o-numero-de-unidades-certificadas-para-a-emissao-de-cbios.html
Acknowledgements This work was funded by FAPESP Proc. 2018/16098-3.

Canada
IEA Bioenergy Task 39 - Implementation Agendas: 2019-2021 Triennium Update 123
4. Canada
Mahmood Ebadian and Jack Saddler, University of British Columbia Oshada Mendis and Oriana Vanderfleet, Natural Resources Canada
Summary • Recently, Canada pledged to update the country’s nationally determined contribution under the
Paris Agreement from 30% to 40-45% below 2005 levels by 2030. As such, Canada’s current GHG reduction targets are (1) a 40-45% reduction in GHG emissions by 2030 (benchmarked against 2005) and (2) net zero emissions by 2050.
• In 2019, the transport sector accounted for 186 Mt CO2 eq (25% of total emissions). GHG emissions from the transport sector have grown by 54% since 1990, mostly driven by increases from freight trucks and light trucks.
• Several federal and provincial initiatives are targetted to decarbonize the transport sector including federal and provincial Renewable Fuels Regulations, British Columbia’s Low Carbon Fuel Standard, Clean Fuel Standard, Federal Greenhouse Gas Pollution Pricing, British Columbia Carbon Tax and Quebec’s cap-and-trade carbon exchange program.
• Federal and provincial-level renewable fuels programs have continued to support conventional biofuels production and use across Canada, e.g., Federal blending mandates of 5% ethanol and 2% biodiesel (volume basis) and provincial mandates of 5% to 10% for ethanol and 2% to 4% for biodiesel (volume basis).
• The volume of ethanol consumed annually has increased from roughly 1,700 million litres in 2010 to 3,034 million litres in 2018. The volume of biodiesel consumed annually has also increased substantially since 2010, rising from roughly 123 million litres in 2010 to 368 million litres in 2018.
• Renewable diesel is blended into diesel in similar volumes as biodiesel, with consumption calculated at 343 million liters in 2018. Currently, there is no domestic production of renewable diesel in Canada and the current consumption is imported.
• Biofuels consumed in Canada offer significant carbon intensity reductions relative to gasoline and diesel. On average, in 2018, ethanol sold in Canada was 53% less carbon intensive than gasoline, while biodiesel and renewable diesel, were estimated to be 89% less carbon intensive than diesel.
• In December 2020, Canada published its nationwide Clean Fuel Standard (CFS) draft regulation in a bid to achieve more than 30 million tonnes of annual reductions in greenhouse gas emissions by 2030. This will be achieved via the increased use of lower carbon fuels, energy sources and technologies.
• Various types of federal and provincial government support have been used to encourage the production and use of biofuels. These span across all stages of the biorefining process and include; low-interest loans, grants for feasibility studies and market development, grants for storage and distribution infrastructure and tax-breaks and rebates for the purchase of biofuel-consuming vehicles.

Canada
IEA Bioenergy Task 39 - Implementation Agendas: 2019-2021 Triennium Update 124
4.1. Introduction
In 2015, Canada and 194 other countries “signed-on” to the Paris Agreement, a legally binding international treaty regarding climate change. It was adopted at COP 21, on 12 December 2015, and entered into force on 4 November 2016. Under the Paris agreement, Canada has committed to a target of reducing its GHG emissions by 30% below 2005 levels by 2030. This means a reduction from 730 megatonnes of carbon dioxide equivalent (Mt CO2 eq) in 2005 to 511 Mt CO2 eq in 2030. Most recently, at the April 2021 Leaders’ Summit on Climate hosted by the United States, Canada’s prime minister pledged to update the country’s nationally determined contribution under the Paris Agreement to 40-45% below 2005 levels by 2030.
To meet its commitment, the government of Canada released the first-ever national climate plan, The Pan-Canadian Framework on Clean Growth and Climate Change, which was jointly developed by the federal, provincial and territorial governments, in consultation with Indigenous peoples. The measures in the Pan-Canadian Framework are projected to help Canada reach its 2030 goal of a 30% reduction below 2005 levels (Government of Canada, 2021a).
In December 2020, the Government of Canada released its strengthened federal climate plan, A Healthy Environment and a Healthy Economy. The plan describes new and established federal policies, programs and investments aimed at cutting pollution and building a stronger, cleaner, more resilient and inclusive economy. The measures also include the Pan-Canadian Framework on Clean Growth and Climate Change. The proposed actions outlined in the strengthened climate plan will, once fully implemented, enable Canada to exceed its current 2030 target (see Figure 4.1) (Government of Canada, 2021a):
• In 2030, GHG emissions are projected to be 588 Mt CO2 eq under Canada's climate plan or 227 Mt CO2 eq lower than the 815 Mt CO2 eq projected before the adoption of the Pan-Canadian Framework.
• In 2030, GHG emissions are projected to be 503 Mt CO2 eq under Canada's strengthened climate plan or about 8 Mt CO2 eq below the 2030 target of 511 Mt CO2 eq.
Figure 4.1. Projected greenhouse gas emissions in 2030 to meet Canada’s commitment to the Paris
Agreement (Government of Canada, 2021a)

Canada
IEA Bioenergy Task 39 - Implementation Agendas: 2019-2021 Triennium Update 125
The emission reduction sources that will be decreased, to help Canada reach its 2030 target, are shown in Figure 4.2. For example, the oil and gas sector as well as the transportation sector are projected to contribute 116 Mt CO2 eq to the 2030 GHG emissions reduction target (about 38% of total reduction target). As described below, these two sectors were the main contributors to the national GHG emissions in 2019 (Government of Canada, 2021a).
Figure 4.2. Sources of emission reductions contributing to reaching the 2030 target (Government of
Canada, 2021a)
Canada has also committed to achieve a net-zero emissions economy by 2050. To help Canada achieve “a prosperous net-zero emissions future by 2050”, the Government of Canada introduced the Canadian Net-Zero Emissions Accountability Act, in Parliament on November 19, 2020. The Act (Bill C-12) was adopted in June 2021 by the Senate. It sets targets for every five years from 2030 to 2050, to guide the country’s transition to net-zero. Budget 2021 proposes to provide $5 billion over seven years (cash basis), starting in 2021-22, to the Net Zero Accelerator. Building on the support for the Net Zero Accelerator announced in the strengthened climate plan, this funding would allow the government to provide up to $8 billion of support for projects that will help reduce domestic greenhouse gas emissions across the Canadian economy. Later in 2021, the Government of Canada will launch the Net-Zero Challenge, a voluntary initiative to encourage Canadian companies, particularly large industrial emitters, to develop and implement plans to transition their operations to net-zero emissions by 2050 (Government of Canada, 2021a). The roadmap of Canada’s Climate Plan from 2016 to 2050, to reach a net-zero emissions economy, is summarised in Figure 4.3.

Canada
IEA Bioenergy Task 39 - Implementation Agendas: 2019-2021 Triennium Update 126
Figure 4.3. Canada’s Climate Plan to reach net-zero emissions economy by 2050 (Natural Resources
Canada, 2021)
Canada's total GHG emissions in 2019 were 730 Mt CO2 eq, a slight increase from 728 Mt CO2 eq in 2018 (see Figure 5.4). In 2019, the oil and gas sector accounted for 191 Mt CO2 eq (26% of total emissions), followed closely by the transport sector, which emitted 186 Mt CO2 eq (25%). The other Canadian economic sectors each accounted for between 7.0% and 12% of total GHG emissions (Government of Canada, 2020a).
Between 1990 and 2019, emissions increased by 21.4%, or 129 Mt CO2 eq. The increase in total GHG emissions between 1990 and 2019 was mostly due to an 87% (89 Mt CO2 eq) increase in emissions in the oil and gas sector and a 54% (65 Mt CO2 eq) increase in the transport sector. These increases were partially offset by a 34 Mt CO2 eq decrease in emissions in the electricity sector and a 20 Mt CO2 eq decrease in emissions from heavy industry (Government of Canada, 2020a).
Figure 4.4. Greenhouse gas emissions by economic sector, Canada, 1990 to 2019 (Government of Canada,
2020a)

Canada
IEA Bioenergy Task 39 - Implementation Agendas: 2019-2021 Triennium Update 127
Figure 4.5 shows the GHG emissions of the transport sector over the period of 1990-2019. Between 1990 and 2019, the GHG emissions from the transport sector grew by 54%. The growth in emissions was mostly driven by increases from freight trucks and light trucks. Between 1990 and 2019, part of the GHG emissions increase was due to a higher number of vehicles on the road and to changes in vehicle type used. Although total emissions from passenger transport grew by 38%, emissions from passenger cars declined by 21%, while emissions from light trucks (including trucks, vans and sport utility vehicles) more than doubled. Emissions from freight travel grew by 153% between 1990 and 2019. Specifically, emissions from freight trucks more than tripled and emissions from other modes of freight transport increased by 16% (Government of Canada, 2020a).
Figure 4.5. Transport sector greenhouse gas emissions, Canada, 1990 to 2019 (Government of Canada,
2020a)
There are several ways to reduce the carbon intensity of the transportation sector including improving vehicle fuel efficiency (through regulated fuel efficiency standards), increasing the number of alternatively fuelled vehicles (such as electric and CNG/LNG vehicles), improving transportation infrastructure, optimizing transport modes and shifting away from petroleum-based to less carbon-intensive fuels such as biofuels. Conventional biofuels, including ethanol and biodiesel (conventional fatty acid methyl ester- FAME) and, to a small extent, natural gas, have been produced and used in Canada to decarbonize the road transportation sector. In addition to renewable fuel mandates, other regulations are contributing to the decarbonization of the road transportation sector in Canada such as British Columbia’s Low Carbon Fuel Requirements Regulation which requires the average lifecycle carbon intensity (CI) of fuel sold within the province to decline over time. This regulation has encouraged the use of drop-in biofuels such as renewable diesel in Canada, although renewable diesel is not currently produced in Canada. Both federal and provincial regulations are in place. These include renewable fuel mandates, which require minimum renewable fuel blending in all gasoline and diesel consumed in the country. These regulations are discussed further in the next section.
4.2. Main drivers for biofuels policy
Canada has the world’s third largest proven oil reserves, after Venezuela and Saudi Arabia, and it is one of the top ten oil exporters in the world. Energy security is therefore not the driver for Canada’s

Canada
IEA Bioenergy Task 39 - Implementation Agendas: 2019-2021 Triennium Update 128
renewable fuel industry. The main drivers for renewable mandates are rural diversification and GHG emission reductions, to fight climate change, with GHG emission reduction the primary driver. The Canadian federal government has introduced carbon intensity benchmarks and it requires all of the Provinces and Territories to have a carbon pricing plan that will encourage consumption of renewable energy and biofuels.
4.3. Biofuels policy
There are many policies designed to increase the use of renewable and low-carbon biofuels at the federal and provincial levels of government in Canada, and reduce transportation greenhouse gas (GHG) emissions.
4.3.1. Biofuels obligations
5.3.1.1. Renewbale Fuels Regulations Federal and provincial-level renewable fuels programs have continued to support conventional biofuels production and use across Canada. From 2006 through 2010, the Provinces of British Columbia, Alberta, Saskatchewan, Manitoba and Ontario established blending requirements of 5 to 8.5% for ethanol in gasoline and 2 to 4% for renewable content in diesel. Since December 2010, federal regulations have required fuel producers and importers to have an average ethanol content of at least 5% based on the volume of gasoline produced or imported. Since July 2011, federal regulations have required fuel producers and importers to have at least 2%, on average, renewable content based on the volume of diesel fuel and heating distillate oil that they produce or import. The current federal Renewable Fuels Regulations include a trading system and administrative, compliance including enforcement provisions such as recordkeeping and reporting (ECCC, 2017). However, some quantities of gasoline and diesel are exempt from blending policies. For example, gasoline and diesel pools in Newfoundland and Labrador, the Territories, as well as other regions north of 60 degrees latitude are not regulated under the federal policy (Navius Research, 2020). Figure 4.6 summarizes the percentage of ethanol and biodiesel to be blended with gasoline and diesel as mandated by provincial regulations in 2020. The details of these provincial regulations can be found at sources such as Navius Research (2020) and USDA Foreign Agricultural Service (2019).
Figure 4.6. Renewbale and Low Carbon Fuel Regulations in Canada (Natural Resources Canada, 2021)

Canada
IEA Bioenergy Task 39 - Implementation Agendas: 2019-2021 Triennium Update 129
In addition to Renewable Fuel Regulations, other federal and provincial initiatives are underway to
decarbonize the transport sector.
5.3.1.2. Federal Clean Fuel Standard
In December 2017, the federal government released its Regulatory Framework on the Clean Fuel Standard
(CFS), which described how Canada will transition from volumetric-based requirements towards a carbon
intensity-based approach. However, the volumetric requirements under the current Renewable Fuels
Regulations will remain in force until Environment and Climate Change Canada (ECCC) clarifies how
Canada will transition to carbon intensity benchmarks. ECCC is the department within the Canadian
government responsible for coordinating environmental policies and programs as well as for preserving
and enhancing the natural environment and renewable resources (Government of Canada, 2020b).
The CFS will complement the Pan-Canadian approach to pricing carbon pollution and will focus on
reducing carbon intensity across the lifecycle of fuels from production to use, reducing GHGs along the
value chain of individual fuels and incenting innovation and technology.
In December 2020, Canada published its nationwide Clean Fuel Standard (CFS) draft regulation in a bid to achieve more than 30 million tonnes of annual reductions in greenhouse gas emissions by 2030. The proposed CFS Regulations would require the primary suppliers (i.e. producers and importers in Canada) of liquid fossil fuels including gasoline and diesel to reduce the carbon intensity (CI) of their fuels from 2016 CI levels by 2.4 gCO2e/MJ in 2022, increasing to 12 gCO2e/MJ in 2030. The proposed Regulations will also establish a credit market whereby the annual CI reduction requirements are met via three main categories of credit-creating actions described below (Government of Canada, 2020b):
(1) actions that reduce the CI of the fossil fuel throughout its lifecycle (e.g., carbon capture and storage, renewable electricity, co-processing)
(2) supplying low-carbon fuels such as ethanol, biodiesel and renewable diesel
(3) specified end-use fuel switching in transportation such as electricity or hydrogen in vehicles.
All three categories of credit creation will include opportunities for hydrogen and renewable natural gas (Government of Canada, 2020b):
• Compliance category 1: Credits can be created for carbon capture and storage when hydrogen is used to produce fossil fuels or lower carbon intensity fuels.
• Compliance category 2: Credits can be created for eligible renewable natural gas and hydrogen that are used as fuels.
• Compliance category 3: Credits can also be created for the hydrogen supplied to fuel cell vehicles, as well as for the renewable natural gas or hydrogen supplied to natural gas powered vehicles.
Parties that are not fossil fuel primary suppliers would be able to participate in the credit market as voluntary credit creators by completing certain actions (e.g. low-carbon fuel producers and importers). In addition, the proposed Regulations would retain the minimum volumetric requirements (at least 5% low CI fuel content in gasoline and 2% low CI fuel content in diesel fuel and light fuel oil) currently set out in the federal Renewable Fuels Regulations (RFR). The RFR would be repealed (Government of Canada, 2020b).
This is part of Canada’s desire to reduce the lifecycle carbon intensity of fuels and energy used in the country. For example, the Clean Fuel Standard (CFS) is a performance-based approach. It is designed to incentivize innovation and adoption of clean technologies and expand the use of low carbon fuels throughout the economy. The Clean Fuel Standard gives fuel suppliers the flexibility to meet the

Canada
IEA Bioenergy Task 39 - Implementation Agendas: 2019-2021 Triennium Update 130
requirements in a cost-effective way that works best for them. It also creates an incentive for industries to innovate and adopt cleaner technologies to lower their compliance costs. The Clean Fuel Standard should complement other climate policies and investments, including carbon pollution pricing. More information can be found on the government of Canada website: https://gazette.gc.ca/rp-pr/p1/2020/2020-12-19/html/reg2-eng.html
Figure 4.7 shows the timeline to develop and implement the CFS in Canada.
Figure 4.7. Clean Fuel Standard regulations development and implementation timeline in Canada (Natural
Resources Canada, 2021)
5.3.1.3. British Columbia’s Low Carbon Fuel Standard
British Columbia’s Low Carbon Fuel Standard (BC LCFS) is one of the most successful emission reduction
legislative measures used globally and is derived from the California LCFS approach. The BC LCFS consists
of both renewable fuel volume requirements (Part 2 of the act) and lifecycle (feedstock
production/acquisition through fuel use) carbon intensity (CI) reduction targets (Part 3). The Part 2
component requires most gasoline and diesel supplied in BC to contain at least 5% and 4% renewable
content by volume, respectively. To comply with the Part 3 component, fuel suppliers (producers and
importers) must reduce the carbon intensity of the provincial transportation fuel mix (gasoline, diesel,
and substitutes) by 20%, by 2030, from a 2010 baseline.
The legislation initially mandated a 10% carbon intensity reduction by 2020. This has since been amended
to 9.1% due to the difficult economic environment resulting from the COVID-19 pandemic and a
corresponding, significant, reduction in the demand for transportation fuels. For different fuel classes,
the BC Ministry of Energy, Mines and Low Carbon Innovation (BC MEMLCI) has established carbon intensity
limits that decrease yearly to a cumulative decrease of 20% by 2030. A fuel supplier generates credits for
fuels supplied in BC with a carbon intensity below the carbon intensity limit while fuels having a carbon
intensity over the limit accrue debits. Each credit or debit is equivalent to 1 tonne of CO2eq and a
supplier’s balance must either carry zero or more credits (in other words, no debits in their account) to
comply or face a non-compliance penalty of $200/debit. BC’s fuel suppliers can comply with BC LCFS by
either supplying low carbon intensity fuels, buying credits from other fuel suppliers, or earning credits
through Part 3 agreements. One of the critical features of the BC LCFS is that the ability to trade credits
provides a “market-based mechanism” for compliance.
Table 4.1 shows the compliance period and the carbon intensity (CI) limit for diesel and gasoline class.
Table 4.1. Carbon intensity reduction goals in road transportation fuels in BC LCFS (BC MEMLCI, 2020)
Compliance Period Carbon Intensity Limit for Diesel
Class Fuel g CO2e/MJ)
Carbon Intensity Limit for Gasoline
Class Fuel g CO2e/MJ)
Baseline 94.76 88.14
2018 88.60 82.41
2019 87.18 81.09
2020 86.15 80.13
2030 75.81 70.51
In addition, Part 3 agreements (an agreement between a fuel supplier and the BC MEMLCI) incentivise
fuel suppliers to undertake actions that increase the use of low carbon fuels sooner than would otherwise

Canada
IEA Bioenergy Task 39 - Implementation Agendas: 2019-2021 Triennium Update 131
have occurred and have a reasonable possibility of reducing GHG emissions. Suppliers are awarded credits
for meeting project milestones even though actual emission reductions may yet to be realized. A good
example is Parkland Refinery Ltd.’s developmental efforts to co-process lipids.
The success of the legislation is exemplified by the fact that the BC LCFS has resulted in the avoidance
of over 9 million tonnes of cumulative GHG emissions from 2010-2018, with a reduction of over 7 million
tonnes due to the use of biofuels (Figure 4.8). The BC MEMLCI is considering several amendments to the
legislation. At present, the BC LCFS relates to only gasoline, diesel and their substitutes, such as ethanol,
biodiesel, and renewable diesel. Since marine and air transport account for substantial emissions, the
ministry is considering the inclusion of jet and marine fuel classes. One option is to expand the legislation
to treat jet and marine fuels in a similar fashion as diesel and gasoline classes. The other is to allow
suppliers of aviation and marine fuel to opt-in and create credits without the added burden of compliance
debits for higher carbon intensity fuels. It is likely that an opt-in approach will bridge the price gap
between renewable jet (SAFs) and marine fuels, support market development as well as help establish
fuel quality standards.
Figure 4.8. Lifecycle emissions avioded by fuel type (BC MEMLCI, 2020)
4.3.2. Carbon Pricing
5.3.2.1. Federal Greenhouse Gas Pollution Pricing
As mentioned before, the federal government released a Pan-Canadian Framework on Clean Growth and
Climate Change, which includes a federal carbon pricing framework. The Pan-Canadian Approach to
Pricing Carbon Pollution was announced October 2016. This pricing strategy would require all provinces
and territories to have some form of carbon pricing plan in place by 2018. Under the Greenhouse Gas
Pollution Pricing Act, adopted on June 21, 2018, the federal carbon pollution pricing system has two
parts:
• A trading system for large industry, known as the output-based pricing system (OBPS)
• A regulatory federal fuel charge (FFC)
The Canadian Provinces and Territories have the flexibility to maintain or develop a carbon pollution
pricing system that works for their circumstances, provided they meet federal benchmark stringency
requirements. To ensure carbon pollution pricing applies throughout Canada, the federal backstop carbon
pollution pricing system applies, in whole or in part, in any Province or Territory that requests it or that

Canada
IEA Bioenergy Task 39 - Implementation Agendas: 2019-2021 Triennium Update 132
does not have a pricing system in place that aligns with the federal benchmark stringency requirements.
Provincial systems in place in Prince Edward Island, Alberta and Saskatchewan also meet the emission
sources they cover.
Figure 4.9 shows the Carbon Pollution Pricing System development and implementation timeline in Canada
(Government of Canada, 2021b). The Carbon Pollution Pricing System sets out a federal benchmark which
is a minimum of $20 per tonne of carbon in 2019, rising by $10 per year to $50 per tonne in 2022, then
with the yearly increase of $15 per tonne until 2030 when it reaches $170 per tonne. All direct proceeds
from carbon pollution pricing under the federal system will be returned to the jurisdiction in which they
were generated.
Figure 4.9. Carbon Pollution Pricing System development and implementation timeline in Canada
(Government of Canada, 2021b)
Since the launch of the federal framework in 2018, there have been many developments across the
country as provinces develop their own carbon pricing plans or choose to implement the federal backstop.
Figure 4.10 gives a snapshot of the various carbon pricing regimes across the country. Recent progress in
the implementation of Pan-Canadian approach to pricing carbon pollution can be found here:
Figure 4.10. Snapshot of the various carbon pricing regimes across Canada (Delphi Group, 2020)
Table 4.2 shows the impact of the federal carbon pricing on the retail price of transportation fuels.

Canada
IEA Bioenergy Task 39 - Implementation Agendas: 2019-2021 Triennium Update 133
Table 4.2. Impact of the federal carbon pricing on the retail price of transportation fuels (Advanced
Biofuels Canada, 2021)
Year 2022 2025 2030
Carbon Price ($CAD/tCO2eq) 50 95 170
Gasoline ($CAD/liter) 0.11 0.21 0.79
Diesel ($CAD/liter) 0.13 0.25 0.46
Biofuels ($CAD/liter)* 0.00 0.00 0.00
* Full excemption if blend exceeds 10% in gasoline and 5% in diesel
5.3.2.2. British Columbia Carbon Tax British Columbia was the first Canadian province to create a fuel tax. British Columbia's carbon tax has been in place since 2008. This policy adds additional carbon taxes to fossil fuels burned for transportation, home heating and electricity, and reduces personal income taxes and corporate taxes by a roughly equal amount. The carbon tax is collected at the point of retail consumption (for example, at the pump for gasoline and diesel). Carbon tax rates started at $10 CDN per ton of carbon dioxide equivalent (CO2e) emissions in 2008. The BC carbon tax was $30/tCO2e from 2012 until 2018. In April 2018, the tax rate increased to $35/tCO2e, and to $40/tCO2e in April 2019. The tax rate will generally increase by $5/tCO2e each year until it reaches $50/tCO2e in 2021. However, the increase in 2020 was delayed in light of the COVID-19 pandemic and the tax rate is still $40/tCO2e as of August 2020. Each $5/tCO2e increment increased the tax on gasoline by 1.11 ¢/L and the tax on diesel by 1.28 ¢/L (Table 4.3) (Navius Research, 2020). Table 4.3. British Columbia carbon tax rates and impact on road transportation fuel retail price (Navius
Research, 2020)
Year 2012-2017 2018 2019-2020 2020 (planned but delayed)
2021
Tax rate (CAD/tCO2eq) 30 35 40 45 50
Gasoline (CAD/liter) 0.067 0.078 0.089 0.100 0.111
Diesel (CAD/liter) 0.077 0.090 0.102 0.115 0.127
5.3.2.3. Quebec Cap and Trade The Québec GHG emissions cap and trade system began in 2014 and suppliers of transportation fuels were included as of 2015. It applies to fuel suppliers who must hold credits for the emissions resulting from the fossil fuels they distribute; emissions from biofuels are exempt from the cap and trade system. The emissions credit price affects the wholesale price of fuels. However, wholesale gasoline and diesel pricing does not show a price differentiation between fossil-biofuel blends and fuels without biofuels. The system has a price floor, which is a minimum price for credit trades. This price began in 2013 at $CAS10.75/tCO2e and rose by 5% plus inflation each year to 2020. The Québec system is linked with the California cap and trade program. The minimum credit price in the joint program must also account for the exchange rate. In practice, the average annual credit price has remained slightly above the price floor (Table 4.4) (Navius Research, 2020). Table 4.4. Quebec cap and trade average annual credit price and estimated price impact on gasoline and
diesel (Navius Research, 2020)
Year 2014 2015 2016 2017 2018 2018
Credit Price (CAD/tCO2eq) 13.4 22.71 22.59 22.31 22.67 22.71
Gasoline (CAD/liter) 0.033 0.055 0.056 0.055 0.055 0.056
Diesel (CAD/liter) 0.037 0.062 0.062 0.062 0.061 0.062

Canada
IEA Bioenergy Task 39 - Implementation Agendas: 2019-2021 Triennium Update 134
4.3.3. Excise duty reductions
While the Canadian biofuels industry had received support from production and consumption subsidies, provincial subsidies have sunset and federal production subsidies ended March 2017. However, Canadian biofuels continue to benefit from provincial-level volumetric requirements stretching from British Columbia to Ontario, which range from 5% to 10% for ethanol and from 2 to 4% for renewable content in diesel and other supporting policies that were discussed in the previous section.
4.3.4. Fiscal incentives and Investment subsidies
Canada ranked 5th amongst OECD countries for public expenditures on energy RD&D as a percentage of GDP in 2012. Expenditures by the Federal government, Provincial governments and industry on renewable and clean energy RD&D totaled approximately $ CAD 630 million in 2013/14 (Natural Resources Canada, 2015). Bioenergy related research is being conducted across Canada in universities and colleges, Federal and Provincial laboratories, and industry. RD&D has been supported at both the Federal and Provincial/territorial levels. There are various types of government support provided in Canada for biofuels, spanning across all stages of the biorefining process (see Figure 4.11). The type of support available includes:
▪ RD&D -Grants and low-interest loans ▪ Business planning - Grants for feasibility studies and market development ▪ Plant construction - Grants and low-interest loans, accelerated depreciation ▪ Production - Fuel tax exemptions, producer payments ▪ Price support - Mandated biofuel blending requirements and tariffs ▪ Distribution - Grants for storage and distribution infrastructure ▪ Consumption -Tax-breaks for the purchase of biofuel-consuming vehicles
The most recent government support to grow clean fuels market across Canada is $1.5-Billion Clean Fuels Fund. The fund supports building new or expanding existing clean fuel production facilities, including hydrogen, renewable diesel, synthetic fuels, renewable natural gas and sustainable aviation fuel. It also supports feasibility and front-end engineering and design studies that will create jobs and enable the sector to grow at the size and pace required to contribute to Canada’s climate goals.

Canada
IEA Bioenergy Task 39 - Implementation Agendas: 2019-2021 Triennium Update 135
- AAFC: Agriculture and Agri-Food Canada; BDC: Business Development Bank of Canada; CIB: Canada Infrastructure Bank; ECCC: Environment and Climate Change Canada; EDC: Export Development Canada; GAC: Global Affairs Canada; ISED: Innovation Science and Economic Development Canada; NRC: National Research Council; NRCan: Natural Resources Canada; NSERC: Natural Sciences and Engineering Research Council of Canada; TBS:Treasury Board of Canada Secretariat Figure 4.11. Fiscal incentives and investment support for bioenergy and biofuels in Canada (Natural
Resources Canada, 2021)
There are variety of investment subsidies that support or have supported the production and consumption of bioenergy and biofuels. Some of the largest incentive programs include:
• Agriculture and Agri-Food Canada (AAFC) o Agricultural Clean Technology Program o AgriInnovate Program o AgriScience Program o Agricultural Bioproducts Innovation Program o The ecoAgriculture Biofuels Capital Initiative
• Business Development Bank of Canada (BDC): o Cleantech Practice
• Canada Infrastructure Bank (CIB) o Clean Power Sector
• Environment and Climate Change Canada (ECCC): o Climate Action Incentive Fund (CAIF) o Low Carbon Economy Fund (LCEF)
• Export Development Canada (EDC): o Risk Management & Financing
• Global Affairs Canada: o CanExport o Canadian International Innovation Program (CIIP) o Going Global Innovation (GGI) o Trade Commissioner Service – Clean Technologies
• Innovation, Science and Economic Development (ISED): o Innovation Superclusters Initiative

Canada
IEA Bioenergy Task 39 - Implementation Agendas: 2019-2021 Triennium Update 136
o Regional Development Agencies (RDA) Programming (CanNor, WD, FedNor, FedDev Ontario, CED, ACOA)
o SD Tech Fund o Strategic Innovation Fund (SIF)
• National Research Council (NRC): o Industrial Research Assistance Program (IRAP)
• Natural Resources Canada (NRCan): o Clean Energy for Rural and Remote Communities Program (CERRC) o Clean Growth in Natural Resource Sectors Program (CGP) o Energy Innovation Program (EIP) o Forest Innovation Program (FIP) o Impact Canada: The Sky’s the Limit Challenge (STL) o Indigenous Forestry Initiative (IFI) o Investments in Forest Industry Transformation (IFIT) o Program of Energy Research and Development (PERD) o Clean Fuels Fund o Federal Internal Energy R&D o Transformative Technologies Program o EcoEnergy for Biofuels
• Treasury Board of Canada Secretariat: o Greening Government Strategy
• Pan-Canadian Framework on Clean Growth and Climate Change o Low Carbon Economy Fund o Low-carbon and Zero-emissions Fuels Fund capitalized with $1.5 billion o Support pre-commercial clean technologies with an additional $750 million over five years
via Sustainable Development Technology Canada
• Natural Sciences and Engineering Research Council of Canada (NSERC) o Alliance Grants
The Natural Sciences and Engineering Research Council of Canada (NSERC) supports research and
innovation undertaken by universities and companies. NSERC funds scholarships, fellowships, research
chairs, strategic projects and networks. Relevant networks include The BiofuelNet Network of Centres of
Excellence (2012 to 2017), the recently completed NSERC Bioconversion Network, the NSERC Biomaterials
and Chemicals Strategic Network (2010-2015) and the NSERC Industrial Biocatalysis Network (2014-2019).
In addition to Federal programs, Canadian Provinces have been proving financial supports to develop
biofuels technologies and markets such as BC Innovative Clean Energy (ICE) Fund, Alberta Bioenergy
Producer Program, Emissions Reduction Alberta.
4.3.5. Other measures stimulating the implementation of biofuels
In August 2018, the federal government issued a nationwide challenge to Canadians to develop the cleanest, most affordable and sustainable aviation fuel to further reduce the carbon footprint of the aviation sector. The details of this program can be found here. The Sky’s the Limit Challenge is a X-prize type model to source a breakthrough in Green Aviation fuels. In May 2019, the four finalists of the Impact Canada The Sky's the Limit Challenge was announced with each finalist receiving up to $2 million to develop their solutions (Cision, 2019). The finalists are:
• Carbon Engineering Ltd for its Sustainable Aviation Fuel., made from Air, Water and Renewable Electricity (British Columbia);
• Enerkem for its Sustainable Aviation Fuels from Agro and Forestry Biomass and from Municipal Solid Waste through a Hub and Spoke approach (Quebec);
• FORGE Hydrocarbons Corp for its Lipid-to-Hydrocarbon Biojet Project (Alberta); and
• SAF Consortium for its Production of Sustainable Aviation Fuel from flue gas–captured CO2 and low-carbon hydrogen (Quebec).
Canada
IEA Bioenergy Task 39 - Implementation Agendas: 2019-2021 Triennium Update 137
The finalists have entered an 18-month period to produce the fuel. In early 2022, the team with the best sustainable aviation fuel will be awarded a $5-million Grand Prize to help commercialize their innovation.
In 2021, the federal government introduced further supports for zero emission technologies and fuels in
its 2021 fiscal budget:
• An additional $5 billion in funding for the Net Zero Accelerator under the Strategic Innovation Fund
• $67 million to implement the Clean Fuels Standard
• Commitment on government procurement of sustainable aviation fuel and sustainable marine fuel
• Preferential tax treatment (50% income tax reduction) for producers of zero emission fuels, including green hydrogen
In addition to national initiatives to encourage the development of biofuels technologies and markets, Canada is heavily engaged in several international initiatives: Mission Innovation
• Canada played a leadership role in the first phase of Mission Innovation. From 2016-2020, Canada co-led the Sustainable Biofuels Innovation Challenge (‘IC4’) – 16 countries looking to make progress towards implementing affordable, advanced biofuels for transportation and industrial applications. Currently, Canada is exploring opportunities to contribute to the next phase of Mission Innovation (‘MI 2.0’). Mission Innovation aims to develop ways to produce, at scale, widely affordable, advanced biofuels for transportation and industrial applications.
Biofuture Platfrom
• Canada is one of 20 countries participating in the Biofuture Platform, a government-led international effort to promote accelerated development of advanced low carbon fuels, biochemicals and biomaterials. Canada is a co-lead country of the Clean Energy Ministerial Biofuture Initiative, which formally launched a The 11 Clean Energy Ministerial (CEM11). The intent is to accelerate the deployment of advanced low carbon fuels, biochemicals and biomaterials.
Global Bioenergy Partnership
• Canada is one of 23 countries participating in the Global Bioenergy Partnership (GBEP). GBEP was established to implement a Plan of Action to support "biomass and biofuels deployment, particularly in developing countries where biomass use is prevalent".
International Renewable Energy Agency
• In 2019, Canada officially joined the International Renewable Energy Agency (IRENA). IRENA is an intergovernmental organisation that supports countries in their transition to a sustainable energy future, and serves as the principal platform for international cooperation, a centre of excellence, and a repository of policy, technology, resource and financial knowledge on renewable energy.
4.4. Promotion of advanced biofuels
Although Canada’s production of biofuels using advanced technology platforms is limited, federal and provincial policy incentives favoring lower carbon intensity biofuels would provide additional support to advanced biofuels production in Canada. Canada has developed significant expertise in the development of technologies to convert non-food-based feedstocks to ethanol. Two Canadian firms have achieved pre-commercial-scale production. Enerkem makes cellulosic methanol and ethanol (which can be used as fuel or other industrial chemicals) from syngas by recycling carbon in non-recyclable municipal solid waste (MSW). In 2014, Enerkem launched the world’s first full-scale MSW-to-biofuels and chemicals facility in Edmonton, Alberta. Enerkem’s Edmonton plant started producing only methanol, but with the addition of a methanol-to-ethanol converter unit, the plant also began producing ethanol in 2017, with a current annual methanol-ethanol production capacity of 38 million

Canada
IEA Bioenergy Task 39 - Implementation Agendas: 2019-2021 Triennium Update 138
liters from 100,000 tonnes of non-recyclable MSW. The Edmonton plant became the first ever MSW-to-cellulosic ethanol plant certified to meet renewable fuel obligations under the U.S. RFS and to generate RINs, having received U.S. EPA pathway approval in 2017. Also in 2017, its ethanol scored the lowest carbon intensity value ever issued by the British Columbia Ministry of Energy and Mines under BC’s Renewable and Low Carbon Fuel Requirements Regulation (Source: Enerkem Website). Ensyn Technologies Inc., established in 1991, began its focus on renewable fuels in 2005 with the commissioning of its 70 dry tons/day plant in Renfrew, Ontario, which was initially designed to produce renewable fuels and chemicals and then retooled in 2014 to focus on heating oil and fuel. Ensyn transforms woody biomass into pyrolysis oil that can be used as a biocrude feedstock and co-processed at refineries to produce lower carbon fuels and chemical feedstocks, used as a renewable fuel oil for heating and cooling, or to produce specialty chemicals. In 2014, Ensyn Corporation converted its production plant in Renfrew, Ontario to a dedicated fuels facility with a 12 million litre/year production capacity. Using Ensyn's patented RTP® pyrolysis technology, this plant has been supplying renewable heating fuel to clients in the Northeast US since 2014. Production capacity is also being used to develop and demonstrate refinery co-processing, and the use of Ensyn's pyrolysis oil as a renewable biocrude feedstock for petroleum refineries. In 2016, construction began on the Cote Nord Project at Port Cartier, Quebec, a 50/50 joint venture between Ensyn and Arbec Forest Products. This plant has a capacity to transform forest residues using rapid thermochemical liquefaction into 40 million liters/year of biocrude by converting approximately 65,000 dry metric tons per year of slash and other forest residues from local sources to biocrude. The facility was commissioned at the end of 2017, with product offtake focusing initially on heating markets in the northeastern U.S. and eastern Canada as well as a renewable feedstock for petroleum refinery coprocessing to produce lower carbon transport fuels (Source: Ensyn Website). In 2016, Canfor Pulp Products Inc. (CPPI), a global producer of premium pulp and paper, and Licella Fibre Fuels Pty Ltd. (Licella), an Australian biofuels production start-up, formed a joint venture to use Licella’s technology to economically convert biomass into biocrude. Using Licella’s first-of-kind Catalytic Hydrothermal Reactor (Cat-HTR) technology that converts lower-value biomass from wood waste and pulp mill waste to lower carbon sustainable biofuel, the companies intend to convert residual wood and by-product streams from the CPPI Kraft pulp mills in Prince George, BC, Canada, into biocrude oil which can be co-processed by existing refineries into next-generation biofuels and biochemicals. The joint venture follows preliminary trials conducted in Australia where Licella successfully converted residual sawmill wood and pulp mill by-product streams originating from CPPI Kraft processes into a stable biocrude oil. In 2020, Licella entered into a new joint venture, Arbios Biotech (‘Arbios’), with Canfor, with a vision to provide low-carbon circular economy solutions around the world using Licella’s breakthrough Cat-HTR™ technology. Arbios will create high-value, sustainable carbon-based products, including advanced biofuels, from post-consumer biomass and residues (Licella website). Other Canadian companies that are planning to produce advanced biofuels in commercial volumes include:
• FORGE Hydrocarbons- transforming waste fats and other low value organic oils into drop-in biofuels
• SBI Bioenergy Inc- production of drop-in biofuels from bio-diesel
• Greenfield Global – integration of grain-based and cellulosic-based ethanol production
• Vanerco, a joint venture between Enerkem and GreenField, plans to develop a cellulosic ethanol plant at the GreenField ethanol plant in Varennes, Quebec
• Carbon Engineering – direct air capture of CO2 and subsequent gasification to produce Fischer–Tropsch (FT) liquids
• SAF+ Consortium- Capture industry CO2 emissions and transform them into synthetic crude and low carbon trasportation fuel like SAF
• CO2 Solutions by SAIPEM- CO2 capture and fuel synthesis- extract and purify CO2 from the air, and employs electrolysis to produce hydrogen from water using renewable electricity. The CO2 and hydrogen are then combined in a process called “thermo-catalysis”, where they are directly synthesized into liquid fuels such as gasoline and diesel
• Steeper Energy Canada Ltd (Hydrothermal Liquefaction)- pilot plant in Calgary

Canada
IEA Bioenergy Task 39 - Implementation Agendas: 2019-2021 Triennium Update 139
• Genifuel (Hydrothermal Liquefaction)- convert wet organic wastes into renewable fuels and other valuable byproducts. Pilot plant in Vancouver
• Woodland Biofuels- converting waste biomass into ethanol or other high value products
• Iogen – enzymatic hydrolysis (agricultural residues) and biogas-based fuels
• Pond Biofuels- producion of biofuels and biochemcials from algae
• Surrey Biofuel facility- processing organic waste into renewable natural gas and high quality compost
• G4 Insight- production of renewable natural gas (RNG) from lignocellulosic biomass
• Cellufuel- production of synthetic renewable fuels from the forestry resource
• CRB Innovations- steam explosion of wood for recovery of cellulosic sugars, HMF, lignin, and fibres
• Bio-Techfar- fast pyrolysis for production of pyrolysis oil, biochar, and syngas
• Cielo Renewables- convert multiple different waste streams into renewable diesel
4.5. Market development and policy effectiveness
4.5.1. Biofuels consumption in Canada
Figure 4.12 shows the consumption of road transportation fuels in Canada from 2010 to 2018. As this figure shows, compared to other biofuels, substantially more ethanol has been consumed in Canada between 2010 and 2018. The volume of ethanol consumed annually has increased from roughly 1,700 million litres in 2010 to 3,034 million litres in 2018. The estimate for 2019 is about 2,817 million litres.
Figure 4.12. Road transportaion fuel consumption in Canada (Navius Research, 2020)
The volume of biodiesel consumed annually has also increased substantially since 2010, rising from roughly 123 million litres in 2010 to 368 million litres in 2018. Hydrogenation-derived renewable diesel (HDRD) is blended into diesel in similar volumes as biodiesel, with consumption calculated at 343 million liters in 2018 (Table 4.5). The total quantity of biomass-based diesel consumption across Canada in 2018 is 711 million litres per year (Navius Research, 2020).
0
10,000
20,000
30,000
40,000
50,000
60,000
70,000
80,000
2010 2011 2012 2013 2014 2015 2016 2017 2018 2019e
Mil
lio
nL
/yr HDRD
Biodiesel
Ethanol
Diesel
Gasoline

Canada
IEA Bioenergy Task 39 - Implementation Agendas: 2019-2021 Triennium Update 140
Table 4.5. Canadian road transport fuel consumption (million liters/yr) (Navius Research, 2020)
Fuel Type 2010 2011 2012 2013 2014 2015 2016 2017 2018 2019e
Gasoline, pure 41,415 39,752 41,496 40,953 41,451 41,669 43,231 43,409 43,542 40,515
Diesel, pure 28,224 27,254 27,894 27,966 28,729 27,087 26,566 27,987 27,833 25,697
Ethanol 1,701 2,371 2,497 2,838 2,961 3,041 3,069 3,047 3,034 2,817
Biodiesel 123.6 256.1 361.9 406.4 378.2 334 340 376 368 345
HDRD 36.7 81.6 142.2 178.7 227.3 193 217 324 343 316
Renewable fuel content in gasoline
3.9% 5.6% 5.7% 6.5% 6.7% 6.8% 6.6% 6.6% 6.5% 6.5%
Renewable fuel content in diesel
0.6% 1.2% 1.8% 2.0% 2.1% 1.9% 2.1% 2.4% 2.5% 2.5%
The percentage of renewable fuel in the gasoline pool (ethanol) and in the diesel pool (biodiesel plus HDRD) is summarised in Figure 4.13. The ethanol content in Canadian gasoline was 6.5% by volume in 2018, down slightly from 6.6% in 2017. The biomass-based diesel content in 2018 was 2.5%, up from 2.4% in 2017. The national average blend rates are above what is required by the federal Renewable Fuels Regulation, partly a result of provincial policies as well as the economies of scale for renewable fuel blending once blending infrastructure is acquired (e.g. supplying a fuel market with 10% ethanol, rather than the specific required percent, once blending infrastructure is built) (Navius Research, 2020).
Figure 4.13. Renewable fuel content by fuel pool, 2010 to 2018 with an estimate for 2019 (Navius
Research, 2020)
Figure 4.14 and Figure 4.15 show the renewable fuel consumption of gasoline and diesel pools by fuel type, and feedstock.
0%
1%
2%
3%
4%
5%
6%
7%
8%
9%
10%
% b
y V
olu
me Renewable
Fuel inGasolinepool
RenewableFuel in Dieselpool

Canada
IEA Bioenergy Task 39 - Implementation Agendas: 2019-2021 Triennium Update 141
Figure 4.14. Renewable fuel consumption of gasoline pool by fuel type and feedstock (Navius Research,
2020)
Figure 4.15. Renewable fuel consumption of diesel pool by fuel type and feedstock (Navius Research,
2020)
The estimated lifecycle carbon intensity (CI) of road transportation fuels in Canada between 2010 and 2018, with an estimate for 2019, is summarised in Figure 4.16. The CI for ethanol in 2018 was 42.7 gCO2e/MJ, 15% below the value used for 2010. The weighted average for the biomass-based diesel CI in 2018 was 10.4 gCO2e/MJ, 46% below the value used for 2010. This suggests that the biofuels consumed in Canada offer significant lifecycle carbon reductions relative to gasoline and diesel. The data also implies that, on average in 2018, ethanol sold in Canada was 53% less carbon intensive than gasoline, while biodiesel and HDRD, are estimated to be 89% less carbon intensive than diesel. The data in Figure 4.17 also indicates that the CI of ethanol, biodiesel, and HDRD has decreased over time (Navius Research, 2020).

Canada
IEA Bioenergy Task 39 - Implementation Agendas: 2019-2021 Triennium Update 142
Figure 4.16. Lifecycle carbon intensity by fuel type, for Canada, with estimate for 2019 (Navius Research,
2020)
The avoided lifecycle GHG emissions in Canada resulting from biofuel consumption is summarised in Figure 4.17. This analysis shows that the avoided GHG emissions in Canada resulting from biofuel consumption has increased from 2.1 MtCO2e/yr in 2010 to 5.6 MtCO2e/yr in 2018. Cumulative national avoided GHG emissions from 2010 to 2018 is estimated to be 40.0 MtCO2e (Navius Research, 2020).
Figure 4.17. Avoided lifecycle GHG emissions, with estimate for 2019 (Navius Research, 2020)
The GHG abatement cost of biofuel blending in Canada from the perspective of consumers is summarised in Figure 4.18. The abatement cost is the cumulative cost impact by source (i.e. wholesale cost, marketing cost, tax cost), divided by the cumulative avoided GHG emissions from 2010-2018 for the gasoline and diesel pool. The cost of abatement from ethanol blending is -$322/tCO2e. The cost of abatement in the diesel pool is $149/tCO2e, or $133/tCO2e if fuel taxes were based on energy rather than volume (Navius Research, 2020).
0
10
20
30
40
50
60
70
80
90
100
2010 2011 2012 2013 2014 2015 2016 2017 2018 2019e
gC
O2e
pe
rM
J
Gasoline
Diesel
Ethanol
Biodiesel andHDRD
0.0
1.0
2.0
3.0
4.0
5.0
6.0
2010 2011 2012 2013 2014 2015 2016 2017 2018 2019e
Avo
ide
d G
HG
Em
issi
on
s, M
t/y
r
Diesel pool
Gasolinepool
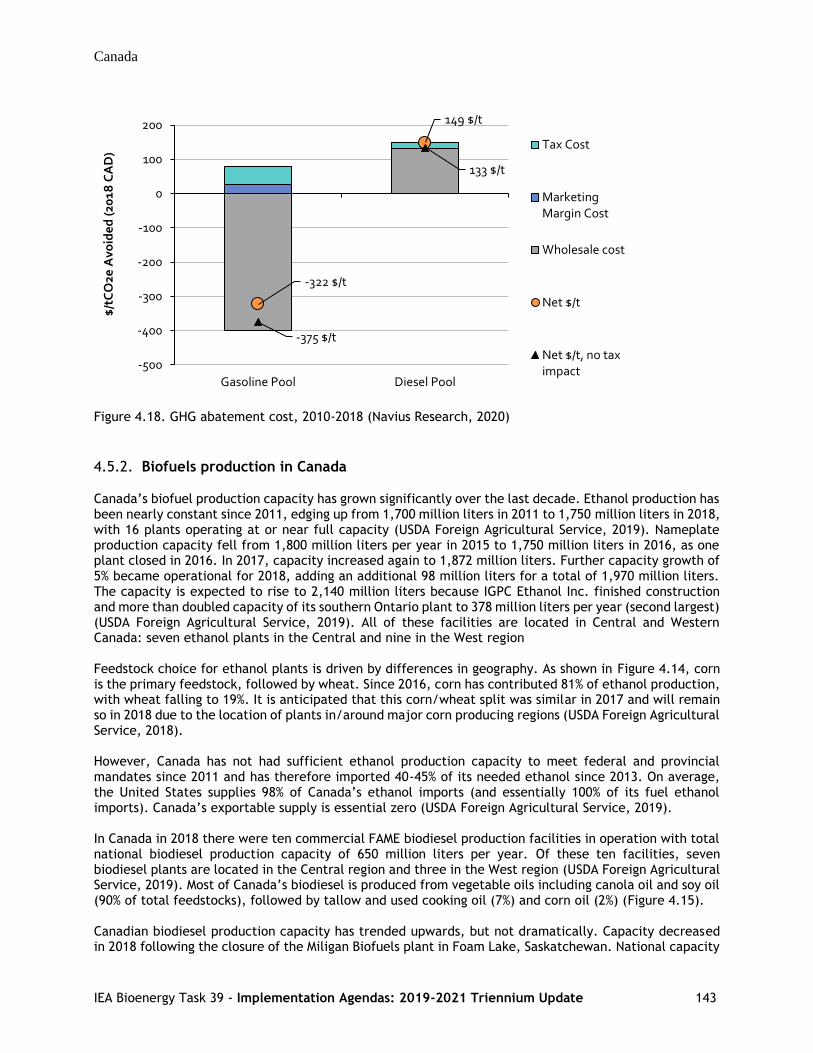
Canada
IEA Bioenergy Task 39 - Implementation Agendas: 2019-2021 Triennium Update 143
Figure 4.18. GHG abatement cost, 2010-2018 (Navius Research, 2020)
4.5.2. Biofuels production in Canada
Canada’s biofuel production capacity has grown significantly over the last decade. Ethanol production has been nearly constant since 2011, edging up from 1,700 million liters in 2011 to 1,750 million liters in 2018, with 16 plants operating at or near full capacity (USDA Foreign Agricultural Service, 2019). Nameplate production capacity fell from 1,800 million liters per year in 2015 to 1,750 million liters in 2016, as one plant closed in 2016. In 2017, capacity increased again to 1,872 million liters. Further capacity growth of 5% became operational for 2018, adding an additional 98 million liters for a total of 1,970 million liters. The capacity is expected to rise to 2,140 million liters because IGPC Ethanol Inc. finished construction and more than doubled capacity of its southern Ontario plant to 378 million liters per year (second largest) (USDA Foreign Agricultural Service, 2019). All of these facilities are located in Central and Western Canada: seven ethanol plants in the Central and nine in the West region Feedstock choice for ethanol plants is driven by differences in geography. As shown in Figure 4.14, corn is the primary feedstock, followed by wheat. Since 2016, corn has contributed 81% of ethanol production, with wheat falling to 19%. It is anticipated that this corn/wheat split was similar in 2017 and will remain so in 2018 due to the location of plants in/around major corn producing regions (USDA Foreign Agricultural Service, 2018). However, Canada has not had sufficient ethanol production capacity to meet federal and provincial mandates since 2011 and has therefore imported 40-45% of its needed ethanol since 2013. On average, the United States supplies 98% of Canada’s ethanol imports (and essentially 100% of its fuel ethanol imports). Canada’s exportable supply is essential zero (USDA Foreign Agricultural Service, 2019). In Canada in 2018 there were ten commercial FAME biodiesel production facilities in operation with total national biodiesel production capacity of 650 million liters per year. Of these ten facilities, seven biodiesel plants are located in the Central region and three in the West region (USDA Foreign Agricultural Service, 2019). Most of Canada’s biodiesel is produced from vegetable oils including canola oil and soy oil (90% of total feedstocks), followed by tallow and used cooking oil (7%) and corn oil (2%) (Figure 4.15). Canadian biodiesel production capacity has trended upwards, but not dramatically. Capacity decreased in 2018 following the closure of the Miligan Biofuels plant in Foam Lake, Saskatchewan. National capacity
-322 $/t
149 $/t
-375 $/t
133 $/t
-500
-400
-300
-200
-100
0
100
200
Gasoline Pool Diesel Pool
$/t
CO
2e A
void
ed
(20
18 C
AD
)
Tax Cost
MarketingMargin Cost
Wholesale cost
Net $/t
Net $/t, no taximpact

Canada
IEA Bioenergy Task 39 - Implementation Agendas: 2019-2021 Triennium Update 144
is expected to increase by 45 million liters per year as BIOX Corp. increases the production capacity of its Canadian operations to 112 million liters per year (16% of national biodiesel capacity). The additional 45 million liters a year would come from the company’s purchase of a shuttered biodiesel facility in Sombra, Ontario (USDA Foreign Agricultural Service, 2019). Canada’s biodiesel plants and biodiesel production are export-oriented with only part of the business focused on the domestic market. In any given year, Canada exports the majority of its biodiesel to the United States. The U.S. market nets higher returns than domestic outlets due to the U.S. biomass-based diesel (BBD) blenders tax credit, and value of Renewable Identification Numbers (RINs). There is no commercial production of renewable diesel in Canada (USDA Foreign Agricultural Service, 2019). Canadian exports have faltered accordingly after reaching a record 422 million liters 2016, falling to 325 million liters in 2017, 297 million liters in 2018, and finally an estimated 270 million liters in 2019. Persistent uncertainty over the passage of a tax extender for the BBD blenders tax credit weighs heavily on the market as well (USDA Foreign Agricultural Service, 2019). A map of ethanol and biodiesel plants in Canada can be found here.
4.6. Coprocessing
Both British Columbia’s Low Carbon Fuel Standard and the federal Clean Fuel Standard have encouraged Canadian oil refineries to consider co-processing as an economically attractive compliance pathway. In British Columbia, Part 3 Agreements have “encouraged” BC oil refineries to consider investing in co-processing as one way of reducing the carbon intensity of their operations. As a result, various co-processing trials have and are being carried out to assess some of the technical and operational aspects of co-processing while evaluating the GHG emission reduction potential resulting from a co-processing approach. For a variety of reasons, such as the non-availability and composition of “biocrudes”, all the co-processing trials carried out to date have used oleochemicals/lipid feedstocks. British Columbia has two oil refineries with a total processing capacity of 67,000 barrel per day (bbl/day) which is about 4% of Canada’s total refining capacity. The Parkland refinery in Burnaby has a capacity of 55,000 bbl/d. This refinery is already routinely co-processing low-carbon intensity lipids. This refinery was the first facility in Canada to use existing infrastructure and equipment to co-process bio-feedstocks such as canola oil, and oil derived from animal fats (tallow) alongside crude oil to produce low carbon fuels. The resulting co-processed low carbon fuels have less than one eighth of the carbon intensity of conventional fuels (Parkland website). The Tidewater refinery with a capacity of 12,000 bbl/d, is located in Prince George. The company recently announced its plans to build renewable diesel and renewable hydrogen facilities utilize Topsoe’s HydroFlex™ and H2bridge™ technologies (Topsoe website).
Sources
Government of Canada, 2020a. Greenhouse gas emissions. https://www.canada.ca/content/dam/eccc/documents/pdf/cesindicators/ghg-emissions/2021/greenhouse-gas-emissions-en.pdf Government of Canada, 2020b. Canada Gazette, Part I, Volume 154, Number 51: Clean Fuel Regulations. https://gazette.gc.ca/rp-pr/p1/2020/2020-12-19/html/reg2-eng.html Government of Canada, 2021a. Progress towards Canada’s greenhouse gas emissions reduction target. https://www.canada.ca/content/dam/eccc/documents/pdf/cesindicators/progress-towards-canada-greenhouse-gas-reduction-target/2021/progress-ghg-emissions-reduction-target.pdf
Government of Canada, 2021b. Putting a price on pollution: Carbon pollution pricing systems across Canada.

Canada
IEA Bioenergy Task 39 - Implementation Agendas: 2019-2021 Triennium Update 145
https://www.canada.ca/en/environment-climate-change/services/climate-change/pricing-pollution-how-it-will-work.html
Natural Resources Canada, 2021. Country report: Canada. IEA Bioenergy Task 39 business meeting, 19-21 April, 2021. BC Ministry of Energy, Mines and Low Carbon Innovation (BC MEMLCI), 2020. Introduction to the BC Low Carbon Fuel Standard. https://documentcloud.adobe.com/link/track?uri=urn:aaid:scds:US:c180982a-5de2-4b00-8387-b95999b89353#pageNum=1 Delphi Group, 2020. Your cheat sheet to carbon pricing in Canada. https://delphi.ca/2018/10/your-cheat-sheet-to-carbon-pricing-in-canada/ Advanced Biofuels Canada, 2021. Low carbon fuel policy trends: Biofuels & fuel marketer opportunities. https://advancedbiofuels.ca/resources/ Natural Resources Canada, 2015. Energy Markets Fact Book: 2014-2015. https://www.nrcan.gc.ca/sites/www.nrcan.gc.ca/files/energy/files/pdf/2014/14-0173EnergyMarketFacts_e.pdf Cision, 2019. Canada Announces Four Finalists for The Sky's the Limit Challenge $5-Million Grand Prize. https://www.newswire.ca/news-releases/canada-announces-four-finalists-for-the-sky-s-the-limit-challenge-5-million-grand-prize-845183710.html Navius Research, 2020. Biofuels in Canada 2020. https://www.naviusresearch.com/publications/2020-biofuels-in-canada/ USDA Foreign Agricultural Service, 2019. Canada Biofuel Annual 2019. https://apps.fas.usda.gov/newgainapi/api/report/downloadreportbyfilename?filename=Biofuels%20Annual_Ottawa_Canada_8-9-2019.pdf
USDA Foreign Agricultural Service, 2018. Canada Biofuel Annual 2017. https://apps.fas.usda.gov/newgainapi/api/report/downloadreportbyfilename?filename=Biofuels%20Annual_Ottawa_Canada_4-6-2018.pdf
Kent Group Ltd, 2017. 2016 Report – Canada’s Downstream Logistical Infrastructure: Refining, Biofuel Plants, Pipelines, Terminals, Bulk Plants & Cardlocks. https://www.kentgroupltd.com/wp-content/uploads/2017/12/Report-OverviewofCanadasLogisticalInfrastructure.pdf

Denmark
IEA Bioenergy Task 39 - Implementation Agendas: 2019-2021 Triennium Update 146
5. Denmark
Sune Tjalfe Thomsen, Department of Geosciences and Natural Resource Management, University of Copenhagen, Frederiksberg C, Denmark
Summary • Since 2010, 5.75% blending mandate (energy basis) for both ethanol and biodiesel has been in place
in Denmark. In 2020, it was increased to 7.6%, but by 2021, it will be down to 5.75% again.
• In 2020, a 0.15% mandate for advanced fuels was introduced. In 2021, the mandate will be increased to 0.75 %.
• The use of bioethanol and biodiesel was 4.5% of total road transport in 2019.
• There is no domestic production of ethanol. There are two biodiesel production plants using rapeseed oil and waste fat/oil as feedstock.
• There are no incentives for use of liquid biofuels only exemptions from CO2 tax. There is a CO2 tax of 0.42 €/L of gasoline and 0.58 €/L of diesel, with decreased tax on biofuel blends.
• There has been a large support for biogas production and use in Denmark. The biogas sector has been expanding by a factor of 4-8 to a total production of more than 18 PJ in 2020. Manure and household waste are the main feedstocks, but straw is increasingly being used and research is active on how to include straw better.
• There are funding programs for clean energy technologies R&D but there are no separate programs for biofuels. After years of decreased research funding, the research funding for green tech has increased substantially in 2020.

Denmark
IEA Bioenergy Task 39 - Implementation Agendas: 2019-2021 Triennium Update 147
5.1. Introduction
Denmark has a multi-faceted energy supply based on a variety of energy sources, a high degree of efficiency in energy consumption and a significant domestic production of oil, natural gas and renewable energy. According to the Government’s national Energy Strategy 2025, from June 2005, the goal is to improve the use of market mechanisms and to promote more cost-effective initiatives. The Danish electricity and natural gas markets have been completely liberalised. With the implementation of the CO2 allowance system in the European Union, a step has been taken towards flexibility in climate protection. It reduces energy costs and increases freedom of choice. Finally, developments in the energy system are largely to be based on Danish knowledge and technology. Overall, the Danish GHG emissions has been reduced the past two decades. Meanwhile, the emissions from transport have been stable, thus the percentual share has risen from 7% in 1990 to 11% in 2019. It should be noted that the presented data is without the share from international transport by Danish ships, planes and vehicles, which otherwise would have been a very considerable contribution due to Denmark’s large marine fleet.
Figure 5.1. Danish greenhouse gas accounts and the contribution of transport sector. Data from:
https://www.statistikbanken.dk/ene2HO
Denmark’s national binding target for renewable energy as stated in the EU Renewable Energy Directive (2009/28/EC) is 30% of gross final energy consumption in 2020. The targeted shares of the three sectors heating/cooling, electricity and transport are shown in Table 5.1. Table 5.1. Denmark’s 2020 renewable energy targets
Sector Share in gross final consumption per sector
Overall target 30%
Heating and cooling 40%
Electricity 52%
Transport 10%
0
10
20
30
40
50
60
70
80
90
100
19
90
19
91
19
92
19
93
19
94
19
95
19
96
19
97
19
98
19
99
20
00
20
01
20
02
20
03
20
04
20
05
20
06
20
07
20
08
20
09
20
10
20
11
20
12
20
13
20
14
20
15
20
16
20
17
20
18
20
19
Gre
enh
ou
se G
as A
cco
un
ts (
Mt
CO
2 e
q.)
Total (without international transport by Danish ships, planes and vehicles)
Transport (without international transport by Danish ships, planes and vehicles)

Denmark
IEA Bioenergy Task 39 - Implementation Agendas: 2019-2021 Triennium Update 148
The main vehicle to foster renewable energy has until recently been the Promotion of the Renewable Energy Act of 2009 (RED I). The act provides detailed feed-in tariffs/premium for wind, biomass, biogas and other renewable energy sourced electricity production. In terms of biofuels, the blending quota accounts for 5.75% in diesel as well as gasoline (by energy content). After years of negotiations, RED II (recast of the 2010–2020 RED I) has been adopted and published in December 2018. RED II sets the framework for the EU renewable energy policy for 2021–2030. In RED II, the overall EU target for Renewable Energy Sources consumption by 2030 has been raised to 32%. The Commission’s original proposal did not include a transport sub-target, which has been introduced by co-legislators in the final agreement: Member States must require fuel suppliers to supply a minimum of 14% of the energy consumed in road and rail transport by 2030 as renewable energy. The RED II defines a series of sustainability and GHG emission criteria that liquid biofuels used in transport must comply with to be counted towards the overall 14% target and to be eligible for financial support by public authorities. Some of these criteria are the same as in the original RED, while others are new or rephrased. In particular, the RED II introduces sustainability for forestry feedstocks as well as GHG criteria for solid and gaseous biomass fuels. Default GHG emission values and calculation rules are provided in Annex V (for liquid biofuels) and Annex VI (for solid and gaseous biomass for power and heat production) of the RED II. The Commission can revise and update the default values of GHG emissions when technological developments make it necessary. Within the 14% transport sub-target, there is a dedicated target for advanced biofuels produced from feedstocks listed in Part A of Annex IX. The contribution of advanced biofuels and biogas produced from the feedstock listed in Part A of Annex IX as a share of final consumption of energy in the transport sector shall be at least 0.2 % in 2022, at least 1% in 2025 and at least 3.5 % in 2030.15 However, REDII is awaiting implementation in Denmark and there is still uncertainty regarding future bioethanol and biodiesel blending requirements. For that reason, a rather peculiar situation has arisen, where the blending mandate has been raised for 2020, only to fall again in 2021. The requirement was 5.75% (energy basis) until 2019, but with amendment of the law in December 2019 (Act 1568 of 27 December 2019), it was raised to 7.6% in 2020. By 2021, the requirement according to the law is again 5.75 %. Biofuels can be bioethanol mixed with gasoline, biodiesel mixed with diesel, and biomethane mixed with natural gas16. The law obliges suppliers to ensure that at least 7.6% of annual sales of gasoline, diesel and gas for land transport are biofuels or biogas. The 7.6% is to be understood as the proportion of the total energy content of the fuel. Any contributions from biofuels produced from raw materials listed in Appendix 1 to the RED II count double in the fulfillment of the obligation. At the same time, suppliers must ensure that at least 5% (by energy content) of biofuels is added to gasoline. In addition, according to Executive Order No. 1625 of 27/12/2019 on the sustainability of biofuels, there is a requirement that at least 0.15% of advanced biofuels be included in the fuel delivered for transport purposes in 2020. The requirement will increase to 0.75% by 2021. This is the responsibility of obligated companies to figure out how to fulfill their biofuels obligation. For example, compliance can be done by mixing 10% by volume bioethanol in gasoline (so-called E10), 7% by volume biodiesel in diesel (so-called B7) and by using, to a certain extent, double-counting biofuels and selling fuel to vehicle fleets running at a particularly high blending percentage. Obligated companies can only fulfill their obligation with biofuels that meet the EU's sustainability criteria for biofuels2. On a national level, by June 2020 the Danish parliament has passed the new ambitious and binding Climate Act, with a reduction target of 70% of greenhouse gas emissions by 2030 compared to 1990 and a long-term goal of climate neutrality by 2050 and with the 1.5-degree objective in mind. The agreement had
15 https://ec.europa.eu/jrc/en/jec/renewable-energy-recast-2030-red-ii 16 https://ens.dk/ansvarsomraader/transport/biobraendstoffer

Denmark
IEA Bioenergy Task 39 - Implementation Agendas: 2019-2021 Triennium Update 149
broad support among the parties of parliament making the Climate Act legally binding for the future17. How this act will influence biofuels blending targets is still unresolved.
5.2. Main drivers for biofuels policy
The main driver for expanded production of biofuels would be climate change mitigation and to some degree rural development.
5.3. Biofuels policy
5.3.1. Biofuels obligations
Biofuels on a larger scale were introduced in Denmark in 2006 when Statoil began selling E5 ethanol. Since 2010, 5.75% blends of ethanol and biodiesel (energy basis) have been mandatory. In 2015, a 0.9% mandate for advanced fuels by 2020 was issued. Until 2019, the use of advanced fuels has been zero. However as stated above, the current mandate of advanced fuel blends has been set to 0.15% for 2020 and 0.75% for 2021 (see Table 5.2). The law mandating a blend of 5.75% biofuels in both diesel and gasoline can be found here: Lov om bæredygtige biobrændstoffer. An addendum was made in 2016 stating that by 2020, 0.9% of the biofuels should be advanced biofuels i.e. 2G fuels. The Danish oil industry has stated a goal of 2.5% by 2020; however, this does not appear to be a realistic goal. Furthermore, there is an order on fuel quality for use in vehicles: Bekendtgørelse om kvaliteten af benzin, dieselolie og gasolie til anvendelse i motorkøretøjer. With regard to assessing sustainability, there is a specific set of guidelines for sustainability assessment. Non-compliance of biofuel policies for companies is regulated by fines. If other renewable fuels/types of energy (e.g., electric vehicles) are used in transport, the 5.75% mandate for biofuels can be correspondingly lowered. With regard to liquid biofuels, there is still a lot of debate whether the technology is the most effective way to use biomass, which creates uncertainty in funding, political direction and legislation. However, this discussion is being shaped in the context of Denmark following the EU directive on sustainability criteria. According to an energy plan in 2012, a focus has been placed on biomass for combined heat and power (CHP) with no support for traditional biofuels. Denmark considers that the use of biomass for CHP production is a more cost-effective way to use the biomass resources than the present technology (first generation) for the production of biofuels. However, fossil fuel consumption in transport continues to increase and this needs to be addressed.
17 https://en.kefm.dk/news/news-archive/2020/jun/danish-climate-act-passed-by-parliament-with-huge-majority-
enshrining-70-reduction-target-by-2030-in-law/

Denmark
IEA Bioenergy Task 39 - Implementation Agendas: 2019-2021 Triennium Update 150
Table 5.2. Biofuel blending mandates (% by energy)
Year Ethanol Biodiesel Share of advanced biofuels
2010 5.75 5.75 0
2011 5.75 5.75 0
2012 5.75 5.75 0
2013 5.75 5.75 0
2014 5.75 5.75 0
2015 5.75 5.75 0
2016 5.75 5.75 0
2017 5.75 5.75 0
2018 5.75 5.75 0
2019 5.75 5.75 0
2020 7.6 7.6 0.15
2021 5.75 5.75 0.75
5.3.2. Excise duty reductions
There is a CO2 tax on gasoline and diesel (see Table 5.3) in Denmark, while biofuels used as motor fuel are exempt from tax18. Table 5.3. CO2 tax on gasoline and diesel in Denmark
Fuel Type Unit 2015 2016 2017 2018 2019 2020
Diesel used as engine fuel €/L 0.40 0.40 0.41 0.41 0.41 0.42
Gasoline €/L 0.56 0.56 0.57 0.57 0.58 0.58
Gasoline with 4.8 % biofuels €/L 0.55 0.56 0.56 0.56 0.57 0.57
Gasoline with 9.8 % biofuels €/L 0.56
Energy tax for gasoline equivalent (biofuel)
€/GJ 0.17 0.17 0.17 0.18 0.18 0.18
Energy tax on diesel equivalent (biofuel) €/GJ 0.10 0.10 0.10 0.10 0.10 0.10
Gasoline is lead-free gasoline (lead content not exceeding 0.013 g per liter). Data from The Danish Customs and Tax Administration, https://skat.dk/SKAT.aspx?oid=2061405, 2020
5.3.3. Fiscal incentives
No fiscal incentives are available for transportation biofuels in Denmark.
5.3.4. Investment subsidies
No investment subsidies are available for transportation biofuels in Denmark. Other measures stimulating the implementation of biofuels.
18 Ref: https://skat.dk/SKAT.aspx?oid=2060521

Denmark
IEA Bioenergy Task 39 - Implementation Agendas: 2019-2021 Triennium Update 151
Danish research activities within bioenergy cover a large range of topics, i.e., pre-treatment of lignocellulosic biomass for biogas production, integration of bioenergy in energy systems, optimal utilisation of solid biofuels, safety in handling and storage, and production of biofuels. An overview of all finalised and ongoing projects within research, development and demonstration can be found at https://energiforskning.dk. This is a website for all Danish research, development and demonstration funding programmes within energy and climate. There are funding programs for Research and Development but there are no separate programs for biofuels. Energy research funding has been has decreasing in recent years, but since 2019 funding has yet again been increasing with the most significant funding agencies being The Innovation Fund Denmark19, The Novo Nordisk Foundation 20, and The Danish energy agency who is responsible for the energy technology development programme (EUDP)21. The program focus is on energy technologies in general and it is the only current research programme that includes biofuels in its strategy. The exact funds for biofuels- or even energy-research cannot be specified, since the foundations have broader scopes. In 2020, the government granted one billion dkk (134 million €) more for green research - in addition to what is being granted normally. The new billion will be used to develop new knowledge and solutions to our massive climate and environmental challenges.
5.4. Promotion of advanced biofuels
Incentives for advanced biofuels include “double counting” of renewables targets of member states in the EU. However, it is argued by many in the industry that this has not worked and that targets for advanced biofuels should be set. By 2020, there is a new 0.15% blending mandate for advanced biofuels in Denmark. At the time of this report, there are no available data on the actual use of advanced biofuels. Ørsteds (formerly known as DONG Energy) Inbicon's ethanol plant in Kalundborg had a treatment capacity of 100 dry tonnes feedstock per day yielding 10 million liters of cellulosic ethanol per year. The conversion technology uses enzymatic hydrolysis to break down lignocellulosic material into C5 and C6 sugars which are then fermented to cellulosic ethanol. The plant was inaugurated in November 2009, produced the first straw-derived cellulosic ethanol in December 2009 and has since sold 5 million litres to Statoil. The plant received €10.2 million in public support, with a total investment around €64 million. In 2015, the plant ceased production and it currently remains idle. It is speculated that this cessation is due to the greater resource allocations required for larger scale development. For a brief time during the 2020 COVID-19 pandemic, the plant was reopened by new owners (RE Energy) and was used to produce ethanol-based hand sanitizer. The longer-term plans for this plant is currently unknown. Maabjerg Energy Center (MEC) is a joint venture between multiple stakeholders companies, among them Ørsted and Novozymes. The concept of MEC is a large-scale ethanol production facility coupled with a CHP plant and biogas plant. Annual production of ethanol and biogas is projected to yield 80 million liter and 50 million m3, respectively. The first two legs of MEC, a biogas plant and a CHP-plant are already in place, but construction of the third leg – an ethanol plant is still not finally decided upon. There are two pilot scale facilities for HTL (hydrothermal liquefaction) of biomass to advanced biofuels including:
• Aarhus University: Current focus is on treatment of sludge eventually mixed with biomass fibers used as filter aid
• Aalborg University in collaboration with Steeper Energy (Hydrofaction technology). In November 2017, the Hydrofaction™ pilot plant in Aalborg, Denmark surpassed 4750 hours of hot operation, with a total of over 1750 hours of oil production. In December 2017, Steeper Energy partnered with Silva Green
19 https://innovationsfonden.dk/en 20 https://novonordiskfonden.dk/en/ 21 https://ens.dk/ansvarsomraader/forskning-udvikling/eudp

Denmark
IEA Bioenergy Task 39 - Implementation Agendas: 2019-2021 Triennium Update 152
Fuel, a Norwegian-Swedish joint venture, to construct a $59M industrial scale demonstration plant in Norway22.
There is a large support for biogas production and use in Denmark. The biogas production has increased by 40-45% during 2016- 2017, compared to 2015 due to economical favorable conditions. The biogas sector is expanding by a factor of 4-8, reaching a total annual production of more than 18 PJ in 2020. Manure and household waste are the main feedstocks but straw is increasingly being used and there is research going on how to better include straw. Upgraded biogas, is still only used to a very minor extent to road transport, and only in special cases such as for a few public city busses.
5.5. Market development and policy effectiveness
Denmark has no domestic production of ethanol meaning that the annual consumption of nearly 86 ML is based on import. The Danish domestic production of biodiesel (FAME) covered roughly 20% (44 ML) of the total biodiesel consumption of 220 ML in 2018. There are two biodiesel plants in Denmark. Emmelev Mølle23 started operation in 2001 and is based on rapeseed as feedstock. The annual production capacity is around 180 ML, which is largely exported. Daka ecoMotion24 started production in 2008 and produces biodiesel based on animal waste fat and oils. The annual production is 55 ML25. There is no production and use of renewable diesel (hydrotreated vegetable oil (HVO) or Hydroprocessed Esters and Fatty Acids (HEFA)) in Denmark. Figure 5.2 shows the locations of pilot, demonstration and commercial biofuel plants in Denmark and Table 5.4 shows the annual biofuel production.
22 https://steeperenergy.com/2017/12/15/steeper-energy-announces-eur-50-6-m-dkk-377-m-advanced-biofuel-
project-with-norwegian-swedish-joint-venture-silva-green-fuel-in-licensing-deal/ 23 www.emmelev.dk 24 www.dakaecomotion.dk 25 IEA Bioenergy Task 39 Newsletter, Issue 53: Biofuels Production and Consumption in Denmark: Status, Advances
and Challenges, online at: http://task39.ieabioenergy.com/newsletters/
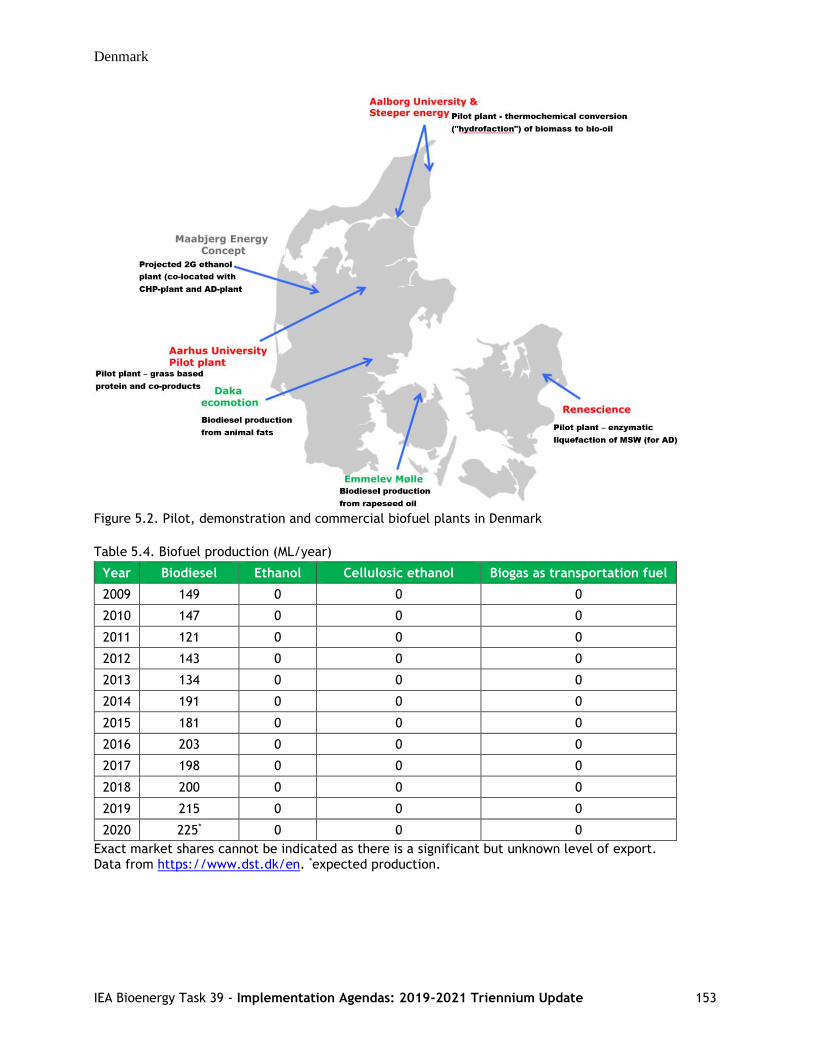
Denmark
IEA Bioenergy Task 39 - Implementation Agendas: 2019-2021 Triennium Update 153
Figure 5.2. Pilot, demonstration and commercial biofuel plants in Denmark
Table 5.4. Biofuel production (ML/year)
Year Biodiesel Ethanol Cellulosic ethanol Biogas as transportation fuel
2009 149 0 0 0
2010 147 0 0 0
2011 121 0 0 0
2012 143 0 0 0
2013 134 0 0 0
2014 191 0 0 0
2015 181 0 0 0
2016 203 0 0 0
2017 198 0 0 0
2018 200 0 0 0
2019 215 0 0 0
2020 225* 0 0 0
Exact market shares cannot be indicated as there is a significant but unknown level of export. Data from https://www.dst.dk/en. *expected production.
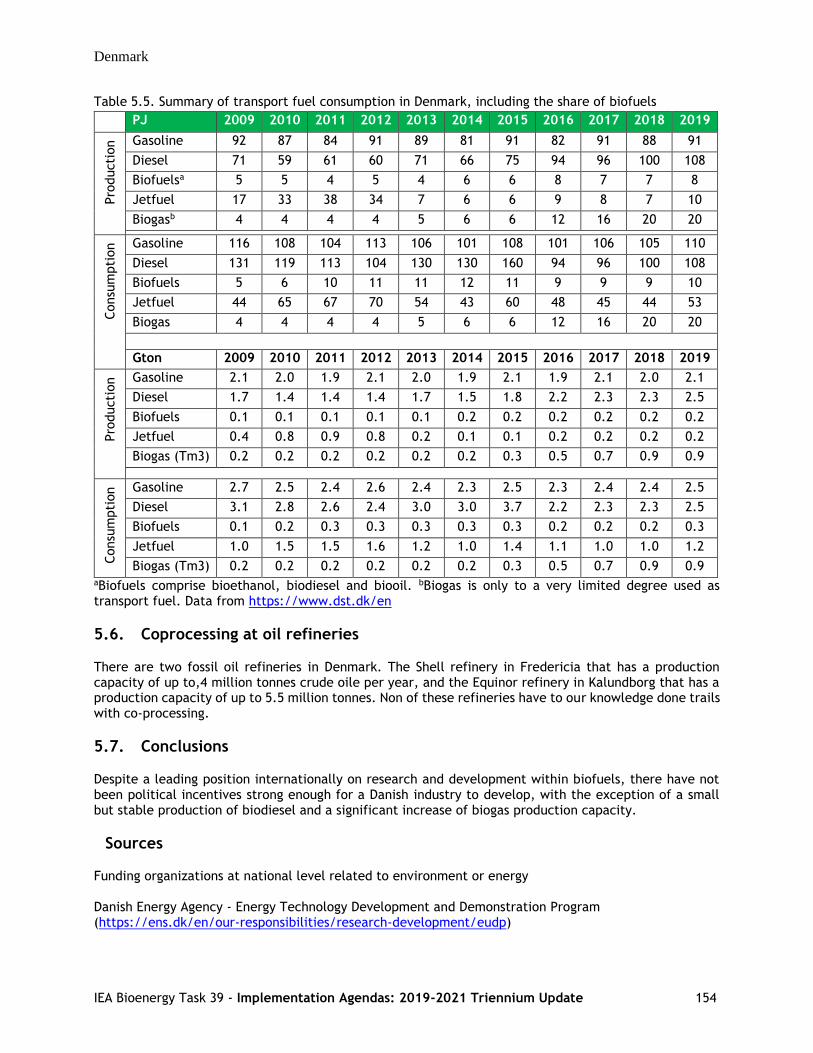
Denmark
IEA Bioenergy Task 39 - Implementation Agendas: 2019-2021 Triennium Update 154
Table 5.5. Summary of transport fuel consumption in Denmark, including the share of biofuels PJ 2009 2010 2011 2012 2013 2014 2015 2016 2017 2018 2019
Pro
ducti
on Gasoline 92 87 84 91 89 81 91 82 91 88 91
Diesel 71 59 61 60 71 66 75 94 96 100 108
Biofuelsa 5 5 4 5 4 6 6 8 7 7 8
Jetfuel 17 33 38 34 7 6 6 9 8 7 10
Biogasb 4 4 4 4 5 6 6 12 16 20 20
Consu
mpti
on Gasoline 116 108 104 113 106 101 108 101 106 105 110
Diesel 131 119 113 104 130 130 160 94 96 100 108
Biofuels 5 6 10 11 11 12 11 9 9 9 10
Jetfuel 44 65 67 70 54 43 60 48 45 44 53
Biogas 4 4 4 4 5 6 6 12 16 20 20
Gton 2009 2010 2011 2012 2013 2014 2015 2016 2017 2018 2019
Pro
ducti
on Gasoline 2.1 2.0 1.9 2.1 2.0 1.9 2.1 1.9 2.1 2.0 2.1
Diesel 1.7 1.4 1.4 1.4 1.7 1.5 1.8 2.2 2.3 2.3 2.5
Biofuels 0.1 0.1 0.1 0.1 0.1 0.2 0.2 0.2 0.2 0.2 0.2
Jetfuel 0.4 0.8 0.9 0.8 0.2 0.1 0.1 0.2 0.2 0.2 0.2
Biogas (Tm3) 0.2 0.2 0.2 0.2 0.2 0.2 0.3 0.5 0.7 0.9 0.9
Consu
mpti
on Gasoline 2.7 2.5 2.4 2.6 2.4 2.3 2.5 2.3 2.4 2.4 2.5
Diesel 3.1 2.8 2.6 2.4 3.0 3.0 3.7 2.2 2.3 2.3 2.5
Biofuels 0.1 0.2 0.3 0.3 0.3 0.3 0.3 0.2 0.2 0.2 0.3
Jetfuel 1.0 1.5 1.5 1.6 1.2 1.0 1.4 1.1 1.0 1.0 1.2
Biogas (Tm3) 0.2 0.2 0.2 0.2 0.2 0.2 0.3 0.5 0.7 0.9 0.9 aBiofuels comprise bioethanol, biodiesel and biooil. bBiogas is only to a very limited degree used as transport fuel. Data from https://www.dst.dk/en
5.6. Coprocessing at oil refineries
There are two fossil oil refineries in Denmark. The Shell refinery in Fredericia that has a production capacity of up to,4 million tonnes crude oile per year, and the Equinor refinery in Kalundborg that has a production capacity of up to 5.5 million tonnes. Non of these refineries have to our knowledge done trails with co-processing.
5.7. Conclusions
Despite a leading position internationally on research and development within biofuels, there have not been political incentives strong enough for a Danish industry to develop, with the exception of a small but stable production of biodiesel and a significant increase of biogas production capacity.
Sources
Funding organizations at national level related to environment or energy Danish Energy Agency - Energy Technology Development and Demonstration Program (https://ens.dk/en/our-responsibilities/research-development/eudp)

Denmark
IEA Bioenergy Task 39 - Implementation Agendas: 2019-2021 Triennium Update 155
Ministry of Environment and Food - The Danish Eco-Innovation Program (https://eng.ecoinnovation.dk/the-danish-eco-innovation-program/) Innovationsfonden – a range of different programs (https://innovationsfonden.dk/en/programmes) IEA Bioenergy- Country reports, 2018. Denmark – 2018 update Bioenergy policies and status of implementation. Norden, 2016. Sustainable jet fuel for aviation: Nordic perspectives on the use of advanced sustainable jet fuel for aviation. Available at: https://books.google.ca/books?id=aV83DQAAQBAJ&printsec=frontcover#v=onepage&q&f=false Global Renewable Energy- Denmark https://www.iea.org/policiesandmeasures/renewableenergy/?country=Denmark&country=Denmark Steeper Energy: https://steeperenergy.com/2017/12/15/steeper-energy-announces-eur-50-6-m-dkk-377-m-advanced-biofuel-project-with-norwegian-swedish-joint-venture-silva-green-fuel-in-licensing-deal/

European Union
IEA Bioenergy Task 39 - Implementation Agendas: 2019-2021 Triennium Update 156
6. European Union
Adrian O’Connell, Nicolae Scarlat European Commission Joint Research Centre Directorate C - Energy, Transport and Climate Energy Efficiency and Renewables - Unit C.2
Summary • The EU is the third largest producer of biofuels in the world. In 2017, North America, South &
Central America and the EU had world shares of 45.5%, 26.9% and 15%, respectively.
• In 2019, EU production of FAME biodiesel, HVO/HEFA fuels and conventional and cellulosic ethanol were ~ 10.3 million tonnes (11.6 billion liters), ~ 2.2 million tonnes (2.8 billion liters), ~ 4.3 million tonnes (5.4 billion liters) and ~ 0.008 million tonnes (0.01 billion liters), respectively. Most production is “stand-alone”, but interest in co-processing in oil refineries is growing.
• At time of writing, and due to a fall in consumption from Covid-19 lockdowns, most recent estimates indicate a likely fall in EU ethanol use of ~ 10% and a similar fall in the use of FAME and HVO-type fuels of ~ 6% in 2020, compared to 2019 levels.
• The policy mechanisms stimulating increased production and use of biofuels within EU Member States are the EU’s Energy Directive (RED, 2009/28/EC) and Fuel Quality Directive (2009/30/EC).
• In December 2018, the REDII recast 2018/2001 was published. In REDII, the overall EU target for Renewable Energy Sources consumption has been raised to 32% by 2030, up from 20% by 2020 previously. The transport sub-target requires Member States’ fuel suppliers to supply a minimum of 14% renewable energy in the energy consumed in road and rail transport by 2030.
• Within the 14% transport sub-target, there is a dedicated target for advanced biofuels. The advanced biofuels must supply a minimum of 0.2% of transport energy by 2022, 1% by 2025, and at least 3.5% by 2030.
• Fuels used in aviation and maritime sectors can opt in to contribute to the RED II’s 14% transport target but are not obligated. The contribution of non-food feedstock-based renewable fuels to these sectors will count 1.2 times their energy content.
• Later, in 2021, the European Commission is to publish two significant delegated acts describing methodologies to a) track the bio-component in co-processed biofuels and b) to calculate the GHGi of renewable fuels of non-biological origin (e.g. electrofuels) & recycled carbon fuels.

European Union
IEA Bioenergy Task 39 - Implementation Agendas: 2019-2021 Triennium Update 157
6.1. Introduction
The EU is the third largest producer of biofuels in the world. In 2017, North America, South & Central America and EU had world shares of 45.5%, 26.9% and 15%, respectively. The EU’s biofuels production in 2018 was approximately 16.8 million tonnes (19.8 billion liters). The main biofuels being produced are FAME biodiesel, renewable diesel produced by HVO/HEFA pathways, as well ethanol and a small but growing amount of biomethane in some countries (e.g., Germany and Sweden). As shown in Figure 6.1, the production of FAME biodiesel, HVO/HEFA renewable diesel and conventional (first generation) and cellulosic (second generation) ethanol were estimated to be 10.3 million tonnes (11.6 billion liters), 2.2 million tonnes (2.8 billion liters), 4.3 million tonnes (5.4 billion liters) and 0.008 million tonnes (0.01 billion liters), respectively. FAME biodiesel has the highest share of biofuels production in the EU (61%) due to the strong demand in EU Member States to meet blending mandates. Figure 6.2 shows the FAME & HVO feedstock shares in the EU in 2018.
Figure 6.1. Production of biofuels in the EU (tonnes) 2018 (USDA, 2019)26
Figure 6.2. Estimated 2018 FAME & HVO feedstock shares in the EU (USDA, 2019)
On a volumetric basis, the biofuel consumption in the EU in the road transport sector in 2019 was 8.5 vol% (FAME + HVO) of the total road diesel used, and 5.6% bioethanol in gasoline (USDA, 2020). Aviation fuel use was just under 70 billion litres in the same year, but biofuel (indeed any sustainable aviation fuel) use remains minimal in this sector (EASA, 2020). In addition, in 2019 it was reported a relatively minor amount of biogas was used in road transport in the EU; amounting to approximately 1.7% of all bioenergy supplied for road transport in the EU in 2017 (EEA, 2019).
26 The data in Figures 1 and 2 are taken from the 2018 USDA Gain Report on biofuel production (USDA, 2019). While giving a good indication of the production status of the EU biofuels industry, it includes information - most notably for biodiesel feedstocks - not often publicised by industry.
4,300,000
8,000
10,300,000
2,200,000
Ethanol - 1st gen
Ethanol - 2nd gen est.
Biodiesel FAME
HVO
5,200,000
2,860,000
2,570,000
1,000,000
800,000
185,000 680,000 Rapeseed
UCO
Palm
Soybean
Animal fats
Sunflower

European Union
IEA Bioenergy Task 39 - Implementation Agendas: 2019-2021 Triennium Update 158
Estimating the import volumes of the feedstock shares noted previously is not straightforward, as there are imports of both feedstocks and finished fuels, and import levels can change from year to year depending on trade discussions. For biodiesels for example, FEDIOL (the EU vegetable oil and proteinmeal industry association) provide an overview on vegetable oil imports into the EU for “technical pruposes”. Technical purposes27 includes a wide range of uses such as cosmetics, soaps, detergents, animal feed etc, and not only biofuel production. In 2018, FEDIOL indicated over 85% of vegetable oil imports (for all technical purposes), or approximately 3.6 million tonnes, consisted of palm oil and palm oil kernel fractions (FEDIOL, 2019). A considerable percentage of FAME biodiesel production can be considered advanced, at least not coming from food or feed sources, due to the significant availability of used cooking oil (UCO) and waste animal fats (tallow) in the EU. The absolute figure for usage of non-food or feed feedstocks used to make biodiesel remains difficult to estimate, however, as the translation of EU legislation into national law allows for margins of flexibility resulting in different consideration being given to certain feedstocks, with palm fatty acids produced during the refining of palm oil being the most notable example. Ethanol production, in contrast, remains almost entirely conventional, i.e., from food crops, mainly corn, wheat and sugar-based crops (Epure, 2019). The small portion of cellulosic ethanol being produced is also from non-food feedstocks such as crop residues, however specifities on production figures for advanced (or second generation) ethanol remain difficult to find. It is important to note that due to a fall in consumption resulting from Covid-19 lockdowns, most recent estimates indicate a likely fall in EU ethanol consumption of ~ 10% and a similar fall in the consumption of FAME and HVO-type fuels in the EU, of ~ 6% in 2020 compared to 2019 levels (USDA, 2020). Figure 6.3 shows share of energy from renewable sources in the transport sector in the EU and its Member States in 2017. As shown in Figure 6.3, Sweden, Finland and Austria already met the EU’s 2020 target of a minimum of 10% renewable energy in the energy consumed in road and rail transport by 2020 while the EU’s share of renewable energy in transport was 7.6% in 2017, as shown in Figure 6.4.
Figure 6.3. Share of energy from renewbale sources in transport in the EU (2017, in % of gross final energy
consumption)
27 https://www.fediol.eu/web/technical%20applications/1011306087/list1187970108/f1.html

European Union
IEA Bioenergy Task 39 - Implementation Agendas: 2019-2021 Triennium Update 159
Figure 6.4. Sectoral renewable energy shares (2004-2017) (European Commission, 2019)
Figure 6.5. Greenhouse gas emissions (including international aviation, excluding LULUCF28) trend, EU-
27, 1990 – 2018 (Eurostat, 2020)
Figure 6.6. Greenhouse gas emissions, analysis by source sector, EU-27, 1990 and 2018 (Eurostat, 2020)
28 LULUCF stands for Land use, land-use change, and forestry

European Union
IEA Bioenergy Task 39 - Implementation Agendas: 2019-2021 Triennium Update 160
As can be seen from the preceding graphs, CO2 emissions compared to 1990 levels in the EU are on the decrease. Nonetheless, it can also be seen that emissions from transport more recently make up approximately 25% of the overall emissions from the EU, and highlight how important efforts to reduce emissions in this sector are. The policy mechanisms stimulating increased production and use of biofuels within EU Member States are the EU’s Renewable Energy Directive (RED, 2009/28/EC) and Fuel Quality Directive (2009/30/EC), as amended in 2015 (so-called ILUC Directive (EU) 2015/1513). These EU directives are binding for all EU Member States and need to be implemented in their respective national laws. In November 2016, the European Commission published its ‘Clean Energy for all Europeans’ initiative. As part of this package, the Commission proposed a recast of the Renewable Energy Directive. The RED II was adopted by the Council on 4 December and was published in December 2018 (RED II, 2018/2001). In December 2019, the European Commission presented the ‘European Green Deal’, a new growth strategy aiming to transform the EU into a fair and prosperous society, with no net emissions of greenhouse gases in 2050 (COM(2019) 640). In order to move to a clean, circular economy and stop climate change, the EU Green Deal provides a roadmap with actions to boost the efficient use of resources. It covers all sectors of the economy, including transport. Transport accounts for a quarter of the EU’s greenhouse gas emissions and it is still growing. In order to achieve climate neutrality, a 90% reduction in transport emissions is needed by 2050. Accelerating the shift to sustainable and smart mobility is one of the elements of the European Green Deal and the ramp-up of the production and deployment of sustainable alternative transport fuels, including advanced biofuels is one of the objectives.
6.2. Policies driving the production and use of biofuels in the EU
6.2.1. RED II
In RED II, the overall EU target for Renewable Energy Sources consumption has been raised to 32% by 2030, up from 20% by 2020 previously. A transport sub-target has been introduced in the final agreement. This requires Member States’ fuel suppliers to supply a minimum of 14% renewable energy in the energy consumed in road and rail transport by 2030. The target set for transport includes a dedicated target for advanced biofuels (Part A of Annex IX) of minimum 0.2% by 2022, 1% by 2025, and at least 3.5% by 2030. Each Member State will define and design its detailed trajectory to reach these targets in their respective Integrated National Energy and Climate Plans following the guidelines set out in the Energy Union Governance Regulation. Figure 6.7 shows the governance of 2030 energy and climate goals.
Figure 6.7. Governance of 2030 energy and climate goals (European Commission, 2019)

European Union
IEA Bioenergy Task 39 - Implementation Agendas: 2019-2021 Triennium Update 161
6.2.2. Sustainability criteria in RED II
The RED II includes reinforced sustainability and greenhouse gas (GHG) emission criteria for bioenergy to cover biofuels but also solid and gaseous biomass fuels for heat and power to ensure that a) delivers high greenhouse gas (GHG) savings compared to fossil fuels; b) does not cause deforestation or degradation of habitats or loss of biodiversity; c) ensures high conversion efficiency into energy, promoting efficient use of limited resources and avoid unintended impacts on other (competitive) uses. Biofuels must comply with sustainability and greenhouse gas (GHG) emission criteria to count towards the 14% target and to be eligible for financial support by public authorities. RED II also introduces specific rules for biofuels, bioliquids and biomass fuels produced from food and feed crops to reduce the potential negative indirect land-use change impact. The RED II provides typical and default GHG emission values and calculation rules in Annex V (for liquid biofuels) and Annex VI (for solid and gaseous biomass for power and heat production). The Commission can revise and update the default values when technological developments make it necessary. Producers have the option to either use default GHG intensity values provided in RED II or to calculate their own actual values for their production pathways. Table 6.1 lists the GHG emission saving threshold in RED II. Table 6.1.Greenhouse gas emissions savings thresholds in RED II
Plant operation start date Transport biofuels
Transport renewable fuels of non-biological origin
Electricity, heating and cooling
Before October 2015 50% - -
After October 2015 60% - -
After January 2021 65% 70% 70%
After January 2026 65% 70% 80%
Biofuels, bioliquids and biomass fuels from agricultural biomass must not be produced from raw materials originating from specific land categories, from land with a high biodiversity value, land with high-carbon stock and land that was peatland in January 2008, as summarized Table 6.2. Table 6.2. . Land categories excluded from the production of biofuel feedstocks in RED II
High biodiversity land: primary forests and other wooded land; highly biodiverse forest and other wooded land; areas designated for nature protection or for the protection of rare and endangered ecosystems or species; and highly biodiverse grasslands
High-carbon stock land: wetlands, continuously forested land or other forested areas with trees higher than five meters and canopy cover between 10% and 30%
Peatland
The EU sustainability criteria are extended to cover solid and gaseous biomass fuels used in production plants above a minimum size, either a total rated thermal input above 20 MW for installations producing power, heating, cooling or fuels from solid biomass fuels, or a total rated thermal input capacity equal to or exceeding 2 MW for installations using gaseous biomass fuels. The RED II also introduces new sustainability criteria for forest biomass (biofuels, bioliquids and biomass fuels produced from forest biomass). Harvesting must be legally permitted, the harvesting level must not exceed the growth rate of the forest, and forest regeneration must take place. In addition, in order to minimise the risk of using forest biomass derived from unsustainable production, biofuels and bioenergy from forest materials must comply with requirements which mirror the principles contained in the EU Land Use, Land Use Change and Forestry (LULUCF) Regulation. The changes in carbon stock associated with biomass harvest must be accounted towards the country's commitment to reduce or limit greenhouse gas emissions and that the LULUCF-sector emissions do not exceed removals. These “forestry” criteria apply either at the country level or the forest sourcing area level; the Commission will define implementation guidelines by end of January 2021.

European Union
IEA Bioenergy Task 39 - Implementation Agendas: 2019-2021 Triennium Update 162
Bioenergy/biofuels generators are responsible for demonstrating compliance with EU sustainability criteria. Sustainability compliance will be verified through national certification schemes or voluntary schemes (VS). The updated certification rules will be posted after 2020 and market surveillance (both for Voluntary Schemes and Certification Bodies) and promotion of mutual recognition are reinforced. Figure 6.8 shows a summary of the sustainability criteria in RED II (2021-2030).
Figure 6.8. the sustainability criteria in RED II (2021-2030) (European Commission, 2019)
6.2.3. Advanced biofuels
Within the 14% transport sub-target, RED II set a dedicated target for advanced biofuels produced from feedstocks listed in Part A of Annex IX (see Table 6.3). These advanced biofuels must supply a minimum of 0.2% of transport energy by 2022, 1% by 2025, and at least 3.5% by 2030.

European Union
IEA Bioenergy Task 39 - Implementation Agendas: 2019-2021 Triennium Update 163
Table 6.3. Feedstocks for the production of biogas for transport and advanced biofuels in RED II
6.2.4. Novel transport fuels in the EU policy
Non-bio but so-called “novel” transport fuels, such as electrofuels, are included in EU legislation. Renewable liquid and gaseous transport fuel of non-biological origin (RFNBOs) and carbon capture and utilization fuels (CCUFs) for transport appeared in EU legislation back in 2015, in the aforementioned ILUC Directive (Directive 2015/1513). That Directive, which amended both the RED and the FQD, defines renewable liquid and gaseous transport fuels of non-biological origin as ‘liquid or gaseous fuels other than biofuels whose energy content comes from renewable energy sources other than biomass, and which are used in transport’. RFNBOs and CCUFs, if the energy source is renewable, count double towards the 10% transport target by 2020 as they are part of Annex IX-Part A of the amended RED.
Part A (i.e. “advanced biofuels”) Part B
Algae, if cultivated on land, either in ponds or photobioreactors
Biomass fraction of MSW from unsorted household waste
Bio-wastes separately collected from households
Biomass fraction of agro-industrial waste not fit for food or feed
Straw
Animal manure
Sewage sludge
Palm oil mill effluent and empty palm fruit bunches
Tall oil pitch
Crude glycerine
Bagasse
Grape marcs and wine lees
Nut shells
Husks
Corn cobs (cleared of corn kernels)
Waste and residues from forestry and forest products industries: bark, branches, pre-commercial thinnings, leaves, needles, tree tops, saw dust, cutter shavings, black liquor, brown liquor, fibre sludge, lignin, and tall oil
Other non-food cellulosic material, including for instance perennial grasses, but also non-starchy cover crops before and after main crops as well as ley crops. This category also includes industrial residues after the extraction of vegetable oils, sugars, starches and proteins.
Other ligno-cellulosic materials, including for instance woody short rotation crops, pulp logs and other forest-based biomass, but excluding veneer logs and saw logs.
Used cooking oil
Animal fats with high risk for human health (Category 1) and animal fats suitable for soil enhancement and chemical industry (Category 2)

European Union
IEA Bioenergy Task 39 - Implementation Agendas: 2019-2021 Triennium Update 164
RED II requires Member States (MS) oblige fuel suppliers achieve a minimum target of 14% renewable energy consumption in transport. According to its Art. 25, for the calculation of the minimum share in transport, Member States:
(a) shall take into account RFNBOs also when they are used as intermediate products for the production of conventional fuels; and
(b) may take into account RCFs. Furthermore, the RED II empowers the Commission to adopt two Delegated Acts: i) specifying the methodology for assessing GHG emission savings from RFNBOs and RCFs, and ii) the minimum thresholds for RCFs; these are under development at time of writing.
6.2.5. Caps and multipliers in RED II
The maximum contribution of biofuels produced from food and feed crops will be capped at 2020 consumption levels plus an additional 1%, with a maximum cap of 7% for road and rail transport fuels in each Member State. In comparison to the share of renewable energy used in road and rail transport in 2018 of 8.0% (with multiplicators) and 6.5% (without multiplicators), the EU average of biofuels from food and feed crops was just 4.1% in 2018 (Eurostat, energy from renewable sources). According to the RED II, the share of biofuels produced from food and feed crops, shall be no more than one percentage point higher than the share of such fuels reached in 2020 in that Member State. If the total share of conventional biofuels in any Member State is less than 1% by 2020, their share can be increased to maximum 2 % of the final consumption of energy in the road and rail transport sectors. Furthermore, if the cap on food and feed crops in a Member State is less than 7%, that country may reduce its transport target by the same amount (for example, a country with a food and feed crop cap of 5% could set its transport target by 2% below the 14% transport target to as low as 12%). “Intermediate crops” such as catch & cover crops are exempt from the cap. Figure 6.9 shows the gradual reduction of conventional biofuels use and phase-out of high ILUC risk biofuels in RED II.
Figure 6.9. Gradual reduction of conventional biofuels use and phase-out of high ILUC risk biofuels
(European Commission, 2019)
Biofuels and bioenergy produced from wastes and residues listed in Annex IX (please see Table 6.4) only need comply with the GHG minimum emission threshold sustainability criterion. Advanced biofuels listed in Part A of Annex IX will be double-counted towards both the 3.5% target and the 14% target. Biofuels produced from feedstocks listed in Part B of Annex IX will be capped at 1.7% in 2030 and will also be double counted towards the 14% target.
European Union
IEA Bioenergy Task 39 - Implementation Agendas: 2019-2021 Triennium Update 165
Table 6.4. Implementation of RED II provisions towards 2030
The Commission will review the overall 32% target by 2023, as well as the 14% sub-target for transport, and could propose to increase, but not decrease the targets.
The Commission must review the feedstocks included in Annex IX every two years and may add feedstocks to the list, but cannot remove any.
The Commission must set out criteria by February 2019 to define both “high indirect land-use change-risk (ILUC)” and ‘low indirect land-use change-risk’ feedstocks. These findings will be reviewed by 2023.
The Commission must set a GHG reduction threshold for recycled carbon fuels by January 2021, and by December 2021 must specify the methodology for GHG accounting for these fuels and for renewable fuels of non-biological origin.
By January 2021, the Commission must define the operational guidance required to demonstrate compliance with the sustainable forest management criteria and the LULUCF requirements.
In 2026, the Commission must propose a regulatory framework for the promotion of renewable energy for the post-2030 period.
Fuels produced from feedstocks with “high ILUC-risk” will be limited by a more restrictive cap at the 2019 consumption level, and will then be phased out by 2030 unless specific batches are certified as “low ILUC-risk.” Feedstocks with “low ILUC-risk” include those that are produced on land not previously used for crop production. Renewable electricity will count 4 times its energy content towards the 14% renewable energy in transport target when used in road vehicles, and 1.5 times when used in rail transport. The renewable electricity used in road vehicles and rail can be calculated on the basis of either the average share of renewable electricity in the EU or in the Member State where the electricity is supplied. The Commission will also develop a framework to guarantee that the renewable electricity used in transport is in addition to the baseline of renewable electricity generation in each Member State. Fuels used in aviation and maritime sectors can opt in to contribute to the RED II’s 14% transport target but are not obligated. The contribution of non-food feedstock-based renewable fuels to these sectors will count 1.2 times their energy content.
6.2.6. Flexibility in the implementation of RED II in member states
RED II grants individual EU Member States (MS) more flexibility compared to the original RED when translating this EU Directive into their national legislation, as summarized in Table 6.5. Table 6.5. Flexibility clauses foreseen in the RED II with respect to the implementation of the Directive by EU Member States
EU MS can exempt or distinguish between different fuel suppliers and energy carriers when defining their trajectory to achieve the 14% minimum sub-target for the transport sector.
EU MS are free to choose the most suitable form of support for renewables in transport, for example volume mandates, energy mandates or GHG emission savings targets.
EU MS can distinguish between different types of conventional biofuels and set different limits for each category (for example, setting a lower cap on oil seed crops than other types of food and feed crops).
EU MS can set lower limits on food and feed-based biofuels than prescribed in the RED II and may also reduce the 14% renewable energy in transport target by the same.
EU MS can set a different cap for biofuels produced by feedstocks in Part B of Annex IX if justified by the local availability of such feedstocks, and can define additional sustainability criteria for bioenergy but not for biofuels.
6.2.7. Translation and implementation of RED II
EU Member States (MS) must translate RED II provisions into their respective national legislation by June 2021, with several technicalities and revision clauses being defined via delegated and implementing acts. Regarding possible non-compliance; under the first RED, MS have to set a obligation on fuel suppliers to ensure that the share of renewable energy within the final consumption of energy in the transport sector

European Union
IEA Bioenergy Task 39 - Implementation Agendas: 2019-2021 Triennium Update 166
is at least 14 % by 2030. If MS do not achieve the RES target in transport, the Commission may launch an infringement procedure and bring the matter to the European Court of Justice. Under RED II, the situation is slightly different as the requirement for MS is mainly to implement a framework for promoting renewables in transport (that thus allows them to achieve the target) by introducing a supply obligation rather than achieving the target.
6.3. Advances and challenges in biofuels technologies
Consistent with EU’s regulatory framework, technological and market research in Europe are largely focussed on ‘advanced’ biofuels from non-food or feed feedstocks. Technological advances are sought in process technologies for converting feedstocks having no or low-ILUC impacts. The RED II is also quite demanding on biofuel producers to achieve high minimum GHG emission reduction thresholds towards 2030 compared to the baseline. The advanced biofuel industry in the EU is focussed on three broad categories of feedstocks: ligno-cellulosic residues from agriculture and forestry; animal manures and the biogenic fraction of wastes and residues like municipal solid wastes; and biomass types not competing with production of food and feed, such as grass feedstocks, perennial and cover crops, and algae. Two imperatives for the EU’s biofuels industry are access to sustainable feedstocks in sufficient volumes and conversion processes able to perform well and at scale on such feedstocks. Three categories of conversion technologies are relevant to achieving the RED II’s mandatory targets: biochemical, thermochemical, and oleochemical production routes. Oleochemical is the most proven and the use of waste and residues as feedstocks is expanding, and expected to continue to do so as a result of regulation. Each of these broad conversion categories includes a number of sub-technologies. The remainder of this section highlights the main identified challenges for each.
6.3.1. Biochemical conversion routes
A lot of research continues in this area (see Figure 6.10), however more and clearer public information on performance would be beneficial, particularly regarding cellulosic ethanol production systems. For anaerobic digestion (AD) for biogas production and further upgrade to biomethane, work continues to make production more profitable, in particular while using more challenging feedstocks. A large part of EU research in this area aims to show or improve the robustness and efficiency of cellulosic ethanol production routes, with butanol production also attracting increasing attention. The increasing scale (and number) of production plants worldwide indicates some progress and a high degree of continued interest in this technological area exists both in the EU and in other world regions. However, the environmental and economic performance of the processes remain critical areas for improvement. While detailed information on production costs is limited, the low level of deployment and market success of these technologies at commercial scale suggests that production costs remain higher than previously forecast, likely because of high feedstock and enzyme costs among other factors.
European Union
IEA Bioenergy Task 39 - Implementation Agendas: 2019-2021 Triennium Update 167
Figure 6.10. Biochemical conversion routes
For the anaerobic digestion sector, availability of sustainable feedstocks in sufficient volumes is among the key priorities for the EU-based biofuel industry, with specific attention being given to agricultural residues and other complex waste streams (e.g., wastewater sludges). Despite certain progress, AD processes are not economically viable; further technology improvements are needed to demonstrate economic feasibility. Research priorities include work to valorise AD digestate by recovering nutrients to co-produce market-ready products, or to embed the AD step as one of the processes in a biorefinery. Biogas upgrading to biomethane is a large goal of much new investment in AD. Public awareness about the potentials of AD is still limiting technical efforts in scaling down the technologies, so interesting possibilities to enlarge feedstock choices, for example by improving the recovery of waste streams at urban and peri-urban levels, remain under exploited.
6.3.2. Thermochemical conversion routes
This area comprises several sub-technology areas (see Figure 6.11). Overall, research on thermochemically-based biomass to liquid (BtL) technologies is attempting to achieve lower operating and capital costs to improve economic feasiblity. Again, it would be beneficial to have more and clearer information on performance and costs in the public domain. Processes making various types of bio-crudes are attempting to take advantage of possible opportunities to co-process their bio-crudes in existing petroleum refineries, and some of large oil refiners are engaged in this work. There are no large-scale gasification plants in the EU producing BtL biofuels today. Improving gasification, syngas cleaning, and Fisher-Tropsch (FT) synthesis are all research areas with potential to enhance process efficiencies and in turn decrease production costs. Smaller scales of operation requiring lower capital and operational costs to establish and run conversion plants have been identified as a promising way forward for process optimization. The energy balance of thermochemical production plants would especially benefit from enhanced integration of sub-processes to reduce external energy import requirements. Improving biomass handling to enable more flexibility towards a broader variety of feedstocks is another important research area. Others include novel clean-up systems for produced raw syngas that reduce the energy required to purify syngas, and also new catalysts that are more tolerant to impurities in syngas. Generally speaking, however, and with the exception of the AMBIGO initiative (Ambigo, 2018), this sector is not showing high confidence in the near-term possibility to profitably produce synthetic natural gas (SNG) via biomass gasification.

European Union
IEA Bioenergy Task 39 - Implementation Agendas: 2019-2021 Triennium Update 168
Figure 6.11. Thermochemical conversion routes
For fast pyrolysis, there are opportunities to improve processes to maximise bio-oil yields and to use catalysts to promote higher selectivity and yield of desirable products. Catalyst improvements also provide opportunities for the subsequent upgrading step. Several technical developments are being researched in the EU to improve catalytic fast pyrolysis and up-grading via refining processes but these are not yet at commercial scale. Reducing hydrogen consumption during hydro-treatment is another important technical challenge being researched. Obtaining pyrolysis liquids from cheaper residual resource feedstocks while maintaining product quality that meets bio-liquid specifications is another important area of investigation. Hydrothermal liquefaction (HTL) approaches for wet feedstocks are technologically proven at laboratory and/or pilot scales and appear promising with additional development for producing bio-crudes that can – as for the previous technologies - be blended with traditional fossil crude for upgrading at existing petroleum refineries. Scaling up production to close-to-market maturity remains a challenge but is critical for ongoing projects, such as the one led by Steeper Energy Aps (SEA) in Denmark, to validate process performance at large-scale and over realistic year-round operation. The potential for more cost-optimised routes that integrate HTL processing into other existing production facilities, such as with a paper mill in the case of Licella Pty Ltd in Australia, have not yet been explored in the EU. Some EU operators have attempted to upgrade biocrudes; NesteOil (Neste Oil, 2018) and Repsol (REPSOL, 2016) who tested co-processing HTL with crude oil at the scale of their production sites, albeit at very low blend levels.
6.3.3. Oleochemical conversion routes
For oleochemical routes (see Figure 6.12), the main issue for the EU (and worldwide) biofuel industry is the need to find increasing volumes – and variety – of sustainable feedstocks, and this is exacerbated by the move away from food-based feedstocks for biofuels. Unlike other routes discussed in this section, FAME and HVO pathways have proven reliable at industrial scale for many years. In the EU, the need for FAME and HVO routes to be more flexible in terms of input feedstocks is currently driving the sector’s technological development. At an individual production plant level, this translates into the need to include more complex pre-treatment units for the process. In parallel to input flexibility, HVO plants in particular are required to be increasingly flexible with respect to outputs. With a more

European Union
IEA Bioenergy Task 39 - Implementation Agendas: 2019-2021 Triennium Update 169
diversified demand for final products to fuel road and other transport modes, namely aviation and marine, the product slate including diesel, kerosene and naphtha from HVO production needs to be able to swiftly adapt to match dynamic market demand.
Figure 6.12. Oleochemical conversion routes
6.3.4. Co-processing
In addition to “stand-alone” HVO production, a considerable interest is growing in the EU towards co-processing, where the biomass feedstock is treated together with fossil feedstock in an oil refinery and thus transformed into final fuels. Co-feeding pyrolysis oils in petroleum refinery units using existing infrastructure and commercial technologies is another promising opportunity being investigated. Vegetable oils remain the most common biomass feedstocks, and the most prevalent way currently of co-processing in the EU is in a hydrotreater (or hydro-desulphurization unit), although there is some fluid catalytic cracking (FCC) capacity in the EU and companies have expressed an interest in possibly using these units to co-process. Co-processing bio-crude at existing crude oil refineries can benefit from reduced capital costs and can achieve greater economies of scale and efficiencies than stand-alone production would permit. This approach would also provide a better opportunity to tailor fuels/products portfolios according to market needs. Co-processing makes use of existing oil refinery facilities, and produces a bio-and-fossil-fuel blend in which the biofuel portion is chemicaly similar to the fossil fraction. This chemical similarity to fossil fuels brings with it the challenge of how to accurately quantify or track the volume of bio-component in the fuel blend. A number of methods are available to companies wishing to track or estimate their bio-content. These include energy balancing, where the energy content of the biomass entering co-processing is described as a fraction of total energy in all inputs (i.e. biomass and fossil). This “bio-fraction” is shared equally across the final fuels produced as a fraction of the energy content in the fuels. A direct method of measurement is 14C or radiocarbon testing of the co-processed fuel sample. Carbon exists in the atmosphere in three distinct types, or isotopes. One isotope known as Carbon 14 or 14C is unstable and slightly radioactive, and is present in biofuels but not fossil fuels, due to radioactive decay over time. Therefore, detecting the presence of 14C in a co-processed fuel allows the amount of bio-component in that fuel to be quantified. Vegetable oil-type feedstocks, in the EU at least, form the majority of co-processed biofeedstocks. There is some co-processing of residues from the paper industry, and bio-oils and bio-crudes made from lignocellulosic raw materials such as straw. But these tend to pose much more technical challenges

European Union
IEA Bioenergy Task 39 - Implementation Agendas: 2019-2021 Triennium Update 170
(especially the latter) with regard to the co-processing operation and therefore remain both of high interest and under development.
6.3.5. Broad indicator of funding by technology routes
Figure 6.13 shows an overview of the number of EU-funded advanced biofuels and biorefineries projects through its Horizon 2020 programme and how this funding is distributed across the different technical approaches for projects above 250k EUR in value and that are starting at greater than lab-scale Technology Readiness Levels (TRLs). It should be noted that some of the biorefinery projects incorporate biofuels within their product slate. Nonetheless, as this Figure 6.13 shows, the majority of fuel focussed projects are in the anaerobic digestion area, followed by fermentation, while the latter has received the largest proportion of funding compared to the other approaches.
Figure 6.13. Distribution of EU funded advanced biofuel technologies projects above 250k EUR
6.4. Conclusions
The existing and forthcoming regulatory framework in the EU requires certain areas or aspects within each biofuel technology pathway to be further developed. Improvements in these areas will yield the greatest benefits towards making these pathways commercially successful and help reach the EU’s established mandatory biofuels targets. For lignocellulosic pathways, a robust operation demonstrating steady and reliable production will be key to help establish commercialization of the technology. Detailed and verifiable results from an operating facility remains a highly sought-after objective; while such data can be commercially sensitive, without clarity on remaining technical hurdles there is a risk that future R&D investments may not be targeted as efficiently as possible. For anaerobic digestion, further developments in the successful use of lignocellulosic feedstocks and other complex waste streams will help resolve the currently constraining issues of feedstock availability and sustainability; improving digestate valorisation and biogas upgrading to biomethane are other key elements that will enable this technology to be more widely implemented.

European Union
IEA Bioenergy Task 39 - Implementation Agendas: 2019-2021 Triennium Update 171
For BtL, smaller scale operations and enhanced process integration may help to make these approaches more financially appealing. In general, co-processing of bio-crudes and bio-oils in existing refining infrastructure is an area of increasing focus, with obvious economic benefits to be realized by taking advantage of existing facilities and technologies, but these advanced feedstocks do bring technological challenges. Fine tuning the production systems of such bio-crudes is likely to reap considerable rewards, especially if the resulting oils can be more easily upgraded. But before co-processing of such advanced oils becomes more prevalent, it is likely that a growing volume of co-processing of vegetable oil-type feedstocks in oil refineries will be seen to take place, mainly because of feedstock availability and the technological maturity of co-processing such feedstocks. For FAME and HVO pathways, an on-going search for sustainable feedstocks remains key, although there are benefits to be gained by further improving the basic processes themselves.
Sources
AMBIGO, 2018. Waste wood to SNG facility. Website accessed December 2018. https://www.ambigo.nl/en/innovation.
European Commission, 2019. Bioenergy in the EU Energy and Climate Policy.
Biofuels Barometer, 2018. EurObserv’ER, September 2018. https://www.eurobserv-er.org/pdf/biofuels-barometer-2018/. EEA, 2019. Quality and greenhouse gas intensities of transport fuels in the EU in 2017. Monitoring under the Fuel Quality Directive in 2017 (2018 reporting). https://www.eea.europa.eu/publications/quality-and-greenhouse-gas-intensities-1/download
Epure, 2019. European Renewable Ethanol Association. Share of European renewable ethanol produced from each feedstock type 2018, September 2019. https://epure.org/media/1926/feedstock-used-to-produce-renewable-ethanol-2018.jpg Eurostat, 2020. Greenhouse gas emission statistics – emission inventories. Statistics Explained. June 2020. https://ec.europa.eu/eurostat/statistics-explained/pdfscache/1180.pdf FEDIOL, 2019. 2018 Annual Stats. Vegetable Oils Production, Imports, Exports, Consumption. Oct‘19. https://www.fediol.eu/data/Stat%20oils%202018%20total%20only%20revised%20rape%20yield.pdf
IRENA, International Renewable Energy Agency, 2016, Innovation Outlook – Advanced Liquid Biofuels, available at: www.irena.org/Publications
NESTE Oil, 2018 (May). Feasibility of SRF based liquids as oil refinery feedstock. EUBCE, 2018 – Copenhagen, proceedings.
Repsol, 2016. Biofuels production in conventional oil refineries through bio-oil co-processing. https://www.repsol.com/imagenes/global/en/Yuste%20R%20-%20Biofuels%20production%20in%20conventional%20oil%20refineries%20through%20bio-oil%20co-processing_tcm14-58321.pdf
USDA, 2018. EU-28 Biofuels Annual 2018. Global Agricultural Information Network. https://gain.fas.usda.gov/Recent%20GAIN%20Publications/Biofuels%20Annual_The%20Hague_EU-28_7-3-2018.pdf
USDA, 2020. EU Biofuels Annual 2020 (June). https://apps.fas.usda.gov/newgainapi/api/Report/DownloadReportByFileName?fileName=Biofuels%20Annual_The%20Hague_European%20Union_06-29-2020
Governance of the Energy Union https://ec.europa.eu/energy/en/topics/energy-strategy-and-energy-union/governance-energy-union

European Union
IEA Bioenergy Task 39 - Implementation Agendas: 2019-2021 Triennium Update 172
EU Document 52016PC0767R https://eur-lex.europa.eu/legal-content/EN/TXT/?uri=CELEX%3A52016PC0767R%2801%29
Clean energy for all Europeans https://ec.europa.eu/energy/en/topics/energy-strategy-and-energy-union/clean-energy-all-europeans
EU Document 32015L1513 https://eur-lex.europa.eu/legal-content/EN/TXT/?uri=celex%3A32015L1513

Germany
IEA Bioenergy Task 39 - Implementation Agendas: 2019-2021 Triennium Update 173
7. Germany
Franziska Müller-Langer and Gabriel Costa de Paiva, DBFZ; Nicolaus Dahmen, KIT
Summary • From 2010 until the end of 2014, Germany had an overall biofuel target which mandated the use
of at least 6,25% biofuel (in energy content) in all transport fuel. During this period, differentiated biofuel targets were also in place including at least 2,8% biofuel in gasoline and 4,4% biofuels in diesel.
• As the first European Member State, Germany shifted from energetic related quota to a GHG related quota starting in January 2015. The GHG reduction targets are 3,5%, 4% and 6% in the fuel mix for the entire fuel sector from 2015, 2017 and 2020 onwards, respectively.
• According to Germany’s Energy Tax Law, there is no tax relief for FAME biodiesel, HVO/HEFA fuels, vegetable oils and ethanol. FAME biodiesel, HVO/HEFA fuels and vegetable oils have the same fuel tax as diesel fuel (€ 0,4104/liter). Ethanol has the same fuel tax as gasoline fuel (€ 0,6545/liter). The fuel tax for CNG and biomethane is €0,0139/kWh until 2023.
• Germany is evaluating specific policies to promote advanced biofuels. There are no specific policies promoting aviation biofuels.
• No financial incentives are available for advanced/new biofuels, making it quite difficult to penetrate into the fuel market, even with the GHG quota.
• There are various funding programs for R&D&D with emphasis on the use of diversified raw materials for various synthetic fuels and fuels components, decentralized-centralized concepts along value chains, promoting Germany’s role as technology developer, and integration of renewable fuels based on biomass and electricity into the energy transition.

Germany
IEA Bioenergy Task 39 - Implementation Agendas: 2019-2021 Triennium Update 174
7.1. Introduction
In Germany, about 30% of total energy demand (~8.996 PJ in 2018) relates to the transport sector, of which just approximately 4% are renewable fuels (BMU 2016; UBA 2020). This share has decreased in the past few years, but is still mainly covered by biofuels that are used for road transport. However, the share of greenhouse gas (GHG) emissions from transport has slightly decreasedfrom 165 Mt in 1990 to about 164 in 2018 (163,6 Mt) . The transport secotor contributes about 19,7% to the total GHG inventoy in in Germany. For comparison, the transport share in the country GHG emissions inventory was 13,5% in 1990 (BMWi 2019, 2015). In the light of the Paris agreement, CO2-eq emission reduction of the transport sector is now a high priority in Germany. According to the German climate protection plan, the GHG reduction target for transport is 40 to 42% until 2030 (compared to 1990) (BMU 2016). Over the same time period, an increase in freight transport of about 38% and in personal transport of about 13% is forecasted by 2030 (compared to 2010) (BMVI 2020). This has to be accompanied by the given challenges in fulfilling emissions standards in the context of energy and transport mode. In this light and pushed by debates (e.g., on bans for combustion engines as result of the “diesel scandal”) in Germany, there are ongoing serious discussions about making a paradigm change to establish renewable based electro mobility and renewable fuels like hydrogen and power based synfuels (so-called power-to-X (PtX) fuels, e.g, power-to-gaseous fuels (PtG) or power-to-liquid fuels (PtL)) in addition to or instead of biofuels. Especially for transport sectors like aviation, heavy duty road transport and cargo shipping, there are enormous challenges to implemente powertrains driven by electrical energy; electrical power is not an option or only to a minor extent for these transport sectors (Müller-Langer et al. 2016).
7.2. Main drivers for biofuels policy
Following the Paris Agreement, the primary driver is to fight climate change by focusing on low-carbon technologies, CO2 use and efficient renewable products from biomass and electricity. GHG savings are the primary driver for implementing German biofuel policies, and for that reason, Germany will be subject to Article 17 of the European Renewable Energy Directive (RED) 2009/28/EC “Promotion of the Use of Energy from Renewable Sources” that states that GHG savings from biofuels, compared to fossil fuels, must exceed 35% as of 2009, 50% as of 2017, and 60% as of 2018 (if the production line started in or after 2017) (European Parliament 2009a).
7.3. Biofuels policy
The main instruments for decarbonizing the transport sector in the EU along the whole value chain (or well-to-wheel, WTW, or well-to-tank, WTT) are: (i) related to the fuel side, a target of 10% sustainable renewables in transportation according to the renewable energy directive (RED, Directive 2009/28/EC) and 6% GHG emission reduction from road fuel suppliers by 2020 according to the fuel quality directive (Directive 2009/30/EC) (European Parliament 2009b); and (ii) related to the vehicle side (or tank-to-wheel, TTW), CO2 emission standards for cars and vans and legislation for a broad market introduction of clean and energy-efficient vehicles (Regulation (EC) No 443/2009; Regulation (EU) No 333/2014; Regulation (EU) No 510/2011; Regulation (EU) No 253/2014) (European Parliament 2014c, 2014d, 2011, 2009c); or (iii) related to, e.g., the aviation side (or tank-to-wake, TTW), with targets for biofuels and low carbon fuels. However, in the current policies, there is no direct link or harmonization between WTT and TTW emissions; the first considers GHG emissions (i.e., including all CO2 equivalents such as methane and nitrous oxide), whereas the latter considers just CO2 emissions related to fuel combustion for driving vehicles.

Germany
IEA Bioenergy Task 39 - Implementation Agendas: 2019-2021 Triennium Update 175
Figure 7.1. Climate protection plan of German Federal Government (©DBFZ, 2019)
Moreover, with the Directive on the deployment of alternative fuels infrastructure (European Parliament 2014b), member states are required to develop national policy frameworks for market development of alternative fuels (mainly electricity, CNG, LNG and hydrogen) with regard to infrastructure requirements. In addition, the Energy Taxation Directive (ETD) is binding and sets minimal taxation rates for energy carriers. For the WTT-related part, RED and FQD have been implemented at the EU Member State (MS) level. Up to now, member states differ significantly in setting policy instruments and measures. Most of them have shifted away from financial instruments towards quota systems for fuel suppliers. For the time frame post-2020, only general, not sectoral related, binding targets until 2030 are set which are: (i) about 40% GHG emission reduction compared to 1990; (ii) 27% share of renewable energies related to energy consumption at EU level; and (iii) 27% improvement in energy efficiency (COM(2014) 15) (European Parliament 2014a). In 2016, the EU set an overall frame with its European strategy for low-emission mobility (COM(2016) 501)(European Parliament 2016). More recently, the EU approved a revised Renewable Energy Directive (RED II) which includes a biomass and biofuel sustainability policy that addresses also quotas for advanced biofuels and criteria for electricity-based heating and cooling. RED II includes for instance targets such as 14% renewable energies in transport by 2030, limits for conventional biofuels, and minimum shares for advanced biofuels. Starting in 2015 and until 2020, the GHG quota is the binding regulation for promotion of biofuels in Germany, making the EU FQD (fuel quality directive) leading instead of the original RED. In Germany, the European directives and regulations are implemented adequately by §37 BImSchG (Federal Immission Protection Act) including BiokraftNachV (related to original RED) and 36. BImSchV (related to FQD) and the EnergieStG (related to ETD). In 2014, the Federal Ministry for the Environment, Nature Conservation, Building and Nuclear Safety published the draft of the twelfth law amending the BImSchG, which includes a change in GHG reduction targets (3,5% from 2015 / 4% from 2017/ 6% from 2020). In addition, it contains numerous enabling provisions which will simplify the implementation of future European law into national law. As the first and probably only European member state to do so, Germany shifted from an energy- related quota to a GHG-related quota starting in January 2015, making the FQD the leading policy instead of the original RED. This means that fossil fuel supplier companies will be obligated to sell their respective

Germany
IEA Bioenergy Task 39 - Implementation Agendas: 2019-2021 Triennium Update 176
biofuel or renewable fuel with its fossil counterpart gasoline or diesel (which is usually done through blending), in order to produce a fuel mixture which achieves a 3,5%/4%/6% GHG mitigation (compared to fossil gasoline and diesel mix) for the entire fuel sector from 2015/2017/2020 onwards. The target continues after 2020 at a fixed level of 6%. Biofuels are currently the only way to fulfill the target, however other policy instruments are anticipated to follow. Because only actual emission savings count towards the quota (i.e., double counting is not allowed; GHG emissions of biofuels must be calculated on a life cycle basis according to the GHG methodology described in RED/FQD), the exact increase in biofuels depends on its specific GHG intensity: the higher the specific GHG mitigation potential, the lower the renewable fuel consumption required to fulfill the quota. The quota target has to be achieved by companies placing fossil fuels on the market over the calendar year (i.e., with possible variations throughout the year and in different regions). Additional GHG quota shares above the annual target may be used to meet the following year’s target. Moreover, obligated entities can delegate their quota requirements to a third party through bilateral contracts. In the case of non-fulfillment of obligations, penalties of about 47 EUR ct/kg CO2 equivalent as well as 19 EUR/GJ are binding.
7.3.1. Biofuels obligations
From 2010 until the end of 2014, Germany had an overall biofuel target which mandated the use of at least 6,25% biofuel (in energy content) in all transport fuel. During this period, differentiated biofuel targets were also in place including at least 2,8% biofuel in gasoline and 4,4% biofuel in diesel, introduced by BlmSchG §37a. Mandates or biofuel volume obligations have been shifted from an energy related quota to a GHG-based quota in 2015. Germany is the first EU member state to implement a GHG related quota: from 2015, 3,5% GHG mitigation; from 2017, 4%; and from 2020 onwards, 6% ( GHG mitigation compared to fossil gasoline and diesel mix) for the entire fuel sector. The 38. BImSchV legislation regulates limits on the maximum energetic share of conventional biofuels such as FAME biodiesel, ethanol, and HVO/HEFA fuels produced from food-competing feedstocks as well as establishes mandates for advanced fuels according to EU RED. The carbon intensities of biofuels are considered indirectly via the national application of the binding methodology of EU RED within the BioKraftNachV, with minimum GHG reduction potentials of 35% and 50% for all facilities from 2018, and for new facilities from 10/2015, and 60% for new facilities from 2017 (the average GHG mitigation potential in 2016 was about 73%). In addition, a carbon tax is indirectly applied via CO2 tax for passenger cars (KraftStG). Germany is evaluating specific policies to promote advanced biofuels. There are no specific policies promoting aviation biofuels (however they can qualify for incentives). There are no financial incentives for advanced/new biofuels, making it quite difficult for new biofuels to penetrate into the fuel market, even with the GHG quota; an appropriate advanced fuel quota will be probably established that will help contribute to the commercial implementation of such fuels. The Federal government has authorized the “Bundesanstalt für Landwirtschaft und Ernährung” (BLE - Federal Institute of Agriculture and Nutrition) to guide and supervise biofuels certification. The BLE is responsible for controlling the sustainability certification systems to be used, in accordance with RED certification bodies and the web-based documentation system called “Nabisy”. Figure 7.2 summarizes the tragets and policy measures for the transport sector in Germany.

Germany
IEA Bioenergy Task 39 - Implementation Agendas: 2019-2021 Triennium Update 177
Figure 7.2. Targets and policy measures (GHG quote) for the transport sector in Germany (© DBFZ)
7.3.2. Excise duty reductions
According to the German Energy Tax Law, since 2018 there is no tax relief for FAME biodiesel, HVO/HEFA fuels, vegetable oils or ethanol. FAME biodiesel, HVO/HEFA fuels and vegetable oils have the same fuel tax as diesel fuel (€ 0,4104/liter). Ethanol has the same fuel tax as gasoline fuel (€ 0,6545/liter). The fuel tax for CNG and biomethane is € 0,0139/kWh until 2023, increasing progressively until € 0,0318/kWh in 2027. Only biofuels used for agriculture or forestry remain fully tax exempted. In addition, carbon taxes are indirectly applied via a CO2 tax on passenger cars. In Germany, a toll is payable for the use of federal highways for motor vehicles whose total weight is at least 7,5 tons. This toll is not payable when using vehicles powered by natural gas in the period from 1.1.2019 to 12.31.2020. After this period, the vehicles will pay toll composed of infrastructure costs (0,08 to 0,174 EUR/km), air pollution (0,011 to 0,085 EUR/km) and noise pollution (0,002 EUR/km) (BMJV 2019; Naumann et al. 2019).
7.3.3. Fiscal incentives
Currently, there is no fiscal incentives for biofuels in Germany.
7.3.4. Investment subsidies
Not relevant for biofuels but for electro mobility, there is a financial support, which in June 2020 was increased to up to 9.000 EUR for plug-in battery electric vehicles (BEVs), up to 6.750 EUR to PlugIn-Hybrid vehicles (PHEVs), and for loading stations up to 4.500 EUR (and for some municipalities up to 6.000 EUR) (BAFA 2020a, 2020b). The list of cars supported can be found in the list of the Federal Office of Economics and Export Control (Bundesamt für Witschaft und Ausfuhrkontrolle), and the municipalities benefits in the list of the General German Automobile Club (Allgemeiner Deutscher Automobil-Club e.V.).
7.4. Promotion of advanced biofuels
In Germany, the term “advanced biofuels” follows the definition according to the EU RED. Following this, there are recognizable projects on advanced transport biofuels at different technology readiness levels (TRL) and fuel readiness levels (FRL). Existing commercial biodiesel (FAME), ethanol and biomethane plants principally can be used also to produce advanced biofuels based on residues or “waste” feedstocks as defined in the EU RED. Capacities for lignocellulosic fuels remain quite low, however. This is also true

Germany
IEA Bioenergy Task 39 - Implementation Agendas: 2019-2021 Triennium Update 178
for electricity-based fuels such as PtX fuels (e.g., hydrogen, synthetic natural gas or liquid hydrocarbon fuels). There were and are different funding programs for R&D&D with different emphases (e.g., use of diversified raw materials, decentralized-centralized concepts along value chains, promoting Germany’s role as a technology developer, and integration of renewable fuels based on biomass and electricity into the energy transition). Table 7.1. Overview on ongoing process developments and infrastructure on biofuels for transportation
being carried out at pilot and demo levels in Germany (with no claim to completeness)
Type of biofuel/ conversion route
Process characteristics, TRL/FRL; Capacities Stakeholder in research and industry in Germany
Biooil from pyrolysis as fuel intermediate
Flash pyrolysis of different biomasses, catalytic upgrading to fuel components and slurry production for gasification
bioliq® demo plant, 2 MW pyrolysis, TRL 5
Karlsruhe Institute of Technology (KIT)
Biocrude from hydrothermal processes as fuel intermediates
Bioethanol & Chem. | wood; lignocellulose pre-treatment (organosolv method), fermentation, enzyme production, organosolv lignin, sugars (for ethanol and various platform chemicals)
Fraunhofer CBP pilot plant in Leuna, operational since 2013, TRL 4-5 lignocellulose pre-treatment: 1 t wood/week, expanded in the period 03/2016-09/2019.
Fraunhofer CBP, Deutsches Biomasseforschungszentrum (DBFZ), Thyssen, Linde Engineering
Hydrothermal liquefaction Lab / technical plants, TRL 3
DBFZ, KIT, Uni Hohenheim, TI
Hydrothermal liquefaction & gasification
Pilot plant Verena, TRL 5-6 KIT
BTG | Syngas for Methanol, chemical products
Pre-treatment and gasification
TRL 6-7 – Pilot Plant – 25.000 tons from coal, waste or residues processed per year ( planned for 2021)
CARBOTRANS project, TU Bergakademie Freiberg, Merseburg University of Applied Sciences, Fraunhofer IMWS and others
BTL | H2-rich synthesis gas, bio-coal and bio-oil
Thermo-Catalytic Reforming (TCR©), Pressure Swing Adsorption and Hydro Deoxygenation
TRL 6-7 – Demonstration Plant (1/5/2017 – 30/4/2021) in Sulzbach-Rosenberg
Fraunhofer CBP (Coord.), Zweckverband Müllverwertung Schwandorf and others
Bioethanol (fermentation)
cellulosic ethanol from agricultural residues like wheat and maize straw
Demo plant sunliquid® in Straubing, operational since 2014, TRL 7, FRL 6 1.000 t/a (from 4.500 t/a straw). Building a 50.000 t/aplant in Romania and signed license agreement in Slovakia and China.
Clariant

Germany
IEA Bioenergy Task 39 - Implementation Agendas: 2019-2021 Triennium Update 179
Type of biofuel/ conversion route
Process characteristics, TRL/FRL; Capacities Stakeholder in research and industry in Germany
Bioethanol from corn-stover, grass and other agriculture waste
TRL 4-5 – Pilot Plant (30 t/y) – focus on development of a commercial yeast for cellulosic ethanol (Bacovsky 2020).
Lesaffre (aquired Butalco plant in Stuttgart)
Isobutene (fermentation)
Fermentation Demonstration plant (TRL 6) Fraunhofer CBP / Global Bioenergies
HVO/HEFA Hydrotreating processes, different feedstocks
Technical units, TRL 2-3
TU Bergakademie Freiberg (TUBAF), VT Schwedt
HCVO (Hydrotreated Cracked Vegetable Oil)
2-step process for different feedstocks: 1st step = SRD (Solvolytic Reactive Distillation) for cracking and deoxygenation: intermediate product = CVO (Cracked Vegetable Oil) 2nd step = hydrotreating: product = HCVO
TRL 6 pilot project (X-Energy/READiTM-PtL project) 2019-21: capacity of SRD READiTM process pilot plant = 2 tons per week UCO; plant under construction (planned commissioning 2021)
HAW Hamburg, Nexxoil, KBS Krebs Brüggen Sekundärrohstoffe
BTL | Methanol / DME /gasoline and other fuels
bioliq process, fast pyrolysis, entrained flow gasification, hot gas cleaning, synthesis
5 MW gasification 40-80 bar (TRL 6-7), 2 MW gasoline synthesis (TRL 7)
bioliq-project, KIT, Chemieanlagenbau Chemnitz, Air Liquide
BTL | Fischer-Tropsch
Micro-structured reactor module
2-50 bpd container plant, TRL 5, syngas transfer from bioliq plant
EnergyLab2.0 at KIT, INERATEC
BTL | Kerosene Thermo-Catalytic Reforming (TCR©), Pressure Swing Adsorption, Hydro Deoxygenation and Hydro cracking/ isomerization
TRL 6-7 – Demonstration Plant – Scale and Location to be determined (probably near TCR© Susteen plant)
University Birmingham (Coord.), Fraunhofer Umsicht, Susteen Technologies, BIGA Energie GmbH, and others
BTG | FT Liquids
Pre-treatment, gasification, syngas formation and FT Synthesis
TRL 4-5 – Pilot plant. Utilization of infrastructure from TUDA pilot plant in Darmstadt with other modules. Planning construction
TU Darmstadt, Aichernig Engineering GmbH, and others
XTL | Methanol, gasoline
HP-POX gasifier (Since 2003), FlexiSlag gasifier (since 2013) and GSP gasifier (since 2018). STF synthesis pilot plant
TRL 6-7 - 5 MW (gasifier) and 10 MW (synthesis) and 120 L/h gasoline output by the STF gasoline pilot plant, which can also synthetize methanol
TUBA Freiberg, Air Liquide, Chemieanlagenbau Chemnitz

Germany
IEA Bioenergy Task 39 - Implementation Agendas: 2019-2021 Triennium Update 180
Type of biofuel/ conversion route
Process characteristics, TRL/FRL; Capacities Stakeholder in research and industry in Germany
2-stage hydrothermal liquefaction, refining
Technical plant, TRL 4 DBFZ and partners
Biomethane via biogas (fermentation)
straw fermentation, fertilizer production; (additional: Bioethanol plants (grain, sugar beet) and biogas
Commercial plant, 16,5 MW (136 GWh/a) from 40 kt/a straw, TRL 8, FRL 8 (260 kt/a bioethanol + 480 GWh biomethane)
VERBIO AG
Biomethane via gasification
Gasification, gas conditioning, methanation
Plant units at technical labs KIT/EBI, Uni Erlangen, DBFZ, ZSW, CUTEC
Gasification, catalytic honeycomb methanation (mobile container), compression
TRL 5, 60 kW (CH4) DVGW/EBI, KIT/EBI
Bio-LNG Gasification or renewable CO2 + H2O-electrolysis, catalytic three phase methanation
TRL 5, 100 kW (CH4) KIT/EBI
High pressure fermentation + electrolysis + biological methanation + liquefaction
TRL 5, 15 kW (CH4) Uni Hohenheim, DVGW-EBI
Biomethane (Bio-CNG/LNG)
Anaerobic fermentation in combination with hydrothermal processes and methanation
Technical pilot plant by end of 2021 including components with TRL 4 - 9
DBFZ, UIT
Different fuels Fuel science center (formely Tailor-made fuels from biomass) Biomass pretreatment; enzymatic + catalytic biomass processing; synthesis and conversion to platform molecules and fuels;
Lab units RWTH Aachen, Fraunhofer IME, Max-Planck-Institute
In addition, the topic of so-called PtX (ie., PtG or PtL fuels or chemicals, also called electrofuels) is gaining an increasing interest, especially in context of the German energy transition and increasing shares of renewable electricity. PtL is viewed as carbon neutral and clean fuel by different OEMs. There are different projects on PtL ongoing in Germany, with examples including:
• PtL demo plant (160 l/day) of Sunfire in Dresden, co-financed by BMBF
• Planned PtL demo plant in Lünen using CO2 exhaust gases from the lignite power plant of Steag Lünen, together with Mitsubishi Hitachi Power Systems Europe (MHPSE), Carbon Recycling International (CRI), co-financed by EC Horizon 2020
• PtX integrated into the Helmholtz EnergyLab2.0, a platform combining different energy conversion and storage technologies with overall process control and simulation, on site at KIT with KIT, DLR and FZJ as partners. Innovative technologies are considered such as microreaction Fischer-Tropsch synthesis for PtL, reverse water gas shift reaction, co-electrolysis and others for syngas generation, PtG by different reactor systems, , and development of catalysts and catalytic processes from lab to pilot.
• Hydrogen cluster HYPOS pushing the production of electrolytical hydrogen and methanation to synthetic natural gas

Germany
IEA Bioenergy Task 39 - Implementation Agendas: 2019-2021 Triennium Update 181
• An interactive map of DVGW (German Technical and Scientific Association for Gas and Water) compiling relevant power to gas plants can be found here: https://www.dvgw.de/themen/energiewende/power-to-gas/interaktive-power-to-gas-karte/
Currently, there are important funding programs for RD&D that are addressing advanced fuels and – to a minor extent - also biofuels. In general, there has been a decrease in funded projects related to biofuels. Funding programs include for instance:
• Ministry of Education and Research (BMBF): “Kopernikus – projects for the energy transition” with one project on PtX with 44 partners, an Namosyn for the production of climate neutral combustion fuels with 37 partners from research and industry. Research is carried out on drop-in hydrocarbon fuels as well as on oxygenated fuel compoents and products from syngas fermentation.
• Federal Ministry of Food and Agriculture (BMEL): Renewable Resources Funding Scheme with projects related to ethanol, biodiesel, vegetable oils, biomethane, and advanced biofuels (e.g., hydrocarbons from biochemical pathways, fuels from other renewable resources like algae, and renewable oxygenates (OME) as gasoline and diesel blending components).
• Federal Ministry for Economic Affairs and Energy (BMWi): funding initiative on “energy transition in the transport sector” which also addresses advanced fuels (focus on PtX)
• Federal Ministry of Transport and Digital Infrastructure (BMVI), within the frame of mobility and fuel strategy projects like, e.g. research and demonstration project on the use of renewable jet fuel at Airport Leipzig/Halle (DEMO-SPK) which deals with the supply and use of multiblend jet fuel
• In addition, there are initiatives on the level of the federal states, such as the strategic dialogue for automotive industry in Baden-Württemberg which funds the reFuels project on the production and demonstration of drop-in hydrocarbon fuels for soon implementation and use in the existing vehicle fleet.
7.5. Market development and policy effectiveness
Currently the market is mainly based on conventional renewable fuels which are expected to remain dominant at least until 2020. For advanced biofuels, there are many R&D&D activities; however, there are only a few production plants. The development of production and use of conventional biofuels such as FAME biodiesel, ethanol, HVO/HEFA fuels and biomethane is shown in 4. There is no production capacity for HVO/HEFA fuels in Germany. Biomethane is produced in significant capacities but for different markets; just a share of roughly 4% is used for transport applications. Pure vegetable oils as fuels (PVO) (annual volume in the range of 5,4 million t/a (6,2 billion liters/year) in 2018 (OVID 2018b, 2018a) are not presented separately due to these also being used as feedstocks for FAME biodiesel and several other uses.

Germany
IEA Bioenergy Task 39 - Implementation Agendas: 2019-2021 Triennium Update 182
Figure 7.3. Production of conventional biofuels in Germany (©DBFZ, 2019) (Naumann et al. 2019)
In 2018, biofuels avoided 9,5 million tons CO2eq in Germany, being the fuel specific GHG mitigation (main fuel options): 83% Biodiesel (FAME), 86% Bioethanol, 77% HVO/HEFA and 90% Biomethane. The raw materials used to produce biofuels consisted 36% of residues and 64% of cultivated biomass (mostly rapeseed, palm oil, corn and wheat) (BLE 2019). Table 7.2. Biofuel production capacity (Naumann et al. 2019; Lenz et al. 2017; VDB 2020; BDBE 2020b;
UDOP 2019)); (no production capacities for HVO/HEFA fuels; cellulosic ethanol capacity
1.262.000 liters/a)
Year Biodiesel / FAME
(ML/year)
Ethanol + ETBE
(ML/year)
Biomethane / Biogas
(PJ/year)
2007 3.783 398 -
2008 3.067 581 1
2009 2.772 750 4
2010 2.880 762 6
2011 2.760 721 10
2012 2.817 774 15
2013 2.965 848 19
2014 3.408 917 23
2015 3.504 934 25
2016 3.544 932 31
2017 3.646 850 33
2018 3.465 785 33
Unit conversion: 1 metric ton of biodiesel=1.136 liters and 1 metric ton of ethanol=1.262 liters. In 2018, about 4,12% or 113 PJ/a of the transport fuels used were biofuels, of which about 81 PJ/a were biodiesel (FAME, the main raw material is Palm Oil, Rapeseed and Waste and Residues), 6 PJ/a of HVO/HEFA fuels (mainly based on palm oil and used cooking oil), about 31 PJ/a of ethanol (mainly based on wheat and sugar beet) and about 1 PJ/a biomethane from biogas (mainly based on residues).

Germany
IEA Bioenergy Task 39 - Implementation Agendas: 2019-2021 Triennium Update 183
Figure 7.4. Biofuel use in Germany in 2018 (DBFZ based on Table 7.3)
The size of the biofuel market is indicated in Table 7.3. Table 7.3. Biofuel consumption and market share (Naumann et al., 2016; VDB, 2017; BDBE, 2017; Lenz et
al., 2017; OVID, 2017; BAFA, 2017; BLE, 2016; BLE, 2014; BLE, 2014; BMVI, 2016; Arbeitsgemeinschaft
Energiebilanzen e.V., 2017. cf. also country report in IEA AMF (2017);a incl. electricity, cellulosic ethanol
not relevant)
Year FAME
Biodiesel
(ML/year)
Pure Plant Oil
(PPO)/
Vegetable oils
(ML/year)
HVO/HEFA
(ML/year)
Ethanol +
ETBE
(ML/year)
Biomethane
/ Biogas
(PJ/year)
Total energy
demand
transport
(PJ/a)
Market
share of
biofuels (%,
energy
related)
2007 3.318 911 - 581 - 2.601 6,38
2008 3.062 436 - 790 - 2.571 5,10
2009 2.883 108 - 1.134 - 2.541 4,80
2010 2.928 66 - 1.291 - 2.559 4,89
2011 2.506 21 320 1.563 - 2.568 4,95
2012 2.117 27 502 1.583 1,21 2.559 4,77
2013 1.972 1 599 1.519 1,75 2.612 4,56
2014 2.226 6 427 1.479 1,63 2.616 4,63
2015 2.243 2 214 1.445 1,25 2.621 4,31
2016 2.257 - 210 1.483 1,37 2.696 4,23
2017 2.480 3 42 1.460 1,62 2.743 4,19
2018 2.586 - 175 1.502 1,00 2.742 4,12
Unit conversion: 1 metric ton of biodiesel=1,136 liters; 1 metric ton of ethanol=1,262 liters; 1 metric ton of PPO=1,087 liters; and 1 metric ton of HVO/HEFA fuel=1,282 liters. The import and export data of Bioethanol and Biodiesel (FAME) in Germany from 2010 to 2019 is indicated in Table 7.4. During this period, the demostic production of bioethanol was never higher than the demand, receiveing almost three quarters of the imports from European countries including the Netherlands, Belgium, France and Ungarn. For Biodiesel, the country has over years of overproduction and has a positive balance of exports for the biofuel, being the two major importeurs the Netherlands and Poland.

Germany
IEA Bioenergy Task 39 - Implementation Agendas: 2019-2021 Triennium Update 184
Table 7.4. Import and export of bioethanol and biodiesel (FAME) in Germany from 2010 to 2019 (Naumann et al. 2019; F.O. Licht 2018, 2019, 2020)
Year Bioethanol Biodiesel (FAME)
Import (ML/year) Export (ML/year) Import (ML/year) Export (ML/year)
2010 1.343 343 1.426 1.320
2011 1.402 248 1.525 1.507
2012 1.400 203 849 1.380
2013 1.290 202 640 1.774
2014 1.104 240 663 1.946
2015 1.128 351 587 1.626
2016 1.123 407 815 1.724
2017 1.115 469 899 1.829
2018 1.300 448 1.383 2.117
2019 1.485 456 1.602 2.601
Unit conversion: 1 metric ton of biodiesel=1.136 liters; 1 metric ton of ethanol=1.262 liters.
To meet the GHG emissions quota, from 3,5% GHG reduction from 2015 to 4% from 2017 and 6% from 2020, direct or indirect effects are expected with regard to the amount of biofuels or renewable fuels used. The major driver for competiveness between fuels within the quota remains the fuel specific GHG emissions reduction potential. Despite the target for advanced biofuels and the ongoing debate about EU RED II, for Germany at least until 2020, it is likely that due to the higher GHG reduction quota of 70% fuel specific GHG mitigation potential on average, the amount of biofuels could slightly increase but will be limited by blending levels with fossil fuels (e.g., B7, E10 etc.). The framework for increasing use of biomethane as transport fuel remains uncertain. This is also true for PtG fuels (Lenz et al. 2017). The 6% reduction target for the German GHG emissions quota continues after 2020. Despite this, the EU regulation is binding until 2030 (i.e., to achieve 40% GHG emissions reduction and to incorporate 27% renewable energies into the energy mix); however, this regulation is not sector-related. Especially with regard to increasing capacities or building up markets for advanced biofuels, it is very difficult to create scenarios that could be likely as the biofuel and renewable energy market sectors are constantly undergoing changes depending on global and regional policies (e.g., targets post-2020, market interventions such as subsidies and support schemes, etc,) as well as fluctuating market conditions (e.g., prices for raw materials, auxiliaries and mineral oil). In Germany, there are two approved certification schemes recognized by the European Union for transport biofuels. The International Sustainability & Carbon Certification (ISSC) is recognized since 09.08.2016 and acts in a global range. The Society for the Certification of Sustainably Produced Biomass (REDcert) is recognized since 10.08.2017 and acts in the European Countries. Both voluntary schemas covers diverse basis of biomass as raw material and covers the entire supply chain of the biofuel industry. Moreover, there is also the challenge of societal acceptance, which leads invariably to further market variability. However, there is ever increasing attention being given to biorefinery concepts, to maximize biomass-to-products ratios and realize biorefineries are multiproduct facilities (e.g., producing an array of biofuels, bulk chemicals, feeds and foods, and energy products). The diversification of biomass-based products will make such plants less susceptible to market shifts. According to the 37. BImSchV which regulates the co-processed biogenic oils, the co-processing of biogenic oil in fossil refineries are credible for the greenhouse gas emission quota established in the country until 2020, but there isn´t any important initiative of co-processing oils or further refining currently in Germany. About 27 facilities with an overall combined capacity of about 4 million t/a (5,54 billion liters per year) are still producing biodiesel, in a production capacity ranging from 2.000 to 300.000 t/a; this reflects some consolidation, as in 2012 there were about 51 production facilities) (Naumann et al. 2016). The most important companies are VERBIO AG, ADM, Cargill, ecoMotion GmbH, German Biofuels GmbH,

Germany
IEA Bioenergy Task 39 - Implementation Agendas: 2019-2021 Triennium Update 185
Natural Energy West GmbH, REG Germany AG, and Mannheim Bio Fuel GmbH (Bunge) (Naumann et al. 2019). The first modern era plants producing ethanol in Germany started operation in 2005. Ethanol is now produced in seven plants, of which one is producing ethanol out of dairy residues (Sachsenmilch) and one is a demonstration plant for lignocellulosic ethanol (Clariant). The overall ethanol production capacity is about 709.000 t/a (805 million liters per year), mainly provided by producers including VERBIO AG, CropEnergies AG, Suiker Unie GmbH & Co. KG and Nordzucker AG (BDBE 2020a). Biomethane from upgraded biogas was produced by about 216 plants in 2018. The main companies producing biomethane for transport are VERBIO AG (biomethane from ethanol stillage and straw), E.ON Bioerdgas GmbH, and Berliner Stadtreinigungsbetriebe. The list of the bioethanol and biodiesel production facilities can be found here: https://datenbank.fnr.de/index.php?id=7696. The location of these facilities can be also found here: https://datenbank.fnr.de/karten/biokraftstoffe/index.php.
7.6. Conclusions
Current policies do not support an increase in production capacities for biofuels or advanced biofuels in Germany as the market development shows. The target is to reduce GHG emissions from the transport sector stepwise by 42% in 2030 compared to 1990. Measures to achieve this target include also the transposition process of the RED II and ESR into national laws and regulations. It is very likely that the GHG quota will be continued from 2021 onwards and further CO2-related instruments will come into effect. However, from a current viewpoint to achieve the 2030 targets without implementation of substantial additional measures seems impossible.
Sources
Bacovsky, Dina (2020): Production Facilities. ETIP Bioenergy. Available online at http://www.etipbioenergy.eu/databases/production-facilities, checked on 4/9/2020.
BAFA (2019): Amtliche Mineralöldaten für die Bundesrepublik Deutschland. Edited by Bundesamt für Wirtschaft und Ausfuhrkontrolle. Available online at https://www.bafa.de/DE/Energie/Rohstoffe/Mineraloelstatistik/mineraloel_node.html;jsessionid=A062EFC20A1EAD3FDB875EF32C30B1F9.1_cid387, updated on 5/7/2019.
BAFA (2020a): Elektromobilität - Förderproramm im Überblick. Bundesamt für Wirtschaft und Ausfuhrkontrolle. Available online at https://www.bafa.de/DE/Energie/Energieeffizienz/Elektromobilitaet/Foerderprogramm_im_Ueberblick/foerderprogramm_im_ueberblick.html, checked on 6/10/2020.
BAFA (2020b): Erhöhter Umweltbonus für E-Autos. Am 3. Juni hat der Koalitionsausschuss eine Erhöhung der Kaufprämie für Elektrofahrzeuge (Umweltbonus) beschlossen. Bundesamt für Wirtschaft und Ausfuhrkontrolle. Available online at https://www.bafa.de/SharedDocs/Kurzmeldungen/DE/Energie/Elektromobilitaet/2020_erhoehter_umweltbonus.html?nn=13683754, updated on 6/10/2020, checked on 6/17/2020.
BDBE (2020a): Bioethanolproduktion seit 2005. Bundesverband der deutschen Bioethanolwirtschaft e.V. Available online at https://www.bdbe.de/biokraftstoff-bioethanol/zellulose-ethanol, checked on 6/8/2020.
BDBE (2020b): Marktdaten 2019. Bundesverband der deutschen Bioethanolwirtschaft e.V. Available online at https://www.bdbe.de/application/files/8515/8746/4313/Marktdaten_2019_1.217_2020_04_03.pdf, updated on 04.2020, checked on 6/10/2020.

Germany
IEA Bioenergy Task 39 - Implementation Agendas: 2019-2021 Triennium Update 186
BImSchG (2019): Gesetz zum Schutz vor schädlichen Umwelteinwirkungen durch Luftverunreinigungen, Geräusche, Erschütterungen und ähnliche Vorgänge. BImSchG, revised 4/8/2019. In BGBl (Heft I Nr. 12), p. 432.
BLE (2013): Evaluations- und Erfahrungsbericht für das Jahr 2012. Biomassestrom-Nachhaltigkeitsverordnung. Biokraftstoff-Nachhaltigkeitsverordnung. 2. überarbeitete Auflage. Bonn. Available online at https://www.ble.de/SharedDocs/Downloads/DE/Klima-Energie/Nachhaltige-Biomasseherstellung/Evaluationsbericht_2012_2_Auflage.pdf;jsessionid=F83723B2944228AD3C163782F8AEBF89.2_cid335?__blob=publicationFile&v=1.
BLE (2014): Evaluations- und Erfahrungsbericht für das Jahr 2013. Biomassestrom-Nachhaltigkeitsverordnung. Biokraftstoff-Nachhaltigkeitsverordnung. Bonn. Available online at https://www.ble.de/SharedDocs/Downloads/DE/Klima-Energie/Nachhaltige-Biomasseherstellung/Evaluationsbericht_2013.pdf;jsessionid=F83723B2944228AD3C163782F8AEBF89.2_cid335?__blob=publicationFile&v=1.
BLE (2015a): Evaluations- und Erfahrungsbericht für das Jahr 2014. Biomassestrom-Nachhaltigkeitsverordnung. Biokraftstoff-Nachhaltigkeitsverordnung. Edited by Bundesanstalt für Landwirtschaft und Ernährung. Bonn. Available online at https://www.ble.de/SharedDocs/Downloads/DE/Klima-Energie/Nachhaltige-Biomasseherstellung/Evaluationsbericht_2014.pdf;jsessionid=F83723B2944228AD3C163782F8AEBF89.2_cid335?__blob=publicationFile&v=1, checked on 5/7/2019.
BLE (2015b): Grafik. THG-Einsparung: Biokraftstoffe aus Nachhaltigkeitsnachweisen aus der staatlichen Datenbank Nabisy. Bonn. Available online at https://www.ble.de/SharedDocs/Downloads/DE/Klima-Energie/Nachhaltige-Biomasseherstellung/THG-EinsparungBiokraftstoffeGrafik.html.
BLE (2018): Evaluations- und Erfahrungsbericht für das Jahr 2017. Biomassestrom-Nachhaltigkeitsverordnung. Biokraftstoff-Nachhaltigkeitsverordnung. Edited by Bundesanstalt für Landwirtschaft und Ernährung. Bonn. Available online at https://www.ble.de/SharedDocs/Downloads/DE/Klima-Energie/Nachhaltige-Biomasseherstellung/Evaluationsbericht_2017.pdf?__blob=publicationFile&v=3, checked on 5/7/2019.
BLE (2019): Evaluations- und Erfahrungsbericht für das Jahr 2018. Bundesanstalt für Landwirtschaft und Ernährung. Available online at https://www.ble.de/SharedDocs/Downloads/DE/Klima-Energie/Nachhaltige-Biomasseherstellung/Evaluationsbericht_2018.pdf;jsessionid=0D53C1196056C1718B48FA27418AF157.2_cid335?__blob=publicationFile&v=2, checked on 10/9/2020.
BMJV (2017): Siebenunddreißigste Verordnung zur Durchführung des Bundes-Immissionsschutzgesetzes (Verordnung zur Anrechnung von strombasierten Kraftstoffen und mitverarbeiteten biogenen Ölen auf die Treibhausgasquote) (37. BImSchV). 37. BImSchV. Available online at https://www.gesetze-im-internet.de/bimschv_37/BJNR119500017.html, checked on 6/18/2020.
BMJV (2019): Gesetz über die Erhebung von streckenbezogenen Gebühren für die Benutzung von Bundesautobahnen und Bundesstraßen (Bundesfernstraßenmautgesetz - BFStrMG) - § 1 Autobahn- und Bundesstraßenmaut. §1 BFStrMG. Available online at https://www.gesetze-im-internet.de/bfstrmg/__1.html, checked on 6/16/2020.
BMU (2016): Klimaschutzplan 2050. Klimaschutzpolitische Grundsätze und Ziele der Bundesregierung. Bundesministerium für Umwelt, Naturschutz und nukleare Sicherheit. Available online at https://www.bmu.de/fileadmin/Daten_BMU/Download_PDF/Klimaschutz/klimaschutzplan_2050_bf.pdf, checked on 6/8/2020.
BMVI (2020): Verkehrsprognose 2030. Bundesministerium für Verkehr und digitale Infrastruktur. Available online at https://www.bmvi.de/SharedDocs/DE/Artikel/G/verkehrsprognose-2030.html, updated on 02.2020, checked on 6/8/2020.
BMWi (2015): Die Energie der Zukunft. Vierter Monitoring-Bericht zur Energiewende. Bundesministerium für Wirtschaft und Energie. Available online at

Germany
IEA Bioenergy Task 39 - Implementation Agendas: 2019-2021 Triennium Update 187
https://www.bmwi.de/Redaktion/DE/Publikationen/Energie/vierter-monitoring-bericht-energie-der-zukunft.pdf?__blob=publicationFile&v=26, checked on 6/8/2020.
BMWi (2019): Energieeffizienz in Zahlen. Entwicklungen und Trends in Deutschland 2019. Bundesministerium für Wirtschaft und Energie. Available online at https://www.bmwi.de/Redaktion/DE/Publikationen/Energie/energieeffizienz-in-zahlen-2019.pdf?__blob=publicationFile&v=72, checked on 6/8/2020.
European Parliament (2009a): Directive 2009/28/EC of the European Parliament and of the Council of 23 April 2009 on the promotion of the use of energy from renewable sources and amending and subsequently repealing Directives 2001/77/EC and 2003/30/EC (Text with EEA relevance). Directive (EU) 2009/28/EG. Available online at https://eur-lex.europa.eu/legal-content/EN/ALL/?uri=CELEX%3A32009L0028, checked on 6/8/2020.
European Parliament (2009b): Directive 2009/30/EC of the European Parliament and of the Council of 23 April 2009 amending Directive 98/70/EC as regards the specification of petrol, diesel and gas-oil and introducing a mechanism to monitor and reduce greenhouse gas emissions and amending Council Directive 1999/32/EC as regards the specification of fuel used by inland waterway vessels and repealing Directive 93/12/EEC (Text with EEA relevance). Directive (EU) 2009/30/EG. Available online at https://eur-lex.europa.eu/legal-content/EN/TXT/?uri=celex%3A32009L0030, checked on 6/8/2020.
European Parliament (2009c): Regulation (EC) No 443/2009 of the European Parliament and of the Council of 23 April 2009 setting emission performance standards for new passenger cars as part of the Community's integrated approach to reduce CO 2 emissions from light-duty vehicles (Text with EEA relevance). Regulation (EU) No 443/2009. Available online at https://eur-lex.europa.eu/legal-content/EN/ALL/?uri=CELEX%3A32009R0443, checked on 6/8/2020.
European Parliament (2011): Regulation (EU) No 510/2011 of the European Parliament and of the Council of 11 May 2011 setting emission performance standards for new light commercial vehicles as part of the Union's integrated approach to reduce CO 2 emissions from light-duty vehicles Text with EEA relevance. Regulation (EU) No 510/2011. Available online at https://eur-lex.europa.eu/legal-content/EN/TXT/?uri=celex%3A32011R0510, checked on 6/8/2020.
European Parliament (2014a): Communication from the Commission to the European Parliament, the Council, the European economic and social committee and the committee of the regions (2014) A policy framework for climate and energy in the period from 2020 to 2030 COM(2014) 15 final. COM(2014) 15. Available online at https://eur-lex.europa.eu/legal-content/EN/TXT/PDF/?uri=CELEX:52014DC0015&from=EN, checked on 6/8/2020.
European Parliament (2014b): Directive 2014/94/EU of the European Parliament and of the Council of 22 October 2014 on the deployment of alternative fuels infrastructure Text with EEA relevance. Directive (EU) 2014/94/EU. Available online at https://eur-lex.europa.eu/legal-content/en/TXT/?uri=CELEX%3A32014L0094, checked on 6/8/2020.
European Parliament (2014c): Regulation (EU) No 253/2014 of the European Parliament and of the Council of 26 February 2014 amending Regulation (EU) No 510/2011 to define the modalities for reaching the 2020 target to reduce CO 2 emissions from new light commercial vehicles Text with EEA relevance. Regulation (EU) No 253/2014. Available online at https://eur-lex.europa.eu/legal-content/EN/TXT/?uri=celex%3A32014R0253, checked on 6/8/2020.
European Parliament (2014d): Regulation (EU) No 333/2014 of the European Parliament and of the Council of 11 March 2014 amending Regulation (EC) No 443/2009 to define the modalities for reaching the 2020 target to reduce CO 2 emissions from new passenger cars. Regulation (EU) No 333/2014. Available online at https://op.europa.eu/en/publication-detail/-/publication/5b971540-bc8f-11e3-86f9-01aa75ed71a1/language-en, checked on 6/8/2020.
European Parliament (2016): Communication from the Commission to the European Parliament, the Council, the European economic and social Committee and the committee of the regions (2016) A European Strategy for Low-Emission Mobility COM(2016) 501 final. COM(2016) 501. Available online at

Germany
IEA Bioenergy Task 39 - Implementation Agendas: 2019-2021 Triennium Update 188
https://ec.europa.eu/transparency/regdoc/rep/1/2016/EN/1-2016-501-EN-F1-1.PDF, checked on 6/8/2020.
F.O. Licht (2018): World Ethanol & Biofuels Report. Bd. 2008–2018. Edited by Informa U.K. Limited.
F.O. Licht (2019): World Ethanol & Biofuels Report. In F.O. Licht 18 (7).
F.O. Licht (2020): World Ethanol & Biofuels Report. In F.O. Licht 18 (10).
Lenz, Volker; Müller-Langer, Franziska; Denysenko, Velina; Daniel-Gromke, Jaqueline; Rensberg, Nadja; Rönsch, Cornelia et al. (2017): Erneuerbare Energien. In BWK: Das Energie-Fachmagazin 69 (5), pp. 54–77.
Müller-Langer, Franziska; Dietrich, Ralph-Uwe; Arnold, Karin; van de Krol, Roel; Harnisch, Falk (2016): Erneuerbare Kraftstoffe für Mobilität und Industrie. Wie decken wir die Bedarfe von morgen? FVEE-Jahrestagung. Berlin, 2016.
Naumann, Karin; Oehmichen, Katja; Remmele, Edgar; Thuneke, Klaus; Schröder, Jörg; Zeymer, Martin et al. (2016): Monitoring Biokraftstoffsektor. 3rd ed. Leipzig: DBFZ (DBFZ-Report, 11). Available online at https://www.dbfz.de/fileadmin/user_upload/Referenzen/DBFZ_Reports/DBFZ_Report_11_3.pdf.
Naumann, Karin; Schröder, Jörg; Oehmichen, Katja; Etzold, Hendrik; Müller-Langer, Franziska; Remmele, Edgar et al. (2019): Monitoring Biokraftstoffsektor. 4th ed. Leipzig: DBFZ (DBFZ-Report, 11). Available online at https://www.dbfz.de/fileadmin//user_upload/Referenzen/DBFZ_Reports/DBFZ_Report_11_4.pdf.
OVID (2018a): OVID-Diagramme. Verband der ölsaatenverarbeitenden Industrie in Deutschland. Available online at https://www.ovid-verband.de/positionen-und-fakten/ovid-diagramme/, checked on 6/8/2020.
OVID (2018b): Zahlen Deutschland. Aktuelle Zahlen für 2018. Verband der ölsaatenverarbeitenden Industrie in Deutschland. Available online at https://www.ovid-verband.de/positionen-und-fakten/zahlen-deutschland/, checked on 6/8/2020.
Radke, Sabine (2014): Verkehr in Zahlen 2014/2015. 43. Jahrgang. Edited by Bundesministerium für Verkehr und digitale Infrastruktur. Hamburg.
UBA (2020): Energieverbrauch nach Energieträgern und Sektoren. Umwelt Bundesamt. Available online at https://www.umweltbundesamt.de/daten/energie/energieverbrauch-nach-energietraegern-sektoren, updated on 3/16/2020, checked on 6/8/2020.
UDOP (2019): Biodiesel 2018/2019. Sachstandsbericht und Perspektive – Auszug aus dem UFOP-Jahresbericht. Union zur Förderung von Öl- und Proteinpflanzen e.V. Available online at https://www.ufop.de/files/8315/7112/3399/UFOP_1693_Biodieselauszug_2019_151019.pdf, updated on 10/2019, checked on 6/15/2020.
VDB (2020): Daten und Fakten. Verband der Deutschen Biokraftstoffindustrie e.V. Available online at http://www.biokraftstoffverband.de/index.php/daten-und-fakten-148.html, checked on 6/8/2020.

India
IEA Bioenergy Task 39 - Implementation Agendas: 2019-2021 Triennium Update 189
8. India
Mr Ravi P Gupta, General Manager ( Bioenergy) , Indian Oil Corporation Limited Dr S K Puri, DBT IOC Centre Coordinator, Indian Oil Corporation Limited Dr SSV Ramakumar, Director (R&D), Indian Oil Corporation Limited
Summary • India’s greenhouse gas emissions (GHG) are the third largest in the world and the main source
is coal. India emits about 3 Giga-tonnes (Gt) CO2eq of GHG each year. The country emits 7% of global emissions.
• Government of India has emphasized on achieving energy security with a target of reducing import dependence i.e. usage of fossil fuels by 10% from current levels by the year 2022 as well as commitment to reduce the carbon footprint by 30-35% by the year 2030.
• Currently, 5% ethanol blending in gasoline is mandatory and the obligated parties can add ethanol in gasoline up to 10%. Government of India has a plan to increase ethanol blending in gasoline from current actual level of 4.3% to 8-10 % by 2020-21. For 10 % ethanol blending, India will require about 4.5 billion litres of ethanol per year.
• Biodiesel blending is not mandatory in India yet.
• In 2018, a new “National Policy on Biofuels” was announced that expanded the scope of feedstocks to be used for biofuel production and targeted achieving 20% ethanol blending in petrol and 5% biodiesel blending in diesel by 2030.
• Biofuel imports are banned but import of feedstock for producing biodiesel is permitted to the extent necessary. Export policy of biofuels was revised in 2018 from free to restricted. A licence is required for both exports and imports of bio-fuels. Bio-fuels include ethyl alcohol, petroleum oil and oils obtained from bituminous minerals, bio-diesel and mixtures.
• Aviation biofuels are covered in the National policy on Biofuels. However, there is no specific policy for marine biofuels.
• Biofuels development is overall led by the Ministry of Petroleum and Natural Gas (MoP&NG). However, the Ministry of Science and Technology, through its Department of Biotechnology, has also been supporting feedstock development and improved biofuel production technology, with a major focus on second generation ethanol.
• Joint ventures and foreign investments in the biofuel sector are encouraged. A 100% Foreign Direct Investment (FDI) in biofuel technologies is encouraged through an automatic approval route provided the biofuels produced are for domestic use only.
• There are two operational advanced biofuel facilities - one pilot and one demonstration plant - with a production capacity of 1.75 million liters per year.
• MoP&NG has taken major initiative for setting up of 12 no of 2G Ethanol commercial plants from agriculture waste across eleven states at an estimated cost of Rs 14,000 crore ( US$1.9 billion) . MoP&NG is also providing financial support under Pradhan Mantri JI-VAN Yojana to Integrated Bioethanol Projects. Under the scheme, Rs.1800 crore ( US $ 240 million) has been allocated for supporting 12 Commercial projects, Rs.150 crore (US $ 20 million) has been allocated for supporting 10 demonstration Projects.

India
IEA Bioenergy Task 39 - Implementation Agendas: 2019-2021 Triennium Update 190
8.1. Introduction
India is one of the fastest growing economies in the world. It is the third-largest importer of crude oil after China and the US and continues to rely largely on imports. In the last five years, annual import volumes of petroleum and petroleum products have risen 25% to 307 billion liters. Additionally, India is the fourth largest consumer of primary energy at 24.9 quadrillion British thermal unit (BTUs), following China, the US and Russia. It is also the eighth largest energy producer at 14.18 quadrillion BTUs. As a result, despite notable fossil fuel resources, India is increasingly dependent on energy imports (GAIN, 2018). The industry and transport sectors are the largest end users of energy in India and account for half of the total energy consumed. The main fuels supplying this demand are coal (in industry), petroleum (in transport), and electricity (in buildings, industry, and agriculture). Growth in the transport sector will continue to increase petroleum consumption. Transportation consumes close to 70% of the total diesel supply, 66% of which is used by passenger and commercial vehicles. Gasoline is also used for light-duty transportation, 60% for two-wheelers such as motorcycles and scooters. Currently, diesel alone meets an estimated 46% of transportation fuel demand, followed by gasoline at 24%. Gasoline and on-road diesel consumption combined are forecast to rise over the next 5 years from the current estimate of 98 billion liters in 2018 to 126 billion liters by 2023 (GAIN, 2018). India’s share of total global primary energy demand is set to roughly double to ~11% by 2040, underpinned by strong population growth and economic development:
• India accounts for more than a quarter of net global primary energy demand growth between 2017-2040.
• 42% of this new energy demand is met through coal, meaning CO2 emissions roughly double by 2040.
• Gas production grows but fails to keep pace with demand, implying a significant growth in gas imports.
Robust growth in prosperity and population size drives a massive increase in India’s primary energy consumption, which expands by 1.2 billion tonnes of oil equivalent or 156% by 2040, making India by far the largest source of energy demand growth in the outlook. India’s population increases by more than 267 millions, and the economy nearly triple in size, meaning income per capita roughly doubles. This growth in absolute terms means India’s share of global primary energy demand jumps from 6% today to 11% by 2040. Power generation increases by 207% to 4,781 TWh by 2040, accounting for 61% of primary energy demand growth. Industry is the strongest source of final energy demand growth (+238 Mtoe) followed by transport (+144 Mtoe) and non-combusted (+64 Mtoe). Coal meets ~42% of India’s new energy demand, increasing by 493 Mtoe. The majority (84%) of this additional consumption is met through domestic production. Renewable energy consumption surges from ~20 Mtoe today to ~300 Mtoe by 2040 – concentrated mainly in the power sector and driven largely by growth in solar capacity. Yet despite this growth in renewables, coal continues to dominate India’s power generation mix, accounting for 80% of output by 2040. As a result, although the carbon intensity of India’s power grid declines by 29% by 2040, it remains 58% above the global average. India’s total net CO2 emissions roughly double to 5 Giga-tonne (Gt) by 2040, meaning India’s share of global emissions increases from 7% today to 14% by 2040. Although gas production increases modestly to ~75 billion cubic metres (Bcm), demand surges some 240% to reach 185 Bcm by 2040, meaning India’s reliance on gas imports is set to continue to grow significantly. Nuclear capacity continues to grow slowly and accounts for 4% of total power generation by 2040. Table 8.1. shows the primary energy consumption in India over the period of 2017-2040.

India
IEA Bioenergy Task 39 - Implementation Agendas: 2019-2021 Triennium Update 191
Table 8.1. Primary energy consumption (units in Mtoe unless otherwise noted)
* Compound annual growth rate. † Oil supply includes crude oil, shale oil, oil sands, natural gas liquids, liquid fuels derived from coal and gas, and refinery gains, but excludes biofuels. Oil demand includes consumption of all liquid hydrocarbon (Source: BP Energy Outlook (2019)) Electricity security has improved through the creation of one national power system and major investments in clean energy. India is now working on integrating higher shares of variable renewable energy into the energy mix. For the period 2016-2018, the share of solar PV and wind doubled in the electricity generation mix from 4% to 8%. Energy efficiency increases have enabled the avoidance of an additional 15% of energy demand and 300 million tonnes (Mt) CO2 emissions over the period 2000-2018. The Government of India has set a target of installing 175 GW of renewable energy capacity by the year 2022, which includes 100 GW from solar, 60 GW from wind, 10 GW from bio-power and 5 GW from small hydro-power (National Institution of Transforming India, 2015). Government has enhanced the target for producing renewable energy to 450 gigawatts (GW) by 2030
India
IEA Bioenergy Task 39 - Implementation Agendas: 2019-2021 Triennium Update 192
(Source: https://energy.economictimes.indiatimes.com/news/renewable/india-to-have-450-gw-renewable-energy-by-2030-president/73802626). India has also been prioritizing access to electricity and clean cooking. Progress in both have been remarkable: 700 million people gained access to electricity since 2000, and 80 million new liquefied petroleum gas (LPG) connections for clean cooking were created. The Government of India is continuing to focus on providing secure, affordable and sustainable energy, while achieving its ambitious renewable energy targets and reducing local air pollution. Figure 8.1 shows the total energy supply in India over the period of 1990-2018.
Figure 8.1. Total energy supply (TES) by source, India 1990-2018 (IEA, 2018)
Considering final energy consumption as the direct amount of energy consumed by end users while primary energy consumption including final consumption plus the energy that was necessary to produce and deliver electricity, in India, the factor primary on final energy is relatively high, i.e. 4.2, because of high transmission losses. Figure 8.2 shows the primary energy consumption in India. In 2020, the transportation sector is projected to account for 21% of total final energy use and 14% of primary energy use, versus 16% of total final energy use and 12% of primary energy use in 2005 (Pinna, et al., 2014).
Figure 8.2. Primary consumption in India, 2017 (BP energy Review 2017)
India’s greenhouse gas emissions (GHG) are the third largest in the world and the main source is coal. India emits about 3 Giga-tonnes (Gt) CO2eq of GHG each year; about two and a half tonnes per person, which is half the world average. The country emits 7% of global emissions.

India
IEA Bioenergy Task 39 - Implementation Agendas: 2019-2021 Triennium Update 193
As of 2019, these figures are quite uncertain, but a comprehensive greenhouse gas inventory is within reach. Cutting greenhouse gas emissions, and therefore air pollution in India, would have health benefits worth 4 to 5 times the cost, which would be the most cost-effective in the world. As of 2014, India's carbon intensity per GDP was twice the world average. The Paris Agreement commitments included a reduction of this intensity by 33-35% by 2030 (Wikipedia, 2019). The largest driver of overall GHG are CO2 emissions from fuel combustion. In India, they have steadily increased since 1990, as shown in Figure 8.3. The data in Figure 8.4 shows that India’s CO2 emissions fall for the the first time in 2020.
Figure 8.3. CO2 emissions from fuel combustion (MtCO2/year) (Climate Transparency, 2019)
Figure 8.4. India’s CO2 emissions fall for the the first time
Note: Figure is an estimate for financial year ending March 2020. Source: Centre for Research and energy for clean air; https://energyandcleanair.org/ India has made important progress towards meeting the United Nation’s Sustainable Development Goals, notably Goal 7 on delivering energy access. Both the energy and emission intensities of India’s gross domestic product (GDP) have decreased by more than 20% over the past decade. This represents

India
IEA Bioenergy Task 39 - Implementation Agendas: 2019-2021 Triennium Update 194
commendable progress even as total energy-related carbon dioxide (CO2) emissions continue to rise. India’s per capita emissions today are 1.6 tonnes of CO2, well below the global average of 4.4 tonnes, while its share of global total CO2 emissions is some 6.4%. India is an active player at international fora in the fight against climate change. The country’s Nationally Determined Contribution under the Paris Agreement sets out targets to reduce the emissions intensity of its economy and increase the share of non-fossil fuels in its power generation capacity while also creating an additional carbon sink by increasing forest and tree cover. Although the emissions intensity of India’s GDP has decreased in line with targeted levels, progress towards a low-carbon electricity supply remains challenging.
India has taken significant steps to improve energy efficiency, which have avoided an additional 15% of annual energy demand and 300 million tonnes of CO2 emissions over the period 2000-18, according to IEA analysis. The major programmes target industry and business, relying on large-scale public procurement of efficient products such as LEDs and the use of tradable energy efficiency certificates. The government’s LED programme has radically pushed down the price of the products in the global market and helped create local manufacturing jobs to meet the demand for energy-efficient lighting (IEA, 2020).
8.2. Main drivers for biofuels policy
Government of India has emphasized on achieving energy security of the country with a target of reducing
import dependence i.e. usage of fossil fuels by 10% from current levels by the year 2022; and also the
country is committed to reduce the carbon footprint by 30-35% by the year 2030. This target will be
achieved by adopting a five pronged strategy which includes (1) Increasing Domestic Production; (2)
Adopting biofuels & Renewables; (3) Energy Efficiency Norms and (4) Improvement in Refinery Processes
and Demand Substitution. This envisages a strategic role for biofuels in the Indian Energy basket. The
growing concern about the import dependence for fuel requirement in tandem with environmental
pollution issues have driven the need for alternative fuels that have superior environment benefits and
are economically competitive with fossil fuel.
Renewable energy resources are indigenous, non-polluting and virtually inexhaustible. India is endowed
with abundant renewable energy resources. Therefore, their use should be encouraged in every possible
way. An indicative target of 20% blending of ethanol in petrol and 5% blending of biodiesel in diesel is
proposed by 2030.
Following alternatives/systems need special attention to make our energy systems sustainable:
• Biofuels: Ethanol, Bio-ethanol, HVO, Bio CNG, etc.
• Hydrogen as fuel of future & Fuel Cell vehicle
• Chemical Sources of Energy (Fuel Cells)
• Battery Operated Vehicles
• Solar / Wind energy
• Municipal Solid Waste (MSW) to drop-in fuels
• Methanol from domestic coal
India has committed to reduce its emissions by 33–35 percent by 2030 compared to 2005 levels at COP-21 Paris Summit (The Economic Times, 2019a).

India
IEA Bioenergy Task 39 - Implementation Agendas: 2019-2021 Triennium Update 195
8.3. Biofuel Policy
Bio-fuels are an alternate energy options as they are renewable, clean and have low carbon emission thereby having positive environmental impact and also cut import dependence. Considering these benefits, the Government of India had started doping 5% ethanol in petrol since 2003. The blending requirement was also raised to 10%. However, the Oil Marketing Companies (OMCs) are not able to receive offers for the required quantity of ethanol against the tenders floated by them due to various constraints like state specific issues, supplier related issues including pricing issues of ethanol.
India has a ray of hope in biofuels for providing energy security and saving the environment from carbon emissions. Their use in transportation sector has become compelling in view of the tightening automotive vehicle emission standards to curb air pollution. As biofuels are derived from renewable biomass resources, it may provide strategic advantage to promote sustainable development, to supplement conventional energy sources in meeting the rapidly increasing requirements for transportation fuels associated with high economic growth. Biofuels also help in increasing farmer’s income while meeting the energy needs of India’s vast rural population in an environmentally benign and cost effective manner.
Strong technology focus is imperative for the development of second generation and advanced biofuels utilizing domestic feedstock. The Indian approach to biofuels is based solely on non-food feedstocks to be raised on degraded or wastelands that are not suited to agriculture, thus avoiding a possible conflict of fuel vs. food security. Government has enhanced the Ethanol Procurement Price and opened alternate route like cellulosic and lignocellulosic materials, including Petrochemical route.
To increase indigenous production of ethanol, since 2014 Indian Government has taken multiple interventions including administered price mechanism, opening alternate route for ethanol production, amendment to Industries (Development & Regulation) Act, 1951 which legislates exclusive control of denatured ethanol by the Central Government, reduction in Goods & Service Tax (GST) from 18% to 5%, Notification of National Policy on Biofuels – 2018, increasing scope of raw material for ethanol procurement, interest subvention scheme for enhancement and augmentation of the ethanol production capacity and extension of EBP Programme to the entire India except islands of Andaman Nicobar & Lakshadweep wef 01st April, 2019.
Government of India has a plan to increase ethanol blending in gasoline from 4.3% now to 8-10 % by 2020-21. For 10 % ethanol blending, India will require about 4.5 billion litres of it in a year, about ₹23,000 crore ( US $ 3 billion) in terms of value. In order to augment feedstock availability and promote Bio-Fuels, Government of India has notified “the National Policy on Biofuels-2018” on 8th June 2018. The Policy encourages innovation and provides thrust to Research & Development (R&D) and Demonstration in the field of biofuels by utilizing developed/emerging technologies while undertaking R&D activities. The Policy dwells on the development of the next generation biofuel conversion technologies based on new feedstocks and promote domestically available feedstock exploring, utilizing the Country’s biodiversity.
The policy also aims to provide financial and fiscal incentives specific to biofuel type, categorized as first generation (1G), second generation (2G) and third generation (3G) fuels. The first generation category of biofuels includes bioethanol and biodiesel. The second generation comprises ethanol from lignocellosic biomass, non-food crops, industrial waste & residue streams & Drop-in Fuels from biomass, MSW, plastics & industrial waste. The third generation includes compressed BioCNG from food waste, biomass, MSW & sewage water, etc. In the new policy, many new additional raw materials for 1G ethanol production have been included like Sugarcane Juice, Sugar containing materials like Sugar Beet, Starch containing materials like Corn, Cassava, damaged food grains like wheat, broken rice, Rotten Potatoes which are going to increase availability of 1G ethanol. However, new additional raw materials for 1G ethanol also would not be able to substantially improve the demand of bio-ethanol for even E10 gasoline on pan India basis. Therefore, production of ethanol from 2G technologies is essentially required to sustain the demand of ethanol by OMCs. Biomass is abundantly available in India, therefore research in the area of conversion of biomass to various valuable green fuels such as ethanol, methanol, BioCNG is essentially required for

India
IEA Bioenergy Task 39 - Implementation Agendas: 2019-2021 Triennium Update 196
the India’s energy security. Moreover, technologies to convert abundantly available MSW, industrial plastic waste, flue gases, etc. to energy would be highly beneficial to India.
With a thrust on advanced biofuels, the policy indicates a viability gap funding scheme for 2G ethanol bio-refineries of Rs 5,000 crore ( US $ 675 million) in 6 years in addition to additional tax incentives, higher purchase price as compared to 1G biofuels. The Policy encourages setting up of supply chain mechanisms for biodiesel production from non-edible oilseeds, used cooking oil and short gestation crops. Oil marketing companies will offer 100% offtake guarantee to biofuel manufacturers and the industry is expected to reach ₹100,000 crore (US $ 13.5 billion) turnover by 2030.
Expected benefits of blending ethanol mandates in the current gasoline pool in India are:
• Reduce Import Dependency: One crore lit of E10 saves Rs.28 crore (US $ 3.8 million) of forex at current rates. The ethanol supply year 2017-18 is likely to see a supply of around 150 crore litres ( 1.5 billion litres) of ethanol which will result in savings of over Rs.4000 crore (US $ 540 million) of forex.
• Cleaner Environment: One crore (US $ 10 million) lit of E-10 saves around 20,000 ton of CO2 emissions. For the ethanol supply year 2017-18, there will be lesser emissions of CO2 to the tune of 30 lakh (US $ 3 million) ton. By reducing crop burning & conversion of agricultural residues/wastes to biofuels there will be further reduction in Green House Gas emissions.
• Health benefits: Prolonged reuse of Cooking Oil for preparing food, particularly in deep-frying is a potential health hazard and can lead to many diseases. Used Cooking Oil (UCO) is a potential feedstock for biodiesel and its use for making biodiesel will prevent diversion of used cooking oil in the food industry.
• MSW Management: It is estimated that, annually 62 MMT of Municipal Solid Waste gets generated in India. There are technologies available which can convert waste/plastic, MSW to drop-in fuels. One ton of such waste has the potential to provide around 20% of drop in fuels.
• Infrastructural Investment in Rural Areas: It is estimated that, one 100 KLPD (Kilo litre per day) biorefinery will require around Rs. 1000 crore ( US $ 135 million) capital investment. At present, Oil Marketing Companies are in the process of setting up twelve 2G biorefineries with an investment of around Rs.14,000 crore ( US $ 1.9 billion) . Further addition of 2G bio refineries across the Country will spur infrastructural investment in the rural areas.
• Employment Generation: One 100 KLPD 2G biorefinery can contribute 1200 jobs in Plant Operations, Village Level Entrepreneurs and Supply Chain Management.
• Additional Income to Farmers: By adopting 2G technologies, agricultural residues/waste which otherwise are burnt by the farmers can be converted to ethanol and can fetch a price for these waste if a market is developed for the same. Also, farmers are at a risk of not getting appropriate price for their products during the surplus production phase. Thus, conversion of surplus grains and agricultural biomass can help in the price stabilization.
8.3.1. Biofuels obligations
The country began 5% ethanol blending (E5) pilot program in 2001 and formulated the National Mission on Biodiesel in 2003 to achieve 20% biodiesel blends by 2011–2012 (Government of India, 2002, 2003). Similar to many countries around the world, India's biofuel programs experienced setbacks, primarily because of supply shortages and global concerns over food security. A National Policy on Biofuels was made by Ministry of New and Renewable Energy in 2009 that proposed a non-mandatory target of a 20% blend for both biodiesel and ethanol by 2017, and outlined a broad strategy for the biofuels program and policy measures to be considered to support the program. In order to augment feedstock availability and promote biofuels, Government of India notified the National Policy on Biofuels-2018 on 8th June 2018.
Salient features of National Policy on Biofuel 2018 include:

India
IEA Bioenergy Task 39 - Implementation Agendas: 2019-2021 Triennium Update 197
1. The Policy categorises biofuels as "Basic Biofuels" viz. First Generation (1G) bioethanol &
biodiesel and "Advanced Biofuels" - Second Generation (2G) ethanol, Municipal Solid Waste
(MSW) to drop-in fuels, Third Generation (3G) biofuels, bio-CNG etc. to enable extension of
appropriate financial and fiscal incentives under each category.
2. The Policy expands the scope of raw material for ethanol production by allowing use of
Sugarcane Juice, Sugar containing materials like Sugar Beet, Sweet Sorghum, Starch containing
materials like Corn, Cassava, damaged food grains like wheat, broken rice, Rotten Potatoes,
unfit for human consumption for ethanol production.
3. Farmers are at a risk of not getting appropriate price for their products during the surplus
production phase. Taking this into account, the Policy allows use of surplus food grains for
production of ethanol for blending with petrol with the approval of National Biofuel
Coordination Committee.
4. With a thrust on Advanced Biofuels, the Policy indicates a viability gap funding scheme for 2G
ethanol biorefineries of Rs.5000 crore (US $ 675 million) in 6 years in addition to additional tax
incentives, higher purchase price as compared to 1G biofuels.
5. The Policy encourages setting up of supply chain mechanisms for biodiesel production from non-
edible oilseeds, Used Cooking Oil, and short gestation crops.
6. Roles and responsibilities of all the concerned Ministries/Departments with respect to biofuels
has been captured in the Policy document to synergise efforts.
Currently, 5% Ethanol in Petrol is mandatory and OMC’s can add ethanol in Petrol up to 10% as per Gazette notification 2nd Jan., 2013 by MoP&NG (Government of India, Ministry of Petroleum and Natural Gas, 2013). However, E10 should meet specification IS 2796:2017 and automotive grade ethanol should meet IS: 15464: 2004 spec. Ethanol procurement prices for sugarcane based raw materials viz. C heavy molasses, B heavy molasses, sugarcane Juice, sugar, sugar syrup are fixed by the Government every year for an Ethanol Supply. Price of ethanol derived from damaged and surplus food grains would also be fixed (Government of India, Ethanol Blended Petrol (EBP) Programme) In India, despite the fact that there are not vehicles in the country running on 100% ethanol or methanol, the government has eliminated the requirement for those vehicles to secure commercial licenses in an effort to promote their use. The policy also applies to electric vehicles and rickshaws. Electric vehicles for both commercial and non-commercial use have special colored license plates so when ethanol/methanol vehicles become available, a specific color will be assigned to those as well (The Times of India, 2018). Biodiesel blending is not mandatory in India yet. B7 diesel should meet IS 1460:2017 specification and biodiesel should meet IS: 15607:16 specification. Government is promoting UCO as raw material for Biodiesel production in India to improve the Biodiesel availability in India and a policy has also been framed for that (The Economic Times, 2019b). National Policy on Biofuels 2018 is aimed at taking forward the indicative target of achieving 20% blending of biofuels with fossil-based fuels by 2030. Import of biofuels is not allowed in India. Export policy of biofuels was revised in 2018 from free to restricted as per the national policy on biofuels 2018. Under the policy, imposed restrictions were imposed on export of biofuels within days of putting similar conditions for its imports. A licence is required for both exports and imports of bio-fuels. Bio-fuels include ethyl alcohol, petroleum oil and oils obtained from bituminous minerals, bio-diesel and mixtures (Financial Express, 2018) There are no market-based policies in India such as Low Carbon Fuel Standard, Carbon tax and
Emissions Trading (cap-and-trade) to encourage the production and use of biofuels.

India
IEA Bioenergy Task 39 - Implementation Agendas: 2019-2021 Triennium Update 198
Aviation Biofuels/Biojets are covered in the National policy on Biofuels. However, there is no specific
policy for marine bio-fuels. However, OMC’s are supplying MARPOL grade Marine fuels. Currently no
incentive scheme for promotion of aviation & marine bio-fuels.
There is currenly no non-complaince penalty for OMCs in India to blend ethanol and biodiesel into their
gasoline and diesel pools.
8.3.2. Excise duty reductions
India’s biofuels market is relatively nascent, despite having had since 2007 a zero excise duty and a zero Value Added Tax (VAT) on biofuels in 5 states (West Bengal, Uttar Pradesh, Uttarakhand, Chhattisgarh and Rajasthan). A recent change in tax regimes threatens to make biodiesel substantially more expensive than regular diesel, as it envisages an additional 12% Goods and Services Tax (GST) on biodiesel. India’s Biodiesel Association asserts that as soon as biodiesel is blended with diesel, taxes can become as high as 20-30% depending on the state, with a litre of biodiesel becoming ~EUR 0.01 more expensive than fossil diesel (Biofuels International, 2017). As a result of this taxation conundrum and other constraints, the previously proposed biodiesel blending level of 20% in fossil diesel by 2017 was not achieved, highlighting the need for a revised policy that keeps this somewhat frail industry from perishing (Biofuture platform, 2018). Under the new GST regime, starting July 2017 biodiesel, industrial alcohol, and ethanol/fuel ethanol (excepting potable alcohol) was taxed at 18%. For states in which the new GST rate is higher than the current VAT rate, the cost of production inputs to produce biofuel will increase. Note that for an unspecified time, crude oil, natural gas, high speed diesel (HSD), and aviation turbine fuel (jet fuel) have been exempted from GST (GAIN, 2018). GST rate on ethanol meant for the Ethanol Blending Program has been reduced from 18% to 5%.
8.3.3. Fiscal incentives and investment subsidies
India encourages joint ventures and investments in the biofuel sector. A 100% Foreign Direct Investment (FDI) in biofuel technologies is fostered by an automatic approval route provided the biofuels to be produced are for domestic use only. Plantations of inedible oil-bearing plants are not elegible for FDI participation (GAIN, 2018). Schemes will be launched to move forward India’s “Advanced Biofuels” program. In addition to exploring opportunities for generating carbon credits, the National Bank for Agriculture and Rural Development (NABARD) and other public sector banks will be encouraged to provide funding and financial assistance through soft loans, etc. These developments remain to be realized, however; no concrete information is yet available regarding specific benefits and impacts to biofuels producers (GAIN, 2018). The National Biofuel Policy proposes to set up a National Biofuel Coordination Committee (NBCC) to be headed by the Prime Minister. Given the role of different agencies and ministries in the biofuel program, the role of NBCC is to provide high level coordination, policy guidance and review on different aspects of biofuel development, promotion and utilization. The policy also provides for formation of a Biofuel Steering Committee to be headed by a Cabinet Secretary that will oversee implementation of the policy. Various state governments will work closely with their respective research institutions, forestry departments, and universities to develop and promote biofuel programs in their respective states, albeit few states have so far drafted policies and set up institutions for promoting biofuel in their states. To deal with different aspects of biofuel development and promotion in the country, several ministries have been allocated specific roles and responsibilities, as shown in Table 8.2.

India
IEA Bioenergy Task 39 - Implementation Agendas: 2019-2021 Triennium Update 199
Table 8.2. Role of ministries in biofuel development and promotion in India (GAIN, 2018)
Ministry Role
Ministry of Petroleum and Natural Gas (MoPNG)
Overall coordinating ministry for development of biofuels, overseeing: • National Biofuel Policy & its implementation • Research, development & demonstration on production
and use of biofuels • Marketing and distribution of biofuels • Blending levels of biofuels • Development & implementation of pricing &
procurement policy • Dispute redressal • Foster international collaboration for advanced biofuel
research and capacity building • Municipal Solid Waste (MSW) to transportation fuels
Ministry of Rural Development • Feedstock planting and supply chain activities along with rural livelihood
Department of Agriculture & Cooperation (Ministry of Agriculture & FW)
• Production of plant materials through nurseries and planting feedstocks for biofuels in coordination with other ministries
Ministry of Environment, Forest and Climate Change (MoEF&CC)
• Biofuel feedstocks planting in forest lands and environmental issues concerning biofuels
• Involvement of communities in maintenance of feedstock growing areas and supply chain
Ministry of Science and Technology (Department of Biotechnology and Department of Science & Technology)
• RD&D on various feedstocks and technology improvements for biofuel development
• Promote innovation and new research in the biofuel area • Develop technologies for bio-refinery and value-added products
Ministry of Road Transport and Highway (MoRTH)
• Encourage consumption/usage of biofuels in the transport sector
Ministry of Railways • Encourage consumption/usage of biofuels
Department of Consumer Affairs (Ministry of CA, F&PD)
• Developing specifications, standards and codes for ensuring quality control of biofuels for end uses
Ministry of Heavy Industries and Public Enterprises
• Advise equipment manufacturers on making equipment compatible with biofuels available in the market
Ministry of New & Renewable Energy • Co-produce energy and bio-power through biogas including enriched biogas, bio-CNG, etc. from biomass/urban, industrial and agricultural wastes
Ministry of Housing & Urban Poverty Alleviation
• Coordinate with states and ULBs for the availability of municipal solid waste (MSW) as an important feedstock for biofuels, including MSW in urban areas
Ministry of Consumer Affairs, Food & Public Distribution, Department of Food & Public Distribution
• Provide suitable financial incentives for the sugar sector to set up ethanol distilleries
A recent scheme called, Pradhan Mantri JI-VAN (Jaiv Indhan- Vatavaran Anukool fasal awashesh Nivaran) Yojana, aims to provide financial support to Integrated Bioethanol Projects using lignocellulosic biomass and other renewable feedstock. Centre for High Technology (CHT), a technical body under the aegis of Ministry of Petroleum and Natural Gas (MoP&NG), will be the implementation Agency for the scheme. Under the scheme, Rs.1800 crore ( US $ 240 million) has been allocated for supporting 12 Commercial projects, Rs.150 crore (US $ 20 million) has been allocated for supporting 10 demonstration Projects.

India
IEA Bioenergy Task 39 - Implementation Agendas: 2019-2021 Triennium Update 200
8.3.4. Other measures stimulating the implementation of biofuels
The Ministry of Science and Technology, through its Department of Biotechnology (DBT), has been supporting feedstock development and improved biofuel production technology, with a major focus on cellulosic (so-called second generation) ethanol. DBT is also promoting cutting edge research and innovation in biofuels production and use for the last eight years through its Center of Excellence, fellowships, training and international collaboration. It focuses on topics such as lignin valorization, algal biofuels, waste biomass to energy (and value-added bioproducts), biobutanol and biohydrogen, among others, generally in a biorefinery context and including LCA. More than US $30 million have been invested in biofuels R&D to date, and cellulosic ethanol production technology has been successfully demonstrated by one of the bioenergy centers supported by the Government of India. Many cost effective biofuel production technologies are being developed and demonstrated at pilot scale (Biofuture platform, 2018). Targeted areas of intensive R&D work include: 1) biofuels feedstocks production; 2) advanced conversion technologies for identified feedstocks; 3) technologies for end-use applications including modifications for biofuels; and 4) utilization of biofuels production byproducts (GAIN, 2018). List of Funding Agencies & Major Program include:
• Department of Biotechnology (DBT) , Ministry of Science & Technology, Government of India
• Centre for High technology (CHT) , Ministry of Petroleum & Natural Gas, Government of India
• Ministry of New & Renewable Energy (MNRE) , Government of India
List of major programs supporting the development of biofuels production and use in India include:
• Viable Gap funding (VGF) for Commercial scale 2G ethanol plants under Pradhan Mantri JI-VAN
Yojana from CHT, MoP&NG
• Financial Assistance for Demonstration Scale 2G Integrated Bioethanol under Pradhan Mantri JI-
VAN Yojana from CHT, MoP&NG
• Grant for Research & development from DBT to 5 Centre for Excellence in Bioenergy Area
8.4. Promotion of advanced biofuels
National Policy on Biofuels 2018 specifically promotes Advanced Biofuels to achieve target of 20% blending of bio-fuels with fossil-based fuels by 2030. LCA of all technologies are carried out for all technologies and part of environment clearance for any commercial & demonstration projects on advanced biofuels to measure the CO2 emission reduction of different technology pathways to produce advanced biofuels. In India, there are two operational advanced biofuel facilities - one pilot and one demonstration plant - with a combined production capacity of 1.75 million liters per year. Indian Glycols built the first plant in the country, in 2016, at their Kashipur site in Uttarakhand. Their cellulosic pilot plant uses technology developed by the Center for Energy Biosciences at the Mumbai Institute of Chemical Technology (DBT-ICT). It has a 750,000 liters (0.75 million litres) annual production capacity. Praj Biofuels built the country’s second facility in 2017, an integrated cellulosic ethanol bio-refinery, which once in full operation will produce 1 million liters of ethanol per year from agricultural residues such as rice, wheat straw, cotton stalk and bagasse. In 2018, Shell Bangalore completed a demonstration plant which will use an innovative waste-to-fuels technology and is expected to produce 50 million liters per year. More recently, in early 2018, Chempolis, Fortum and Numaligarh Refinery announced forming a joint venture to build a biorefinery in Assam that will convert bamboo into ethanol, furfural, acetic acid and biocoal (Biofuture platform, 2018). Table 8.3 lists India’s operational, recently completed and planned advanced biofuels plants.

India
IEA Bioenergy Task 39 - Implementation Agendas: 2019-2021 Triennium Update 201
Table 8.3. Operational, recently completed and planned advanced biofuels plants in India (Biofuture
platform, 2018)
Name of company Status (planned; operational; closed)
Technology Production capacity (ML/year)
Indian Glycols Kashipur/ 2016
Operational Demo/ Cellulosic ethanol/ DBT ICT Technology
0.75
Praj Biofuels/2017 Operational Demo/ Cellulosic ethanol/Praj
1.0
Shell Bangalore/2018 Operational Demo/ Drop-in
fuels/Shell
0.6
NRL Numaligarh/2018 Planned Commercial /Cellulosic ethanol/Chempolis
60
IOCL Panipat Planned Commercial /Cellulosic ethanol/Praj
30
BPCL Bargarh Planned Commercial /Cellulosic ethanol/Praj
30
HPCL, Bhatinda Planned Commercial /Cellulosic ethanol/Praj
30
IOCL Panipat Planned Demo/Cellulosic ethanol/IOC R&D
0.75
CSIR-IIP, Dehradun Operational Pilot/ HEFA Biojet/CSIR IIP
0.01
India’s new biofuel policy encourages the use of “wastelands” for increased production of feedstocks such as non-edible oilseed bearing trees and crops such as Pongamia pinnata (Karanja), Melia azadirachta (Neem), castor, Jatropha carcus, Callophylum innophylum, Simarouba glauca, and Hibiscus cannabbinus in order to augment current domestic feedstock supply for biodiesel production. It is noted that the National Biodiesel Mission (NBM) had previously identified jatropha (jatropha curcas) as the most suitable inedible oilseed feedstock to help reach the proposed biodiesel blend level of 20% by 2017. However, using jatropha has so far proved to be untenable due to a host of agronomic and economic constraints (GAIN, 2018). Farmers have been encouraged to grow a variety of different biomass crops including oilseeds on their marginal lands as inter-crops, and as a second crop wherever only one crop is historically cultivated under rain-fed conditions. Suitable supply chain mechanisms, feedstock collection centers, and fair price mechanisms for the engaged communities are planned for development in coordination with local bodies, states, and concerned stakeholders. In addition, Oil Marketing Companies (OMCs) have agreed to sign Ethanol Purchase Agreements (EPAs) with cellulosic ethanol suppliers for a period of 15 years to provide a more secure market outlook for private investors and stakeholders as well as to support cellulosic ethanol production initiatives. Bio-compressed natural gas (bio-CNG) is one of the major potential by-products of cellulosic ethanol bio-refineries and also a transport fuel and so will also be provided with offtake assurances by the public sector gas marketing companies (GAIN, 2018). According to the TIFAC 2018 report on estimation of surplus crop residues in India for Biofuel production, the total dry biomass generated in India was about 683 MT for the major eleven crops. Out of this total dry biomass only 178 MT (26%) was found to be surplus. The total annual bioethanol (2G ethanol) production potential of the country is 51.35 billion litres (BL) from 178 MT of surplus crop biomass generated.

India
IEA Bioenergy Task 39 - Implementation Agendas: 2019-2021 Triennium Update 202
All the three OMC’s in India (Oil Marketing Companies -IOCL, HPCL, BPCL) have recently conducted surveys of Used Cooking Oil (UCO) potential in the country. An expression of interest for supply of bio-diesel produced from UCO, from plants processing used cooking oil and providing the produced biodiesel to various Terminals locations/Retail Outlets of IndianOil / BPCL/ HPCL across the country was floated on 10th August 2019. Apart from Biodiesel production, UCO has been considered for the production of renewable diesel and biojet fuels. 300 kilo tonnes of UCO quantity may be available for producing biodiesel or biojet fuels in India. India imports about 70% or 16 million tonnes of its annual 24 million tonnes of edible oil requirements (https://www.thehindubusinessline.com/economy/agri-business/centre-imposes-restrictions-on-import-of-refined-palm-oil/article30515808.ece). The government recently expressed their interest in the procurement of biodiesel from used cooking oil across 100 cities and asking for companies to submit Expression of Interest (EOI). The purpose of inviting this EOI is to encourage the applicants to set up Biodiesel producing plants from Used Cooking Oil (UCO), processing plants and further utilizing the existing potential of UCO based Bio-diesel in India. The National Policy on Biofuels envisages production of biofuel from UCO and the Food Safety and Standards Authority of India (FSSAI) is implementing a strategy to divert UCO from the food value chain and curb current illegal usage. The National Policy on Biofuels – 2018 envisages a target of 5% blending of Biodiesel in HSD by 2030. In order to achieve the blending target, 500 crore litres of Biodiesel is required in a year. In India, approximately, 22.7 MMTPA (2700 crore litres) of Cooking Oil is used out of which 1.2 MMTPA (140 Crore) UCO can be collected from Bulk Consumers such as hotels, restaurants, canteens, etc. for conversion, which will give approximately 110 crore litres of Biodiesel in one year. Presently there is no established collection chain for UCO (BiofuelsDigest, 2019). As per CBDA (Chhattisgarh Biofuel Development Authority), India has enormous potential of oilseeds of Tree Borne Oil (TBO) seed species. TBO’s are grown on their own naturally and established in all kinds of land even not suitable for agricultural practices and in varied agro-climatic conditions. About 1.22 million tones of TBO oil may be available for producing biodiesel or biojet fuels in India. However, establishing a robust rural network for collection of tree borne oilseeds and its processing is a challenge. Substantial work has been done in the area of biojets by various global and indigenous research institutes since the beginning of the 21st century. In India, consortium involving Indian Institute of Petroleum, Dehradun (IIP-Dehradun), Indian Oil Corporation Limited (IOCL), Hindustan Petroleum Corporation Limited (HPCL), Indian Institutes of Technology (IIT) Kanpur and Indian Institute of Science (IISc) has carried out lot of research work in collaboration with consortia from Canada involving M/s Pratt & Whitney (P&W), McGill University, Ryerson University, Laval University & NRC IAR. During this collaborative work, a process for the production of biojets from vegetable oils was developed and fit-for-purpose & engine performance studies were completed. The working group on biofuels under the Ministry of Petroleum & Natural Gas (MoP&NG), Government of India, constituted a subcommittee on biojet fuel comprising of members from the Oil Marketing Companies (OMCs), IIT Kanpur, Council of Scientific and Industrial Research(CSIR)-IIP, Chhattisgarh Biofuel Development Authority (CBDA), Department of Science & Technology (DST), Directorate General of Civil Aviation (DGCA), and SpiceJet to consolidate these efforts and scale up the work in this field. MOP&NG in August 2019 also constituted committees to give impetus to the biojet fuels (Bio-ATF) program in the country. The committee mandate was to look into the availability of feedstock across India for the production of biojets, current demand for biojets, estimate of future requirements and its cost of production etc. in view of CORSIA policy on emissions. The committee suggested that Feedstock availability and the production costs are the key drivers towards sustainable commercial production & successful implementation of biojets in India. Biojets production technologies meeting desired quality are available nationally and internationally. CSIR-IIP Dehradun has developed hydro-processed Esters & Fatty Acids technology (HEFA) using non-edible vegetable oils including UCO up to pilot scale. IIP has also demonstrated the biojet fuel performance in ATF in Spicejet commercial flight. However, limited availability of raw material such as vegetable oils, UCO, Tree borne oils etc, high production cost and competing biodiesel technology is a challenge for sustainable commercial production of HEFA based biojet in India. Alcohol to jet fuel (ATJ) drop-in-fuels also has great potential in India as new technologies such

India
IEA Bioenergy Task 39 - Implementation Agendas: 2019-2021 Triennium Update 203
as gas fermentation efficiently convert plentiful wastes such as steel mill off-gases, gases from oil refineries and residues from agricultural processes to bioethanol are being established in India to improve the bioethanol availability required for this process. However, economics of this process is a challenge due to high current cost of ethanol and high processing cost in India. Economies of scale for HEFA/ATJ processes as well as policy interventions such as subsidies, feedstock incentives, VGF funding, differential fuel pricing may accelerate the adoption of biojet fuels in India (Ministry Petroleum and Natural Gas, 2020).
8.5. Market development and policy effectiveness
India has about 330 distilleries, which can produce over 4.8 billion litres of rectified spirits (alcohol) per year. Of this total, about 166 distilleries have the capacity to distil 2.6 billion litres of ethanol (denatured and undenatured) to be used in fuel, industrial chemicals, and beverages. India currently combined annual production capacity of 650 million liters of biodiesel per year. The production capacity of existing plants range from 11 million liters to 280 million liters. The country’s bio-diesel production is expected to increase 2.7% to 190 million liters in 2019. The fuel is mainly manufactured from imported palm stearin, and small volumes of non-edible oils, Used Cooking Oil (UCO) and domestically sourced animal fats. Feedstock constraint has led to low plant utilization of 29 percent, the report said (The Economic Times, 2019c). Figure 8.5 and Table 8.4 show biodiesel production capacity over the period of 2010-2019 and biodiesel production facilities in India.
Figure 8.5. Nameplate capacity of biodiesel production in India from 2010 to 2019 (in million liters)
(Statista, 2019)

India
IEA Bioenergy Task 39 - Implementation Agendas: 2019-2021 Triennium Update 204
Table 8.4. Biodiesel plants, their locations and construction years in India
COMPANY NAME BIODIESEL PLANT LOCATION YEAR
Kaleesuwari Refinery Private Limited Andhra Pradesh 2008
Bio Max Andhra Pradesh 2009
Emami Biotech Pvt Ltd West Bengal 2009
Universal Biofuels Andhra Pradesh 2008
CREDA Raipur 2008
Khanda Biofuels Pvt Ltd Hyderabad 2011
Yantra Fintech Ltd Chennai 2009
Yamuna Bio Industries Ltd Varoda 2015
Unicon Fibro Chem Ltd Silvassa 2015
Rajputana Biofuels Ltd Jaipur 2018
Kotiar Biofuels Ltd Abu Road, rajashtan 2019
Wash well Bhilwara 2015
Kissan Agro Industries Ltd Noida 2012
Monopoly Industries Ltd Khopoli 2018
Eco Green Fuels Pvt. Ltd Bangalore 2012
BioD Industries Ltd Bawal, Haryana 2019
Munzer Bharat New Mumbai 2019
Global Panvel 2015
Al Noor Muzaffarnagar 2015
Elite Oil Ltd Kakinada 2018
Southern Biotech Ltd Andhra Pradesh 2007
Southern Biotech Ltd Andhra Pradesh 2010
Nova Biofuels P Ltd Haryana 2008
Ruchi(Pilot Plant) Gujarat 2012
RIL(pilot plant) Andhra Pradesh 2009
Costal Energy West Bengal 2008
Source: https://www.bdai.org.in/bioplant.php Table 8.5 and Table 8.6 shows the actual production and consumption of ethanol and biodiesel in India in the last two years.

India
IEA Bioenergy Task 39 - Implementation Agendas: 2019-2021 Triennium Update 205
Table 8.5. Actual production of transport biofuels (million L/year) (GAIN, 2019; Ethanol Producer Magazine, 2019)
Year Biodiesel
(FAME)
Bioethanol
(conventional)
Renewable diesel (from lipids)
Cellulosic ethanol
Biogas as transportation fuel
Other advanced biofuels
2018 180 2700 NIL NIL NIL NIL
2019 190 3000 NIL NIL NIL NIL
Table 8.6. Summary of transport fuel consumption (‘000 Metric tonnes & Million Litres)
Year Gasoline (Mt) Diesel fuels (Mt) Aviation fuel (Mt) Biodiesel (Ml) Bioethanol (Ml)
2019-2020 29,976 ‘000 82,579 ’000 8,000 ’000 82.1 1,808
Source: https://www.ppac.gov.in/content/147_1_ConsumptionPetroleum.aspx According to the MoP&NG, the approximate ethanol availability in India is 300 crore ( 3 billion) litres. Of this, about 130 crore ( 1.3 billion) litres goes into making liquor, which is non-negotiable for states as liquor is a major revenue source for them. That leaves around 170 crore ( 1.7 billion) litres, out of which about 60 to 80 crore (0.6-0.8 billion) litres goes into making chemicals. That leaves about 100 to 120 crore (10-1.2 billion) litres for blending in gasoline. Compared to the Ethanol Bleding programme, a limited number of suppliers produce biodiesel, and most of their production capacities are under-utilized since the availability of feedstock is not sufficient. The majority of the biodiesel produced is consumed by a disbursed and informal groups at the local level, much of this used in power generation. Indian’s Ethanol and Biodiesel Blending Performance (EBP) are shown in Table 8.7 and Table 8.8 in the last five years, respectively. Table 8.7. Indian’s Ethanol and Biodiesel Blending Performance (EBP)
Period EBP (actual blending level) (%)
Volume of Ethanol in Million Litre
Total MS/EBMS ( Motor spirit/ Ethanol blended Motor spirit) sale in Million Litre
Apr’14-Mar’15 1.69 187.9 10918
Apr’15-Mar’16 3.46 422.9 12218
Apr’16-Mar’17 3.54 486.4 13722
Apr’17-Mar’18 2.80 406.1 14527
Apr’18-Mar’19 5.25 804.5 15331
Apr’19-Mar’20 4.44 758 17066
April-20 6.14 365 5946
Ethanol % age in gasoline in last five years on pan India basis

India
IEA Bioenergy Task 39 - Implementation Agendas: 2019-2021 Triennium Update 206
Table 8.8. Indian’s Biodiesell Blending Performance (EBP) in Kilolitre (KL)
Period Actual blending level (%)
Volume of B100 procured in KL
Total B-5/B-7 Blended sale in KL
Total B100 Blended sale in KL
Apr’14-Mar’15 0.00 0 0 0
Apr’15-Mar’16 0.09 5103 81872 4094
Apr’16-Mar’17 0.04 19181 383843 19192
Apr’17-Mar’18 0.05 24021 459975 22999
Apr’18-Mar’19 0.08 39575 750175 37509
Apr’19-Mar’20 (7%) 0.10 41454 597323 41813
Apr-20 0 236 0 0
Biodiesel % in Diesel in last five yrs Table 8.9. Ethanol procurement and blending details by Oil Marketing Companies (OMC) in India
Ethanol Supply Year Tendered Qty (Million Lit)
Qty Allocated (Million Lit)
Qty Supplied (crore Lit)
Blending %age PSU OMCs
2012-13 1030 320 154 0.67%
2013-14 1150 704 380 1.53%
2014-15 1280 865 674 2.33%
2015-16 2660 1305 1114 3.51%
2016-17 2800 807 665 2.07%
2017-18 3130 1610.4 1505 4.22%
2018-19 3290 2689.9 18857 5.00%
2019-20 (upto 18.05.20) 5110 1865.4 7265 4.71%
Ethanol quantity supplied to OMC & Blended The new Ethanol Blending Program (EBP) stipulates procurement of ethanol produced directly from Bheavy molasses, sugarcane juice, and damaged food grains such as those of wheat and broken rice. A surplus sugar season coupled with a stronger financial incentive to convert excess sugar to ethanol helped the OMCs to achieve its highest fuel ethanol market penetration at 5% in 2018-19 compared to the previous record 4.22% % in 2017-18. In contrast, biodiesel market penetration will remain stuck at last year’s level (0.14%) due to limited supply, insufficient feedstocks, supply chain constraints, and restrictions on imports. Buyers of such blended diesel are limited to some retail outlets of oil marketing companies, the Indian railways, State Road Transport Corporation of different states, fleet owners of road transport companies, and port authorities CSIR-IIP Dehradun, India has a pilot-scale bio-jet plant (0.3 TPD feed processing) which has produced approximately 4000 litres of bio-aviation fuel so far. The bio-jet fuel has been supplied to Spicejet Ltd. for India’s 1st Biofuel flight on August, 27, 2018 on the Bombardier Q-400 turboprop aircraft with PW150A twin engines (at 25% blend in one engine), and to Indian Air Force (IAF) for testing on the Russian Antonov AN-32, medium-range military transport aircraft with Ivchenko AI-20 Soviet turboprop twin-engine (10% blend) (CSIR IIP Dehradun website) https://www.iip.res.in/bio-jet-fuel-process-for-conversion-of-non-edible-oil-into-renewable-aviation-fuel/

India
IEA Bioenergy Task 39 - Implementation Agendas: 2019-2021 Triennium Update 207
The main concern over further biofuels deployment in India is availability of indigenous feedstocks for conventional (1G) biofuel production and uncertainty of future biomass supply due to the absence of established supply chain logistics networks operating at the required scales (Biofuture platform, 2018). Ethanol sourced from sugarcane-derived molasses remains the main biofuel used for blending in gasoline. For biodiesel, the majority of production comes from palm stearin, a non-edible by-product of palm oil production. Depending upon availability of domestic feedstocks and blending requirements, the import of feedstocks for producing biodiesel will be permitted to the extent necessary. Feedstock import requirements under this policy will be decided by the NBCC. As domestic availability of biofuels is much lower than India’s requirements, export of biofuels will not be allowed (GAIN, 2018).
8.6. Conclusions
India has a ray of hope in biofuels for providing energy security and saving the environment from carbon emissions. Their use in transportation sector has become compelling in view of the tightening automotive vehicle emission standards to curb air pollution. As biofuels are derived from renewable bio-mass resources, it may provide strategic advantage to promote sustainable development, to supplement conventional energy sources in meeting the rapidly increasing requirements for transportation fuels associated with high economic growth. Biofuels also help in increasing farmer’s income while meeting the energy needs of India’s vast rural population in an environmentally benign and cost effective manner. To increase indigenous production of ethanol, Government since 2014 took multiple interventions including opening alternate route for ethanol production, amendment to Industries (Development & Regulation) Act, 1951 which legislates exclusive control of denatured ethanol by the Central Government, reduction in Goods & Service Tax (GST) from 18% to 5%, Notification of National Policy on Biofuels – 2018, increasing scope of raw material for ethanol procurement, interest subvention scheme for enhancement and augmentation of the ethanol production capacity and extension of EBP Programme to whole of India except islands of Andaman Nicobar & Lakshadweep wef 01st April, 2019. While ethanol procurement prices for sugarcane based raw materials viz. C heavy molasses, B heavy molasses, sugarcane Juice, sugar, sugar syrup are fixed by the Government every year for an Ethanol Supply. Price of ethanol derived from damaged and surplus food grains would also be fixed. Govt is promoting UCO as raw material for Biodiesel production in India to improve the Biodiesel availability in India and a policy has also been framed for that. Feedstock availability and the production cost are the key drivers towards sustainable and commercial production & implementation of biofuels in India. Strong technology focus is imperative for the development of second generation and advanced biofuels utilizing domestic feedstock A collective effort from all the organizations would lead to effective and sustainable implementation of biofuels blending programme in India.
Sources
Biofuels International, 2017. High taxes are holding back biodiesel in India. Retrieved from https://biofuels-news.com/display_news/12073/high_taxes_are_holding_back_biodiesel_in_india/ Biofuture platform, 2018. Creating the Biofuture: A Report on the State of the Low Carbon Bioeconomy. Retrieved from: http://funag.gov.br/loja/download/creating-the-biofuture-a-report-state-low-carbon-bioeconomy.pdf BiofuelsDigest, 2019. India’s government looking to UCO to meet biodiesel demand. https://www.biofuelsdigest.com/bdigest/2019/08/10/indias-government-looking-to-uco-to-meet-biodiesel-demand/

India
IEA Bioenergy Task 39 - Implementation Agendas: 2019-2021 Triennium Update 208
BP Energy Outlook, 2019: https://www.bp.com/content/dam/bp/business-sites/en/global/corporate/pdfs/energy-economics/energy-outlook/bp-energy-outlook-2019-country-insight-india.pdf BusinessLine, 2020. Central Government imposes restrictions on import of refined palm oil. https://www.thehindubusinessline.com/economy/agri-business/centre-imposes-restrictions-on-import-of-refined-palm-oil/article30515808.ece Climate Transparency, 2019. Brown to Green: The G20 transition towards a net-zero emissions economy, Climate Transparency, Berlin, Germany www.climate-transparency.org Ethanol Producer Magazine, 2019. Report: India to use, produce a record volume of ethanol in 2019. http://ethanolproducer.com/articles/16451/report-india-to-use-produce-a-record-volume-of-ethanol-in-2019 Financial Express, 2018. Government puts restrictions on export of bio-fuels. https://www.financialexpress.com/industry/government-puts-restrictions-on-export-of-bio-fuels/1296171/ Global Agriculture Information Network (GAIN), 2019. India- Biofuels Annual 2019. USDA Foreign Agriculture Service. https://apps.fas.usda.gov/newgainapi/api/report/downloadreportbyfilename?filename=Biofuels%20Annual_New%20Delhi_India_8-9-2019.pdf Government of India, Ministry of Petroleum and Natural Gas, 2013. 5% mandatory ethanol blending with petrol under EBP programme. http://petroleum.nic.in/sites/default/files/ethanol_1.pdf Global Agricultural Information Network (GAIN), 2018. India Biofuels Annual 2018. Retrieved from: https://gain.fas.usda.gov/Recent%20GAIN%20Publications/Biofuels%20Annual_New%20Delhi_India_7-10-2018.pdf International Energy Agency (IEA), 2020. India 2020, Energy Policy Review. https://www.iea.org/reports/india-2020 International Energy Agency (IEA), 2018. India. https://www.iea.org/countries/india#overview Ministry Petroleum and Natural Gas, 2020. http://petroleum.nic.in/ National Institution of Transforming India, 2015. Report of the expert group on 175 GW RE by 2022. https://niti.gov.in/writereaddata/files/175-GW-Renewable-Energy.pdf Pinna, I., Dalla Chiara, B., Pant, K., 2014. Energy Used By Transport Systems In India: The Role Of The Urban Population, Sources, Alternative Modes And Quantitative Analyses. WIT Transactions on Ecology and The Environment, Vol. 190. Statista, 2019. Nameplate capacity of biodiesel production in India from 2010 to 2019. https://www.statista.com/statistics/1052762/india-nameplate-capcity-biodiesel-production/ The Economic Times, 2019a. India to achieve most of COP 21 climate change goals in next 1.5 years. https://economictimes.indiatimes.com/news/politics-and-nation/india-to-achieve-most-of-cop-21-climate-change-goals-in-next-1-5-years-modi/articleshow/70809788.cms?from=mdr The Economics Times, 2019b. Government launches programme for converting used cooking oil into biodiesel in 100 cities. https://economictimes.indiatimes.com/industry/energy/oil-gas/government-launches-programme-for-converting-used-cooking-oil-into-biodiesel-in-100-cities/articleshow/70617703.cms?from=mdr

India
IEA Bioenergy Task 39 - Implementation Agendas: 2019-2021 Triennium Update 209
The Economic Times, 2019c. India’s bio-diesel blending for road transport to remain muted in 2019: US Dept of Agriculture. https://energy.economictimes.indiatimes.com/news/oil-and-gas/indias-bio-diesel-blending-for-road-transport-to-remain-muted-in-2019-us-dept-of-agriculture/70868387 The Times of India, 2018. No commercial permit for vehicles plying on ethanol. https://timesofindia.indiatimes.com/india/no-commercial-permit-for-vehicles-running-on-alternative-fuel/articleshow/66338141.cms Wikipedia, 2019. Greenhouse gas emissions by India. https://en.wikipedia.org/wiki/Greenhouse_gas_emissions_by_India https://www.bp.com/en/global/corporate/energy-economics/statistical-review-of-world-energy.html Estimation of Surplus Crop Residues in India for Biofuel Production; Technology Information, Forecasting & Assessment Council (TIFAC); October 2018 https://www.statista.com/statistics/1052762/india-nameplate-capcity-biodiesel-production/#:~:text=The%20nameplate%20capacity%20of%20biodiesel,months%20under%20normal%20operating%20conditions. https://www.iip.res.in/bio-jet-fuel-process-for-conversion-of-non-edible-oil-into-renewable-aviation-fuel/

Ireland
IEA Bioenergy Task 39 - Implementation Agendas: 2019-2021 Triennium Update 210
9. Ireland
Adrian O’Connell, European Commission Joint Research Centre Shane Malone, Byrne Ó Cléirigh Consulting (www.boc.ie)
Summary • Overall, renewable energy supply in Ireland was 11% of its gross final consumption. Ireland has a
binding EU target for renewable energy of 16% by 2020, and while much progress has been made, Ireland is not on track to meet its 2020 renewable energy targets.
• The use of renewable energy in Ireland successfully displaced 2 million tonnes of fossil fuel and avoided 4.9 million tonnes of CO2 emissions, equivalent to 13% of total energy-related CO2 emissions.
• In the transport sector, more than 98% of the renewable energy consumed came from biofuels; almost 88% was biodiesel and 10% biogasoline (i.e. bioethanol).
• Ireland continues to rely heavily on imports, importing 82% of the liquid biofuels it uses in transport.
• To help Ireland meet the renewable energy transport target of the RED, Ireland implemented the Biofuel Obligation Scheme (BOS). The BOS places an obligation on the suppliers of mineral oil to ensure that 12.359% (by volume) of the gasoline and diesel placed on the road transport market in Ireland is produced from renewable sources, e.g. bioethanol and biodiesel. The obligation was increased to this level for 2020, having previously been 11.111%.
• Excise duty requirements on transport fuels consumed in Ireland are administered via a mineral oil tax. Biofuels, which are counted as having zero tailpipe emissions, are not liable for the carbon component of the mineral oil tax. The carbon tax was introduced in Ireland in 2010 and was based on a charge of €10 per tonne of CO2 emitted. It has increased steadily over the years and was increased to €33.50 per tonne in Ireland’s most recent national budget (applies from October 2020).

Ireland
IEA Bioenergy Task 39 - Implementation Agendas: 2019-2021 Triennium Update 211
9.1. Introduction
In 2018, the overall share of renewable energy in the Irish energy mix was 11%, while in transport and heat it accounted for 7.2% and 6.5% respectively. With regard to electricity production, Ireland produced 33.3% of its electricity from renewable sources. While considerable, these renewable energy shares do not meet the EU Renewable Energy Directive (2009/28/EC) – the RED – 2020 targets (16% overall, 10% transport, 12% heat and 40% electricity). Nonetheless, renewable energy penetration has been increasing steadily over time. Figure 9.1 shows the historical use of renewable energy in Ireland over the period of 2010-2018.
Figure 9.1. Growth in Renewable Energy use in Ireland, 2000 to 2018 (Source: SEAI, 2020)
According to Ireland’s Sustainable Energy Authority (SEAI), most of this growth in renewable energy has come from wind, which provided 55% of all renewable energy used in Ireland in 2018. Solid biomass and bioliquids were the next largest sources of growth. Bioenergy, including biomass, landfill gas, biogas and bioliquids, collectively accounted for 36% of renewable energy in 2018 (SEAI, 2020). As a member of the EU, Ireland is subject to the requirements of the RED. This established a mandatory minimum renewable energy target of 10% for the share of all petrol, diesel, biofuels and electricity consumed in road and rail transport by 2020. The RED also specifies a number of “weightings” (or multipliers) that can be applied to certain fuels. The weightings help to incentivise these fuels, by making it easier to meet the renewable energy in transport target (the RES-T). A weighting factor of 2 is applied to advanced biofuels, i.e. those typically produced from wastes and residues. The primary feedstock used to produce biofuel consumed in Ireland is used cooking oil (UCO) – it accounted for 62% of the biofuel placed on the market in 2018, and 68% in 2019 (NORA, 2020). A weighting of 2.5 is applied to electricity produced from renewable energy sources consumed by electric rail transport, and a weighting of 5 is applied to electricity produced from renewable sources consumed by electric cars. The share of electricity that comes from renewable sources in a particular year is taken to be the share that was measured two years before the year in question. Figure 9.2 shows the progress towards the RES-T target, with and without the weightings applied. In 2018, the RES-T stood at 7.2%, compared to the 2020 target of 10% (SEAI, 2020).

Ireland
IEA Bioenergy Task 39 - Implementation Agendas: 2019-2021 Triennium Update 212
Figure 9.2. Growth in Renewable Energy use in transport in Ireland, 2005 to 2018 (Source: SEAI, 2020)
The total amount of renewable energy consumed in transport was approximately 156 ktoe in 2018. Over 81% came from biodiesel and 17% from biogasoline, with minor amounts of pure plant oil and renewable electricity (SEAI, 2020).
9.2. Main drivers for biofuels policy
9.3. Up-to 2020
As set out previously, the RED is one of the main drivers for current biofuels policy in Ireland. The transport related requirements were transposed into Irish law by the Energy (Biofuels Obligation and Miscellaneous Provisions) Act 2010 and several subsequent regulations. While the RED is the primary driver for increasing the penetration of renewables in the transport sector, Article 7a of the Fuel Quality Directive and the Alternative Fuel Infrastructure Directive (The European Parliament and the Council of the European Union, 2014) also support increasing use of renewables. The RED and FQD have established mandatory targets for the penetration of sustainable biofuel and for reducing the carbon intensity of energy consumed in the transport sector. Article 7a of the FQD sets a target for suppliers of transport fuels to reduce the lifecycle carbon intensity of the fuels they supply by 6% relative to a 2010 baseline29, by 2020. Ireland’s domestic policy (White Paper30, National Mitigation Plan31 and National Policy Framework on alternative fuels32) caters for these Directives, primarily through the BOS and promoting electric vehicles. There are other measures, but they are generally aimed at improving energy efficiency rather than increasing the penetration of renewable energy and low carbon fuels. Meeting the RED and FQD targets in 2020 will be very challenging, particularly because the uptake of electric vehicles has been much lower than predicted. Consequently, it is anticipated that the burden for reaching the 2020 targets will rest primarily on substituting sustainable biofuels for fossil fuels.
29 The fuel baseline standard (FBS) is 94.1 gCO2eq/MJ. 30 Department of Communications, Energy and Natural Resources. The Energy White Paper. Ireland's Transition to a Low Carbon Energy Future, 2015-2030. 2015 31 Department of Communications, Climate Action and Environment. National Mitigation Plan. 2017 32 Department of Transport, Tourism and Sport. National Policy Framework. National Policy Framework Alternative Fuels Infrastructure for Transport in Ireland 2017 to 2030. 2017

Ireland
IEA Bioenergy Task 39 - Implementation Agendas: 2019-2021 Triennium Update 213
9.4. Post-2020
In the post-2020 period, the recast Renewable Energy Directive (RED II) will play a central role with respect to renewable fuels in transport. The Directive, published in December 2018, sets a specific target for the transport sector along with similar sub-targets and constraints already introduced by amendments to the RED. RED II sets a target of 14% for renewable energy in transport by 2030. There are various sub-targets and constraints that are designed to transition the biofuel market away from crop-based biofuels, and from used cooking oil (UCO) and tallow derived biofuels, to advanced biofuels. The 6% carbon intensity target of the FQD will also continue to apply. In addition to RED II, there are national policy objectives, which are generally driven by EU and international agreements such as the Paris Agreement. The Energy White Paper, the National Mitigation Plan, and the National Energy & Climate Plan (NECP) 2021-203033, set out Ireland’s vision for, inter alia, decarbonising the transport system and increasing the incorporation of renewable energy. The NECP includes two ‘with additional measures’ scenarios that incorporate a move to E1034 and B1235 in 2030 – if this was to be achieved, Ireland would exceed the 14% RED II target. In March 2021, the Irish government published the new “Climate Action and Low Carbon Development (Amendment) Bill 2021”. When enacted, the Bill will commit the Irish government to moving to a climate resilient and climate neutral economy by the end of 2050. The Bill is described as “an ambitious piece of legislation”, and commits to moving Ireland to a climate resilient and climate neutral economy by 2050. In its programme, the Irish Government has committed to a 7% average yearly reduction in overall GHG emissions over the next decade, and to net zero emissions by 2050. The 2021 Bill plans to implement various policies to help Ireland reach these goals. This includes a new system of 5-year economy-wide carbon budgets (albeit subject to further government approval), with a ceiling for total greenhouse gas emissions. It hopes to show Irish businesses, farmers and the community in general that climate action can be positive for the economy, i.e., allowing Ireland to reach its climate targets while creating jobs and sustainable growth in new sectors (GOV, 2020). Given that a large fraction of Ireland’s overall GHG emissions comes from its transport sector, if Ireland is to push towards the higher GHG emission reductions envisaged in the Climate Bill, it will necessitate the increased use of renewable energy (biofuels, electricity and other lower carbon intensity fuels) in the transport sector.
9.5. Biofuels policy
9.5.1. Biofuels obligations
To help Ireland meet the renewable energy transport target of the RED, Ireland implemented the Biofuel Obligation Scheme (BOS) which was given effect in law by the Energy (Biofuel Obligation and Miscellaneous Provisions) Act 2010. The Scheme is one aspect of a twin approach to try and meet the EU target for the use of renewable energy in transport. The second was to encourage the accelerated development and usage of electric vehicles, for which Ireland originally had a target of 10% of vehicles by 2020. The BOS places an obligation on the suppliers of mineral oil to ensure that 12.359% (by volume) of the gasoline and diesel placed on the road transport market in Ireland is produced from renewable sources, e.g. bioethanol and biodiesel. The obligation was increased to this level for 2020, having previously been 11.111% (NORA, 2020). The BOS was modified in 2018 and 2019 to incorporate the administration of transport fuel suppliers’ compliance with Article 7a of the FQD, which was transposed into Irish law by Statutory Instrument No. 160 of 2017 (SI 160). Article 7a of the FQD has a broader scope than the RED and includes fuels consumed
33 Department of Environment, Climate and Communications. Ireland’s national Energy and Climate Plan 2021 – 2030. 2020. 34 Gasoline with 10% ethanol by volume. 35 Diesel with 12% biodiesel by volume.

Ireland
IEA Bioenergy Task 39 - Implementation Agendas: 2019-2021 Triennium Update 214
in non-road mobile machinery (e.g. trains, tractors and mobile farm machinery) and inland waterway vessels. Designated fuel suppliers in Ireland, which are typically the same companies that are obligated under Ireland’s BOS, are also required to comply with SI 160 and reduce the carbon intensity of the fuels they supply to transport by 6% by 2020. It is expected that sustainable biofuels will play a significant role in supporting companies meet both the RES-T (10% renewable energy penetration requirement) and the carbon intensity reduction target of SI 160. However, the biofuel obligation, which implements the 10% RES-T of the RED, is not aligned with the 6% carbon intensity target of the FQD, i.e. reaching the 10% renewable energy target does not ensure the 6% carbon intensity target is achieved. In Ireland, reaching the 10% RES-T using sustainable biofuel (and a very small portion of renewable electricity), would give rise to a carbon intensity reduction of between 3% and 3.5% (NORA, 2020). While achieving the 6% target may necessitate additional biofuel being placed on the market in 2020 (statistics tbc at time of writing) and in the early part of the next decade (i.e. more biofuel than required to comply with the RES-T), the penalty contained in SI 160 for not complying with the 6% target is low, so it is not clear if it will be sufficient to incentivise increased biofuel blending. In addition, compliance with SI 160 can also be achieved by using carbon savings generated by electricity supplied to electric road vehicles and upstream emission reductions (UERs) (both additional mechanisms are allowed for in the FQD). The quantity of electricity supplied to electric vehicles is currently very small, because the number of electric vehicles in the Irish fleet is low. UERs are currently an unknown entity and their potential contribution towards the 6% target is undetermined.
9.5.2. Excise duty reductions
Excise duty requirements on transport fuels consumed in Ireland are administered via a mineral oil tax. There are two components of the mineral oil tax: a carbon component and a non-carbon component. The non-carbon component depends on the type of fuel; the carbon component depends on the carbon emissions from the fuel when consumed. Thus, biofuels, which are counted as having zero tailpipe emissions, are not liable for the carbon component of the mineral oil tax. The carbon tax was introduced in Ireland in 2010 and was based on a charge of €10 per tonne of CO2 emitted. It has increased steadily over the years and was increased to €33.50 per tonne in Ireland’s most recent national budget (applied from October 2020). This level of carbon tax equates to a cost of €77.52 per 1,000 litres of gasoline and €89.66 per 1,000 litres of diesel. The non-carbon component applies to both bio- and fossil fuel and is €541.84 per 1,000 litres of gasoline and €425.72 per 1,000 litres of diesel.
9.5.3. Fiscal incentives
Ireland’s aforementioned BOS operates by awarding certificates for biofuel that has been demonstrated to be sustainable. One certificate is awarded for every litre of sustainable biofuel and two certificates are awarded where it can be demonstrated that the biofuel was manufactured from a waste or residue. At the end of the year, each obligated party is required to surrender sufficient BOS certificates to meet its obligation (i.e. 12.359% in 2020). Surplus BOS certificates can be traded between the companies participating in the scheme. A buy-out charge of €0.45 per litre is payable at the year-end if a company does not surrender sufficient certificates (BOC, 2020). As discussed previously, SI 160 contains a requirement to decrease the carbon intensity of transport fuels in Ireland. Carbon savings can be claimed for sustainable biofuel, electricity consumed by road vehicles and by UERs. The quantity of carbon savings generated by biofuels depends on their lifecycle carbon intensity. For example, 1,000 MJ of biodiesel with a carbon intensity of 14 gCO2eq/MJ will generate carbon savings of 80 kg CO2eq (the fuel baseline standard is 94.1 gCO2eq/MJ). Similar to BOS certificates, surplus carbon savings can be traded between the companies participating in the scheme (NORA, 2020). There is no buy-out charge contained in SI 160, but a maximum fine of €250,000 for non-compliance may be applied.
Ireland
IEA Bioenergy Task 39 - Implementation Agendas: 2019-2021 Triennium Update 215
9.6. Market development and policy effectiveness
As shown in Figure 9.3, there has been a relatively consistent growth in the use of liquid biofuels, in particular biodiesel, in the Irish road transport sector. The trajectory matches to a large extent the increasing biofuel obligation. Reductions in the quantities of biofuels placed on the market from year-to-year can be explained by the fact that Ireland’s BOS allows obligated parties to carry forward excess certificates for a period of two years (there is a limit on how many certificates carried forward from previous periods can be used to discharge the obligation). This affords the obligated parties some flexibility in their biofuel blending strategies and to marginally reduce the quantity of biofuel placed on the market while maintaining compliance with the obligation.
Figure 9.3. Growth in biofuels use in transport in Ireland, 2005 to 2018 (Source: SEAI, 2020)
By a considerable margin, biofuel is the dominant source of renewable energy in transport in Ireland. Biodiesel in particular is relied upon because the road transport market is dominated by a diesel fleet, and, to a lesser extent, because Ireland’s fuel suppliers continue to supply E5 to the gasoline fleet and have not moved to supply E10. Reliance on biodiesel has intensified over the years because biodiesel is the most efficient way of meeting the biofuel obligation; this is because the vast majority of the biodiesel placed on the market in Ireland is produced from UCO and Category 1 tallow, which are widely available feedstocks and both generate two certificates per litre. In terms of indigenous biofuel production, the current biodiesel capacity is approximately 60 million litres (c. 47 ktoe); all of it is produced from UCO or tallow. Some bioethanol for the transport market is also produced indigenously, albeit in relatively small quantities (c. 4 ktoe in 2019). All the indigenous bioethanol was produced from whey permeate (a residue from cheese production) (NORA, 2020). In addition to bioethanol and biodiesel, bioLPG (i.e. biopropane) is also supplied to the transport market in Ireland, albeit in relatively small quantities. CNG is also supplied via a small number of retail forecourts and to some captive road transport fleets. It is worth noting that biogas/biomethane has long been identified as having considerable potential to augment the volumes of renewable energy entering the Irish transport system (Murphy et al, 2013, and IEA Bioenergy Task 37, 2018).

Ireland
IEA Bioenergy Task 39 - Implementation Agendas: 2019-2021 Triennium Update 216
Sources
BÓC, 2020. Development of Ireland’s biofuels obligation scheme. http://boc.ie/Case-Studies/Development-of-biofuels-obligation-scheme Citizens Information, 2020. Statutory body supporting the provision of information, advice and advocacy on a broad range of public and social services in Ireland. Carbon Tax page. https://www.citizensinformation.ie/en/money_and_tax/tax/motor_carbon_other_taxes/carbon_tax.html GOV, 2020. Official Irish Government website. https://www.gov.ie/en/publication/984d2-climate-action-and-low-carbon-development-amendment-bill-2020/ IEA Bioenergy, 2018. Ireland Country Report, 09/2018. https://www.ieabioenergy.com/wp-content/uploads/2018/10/CountryReport2018_Ireland_final.pdf IEA Bioenergy, 2018a. Green Gas. Facilitating a future green gas grid through the production of renewable gas. IEA Bioenergy Task 37, 2018:2 https://www.ieabioenergy.com/wp-content/uploads/2018/04/green_gas_web_end.pdf Murphy, J.D., Korres, N.E., Singh, A., Smyth, B., Nizami, A.S. and Thamsiriroj, T. 2013. The Potential for Grass Biomethane as a BiofuelCompressed Biomethane Generated from Grass,Utilised as a Transport Biofuel. Report prepared for the Irish Environmental Protection Agency. https://www.epa.ie/pubs/reports/research/climate/ccrp11-thepotentialforgrassbiomethaneasabiofuel.html NORA, 2020. Irish National Oil Reserves Agency. Biofuels Obligation Scheme. https://www.nora.ie/biofuels-obligation-scheme.141.html SEAI, 2020. Renewable Energy In Ireland, Updated April 2020. https://www.seai.ie/publications/2020-Renewable-Energy-in-Ireland-Report.pdf

Japan
IEA Bioenergy Task 39 - Implementation Agendas: 2019-2021 Triennium Update 217
10. Japan
Yuta Shibahara New Energy and Industrial Technology Development Organization (NEDO)
Summary • Japanese Cabinet has decided to reduce its 2030 GHG emissions by 26% from 2013 levels and strives
to meet energy security and climate mitigation goals.
• The Ministry of Economy, Trade and Industry (METI) formulated a “Green Growth Strategy Through Achieving Carbon Neutrality” in collaboration with related ministries and agencies in 2020. This strategy is an industrial policy to lead the challenging goal of achieving carbon neutrality by 2050
• There is a bioethanol blending mandate of 824 million liters (500 million liters, crude oil equivalent) until at least 2022. Currently, there is no blending mandate for biodiesel in Japan.
• Although the government has mandated the utilization of bioethanol, it left the decision of how to meet the requirement to industry, which has chosen to use bio-ETBE as it has no/minimum impact on fuel distribution infrastructure. As the demand for biodiesel in Japan is very limited, biodiesel plays virtually no role in meeting the biofuels use goal.
• Import of bio-ETBE is encouraged through a zero tariff in place until March 2021.
• Consumption of ethanol is encouraged through a special tax incentive effective until March 2020. Diesel oil delivery tax is not charged for B100 (100% biodiesel) and many local governments are investigating the use of B100 for fueling municipal vehicles such as garbage trucks.
• Biofuels continue to be supported in Japan, but with a focus on next generation technologies based on feedstocks that do not compete with food, and the development of algal-based biofuels.
• The government plans to introduce 10 million liters/year (crude oil equivalent) as the target for introducing next-generation biofuels from 2023 onwards.
• The government maintains several incentive programs to promote the use of biofuels.
• The Government wants to introduce biojet fuel for commercial flights within 2021.

Japan
IEA Bioenergy Task 39 - Implementation Agendas: 2019-2021 Triennium Update 218
10.1. Introduction
Japan is the world's largest liquefied natural gas importer, second-largest coal importer, and third-largest net importer of crude oil and oil products. Japan has limited domestic energy resources that have met less than 9% of the country's total primary energy use since 2012, compared with about 20% before the removal of nuclear power following the Fukushima plant accident. Domestic production of renewable energy has therefore become important, including increased utilisation of wood wastes and increased import of wood pellets for bioenergy production (co-fired with coal). Bioenergy power production is promoted through a feed-in tariff system. Japan has committed to reduce its 2030 GHG emissions by 26% from 2013 levels and strives to meet energy security and climate mitigation goals. Table 10.1 show Japan’s total primary energy supply (TPES) and the contribution of the transport sector within the TPES. The transportation sector has been contributing about 17% to TPES. Table 10.1. Japan’s total primary energy supply (TPES) and the contribution of the transport sector within
the TPES
(PJ) FY2014 FY2015 FY2016 FY2017 FY2018
TPES 18,411 18,105 17,883 18,082 17,851
TFC * 12,433 12,295 12,099 12,251 11,841
Transport 3,056 3,049 3,016 2,991 2,954
Source: Comprehensive Energy Statistics, IEA based table (LHV) https://www.enecho.meti.go.jp/statistics/total_energy/results.html#headline8 *TFC: Total Final Consumption In terms of GHG emissions generation, the transportation sector has also contributing about 16% to the total GHG emissions inventorty in Japan in recent years (see Table 10.2). Table 10.2. Japan’s GHG emissions ineventoy in the period of 2014-2018
(Mt-CO2eq) FY2014 FY2015 FY2016 FY2017 FY2018
Japan total 1,361 1,322 1,305 1,291 1,240
transport 210 209 207 205 203
Source: http://www-gio.nies.go.jp/aboutghg/nir/nir-e.html Japan published its newest Basic Energy Plan for the next five years in 2018. Renewable energies form a key focus based on their potential to foster energy security, climate change mitigation and revitalisation of regional economies. After the Fukushima disaster, all nuclear reactors in Japan were shut down with the result that energy imports increased dramatically. However, some reactors are now restarting. Japan’s current renewable energy policy focuses on generating power from solar, wind, biomass, and geothermal sources, and biofuels are also part of this renewable energy policy. Japan is targeting 22-24% of its generated power to come from renewable sources by 2030. For biofuels, the government plans to maintain its 500 million liters (crude oil equivalent) mandate until at least 2022. Biofuels continue to be supported, but with a focus on next generation technologies based on feedstocks that do not compete with food, and the development of algal-based biofuels. A major reason for focusing research efforts on cellulosic ethanol is the fact that it does not compete with food, as debate continues about how much food prices are affected when food/feed feedstocks are also used for biofuel production. From 2009 to 2013, Japan’s New Energy and Industrial Technology Development Organization (NEDO) focussed on “Development of an Innovative and Comprehensive Production System for Cellulosic Bioethanol” that coupled cultivation of feedstock that does not compete with food resources to a ethanol production process. In 2014, NEDO started the “Demonstration and Development Project of Production System for Cellulosic Bioethanol” in 2014 in order to prove out a comprehensive production process and establish scale-up technology. Consistent with the government’s “Standards for Judgment for Oil Refiners

Japan
IEA Bioenergy Task 39 - Implementation Agendas: 2019-2021 Triennium Update 219
regarding Implementation of Non-Fossil Energy Sources Use”, demonstration and development of production system for cellulosic ethanol, which satisfy 50% reduction in CO2 emissions and fossil energy use, will be carried out to verify suitable combinations of key process technologies (see Figure 10.1). Development of production technologies for BioJet Fuels project is currentry underway from 2017 to 2024. In addition, new technology developments in Japan and abroad will be researched and investigated. Concrete themes are as follows:
• Investigate and study superior technologies developed domestically or internationally
• Determine the best combinations of elemental process technologies and perform feasibility studies
• Develop technologies for integrated production of cellulosic ethanol from woody biomass that meets the Japanese standard for sustainability and conduct feasibility studies
• Develop and evaluate the use of steam explosion pretreatment of pulp for ethanol production
• Develop the biomass to biojet fuel production and research supply chain construction
Large scale demonstrations will be scheduled based on research and investigation results.
10.2. Main drivers for biofuels policy
One of the key drivers for biofuels policy in Japan is environmental benefits, focusing on the reduction of CO2 emissions, Carbon Neutral by 2050 as a countermeasure against global warming. Furthermore, the government has targeted reductions in oil dependency as a means of increasing national energy security. The production and utilization of biofuels can support this goal.
10.3. Biofuels Policy
10.3.1. Biofuels targets
In July 2018, Japan published its Basic Energy Plan, which is reviewed and revised every three to four years. For biofuels, the Basic Energy Plan states that “concerning biofuels, which are mostly imported, Japan will introduce next-generation biofuels based on international trends and technological development progress” According to industry sources, this statement reflects the policy that biofuels should be sourced from non-food crops (e.g., cellulosic ethanol). In 2018, Japan revealed its preliminary biofuel policy for FY2018 to FY2022, and it plans to maintain the 500 million liters mandate. Table 10.3 shows the biofuel blending mandates in Japan since 2011. In addition, the standard for reducing greenhouse gas (GHG) emissions was set to be increased from 50% to 55% of gasoline, and the use of Brazilian sugarcane ethanol, US corn-based ethanol are also permitted. The carbon intensity of gasoline is currently set as 84.11gCO2eq/MJ. Regarding next-generation bioethanol, Japan set the target amount of 10 thousand kl/yr from 2023 to 2027, under the “Sophisticated Methods of Energy Supply Structures Act”. This number will be included in the total target for bioethanol, which will be decided later on. Auction will be conducted for the procurement of bioethanol by the oil refiners.

Japan
IEA Bioenergy Task 39 - Implementation Agendas: 2019-2021 Triennium Update 220
Figure 10.1 Phased plan for introducing biofuels, 2011-2022
Source: METI. http://www.meti.go.jp/meti_lib/report/H28FY/000069.pdf Note: FAS Tokyo created this table based on METI’s information. Table 10.3. Biofuel obligations/mandates (target volumes)
Year Ethanol * Biodiesel
2011 346 ML (210 ML) -
2012 346 ML (210 ML) -
2013 428 ML (260 ML) -
2014 527 ML (320 ML) -
2015 626 ML (380 ML) -
2016 725 ML (440 ML) -
2017 824 ML (500 ML) -
2018 824 ML (500 ML) -
2019 824 ML (500 ML) -
2020 824 ML (500 ML) -
2021 824 ML (500 ML) -
2022 824 ML (500 ML) -
*Ethanol target volumes, the values in parenthesis shows the amount of displaced crude oil Ref: http://www.meti.go.jp/committee/materials2/downloadfiles/g100913aj02.pdf;
http://www.jari.or.jp/portals/0/jhfc/data/report/2005/pdf/result_ref_1.pdf
Bio-ETBE blended gasoline is far more prevalent than E3 gasoline and is widely distributed. In 2012, the Government began to permit sales of E10 and ETBE22 gasoline, and vehicles designed to use these biofuels. However, this change has had little effect on the market as the supply of E3 and E10 remains small compared to that of bio-ETBE gasoline, and the Japanese petroleum industry does not have plans to supply ETBE22 gasoline.

Japan
IEA Bioenergy Task 39 - Implementation Agendas: 2019-2021 Triennium Update 221
Most of the ethanol for fuel is used in ETBE. The distribution channel for ethanol blended gasoline (E3) is limited compared to that of ETBE blended gasoline. Presently, E3 gasoline is available at only six gas stations in Niigata Prefecture, while ETBE blended gasoline is available throughout the nation. The acceptable blend level for biodiesel is 5% (B5), and is applied to cars, busses, and trucks. Of Japan’s 33.6 billion liters of diesel used in 2015, approximately 76% (25.7 billion liters) was for on-road use. Ministry of Economy, Trade and Industry (METI) provides special approvals for operators to use biodiesel at a blend level higher than 5% for trucks and buses. Trade data shows that Japan’s imports of biodiesel in 2016 grew by 19.7% (or 210,000 liters) from the previous year. According to industry sources, this trend may be attributed to increased use by small-scale power plants and large-scale oil-fired power plants. The food-vs-fuel debate is a significant issue in Japan. Japan has a low level of food self-sufficiency – imports comprise the majority of the food it consumes. As a result, Japanese people are highly sensitive to rising food prices, leading some in Japan to question the use of food crops to produce biofuels. Table 10.4 summarises the timline of biofuel policies in Japan since 2008. Table 10.4. Timeline of the development of biofuels policies in Japan
Year Policies
2008 Amendment of the Quality Control of Gasoline and Other Fuels Act (gasoline tax
exemption) Amendment of the Customs Tariff Act (tariff exemption for bioETBE)
2010 Law Concerning the Promotion of Use of Non-fossil Energy Sources and Effective Use
of Fossil Energy Raw Materials by Energy Suppliers
2014 4th Basic Energy Plan
2016 Amendment of the Customs Tariff Act (tariff exemption for bioethanol)
2018 Revision of Notice under the Law Concerning the Promotion of Use of Non-fossil
Energy Sources and Effective Use of Fossil Energy Raw Materials by Energy Suppliers 5th Basic Energy Plan
2019 Roadmap for Carbon Recycling Technologies
2020 Revision of Notice under the Law Concerning the Promotion of Use of Non-fossil
Energy Sources and Effective Use of Fossil Energy Raw Materials by Energy Suppliers
10.3.2. Excise duty reductions
Diesel oil delivery tax (¥32.1/liter) is not charged for B100 (100% biodiesel). Therefore, in many local governments, the use of B100 as fuel is investigated for municipal vehicles such as garbage trucks. Consumption of ethanol is encouraged through a special tax incentive effective until March 2022. If
gasoline contains 3% ethanol (volume basis), the gasoline tax is lowered by ¥1.6/L (= 1.5¢/L, under a
currency exchange rate of US$1 = ¥ 110). The tax for unblended gasoline is ¥53.8/L. 3.1% import tariff
on bio-ETBE and 10% import tariff on bioethanol are amended. Import of bio-ETBE is encouraged through a zero tariff in place until March 2021.
10.3.3. Incentives, subsidies and other measures to promote biofuels
Although a number of ministries collaborate on Japan’s biofuels policy, the two ministries that play major roles in developing and implementing Japanese biofuels policies are the Ministry of Economy, Trade and Industry (METI) and the Ministry of Environment (MOE). MOE is concerned with preventing global warming and meeting Japan’s commitment to reduce its greenhouse gas (GHG) emissions. In May 2016, Japan committed to reduce its GHG emissions to 26% of its 2013 levels by fiscal year (FY) 2030 (April 2030 to March 2031), in Octorber 2020, Japanese Prime Minister presented Carbon Neutrality by 2050 at the first Diet policy speech. METI’s interest in biofuels is as supplemental sources of fuels for Japan, and in

Japan
IEA Bioenergy Task 39 - Implementation Agendas: 2019-2021 Triennium Update 222
analyzing the costs and benefits of shifting to renewable fuels, including impacts on automobiles and infrastructure. METI collaborates with the oil industry to determine how and when to introduce biofuels into the Japanese market. The Ministry of Agriculture, Forestry and Fisheries (MAFF) previously played a leading role in developing and implementing biofuels policies in Japan. MAFF’s interest was focused on the potential to revitalize rural communities through the production of biofuels from domestic resources (e.g., rice for non-food purpose). However, its focus has shifted from biofuels to the production of renewable energies (i.e., heat and power) from wastes generated by the livestock and forestry sectors. The government of Japan maintains the following programs and incentives to promote the use of biofuels:
• In 2008, the “Quality Control of Gasoline and Other Fuels Act” was amended to lower the gasoline tax (¥53.8/liter) by ¥1.6 per liter (about $0.02/liter) if the fuel contains 3% ethanol. This incentive is effective until March 2022.
• In 2008, the “Customs Tariff Act” and the “Temporary Measures Concerning Customs Act” were amended to eliminate the 3.1% import tariff on bio-ETBE. Moreover, in 2016, these acts were further amended to eliminate the 10% import tariff on bio-ethanol for the production of bio-ETBE. As with the gasoline tax, the Customs Tariff Act must be renewed annually and is currently approved through March 2021.
• In 2008, MAFF proposed and the Diet (Japanese Parliament) passed the “Law Concerning the Promotion of Biomass Resources as Raw Materials for Biofuels.” This law provides tax breaks and financial assistance to newly built biofuels production facilities that MAFF determines qualified for benefits. Although initially available only to ethanol producers, benefits now have been extended to producers of alternative forms of bio-energy (such as biodiesel, wood pellets, methane gas, or hydrogen gas). Under the scheme, newly built biofuel facilities that are approved for the program by 2018 will have their fixed property tax reduced by half for three years. The legislation authorizes MAFF to extend the repayment period of interest-free loans in two-year increments for a maximum of 12 years. MAFF records show that 21 projects have been qualified for the benefits since the program began in 2008, though some have since ceased operations.
Figure 10.2 shows the timeline of NEDO’s biomass energy and fuel projects in the period of 2007-2020.
Figure 10.2. The timline of NEDO’s biomass energy and fuels projecet in the period of 2007-2020.

Japan
IEA Bioenergy Task 39 - Implementation Agendas: 2019-2021 Triennium Update 223
10.3.4. Other measures stimulating the implementation of biofuels
Under the “Basic Law for Promoting Biomass Utilization” enacted in 2009, MAFF had a target to establish biofuel manufacturing technology and provided tax breaks and financial assistance to biofuel producers and farmers producing feedstock.
10.4. Promotion of advanced biofuels
In order to promote advanced biofuels, Japan has decided that next-generation bioethanol and ethanol derived from waste materials will be doubled within the amount introduced under the“Sophisticated Methods of Energy Supply Structures Act”. In other words, advanced bioethanol is counted twice for meeting the blending mandate. From 2023 to 2027, special mandate for advanced bioethanol (10 million liters) will be introduced as mentioned in the next Act notification introduction The government has decided to introduce 10,000 kl from 2023 to 2027 as the target amount. Japanese private companies and Japan’s scientific community, including universities and public and private research institutions, continue substantial basic and applied research related to biofuels. A major focus of research projects is on cellulosic and algal feedstocks and conversion technologies to produce biofuels at commercial scale in a sustainable way. Several joint research projects aim to produce commercial-scale biojet fuel from algae, with the goal of commercializing these fuels by 2030. Table 10.5 lists some of the industry-led advanced biofuels projects active in Japan. To utilize domestic biomass feedstock at its maximum potential, not only cellulosic biomass but also food waste will be investigated as feedstocks not competing with food.

Japan
IEA Bioenergy Task 39 - Implementation Agendas: 2019-2021 Triennium Update 224
Table 10.5. Partial list of company-led advanced biofuel projects in Japan
Company City Startup Raw Material Technology Output Capacity
DINS Sakai Sakai, Osaka
Jan 2007
woody biomass (construction wastes) (since Sep 2012, adding of sugar solution such as abolished juice)
saccharification with diluted sulphuric acid and fermentation using recombinant E. Coli, KO11
1.4 ML/year
Oji/JXTG
(NEDO) Hiroshima
Oct 2016 Pilot plant
woody biomass
simultaneous saccharification and cofermentation
100 kL/year
Biomaterial in Tokyo
(NEDO)
Kawasaki, Kanagawa
Apr 2016 Pilot plant
cellulosic waste
simultaneous saccharification and cofermentation
100 kL/year
GEI (BioJet) Kisarazu, Chiba
Oct 2018 isobutanol (old clothes)
ATJ Unpublished
Euglena (NEDO/BioJet
)
Yokohama, Kanagawa
Nov 2018 (NEDO Project 2020-2021)
waste oil & algae CHJ (catalytic hydrothermolysis jet)
125 KL/year
Mitsubishi Power/JERA/TEC
(NEDO/BioJe
t)
Nagoya, Aichi End in Nov.2020
Jun 2020 (NEDO Project 2017-2021)
woody biomass Gasification - FT 2.4 KL
IHI
(NEDO/BioJe
t)
Yokohama Kanagawa End in Dec.2020
(NEDO Project 2017-2021)
algae HC-HEFA SPK 0.1 KL
Ref.: http://www.dinsgr.co.jp/dins_sakai/business/baio_business/index.html; http://www.nedo.go.jp/content/100862614.pdf As shown in Table 10.6, it is projected that the gasoline demand will decrease in 2021 compared to 2006 because of EV shift and structural reasons such as population reduction. However, demand for fuels to supply larger vehicles and airplanes that rely on high energy density fuels is expected to remain steady. In the medium- and longer-term, the possible introduction of biojet and biodiesel fuels is likely to be further investigated to better assess or estimate needed policy(ies), biomass resource supply and investment.

Japan
IEA Bioenergy Task 39 - Implementation Agendas: 2019-2021 Triennium Update 225
Table 10.6. Change in the fuels in Japan, 2006-2021 (ML)
Fuel 2006 2021 (estimated) Decrease rate
Gasoline 60,550 47,050 -22%
Jet Fuel 5,390 5,340 -1%
Diesel 36,610 33,360 -9%
Source: Statistics of Agency for Natural Resource and Energy, Petroleum products demand and supply calculation 2017-2021 The Government wants to introduce biojet fuel for commercial flights within 2021. In 2015, the Ministry of Land, Infrastructure, Transport and Tourism (MLIT) and METI jointly established a “Committee for the Introduction of Biojet Fuel for Olympic and Paralympic Games Tokyo 2020,”(which have been postponed). The committee is conducting research into the biojet fuel supply chain and investigating fuel production. For this national project, NEDO has completed R&D of the pilot plant for the production of new-generation BioJet Fuel at the gasification FT synthesis technology (ASTM D7566 Annex 1) using wood cellulose as a raw material. A brand new generation technology (ASTM D7566 Annex 7) that uses microalgae as a raw material, was evaluated and verified (FY2017-FY2021). In 2021, both fuels met ASTM standards after mixing with fossil fuels and completed biojet fuel production. NEDO Project is working to expand the production volume by deploying the basic plan of "Bio Jet Fuel Production Technology Development Project" during FY2017-FY2024. NEDO is promoting the basic plan of "BioJet Fuel Production Technology Development Project" in FY2017-FY2024, and is working to expand those production volume. In addition, a venture company in Tokyo, which is also a member of the BioJet Fuel Committee, constructed the demonstration plant in Yokohama in 2018 to produce and commercialize bio-fuel. The fuel is made from Euglena algae that grow on Ishigaki Island in Okinawa and waste cooking oil (UCO) around Yokohama. This plant is operational in the summer of 2019 with an annual bio-fuel production capacity target of 125,000 liters. Biojet fuels can be used to meet the bioethanol mandate under the Law Concerning the Promotion of Use of Non-fossil Energy Sources and Effective Use of Fossil Energy Raw Materials by Energy Suppliers.
10.5. Market development and policy effectiveness
Japan’s total fuel ethanol consumption in 2018 was 823 million liters, including both the pure ethanol equivalent of ETBE consumed plus a small amount of ethanol consumed in direct blending in gasoline. This translates to an effective national average blend rate of 1.7%; Japan’s estimated gasoline consumption in 2018 was 50.8 billion liters. The government mandated the utilization of biofuels, leaving the decision of how to meet the requirement to industry, which is using bio-ETBE (leaving biodiesel out of the picture). Japan’s number of conventional ethanol plants and their combined production capacity, which was as high as 6 plants with 35 million liters annual capacity, has diminished. Today, Japan has one plant that annually produces approximately 0.2 million liters of ethanol for fuel use from domestic rice. This plant is located in Niigata Prefecture and is operated by JA Zen-noh, the federation of agricultural cooperatives. It uses high yield rice grown specifically for biofuel production. The ethanol is used as part of an E3 blend, and the E3 gasoline is sold at six affiliated gas stations around Niigata Prefecture. In 2010, Japan Biofuels Supply LLP started to produce ETBE domestically. In 2019, the union produces 143 million liters of ETBE, using 61 million liters of ethanol. Previously, mostly imported ethanol with some domestically produced ethanol added were used to make ETBE, but following the closure of two ethanol plants in Hokkaido in 2014, the company became fully reliant on imported ethanol. In 2019, Japan imported 823 million liters of ethanol for transportation, consisting of 817 million liters of ethanol imported as ETBE and 61 million liters of ethanol to be used for domestic ETBE production. Due to sustainability requirements, all imported ethanol used in domestic ETBE production has come from Brazil, and all imported ETBE from the United States, made using Brazilian ethanol. The government of

Japan
IEA Bioenergy Task 39 - Implementation Agendas: 2019-2021 Triennium Update 226
Japan is assessing alternative sources for fuel ethanol, and U.S. corn ethanol is designated as eligible under Japan’s sustainability policy (see Policy and Programs section for more information on Japan’s requirement to reduce GHG emission by at least 55%). Following the recent policy change in the sustainability criteria by the Japanese Government, the country received its first shipment of ethyl tert-butyl ether (ETBE) made from US corn-based ethanol in July 2019. Japan will allow US ethanol to meet up to 44% of a total estimated annual demand of 824 million liters of ethanol used in the production of ETBE, which equates to around 363 million liters of ethanol. The use of ETBE is expected to increase further, as the Petroleum Association of Japan (PAJ) aims to start supplying 1.94 billion liters of ETBE annually by 2017. Accordingly, the PAJ continues to supply the same amount of ETBE from 2018 to 2022. All results up to 2019 have been successfully achieved. The PAJ expects to import most of its supply (annually 1.8 billion liters of the 1.94 billion liters of ETBE) from the United States. There are no import tariffs on ETBE derived from biomass or on ethanol used to make ETBE and this measure has been extended. Japan does not export either ETBE or ethanol. Japan’s biodiesel market is extremely limited, meeting just 0.04% of national on-road transportation demand for diesel fuel, and there is no renewable diesel market. 13 million liters of biodiesel was produced in 2019 based on National Biodiesel Fuel Utilization Council (NBUC) data. Compared to Europe and the United States, Japan uses extremely little diesel fuel, thus the demand for biodiesel fuel and technology development has not been sufficient so far. In the other hand, there is a strong desire to develop new technologies based on the premise of next-generation raw materials, and the development of technologies for microalgae biofuel production and biojet fuel production is progressing. In addition, the pathway to carbon neutrality in 2050 is being built. The most common feedstock for biodiesel production in Japan is used cooking oil (UCO). It is reported that the annual supply of UCO is about 450,000 MT, from which about 410 million liters of biodiesel (or renewable diesel) could be produced. Some 18,000 MT of UCO is currently used to produce biodiesel. In the past, there were 116 projects being administered by municipal governments and regional non-profit organizations across Japan that took part in small-scale biodiesel projects through the “Rapeseed Project.” The projects involved growing rapeseed to produce cooking oil, collecting the used oil, and recycling it as biodiesel to fuel regional garbage and cargo trucks. There is another project by the City of Kyoto to collect UCO from restaurants and individual households. The oil is processed into biodiesel at the city’s refinery, which produces approximately 5,000 liters per day or annually 1.3 million liters of biodiesel fuel that is used in the city’s garbage trucks (B100) and municipal buses (B20). Furthermore, in Kyoto, there is also a private company (REVO International Kyoto) producing UCO-based biodiesel. This firm started from a citizen’s group whose activities included collecting UCO for the purpose of environmental protection. To date, the firm has established its own network to collect feedstock from individual households, restaurants, and any public or private organization nationwide. Its refinery in Kyoto can produce 11 million liters of biodiesel annually. According to the company, it is the largest capacity biodiesel refinery in Japan. Since 2011, the company has been exporting biodiesel fuel to the Netherlands. Biodiesel has no role in meeting the government target to introduce 500 million liters of biofuels (crude oil equivalent) in the market, even though there is considerable unrealized potential since Japan is the 4th largest diesel market following the EU, United States and Brazil. The Japanese oil industry selected bio-ETBE and ethanol to meet the renewable fuel target because this solution requires no significant oil industry investment in new delivery infrastructure. That said, renewable diesel (hydrogenated vegetable oil is one type which is produced on a commercial scale in Europe, Singapore and the United States) is fully substitutable with fossil diesel and thus requires no new investments in infrastructure. UCO is the only abundant feedstock locally available and few large-scale collection systems exist to exploit this resource in a cost effective manner. In 2019, Japan exported 8.9 million liters of biodiesel primarily to the European Union and Switzerland, a 30 percent increase from 2018 (USDA GAIN, 2020).

Japan
IEA Bioenergy Task 39 - Implementation Agendas: 2019-2021 Triennium Update 227
According to an industry source, consumption of biodiesel in the transportation sector is not expected to increase beyond small changes because distribution channels are not established and fuel standards limit blending due to concern that the fuel blended at higher rates may damage engines. Since 2011, a private company in Kyoto has been exporting biodiesel to the Netherlands (see Production section above). Exports have risen over the years but remain very limited, reaching 5.5 million liters in 2016 and forecasted to total 6 million liters in 2017 and 2018. While Japan’s imports of biodiesel have increased in recent years, they remain limited. According to some industry sources, biodiesel may be imported for generating power at oil-fired power plants. In 2016, Japan imported 1.27 million liters of biodiesel, 98% from Malaysia (see Table 10.7); there is no import tariff on biodiesel from Malaysia under a bilateral economic partnership agreement. Table 10.7. Key suppliers of biodiesel to Japan (ML) (The World Trade Atlas)
Supplier 2012 2013 2014 2015 2016 2017 2018 2019
World 0.08 0.49 0.61 1.06 1.27 1.29 1.34 0.88
Malaysia - 0.42 0.44 1.02 1.24 1.20 1.31 0.84
Philippines - - - - 0.2 0.03 0.03 0.03
United Kingdom - - - - 0.01
Germany 0.03 0.03 0.04 0.04 0.01
The Bioethanol Division of a private company in Sakai City, Osaka Prefecture, operates recycling facilities to process waste products and materials, and began producing ethanol from wood and cellulosic lumber waste in 2007. Its annual ethanol production capacity is 1.4 million liters. For the first several years, the company supplied its ethanol to a couple of oil distributors making E3 gasoline to sell at the distributors’ affiliated gas stations. However, because E3 gasoline did not come into wide use, there is little demand for the company’s fuel ethanol. The company is currently using most of the ethanol it produces to generate power for its facility, and it sells the rest to an industrial alcohol distributor. Biofuels production capacity and market share trends since 2006 for are shown in Table 10.8, and transport fuel consumption trends are shown in Table 10.9. Table 10.8. Biofuel production– installed production capacity (ML/year)
Year FAME Biodiesel
Ethanol Cellulosic ethanol
Biogas as transportation fuel
Renewable diesel (from lipids)
2006 - - 0 - -
2007 - - 1.4* - -
2008 - - 1.4 - -
2009 - - 1.4 - -
2010 - 31.75 1.4 - -
2011 - 31.75 1.4 - -
2012 - 32.75 1.4 - -
2013 - 32.75 1.4 - -
2014 - 32.75 1.4 - -
2015 - 32.75 1.4 - -
2016 - 2.0 1.4 - -
2017 - 2.0 1.6 - -
2018 2.0 1.6
2019 2.0 1.6
* http://www.env.go.jp/press/7859.html (Commercial plant started at Sakai in January 2007)

Japan
IEA Bioenergy Task 39 - Implementation Agendas: 2019-2021 Triennium Update 228
Table 10.9. Summary of transport fuel consumption (ML)
Year Gasoline Diesel fuels
Aviation fuel
Biodiesel* Ethanol** Market share (%) of biofuels ***
2010 54,603 27,798 3,729 9 361 0.7
2011 54,189 26,705 3,652 9 351 0.6
2012 54,808 26,256 3,863 8 358 0.7
2013 54,060 26,027 4,095 10 418 0.8
2014 52,076 26,040 4,112 16 504 1.0
2015 51,888 26,017 4,078 17 622 1.2
2016 51,534 25,779 4,119 15 741 1.4
2017 50,910 25,802 4,192 15 816 1.6
2018 49,718 25,928 4,244 14 827 1.7
*Based on survey replies; it could be 20-25 ML/year **Based on 1G bioethanol *** Market share of biofuels in total transport fuel consumption. Bioethanol in Gasoline (Biodiesel in Diesel: <0.1%) Ref: http://www.mlit.go.jp/k-toukei/22/annual/22a0excel.html; http://www.mlit.go.jp/k-toukei/cgi-bin/search.cgi Comprehensive Energy Statistics, https://www.enecho.meti.go.jp/statistics/total_energy/results.html#headline2 Table 10.10 shows the import volumes of bioethanol and biodiesel in Japan in the period of 2010-2018. Table 10.10. Import volumes of bioethanol and biodiesel in Japan in the period of 2010-2018 (ML)
Year Bioethanol Biodiesel
2010 340 0
2011 325 0
2012 332 0.1
2013 398 0.5
2014 486 0.6
2015 620 1.4
2016 741 1.2
2017 816 1.4
2018 827 0.9
Source: Comprehensive Energy Statistics https://www.enecho.meti.go.jp/statistics/total_energy/results.html#headline2
10.6. Co-processing at oil refineires
As shown in Figure 10.3, there are 22 oil refineries in Japan with a total refining capacity of 3,518,800 barrels/day. No co-processing trials have been yet conducted in Japanese oil refineries.

Japan
IEA Bioenergy Task 39 - Implementation Agendas: 2019-2021 Triennium Update 229
Figure 10.3. Oil refineries and the refinering capacity in Japan
Sources
The Strategic Energy Plan of Japan, METI (Ministry of Economy, Trade and Industry): https://www.enecho.meti.go.jp/en/category/others/basic_plan/5th/pdf/strategic_energy_plan.pdf https://www.meti.go.jp/english/press/2020/1225_001.html https://www.meti.go.jp/press/2019/06/20190607002/20190607002-2.pdf NEDO (New Energy and Industrial Technology Development Organization): http://www.nedo.go.jp/activities/introduction8_01_03.html https://www.nedo.go.jp/activities/ZZJP_100127.html https://www.youtube.com/watch?v=MdcK7tRNf-8&list=TLPQMjkwNjIwMjBcA-88XdUM6A&index=1 https://www.youtube.com/watch?v=MdcK7tRNf-8 USDA (2017) Japan Biofuels Annual. GAIN Report Number JA7100. The Strategic Energy Plan of Japan: http://www.enecho.meti.go.jp/en/category/others/basic_plan/pdf/4th_strategic_energy_plan.pdf Japan’s National Energy Strategy;(2006) http://eneken.ieej.or.jp/en/data/pdf/350.pdf https://eneken.ieej.or.jp/en/ “Standards for Judgment for Oil Refiners regarding Implementation of Non-Fossil Energy Sources Use”: http://www.nedo.go.jp/content/100862614.pdf Ethanol (ETBE, E3, E10): http://www.jbsl.jp/biogasoline/; http://www.env.go.jp/earth/ondanka/biofuel/okinawabio/bio_hokokusyo.pdf

Japan
IEA Bioenergy Task 39 - Implementation Agendas: 2019-2021 Triennium Update 230
Biodiesel (B5, B100) http://www.svctokyo.co.jp/japanese/bio/1diesel.html B100 (pure diesel) and ETBE for gasoline tax-exempted. http://www.tax.metro.tokyo.jp/shitsumon/tozei/index_n.html http://www.maff.go.jp/j/aid/zeisei/bio/pdf/250401_23.pdf http://www.nedo.go.jp/content/100776053.pdf http://v4.eir-parts.net/v4Contents/View.aspx?cat=tdnet&sid=1199361 https://www.nikkei.com/article/DGXLASDZ28HZ6_Y5A520C1TJC000/ Registered biodiesel production facilities: http://www2.jarus.or.jp/biomassdb/instinfolist03.html JST/ALCA (Japan Science & Technology Agency/Advanced Low Carbon Technology Research and Development Program) under MEXT (Ministry of Education, Culture, Sports, Science and Technology) http://www.jst.go.jp/alca/kadai/bnk_07.html MAFF (Ministry of Agriculture, Forestry and Fisheries) http://www.maff.go.jp/j/shokusan/bio/nenryoho/ MOE (Ministry of the Environment) http://www.env.go.jp/earth/ondanka/biofuel/index.html JST/ALCA (Japan Science & Technology Agency/Advanced Low Carbon Technology Research and Development Program) under MEXT (Ministry of Education, Culture, Sports, Science and Technology), Advanced Ethanol Production with Acetic Acid Fermentation from Lignocellulosics http://www.jst.go.jp/alca/kadai/prj_07.html#h22_02 Oil refineries in Japan https://www.paj.gr.jp/english/statis/data/08/paj-8%E7%B2%BE%E8%A3%BD%E8%83%BD%E5%8A%9B%E4%B8%80%E8%A6%A7E202006.pdf Japan receives first shipment of ETBE from US corn-based ethanol https://biofuels-news.com/news/japan-receives-first-shipment-of-etbe-from-us-corn-based-ethanol/ Comprehensive Energy Statistics https://www.enecho.meti.go.jp/statistics/total_energy/results.html#headline2 NEDO BioJet PR video https://www.youtube.com/watch?v=MdcK7tRNf-8 (Full version) https://www.youtube.com/watch?v=j-uMdIEJSs4 (Trailer version - Reverse production)

Netherlands
IEA Bioenergy Task 39 - Implementation Agendas: 2019-2021 Triennium Update 231
11. Netherlands
K.W. Kwant, T. Gerlagh, T.P. Sinnige Netherlands Enterprice Agency
Summary • There is 16.4% biofuels mandate (both ethanol and biodiesel) mainly for road transport in energy
content in 2020.
• The Dutch regulation includes a sub-target for the use of advanced biofuels at 1.0% level in 2020 (including double counting).
• National implementation of the RED2 will be effective from 2022, the current regulation will be extended for 2021 with a mandate level of 17.5% and a sub-target for advanced bioduels of 0.6%.
• There are production facilities for bioethanol, biodiesel, HVO and biomethanol in the Netherlands.
• There is not a separate market-based mechanism aiming to reduce CO2 emissions in transport, such as carbon tax and emissions trading (cap-and-trade) in the Netherlands.
• An mandate for SAF in aviation is in preparation, until then an opt-in system for aviation biofuels can be used to generate tradable units, as a contribution to the mandate for road transport
• No financial incentives (e.g. subsidies, credits, incentives) are provided for biofuel uptake. The blending of biofuels is encouraged with the quota obligation for fuel suppliers.

Netherlands
IEA Bioenergy Task 39 - Implementation Agendas: 2019-2021 Triennium Update 232
11.1. Introduction
The total energy supply (TES) of the Netherlands in 2019 amounted to 2984 petajoule (PJ). It is still for
around 90% dominated by fossil fuels, particularly gas and oil, which represent 45% (1342 PJ) and 36%
(1077 PJ) of total energy supply respectively. Coal represents around 9% of TES (269 PJ). Renewable
energy sources have a share of 7.3% or 217 PJ. Around 70% of renewable energy supply in 2019 came from
biomass (149 PJ), followed by wind energy (41 PJ) and solar energy (20 PJ) (see Figure 11.1).
Overall TES slightly declined in the past decade. Natural gas is the main source of energy – its consumption was fairly stable between 1400 and 1500 PJ up to 2011, which was around 45% of TES. After that there was a temporary decline to 1200 PJ in 2015. However, in recent years natural gas use increased again up to 1340 PJ in 2019. Oil products have been relatively stable around 1100-1200 EJ in the past decade, representing around 37% of TES. An important share of oil products (~360 PJ) are consumed for non-energy use. Coal used to be quite stable around 350 PJ up to 2013 (10% of TES). With the building of new coal power plants it increased to a level of 460 PJ (15% of TES) in 2015. Meanwhile the use of coal has started to decline, to a level of 270 PJ (9% of TES) in 2019. Nuclear energy only had a modest role in the Netherlands around 1.5% of TES (40 PJ), which has been quite stable in the past decades.
Figure 11.1. Total energy supply36 and the contribution of different energy sources in The Netherlands,
with distribution in 2019 (Source: IEA (2021) World Energy Balances and Renewables Information)
36 Total energy supply refers to the use of resources. In terms of the role in the energy system this distribution
overestimates the role of resources producing electricity with a high share of unused waste heat (like nuclear
plants).

Netherlands
IEA Bioenergy Task 39 - Implementation Agendas: 2019-2021 Triennium Update 233
Figure 11.2 shows the development of total energy supply from bioenergy in The Netherlands over the period of 2000- 2019. The share of renewable energy continuously increased from 2005, albeit at fairly modest levels. Since 2017 there is a clear acceleration of renewable energy, mainly in bioenergy, wind and solar energy. The share of renewable energy is expected to continue to grow in coming years. The European Renewable Energy Directive (RED) targets are 14% renewable energy overall and 10% share of renewable energy in final consumption of energy in transport by 2020. The two biggest sources of bioenergy in the Netherlands are solid biomass (65 PJ or 44% of bioenergy supply) and renewable municipal waste (39 PJ or 26%). 20% of bioenergy comes from liquid biofuels (30 PJ) and 10% from biogas (15 PJ).
Figure 11.2: Development of total energy supply from bioenergy in The Netherlands 2000 – 2019
(Source: IEA (2021) World Energy Balances and Renewables Information)
Energy policies in the Netherlands focus on developing a mix of resources that will assure reliable, affordable supply while recognizing the need to reduce reliance on carbon-intensive resources. There are two recent developments that can have major impact on the energy policy: the decision to reduce the extraction of natural gas out of the Groningen field (the main source of natural gas in recent decennia) and the targets of the Rutte II administration to reduce greenhouse gas emissions 49% by 2030. In June 2019, this was implemented in the Dutch Climate Agreement between the government and stakeholders, as a follow up of the earlier National Energy Agreement (September 2013). The government supports deployment of renewables, energy efficiency, nuclear power, and relies on biomass co-firing and carbon capture and sequestration (CCS) to curb carbon emissions from coal and gas-fired generators. The Dutch government has in place a number of policies and programs to support decarbonization. The Renewable Energy Directives obliges member states of the EU to produce a certain amount of renewable energy.The Netherlands is implementing the EU-RED by gradually raising its share of energy from renewable sources such as biofuels, biogas, and electricity for road transport. The 10% target of renewable energy in the final consumption of energy in transport is to contribute 36 PJ to final renewable energy use in 2020. Implementation of the EU-RED recast (RED2) with tightened targets towards 2030 is currently in preparation.
11.2. Main drivers for biofuels policy
The main driver for biofuel consumption in the Netherlands is the national annual mandate for renewable energy in transport (Jaarverplichting Energie Vervoer). The mandate is designed to cover the obligatory

Netherlands
IEA Bioenergy Task 39 - Implementation Agendas: 2019-2021 Triennium Update 234
share of renewable energy in transport as defined in the European Renewable Energy Directive (RED), the mandatory percentage of GHG reduction as defined in the European Fuel Quality Directive (FQD) and the National Energy Agreement for 2023. A revision of the national mandate by 2021 will implement the RED2, continue the FQD mandate and implement the policy for reducing greenhouse gas emissions from transport as part of the Dutch Climate Agreement.
11.3. Biofuels policy
The biofuel policy in the Netherlands is closely linked to European policy and the Paris agreement. The Ministry of Infrastructure and Water Management (IenW) is responsible for biofuels policy. Since 2007, a quota obligation for fuel suppliers was introduced, which became later part of implementation of the RED (2009/28/EC). For this directive, it provides a contribution to an overall target for renewable energy and the specific target for 10% renewable energy in transport in 2020. The implementation of the original RED and the Fuel Quality Directive (2009/30/EC) was completed in 2011. In the same year, the Dutch Emissions Authority (NEa) was appointed as the authority in charge of monitoring compliance with national legislation. In 2015, the RED was changed, partly because of the discussion on the land use change impact of biofuels. Renewable Energy Directive (2009/28) and Fuel Quality Directive (2009/30) (both revised in iLUC directive (2015/1513)) implemented in Besluit energie vervoer 2015 (and under revision as part of implementation the iLUC directive). The revised RED (ILUC Directive) from 2015 includes a cap on crop-based fuels (7%) and a sub-target for advanced biofuels (0.5%). This is implemented in “Besluit energie vervoer”, published June 2018. Through the Annual Obligation 37 fuel suppliers are obliged to achieve a minimum blending level or else
face financial sanctions for non-compliance. The obligation mirrors the EU wide scheme, allowing
“double-counting” for biofuels based on wastes and residues and other non-food cellulosic and hemi-
cellulosic feedstocks as specified in Annex IX of the RED. There are also limits on the proportion that can
come from “food and feed crop-based biofuels” and from feedstocks listed in Annex IX Part B (principally
used cooking oil), and a mandatory level for” advanced biofuels”. The levels of the obligation are being
set through to 2030, providing market certainty.
In the coalition agreement (November 2017) of the Rutte II administration, new targets were set for emission reduction in 2030 (49%). Implementation of this agreement will be the basis of new regulation, which will enter into force in 2022. As the revised national mandate will come into force in 2022, the current mandate is extended to 2021 with a proposed increased target of 17.5%. In 2019, the Climate Agreement was signed by a number of parties and lays down the future transition to a sustainable electricity from solar, wind, smart grids and storage of energy (e.g. in H2). It is expected that wind and solar can grow a 10-fold (wind from the 1 GW in 2020 to 10 – 14 GW in 2030). This requires an improved infrastructure and flexibility. Innovation is crucial to realise this. By 2030 the coal fired power plants will be closed and biomass for power will also fade out. A sustainability framework for high value use of biobased raw materials was developed in 2019 – 2020 and agreed upon with the Parliament in 2020, and lays down a preference for cascading use of bioresources: First for chemicals and materials, Secondly for (transport) fuels, heavy road, aviation, shipping and it is recommended to reduce the use of biomass for heating and power. The sustainability governance of biofuels in the Netherlands is based on the comprehensive EU RED (2) framework. This defines a series of sustainability and GHG emission criteria that transport biofuels must meet in order be counted towards targets and to be eligible for financial support by public authorities. In particular RED II reinforces the measures aimed at reducing ILUC effects.
37 Annual obligation | Obligations - Energy for Transport | Dutch Emissions Authority

Netherlands
IEA Bioenergy Task 39 - Implementation Agendas: 2019-2021 Triennium Update 235
EU
NL
Figure 11.3. Timeline of biofuels policy development in the Netherlands
The industrie sectors in the Netherlands made the largest staps to GHG emission reduction in the last decades, followed by electricity production and mobility. Agriculture and housing made a more moderate progress to reduction.
Figure 11.4. Changes in the GHG emissions in different sectors over the period of 1990-2020 and 2030
target
In the last decade, the CO2 emissions of road traffic declined with some 75 Ktonnes CO2 eq. Mainly due to the growing share of renewables and more recent by electric vehicels. Main part of the emissions is still the result of passenger cars.
2010 Renewable Energy Directive in force
2015 ILUC directive in force
(revision RED + FQD GHG reduction report)
2018 Second Renewable
Energy Directive (RED2) into force
2011 Blending mandate
Biotickets
2015 Annual energy
mandate in transport (HBE)
2018 1th revision of the
Annual energy mandate in transport
(HBE)
2019 Dutch Climate
Agreement

Netherlands
IEA Bioenergy Task 39 - Implementation Agendas: 2019-2021 Triennium Update 236
Source: Statline, Statistics Netherlands Figure 11.5. Air emissions from on Dutch territory from road traffic
Order in Council for the Dutch annual energy mandate Besluit energie vervoer (in Dutch):http://wetten.overheid.nl/BWBR0040922/2018-07-01 The paragraph on climate and energy in the coalition aggreement (in Dutch): https://www.rijksoverheid.nl/regering/regeerakkoord-vertrouwen-in-de-toekomst/3.-nederland-wordt-duurzaam/3.1-klimaat-en-energie A summary of the intended post 2020 policy on renewbale fuels in the Netherlands are:
• 2030 blending biofuels mandate in road (60 PJ) and inland shipping (5 PJ) leading to a fysical contribution of 65 PJ
• Focused on energy targets RED2 and Tank-to-Wheels (WTW) CO2 emissions contributing to the Paris agreement
• Politic claim all growth in advanced biofuels
• Sustainability demands beyond RED according to Biofeedstock approach gouvermnment
• Temporary opt-in on aviation and advanced marine fuels until 2025, in anticipation to a separate targets on Aviation (14% by 2030). A separate target on marine fuels after 2025 will be investigated.
• Looking at more instruments to support investments in advanced biofuel production
11.3.1. Biofuels obligations
Mandatory targets to blend at least 3.5% biofuels in both the petrol and diesel segment of the transport fuel market were removed by the legislation that came into force in 2015. This legislation sets an annual energy obligation (“Jaarverplichting Hernieuwbare Energie Vervoer”) in transport fuels that requires fuel suppliers to ensure a minimum level of renewable energy (on energy basis) used in transport fuels. In 2015, fuel suppliers were obliged to blend fossil fuels with at least 6.25% biofuels in energy content ascending to 16.4% in 2020 and 17.5% in an extention of this policy until 2021. A fuel suppler that fails to fulfill the quota obligation is liable to pay a penalty. The enforcement of the annual obligation has a legal basis. Next to this pump owners are obliged to supply E10 since October 2019. Currently a 5% cap for first generation biofuels and a 0.5% subtarget for advanced biofuels (both 2020 targets) are implemented as part of implementing the EU iLUC directive. Emissions of biofuels are also taken into account based on the European Fuel Quality Directive (2009/30/EC) that requires well to wheel emission reduction (WTW) of 6% in 2020 compared to 2005. For transport in the Netherlands, there are no market-based mechanisms for reducing CO2-emissions in transport such as a carbon tax or emissions trading (cap-and-trade). The NL Climate Agreement sets the intention to additionally reduce emissions in

Netherlands
IEA Bioenergy Task 39 - Implementation Agendas: 2019-2021 Triennium Update 237
transport, compared to the 2030 projection of the National Energy Exploration 2017. The Climate Agreement demands a limit to the first generation biofuels from food and feed crops on the level of 2020 in the revision of the annual obligation. In addition, the Agreement aims to maximise the share of biofuels in road transport. This will be effectuated in the revision of the annual energy mandate for 2022. A summary of the Climate Agreement related to the transportation include:
• 49% CO2 reduction by 2030 (Paris agreement)
• Multistakeholder proces including Urban environment, Mobility, Industry, Agriculture and land use, and Electricity
• Mobility, additional CO2-reduction (Electrification (2 milions EV); Biofuels 27 PJ (2,0 Mton CO2) plus; and various efficiency measures
• 27 PJ from biofuels is additional to the estimated 33 PJ from the EU obligation (2,5 Mton CO2).
• 5 PJ additional biofuels in inland shipping (0,4 Mton CO2)
• € 200 milions subsidy to stimulate the production of advanced biofuels in the Netherlands
• Transport levy contributes to CO2 reduction measures taken by transport companies
• Separate appointments on aviation and shipping outside the 27 PJ (not part of Paris Agreement)
• Integral sustainability requirements on biofeedstock Since 2011, fuels from wastes/residues and lignocellulosic materials count double in the Netherlands. As part of implementing the EU ILUC directive (2015/1513/EC), a specific sub-target stimulates advanced fuels. In the Netherlands, double counting remains part of the regulation up to 2021 and probably beyond. In RED, sustainability criteria for biofuels are defined in article 17, mass balance and governance demands in article 18, and advanced fuels in Annex IX A. In the RED2 the sustainability criteria as well as requirements concerning the governance are laid down in Articles 29 and 30. In the Netherlands, fuel suppliers that sell fuels to the aviation and marine industry have no obligation to supply a certain percentage of biofuel. However, these sectors can contribute voluntarily (opt-in system) to the realisation of the target in the annual obligation for road transport by generating tradable renewable energy units (HBEs). This opt-in is under discussion for the new national mandate because the CO2 reductions achieved in the aviation and maritime sectors do not contribute to the national obligation resulting from the Paris agreement. The minister of IenW has announced the intention to set up a dedicated obligation for the aviation sector preferably EU wide, bud if nessesary on a national basis. In 2018, 3 types of tradable units were introduced, HBE-C (conventional), HBE-A (advanced) and HBE-O (others), to facilitate meeting the sub-target for advanced biofuels and limiting conventional biofuels. In the coming national madate, an extra HBE unit will be introduced to regulate the cap resulting from the RED2 for Annex IX-B biofuels, i.e. used cooking oil and animal fats (HBE-B). Table 11.1 provides information on current obligations for biofuels in the Netherlands. Obliged parties are oil companies that bring petrol and diesel from excise warehouses into the Dutch fuel market. All biofuels that are proven to be sustainable and fuels or energy demonstratable from renewable sources are eligible to meet the obligation. Sustainability can be proven by using one of the EU accepted voluntary schemes (see link to European Commission website). For this obligation, biofuels produced from wastes/residues as well as non-food cellulosic and hemicellulosic materials count double. A list of materials counting double is part of RED Annex IX (A and B). The category “industrial waste” is specified with a specific Dutch list of materials. Verification of double counted material is obliged. A protocol for verifying double counting of eligible biofuels is made available by the government. Companies wishing to enter a claim for a biofuel to be eligible for double-counting must have a double-counting declaration for this biofuel. This declaration proves that the double counting has been confirmed by an authorized independent verifier to meet legal conditions.

Netherlands
IEA Bioenergy Task 39 - Implementation Agendas: 2019-2021 Triennium Update 238
Table 11.1. Biofuel obligations/mandates (% by energy content)
Year Total % renewable energy in the transport
market, obligation to market parties
Subtarget
advanced biofuels (Annex IX A)
Limit
conventional
Target Achieved
2010 4% Unknown
2011 4.25% 4.31%
2012 4.5% 4.54%
2013 5% 5.05%
2014 5.5% 5.54%
2015 6.25% 6.25%
2016 7% 7.0%
2017 7.75% 7.75%
2018 8.5% 8.9% 0.3% 3.0%
2019 12.5% 12.7% 0.4% 4.0%
2020 16.4% 16.5% 0.5% 5.0%
2021 17.5% 0.6% 5.0%
From January 2015, administration of obligations has been through an automated digital register managed by NEa. Companies in non-compliance with their obligation are subject to a financial penalty according to the act on economic crimes. Companies that supply renewable energy to the Dutch transport sector can claim the delivered renewable energy in their account in the Energy for Transport Registry (REV), and receive Renewable Energy Units (HBEs) in return. Renewable energy encompasses liquid biofuels, gaseous biofuels, renewable liquid fuels and electricity. Eligibility conditions apply to both the claiming operators and the renewable energy to be claimed. In addition, obligated companies can comply with their mandated greenhouse gas intensity reductions by purchasing HBEs. The legislation sets a maximum to the administrative transfer of biofuels supplied in a previous year, with the objective of selling HBEs to others for the purpose of using them to meet their obligation in a subsequent year ("carry-over"). This restriction does not apply to physical biofuel stocks. Physical and administrative biofuel stocks transferred to a subsequent year must still comply with sustainability requirements in force in that year. To demonstrate the sustainability of biofuels, companies must use one of the voluntary schemes (for instance ISCC or Better Biomass) that has been recognised by the European Commission.
11.3.2. Excise duty reductions
No financial incentives (e.g., subsidies or credits) are provided for biofuel uptake. The blending of biofuels is encouraged within the quota obligation for fuel suppliers. The Climate Agreement includes the intention to support the production of advanced biofuels for the Dutch market. This is currently work in progress.

Netherlands
IEA Bioenergy Task 39 - Implementation Agendas: 2019-2021 Triennium Update 239
11.3.3. Fiscal incentives
No financial incentives (e.g., subsidies or credits) are provided for biofuel uptake. The blending of biofuels is encouraged within the quota obligation for fuel suppliers. The Climate Agreement includes the intention to support the production of advanced biofuels for the Dutch market. This is currently work in progress.
11.3.4. Investment subsidies
The Energy Investment Deduction scheme (EIA), the Environmental Investment Deduction scheme (MIA) and the Random Depreciation Environmental Investment scheme (VAMIL) all provide tax incentives for investment in renewable energy projects. These schemes support various renewable energy technologies, including biomass processing equipment, pyrolysis installations for recycling of residues, production facilities for algae, etc.
11.3.5. Other measures stimulating the implementation of biofuels
Since 2017, the Demonstration Scheme for Climate Technologies and Innovations in Transport (DKTI Transport) has provided subsidies for: 1) technology and innovation development at pre-commercial phase; 2) reduction of CO2, NOx, fine dust emissions and noise; and 3) transport of alternative fuels, including accelerated roll-out or use of infrastructure for alternative fuels. Both the MIA and VAMIL schemes are applicable to natural gas cars, hydrogen cars, fully electric and plug-in hybrid cars. Cars with diesel engines are excluded from MIA and VAMIL.
11.4. Promotion of advanced biofuels
The Dutch regulation includes a sub-target for the use of advanced biofuels at 0.6% level in 2021. For implementing RED2, an increase of advanced biofuels up to 1.75% (3.5% with double counting) is needed. The Dutch Climate Aggreement aims for an additional 2 MT CO2 reduction in 2030 on top of the reductions achieved by the RED2 mandate, mainly to be achieved with advanced and renewable fuels of non-biological origin. The new national mandate will propose a sub-target for advanced biofuels that reflects that ambition.
11.5. Market development and policy effectiveness
Table 11.2 shows the list of biofuel production facilities in the Netherlands. There are two ethanol plants in the Netherlands. First is the Alco Energy plant of 384 kton (484.6 million liters) annual capacity. The second plant is operated by Cargill and has an annual capacity of 32 kton (40.4 million liters). The five biodiesel plants in the Nethelands are operational with a total annual capacity of 773 kton (878 million liters) (see Table 11.2).

Netherlands
IEA Bioenergy Task 39 - Implementation Agendas: 2019-2021 Triennium Update 240
Table 11.2. Biofuel production– installed production capacity (KT/year)
Name of company Status Technology Production capacity (KT or Mm3/year)
Alco Energy operational Ethanol 380 kton
Biorefinery Development Expected 2022 Lignocellulosis based ethanol 75 kton
Cargill operational Ethanol from residual starch 32 kton
Biondoil Expected 2023 Lignocellulosis based ethanol 80 kton
BioMCN Oprational Methanol from biomethane 440 Mm3
Enerkem Expected 2021 Methanol from MSW 220 Mm3
Sunoil Biodiesel Operational FAME biodiesel 208 kton
Argent Energy Group Operational FAME biodiesel 110 kton
Biopetrol Operational FAME biodiesel 400 kton
Eco-Fuels Operational FAME biodiesel 50 kton
Ecoson Operational FAME biodiesel 5 kton
Ecopark Operational Pure plant oil 32 kton
Neste Operational HVO 1,000 kton
Attero Operational Biomethane from MSW 28 Mm3
DSL-01 Expected 2022 HEFA (SAF) 75 kton
There is also one renewable diesel (HVO) plant operated by Neste with an annual capacity around 1 Mton (1.2 billion liters) and one BioMCN plant producing 440 kton biomethanol. Next to digesters that account for 6 Mm3/y, biomethane is also produced in plants operated by Attero (28 Mm3/y). New plants for cellulosic ethanol (155 KT) and methanol produced from municipal waste (220 KT) are expected in the coming years, but are not yet in place. Table 11.3 lists the historical installed production capacities of biofuels plants in the Netherlands.

Netherlands
IEA Bioenergy Task 39 - Implementation Agendas: 2019-2021 Triennium Update 241
Table 11.3. Biofuel production– installed production capacity (ML/year)
Year Biodiesel/Renewbale Diesel
(FAME/HVO) Ethanol
(conventional) Cellulosic ethanol*** Biogas as transport
fuel (Mm3) **
2006 18 11 - -
2007 85 10 - -
2008 83 7 - -
2009 274 0 - -
2010 382 - - -
2011 491 - - 9
2012 1,177 - - 12
2013 1,375 414 - 11
2014 1,720 - - 6
2015 1,629 420 * - 5
2016 1,462 420 * - 5
2017 1,932 420 * - 5
2018 1,932 420 * - 33
2019 2,078 420 * - 33
2020 2,078 420 * - 33
* RVO, market data, no official statistics ** Amount of biogas used for the transport obligation. The feed-in of sustainable biogas into the grid and delivery of gas from the grid to transport are proven *** unknown Table 11.4 shows the steady increase in biofuels consumption for transport since 2006. The share of transportation biofuels in the total transport fuel consumption has increased from 4.8% in 2011 to 7.9% in 2019.

Netherlands
IEA Bioenergy Task 39 - Implementation Agendas: 2019-2021 Triennium Update 242
Table 11.4. Summary of transport fuel consumption (ML/year)
Year Gasoline Diesel fuels
Aviation fuel
Biodiesel Ethanol CNG (Mm3) Market
share of biofuels (%)
2006 5,793 9,252 - 22 28 2
2007 5,811 9,350 - 271 132 3
2008 5,797 9,420 - 287 163 4
2009 5,793 8,813 - 328 213 8
2010 5,789 8,830 - 109 208 12
2011 5,882 8,929 - 220 231 23 4,8
2012 5,610 8,658 - 273 193 31 4.9
2013 5,464 8,055 - 274 194 35 5,1
2014 5,318 7,550 - 322 199 45 6,2
2015 5,408 7,551 - 251 220 48 5,3
2016 5,540 7,463 - 182 187 48 4,7
2017 5,680 7,500 - 260 267 5,7
2018 5,726 7,518 - 508 214 24 5,5
2019 5,786 7,573 - 701 361 24 7,9
* Ethanol and biodiesel are the amounts blended into normal gasoline and diesel and are also included in the gasoline and diesel fuel amounts in this table. ** Market share is the percentage renewable energy in transport as calculated according to the renewable energy directive, including double counting and use of electricity for transport. An increasing portion of the biofuels on the Dutch transport market is produced from waste streams; in 2020 the share of these feedstocks amounted to 81%, with used cooking oil accounting for a share of 55%. It is attractive to use waste based biofuels because their energy content may be counted twice to achieving the targets. The other 19% of biofuels are produced from agricultural crops, mainly corn and wheat. The feedstocks of the biofuels that were used in the Netherlands in 2020 originate from 85 different countries. 15 countries account for almost 83% of the total feedstock volume. This top 15 consists mainly of countries from Europe and Asia. Less than 7% of the biofuels used in Dutch transport are produced from feedstocks that originate in the country itself.
11.6. Co-processing in refineries
As a delta region, the Netherlands is an excellent location to receive, process and transport oil products to the the European mainland. With 6 refineries, mainly located in the Rotterdam area, a total capacity of 63.5 Mt / year Netherlands has a share of almost 10% in the European market. Co-processing in refineries does not take place in the Netherlands yet.
11.7. Conclusions
The Netherlands was one of the first European countries to implement the annual obligation and the double counting policy on fuels form wastes and residues and are very succesfull wit that raching a share of share of 89% of biofuels from used cooking oil (UCO) and animal fats. The share of renewables that

Netherlands
IEA Bioenergy Task 39 - Implementation Agendas: 2019-2021 Triennium Update 243
could be reported to the European Commission in 2019 was 12,5% of the total use of gasoline, diesel and renewable electricity in transport in the Netherlands, and exceeded the obligatory share of 10% by 2020. Strenghts of the Dutch approach are the national trading system that supports the market in an efficent uptake of the obligation, ambitious goals set in a national Climate Agreement and the announcement of a sepererate obligation on aviation fuels. High ambitions on a fast growing share of biofuels from wastes and residues with a consitant share of UCO and animal fats. As points, al low limit on the share of feedstock from food and feed crops and the influence of (perhaps large volumes) of marine fuels on prices are pints of attention that need to befaced.
Sources
Dutch Climate agreement: https://www.klimaatakkoord.nl/ IEA Bioenergy, country report Netherlands 2018. https://www.ieabioenergy.com/wp- content/uploads/2018/10/CountryReport2018_Netherlands_final.pdf A platform for sustainable biofuels in the Netherlands: http://platformduurzamebiobrandstoffen.nl/ Website EC with background of EU policy : https://ec.europa.eu/energy/en/topics/renewable-energy/biofuels/ Background policy in the Netherlands: https://www.rijksoverheid.nl/onderwerpen/milieuvriendelijke-brandstoffen-voor-vervoer/biobrandstoffen Subsidie DKTI-transport: https://www.rvo.nl/subsidies-regelingen/DKTI-Transport statistics on energy, fuels and biofuels: http://statline.cbs.nl/statweb/ Reports regarding the obligation results: https://www.emissieautoriteit.nl/onderwerpen/rapportages-ev-2018/documenten/publicatie/2020/06/29/rapportage-energie-voor-vervoer-in-nederland-2019 Biofuel policies in the Netherlands http://saee.gov.ua/sites/default/files/Kvant_0.pdf Netherlands- Energy System Overview https://www.iea.org/media/countries/Netherlands.pdf Netherlands- Energy https://www.export.gov/article?id=Netherlands-Energy
▪ Tax law, article 72a on biofuels (“Wet op de accijns m.b.t. biobrandstoffen, art. 72a) ▪ Policy letter on biofuels of Government to parliament - March 2006. ▪ www.biofuel-cities.eu ▪ National Renewable Energy Action Plan – The Netherlands:
http://ec.europa.eu/energy/renewables/transparency_platform/doc/national_renewable_energy_action_plan_Netherlands_en.zip
▪ GAVE website: https://www.rvo.nl/onderwerpen/duurzaam-ondernemen/duurzame-energie-opwekken/bio-energie/biobrandstof-voor-vervoer
▪ https://www.emissionsauthority.nl/topics/themes/energy-for-transport (website of the Dutch Emissions Authority (NEa) in English) https://www.emissionsauthority.nl/topics/themes/energy-for-transport
New Zealand
IEA Bioenergy Task 39 - Implementation Agendas: 2019-2021 Triennium Update 244
12. New Zealand
Paul Bennett, Scion Research
Summary • The government aims to reduce national GHG emissions to net zero by 2050. It plans to implement
new Zero Carbon legislation to meet the 2050 goal.
• Work is also underway to define best options to meet Paris GHG reduction targets such as buying international credits, emissions reductions and forest plantations.
• An emissions trading scheme (ETS) is the country’s key tool for reducing carbon emissions. It is based on tradable units and includes most sectors of the economy, including transport.
• There is currently no mandate for biofuel use or for any type of biofuel volume obligations.
• Ethanol, including imported ethanol, is exempt from excise duty (NZD 0.595/liter vs retail petrol price of NZD 2.3/liter). This exemption does not apply to biodiesel or other biofuels.
• A biodiesel grants scheme ran from July 2009 to June 2012. This was designed to support the growth of a biodiesel manufacturing industry by providing a grant of up to 42.5 cents per litre for biodiesel production, subject to certain conditions. This scheme resulted in a steady increase in domestic biodiesel production, however since the scheme ended in June 2012 biodiesel production has plummeted.
• There are no specific policies promoting advanced biofuels deployment.
• There are no investment subsidies supporting biofuel deployment.

New Zealand
IEA Bioenergy Task 39 - Implementation Agendas: 2019-2021 Triennium Update 245
12.1. Introduction
New Zealand is a geographically-isolated country with a long skinny geography, a land area of 268,000 km2, and a comparatively small population (4.8 M). It has a temperate climate, with an export-focussed economy which is highly dependent on agriculture, particularly dairy products, meat, forestry and horticulture. Per-capita use of transport fuels is also relatively high due to the country’s low population density and the nature of the economy. Almost all New Zealand’s liquid fuel needs are met by imported fossil oil (7.9 Mt in 2019), mainly for use in the country’s transport sector. These liquid fuels are imported mainly as crude oil for refining at New Zealand’s only oil refinery (~60%), and as finished fuel products (~40%). Domestic crude oil production currently accounts for around 20% of domestic demand; however, almost all domestic production is exported as it is light and sweet, whereas the refinery is configured to process sour crude. As shown in Figure 12.1, almost the entire energy use of the transport sector is fullfiled by fossil fuels.
Figure 12.1. New Zealnd energy consumption (MBIE, 2014)
New Zealand has committed to reduce its GHG emissions by 30% below 2005 levels by 2030 and also has a further longer-term target to reduce emissions. In 2019, the Climate Change Response (Zero Carbon) Amendment Act set into law a new domestic 2050 target:
• net zero emissions of all greenhouse gases other than biogenic methane by 2050
• 24 to 47% reduction below 2017 biogenic methane emissions by 2050, including 10% reduction below 2017 biogenic methane emissions by 2030.
The Act also will:
• establish a system of emissions budgets to act as stepping stones towards the long-term target
• require the Government to develop and implement policies for climate change adaptation and mitigation
• establish a new, independent Climate Change Commission to provide expert advice and monitoring to help keep successive governments on track to meeting long-term goals.
GHG emissions from liquid fuel consumption, driven by transport, accounted for over 47% of energy sector emissions in 2017, or around 19.1% of total gross emissions. New Zealand’s total gross greenhouse gas emissions in 2018 were 78.9 Mt CO2-e, predominantly made up from 31.9 Mt CO2-e from the energy sector and 7.7 Mt CO2-e from the Agricultural sector (largely as methane emissions).

New Zealand
IEA Bioenergy Task 39 - Implementation Agendas: 2019-2021 Triennium Update 246
Liquid fuel emissions have almost doubled between 1990 and 2018, to 15.1 Mt CO2-e and have been largely responsible for the rise in New Zealand’s energy sector emissions. Reducing emissions from liquid fossil fuel use, particularly for transport, represent one of the few options to significantly reduce the country’s emissions, as the country already has a high proportion of renewable electricity (85% in 2019), a growing population and almost half the country’s emissions come from agriculture where ways to significantly reduce emissions without reducing production are challenging. New Zealand’s emissions trading scheme (ETS) is considered to be the country’s key tool for reducing carbon emissions. It is based on tradable units and includes most sectors of the economy, including transport. However, agriculture, which is responsible for 49% of New Zealand’s GHG emissions, currently remains outside the scheme. Carbon emissions from international aviation and shipping are also outside the scope of New Zealand’s ETS.
12.2. Main drivers for biofuels policy
While all the main drivers for global growth of biofuels- environmental benefits, rural economic development and security of fuel supply- exist in New Zealand, to date only limited encouragement has been given to large-scale deployment and use of biofuels, with biofuels still making up less than 0.1% of the country’s liquid fuel use. The New Zealand Energy Strategy 2011-2021 sets the strategic direction for the energy sector and the role energy will play in the New Zealand economy. This strategy has been developing renewable energy resources, as one of its two key focus areas, and biomass is recognised as a resource having considerable potential. However, the current government, which came into power in October 2017, sees taking decisive action on climate change as one of its priorities, and has initiated a comprehensive re-look at how New Zealand can transition to a low-carbon economy. This include introducing Zero Carbon legislation to provide a long-term and stable policy environment, with a clear emissions reduction target and a strategy to reach this target, as well as required changes to the ETS and other policies. A programme of work is underway to develop the actions and make the necessary legislative changes, which may influence future policy around biofuels. Scion’s recent New Zealand Biofuels Roadmap study illustrates what large-scale production and use of biofuels in New Zealand could look like and identifies key issues, decisions and actions needed for large scale biofuel deployment.
12.3. Biofuels policy
The ETS zero-rates the biofuel component of any transport fuel, so should provide an incentive for biofuel production if the carbon prices are sufficiently high. However, the impact on consumers to date has been comparatively modest, up to about 3.1 cents per litre for petrol and 3.3 cents per litre for diesel; well within the normal range of variation in fuel prices seen at the pump as a result of fluctuations in oil price and exchange rates. Fuel quality standards allow retail sale of blends of ethanol in fossil petrol of 10% and up to 7% blends of biodiesel in fossil diesel, although higher blends can be sold as long as there is a commercial contract or agreement in place with the customer. Carbon emissions from international aviation (~76% of the aviation fuel offtake in New Zealand) and international use of marine fuels are not currently covered by the ETS, so this policy provides no incentive for biofuel substitution into these sectors.
12.4. Biofuels obligations
There is currently (Sept 2018) no mandate on biofuel use or any biofuel volume obligations.

New Zealand
IEA Bioenergy Task 39 - Implementation Agendas: 2019-2021 Triennium Update 247
A Biofuel bill, enacted in September 2008, introduced a mandated Biofuel Sales Obligation from October 2008. This required all oil companies to include liquid biofuels as a fixed percentage of their total sales. Under the obligation, liquid biofuels were to have made up 0.5% of oil companies' sales in 2008, with obligation levels rising by 0.5% increments to 2.5% in 2012. However, as a result of a change in government, the Biofuel Sales Obligation and associated regulations were repealed in December 2008, and since then there have been no biofuel blending targets or mandates.
12.4.1. Excise duty reductions
Ethanol (including imported ethanol) is exempt from excise duty (NZD 0.595/L vs current retail petrol price of NZD 2.3/ L). This exemption does not apply to biodiesel or other biofuels. Biofuels are zero-rated under the ETS.
12.4.2. Fiscal incentives
A biodiesel grants scheme ran from July 2009 to June 2012. This was designed to support the growth of a biodiesel manufacturing industry within New Zealand by providing a grant of up to 42.5 cents per litre for biodiesel production, subject to certain conditions. This did lead to a steady increase in biodiesel production in New Zealand, however since the scheme ended in June 2012, due a change in Government, domestic biodiesel production has plummeted.
12.4.3. Investment subsidies
There are currently no investment subsidies supporting biofuel deployment.
12.4.4. Other measures stimulating the implementation of biofuels
In spite of a limited amount of government support, a number of potential end-users remain interested in using biofuels. These include Air New Zealand, the national airline, and New Zealand Rail, the operator of the main ferry service between the two islands. While not a policy measure, such end-user interest may well stimulate biofuel production and use within New Zealand.
12.5. Promotion of advanced biofuels
There are currently no specific policies promoting advanced biofuels deployment. However, other Government funding mechanisms (e.g., Primary Growth Partnerships) can be used to support biofuel research and development (R&D) if other criteria for that fund are satisfied. For example, the Ministry of Primary Industries previously has provided substantial financial support for an industry partnership to investigate the commercial feasibility of producing liquid biofuels from forestry residues. The government, via its Ministry of Business Innovation and Technology, supports a number of Crown Research Institutes, particularly Scion and NIWA, to undertake R&D projects aimed at the production of advanced biofuels. The Universities of Auckland and Canterbury also have or have had research programmes in this area. LanzaTech, a NZ startup company, previously received over $10 M in government grants to fund process development and scale-up of their proprietary process to ferment CO-rich industrial waste gases into ethanol and other products. The company has subsequently re-located to the US.
12.6. Market development and policy effectiveness
The bulk of the ethanol produced in New Zealand is produced at 3 plants, all owned by Anchor Ethanol Ltd, by fermentation of whey, a by-product of cheese making. DB Breweries and Gull (an independent fuel distributor) have entered into a partnership to produce small volumes of ethanol from a by-product of beer production.

New Zealand
IEA Bioenergy Task 39 - Implementation Agendas: 2019-2021 Triennium Update 248
Domestic biodiesel production was 0.5 million litres in 2018. The largest current domestic producer of biodiesel is Green Fuels, which produces biodiesel from recycled vegetable oil. In November 2018, New Zealand’s first commercial scale biofuels plant, built by energy retailer Z Energy, began supplying high quality biodiesel to commercial customers. The plant, named Te Kora Hou has produced high-quality biodiesel that meets European, New Zealand and Z Energy’s own stringent specifications. Z produced over two million litres B100 biodiesel over the last financial year. Running at peak production, the plan could safely produce at a run rate of over 7 million litres of biodiesel per annum. Z Energy has recently announced that it will temporarily hibernate the manufacturing capability of the plant until the economics of production improve, but will continue to use the plant as an import terminal to meet customer biodiesel demand. Table 12.1 summarizes domestic biofuel production since 2007. Table 12.1. Biofuel production (ML/year)
http://www.mfe.govt.nz/climate-change/what-government-doing/climate-change-programme https://www.scionresearch.com/science/bioenergy/nz-biofuels-roadmap Ministry of Business, Innovation and Employment (2017) Duties, taxes and levies on motor fuels in New Zealand http://www.mbie.govt.nz/info-services/sectors-industries/energy/liquid-fuel-market/duties-taxes-and-direct-levies-on-motor-fuels-in-new-zealand Ministry of Business, Innovation and Employment (2017) 2016/17 updates to New Zealand’s engine fuel specifications http://www.mbie.govt.nz/info-services/sectors-industries/energy/liquid-fuel-market/engine-fuel-quality/2016-17%20updates Norske Skog, Z Energy (2014) Norske Skog Tasman/Z Energy stump to pump project. These are all domestic production figures. 2017 data is not yet available. Some ethanol is also imported. Some biogas is produced (2.7 – 3.3 PJ/yr), but very little of this is used for road transport. Table 12.2 summarizes domestic fuel consumption for transport since 2007. Total transportation fuel consumption 7.3 billion litres. Biofuels contribute to about 0.06% of total transportation fuels in New Zealand with bioethanol produced from Whey and Biodiesel produced from UCO and Tallow.
Year Biodiesel (FAME)
Ethanol (conventional)
Cellulosic ethanol
Biogas as transportation fuel
Renewable diesel (from lipids)
2007 1.20 0.30 - - -
2008 1.20 0.11 - - -
2009 1.15 3.70 - - -
2010 1.61 3.10 - - -
2011 2.35 4.81 - - -
2012 1.27 5.67 - - -
2013 0.24 4.97 - - -
2014 0.90 3.25 - - -
2015 0.56 2.87 - - -
2016 0.47 4.84 - - -
2017 0.46 3.64 - - -
2018 0.45 5.25 - - -

New Zealand
IEA Bioenergy Task 39 - Implementation Agendas: 2019-2021 Triennium Update 249
Table 12.2. Transport Fuel consumption (ML/year)
Year Gasoline Diesel
fuels
Aviation
fuel
Biodiesel Ethanol Market share of
biofuels (%)
2006 3,206 2,799 478 - - -
2007 3,266 2,883 394 - - -
2008 3,198 2,855 425 - - -
2009 3,145 2,724 404 - - -
2010 3,146 2,762 396 - - -
2011 3,126 2,876 378 - - -
2012 3,029 2,910 322 - - -
2013 3,032 3,027 335 - - -
2014 3,033 3,135 335 - - -
2015 3,123 3,185 335 - - -
2016 3,195 3,297 368 - - -
2017 3,286 3,506 393 - - -
2018 3,218 3,615 425 - - -
2019 3,219 3,685 402 - - -
http://www.mfe.govt.nz/climate-change/what-government-doing/climate-change-programme https://www.scionresearch.com/science/bioenergy/nz-biofuels-roadmap Ministry of Business, Innovation and Employment (2017) Duties, taxes and levies on motor fuels in New Zealand http://www.mbie.govt.nz/info-services/sectors-industries/energy/liquid-fuel-market/duties-taxes-and-direct-levies-on-motor-fuels-in-new-zealand Ministry of Business, Innovation and Employment (2017) 2016/17 updates to New Zealand’s engine fuel specifications http://www.mbie.govt.nz/info-services/sectors-industries/energy/liquid-fuel-market/engine-fuel-quality/2016-17%20updates Norske Skog, Z Energy (2014) Norske Skog Tasman/Z Energy stump to pump project. It should be emphasized that the numbers in Table 12.2 are for total domestic transport use only. Most (79%) aviation fuel is used for international travel, with a total aviation fuel offtake in 2019 of 1,924 million litres. Consumption of biofuels is not monitored in New Zealand, but is likely to total <0.1% of total transport fuels.
12.7. Conclusions
Due to a lack of policy support biofuels production in New Zealand has been very limited. More recent Government initiatives, such as setting up the Climate Change Commission, Ministry of Transports focus on Green Freight, and the Ministry for Primary Industries focussing on the use of forest harvesting waste has refocussed attention onto biofuels. Biofuels are again being evaluated as a potential part of the energy solution in New Zealand’s future.
Sources
Ministry of Business, Innovation and Employment (2019) Energy in New Zealand 2019. https://www.mbie.govt.nz/building-and-energy/energy-and-natural-resources/energy-statistics-and-modelling/energy-publications-and-technical-papers/energy-in-new-zealand/
Ministry for the Environment (2019) About New Zealand's Climate Change Response (Zero Carbon) Amendment Act https://www.mfe.govt.nz/climate-change/zero-carbon-amendment-act

New Zealand
IEA Bioenergy Task 39 - Implementation Agendas: 2019-2021 Triennium Update 250
Ministry for the Environment (2020) New Zealands Greenhouse Gas Inventory 1990-2018. https://www.mfe.govt.nz/publications/climate-change/new-zealands-greenhouse-gas-inventory-1990-2018
https://www.mfe.govt.nz/publications/climate-change/new-zealands-greenhouse-gas-inventory-1990-2017
Ministry of Business, Innovation and Employment (2017) New Zealand Energy Sector Greenhouse Gas Emissions 2015 Calendar Year Edition. http://www.mbie.govt.nz/info-services/sectors-industries/energy/energy-data-modelling/publications/energy-greenhouse-gas-emissions/documents-image-library/NZ%20Energy%20Greenhouse%20Gas%20Emissions.pdf
Ministry for the Environment (2017) About the New Zealand Emissions Trading Scheme http://www.mfe.govt.nz/climate-change/reducing-greenhouse-gas-emissions/about-nz-emissions-trading-scheme
Ministry of Business, Innovation and Employment (2011) NZ Energy Strategy 2011-2021 http://www.mbie.govt.nz/info-services/sectors-industries/energy/documents-image-library/nz-energy-strategy-lr.pdf
Ministry of Business, Innovation and Employment (2017) Unlocking our energy productivity and renewable energy potential. NZ Energy Efficiency and Conservation Strategy 2017-2022 http://www.mbie.govt.nz/info-services/sectors-industries/energy/documents-image-library/NZEECS-2017-2022.pdf
http://www.mfe.govt.nz/climate-change/what-government-doing/climate-change-programme
https://www.scionresearch.com/science/bioenergy/nz-biofuels-roadmap Ministry of Business, Innovation and Employment (2017) Duties, taxes and levies on motor fuels in New Zealand http://www.mbie.govt.nz/info-services/sectors-industries/energy/liquid-fuel-market/duties-taxes-and-direct-levies-on-motor-fuels-in-new-zealand
Ministry of Business, Innovation and Employment (2017) 2016/17 updates to New Zealand’s engine fuel specifications http://www.mbie.govt.nz/info-services/sectors-industries/energy/liquid-fuel-market/engine-fuel-quality/2016-17%20updates
Norske Skog, Z Energy (2014) Norske Skog Tasman/Z Energy stump to pump project. Final report http://www.mpi.govt.nz/document-vault/4975
IEA (2017) Energy policies of IEA countries. New Zealand 2017 Review https://www.iea.org/publications/freepublications/publication/EnergyPoliciesofIEACountriesNewZealand2017.pdf
Energy Efficiency and Conservation Authority www.eeca.govt.nz/ Bioenergy Association of New Zealand https://www.bioenergy.org.nz/

Norway
IEA Bioenergy Task 39 - Implementation Agendas: 2019-2021 Triennium Update 251
13. Norway
Odd Jarle Skjelhaugen and Svein Jarle Horn, Norwegian University of Life Sciences; Mats Nordum,
Norwegian Environment Agency; Einar Gotaas, Drivkraft Norge; Duncan Akporiaye, SINTEF Industry
Summary • Norway is a large fossil fuel (oil and gas) producer and exporter. Also, hydropower production is large.
Bioenergy for heating and transportation makes 8% of the national energy supply.
• Driven by its national climate policy, Norway introduced biofuels blend-in mandates for road transport in 2009. The blend-in rates started low and increased year by year. The blending mandate for biodiesel is 24.5% in 2021 and aims for 40% in 2030. The blending obligation for bioethanol in gasoline has been 4% since 2017.
• Mandatory blend-in of 0.5% biofuel in jet fuel started in 2018 (first worldwide).
• The voluntary biofuel consumption above the blending mandate for road transportation was about 4% of total fuel consumption in 2019.
• The National Climate Plan 2021-2030, approved by the Norwegian Parliament April 14th 2021, prolongs the blend-in mandate as the primary tool for biofuels until 2030. The mandate will be expanded to include the construction industry and shipping.
• Norwegian domestic production of biofuels is low and constitutes about 1% of the consumption.
• The suppliers of biofuels in road transportation have one incentive: no carbon tax.
• There is a growing commercial interest for utilizing forest residues as feedstock for biofuels. Two plants are in progress for pilot stage.
• The sustainability of biofuels has to be documented. When using Norwegian forest biomass as feedstock, at least 30 % of the residues must be left in the forest.
• There are public grants available for developing biofuel supply chains and production plants.
• Norway currently has 40 operating biogas plants for processing municipal, food and industrial organic waste. Of these, 10 plants produce biogas for transportation.
• The worlds’ largest liquefied biogas plant, Biokraft, is located in Norway and is processing fish farming and paper mill waste.
• Oslo, European Environmental Capital in 2019 and a driving force in cutting GHG emissions, operates 3 large biogas plants.

Norway
IEA Bioenergy Task 39 - Implementation Agendas: 2019-2021 Triennium Update 252
13.1. Introduction
Norway is a large fossil fuel producer and exporter. The country is also a relatively large producer of renewable electricity (mainly hydro but in recent years also some wind-power). Biomass in Norway is mainly used for heating. Table 13.1 shows the primary energy supply in Norway in 2019. Table 13.1. Norwegian primary energy supply in 2019 (TWh) (Source: Statistics Norway (SSB), 2019)(Ref:
SSB, 2019)
Coal Gas Oil El (Hydro) Bio * Waste * Total
Production 1 1,174 946 132 13 5 2271
Import 9 - 105 12 6 - 132
Export 1 1,111 957 12 1 - 2082
Bunker - - 15 - - - 15
Net national energy supply
9 63 96 132 18 5 323**
*Mostly heat **Thereof energy for onshore transportation is 51 TWh Norway’s CO2 emissions have risen since 1990. However, emissions of other greenhouse gases have declined, and total GHG emissions have been relatively stable. Figures from Statistics Norway show that Norway’s greenhouse gas emissions totaled 50.3 million tonnes CO2 equivalents in 2019 (see Figure 13.1). About 31% of the national GHG emissions originated from transport. The primary emission sources in Norway are oil- and gas extraction, industry, road traffic and other transport.
Figure 13.1 Norway’s total GHG emissions
Emissions from road traffic have increased by 15% since 1990. This is mainly because of growth in the volume of freight transport and an accompanying rise in emissions from vans and heavy vehicles. Despite large increases in distance driven, emissions from passenger cars have been relatively stable. This is explained by improvements in efficiency and thus reductions in fuel consumption, and a rise in the proportion of diesel vehicles. After 2015, these emissions began to decline as biofuel use increased and the proportion of electric vehicles rose. In 2019, the emissions from road traffic were 8.6 million tonnes CO2 equivalents. This was 16% lower than in 2015. The emissions in 2019 would have been 10.3 million tonnes CO2 if only fossil fuels had been used.

Norway
IEA Bioenergy Task 39 - Implementation Agendas: 2019-2021 Triennium Update 253
Figure 13.2 shows how biofuels and electricity have contributed to the reduction of GHG emissions. Biofuels contributed to the reduced emission of CO2 by 1.5 million tonnes. Battery Electric Vehicle (BEV) and hybrid cars contributed to the CO2 emissions reduction by 0.6 million tonnes. The CO2-reduction effect, based on LCA analyses, of the biofuels-part of the diesel and gasoline consumed in the road traffic was 73% in 2019. The reduction in GHG emissions from road traffic heavily depends on imported biofuels as domestic production is small.
Figure 13.2. GHG-emissions from road traffic, in million tonnes CO2 equivalents (Source: Drivkraft Norge)
Total emissions from other transport sectors rose by 25% from 1990 to 2019. There is considerable variation from year to year in emissions from these sectors. In recent years, emissions from shipping and fishing vessels have shown a downward trend, while emissions from non-road mobile machinery have been rising. From 2018 to 2019, there was a decline in emissions from shipping, fishing vessels, aviation and non-road mobile machinery. The reduction is mainly due to electrification of ferries. More information can be found here: https://www.environment.no/topics/climate/norwegian-green-house-gas-emissions/.
13.2. Main drivers for biofuels policy
The main driver for the biofuel policy in Norway is national ambition to reduce GHG-emissions. Energy security is not a driver, as the country is a large energy exporter of fossil fuels and partly also hydropower. There are two drivers for developing national forest-based biofuel production: 1) increased utilization of large national forest resources and 2) reduce export of low quality forest biomass. Norway has relatively large forest resources. The standing volume is increasing year by year (see Figure 13.3). The high-quality biomass is being used for construction materials and the low quality for other applications, such as chemicals and paper (moderate volumes). The low-quality biomass represents a large feedstock resource for new biodiesel production. Per 2020 only minor volumes of bioethanol is being produced from Norwegian forest biomass. 99% of the biofuels used in Norway are imported. The harvest in 2009 constituted 6 million m3 of saw log quality that was used for construction materials, and 5 million m3 of pulpwood quality that was processed for producing paper, cellulose and chemicals. In addition, large volumes of branches, tops and cuttings from the harvest, estimated to constitute about 3 million m3 were left in the forest.
0
2
4
6
8
10
12
2000 2001 2002 2003 2004 2005 2006 2007 2008 2009 2010 2011 2012 2013 2014 2015 2016 2017 2018 2019 2020
Mill. tonn CO2
CO2-emission fossile fuels GHG emissions reduction by biofuels
GHG emissions reduction by Battery Electric Vehicle GHG emissions by hybrid cars
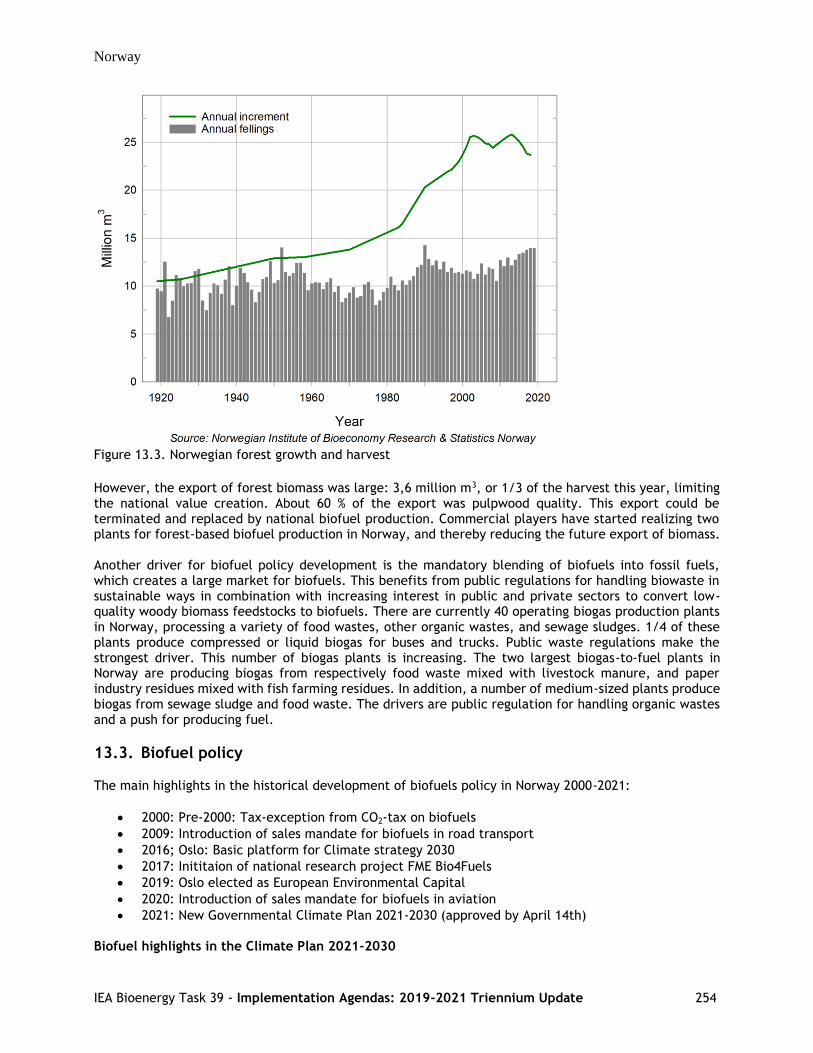
Norway
IEA Bioenergy Task 39 - Implementation Agendas: 2019-2021 Triennium Update 254
Figure 13.3. Norwegian forest growth and harvest
However, the export of forest biomass was large: 3,6 million m3, or 1/3 of the harvest this year, limiting the national value creation. About 60 % of the export was pulpwood quality. This export could be terminated and replaced by national biofuel production. Commercial players have started realizing two plants for forest-based biofuel production in Norway, and thereby reducing the future export of biomass. Another driver for biofuel policy development is the mandatory blending of biofuels into fossil fuels, which creates a large market for biofuels. This benefits from public regulations for handling biowaste in sustainable ways in combination with increasing interest in public and private sectors to convert low-quality woody biomass feedstocks to biofuels. There are currently 40 operating biogas production plants in Norway, processing a variety of food wastes, other organic wastes, and sewage sludges. 1/4 of these plants produce compressed or liquid biogas for buses and trucks. Public waste regulations make the strongest driver. This number of biogas plants is increasing. The two largest biogas-to-fuel plants in Norway are producing biogas from respectively food waste mixed with livestock manure, and paper industry residues mixed with fish farming residues. In addition, a number of medium-sized plants produce biogas from sewage sludge and food waste. The drivers are public regulation for handling organic wastes and a push for producing fuel.
13.3. Biofuel policy
The main highlights in the historical development of biofuels policy in Norway 2000-2021:
• 2000: Pre-2000: Tax-exception from CO2-tax on biofuels
• 2009: Introduction of sales mandate for biofuels in road transport
• 2016; Oslo: Basic platform for Climate strategy 2030
• 2017: Inititaion of national research project FME Bio4Fuels
• 2019: Oslo elected as European Environmental Capital
• 2020: Introduction of sales mandate for biofuels in aviation
• 2021: New Governmental Climate Plan 2021-2030 (approved by April 14th) Biofuel highlights in the Climate Plan 2021-2030

Norway
IEA Bioenergy Task 39 - Implementation Agendas: 2019-2021 Triennium Update 255
The Climate Plan constitutes a platform for the annual national budgets the coming ten years. Replacing fossil fuels with biofuels will continue. The biofuel volume for road traffic will be the same or higher than the 2021-volume in absolute volume (not in percentage). This ensures the biofuel market at the same or higher volume, even if the number of battery electric vehicles will increase sharply. The government also plan to:
• introduce a biodiesel mandate for the construction-market, starting in 2022. The blend-in rate will gradually increase to the same level as for road traffic in 2030.
• introduce a biofuel mandate for shipping from 2022, however, details not yet decided.
• evaluate the existing blend-in mandate for aviation and gradually increase it In summary, the plan states that the national biofuel market will be stable over the coming decade. The challenge will be to increase the national production of advanced biofuels which has a high CO2-reduction impact.
Figure 13.4. Front page of the Norwegian Climate Plan 2021-2030
Oslo: European Environmental Capital 2019 Oslo, the capital of Norway, was appointed the European Environmental Capital by the European Union in 2019. This was based on the town’s long-term climate policy, and the realization of large climate gas reductions within transportation, logistics and heating. Public and private person-transport have been changed dramatically. An advanced and effective subway cowering all central parts of the city has been built, strong restrictions for cars have been introduced and new low-carbon buses and ferries are in operation. All sewage and food waste are being processed to biogas used in compressed or liquid form as fuel for public buses. The residual biomass from the biogas plant is being used as fertilizer in the agriculture nearby. Also, new regulations and guidelines for all construction work have been introduced, creating another market for biofuels and electricity. Oslo municipality is known for combing budgets for its many departments with climate gas reduction targets; ‘no CO2 cuts – no money is the slogan’. It helps keeping an eye on climate impact and quality of life all the time.

Norway
IEA Bioenergy Task 39 - Implementation Agendas: 2019-2021 Triennium Update 256
Figure 13.5. Oslo, European Environmental Capitol, 2019
Concerning biofuels, Oslo owns and operates three large biogas plants, one processing food wase and two processing sewage sludge. The biogas, in liquid form, is being used as fuel for the town’s buses. The biomass residue (digestate) is being used as fertilizer in the agriculture.
Figure 13.6. Oslo biogas plant Romerrike processing food waste to bus fuel and fertilizer
13.3.1. Biofuels obligations
Replacing fossil fuels by biofuels has been a national action:
• Mandatory biodiesel blend-in for road traffic since 2009 with increasing rates yearly, 24.5 % per 2021, and aiming for 40% in 2030.
• The blending obligation for bioethanol in gasoline has been 4% since 2017.
• Mandatory blend in of biofuels in aviation since 2018. Current mandate is 0.5%.
• In addition, voluntary biofuel consumption above mandate for road traffic was about 4% of total fuel consumption in 2019.
• The production of biodiesel and bioethanol in Norway is low compared to Sweden and Finland. However, the commercial interest in domestic biofuel production is growing. Per 2021 two new biofuel producing plants are in progress, one at pilot level, and one at concept level, both using forest residues as feedstock.
• Also, without a mandate, 40 biogas plants with a total production capacity of about 800 GWh annually, are in operation. The feedstocks are food waste, sludge and industrial organics wastes.
• The largest liquified biogas plant in the world, Biokraft, is located in Norway.
• There is currently no mandate for including biogas in fossil methane gas grids.

Norway
IEA Bioenergy Task 39 - Implementation Agendas: 2019-2021 Triennium Update 257
The only relevant biofuel policy is the blend-in-regulation given in the sales mandate defined in the Norwegian product regulation. Norway has no regulation for biofuels production. The new National climate plan prolongs and expands the blend-in mandate as the primary tool for supporting biofuels. The biofuel suppliers are obliged to report the origin (country) of the feedstock used for producing their biofuels, and the climate impact has to be documented by a third party using standardized methods. Mandates for biodiesel use started in 2009. The initial blending obligation was at 2.5%, which has gradually increased to 24.5% in 2021. Blending obligation for ethanol in gasoline has been 4% since 2017. Sales mandate for advanced biofuels in aviation was introduced in 2020 (0.5%). Advanced biofuels blending started in 2017 at 0.9%, increasing to 9% for 2021. Table 13.2 shows the biofuel blending mandates in Norway since 2010. In addition to the blending mandates, public procurements provide a substantial market for biofuels in both mass transit buses and non-road machinery (construction sites etc.). Table 13.2. Biofuels obligations/mandates
Year Biofuel sales mandate (volume in road
transport)
Sub-mandate Biofuel in petrol
Sub-mandate
Advanced biofuels (volume)
2010 3.5 % - -
2011 3.5 % - -
2012 3.5 % - -
2013 3.5 % - -
2014 3.5 % - -
2015 4 % - -
2016 5.5 % - -
2017 7.5 % 4 % 0,875 %
2018 10 % 4 % 1,75 %
2019 12 % 4 % 2,25 %
2020 20 % 4 % 4 % (+ 0,5 % in aviation)
2021 24.5 % 4 % 9%
The EU’s Renewable Energy Directive and sustainability criteria are implemented in Norwegian regulations and require biofuels to achieve at least 50 % GHG reduction (in life cycle emissions) compared to fossil fuels to be eligible for use in the mandate. Norway has also implemented the EU’s Fuel Quality Directive, which requires fuel suppliers to lower GHG emissions of all gasoline and diesel used for road and non-road uses by 6% in 2020. The EU commission approves sustainability certification schemes used for certifying biofuels, and these certification schemes are also approved in Norway. The list of these schemes is available at: https://ec.europa.eu/energy/topics/renewable-energy/biofuels/voluntary-schemes_en The non-compliance cost for obligated parties who do not meet their biofuels blending mandate obligations is in the form of fines (not pre-determined but set on a case-by-case basis) or reporting to the police.

Norway
IEA Bioenergy Task 39 - Implementation Agendas: 2019-2021 Triennium Update 258
13.3.2. Fiscal incentives
There is only one economic incentive for biofuels: no CO2 tax. Road tax is the same for biofuels and fossil fuels, relative to their energy content. The total tax for biodiesel is about 30% lower than for fossil diesel, and about 60% lower for bioethanol compared to gasoline (see Table 13.3). Table 13.3. Fiscal incentives for biofuels
Fuel Unit Road-tax CO2-tax Total tax
Gasoline NOK/liter 5.01 1.37 6.38
Diesel NOK/liter 3.58 1.58 5.16
Bioethanol NOK/liter 2.45 0 2.45
Biodiesel NOK/liter 3.66 0 3.66
Natural gas NOK/Sm3 1.82 1.17 2.99
LPG NOK/kg 4.27 1.77 6.04
13.3.3. Other measures stimulating the implementation of biofuels
The main Norwegian funding agencies that support the production and use of biofuels are:
• Enova (funding agent for industry projects)
• Innovation Norway (helps Norwegian companies going international)
• The Research Council of Norway (RCN; funding research on biofuels)
Innovation Norway, co-owned by the Norwegian state and regional authorities (municipalities), is the main public agency for industry development. It stimulates innovation, sustainable growth and export through grant instruments and loans, as well as advisory services. Innovation Norway has provided capital and other services to several initiatives within biofuel production. Projects supported in the research and scale-up phases include biogas, liquid biofuel from wood and the recycling of waste or industry flue gases (CCU). The Research Counsel of Norway is funding R&D-projects within biofuels and biogas, most of them involving both research institutions and industries. The largest project is the research center Bio4Fuels (2017-2024), focusing on developing biofuel production in Norway. Bio4Fuels is a research center for environmental-friendly energy (Figure 13.7) lasting for 8 years. The center involves all relevant research-institutions and industry actors in Norway. It includes the main elements biomass feedstocks, sustainable value chains, thermochemical processing, biochemical processing, gasification, process design and end use (see Figure 13.8). Industry has majority in the centre board. The centre organization reflects relevant value chains from feedstock (forest biomass and organic waste) to fuel end product and valuable biochemicals).

Norway
IEA Bioenergy Task 39 - Implementation Agendas: 2019-2021 Triennium Update 259
Figure 13.7. Current National Research Centers for Environmentally Friendly Energy (FME)
Figure 13.8. Structure of Bio4Fuels, the Norwegian R&D centre for Sustainable Bio-based Fuels
13.3.4. Some other ongoing biofuels -related R&D-projects
Financed from Norway
• Enzymes4Fuels: Developing innovative enzyme technology for sustainable biofuels production
• Bio4-7Seas: Biofuels for climate change mitigation in deep-sea shipping
• BioPath: Advancing the understanding of regional climate implications of bioenergy systems
• B2A: Conversion of biomass to aviation fuels
• BioSynGas: Combined biogas- and thermochemical processes Financed from EU
• METAFLUIDS: New enzymes for biomass processing
• 4Refinery: Conversion of lignocellulosic Biomass via HTL and Pyrolysis to Advance Biofuels
• Waste2Road: Conversion of Biogenic Waste via HTL and Pyrolysis to Advance Biofuels
• EBIO: Electrochemical upgrading of Bio Oils
• BL2F: Biofuels from black liquor via HTL
• NextGenRoadFuels: Biofuels from sludge and organic waste via HTL

Norway
IEA Bioenergy Task 39 - Implementation Agendas: 2019-2021 Triennium Update 260
• PyroCO2: European Green Deal project; gas fermentation of industrial carbon emissions
13.4. Market development and policy effectiveness
Table 13.4 shows biofuels production capacity in Norway since 2010. The biodiesel production capacity is 90 million liters since 2016. There is one producer: Adesso Bioproducts. Norway has experienced a strong increase in the production capacity for biogas as transportation fuel, from 27 GWh in 2013 to 334 GWh in 2019. The production of wood-based ethanol is moderate and limited, being one of several products from a biorefinery producing for the international market. Table 13.4. Transport biofuels production (million L (ML)/year)
Year Biodiesel (FAME)
Bioethanol (wood-based)
Renewable diesel)
Biogas as transportation fuel
Other advanced biofuels (specify)
2010 5
2011 5
2012 5
2013 5 27 GWh
2014 5 34 GWh
2015 5 42 GWh
2016 90 5 84 GWh
2017 90 5 175 GWh
2018 90 10 209 GWh
2019 90 15 334 GWh
2020 90 15
Table 13.5 shows the current advanced biofuels production capacity in Norway.

Norway
IEA Bioenergy Task 39 - Implementation Agendas: 2019-2021 Triennium Update 261
Table 13.5. Advanced biofuel production in Norway
Name of company Status Biofuel Technology and
feedstock
Production
capacity (ML/year & GWh/year)
Biofuel producers
Borregaard Sarpsborg
Operational Bioethanol Biorefinery, wood-based ethanol
20 ML ethanol
Adesso Bioprod.
Fredrikstad
Operational Biodiesel Biorefinery, vegetable biodiesel
90 ML biodiesel
Silva Green Fuel
Tofte
Pilot 2021 Biodiesel HTL-Thermochem., forest residues
600 ML biodiesel
Biozin
Åmli
Planned Biodiesel IH2-Thermochem., forest residues
120 ML biodiesel
Refineries
Equinor
Mongstad
Successful testing Fossil + Bio Catalytic cracker,
co-feed vegetable oil
Biogas for fuel
producers Feedstock Production
ca. 500 GWh/y
Biokraft
Skogn
Operational Liquid
methane
Paper mill waste &
fish farming waste
120 GWh/y
Truck fuel
Greve Biogas
Tønsberg
Operational
Compressed
methane
Food waste &
livestock manure
90 GWh/y
Bus-fuel
VEAS Oslo
Operational Compressed methane
Sewage sludge 85 GWh/y Bus-fuel
Romerike Biogas Oslo
Operational Liquid methane
Food waste 45 GWh/y Bus-fuel
Bekkelaget Biogas Oslo
Operational Compressed methane
Sewage sludge 25 GWh/y Bus-fuel
IVAR Biogas Stavanger
Operational Compressed methane
Sewage sludge 30 GWh/y Transport-fuel
Ecopro Verdal
Operational Compressed methane
Food waste & sewage sludge
30 GWh/y Transport-fuel
Frevar Fredrikstad
Operational Compressed methane
Food waste & sewage sludge
23 GWh/y Bus-/truck fuel
Bergen Biogass Bergen
Operational Compressed methane
Sewage sludge 15 GWh/y Bus fuel
Lindum Drammen
Operational Compressed methane
Sewage sludge 9 GWh/y Bus-/truck fuel

Norway
IEA Bioenergy Task 39 - Implementation Agendas: 2019-2021 Triennium Update 262
Biogas: Total 40 plants in Norway. Thereof 10 upgrading to biofuel for road traffic (2 to liquid biogas and 8 to compressed biogas).
Figure 13.9. Biofuel plants in Norway (Biogas: largest plants only)
The consumption of different transportation fuels in Norway is shown in Table 13.6. Almost all the biofuel consumed is being imported. The national production is limited to moderate volumes of bioethanol and lipid-based diesel. However, the national biogas production is significant, and all is being consumed in Norway. Table 13.6. Summary of Norwegian transport fuel consumption (ML)
Year Gasoline Diesel fuels
Aviation fuel 3)
Biodiesel1)
Bioethanol2)
Renewable diesel
Cellulosic ethanol
Bioga (GWh)
2010 1,628 2,524 975 133 18 0 1 N/A
2011 1,489 2,621 933 135 18 0 1 27
2012 1,395 2,730 1,012 157 21 0 1 34
2013 1,307 2,816 1,098 151 22 0 1 42
2014 1,246 2,947 1,225 152 22 205 2 84
2015 1,177 3,041 1,186 167 16 453 3 175
2016 1,155 3,185 1,078 361 66 237 5 209
2017 1,121 3,109 1,145 593 66 336 3 334
2018 1,087 3,065 1,174 422 74 0 1 N/A
2019 1,028 2,999 1,118 537 92 0 1 N/A
2020 971 2,842 521 440 83
1) Volumes included in column ‘Diesel fuels’ 2) Volumes included in column ‘Gasoline’ 3) Source: Avinor

Norway
IEA Bioenergy Task 39 - Implementation Agendas: 2019-2021 Triennium Update 263
13.4.1. Advanced biofuels production
To stimulate the consumption of advanced biofuels even more than the blend-in mandate, the government introduced no-road-tax (NOK 3.50 for diesel and 5 for gasoline) for biofuel volumes above the blend-in mandate volumes for the period 2016-2020. The biofuel consumption increased considerably for both gasoline and diesel (see Table 13.7). Table 13.7. Biofuel sale with no road-tax above mandatory blend-in volumes 2016-2020
Fuel type Fuel sale (ML) Thereof biofuel sale (ML)
Thereof biofuel sale (%)
Biofuels sales mandate (%)
Gasoline 1,028 92 9 % 4 %
Diesel 2,999 537 18 % 12 %
Sum 4,027 629 16 %
Table 13.8. Composition of biofuels sold in Norway 2019
Biofuel type Biofuel composition
Biogasolinen conventional Ethanol 88 % + Naphtha 12 %
Biogasolinen advanced Ethanol 32 % + Naphtha 58 % + Other 10 %
Biodiesel conventional HVO 36 % + FAME 64 %
Biodiesel advanced HVO 94 % + FAME 6%
The label ‘advanced biofuel’ used in the blend-in regulation is linked to the feedstock. Feedstock that can be used for food production cannot be used for producing advanced fuel. For example, HVO can be classified as conventional or advanced, depending on the feedstock type.
13.4.2. Biofuel feedstocks
For advanced biofuels, slaughterhouse waste not fitted for livestock feeding was the most common feedstock. This was followed by used cooking oil. For conventional biofuels, rape seed was the main feedstock, followed by maize. Sustainable palm-oil as biofuel feedstock is being accepted in Norway, but EU has defined it as having high risk for LUC (land use change). The main palm-oil producing countries used to be Indonesia, Malaysia and some countries in South America. During 2016-2019 large volumes of palm-oil-based biofuel were delivered to Norwegian gas-stations. This has been criticised due to the rainforest issue. However, the Norwegian Environmental Agency has accepted palm-oil-diesel if the supplier can document acceptable climate sustainability, including no LUC (Land Use Change) consequences. 2020 was the first year with almost zero palm-oil based biofuel delivered to Norwegian gas stations.

Norway
IEA Bioenergy Task 39 - Implementation Agendas: 2019-2021 Triennium Update 264
Figure 13.10. Sales of liquid biofuels in road transport 2015-2020, divided into advanced*) biofuels,
biofuels made from palm oil and biofuels made from another feedstock.
*) = Biofuel made from feedstocks listed in part A and part B in Annex IX in the EU ILUC directive. https://www.miljodirektoratet.no/ansvarsomrader/klima/fornybar-energi/biodrivstoff/ Biofuel suppliers in Norway buy their products on the world market. The fuel origins from European Union, Asia and America (almost equal shares) (see Figure 13.11).
Figure 13.11. Origin of imported biofuels to Norway in 2019. Ref: Drivkraft Norge
13.4.3. Forest based biofuel production plants in Norway
Silva Green Fuel
Statkraft and the Swedish company Sødra Cell established in 2015 the company Silva Green Fuel to develop large forest-based biofuel production plants. The processing technology is the new Hydrothermal Liquefaction (HTL) technology developed by the Danish company Steeper Energy. The technology involves supercritical conversion of biomass at high pressure and temperature. After several lab-tests and commercial evaluations, a test plant was built in 2020-2021. The test operation will start the autumn of 2021 and establish the basis for designing and building a full-scale plant with a capacity of 600 ML crude biodiesel annually. The plant will be located at Tofte, close to Oslofjorden, the same site as Sødra operated its cellulose factory some years ago (see the map in Figure 13.9). The feedstock is forest residues from large forests in southern Norway. In a long-term perspective, several full-scale factories will be built, within and outside Norway. In the same way as Statkraft builds and operates hydro-power plants in many countries.
0
100
200
300
400
500
600
700
2015 2016 2017 2018 2019 2020
Mill
ion
litr
e
Advanced biofuels Conventional biofuels Palm oil
26%
39%
35% EU
Asia
Amerika

Norway
IEA Bioenergy Task 39 - Implementation Agendas: 2019-2021 Triennium Update 265
Figure 13.12. The Silva Green Fuel biofuel plant at Tofte, with access to Oslofjorden. To be built 2022-
2023, based on experiences from a pilot plant at the same site.
Biozin The company Biozin was established in 2017 by Bergene Holm, the second largest saw-mill operator in Norway. Biozin targets to produce biocrude oil in several decentralised plants located near the forest feedstocks and sawmills. The biocrude oil will be sold to the Preem refinery in Sweden for upgrading to advanced biofuel. The planned capacity is 120 ML/year crude biodiesel from forest and sawmill by-products. The location near the feedstock will reduce transportation cost and open up for smaller and cheaper biocrude production plants. A concept study shows 90% reduced carbon footprint compared to fossil fuel. The first plant will be located in Åmli, near a sawmill (see the map in Figure 13.9). The biofuel plant will use the same feedstock supply chain as the sawmill for harvesting and transporting forest residues and non-commercial forest biomass. The facility will be one of the first of its kind world-wide, based on the Shell-owned IH2 thermochemical processing technology. However, there are still (2021) processing technology challenge not solved. And the pre-engineering study is not yet completed.

Norway
IEA Bioenergy Task 39 - Implementation Agendas: 2019-2021 Triennium Update 266
Figure 13.13. The first Biozin biocrude plant will be located next to the Bergene Holm sawmill in Åmli
(Photo: Bergene Holm AS)
13.5. Coprocessing at oil refineries
The Norwegian energy company Equinor owns and operates a large oil refineriey in Mongstad where co-feeding of biomass based on vegetable oils in catalytic cracker is on-going. The future ambition is to increase the amount of biomass feedstocks compliant with the revised EU RED II (Renewable Energy Directive), resulting in an increased share of advanced biofuels in the final products.
Figure 13.14. Equinor refinery at Mongstad, Norway
13.6. Conclusions
Even if Norway is a large fossil fuesl producer, the national climate policy is clear on cutting climate gas emissions. Blend-in mandates with increasing biofuel-rates for road transport has reduced the annual national GHG emissions by about 15% per 2019. The production of biogas for road transport has been doubled the last few years, and new plants are being planned. The Norwegian oil company Equinor is building competence within processing biocrude to biofuel.

Norway
IEA Bioenergy Task 39 - Implementation Agendas: 2019-2021 Triennium Update 267
Two large forest-based biofuel (crude) producing facilities are at pilot stage, both introducing new processing technologies. Several biofuel-revant R&D projects are in operation, most of them involving industry partners. The Norwegian Parliament approved in April 2021 a 10-year Climate Plan including expanded markets and strong incentives for biofuels.
Sources
FME Bio4Fuels, https://www.nmbu.no/en/services/centers/bio4fuels Miljødirektoratet https://www.miljodirektoratet.no Drivkraft Norge https://www.drivkraftnorge.no/in-english/ Climate Plan 2021-2030 (in Norwegian only) https://www.regjeringen.no/no/dokumenter/meld.-st.-13-20202021/id2827405/ Adesso Bioproducts http://www.adessobioproducts.se Borregaard, https://www.borregaard.no Biokraft, https://www.biokraft.no Equinor, https://www.equinor.com Silva Green Fuel, https://www.silvagreenfuel.n

South Korea
IEA Bioenergy Task 39 - Implementation Agendas: 2019-2021 Triennium Update 268
14. South Korea
Jin-Suk Lee, Korea Institute of Energy Research
Summary • The main drivers for biofuel production are the National GHG Reduction Target and the Renewable
Fuel Standard (RFS).
• The only biofuels with blending mandate is biodiesel currently at 3% (B3)
• Currently there is no blending mandate for other biofuels. Ethanol blending is being evaluated at E3 and E5 levels for compatibility with current Korean infrastructure. Biomethane is also under evaluation.
• The share of biofuels for transport is modest at 2.5%.
• Funding programs are available to support R&D for projects such as ethanol and biodiesel from algae; however, there is no financial assistance in the form of loan guarantees or grants.
• Significant efforts are dedicated to commercializing algal biofuels. Due to limited availability of land, algal biofuels are not regarded as a promising option to meet the country’s implementation target for transport biofuels.

South Korea
IEA Bioenergy Task 39 - Implementation Agendas: 2019-2021 Triennium Update 269
14.1. Introduction
South Korea is the fifth largest petroleum importer in the world and the tenth largest CO2 emitter in the world, emitting 550 million tons in 2007. The National GHG Reduction Target (2015) was set to reduce emissions by 37% from business-as-usual (BAU) levels by 2030 (851 MTon down to 536 MTon). In 2010, the government introduced an emission trading scheme to start in 2013. The new government’s energy policy includes increasing renewable energy to 11% of primary energy consumption by 2035, and this policy includes the Renewable Fuel Standard (RFS) being introduced in 2013 and becoming effective starting in 2015. Figure 14.1 graphically shows these two main policies that promote the production and use of biofuels in South Korea.
Figure 14.1. Main drivers for biofuels production and use in South Korea: Renewable Fuel Standards (RFS)
(left) and National GHG Reduction Target (right) (Korea Ministry of Environment, 2020)
Table 14.1 shows the total energy consumption and the contribution of the transport sector over the period of 2015-2018. The transport sector has been contributing 14% to the total energy consumption. Table 14.1. Energy Consumptions in Korea1
Year TPES, 106 TOE Transport energy consumption
Contribution of Transport energy, %
2015 28.7 3.99 13.9
2016 29.4 4.23 14.4
2017 30.2 4.23 14.0
2018 30.7 4.30 14.0
Source: KEEI, Korea Energy Statistical Information System, 2020. The national GHG emission inventory in South Korea has increased from 292.5 million tonnes of CO2-eq (Mt CO2-eq) in 1990 to 727.6 Mt CO2-eq in 2018, 149% increase. The share of the transport sector in the national GHG emission inventory has increased from 35.3 Mt CO2-eq to 98.1 Mt CO2-eq over the same period of time, as shown in Table 14.2.

South Korea
IEA Bioenergy Task 39 - Implementation Agendas: 2019-2021 Triennium Update 270
Table 14.2. Historical GHG emissions inventory data of South Korea (million tonnes)
Year Total CO2 emissions CO2 emissions, Transport
Contribution of transport, %
1990 292.5 35.3 12.1
2000 502.9 69.9 13.9
2010 656.3 85.4 13.0
2016 693.5 98.8 14.2
2017 709.7 98.3 13.9
2018 727.6 98.1 13.5
Source: Korea Ministry of Environment, National Inventroy Report, 2020 The share of renewable energy in South Korea was about 5.56% in 2018. The total primary energy supplied by renewable energy sources was dominated by energy from biomass which alone accounted for 55% (4.4x10 6 TOE) of combined renewable energy production. Solar energy contributed 24.7% (2.0x10⁶ TOE), with the balance spread between hydropower (0.7x10⁶ TOE), geothermal energy (0.2x10⁶ TOE ), wind energy (0.5x10⁶ TOE ) plus a small fraction of tide, wave and ocean energy (0.1x10⁶ TOE ). Over half of the bioenergy comes from solid biomass (2.5x10⁶ TOE ). Biodiesel accounts for 0.67x10⁶ TOE (15%), other liquid biofuels for 0.47x10⁶ TOE (11%), renewable municipal solid waste (MSW) for 0.51x10⁶ TOE (12%), and biogas for 0.22x10⁶ TOE (5%), as shown in Figure 14.2.
Figure 14.2. Total primary energy supply from bioenergy in South Korea in 2018 (4.4x10⁶ TOE) (Source:
KNREC 2019)
Approximately 15% of energy consumption in the Korea is for transportation. The share of renewables in primary energy is expected to increase four-fold from 2012 to 2035, with the total bioenergy share increasing by a factor of 4.8 over this same period. In terms of feedstock, over 50% needs to be sourced domestically. Based on current biomass supplies, significant sourcing from other countries would still be needed. In response, research and development efforts have focused on options including algae for both ethanol and biodiesel production. As the strategy for securing a stable biomass supply, the South Korean government is investigating three options:
1) Utilize domestically available biomass (i.e., organic wastes, agricultural and forestry residues), 2) Identify new biomass feedstocks (i.e., aquatic biomasses, energy crops), 3) Source foreign biomass (e.g., plantation residues).
14.2. Main drivers for biofuels policy
In 2008, the Government’s Energy Policy emphasized Low Carbon Green Growth and identified green technology development as the new growth engine to improve the quality of life and to contribute to global progress. Core green technologies of this Green New Deal include photovoltaics, wind, fuel cells, integrated gasification combined cycle (IGCC) and nuclear, while “clean fossil fuels” of interest include those that can be used in clean fuel cells or enable carbon capture and sequestration (CCS). Energy

South Korea
IEA Bioenergy Task 39 - Implementation Agendas: 2019-2021 Triennium Update 271
efficiency, smart grid, LED, energy storage, combined heat and power (CHP), and heat pumps were also identified as important technologies.
14.3. Biofuels policy
14.3.1. Biofuels targets
The main driver for biofuel production is the Renewable Fuel Standard (RFS) for biodiesel. Table 14.3 shows the biodiesel mandates since 2007. Since July 2015, biodiesel has been blended at a level of 2.5% into conventional diesel; the biodiesel blending level increases to 3.0% from 2018 to 2020 (see Table 14.3). Oil refinery companies are responsible for meeting required fuel mixture targets and try to find the most economical way of including bio-based (non fossil) components in their fuels. The non-compliance cost of not meeting transport biofuel policies requirements in Korea is $24/GJ biodiesel (KMOTIE, New & Renewable Energy Act. 2020). While biodiesel is currently applied as B3.0, it is expected that biodiesel blends will reach B5 in near future. Ethanol blending is also being evaluated at E3 and E5 levels for compatibility with current South Korean infrastructure (at four gas stations over one year). In addition, biomethane is under evaluation. An option under consideration is whether local residues can be used as feedstocks or whether feedstocks will be imported. Another option is whether ethanol will be directly blended or used as ETBE. The share of biofuels within transport remains modest at 2.5%. Table 14.3. Targets and mandates for biofuels
Year Biodiesel (energy content%)
Ethanol (%)
2005 - -
2006 - -
2007 0.5% (target) -
2008 1.0% (target) -
2009 1.5% (target) -
2010 2.0% (target) -
2012 Mandate effective for biodiesel
-
2013 Mandate for other biofuels under review
-
2015-2017 2.5% (mandate)
2-18-2020 3.0% (mandate) 5.0% (target)
There are no market based- mechanisms such as Low Carbon Fuel Standard (LCFS), Carbon Tax and Emission Trading (cap-and-trade) in South Korea. In addition, there are no sustainability measures or verification processes for biofuels environmental performance. There are no specific policies to promote advanced biofuels or promoting aviation or marine biofuels in Korea.
14.3.2. Excise duty reductions
Supportive biofuel policies in South Korea have relied on a tax exemption scheme. Biodiesel was initially exempted from taxation, however since 2015 biodiesel blending mandates have replaced tax exemptions.
14.3.3. Fiscal Incentives
There are no fiscal incentives available in the Korea for the production and use of biofuels.

South Korea
IEA Bioenergy Task 39 - Implementation Agendas: 2019-2021 Triennium Update 272
14.3.4. Investment subsidies
There is no investment subsidies available in the Korea for the production and use of biofuels.
14.3.5. Other measures stimulating the implementation of biofuels
Funding programs are available for R&D such as ethanol from algae at $16 million and biodiesel from algae at $200 million but there is no financial assistance in the forms of either loan guarantees or grants. The main funding agencies are the Korea Institute of Energy Technology Evaluation and Planning (KETEP) and the Korea National Science Foundation (KNSF). Major research projects focusing on biofuel production are carried out at the Advanced Biomass R&D center (2010-2019) and also on jet engine testing with bio-jet fuel (2017-2021).
14.4. Promotion of advanced biofuels
South Korea is dedicating significant efforts toward algal biofuel commercialization. Due to limited availability of land, algal biofuels are regarded as a promising option to meet South Korea’s implementation target for transport biofuels. Uncertainty about the availability of algal biomass is the major barrier for commercialization of such biofuels. To improve the economics of algal biofuels production, a biorefinery-based approach based on multi-disciplinary collaboration may be required. Active R&D is being performed to reduce some of the technical uncertainties. South Korea has had two major projects involving algae. The ethanol from macroalgae (Gelidium amansii) project ran from 2010 to the end of 2012 with a budget of $16 million. The project’s objective was to establish an ethanol production pilot plant producing at levels of 400 L/day and to evaluate the cost of producing ethanol from macroalgae. This project developed a continuous saccharification process and achieved ethanol yields and concentrations of 0.2 (weight/ weight biomass) and 3.5% (weight /volume). After developing and operating the pilot process (capacity: 0.4kL/day), the project was halted due to poor economic feasibility. The longer-term project on biodiesel production from microalgae has been underway since 2010 and was finished in 2019. Although some technological improvements like identification of some suitable algal strains (freshwater and marine), low cost photobioreactors (PBR) for mass cultivation, and a pilot-scale production system, have been made but failed to reach commercialization target.
14.5. Market development and policy effectiveness
Table 14.4 and Table 14.5 respectively summarize South Korea’s biofuel production capacity, and overall transport fuel consumption and biofuels’ market share over the past decade. Table 14.4. Biofuels production– installed (and actual) production capacity (ML/year)
Year Biodiesel (FAME)
Ethanol (conventional)
Cellulosic ethanol
Biogas as transportation
fuel
Renewable diesel (from lipids)
2010 600 (395) - - - -
2013 789 (393) - - - -
2015 798 (470) - - - -
2017 1,160 (606)
- - - -
2019 1,325 (735)
- - - -

South Korea
IEA Bioenergy Task 39 - Implementation Agendas: 2019-2021 Triennium Update 273
Table 14.5. Transport fuel consumption (ML/year)
Year Gasoline Diesel fuels
Aviation fuel
Biodiesel Ethanol Market share of biofuels (%)
2010 10.683 21,409 4,164 600 0 2.29
2011 10.783 21,331 4,522 800 0 3.00
2012 11,122 21,740 4,803 800 0 2.08
2013 11,379 22,740 4,822 789 0 1.99
2014 11,387 23,029 5,082 789 0 1.96
2015 11,867 24,861 5,463 789 0 1.84
2016 11,909 21,924 5,327 869 0 2.17
2017 12,340 26,847 6,075 1,162 0 2.50
2018 12,350 26,557 6,337 1,162 0 2.50
Source: KEEI, Korea Energy Statistical Information System, 2020. Table 14.6 shows the current producers of biodiesel in South Korea with a total annual production capacity of 1325 million liters, with primary feedstocks being palm oil (48%), used cooking oil (28%), soybean oil (23%), and rapeseed oil (1%). There are no ethanol, renewable diesel or other advanced biofuel production facilities in the country. Table 14.7 shows the export and import of biodiesel and feedstocks in South Korea. Table 14.6. List of biodiesel producers in South Korea
Biodiesel Plant Installed capacity (ML/year)
Feedstock Status
Danseok Industry 341 Vegetable oil, used cooking oil
Operational
Emac Bio 99 Used cooking oil Operational
SK Eco-prime 280 Palm fatty acid distillate (PFAD)
Operational
JC Chemical 165 Used cooking oil Operational
Aekyung Petrochem
200 Used cooking oil Operational
GS Bio 120 Vegetable oil, used cooking oil
Operational
Eco solution 120 Used cooking oil, tallow
Operational
Total 1,325
Source: Korea Bioenergy Association (KBEA), 2020. Table 14.7. Export and import of biodiesel and feedstocks in South Korea, 2010-2019
Year Transport Biofuel (Biodiesel, FAME) Feedstocks (used cooking oils, PFAD etc)
Import (M liter/year)
Export (M liter/year)
Import (M tonnes/year)
Export (M tonnes/year)
2010 0 0 0.28 0
2012 0 0 0.26 0
2014 0 76 0.22 0
2017 0 28 0.324 0
2018 0 35 0.433 0
2019 0 108 0.465 0
South Korea’s limited biomass resources coupled with the relatively high cost of producing biofuels are major barriers to achieving the country’s 2035 implementation targets. To solve this dilemma, a systematic approach for identifying and mass producing or aggregating novel biomass residues such as algae and plantation residues is now being undertaken. Research activities are also targeting the commercialization of advanced biofuels. With all these efforts, biofuels are expected to be cost

South Korea
IEA Bioenergy Task 39 - Implementation Agendas: 2019-2021 Triennium Update 274
competitive by 2020 and as a result, South Korea may be successful achieving its 2035 bioenergy implementation target.
14.6. Coprocessing at oil refineries
Figure 14.3 shows the location and refining capacities of four oil refineries in South Korea. The combined capacity of these oil refineries is 3000,000 bbl/day. Currently, no-co-processing has been considered and conducted in these oil refineries and there are no policy supporting the co-processing in South Korea.
Figure 14.3. Oil refineries in South Korea
14.7. Conclusions
In Korea, the tax exemption policy was adopted to accllerate the biodiesel implementation. However, as the supply of biodiesel was increased, financial problems were also incurred. For biodiesel, the deficit in 2009, when 300,000 kL of biodiesel was supplied in the country, was about 0.12 billion dollars. In response to this problem, the Korean government changed the policy to mandatory use instead of tax exemption since July 2015. With the policy, the supply of biodiesel is increased slow but steadily in the country. The major weakness of Korean RFS policy is the endowment of same credit to all biofuels. The policy has brought no interests for the biodiesel suppliers to develop advanced biodiesels. Korean government now considers the endowment of different credit to biodiesel made from inedible feedstocks. As diesel consumption of the transport sector in Korea is about 2 times larger than gasoline, biodiesel has been the first biofuel available to public. The tax exemption policy was adopted to accllerate the biodiesel implementation. However, as the supply of biodiesel was increased, financial problems were also incurred. For biodiesel, the deficit in 2009, when 300,000 kL of biodiesel was supplied in the country, was about 0.12 billion dollars. In response to this problem, the Korean government changed the policy to mandatory use instead of tax exemption since July 2015. With the policy, the supply of biodiesel is increased slow but steadily in the country. The major weakness of Korean RFS policy are: - No incentives for advanced biofuels (In USA, higher RINs are for advanced biofuels) - No consideration to carbon intensity of biofuels "
Sources
IEA Bioenergy- Country reports, 2018. Republican of Korea– 2018 update Bioenergy policies and status of implementation. http://www.egnret.ewg.apec.org/meetings/egnret36/EP3A-%20EGNRET_Korea%20Presentation.pdf

South Korea
IEA Bioenergy Task 39 - Implementation Agendas: 2019-2021 Triennium Update 275
http://www.4thintegrationconference.com/downloads/Session%201-6_Konkuk%20University_Park.pdf KMOE, CO2 inventory target in Korea, 2020. KEEI, Korea Energy Statistical Information System, 2020. KMOTIE, New & Renewable Energy Act. 2020. Korea Bioenergy Association, 2020.
Sweden
IEA Bioenergy Task 39 - Implementation Agendas: 2019-2021 Triennium Update 276
15. Sweden
Tomas Ekbom (Swedish Bioenergy Association – SVEBIO) Cecilia Higa (Swedish Bioenergy Association – SVEBIO)
Summary • Sweden had the highest share of energy from renewable sources (54.6%) in its gross final
consumption in the EU.
• Sweden would be zero net emissions by 2045 according to the Climate Act, settled in 2017. For that, the emissions from transport would be reduced by at least 70% by 2030, compared to 2010.
• The main legislation impacting biofuels are a tax exemption on biofuels used as transport fuels and a “pump law” on distribution of biofuels.
• The tax exemption has varied from full to reduced tax exemption. For biofuels, it is until December 2021 and for bio-CNG, until December 2029. However, since January 2018 all biofuels are fully exempted from the fuel tax.
• A quota mandate system has been in place since July 2018. This policy mandates emissions reductions for petrol (gasoline) and diesel sectors, targeting GHG emission reductions of 4.2% for petrol and 21.0% for diesel from January 2021.
• Biofuels for transport has expanded quickly in the market in recent years and in 2019 biofuels accounted for 20.9% of all transport fuels sold compared to 5.1% in 2011. The largest share biofuel was HVO fuel, which accounted for two thirds of all biofuels sold, equivalent to 25% of all diesel sold.
• The Government has proposed a policy for increased production and use of biojet fuels in Sweden, by mandate in July 2021 starting with a reduction quota of 0.5%.
• Bioenergy has a high priority within Sweden’s R&D portfolio. Over the years, Swedish energy R&D has investigated most of the major economically and environmentally relevant bioenergy topics.

Sweden
IEA Bioenergy Task 39 - Implementation Agendas: 2019-2021 Triennium Update 277
15.1. Introduction
The European Union (EU) has set a goal to reach a 20% share of gross final energy consumption from renewables by 2020. Each Member State designed its own national action plans to reach this goal. Figure 15.1 shows the overall share of energy from renewable sources in the EU Member States in the gross final energy consumption in 2019. Sweden had a higher share of energy from renewable sources (56.4%) in its gross final consumption. This positive outcome has been enacted by Directive 200928/EC on the encouragement of the utilization of energy from renewable sources.
Figure 15.1. Share of energy from renewables sources in the EU Member States (% of gross final energy
consumption), in 2019 (EUROSTAT, 2020).
To reduce the carbon intensity of the transportation sector, the EU agreed to establish a common goal of 10% for the share of renewables (e.g., liquid biofuels, hydrogen, biomethane, etc.) by 2020. In 2019, the share of renewable energy in transportation was 8.9%. Figure 15.2 shows the share of renewable energy in transport fuels, including multiple- counting and not real percentage points. Based on this calculation, the share of renewable energy in transport fuels for Sweden was 30.3% (29.7 – 2018), whereas real percentage was around 19% (update this value for 2019). The country has opted not to divide its renewable energy target into subtargets by sector. Thus, Sweden has no specific targets for bioenergy, apart from the targets set by the EU-RED.

Sweden
IEA Bioenergy Task 39 - Implementation Agendas: 2019-2021 Triennium Update 278
Figure 15.2. Share of energy from renewables sources in transport (% of gross final energy consumption),
in 2019 (EUROSTAT, 2020).
In addintion to the targets set by the EU, the Swedish parliament decided in 2009 that Sweden’s vehicle fleet shall be fossil fuel independent by 2030. In 2014, the government declared the country should become a “fossil free welfare state” by 2050. In 2017, the parliamentet decided upon a climate-political framework, with climate emissions reduction of 70% by 2030 compared with 2010 and “At the latest in the year 2045, Sweden shall have no net emissions of greenhouse gases to the atmosphere, and will thereafter achieve negative emissions”. In January 2018, a new climate law was came into effect. High shares of bioenergy, hydropower and nuclear power characterizes the energy supply in Sweden, accounting for 95% of domestic energy production and 73% of the total primary energy supply (TPES) in 2017. The country counts with a substantial and growing supply of bioenergy, mostly originated from domestic forest sources. The supply of biomass-based fuels and waste increased by 24%, between 2007 and 2017 across transport and heat generation, among other sectors. Oil supply decreased by 20% at the same period, due to increasing use of biofuels in the transport sector and biomass in the heating sector. The increasing trend in biofuels in the transport sector is shown in Figure 15.3.

Sweden
IEA Bioenergy Task 39 - Implementation Agendas: 2019-2021 Triennium Update 279
Figure 15.3. Biofuels in the transport sector (domestic) by fuel, from 1995 to 2018 (Sweden, 2020).
According to preliminary statistics from the Swedish Energy Agency (SEA), bioenergy represents 63% of total primary energy supply from renewable energy sources with 229.5 TWh, followed by hydropower (64.6 TWh) and wind energy (19.9 TWh), in 2019 (see Figure 15.4). Bioenergy comprise biomass combined heat and power plants, biomass heating plants, biogas, biofuels, biooils and other biobased energy in industry. The role of solar energy is marginal in Sweden.
Figure 15.4. Renewable energy in Sweden, in 2019 (Sweden, 2020a)
Figure 15.5 shows Sweden’s historical GHG emission and the contribution of the different segments from 1990 to 2016.

Sweden
IEA Bioenergy Task 39 - Implementation Agendas: 2019-2021 Triennium Update 280
Figure 15.5. Sweden CO2 emissions by years from 1990 to 2016 (Worldmeters, 2019)
Throughout this period, the emissions from transport were dominated by road transportation. A decreasing trend could be considered due to more energy eficient vehicles and increase use of biofuels in this sector, although the effects of these measures on emission reduction have been suppressed by an increased tendency in the quantity of traffic. The total emissions for 2019 were 50.9 million tonnes, exclusive of LULUCF and of international transports. Of these Work machines constituted 3.3, Waste 1.1, Heat and power 4.6, Industry 16.3, Domestic transport 16.4, Agriculture 6.9, Solvents and other chemical product uses 1.5, Heating of houses and offices 0.8 million tonnes respectively. In 2016 the total emissions were 53.6 million tonnes and since then the reduction has been made almost all of it in the transport sector.
15.2. Main drivers for biofuels policy
The main drivers for biofuels in Sweden are climate change mitigation and reduction of GHG emissions. Other important drivers are energy security, technology development towards a circular bioeconomy and job creation. Sustainability is the key element in policies for energy, climate and the environment.38
15.3. Biofuels policy
The energy policies have been rather stable since a long period of time in Sweden. The main incentives and tax measures are shown in Figure 15.6. The most relevant policies to the transportation sector are discussed below.
38 http://www.energimyndigheten.se/fornybart/hallbarhetskriterier/

Sweden
IEA Bioenergy Task 39 - Implementation Agendas: 2019-2021 Triennium Update 281
Figure 15.6. Sweden’s bioenergy policies timeline
15.3.1. Biofuels obligations
Transport fuels are subjected to an energy tax and a carbon tax as well as a value-added tax (VAT), where all are based on volume instead of energy unit. The VAT (25%) is added to the total sum which means that the energy and carbon taxes are also subject to VAT. The energy tax has been revised every year with change in taxation and biofuel policy. This tax always remains above the minimum tax on fuels set by the European Union in its Energy Tax Directive. Under certain circumstances, tax exemptions can be made, and Sweden has historically applied for state-aid approval for tax exemption of biofuels. Biofuels were initially fully tax exempt; however, the tax exemption was reduced in 2015 because of EU concern that this approach risked over-compensating some fuels, e.g., ethanol E85 and Rapeseed Methyl Esters (RME). Later there has been reduced tax exemption when price changes have occurred but always as reaction to dated changes and not current prices. Since January 2018, all biofuels are once again fully tax exempt. The current enery tax for Petrol Environmental Class 1 (EC1) is 4.13 SEK/liter, and 4.74 SEK/liter for

Sweden
IEA Bioenergy Task 39 - Implementation Agendas: 2019-2021 Triennium Update 282
Diesel Environmental Class 1 (EC1). Regarding the carbon tax, the values are 2.61 for petrol and 2.26 for diesel, respectively (see Table 15.1) 39 Table 15.1. Fuel taxes from January 2021.
Product Energy tax CO2 tax Total tax
Petrol EC1 4.13 SEK/liter 2.61 SEK/liter 6.74 SEK/liter
Diesel EC1 2.48 SEK/liter 2.26 SEK/liter 4.74 SEK/liter
Diesel EC2 2.80 SEK/liter 2.26 SEK/liter 5.06 SEK/liter
Diesel EC3 2.96 SEK/liter 2.26 SEK/liter 5.22 SEK/liter
Since July 2018, a reduction quota mandate system has been in place with emissions reduction targets for petrol (gasoline) and diesel. Sweden follows the given emission values for petrol and diesel according to the Renewable Energy Directive (RED II40). This policy mandates a reduction in carbon dioxide emissions of 4.2% for petrol and 21.0% for diesel by January 2021 compared with neat fossil fuels. Highly concentrated biofuels such as E85, HVO100, B100 and others outside the petrol and diesel standard are not included and are fully tax exempted until end of 2021 and for bio CNG until 2030. The penalty cost for not meeting the mandate is by law maximum 7 SEK per kg carbon dioxide equivalents but the current regulation stipulates 5 SEK for petrol and 4 SEK for diesel. In addition, there are longstanding policies on vehicles to incentivize efficiency, i.e., such as classifying cars based on their environmental performance for eligibility to receive bonuses or other benefits, that have impacted biofuel consumption. There are other initiatives that have also had impacts but these are the most important and relevant.41 The reduction quota obligation for petrol, diesel and full tax exemption on high-blend, highly concentrated biofuels came into effect as of July 2018. The 2030 goal is to achieve a 70% reduction in carbon emissions and an approximate biofuels share of 50% on an energy basis assuming continuing efficiency improvements and electrification in transport. Emission reduction quotas for 2018 to 2020 are shown in Table 15.2. The proposal from the SEA for reduction levels from 2021 to 2030 is presented in Table 15.3. Table 15.2. Reduction quota system with mandated reduced carbon emissions for each fuel type
Reduction July 2018 January 2019 January 2020
Petrol 2.6% 2.6% 4.2%
Diesel 19.3% 20.0% 21.0%
Source: Swedish Energy Agency, 2019 Table 15.3. Reduction level proposed by the Swedish Energy Agency from 2021 to 2030 (update – new for
the reduction quota mandate) The values for 2021 are from Aug 2021.
Reduction 2021 2022 2023 2024 2025 2026 2027 2028 2029 2030
Petrol 6.0% 7.8% 10.1% 12.5% 15.5% 19.0% 22.0% 24.0% 26.0% 28.0%
Diesel 26.0% 30.5% 35.0% 40.0% 45.0% 50.0% 54.0% 58.0% 62.0% 66.0%
Source: Swedish Government, 2020 It is noted that a state investigation about proposing policy for increased production and use of biojet fuels in Sweden was delivered in 2019 which proposed a reduction quota mandate from 2020. The government has yet to propose to the parliament for such a law to be decided upon. The system would
39 https://drivkraftsverige.se/statistik/skatter/skatter-fossila-drivmedel-och-branslen/ 40 https://eur-lex.europa.eu/legal-content/EN/TXT/PDF/?uri=CELEX:32018L2001&from=fr 41 http://www.energimyndigheten.se/fornybart/hallbarhetskriterier/

Sweden
IEA Bioenergy Task 39 - Implementation Agendas: 2019-2021 Triennium Update 283
start with a quota of 0.5% by volume and increase to about 30% by 2030 and increased to 100% by 2045. Noteworthy is that the mandate would include both domestic and international air traffic which is fueled in Sweden.
15.3.2. Excise duty reductions
The main legislation impacting biofuels are the tax exemption on biofuels distributed as transport fuels and the “pump law” on distribution of biofuels. As discussed before, the tax exemption has varied from full to reduced tax exemption but from January 2018 all biofuels are fully exempted from the tax (note that this tax is divided into energy tax and carbon dioxide tax components).42 The petrol/diesel usage ratio in Sweden is closer to the North American average than the European average, largely due to tax differences. However, diesel is increasing its share rapidly due to fiscal incentives for new cars and an increasing demand for transportation of goods.
15.3.3. Fiscal incentives
The “pump law” mandates fuel retailers that have a fuel turnover above 1,500 m3 per month to offer at least one fuel with a greater than 50% biofuel blend, meaning at least one pump dedicated to biofuels. A number of government institutions, foundations and authorities provide funding for biofuels research and development (R&D). There are investment subsidies (fiscal incentives) for biofuel pumps available from the Environmental Protection Agency.
15.3.4. Investment subsidies
Subsidies for investments are available for pilot and demo plants, and for climate action programs that reduce carbon emissions (also for commercial technologies). The Swedish Energy Agency (SEA) provides 25% investment support and the Swedish Environmental Protection Agency (EPA) provides up to 45% investment support. Support is also provided for investments in electric charging stations and biogas infrastructure. There are subsidies for consumers, most notably the full tax exemption on biofuels (low blends until June 2018 and then taxed under reduction quota system, with highly concentrated biofuels fully exempt until 2021). As of April 2021, car buyers can receive a maximum SEK 70,000 bonus for certain more fuel efficient vehicles, or conversely be penalized for vehicles emitting more than 95 gCO2/km. The penality (malus) for each gram of CO2 above 95 gCO2/km is an additional cost of SEK 77 per each additional gram, which is charged during the first three years of vehicle use. If the emissions are above 140 gram per km, the owner pays an additional SEK 100 per gram.
15.3.5. Other measures stimulating the implementation of biofuels
Diverse funding agencies and programmes are dedicated to supporting research on hydropower, wind power, solar cells, sustainable biomass production and conversion into district heating as well as CHP plants. Major funding agencies and sources in Sweden include the following:
• Swedish Energy Agency (SEA)
• Swedish Environmental Protection Agency (EPA)
• Swedish Knowledge Centre for Renewable Transportation Fuels (f3)
• Swedish Research Council for Sustainable Development (FORMAS)
• Swedish Research Council (Vetenskapsrådet)
• Mistra Foundation
42 http://www.energimyndigheten.se/fornybart/hallbarhetskriterier/

Sweden
IEA Bioenergy Task 39 - Implementation Agendas: 2019-2021 Triennium Update 284
• Knowledge Foundation (KK-stiftelsen)
• Swedish Government Agency for Innovation Systems (Vinnova)43. Bioenergy has a high priority within Sweden’s R&D portfolio. Over the years, Swedish energy R&D has investigated most of the major economically and environmentally relevant bioenergy topics. The three most ambitious projects up to 2017 in Sweden’s overall energy R&D portfolio all focus on development of new bioenergy technologies and processes: (i) gasification of black liquor, (ii) saccharification and fermentation of woody cellulose and (iii) synthesis of liquid fuels via gasification. These technologies are all considered central to advancing Sweden’s current use of bioenergy. In 2018, the SEA announced a countribution of EUR 50 million to establish and operate a pilot plant to test hydrogen-based steel production, although the biomass component within this project is relatively small. In addition, there are more than 10 research projects focused on biofuels within the SEA’s thermochemical biofuels program (Termokemiska biodrivmedelsprogrammet) up to 2020. In terms of production and budget, the largest research, development and demonstration (RD&D) project is the biomass gasification and biomethane synthesis pilot demonstration plant (Gobigas) in Gothenburg. This project was funded by the SEA as a first demonstration phase. The second phase of the project (Gobigas 2) for a four times scale-up was cancelled despite EU funding in the NER300 program, due to reasons of uncertain financial returns on investment and high capital costs. Other important projects are the RenFuel pilot plant for organic catalysis of lignin to biocrude with a capacity of 3,000 tonnes per year, in which the biocrude is intended to be used for HVO (renewable diesel) production externally and the Bio-DME plant in Piteå producing DME via black liquor gasification. The Swedish EPA also has a $800 million climate investment subsidies program (KlimatKlivet) where projects are developed to reduce fossil fuels use and associated carbon emissions. In this program, there are a few projects involving biofuel production (i.e., pyrolysis of biomass and biogas plants) which are intended to commence plant construction in the next two years. One such project is Pyrocell with 25 000 tonnes of “biooil” where the start of construction was made in March 2020.44,45
15.4. Promotion of advanced biofuels
Following EU policy, there is no special system other than the reduction quota system favouring biofuels that enable high emission reductions. The same tax exemption incentives as other biofuels are applied to advanced biofuels, and all biofuels must also comply with sustainability measurement/verification requirements (i.e., EU sustainability criteria) and fuel quality standards. Table 15.4 lists operational and planned advanced biofuels projects in Sweden.
43 http://www.energimyndigheten.se/fornybart/hallbarhetskriterier/ 44 http://www.energimyndigheten.se/fornybart/hallbarhetskriterier/ 45 www.naturvardsverket.se

Sweden
IEA Bioenergy Task 39 - Implementation Agendas: 2019-2021 Triennium Update 285
Table 15.4. Operational and planned advanced biofuels projects in Sweden
Company Status Technology Production
Capacity
Gothenburg
Energy
Closed Biomass gasification for biomethane 20 MWth
biomethane
Domsjö Fabriker Operational Cooking digester, ethanol 21 ML
SunPine Operational Tall oil separation to raw tall diesel for HVO 100 ML
Preem Operational Hydrogenation to HVO 200 ML
SunPine Operational Tall oil separation to raw tall diesel for HVO 50 ML
Preem Operational Hydrogenation HVO 500 ML
Södra Operational Separation to methanol 5 ML
Setra Construction Wood pyrolysis to biooil for HVO 26,000 tonnes
SCA Planned Tall oil separation to raw tall diesel for HVO 100 ML
St1 Construction Hydrogenation to HVO 200 ML
St1 Planned Hydrogenation to HVO 200 ML
RenFuel Planned Organic catalysis to biocrude for HVO 200 ML
Domsjö Fabriker Planned Biofuels 400 ML
Energifabriken Planned RME 25 ML
Note: St1 in Gothenburg and Agroetanol in Norrköping use bakery wastes and grain to produce ethanol Source: Swedish Energy Agency, 2019b The first bio-SNG plant at industrial scale in the world, GoBiGas in Gothenburg, started operating in 2014. This plant provided 20 MW (160 GWh) of bio-methane to the gas grid. The outcome from the demonstration is that the technology is ready for large scale deployment, applying commercially mature components, for which the production cost would be in the range of EUR 0.55 per litre petrol equivalent (whereas feedstock is 35% of the cost) at the current feedstock price for woody biomass in the region. The demonstration was finalized in March 2018 and the plant was decided to be closed because the right market conditions were not available for the continuation. Forest biomass by-products such as tall oil and lignin are co-processed, or piloted to be co-processed, respectively, in a fossil refinery. Sunpine uses Crude Tall Oil (CTO) to produce Crude Tall Diesel (CTD) on a commercial scale (150,000 cubic metres/year) at its plant in Piteå. The CTD is refined at Preem refinery in Gothenburg to HVO. Preem and Vattenfall recently published plans to use electrolysis to produce the hydrogen gas used for HVO production. Preem and RenFuel are assessing, the construction of the world’s first lignin plant for biofuels, at a pulp mill. This plant is expected to produce an annual volume of 100,000-200,000 tonnes of crude lignol (biooil) for further refining to HVO products. At this point no location has been publicly released. In addition, a joint-venture by Setra and Preem called Pyrocell has been set up. Pyrocell will process sawdust with pyrolysis into liquids and Preem will refine these to HVO biofuels at their refinery. Pyrocell announced in 2019 the selection of the Dutch companies TechnipFMC and BTG BioLiquids (BTG-BTL) to design and build the plant. The startup for some 26,000 tonnes per year is planned for September 2021. A collaboration between Fortum, Preem and Valmet aim to develop and commercialize a pyrolysis technology for upgraded pyrolysis liquid suitable e.g. as refinery co-feed (based on a technology platform

Sweden
IEA Bioenergy Task 39 - Implementation Agendas: 2019-2021 Triennium Update 286
similar to Fortum’s Joensuu bio-oil plant, supplied by Valmet). Preem will process the upgraded pyrolysis liquid into transportation fuels at their refineries.
15.5. Market development and policy effectiveness
Biofuels for transport has expanded quickly in recent years as shown in Table 15.5. In 2017, biofuels accounted for 20.6% of all transport fuels sold in Sweden, compared to 6.9% in 2011. The largest share was HVO fuel, which accounted for two thirds of all biofuels sold an amount equivalent to about 25% of all diesel sold. HVO fuel is based on oleaginous (lipid/fatty acid) feedstocks like tall oil, animal fats, and recovered vegetable oils. HVO is fully blendable with diesel. In current standard for diesel FAME fuels are constricted but there are a standard for neat RME fuel. Table 15.5. Transport fuel consumption (ML) and biofuels market share (%), 2006-2017
Year Petrol Diesel
fuels*
Aviation
fuel
Biodiesel (RME
and HVO)
RME HVO Ethanol
Biofuels market
share (%)
2010 4 322 4 055 191 225 225 0 393 5.8
2011 3 997 4 146 211 295 250 45 410 6.9
2012 3 661 4 025 211 425 294 131 393 8.4
2013 3 460 3 965 211 583 293 289 359 10.3
2014 3 325 3 865 211 806 368 439 324 13.4
2015 3 191 3 945 201 1106 451 655 256 15.7
2016 3 236 4 577 221 1545 341 1204 222 18.6
2017 3 101 4 608 - 1773 326 1446 205 20.8
*Diesel fuels exclude heating oils Source: Swedish Energy Agency, 2019c
Table 15.6 shows Sweden’s biofuel mandates. There is an ethanol mandate for E5. While E10 is also
technically possible, it is not pursued by petrol companies. There is also a biodiesel B5. While B7 is allowed, because of problems using biodiesel in certain cars, B5 is mostly pursued by refineries. Historically and until June 2018, only volumes factored into the use of biofuels in Sweden not energy content or carbon intensity. From July 2019, however, carbon emission reductions have become the dominant factor. There are both EU standards (EN228 and EN590) and Swedish standards (MK1 Petrol and MK1 Diesel). With now improved EU standards, the current differences between the EU and Swedish standards are small. There are also other market mechanisms such as a carbon tax, imposed since January 1991, that apply for households and industry. Until 2010, bioethanol was the most important liquid biofuel in Sweden. Since then it has lost market share because of taxation changes both on fuels and on vehicles for ethanol fuel. Use of diesel type biofuels overtook use of ethanol biofuels in 2011 and diesel biofuels use has continued to grow (from 7.4 PJ in 2010 to 42.7 PJ in 2016). Despite growing biofuels use, Swedish consumption of liquid biofuels is primarily based on imports, with only 10-15% supplied by domestic production. Biogas use in transport has also seen continuous growth in recent years, with interesting development in Liquified Biogas (LBG) (from 1.2 PJ in 2005 to 7.3 PJ in 2016). In recent years, there has been some development with HVO green petrol blended in petrol from some distributors, but volumes smaller than 20 000 cubic metres per year.

Sweden
IEA Bioenergy Task 39 - Implementation Agendas: 2019-2021 Triennium Update 287
Table 15.6. Biofuel obligations/mandates (% by volume)
Year Ethanol Biodiesel Other (specify e.g. advanced fuels)
2010 5 vol.% 5 vol.% E10 is allowed but only E5 obligated B7* is allowed but obligated as B5
2011 5 vol.% 5 vol.% E10 is allowed but only E5 obligated B7 is allowed but obligated as B5
2012 5 vol.% 5 vol.% E10 is allowed but only E5 obligated B7 is allowed but obligated as B5
2013 5 vol.% 5 vol.% E10 is allowed but only E5 obligated B7 is allowed but obligated as B5
2014 5 vol.% 5 vol.% E10 is allowed but only E5 obligated
B7 is allowed but obligated as B5
2015 5 vol.% 5 vol.% E10 is allowed but only E5 obligated B7 is allowed but obligated as B5
2016 5 vol.% 5 vol.% E10 is allowed but only E5 obligated B7 is allowed but obligated as B5
2017 5 vol.% 5 vol.% E10 is allowed but only E5 obligated
B7 is allowed but obligated as B5
2018 5 vol.% 5 vol.% E10 is allowed but only E5 obligated B7 is allowed but obligated as B5
2019 5 vol.% 5 vol.% E10 is allowed but only E5 obligated B7 is allowed but obligated as B5
*B7 has been mostly 7% but depending on price and various problems with RME 5-7% and the distributor Source: Swedish Energy Agency, 2019d There are two ethanol plants in Sweden, the St1 Refinery in Gothenburg with a 5 ML/year capacity. The feedstock for this facility is bakery waste. The second facility is Agroetanol plant in Norrköping with a capacity of 230 ML/year. In some years, one production line was closed and the capacity was only 160 ML/year (initial start-up production capacity). There are two large FAME biodiesel facilities in Sweden. Adesso Bioproducts in Stenungsund have capacity today to produce 155 ML RME (FAME biodiesel) per year. Energifabriken in Karlshamn have capacity to produce 55 ML RME/year. There are also a number of small plants where farmers produce FAME for their own or local consumption and also biogas to bio-CNG plants. Sunpine in Piteå produces 100 ML Raw Tall Diesel (RTD) per year. In December May 2020, one more plant with an additional 50 ML RTD per year capacity came online. RTD is the raw material used to make HVO fuels at Preem. The Preem refinery in Gothenburg has the capacity to produce >200 ML HVO fuels per year including HVO petrol. Table 15.7 summarizes biofuels production capacities.

Sweden
IEA Bioenergy Task 39 - Implementation Agendas: 2019-2021 Triennium Update 288
Table 15.7. Biofuel production – installed production capacity (ML/year), 2006-2017
Year Biodiesel (FAME)
Ethanol (conventional)
Cellulosic ethanol
Biogas as transportation fuel
(consumption)
Renewable diesel (from
lipids)
Other advanced biofuels
2010 203 230 19.5 0.6 TWh 100 1)
2011 203 230 19.5 0.7 TWh 100 1) 2)
2012 203 230 19.5 0.8 TWh 100 1) 2)
2013 203 230 19.5 0.9 TWh 100 1) 2)
2014 203 230 19.5 1.0 TWh 100 1) 2) 3)
2015 203 230 19.5 1.1 TWh 100 1) 2) 3)
2016 203 230 19.5 1.3 TWh 200 1) 2) 3)
2017 203 230 19.5 1.5 TWh 200 1) 2) 3)
1. Since 2004, the Biorefinery Demo Plant, a cellulosic ethanol pilot plant with a capacity of 300-400 litres per day, has been operated under the auspices of Research Institutes of Sweden (RISE)); if operated at capacity for 300 days per year, it has an annual ethanol production capacity of 120,000 liters.
2. Since 2011, a pilot plant for bio-DME production from black liquor has been operating with a capacity of 4 ton per day; if operated 300 days year, its annual capacity is 1200 tonnes.
3. Since 2014, a pilot plant for biomethane production via biomass gasification has been operating with a methane synthesis capacity of 20 MWth biomethane; if operated 300 days per year, its annual capacity is 11,200 tonnes.
There are also approximately 300 biogas plants in Sweden, nearly all of them small in comparison with other Swedish biofuels plants. It is difficult to estimate total production capacity as a varying share is further upgraded to biomethane for transport. The other plants produce biogas used for power and heat production.46
15.6. Coprocessing at oil refineries
Preem is the largest fuel company in Sweden, and also Sweden’s largest refiner with two plants in Gothenburg and Lysekil. Preem refine and sell gasoline, diesel, heating oil and renewable fuels to companies and consumers in Sweden and abroad. Preem accounts for 80 percent of the Swedish refinery capacity and 30 percent of the Nordic refinery capacity. In total, nearly 18 million cubic meters of crude oil are refined every year at their wholly owned refineries Preemraff Göteborg and Preemraff Lysekil with refining capacity of 6.0 million and 11.4 million tonnes per year, respectively. This provides a total refining capacity of around 345,000 barrels per calendar day, which corresponds to 15 percent of Sweden’s total energy consumption. About two-thirds of the products are exported. The two refineries, Preemraff Lysekil and Preemraff Göteborg, are designed to process several qualities of crude oil. Availability and a lower price of crude oils with high sulfur content increase the use of these crude oils within Preemraff. The strategy is that the refinery operates at maximum capacity, i.e., about 11.4 million tons/year. In recent years the strategy has been to focus production on so-called environmentally-classed products. Preem refines biobased oils with coprocessing to HVO products in Gothenburg and is investing to also refine in Lysekil. Several investment projects have increased the coprocessing capacity along the general plan for modernising the refineries. St1 Sverige has a refinery in Gothenburg called St1 Refinery, which was purchased from Shell in 2010. Out of about 4 million tonnes of crude oil the refinery produces liquid propane gas (LPG), aviation fuel, petrol
46 http://www.energimyndigheten.se/fornybart/hallbarhetskriterier/

Sweden
IEA Bioenergy Task 39 - Implementation Agendas: 2019-2021 Triennium Update 289
and diesel and marine fuels with low sulphur content. The refinery also has a small ethanol plant from bakery wastes. The refinery also produces district heat for the city of Gothenburg, of 660 GWh per year. Every fourth house-hold is heated by the refinery waste heat, making it the world’s largest waste heat recovery plant. The refinery has a capacity of 30 million barrels per year of crude oil, about 11 500 tonnes per day. The corresponds to about 25% of the total demand for oil products in Sweden. The main product is sulphur-free diesel and other middle distillates. In total 60 products are supplied to Scandinavia. Nynäs is a specialty oil refining company with two refineries in Sweden which together processes about 1 million tonne of crude oil. The main refinery in Sweden is located in Nynäshamn where every three months one ship with 80 000 tonnes of crude oil enters from fields in the Nordic Sea to Nynäshamn. A smaller refinery is located in Gothenburg. The core competence is the refining of heavy oils to balanced product mix of naphtenic specialty oils and bitumen products. Every year 2.5 million tonnes of bitumen and naphtenic specialty oils are produced in the four refineries with the other two located in Germany and in United Kingdom.
15.7. Conclusions
With the current strategy of Preem and St1 for large production increase in HVO there will be much focus on co-processing as well as dedicated on biofuels in single-lines. There is little information on details on how the co-processing is done and how other biobased oils will be refined. The regulation makes it possible to co-process but the market value has been in the dedicated neat biofuels. However, with the limited tax exemption the main market will likely be blending with petrol and diesel. Therefore, the dedicated processing is not a necessity, unless EU regulations will stipulate this as only approved way of production in coming years in the sustainable criteria.
Sources
IEA Bioenergy - Country reports, 2018. Sweden - 2018 update Bioenergy policies and status of implementation. http://www.energimyndigheten.se/fornybart/hallbarhetskriterier/ www.svebio.se www.naturvardsverket.se www.scb.se https://www.naturvardsverket.se/upload/miljoarbete-i-samhallet/internationellt-miljoarbete/miljokonventioner/FN/nir-sub-15-april.pdf. Swedish Energy Agency, 2019. Available at: http://www.regeringen.se/artiklar/2017/09/bonusmalus-och-branslebytet/. Swedish Energy Agency, 2019a. Available at: https://www.energimyndigheten.se/globalassets/fornybart/hallbara-branslen/reduktionsplikt/kontrollstation-2019.pdf Swedish Energy Agency, 2019b. Available at: http://www.energimyndigheten.se/fornybart/hallbarhetskriterier/. Swedish Energy Agency, 2019c. Available at: http://www.energimyndigheten.se/fornybart/hallbarhetskriterier/. Swedish Energy Agency, 2019d. Available at: http://www.energimyndigheten.se/fornybart/hallbarhetskriterier/. Swedish Energy Agency, 2020. Available at: http://www.energimyndigheten.se/nyhetsarkiv/2020/energilaget-2020---en-samlad-bild-pa-energiomradet-i-sverige/. Swedish Energy Agency, 2020a. Available at: http://www.energimyndigheten.se/globalassets/statistik/prognoser-och-scenarier/kortsiktsprognos-i-siffror-vinter-2020-4ar.xls Worldmeters, 2019. Available at: https://www.worldometers.info/co2-emissions/sweden-co2-emissions/.

United States
IEA Bioenergy Task 39 - Implementation Agendas: 2019-2021 Triennium Update 290
16. United States
James D. McMillan, National Renewable Energy Laboratory
Summary • The federal RFS2 is the primary policy encouraging biofuels use in the United States. Besides the
RFS2, another strong policy driving increased biofuels production and use in the US is California’s Low-Carbon Fuel Standard (LCFS).
• Compared to the RFS2 program in which there are volumetric mandates for renewable fuels, California’s LCFS is fuels agnostic and incents low carbon fuels, with credits or deficits generated based on a fuel’s carbon intensity.
• In addition to federal and state legislations supporting the production and use of biofuels to help decarbonize the US’s transportation sector, increasing Corporate Average Fuel Economy (CAFÉ) standards have been contributing to the decarbonization of the transportation sector by reducing energy consumption through higher fuel economy of light duty vehicles (cars and trucks).
• There are also blenders credits in force at times/in specific time periods for various biofuels. The blenders credit has been particularly important for expansion of biodiesel production in recent years. Various incentives that vary by city or state also exist.
• In 2017, a total of 15.8 billion gallons (59.8 billion liters) of fuel ethanol was produced and diesel biofuels production reached about 2.5 billion gallons (9.5 billion liters). Total production of renewable diesel, cellulosic biofuels, and biojet in 2017 was 453, 10, and 1.7 million gallons (1715, 38, 6.5 million liters), respectively.
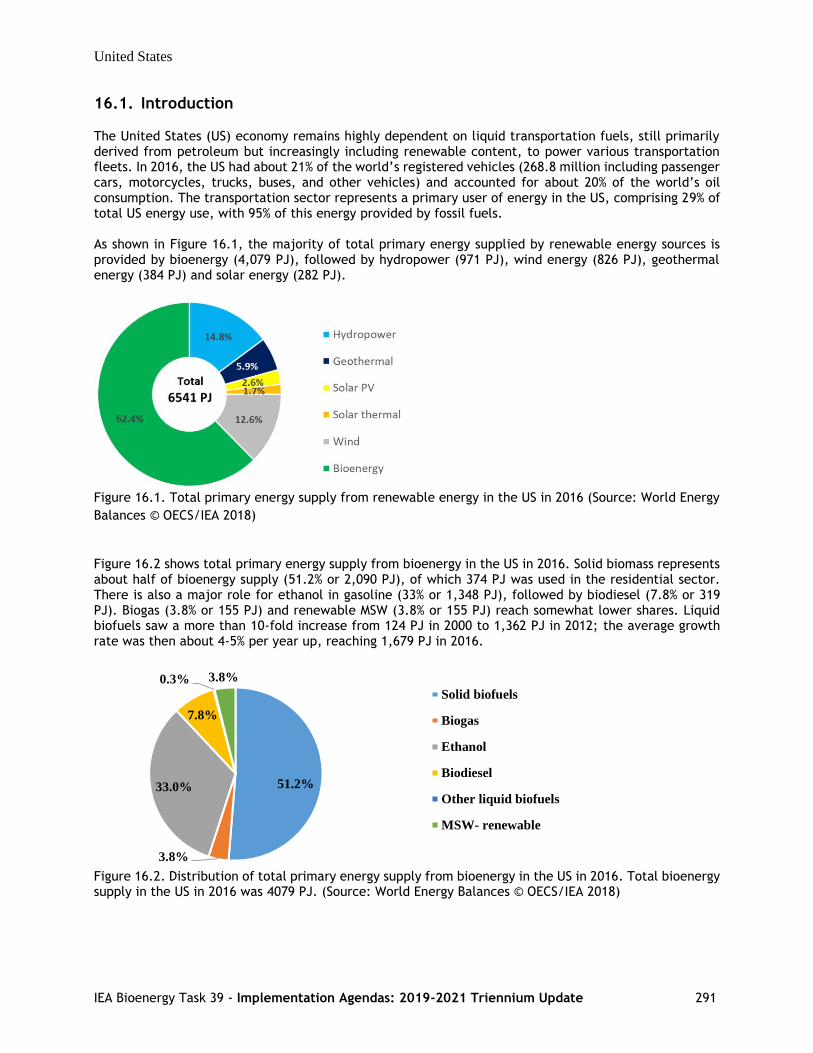
United States
IEA Bioenergy Task 39 - Implementation Agendas: 2019-2021 Triennium Update 291
16.1. Introduction
The United States (US) economy remains highly dependent on liquid transportation fuels, still primarily derived from petroleum but increasingly including renewable content, to power various transportation fleets. In 2016, the US had about 21% of the world’s registered vehicles (268.8 million including passenger cars, motorcycles, trucks, buses, and other vehicles) and accounted for about 20% of the world’s oil consumption. The transportation sector represents a primary user of energy in the US, comprising 29% of total US energy use, with 95% of this energy provided by fossil fuels. As shown in Figure 16.1, the majority of total primary energy supplied by renewable energy sources is provided by bioenergy (4,079 PJ), followed by hydropower (971 PJ), wind energy (826 PJ), geothermal energy (384 PJ) and solar energy (282 PJ).
Figure 16.1. Total primary energy supply from renewable energy in the US in 2016 (Source: World Energy
Balances © OECS/IEA 2018)
Figure 16.2 shows total primary energy supply from bioenergy in the US in 2016. Solid biomass represents about half of bioenergy supply (51.2% or 2,090 PJ), of which 374 PJ was used in the residential sector. There is also a major role for ethanol in gasoline (33% or 1,348 PJ), followed by biodiesel (7.8% or 319 PJ). Biogas (3.8% or 155 PJ) and renewable MSW (3.8% or 155 PJ) reach somewhat lower shares. Liquid biofuels saw a more than 10-fold increase from 124 PJ in 2000 to 1,362 PJ in 2012; the average growth rate was then about 4-5% per year up, reaching 1,679 PJ in 2016.
Figure 16.2. Distribution of total primary energy supply from bioenergy in the US in 2016. Total bioenergy supply in the US in 2016 was 4079 PJ. (Source: World Energy Balances © OECS/IEA 2018)
51.2%
3.8%
33.0%
7.8%
0.3% 3.8%
Solid biofuels
Biogas
Ethanol
Biodiesel
Other liquid biofuels
MSW- renewable

United States
IEA Bioenergy Task 39 - Implementation Agendas: 2019-2021 Triennium Update 292
16.2. Main drivers for biofuels policy
The main drivers currently are job creation, rural development and energy security, together bundled as “advancing a thriving bioeconomy.” (https://energy.gov/eere/bioenergy). The strategic plan for the Bioenergy Technologies Office (BETO), the office within the United States Department of Energy (DOE) leading biofuels development, is available at: https://www.energy.gov/sites/prod/files/2017/09/f36/beto_strategic_plan_december_2016.pdf. Climate change mitigation was previously a large driver but is no longer a major driver under the current administration. However, it is likely to become a key driver again in the near future as already mounting climate disruption worsens and the ability to dispute or disregard the growing peril of global warming wanes.
16.3. Biofuels policy
Historically, in past administrations, especially before the tight oil fracking revolution over the past decade, the main drivers for developing biofuels in the US have been energy security first and foremost and then also and increasingly climate change mitigation. Before US domestic petroleum production increased due to fracking, petroleum imports into the US accounted for over 60% of total consumption and the level of imports was continuing to grow. In recent years, due to the fracking revolution, this trend has impressively been reversed. In 2017, US net imports of petroleum accounted for only 19% of US petroleum consumption, the lowest level since 1967 (EIA, 2018). As shown in Figure 16.3, in 2017 total net energy imports into the US fell to 7.3 quadrillion British thermal units (quads), a 35% decrease from 2016 and the lowest level since 1982. In 2017, the US also substantially increased its fossil fuel exports over 2016 levels, with larger exports of crude oil (89% higher), petroleum products (11%), natural gas (36%), and coal (61%). Petroleum products including gasoline, distillate fuel, propane, and other fuels currently comprise the majority (54%) of US energy exports.
Figure 16.3. US gross and net energy trade (1950-2017)
In addition to the significant increase in the domestic production of fossil fuels, continuing relatively low petroleum prices and an unclear carbon policy landscape are hindering further investment in conventional and especially advanced liquid biofuels. This situation won’t likely change until the future of both the federal renewable fuel standard (RFS2) and the corporate average fuel economy (CAFÉ) vehicle efficiency standards are better understood. These policies remain under discussion for revision, and policy changes are anticipated, however it remains unclear what they will be.
Qu
adri
llio
n B
riti
sh t
her
mal
unit
s (q
uad
s)

United States
IEA Bioenergy Task 39 - Implementation Agendas: 2019-2021 Triennium Update 293
16.3.1. Biofuel obligations
The Energy Independence and Security Act (EISA) was enacted in 2007 to enhance domestic production of fuels and spur economic development while reducing reliance on imports and improving the environment (through reducing both the absolute level of fossil fuel use (lowering GHG emissions), and fuel combustion-related pollution such as ground-level ozone and smog). This EISA contains a number of provisions to increase the energy efficiency and the availability and use of renewable energy. One of these provisions amended the original Renewable Fuels Standard (RFS) created under the Energy Policy Act of 2005. The 2007 amended RFS (RFS2) targets the ramping up of domestic biofuel production to 36 billion gallons per year (BGY) by 2022 (over 136 billion liters). As depicted in Figure 16.4, this comprises 15 BGY of conventional corn starch-based ethanol (~ 57 billion liters) and 21 BGY of advanced, cellulosic and biodiesel biofuels (~ 80 billion liters) (i.e., 16 BGY of cellulosic biofuels, 4 BGY of advanced biofuels, and 1 BGY of biomass-based biodiesel). The Clean Air Act provides EPA authority to adjust cellulosic, advanced and total volumes set by Congress as part of the annual rule process, and volume obligation targets for advanced biofuels have been lowered in recent years owing to commercial production levels lagging initial expectations, e.g., the de facto stalling of commercial deployment of cellulosic ethanol following the crash in oil prices in mid 2014. The EISA legislation also contains a general waiver authority that allows the Administrator (EPA) to waive the RFS volumes, in whole or in part, based on a determination that implementation of the program is causing severe economic or environmental harm, or based on inadequate domestic supply. Table 16.1 shows the four categories of renewable fuels mandated under the RFS program.
Figure 16.4. Volume targets for renewable fuels under revised RFS2 as orginally enacted in 2007

United States
IEA Bioenergy Task 39 - Implementation Agendas: 2019-2021 Triennium Update 294
Table 16.1. Renewable fuels categories under the RFS program
Category Code Minimum GHG reduction
requirement1
Description
Cellulosic Biofuel D3 60% Renewable fuels made from cellulose, including ethanol, renewable gasoline, biogas-derived CNG and LNG
Cellulosic Diesel D7 60% Cellulosic diesel, jet fuel and heating oil
Advanced Biofuel D5 50% Renewable fuels other than ethanol derived from corn starch (sugar cane ethanol), biogas from other waste digesters, etc.
Biomass-derived Diesel
D4 50% Renewable fuels that meet the definition of either biodiesel or non-ester renewable diesel
Renewable Fuel D6 20% Renewable fuels produced from corn starch or any other qualifying renewable biomass
1 compared to the petroleum baseline In November 2018, EPA finalized volume requirements under the RFS program for 2019. Table 16.2 lists these volumes for four categories of biofuels. The volume requirements has increased for all biofuels categories. The highest change is seen in cellulosic biofuels with over 100 million gallons increase in 2019 compared to 2018. Table 16.2. Biofuels volume requirement under EPA RFS program (Biofuels Digest, 2019)
Year 2018 2019 Change in 2019 compared to 2018
Cellulosic biofuels (billion gallons) 0.311 0.418 +35%
Biomass-based diesel (billion gallons) 2.00 2.10 +5%
Advanced biofuels (billion gallons) 4.28 4.92 +15%
Renewable biofuels (billion gallons) 19.28 19.92 +3%
Total biofuels 25.87 27.36 +5.8%
The federal RFS is the primary policy encouraging biofuels use in the United States. The RFS is implemented by the US Environmental Protection Agency (US EPA). EPA implements the revised program (RFS2) in consultation with the USDA and US Department of Energy (USDOE). An overview of the program and its history of development is provided at: https://www.epa.gov/renewable-fuel-standard-program/overview-renewable-fuel-standard. Obligated parties under the RFS program are refiners or importers of gasoline or diesel fuel. Compliance is achieved by blending renewable fuels into transportation fuel, or by obtaining credits, called “Renewable Identification Numbers” (RINs) to meet an EPA-specified Renewable Volume Obligation (RVO). RVO percentages are calculated by dividing the mandated quantity of each renewable fuel type by the total estimated supply of non-renewable gasoline and diesel fuel in each year. The RVOs are applied to each obligated party's actual supply of gasoline and diesel fuel to determine its specific renewable fuel obligation for that year. To qualify as a renewable fuel under the RFS program, a fuel should be produced from an approved feedstock through an approved pathway. For a given approved feedstock, there can be several approved conversion pathways. A RIN is generated when a producer makes a gallon of renewable fuel by an approved pathway and this RIN is then attached to it. Obligated parties should blend the renewable fuel into fuel derived from petroleum, or purchase RINs credits to meet their specified annual volume obligation. RINs are traded in two forms: 1) “assigned RINs” are directly associated with a batch of fuel and purchasers obtain both the renewable fuel and the RINs together; and 2) “separated RINs” are separated from a specific batch of renewable fuel and are traded separately. The renewable fuel producer generates these separated RINs and market participants can then trade these RINs with obligated parties that can obtain and retire them for compliance with annual RVOs. Figure 16.5 shows a schematic of a RIN’s lifecycle under the RFS program.

United States
IEA Bioenergy Task 39 - Implementation Agendas: 2019-2021 Triennium Update 295
Figure 16.5. Lifecycle of a Renewable Identification Number (RIN) under RFS program (US EPA, 2017)
Besides the RFS, another strong policy driving increased biofuels production and use in the US is California’s Low-Carbon Fuel Standard (LCFS). The main goal of this legislation is to decarbonize the transportation sector by at least 10% by 2020 (from a 2010 baseline) by using low-carbon alternative fuels such as ethanol, biojet and biodiesel as well as cleaner burning fossil fuels such as CNG and LNG. Enacted in 2007, with specific eligibility criteria defined by the California Air Resources Board (CARB) in April 2009, and first taking effect in January 2011, this legislation was readopted in 2015. CARB is the responsible organization in California to implement and monitor LCFS. Compared to the RFS program in which there are volumetric mandates for renewable fuels, California’s LCFS incentivizes production of low carbon fuels. The LCFS program is fuels agnostic, with credits or deficits generated based on a fuel’s\ carbon intensity (CI). All fuels and energy systems compete against each other including natural gas, electricity\, biofuels, etc. Figure 16.6 shows the volumes of alternative fuels (low carbon fuels) consumed in California from 2011 to 2017. The total volume of alternative fuels increased 60% in 2017, from 1,152 million gasoline gallon equivalent (GGE) in 2011 to 1,930 GGE. California’s LCFS works with three other programs to reduce transportation GHG emissions (i.e., its Cap-and-Trade Program, Advanced Clean Car Program, and SB 375 legislation). Other jurisdictions following California include Oregon and Washington in the US and British Columbia in Canada. Together, they have formed a regional initiative called the Pacific Coast Collaborative. Each jurisdiction has its own LCFS in place and a regional low-carbon fuels market is being considered for the future. An overview of California’s LCFS program and its history of development is provided at: https://www.arb.ca.gov/fuels/lcfs/lcfs.htm. Beyond California and structured to more broadly support bio-based production, Iowa has developed a bio-based chemicals production credit program: https://tax.iowa.gov/legislative-summaries/renewable-chemical-production-tax-credit-program). A variety of fuels are being sold into California, but the main product is ethanol, as shown in Figure 16.6. Ethanol is coming mostly from US midwest states such as Minnesota, Iowa, Kansas, Nebraska, Illinois, and Indiana. The lowest CI ethanol is the most likely product to be sold into the California market, as it has more credit value for the producer. The most efficient plants from a production standpoint, and ones using alternative feedstocks or who have very good energy profiles, are the producers servicing the California market. Geography matters as well, and how and how far fuels have to travel to market can also be an important factor. Credits are available for qualifying production under both the US federal RFS and state of California LCFS. Standard measurements and/or verification processes are not yet in force. Many sustainability metrics and measurement schemes are being examined (e.g., GBEP indicators) however more work is needed to develop consensus reporting requirements and certification procedures.

United States
IEA Bioenergy Task 39 - Implementation Agendas: 2019-2021 Triennium Update 296
Figure 16.6. Alternative low-carbon fuel volumes used in California (California Air Resources Board, 2019)
California is pushing its GHG reduction goals beyond its original 2020 goal. The original provision in California’s Global Warming Solutions Act of 2006 required California to reduce its GHG emissions to 1990 levels by 2020. Updated legislation increases this goal to reduce emissions 80% below 1990 levels by 2050. The LCFS is a key element of the strategy to decarbonize the transportation sector, requiring a 10% reduction in the CI of transportation fuels between 2011 and 2020. CARB is poised to extend its LCFS program to 2030 and require a 20% reduction to be achieved. CARB continues to work on refining and updating its LCFS program to make it an ever more effective tool for reducing emissions. Most recently, California’s Greenhouse Gases, Regulated Emissions and Energy Use in Transportation (CA GREET) model for fuel ethanol was updated to reflect industry’s production efficiency improvements, which is expected to create more credit generation by the program. CARB has also added additional crediting mechanisms, i.e., new ways to generate credits, one of these being by using alternative (lower CI) jet fuel. Another new pathway that could be very beneficial for the ethanol industry is to recognize and reward carbon capture and sequestration (CCS). If this moves forward, CCS could provide a new source of revenue, a lot of GHG reduction and a significant new area for credit generation. One of the other big changes being implemented in California’s LCFS is third-party verification. CARB will require facilities to contract an indepenent third party to verify their pathway (application data) is indeed valid. Verification is one of the most important amendments being proposed by CARB, as it will provide a way for CARB to better understand how the fuels production plants are operating. Traditionally, custom pathways were outlined for plants based on a facility’s CI score. Many factors go into determining the CI of a plant, such as how much energy it is using, what kind of energy it is using, what production yield it is achieving, what coproducts it is producing, and more. The challenge for CARB is keeping track of all of the salient information. The large amount of data that needs to be tracked stretches CARB’s capabilities, so it has requested third parties to become CARB-certified verifiers (after having satisfactorily completed requisite training programs) to assist this effort. Third-party verification will become mandatory for any LCFS participants in 2019. The goal is for most of the amendments to take effect January 2019, but some will be phased in over time47.
47 http://www.ethanolproducer.com/articles/15575/lcfs-matures
0
500
1,000
1,500
2,000
2,500
2011 2012 2013 2014 2015 2016 2017
Fu
el V
olu
me
(Mil
lon
GG
E) Electricity
Biomethane
Fossil Natural Gas
Renewable Diesel
Biodiesel
Ethanol

United States
IEA Bioenergy Task 39 - Implementation Agendas: 2019-2021 Triennium Update 297
Similar to the California LCFS, Oregon’s Clean Fuels Program was initiated in 2009. In some respects, it does not have as many regulations as California’s program does however it also requires a minimum of 10% CI reduction over 10 years. In 2015, the Oregon legislature passed S.B. 324 which allowed for the full implementation of the Clean Fuels Program within the calendar year 2016. Currently there is a single biodiesel producer pathway approved for the program. Oregon also has an existing renewable fuel standard which requires blending of 5% biodiesel into the transportation diesel supply. Other regions in the US are considering similar legislation. The US midwest has shown interest several times in creating its own LCFS program, as it would be a lot easier to transport and sell fuel within the midwest where the majority of US biofuels are produced. In Minnesota, B20 will be in effect during the state’s summer months of April through September; the biodiesel minimum blend level will remain at 5% October through March.
16.3.2. Excise duty reductions
There are also blenders credits that are in force at times/in specific time periods for various biofuels; the blenders credit has been particularly important for expansion of biodiesel production in recent years. Various incentives that vary by city or state also exist. At the end of 2015, the biodiesel blender’s tax credit of $1.0 per gallon was extended through 2016 (and to retroactively cover 2015). There have been tax credits for the purchase of alternative fueled vehicles, e.g., flex-fuel, in the past, but none at present except for electric or fuel cell vehicles.
16.3.3. Fiscal incentives and investment subsidies
Both USDA and US DOE administer loan guarantee programs intended to buy down the risk of constructing first of a kind scaled up commercial facilities. The USDA’s 9003 Biorefinery Assistance Program assists companies in the development, construction, and retrofitting of new and emerging technologies for advanced biofuels, renewable chemicals and bio-based products by providing loan guarantees of up to $250 million for first of a kind commercial facilities. Information on US DOE’s Loan Guarantee Program can be found here. Other agencies such as the US EPA and the National Science Foundation (NSF) also provide funding, mostly for research, some directed at biofuels. There are many other laws and incentives depending upon the fuel type and jurisdiction. The USDOE’s Alternative Fuels Data Center provides a good single site for finding/searching these many laws and incentives at both federal and state levels: https://www.afdc.energy.gov/laws. In addition to federal and state legislations supporting the production and use of biofuels to help decarbonize the US’s transportation sector, increasing Corporate Average Fuel Economy (CAFÉ) standards have been contributing to the decarbonization of the transportation sector by reducing energy consumption through increasing the fuel economy of light duty vehicles (cars and trucks). Increasing CAFÉ standards have been highly effective in reducing demand for transport fuels. More information on the US’s CAFE standards can be found at: https://www.nhtsa.gov/laws-regulations/corporate-average-fuel-economy. Carbon taxes continue to be lobbied for by various stakeholder groups, however no legislation is yet under serious consideration. Emission trading schemes and state compacts are being used for acid rain-precursors but not yet for GHGs.
16.3.4. Other measures stimulating the implementation of biofuels
The USDA and US DOE and some states also administer a wide variety of programs aimed at encouraging greater production and use of bioproducts and biofuels. USDA’s National Institute of Food and Agriculture (NIFA) through its Division of Bioenergy supports research on sustainable production of biomass, genomic improvement of bioenergy feedstocks, as well as other areas of biomass conversion. NIFA has provided financial incentives for feedstock development such as in the Advanced Hardwood Biofuels Northwest and

United States
IEA Bioenergy Task 39 - Implementation Agendas: 2019-2021 Triennium Update 298
Northeast Woody/Warm-season Biomass Consortium initiatives. A listing of projects facilitating the development of regional bio-based industries producing advanced biofuels, industrial chemicals, and other bio-based products can be found here. In addition, USDA’s Agricultural Research Service (ARS) focuses on feedstock development, feedstock production and biorefining. The Food, Conservation, and Energy Act of 2008 (2008 Farm Bill) established new energy programs, including the Biorefinery Assistance Program, the Biobased Marketing Program and the Biomass Crop Assistance Program (BCAP). The Agricultural Act of 2014 (2014 Farm Bill) reauthorized and provided $880 million for energy programs established in the 2008 Farm Bill; expanded the Biorefinery Assistance Program to include biobased products and renewable chemical manufacturing; and expanded the Biopreferred program to include forestry products. The USDA Biomass Crop Assistance Program (BCAP) was created to support the establishment and production of eligible crops for conversion to bioenergy in selected BCAP project areas; and to assist agricultural and forest land owners and operators with collection, harvest, storage, and transportation of eligible material for use in a biomass conversion facility. The 2014 Farm Bill authorized $3 million support for biomass research and development grants. US DOE has supported related feedstock supply chain development such as Sun Grant/DOE Regional Biomass Feedstock Partnership and Feedstock-Conversion Interface Consortium. Information about US DOE’s feedstock development and conversion programs can be found here. The US DOE provides research funding through both its Office of Energy Efficiency and Renewable Energy’s (EERE) (primarily via EERE’s Bioenergy Technologies Office (BETO)) and its Office of Science (SC) (primarily via SC’s Biological and Environmental Research Office (BER)). Funding is directed at advancing biochemical, thermochemical and hybrid biofuels production technologies. The primary focus is on non-food/feed feedstocks such as lignocellulosic biomass, photosynthetic algae and carbonaceous waste streams such as municipal solid waste (MSW) and CO/CO2 rich gases. Over the past 10 years (2007–2017), three Bioenergy Research Centers (BRCs) supported by the Genomic Science program within DOE’s SC BER Office have made significant advances toward the bio-based economy. These centers are the Great Lakes Bioenergy Research Center, the Joint BioEnergy Institute, and the BioEnergy Science Center (now becoming the Center for Bioenergy Innovation). In February, a fourth DOE-funded center also began operating, the Center for Advanced Bioenergy and Bioproducts Innovation. These BRCs are producing multiple breakthroughs in the form of deepened understanding of sustainable biomass production practices, targeted re-engineering of biomass feedstocks, development of new methods for deconstructing feedstocks, and engineering of enzymes, microbes and inorganic catalysts for more effective production of a diverse range of biofuels and bio-based products. Another supporting initiative by DOE is the State Energy Program (SEP) to help advance the clean energy economy while contributing to national energy goals.
16.4. Promotion of advanced biofuels
Despite the substantial presence of conventional biofuels (i.e., biodiesels and starch-based ethanol) in the US transportation fuel market, the production of advanced cellulosic feedstock-based biofuels remains relatively small. Advanced biofuels production volumes remain far below original targets due to slower than expected progress in scale up and deployment of commercial production of cellulosic ethanol and other advanced biofuels. In 2017, total production of renewable diesel, cellulosic biofuels, and biojet was 453, 10, and 1.7 million gallons (1,715, 38, 6.5 million liters) respectively (based on EPA RIN data). Future production level increases depend on the ability to export as well as on how fast cellulosic biofuels production can be ramped up. It is anticipated that biofuels production for the aviation sector will continue to increase, in part due to the anticipated global expansion of commercial aviation and limited alternative options beyond low carbon biofuels to decarbonize this sector. Additionally, the US military previously committed to increase its use of domestically manufactured aviation fuel and biodiesel fuels as part of a national security imperative. However, while the US Secretaries of Agriculture, Energy, and the Navy in 2011 signed a Memorandum of Understanding to commit $ USD 510 million ($170 million from each agency) to produce

United States
IEA Bioenergy Task 39 - Implementation Agendas: 2019-2021 Triennium Update 299
hydrocarbon jet and diesel biofuels, the future of this initiative is currently unclear and under discussion. Table 16.3 lists operational, under construction and planned biojet and renewable diesel production facilities in the US. Table 16.3. Operational and planned jet fuel and renewable diesel production facilities in the US.
Project Name
Location Feedstock Technology Capacity (ML/year)
Operational - year started or
anticipated
Fulcrum Sierra Biofuels
Storey County, NV
MSW Gasification 38 2019
Emerald Biofuels
Gulf Coast Fats, oils, and greases
HEFA 333 2017
Red Rock Biofuels
Lakeview, OR
Woody biomass
Gasification, micro-channel FT
61 2017
AltAir Fuels Los Angeles, CA
Fats, oils, and greases
HEFA 152 2016
REG Synthetic Fuels
Geismar, LA Fats, oils, and greases
HEFA 284 2014
Diamond Green Diesel
Norco, LA Fats, oils, and greases
HEFA 568 2013
SG Preston South Point, OH
Fats, oils, and greases
HEFA 455 2020
SG Preston Logansport, IN
Fats, oils, and greases
HEFA 455 2020
With the support from US federal and state agencies and many collaborations among universities, national labs and companies, the science and technology for producing lower carbon renewable biofuels keep marching forward with the efficiencies and technology readiness levels of many routes to biofuels continuing to improve. Recent examples of such advances include:
• Demonstration of commercial-scale cellulosic ethanol production improving: In 2017, POET-DSM’s pioneer cellulosic ethanol production facility in Emmetsburg, Iowa, reported beginning to routinely achieve corn stover conversion yields of 70 gallons ethanol per bone-dry ton of biomass, near this plant’s design target, albeit this facility remains in a ramp-up phase for plant throughput. More recently, POET-DSM announced it is going to add on-site enzyme manufacturing to this facility.
• Ethanol production from corn fiber being implemented in existing corn dry mills: Ethanol production from corn fiber has become an area of active R&D and commercialization since 2014, when the EPA classified corn kernel fiber as a crop residue, with multiple routes now being commercialized to convert some or most of the corn kernel fiber byproduct present in dry mill ethanol facilities to ethanol. These technologies enable conventional corn ethanol dry mill plants to generate 2%-10% additional ethanol (cellulosic ethanol) from their captive fibrous residue stream(s). Technology development companies with patented corn fiber to cellulosic ethanol pathways include D3MAX, Edeniq, ICM and Quad County Corn Processors. EPA has so far approved seven corn ethanol plants to produce cellulosic ethanol from corn kernel fiber (Table 16.4).

United States
IEA Bioenergy Task 39 - Implementation Agendas: 2019-2021 Triennium Update 300
Table 16.4. List of ethanol plants approved to generate RINs from corn kernel fiber
Corn Ethanol Plant Location Data approved by EPA to generate cellulosic ethanol
Quad County Corn Processors Galva, IA October 2014
Pacific Ethanol Stockton, CA September 2016
Flint Hills Resources Shell Rock, IA December 2016
Little Sioux Corn Processor Marcus, IA January 2017
Siouxland Energy & Livestock Cooperative
Sioux Center, IA
June 2017
Flint Hills Resources Iowa Falls, IA October 2017
Mid America Agri Products/Wheatland LLC
Madrid, NE December 2017
The increase in cellulosic ethanol production owing to increasing implementation of corn fiber conversion technology as well as increasing production from the POET-DSM plant discussed above is measurable. Cellulosic ethanol production was more than doubled from 3.8 million gallons (14.3 million liters) in 2016 to 10 million gallons (38 million liters) in 2017 (see Figure 16.7), as more corn stover- and corn kernel-based ethanol production came online. EPA RIN data indicate production volumes are continuing to increase during 2018 year to date.
• Drop-in fuels by co-processing in petroleum refineries advancing: Co-processing refers to the simultaneous processing of biogenic and fossil (petroleum) feedstocks, especially combined processing in existing petroleum refineries of biomass-derived biocrudes or bio-oils with intermediate petroleum distillates such as vacuum gas oil (VGO). This co-processing approach is of interest because of its potential to use existing fuel refining, distribution and storage infrastructure to produce lower carbon drop-in fuels. Several national labs and universities are active in co-processing R&D, and a few commercial refiners are exploring production at pilot and larger scales. Current research is mostly examining the potential to do such co-processing using fluid catalytic cracking (FCC) or hydrocracking/hydrotreating units in existing refineries. Research to date suggests that co-processing of up to 20% (by wt.) biogenic oils (e.g., vegetable oils, animal fats) with VGO may be possible in FCC units. The US DOE estimates that more than 8 billion gallons of renewable hydrocarbon fuels (over 30 billion liters) could potentially be produced via co-processing using the 110 FCC units that already exist in the US.
Figure 16.7. Production of cellulosic ethanol, 2012-2017 (based on EPA RIN data)
20,069 0728,509
2,181,096
3,805,246
10,046,934
0
2,000,000
4,000,000
6,000,000
8,000,000
10,000,000
12,000,000
2012 2013 2014 2015 2016 2017
Cel
lulo
sic
ethan
ol
(gal
lons)

United States
IEA Bioenergy Task 39 - Implementation Agendas: 2019-2021 Triennium Update 301
• Commercialization of ethanol from CO/syngas progressing: LanzaTech’s gas fermentation platform enables regional production from local wastes and residues, including gases as varied as industrial flue gas, gasified biomass wastes and residues, biogas, and high-CO2 stranded natural gas. Originally founded in 2005 in New Zealand, the company relocated its headquarters to the US in 2014.
• Co-optimization of fuels and engines: The US DOE’s crosscutting “Co-Optima” initiative tackles fuel and engine innovation from a systems perspective, with the goal of optimizing overall performance and efficiency. This initiative seeks to improve transportation fuel economy 15%–20% beyond business as usual targets for separate R&D on engines and fuels. This is a large collaboration drawing on the expertise of two DOE research offices, nine national laboratories, and numerous industry and academic partners. Results to date indicate that increasing the efficiency of internal combustion engines through the use of renewable blending components has great potential to increase the efficiency of both conventional and hybrid vehicles. Higher octane gasoline allows for greater fuel efficiencies, but engines must be tuned to optimally run on higher octane blends. By matching high octane fuels to high compression ratio engines, the auto industry can gain an additional 3-4.5% in vehicle efficiency. More information on Co-Optima can be found at: https://www.energy.gov/eere/bioenergy/co-optimization-fuels-engines.
• Algae-based biofuels: Algae have significant potential to support an advanced biofuels and biorefining industry in the US, and the goal of US DOE BETO’s Advanced Algal Systems Program is to develop cost-effective algal biofuels production and logistics systems. Since reviving its algal biofuels program in 2009, BETO has invested in a variety of research, development, and demonstration projects tackling the barriers to economic scale-up of commercial algal biofuels. A recent report, “National Algal Biofuels Technology Review” discusses the current status and remaining challenges to commercialize production of algal-based biofuels and bioproducts in the US.
• Feedstock development: Research is also underway to develop improved biomass/bioenergy crops that exhibit more favorable chemical compositions and are easier to convert to targeted biofuels. One example of alternative feedstock development is an effort to transform sugarcane and Miscanthus into better feedstocks for producing biodiesel and biojet fuels by engineering these plants to produce higher levels of oil (lipids) rather than sugar (carbohydrates). In February 2018, the US DOE awarded $10.6 million grant to the so-called Renewable Oil Generated with Ultra-productive Energycane (ROGUE) project, a collaboration by researchers from the University of Illinois, Brookhaven National Laboratory, University of Florida, and Mississippi State University. USDA and US DOE also support a variety of projects to develop cost-efficient and reliable feedstock logistics and supply chains. For example, DOE’s High-Tonnage Biomass Logistics Demonstration Projects were focused on developing five improved harvesting technologies to reduce biomass logistics costs while maintaining or improving harvested biomass quality.
16.5. Market development and policy effectiveness
Over the past decade, the RFS2 has effectively propelled increased production and use of biofuels in the US, primarily more conventional ethanol production from corn kernel starch but also conventional fatty acid methyl ester (FAME) biodiesel from oleaginous feedstocks. In recent years, volumes of cellulosic ethanol and renewable diesel (also known as hydrotreated vegetable oil (HVO) or hydroprocessed esters and fatty acids (HEFA)) have also increased. Figure 16.8 shows how ethanol production has increased under RFS2. In 2017, a total of 15.8 billion gallons (59.8 billion liters) of fuel ethanol was produced in the US. This production came from 199 plants located across 29 states. Considering supply and distribution chains, this production alone accounts for over 270,000 jobs. In 2015, about 0.1 billion gallons of ethanol was imported into the US and the total exported volume was about 0.8 billion gallons. US motor gasoline consumption has grown in the past four years, increasing from 8.7 million barrels per day (b/d) in 2012 to 9.3 million b/d in 2016, resulting in an increase of 7% in additional ethanol demand for E10 blending in gasoline that has helped to support the consistent growth in ethanol production over this period. The US remains the largest producer of ethanol in the world (58%), followed by Brazil (26%) and EU (5%).

United States
IEA Bioenergy Task 39 - Implementation Agendas: 2019-2021 Triennium Update 302
Figure 16.8. Historical production of ethanol in the US, 2000-2017
Corn is the primary feedstock for ethanol production in the US, and large corn harvests in recent years have contributed to increased production. The US Department of Agriculture (USDA) estimates that the US produced a record 15.1 billion bushels of corn in the 2016–17 harvest year, 11% more than the 2015–16 harvest. Increased corn yields and relatively stable corn prices help make increased conventional ethanol production from corn kernel starch more profitable. In 2017, about 30% of the total US corn crop – over 4.2 billion bushels of corn – was used to produce fuel ethanol. Similar to ethanol, the RFS has driven increased production and use of diesel biofuels in the last 10 years, both FAME biodiesel and renewable diesel type. As shown in Figure 16.9, diesel biofuels production reached about 2.5 billion gallons (9.5 billion liters) in 2017 as compared to 215 million gallons (814 million liters) in 2010. This production level was achieved by 97 plants operating across 37 states. FAME biodiesel and renewable diesel compete for the same oleaginous feedstocks and the recent trend has been renewable diesel starting to outcompete for the limited feedstock, meaning more renewable diesel (HVO/HEFA fuels) production and less FAME biodiesel production. Table 16.5 shows transport fuel consumption in the US from 2006-2017.
0
2,000
4,000
6,000
8,000
10,000
12,000
14,000
16,000
18,000Eth
anol
pro
ducti
on (
millions
of
gallons)

United States
IEA Bioenergy Task 39 - Implementation Agendas: 2019-2021 Triennium Update 303
Figure 16.9. Diesel biofuel production in the US, 2010-2017 (based on EPA RIN data)
Production volumes of diesel-substituting biofuels are limited by the availability of oleaginous feedstocks. In 2016, 11.05 billion pounds (over 5 million metric tons) of such feedstocks were used to produce diesel biofuels, 77% vegetable oils and 23% recycled/used vegetable oils and animal fats. Soybean oil was the largest single feedstock for US production, using 6.1 billion pounds of soybean oil in 2016, compared to 4.9 billion pounds in 2015, an increase of 24%, and representing approximately 28% of total 2016 US soybean oil production (22.1 billion pounds (over 10 million metric tons)).
214
1,077 1,056
1,534 1,436 1,515
2,1942,048
1
45.2 0.9
0.50.2
4
421453
0
500
1000
1500
2000
2500
3000
2010 2011 2012 2013 2014 2015 2016 2017
Bio
die
sel and r
enew
able
die
sel
pro
ducti
on
(Millions
of
gallons)
Biodiesel (FAME) Renewable diesel

United States
IEA Bioenergy Task 39 - Implementation Agendas: 2019-2021 Triennium Update 304
Table 16.5. Summary of transport fuel consumption (ML/year)
Year Gasoline2
Diesel
fuels
Aviation fuel (jet only) 2
Biodiesel
Ethanol Market share
of biofuels (%)
2006 523,976 175,075 94,749 988 20,749 2.67
2007 527,648 176,249 94,143 1,339 26,065 3.32
2008 512,658 158,874 89,298 1,149 36,656 4.73
2009 513,037 152,401 80,856 1,218 41,778 5.45
2010 512,090 160,388 83,090 985 48,675 6.17
2011 498,538 165,309 82,711 3,355 48,806 6.53
2012 494,715 157,776 81,121 3,403 48,763 6.64
2013 503,649 162,735 83,241 5,409 50,026 6.89
2014 509,403 169,889 85,285 5,364 50,891 6.85
2015 512,696 172,577 89,828 5,656 52,794 7.01
2016 520,721 170,798 93,689 7,894 54,344 7.34
2017 514,059 157,322 95,771 7,478 54,415 7.47 1 Based on projecting 10 month “through October 2017” results to full calendar year 2017. 2 Aviation gasoline consumption also reported 3 Based on projecting 11 month “through November 2017” results to full calendar year 2017 4 https://www.eia.gov/energyexplained/?page=us_energy_transportation
Sources
Biofuels Digest, 2019. Biofuels mandates around the world 2019, http://www.biofuelsdigest.com/bdigest/2019/01/01/biofuels-mandates-around-the-world-2019/ Statista (2016). Number of vehicles in use worldwide and the U.S. https://www.statista.com/statistics/183505/number-of-vehicles-in-the-united-states-since-1990/ BP (2016). Statistical Review of World Energy June 2016. 65th Edition. EIA (2016). US primary energy consumption by source and sector, https://www.eia.gov/petroleum/ethanolcapacity/index.cfm. Gottumukkala, L.D., and Hayes, D., 2018. Introduction to RINs. Retrieved from https://www.celignis.com/RINs-credits.php U.S. Sustainability Alliance (2014). The renewable Fuel Standard and Biofuels Policy, https://thesustainabilityalliance.us/biofuels/. EPA (2017).Renewable Fuel Standard Program: Overview for Renewable Fuel Standard. https://www.epa.gov/renewable-fuel-standard-program/overview-renewable-fuel-standard. Golden, J.S., Handfield, R., Pascual-Gonzalez, J., Agsten B., Brennan T., Khan L., True E., (2018). Indicators of the U.S. Biobased Economy. USDA, Office of the Chief Economist. EIA (2017). U.S. fuel ethanol production continues to grow in 2017. https://www.eia.gov/todayinenergy/detail.php?id=32152

United States
IEA Bioenergy Task 39 - Implementation Agendas: 2019-2021 Triennium Update 305
Renewable Fuels Association (2018). Annual US Fuel Ethanol Production. http://www.ethanolrfa.org/resources/industry/statistics/#1454099788442-e48b2782-ea53. EPA (2018). Public Data for the Renewable Fuel Standard: https://www.epa.gov/fuels-registration-reporting-and-compliance-help/public-data-renewable-fuel-standard EIA (2017). U.S. Inputs to biodiesel production: https://www.eia.gov/biofuels/biodiesel/production/table3.pdf USDA Economic Research Service (2017). Oil Crops Outlook: February 2017. https://www.ers.usda.gov/publications/pub-details/?pubid=82415 POET-DSM Advanced Biofuels (2017):http://poetdsm.com/pr/poet-dsm-achieves-cellulosic-biofuel-breakthrough Cagle, K., (Novozmes) (2017). Bioeconomy 2017 conference, session 1E: Drawing a Roadmap to Cellulosic Biofuel Deployment, July 11, 2017. Brent, E., (2018). A Rising Tide of Cellulosic Ethanol Production. Industrial Biotechnology, Vol. 14, No. 2. Environmental and Energy Study Institute (2017).1.5 Gen Technologies Could Boost Cellulosic Ethanol Production by Nearly 2 Billion Gallons: http://www.eesi.org/articles/view/1.5-gen-technologies-could-boost-cellulosic-ethanol-production-by-nearly-2-
California Air Resources Board (2017). Co-processing of biogenic feedstocks in petroleum refineries, Draft Staff Discussion Paper. Fogassy, Gabriella, et al. (2010). Biomass derived feedstock co-processing with vacuum gas oil for second generation fuel production in FCC units." Applied Catalysis B: Environmental 96.3 (2010): 476-485. DOE (2016). New Pilot Plant Demonstrates the Potential to Co-Process Biomass Streams with Petroleum. https://www.energy.gov/eere/bioenergy/articles/new-pilot-plant-demonstrates-potential-co-process-biomass-streams-petroleum Environmental and Energy Study Institute (2018). http://www.eesi.org/articles/view/auto-exec-raise-the-octane-rating-of-u.s.-gasoline-for-bump-in-fuel-efficie Speth et al., (2014). Economic and Environmental Benefits of Higher-Octane Gasoline. Jounral of Environ. Sci. Technol., 48 (12), pp 6561–6568. EIA (2017). U.S. net energy imports in 2017 fall to their lowest levels since 1982. https://www.eia.gov/todayinenergy/detail.php?id=35532 IEA Bioenergy- Country reports, 2018. United States– 2018 update Bioenergy policies and status of implementation. Ethanol data from EIA: https://www.eia.gov/renewable/data.php#alternative and then details under “Alternative transportation fuels” subsection. Data on fossil gasoline, diesel and aviation (jet + gasoline) obtained from EIA’s Table 3.7c (“Petroleum Consumption: Transportation and Electric Power Sectors”) of Monthly Energy Review: https://www.eia.gov/totalenergy/data/browser/index.php?tbl=T03.07C#/?f=A&start=1949&end=2016&charted=6)

United States
IEA Bioenergy Task 39 - Implementation Agendas: 2019-2021 Triennium Update 306
A good breakdown of estimated shares of total US transportation energy use by mode of transport is provided at: https://www.eia.gov/Energyexplained/?page=us_energy_transportation#tab2 The Renewable Fuels Association (www.ethanolrfa.org/) maintains industry statistics. A summary table and map of ethanol-based biorefinery locations is provided at http://www.ethanolrfa.org/resources/biorefinery-locations/. FAME biodiesel producers in the US are summarized by state by EIA at: https://www.eia.gov/biofuels/biodiesel/production/table4.pdf. Biomass magazine also has a good listing that lists specific producers (not just by state): http://www.biodieselmagazine.com/plants/listplants/USA/. The National Biodiesel Board also has some data on total production of both FAME biodiesel and renewable diesel – see http://biodiesel.org/production/production-statistics. A recent article in Biofuels Digest discusses the status of advanced biofuels http://www.biofuelsdigest.com/bdigest/2018/02/05/10-years-after-advanced-biofuels-status-opportunities-and-challenges/. Price, A., 2013. Competitive biofuel renewable identification numbers (RINs). Retrieved from http://www.competitive-energy.com/blog/renewables/biofuel-renewable-identification-numbers-rins California Air Resources Board, 2019. Data dashboard. Retrieved from https://www.arb.ca.gov/fuels/lcfs/dashboard/dashboard.htm

Appendix B- Questionnaire
IEA Bioenergy Task 39 - Implementation Agendas: 2019-2021 Triennium Update 307
Appendix B- Questionnaire
Implementation agendas: 2020-2021 Update (Compare and contrast transport Biofuels Policies)
Request for information for completion of Country sections Country: Names and affiliation of authors contributing to the report:
Please provide links/references to websites and documents referred to in the relevant sections. Please add full reference citations at the end of the questionnaire.
Please provide any appropriate figures, diagrams, maps and graphs as visual aids for specific section(s) rather than only text. All sections don’t require figures however it will be really helpful if some figures can be provided for some sections to supplement the tables and text.
Please use the same units (metric) for energy, volume and GHG emissions.
Introduction and main drivers for transport biofuels in this country - Please provide a brief summary of your country’s total primary energy supply (TPES) and the specific contribution the transport sector within the TPES. - Please provide a brief summary of your country’s historical GHG emissions inventory data and the contribution of the transport sector to national GHG emissions. Describe the main drivers for biofuels production in your country (e.g., energy security, climate change mitigation/GHG emissions reductions, rural development, job creation) - Please provide specific targets (if any) for each driver, e.g., 30% GHG emissions reduction by 2030. Briefly describe the historical development of biofuels policy in your country and If possible PLEASE include a timeline diagram: Below is a template of biofuel polices timeline. Please draw the timeline since 2000.
Transport Biofuels policies List the main legislation that impactS biofuels production and/or use in your country (e.g., Renewable Fuel Standard, Low Carbon Fuel Standard, GHG emissions reduction goal)

Appendix B- Questionnaire
IEA Bioenergy Task 39 - Implementation Agendas: 2019-2021 Triennium Update 308
Identify which of the following policies are used in your country to encourage the production and use of transport biofuels
Type of policy Yes/No (Provide Details / Comments)
Mandates or biofuels volume obligation:
- Ethanol (e.g. E5)
- Biodiesel (e.g. B2)
- Other biofuels (e.g. advanced biofuels such as cellulosic ethanol)
Indicate whether the carbon intensity or emissions of biofuels are taken into account
Indicate if financial incentives are provided (e.g., subsidies, credits, incentives):
- For the biofuels producer (producer credit based on volume of production)
- For the biofuels blender (blender’s credit based on volume blended)
- For the biofuels consumer (e.g., reduced license fees, tax credits for purchasing flex-fuel or natural gas vehicles, etc.)
- Financial incentives for feedstock development (e.g., grants for new feedstock development or new supply chain development)
- Tax credits
- Eliminating excise tariffs / Putting tariffs on imported biofuels
Indicate financial assistance (e.g., loan guarantees, grants)
- For construction of pilot, demo or pioneer biofuels production facilities
- For development of distribution infrastructure, e.g., fuel stations for E85
- For improvement or upgrading of existing biofuels production to further reduce the carbon intensity of biofuels
Indicate if funding is provided for Research and Development
Indicate if your country has relevant policies / targets for transportation fuels such as a Low Carbon Fuel Standard (LCFS), Clean Fuel Standard or specific emission reduction targets
Other market based- mechanisms:
- Carbon tax
- Emissions Trading (cap-and-trade) - Other?
Are there specific policies to promote advanced biofuels (if so, specify – blend mandate, etc.)?
Are there any sustainability measures or verification processes for biofuels environmental performance (e.g., LCAs)?
Are there any approved certification schemes for transport biofuels?

Appendix B- Questionnaire
IEA Bioenergy Task 39 - Implementation Agendas: 2019-2021 Triennium Update 309
Are there specific policies to promote aviation or marine biofuels (e.g., can they qualify for incentives)?
How easy is it for new biofuels to enter the market and/or earn incentives?
Are there any other policies that promote biofuels production and consumption?
What is the non-compliance cost (e.g., $/tCO2, $/GJ) of not meeting transport biofuel policies requirements?
Please expand on the details of any key policies with a short paragraph and a link to further documents or websites. Complete the table below indicating the mandates for bioethanol, biodiesel, and any other transport biofuels. Include federal and provincial/State mandates. Table - Biofuels obligations/mandates. Please specify if mandates are specified based on volume or energy content or CO2 / GHG emissions reduction potential.
Year Ethanol Biodiesel Other (specify e.g. advanced fuels, biogas)
2010
2011
2012
…
2020
2020+
Market development and policy effectiveness Indicate the size of the biofuels market by completing the following tables. Please specify whether this production data represent biofuels production capacities or actual production levels. Table – Transport biofuels production capacity/actual production (million L (ML)/year)
Year Biodiesel
(FAME
Bioethanol
(conventional)
Renewable diesel (from
lipids)
Cellulosic ethanol
Biogas as transportation
fuel
Other advanced biofuels (specify)
2010
2011
2012
…
2020

Appendix B- Questionnaire
IEA Bioenergy Task 39 - Implementation Agendas: 2019-2021 Triennium Update 310
Table - Summary of transport fuel consumption (ML)
Year Gasoline Diesel fuels
Aviation fuel
Biodiesel Bioethanol Renewable diesel (from
lipids)
Cellulosic ethanol
Biogas as transport
fuel
Other advanced biofuels (specify)
2010
2011
2012
2013
…
2020
biofuels facilities and main companies How many conventional Bioethanol PRODUCTION facilities ARE THERE in your country? (number of facilities and IF POSSIBLE list names and capacitIES and Their locations on A Map (IF THERE ARE too many companies, then provide totals) How many FAME Biodiesel PRODUCTION facilities ARE THERE in your country? (Number of facilities and IF POSSIBLE list names and capacitIES and Their locations on A Map (IF THERE ARE too many companies, then provide totals) How many Renewable diesel (hydrotreated vegetable oil (HVO) OR HYDROGENATED ESTERS AND FATTY ACIDS (HEFA)) PRODUCTION facilities ARE THERE in your country and IF POSSIBLE LIST Their locations on A Map (Number of facilities and IF POSSIBLE list names and capacitIES) Please provide the following information on other advanced biofuels producers (e.g., cellulosic ethanol, Biogas, BIOJET, ETC.)
Name of company Status (planned; operational; closed)
Technology Production capacity (ML/year)

Appendix B- Questionnaire
IEA Bioenergy Task 39 - Implementation Agendas: 2019-2021 Triennium Update 311
biofuels and feedstocks: imports and exports Please describe the type of biofuels/feedstocks and the volumes/MASSES that are imported/exported
Year Transport Biofuel (please specify type, e.g. renewable diesel)
Feedstocks (please specify types, e.g. used cooking oils, animal fats. etc.)
Import (M liter/year)
Export (M liter/year)
Import (M tonnes/year
Export (M tonnes/year)
2010
2011
2012
2013
…
2020
Coprocessing at oil refineries Please describe the number and production capacity of any oil refineries in your country (barrels/day). Please also indicate their location on a map. Please provide any recent/on-going co-processing trials at oil refineries (co-processing rate, type and volume of biogenic feedstocks, insertion points (FCC unit or hydrotreater)), etc. Please describe any policies supporting co-processing at oil refineries (e.g., LCFS). Research and Development and Additional information List funding agencies and Major programs List any major recent/ongoing research projects focusing on biofuels technology development and deployment Provide any additional information that may be relevant (e.g., on new or revised biojet/biomarine initiatives) Sources of information Please list any documents and websites that were used as sources for the above information.

IEA Bioenergy Task 39 - Implementation Agendas: 2019-2021 Triennium Update 312
Copyright © 2022 FDOKUMEN