Emissions from burning biofuels in metal cookstoves
10
Emissions from Burning Biofuels in Metal Cookstoves VEENA JOSHI* Tata Energy Research Institute 7, Jor Bagh New Delhi, 110003, India CHANDRA VENKATARAMAN Department of Chemical Engineering University of California at Los Angeles Los Angeles, California 90024, USA DILIP R. AHUJA Office of Policy Analysis PM-221, Environmental Protection Agency 401 M Street, SW, Washington, DE; 20460, USA ABSTRACT / Promoting stoves that burn wood and other bio- fuels more efficiently is one of the means to reduce fuel con- sumption, but such efficient stoves may also emit more carbon monoxide and total suspended particulates. In an earlier study, a standard chamber method was proposed to estimate emission factors from burning fuelwood (Acacia ni- Iotica). Here that methodology is extended to measure emis- sion factors from burning of dungcakes and crop residues (Brassica or mustard stalks)--common fuels in many devel- oping countries. The amounts of carbon monoxide (CO) and total suspended particulates (TSP) emitted by four different models of stoves, when using each of the three biofuels, are measured. The CO emission factors range from 13-68 (g/kg) for fuelwood to 26-67 g/kg for dungcakes and 20-114 g/kg for crop residues, for particulates they range from 1.1-3.8 to 4.1-7.8 and 2.1-12.0 g/kg for the three fuels, respectively. On a per unit heat delivered basis, the emissions of CO and TSP from both dungcakes and crop residues are two to three times higher compared to those from fuelwood. While for some "improved" stove-fual combinations, the increase in emission factors was offset by the increase in thermal effi- ciency, this was not always so and causes a dilemma. The more efficient stoves are found to have higher emission factors of both CO and TSP for all three fuels. Emissions per standard task (i.e, on a unit heat delivered basis) is pro- posed as a criterion to evaluate cookstoves. The realization of the numerous adverse effects as- sociated with deforestation led to many efforts to de- sign and disseminate fuel-efficient cookstoves (Foley and Moss 1983, Clarke 1985). Most methods to certify new designs of biofuel-burning stoves are based on their thermal performance only (VITA 1985) and ig- nore the emission of pollutants, even though unvented biofuel stoves are known to emit large amounts of health-damaging air pollutants, often leading to ex- tremely high human exposures (Smith 1987). In spite of the availability of standardized methods to measure fuel economy, very few stove promotion programs monitor how much fuel these stoves actually save and fewer still monitor their impact on air pollution. In practice, many of the stoves use fuels other than what the stoves are designed for, depending on the season and fuel availability. The objective of this research was to study the per- formance of a few unrented metal stoves as affected by three different fuels: wood, dungcakes, and mus- hard stalks. A standard methodology to estimate emis- KEY WORDS: Developing countries; Cookstoves;Biomess combus- tion; Emission factors; Performance standards *Author to whom correspondence shouldbe addressed. sion factors from combustion in unvented cookstoves using fuelwood (Ahuja and others 1987) was extended here to estimate emissions from stoves burning dung- cakes and mustard stalks. Assuming that a stove is capable of cooking the cui- sine of the region where it is sought to be introduced, the two most important sets of criteria are thermal and emissions characteristics. In the former set are in- cluded the power output of the fire (burning rate), the overall thermal efficiency, and the time taken to per- form a particular task. Emission factors of various pol- lutants, or as proposed by us, emissions per task of carbon monoxide (CO) and total suspended particu- lates (TSP) characterize the latter set, Both CO and TSP are known to occur in concentrations hazardous to health in houses burning biofuels in unrented stoves and both have readily available monitoring de- vices (Smith 1987). CO is perhaps the most important indicator of acute hazard, whereas TSP indicates chronic toxicity. Sampling particulates also enables in- dividual organics such as benzo[a]pyrene to be deter- mined. We have examined how each of the variables listed above changes with a change in the kind of fuel, what the interrelationships among these variables are, and how these relationships change across different fuels. Environmental Management Vol 13, No 6, pp 763-772 @1989 Springer-Vedag New YorkInc
Transcript of Emissions from burning biofuels in metal cookstoves

Emissions from Burning Biofuels in Metal Cookstoves VEENA JOSHI* Tata Energy Research Institute 7, Jor Bagh New Delhi, 110003, India
CHANDRA VENKATARAMAN Department of Chemical Engineering University of California at Los Angeles Los Angeles, California 90024, USA
DILIP R. AHUJA Office of Policy Analysis PM-221, Environmental Protection Agency 401 M Street, SW, Washington, DE; 20460, USA
ABSTRACT / Promoting stoves that burn wood and other bio- fuels more efficiently is one of the means to reduce fuel con- sumption, but such efficient stoves may also emit more carbon monoxide and total suspended particulates. In an earlier study, a standard chamber method was proposed to estimate emission factors from burning fuelwood (Acacia ni-
Iotica). Here that methodology is extended to measure emis- sion factors from burning of dungcakes and crop residues (Brassica or mustard stalks)--common fuels in many devel- oping countries. The amounts of carbon monoxide (CO) and total suspended particulates (TSP) emitted by four different models of stoves, when using each of the three biofuels, are measured.
The CO emission factors range from 13-68 (g/kg) for fuelwood to 26-67 g/kg for dungcakes and 20-114 g/kg for crop residues, for particulates they range from 1.1-3.8 to 4.1-7.8 and 2.1-12.0 g/kg for the three fuels, respectively. On a per unit heat delivered basis, the emissions of CO and TSP from both dungcakes and crop residues are two to three times higher compared to those from fuelwood. While for some "improved" stove-fual combinations, the increase in emission factors was offset by the increase in thermal effi- ciency, this was not always so and causes a dilemma. The more efficient stoves are found to have higher emission factors of both CO and TSP for all three fuels. Emissions per standard task (i.e, on a unit heat delivered basis) is pro- posed as a criterion to evaluate cookstoves.
The realization of the numerous adverse effects as- sociated with deforestation led to many efforts to de- sign and disseminate fuel-efficient cookstoves (Foley and Moss 1983, Clarke 1985). Most methods to certify new designs of biofuel-burning stoves are based on their thermal performance only (VITA 1985) and ig- nore the emission of pollutants, even though unvented biofuel stoves are known to emit large amounts of health-damaging air pollutants, often leading to ex- tremely high human exposures (Smith 1987). In spite of the availability of standardized methods to measure fuel economy, very few stove promotion programs monitor how much fuel these stoves actually save and fewer still monitor their impact on air pollution. In practice, many of the stoves use fuels other than what the stoves are designed for, depending on the season and fuel availability.
The objective of this research was to study the per- formance of a few unrented metal stoves as affected by three different fuels: wood, dungcakes, and mus- hard stalks. A standard methodology to estimate emis-
KEY WORDS: Developing countries; Cookstoves; Biomess combus- tion; Emission factors; Performance standards
*Author to whom correspondence should be addressed.
sion factors from combustion in unvented cookstoves using fuelwood (Ahuja and others 1987) was extended here to estimate emissions from stoves burning dung- cakes and mustard stalks.
Assuming that a stove is capable of cooking the cui- sine of the region where it is sought to be introduced, the two most important sets of criteria are thermal and emissions characteristics. In the former set are in- cluded the power output of the fire (burning rate), the overall thermal efficiency, and the time taken to per- form a particular task. Emission factors of various pol- lutants, or as proposed by us, emissions per task of carbon monoxide (CO) and total suspended particu- lates (TSP) characterize the latter set, Both CO and TSP are known to occur in concentrations hazardous to health in houses burning biofuels in unrented stoves and both have readily available monitoring de- vices (Smith 1987). CO is perhaps the most important indicator of acute hazard, whereas TSP indicates chronic toxicity. Sampling particulates also enables in- dividual organics such as benzo[a]pyrene to be deter- mined. We have examined how each of the variables listed above changes with a change in the kind of fuel, what the interrelationships among these variables are, and how these relationships change across different fuels.
Environmental Management Vol 13, No 6, pp 763-772 @ 1989 Springer-Vedag New York Inc

764 v. Joshi and others
Materials and Methods
Experiments were conducted in a 16-m a hut with mud walls and a thatch roof, constructed in the court- yard of a two-storey house in a residential section of New Delhi. The house was separated from the busy roads to its west and north by two rows of houses. The hut was surrounded on all sides by an asbestos-ce- ment sheet enclosure (volume 52 m s ) to provide an extra layer of shelter against local wind effects and to maintain uniform ventilation during and between ex- periments.
All the openings (three windows and one door) of the hut and the south-facing window of the enclosure were left open. Two low-speed pedestal fans (1.25 m high) were placed in the space between the hut and the enclosure to reduce vertical stratification of pol- lutants in the hut. The fan at the north window faced the hut and was oscillating (i.e., swept continuously from east to west and back again), whereas the one at the south window was stationary and faced east. Both were tilted slightly towards the roof to avoid interfer- ence with combustion.
Four metal cookstoves were used in the experi- ments. The Priyagni (PA), designed by Central Power Research Institute in Bangalore, and the conventional (CM) U-shaped design were procured from retailers, whereas the other two were obtained from their re- spective developers: TARA (TR) from Development Alternatives in New Delhi and the one (CP) developed by SMVM Community Polytechnic in Tanuku in Andhra Pradesh. The stove design parameters are summarized in Table 1.
Three biofuels were used in the experiments: fuel- wood (FW), crop residues (CR), and dungcakes (DC). Wood (Acacia nilotica) was obtained in one lot from a wholesale dealer, split, and air-dried. Three or four semicylindrical pieces (2-4 cm in diameter, 20-25 cm long) of wood were used during the experiments. Crop residues (dried stalks of Brassica) and dungcakes were also obtained locally in one lot. The moisture content of fuels was determined periodically. At the end of the series of experiments calorific values of charcoal, FIAt, CR, and DC were determined using a bomb calorimeter (Venkataraman and others 1987).
The x, y, and z coordinates of the CO and the TSP monitors, relative to the centroid of the combustion zone, were 1, 0.5, and 1 m, respectively. Particulates were collected on a 37-mm Teflon-coated glass-fiber filter (Paliflex Corporation) with a low-flow personal air sampling pump (model HFS 113, Gilian Corpora- don). The flow rate of the pump was adjusted to about 3 liters/rain and calibrated before each experi- ment with a bubble tube (WHO 1984). Filters were
weighed before and after an experiment on an analyt- ical balance accurate to 0.01 mg (model SB-4, Scientific Instrument Co.). Carbon monoxide concentrations were measured with a portable monitor (model CO-82, Gas Tech Corporation). The gain of the mon- itor was adjusted by using a span gas of known con- centration (108 ppm) and set to zero before each cali- bration and experiment. The CO readings, therefore, give the contribution from the cookstoves alone. All TSP readings include the background concentrations that, in separate measurements in and around the hut, were found to be of the order of 140 Ixg/m s.
To estimate both thermal performance and emis- sion characteristics from a single test, the variations in emission characteristics were minimized by burning a single charge of fuel with minimal fre-tending.
Three and a half kilograms o f water were brought to a boil in a covered, flat-bottomed, aluminum vessel of 5-liter capacity. A thermometer was inserted through a rubber stopper in the lid. Just enough fuel was used in each experiment to bring the water to a boil and keep it boiling for about 15 min. The vessel, lid, thermometer, water, and wood were all weighed on a pan balance of l-g accuracy.
Ends of the pieces of the fuel were dipped in a measured amount of kerosene before being lit. As the fire was being lit, both monitors were switched on. The concentration of CO was recorded every minute and the temperature of water every fourth minute. The water boiling test was terminated when the water tem- perature dropped by 0.5~ The vessel was reweighed to calculate the mass of steam evaporated.
The remaining pieces of charcoal were weighed and then removed from the test site. Subsequently, the CO concentration in the room was recorded for 20 min to estimate the ventilation rate.
Analysis
Thermal Parameters
The burn rate for an experiment is calculated after correcting for kerosene used, the charcoal remaining, and the moisture content of the fuel (TERI 1987). The average power output is calculated using the lower calorific value of the fuel (Venkataraman and others 1987) and the burn rate. In the estimation of thermal efficiency, the amount of heat used to evapo- rate water is considered as useful heat input, but the heat absorbed by the pot material is neglected (Ahuja and others 1987). The heat input is calculated by cor- recting the gross heat input for hydrogen and mois- ture contents of the fuel.
The time taken to perform a task is an important

Biofuel Emissions from Cookstoves 765
Table 1. Design parameters of stoves.
Weight Wall thickness Stove (kg) (ram)
Combustion volume (liters)
Height from grate to pot bottom
(cm) Heat transfer area
(cm~)
TR 1.6 0.9 3.5 12.3 900 CP 2.0 0.9 4.0 8.5 450 PA 2.2 1.0 4.1 7.5 450 CM 2.3 1.0 6.8 22.0 450
attribute used by cooks in evaluating stove perfor- mance (Gupta and others 1987). We standardized the task in our experiments as the time taken to raise the temperature of 3.5 kg of water by 60~
Emission Parameters
If we assume that the outdoor concentration of the pollutant of interest is negligible and also that there is little deposition, resuspension, chemical transforma- tion, or reinfiitration of the pollutant during the ex- periment, the first-order mass balance equation de- scribing the rate of change of indoor concentration, C, with t ime, t, can be written as:
dC(O = F E - VSC(t) (1) dt
where FE, the product of burn rate (F) and the emis- sion factor (E), describes the source term, which is as- sumed to be constant during the burn; V is the chamber volume, and S the air exchange rate. Using the fact that the initial concentration in the chamber is zero enables us to solve the equation to yield,
FE(1 - e -ts) c(t) = ( 2 )
VS
Therefore, a knowledge of the concentration en- ables us to calculate the emission factor as
VS E = C(t) (3)
F(1 - e -ts)
When the monitoring time is large (t ~> S-~), equi- librium or steady-state conditions are reached and we get
VS E = C, T (4)
Two sources of error are frequently encountered in the fiterature when attempts are made to estimate emission factors using equations 3 or 4. One springs from "untenability" of the assumption that the pol- lutants are well mixed and the other from use of mean concentration during the sampling period instead of C, to estimate E in equation 4 or, alternatively, using
an instantaneous concentration to estimate E in equa- tion 3 but leaving out the term in. parenthesis in the denominator.
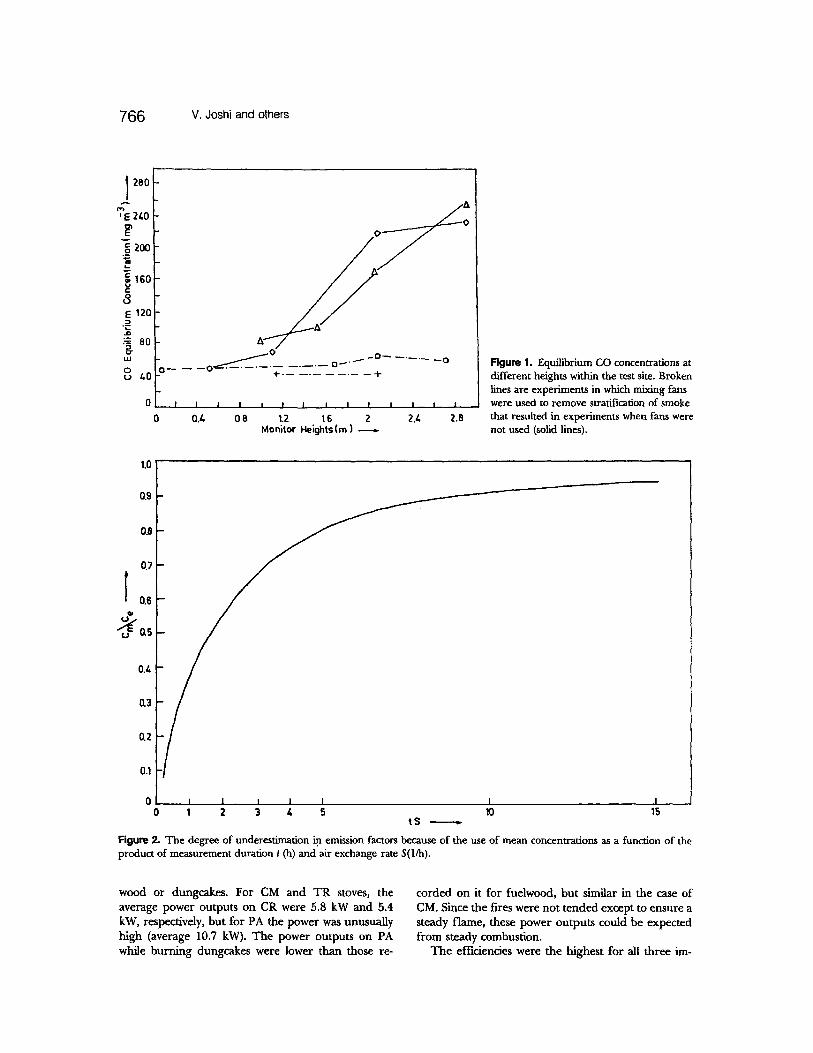
Under normal ventilation, i.e., without the use of mixing fans, there is vertical stratification of pol- lutants. This is shown in Figure 1, which also shows that the use of two fans was effective in greatly re- ducing the stratification. As is clear from this figure, depending on the vertical location of the samplers in the experiments where the pollutants are stratified, varying degrees of under- or overestimation of the emission factors are possible. Whereas C, could be higher, the air exchange rates will be lower when fans are not used.
Many instruments, such as the sampling pump Used here to collect particulates, monitor average concen- tration over the time period they are operated, i.e.,
I rt C,, = 7 J0 C(t)at (5)
substituting for C(t) from equation 2 yields
I f the average concentration is used for the calcula- tion of the emission factors, this will underestimate the true emission factor by an amount given by the term in parenthesis in equation 6. The degree of underesti- marion is a function of ~ and is plotted in Figure 2. For r > 5, this term approximates to 1 - (l/N).
The emissions per task for each pollutant is given by the product of emission factor, E, for that pollutant, the burn rate, F, and the task time.
Results and Discussion
Thermal Parameters
Table 2 gives the average values and ranges for power, efficiency, and task times for the different stove-fuel combinations. Also shown are the number of experiments in each set.
Mustard stalks, being of low density, low moisture content, and thinner diameters, burn quicker than
766 v. Joshi and others
280
' s 2/.0
o = 2OO
g 1so
8 E 120
.'-~ 80 LU
0
0
0
o
f . I 0 J O ~
,,W . . . . . . . . . . '4-
! I m I I I I I I I I I I I
0.~ 0 8 1.2 16 Z 2.4 2.8 Monitor Heights (m } ,,.
Figure 1. Equilibrium CO concentrations at different heights within the test site. Broken lines are experiments in which mixing fans were used to remove stratification of smoke that resulted in experiments when fans were not used (solid lines).
1 . 0 i
O.9
O~
0.7
r 0.6
OJ,
~3
O.2
0.1
0
I
! I I I i I ,, . I
0 1 2 3 4 5 10 15
Figure 2. The degree of underestimation in emission factors because of the use of mean concentrations as a function of the product of measurement duration t (h) and air exchange rate S(1/h).
wood or dungcakes. For CM and T R stoves, the average power outputs on CR were 5.8 kW and 5.4 kW, respectively, but for PA the power was unusually high (average 10.7 kW). T h e power outputs on PA while burning dungcakes were lower than those re-
corded on it for fuelwood, but similar in the case of CM. Since the fires were not tended except to ensure a steady flame, these power outputs could be expected f rom steady combustion.
T h e effidencies were the highest for all three im-

Biofuel Emissions from Cookstoves 767
Table 2. Thermal parameters for different stove-fuel combinations.
Powe/" Efficiency Task time (kW) (%) (min)
Stove FW CR DC FW CR DC FW CR DC
PA min 3.81 9.25 2.62 max 5.65 12.14 3.65 mean 4.64 10.7 3.02 N 4 2 7
CM rain 2.96 4.43 3.17 max 4.96 8.75 5.03 mean 3.93 5.79 4.24 N 7 4 3
TR rain 1.79 5.17 - - max 3.15 5.63 - - mean 2.50 5.39 - - N 11 4
CP min 1.76 - - - - max 2.82 - -
mean 2.14 - - N 4 - -
22 11 20 20 12 12 30 12 23 24 17 28 26 12 22 16 15 20
4 2 7 4 2 7
12 14 13 14 13 17 17 16 15 39 24 28 15 15 14 25 20 21 7 4 3 7 4 3
28 29 - - 1 2 9 - -
43 35 - - 25 10 35 32 - - 19 9 - - 11 4 - - 11 4 - -
34 - - - - 1 4 - -
40 - - - - 2 3 - - - -
37 - - - - 20 - - - - 4 - - - - 4 - -
proved stoves when the fuel was wood. This is ex- pected, as the stoves are optimized for wood fuels. Among the four stoves tested, the thermal perfor- mance of CM changed the least with different fuels: conventional designs allow different fuels to be used. Except for PA-CR, the efficiency declined only mar- ginally when going from wood to lower quality fuels. The thermal efficiencies seem more stove dependent than fuel dependent. Interestingly, a stove that is more efficient than another on one biofuel is also more effi- den t on other fuels. The improved metal stoves, on average, had efficiendes better than the conventional one (anywhere from 75% to 150% on wood); the effi- ciency of the conventional stove is also higher than the typical assumption of 5% (Gill 1987).
For a given fuel across stoves, the average overall thermal effidency is smaller if the average power level is greater. Moreover, efficiency seems to be a function of the power at which a stove is operated rather than the fuel.
Task time is related inversely to both power and the overall thermal efficiency. Figure 3 shows the task time versus the product of efficiency and power (the heat input rate into the pot) for all the stove-fuel combina- tions tested. Also shown is the ideal case. Except for PA-DC, the average task time for a stove-fuel combi- nation differs from the predicted average for the given heat input rate by less than 3 rain. From Table 2 we can infer that regardless of the fuel, the conven- tional metal stove, in spite of the relatively high power, seems to be the slowest because of the low effidencies that resulted. In the rest of the discussion we restrict
ourselves to the cases where fuels are kept constant and stoves changed.
Environmental Parameters Carbon Monoxide Emission Factors E(CO). We have
three stoves, the two "improved" designs burn fuel- wood with an average power of a round 2 kW (TR and CP) and the CM at a power more than twice this (Table 3). On an average, the two low-power stoves have higher emission factors than the conventional stove (Figure 4). Within the low-power group, how- ever, this relationship does not hold, i.e., TR has a slightly lower power but much lower E(CO) than CP. It should be possible, therefore, to reduce CO emis- sions by about a factor of 2 by proper stove design even at low power ratings.
A monotonically increasing relationship is displayed between emission factors and overall efficiency, i.e., E(CO) values, while burn ing fuelwood are higher for the more efficient stoves. With crop residues, similar monotonic relationships are observed: the lower the power, the higher the overan effidency and the higher the emission factors (Figure 4). For almost the same power, large differences in E(CO) are possible (TR and CM), and for similar E(CO), large differences in power are possible (CM and PA). A similar resuk is obtained for dungcakes. PA has lower power, higher efficiency, and higher emission factors than CM.
Particulate emission factors E(TSP). Most of the par- ticulates (dose to 90%) from biofuel combustion have been determined to be respirable, with a particle size of less than 3 p.m (Smith 1987), and are thought to

768 v. Joshi and others
/.0
35 -
3O
E
zo~ r
15
10
5
0 0
0 ~ O O �9
~176 2
~ m
I I | I I | I I I
02 0/, 0.6 0.8 1.0 12 1.4 16 1.6 Heat Inl~ut Rate (k'#/h/h)
J Z0
Figure 3. The time taken to raise the temperature of 3.5 kg of water by 60~ as a function of the heat input rate into the pot (product of power and efficiency) for different stove- fuel combinations. Stoves: CM, circles; TR, squares; PA, triangles; CP, diamonds; fuels: FW, blank; CR, dot; DC, filled. The solid line depicts the theoretical values.
behave like gases. For the three stoves tested using fuelwood, E(TSP)s are doser to each other compared to E(CO)s.
Insofar as the particulates consist of unburned hy- drocarbons, the analysis of dependence of E(TSP) on power and effidency will be similar as for CO; other- wise E(TSP) should also be related to the ash content of the fuel, turbulence of the fire, and the frequency of fire-tending.
The variation in E(TSP) for fuelwood is too small to deduce conclusively a systematic dependence of E(TSP) on P or n. For crop residues, an inverse rela- tionship with power and a definite (almost linearly in- creasing) relationship with efficiency is observed (Figure 4). In the case of dungcakes, lower power is associated both with higher efficiency and higher emission factors.
Emission Factors versus Power and Overall Efficiency
In order to explain why E(CO) increases with in- creasing overall efficiency, we have to understand why both E(CO) and efficiency decrease with increasing power. Overall efficiency is made up of two major components n c and nt (VITA 1985, Baldwin 1986). A
stove that operates at a higher power will have a higher combustion efficiency, no, but also a lower heat transfer efficiency, n , with the result that overall effi- ciency may be lower. Because nc is higher, E(CO) will be lower. This in part explains why we observe a higher E(CO) with increasing overall efficiency. The improvements in n have come from improvements in nt at the expense of deterioration in no to which the CO emissions should be directly proportional.
Increasing power will generally imply a more com- plete combustion and, therefore, a higher combustion efficiency, lower emissions, higher thermal losses, a lower heat transfer efficiency, and a lower overall effi- ciency. These relationships are more or less demon- strated by the left panels of Figure 4. With the limited data we have, it seems that to have reasonably low emission factors, a wood stove should be designed not to operate below 3 kW, a DC stove below 4.5 kW, and a CR stove below 6 kW.
The right panels in Figure 4 strongly indicate that both CO and TSP emission factors seem to increase with increasing overall thermal efficiencies. This rela- tionship is valid across stoves. The relationships for the two pollutants for any given fuel are strikingly similar. The difference between CO and TSP for FW seems to

Biofuel Emissions from Cookstoves 769
10 �84
r
4 uJ
0
100
80 o t
"=so (.,,)
r 40
20
3O
~20
10
"-.o
,,o 0-~ . . . . - 0
9 i
! I
I O ~
? I !
\o i i ! I I t " t
~ A t
~ 0 0 . . . . . . . . . .&
*o
i.
P /
/ i
/ I"
. /
! p
K o
. P
0
/
/
/
' 2 / i I /
I A / # I
/ .o &..O ~
F..XPLM4 A1 ION SIOVF.S 0 r O l p
0 CP FUIrLS
FW
OC
0 I I I I I I I i I
0 z 4 6 8 10 0 10 20 30 z0 P(kW) ~ (%)
T b,
Figure 4. Emission factors of CO and TSP (g/kg) as a function of power output P (kW) and efficiency n (%) for different stove-fuel combinations.
be caused by very high emissions of CO (rather than TSP) for stoves that operate at the lower ends of the power range.
Emissions per Task
Although a higher efficiency stove is seen to have higher emission factors, what is really of interest is total emissions dur ing a cooking task, because a higher efficiency stove would also require less fuel for the completion of a task. Emissions of either CO or TSP per standard task (El) can be used as a performance index to compare the air pollution potential of dif- ferent s tove-fuel combinations. In emissions per task, the emission factor is calculated on a unit heat deliv- ered basis (g/MJ of heat delivered) rather than heat emitted. Even though it incorporates the overall fuel efficiency (n), it does not do away with the need to
independent ly measure fuel efficiency of a stove. Therefore both E t and n are needed to judge stove performance; EF becomes then an intermediate step in calculating Er
We defined a standard task as one that would de- liver 879 kJ to the pot. El is directly proportional to EF and inversely proportional to efficiency. Therefore, it should be as small as possible. In other words, effi- ciency must increase by the same or greater amount than emission factors for emissions per task to be same or lower.
It is apparent from Tables 3, 4, and 5 that fuelwood will emit less CO as compared to CR or DC on the same stove performing an equivalent task. Our data do not permit a judgement as to whether CR or DC in general will result in higher CO emissions.
The emissions of TSP per task for fuelwood are

770 v. Joshi and others
Table 3. Environmental performance of stoves burning fuelwood.
P n T E(CO) E(TSP) E(CO) E(TSP) Stove (kW) (%) (rain) (g/kg) (g/kg) (g/task) (g/task)
CM 3.60 13 31 13 1.3 5 0.5 4.94 16 18 15 1.7 5 0.5 4.96 17 14 22 2.7 5 0.7
Mean 4.50 15 21 17 1.9 5 0.6
TR 2.01 31 22 35 1.1 5 0.2 1.79 28 25 25 2.1 4 0.3 2.21 34 23 39 2.7 7 0.5
Mean 2.00 31 23 33 2.0 5 0.3
CP 2.82 34 14 48 1.8 7 0.2 1.84 37 23 68 3.2 10 0.5 2.07 36 21 66 2.3 10 0.3 1.76 40 21 65 3.8 8 0.5
Mean 2.13 37 20 62 2.8 9 0.4
Table 4. Environmental performance of stoves burning crop residues.
P n T E(CO) E(TSP) E(CO) E(TSP) Stove (kW) (%) (min) (g/kg) (g/kg) (g/task) (g/task)
CM 8.75 14 13 39 5.0 16 2.1 4.71 16 22 20 2.1 7 0.8 5.25 15 21 20 2.2 8 0.9 4.43 16 24 28 2.8 11 1.1
Mean 5.79 15 20 27 3.0 11 1.2
PA 12.14 11 12 27 2.8 14 1.5 9.25 12 17 23 2.1 13 1.2
Mean 10.70 12 15 25 2.4 14 1.3
TR 5.63 29 9 76 7.1 14 1.2 5.38 34 9 79 8.5 14 1.5 5.17 35 9 114 12.0 14 2.0 5.38 29 10 95 10.0 18 1.9
Mean 5.39 32 9 91 9.4 16 1.7
Table 5. Environmental performance of stoves burning dungcakes.
P n T E(CO) E(TSP) E(CO) E(TSP) Stove (kW) (%) (min) (g/kg) (g/kg) (g/task) (g/task)
CM 3.17 13 28 32 5.3 15 2.5 5.03 13 17 36 5.2 16 2.4 4.53 15 18 26 4.1 11 1.8
Mean 4.24 14 21 31 4.9 14 2.2
PA 3.65 22 12 42 5.6 10 1.3 3.06 22 13 67 7.8 14 1.7 3.10 23 18 34 4.2 10 1.3 2.82 22 20 29 4.6 9 1.4
Mean 3.16 22 16 53 5.6 11 1.4

Biofuel Emissions from Cookstoves 771
26 2./,
2.2
2.0
I t.8
~ L2
1 0
0.8
0.6
0./-
0.2
0.0 0
2 0
1 8
1 6
12 g
tU
2
0 0
I
- - (p -
T I J ~ ' ~ " - |
-r---. I , . . - - . . . . . . ,'-
T -b-----..._
I I 310 I I 6 20 2/. 36 40
I
1
. . . . . . . . . . . . .
I I I I 10 1/., 18 22
~ 6 i I i i 30 34 38 40
Figure 5. Emissions per task of CO and TSP (g/task) as a function of thermal efficiency n (%) for different stove fuel combinations. See text for definition of task, symbols same as in Figure 4.
also lower than those for both CR and DC. For both CM and PA, the total particulate emissions from dung seem higher than those from CR.
Emissions per Task vs Efficiency
The emissions per task are plotted against the overall thermal efficiency in Figure 5. One dilemma occurs when the more fuel efficient stove is also more polluting. The other dilemma arises when two stoves have comparable efficiencies but one has more Et(CO) and the other more Et(TSP). For any given fuel, we would perfer the stove that is as far to the right (more fuel efficient) and as close to the x axis as possible (less polluting).
It seems that except for T R - C R (for both CO and TSP) and CP-FW (for CO), in all other cases the in- crease in efficiency is able to offset the increase in emission factors.
This would be heartening for agencies involved in popularizing these stoves, which have thus far concen- trated on promoting stoves based only on efficiency and without regard to the total pollution that these stoves cause. With the one exception given, the more efficient fuelwood stoves result in comparable total emissions of CO and, in fact, lower emissions of partic- ulates. For DC, PA is more efficient (than CM) and also has lower total emissions of CO and TSP. For crop residues, the conventional stove seems to per- form the best, having a higher efficiency than PA and

772 v. Joshi and others
lower emissions. As already mentioned, T R - C R re- suits in higher emissions than either PA or CM, but the efficiency is also much higher; hence the dilemma.
Finally, it should be pointed out that the total emis- sions for both particulates and CO for any stove-fuel pair lies within a factor of 2 for the worst case and within a factor of 3 for efficiencies. This should give an idea of what is the best level of savings achievable in the field. Acac/a n//ot/ca is a "prized" biofuel and, where it is marketed, commands a higher price than wood of other species because of its reputation for burning well. It is possible therefore that for many other fuel- wood species, the difference between their emissions and those from CR and DC would be smaller than those observed in our study.
Relative Emissions of CO and TSP
There seem to be two clusters in this data set. One is for average powers greater than 3 kW wherein the CO/TSP ratio rises from a value of about 7 at 3 kW (for DC) to 10 for average power of 11 kW (for CR). The two relatively high-power woodburning stoves also lie in this range. The two low-power (2 kW) woodburning stoves form the other duster with higher values of CO to TSP (16 and 23). It is apparent from Figure 4 that this high ratio comes from much higher emission o f CO at lower power rather than reduced emissions of particulates, which are comparable for the four stoves.
Conclusions
1. The highest effidendes for all the three im- proved stoves were observed when the fuel was wood. The thermal efficiencies seem to be more stove depen- dent than fuel dependent. The effidency changed least for CM when fuel was changed.
2. I t appears that to have reasonably low emission factors a FW stove should be designed not to operate below 3 kW, a DC stove below 4.5 kW, and a CR stove below 6 kW.
3. Emission factors of CO and TSP increase with increasing overall efficiency.
4. For a stove, emissions per task for CO and TSP for FW are lower than those for CR and DC. While emissions per task for TSP seem to be higher for DC than for CR, the same cannot be said for CO emis- sions.
5. It seems that except for T R - C R (for both CO and TSP) and C P - F W (for CO), in all other cases the
increase in efficiency is able to offset the increase in emission factors.
6. The total emissions for both TSP and CO for any stove pair lies within a factor of 2 for the worst case and within a factor of 3 for efficiencies. This is indicative of the best level of savings achievable in the field.
Acknowledgments
This research was funded in part by a grant (No. 323) of the Environmental Research Committee of the Department of Environment, Government of India. We are grateful to Dr. Kirk R. Smith of the East-West Centre for his involvement in this project.
Literature Cited
Ahuja, D.R., V. Joshi, K.R. Smith, and C. Venkataraman. 1987. Thermal performance and emission characteristics of biomass-burning cookstoves: A proposed standard method for evaluation. Biomass 12:247-270.
Baldwin, S. F. 1986. Biomass stoves: Engineering design, de- velopment and dissemination. Volunteers in Technical As- sistance, Arlington, Virginia, and Princeton University, Princeton, New Jersey. 31 pp.
Clarke, R. (ed.). 1985. Woodstove dissemination. Proceedings of the conference held at Wolfheze, The Netherlands. In- termediate Technology Publications, London.
Foley, G., and P. Moss. 1983. Improved cooking stoves in developing countries, Earthscan Energy Information, London. Programme Technical Report 2. 22 pp.
Gill, J. 1987. Improved stoves in developing countries: A cri- tique. Energy Policy 15:135-144.
Gupta, C.L., U.K. Rao, and U. Prema. 1983. Improved chimneyless fuelwood cookstoves (Pondicherry region). Pages 141-154 in IC K. Prasad, and P. Verhaart (eds.), Wood heat for cooking. Indian Academy of Sciences, Ban- galore.
Smith, K.R. 1987, Biofuels, air pollution and health: A global review. Plenum Press, New York, 109 pp.
TERI (Tata Energy Research Institute). 1987. Evaluation of performance of cookstoves in regard to thermal efficiency and emissions from combustion, Research Report. TERI, New Delhi.
Venkataraman, C., P. Raman, and S. Kohli. 1987. Calorific value measurements for biomass fuels. Energ) Environment M ~ 3:63-67.
VITA (Volunteers in Technical Assistance, Inc.). 1985. Testing the efficiency of wood burning cookstoves: Inter- national Standards, Arlington, Virginia.
WHO (World Health Organization). 1984. Evaluation of ex- posure to airborne particles in the work environment. WHO Offset Publication No. 80, Geneva.