
NBER WORKING PAPER SERIES EXPANDING ...
51
NBER WORKING PAPER SERIES EXPANDING GOVERNANCE AS DEVELOPMENT: EVIDENCE ON CHILD NUTRITION IN THE PHILIPPINES Eli Berman Mitch Downey Joseph Felter Working Paper 21849 http://www.nber.org/papers/w21849 NATIONAL BUREAU OF ECONOMIC RESEARCH 1050 Massachusetts Avenue Cambridge, MA 02138 January 2016 The authors thank discussants Christopher Blattman and Matthew Webb, and participants in seminars and sessions at the NBER Economics of National Security, UC San Diego, University of British Columbia, the Empirical Studies of Conflict annual meetings at the US Institute of Peace, the American Economic Association, the Pacific Conference on Development Economics at UCSD, the Seminar for the Study of Development Strategies at Columbia University – for which Kolby Hanson and Anselm Rink replicated our results, the “Political Economy of Social Conflict” conference at Yale University, and the “Defence and Security Economics Workshop” at Carleton University. This research is supported by the Office of Naval Research (ONR) through Award N000141110735 at the National Bureau of Economic Research and the Development and Conflict Research Program at the UC Institute on Conflict and Cooperation. Any opinions, findings, conclusions or recommendations in this document are those of the authors and do not necessarily reflect views of ONR. All mistakes are ours. The views expressed herein are those of the authors and do not necessarily reflect the views of the National Bureau of Economic Research. NBER working papers are circulated for discussion and comment purposes. They have not been peer- reviewed or been subject to the review by the NBER Board of Directors that accompanies official NBER publications. © 2016 by Eli Berman, Mitch Downey, and Joseph Felter. All rights reserved. Short sections of text, not to exceed two paragraphs, may be quoted without explicit permission provided that full credit, including © notice, is given to the source.
-
Upload
khangminh22 -
Category
Documents
-
view
1 -
download
0
Transcript of NBER WORKING PAPER SERIES EXPANDING ...
NBER WORKING PAPER SERIES
EXPANDING GOVERNANCE AS DEVELOPMENT:EVIDENCE ON CHILD NUTRITION IN THE PHILIPPINES
Eli BermanMitch DowneyJoseph Felter
Working Paper 21849http://www.nber.org/papers/w21849
NATIONAL BUREAU OF ECONOMIC RESEARCH1050 Massachusetts Avenue
Cambridge, MA 02138January 2016
The authors thank discussants Christopher Blattman and Matthew Webb, and participants in seminarsand sessions at the NBER Economics of National Security, UC San Diego, University of British Columbia,the Empirical Studies of Conflict annual meetings at the US Institute of Peace, the American EconomicAssociation, the Pacific Conference on Development Economics at UCSD, the Seminar for the Studyof Development Strategies at Columbia University – for which Kolby Hanson and Anselm Rink replicatedour results, the “Political Economy of Social Conflict” conference at Yale University, and the “Defenceand Security Economics Workshop” at Carleton University. This research is supported by the Officeof Naval Research (ONR) through Award N000141110735 at the National Bureau of Economic Researchand the Development and Conflict Research Program at the UC Institute on Conflict and Cooperation.Any opinions, findings, conclusions or recommendations in this document are those of the authorsand do not necessarily reflect views of ONR. All mistakes are ours. The views expressed herein arethose of the authors and do not necessarily reflect the views of the National Bureau of Economic Research.
NBER working papers are circulated for discussion and comment purposes. They have not been peer-reviewed or been subject to the review by the NBER Board of Directors that accompanies officialNBER publications.
© 2016 by Eli Berman, Mitch Downey, and Joseph Felter. All rights reserved. Short sections of text,not to exceed two paragraphs, may be quoted without explicit permission provided that full credit,including © notice, is given to the source.

Expanding Governance as Development: Evidence on Child Nutrition in the PhilippinesEli Berman, Mitch Downey, and Joseph FelterNBER Working Paper No. 21849January 2016JEL No. F51,I15,O53
ABSTRACT
Worldwide, extreme poverty is often concentrated in spaces where people and property are not safeenough to sustain effective markets, and where development assistance is dangerous – and might eveninduce violence. Expanding governance by coercively taking control of territory may enable marketsand development programs, but costs to local residents may exceed benefits, especially if that expansionis violent. We estimate for the first time whether a large counterinsurgency program improves welfare.We exploit the staggered roll-out of the Philippine “Peace and Development Teams” counterinsurgencyprogram, which treated 12% of the population between 2002 and 2010. Though treatment temporarilyincreased violence, the program progressively reduced child malnutrition: by 10% in the first year,and by 30% from year three onwards. Improved nutritional status was not due to increased health andwelfare expenditures, but instead to improved governance. Treatment effects are comparable to thoseof conventional child health interventions, though conventional programs are likely infeasible in thissetting. Rebels apparently react to treatment by shifting to neighboring municipalities, as malnutritionworsens there – with statistically significant 'treatment' effects of similar size. Thus overall programeffects are close to zero. These findings invite an evidence-based discussion of governance expansion,an extensive margin of development.
Eli BermanDepartment of Economics, 508University of California, San Diego9500 Gilman DriveLa Jolla, CA 92093and [email protected]
Mitch DowneyDepartment of Economics, 508University of California, San Diego9500 Gilman DriveLa Jolla, CA [email protected]
Joseph FelterCISAC and Hoover InstitutionStanford UniversityEncina Hall, C222Stanford CA [email protected]

Keywords: Development and Conflict; Counterinsurgency; Malnutrition; Philippines
JEL Classification Numbers: F51, I15, O22.
Contents
1 Introduction 1
2 Context 4
3 Data 53.1 PDT . . . . . . . . . . . . . . . . . . . . . . . . . . . . . . . . . . . . . . . . 63.2 Violent incidents . . . . . . . . . . . . . . . . . . . . . . . . . . . . . . . . . 63.3 Malnutrition . . . . . . . . . . . . . . . . . . . . . . . . . . . . . . . . . . . . 63.4 Summary statistics . . . . . . . . . . . . . . . . . . . . . . . . . . . . . . . . 83.5 PDT implementation . . . . . . . . . . . . . . . . . . . . . . . . . . . . . . . 9
4 Selection into PDT 11
5 Estimated Treatment Effects 125.1 Estimating equation . . . . . . . . . . . . . . . . . . . . . . . . . . . . . . . 125.2 Treatment effects . . . . . . . . . . . . . . . . . . . . . . . . . . . . . . . . . 145.3 Spillovers . . . . . . . . . . . . . . . . . . . . . . . . . . . . . . . . . . . . . 165.4 Robustness checks . . . . . . . . . . . . . . . . . . . . . . . . . . . . . . . . . 185.5 Scaling . . . . . . . . . . . . . . . . . . . . . . . . . . . . . . . . . . . . . . . 205.6 Net program effect . . . . . . . . . . . . . . . . . . . . . . . . . . . . . . . . 20
6 Interpretation 21
7 Conclusions 22
A Additional data details 24
B Additional results 25

“Thousands of children are killed every year as a direct result of fighting - from knifewounds, bullets, bombs and landmines, but many more die from malnutrition and diseasecaused or increased by armed conflicts... Any disease that caused as much large-scaledamage to children would long ago have attracted the urgent attention of public healthspecialists.”
— Graca Machal (1996), Expert Report to the Secretary-General of the United Nations
1 Introduction
Conflict and unstable governments are currently central challenges to development. Con-sider development assistance: as Table I illustrates, countries receiving Western OfficialDevelopment Assistance (ODA) tend to be not only poor, but also conflict-cursed. Thetable lists the top 15 recipients of ODA per capita from the World Bank, the United States,and the United Kingdom, along with measures of poverty, political instability, and conflict.These 15 include four of the five least stable countries on the globe, and five of the bottomten. Seven have suffered conflict for at least 15 of the last 25 years, with Sudan and Colom-bia involved in conflict for all 25. Foreign assistance is a major segment of these economies.From 2003-2012, ODA from these three sources made up more than 5% of GDP in nine ofthese countries and more than 25% in the case of Afghanistan.
[Table I about here.]
Current recipients of development assistance are typically violent and unstable for tworeasons. First, poor governance in general and violence in particular undermines investmentof all types, including in human capital and in institutions. So while countries such as China,with politically stable governments that protect property and people (at least for elites) haveexperienced sufficient growth to graduate out of a need for assistance, the conflict-cursedcountries in the table have not. Somalia, Afghanistan and Sudan, for instance, have averageGDP per capita of less than $2 per day.1
Second, ODA is often directed at countries such as Iraq and Colombia (who are notamong the poorest) with the objective of helping control their ungoverned spaces as partof a separate agenda of countering terrorism, narcotics, human trafficking and other globalpublic bads. Economists might object that this agenda distorts allocation of assistance tothe very poorest. Yet, if development assistance actually helped improve governance, thatallocation might be justifiable on efficiency grounds. That extensive margin of development,bringing governance to unsafe spaces, is the focus of this paper.
The centrality of conflict in modern development raises both practical and conceptualchallenges. Practically, development programs insert lootable and extortable resources likecash, food, equipment and personnel into insecure spaces, inviting predation and targeting byrebel groups.2 Conceptually, the usual logic by which development programs improve welfare
1The World Development Indicators had no GDP per capita on record for Somalia.2See Collier (2000), Nunn and Qian (2014).
1

requires that people and property are safe enough to allow contracting. If so, an injection ofresources implies a welfare improvement if the other conditions of the first welfare theoremare also met. In the absence of those conditions, development assistance of any form mayreduce welfare of residents by shifting rents to extortionary actors or by inducing welfareloss through violence and human rights abuses.3
Recent empirical results underscore this challenge. Using a regression discontinuity de-sign Crost, Felter, and Johnston (2014) show sharp increases in rebel-initiated attacks inPhilippine villages following the award of small-scale infrastructure grants. Using a multi-country panel, Besley and Persson (2011) show that in the absence of strong institutions,increases in foreign aid significantly increase the onset of large-scale political violence. Nunnand Qian (2014) show that US food aid to conflict-prone countries increases the intensityand duration of civil conflict. Aid can intensify conflict, perhaps undermining the possibilityof economic development by reducing security of people and property.4
Rather than implementing development programs in poorly governed spaces, an alter-native might be to first expand governance into that space. This is often an option; manycountries, like the Philippines, have pockets of ungoverned or poorly controlled space bor-dering fairly well controlled areas. Expansion of governance is a new topic for economists,though recently Callen et al. (2015) provide an economic explanation for the expansion ofPakistan into formerly ungoverneed space, and both Vanden Eynde (2015) and Berman et al.(2012) have looked at whether potential tax revenue induces government to contest rebel con-trol, in India and the Phillippines respectively. While as economists we may have normativeconcerns about recommending a coercive policy, it would nevertheless be a valuable positiveexercise to investigate what the net welfare effects of such an expansion of governance are.
Does expanding governance improve development outcomes? The answer is theoreticallyambiguous. We tend to think that a state will provide institutions that are more conduciveto functioning markets (and therefore welfare) than will rebels or informal governance. Yetstates sometimes neglect populations in the periphery, and rebels often provide services.5
Moreover, even if state governance is preferable to that by rebels, the transition is sometimescoercive and destructive (Machal, 1996), and accompanied by abuses of human rights, as ithas been in the Philippines (Sales, 2009). So the net effect of an expansion of governancemay make it undesirable for residents, even if government is preferred to rebels in a steady
3Grossman (1999).4One option implemented in Afghanistan and Iraq was development programs selected and protected by
the military. Berman et al. (2013) show that development projects, when accompanied by adequate forcelevels in Iraq, were security enhancing (in the sense of reducing violent incidents). Discussing developmentand counterinsurgency in Afghanistan, NATO force commander McChrystal said: “We view it as a process...which enables Afghan ownership and reinforces Afghan sovereignty... In some areas, it will be securityassistance. In some areas... it will be more based on help with governance and development...” (McChrystal,2010).
5Berman (2009) describes provision of services by Hamas, Hezbollah, the Mahdi Army and the Taliban;Heger (2010) documents community services provided by the Irish Republican Army; Keister (2011) describesservices provided by the Moro Islamic Liberation Front and the Moro National Liberation Front in theSouthern Philippines. These sources and anecdotal evidence suggest that when rebels control territorythey typically provide at least some form of security and dispute adjudication services to noncombatants,apparently at low cost to themselves.
2

state.
To date, no empirical research has directly assessed the net benefits of expanding gov-ernance, despite the volume of assistance now directed at unstable spaces. In this paper,we attempt to fill that void by evaluating a large counterinsurgency program operated bythe Armed Forces of the Philippines: “Peace and Development Teams” (PDT). Exploitingunprecedented access to precise program data on location and timing, and the program’sstaggered roll-out over nine years, we estimate effects on one of the few development out-comes available annually for Philippines municipalities: child malnutrition.
The program progressively reduced child malnutrition, by about 10% after the first yearand 30% after three years, an effect that is persistent for the seven year duration that we canestimate.6 These improvements in child welfare occurred despite increased violence associ-ated with treatment –much of which is initiated by government forces. These improvementsare slightly smaller than the treatment effects of other successful child health interventions,yet those alternatives would be difficult to implement in such weakly governed spaces. Whilewe can provide little detail about the mechanism by which PDT reduced child malnutrition,we can rule out the possibility that it proxies for a general expansion of social services, in-cluding health services. We therefore conclude that improvements in security, in access tomarkets, or in access to existing government services must be the causal mechanisms.
How do rebels react to PDT implementation? One possibility is that they are deterred,and retreat into inaction. This is often the working assumption of one-location models, evenwhen estimated with data from multiple locations (e.g., Berman et al. (2013)). Our evidenceindicates the opposite. Rebels apparently respond to PDT by relocating to neighboring mu-nicipalities, as evidenced by worsening malnutrition among neighbors following PDT. Thus,despite the improvements in child nutrition in treated municipalities, the aggregate effectof the program seems to be nullified by a displacement of malnutrition to neighboring mu-nicipalities which experience an approximately equal and opposite increase in malnutrition.This is the first evidence, to our knowledge, of a localized strategic reaction by opponentsto a program of this type.
In the next section, we discuss the Philippine conflict and the design of the PDT pro-gram. Section 3 describes our data. In Section 4 we consider non-random selection of wherePDT is implemented. Since we lack a strictly exogenous source of variation in implementa-tion, Section 4 is useful for understanding threats to causal inference. In Section 5 we usean “event study” design to estimate the malnutrition effects of PDT. We show that PDTwas not preceded by trends in malnutrition and that our results are unaffected by the se-lection controls identified in Section 4. Section 6 presents additional results that are usefulfor interpreting the estimated effect before Section 7 concludes with a discussion of policyimplications, comparing these estimated effects to those of other malnutrition interventionsand speculating on the larger question of secure governance in development.
6Estimates are subject to caveats about scaling, which we discuss below.
3

2 Context
The Philippines has suffered low-grade civil conflict for many decades,7 which continuesdespite a history of fairly functional multiparty democracy since 1986 (polity score of eight,since 1989).8 In that sense it is similar to Colombia, Mexico, Indonesia, or Turkey.
While a number of rebel groups are active, they can be broadly classified into two cat-egories. The New People’s Army (NPA), the armed wing of the Communist Party of thePhilippines (CPP), form the first category. The NPA has a following among the very poor,which is exacerbated by severe income inequality and the very gradual pace of land reform,even in the period of democracy (Montinola, 2013). During the first decade of this century,the NPA has accounted for nearly two-thirds of violent incidents (Crost et al., 2014). It isactive throughout the Philippines, though more so in rural areas.
Islamic separatists form a second category, which includes the Moro Islamic LiberationFront (MILF), the Moro National Liberation Front (MNLF), and the smaller and moreextreme Abu Sayyaf Group (ASG). Separatists are primarily active in the country’s South,in Mindanao and the Sulu Sea, and are ostensibly fighting for an independent Islamiststate. Past compromises between Islamist militants (primarily the MNLF) and the federalgovernment have significantly expanded the scope of local authority, with the establishmentof the Autonomous Region of Muslim Mindinao (ARMM) in 1996, one of the Philippines’seventeen regions.9
Importantly, the formal government faces little risk of being overthrown. The asymme-try of power is heavily tilted in its favor.10 The conflict with the NPA is characterized bysmall-scale insurgent attacks in poor rural areas, rather than frequent full-scale battles. Gov-ernment authority is relatively uncontested in urban areas, where rebel groups have limitedpopular support and opportunities to organize. Figure I displays this pattern, showing thatboth violent incidents and malnutrition –our key development outcome, are associated withlow population density. Both conflict and poverty are concentrated in rural areas.
[Figure I about here.]
As part of an effort to expand governance, the Philippine Army launched the PDTprogram in 2002, which continued earlier “stabilization operations.” Our sample periodroughly coincides with the Presidency of Gloria Macapagal-Arroyo11 (January 2001 untilJune 2010), though the program has continued under her successor.12 According to the
7Here, we provide only a brief review of these conflicts. The interested reader should see Crost andJohnston (2010), Felter (2005), Hernandez (2014), Quimpo (2012), or Schiavo-Campo and Judd (2005).
8Since 1989, the Philippines has maintained a polity score of eight. This score, originated by Ted Gurr,ranges from -10 (least democratic) to 10 (most democratic) and is based on executive recruitment, executiveconstraints, and political competition (Marshall and Cole, 2011).
9Regions are the largest subnational division of government.10In asymmetric conflicts like these, governments struggle to obtain information that helps them locate
insurgents, rather than struggle to defend territory (Berman and Matanock, 2015).11A professor of economics from an elite Philippine family.12The sample period also includes a Presidential election in May 2004 and three small suppressed military
4

program manual, special Army units were designated to enter selected villages (barangay),13
clear out entrenched rebels, assess community needs, and connect the village to governmentprograms and services. In principle, this might include building schools or clinics (thoughwe report evidence below to the contrary).14 Treatment more likely included protectinglocal business or markets from rebel extortion, securing roads to nearby villages or cities,or simply providing sufficient security for other government or international agencies to dotheir work. Each PDT implementation is relatively short, averaging less than three months,but is meant to establish a basis for continuing government involvement.
The PDT program is quite significant in scale. Table II reports PDT implementationsper year, as well as cumulative implementations through 2010. In any given year, 500-1,000of the Philippines’ 42,000 villages, accounting for 1-2% of the population, were treated. Overthe full period, over 5,000 villages (fully 12% of the population) received treatment. ThePhilippines has about 1,600 municipalities, nearly half of which (47% of the population)contained a village treated with PDT during the sample period.15
[Table II about here.]
Figure II maps implementations. Note that PDT treatment is spread throughout thePhilippines, though disproportionately in peripheral locations with low population density.
[Figure II about here.]
In conclusion, the PDT program represents a concerted effort by the government to sys-tematically expand control into areas that are relatively poor, violent and rural. It includessecurity and, in principle, development elements. To estimate treatment effects we willexploit staggered roll-out over nine sample years.
3 Data
We have three primary variables: PDT implementations, malnutrition rates, and vio-lent incidents. Additional variables (e.g., population, geography, etc.) are discussed in an
uprisings: a mutiny in July 2003, a state of emergency in February 2006 in reaction to an alleged coup attemptand a small rebellion in November 2007. None of these seem to affect program rollout (analysis availableupon request).
13Officially, the program is implemented within barangays, subnational political units smaller than mu-nicipalities. Barangays are mutually exclusive and exhaustive and are located entirely within municipalities.The Philippines has approximately 42,000 barangays, with an average population of about 3,000. Through-out the paper, we refer to barangays as “villages.” The exact number of villages and municipalities in thePhilippines changes every year, as these units merge and split. For analysis we use a consistent set of villageand municipality definitions that closely corresponds to official 2009 definitions used in Felter (2005).
14Unfortunately, we lack data about the specific set of services offered in PDT operations.15The geographic unit immediately larger than villages is the municipality, which have considerable po-
litical authority. The Philippines draws a distinction between “municipalities” and “cities.” Technicallyspeaking, there are about 1,500 municipalities and 140 or so cities, which have larger populations. The polit-ical distinction between these units is small so for simplicity, we use the term “municipalities” to collectivelyrefer to cities and municipalities.
5

appendix.
3.1 PDT
This research is enabled by access to a dataset unique in the study of counterinsurgencies.The Armed Forces of the Philippines (AFP) have shared with us the location and timing ofall PDT implementations from 2002 through 2010.16 While the AFP had been expandinggovernance and providing development services long before 2002, we lack systematic dataon those efforts. (So we can only study the effects of this particular wave of interventions,without being able to account for how previous programs might influence current treatmenteffects.)
3.2 Violent incidents
Our incident data include the full universe of violent incidents reported by the AFP.They were first compiled and analyzed in Felter (2005)17 and subsequently updated as partof the Empirical Studies of Conflict project. The data are based on underlying AFP incidentreports.18 For each incident, the data includes rebel, civilian, and government casualties;the number of rebels captured or surrendered; and a geographic code corresponding to thevillage where the incident occurred.19 A unique characteristic of these data is an indicatorfor whether the incident was rebel- or government-initiated.
3.3 Malnutrition
Malnutrition data is from the Philippines National Nutrition Council’s (NNC) Opera-tion Timbang (OPT) project. Operation Timbang is the NNC’s largest program, seekingto annually weigh every child in the country aged 0-71 months. In the late 1970’s, thePhilippine government established village-based health care provision as a national strategy(Phillips, 1986). Since that time, it has conducted a number of large-scale programs to sys-tematically establish permanent health care experts in local villages. Currently operatingprograms include the Barangay (village) Nutrition Scholars (BNS) program (established in1978), Day Care Centers (established in 1990), the Barangay Health Worker (BHW) pro-gram (established in 1995), and the Rural Health Midwives Placement Program (RHMPP)through which placements began in 2008.
16For 75% of implementations, we also observe end dates. For a small fraction (0.6%) of implementations,the geographic code corresponded to a municipality. We coded these as having occurred in each villagewithin that municipality. Because of changes in the definition of villages over time, we were unable to mergetwo of the 6,819 implementations with the rest of our data.
17See also Crost et al. (2014) and Crost et al. (2013).18Because the data originally come from AFP incident reports, they likely undercount attacks in which
the AFP was not involved. This complicates the variable’s interpretation, but does not bias our results.19For about 7% of incidents, the geographic code corresponds to a municipality. These incidents are
excluded from village-level analyses. Since our main analyses are conducted at the municipality-level, thishas little bearing on our empirical results.
6
Weighing is conducted by an OPT Plus Team, which includes village health and day careworkers, members of the Barangay Council, and sometimes other local community leadersand mothers. This team seeks to compose an exhaustive list of all children in the village age 5and under.20 The team designates an accessible location where weighing can occur. The NNCspecifies that this “may be held in a barangay hall, day care center, barangay health station,health and nutrition post, home or any place easily accessible to the target population.”Beginning in January, the OPT Plus Team is provided with instructions and materials fromthe federal government for the weighing procedure. Weighing occurred between January andMarch each year, with results reported to the federal government. The OPT program receivessignificant attention in the local media and results are widely publicized and discussed. Theyinform government resource allocation decisions.
The details of the Operation Timbang process are important for two reasons. First, thevillage-centric measurement process probably increases data reliability. Particularly becausewe are interested in unstable places where the government has limited authority, we mightbe concerned if federal agencies were directly responsible for weighing children. Since OPTis implemented by local staff from the same village they are likely to know of and have accessto all children.21 Second, the systematic nature of the program (e.g., the standards for theestablishment of the OPT Plus Team, the provision of a consistent set of instructions andmaterials, etc.) gives us some confidence in comparability over time and across locations.
We use the official estimated malnutrition rate, based on weight-for-age z-scores. Thisdefinition of malnutrition,22 and of the reference population used, follow the recommenda-tions of the World Health Organization (WHO). The publicly available NNC data has twolimitations relative to the underlying data collected. First, it is aggregated over villages up tothe municipality level. This still provides quite detailed data for analysis, as the Philippineshas approximately 1,600 municipalities, but does not match the village-level precision of thePDT data. Second, rather than report the distribution of weight for age, the data report onlythe malnutrition rate (defined as the percent of children who are two standard deviationsbelow the age-specific mean of an internationally-recognized reference population).
Table III displays descriptive statistics for our three key malnutrition variables: mal-nutrition rates, severe malnutrition rates, and the OPT estimate of coverage – the percentof children in the municipality who were weighed. The first panel presents all availableobservations. It suggests significant heterogeneity in malnutrition: the 75th percentile hastwo and a half times the malnutrition rate of the 25th percentile. The second panel weights
20Recall that the average village is 3,000 people.21Similarly, the involvement of local midwives and day care workers increases the likelihood that weighed
children are actually aged 0-71 months, as the program designates.22This definition of malnutrition, weight-for-age z-scores (WAZ) dates to Gomez et al. (1956). Since then,
Seoane and Latham (1971) have proposed splitting (WAZ) scores into height-for-age and weight-for-heightz-scores (Cole et al., 2007). Height-for-age (HAZ) is considered a measure of long-term malnutrition (“stunt-ing”) and weight-for-height (WHZ) is considered a short-term acute measure (“wasting”). Unfortunatelythe OPT data include only malnutrition defined according to WAZ scores. In 2010, following the recom-mendation of the World Health Organization, the Philippines switched from the International ReferenceStandard (IRS) to the WHO Child Growth Standard (CGS), which defines malnutrition in the same way,but uses a different reference population (Growth Reference Study Group, 2006). This was done to maintainconsistency with international standards.
7

municipalities by their population to obtain estimates more representative of the country.
[Table III about here.]
Of particular concern is the coverage measure, which is often quite low and sometimesquite high. We might be concerned that the malnutrition estimates from these municipalitiesare not reliable. Thus, for our main analyses, we exclude municipalities for which a) coverageis less than 66% or greater than 110%, and b) population is greater than twice the mean.23
The third panel displays malnutrition characteristics for this sample, which trims about 13%of observations.
Finally, OPT contains no data from the Autonomous Region of Muslim Mindanao(ARMM), where Islamist rebel groups are most active. This is because the autonomousregional government has overwhelming legal authority and is not required to cooperate withfederally sponsored data collection. As such, our malnutrition results are driven by PDTimplementations outside the ARMM, under-representing regions affected by Islamist rebelsand over-representing those affected by NPA. Recall that the NPA is responsible for nearlytwo-thirds of violent incidents (in data which are representative).
Importantly, malnutrition rates decline throughout the sample period, as illustrated inFigure III, which reports the weighted mean and 90/10 range over time. To account forthis national trend our analyses below will include year fixed effects. Because this rateof decline may well vary across municipalities, we will focus on results that also allow formunicipality-specific linear trends in malnutrition.
[Figure III about here.]
3.4 Summary statistics
Our main analyses will be conducted at the municipality-year level. Table IV presentssummary statistics, including separate figures for municipalities that received PDT and thosethat did not.24
[Table IV about here.]
Municipalities receiving PDT tend to be relatively disadvantaged: They have highermalnutrition rates (10.1% compared to 8.6%), are more likely to experience violent incidents
23Coverage is the number of children weighed as a percentage of the estimated number of children age 0-71months. Thus, it can exceed 100 for a number of reasons, including children being weighed multiple timesor, more likely, inaccurate population estimates. The NNC recommends caution with measurements outside80 and 110. We felt 80 was too restrictive. We only exclude municipality-years with poor coverage whenthey are large because we weight by population and were primarily concerned about inaccurate measurementamong particularly influential observations.
24The determination of key variables is discussed in Section 4. The Table reports statistics for our mainestimation sample, and uses the population weights used in the final analysis.
8

(70% of municipality-years compared to 41%) and, when experiencing violence, tend to havemore intense violence (7 incidents per year per 1,000 residents compared to 4.4). These de-scriptive statistics foreshadow the formal results regarding non-random PDT implementationdiscussed in the next section.
Table IV also reports several other facts relevant to estimation. First, municipality fixedeffects alone account for over 79% of variation in malnutrition, our dependent variable,leaving less than 21% with which to estimate treatment effects conditional on municipality.Second, conditional on a PDT implementation within a given municipality-year, only 12.5%of the population live in a treated village. Thus, our estimated municipality-level treatmenteffects are based on treatment experienced directly by, on average, only about a seventh ofthe measured municipality population. Finally, we observe malnutrition for years after PDTimplementation (2.6 years after the most recent, on average) allowing us to estimate delayedeffects.
3.5 PDT implementation
Three aspects of the program are important in understanding PDT implementation:PDT implementations are geographically clustered; repeat implementations are common;and nominal implementation is preceded by a period of government-initiated incidents.
Geographic clustering of PDT makes operational sense. Villages are quite small, withan average population of about 3,000, so a collection of five neighboring villages remains arelatively small area and clustering implementations would simplify the logistics of organizingmilitary units locally. Moreover, PDT might simply push rebels to the next village, whichwould then require attention, so treating clusters would be efficient.
We investigate spatial clustering by estimating
PDTit = αi + δt + β3NeighborPDTi,t−1,t−3 + β6NeighborPDTi,t−4,t−6 + εit . (1)
Here PDTit is an indicator that PDT was implemented in village i during month t, δt is amonth effect, NeighborPDTi,t−1,t−3 is the fraction of the four villages nearest to i in whichPDT was implemented between 1 and 3 months ago, andNeighborPDTi,t−4,t−6 is the fractionof these villages receiving PDT between 4 and 6 months ago. As shown in Table V below,these neighboring implementations are highly predictive. The first columns shows that theeffect of having all four nearest neighbors receive PDT in the last three months increases theprobability of PDT receipt by over 3 percentage points, from a base of only .12%. Columns(2)-(4) show that village fixed effects reduce this effect to about 2 percentage points, but itremains highly statistically significant (p < .01).
Given this evidence of geographical clustering, and the possibility that it is due to relo-cation of rebels across space, we will control for spillovers between neighbors in estimatingselection into PDT treatment.
[Table V about here.]
9
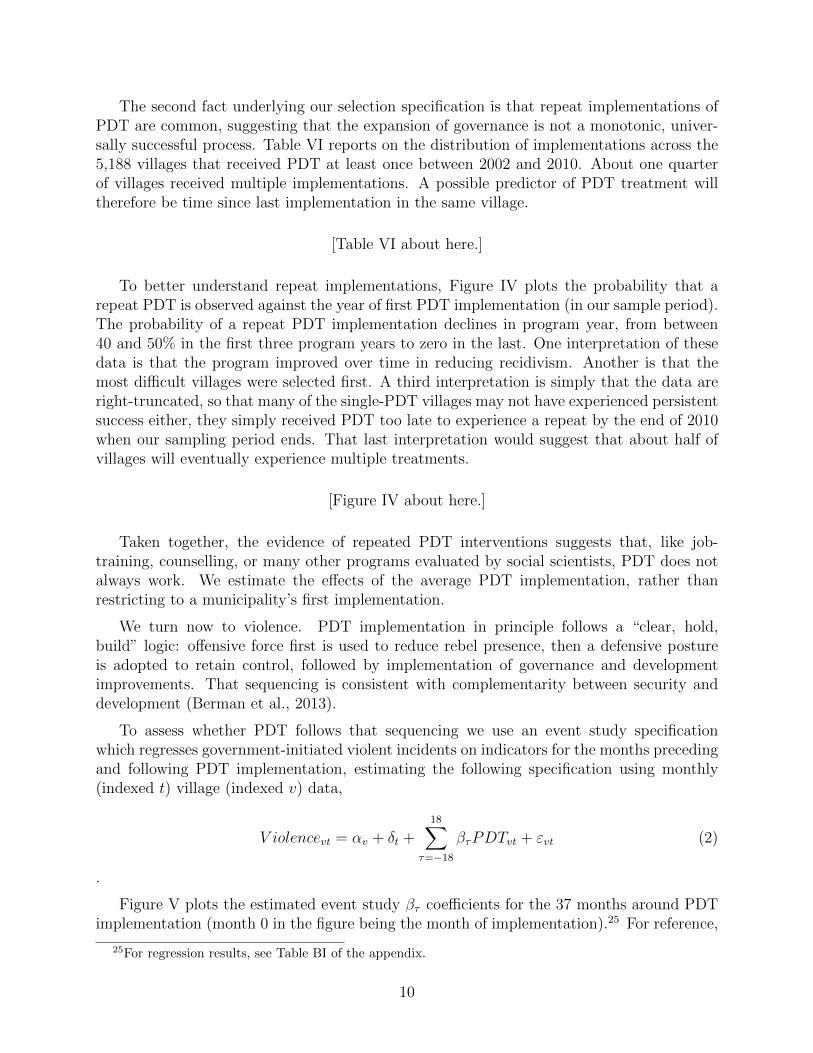
The second fact underlying our selection specification is that repeat implementations ofPDT are common, suggesting that the expansion of governance is not a monotonic, univer-sally successful process. Table VI reports on the distribution of implementations across the5,188 villages that received PDT at least once between 2002 and 2010. About one quarterof villages received multiple implementations. A possible predictor of PDT treatment willtherefore be time since last implementation in the same village.
[Table VI about here.]
To better understand repeat implementations, Figure IV plots the probability that arepeat PDT is observed against the year of first PDT implementation (in our sample period).The probability of a repeat PDT implementation declines in program year, from between40 and 50% in the first three program years to zero in the last. One interpretation of thesedata is that the program improved over time in reducing recidivism. Another is that themost difficult villages were selected first. A third interpretation is simply that the data areright-truncated, so that many of the single-PDT villages may not have experienced persistentsuccess either, they simply received PDT too late to experience a repeat by the end of 2010when our sampling period ends. That last interpretation would suggest that about half ofvillages will eventually experience multiple treatments.
[Figure IV about here.]
Taken together, the evidence of repeated PDT interventions suggests that, like job-training, counselling, or many other programs evaluated by social scientists, PDT does notalways work. We estimate the effects of the average PDT implementation, rather thanrestricting to a municipality’s first implementation.
We turn now to violence. PDT implementation in principle follows a “clear, hold,build” logic: offensive force first is used to reduce rebel presence, then a defensive postureis adopted to retain control, followed by implementation of governance and developmentimprovements. That sequencing is consistent with complementarity between security anddevelopment (Berman et al., 2013).
To assess whether PDT follows that sequencing we use an event study specificationwhich regresses government-initiated violent incidents on indicators for the months precedingand following PDT implementation, estimating the following specification using monthly(indexed t) village (indexed v) data,
V iolencevt = αv + δt +18∑
τ=−18
βτPDTvt + εvt (2)
.
Figure V plots the estimated event study βτ coefficients for the 37 months around PDTimplementation (month 0 in the figure being the month of implementation).25 For reference,
25For regression results, see Table BI of the appendix.
10

mean violence for the omitted category (months more than a year and a half before or afterPDT) is .0024 incidents per month per 1,000 population.
[Figure V about here.]
Figure V shows that government-initiated violence increases about fivefold nine monthsbefore a nominal PDT implementation date, increases again the month before implementa-tion, remains high for about four months, and then drops to the pre-implementation plateauand declines gradually back to the year-before mean over the next half-year. For our pur-poses the key is that the “clear” stage can be dated to nine months before the nominalimplementation date, a fact reflected clearly in the precisely estimated spike reported inTable BI. 26
4 Selection into PDT
We seek to estimate the effect of PDT implementation on malnutrition, but are sensitiveto the possibility of selection bias – namely that villages may be selected for PDT treat-ment on criteria that themselves predict malnutrition so that estimated treatment effectsare confounded with selection. In this section we investigate the selection mechanism inorder to help design estimates which avoid that bias. In the next section we will take twoapproaches to selection bias: using an event-study specification that examines estimatedpre-implementation trends directly, and including predictors of selection as regressors.
Formally, we aspire to estimate the coefficents of an equation like this one,
ln(MalnutritionRate)it = αi + β1FractionPDTit−1 + εit (3)
where i indexes municipalities and t years, the malnutrition rate (weight for age) is measuredas explained above, and the fraction of the municipality’s population in PDT-treated villagesis measured by FractionPDT . A municipality-specific fixed effect accounts for fixed factorsthat might predispose municipalities to have high malnutrition absent PDT.
We estimate a PDT selection equation with four features. First, to account for the“clear” stage, we date PDT implementations as beginning nine months before their nominalstart date. Second, because PDT is implemented in geographic clusters, we control for PDTimplementations in the nearest four villages over the previous three and six months (column1). Third, to allow for previous violence to predict implementation, we include three and sixmonth lags of incident rates in the village (column 2) and in the village’s municipality (column3). Finally, to account for complicated patterns of repeat implementations, we include anindicator for whether the village has previously received PDT and a linear (column 4) and
26One might be concerned that violence actually causes reactive PDT at a nine month lag, rather thanthe opposite. To check, we created the same figure using rebel-initiated violence (rather than government-initiated), and found no similar lead pattern, leaving us to conclude that causality more likely flows fromplanned PDT to pre-PDT, government-initiated violence.
11

quadratic (column 5) time trend in months since the last PDT implementation.27
PDTit = γ1NeighborPDTi,t−1,t−3 + γ2NeighborPDTi,t−1,t−6
+ γ3AvgV iolencei,t−1,t−3 + γ4AvgV iolencei,t−4,t−6
+ γ5PreviousPDTit + γ6MonthsSincePDTit + γ7MonthsSincePDT 2it
+ αi + ηm(t) + φy(t) + δit+ εit (4)
Table VII reports these results, estimated at the village-month level.28 The three majorfindings of the previous section again express themselves in predicting PDT implementation.PDT in neighboring villages during the previous three and six months predict new PDTstarts, as we saw in Table V. Lagged incidents predict PDT, over the previous three andsix months. Finally, recent PDT in the same village predicts an increased probability ofrepeat treatment, though that effect fades over time. While all of these findings hold afterincluding village fixed effects (column 7), all coefficients drop substantially. This suggeststhat a large part of the non-random selection is accounted for by time-invariant unobservedheterogeneity.
[Table VII about here.]
To summarize, the AFP seems to select villages for treatment by violence, proximityto treated neighbors and recent treatment. That selection has the potential to bias ourestimates of PDT on malnutrition (equation (3)), which we now turn to.
Unfortunately, our outcome measure (child malnutrition) is available for municipalitiesrather than villages and only annually. Appendix B reports the model presented in Equation(4) aggregated to the municipality-year level to match the units of observation we will useto estimate treatment effects. The key results in Table VII hold at these higher levels ofaggregation (see Table BII).
With a set of predictors of PDT implementation in hand, we can check for robustnessto selection bias in estimating the treatment effects of PDT on malnutrition. Short ofan instrument for selection, or the ethically disturbing idea that coercive force would berandomly assigned across municipalities, this is the best we can hope for.
5 Estimated Treatment Effects
5.1 Estimating equation
We can now estimate the effect of PDT on malnutrition while checking for possibleselection effects. We use two methods to deal with selection bias: first, we include a set of
27To avoid imputing PDT end dates, we use a time trend in months since the last PDT began. Since weinclude an indicator of whether the village had previously received PDT, the value of that time trend forvillages never receiving PDT does not apply to those villages.
28Table BII in the appendix shows the same specification estimated at the municipality-year level.
12

lead coefficients in an “event study” specification (Jacobson, LaLonde, and Sullivan, 1993;Hoynes, Page, and Stevens, 2011; Sandler and Sandler, 2013), that also allows municipalityspecific trends, and province-year effects as controls; second, we include predictors of PDTsuggested by the analysis of selection in the previous section.
Our base estimating equation is
ln(MalnRate)mt = αm + δp(m)t + γmt+k∑
τ=−k
1{τ 6= −1}βτPDTmt−τ + εmt (5)
where m indexes municipalities, p indexes provinces, and t years. ln(MalnRate) is thenatural logarithm of the malnutrition rate, PDTmt−τ is the fraction of municipality m’spopulation living in a village receiving PDT in year t − τ . As in the previous section, wedate PDT at nine months before the nominal start date to account for the “clear” evidentin Figure V of Section 3.5 above. We use log malnutrition because we expect a proportionalresponse to treatment.29
The βτ coefficients for τ < 0 are the coefficients on PDT leads, which we include in orderto check for pre-existing trends in malnutrition before treatment. The coefficients βτ forτ > 0 estimate lagged impulse-response as the result of PDT treatment. This may occurbecause governance is persistent, or because the economic effects of governance take sometime to set in. In particular, we might expect investment in physical and human capitalto accumulate over years as a result of improvements in property rights, safety, and accessto markets. The health effects of improved health and nutrition would also take time toaccumulate in weight for age.
Our specification drops the 1-year lead of PDT to form a reference point (the regressionconstant) in checking for pre-existing trends. Given the reference point and the timing ofmeasurement (January through March of every year), treatment effects should primarily bereflected in the lag coefficients βτ for τ >0.
Rebels may respond to PDT treatment by displacing their activity to untreated areas.To the extent that this happens within the same municipality it will be captured in theestimated treatment effect, since our unit of observation is a municipality. Should rebelsrelocate their activity to neighboring municipalities, we can estimate the effect of possiblespillovers by including as a regressor the average level of PDT in the four nearest neighbormunicipalities (measured by geometric distance from midpoint).
29The malnutrition rate is the percent of children whose weight falls below an age-specific thresholdrecommended by the World Health Organization (on the basis of a standard reference population). In amodel where PDT has a linear effect on children’s weights near the threshold, the effect will be largerwhere the mass near the threshold is larger. Unfortunately we do not observe the mass near the threshold.However, because children’s weights tend to have bell-curve type distribution (The WHO assumes Box-CoxPower Exponential) and because the threshold is likely to the left of this distribution’s peak (since the averagemalnutrition rate is only about 10%), we expect the mass to be larger when the malnutrition is higher. Thelog transformation generates larger effects when the malnutrition rate is higher. The malnutrition rate isnever zero (Table III), so no observations are lost by taking logarithms.
13

Our estimating equation including spillovers is then
ln(MalnRate)mt =αm + δp(m)t + γmt+k∑
τ=−k
1{τ 6= −1}βτPDTmt−τ
+k∑τ=0
θτNeighborPDTmt−τ + εmt
(6)
where NeighborPDTmt−τ is the population-weighted average of PDT in the four nearestmunicipalities so that the lag coefficients θτ estimate spillovers from neighboring munici-palities. Following the discussion above, those spillovers cannot be signed in theory. Theymight increase malnutrition due to transition effects and degradation in governance betweengovernment and rebel control, or they might improve nutrition if rebel governance is actuallyan improvement.
5.2 Treatment effects
Our main results are illustrated in Figure VI which plots the estimated coefficients ofequation (6). Visually, there is little evidence of a pre-existing trend in PDT before treat-ment, in years t=-5 through t=-2. The year t-1 coefficient is normalized to zero. From theyear that treatment begin (t=0), we see a persistent reduction in malnutrition, which levelsoff five or six years after treatment. Standard error bands indicate that none of the estimatedcoefficients are statistically different from zero (at the 5% level).
[Figure VI about here.]
Table VIII reports estimated coefficients. In order to gain precision coefficients are re-stricted to be equal for lag combinations (3,4), (5,6) and 7 or more, as reported in column1. (The full set of lags and leads illustrated in the figure is reported in Appendix tableBIV.) Specifications reported in this table all include a full set of municipality fixed effects,municipality specific trends, and province x year fixed effects. (Appendix table BIV reportsthat results are sensitive to excluding municipal trends, and that province x year fixed effectsimprove precision.)
[Table VIII about here.]
In this specification (and those that follow) the coefficients on PDT leads are generallysmall. We test for selection or some other source of pre-existing trends with an F-test of thejoint significance of the four lead coefficients (which fortunately share the same sign). TheF-test has a p value of 0.56, which indicates no evidence of a pre-existing trend.
Treatment effects of PDT on malnutrition are reflected in the contemporaneous andlagged coefficients: a reduction of 6.6 log points in the treatment year, 18.1 log points the
14

year after, 25.9 log points after two years... through a 33.6 log point reduction after sevenyears. These are large reductions. Nevertheless, the F-statistic on the joint significance ofthe six contemporaneous and lagged coefficients has a p-value of 0.06, not quite significantat the 5% level.
More precision can be gained for testing by further restricting the set of lagged coeffi-cients, but before we pursue that, the true size of our F-tests requires some attention. Ourstandard errors are clustered at the province level (for the 78 Philippine provinces). Recentresults by MacKinnon and Webb (2014) indicate that when clustered entities are unbal-anced (i.e., come in very different sizes), or when the proportion of clusters treated is small,sampling distributions of the cluster robust variance estimator diverge from asymptotic ap-proximations, even for fairly large sample sizes, resulting in test size distortions and frequentoverrejection of the null hypothesis.
As a check, Column 2 reports the same set of coefficient estimates with standard errorsestimated by the wild cluster bootstrap method of Cameron et al. (2008), which are con-sistent. Note that these boostrapped standard errors are about ten percent larger than theanalytic in Column 1, indicating a possible size distortion in testing. More importantly, awild cluster bootstrap of the F-test indicates that our F-statistic rejects a true null hypoth-esis fully 14 percent, more than twice the 6 percent estimated of the asymptotic p (labeled“analytic” in the Table).30
To illustrate this point, Figure VII compares the empirical distribution of the boot-strapped F-statistic, the histogram, to the analytical F distribution, which is drawn as acurve. The histogram clearly has a lot of density to the right of the curve. The vertical redline indicates the realized F-statistic of 2.228, with six percent of the curve to the right of it,but 14 percent of the histogram. This discrepancy suggests skepticism about the analyticalp-value, and about our asymptotic approximations in general, when clustering by province.
[Figure VII about here.]
Faced with a lack of precision, despite our wealth of observations, we must make someassumptions. One approach would be to impose uncorrelated errors across municipalities (aswell as across provinces). This assumption would be violated if rebels responded to PDT byrelocating their activity to neighboring municipalities in a way that affected child nutrition.Column 3 reports estimates of the same specification with standard errors clustered by 1513municipalities. Standard errors of estimated treatment effects (lags) are generally larger un-der this assumption, leading to an F-statisic of 1.035 with a p-value of 0.346 (bootstrapped),even further from rejection. Larger standard errors under an assumption of uncorrelatedresiduals indicate that εmt may be negatively correlated across municipaliites in equation(5), which would be consistent with spillover effects of PDT across municipalities throughrebel relocation. Henceforth, we stick with clustering standard errors at the province level.
Before turning to a test for spillovers across municipalities, we try an alternative routeto precision by restricting lead and lag coefficients. This should yield precision gains since
30We thank our discussant Matthew Webb for alerting us to this possible problem, and for generouslyassisting with Stata code for testing.
15

PDT is highly serially correlated within municipality, so that estimated coefficients have high(negative) sample covariance. The event study plot in Figure VI indicates many optionsfor constraining coefficients, since lead coefficients look statistically identical and laggedcoefficients change very little from three years after treatment onwards. Column 4 reportsthe effect of restricting the coefficients on leads two through four to be equal, while alsorestricting coefficients on lags three onward to equality. Estimated treatment effects aresimilar through lag three, with a long run estimated reduction in malnutrition of 27.8 logpoints. In this specification the F-test on leads indicates joint insignificance (p=0.47), whilethe F-test on lagged and contemporaneous coefficients rejects at p=0.026 (wild clusteredbootstrap) and 0.017 (analytical).
Further precision can be obtained by restricting the contemporaneous and lagged coeffi-cients to a spline function that restricts coefficients in years zero, lag one and lag two to belinearly related with a constant slope (τ+1)*β. That specification is reported in Column 5,yielding a slope of 0.084 for treatment year, the next year and the following year (reductionsin malnutrition of .084, .168 and .252 log points) and a long run effect of -0.286 after yearthree. With that restriction, the joint F test rejects a null of no treatment effect at p=0.01(wild clustered bootstrap).
Figure VIII illustrates the splined specification of Column 5 with a solid line in a shadedconfidence region. Compared to the unconstrained results, the estimated treatment effectsare indeed smaller (i.e., less malnutrition reduction). Nevertheless, from one year aftertreatment onwards the treatment effect is precisely enough estimated to be statisticallydifferent from zero, with a long run, precisely estimated, reduction in malnutrition of 28.6log points, or 25 percent.31
[Figure VIII about here.]
5.3 Spillovers
We return now to the possibility of spillover effects of PDT on malnutrition in neighboringmunicipalities. Geographical relocation of rebels is common in asymmetric civil wars, and isanecdotally present in the Philippine context in particular. Having established that PDT hasa treatment effect, it would not be surprising to find that relocation of rebels has an oppositeeffect, through reduced security of people and property or reduced access to markets. Thattype of spillover was also suggested by the discovery of negatively correlated residuals acrossmunicipalities in Table VIII.
Table IX reports the results of estimating equation (6), which augments estimated treat-ment effects with spillover coefficients reflecting the effects of PDT in neighboring munici-palities. Column 1 reports again the estimated treatment effects from Table VIII Column 5,using the spline specification to maximize precision.
31The estimated five year lead coefficient has very low precision for lack of data. Table BIII (below)displays the distribution of the number of years since the most recent PDT, across municipality-years in theestimation sample. About 75% of observations are within four years of a PDT implementation and 90% arewithin six years.
16

[Table IX about here.]
Column 2 adds analogous coefficients for neighbor PDT, again imposing the spline re-striction on lagged coefficients, as in Column 1, but this time on both own and NeighborPDT. The coefficients on PDT in neighboring municipalities (averaged over the four nearestneighbors) are positive, indicating that PDT in neighboring municipalities increases malnu-trition. They are about the same size as the own-PDT coefficients. The long run (3+ years)coefficient on neighboring PDT is statistically different from zero, indicating a 34.4 log pointincrease in malnutrition, as opposed to the long term own PDT coefficient estimate indicat-ing a 35.5 long point reduction. The neighboring PDT coefficients are jointly just barelystatistically significant at the ten percent level (with an analytical p-value of 0.106 reportedfor an F test at the bottom of the table, and a boostrapped p-value of 0.099) but providehighly suggestive evidence that PDT in neighboring municipalities worsens malnutrition,especially in the long term.
Those effects are illustrated by Figure IX, which plots spline coefficents and confidenceintervals for both own PDT and neighbors’ PDT. The effects are approximately symmetricand of opposite sign, both over the first three years, and thereafter.
[Figure IX about here.]
One concern with this evidence of spillover is that it may be a statistical “reflection” dueto the correlation of neighbor PDT with own PDT, causing a bias to be transmitted from thelatter coefficients to the former. In column 3 we explore that possibility by estimating thespillover coefficients (the effects of PDT in neighboring municipalities) for 6001 municipalitiesthat do not receive PDT during the sample period. 32 We find strong evidence of spillovereven into municipalities that do not receive any PDT: the F-test for joint significance of thetwo spline coefficients has a p-value of 0.01. We infer that PDT in neighboring municipalitiestruly does increase malnutrition through spillover.
To complete the split-sample analysis, Column 4 reports estimates of the full spilloverspecification for the complementary sample of municipalities that ever experience PDT. Own-PDT and neighboring PDT coefficients are very close to those reported for the full sample(Column 2) and statistically indistinguishable. Compared to estimates for muncipalities thatnever experience PDT, the spillover effects are much smaller in municipalities that experienceat least some PDT. One possible explanation is that a small amount of PDT is protectiveagainst spillovers. Another is that treatment effects differ with the level of PDT, so that alog-linear specification provides a poor approximation. Municipalities that never experiencePDT average much lower rates of PDT among neighbors (4.1% vs. 7.7%) as well as lowermalnutrition rates (8.6% vs. 10.1%), as reported in Table IV.
Returning to the estimated effects in Column 2, the estimated spillover effects inviteinterpretation. PDT induces negative spillovers among neighbors, in addition to positiveimprovements in child nutrition. Including those coefficients in the longer regression corrects
32We thank David Green and Francesco Trebbi of the University of British Columbia for this suggestion.
17

a small omitted variable bias (since own PDT is apparently correlated with neighbors’ PDT),resulting in slightly larger own-treatment effects. The effect for 3+ years is stronger, a35.5 log point reduction. That effect might also have been slightly overstated in the shortregression due to contamination of comparisons from treatment, but that contaminationwould have been diluted among the 1,512 comparison municipalities.
We have no direct evidence on the mechanism by which spillover takes place, yet anec-dotal evidence suggests that PDT displaces rebels from treated muncipalities to neighboringmunicipalities, reversing the mechanism by which PDT reduces malnutrition. The only otherplausible alternative we can think of by which PDT would lower malnutrition for childrenin treated municipalities while increasing it for children in neighboring municipalities is thatPDT redirects other government resources from the neighbors to the treated. We rule thatout with direct evidence on spending below, leaving us to conclude that rebels react to PDTnot by being deterred into inaction but by relocating to neighboring municipalities, which inturn worsens malnutrition. To our knowledge this is the first empirical evidence of strategicreaction by rebels to a large scale development program of this type.
5.4 Robustness checks
The results in Table VIII include municipality and province-year fixed effects andmunicipality-specific linear trends. The lead coefficients show no evidence of pre-existingtrends before treatment. However, we can additionally test for selection bias by checking ifestimated treatment effects are robust to including predictors of PDT, which we investigatedin Section 4. There we found that treatment of neighbors was a predictor of PDT, which wehave covered in our discussion of spillover. We also saw that lagged violence predicted PDT,which we turn to here. In addition, we will check for robustness of results to using only thefirst instance of PDT (in a village) and to the calculated timing of treatment.
Table X shows that the estimated treatment effects are virtually unaffected by addingviolence as a predictor of PDT. Column 1 replicates our preferred specification, column 2of Table IX. Adding violent incidents comes at a cost: because we don’t observe violentincidents beyond 2010, controlling for lagged incidents requires dropping 2012 from theestimation sample. Column 2 replicates column 1 on the sample from 2005-2011. Theseresults are very similar to those in column 1 except that the estimated treatments effects areless precisely estimated.33
Column 3 adds violence as a predictor, estimating
ln(MalnRate)mt =αm + δp(m)t + γmt+k∑
τ=−k
1{τ 6= −1}βτPDTmt−τ
+k∑τ=0
θτNeighborPDTmt−τ + ηV iolencemt−1 + εmt. (7)
33The loss of precision occurs because we’ve lost nearly 15% of the sample by dropping 2012, includingthe part most likely to be informative about post-PDT effects.
18

where V iolencemt−1 is the lagged rate of violent incidents in the municipality andNeighborPDTmt−1 is, again, the population-weighted average of PDT in the four nearestmunicipalities. Comparing columns 2 and 3, including a measure of violence has almost noeffect on the estimated treatment effect of PDT, except for a small lead effect suggestingselection on high malnutrition when lead violence is included as a regressor. So there isno evidence of omitted variable bias due to omission of violence which predicts PDT. Weconclude that the event study specification (including municipality and province-year effectsand municipality-specific trends) is fairly robust to any selection on malnutrition that wecan predict, though the specification in column 3 suggests that the trend reduction mightbe slightly overstated.
[Table X about here.]
As an alternative robustness check we exclude repeat PDT interventions from the anal-ysis, using only first instances. As discussed above, treated villages sometimes suffer a typeof recidivism and are selected for repeat treatment. Our preferred approach has been toestimate the effect all PDT treatments in a village in order to report an average treatmenteffect, which includes the possibility that repeat PDT indicates villages predisposed to mal-nutrition or that a second PDT is less (or more) intense than the first. Column 4 replicatesthe specification from column 1, but uses only first PDT implementations received by avillage (and aggregated to the municipality level). Estimated coefficients are similar, thoughthey show some sign of pre-treatment selection. Given that the selection criteria of villagesfor repeat implementation might differ from that of initial implementations, the fact thatestimated effects are similar for both again demonstates robustness, supporting a causal in-terpretation. The estimated effects for first PDT are a little smaller in absolute value, butstatistically the same as those for any PDT. They are less precisely estimated.
As an additional robustness test, we check whether results are robust to the estimatedstart date of PDT, which we coded as nine months before the nominal start date, as indi-cated by the evidence of “clear” activity in Figure V. The lead coefficients indeed show evi-dence that malnutrition rates were higher beyond 1-year before PDT (the omitted category),though the t tests are statistically unimpressed (as is the joint F, which is not reported).Importantly, the lead coefficients should now be interpreted as malnutrition relative to theyear before the “official” PDT start date, and, as Figure V shows, government forces wereactive in the village for most of that year. Thus, we feel that the positive lead coefficientsin column 5 are evidence of short-term treatment effects, rather than selection bias.
In summary, PDT provides a statistically significant medium term malnutrition reductionthat accumulates to about 30 percent after three years (35 log points) and is constant untilat least seven years out.34
34A disturbing possible source of bias is that PDT increased child mortality among the malnourished,reducing the proportion of malnourished children. We checked by estimating whether PDT reduced thenumber of children age 5 and under (reported in the OPT data) and found no evidence of such an effect.We also checked whether PDT increased OPT coverage (the share of children weighed), which was alreadyquite high, and again found no effects.
19

5.5 Scaling
The scaling of our estimated treatment effects requires some explanation. To this point,we have described PDT’s effects on child malnutrition by directly interpreting the coefficienton the lagged PDT variables. This is the estimated reduction that would occur if the shareof the population receiving PDT went from 0 to 1, which is realistic for a village. Howeverour unit of observation for regression analysis is a municipality. The average municipalityhas 26 villages and (as Table IV shows) the average implementation only treats 12.5% ofthe municipality’s population. Our preferred specification (column 2 of Table IX) impliesthat PDT reduces the malnutrition rate by about 30% in the long run. So our estimatedtreatment effect is based on linear extrapolation from a program that on average treats onlyabout one eighth of the municipality’s population to inference about what would happen ifthe full population were treated.
If the effects of PDT accrued only to the population in the treated villages (the 12.5% ofthe municipality’s population, on average), then linear extrapolation of our estimates wouldimply that a village which receives PDT sees malnutrition fall by 30%. Beyond extrapolationof a possibly nonlinear effect, there is also the potential for externalities, since PDT maywell affect non-recipient villages within municipalities, just as we have seen that it affectsneighboring municipalities. Other villages may benefit from a nearby PDT implementationif PDT improves security, infrastructure, or services in the area –access to markets andregional clinics, for instance, could benefit children in neighboring villages. In that case,some of the malnutrition reduction we estimate is realized by non-recipient villages in themunicipality and recipient villages must experience a less than 30% decline in malnutrition.On the other hand, PDT might relocate rebel activity from treatment villages to neighboringvillages within the muncipality, to the detriment of child nutrition, (as we have seen acrossmunicipalities in Table IX). In this case, the malnutrition reduction we estimate includesimprovements for recipient villages, offset by worsening malnutrition in neighboring villages,and recipient villages actually experience more than a 30% decline in malnutrition. Withthose caveats, our estimated treatment effects should be interpreted as a linear approximationto the effect of a small change in treated population in a municipality, including possiblewithin-municipality spillovers, possibly positive or negative.
5.6 Net program effect
Given the evidence of spillovers, what’s the aggregate effect of the PDT program? Oneway to answer that question is to test whether the malnutrition increase due to neighbors’PDT (the θs in equation (6)) negate the decrease due to own PDT (the βs). Specifically,equation (6) with a spline imposed has two coefficients on lagged own PDT, a linear and along term level –call them βlin and βlt, and two coefficients on lagged neighbors’ PDT, –θlinand θlt. We test whether βlin = - θlin, and whether βlt = - θlt. Those test statistics arereported in the bottom four rows of Table IX. In neither case are they rejected, indicatingthat the own effects of PDT are statistically negated by those of neighbors’ PDT. Thatwould imply a net treatment effect of about zero if population and malnutrition rates werebalanced across treated municipalities and neighbors experiencing spillover.
20

Estimating the aggregate effect is a little more complicated because population and mal-nutrition rates differ across municipalities (they tend to be higher in treated municipalitiesthan in their neighbors). Predicting the effects of the specification in column (2) of TableIX by converting log changes to levels and aggregating yields a small aggregate increase inmalnutrition due to PDT of one hundredth of one percent.
An alternative, more flexible, approach would be to predict an aggregate effect using thesplit sample estimates reported in Columns 3 and 4 of Table IX, which allow the spillovereffects to differ between ever-treated and never-treated municipalities. The never-treatedhave higher spillover effects but lower baseline malnutrition rates (as we saw in Table III).That approach yields an estimated aggregate program effect of a one tenth of one percentimprovement (i.e., reduction) in child malnutrition. Our conclusion is that across specifica-tions, spillovers either largely or completely negate the reductions in malnutrition due to thePDT program.
6 Interpretation
While PDT reduces malnutrition quite substantially, we know very little about how.One possibility is that security and removal of extortionary rebels allow markets to function,enabling private expenditure on food and medical care for children. Alternatively, given theevidence of “clear” activity and the program rhetoric about enabling government services,one might suspect that PDT is only the visible tip of a vast iceberg of associated securityand governance programs, including medical care.
To check the hypothesis that improved government services are an omitted variable cor-related with PDT we estimate the effects of PDT on municipal government spending onhealth and nutrition as well as total spending (again coding start dates with a nine monthlead, to reflect “clear” activity). Figure X reports coefficients from an event study regressionof the logarithm of health and nutrition spending (Panel (a)) and total spending (Panel (b))at the municipality level on leads and lags of PDT. There is no evidence that PDT had anyeffect on either type of spending, or that PDT was preceded by trends in these spendingvariables.
[Figure X about here.]
A related interpretation would by that a PDT implementation coincides with a broaderincrease in federal interest in a municipality. In this case, we would expect to see PDTaccompanied by an increase in federal-municipal transfers, an important revenue source formunicipal governments.35 Figure XI shows that, to the contrary, PDT typically occurs inthe middle of a sustained decrease in federal-municipal transfers.
35While transfer amounts are legally determined by a fixed formula, federal authorities have some discre-tion. See Troland (2014) for a detailed discussion of Federal-Municipal transfers and their effects on localpublic finances.
21

[Figure XI about here.]
In summary, the evidence weighs against infering that PDT improves nutrition througheffects on government spending. That leaves two possibilities: either enhanced securityimproved the quality of government service provision at constant spending rates, in waysthat favored children’s nutrition; or enhanced government control enabled the functioning ofmarkets in a way that advantaged nutrition of children.
7 Conclusions
A major challenge confronting development economics is how to effectively assist peoplewho unfortunately live in violent, unstable places. Many programs require a minimallyfunctional government, without which implementing agents face unacceptable risks or entirepopulations are left out of reach. Even when interventions can reach these target populations,implementation is often compromised by leakage, and the implied insertion of capturablerents into an insecure environment may actually increase violence.
An alternative, or precursor, to effective development assistance may be expansion ofgovernance, hopefully enabling provision of basic services, development assistance, and thefunctioning of markets. Coercive expansion of governance runs the risk of violence andhuman rights abuses, so the net effect on welfare of residents is unclear. We take a first steptowards measuring those net welfare effects, in the context of the Philippines, a middle incomeeconomy with a military subject to weak democratic oversight, experiencing a festering, lowintensity insurgency.
The Philippines’ Peace and Development Teams, operated by the Armed Forces of thePhilippines, directly reached 12% of the population over nine years. We estimate that theaverage implementation reduced child malnutrition by about 30% in treated villages afterthree years, and persisted afterwards until at least year seven. As to mechanism, PDT is notassociated with expansions in government expenditure on welfare or health, so we concludethat improvements in security, access to markets or access to existing government servicesmust have enabled improved infant health.
How important is this finding? To put these effect sizes in context, Table XI summarizesseveral evaluations of child malnutrition treatments which use weight-for-age z-scores (WAZ)as an outcome.36 For each study, we summarize the intervention, the measurement of thedependent variable, the estimated effect in its original form, and the implied reduction inthe malnutrition rate.
36Many studies separate WAZ into weight-for-height and height-for-age (Duflo, 2003; Graff-Zivin, Thiru-murthy, and Goldstein, 2006; Lavy et al., 1996), something we cannot do with Operation Timbang data. Alsonot included in the table are a large number of interventions for which no effects have been found. See Massetet al. (2011) for a review of mostly unsuccessful agricultural interventions, Morris et al. (2004) for a studyestimating that a Brazilian conditional cash transfer program increased malnutrition, Lind et al. (2008) foran RCT showing that iron supplements can increase malnutrition for non-deficient infants, and Singh, Park,and Dercon (2013) for a study estimating that India’s school lunch program did not reduce malnutritionamong participants (although it did protect against the deleterious effects of unexpected drought).
22

[Table XI about here.]
As the Table makes clear, PDT induced improvements in child nutrition comparable tothe leading examples in the literature. Each intervention estimates a 35-45% reduction inthe malnutrition rate, which is a little more than the estimated long term effects from ourpreferred specification (about 30%).
Moreover, the interventions described in Table XI would likely be infeasible in PDT vil-lages, given their lack of governance. In the absence of a persistent security presence, itis difficult to imagine programs distributing medicine or cash to those vulnerable popula-tions operating safely or successfully. A precursor program such as PDT can enable thoseinterventions, and has substantial welfare benefits for local residents, even if the rebels itdisplaces are relatively benign Marxists conducting a fairly low casualty insurgency.
Our conclusions come with three important caveats. First, even compared to othermultifaceted interventions, there are deficits in our knowledge of the actual content of thePDT intervention, and in our understanding of the mechanism by which health improvementsoccurred. Research on those topics, which is likely to be qualitative, would be welcome.Second, the health effects of PDT come from an intervention that connects peripheral villagesto a middle income economy governed by a fairly stable multiparty democracy, making itmore like Turkey or Indonesia than like a less functional setting such as the undergovernedspaces of the Middle East or Africa.
Third, and most importantly for policy, the aggregate effects of the intervention on childwellbeing were approximately zero, since the negative spillover effects of PDT on neighboringmunicipalities negated the positive treatment effects. Those negative spillovers suggest thatnot only is government good for child development, rebels are bad for it –even in a relativelylow-intensity conflict like that in the Philippines. Nevertheless, though the interventionbenefited children locally, it was not conducted at sufficient scale to accomplish more thandisplacing malnutrition associated with rebel activity, unfortunately evoking a “whack-a-mole” analogy.
We do not believe that military-centric counterinsurgency programs are a panacea forhuman development in poorly governed spaces. We do think that these findings invite anevidence-based discussion of the role of expansions of governance, as an extensive margin ofdevelopment.
Affiliations:Department of Economics, University of California, San Diego and NBERDepartment of Economics, University of California, San DiegoCenter for International Security and Cooperation and Hoover Institution, Stanford Univer-sity
23

A Additional data details
Three important variables not discussed in the main text are: municipality populations,village populations, and geography (used to identify the four nearest neighbors).
We seek annual estimates of population variables. We obtain these from three datasources:
1. Annual province-level population estimates from the National Statistical CoordinationBoard (NCSB) from 2000-2011
2. Municipality-level population estimates from 2000, 2003, 2007, and 2010
• Estimates from 2000, 2007, and 2010 are from the Philippine Census
• Estimates from 2003 are from the NCSB small area poverty estimates
3. Village-level population estimates from the 2007 Census
With these data sources, we estimate annual populations in three steps. First, we linearlyinterpolate and extrapolate municipality populations for missing years. Second, we propor-tionally adjust these municipality populations so that they sum to the annual province-levelestimates. Finally, we divide a municipality’s population among its villages using the 2007population distribution.
As a basis for the geography variables, we rely on a dataset from the NCSB with thelongitude and latitude of each villages’ centroid. A similar dataset was available for munic-ipality longitude and latitdue, but inspection revealed it was fraught with inconsistencies.The village-level longitudes and latitudes were much more reliable.
Thus, we estimated each municipality’s longitude and latitude using the village data. Todo so, for each municipality, we took the midpoint of the longitude and the latitude fromthe various villages within the municipality. This identifies a point which is in the centerof the smallest rectangle that could be drawn to include each village’s centroid. However,there is no guarantee that this point is actually within the municipality.37 Thus, we definethe longitude and latitude of the municipality to be the village centroid with the smallestEuclidean distance from this rectangle’s center. This does not guarantee that the municipal-ity’s “location” is its centroid, but provides a reasonable approximation which guaranteesthat the location will actually be within the municipality.
Finally, we calculate a distance matrix containing the Euclidean distance between eachmunicipality. The four nearest neighbors were selected to be the four municipalities for whichthe Euclidean distance was the smallest.
37Consider, for instance, a u-shaped municipality. This point would lie outside of its borders, despitebeing the center of the smallest inclusive rectangle.
24

B Additional results
Table BI reports the coefficient estimates illustrated in Figure V.
[Table BI about here.]
In Section 3.5, we presented evidence for three important considerations regarding selec-tion in the PDT implementation decision. These were formalized in Equation (4) in a modelestimated in Table VII at the village-month level. Unfortunately, our key outcome measure(child malnutrition) is not observed at the village-month level, but is only available at themunicipality-year level, and so we must aggregate this selection model. The main findingsof 3.5 turn out to be robust to both those aggregations – over periods and over space.
Table BII presents the same selection model at this higher level of aggregation. Instead ofa binary indicator of a PDT implementation beginning in month t, the dependent variable isthe fraction of the municipality’s population living in a village with a PDT implementationbeginning in year t.38 As in Table VII, Table BII codes PDT as starting nine months beforethe nominal start date to account for the “clear” period. The municipality-level results(Table BII) are broadly consistent with the village-level results (Table VII).
[Table BII about here.]
To fully represent the data and help the reader understand precision issues in estimatinglong-term effects, Table BIII shows the distribution of years since most recent PDT for themunicipality-year observations included in the main estimation sample.
[Table BIII about here.]
[Table BIV about here.]
38Most independent variables are analogous to their village-level counterparts. The fraction of four nearestneighbors is now the fraction of population in the four nearest municipalities living in a village where PDTbegan during the previous three and six months. We now include an indicator of whether any village haspreviously received PDT and the time trend counts the number of months since any village in the municipalityreceived PDT.
25

References
Berman, E. (2009). Radical, Religious and Violent: The New Economics of Terrorism. MITPress.
Berman, E., J. H. Felter, E. Kapstein, and E. Troland (2012). Predation, Taxation, Invest-metn and Violence: Evidence from the Philippines. NBER Working Paper (18375).
Berman, E., J. H. Felter, J. N. Shapiro, and E. Troland (2013). Modest, Secure, and In-formed: Successful Development in Conflict Zones. American Economic Review 103 (3),512–17.
Berman, E. and A. Matanock (2015). The Empiricists’ Insurgency. Annual Review ofPolitical Science 18, 443–464.
Besley, T. and T. Persson (2011). The Logic of Political Violence. The Quarterly Journal ofEconomics 126 (3), 1411–1445.
Brown, K. H., J. M. Peerson, J. Rivera, and L. H. Allen (2002). Effect of supplemental zincon the growth and serum zinc concentrations of prepubertal children: a meta-analysis ofrandomized controlled trials. The American journal of clinical nutrition 75 (6), 1062–1071.
Callen, M., S. Gulzar, A. Rezaee, and J. N. Shapiro (2015). Choosing Ungoverned Space:Pakistan’s Frontier Crimes Regulation. UCSD mimeo.
Cameron, A. C., J. B. Gelbach, and D. L. Miller (2008). Bootstrap-based improvements forinference with clustered errors. The Review of Economics and Statistics 90(3), 414–427.
Cole, T. J., K. M. Flegal, D. Nicholls, and A. A. Jackson (2007). Body mass index cutoffs to define thinness in children and adolescents: International survey. British MedicalJournal 335 (7612), 194.
Collier, P. (2000). Rebellion as a quasi-criminal activity. Journal of Conflict Resolu-tion 44 (6), 839–853.
Crost, B., J. Felter, and P. Johnston (2014). Aid Under Fire: Development Projects andCivil Conflict. The American Economic Review .
Crost, B., J. H. Felter, H. Mansour, and D. I. Rees (2013). Election Fraud and Post-ElectionConflict: Evidence from the Philippines. IZA Discussion Paper .
Crost, B. and P. B. Johnston (2010). Aid Under Fire: Development projects and CivilConflict. Harvard Kennedy School, Belfer Center for Science and International Affairs.
Duflo, E. (2003). Grandmothers and Granddaughters: Old-Age Pensions and IntrahouseholdAllocation in South Africa. The World Bank Economic Review 17 (1), 1–25.
Felter, J. H. (2005). Taking guns to a knife fight: a case for empirical study of counterinsur-gency. Stanford University.
26

Gomez, F., R. R. Galvan, S. Frenk, J. C. Munoz, R. Chavez, and J. Vazquez (1956). Mortalityin second and third degree malnutrition. Journal of Tropical Pediatrics 2 (2), 77–83.
Graff-Zivin, J. S., H. Thirumurthy, and M. Goldstein (2006). AIDS Treatment and Intra-household Resource Allocations: Children’s Nutrition and Schooling in Kenya. NBERWorking Paper .
Grossman, H. I. (1999). Kleptocracy and revolutions. Oxford Economic Papers 51 (2), 267–283.
Growth Reference Study Group, W. M. (2006). WHO Child Growth Standards based onlength/height, weight and age. Acta Paediatrica 450, 76.
Heger, L. (2010). In the Cross-Hairs: Examining the Factors that make Terrorists Likely toAttack Civilians. PhD Thesis, UC San Diego.
Hernandez, A. (2014). Managing Intractable Identity Conflicts–A Concert of Measures inthe Southern Philippines. In A. Hernandez (Ed.), Nation-building and Identity Conflicts,pp. 149–185. Springer.
Hoynes, H., M. Page, and A. H. Stevens (2011). Can targeted transfers improve birthoutcomes? Evidence from the introduction of the WIC program. Journal of Public Eco-nomics 95, 813–827.
Jacobson, L. S., R. J. LaLonde, and D. G. Sullivan (1993). Earnings Losses of DisplacedWorkers. The American Economic Review , 685–709.
Jankowska, M. M., D. Lopez-Carr, C. Funk, G. J. Husak, and Z. A. Chafe (2012). Cli-mate change and human health: Spatial modeling of water availability, malnutrition, andlivelihoods in Mali, Africa. Applied Geography 33, 4–15.
Keister, J. (2011). States within States: How Rebels Rule. PhD Thesis, UC San Diego.
Lavy, V., J. Strauss, D. Thomas, and P. De Vreyer (1996). Quality of health care, survivaland health outcomes in Ghana. Journal of Health Economics 15 (3), 333–357.
Lind, T., R. Seswandhana, L.-A. Persson, and B. Lonnerdal (2008). Iron supplementationof iron-replete Indonesian infants is associated with reduced weight-for-age. Acta Paedi-atrica 97 (6), 770–775.
Machal, G. (1996). Impact of Armed Conflict on Children. Report of the expert of the UNSecretary-General, submitted pursuant to General Assembly resolution 48/157 .
MacKinnon, J. G. and M. D. Webb (2014). Wild Bootstrap Inference for Wildly DifferentCluster Sizes. Queen’s Economics Department Working Paper, No. 1314 .
Maluccio, J. and R. Flores (2005). Impact evaluation of a conditional cash transfer program:The Nicaraguan Red de Proteccion Social. International Food Policy Research Institute.
27

Marshall, M. G. and B. R. Cole (2011). Global Report 2011: Conflict, Governance, andState Fragility. Working Paper, Center for Systemic Peace.
Masset, E., L. Haddad, A. Cornelius, and J. Isaza-Castro (2011). A systematic review ofagricultural interventions that aim to improve nutritional status of children.
McChrystal, G. S. A. (2010). DoD Media Roundtable with Gen. McChrystal NATO Head-quarters in Brussels. DoD Transcript (June 10, 2010).
Montinola, G. R. (2013). Change and Continuity in a Limited Access Order: The Philippines.In D. C. North, J. J. Wallis, S. B. Webb, and B. R. Weingast (Eds.), In the Shadow ofViolence: Politics, Economics, and the Problems of Development, pp. 149–197. Cambridge.
Morris, S. S., P. Olinto, R. Flores, E. A. Nilson, and A. C. Figueiro (2004). Conditionalcash transfers are associated with a small reduction in the rate of weight gain of preschoolchildren in northeast Brazil. The Journal of Nutrition 134 (9), 2336–2341.
Nunn, N. and N. Qian (2014). US Food Aid and Civil Conflict. American Economic Re-view 104 (6), 1630–66.
Phillips, D. R. (1986). Primary health care in the Philippines: Banking on the Barangays?Social Science & Medicine 23 (10), 1105–1117.
Quimpo, N. G. (2012). Mindanao, Southern Philippines: The Pitfalls of Working for Peacein a Time of Political Decay. In M. A. Miller (Ed.), Autonomy and Armed Separatism inSouth and Southeast Asia. Singapore: Institute of Southeast Asian Studies.
Ruel, M. T., P. Menon, J.-P. Habicht, C. Loechl, G. Bergeron, G. Pelto, M. Arimond,J. Maluccio, L. Michaud, and B. Hankebo (2008). Age-based preventive targeting of foodassistance and behaviour change and communication for reduction of childhood undernu-trition in Haiti: a cluster randomised trial. The Lancet 371 (9612), 588–595.
Sales, P. M. (2009). State terror in the Philippines: the Alston Report, human rights andcounter-insurgency under the Arroyo administration. Contemporary Politics 15 (3), 321–336.
Sandler, D. H. and R. Sandler (2013). Multiple Event Studies in Public Finance and LaborEconomics: A Simulation Study with Applications. Working Paper .
Schiavo-Campo, S. and M. P. Judd (2005). The Mindanao conflict in the Philippines: Roots,costs, and potential peace dividend, Volume 24. Conflict Prevention & Reconstruction,Environmentally and Socially Sustainable Development Network, World Bank.
Seoane, N. and M. C. Latham (1971). Nutritional anthropometry in the identification ofmalnutrition in childhood. Journal of Tropical Pediatrics 17 (3), 98–104.
Singh, A., A. Park, and S. Dercon (2013). School meals as a safety net: An evaluation ofthe Midday Meal scheme in India. Young Lives Working Paper 75.
28

Troland, E. (2014). Can Fiscal Transfers Increase Local Revenue Collection? Evidence FromThe Philippines. Working Paper .
Vanden Eynde, O. (2015). Mining Royalties and Incentives for Security Operations: Evidencefrom India’s Red Corridor. Paris School of Economics mimeo.
29

Table I: Conflict and instability among top foreign aid recipients
Average from 2003-2012 ConflictAnnual ODA per capita GDP Rank of Pol. Years
Country World Bank USA UK Total per capita Instability 1988-2012
Iraq $0 $136.9 $11.9 $148.8 $2,279.5 2 19Afghanistan 1.9 76.8 11.4 90.1 351.8 3 24Haiti 0 52.4 1.0 53.5 524.5 23 3Somalia 0 22.1 14.3 36.3 – 1 18Zambia 6.0 17.4 10.4 33.8 789.2 130 0Rwanda 4.3 14.1 9.1 27.6 362.3 65 16Ghana 13 6.3 7.8 27.1 655.5 103 0Colombia 13.4 13.3 .2 26.8 4,284.3 9 25Mozambique 9.8 10.3 5.3 25.5 399.2 123 5Tanzania 11.5 6.4 6.4 24.3 457.6 78 0Sudan 0 18.3 5.4 23.6 858.1 5 25Uganda 8 10.6 4.7 23.3 410.3 32 23Malawi 2.8 7.5 10.8 21.2 255.4 101 0Senegal 12.9 6.3 .5 19.7 896.7 83 10Mali 9.1 10 .1 19.1 540.7 84 6
Philippines -.9 1.2 -.1 .3 1,499.9 18 25
The table displays the top 15 recipients, among countries with populations of 10 millionor more, of total official development assistance (ODA) from the World Bank, the UnitedStates, and the United Kingdom. World Bank ODA refers to the International Bank forReconstruction and Development (IBRD) and the International Development Association(IDA) only. USA and UK ODA refer to all sources of bilateral flows. The “Total” columnrefers to the total of these three sources. GDP per capita is adjusted for Purchasing PowerParity. ODA and GDP per capita are in 2011 US dollars and are obtained from the WorldBank’s World Development Indicators. “Pol. Instability” refers to the World Bank’s PoliticalInstability measure in the World Governance Indicators (WGI), which ranks 214 countriesaccording to “perceptions of the likelihood of political instability and/or politically-motivatedviolence, including terrorism.” Conflict refers to the definition from the Peace ResearchInstitute Oslo (PRIO), which defines a conflict as involving 25 or more battle deaths in ayear.
30

Table II: Scale of PDT
Cumulative AnnualVillages Municipalities Villages Municipalities
Year N of42,013
% ofPop.
N of1,648
% ofPop.
N of42,013
% ofPop.
N of1,648
% ofPop.
2002 457 1.21% 156 9.7% 457 1.21% 156 9.7%2003 907 2.10 247 14.7 459 .89 143 8.92004 1,606 3.32 361 20.6 743 1.35 197 11.72005 2,445 4.72 448 27.4 928 1.61 202 13.72006 2,938 6.51 502 34.1 647 2.16 172 14.42007 3,600 8.10 604 38.4 929 2.21 254 18.12008 4,286 9.86 652 40.7 1,008 2.81 237 16.52009 4,996 11.5 693 46.2 1,027 2.49 213 18.72010 5,176 11.9 712 47.1 426 1.00 128 10.6
Source: Authors’ calculation based on data provided by the Armed Forces of the Philip-pines (AFP). Note: Treatment is at the village level. Municipalities are considered treatedif they include a treated village.
Table III: Malnutrition summary statistics
Variable Obs Mean Std. Dev. Min Max P25 P75
All, unweighted
Malnutrition rate 11506 11.805 7.333 .057 64.989 6.113 16.107Severe malnutrition rate 11506 1.641 1.841 0 36.292 .523 2.094Coverage 10824 87.222 18.645 6.38 877.45 76.92 100
All, population weighted
Malnutrition rate 11506 9.163 6.527 .057 64.989 4.201 12.461Severe malnutrition rate 11506 1.306 1.444 0 36.292 .503 1.62Coverage 10824 89.223 15.732 6.38 877.45 81.3 100
Main estimation sample, population weighted
Malnutrition rate 11383 9.327 6.589 .057 64.989 4.304 12.805Severe malnutrition rate 11383 1.317 1.470 0 36.292 .491 1.638Coverage 10715 89.771 15.047 6.38 877.45 82.08 100
Source: Authors’ calculations based on Operation Timbang (OPT) data. Note: Mal-nutrition is measured as a weight-for-age Z-score (WAZ). Full sample is based on animbalanced panel of 1,537 municipalities with at least one malnutrition measurementfrom 2005-2012. Estimation sample is based on an imbalanced panel of 1,513 mu-nicipalities with at least three malnutrition measurements from 2005-2012, in whichthat measurement meets some minimal data quality standards, and in which otherkey variables are available.
31

Table IV: Summary statistics
All municipalities PDT municipalities Non-PDT municipalitiesMean R2 from mun.
P (X = 0)Mean (s.d.)
P (X = 0)Mean (s.d.)
X (s.d.) fixed effects given X > 0 given X > 0Malnutrition rate 9.33 (6.59) .786 0 10.06 (6.86) 0 8.57 (6.21)Incidents .026 (.073) .542 .30 .070 (.111) .59 .044 (.076)PDT pop. frac. .012 (.064) .1 49 .81 .125 (.169) – –Neighboring PDT .016 (.051) .223 .64 .077 (.093) .90 .041 (.059)Years since PDT 1.07 (1.72) .645 .21 2.64 (1.78) – –N 11,383 5,374 6,009
“Malnutrition rate” is the percent of children age 5 and under who are two standard deviations or morebelow the mean of an age-specific reference population. “Incidents” is the rate of incidents (mostlyviolent) reported by the Armed Forces of the Philippines, per 1,000 population. It is unavailable in2012, and therefore based on a smaller sample. “PDT pop. frac.” is the fraction of the municipalityliving in a village that received PDT in the given year. “Neighboring PDT” is the PDT populationfraction, averaged over the four nearest municipalities. “Years since PDT” is the number of years sinceat least one village in the municipality received PDT. See text for further details.
32

Table V: Evidence of geographical clustering of PDT implementation
DV : 100× PDTStart (1) (2)
NeighborPDTt−1,t−3 3.295*** 1.944***(0.386) (0.419)
NeighborPDTt−4,t−6 1.701*** 0.353(0.308) (0.271)
Constant 0.128***(0.019)
N 4.25e+06 4.25e+06R2 0.002 0.015Barangay effect No YesMonth effect Yes Yes
* p < .10, ** p < .05, *** p < .01. Depen-dent variable is 100 times a binary indicatorthat PDT started in a given Barangay (village)during a given month. NeighborPDTt−1,t−3
is the share of the four nearest Barangayswhere PDT began in the previous one to threemonths. NeighborPDTt−4,t−6 is the share ofthe four nearest Barangays where PDT beganin the previous four to six months, but notthe last three months. Sample includes a bal-anced panel of 42,038 Barangays from 2002-2010. Because of lags, the first six months of2002 are excluded. Standard errors clusteredat the province (n = 78) level in parentheses.
Table VI: Repeat PDT implementations
Implementations Villages Percent1 3,873 74.0%2 1,106 21.33 215 4.14 25 0.55 5 0.16 1 <0.1
Total 5,188 100%
Source: Authors’ calculations basedon data provided by the ArmedForces of the Philippines (AFP).Implementations refers to PDT im-plementations.
33
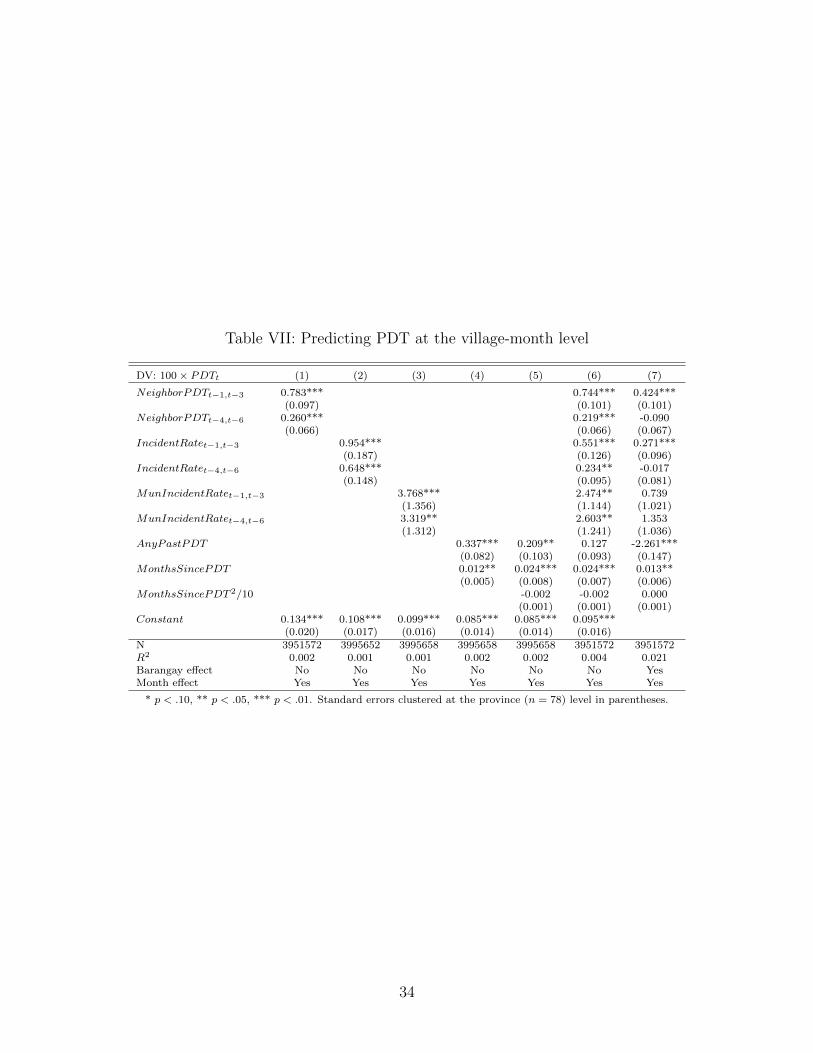
Table VII: Predicting PDT at the village-month level
DV: 100× PDTt (1) (2) (3) (4) (5) (6) (7)
NeighborPDTt−1,t−3 0.783*** 0.744*** 0.424***(0.097) (0.101) (0.101)
NeighborPDTt−4,t−6 0.260*** 0.219*** -0.090(0.066) (0.066) (0.067)
IncidentRatet−1,t−3 0.954*** 0.551*** 0.271***(0.187) (0.126) (0.096)
IncidentRatet−4,t−6 0.648*** 0.234** -0.017(0.148) (0.095) (0.081)
MunIncidentRatet−1,t−3 3.768*** 2.474** 0.739(1.356) (1.144) (1.021)
MunIncidentRatet−4,t−6 3.319** 2.603** 1.353(1.312) (1.241) (1.036)
AnyPastPDT 0.337*** 0.209** 0.127 -2.261***(0.082) (0.103) (0.093) (0.147)
MonthsSincePDT 0.012** 0.024*** 0.024*** 0.013**(0.005) (0.008) (0.007) (0.006)
MonthsSincePDT 2/10 -0.002 -0.002 0.000(0.001) (0.001) (0.001)
Constant 0.134*** 0.108*** 0.099*** 0.085*** 0.085*** 0.095***(0.020) (0.017) (0.016) (0.014) (0.014) (0.016)
N 3951572 3995652 3995658 3995658 3995658 3951572 3951572R2 0.002 0.001 0.001 0.002 0.002 0.004 0.021Barangay effect No No No No No No YesMonth effect Yes Yes Yes Yes Yes Yes Yes
* p < .10, ** p < .05, *** p < .01. Standard errors clustered at the province (n = 78) level in parentheses.
34

Table VIII: Estimated effects of PDT
DV: ln(MalnRate) (1) (2) (3) (4) (5)PDTt+5 0.156 0.156 0.156 0.174 0.166
(0.416) (0.378) (0.416) (0.695) (0.594)PDTt+4 0.018 0.018 0.018
(0.186) (0.201) (0.174)PDTt+3 0.082 0.082 0.082
(0.090) (0.094) (0.106)PDTt+2 0.057 0.057 0.057
(0.045) (0.045) (0.064)∑4τ=2 PDTt+τ 0.055 0.047
(0.059) (0.090)PDTt -0.066 -0.066 -0.066 -0.061
(0.079) (0.086) (0.064) (0.097)PDTt−1 -0.181** -0.181* -0.181* -0.170*
(0.087) (0.098) (0.094) (0.091)PDTt−2 -0.259*** -0.259** -0.259** -0.242**
(0.098) (0.113) (0.122) (0.103)∑2τ=0(τ + 1)PDTt−τ -0.084**
(0.035)∑4τ=3 PDTt−τ -0.303** -0.303** -0.303*
(0.115) (0.127) (0.170)∑11τ=3 PDTt−τ -0.278** -0.286***
(0.119) (0.110)∑6τ=5 PDTt−τ -0.322** -0.322** -0.322
(0.138) (0.147) (0.200)∑11τ=7 PDTt−τ -0.336* -0.336* -0.336
(0.183) (0.190) (0.253)N 11383 11383 11383 11383 11383R2 0.943 0.943 0.943 0.943 0.943F (pre) 0.750 0.750 0.340 0.759 0.366p (analytic) 0.561 0.561 0.851 0.472 0.695p (bootstrap) 0.707 0.846F (post) 2.228 2.228 1.035 3.611 6.590p (analytic) 0.060 0.060 0.396 0.017 0.002p (bootstrap) 0.140 0.346 0.026 0.010Clustering Prov. (78) Prov Mun. (1513) Prov ProvStandard errors Analytic Bootstrap Bootstrap Bootstrap Bootstrap
* p < .10, ** p < .05, *** p < .01. Effects of PDT estimated at the municipality-yearlevel. PDT is the fraction of the municipality’s population treated. To improve precisionwe impose equality of coefficients (e.g., the 5-year effect is the same as the 6-year effect) inColumns 1-3 and linear splines in columns 4 and 5. The “pre” F-statistic tests the null thatcoefficients on all leads are jointly zero. The “post” tests the null that the contemporaneousand all lagged coefficients are jointly zero. Standard errors, in parentheses, clustered byprovince (n=78), except in Column 3. Wild clustered bootstrapped standard errors use999 replications. 35

Table IX: Spillover effects
DV: ln(MalnRate) (1) (2) (3) (4)
PDTt+5 0.166 0.218 0.156(0.560) (0.607) (0.600)∑4
τ=2 PDTt+τ 0.047 0.046 0.034(0.087) (0.079) (0.088)∑2
τ=0(τ + 1)PDTt−τ -0.084** -0.100** -0.080**(0.034) (0.039) (0.038)∑11
τ=3 PDTt−τ -0.286** -0.355*** -0.295**(0.114) (0.129) (0.125)∑2
τ=0(τ + 1)NeighPDTt−τ 0.071 0.403*** 0.022(0.050) (0.149) (0.052)∑11
τ=3NeighPDTt−τ 0.344** 0.920** 0.294(0.172) (0.466) (0.210)
N 11383 11383 6001 5350R2 0.943 0.943 0.937 0.950F (own) 6.590 7.174 3.316p (analytic) 0.002 0.001 0.043p (bootstrap) 0.013 0.008 0.078F (neigh.) 2.309 6.378 1.733p (analytic) 0.106 0.003 0.185p (bootstrap) 0.114 0.010 0.194F (βlin + θlin = 0 ) 0.654 1.211p (analytic) 0.421 0.275F (βlong + θlong = 0 ) 0.006 0.000p (analytic) 0.936 0.995Sample All All non-PDT mun. PDT mun.Nprov 78 78 75 64
* p < .10, ** p < .05, *** p < .01. Standard errors are based on wild clusterbootstrap of Cameron et al. (2008), clustered on province. All bootstrapped resultsare based on 999 replications. All columns include municipality fixed effects andtrends, and province × year effects. See note to table VIII for details. The numberof municipalities in the split sample (columns 3 and 4) does not add to the totalbecause province x year fixed effects absorb some observations.
36

Table X: Estimated Effects of PDT: Robustness checks
DV: ln(MalnRate) (1) (2) (3) (4) (5)
PDTt+5 0.218 0.291 0.115 -0.294 0.236(0.666) (0.632) (0.632) (0.376) (0.267)∑4
τ=2 PDTt+τ 0.046 0.074 0.088 0.034 0.104(0.077) (0.082) (0.080) (0.108) (0.097)∑2
τ=0(τ + 1)PDTt−τ -0.100*** -0.118*** -0.117*** -0.089 -0.075**(0.036) (0.040) (0.039) (0.059) (0.032)∑11
τ=3 PDTt−τ -0.355*** -0.424*** -0.413*** -0.320* -0.174*(0.134) (0.115) (0.133) (0.181) (0.103)∑2
τ=0(τ+1)NeighPDTt−τ 0.071 0.076 0.094* 0.016 0.053(0.050) (0.050) (0.050) (0.078) (0.043)∑11
τ=3NeighPDTt−τ 0.344** 0.341* 0.405** 0.142 0.094(0.166) (0.174) (0.177) (0.218) (0.168)
Lagged violence rate 0.046(0.043)
N 11383 9933 9912 11383 11383R2 0.943 0.948 0.948 0.943 0.943F (own) 7.174 6.643 5.814 2.633 5.344p (analytic) 0.001 0.002 0.004 0.078 0.007p (bootstrap) .009 .006 .004 .097 .024F (neigh.) 2.309 1.299 2.034 0.868 1.173p (analytic) 0.106 0.279 0.138 0.424 0.315p (bootstrap) .099 .120 .171 .425 .264F (βlin + θlin = 0 ) 0.654 0.428 0.124 2.065 0.262p (analytic) 0.421 0.515 0.726 0.155 0.610F (βlong + θlong = 0 ) 0.006 0.130 0.001 1.166 0.203p (analytic) 0.936 0.719 0.973 0.284 0.653PDT Any Any Any First AnyStart date 9 mon.
lead9 mon.
lead9 mon.
lead9 mon.
leadActual
Years 2005-2012 2005-2011 2005-2011 2005-2012 2005-2012
* p < .10, ** p < .05, *** p < .01. Standard errors are based on wild cluster bootstrapof Cameron et al. (2008). All bootstrapped results are based on 999 replications. See noteto Table VIII for details. Lagged violence rate is incidents per 1,000 population during theyear before malnutrition is measured. Incident data for 2011 is unavailable so including laggedincidents requires restricting to 2005-2011 (columns 2 and 3). Columns (1)-(3) and (5) use allof a Barangay’s PDT implementations, while column (4) uses only the first. Column (5) usesnominal program start date.
37

Table XI: Malnutrition impacts for various interventions
Study Study context Dep. Var. Estimated effect Re-duc-tion
Brownet al.(2002)
Meta-analysis of 31 RCTs ofzinc supplements
Most studiesused
individual-level WAZ
scores
Zinc supplements increase WAZ by0.309 SD (95% CI: [.178,.439])
43.9%
Jankowskaet al.(2012)
Estimated effects ofexpanding drought and Saheldesert in Mali, extrapolatedfrom past droughts’ effects
Village-levelaverage WAZ
scores
One standard deviation decrease in“drought” increases village average
WAZ by .159 (off a base of -1.22, withstandard deviation 0.49)
16.3%
Maluc-cio andFlores(2005)
RCT evaluating 2-year effectsof conditional cash transfers
(CCT) in Nicaragua
Community-level WAZ
scores
Program reduced malnutrition rate by6.2 percentage points (off a base of
16.6%)
37.3%
Ruelet al.(2008)
RCT evaluating 3-year effectsof World Vision maternal andchild health programs in Haiti
Community-level WAZscores forchildrenunder 5
Program reduced malnutrition rate by6 percentage points (off a base of
17.8%)
33.7%
Brown et al. (2002): To convert the impact on individual z-scores to the impact on the malnutrition rate,we used the following procedure. First, we assumed that the child weight distribution in the Philippineshas the same variance as the reference population (this assumption is surely wrong). Then a malnutritionrate of 9.59% (our sample mean) implies that the average child’s z-score is -.7, approximately. Thezinc supplements, then, would move children’s weights by .309, which implies a change in the fractionof children with z-scores below -2 (the fraction who are malnourished) from .0959 to .0538, or a 43.9%reduction in the malnutrition rate.
Jankowska et al. (2012): Formally, “drought” is defined as rainfall minus potential evapotranspiration(PET). To convert the impact on individual z-scores to the impact on the malnutrition rate, we used thefollowing procedure. First, we assumed that the child weight distribution has the same variance as thereference population. We also assume that village size is orthogonal to malnutrition rates. Then we candirectly convert the summary statistics of the village-level average WAZ score (mean: -1.22, standarddeviation: 0.49) into a distribution of malnutrition rates (mean: 23.9%, standard deviation: 13.9%).A reduction in drought would increase the average village-level WAZ score by .159, implying the newaverage malnutrition rate is 20%, or 16.3% lower.
38

Table BI: Government-initiated violence: Event study coefficients
Distant pre-PDT Shortly before PDT PDT and immediate post Distant post-PDT
PDTt+18 0.00009 PDTt+9 0.00147** PDTt 0.00429*** PDTt−8 0.00021(0.00034) (0.00057) (0.0008) (0.00033)
PDTt+17 0.00031 PDTt+8 0.00085** PDTt−1 0.00618*** PDTt−9 0.00011(0.00038) (0.00034) (0.00105) (0.00027)
PDTt+16 0.00013 PDTt+7 0.00069** PDTt−2 0.00346*** PDTt−10 0.00005(0.00033) (0.00032) (0.00079) (0.0002)
PDTt+15 0.00027 PDTt+6 0.00106*** PDTt−3 0.00139*** PDTt−11 -0.00001(0.00037) (0.00033) (0.00037) (0.00018)
PDTt+14 -0.00012 PDTt+5 0.00111*** PDTt−4 0.00146*** PDTt−12 -0.0002(0.00032) (0.00031) (0.0004) (0.00019)
PDTt+13 0.00001 PDTt+4 0.00078** PDTt−5 0.0009*** PDTt−13 0.00067(0.00023) (0.00037) (0.00032) (0.00034)
PDTt+12 -0.00025 PDTt+3 0.00189*** PDTt−6 0.00043 PDTt−14 -0.00006(0.00031) (0.00052) (0.0003) (0.0003)
PDTt+11 0.00016 PDTt+2 0.00151*** PDTt−7 0.00075** PDTt−15 0.00014(0.0003) (0.00041) (0.00032) (0.00023)
PDTt+10 0.00014 PDTt+1 0.00367*** PDTt−16 -0.00001(0.00028) (0.00056) (0.00021)
PDTt−17 0.00008(0.00034)
PDTt−18 0.00015(0.00028)
* p < .10, ** p < .05, *** p < .01. Standard errors, clustered at the province level, shown inparentheses. The Table reports coefficients corresponding to monthly leads and lags of PDT inequation (2), which includes month and village fixed effects. See Figure V to see the coefficientsplotted over time.
39

Table BII: Predicting PDT at the municipality-year level
DV: PDTFractiont (1) (2) (3) (4) (5) (6)
NeighPDTt−1 0.125*** 0.033 0.003(0.024) (0.026) (0.028)
IncidentRatet−1 0.076*** 0.046** 0.010(0.027) (0.018) (0.014)
AnyPastPDT 0.022*** 0.018** 0.014* 0.010(0.006) (0.008) (0.008) (0.009)
FracPastPDT 0.041** 0.041** 0.035** -0.268***(0.016) (0.016) (0.017) (0.017)
Y earsSincePDT -0.001 0.003 0.005 0.007*(0.001) (0.005) (0.004) (0.004)
Y earsSincePDT 2 -0.001 -0.001 -0.001(0.001) (0.001) (0.000)
Constant 0.015*** 0.015*** 0.009*** 0.009*** 0.008***(0.002) (0.003) (0.002) (0.002) (0.002)
N 13184 13184 13184 13184 13184 13184R2 0.017 0.016 0.039 0.039 0.042 0.273Municipality effect No No No No No YesYear effect Yes Yes Yes Yes Yes Yes
* p < .10, ** p < .05, *** p < .01. Standard errors clustered at the province (n = 78) levelin parentheses. The table uses a PDT start date that is nine months ahead of the nominal,official start date to account for the pre-implementation “clear” stage documented inFigure V and Table BI.
40

Table BIII: Distribution of years since PDT
Years since PDT Municipality-years Percent Cumulative1 1,004 23.6% 23.6%2 876 19.8 43.33 788 17.8 61.14 588 13.3 74.45 413 9.3 83.76 284 6.4 90.17 210 4.7 94.88 131 3.0 97.89 69 1.6 99.310 30 0.7 100
Total 4,433 100%
Source: Authors’ calculations based on data provided by theArmed Forces of the Philippines (AFP). Table is based onthe main estimation sample (2005-2012). Because PDT enddates are often missing, “Years since PDT” refers to thenumber of years since the most recent PDT implementationbegan, not ended. Because most PDT implementations forwhich end dates are available are less than three months, wedo not consider this a major problem.
41

Table BIV: Appendix table with FE’s and unconstrained coefficients
DV: ln(MalnRate) (1) (2) (3) (4)
PDTt+5 0.036 0.175 0.156 0.209(0.877) (0.585) (0.416) (0.447)
PDTt+4 -0.053 -0.159 0.018 0.063(0.200) (0.160) (0.186) (0.215)
PDTt+3 -0.046 -0.019 0.082 0.110(0.084) (0.073) (0.090) (0.124)
PDTt+2 -0.004 0.008 0.057 0.066(0.046) (0.055) (0.045) (0.063)
PDTt 0.025 -0.039 -0.066 -0.082(0.065) (0.081) (0.079) (0.091)
PDTt−1 -0.030 -0.122 -0.181** -0.211*(0.067) (0.096) (0.087) (0.110)
PDTt−2 -0.026 -0.180 -0.259*** -0.304*(0.084) (0.112) (0.098) (0.154)
PDTt−3 -0.373*(0.194)
PDTt−4 -0.374(0.249)∑4
τ=3 PDTt−τ 0.035 -0.206 -0.303**(0.087) (0.153) (0.115)
PDTt−5 -0.394(0.268)
PDTt−6 -0.476(0.333)∑6
τ=5 PDTt−τ 0.132 -0.190 -0.322**(0.119) (0.189) (0.138)∑∞
τ=7 PDTt−τ 0.072 -0.215 -0.336* -0.483(0.149) (0.221) (0.183) (0.374)
N 11409 11409 11383 11383R2 0.879 0.936 0.943 0.943F (pre) 0.128 0.428 0.750 0.452p (analytic) 0.972 0.788 0.561 0.771F (post) 2.672 1.060 2.228 2.285p (analytic) 0.028 0.389 0.060 0.036Mun. FE Yes Yes Yes YesMun. trends No Yes Yes YesProv.×year FE No No Yes Yes
* p < .10, ** p < .05, *** p < .01. Observations aremunicipality-years. PDT is the fraction of the municipal-ity’s population living in a village receiving PDT. The “pre”F-statistic corresponds to the null hypothesis that coeffi-cients on all leads are jointly zero. The “post” F-statisticcorresponds to the null hypothesis that coefficients on alllags are jointly zero. Observations are dropped betweencolumns (2) and (3), when province×year effects are addedbecause there is only one municipality in the province-year.Standard errors are clustered by province (n=78). Analyticrejection probabilities assume an asymptotic F distribution.
42

Figure I: Violent incident and malnutrition rates by population density quintile
0.0
5.1
.15
1 2 3 4 5
Malnutrition rate (age 5 & under) Incidents per 1,000 pop.
Figure displays population-weighted average violent incident and malnutrition rates for 1,513 municipalitiesby population density quintile (1 = least dense, 5 = most dense). Quintiles are constructed to include equalpopulation shares. Results are similar based on violent incident counts, rather than rates.
Figure II: Villages receiving PDT
Figure displays locations of all 6,819 PDT implementations. See Section 3 for further description of the data.
43

Figure III: Malnutrition rates over time
05
10
15
20
25
Ma
lnu
tritio
n r
ate
2005 2006 2007 2008 2009 2010 2011 2012Year
Mean
10th percentile
90th percentile
Source: Authors’ calculations based on Operation Timbang (OPT) data. Note: Malnutrition is based onweight-for-age Z-scores (WAZ) for children age 0-5. All three rates based on population-weighted estimatesacross municipalities. See Section 3 for further discussion of the data.
Figure IV: Probability repeat PDT is observed
0.1
.2.3
.4.5
Pro
ba
bili
ty r
ep
ea
t P
DT
ob
se
rve
d
2002 2003 2004 2005 2006 2007 2008 2009 2010Year of first PDT
Figure displays the probability that a Barangay receiving its first PDT in year x receives another implemen-tation by the end of the program (in 2010).
44

Figure V: Village-level violence around PDT
0.0
02
.004
.006
.008
Incid
ent ra
te
−18 −15 −12 −9 −6 −3 0 3 6 9 12 15 18Months (PDT implementation = 0)
Government−initiated incidents
Figure plots coefficients, and 95% confidence intervals, corresponding to leads and lags of PDT in equation(2), which includes month and village fixed effects. Month 0 corresponds to the month of PDT implemen-tation. Mean violence for the omitted category (months more than a year and a half before or after PDT)is .0024 incidents per month per 1,000 population.
Figure VI: Estimated effects of PDT
−1
−.5
0.5
1L
og
ma
lnu
tritio
n r
ate
−5 −4 −3 −2 −1 0 1 2 3 4 5 6 7Year (0 = year of implementation)
Point estimate 95% CI
Figure plots coefficients, and 95% confidence intervals, corresponding to a PDT implementation at time 0.Coefficients are based on Column (4) of Appendix table BIV. Log malnutrition rates are normalized to zeroduring the year preceding treatment. An F-test fails to reject the null that the pre-PDT coefficients arejointly zero (F = .452, p = .771), but does reject the null that the post-PDT coefficients are jointly zero(F = 2.285, p = .036).
45

Figure VII: Bootstrapped F-statistic
0.2
.4.6
.8
0 2 4 6 8F−statistics
Empirical density Theoretical density
Bootstrapped F-distribution is for the test of lagged coefficients, Table VIII Column 2, 78 (province) clusters.The wild clustered bootstrap of Cameron et al. (2008) is implemented in Stata with 999 replications. Thevertical line marks F=2.23, which has an asymptotically correct p of 0.06 but sits to the left of 14% of theempirical density.
Figure VIII: Spline results alongside unconstrained results
−1
−.5
0.5
1L
og
ma
lnu
tritio
n r
ate
−5 −4 −3 −2 −1 0 1 2 3 4 5 6 7Year (0 = year of implementation)
Unconstrained 95% CI
Constrained 95% CI
Green dots and vertical bars correspond to coefficients (and 95% confidence intervals) for the unconstrainedevent study model displayed in Figure VI and Column (4) of Appendix table BIV. Blue lines and shadedareas correspond to estimated effects (and 95% confidence intervals) for the spline model in Column (5) ofTable VIII. Log malnutrition rate is normalized to zero for the year preceding PDT implementation.
46

Figure IX: Direct and spillover effects of PDT on malnutrition
−.7
5−
.5−
.25
0.2
5.5
.75
Lo
g m
aln
utr
itio
n r
ate
0 1 2 3 4 5Year (0 = year of implementation)
Own PDT 95% CI
Neighbor PDT 95% CI
Lower (blue) lines and shaded areas correspond to estimated effects (and 95% confidence intervals –asymptotic rather than bootstrapped) of PDT in the same municipality. Upper (red) lines illustrate es-timated effects of PDT averaged over four nearest neighboring municipalities. Estimates are from Column(2) of Table IX. Log malnutrition rate is normalized to zero for the year preceding PDT implementation.
Figure X: Spending effects of PDT
−1
−.5
0.5
1Log h
ealth &
nutr
itio
n s
pendin
g
−8 −6 −4 −2 0 2 4 6Year
Point estimate 95% CI
(a) Health and Nutrition Spending
−1
−.5
0.5
Log m
un. gov. spendin
g
−8 −6 −4 −2 0 2 4 6Year
Point estimate 95% CI
(b) Total Municipal Spending
The figure plots coefficients, and 95% confidence intervals, corresponding to the effects of an average PDTimplemented at time 0. Underlying regressions, available upon request, include municipality and province-year effects and municipality-specific trends. Log spending rates are normalized to zero during the yearbefore the intervention.
47

Figure XI: Federal Transfers and PDT
−.4
−.2
0.2
.4.6
Log federa
l−m
unic
ipal tr
ansfe
rs
−8 −6 −4 −2 0 2 4 6Year
Point estimate 95% CI
The figure plots coefficients, and 95% confidence intervals, corresponding to the effects of an average PDTimplemented at time 0. Underlying regressions, available upon request, include municipality and province-year effects and municipality-specific trends. Log spending rates are normalized to zero during the yearbefore the intervention.
48