NBER WORKING PAPER SERIES FINANCING MUNICIPAL ...
54
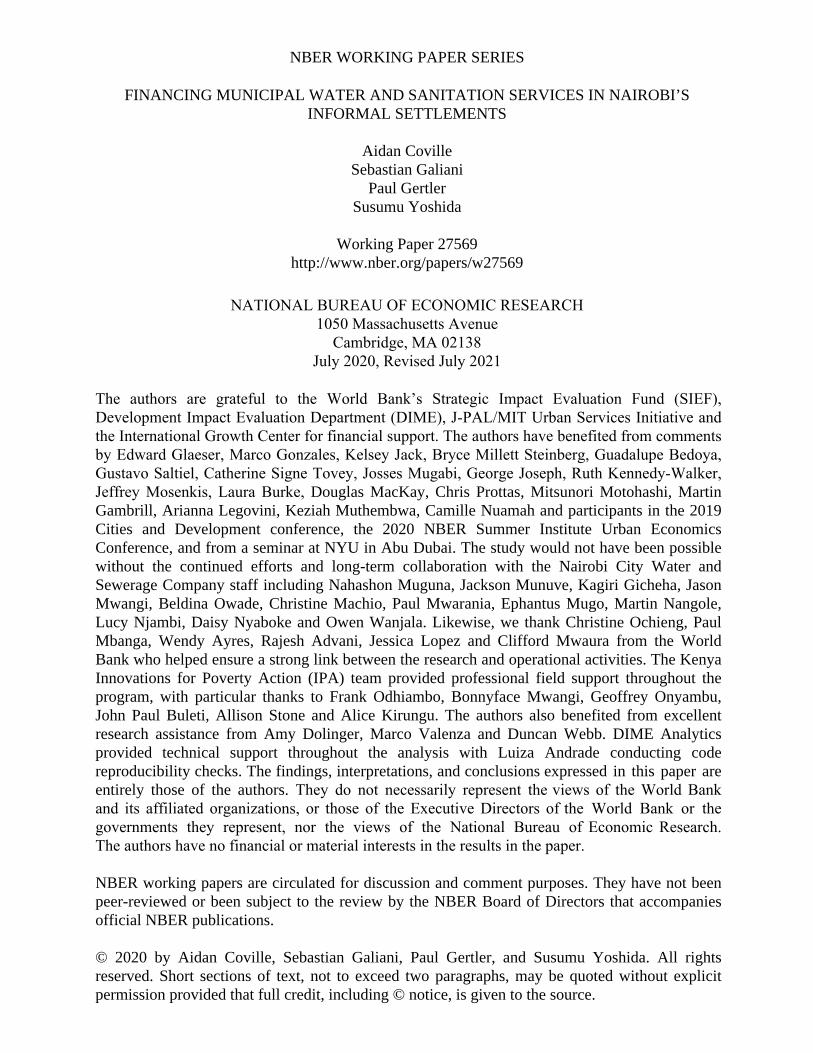
NBER WORKING PAPER SERIES FINANCING MUNICIPAL WATER AND SANITATION SERVICES IN NAIROBI’S INFORMAL SETTLEMENTS Aidan Coville Sebastian Galiani Paul Gertler Susumu Yoshida Working Paper 27569 http://www.nber.org/papers/w27569 NATIONAL BUREAU OF ECONOMIC RESEARCH 1050 Massachusetts Avenue Cambridge, MA 02138 July 2020, Revised July 2021 The authors are grateful to the World Bank’s Strategic Impact Evaluation Fund (SIEF), Development Impact Evaluation Department (DIME), J-PAL/MIT Urban Services Initiative and the International Growth Center for financial support. The authors have benefited from comments by Edward Glaeser, Marco Gonzales, Kelsey Jack, Bryce Millett Steinberg, Guadalupe Bedoya, Gustavo Saltiel, Catherine Signe Tovey, Josses Mugabi, George Joseph, Ruth Kennedy-Walker, Jeffrey Mosenkis, Laura Burke, Douglas MacKay, Chris Prottas, Mitsunori Motohashi, Martin Gambrill, Arianna Legovini, Keziah Muthembwa, Camille Nuamah and participants in the 2019 Cities and Development conference, the 2020 NBER Summer Institute Urban Economics Conference, and from a seminar at NYU in Abu Dubai. The study would not have been possible without the continued efforts and long-term collaboration with the Nairobi City Water and Sewerage Company staff including Nahashon Muguna, Jackson Munuve, Kagiri Gicheha, Jason Mwangi, Beldina Owade, Christine Machio, Paul Mwarania, Ephantus Mugo, Martin Nangole, Lucy Njambi, Daisy Nyaboke and Owen Wanjala. Likewise, we thank Christine Ochieng, Paul Mbanga, Wendy Ayres, Rajesh Advani, Jessica Lopez and Clifford Mwaura from the World Bank who helped ensure a strong link between the research and operational activities. The Kenya Innovations for Poverty Action (IPA) team provided professional field support throughout the program, with particular thanks to Frank Odhiambo, Bonnyface Mwangi, Geoffrey Onyambu, John Paul Buleti, Allison Stone and Alice Kirungu. The authors also benefited from excellent research assistance from Amy Dolinger, Marco Valenza and Duncan Webb. DIME Analytics provided technical support throughout the analysis with Luiza Andrade conducting code reproducibility checks. The findings, interpretations, and conclusions expressed in this paper are entirely those of the authors. They do not necessarily represent the views of the World Bank and its affiliated organizations, or those of the Executive Directors of the World Bank or the governments they represent, nor the views of the National Bureau of Economic Research. The authors have no financial or material interests in the results in the paper. NBER working papers are circulated for discussion and comment purposes. They have not been peer-reviewed or been subject to the review by the NBER Board of Directors that accompanies official NBER publications. © 2020 by Aidan Coville, Sebastian Galiani, Paul Gertler, and Susumu Yoshida. All rights reserved. Short sections of text, not to exceed two paragraphs, may be quoted without explicit permission provided that full credit, including © notice, is given to the source.
-
Upload
khangminh22 -
Category
Documents
-
view
1 -
download
0
Transcript of NBER WORKING PAPER SERIES FINANCING MUNICIPAL ...
NBER WORKING PAPER SERIES
FINANCING MUNICIPAL WATER AND SANITATION SERVICES IN NAIROBI’S INFORMAL SETTLEMENTS
Aidan CovilleSebastian Galiani
Paul GertlerSusumu Yoshida
Working Paper 27569http://www.nber.org/papers/w27569
NATIONAL BUREAU OF ECONOMIC RESEARCH1050 Massachusetts Avenue
Cambridge, MA 02138July 2020, Revised July 2021
The authors are grateful to the World Bank’s Strategic Impact Evaluation Fund (SIEF), Development Impact Evaluation Department (DIME), J-PAL/MIT Urban Services Initiative and the International Growth Center for financial support. The authors have benefited from comments by Edward Glaeser, Marco Gonzales, Kelsey Jack, Bryce Millett Steinberg, Guadalupe Bedoya, Gustavo Saltiel, Catherine Signe Tovey, Josses Mugabi, George Joseph, Ruth Kennedy-Walker, Jeffrey Mosenkis, Laura Burke, Douglas MacKay, Chris Prottas, Mitsunori Motohashi, Martin Gambrill, Arianna Legovini, Keziah Muthembwa, Camille Nuamah and participants in the 2019 Cities and Development conference, the 2020 NBER Summer Institute Urban Economics Conference, and from a seminar at NYU in Abu Dubai. The study would not have been possible without the continued efforts and long-term collaboration with the Nairobi City Water and Sewerage Company staff including Nahashon Muguna, Jackson Munuve, Kagiri Gicheha, Jason Mwangi, Beldina Owade, Christine Machio, Paul Mwarania, Ephantus Mugo, Martin Nangole, Lucy Njambi, Daisy Nyaboke and Owen Wanjala. Likewise, we thank Christine Ochieng, Paul Mbanga, Wendy Ayres, Rajesh Advani, Jessica Lopez and Clifford Mwaura from the World Bank who helped ensure a strong link between the research and operational activities. The Kenya Innovations for Poverty Action (IPA) team provided professional field support throughout the program, with particular thanks to Frank Odhiambo, Bonnyface Mwangi, Geoffrey Onyambu, John Paul Buleti, Allison Stone and Alice Kirungu. The authors also benefited from excellent research assistance from Amy Dolinger, Marco Valenza and Duncan Webb. DIME Analytics provided technical support throughout the analysis with Luiza Andrade conducting code reproducibility checks. The findings, interpretations, and conclusions expressed in this paper are entirely those of the authors. They do not necessarily represent the views of the World Bank and its affiliated organizations, or those of the Executive Directors of the World Bank or the governments they represent, nor the views of the National Bureau of Economic Research. The authors have no financial or material interests in the results in the paper.
NBER working papers are circulated for discussion and comment purposes. They have not been peer-reviewed or been subject to the review by the NBER Board of Directors that accompanies official NBER publications.
© 2020 by Aidan Coville, Sebastian Galiani, Paul Gertler, and Susumu Yoshida. All rights reserved. Short sections of text, not to exceed two paragraphs, may be quoted without explicit permission provided that full credit, including © notice, is given to the source.
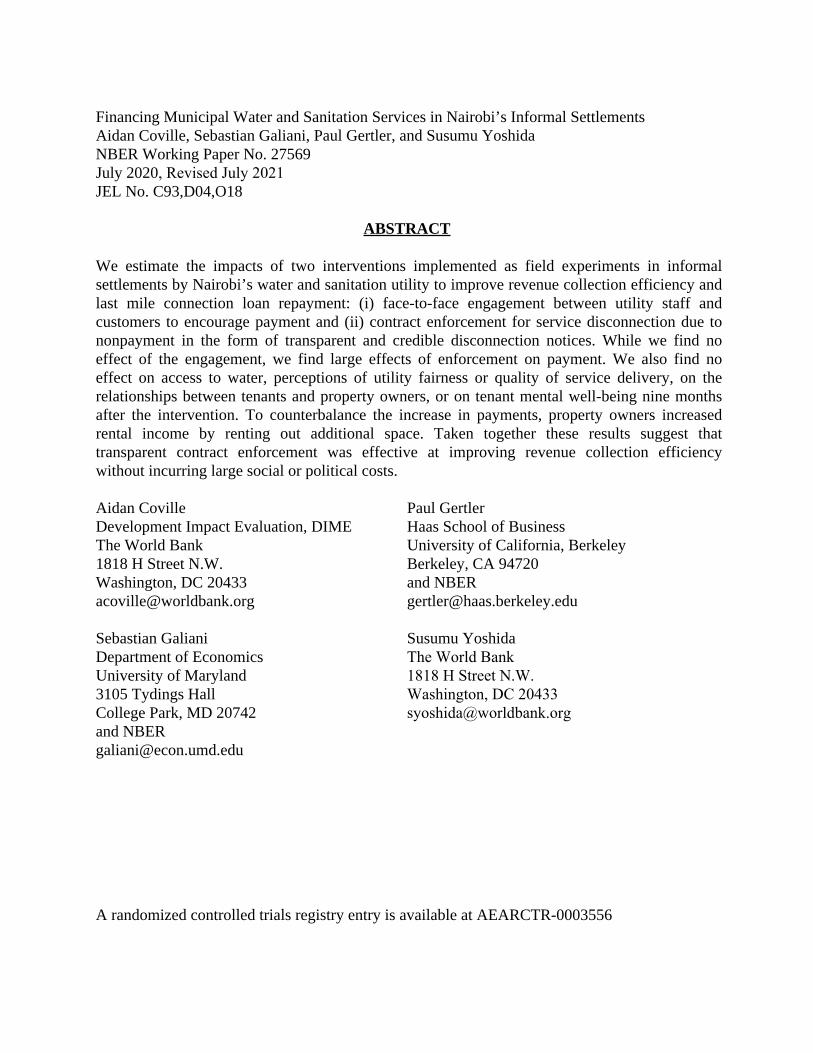
Financing Municipal Water and Sanitation Services in Nairobi’s Informal Settlements Aidan Coville, Sebastian Galiani, Paul Gertler, and Susumu YoshidaNBER Working Paper No. 27569July 2020, Revised July 2021JEL No. C93,D04,O18
ABSTRACT
We estimate the impacts of two interventions implemented as field experiments in informal settlements by Nairobi’s water and sanitation utility to improve revenue collection efficiency and last mile connection loan repayment: (i) face-to-face engagement between utility staff and customers to encourage payment and (ii) contract enforcement for service disconnection due to nonpayment in the form of transparent and credible disconnection notices. While we find no effect of the engagement, we find large effects of enforcement on payment. We also find no effect on access to water, perceptions of utility fairness or quality of service delivery, on the relationships between tenants and property owners, or on tenant mental well-being nine months after the intervention. To counterbalance the increase in payments, property owners increased rental income by renting out additional space. Taken together these results suggest that transparent contract enforcement was effective at improving revenue collection efficiency without incurring large social or political costs.
Aidan CovilleDevelopment Impact Evaluation, DIME The World Bank 1818 H Street N.W. Washington, DC [email protected]
Sebastian GalianiDepartment of EconomicsUniversity of Maryland3105 Tydings HallCollege Park, MD 20742and [email protected]
Paul GertlerHaas School of Business University of California, Berkeley Berkeley, CA 94720and [email protected]
Susumu YoshidaThe World Bank1818 H Street N.W.Washington, DC [email protected]
A randomized controlled trials registry entry is available at AEARCTR-0003556
1 Introduction
Some 844 million people lack clean drinking water and 2.4 billion people do not have im-proved sanitation, most of which are living in low- and middle-income countries (LMICs).1
An estimated US$ 1.7 trillion is needed to finance the goal of universal access by 2030 (Hut-ton and Varughese, 2016). With two-thirds of the world’s population expected to live incities by 2050, finding scalable and sustainable solutions to expand reliable urban water andsanitation services is critical. However, basic service provision is not keeping up with rapidurbanization. Africa’s cities, for instance, grew by 80% between 2000 and 2015, while accessto piped water declined from 40% to 33% (World Bank, 2017).
The primary route for expanding services in urban areas is through public utilities, bututilities are struggling to deliver reliable services to connected households let alone increasecoverage (Trimble et al., 2016; World Bank, 2017; Soppe et al., 2018). Revenue collectionhas become a major stumbling block for utility performance (Ahluwalia, 2002; World Bank,2017). Losses from nonpayment of service use bills are significant. Utilities worldwide failedto collect an estimated US$ 39 billion of billable water and US$ 96 billion in electricitycharges each year (Liemberger and Wyatt, 2019; Northeast Group, 2017). Nonpayment forservices lowers effective prices, and when effective prices fall below marginal cost, each newcustomer becomes a financial liability and may lead to rationing (Burgess et al., 2020; McRae,2015).2 Water rationing is not only inconvenient but can have negative impacts on health(Galiani et al., 2005; Ashraf et al., 2021). There is well-documented concern over servicequality degradation worldwide from poorly maintained infrastructure, and the vicious cyclebetween low payment and deteriorating quality of services (Jiménez and Pérez-Foguet, 2011;Cronk and Bartram, 2017; Foster et al., 2020; Dzansi et al., 2018; World Bank, 2017).
More financial stress comes from the problem of paying for the significant last mileconnection costs that constrain household access to the utility’s services (WaterAid, 2007;Golumbeanu and Barnes, 2013; Lee et al., 2020). Significant investments in urban trunk in-frastructure are underutilized when households close to water and sewer lines do not connect(Kennedy-Walker et al., 2020). While subsidies have been effective at increasing householdconnections (Lee et al., 2020; Guiteras et al., 2015), they are costly, potentially regressive,and are limited by public budget constraints (Abramovsky et al., 2020).
Providing credit to households to amortize upfront connection costs offers an attractive
1World Bank (water): https://www.worldbank.org/en/topic/watersupply; World Bank (sanitation):https://www.worldbank.org/en/topic/sanitation
2Many utilities have tariffs that even when fully paid do not cover operating costs, and, in settings whereonly a minority have access to piped services, introduce a regressive subsidy in favor of connected households(Abramovsky et al., 2020).
1
alternative to subsidies. For example, the provision of credit increased piped water connec-tion rates in Morocco by 69% (Devoto et al., 2012). To overcome thin credit markets, utilitiesare taking out commercial loans that they use to finance loans from the utility to customers.Customers then repay these loans through additional installment payments to their monthlybills. There is, however, an inherent financial risk to utilities if customers do not repay theirloans. Nonperforming loans must be paid for through either service degradation or out ofgeneral tax revenues.
In Nairobi, until recently, household-level piped water and sanitation were not availableto residents living in informal settlements. Settlement residents, who make up an estimated60% of Nairobi’s population, typically live in multi-household compounds with a shared pitlatrine and purchased water from utility public water kiosks and private vendors. In 2014,Nairobi’s utility began expanding compound-level piped water and sanitation services to in-formal settlements. Compounds were offered a combination of subsidies and loans to financethe US$ 1,100 cost of connection to the new trunk lines. This consisted of a US$ 750 (69%)subsidy and a loan for the rest. The utility obtained a commercial loan that they used tofinance the loans to property owners. Property owners then agreed to repay the loan to theutility over time by adding installment payments to their monthly water and sewerage bills.Between 2014 and 2018, the utility expanded services to 137,000 previously unconnectedpeople in informal settlements (World Bank, 2019).
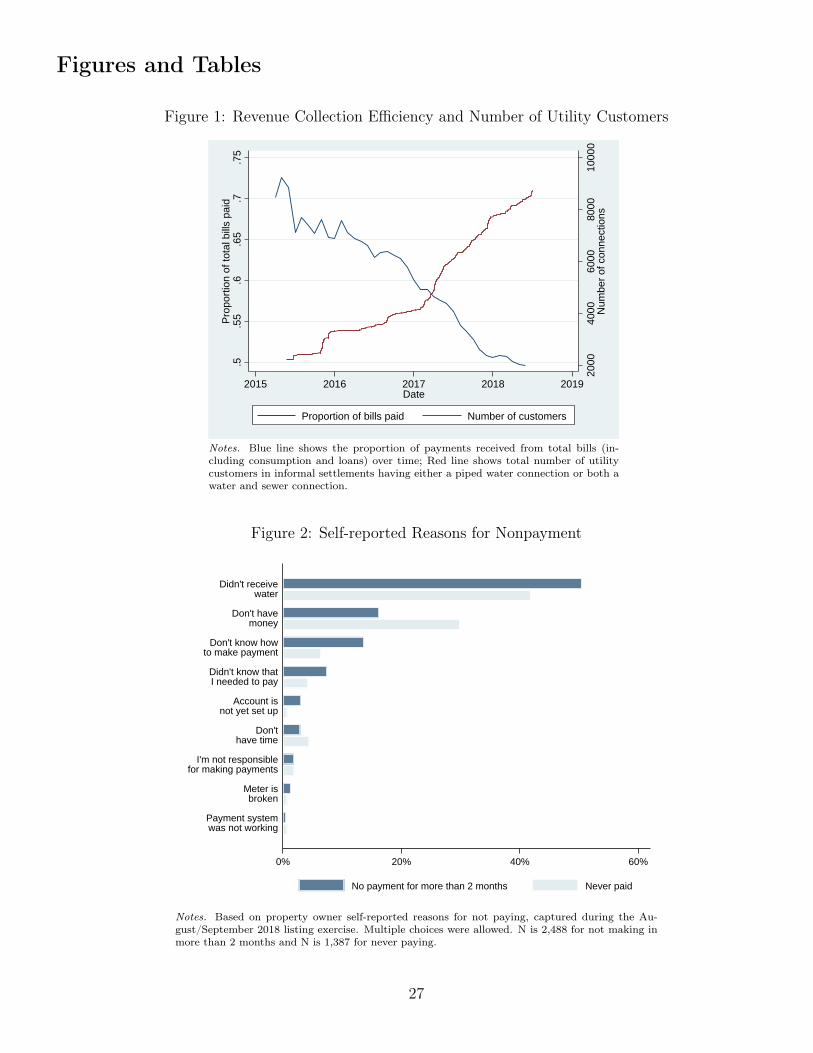
However, after the expansion, the utility experienced significantly lower revenue collec-tion than originally anticipated. In 2016, 40% of the newly connected property owners hadyet to make a single service or loan payment and the average share of bills and loans paid fellfrom above 65% in 2014 to below 50% in 2018 (Figure 1). Service quality also deterioratedover this period from 95% of compounds with piped water reporting having received servicein the past week in 2014 to 40% in 2018. In response, the utility considered two strategies toimprove revenue collection: (i) an engagement approach to encourage payment; and (ii) ser-vice contract enforcement that allowed for disconnection for nonpayment.3 Both approachesare commonly used by utilities around the world to improve revenue collection efficiency, butlimited evidence exists on their costs and benefits (Hernandez and Laird, 2019; Szabó andUjhelyi, 2015). In this paper we report on the results of a field experiment designed to testboth strategies.
The first approach was a face-to-face meeting between tenants and the utility’s existingoutreach team to explain the financial status of the water and sewer bill, the consequences for
3The utility requested support from the research team based on a long-standing relationship that beganin 2012 related to the last mile connection issues. See appendix for a description of the other interventionsdesigned to enhance revenue collection considered at the time.
2
the utility, and discuss what they could do to encourage property owners to make payment.The idea was to empower renters to discuss such matters with property owners becauseservice disconnection would be a violation of their rental agreements as 93% of tenants hadpiped water included in their rent. While the utility had primarily targeted property ownersin their previous outreach efforts, this new approach was designed to strengthen bottom-upaccountability.
The second approach was to systematically enforce the terms of the contract that theproperty owners had signed with the utility, specifying service disconnection for propertyowners with significant payment arrears.4 Prior to the study, 82% of property owners wereeligible for disconnection under the contract’s terms, which made implementation of the dejure policy infeasible. As a result, the de facto application of the disconnection policy wasad hoc, which could potentially limit contract enforcement effectiveness and create opportu-nities for extortion (Ashraf et al., 2016). Given the significant subsidy and loans given toproperty owners for last mile connections and the importance of the sustainability of servicequality, the utility was in the process of systematizing contract enforcement to improve rev-enue collection.
Contract enforcement is key to sustaining the rule of law and the process of economic de-velopment (Glaeser and Shleifer, 2002). However, contract enforcement was potentially riskyfor both the utility and for its customers. From the utility’s perspective, enforcement wouldbe effective if it improved payment and social costs were low. Currently connected residentswould benefit if the utility used the new revenues to improve service quality. Currentlyunconnected residents would benefit if enhanced revenue collection were used to expand con-nections. However, households that are disconnected could face added burdens in the formof increased cost and reduced access to water sources. The utility might also face increasedcustomer dissatisfaction with perceived fairness and service quality leading to loss of politicalsupport for the utility and government.
These potential risks motivated the utility to pilot enforcement to better understand thecosts and benefits. In practice, this meant exempting from disconnection a set of compoundswho otherwise would have been considered for disconnection to serve as a control group, whileensuring compounds in the treatment group followed a clearly articulated contract enforce-ment implementation plan. The criteria for disconnection were set at a substantially higherlevel of nonpayment than specified in the contracts for more selective targeting. Enforcementwas then implemented along a strict selection protocol governed by (1) systematic identi-fication of all disconnection-eligible compounds, (2) randomly selecting a subset to receive
4Service disconnection for nonpayment was explicitly specified in the contract signed by property ownerswhen they agreed to receive the infrastructure upgrades to their property.
3
disconnection notices with clear instructions on how to pay or appeal for a financial hardshipexemption, (3) allowing a reasonable period of time for property owners to pay or appeal,and (4) disconnecting services if they did not pay at least some of their outstanding bill ina timely fashion or apply for a financial hardship exemption.
The intervention was implemented in a context where water and sanitation charges wereaffordable, i.e., significantly below the 3% (water) and 5% (water and sanitation) thresholdsof monthly income for service affordability set by the United Nations (United Nations, 2010).In addition, alternative water sources were available through utility-run public kiosks andprivate vendors, which were the primary sources of water prior to the 2014 expansion of util-ity piped water. During the intervention rollout, the utility maintained a transparent andconvenient process through which property owners could delay payment and disconnectionin the case of financial distress.5
Using administrative data from the utility’s electronic billing and payment system, wefind that contract enforcement significantly increased both the likelihood of property ownersmaking a payment, and the overall amount paid. However, most of the change in paymentbehavior took place shortly after enforcement took place, with no evidence of further in-creases over time. This could be because the enforcement intervention was implemented as aone-time policy and not as a permanent change. We also find no evidence of spillover effectsin the form of improved payment behavior among control property owners with compoundsin treatment clusters. The face-to-face engagement intervention had a precisely estimatednull effect.
In addition to the observed payment behavior, we did not find evidence that tenants werenegatively affected nine months after implementation of the enforcement intervention. Usingsurvey data, we find that water and sanitation service connections were not meaningfullydifferent between treatment and control compounds. This is because most property ownerswhose service was disconnected were reconnected after agreeing to a payment plan. Duringservice interruptions tenants had access to water from kiosks operated by the utility andprivate vendors and reported no reductions in water use nor increase in spending on water.Moreover, we do not find evidence that the disconnection policy negatively affected eithertenants’ or property owners’ perceptions of fairness and quality of water service delivery, nordid the policy affect the relationships of tenants and property owners. Finally, tenants wereno more likely to move out.
To counterbalance the effective increase in utility fees paid, property owners increasedtheir rental income predominantly by renting out additional space. Together, these resultssuggest that the transparent contract enforcement of the disconnection policy increased pay-
5More details related to the study’s ethical considerations can be found in the appendix.
4
ment and improved the financial position of the utility without incurring any observed socialcosts on the tenants and property owners or political costs to the utility.
2 Contributions to the Literature
A significant body of research explores approaches to expanding access to services. Witha few exceptions (Devoto et al., 2012; Galiani et al., 2005), this work predominantly focuseson rural settings (Lee et al., 2020; Whittington et al., 2020).6 Problems with both expand-ing access and service quality can be linked back to financial constraints. Our work adds tothe literature testing strategies to improve payment behavior and thereby relaxing financialconstraints on service delivery.
Despite the frequent use of service disconnections for nonpayment by utilities worldwide,7
to our knowledge, there are no experimental studies that estimate their potential impact.Jack and Smith (2020) explore the role of pre-paid electricity meters on service paymentsand consumption patterns in South Africa. Pre-paid meters offer a technical solution topayment problems by ensuring that customers only receive service if they provide upfrontpayment rather than more standard post-paid systems and can be programmed to includeloan repayments. In effect, users are disconnected if they do not prepay. The study foundthat switching to pre-paid meters reduced electricity usage by 14 percent, but still increasedoverall municipal revenue through improved revenue collection. Pre-paid meters for waterwere piloted in a few middle-income neighborhoods in Nairobi but were abandoned becauseof vandalism and high fixed costs of installation (Heymans et al., 2014).
There is some limited evidence that outreach campaigns improve service payment. Szabóand Ujhelyi (2015) find that simply delivering a payment “education campaign” increasedpayment rates by 25% in an informal settlement in South Africa, although the effects wereshort-lived. Rockenbach et al. (2019) find that information campaigns designed using psy-chological commitment techniques increase payment by between 30-61%, but again only hadshort run effects. More broadly, interventions that try to improve bottom-up accountability– typically from communities to place pressure on service providers - have mixed results thatmay be influenced by the heterogeneity of these groups and the existing top-down account-ability measures in place (Björkman and Svensson, 2010; Olken, 2007; Serra, 2012).
6Increasing sanitation coverage in rural area has been challenging when relying purely on behavioralchange approaches (Briceño et al., 2017; Cameron et al., 2019), and there has been more traction when thisis combined with financial subsidies, although this increases program costs (Clasen et al., 2014; Guiteraset al., 2015).
7For example, an estimated 15% of households in the United States received service disconnection noticesand 3% were disconnected in 2015 (Hernandez and Laird, 2019).
5
Observational studies provide insights into determinants of service payment behaviorsuch as households strategically delaying payment as a form of credit (Violette, 2020) orthe perceived ease of payment and social pressure being associated with prompt payment(Mugabi et al., 2010). While experimental work on improving utility revenue collection hasstarted to grow, these papers mostly rely on administrative billing and basic demographicdata to assess impacts and typically limit their attention to two dimensions – payment andconsumption behavior (Allcott, 2011; Jack and Smith, 2020; Szabó and Ujhelyi, 2015; Rock-enbach et al., 2019). Our study combines five years of daily administrative billing data withrich primary survey data from property owners and tenants over the course of three yearson a range of outcomes that helps present a more comprehensive assessment of the potentialwelfare implications of utility interventions.
Our study also contributes to the high-stakes contract enforcement approaches to improv-ing regulatory compliance. The evidence on high-stakes contract enforcement is particularlylimited, especially when compared to lighter-touch information/engagement interventions.The existing evidence on enforcement is mostly limited to developed country settings, mostprominently in the tax evasion literature (Slemrod et al., 2001; Kleven et al., 2011), andto a lesser extent in environmental protection (Telle, 2013; Duflo et al., 2018). The smallnumber of studies exploring high-stakes enforcement in developing countries find significantimpacts. In Brazil, de Andrade et al. (2016) randomize inspections and fine firms if theyare found to be operating without a business license and find that the intervention increasesbusiness registrations. In Costa Rica, Brockmeyer et al. (2019) find significant increases intax payments from credible enforcement emails. In Kenya, Bedoya et al. (2021) randomizea regime of high-intensive inspections of health facilities with enforcement of warnings andsanctions, including the risk of closure if they do not have a license to operate. These inspec-tions successfully increase compliance with minimum patient safety standards for all typesof facilities without increasing patients’ payments or reducing facility use.
3 Institutional Context
Like many LMICs, Kenya’s constitution established the right to “reasonable standardsof sanitation” and “clean and safe water in adequate quantities”, and Kenya’s Vision 2030set a goal of universal water and sanitation coverage. Achieving this vision faces importantchallenges. Nairobi’s urban population has tripled over the past 25 years,8 but access to safelymanaged water fell from 62% in 2000 to 50% in 2017.9 Water supply for existing customers
8UN population dynamics data 20219Joint Monitoring Program data: https://washdata.org/data/household!/
6

was only able to meet about 70% of demand and even that is with intermittent supply(NCWSC, 2017).10 Like in many developing countries, sanitation coverage is significantlylower than water access, with approximately 18% of Kenya’s urban residents having a sewer-connected facility (Kenya National Bureau of Statistics et al., 2015).
3.1 Expansion into Informal Settlements
Nairobi’s water services board, Athi Water Works Development Agency, expanded wa-ter and sanitation trunk lines into many of Nairobi’s informal settlements between 2012 and2016. After the trunk infrastructure was in place, Nairobi’s water and sanitation utility couldoffer compound-level connections to the piped system. Property owners were able to connecttheir compounds to the trunk lines by signing a contract agreeing to be responsible for pay-ing water and sanitation consumption and loan charges, and to service disconnection in theevent of nonpayment. The utility offered each property owner a comprehensive infrastruc-ture upgrading package including (i) upgrading of existing latrines to be connection-readyincluding filling pit latrines and building superstructures where needed; (ii) a single pipedwater connection to the compound; (iii) a wash basin; (iv) a 400-liter water storage tank forwhen supply was temporarily unavailable; and (v) the physical connection of the latrine(s)to the newly built sewerage line.11
The unsubsidized cost of this full package was approximately US$ 1,100 – twice the av-erage monthly income of property owners in the target areas. The World Bank providedgrant financing to reduce the connection costs by 69%, and the utility took commercialloans to finance loans from the utility to property owners for the rest. Property ownerspaid off the loans in monthly installments of US$ 6 (US$ 4.50 for sewer and US$ 1.50 forwater) added to the monthly service use bills.12 This was offered to property owners on avoluntary opt-in basis, if they agreed to the terms of the contract and paid a US$ 16 upfrontdeposit. Since these monthly loan installments were highly affordable – representing 1.1%of property owner income on average – over 90% of property owners agreed to participate.13
This resulted in an estimated 137,000 people living in Nairobi’s informal settlements gaining
10While significant investments to expand water supply to the city are underway, rationing is expected tocontinue. This limited supply is exacerbated by cartels that damage utility infrastructure and control watersupply in some parts of the city. Cartels were not active in the specific study areas during the time of theresearch (World Bank, 2019).
11The water connection program started prior to the sanitation expansion. Compounds started receivingwater connections from 2014, but only started receiving sanitation connections from 2016. Investment in thewater connection was a prerequisite for sanitation upgrading.
12We use an exchange rate of 1 USD = 100 KES throughout.13These loan installment payments were lower than the drudging cost of pit latrines, about US$ 8.00 per
month, that many residents used prior to trunk line services.
7
access to compound-level piped water and sewer services between 2014 and 2018 (WorldBank, 2019).
The model to finance the last mile connection costs relied on the assumption that prop-erty owners would repay their loans and pay the monthly service fees. During the course ofthe program, however, it became clear that that the utility faced critical nonpayment issues.In 2016, 40% of connected property owners had yet to make a single service payment orloan installment even though the average property owner had already been connected for1.3 years. Moreover, the average share of bills and loans paid fell from above 65% in 2014to below 50% in 2018 (Figure 1).14 Service quality deteriorated substantially over this timeperiod, including a city-wide rationing program that started in early 2017. Based on datacollected from a panel survey of 587 households from one of the settlements, the proportionof compounds that received water from their water point in the week prior to the survey fellfrom 95% to 40% between 2014 and 2018.15
3.2 Compounds and Residents
Characteristics of property owners and tenants living in one such informal settlement,Kayole Soweto, are presented in Table 1 for owners and Table 2 for tenants.16 In KayoleSoweto, almost all property owners are sole owners of their compounds with self-reportedsales’ values of about US$ 20,000 on average. Property owners are 51 years old, are 60%male, 54% have completed secondary education or higher, and make US$ 551 in income permonth on average from all sources.
Property owners rent out space in 86% of the compounds and make the compound theirprincipal residence in about half. On average, the rental compounds have 7.7 distinct rentalrooms, and generate US$ 115 per month in total rent per compound, or US$ 83 in incomeafter deducting expenses. Approximately three quarters of tenants have written or verbalmonth-to-month rental agreements and paid a deposit in 47% of the cases. Eighty percentof individual tenancy rents fall between US$ 15 and US$ 35 per month and averages US$ 25.A tenant makes US$ 137 on average in income per month which translates into an averagetotal compound renter income of US$ 1,306.
The primary source of water in the informal settlement is piped water. The utilityconnects a single piped water and sewer line that serves the entire compound which isconsidered a single customer. The property owner is responsible for paying the water and
14The program target was an 80% collection rate, which is consistent with the Kenyan regulator guidelines.15We use data from a listing exercise that we conducted in 2014 and combine this with an updated listing
exercise conducted by the utility in 2018 which is described in further detail in Section 7.16Based on a survey of property owners and a random sample of their tenants conducted in Kayole Soweto
in 2015/2016.
8
sanitation bill, and these services are explicitly included in the rent in 93% of the compoundrental agreements. Customers use Jisomee Mita, a web-based ICT platform that enabledproperty owners to use a mobile phone to self-read meters, receive and pay water bills, andcheck their current balance at any time. While 80% of compounds have a piped waterconnection, 7% report that their connection is not working. Because many households areunable to access piped water in their homes, the utility also operates water kiosks whereresidents can purchase clean water at a regulated price of US$ 0.2 per kiloliter.
3.3 Utility Charges and Reasons for Nonpayment
Piped water is affordable relative to income in this setting. In 2016 the average monthlywater service bill for Kayole Soweto property owners was US$ 4.20, which accounts for 3.6% ofcompound rent, 0.3% of total compound resident income, or 1.1% of property owner income.An additional US$ 6 per month was charged by the utility to repay the water connectionloan (US$1.50 for 30 months) and the sanitation loan (US$ 4.50 for 60 months). Sanitationservices were charged at 70% of the water consumption bill. Even with the inclusion of theloan repayment, the total monthly contribution is significantly lower than the 3% thresholdused by the United Nations to assess water affordability and 5% threshold including san-itation (United Nations, 2010). However, even with reliable service and affordable tariffs,nearly 40% of property owners had yet to make a single payment for services since beingconnected 1.3 years ago on average and the average time since the last payment was madewas 6 months. As a result of this nonpayment, property owners owed US$ 24 on average forpast water use and behind on US$ 38 of their infrastructure loan repayments.
Why did property owners not pay their loans or consumption bills? Figure 2 presentsproperty owner self-reported reasons for (i) not making a payment in the last 2 monthsand (ii) never making a payment based on self-reported data collected from a 2018 surveyof 5,091 property owners in six settlements. Service quality was the most cited reason fornonpayment, reported by about half of respondents, lack of liquidity was the second mostcited reason, and third was not knowing how to make payments. The payment system andbilling infrastructure were not a perceived constraint.
Next, we look at correlates with payment behavior within a regression framework, usingthe 2018 survey data merged with the utility administrative billing data. The sample con-sists of compounds that (i) have a water connection and (ii) have tenants. The dependentvariables include whether the property owner ever made a payment; (ii) the proportion ofbills paid; (iii) the outstanding proportion of water connection loan; and (iv) whether theloan has been fully paid.
9

Two takeaways are clear from the results presented in Table 3. First, the associationsare consistent with reasonable priors: Property owners receiving better service, living on theproperty, and more knowledgeable about payment procedures have better payment practices– for both loans and consumption charges. Second, self-reported reasons for nonpaymentappear consistent with actual behavior measured in the regression analysis but also over-estimate the role of some factors. Service quality is presented as the single most importantself-reported reason for nonpayment. While the regression analysis identifies this as an im-portant contributor, it explains a substantially smaller amount of variation in payments thanthe self-reported reasons for nonpayment.
Another factor that may influence payment behavior is accountability and enforcement.The official policy of the utility allows for disconnection of water services if a property owneris more than 30 days in arrears and has not responded to a formal notice after 15 days.Property owners are notified and given at least 15 days to pay before service is cutoff or toappeal for a delay in payment based on financial difficulty. Property owners are informed ofand consent to this remedy in their service contracts that they sign at the time of connection.In practice, implementation of the disconnection policy was partial and ad hoc in terms ofdetermining which of the eligible property owners would be disconnected. The disconnectionpolicy is challenging to implement in informal settlements because of the potential for socialand political costs associated with disconnections, the potential for some property ownersnot to be able to pay due to financial constraints, and the sheer size of the problem: 82% ofproperty owners were eligible for disconnection based on the formal policy, as of July 2018.
4 Interventions
To ensure basic information constraints were not to blame for low payment rates, aninitial awareness campaign was rolled out by the utility to all property owners in the six tar-geted Nairobi informal settlements in August and September 2018. The utility delivered thefollowing activities in sequence: (i) A phone call to the property owner to collect up-to-datecontact information, provide basic information on how to read meters and pay bills, andshare their latest account balance on record; (ii) an on-site meter reading to ensure accuratebilling records; and (iii) an SMS to property owners providing the account balance based onthe meter reading.
Two additional approaches to encourage payment were rolled out experimentally by theutility. The first was an engagement intervention in which compounds in payment arrearsreceived a face-to-face visit from the utility informing tenants about the current balance,how payments could be made, and the importance of ensuring the property owner makes
10
payment for the utility to be able to provide quality service and avoid disconnection. Utilitystaff followed a specific script loaded onto a tablet during each visit to ensure uniformityin intervention delivery (see appendix). This intervention took place during September andOctober of 2018 after the initial awareness campaign described above.
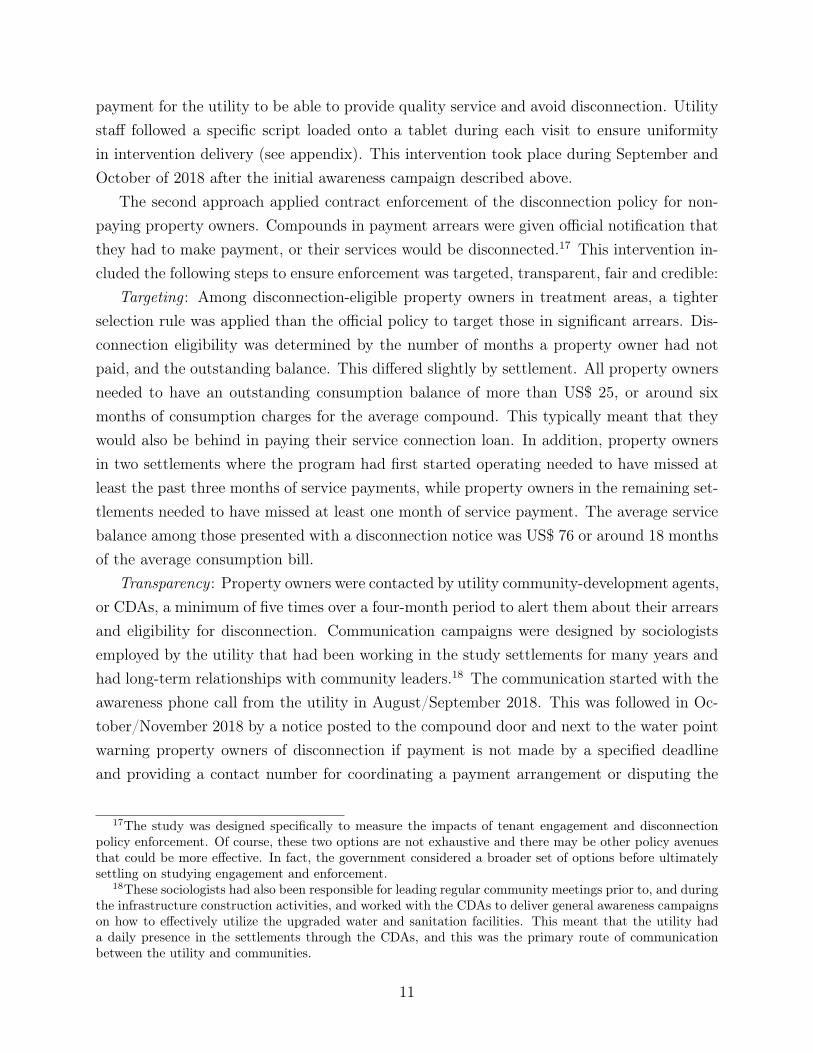
The second approach applied contract enforcement of the disconnection policy for non-paying property owners. Compounds in payment arrears were given official notification thatthey had to make payment, or their services would be disconnected.17 This intervention in-cluded the following steps to ensure enforcement was targeted, transparent, fair and credible:
Targeting : Among disconnection-eligible property owners in treatment areas, a tighterselection rule was applied than the official policy to target those in significant arrears. Dis-connection eligibility was determined by the number of months a property owner had notpaid, and the outstanding balance. This differed slightly by settlement. All property ownersneeded to have an outstanding consumption balance of more than US$ 25, or around sixmonths of consumption charges for the average compound. This typically meant that theywould also be behind in paying their service connection loan. In addition, property ownersin two settlements where the program had first started operating needed to have missed atleast the past three months of service payments, while property owners in the remaining set-tlements needed to have missed at least one month of service payment. The average servicebalance among those presented with a disconnection notice was US$ 76 or around 18 monthsof the average consumption bill.
Transparency : Property owners were contacted by utility community-development agents,or CDAs, a minimum of five times over a four-month period to alert them about their arrearsand eligibility for disconnection. Communication campaigns were designed by sociologistsemployed by the utility that had been working in the study settlements for many years andhad long-term relationships with community leaders.18 The communication started with theawareness phone call from the utility in August/September 2018. This was followed in Oc-tober/November 2018 by a notice posted to the compound door and next to the water pointwarning property owners of disconnection if payment is not made by a specified deadlineand providing a contact number for coordinating a payment arrangement or disputing the
17The study was designed specifically to measure the impacts of tenant engagement and disconnectionpolicy enforcement. Of course, these two options are not exhaustive and there may be other policy avenuesthat could be more effective. In fact, the government considered a broader set of options before ultimatelysettling on studying engagement and enforcement.
18These sociologists had also been responsible for leading regular community meetings prior to, and duringthe infrastructure construction activities, and worked with the CDAs to deliver general awareness campaignson how to effectively utilize the upgraded water and sanitation facilities. This meant that the utility hada daily presence in the settlements through the CDAs, and this was the primary route of communicationbetween the utility and communities.
11

bill (see appendix for example). The notification ensured that tenants were also informedabout the procedure. Third, an SMS warning and fourth, a phone call warning was made tothe property owner prior to the notification deadline, alerting them to pay within 48 hoursor be disconnected. Finally, the utility visited the compound on the deadline and made alast request for payment before proceeding with disconnection.
Fairness : All property owners agreed to the utility’s disconnection policy in writing atthe time of receiving their water and sanitation infrastructure upgrade. Poster notificationsincluded a contact number for property owners or tenants to contact the utility and disputetheir balance or provide justification for why they were unable to afford to pay for the serviceand agree on a payment plan. If property owners were found to be indigent and/or agreedto a flexible payment plan, they would not be disconnected. Tenants were made aware ofthe outstanding balance and could also pay the bills themselves to avoid disconnection. Ifnone of these remedies were taken and service was disconnected, tenants could revert to thestatus quo prior to receiving the piped services - purchasing water from various water kiosksoperated privately or by the utility in the settlement. Since piped water was intermittent,these were the same water sources tenants were currently using in conjunction with theirpiped services.
Credibility : The utility followed through with disconnections if there was no attempt bythe property owner or tenants to make any payment. However, although the official policyrequires property owners to pay a reconnection fee and the full outstanding balance, thiswas not enforced in this setting, and property owners that showed a willingness to cooperatewith the utility could be reconnected. Since the reconnection process was quick and low-costthis meant that people could be reconnected soon after disconnection with limited cost.
The implementation of disconnections in this setting are low-cost, reversible activities.The disconnection costs the utility approximately US$ 3.30.19 Reconnection costs are simi-lar in magnitude to disconnection costs. The disconnection notices were delivered from 29October to 7 November of 2018, with follow ups and disconnections taking place duringNovember and December of the same year.
19Disconnection costs include communication costs of notifying the customer (printing the poster notifica-tion, the phone call reminder and the SMS reminder) of about US$ 0.30 plus labor costs of the disconnectionof about US$ 3.00. The disconnection is conducted by a trained utility staff member who is paid approxi-mately US$ 30 a day.
12
5 Experimental Design
All informal settlement property owners in the utility database were first called to confirmcontact details and receive the base intervention. Eligibility criteria into the study included:(i) property owners were able to be contacted and their contact details could be updated;(ii) their payment accounts were in arrears and (iii) property owners did not hold multipleaccounts (multiple-property owners). All eligible property owners then received the basicinformation intervention and contact details were updated.
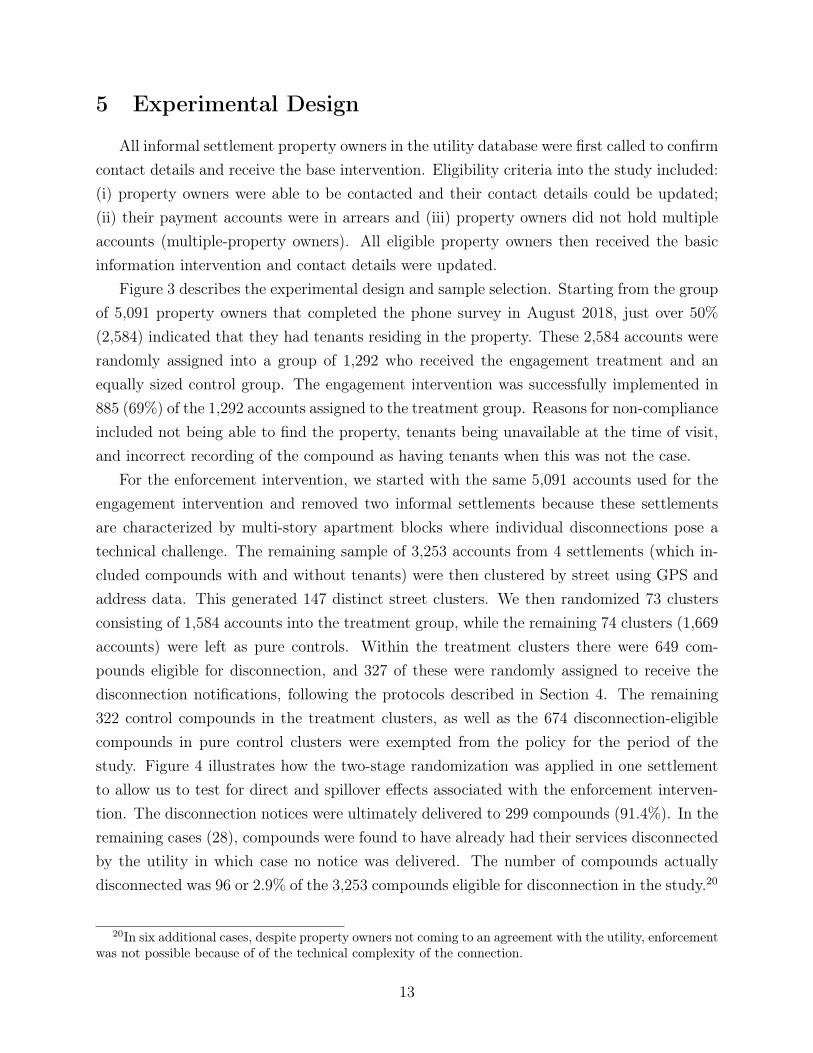
Figure 3 describes the experimental design and sample selection. Starting from the groupof 5,091 property owners that completed the phone survey in August 2018, just over 50%(2,584) indicated that they had tenants residing in the property. These 2,584 accounts wererandomly assigned into a group of 1,292 who received the engagement treatment and anequally sized control group. The engagement intervention was successfully implemented in885 (69%) of the 1,292 accounts assigned to the treatment group. Reasons for non-complianceincluded not being able to find the property, tenants being unavailable at the time of visit,and incorrect recording of the compound as having tenants when this was not the case.
For the enforcement intervention, we started with the same 5,091 accounts used for theengagement intervention and removed two informal settlements because these settlementsare characterized by multi-story apartment blocks where individual disconnections pose atechnical challenge. The remaining sample of 3,253 accounts from 4 settlements (which in-cluded compounds with and without tenants) were then clustered by street using GPS andaddress data. This generated 147 distinct street clusters. We then randomized 73 clustersconsisting of 1,584 accounts into the treatment group, while the remaining 74 clusters (1,669accounts) were left as pure controls. Within the treatment clusters there were 649 com-pounds eligible for disconnection, and 327 of these were randomly assigned to receive thedisconnection notifications, following the protocols described in Section 4. The remaining322 control compounds in the treatment clusters, as well as the 674 disconnection-eligiblecompounds in pure control clusters were exempted from the policy for the period of thestudy. Figure 4 illustrates how the two-stage randomization was applied in one settlementto allow us to test for direct and spillover effects associated with the enforcement interven-tion. The disconnection notices were ultimately delivered to 299 compounds (91.4%). In theremaining cases (28), compounds were found to have already had their services disconnectedby the utility in which case no notice was delivered. The number of compounds actuallydisconnected was 96 or 2.9% of the 3,253 compounds eligible for disconnection in the study.20
20In six additional cases, despite property owners not coming to an agreement with the utility, enforcementwas not possible because of of the technical complexity of the connection.
13
Of these, 74% had tenants.The two interventions were implemented sequentially. The engagement intervention was
implemented in September and October 2018, while the enforcement intervention was im-plemented in November and December of the same year.
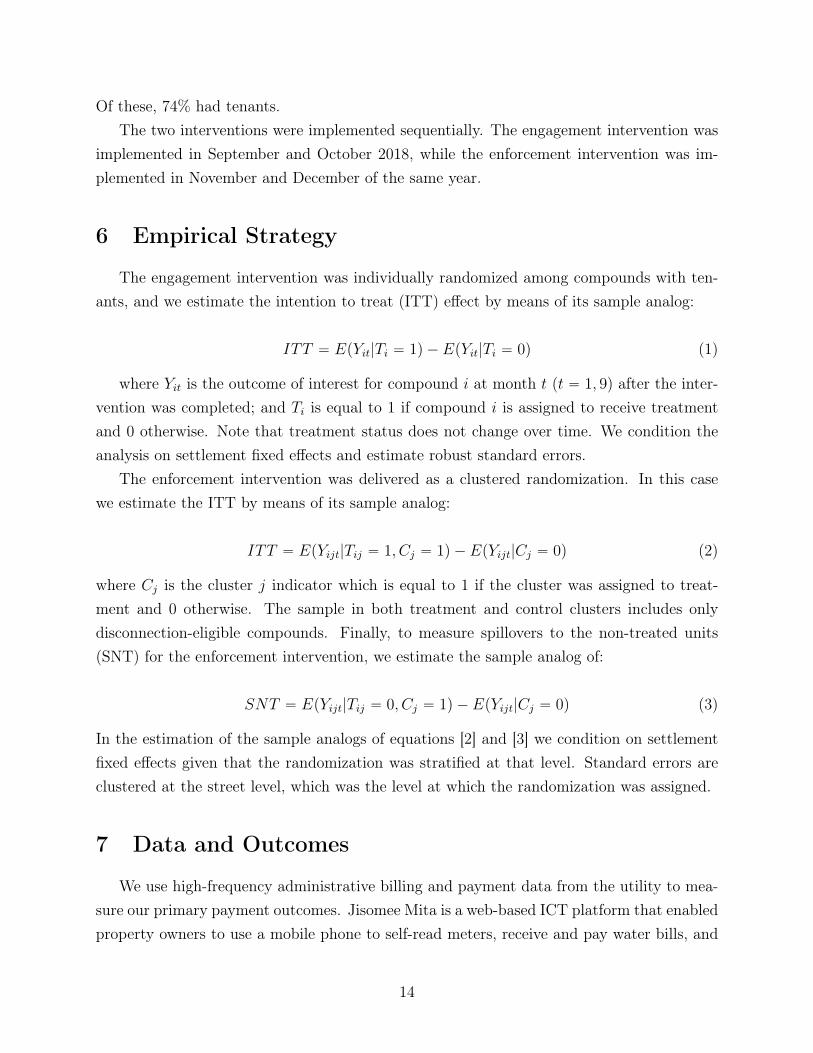
6 Empirical Strategy
The engagement intervention was individually randomized among compounds with ten-ants, and we estimate the intention to treat (ITT) effect by means of its sample analog:
ITT “ EpYit|Ti “ 1q ´ EpYit|Ti “ 0q (1)
where Yit is the outcome of interest for compound i at month t pt “ 1, 9q after the inter-vention was completed; and Ti is equal to 1 if compound i is assigned to receive treatmentand 0 otherwise. Note that treatment status does not change over time. We condition theanalysis on settlement fixed effects and estimate robust standard errors.
The enforcement intervention was delivered as a clustered randomization. In this casewe estimate the ITT by means of its sample analog:
ITT “ EpYijt|Tij “ 1, Cj “ 1q ´ EpYijt|Cj “ 0q (2)
where Cj is the cluster j indicator which is equal to 1 if the cluster was assigned to treat-ment and 0 otherwise. The sample in both treatment and control clusters includes onlydisconnection-eligible compounds. Finally, to measure spillovers to the non-treated units(SNT) for the enforcement intervention, we estimate the sample analog of:
SNT “ EpYijt|Tij “ 0, Cj “ 1q ´ EpYijt|Cj “ 0q (3)
In the estimation of the sample analogs of equations [2] and [3] we condition on settlementfixed effects given that the randomization was stratified at that level. Standard errors areclustered at the street level, which was the level at which the randomization was assigned.
7 Data and Outcomes
We use high-frequency administrative billing and payment data from the utility to mea-sure our primary payment outcomes. Jisomee Mita is a web-based ICT platform that enabledproperty owners to use a mobile phone to self-read meters, receive and pay water bills, and
14

check their current balance at any time. Jisomee Mita data contains water consumption,invoice amounts, payment history, current balance, and contact information of the propertyowner. When payments or balance checks are submitted, the Jisomee Mita data are updatedautomatically. However, monthly standing charges are applied to each account independentof whether a property owner made a payment or billing enquiry which means that eachproperty owner’s balance is updated at least once a month.
The billing data is complemented with tenant and property owner survey data. A shortbaseline listing phone survey of property owners was conducted in August and September2018. This captured ownership and water/sanitation connection status, property owner res-idency and number of paying tenants in the compound.
From August to October 2019 a follow up survey of both property owners and tenantsincluded in the enforcement intervention captured data on rent, service-level satisfaction,political engagement, property owner-tenant interactions, water use and practices, mentalwell-being and general demographic measures of one randomly selected tenant and the cor-responding property owner from each compound in the sample.
We use utility billing data to generate payment outcomes. This includes: (1) the propor-tion of property owners making a payment for water/sewer charges since the intervention,(2) the total amount paid by property owners’ post-intervention and (3) the proportion ofoutstanding service charges paid post-intervention. The data spans the entire period fromwhen the first property owners were connected in 2014 up to nine months after the interven-tions were implemented (September 2019).
We rely on the follow up tenant and property owner survey to measure a range of out-comes that assess the possible welfare effects of the enforcement intervention. We collectmeasures related to water and sanitation infrastructure and use to assess how the interven-tion may have affected access: whether the compound had a pour-flush toilet and pipedwater connection at the time of the endline, whether the water connection was working, themain source of water used by compound residents, the amount of time spent fetching waterin the last week, the amount spent on water in the last month, and the overall piped waterconsumption in the compound. We also capture a range of outcomes that may be affected bythe intervention and changes in water and sanitation access. Here we combine like outcomesinto weighted, standardized indices following Anderson (2008) to reduce the potential forfalse positives from multiple hypothesis testing. We generate the following indices (full listof sub-indicators is presented in the appendix Tables A1 and A2):
Tenant-Property owner relationship: For the property owner index this includes prop-erty owner perceptions on whether tenants complain about the water and sewer facilities orabout the general conditions of the compound, and whether tenants keep the compound in
15
a good condition. For tenants, we simply ask how they would rate their relationship withthe property owner from 1 (very poor) to 10 (excellent).
Perception of service quality : Tenant / Property owner agrees or strongly agrees thatthey are satisfied with utility services, the utility services improve people’s lives and pro-vides clear communication, the government is trying to improve their lives, and (reversecoded) the government is not interested in helping the community.
Perception of service fairness : Tenant / Property owner agrees or strongly agrees thatthe utility enforcement mechanisms are fair and bills are accurate and fair.
Activism: Whether the compound has a committee, tenants have reached out to commu-nity leaders, participated in community meetings, or are members of community committees.
Psychological well-being : We include a set of standardized measures to capture differentdimensions of psychological well-being among tenants, including Cohen’s four-item stressscale (Cohen et al., 1983), depression (Center for Epidemiologic Studies Depression (CES-D)seven-point scale (Radloff, 1977)), optimism (Rosenberg optimism questionnaire (Rosenberg,1965)), and the World Value Survey (WVS) measures of happiness, trust and life satisfac-tion. The psychological well-being index in turn is a standardized weighted average of thesesub-indices.
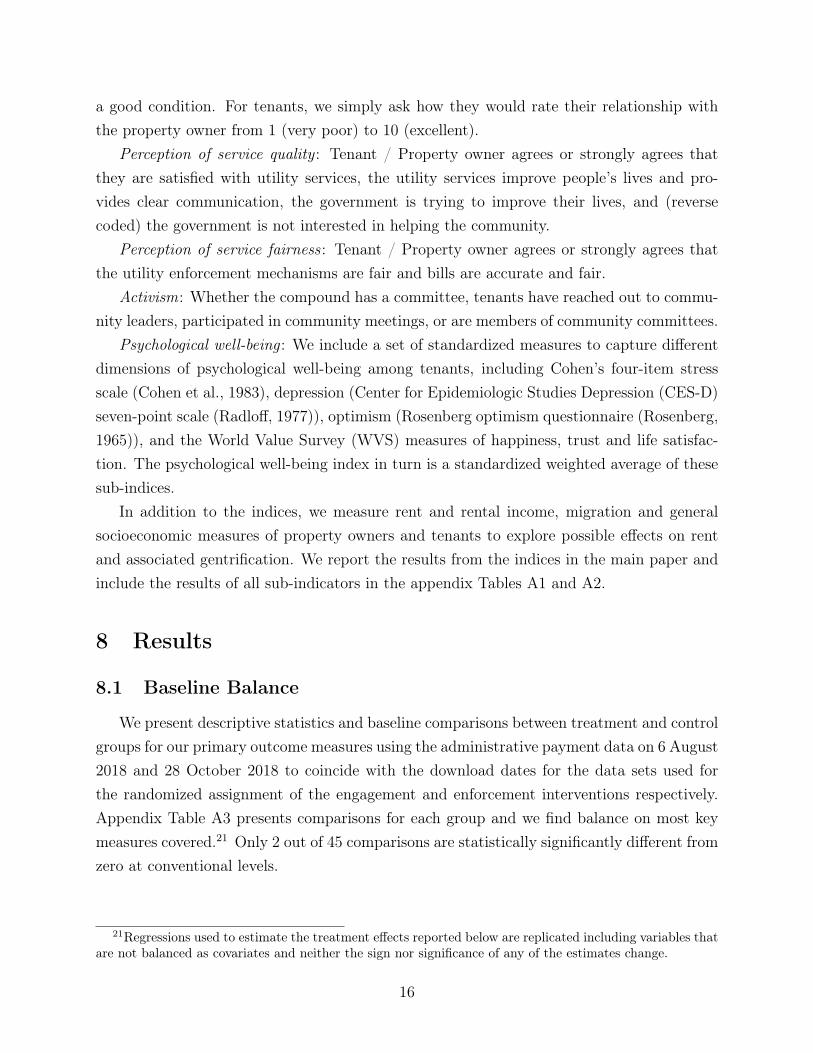
In addition to the indices, we measure rent and rental income, migration and generalsocioeconomic measures of property owners and tenants to explore possible effects on rentand associated gentrification. We report the results from the indices in the main paper andinclude the results of all sub-indicators in the appendix Tables A1 and A2.
8 Results
8.1 Baseline Balance
We present descriptive statistics and baseline comparisons between treatment and controlgroups for our primary outcome measures using the administrative payment data on 6 August2018 and 28 October 2018 to coincide with the download dates for the data sets used forthe randomized assignment of the engagement and enforcement interventions respectively.Appendix Table A3 presents comparisons for each group and we find balance on most keymeasures covered.21 Only 2 out of 45 comparisons are statistically significantly different fromzero at conventional levels.
21Regressions used to estimate the treatment effects reported below are replicated including variables thatare not balanced as covariates and neither the sign nor significance of any of the estimates change.
16
8.2 Payment Behavior
We find a precisely estimated null effect of the engagement intervention for all primarypayment outcomes and time periods measured in Table 4. The control group paymentsincrease steadily over the nine-month period from 30.1% of property owners having madepayments one month after the intervention to 55.8% having made at least one payment bynine months (cumulative). However, compounds being exposed to the engagement interven-tion track almost the exact same trajectory as their control comparison. The total amountpaid, and proportion of balance paid off are similarly indistinguishable across treatment andcontrol group.
In contrast to the engagement intervention, we find a sharp increase in payment behav-ior among compounds exposed to the disconnection notices (Table 5). The likelihood ofpayment within one month almost quadruples - increasing by 30 percentage points from 11percentage points (p-value < 0.001). This difference in payment likelihood sustains throughthe nine-month period, although with a slight decline relative to the control group. A sim-ilar pattern is found for the total payments after one month, which increases by US$ 8.80(p-value < 0.001) from a base of US$ 5.02. After this sharp initial increase, the differenceremains roughly constant between treatment and control groups while both increase overtime. Treatment compounds have paid off 11.3 percentage points more of their balance thancontrol compounds after the first month of intervention (p-value < 0.001). Control com-pounds begin to catch up gradually over the nine months, closing this gap to 7.8 percentagepoints (p-value = 0.005).
Figure 5 presents the full time series data available from the daily payment informationextracted from the utility billing database. The visualization strengthens the main messagesidentified through the regression results. First, we find strong evidence of balanced paymentpractices across treatment and control groups from 2014 when property owners first startedconnecting to October 2018 just before the enforcement intervention. Second, we see thatthe payment trajectories continue to overlap after November 2018 when comparing the en-gagement intervention group to the control. Third, we see a sharp jump in the enforcementintervention group immediately after the intervention was delivered, which then stabilizesover time, suggesting that most of the impact identified in the regressions is driven by thebehavior change in the first month after the intervention.
8.3 Spillovers
To test for spillovers on the payment behavior of disconnection-eligible property ownerswe compare control compounds in treatment clusters to the equivalent disconnection-eligible
17
property owners in control clusters and find no significant difference between the groups,suggesting no discernible spillover effects from the program using our originally specifiedempirical strategy for estimating spillovers (Table 6, Panel A). In Table 6, Panel B we reportsimilar results for disconnection-ineligible property owners suggesting that the enforcementintervention had no observable spillovers on paying property owners either.
8.4 Heterogenous Treatment Effects on Payment Behavior
We consider two sets of sub-group analysis. First, the calculus for resident propertyowners is likely to be different to that for non-resident property owners (the former would bemore directly affected by service disruption in the enforcement intervention, and potentiallymore accessible in the engagement intervention). Second the constraints and decisions tomake payment may be different when considering the intensive (getting payers to pay more)versus the extensive margin (inducing those that have never made a payment to start paying).The appendix Tables A4 and A5 present sub-group analyses for property owner residencystatus and the intensive vs. extensive margin of payment respectively. In both cases we findno clear evidence of strong differences across these subgroups.
8.5 Water Access and Use
To measure social and economic costs of the enforcement intervention we use surveydata collected nine months after the intervention, as reported in Section 7. Estimatedimpacts are presented in Table 7. The enforcement intervention had little effect on compoundconnections to water and sanitation services. The majority of the 96 disconnected compoundswere reconnected after agreeing to pay a portion of their balance. We observe 27 of thesecompounds made a payment after being disconnected, with 20 of these payments beingmade within one month of the disconnection. The remaining compounds were reconnectedwithout requiring a payment if they agreed on a plan with the utility. Compounds receivingthe enforcement intervention have statistically indistinguishable piped water and sanitationconnection rates at endline. This remains true when considering whether the piped waterconnection is currently working. We also find little evidence of illegal connections based onenumerator observation (3 cases across the sample).
Many households with piped water do not report this as their primary water source.Only 30.6% of control households report using piped water as their main source of water,which is 4.4 percentage points higher among treatment households, but non-significant (p-value=0.243). Many households in both groups are more likely to rely on water kiosks orboreholes (40%) than piped water. Both groups report spending similar amounts on water
18

for all uses in the last month (Control: US$ 6.62; Treatment: US$ 6.86; p-value = 0.803) andtotal time spent collecting water in the past week (Control: 118 minutes; Treatment: 100minutes; p-value = 0.388), although this measure is noisy. Unsurprisingly then, we find nochanges in overall piped water consumed based on meter readings at compounds during theendline survey. Overall, nine months after the interventions, access to water and sanitationwere indistinguishable between treatment and control groups.
The study had originally intended to include child health as a secondary outcome and hadcollected maternal-reported illness symptoms for children under five. However, we choose notto include analysis of these outcomes for two reasons. First, sample sizes were very low sincenot all surveyed households had children under five. Second, it is unlikely that there wouldbe any impact on health since there was no impact on the primary mechanism through whichthe intervention could have impacted health, i.e., access to water and sanitation services.
8.6 Performance Perceptions and Political Costs
We find no effect of the intervention on perceptions of service delivery quality and fairnessamong property owners or tenants (Table 7). Similarly, we find no impacts on the strengthof the relationship between property owners and tenants, as reported by either group. Com-munity activism among tenants, too, does not differ across groups. All indices have effectsize point estimates with small absolute values, and the signs of these differences vary, sug-gesting no obvious pattern. The full set of indicators from which these indices are calculatedis presented in the appendix, which similarly finds no discernible pattern (Appendix TablesA1 and A2). The only significant difference found is an 11.3-percentage point improvedperception among property owners that “water bills are accurate”. Given the high numberof variables and potential for false positives, we interpret the results overall as showing nomeaningful impact of the intervention on any of the outcomes measured.
8.7 Psychological Well-Being
In total we measure seven constructs (depression, life satisfaction, stress, happiness, self-esteem, trust, and life orientation), collected among tenants. We find no impact of theintervention on the overall psychological well-being index which combines these sub-indices(Table 7). The full set of seven constructs is presented in the appendix, which finds nostatistically significant differences across these either (Table A6).
19
8.8 Rental Market
We find that property owner rental income increases significantly from US$ 62.58 by US$23.88 (p-value = 0.019; Table 8). Interestingly, this does not appear to be driven by increasesin tenant rental prices. Control households report paying US$ 33.06 a month in rent, whichis indistinguishable from treatment household rents. While property owners in treatmentareas are slightly more likely to have increased rent in the past six months, this is only 3.6percentage points higher and borderline significant (p-value = 0.091) in the treatment groupwhich cannot explain the significant increases in rental income that they receive. However,we find a large and significant increase in the proportion of property owners renting out atleast part of their compound, which increases from 58.9% by 13.5 percentage points (p-value< 0.001). Since there is a small imbalance in this indicator at baseline, we rerun the analysis,including this measure as a lagged dependent variable and find that the significant increaseholds, although with a reduced point estimate on both the proportion of property ownersrenting out their compound, and rental income. The results suggest that property ownersresponded to an increase in effective water and sanitation service charges from increasedcontract enforcement by becoming more likely to rent out parts of their compound. Thisincreased rental income to cover the increased costs.
9 Conclusion
The status quo in delivery of basic services excludes millions of poor households. Achiev-ing universal access to improved water and sanitation requires innovations in service deliveryapproaches to help reduce the gap between available resources and the estimated costs ofachieving national and global targets. Low-income households in urban centers facing highgrowth rates and stressed infrastructure are of particular concern. While providing creditto overcome high upfront costs to water and sanitation infrastructure connections has beenshown to substantially increase take up in some settings, the sustainability of this modelof infrastructure expansion is predicated on the repayment of loans by customers. In sixof Nairobi’s informal settlements where compounds received comprehensive water and san-itation infrastructure upgrades, we find repayment on these loans, and payment of generalservice charges, is well below targets, despite these charges being affordable under standardglobal benchmarks.
We test two common interventions used by utilities to improve revenue collection ef-ficiency. The first – a face-to-face engagement intervention aimed at spurring bottom-upaccountability from tenants to property owners, had a precisely estimated null effect on pay-
20

ment behavior in our setting. The second intervention – contract enforcement in the form oftargeted, transparent, flexible and credible disconnection notices quadrupled the likelihoodof property owners making a payment in the month of the intervention. We see limited ev-idence of further increases nine months after the intervention, and no evidence of potentialspillover effects of the enforcement intervention on other property owners. This is possiblyattributable to the fact that owners viewed the enforcement intervention as a onetime eventrather than a permanent change in policy.
We did not find evidence that residents were negatively affected by the contract en-forcement intervention nine months after implementation. Water and sanitation serviceconnections and water consumption were not meaningfully different between treatment andcontrol compounds. This is because most property owners whose service was disconnectedwere quickly reconnected after agreeing to a payment plan and during service interruptionsresidents had access to water from kiosks operated by the utility and private vendors. More-over, contract enforcement did not affect either tenants’ or property owners’ perceptions offairness and quality of water service delivery, nor affect the relationships of tenants and prop-erty owners. Finally, tenants were no more likely to move out. Taken together these resultssuggest that transparent contract enforcement was effective at improving revenue collectionefficiency without incurring large social or political costs.
21
References
Abramovsky, L., L. Andrés, G. Joseph, J. P. Rud, G. Sember, and M. Thibert (2020). Studyof the Distributional Performance of Piped Water Consumption Subsidies in 10 DevelopingCountries. The World Bank.
Ahluwalia, M. S. (2002, September). Economic reforms in India since 1991: Has gradualismworked? Journal of Economic Perspectives 16 (3), 67–88.
Allcott, H. (2011). Social norms and energy conservation. Journal of public Economics 95 (9-10), 1082–1095.
Anderson, M. L. (2008). Multiple inference and gender differences in the effects of early inter-vention: A reevaluation of the Abecedarian, Perry Preschool, and early training projects.Journal of the American statistical Association 103 (484), 1481–1495.
Ashraf, N., E. Glaeser, A. Holland, and B. M. Steinberg (2021). Water, health and wealth:The impact of piped water outages on disease prevalence and financial transactions inZambia. Economica.
Ashraf, N., E. L. Glaeser, and G. A. Ponzetto (2016). Infrastructure, incentives, and insti-tutions. American Economic Review 106 (5), 77–82.
Bedoya, G., J. Das, and A. Dolinger (2021). Randomized regulation: The impact of inspec-tions on health markets.
Björkman, M. and J. Svensson (2010). When is community-based monitoring effective?evidence from a randomized experiment in primary health in Uganda. Journal of theEuropean Economic Association 8 (2-3), 571–581.
Briceño, B., A. Coville, P. Gertler, and S. Martinez (2017). Are there synergies from com-bining hygiene and sanitation promotion campaigns: evidence from a large-scale cluster-randomized trial in rural Tanzania. PloS one 12 (11), e0186228.
Brockmeyer, A., S. Smith, M. Hernandez, and S. Kettle (2019). Casting a wider tax net:Experimental evidence from Costa Rica. American Economic Journal: Economic Pol-icy 11 (3), 55–87.
Burgess, R., M. Greenstone, N. Ryan, and A. Sudarshan (2020). The consequences of treatingelectricity as a right. Journal of Economic Perspectives 34 (1), 145–69.
22

Cameron, L., S. Olivia, and M. Shah (2019). Scaling up sanitation: evidence from an RCTin Indonesia. Journal of development economics 138, 1–16.
Clasen, T., S. Boisson, P. Routray, B. Torondel, M. Bell, O. Cumming, J. Ensink, M. Free-man, M. Jenkins, M. Odagiri, et al. (2014). Effectiveness of a rural sanitation programmeon diarrhoea, soil-transmitted helminth infection, and child malnutrition in Odisha, India:a cluster-randomised trial. The Lancet Global Health 2 (11), e645–e653.
Cohen, S., T. Kamarck, and R. Mermelstein (1983). A global measure of perceived stress.Journal of health and social behavior , 385–396.
Cronk, R. and J. Bartram (2017). Factors influencing water system functionality in Nigeriaand Tanzania: A regression and bayesian network analysis. Environmental Science &Technology 51 (19), 11336–11345. PMID: 28854334.
de Andrade, G. H., M. Bruhn, and D. McKenzie (2016, 10). A Helping Hand or the LongArm of the Law? Experimental Evidence on What Governments Can Do to FormalizeFirms. The World Bank Economic Review 30 (1), 24–54.
Devoto, F., E. Duflo, P. Dupas, W. Parienté, and V. Pons (2012). Happiness on tap: Pipedwater adoption in urban Morocco. American Economic Journal: Economic Policy 4 (4),68–99.
Duflo, E., M. Greenstone, R. Pande, and N. Ryan (2018). The value of regulatory discretion:Estimates from environmental inspections in India. Econometrica 86 (6), 2123–2160.
Dzansi, J., S. Puller, B. Street, and B. Yebuah-Dwamena (2018). The vicious circle ofblackouts and revenue collection in developing economies: Evidence from Ghana.
Foster, T., S. Furey, B. Banks, and J. Willetts (2020). Functionality of handpump water sup-plies: a review of data from sub-Saharan Africa and the Asia-Pacific region. InternationalJournal of Water Resources Development 36 (5), 855–869.
Galiani, S., P. Gertler, and E. Schargrodsky (2005). Water for life: The impact of theprivatization of water services on child mortality. Journal of political economy 113 (1),83–120.
Glaeser, E. L. and A. Shleifer (2002). Legal origins. The Quarterly Journal of Eco-nomics 117 (4), 1193–1229.
Golumbeanu, R. and D. Barnes (2013). Connection charges and electricity access in sub-Saharan Africa.
23
Guiteras, R., J. Levinsohn, and A. M. Mobarak (2015). Encouraging sanitation investmentin the developing world: a cluster-randomized trial. Science 348 (6237), 903–906.
Hernandez, D. and J. Laird (2019). Disconnected: Estimating the national prevalence ofutility disconnections and related coping strategies. Philadelphia, PA: American PublicHealth Association.
Heymans, C., K. Eales, and R. Franceys (2014). The limits and possibilities of prepaid waterin urban Africa.
Hutton, G. and M. Varughese (2016). The Costs of Meeting the 2030 Sustainable Develop-ment Goal Targets on Drinking Water, Sanitation, and Hygiene. The World Bank.
Jack, K. and G. Smith (2020, April). Charging ahead: Prepaid metering, electricity use, andutility revenue. American Economic Journal: Applied Economics 12 (2), 134–68.
Jiménez, A. and A. Pérez-Foguet (2011). The relationship between technology and function-ality of rural water points: evidence from Tanzania. Water science and technology 63 (5),948–955.
Kennedy-Walker, R., N. Mehta, S. Thomas, and M. Gambrill (2020). Connecting the un-connected.
Kenya National Bureau of Statistics, Ministry of Health/Kenya, National AIDS ControlCouncil/Kenya, Kenya Medical Research Institute, and National Council for Populationand Development/Kenya. (2015). Kenya demographic and health survey 2014. Technicalreport.
Kleven, H. J., M. B. Knudsen, C. T. Kreiner, S. Pedersen, and E. Saez (2011). Unwilling orunable to cheat? evidence from a tax audit experiment in denmark. Econometrica 79 (3),651–692.
Lee, K., E. Miguel, and C. Wolfram (2020). Experimental evidence on the economics of ruralelectrification. Journal of Political Economy 128 (4), 1523–1565.
Liemberger, R. and A. Wyatt (2019). Quantifying the global non-revenue water problem.Water Supply 19 (3), 831–837.
McRae, S. (2015). Infrastructure quality and the subsidy trap. American Economic Re-view 105 (1), 35–66.
24
Mugabi, J., S. Kayaga, I. Smout, and C. Njiru (2010). Determinants of customer decisionsto pay utility water bills promptly. Water Policy 12 (2), 220–236.
NCWSC (2017). Equitable water distribution program.
Northeast Group (2017, May). Electricity theft and non-technical losses: Global markets,solutions, and vendors. Technical Report ID: 4311626.
Olken, B. A. (2007). Monitoring corruption: evidence from a field experiment in Indonesia.Journal of political Economy 115 (2), 200–249.
Patil, S. R., B. F. Arnold, A. L. Salvatore, B. Briceno, S. Ganguly, J. M. Colford Jr, andP. J. Gertler (2014). The effect of India’s total sanitation campaign on defecation behaviorsand child health in rural madhya pradesh: a cluster randomized controlled trial. PLoSMed 11 (8), e1001709.
Radloff, L. S. (1977). The ces-d scale: A self-report depression scale for research in thegeneral population. Applied psychological measurement 1 (3), 385–401.
Rockenbach, B., S. Tonke, and A. R. Weiss (2019). From diagnosis to treatment: A large-scale field experiment to reduce non-payments for water.
Rosenberg, M. (1965). Society and the adolescent self-image. Princeton university press.
Serra, D. (2012). Combining top-down and bottom-up accountability: evidence from abribery experiment. The journal of law, economics, & organization 28 (3), 569–587.
Slemrod, J., M. Blumenthal, and C. Christian (2001). Taxpayer response to an increasedprobability of audit: evidence from a controlled experiment in Minnesota. Journal ofpublic economics 79 (3), 455–483.
Soppe, G., N. Janson, and S. Piantini (2018). Water Utility Turnaround Framework. WorldBank.
Szabó, A. and G. Ujhelyi (2015). Reducing nonpayment for public utilities: Experimentalevidence from South Africa. Journal of Development Economics 117, 20–31.
Telle, K. (2013). Monitoring and enforcement of environmental regulations: Lessons from anatural field experiment in Norway. Journal of Public Economics 99, 24–34.
Trimble, C., M. Kojima, I. P. Arroyo, and F. Mohammadzadeh (2016). Financial Viabilityof Electricity Sectors in sub-Saharan Africa: Quasi-Fiscal Deficits and Hidden Costs. TheWorld Bank.
25
United Nations (2010). Eight short facts on the human right to water and sanitation.
Violette, W. (2020). Microcredit from delaying bill payments.
WaterAid (2007). Water, environmental sanitation and hygiene programme for urban poor.Technical report.
Whittington, D., M. Radin, and M. Jeuland (2020, 01). Evidence-based policy analysis?The strange case of the randomized controlled trials of community-led total sanitation.Oxford Review of Economic Policy 36 (1), 191–221.
World Bank (2017). Performance of water utilities in Africa. Technical report.
World Bank (2019). Implementation completion and results report – nairobi sanitation obaproject. Technical report.
26
Figures and Tables
Figure 1: Revenue Collection Efficiency and Number of Utility Customers
2000
4000
6000
8000
1000
0N
umbe
r of c
onne
ctio
ns
.5.5
5.6
.65
.7.7
5P
ropo
rtion
of t
otal
bill
s pa
id
2015 2016 2017 2018 2019Date
Proportion of bills paid Number of customers
Notes. Blue line shows the proportion of payments received from total bills (in-cluding consumption and loans) over time; Red line shows total number of utilitycustomers in informal settlements having either a piped water connection or both awater and sewer connection.
Figure 2: Self-reported Reasons for Nonpayment
0% 20% 40% 60%
Payment systemwas not working
Meter isbroken
I'm not responsiblefor making payments
Don'thave time
Account isnot yet set up
Didn't know thatI needed to pay
Don't know howto make payment
Don't havemoney
Didn't receivewater
No payment for more than 2 months Never paid
Notes. Based on property owner self-reported reasons for not paying, captured during the Au-gust/September 2018 listing exercise. Multiple choices were allowed. N is 2,488 for not making inmore than 2 months and N is 1,387 for never paying.
27

Figure 3: Experimental Design and Sample Sizes
Notes. This figure presents the sample selection and randomization assignment for the engagement and enforcementexperiments. Two settlements were excluded from the enforcement intervention because of housing density andcompound design.
Figure 4: Example of Two-stage Randomization for Disconnection Notices in One Settlement
Notes. Map represents an example of random assignment in one settlement for illustrative purposes. Actual assignmentis not reported to maintain confidentiality.
28
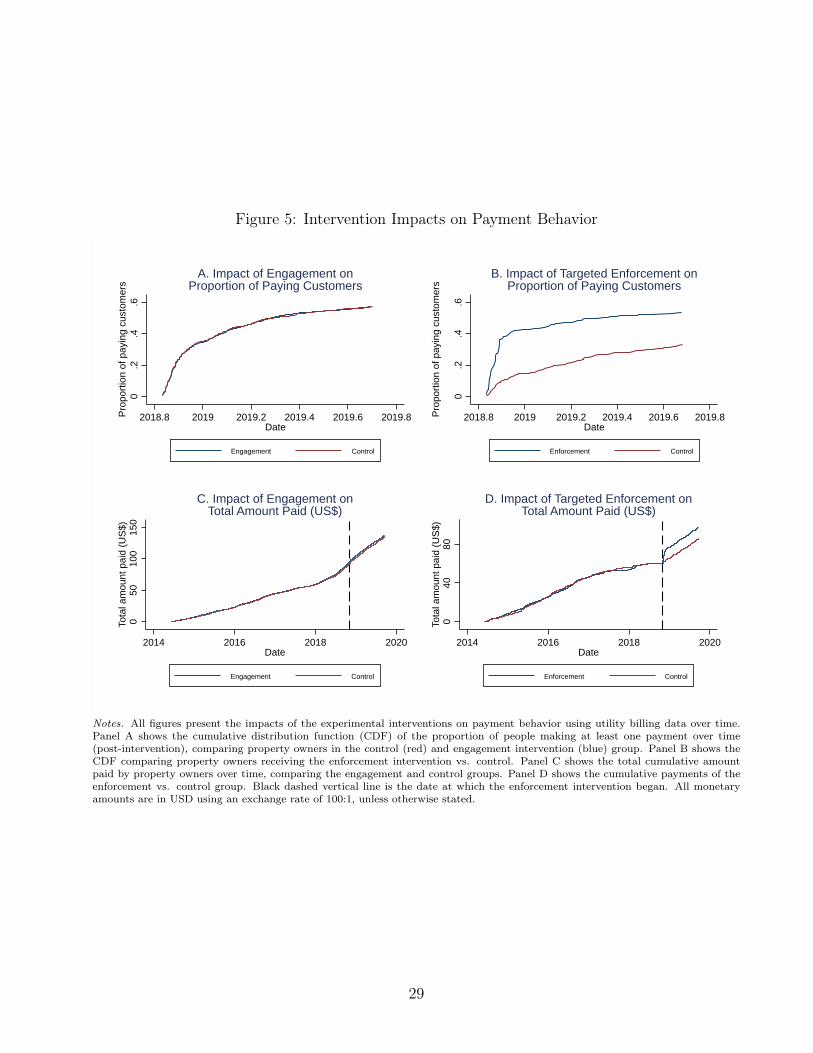
Figure 5: Intervention Impacts on Payment Behavior
0.2
.4.6
Pro
porti
on o
f pay
ing
cust
omer
s
2018.8 2019 2019.2 2019.4 2019.6 2019.8Date
Engagement Control
A. Impact of Engagement onProportion of Paying Customers
0.2
.4.6
Pro
porti
on o
f pay
ing
cust
omer
s
2018.8 2019 2019.2 2019.4 2019.6 2019.8Date
Enforcement Control
B. Impact of Targeted Enforcement onProportion of Paying Customers
050
100
150
Tota
l am
ount
pai
d (U
S$)
2014 2016 2018 2020Date
Engagement Control
C. Impact of Engagement onTotal Amount Paid (US$)
040
80To
tal a
mou
nt p
aid
(US
$)
2014 2016 2018 2020Date
Enforcement Control
D. Impact of Targeted Enforcement onTotal Amount Paid (US$)
Notes. All figures present the impacts of the experimental interventions on payment behavior using utility billing data over time.Panel A shows the cumulative distribution function (CDF) of the proportion of people making at least one payment over time(post-intervention), comparing property owners in the control (red) and engagement intervention (blue) group. Panel B shows theCDF comparing property owners receiving the enforcement intervention vs. control. Panel C shows the total cumulative amountpaid by property owners over time, comparing the engagement and control groups. Panel D shows the cumulative payments of theenforcement vs. control group. Black dashed vertical line is the date at which the enforcement intervention began. All monetaryamounts are in USD using an exchange rate of 100:1, unless otherwise stated.
29
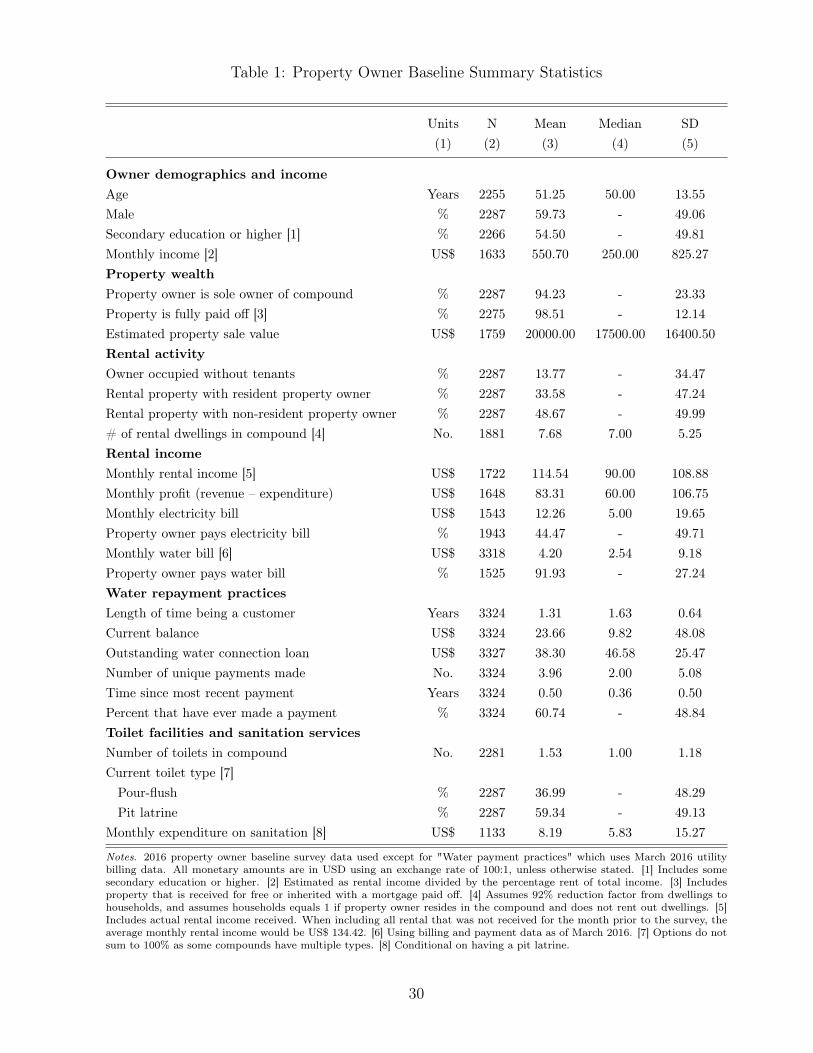
Table 1: Property Owner Baseline Summary Statistics
Units N Mean Median SD(1) (2) (3) (4) (5)
Owner demographics and incomeAge Years 2255 51.25 50.00 13.55Male % 2287 59.73 - 49.06Secondary education or higher [1] % 2266 54.50 - 49.81Monthly income [2] US$ 1633 550.70 250.00 825.27Property wealthProperty owner is sole owner of compound % 2287 94.23 - 23.33Property is fully paid off [3] % 2275 98.51 - 12.14Estimated property sale value US$ 1759 20000.00 17500.00 16400.50Rental activityOwner occupied without tenants % 2287 13.77 - 34.47Rental property with resident property owner % 2287 33.58 - 47.24Rental property with non-resident property owner % 2287 48.67 - 49.99# of rental dwellings in compound [4] No. 1881 7.68 7.00 5.25Rental incomeMonthly rental income [5] US$ 1722 114.54 90.00 108.88Monthly profit (revenue – expenditure) US$ 1648 83.31 60.00 106.75Monthly electricity bill US$ 1543 12.26 5.00 19.65Property owner pays electricity bill % 1943 44.47 - 49.71Monthly water bill [6] US$ 3318 4.20 2.54 9.18Property owner pays water bill % 1525 91.93 - 27.24Water repayment practicesLength of time being a customer Years 3324 1.31 1.63 0.64Current balance US$ 3324 23.66 9.82 48.08Outstanding water connection loan US$ 3327 38.30 46.58 25.47Number of unique payments made No. 3324 3.96 2.00 5.08Time since most recent payment Years 3324 0.50 0.36 0.50Percent that have ever made a payment % 3324 60.74 - 48.84Toilet facilities and sanitation servicesNumber of toilets in compound No. 2281 1.53 1.00 1.18Current toilet type [7]Pour-flush % 2287 36.99 - 48.29Pit latrine % 2287 59.34 - 49.13
Monthly expenditure on sanitation [8] US$ 1133 8.19 5.83 15.27
Notes. 2016 property owner baseline survey data used except for "Water payment practices" which uses March 2016 utilitybilling data. All monetary amounts are in USD using an exchange rate of 100:1, unless otherwise stated. [1] Includes somesecondary education or higher. [2] Estimated as rental income divided by the percentage rent of total income. [3] Includesproperty that is received for free or inherited with a mortgage paid off. [4] Assumes 92% reduction factor from dwellings tohouseholds, and assumes households equals 1 if property owner resides in the compound and does not rent out dwellings. [5]Includes actual rental income received. When including all rental that was not received for the month prior to the survey, theaverage monthly rental income would be US$ 134.42. [6] Using billing and payment data as of March 2016. [7] Options do notsum to 100% as some compounds have multiple types. [8] Conditional on having a pit latrine.
30
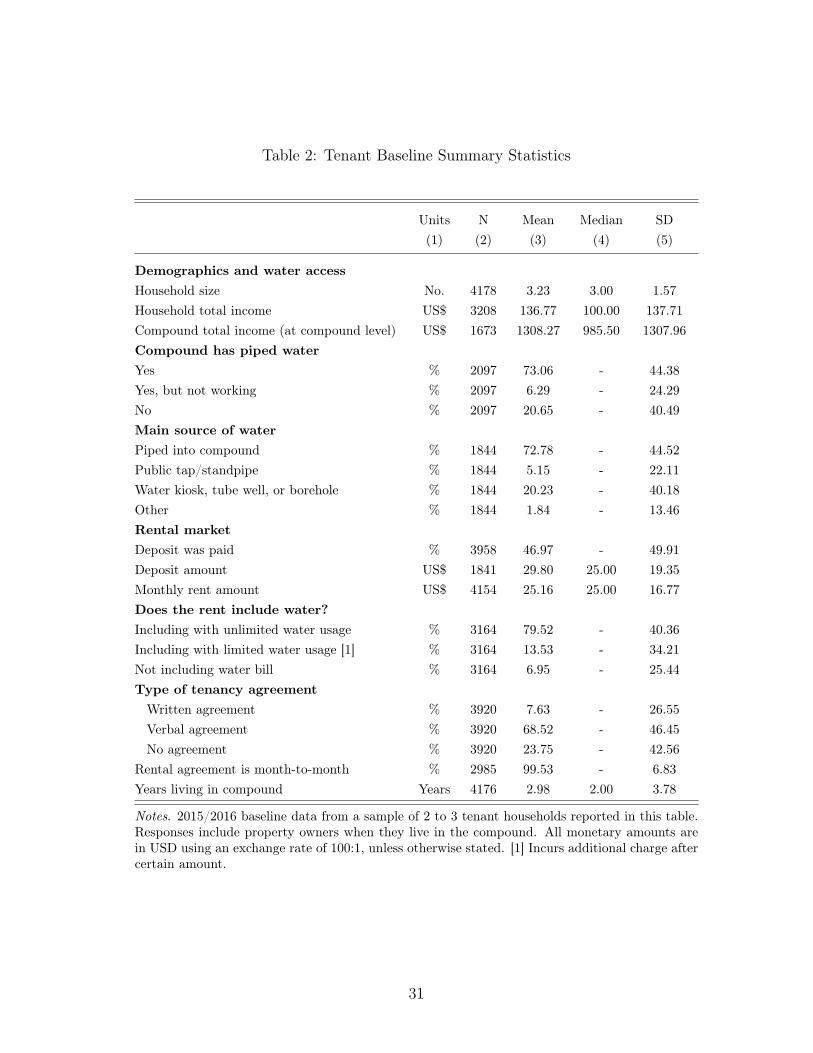
Table 2: Tenant Baseline Summary Statistics
Units N Mean Median SD(1) (2) (3) (4) (5)
Demographics and water accessHousehold size No. 4178 3.23 3.00 1.57Household total income US$ 3208 136.77 100.00 137.71Compound total income (at compound level) US$ 1673 1308.27 985.50 1307.96Compound has piped waterYes % 2097 73.06 - 44.38Yes, but not working % 2097 6.29 - 24.29No % 2097 20.65 - 40.49Main source of waterPiped into compound % 1844 72.78 - 44.52Public tap/standpipe % 1844 5.15 - 22.11Water kiosk, tube well, or borehole % 1844 20.23 - 40.18Other % 1844 1.84 - 13.46Rental marketDeposit was paid % 3958 46.97 - 49.91Deposit amount US$ 1841 29.80 25.00 19.35Monthly rent amount US$ 4154 25.16 25.00 16.77Does the rent include water?Including with unlimited water usage % 3164 79.52 - 40.36Including with limited water usage [1] % 3164 13.53 - 34.21Not including water bill % 3164 6.95 - 25.44Type of tenancy agreementWritten agreement % 3920 7.63 - 26.55Verbal agreement % 3920 68.52 - 46.45No agreement % 3920 23.75 - 42.56
Rental agreement is month-to-month % 2985 99.53 - 6.83Years living in compound Years 4176 2.98 2.00 3.78
Notes. 2015/2016 baseline data from a sample of 2 to 3 tenant households reported in this table.Responses include property owners when they live in the compound. All monetary amounts arein USD using an exchange rate of 100:1, unless otherwise stated. [1] Incurs additional charge aftercertain amount.
31

Table 3: Correlates with Payment Behavior
Evermade apayment
Proportionof invoices
paid
Proportionof loan
outstand-ing
Connectionloan fullyrepaid
(1) (2) (3) (4)
Property owner resides in the compound 0.034**(0.014)r0.017s
-0.029*(0.017)r0.087s
0.080***(0.026)r0.002s
-0.054***(0.015)r0.000s
Compound received water last week 0.169***(0.012)r0.000s
0.191***(0.015)r0.000s
-0.276***(0.023)r0.000s
0.125***(0.013)r0.000s
Property owner knows how to pay the bill 0.215***(0.015)r0.000s
0.224***(0.018)r0.000s
-0.204***(0.027)r0.000s
0.090***(0.016)r0.000s
Compound has tenants 0.006(0.013)r0.661s
-0.005(0.015)r0.744s
-0.032(0.023)r0.157s
0.013(0.014)r0.342s
Property owner pays water bills -0.004(0.018)r0.827s
0.020(0.022)r0.378s
-0.034(0.034)r0.309s
0.002(0.020)r0.911s
Years with a water and/or sewerage connection 0.208***(0.006)r0.000s
0.127***(0.008)r0.000s
-0.050***(0.011)r0.000s
0.116***(0.007)r0.000s
Property owner knows how to read the meter 0.012(0.014)r0.410s
-0.006(0.017)r0.727s
-0.014(0.026)r0.577s
0.011(0.015)r0.466s
Property owner knows how to check balance 0.004(0.016)r0.818s
0.032(0.020)r0.108s
-0.056*(0.030)r0.059s
0.045***(0.018)r0.010s
Observations 4175 4164 4175 4175R-squared 0.432 0.237 0.148 0.209
Notes. Standard errors in parentheses; P-value in brackets. *** p<0.01, ** p<0.05, * p<0.1. Paymentoutcomes are derived from the billing data and compound outcomes come from the property owner listingexercise in August/September 2018. Settlement fixed effects included.
32
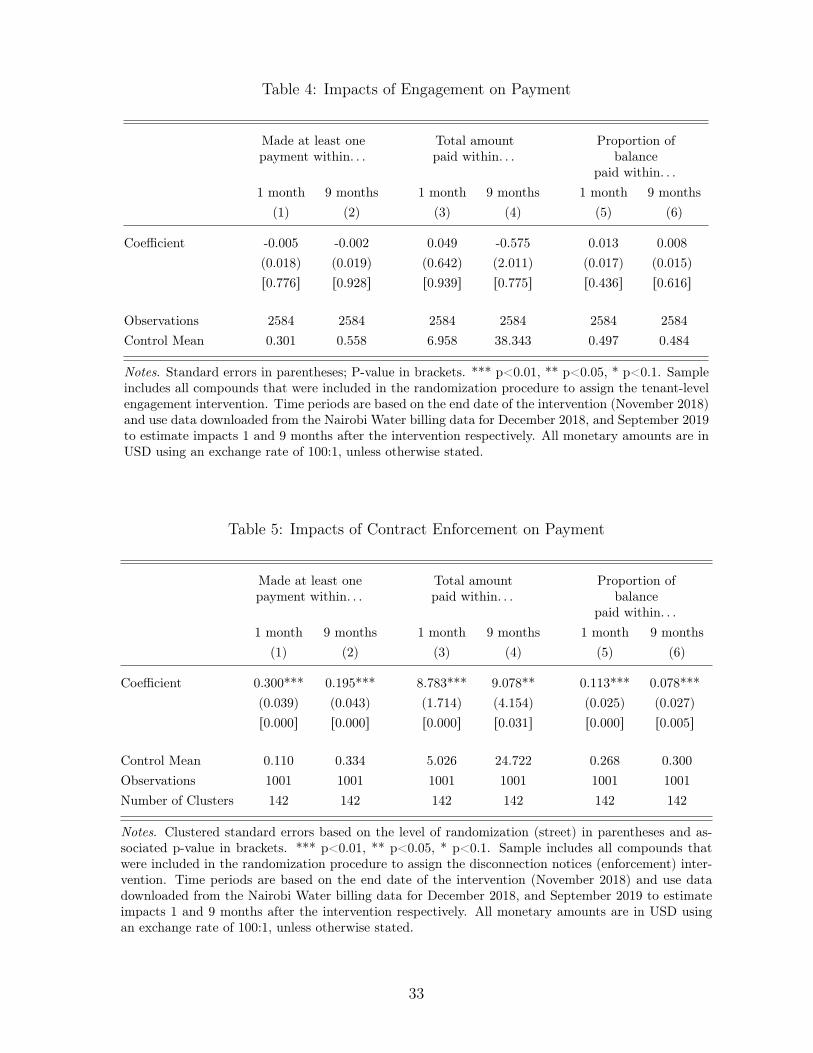
Table 4: Impacts of Engagement on Payment
Made at least onepayment within. . .
Total amountpaid within. . .
Proportion ofbalance
paid within. . .1 month 9 months 1 month 9 months 1 month 9 months
(1) (2) (3) (4) (5) (6)
Coefficient -0.005(0.018)r0.776s
-0.002(0.019)r0.928s
0.049(0.642)r0.939s
-0.575(2.011)r0.775s
0.013(0.017)r0.436s
0.008(0.015)r0.616s
Observations 2584 2584 2584 2584 2584 2584Control Mean 0.301 0.558 6.958 38.343 0.497 0.484
Notes. Standard errors in parentheses; P-value in brackets. *** p<0.01, ** p<0.05, * p<0.1. Sampleincludes all compounds that were included in the randomization procedure to assign the tenant-levelengagement intervention. Time periods are based on the end date of the intervention (November 2018)and use data downloaded from the Nairobi Water billing data for December 2018, and September 2019to estimate impacts 1 and 9 months after the intervention respectively. All monetary amounts are inUSD using an exchange rate of 100:1, unless otherwise stated.
Table 5: Impacts of Contract Enforcement on Payment
Made at least onepayment within. . .
Total amountpaid within. . .
Proportion ofbalance
paid within. . .1 month 9 months 1 month 9 months 1 month 9 months
(1) (2) (3) (4) (5) (6)
Coefficient 0.300***(0.039)r0.000s
0.195***(0.043)r0.000s
8.783***(1.714)r0.000s
9.078**(4.154)r0.031s
0.113***(0.025)r0.000s
0.078***(0.027)r0.005s
Control Mean 0.110 0.334 5.026 24.722 0.268 0.300Observations 1001 1001 1001 1001 1001 1001Number of Clusters 142 142 142 142 142 142
Notes. Clustered standard errors based on the level of randomization (street) in parentheses and as-sociated p-value in brackets. *** p<0.01, ** p<0.05, * p<0.1. Sample includes all compounds thatwere included in the randomization procedure to assign the disconnection notices (enforcement) inter-vention. Time periods are based on the end date of the intervention (November 2018) and use datadownloaded from the Nairobi Water billing data for December 2018, and September 2019 to estimateimpacts 1 and 9 months after the intervention respectively. All monetary amounts are in USD usingan exchange rate of 100:1, unless otherwise stated.
33

Table 6: Spillovers from Contract Enforcement
Made at least onepayment within. . .
Total amountpaid within. . .
Proportion ofbalance
paid within. . .1 month 9 months 1 month 9 months 1 month 9 months
(1) (2) (3) (4) (5) (6)
Panel A: Spillovers on compounds eligible for disconnection
Coefficient 0.010(0.023)r0.681s
-0.020(0.039)r0.610s
-0.424(1.353)r0.754s
-1.721(3.924)r0.662s
0.019(0.025)r0.449s
0.008(0.027)r0.760s
Control Mean 0.110 0.334 5.026 24.722 0.268 0.300Observations 996 996 996 996 996 996Number of Clusters 144 144 144 144 144 144
Panel B: Spillovers on compounds not eligible for disconnection
Coefficient -0.015(0.023)r0.507s
-0.009(0.029)r0.752s
-0.340(0.723)r0.639s
0.303(3.617)r0.933s
-0.002(0.025)r0.924s
0.006(0.026)r0.815s
Control Mean 0.409 0.734 8.544 51.156 0.722 0.655Observations 1930 1930 1930 1930 1930 1930Number of Clusters 143 143 143 143 143 143
Notes. Clustered standard errors based on the level of randomization (street) in parentheses and associatedp-value in brackets. *** p<0.01, ** p<0.05, * p<0.1. Panel A includes all compounds that were eligi-ble for the enforcement intervention. The comparison is between compounds assigned to the control groupin treatment clusters with all disconnection-eligible compounds residing in control clusters. Panel B in-cludes all compounds that were not eligible for the disconnection intervention. The comparison is betweendisconnection-ineligible compounds in treatment clusters with all disconnection-ineligible compounds resid-ing in control clusters. Time periods are benchmarked on the end date of the intervention (November 2018)and use data downloaded from the Nairobi Water billing data for December 2018 and September 2019 to es-timate impacts 1 and 9 months after the intervention respectively. All monetary amounts are in USD usingan exchange rate of 100:1, unless otherwise stated.
34

Table 7: Effect of Contract Enforcement on Owner and Tenant Outcomes
N Controlmean
Treatmentcoefficient
Standarderror p-value
(1) (2) (3) (4) (5)
Water and Sanitation AccessCompound has a piped water connection 600 0.916 -0.036 0.024 0.135Main toilet facility is a pour-flush system in the compound 608 0.942 -0.014 0.019 0.471Compound has a working piped water connection 591 0.573 -0.033 0.041 0.423Main source of water is piped water to compound 589 0.306 0.040 0.037 0.286Piped water consumption (meter reading) 474 169.554 2.583 20.684 0.901Amount household spent on water for all uses last month (US$) 334 6.617 0.664 1.005 0.509Time spent fetching water in a week [1] 601 118.187 -17.569 21.682 0.418Somewhat or very satisfied with main water source 608 0.443 0.004 0.040 0.924Property ownerIndex: Perceptions of service delivery fairness 570 -0.000 0.070 0.084 0.404Index: Perceptions of service delivery quality 589 0.000 -0.016 0.079 0.840Index: Relationship with tenants 371 -0.000 -0.043 0.105 0.680TenantIndex: Perceptions of service delivery fairness 357 0.000 0.030 0.107 0.779Index: Perceptions of service delivery quality 402 0.000 0.086 0.101 0.395Index: Psychological well-being 403 0.000 0.139 0.105 0.186Index: Community activism 403 0.000 -0.084 0.101 0.411Relationship with property owner (scale of 1 to 10) 403 8.266 0.232 0.241 0.337
Notes. *** p<0.01, ** p<0.05, * p<0.1. Sample includes all compounds that were included in the follow up survey: controland treatment compounds in enforcement-treatment clusters. Property owner and compound water outcomes are from theproperty owner survey. Tenant outcomes are from the tenant survey. Indices are computed following Anderson (2008), nor-malized by the control group. All monetary amounts are in USD using an exchange rate of 100:1, unless otherwise stated.[1] In minutes.
35
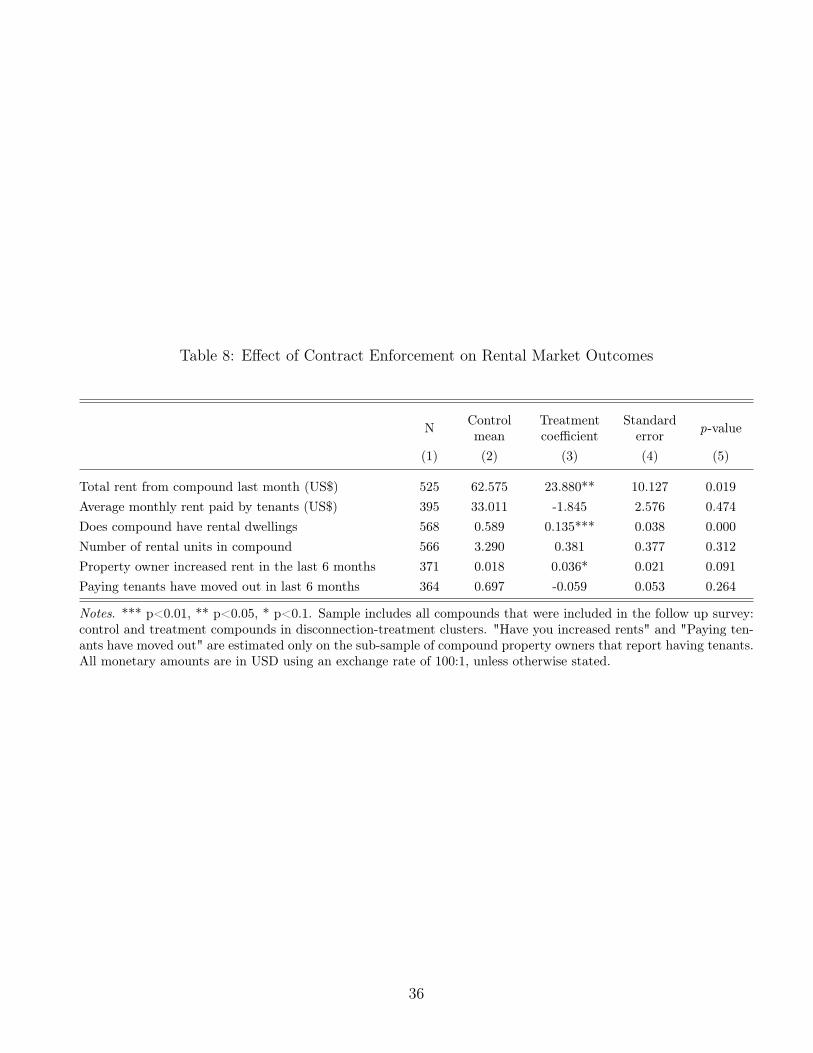
Table 8: Effect of Contract Enforcement on Rental Market Outcomes
N Controlmean
Treatmentcoefficient
Standarderror p-value
(1) (2) (3) (4) (5)
Total rent from compound last month (US$) 525 62.575 23.880** 10.127 0.019Average monthly rent paid by tenants (US$) 395 33.011 -1.845 2.576 0.474Does compound have rental dwellings 568 0.589 0.135*** 0.038 0.000Number of rental units in compound 566 3.290 0.381 0.377 0.312Property owner increased rent in the last 6 months 371 0.018 0.036* 0.021 0.091Paying tenants have moved out in last 6 months 364 0.697 -0.059 0.053 0.264
Notes. *** p<0.01, ** p<0.05, * p<0.1. Sample includes all compounds that were included in the follow up survey:control and treatment compounds in disconnection-treatment clusters. "Have you increased rents" and "Paying ten-ants have moved out" are estimated only on the sub-sample of compound property owners that report having tenants.All monetary amounts are in USD using an exchange rate of 100:1, unless otherwise stated.
36

Appendix
A Ethical considerations
A.1 Project timeline, evolution, and question selection process
The project originated in 2012 where government partners gathered at an impact evalua-tion workshop in Kenya to discuss how to provide evaluation support to water and sanitationinvestments in Nairobi. At the time, the government partners and operations team deter-mined that last mile connections were the most pressing concern that the impact evaluationcould support. Large investments in trunk infrastructure were being made, but the house-hold connection costs to water and sewer lines could cost over $1,000 – significantly morethan anticipated willingness/ability to pay.
The project aimed at reducing last mile connection costs in Nairobi’s informal settlementby offering subsidies to property owners for part of the connection costs and a loan for therest. Property owners would then be required to repay the loan through their monthly waterbills at $4.50 per month for the sanitation upgrade and $1.50 per month for the water connec-tion. The water connection provided a single piped water tap to a compound. The sanitationinvestment upgraded existing latrines, providing a water tank, wash basin and a pour-flushtoilet system connected to the sewer line (where previously compounds typically had a pitlatrine). This investment in the physical upgrading of the actual compound went beyond thescope of a typical connection and included infrastructure retrofitting/improvements. Cus-tomers would then sign an agreement with the utility that they understood that serviceswould be disconnected in the event of non-payment.
The subsidy was made possible through a World Bank grant and the ability to amortizethe remaining upfront connection costs was made possible through a commercial loan thatthe utility was able to use to then on-lend to customers. The commercial loan was securedon the basis that customers would repay their loan and service charges. The piped waterand sanitation expansion under consideration in the study would not have taken place with-out this assumption and associated loan/grant since public funds were not available for thisinvestment.
The original design was developed in 2013 and focused on estimating price elasticity ofdemand for sanitation take up and received IRB approval in December 2013. The trial wasregistered later in the AEA trial registry and planned to provide randomly offered top-upsubsidies beyond the base project subsidy as a way to estimate demand elasticities.
From 2014 – 2016 the research team worked with the utility sociologists responsible for
37

community engagement to begin sensitization in the study communities and begin collectingbaseline data for the project.
By 2016, using baseline data from the impact evaluation, the overall project was revised,and additional funding was provided to the project to ensure it would be able to provide anoffering to customers in line with, or below, their existing water and sanitation expenses.
By 2018, through tracking applications and connections, the research team found that therevised base subsidy was enough to reach high coverage rates (90%). This project was thussuccessful in significantly increasing water and sanitation services to an estimated 137,000people in informal settlements, but this high base take up rate also meant that the originalproposed research design was no longer an option – randomizing top-up subsidies on sucha high base connection rate would not have the statistical power to draw conclusions aboutdemand for sanitation.
At the same time as customers were being connected, the utility found that many cus-tomers were not repaying their loan or service charges despite the fact that service chargesrepresented approximately 1.1% of landlord monthly income, significantly below the 3%threshold for affordability determined by the United Nations. Since sustainability (proxiedthrough customer repayment levels) was a key measure of program success, the utility lookedto understand how to effectively increase revenue collection efficiency. This was importantbecause the use of a commercial loan had the opportunity to unlock demand and expandservices to informal settlements within the context of stretched public funds but could onlybe a viable and replicable model if customers repaid their commitments.
Since the research team had already collected significant primary data in the projectareas, the project team requested the research team to participate in a series of workshopsin May and June 2018 that included World Bank project staff, the utility and communityengagement officers.
All the existing utility efforts to improve repayment behavior were discussed: (i) infor-mation campaigns to improve knowledge and use of the “jisomee mita” payment system; (ii)community barazas; (iii) pre-paid meter installation; (iv) SMS reminders; (v) meter readingsfollowed by payment requests; (vi) warnings and follow up disconnections in case of contin-uous non-payment; and (vii) guidance on financial arrangements / planning that could helpcustomers repay over time.
The utility rolled out the interventions that were deemed unambiguously useful like ji-somee mita training, reminders, and meter readings, and dismissed the use of pre-paid metersin this setting because of their previous experiences finding them to be difficult to main-tain and costly to deploy. Guidance on alternative financial arrangements for customerswas originally considered to be tested, however it was ultimately decided that anybody that
38
needed this support / guidance in developing alternative payment strategies would receive it,rather than limiting access experimentally. Improving service supply reliability and tacklingcartelization were important considerations within the broader dialog of ensuring sustainablewater and sanitation provision. While exploring the question “does improved service relia-bility improve repayment behavior?” would be an important policy contribution, this wasnot viable in the project setting given the network structure of the infrastructure. It would,however, be an important potential area of future research. The discussion concluded thatthe team would prioritize impact evaluation questions around the benefits and costs of thedisconnection policy because of the unknown impacts – both for the utility and its customers.The impact evaluation would also look into alternative approaches to community outreachthat had yet to be attempted.
The engagement intervention design started by assessing the existing utility outreachefforts and combined this with an assessment of the data and literature of what may bemissing in this existing outreach – specifically incorporating the tenant-landlord relationshipinto the outreach efforts as a way to strengthen bottom-up accountability.
Once the utility had settled on the interventions to be tested, the research team followedprocedures to obtain new local and international IRB approvals and a local research permitin July/August 2018. Details of the ethical considerations are described in the followingsection. The study interventions took place between September and November 2018.
A.2 Transparency and ethics
The study originally received a research permit from the Kenyan National Commissionfor Science, Technology and Innovation (NACOSTI) in 2014 as well as international ethi-cal clearance from Innovations for Poverty Action International Review Board in December2013 for the subsidy experiment. Additional local IRB approval was received from MasenoUniversity in 2015, prior to the baseline landlord and tenant surveys. The IRB proposalswere amended in 2018 to include the repayment experiments, which were approved prior tostudy commencement, through Maseno and IPA IRBs and NACOSTI. The overall design,interventions, primary and secondary outcomes, and power calculations for both the subsidyand repayment experiments were published in the American Economic Association RCTregistry (AEARCTR-0002063 and AEARCTR-0003556).
The Belmont Report (1979) ethical principles of respect for persons, beneficence and jus-tice were designed to guide clinical and behavioral research. Recent literature has identifiedthe tradeoffs with transposing the application of these principles directly from clinical work
39

to field experiments (Glennerster and Powers, 2016; Humphreys, 2015; MacKay, 2020) andoffered practical guidance on how to assess and communicate the ethical considerations of astudy more comprehensively (Asiedu et al., 2021; Evans, 2021). We find this to be a usefulstarting point to frame the ethical considerations of this research and describe how eachprinciple guided the research process before discussing the ethical considerations of random-ization of government policies.
Respect for persons: The primary approach to respecting participants during researchis to ensure they have autonomy over their participation wherever possible. While this isnot always possible (Humphreys, 2015) or necessarily always the best approach to respect-ing participant autonomy (MacKay and Chakrabarti, 2018), it does provide an importantstarting point for following the guiding principle of respect for persons. All collection ofprimary survey data used in this research required consent from households – both landlordsand tenants - after describing the broad research objectives, data storage and confidentialityprocedures and possible risks and benefits. Only participants that agreed to participate inthe research are included in any of the primary data analysis for the study.
Administrative billing data from the utility includes a broader set of people than thosewhere primary data were collected. To respect customers that did not participate in anyprimary data collection, but were included in billing analysis, no identifiable administrativedata is presented in any analysis, in accordance with the utility agreement. Participants alsoconsented to the two interventions included in this study. In the engagement intervention,tenants were offered the opportunity to refuse the intervention prior to its delivery, and inpractice this happened in only 2 of 893 cases. For the enforcement intervention, all customersagreed to the terms and conditions of receiving utility infrastructure upgrades of a toilet,water point, wash basin and water tank at the time of becoming a customer, which includedthe utility’s disconnection policy in case of nonpayment of the infrastructure loan and servicecharges in the form of a written contract.
Beneficence: While assessing ethical questions relating to RCTs, (Deaton, 2020) makesclear: “Beneficence is one of the basic requirements of experimentation on human subjects.”.In practice, this does not mean ensuring improvement for all individuals in the study, whichwould make most field (and clinical) research impossible, but rather that risks are mini-mized, and the benefits of the research outweigh these risks (Glennerster and Powers, 2016).A thorough assessment of potential risks and benefits is critically important for studies thatmay pose important risks for certain individuals in order to benefit the broader community –a common challenge for all compliance-related interventions (de Andrade et al., 2016; Brock-meyer et al., 2019).
For the enforcement intervention, the study minimizes risk to participants in the following
40
ways: (i) the work was conducted in a setting where access to communal water sources wasavailable, ensuring that people had access to water regardless of having an individual pipedwater service; (ii) we implement a stricter set of conditions for applying the disconnectionnotices than the existing policy uses, which reduces disconnection-eligible customers from82% to 41% and improves targeting on observables; (iii) we explicitly exclude customers incontrol clusters and control customers within treatment clusters from being exposed to theenforcement intervention, which reduces the disconnection-eligible sample further to 9.2%;and (iv) among the disconnection eligible sample, we employ a rigorous process of contactand awareness creation to help customers avoid disconnection, which included 5 contactswith landlords to provide warning, guidance on how to pay, and the opportunity for cus-tomers to appeal to ensure that those unable to pay for hardship reasons would not bedisconnected. Tenants also received notification and feedback in this process when notifi-cations were provided at the compounds 2 weeks prior to any enforcement. This effort tominimize the disconnection risk for customers ultimately resulted in 2.9% of customers inthe study sample being disconnected. Although the study unambiguously reduced risk tocustomers for being disconnected when compared to the prevailing policy, another importantquestion is whether the study reduced risk to customers compared to actual implementationof the policy at the time. Here we rely on information from non-study areas collected duringthe same time (October 2018) as part of a meter reading exercise. Two settlements wereoriginally planned to participate in the study but were excluded for logistical reasons. Inthese settlements, based on the meter reading exercise, we observe 8% of 1,384 compoundsvisited were found to be disconnected at the time of the reading, providing a counterfactualassessment of the potential disconnection rate absent the study, and consistent with the util-ity’s plans to implement enforcement as the sanitation expansion program neared an end asa way to improve financial sustainability and use the model to illustrate how services couldbe further expanded.
We now turn to the potential benefits. While disconnection policies are applied by util-ities all around the world to varying degrees, no experimental evidence exists on whetherthe benefits of more financially sustainable services are outweighed by the potential costs,and what may be effective strategies for reducing risks/costs. Given the multiple potentialoutcomes affected – for the utility, customer and residents – it is not feasible to determinethe implications of the policy without rigorous evidence. The study helps directly answer3 questions important for balancing the risks and benefits of utility policies: First, can al-ternative interventions that do not require enforcement yield positive changes in repaymentbehavior? This would help utilities direct efforts towards more effective and less costly in-terventions. Second, can targeted enforcement improve repayment behavior of non-enforced
41
customers? This would help utilities understand how to minimize risk through effective tar-geting. And finally, what are the actual costs and benefits of enforcing repayment? Whilequasi-experimental evidence may help to estimate the potential repayment benefits, it isunlikely that this would generate robust evidence on other impacts that customers and res-idents may face given the selection process inherent in the intervention. Thus, the studywas designed to generate evidence that could help expand sustainable water and sanitationservices while minimizing the risk associated with policies designed to facilitate financialsustainability of these services.
Justice: The third guiding principle for ethical research is ensuring fair distributionof the risks and benefits of the research. An important concern in the burgeoning field ofdevelopment economics experiments is the link between the evidence being generated andthe study group used to conduct the research. This becomes a concern especially when theresearch is designed to test specific academic questions or theories, and the sample usedto conduct the research is used for convenience purposes, rather than because the studygroup will be beneficiaries of the research. From a justice perspective, this may result inthe study population bearing all the risks of the research, with the benefits accrued else-where, effectively instrumentalizing study participants (Belmont Report, 1979; Baele, 2013;Deaton, 2020). This particular research explores the impacts of existing policies applied tothose living in the study area and the primary goal of the work was to support the utilityand improve the functioning of the water and sanitation investments in order to providemore accessible and reliable services to the communities included in the research. While theresearch conducted here has broader application to other settings, the reason for conduct-ing the research in the specific study area was to learn about how to support the ongoinginvestments in these communities.
To ensure fair burden sharing, the study interventions only included compounds thatwere eligible for disconnection based on their arrears and ensured that there was a processfor which customers that were not able to pay charges due to extenuating circumstanceswere provided the contact information and could engage with the utility to agree to flexiblerepayment options over time. Since tenants would also be directly affected by the interven-tions, the following protections were put in place: tenants were provided (i) prior warningthrough written notices at their property; (ii) guidance on how they could pay charges di-rectly if needed; and (iii) contact details of the utility for any required follow up. In addition,the study was conducted in locations where utility-provided and private water services wereavailable through kiosks and other vendors across the informal settlements so that house-holds would have access to alternative water sources – those used by the majority of informalsettlement dwellers, given the limited coverage of private piped services. This is consistent
42
with the objective of Kenya’s Water Services Regulatory Board (WASREB) and the 2016Water Act to provide communal water access, while ensuring a “balance of social, commer-cial, and ecological interests” in revenue collection as a means to promote the government’s2030 goal of universal access to water and sanitation services enshrined in Kenya’s Consti-tution (WASREB, 2016).
Randomization of government policies: A final ethical concern is conducting re-search on potentially sub-optimal government interventions. If there are known policies thatare better and can be provided by the government, then testing inferior policies would beunethical in many cases (MacKay, 2020). For this particular setting we see that (i) provid-ing water and sanitation services without requiring repayment is not a sustainable policyoption – public funds do not allow for this, and participants were only able to access the ser-vices because commercial funding was unlocked on the basis of the utility attaining revenuethrough service charges and loan repayments; and (ii) there was genuine ex ante equipoise22
regarding the costs and benefits of the different interventions tested, given the wide range ofoutcomes and stakeholders that could be affected in different ways. Alternative interventionsto improve revenue collection efficiency exist – the most similar in nature being the deploy-ment of pre-paid meters. However, this was not considered a viable option by the utility inthis context, presents similar ethical concerns around equitable treatment to customers, andthere is no existing evidence to suggest this would be a superior approach. It is within thiscontext, and with the understanding that the government was working towards the ultimategoal of expanding services to improve lives, that the study was conducted.
The work tackles a sensitive, but important topic that makes it crucial that all ethicalconcerns are thoroughly considered when undertaking the research. The work was guidedby these concerns and principles by: making a concerted effort to minimize potential risk,building in a framework for respecting participants while still maintaining the credibility ofthe research, and ensuring that the work was undertaken with the utility and in the com-munities who would be the direct primary beneficiaries of the evidence generated from theresearch.
22Equipoise refers to the genuine uncertainty about the relative merits of each arm in a study trial
43
References
Asiedu, E., D. Karlan, M. P. Lambon-Quayefio, and C. R. Udry (2021). A call for structuredethics appendices in social science papers. Technical report, National Bureau of EconomicResearch.
Baele, S. (2013). The ethics of new development economics: Is the experimental approachto development economics morally wrong? Journal of Philosophical Economics 7 (1).
Belmont Report (1979). The belmont report: Ethical principles and guidelines for theprotection of human subjects of research. Technical Report DHEW Publication No.(OS)78–0013.
Brockmeyer, A., S. Smith, M. Hernandez, and S. Kettle (2019). Casting a wider tax net: Ex-perimental evidence from costa rica. American Economic Journal: Economic Policy 11 (3),55–87.
de Andrade, G. H., M. Bruhn, and D. McKenzie (2016, 10). A Helping Hand or the LongArm of the Law? Experimental Evidence on What Governments Can Do to FormalizeFirms. The World Bank Economic Review 30 (1), 24–54.
Deaton, A. (2020, July). Randomization in the tropics revisited: a theme and eleven varia-tions. Working Paper 27600, National Bureau of Economic Research.
Evans, D. K. (2021). Towards improved and more transparent ethics in randomised controlledtrials in development social science. Technical report, Center for Global Development.
Glennerster, R. and S. Powers (2016). Balancing risk and benefit: ethical tradeoffs in runningrandomized evaluations. Oxford: Oxford University Press.
Humphreys, M. (2015). Reflections on the ethics of social experimentation. Globalizationand Development 6 (1), 87–112.
MacKay, D. (2020). Government policy experiments and the ethics of randomization. Phi-losophy & Public Affairs 48 (4), 319–352.
MacKay, D. and A. Chakrabarti (2018). Government Policy Experiments and InformedConsent. Public Health Ethics 12 (2), 188–201.
WASREB (2016). Tariff guidelines.
44
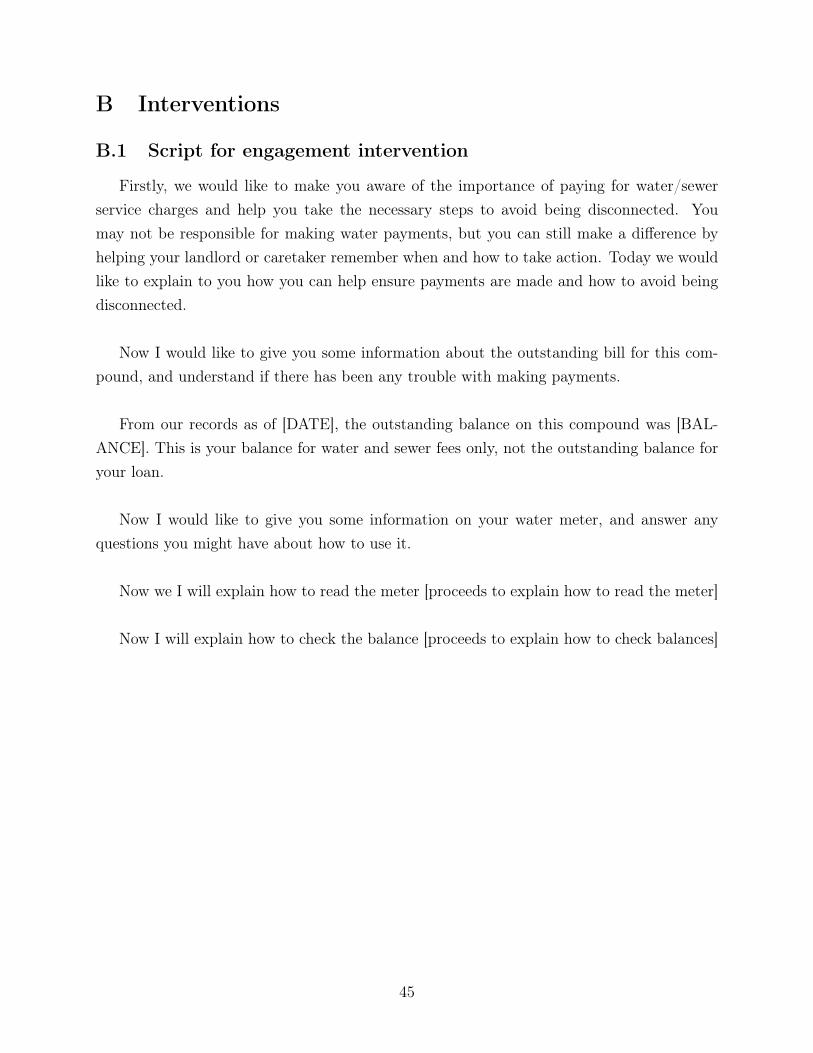
B Interventions
B.1 Script for engagement intervention
Firstly, we would like to make you aware of the importance of paying for water/sewerservice charges and help you take the necessary steps to avoid being disconnected. Youmay not be responsible for making water payments, but you can still make a difference byhelping your landlord or caretaker remember when and how to take action. Today we wouldlike to explain to you how you can help ensure payments are made and how to avoid beingdisconnected.
Now I would like to give you some information about the outstanding bill for this com-pound, and understand if there has been any trouble with making payments.
From our records as of [DATE], the outstanding balance on this compound was [BAL-ANCE]. This is your balance for water and sewer fees only, not the outstanding balance foryour loan.
Now I would like to give you some information on your water meter, and answer anyquestions you might have about how to use it.
Now we I will explain how to read the meter [proceeds to explain how to read the meter]
Now I will explain how to check the balance [proceeds to explain how to check balances]
45
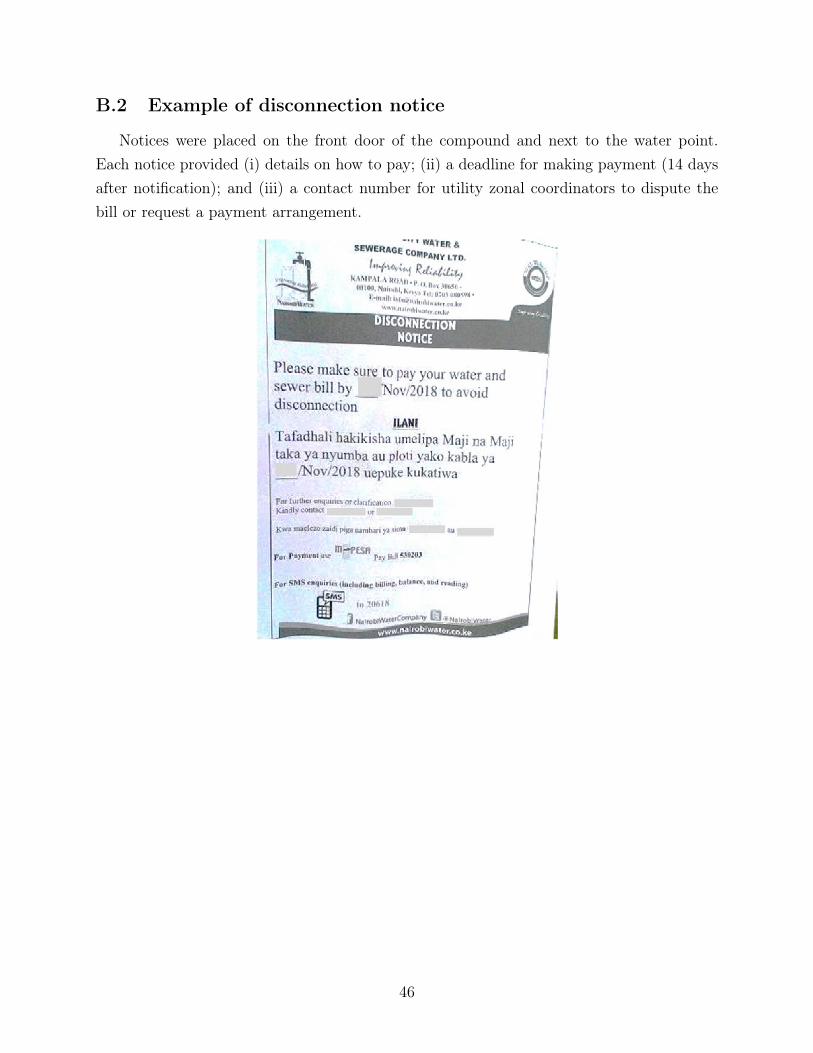
B.2 Example of disconnection notice
Notices were placed on the front door of the compound and next to the water point.Each notice provided (i) details on how to pay; (ii) a deadline for making payment (14 daysafter notification); and (iii) a contact number for utility zonal coordinators to dispute thebill or request a payment arrangement.
46
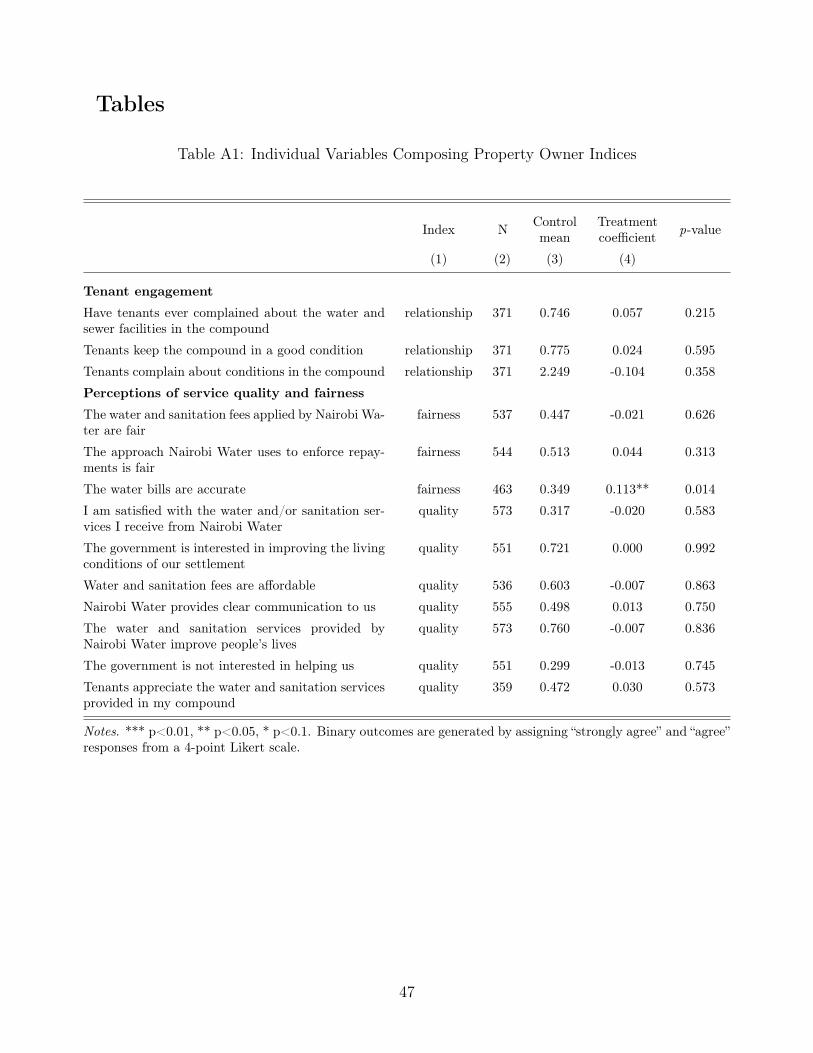
Tables
Table A1: Individual Variables Composing Property Owner Indices
Index N Controlmean
Treatmentcoefficient p-value
(1) (2) (3) (4)
Tenant engagement
Have tenants ever complained about the water andsewer facilities in the compound
relationship 371 0.746 0.057 0.215
Tenants keep the compound in a good condition relationship 371 0.775 0.024 0.595
Tenants complain about conditions in the compound relationship 371 2.249 -0.104 0.358
Perceptions of service quality and fairness
The water and sanitation fees applied by Nairobi Wa-ter are fair
fairness 537 0.447 -0.021 0.626
The approach Nairobi Water uses to enforce repay-ments is fair
fairness 544 0.513 0.044 0.313
The water bills are accurate fairness 463 0.349 0.113** 0.014
I am satisfied with the water and/or sanitation ser-vices I receive from Nairobi Water
quality 573 0.317 -0.020 0.583
The government is interested in improving the livingconditions of our settlement
quality 551 0.721 0.000 0.992
Water and sanitation fees are affordable quality 536 0.603 -0.007 0.863
Nairobi Water provides clear communication to us quality 555 0.498 0.013 0.750
The water and sanitation services provided byNairobi Water improve people’s lives
quality 573 0.760 -0.007 0.836
The government is not interested in helping us quality 551 0.299 -0.013 0.745
Tenants appreciate the water and sanitation servicesprovided in my compound
quality 359 0.472 0.030 0.573
Notes. *** p<0.01, ** p<0.05, * p<0.1. Binary outcomes are generated by assigning “strongly agree” and “agree”responses from a 4-point Likert scale.
47

Table A2: Individual Variables Composing Tenant Indices
Index N Controlmean
Treatmentcoefficient p-value
(1) (2) (3) (4)
Political involvement / community engagement
Does your compound have a committee / group respon-sible for dealing with general issues
activism 399 0.070 0.008 0.773
Did you ever approach a leader in this community aboutyour needs or community issues in the past 6 months
activism 403 0.080 -0.017 0.528
Did you attend any community meetings for this com-munity in the last 6 months
activism 403 0.128 -0.025 0.423
Is anyone in your household a member of a communitycommittee
activism 403 0.037 0.013 0.536
Relationship with property owner
On a scale of 1 to 10 where 1 is very poor and 10 isexcellent how would you rate your relationship with theproperty owner
relationship 403 8.266 0.232 0.337
Perceptions of service quality and fairness
The water and sanitation fees applied by Nairobi Waterare fair
fairness 268 0.636 -0.086 0.187
The water bills are accurate fairness 223 0.594 0.035 0.628
The approach Nairobi Water uses to enforce repaymentsis fair
fairness 314 0.628 0.011 0.852
I am satisfied with the water and/or sanitation servicesI receive from Nairobi
quality 388 0.393 0.031 0.560
The government is interested in improving the livingconditions of our settlement
quality 369 0.678 0.015 0.769
Water and sewer fees are affordable quality 269 0.669 -0.034 0.597
Nairobi Water provides clear communication to us quality 297 0.490 0.022 0.728
The water and sanitation services provided by NairobiWater improve people’s lives
quality 377 0.782 -0.014 0.760
The government is not interested in helping us quality 364 0.407 -0.088* 0.091
Tenants appreciate the water and sanitation servicesprovided in my compound
quality 381 0.528 -0.009 0.863
Notes. *** p<0.01, ** p<0.05, * p<0.1. Binary outcomes are generated by assigning “strongly agree” and “agree”responses from a 4-point Likert scale.
48

Table A3: Baseline Balance
Engagement Enforcement
(1) (2) (3) (4) (5) (6) (7) (8)
Control Treatment t-testp-value(2)-(1)
Control Spillover control Treatment t-testp-value(6)-(4)
t-testp-value(6)-(5)N Mean N Mean N Mean N Mean N Mean
Payment dataEver made a payment 1292 0.603 1292 0.616 0.493 322 0.494 674 0.509 327 0.502 0.844 0.907
Years as a customer of the utility 1292 2.137 1292 2.160 0.688 322 2.261 674 2.309 327 2.272 0.926 0.884
Number of unique payments made 1292 5.801 1292 5.362 0.204 322 3.531 674 3.010 327 3.477 0.905 0.436
Total amount paid (USD) 1290 62.791 1289 64.386 0.674 322 49.142 673 40.880 326 48.847 0.967 0.408
Current outstanding balance (USD) 1292 40.317 1289 39.581 0.720 322 62.567 674 61.069 327 59.617 0.526 0.799
Months until first payment 779 0.702 796 0.685 0.591 159 0.644 343 0.683 164 0.673 0.684 0.877
Compound dataCompound has a water connection 1280 0.988 1279 0.991 0.432 316 0.994 653 0.992 314 1.000 0.158 0.020**
Compound has a sewer connection 1273 0.973 1273 0.978 0.372 315 0.959 650 0.978 315 0.965 0.678 0.298
Property owner pays water/sewer bills 1282 0.846 1286 0.838 0.613 316 0.829 658 0.845 316 0.842 0.668 0.908
Compound received water last week 1091 0.478 1070 0.443 0.107 269 0.349 556 0.338 273 0.337 0.761 0.983
Property owner resides in compound 1280 0.554 1282 0.555 0.972 316 0.506 653 0.533 313 0.505 0.969 0.409
Compound has paying tenants 1282 1.000 1286 1.000 . 316 0.639 658 0.634 316 0.712 0.051* 0.033**
Number of paying tenant households 1282 4.245 1286 4.592 0.317 172 4.814 360 4.764 192 4.875 0.888 0.771
Reason bill has never been paid
Lack of money 472 0.146 455 0.114 0.150 142 0.204 300 0.193 143 0.189 0.744 0.913
Owner doesn’t know how to pay 472 0.117 455 0.095 0.276 142 0.148 300 0.093 143 0.133 0.716 0.240
Compound didn’t receive water 472 0.492 455 0.523 0.337 142 0.500 300 0.527 143 0.497 0.953 0.632
Notes. *** p<0.01, ** p<0.05, * p<0.1.. Payment outcomes are derived from the billing data and compound outcomes come from the property owner survey in August2018. Baseline balance comparisons for the engagement intervention use administrative billing data from August 2018 - the data used to draw the original sample for theproperty owner updating survey. Balance tests for the enforcement intervention use October 2018 administrative billing data - the dataset on which the targeted enforce-ment randomization was conducted. P-values for t-test comparisons between the engagement group treatment and control are presented in column (3). Comparison testsbetween the targeted enforcement treatment group and controls within treatment clusters are presented in column (7). Comparisons between the targeted enforcementtreatment group and controls in control clusters are presented in column (8).
49
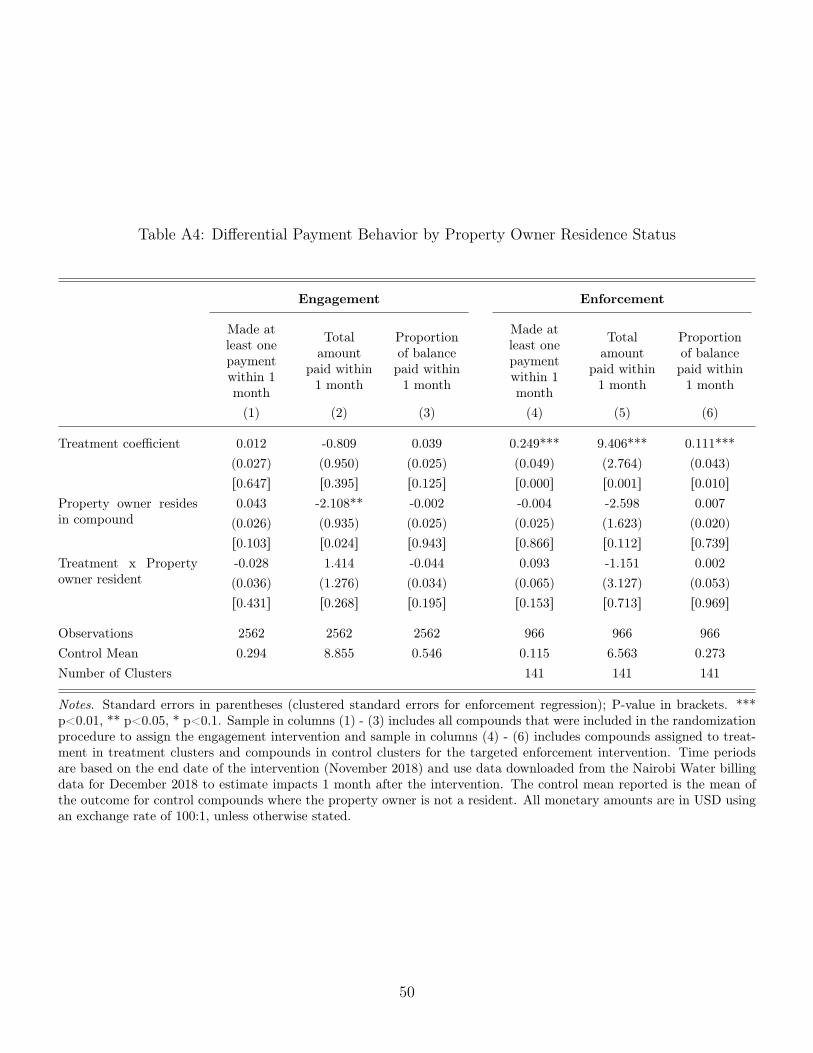
Table A4: Differential Payment Behavior by Property Owner Residence Status
Engagement Enforcement
Made atleast onepaymentwithin 1month
Totalamount
paid within1 month
Proportionof balancepaid within1 month
Made atleast onepaymentwithin 1month
Totalamount
paid within1 month
Proportionof balancepaid within1 month
(1) (2) (3) (4) (5) (6)
Treatment coefficient 0.012(0.027)r0.647s
-0.809(0.950)r0.395s
0.039(0.025)r0.125s
0.249***(0.049)r0.000s
9.406***(2.764)r0.001s
0.111***(0.043)r0.010s
Property owner residesin compound
0.043(0.026)r0.103s
-2.108**(0.935)r0.024s
-0.002(0.025)r0.943s
-0.004(0.025)r0.866s
-2.598(1.623)r0.112s
0.007(0.020)r0.739s
Treatment x Propertyowner resident
-0.028(0.036)r0.431s
1.414(1.276)r0.268s
-0.044(0.034)r0.195s
0.093(0.065)r0.153s
-1.151(3.127)r0.713s
0.002(0.053)r0.969s
Observations 2562 2562 2562 966 966 966Control Mean 0.294 8.855 0.546 0.115 6.563 0.273Number of Clusters 141 141 141
Notes. Standard errors in parentheses (clustered standard errors for enforcement regression); P-value in brackets. ***p<0.01, ** p<0.05, * p<0.1. Sample in columns (1) - (3) includes all compounds that were included in the randomizationprocedure to assign the engagement intervention and sample in columns (4) - (6) includes compounds assigned to treat-ment in treatment clusters and compounds in control clusters for the targeted enforcement intervention. Time periodsare based on the end date of the intervention (November 2018) and use data downloaded from the Nairobi Water billingdata for December 2018 to estimate impacts 1 month after the intervention. The control mean reported is the mean ofthe outcome for control compounds where the property owner is not a resident. All monetary amounts are in USD usingan exchange rate of 100:1, unless otherwise stated.
50

Table A5: Differential Payment Behavior by Property Owner Payments Prior to Treatment
Engagement Enforcement
Made atleast onepaymentwithin 1month
Totalamount
paid within1 month
Proportionof balancepaid within1 month
Made atleast onepaymentwithin 1month
Totalamount
paid within1 month
Proportionof balancepaid within1 month
(1) (2) (3) (4) (5) (6)
Treatment coefficient 0.004(0.027)r0.884s
0.546(1.023)r0.593s
-0.002(0.023)r0.928s
0.256***(0.053)r0.000s
6.381***(2.312)r0.007s
0.134***(0.037)r0.000s
Owner has ever madepayment
0.276***(0.026)r0.000s
4.295***(0.971)r0.000s
0.497***(0.022)r0.000s
0.049(0.032)r0.130s
0.760(1.407)r0.590s
0.383***(0.026)r0.000s
Treatment x Owner evermade payment
-0.020(0.035)r0.563s
-0.895(1.310)r0.495s
0.015(0.029)r0.619s
0.081(0.062)r0.193s
4.608(3.054)r0.134s
-0.066(0.051)r0.197s
Observations 2584 2584 2584 1001 1001 1001Control Mean 0.144 3.833 0.193 0.091 4.698 0.067Number of Clusters 142 142 142
Notes. Standard errors in parentheses (clustered standard errors for enforcement regression); P-value in brackets. ***p<0.01, ** p<0.05, * p<0.1. Sample in columns (1) - (3) includes all compounds that were included in the randomizationprocedure to assign the engagement intervention and sample in columns (4) - (6) includes compounds assigned to treat-ment in treatment clusters and compounds in control clusters for the targeted enforcement intervention. Time periodsare based on the end date of the intervention (November 2018) and use data downloaded from the Nairobi Water billingdata for December 2018 to estimate impacts 1 month after the intervention. The control mean reported is the mean ofthe outcome for control compounds where the property owner is not a resident. All monetary amounts are in USD usingan exchange rate of 100:1, unless otherwise stated.
51
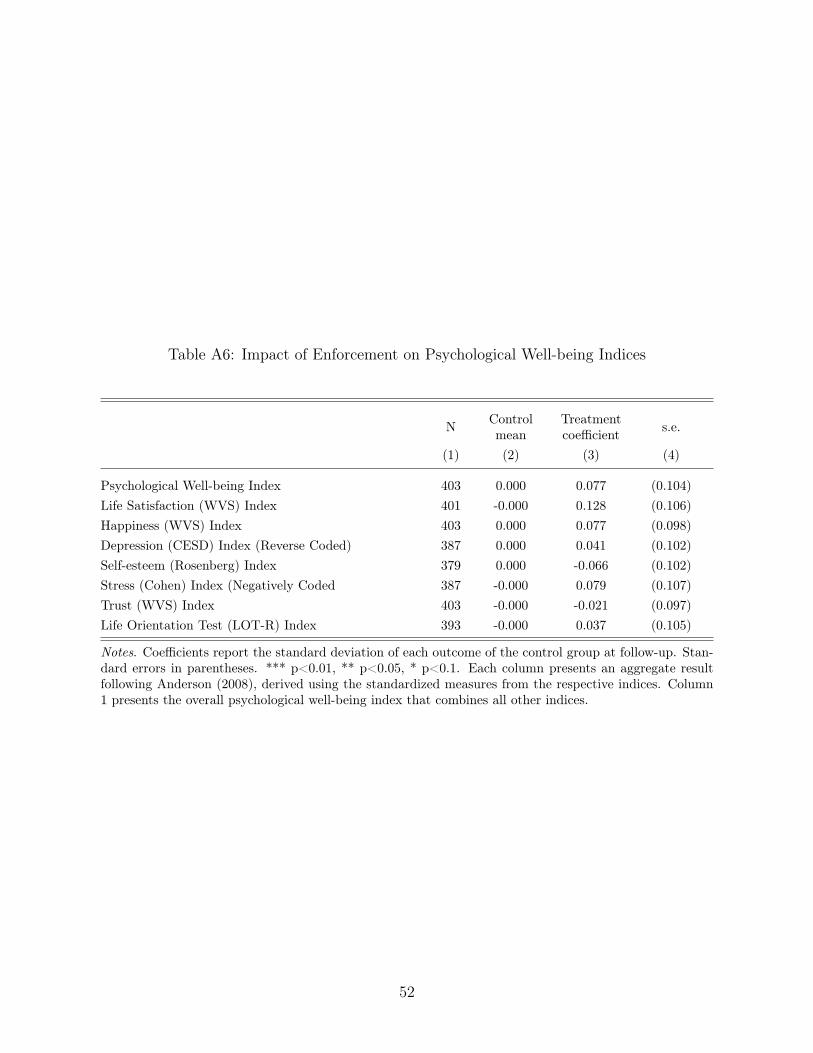
Table A6: Impact of Enforcement on Psychological Well-being Indices
N Controlmean
Treatmentcoefficient s.e.
(1) (2) (3) (4)
Psychological Well-being Index 403 0.000 0.077 (0.104)Life Satisfaction (WVS) Index 401 -0.000 0.128 (0.106)Happiness (WVS) Index 403 0.000 0.077 (0.098)Depression (CESD) Index (Reverse Coded) 387 0.000 0.041 (0.102)Self-esteem (Rosenberg) Index 379 0.000 -0.066 (0.102)Stress (Cohen) Index (Negatively Coded 387 -0.000 0.079 (0.107)Trust (WVS) Index 403 -0.000 -0.021 (0.097)Life Orientation Test (LOT-R) Index 393 -0.000 0.037 (0.105)
Notes. Coefficients report the standard deviation of each outcome of the control group at follow-up. Stan-dard errors in parentheses. *** p<0.01, ** p<0.05, * p<0.1. Each column presents an aggregate resultfollowing Anderson (2008), derived using the standardized measures from the respective indices. Column1 presents the overall psychological well-being index that combines all other indices.
52