Financing Decentralized Education in Macedonia
49
Financing Decentralized Education in Macedonia Review of the national allocation system Report written for MLGA/USAID in Skopje Jan Herczyński Center for Interdisciplinary Modeling ICM, Warsaw University May 2011 Contents: Executive summary ............................................................................................................................. 3 Introduction ......................................................................................................................................... 5 1. Decentralization process in Macedonia from 2005 till today ......................................................... 8 2. Allocation of education grants to Macedonian municipalities ...................................................... 10 2.1. Ordinances with formulas for education grants ..................................................................... 10 2.2. Evolving formulas for education grants................................................................................. 12 2.3. Review of the application of the lump sum and per student amount ..................................... 21 2.4. Review of the application of the buffers ................................................................................ 28 2.5. Equity of the allocation formulas........................................................................................... 31 3. Education grants and education expenditures ............................................................................... 38 4. The limitations of the second phase of education decentralization ............................................... 41 5. Education finance in Macedonia in international perspective....................................................... 43 Conclusions and recommendations ................................................................................................... 46 References ......................................................................................................................................... 49
-
Upload
independent -
Category
Documents
-
view
1 -
download
0
Transcript of Financing Decentralized Education in Macedonia

Financing Decentralized Education in Macedonia
Review of the national allocation system
Report written for MLGA/USAID in Skopje
Jan Herczyński
Center for Interdisciplinary Modeling ICM, Warsaw University
May 2011
Contents: Executive summary ............................................................................................................................. 3 Introduction ......................................................................................................................................... 5 1. Decentralization process in Macedonia from 2005 till today ......................................................... 8 2. Allocation of education grants to Macedonian municipalities ...................................................... 10
2.1. Ordinances with formulas for education grants ..................................................................... 10 2.2. Evolving formulas for education grants ................................................................................. 12 2.3. Review of the application of the lump sum and per student amount ..................................... 21 2.4. Review of the application of the buffers ................................................................................ 28 2.5. Equity of the allocation formulas........................................................................................... 31
3. Education grants and education expenditures ............................................................................... 38 4. The limitations of the second phase of education decentralization ............................................... 41 5. Education finance in Macedonia in international perspective....................................................... 43 Conclusions and recommendations ................................................................................................... 46 References ......................................................................................................................................... 49

Jan Herczyński Financing Decentralized Education in Macedonia
Page 2/49
List of tables: Table 1 Advancement of Macedonian municipalities to the second phase of decentralization ........... 8 Table 2 Ordinances with allocation formulas for education grants .................................................... 10 Table 3 Density groups for categorical grants for primary education (inhabitants per square km) ... 13 Table 4 Number of municipalities and primary school students in different density groups ............. 13 Table 5 Density weights for categorical grants, primary education ................................................... 13 Table 6 Lump sum and per student amount for categorical grants, primary education (MKD) ........ 13 Table 7 Different values of per student amount for categorical grants, primary education (MKD) .. 14 Table 8 Lower and upper buffers for categorical grants, primary education (%) .............................. 15 Table 9 Lower and upper buffers for categorical grants, secondary education (%) ........................... 15 Table 10 Coefficients for categorical grants, secondary education .................................................... 16 Table 11 Lump sum and per student amount for categorical grants, secondary education (MKD) ... 16 Table 12 Density weights for block grants, primary education .......................................................... 17 Table 13 Lump sum and per student amount for block grants, primary education (MKD) ............... 18 Table 14 Lower and upper buffers for block grants, primary education (%) ..................................... 18 Table 15 Lump sum and per student amount for block grants, secondary education (MKD) ........... 19 Table 16 Structural comparison of 4 formulas ................................................................................... 21 Table 17 Students, class sizes and population density in small and large municipalities .................. 22 Table 18 Per student allocation of categorical grants in 2006 and 2011, primary education ............. 23 Table 19 Per class allocation of categorical grants in 2006 and 2011, primary education ................. 24 Table 20 Average per class allocation in 2006 and 2011, categorical grants for primary education . 24 Table 21 Class sizes in small and large municipalities, primary education ....................................... 25 Table 22 Per student allocation of block grants 2008 – 2011, primary education (MKD) ................ 25 Table 23 Contribution from the lump sum in small and large municipalities, primary education ..... 26 Table 24 Per class allocation of block grants 2008 – 2011, primary education (MKD) .................... 26 Table 25 Stipulated buffers for categorical and block grants ............................................................. 30 Table 26 Interference of buffers on allocation of grants for primary education (# of municipalities) 30 Table 27 Number of municipalities which spent less than received in 2010 ..................................... 39 Table 28 Number of municipalities which spent more than received in 2010 ................................... 40 Table 29 Public expenditure on education in Macedonia relative to GDP (%).................................. 44 Table 30 Public expenditure on education in selected OECD countries relative to GDP (%) ........... 44 Table 31 Public expenditure on education in selected transition countries relative to GDP (%) ....... 45 Table 32 Per student expenditure in selected OECD countries relative to GDP per capita (%) ........ 45 Table 33 Relative per student expenditure for secondary education in OECD countries (%) ........... 46
List of graphs: Graph 1 Overview of advancement to the second phase of decentralization (municipalities) ............. 9 Graph 2 Overview of advancement to the second phase of decentralization (students) .................... 10 Graph 3 Evolving values of per student amounts for categorical grants, primary education (MKD) 14 Graph 4 Values of per student amounts for categorical grants (MKD) .............................................. 16 Graph 5 Values of the lump sum for categorical grants (MKD) ........................................................ 17 Graph 6 Upper and lower buffers for categorical and block grants, primary education (%) ............. 18 Graph 7 Values of the per student amount for block grants (MKD) .................................................. 20 Graph 8 Values of the lump sum for block grants (MKD) ................................................................. 20 Graph 9 Per class allocation for large and small municipalities, block grants (MKD) ...................... 27 Graph 10 Class sizes and per student allocation for categorical grants, 2008 .................................... 32 Graph 11 Class sizes and per student allocation for block grants, 2008 ............................................ 33 Graph 12 Population density and class sizes in 2011 ......................................................................... 34 Graph 13 Class sizes and per class allocation for categorical grants, 2008 ....................................... 34 Graph 14 Class sizes and per class allocation for block grants, 2008 ................................................ 35 Graph 15 Class sizes and per student allocation for categorical grants, 2011 .................................... 36 Graph 16 Class sizes and per student allocation for block grants, 2011 ............................................ 36 Graph 17 Class sizes and per class allocation for categorical grants, 2011 ....................................... 37 Graph 18 Class sizes and per class allocation for block grants, 2011 ................................................ 37 Graph 19 Class sizes and local contributions to received grants, 2010 .............................................. 41

Jan Herczyński Financing Decentralized Education in Macedonia
Page 3/49
Executive summary
The present report provides a review of the financing of Macedonian education as the country
comes close to completing the first phase of decentralization. Soon all municipalities will find
themselves in the second phase of decentralization, so the natural question is, what has been
accomplished and what should be the next steps. Is decentralization complete, and if not, what
remains to be done.
A more specific technical question concerns the financing of decentralized education in
Macedonia, and in particular the functioning of per student allocation formulas, in use since
2006. Properly managed and updated, allocation formulas may be a strong policy instrument
of the Government.
The key findings of the report are as follows:
1. The allocation formula does not serve as an effective policy instrument. In particular,
it is adopted in an ordinance long before the Budget Circular Letter defined budget
limits for each sector and before next year’s student numbers are known. Key financial
elements of the formula are not routinely made public. The formula has been changed
only once and few people in Macedonia understand its impact.
2. The preference which the formula gives to small municipalities to support them in
maintaining unavoidably smaller classes is a rational policy of the Ministry. However,
analysis shows that this preference, resulting from simultaneous use of the lump sum
and population density weights, is excessive and hence the allocation is not very
efficient (small municipalities received relatively too much compared to the cities).
3. The use of buffers for allocation of grants to primary education has not been the
subject of public discussion in recent years. It seems that the buffers are used more to
limit the allocation than to provide stability of funding from year to year. Future use of
the buffers should be dependent on their clear and universally accepted function in the
allocation process.
4. The equity of education finance in Macedonia is insufficient. While some small
municipalities are generously supported with increased education grants, others
receive relatively little when assessed on the per class basis.
5. Despite overall significant support to small municipalities, the allocation mechanism
probably forces some of them to make significant local contributions to the received
grants. In other words, lack of equity has real and negative effects on a number of
small municipalities.
6. The entry to the second phase has not been accompanied by an appropriate increase of
managerial powers of local governments. Many legal regulations still reflect the
centralized mindset. Hence even completion of the second phase of decentralization
will not constitute a breakthrough in the financing and management of education. A
third phase is needed, to align financial responsibilities with increased managerial
Jan Herczyński Financing Decentralized Education in Macedonia
Page 4/49
responsibilities.
7. Compared to OECD countries, Macedonian allocation for primary and secondary
education, relative to GDP per capita, is insufficient. A strategy for gradually
increasing this to come closer to OECD average should be prepared by the Ministry.
The findings reported above indicate that the Macedonian Ministry of Education and Science
should review the progress of decentralization, with special emphasis on management and
finance. This should be a public review, with full involvement of all education stakeholders,
in particular of the education Commission of ZELS.
Among the key issues which need to be discussed is the continued support for small schools
in small, sparsely populated municipalities. Our preliminary review shows that in some
municipalities, this support is excessive, while some other municipalities need to make
significant additional contribution to the received education grant. Therefore this policy needs
to be carefully reviewed. In particular, the Ministry needs to assess alternative policies, such
as support to designing and implementing rationalization strategies for school networks. This
policy in turn may only be successful if the Ministry enters into a serious dialogue with the
owners of local school networks, that is with the municipalities. It will be very difficult to
achieve long term efficiency improvement in Macedonian education without constructive
involvement of the municipalities and of their representative, ZELS.
The same dialogue is needed if the Ministry of Education will undertake efforts to consolidate
decentralization reforms and introduce the necessary managerial and institutional framework
to manage decentralized education, in line with the existing fiscal framework. As discussed in
section 4, the managerial powers of municipalities in the second phase of decentralization do
not match their financial responsibilities. Education is a very sensitive sector and all changes
in its management structure need to be discussed with stakeholders before implementation, to
clarify the new roles and responsibilities. The reforms should be implemented cautiously, but
the goals need to be spelt out publicly and the schedule agreed with the municipalities. All
education stakeholders in Macedonia need to understand that education decentralization is a
never ending process, during which there will constantly appear new challenges and new
opportunities.
Finally, the same dialogue is needed if the Ministry adopts a strategy to gradually increase its
allocation for education, in line with OECD practices. The Ministry needs to discuss with the
municipalities how to ensure that the future increases of education spending in Macedonia are
used not only to increase teacher salaries, but will also serve as an instrument to improving
the quality of education.

Jan Herczyński Financing Decentralized Education in Macedonia
Page 5/49
Introduction
Republic of Macedonia has been one of the first of former Yugoslav republics which have
introduced per student financing of education (see Herczyński, Vidanovska, Lacka 2009) as
part of the wider decentralization process in the country. The fiscal decentralization process
was designed by the Ministry of Finance in two phases:
• First phase, during which municipalities became responsible for maintenance of
transferred facilities, but all salaries were still paid by the central government.
• Second phase, during which municipalities were also entrusted with the payment of
staff salaries.
The first phase started for all Macedonian municipalities together on the same data (as we
discuss in section 1, this was on July 1, 2005). However, the Law on Local Government
Finance of 2004 provided for specific conditions for the entry of municipalities into the
second phase (these conditions are reviewed in Levitas, Peteri 2007). Therefore Macedonian
municipalities moved into the second phase in groups at different times (see Table 1 below).
We should stress here that the scheduling of the decentralization process as in Macedonia,
namely transferring first the responsibility for material expenditures and only later for
salaries, although a relatively common approach, is not the only possible. Romania for
example adopted analogous schedule, leading to significant fragmentation of responsibilities
(see Bishoff, Herczyński 2009). On the other hand, Poland transferred both material and
remuneration responsibilities together for each sector, but at different times depending on the
sector. Thus, for example, primary education was decentralized in 1996, while secondary
education only in 1999 (see Levitas, Herczyński 2002). In contrast, Macedonia decentralized
both primary and secondary education at the same time, though in a subtly different way.
Indeed, we have to recall that local governments in Macedonia form a one tier system of 84
municipalities with the exception of the capital, Skopje, where there exist two tiers: ten
municipalities covering the city form the first tier, and the City of Skopje forms the second
tier (with only one local government), also with its elected council and mayor. This structure
has implications for the decentralization process, of course. All municipalities became
responsible for primary schools located on their territory1. However, only municipalities
outside of Skopje took responsibility for secondary schools located there, while in Skopje the
secondary schools have been transferred to the City of Skopje2. Thus in the capital we have a
clear division of education responsibilities: primary schools are owned by municipalities,
secondary schools by the city. This is in fact a very reasonable solution, due to the nature of
catchment areas for primary and secondary schools. While most students will attend the
primary school in their neighborhood, which means typically in the municipality in which
they live (and in which their parents vote), the choice of the secondary school in the city is
quite free thanks to easy communication through public transport. It was therefore natural to
transfer the primary schools to municipalities and the secondary schools to the City of Skopje,
1 This refers to all municipalities which have primary schools located on their territory. Vranestica is a small
municipality with no primary school and its children are served by satellite schools of primary schools located in
neighboring municipalities. Therefore we omit Vranestica from our analysis and proceed as if there were only 83
municipalities in Macedonia. 2 Thus Macedonia has 84 local governments responsible for education: 83 municipalities and the City of Skopje.

Jan Herczyński Financing Decentralized Education in Macedonia
Page 6/49
whose elected officials represent the wider community of the capital, as it allowed to align the
political responsibility with the distribution of the assets3.
We note that City of Skopje moved to the second phase of decentralization on April 1, 2008.
All ten Skopje municipalities are also already in the second phase (see also section 1 below).
The financial flows to support the decentralized sectors in the two phases of decentralization
are called categorical grants and block grants respectively (namenski and blokovi grantovi,
see Levitas 2009). Very clearly, the block grants are much larger than the categorical grants.
This difference is especially significant in education, as teacher salaries constitute very large
proportion of school expenditures. Overall salaries form over 85% of school budgets (see
Herczyński et al 2009), so block grants in education should be about 6 times larger than the
categorical grants.
It is worth stressing here the intended difference between the categorical grants and the block
grants. Categorical grants should provide the municipalities the freedom to efficiently and
effectively manage the material assets of each sector, such as education. No movement of
funds between maintenance and salaries is allowed during the first phase, but the
municipalities have the right to decide how the material assets are used and how basic
maintenance is provided. In contrast, block grants should provide the municipalities the
freedom to efficiently and effectively manage all assets of each sector, including its staff. In
different municipalities, different mixes of salaries and material expenditures may best meet
the local needs, and the sectoral block grants should support these different managerial and
financing strategies.
Nevertheless, both categorical and block grants can be used only for the sector to which they
are allocated. Indeed, a strict treasury system, operated by the Ministry of Finance, ensures
that the use of the funds is consistent with their purpose. The control over the categorical
grants and the block grants exerted through the treasury system is essentially the same.
For the education sector, this scheduling of the decentralization process resulted in the two
phases of decentralization having very different meaning and impact. During the first phase,
Macedonian municipalities became responsible for school buildings and for the school
equipment, for ensuring proper operation of the school facilities and for student transportation
to schools. The single largest expenditure item entrusted to the municipalities was heating.
The first phase also transferred responsibility for managing the school network, that is for
closing and opening of schools and for changing the profiles of secondary schools, although
such decisions still need the approval of the Ministry of Education. The impact of the second
phase of decentralization on the management of education is discussed in section 4 below.
The transfer of ownership of decentralized facilities, including the land, buildings and the
associated equipment, was an independent process which required clarification of the status of
ownership before this could be transferred to municipalities. The key here was the state of
cadaster registries of land use and ownership. All partners in Macedonia agreed that the
ownership of facilities should be transferred to municipalities as part of the decentralization
process. Although in principle non-controversial, this proved to be a difficult process, because
during the years of centralization the necessary cadaster records were not updated properly.
The responsibility for clarification of the cadaster registries fell on the Ministry of Finance,
3 However, see URC 2007 for a review of conflicts arising between Skopje municipalities and the City of Skopje
in other decentralized sectors.

Jan Herczyński Financing Decentralized Education in Macedonia
Page 7/49
which had little institutional interest in rushing this process through (unlike the municipalities,
which are the beneficiaries of the ownership transfer). Therefore this second process took
much longer and is largely, though not yet fully completed today.
In the education sector, the transfer of ownership was particularly difficult. For many schools,
the ownership was either unclear or the registered ownership was very different from the
actual one. Often, the donation or purchase of the land parcel for the education purposes was
not documented properly. In many cases, the school buildings either did not have the building
permits, or did not have proper architectural documentation, or after construction was
completed they were not approved for use, or finally since construction they had been so
extensively modified that the use permit became legally invalid. The missing or incorrect
documents in many cases referred to period long before the independence of Macedonia
(more than 20 years ago). The clarification of the status of all facilities was an arduous and
time consuming process (see Herczyński 2007), and is still not complete.
Due to the staggered schedule of education decentralization, the allocation of funds for
decentralized education functions is a complicated issue. As there are two separate laws for
primary and secondary education, these two are considered different sectors and require
separate formulas. Moreover the continuous presence of some municipalities in the first phase
requires separate allocation formulas for categorical grants and for block grants. Thus each
year Macedonia requires four allocation formulas (the only exception was the first two years,
when there were still no municipalities in the second phase, but a separate formula was
required for allocation of funds for student transportation). Ministry of Education is
responsible for adopting the allocation formulas, making sure that the total pool of funds is
consistent with the limits approved by the Ministry of Finance and contained in the yearly
budget laws. There is no doubt that simultaneous development of four separate formulas
under such strong constrains requires from the Ministry of Education sound technical
expertise and good negotiations skills.
In the present report, we review the experience of financing decentralized education in
Macedonia since the beginning of the first phase until today (2011). The report has a
somewhat pedagogical and descriptive character, as it explains at length how the allocation
system for Macedonian education works, how it should be analyzed and reviewed, and what
are the main reasons for many decisions which now may appear strange, but were the only
natural choice to be made at the time. Nevertheless, the report includes focused analysis of
selected problems of education finance and presents key challenges facing Macedonian
reformers. Special attention is devoted to technical aspects of per student allocation formula
utilized in Macedonia, including the lump sum and the buffers (see section 2). This technical
knowledge is of course necessary for informed public discussions of the financing of
education, and is not presently widely shared among education professionals in the country.
Indeed, the very few changes introduced into the formula since 2006 (see section 2), as well
as a review of the systematized position of Education Commission of ZELS show that the
allocation formula is not the subject of serious debate in Macedonia, despite its crucial
importance for education.
The additional reason why we focus on the technical aspects on the allocation of education
grants is to stress that the discussion should not be exclusively concerned with adequacy
issues, that is with the sufficiency of allocated funds to finance decentralized functions. Of
course, adequacy is extremely important, and inadequate funding of decentralized education
creates very serious long term risks both for the sector and for the country. But all too often

Jan Herczyński Financing Decentralized Education in Macedonia
Page 8/49
the discussions of adequacy are reduced into simple demands for increased funding, at the
expense of other relevant values, such as equity or stability.
A final comment of the present introduction concerns the position of the author. Between
2003 and 2007, when the decentralization process was initiated, I have had the honor to assist
the then Macedonian Minister of Education, dr. Aziz Pollozhani. Working under a succession
of USAID projects in Skopje, I have been intimately involved with the work conducted under
the leadership of dr. Pollozhani by a dedicated team of his officials and advisors4. I have also
prepared a number of policy notes and education finance analyses for the Ministry of
Education (some of which are listed in the references). The present report, written with a
distance of a few years, provides a sympathetic yet not uncritical account of what has
happened since then.
1. Decentralization process in Macedonia from 2005 till today
A specific and persistent feature of the decentralization process in Macedonia has been the
entry of municipalities into the first and the second phase at different times of the fiscal year,
not always on January 1. The first phase of the process, due to political delays5, was initiated
on July 1, 2005, rather than at the beginning of 2005. This meant that from the very first steps
of the decentralization, both the transfer of the management responsibilities and the
introduction of new financial flows (grants) occurred in the middle of the fiscal year.
On September 1, 2007, again in the middle of the fiscal year, Macedonia began the second
phase of decentralization. At different dates different groups of municipalities6, depending on
whether the satisfied the legal criteria, were allowed to move into the second phase, as the
following Table 1 shows:
Table 1 Advancement of Macedonian municipalities to the second phase of decentralization
Date Number of municipalities
1 September 1, 2007 42
2 January 1, 2008 9
3 April 1, 2008 8
4 July 1, 2008 5
5 November 1, 2008 2
6 November 1, 2009 2
7 April 1, 2010 5
8 July 1, 2010 1
9 January 1, 2011 3
4 In particular, I have worked closely with a small Analytical Unit in the Ministry of Education, whose task was
to prepare analyses and recommendations for the Ministry. 5 Prior to the decentralization process, the Government introduced consolidation of the Macedonian
municipalities, reducing their number from 125 to 85 (for political reasons some small municipalities were
allowed to operate for a few more years). Protests against the consolidation forced the Government to conduct a
national referendum in October 2004. Therefore the planned beginning of decentralization was delayed by half a
year (see Herczyński et al, 2009). Local elections to consolidated municipalities took place in April 2005. 6 In table 1, we include all 84 municipalities and the City of Skopje. The 77 municipalities listed in Table 1
together with 8 municipalities still in phase as of January 1, 2011, make the total of 85 units.

Jan Herczyński Financing Decentralized Education in Macedonia
Page 9/49
As of January 1, 2011, 8 municipalities still remained in phase 1. The fact that for some years
different municipalities moved into the second phase at different dates (there were four such
dates for 2008 and not a single one in 2009), means that for each year we have three different
classes of municipalities: those who remained in the first phase for the entire fiscal year, those
who advanced to the second phase in the middle of the fiscal year (with the necessary budget
rebalance), and those which were in the second phase for the entire fiscal year. The following
graph provides the overview of this process (of course the data for 2011 are not definitive, as
it is possible that some municipalities will advance to the second phase before December 31):
Graph 1 Overview of advancement to the second phase of decentralization (municipalities)
From Graph 1 it follows, for example, that no municipality was in phase 2 for the entire 2007
year, while in the year 2008 this was the case for 51 municipalities. That number kept
increasing with time, of course. This situation creates problems for the proper review of the
financial and institutional progress of decentralization and for analysis of revenues and
expenditures across years in some standardized manner (for example, on per student or per
class basis).
However, the movement towards the second phase of decentralization is somewhat more
rapid if we take into account not the number of municipalities, but the number of students.
This is the case because for larger municipalities, whose schools enroll more students, it is
relatively easier to satisfy the formal conditions required for entry to the second phase. The
following graph provides the data on primary school students enrolled in schools owned by
municipalities in the different stages of decentralization (for simplicity and to avoid the
impact of demographic trends, we use the numbers of primary school students in 2006).
0
10
20
30
40
50
60
70
80
90
2007 2008 2009 2010 2011
Fully in Phase II
Partially in Phase II
Not in Phase II

Jan Herczyński Financing Decentralized Education in Macedonia
Page 10/49
Graph 2 Overview of advancement to the second phase of decentralization (students)
As Graph 2 shows, initially the movement to the second phase was marked more strongly in
terms of students than in terms of municipalities, since initially it was the larger municipalities
which fulfilled the required criteria. However, over time this movement stalled, in part
because there is still one large city in phase I (namely Ohrid).
2. Allocation of education grants to Macedonian municipalities
2.1. Ordinances with formulas for education grants
The persistence of concurrent municipalities in first and in second phase of decentralization
has led to the need for issuing every year of a number of ordinances on allocation formulas,
separately for categorical and block grants (for phase 1 and 2, respectively) and separately for
primary and secondary education. The dates when the ordinances were published in the
official gazette are listed in the following Table 2.
Table 2 Ordinances with allocation formulas for education grants
Year Categorical grants Block grants
Primary Secondary Primary Secondary
2005 April 11, 2005 April 11, 2005
2006 Feb 9, 2006 Feb 9, 2006
2007 Feb 27, 2007 March 6, 2007 Aug 22, 2007 Aug 22, 2010
2008 Oct 16, 2007 Oct 21, 2007 Oct 21, 2007 Oct 21, 2007
2009 June 24, 2008 June 24, 2008 June 24, 2008 June 24, 2008
2010 Aug 24, 2009 June 9, 2009 June 9, 2009 Aug 24, 2009
2011 July 20, 2010 July 20, 2010 July 20, 2010 July 20, 2010
What is striking about the dates reported in Table 2 is that beginning with the allocation
formulas for fiscal year 2009 they are adopted before September, which is before the new data
on student numbers are known and before the initial budget guidelines from the Ministry of
0
30 000
60 000
90 000
120 000
150 000
180 000
210 000
240 000
270 000
2007 2008 2009 2010 2011
Fully in phase II
Partially in phase I
Fully in phase I

Jan Herczyński Financing Decentralized Education in Macedonia
Page 11/49
Finance are issued and made public. The guidelines include the limits for specific budget
lines, in other words they include the information about how much money in the national
budget is likely to be allocated for different education grants. At the same time, the Budget
Circular Letter which is sent from the Ministry of Finance to all municipalities in September
already shows the values of education grants.
The dialogue between different education stakeholders, conducted primarily between the
Ministry of Education, the institution responsible for proposing the allocation formulas, which
are then adopted by the Government, and the Association of Units of Local Self-Government
ZELS, held earlier in the year (April) is therefore limited to review a few coefficients, without
any meaningful projections of the results of proposed formulas. In order to properly review
the formulas and their impact, experts need to know (see the following subsection for more
specific discussion of the formulas themselves):
• Main financial elements of the formula, that is the lump sum and the per student
amount.
• Upper and lower buffer used in the formulas for primary education (the buffers limit
the variation of per student allocation from year to year).
• The number of student in each municipality, to which the formula will apply.
Only knowing these numbers makes it possible to calculate the education grant to any given
municipality, to compare it to previous years’ allocation, to assess the needs of the schools in
the coming fiscal year, and to formulate a sound judgment. However, the financial elements
may be assessed and proposed only after the Ministry of Finance issues its budget limits
(typically in September). Similarly, the new student numbers for the coming school year
become available only after the start of the school year in September. We have to conclude
that in April, May and June, when the formulas are discussed, the basis for actually analyzing
the formulas and their impact on the financial situation of the municipalities does not yet
exist. This is a very serious limitation of the negotiation process between the Government and
ZELS and puts Education Commission of ZELS at a clear disadvantage.
However, the same situation creates serious problems also for the experts of the Ministry of
Education. Indeed, once the student numbers and the budget limits are known in September,
the allocation formula has already been fixed in the ordinance issued by the Government. This
means that Ministry officials no longer have the freedom of setting important allocation
coefficients in accordance to the actual relative needs of municipalities, as expressed, for
example, in their very different average class sizes. The only room for maneuver that the
Ministry has at that stage is to set the two financial elements, the lump sum and the per
student amount, as well as the lower and upper buffers (for primary education). These four
parameters must be selected under the hard budget constraint of the budget limits. Moreover,
they should ensure that the block grants are sufficient to cover the salary needs of all schools
in the given municipality (through the Treasury System the Ministry of Finance knows these
needs). In practice, it seems that the Ministry decides on the two financial parameters and then
sets the buffers so as to align the overall allocation with the Ministry of Finance limits and at
the same time to cover the salary requirements. This can be deduced, for example, from the
values of the fiscal year 2010, in which both buffers were exceedingly small (75% and 84%).
For secondary education, where no buffers are used, setting the value of one of these two
financial elements immediately determines the value of the other one. For the planning and
execution of the education policy of the Ministry, this is a rather uncomfortable situation.
Jan Herczyński Financing Decentralized Education in Macedonia
Page 12/49
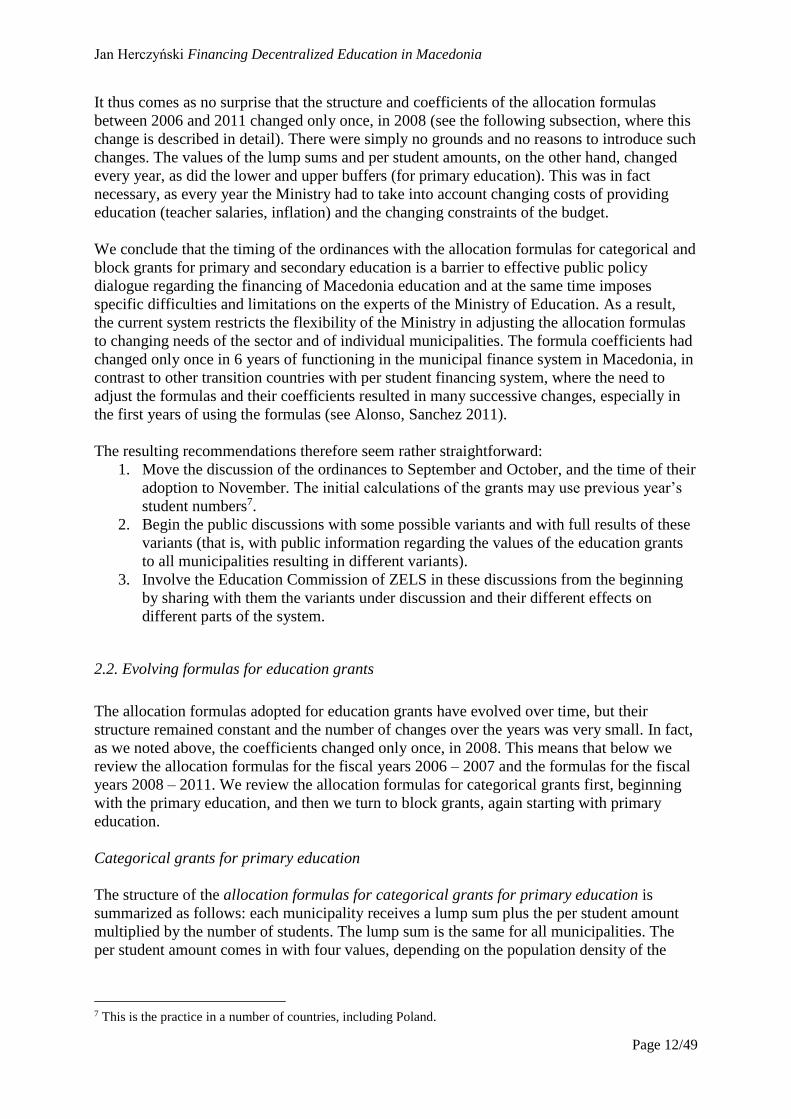
It thus comes as no surprise that the structure and coefficients of the allocation formulas
between 2006 and 2011 changed only once, in 2008 (see the following subsection, where this
change is described in detail). There were simply no grounds and no reasons to introduce such
changes. The values of the lump sums and per student amounts, on the other hand, changed
every year, as did the lower and upper buffers (for primary education). This was in fact
necessary, as every year the Ministry had to take into account changing costs of providing
education (teacher salaries, inflation) and the changing constraints of the budget.
We conclude that the timing of the ordinances with the allocation formulas for categorical and
block grants for primary and secondary education is a barrier to effective public policy
dialogue regarding the financing of Macedonia education and at the same time imposes
specific difficulties and limitations on the experts of the Ministry of Education. As a result,
the current system restricts the flexibility of the Ministry in adjusting the allocation formulas
to changing needs of the sector and of individual municipalities. The formula coefficients had
changed only once in 6 years of functioning in the municipal finance system in Macedonia, in
contrast to other transition countries with per student financing system, where the need to
adjust the formulas and their coefficients resulted in many successive changes, especially in
the first years of using the formulas (see Alonso, Sanchez 2011).
The resulting recommendations therefore seem rather straightforward:
1. Move the discussion of the ordinances to September and October, and the time of their
adoption to November. The initial calculations of the grants may use previous year’s
student numbers7.
2. Begin the public discussions with some possible variants and with full results of these
variants (that is, with public information regarding the values of the education grants
to all municipalities resulting in different variants).
3. Involve the Education Commission of ZELS in these discussions from the beginning
by sharing with them the variants under discussion and their different effects on
different parts of the system.
2.2. Evolving formulas for education grants
The allocation formulas adopted for education grants have evolved over time, but their
structure remained constant and the number of changes over the years was very small. In fact,
as we noted above, the coefficients changed only once, in 2008. This means that below we
review the allocation formulas for the fiscal years 2006 – 2007 and the formulas for the fiscal
years 2008 – 2011. We review the allocation formulas for categorical grants first, beginning
with the primary education, and then we turn to block grants, again starting with primary
education.
Categorical grants for primary education
The structure of the allocation formulas for categorical grants for primary education is
summarized as follows: each municipality receives a lump sum plus the per student amount
multiplied by the number of students. The lump sum is the same for all municipalities. The
per student amount comes in with four values, depending on the population density of the
7 This is the practice in a number of countries, including Poland.

Jan Herczyński Financing Decentralized Education in Macedonia
Page 13/49
municipality (population density is measured in the number of inhabitants per square
kilometer). The Macedonian municipalities are divided into four groups, as follows:
Table 3 Density groups for categorical grants for primary education (inhabitants per square km)
2006 – 2007 2008 – 2011
Very low population density Under 25 Under 20
Low population density Between 25 and 40 Between 20 and 35
Medium population density Between 40 and 70 Between 35 and 70
Normal population density Above 70 Above 50
The change in the population density thresholds resulted in the decrease of the number of
municipalities with very low and low population density, as the following table illustrates.
The table also provides the number of primary school students in the two groupings of
municipalities (for comparability we use data for 2006).
Table 4 Number of municipalities and primary school students in different density groups
2006 – 2007 2008 – 2011
Municipalities Students Municipalities Students
Very low population density 16 9 646 13 6 807
Low population density 12 16 887 12 15 334
Medium population density 19 28 322 22 32 714
Normal population density 36 199 123 36 199 123
We note that since 2008, the municipalities with very low population density account for 16%
of all Macedonian municipalities, but their schools enroll only 3% of all primary school
children.
Lowest per student amount is allocated to municipalities with normal population density. For
other groups of municipalities the per student amount is larger by the additional weight,
determined in the formula. The weights used in the formulas were as follows:
Table 5 Density weights for categorical grants, primary education
2006 – 2007 2008 – 2011
Very low population density 0.6 1.4
Low population density 0.4 0.8
Medium population density 0.2 0.6
We note that the change in 2008 led to bigger differences between the values of per student
amount in different groups of municipalities.
We can now present the main financial elements of the formulas for categorical grants for
primary education between 2006 and 20118.
Table 6 Lump sum and per student amount for categorical grants, primary education (MKD)
2006 2007 2008 2009 2010 2011
Lump sum 400 000 500 000 600 000 700 000 840 000 1 000 000
8 As discussed in section 2.1, the lump sums, per student amounts and the upper and lower buffers (see Table 8),
are unfortunately not provided in yearly ordinances with the formulas approved by the Minister of Education.
We use the information which was provided to us directly by the Ministry.

Jan Herczyński Financing Decentralized Education in Macedonia
Page 14/49
Per student amount 1 588.90 2 244.74 3 660.00 4 000.00 3 100.00 3 260.00
We note that per student amount grew between 2006 and 2009, and suffered considerable
decrease in 2010. Further growth in 2011 was not sufficient to overcome this decrease. This
indicates that in 2009 and 2010 the budget constraints were especially hard due to financial
crisis. On the other hand, the lump sum was increased every year, including in 2010.
For reference, we provide also the values of the per student amount for different groups of
municipalities. Table 7 below show that for normal population density, these are the same as
in Table 6, and for municipalities with lower population density, the values are increased
using the additional weights provided in Table 5. The results are rounded to complete MKD.
Table 7 Different values of per student amount for categorical grants, primary education (MKD)
2006 2007 2008 2009 2010 2011
Very low population density 2 542 3 592 8 784 9 600 7 440 7 824
Low population density 2 224 3 143 6 588 7 200 5 580 5 868
Medium population density 1 907 2 694 5 856 6 400 4 960 5 216
Normal population density 1 589 2 245 3 660 4 000 3 100 3 260
The evolving values of per student amounts are best reviewed in a graph.
Graph 3 Evolving values of per student amounts for categorical grants, primary education (MKD)
We note in Graph 3 that, as expected, the decrease in 2010 affected all four values of per
student amount in the same manner. However, monetary value of the decrease was highest for
municipalities with very low population density.
For each municipality, the calculation of the grant proceeds as follows. The lump sum is
added to the number of students multiplied by the per student amount. The resulting value is
then compared to the grant allocation of the previous year (except for the first year of using
the formula, when a specific procedure for calculating the historical allocation was used). It is
now that the buffers are used. The lower and upper buffer are provided as percentage
amounts. If the calculated value is less than the lower buffer multiplied by previous year’s
allocation, then it is increased up to that product (result of multiplication). Analogously, if the
0
2 000
4 000
6 000
8 000
10 000
2006 2007 2008 2009 2010 2011
Normal density
Medium density
Low density
Very low density

Jan Herczyński Financing Decentralized Education in Macedonia
Page 15/49
calculated value is more than the upper buffer multiplied by previous year’s allocation, then it
is decreased down to that product. This means that the buffers limit the year to year variation
of the allocated categorical grants.
The following table presents the upper and lower buffers for the categorical grants for primary
education. These are each year applied to the previous year’s allocation.
Table 8 Lower and upper buffers for categorical grants, primary education (%)
2006 2007 2008 2009 2010 2011
Lower buffer 85% 130% 120% 113% 75% 102,5%
Upper buffer 112% 149,86% 135% 119% 84% 106%
Table 8 is very interesting to review, since as we had discussed earlier, it is most likely the
buffers which are used by the Ministry of Education to limit the overall allocation to the
budget constrained imposed by the Ministry of Finance. We note that most years, the lower
buffer imposes a growth of the categorical grant for previous year’s allocation by a certain
percentage, and at the same time the upper buffer limits this growth. Thus in 2009, each
municipality, which was still in Phase I of decentralization, received at least 13% and at most
19% more than it had received in 2008. However, the year 2010 provides an important
exception. In this specific year, the categorical grant for primary education was in fact lower
than the grant received by the municipality the year before, and the decrease of the grant was
between 16% and 25%. This of course reflects the conditions of financial crisis, whose first
reflection we already noted in Graph 3 above.
Categorical grants for secondary education
The allocation formulas for categorical grants for secondary education are much simpler
than for primary education. Similarly to other grants, the formula changed only once, in 2008.
Initially, the formula did not include the lump sum, and only one density threshold. This
means that instead of 4 groups of municipalities, based on population density, only two
groups are considered, namely the municipalities with under 40 inhabitants per square
kilometer (low population density municipalities), and those with over 40 inhabitants per
square kilometer (high density municipalities). The additional coefficient for low density
municipalities was set at 0.1.
Since 2008, the density threshold was abandoned, but instead the lump sum was added. The
lump sum was adjusted every year since 2008, together with the per student amount.
In addition, a coefficient for gymnasium education was introduced. This coefficient was 1 in
2006 and 2007, and was decreased to 0.5 since 2008. Finally, the upper and lower buffers
were used in 2006 and 2007, and were abandoned since 2008. The values of the buffers are
provided in Table 9.
Table 9 Lower and upper buffers for categorical grants, secondary education (%)
2006 2007
Lower buffer 80% 130%
Upper buffer 170% 149,86%
Please note that the values of the buffers for the years 2006 and 2007 are very similar for
primary and for secondary education (compare with Table 8).

Jan Herczyński Financing Decentralized Education in Macedonia
Page 16/49
Changing coefficients of the formula for categorical grants for secondary education are
provided in the following table.
Table 10 Coefficients for categorical grants, secondary education
2006 – 2007 2008 – 2011
Low population density 0.1
Gymnasium students 1 0.5
The lump sum and the per student amount for consecutive years were as follows:
Table 11 Lump sum and per student amount for categorical grants, secondary education (MKD)
2006 2007 2008 2009 2010 2011
Lump sum 350 000 400 000 97 000 450 000
Per student amount 1 294.20 1 611.32 2 674.9 3 100.00 7 296.00 8 170.00
We note the dramatic decrease of the lump sum in 2010, decreasing by more than 80%. This
is certainly the reflection of the same financial crisis, which we had reviewed above, in Graph
3 and in Table 8. The difference is that for primary education, the Ministry chose to reduce
the lower and upper buffers and the per student amount, and maintained the increase of the
lump sum. For the secondary education, in contrast, where the buffers were no longer used,
the reduction in allocation was achieved through the reduction of the lump sum only, while
per student amount was not reduced. Interestingly, in 2011 the lump sum recovered to well
above the 2009 level, unlike the per student amount for primary education.
This discussion is summarized in the following two graphs.
Graph 4 Values of per student amounts for categorical grants (MKD)
2 000
3 000
4 000
5 000
6 000
7 000
8 000
9 000
2008 2009 2010 2011
Primary
Secondary

Jan Herczyński Financing Decentralized Education in Macedonia
Page 17/49
Graph 5 Values of the lump sum for categorical grants (MKD)
Comparison of Graph 4 and Graph 5 shows what was discussed already above, namely that
for primary education, the reduction of allocation in 2010 was achieved by decreasing per
student amount (and the buffers), while for secondary education by very significant reduction
of the lump sum. However, per student amount for secondary education more than doubled in
2010 and exceeded that of primary education.
We now turn to the two formulas for block grants, used to finance primary and secondary
education during the second phase of decentralization. Both formulas were introduced in 2008
and have not been changed since then, except for the financial elements (the lump sum and
the per student amount) and for the buffers (used for primary education only).
Block grants for primary education
The structure of the allocation formulas for block grants for primary education is very similar
to the formula for categorical grants. It includes the lump sum as well as four groups of
municipalities defined on the basis of population density. It also includes the lower and upper
buffers.
The following table summarizes the population density thresholds as well as additional
weights associated with these thresholds.
Table 12 Density weights for block grants, primary education
Density thresholds Additional
weights
Very low population density Under 40 inhabitants per km2 0.6
Low population density Between 40 and 50 inhabitants per km2 0.4
Medium population density Between 50 and 70 inhabitants per km2 0.2
Standard population density Above 70 inhabitants per km2
Note that the density coefficients for block grants are far smaller than for categorical grants
(compare with Table 5).
0
200 000
400 000
600 000
800 000
1 000 000
2008 2009 2010 2011
Primary
Secondary

Jan Herczyński Financing Decentralized Education in Macedonia
Page 18/49
In addition to the coefficients based on population density, the block grant formula has two
additional coefficients, absent in the categorical grant formula. The first of these is the
coefficient for special needs students, designed to provide more funds to municipalities with a
high share of special schools and special classes. The additional weight for each special needs
student is equal 1. The second is the coefficient for subject teaching, reflecting the higher
costs of teaching in higher classes, in which, instead of one teacher as in initial classes, there
is the need to employ many teachers to teach different subjects. The additional weight has
value 0.2 and applies to all students attending classes between 5 and 8 in primary schools.
The values of the main financial elements, the lump sum and the per student amount, in
successive years are provided in the following table.
Table 13 Lump sum and per student amount for block grants, primary education (MKD)
2008 2009 2010 2011
Lump sum 5 000 000 5 100 000 4 900 000 5 000 000
Per student amount 24 800 27 700 29 650 31 630
Once again we note that the serious financial crisis in 2010 is reflected in the reduced lump
sum. However, the reduction at 4% is not as significant as for the categorical grants, (recall
that in 2010 the lump sum in the formula for categorical grant for secondary education
collapsed to less than 20% of its 2009 value). Moreover per student amount increased every
year.
Finally, we review the buffers used for block grants for primary education.
Table 14 Lower and upper buffers for block grants, primary education (%)
2008 2009 2010 2011
Lower buffer 102.7% 108.45% 102.0% 102.7%
Upper buffer 103.6% 111.4% 105.0% 106.8%
To facilitate the comparison of the upper and lower buffers for categorical grants with those
for block grants (Table 8 and Table 14), we present these data in a graphical format.
Graph 6 Upper and lower buffers for categorical and block grants, primary education (%)
70%
80%
90%
100%
110%
120%
130%
140%
2008 2009 2010 2011
Categorical, upper
Categorical, lower
Block, upper
Block, lower

Jan Herczyński Financing Decentralized Education in Macedonia
Page 19/49
We note that buffers for the block grants are more narrow, meaning that the difference
between upper and lower buffer is smaller. This has an important effect: the allocation of the
block grants to municipalities resembles more closely the previous year’s allocation than that
of categorical grants. This increased stability of funding is certainly related to the fact that
block grants are much larger and include teacher salaries. However, with time the gap
between the upper and lower buffer for categorical grant was decreasing, while the gap for
block grants was increasing, until in 2011 they converged.
What is striking and very important in Graph 6 is that during the financial crisis of 2010, the
Ministry of Education did not decrease the allocation of block grants using the buffers, as it
did for the categorical grants. This is not difficult to understand. The salaries of teachers and
other school staff, while not seriously increased during the financial crisis, were not cut either
and had to paid out. The financial crisis therefore affected mainly material expenditures
(school maintenance, communal expenses, heating). The Ministry pursued a prudent policy of
protecting teachers at the expense of material expenditures. Hence the evident decrease of the
allocation of categorical grants, which are used to finance material costs, and strong
protection – through a modest increase – of the salaries, which form the bulk of block grants.
Another important and somewhat overlooked issue concerns the way the buffers are applied.
This is certainly non-problematic, if throughout the previous fiscal year the municipality was
in the same phase of decentralization – be it the first or the second – in which it finds itself in
the current fiscal year. Indeed, in such a situation the previous year’s allocation will be largely
similar to the current year’s allocation, and the comparison of the two using the buffers makes
sense. However, if the municipality moved to the second phase either during the previous
fiscal year or at the beginning of the current fiscal year, then the application of the buffers is
not possible (one cannot compare funds for maintenance with funds for education). Some ad
hoc technical calculation surely becomes necessary, which leaves significant room for own
decisions of the Ministry of Education. Given the narrow band of upper and lower buffers, as
seen in Graph 6, this innocuous technical calculation will have significant impact on the
future allocations for primary education through the block grants9. We return to the issue of
testing the buffers in the next subsection.
Block grants for secondary education
Finally we turn to the allocation formulas for block grants for secondary education. This is
the simplest set of formulas used in the education sector in Macedonia. It uses a lump sum
and one coefficient for students of vocational education. That coefficient is equal to 0.1 since
it was introduced in 2008. The formula uses no density coefficients and no buffers.
The two financial elements of the formula are summarized in the following table.
Table 15 Lump sum and per student amount for block grants, secondary education (MKD)
2008 2009 2010 2011
Lump sum 5 000 000 5 000 000 6 000 000 6 000 000
Per student amount 26 185 28 311 35 580 36 240
We note that in 2010 there is no decrease in either the lump sum (which grows in this year by
20%) nor in the per student amount (which stays roughly constant, growing by under 2%).
9 Of course, given the number of municipalities which still need to make the move to the second phase of
decentralization, this problem may seem to have more historical than actual significance.

Jan Herczyński Financing Decentralized Education in Macedonia
Page 20/49
Thus under the allocation formulas for block grants, the protection of teacher salaries in
secondary schools is even stronger than in primary schools.
The following two graphs summarize the evolution of lump sums and per student amounts in
block grants formulas for primary and secondary education, analogously to Graph 4 and
Graph 5 above (which showed the same evolution for categorical grants).
Graph 7 Values of the per student amount for block grants (MKD)
Graph 8 Values of the lump sum for block grants (MKD)
The comparison of Graphs 6 and Graph 8 leaves no doubt that during the financial crisis of
2010 the treatment of secondary education was considerably better than the treatment of
primary education. While the lump sum for primary education was largely unchanged, that for
secondary education enjoyed 20% jump upwards. At the same time, per student amount for
secondary education grew much more than that for primary education. Whether this clear
policy option was based on understanding that up to 2009 secondary education was relatively
20 000
25 000
30 000
35 000
40 000
2008 2009 2010 2011
Primary
Secondary
4 500 000
5 000 000
5 500 000
6 000 000
6 500 000
2008 2009 2010 2011
Primary
Secondary

Jan Herczyński Financing Decentralized Education in Macedonia
Page 21/49
underfinanced compared to primary education, or on other policy considerations needs further
research.
The following table summarizes the elements used in allocation formulas since 2008 and
shows that from the structural point of view, the formulas for categorical and block grants are
similar to each other, while formulas for primary and for secondary education are rather
different.
Table 16 Structural comparison of 4 formulas
Primary education Secondary education
Categorical Block Categorical Block
Lump sum Yes Yes Yes Yes
Population density coefficients 3 3 No No
Other coefficients 2 1 1
Lower and upper buffers Yes Yes No No
2.3. Review of the application of the lump sum and per student amount
The reason for introducing the additional coefficients for municipalities with low population
density is related to average class sizes. In sparsely populated areas, the network of villages is
more fragmented and it is more difficult to maintain schools with reasonable classes. It is
therefore natural to provide more funds on a per student basis to these remote areas. Indeed, it
is a universal phenomenon that classes in rural schools are smaller than classes in urban
schools, and every per student allocation formula must take this into account (see J. Alonso,
A. Sanchez 2011).
Similarly, the purpose of introducing the lump sum is to provide additional support to
municipalities with very small number of students. Indeed, the main rationale of the lump sum
is that for small municipalities it will provide significant contribution to per student amount
(because the fixed lump sum will be divided by a small number of students in a given
municipality), while for large municipalities the contribution from the lump will be quite
insignificant. In this sense, the lump sum and the weights based on population density serve
the same purpose and reinforce each other.
In order to review the impact of these two mechanisms, we analyze the extreme cases, that is
the largest and smallest municipalities, as measured by the number of students. We select 5
largest and 5 smallest municipalities in 2006 and 2007. These two groups have changed
somewhat between 2006 and 201110. The following table shows the number of students, class
size and population density for these municipalities in 2006 and 2011. Note that population
density is assessed using 2002 national census, so it does not in fact change between 2006 and
2011. The extreme cases of high population density are all municipalities in Skopje11.
10 The largest municipalities in 2006 were Kumanovo, Tetovo, Kisela Voda, Gostivar and Centar. In 2011 these
were Kumanovo, Tetovo, Cair, Bitola, Gostivar. The smallest municipalities in 2006 were Debarca, Vevcani,
Drugovo, Zrnovci and Konce. In 2011 these were Novaci, Drugovo, Lozovo, Vevcani, Zrnovci. 11 These are Kisela Voda and Centar in 2006, and Cair in 2011.

Jan Herczyński Financing Decentralized Education in Macedonia
Page 22/49
Table 17 Students, class sizes and population density in small and large municipalities
Municipality Year 2006 Year 2011
Number of
students
Population
density
Class
size
Number of
students
Population
density
Class
size
Smallest 188 13.5 11.75 189 4.8 8.59
2nd smallest 232 69.3 14.50 196 8.3 11.53
3rd smallest 316 8.3 17.56 200 8.2 11.76
4th smallest 331 64.1 19.47 235 69.3 13.06
5th smallest 332 15.7 16.60 238 64.1 14.00
Largest 14 360 244.4 24.34 12 282 244.4 21.03
2nd largest 13 151 331.2 26.78 10 804 331.2 21.65
3rd largest 12 452 7 726.0 27.13 8 069 1 287.5 22.60
4th largest 11 609 217.2 23.84 7 847 123.7 18.29
5th largest 11 037 4 694.9 26.28 7 700 217.2 16.92
Table 17 shows that indeed the smallest municipalities are those with low population density
and with very small average class sizes. So provision of additional per student financing to
municipalities with a small number of students through the lump sum, and to municipalities
with low population density using the weights based on density, are both reasonable policy
measures.
The purpose of the present chapter is to explore how successful these two elements have been
in providing appropriate funding levels to Macedonian municipalities. We concentrate on the
formula itself, without the use of the buffers (the buffers are discussed in the following
subsection).
We begin our discussion with the categorical grants12. As seen from the formulas (see section
2.2), there are two basic contributions to the allocation, namely the lump sum and the per
student amount (the latter is multiplied by the number of students and uses additional weights
depending on population density). In what follows, we separate the contribution from the
lump sum and contribution from the per student amount. This is the key technical step
necessary for the analysis of respective impact of the two elements of the formula.
Recall from the previous subsection that the grant to a municipality for primary education is
equal to the sum of two contributions, namely the lump sum and the per student amount
multiplied by the number of students in the municipality: 𝐿 + 𝑁𝑢 ∗ 𝑆. Here 𝐿 is the lump sum
and 𝑁𝑢 is the number of students, while 𝑆 is the per student amount, taking one of 4 values
depending on the population density (see Table 7). These two contributions will be analyzed
separately here. For example, the contribution from the lump sum calculated at a per student
basis is simply equal to the lump sum divided by the number of students 𝐿/𝑁𝑢, and is
different for different municipalities. So clearly this lump sum contribution is very high for
small municipalities and becomes insignificant for very large municipalities. Per student
amount also varies between the municipalities, but to a lesser extent (see Table 7).
12 Our discussion here is somewhat theoretical, for two reasons. First, we review the formula for categorical
grants as if all municipalities were still in phase I of decentralization, while of course most have moved to the
second phase. Second, we ignore buffers. Still, the discussion is useful because it shows how different elements
of the formula should be analyzed.

Jan Herczyński Financing Decentralized Education in Macedonia
Page 23/49
The following table provides total per student allocation through categorical grants for 5
smallest and 5 largest municipalities in 2006 and in 2011. These totals are the sum of the two
separate contributions from the lump sum and from per student amount (the buffers are not
taken into account; see number of students, class sizes and population density in Table 17).
Table 18 Per student allocation of categorical grants in 2006 and 2011, primary education
Municipality Year 2006 Year 2011
Lump sum
contribution
Per
student
amount
Total Lump sum
contribution
Per
student
amount
Total
Smallest 2 128 2 542 4 670 5 291 7 824 13 115
2nd smallest 1 724 1 907 3 631 5 102 7 824 12 926
3rd smallest 1 266 2 542 3 808 5 000 7 824 12 824
4th smallest 1 208 1 907 3 115 4 255 5 216 9 471
5th smallest 1 205 2 542 3 747 4 202 5 216 9 418
Largest 28 1 589 1 617 81 3 260 3 341
2nd largest 30 1 589 1 619 93 3 260 3 353
3rd largest 32 1 589 1 621 124 3 260 3 384
4th largest 34 1 589 1 623 127 3 260 3 387
5th largest 36 1 589 1 625 130 3 260 3 390
The first observation is that indeed the difference in the lump sum contributions between
small and large municipalities is enormous, both in 2006 and in 2011. Of course, this is the
planned effect and it illustrates how the lump sum provides more funds to smaller
municipalities (when viewed on per student level). This is also the main reason for the
difference in total per student allocation.
As for the per student amounts, these are uniform for large municipalities (standard
population density), but vary significantly between small municipalities, due of course to the
additional weights depending on population density. Here the differences have grown
considerably between 206 and 2011, and the growth can be traced to the change of coefficient
for municipalities with very low population density (see Table 5). Indeed, this coefficient
changed from 0.6 to 1.4, which means that per student amount in small municipalities is
240% of the amount for the cities – more than doubled. The last columns for 2006 and 2011
provide the total per student allocations. We can see that in small municipalities in 2006 they
were about three times higher than in the cities, and about 4 times higher in 2011.
So the question arises, is this allocation equitable, are the clear differences in per student
allocation justified or not. In order to review this problem, it is very useful to pass from per
student allocation to per class allocation. Indeed, we assume that per class allocation in
different municipalities should be comparable to each other. This is relevant for categorical
grants discussed here, and become even more important for the block grants, which include
teacher salaries and are discussed below. Indeed, the bulk of block grants are spent on teacher
salaries, teacher salaries do not differ much between municipalities, and all classes should
receive comparable level of teaching according to curriculum norms. Hence per class
spending – and therefore also allocation of the block grants – should be rather uniform across
municipalities. To move from per student allocation to per class allocation, we need to
multiply the funds allocated per student by the average class size for each analyzed
municipality (average number of students in a class is reported in Table 17).
Jan Herczyński Financing Decentralized Education in Macedonia
Page 24/49
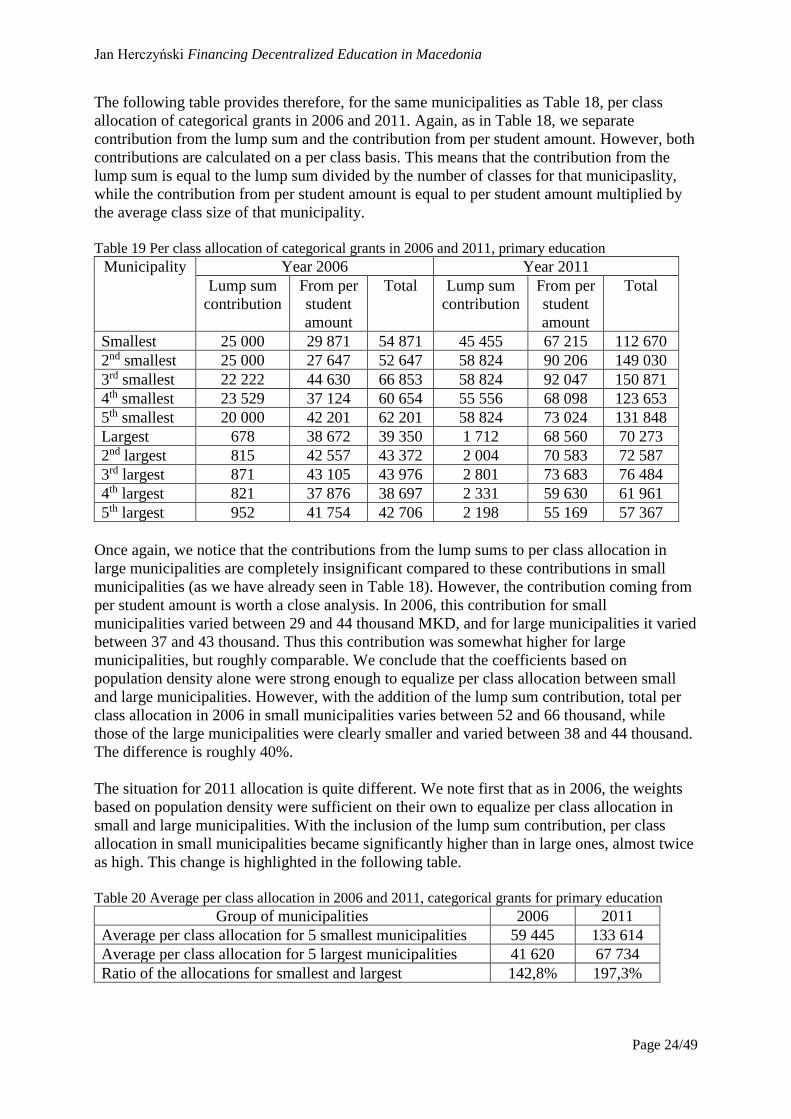
The following table provides therefore, for the same municipalities as Table 18, per class
allocation of categorical grants in 2006 and 2011. Again, as in Table 18, we separate
contribution from the lump sum and the contribution from per student amount. However, both
contributions are calculated on a per class basis. This means that the contribution from the
lump sum is equal to the lump sum divided by the number of classes for that municipaslity,
while the contribution from per student amount is equal to per student amount multiplied by
the average class size of that municipality.
Table 19 Per class allocation of categorical grants in 2006 and 2011, primary education
Municipality Year 2006 Year 2011
Lump sum
contribution
From per
student
amount
Total Lump sum
contribution
From per
student
amount
Total
Smallest 25 000 29 871 54 871 45 455 67 215 112 670
2nd smallest 25 000 27 647 52 647 58 824 90 206 149 030
3rd smallest 22 222 44 630 66 853 58 824 92 047 150 871
4th smallest 23 529 37 124 60 654 55 556 68 098 123 653
5th smallest 20 000 42 201 62 201 58 824 73 024 131 848
Largest 678 38 672 39 350 1 712 68 560 70 273
2nd largest 815 42 557 43 372 2 004 70 583 72 587
3rd largest 871 43 105 43 976 2 801 73 683 76 484
4th largest 821 37 876 38 697 2 331 59 630 61 961
5th largest 952 41 754 42 706 2 198 55 169 57 367
Once again, we notice that the contributions from the lump sums to per class allocation in
large municipalities are completely insignificant compared to these contributions in small
municipalities (as we have already seen in Table 18). However, the contribution coming from
per student amount is worth a close analysis. In 2006, this contribution for small
municipalities varied between 29 and 44 thousand MKD, and for large municipalities it varied
between 37 and 43 thousand. Thus this contribution was somewhat higher for large
municipalities, but roughly comparable. We conclude that the coefficients based on
population density alone were strong enough to equalize per class allocation between small
and large municipalities. However, with the addition of the lump sum contribution, total per
class allocation in 2006 in small municipalities varies between 52 and 66 thousand, while
those of the large municipalities were clearly smaller and varied between 38 and 44 thousand.
The difference is roughly 40%.
The situation for 2011 allocation is quite different. We note first that as in 2006, the weights
based on population density were sufficient on their own to equalize per class allocation in
small and large municipalities. With the inclusion of the lump sum contribution, per class
allocation in small municipalities became significantly higher than in large ones, almost twice
as high. This change is highlighted in the following table.
Table 20 Average per class allocation in 2006 and 2011, categorical grants for primary education
Group of municipalities 2006 2011
Average per class allocation for 5 smallest municipalities 59 445 133 614
Average per class allocation for 5 largest municipalities 41 620 67 734
Ratio of the allocations for smallest and largest 142,8% 197,3%

Jan Herczyński Financing Decentralized Education in Macedonia
Page 25/49
We conclude that the simultaneous use of the lump sum and of the additional weights for
sparsely populated municipalities in the categorical grant formula is excessive and provides
too much support to small rural local governments. The second mechanism is probably
sufficient to provide additional funds to small municipalities to offset the necessarily smaller
classes there.
Preceding discussion was perhaps somewhat theoretical in that it concerned categorical
grants, which are now applicable only to a handful of municipalities. It is included here
largely for instruction purposes. Now however we turn our attention to the block grants for
primary education. The discussion is no longer theoretical and concerns the key financial
elements of the formula allocating very significant public funds to Macedonian local
governments.
We proceed in the same way as we did for categorical grants and focus on the 5 smallest and
five largest municipalities between the years 2008 and 2011, the period during which the
block grants were used. The two groups of municipalities have not changed in these 4 years13.
The average class sizes in the two groups of municipalities are provided below.
Table 21 Class sizes in small and large municipalities, primary education
Group of municipalities 2008 2009 2010 2011
5 smallest municipalities 13,7 13,0 12,2 11,8
5 largest municipalities 22,2 21,5 20,4 20,0
We note that as a result of demographic decline, there is a decrease of the average class size in
primary schools both in the smallest municipalities – by about 14% -- and in the largest
municipalities – by 10%. Therefore the rural classes are throughout the 4 years about 40%
smaller than urban classes. This finding is somewhat surprising, as the management of class
network in large cities should be much easier than in the small municipalities.
The following Table 22 provides average values for smallest and largest municipalities of the
lump sum contributions and the contributions to per student allocation through the block
grants. Similar to Table 18, the contribution from the lump sum is equal to the lump sum
divided by the number of students and then averaged over the two groups of five
municipalities, while the contribution from per student amount is simply the average of per
student amounts for the 5 municipalities.
Table 22 Per student allocation of block grants 2008 – 2011, primary education (MKD)
Group of
municipalities
2008 2009 2010 2011
5 smallest
municipalities
Lump sum contribution 20 059 21 519 21 934 23 850
Per student amount contribution 35 712 57 616 61 672 65 790
Total per student allocation 55 771 79 135 83 606 89 640
5 largest
municipalities
Lump sum contribution 509 536 523 555
Per student amount contribution 24 800 27 700 29 650 31 630
Total per student allocation 25 309 28 236 30 173 32 185
13 Both groups are listed in footnote 9. Although the two groups remained the same in the 4 years, their order
according to the number of students changed from year to year.

Jan Herczyński Financing Decentralized Education in Macedonia
Page 26/49
As expected, Table 22 shows that per student lump sum contribution is very significant for
small municipalities and become insignificant for large ones. This is similar to what we have
seen above for categorical grants (see Table 18). The following table shows percentage
contribution to per student allocation in the total allocation of block grants coming from the
lump sum in small and large municipalities.
Table 23 Contribution from the lump sum in small and large municipalities, primary education
Group of municipalities 2008 2009 2010 2011
5 smallest municipalities 35,7% 27,2% 26,4% 26,8%
5 largest municipalities 2,0% 1,9% 1,7% 1,7%
We note in Table 22 that also per student amounts are higher in small municipalities, as a
result of application of additional weights on the basis of population density, but these
differences are much smaller for block grants than for categorical grants. The reason is easy to
see: the values of these additional weights for categorical grants after 2008 (Table 5) are much
higher than for block grants (Table 12).
Table 22 indicates that total per student allocation for small municipalities grows more
quickly than for large municipalities. In 2008 per student allocation in small municipalities is
about 220% that of the largest municipalities, while in 2011 it is almost 280%. In other words,
the two mechanisms (the lump sum and per student amount depending on population density)
over the years have increased the preference for small municipalities, despite largely stable
differences in average class sizes (Table 21).
We also note that in the 4 years analyzed, the lump sum contribution grew just a little, while
per student contribution more than doubled. Most of this growth happened in year, in 2009,
and is due to increase of per student amount (see Table 13). This is also reflected in Table 23,
which shows the decrease of contribution from the lump sum between 2008 and 2009. We
conclude that for the block grants, the reliance on the lump sum as protection mechanism for
small municipalities decreased in 2009.
As for the categorical grants, the proper way to review these very high differences in per
student allocation is to analyze per class allocations. These are provided in the following
Table 24. Similarly to Table 19, the contributions from the lump sum are simply the lump
sums divided by the number of students and then averaged over the two groups of
municipalities, while the contribution from per student amount is equal to per student amount
of that municipality multiplied by its average class size (and then averaged).
Table 24 Per class allocation of block grants 2008 – 2011, primary education (MKD)
Group of
municipalities
2008 2009 2010 2011
5 smallest
municipalities
Lump sum contribution 272 236 277 681 262 660 277 481
Per student amount contribution 490 278 742 405 730 455 757 937
Total per class allocation 762 514 1 020 086 993 115 1 035 417
5 largest
municipalities
Lump sum contribution 11 266 11 463 10 614 11 032
Per student amount contribution 550 878 594 438 605 583 633 218
Total per class allocation 562 144 605 901 616 198 644 250
Ratio of per class allocations in smallest and the
largest municipalities 135,6% 168,4% 161,2% 160,7%

Jan Herczyński Financing Decentralized Education in Macedonia
Page 27/49
The above Table 24 is the key to understanding the equity impact of the two mechanism for
the protection of small rural municipalities, namely the lump sum and differentiated weights
based on population density under the block grants. In this way it resembles earlier analysis
for categorical grants (see Table 19). We observe first that only in 2008 the contribution
coming from per student amount to per class allocation is higher for large municipalities than
for small municipalities. The increase of per student amount in 2009, already noted above,
reversed this situation in 2009. Since then, the additional weights based on population density
on their own consistently provided to small municipalities, on a per class basis, about 20%
more funds than to large municipalities. This indicates that these weights alone maybe are
more than sufficient protection mechanism for small rural municipalities.
But then comes the lump contribution and increases the preference for small municipalities to
about 35% in 2008 and to about 60% in 2011. This is a key conclusion from Table 24. It is
illustrated in Graph 9:
Graph 9 Per class allocation for large and small municipalities, block grants (MKD)
We note that consistently since 2009, per class allocation coming from per student amount
was about 20% higher for small municipalities than for large municipalities, and that the
addition of the per class contribution coming from the lump sum increased this difference to
about 60%. This ratio is smaller than for categorical grants (compare Table 20), but still very
high.
Now we have to recall that the block grants cover all school expenditures, including teacher
salaries and salaries of other staff (administration, technical, and kitchen). These salaries form
a very large proportion of school expenditures. At the same time, primary schools in different
municipalities follow the same curriculum and have very comparable teacher salaries. The
unit of teaching, and therefore the unit carrying the main cost of school operations, is the
class. It follows that we should expect rather small differences in per class expenditures, and
therefore in per class allocation.
The analysis presented above is of course limited and does not fully take into account the
specific features of either small or large municipalities (maybe the choice of the 5 smallest
and 5 largest introduced a specific additional bias into the data). However, it poses a number
0
200 000
400 000
600 000
800 000
1 000 000
1 200 000
Lump sumcontribution
Per studentamountcontribution

Jan Herczyński Financing Decentralized Education in Macedonia
Page 28/49
of relevant questions, which can only be clarified through an open informed discussion of
education stakeholders in Macedonia. Additionally, it is of great interest to review how this
additional allocation to small municipalities is used. These issues, again, should be discussed
by the Macedonian experts in the light of more detailed and specific information.
2.4. Review of the application of the buffers
A fundamental question to be asked whenever an education finance system uses the upper or
lower buffers is the following: how many municipalities receive funds according to the
formula itself, without interference of the buffers, and how many receive the funds according
to the upper or lower buffer.
The reason why this question is so important is as follows. In general, we assume that the
formula selected by the Ministry reflects correctly the differentiated needs of the
municipalities and therefore provides an optimal – from the point of view of the Ministry –
allocation of funds. The buffers are used in two situations. The first arises in the early years of
the functioning of the formula, when there is still a difference between what the Ministry
considers optimal and what are the inherited needs of schools in different parts of the country.
If for example in a number of municipalities prior to the introduction of the new per student
formula there had been systematic over-employment of teachers (for whatever reason), than
the allocation formula should not recognize this fact, so as not to perpetuate it, and as a result
the formula will allocate not enough funding to finance overstaffed schools. In this situation
one can use the lower buffers to prevent sudden decrease of allocation. For example, one can
decide that whatever the formula will allocate, the municipality will for a few years receive no
less than 95% of previous year’s allocation. Such a slow decrease will give the municipality
enough time to restructure school employment to align it with the national standards. For such
a strategy to effective, however, the municipality must know that it receives funds according
to the lower buffer rather than according to the formula itself, so it has sufficient knowledge
and understanding to be able to address the structural problems of its local school system. The
strategy will also not be effective if the municipality assumes that the buffers will protect its
excessive spending forever.
A reverse situation arises if in a given municipality historical costs for whatever reasons were
significantly lower than the current per student allocation formula assesses for that
municipality. In such a case providing too much funds to the municipality may be inefficient,
because it is not easy to suddenly expand education spending in a rational way. Search for and
employment of new teachers and of new staff should proceed gradually, so that any new
additions to the school work force are used in an optimal way. In such a case, one will use
upper buffers, of course. Similarly to the previous example, the buffers should be used for a
limited period only.
The buffers may be used also for a different reason, when the Ministry is uncertain of its
formula and is still conducting or requesting research into a better, more fair and equitable
formula, or when there is financial crisis and the Ministry needs to reduce spending, but does
not want to abandon the established per student financing system. The last case seems to have
occurred in Macedonia in 2010.

Jan Herczyński Financing Decentralized Education in Macedonia
Page 29/49
In any of the above scenarios, the knowledge of which municipalities receive funds according
to which buffer is essential both for the Ministry and for the municipalities. If most or a large
number of municipalities receive funds according to the buffers, then the impact of the actual
formula on the allocation is very limited and the main driver of the allocation resides in the
history. A possible policy response to this situation is to adjust the formula. If most or all
municipalities receive funds according to the formula, without intervention from the buffers,
then perhaps the buffers and no longer relevant and should be abandoned. In either case, it is
important to identify and review the municipalities receiving allocation according to either the
upper or the lower buffer.
Such a discussion was not recently conducted in Macedonia, and the purpose of the present
chapter is to address these issues. In the future, such discussions need to be performed every
year by the Ministry in dialogue with the representatives of local governments and of national
experts.
Given the limitations of the data, we conduct our analysis for three consecutive years, namely
2009, 2010 and 2011, and only for primary education. The education grants for each
municipality, irrespective of their nature (categorical or block), are defined each year in the
budget law according to the formula and using the buffers. If there are budget amendments
during the fiscal year, due for example to movement of a municipality to phase II of
decentralization, or to an increase of teacher salaries, then the corrected values of the grants
no longer are based on the original formula and are not taken into account.
The values of the education grants for primary education are compared to the grants allocated
in the previous year, in order to assess whether they differ from the previous year’s grants
within the limits prescribed by the buffers. Of course, as discussed in the previous subsection
the comparison is only possible if in the two successive fiscal years a given municipality
received grants of the same type, either categorical or block. If this condition is not met, no
comparison is possible. The values of the buffers are provided in Table 8 for categorical
grants and in Table 14 for block grants, and are summarized in Graph 6.
The analysis reveals a few unexpected facts:
• In 2010, three municipalities (out of 10) in the first phase of decentralization received
allocation at the level above 90% of their 2009 categorical grants. This is above the
upper buffer of 84% stated in Table 8. It probably represents either some special
consideration, for example some increase of the categorical grant during the 2009 year
for unspecified reason, or a calculation error.
• In 2011, 4 municipalities (out of 7) in phase I had their allocation at the level of
92.62% of their 2010 categorical grant. This is significantly less than the value of
102.5%, stated in Table 8. We probably can conclude that actual lower buffer in that
year was 92.62%.
• In 2010, about twenty municipalities in the second phase had their allocation at the
level 96.95% of their 2009 block grant. This is clearly below the lower buffer of
102.0% indicated in Table 14. The number of municipalities involved allows us to
assume that the buffer actually used was 5.05% lower than 102.0%, stated in Table 14.
• In 2011, for almost 20 municipalities the allocation was at the level of 110.26% of
their 2010 block grant. This strongly suggests that the actual upper buffer was 3.46%
more than 106.8% stated in Table 14.

Jan Herczyński Financing Decentralized Education in Macedonia
Page 30/49
We need to stress that the conclusions reached here are somewhat uncertain and need to be
verified with the Ministry. Indeed, it is not possible to say with certainty whether the 3 special
cases of rather high allocation of categorical grants in 2010 (first bullet point above) is due to
some special consideration or a calculation error. It is precisely such issues which need to be
identified and agreed between education stakeholders during public debates. In what follows
we assume that these refer to special considerations and that all 3 municipalities received
allocation equal to upper buffer.
The remaining cases are less troublesome to review, given the number of very similar cases.
This allows us to conclude that actual buffers used for primary education between 2009 and
2011 were as follow14:
Table 25 Stipulated buffers for categorical and block grants
2009 2010 2011
Categorical Lower buffer 113.00% 75.00% 92.62%
Upper buffer 119.00% 84.00% 106.00%
Block Lower buffer 108.45% 96.95% 102.70%
Upper buffer 111.40% 105.00% 110.26%
Of course, if the buffers used for primary education were indeed as in Table 25, then also
Graph 6 needs to be adapted.
Now we assume that Table 25 correctly represents the lower and upper buffers used for
categorical and block grants. The analysis of allocated grants is summarized in the following
Table 26, which provides the numbers of municipalities either at the upper or lower buffer
(municipalitis for which the buffers did intervene) or between the buffers (municipalities for
which the buffers did not intervene).
Table 26 Interference of buffers on allocation of grants for primary education (# of municipalities)
2009 2010 2011
Phase I
(categorical grants)
At lower buffer 10 0 4
Between buffers 1 7 3
At upper buffer 5 3 0
Phase II
(block grants)
At lower buffer 24 25 0
Between buffers 6 40 46
At upper buffer 21 0 21
Not comparable 16 8 9
To review Table 26, we first recall that an application of buffers is possible only if in the
given and previous year the type of grant received by the municipality is the same (either
categorical or block, see discussion in the previous section following Graph 6). Movement
from phase I to phase II explains why every year there are some municipalities which cannot
be compared with the previous year (the last row of Table 26).
The application of buffers yielded very different results in every of the three studied years. In
2009, for municipalities in both the first and the second phase the situation is rather similar:
vast majority of municipalities received funds at either the lower or the upper buffer. Indeed,
out of 67 municipalities for which the comparison can be made, only 7 (of which one in phase
14 Note that buffers of 2009 did not need any corrections In Table 25.
Jan Herczyński Financing Decentralized Education in Macedonia
Page 31/49
I) received the funds according to the formula. For 60 municipalities the formula allocated
either too much or too little funds relative to the previous year, and the buffers intervened.
This clearly creates some doubts: either the formula is not functioning properly, or the buffers
are too narrow.
In the following 2010 year the situation is very different. Recall that this is the year of
financial crisis and of decreased allocation for material expenditures. We note that in phase I,
3 municipalities are at the upper buffer and 7 are between buffers. Here we see joint effects of
the decreased allocation through the per student amount (see Table 6) and through the
decreased buffers (see Table 8). In those municipalities, where the smaller per student amount
did not succeed in reducing the allocation sufficiently, the upper buffers intervened to push
them further down. In the second phase a different story occurred. A decrease of the lump
sum resulted in decreased allocation, and since the buffers were not significantly reduced
(with lower buffer at the level of 97%, see Table 25), the lower buffer intervened to protect
the allocation from falling even further. No municipality in the second phase had an allocation
at the upper buffer level.
The following year sees limited financial recovery in Macedonia and the overall allocation for
primary education is somewhat increased. For municipalities in phase I, however, Table 26
provides a rather unclear picture. Indeed, despite the increases of lump sum and per student
amount (see Table 6) we still have a number of municipalities who have lower allocation than
in 2010, and 4 of them need to supported with the lower buffer (without the buffers they
would receive even less). For the second phase, the increases dictated by lump sum and per
student amount (see Table 13) become rather strong and upper buffer is used to limit them. In
contrast to 2010, not a single municipality is at the level of the lower buffer.
The preceding analysis raises perhaps more questions than it provides answers, and this is
because one needs more knowledge about the intentions of the Ministry of Education to
assess its education finance policies. And in any case, these are discussions which have to
take place between education stakeholders of the country. The review of the application of the
buffers provided here should serve as an example, and not as a definite judgment.
2.5. Equity of the allocation formulas
The analysis of the relative contribution of the lump sum and different weights based on
population density to the overall allocation of education grants, presented in subsection 2.3,
did not use the buffers (indeed, the intervention of the buffers affects each contribution to the
allocation of education grants, so the different contributions can no longer be analyzed
separately). In subsection 2.4 we reviewed the application of buffers, focusing on which
buffers intervened in the allocation process and affected how many municipalities. The
formula (including the lump sum and the weights affecting per student amount) and the
buffers were discussed separately and independently of each other.
In the present subsection, we finally analyze the results of the complete allocation process,
including the effects both of the formula and of the buffers. This means we can no longer
ignore which municipality is in which phase of decentralization (the approach which made
our analysis of the lump sum, in subsection 4.3 relatively easy). Our primary concern is the

Jan Herczyński Financing Decentralized Education in Macedonia
Page 32/49
equity or justness of allocation. As in the previous two subsections, we review only primary
education.
Clearly equity issues in education are always very complex and their complete analysis
requires, among others, knowledge of different needs of students in different municipalities
and information about the extent to which these needs have been satisfied. In Macedonian
context, for example, such an analysis would include the different needs of students coming
different ethnic backgrounds and from differently education and situated families. This is a
complex problem going beyond the present report. Instead, we focus on equity in one rather
sense, which will allow us to provide some simple analysis. Following the approach already
used in subsection 2.3, we move from per student allocation to per class allocation and review
how differentiated is the per class allocation for primary education between different
municipalities, separately for categorical grants and for block grants (separately for
municipalities in the first and second phase of decentralization).
The nature of equity problems means that instead of looking of averages of groups of
municipalities (as we had done in previous subsections) one needs to take into account each
municipality. Therefore, to make further discussion readable, we provide graphs instead of
long tables. Moreover in order to limit the number of graphs, we discuss only two years,
namely 2008 (the first year of operation of block grants) and the current year 2011. We
analyze the allocation of education grants to municipalities, so the data we use come from the
yearly budget laws. For our purpose therefore the key information is which municipality
belonged to which phase of decentralization on January 1. Any subsequent changes in the
budgets, including passage of some municipalities to the second phase, are not taken into
account in the discussion below.
We first review the allocation of funds for categorical and block grants for primary in 2008.
On the following graphs, each municipality is represented by a dot (if it is in the first phase, it
appears in Graph 10, if it is in the second phase, it appears in Graph 11). On the X-axis the
average class size in primary schools is marked, while the Y-axis shows per student
allocation.
Graph 10 Class sizes and per student allocation for categorical grants, 2008
0
2 000
4 000
6 000
8 000
10 000
12 000
14 000
16 000
9 11 13 15 17 19 21 23 25 27 29
Categorical 2008 per student

Jan Herczyński Financing Decentralized Education in Macedonia
Page 33/49
Graph 11 Class sizes and per student allocation for block grants, 2008
The two graphs show rather striking differences. We know from analysis conducted in
previous subsections that the allocation process in Macedonia includes two strong
mechanisms to support small rural municipalities, namely the lump sum and weights based on
population density. It is also assumed that municipalities with low population density will
usually have small class sizes. We therefore expect that per student allocation for
municipalities with small classes will be higher and for municipalities which are more densely
populated it will be lower. This is indeed the case for the block grants (Graph 11), but not for
the categorical grants (Graph 10).
There may be two reasons for this counterintuitive behavior: either the use of buffers limits
the allocation for some sparsely populated municipalities, or there are some municipalities
which have reasonable population density (and therefore rather low weight based on
population density applies to them). Most likely both reasons apply in some measure. The
second reason is apparent from the following graph, in which the position of each
municipality is determined by its population density (X-axis) and average class size in
primary schools (Y-axis). Only municipalities with relatively low population density (under
300 inhabitants per square kilometer) are included.
0
20 000
40 000
60 000
80 000
100 000
120 000
9 11 13 15 17 19 21 23 25 27 29
Block 2008 per student
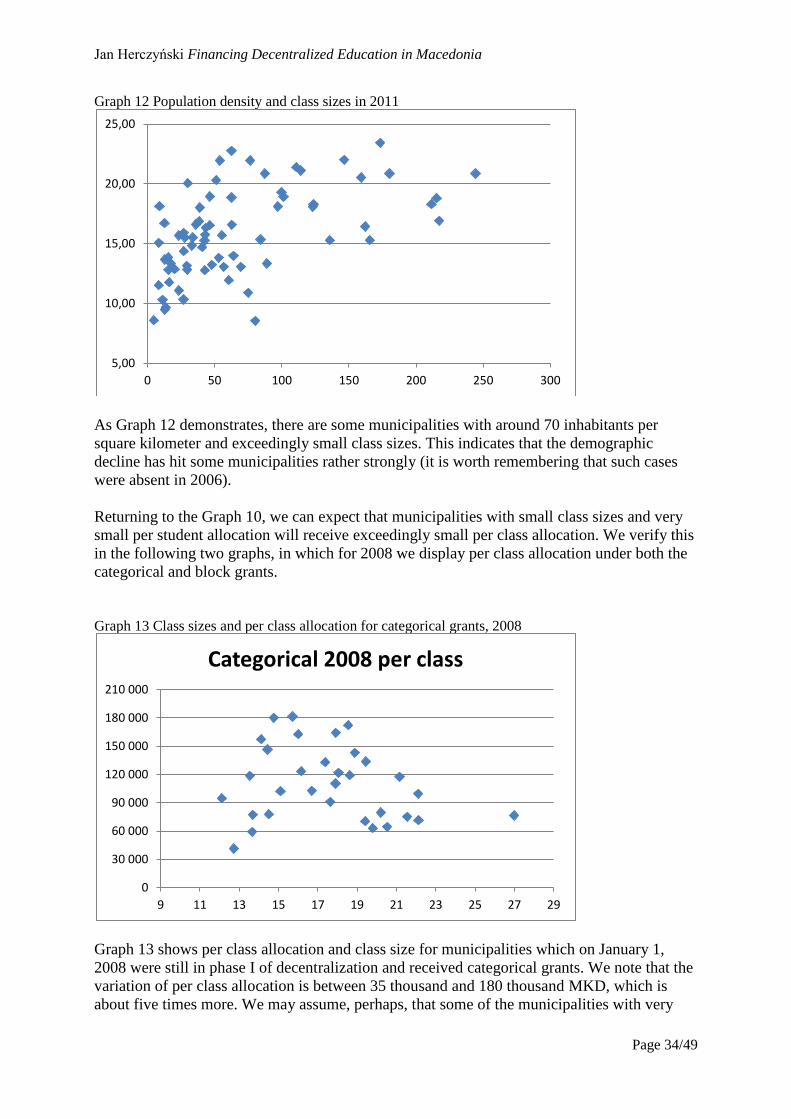
Jan Herczyński Financing Decentralized Education in Macedonia
Page 34/49
Graph 12 Population density and class sizes in 2011
As Graph 12 demonstrates, there are some municipalities with around 70 inhabitants per
square kilometer and exceedingly small class sizes. This indicates that the demographic
decline has hit some municipalities rather strongly (it is worth remembering that such cases
were absent in 2006).
Returning to the Graph 10, we can expect that municipalities with small class sizes and very
small per student allocation will receive exceedingly small per class allocation. We verify this
in the following two graphs, in which for 2008 we display per class allocation under both the
categorical and block grants.
Graph 13 Class sizes and per class allocation for categorical grants, 2008
Graph 13 shows per class allocation and class size for municipalities which on January 1,
2008 were still in phase I of decentralization and received categorical grants. We note that the
variation of per class allocation is between 35 thousand and 180 thousand MKD, which is
about five times more. We may assume, perhaps, that some of the municipalities with very
5,00
10,00
15,00
20,00
25,00
0 50 100 150 200 250 300
0
30 000
60 000
90 000
120 000
150 000
180 000
210 000
9 11 13 15 17 19 21 23 25 27 29
Categorical 2008 per class

Jan Herczyński Financing Decentralized Education in Macedonia
Page 35/49
small allocation have schools heated with wood, which is the cheapest form of school heating.
This is relevant because heating costs constitute a large percentage of overall material costs.
Nevertheless, fivefold difference in per class allocation is rather extreme.
The following graph displays the same information for the municipalities in the second phase
of decentralization as of January 1, 2008.
Graph 14 Class sizes and per class allocation for block grants, 2008
We note that contrary to the categorical grants, the block grants have much lesser variation,
which ranges from about 600,000 MKD to about 900,000 MKD on a per class basis. Thus we
are talking about the variation in the range of 50%.
We now move into 2011 (skipping the two year in between). As before, we begin with two
graphs showing per student allocation. Of course, there were many more municipalities in the
second phase on January 2011 than 4 years earlier. That is why the number of municipalities
(dots on the graph) on the Graph 15 is much lower than on Graph 10, and conversely, on
Graph 16 so much less than on Graph 11.
400 000
600 000
800 000
1 000 000
1 200 000
9 11 13 15 17 19 21 23 25 27 29
Block 2008 per class

Jan Herczyński Financing Decentralized Education in Macedonia
Page 36/49
Graph 15 Class sizes and per student allocation for categorical grants, 2011
Graph 16 Class sizes and per student allocation for block grants, 2011
We note that the reduction of the number of municipalities in the first phase between 2008
and 2011 led to some alignment of the class sizes and per student allocation. However, we
still can note that for some municipalities with on average 10 students in class per student
allocation is over 60,000, while for others it may be even 100 thousand. This in turn has an
impact of equity, as the following two graphs demonstrate.
0
2 000
4 000
6 000
8 000
10 000
12 000
14 000
16 000
9 11 13 15 17 19 21 23 25 27 29
Categorical 2011 per student
0
20 000
40 000
60 000
80 000
100 000
120 000
9 11 13 15 17 19 21 23 25 27 29
Block 2011 per student

Jan Herczyński Financing Decentralized Education in Macedonia
Page 37/49
Graph 17 Class sizes and per class allocation for categorical grants, 2011
Graph 18 Class sizes and per class allocation for block grants, 2011
Graph 17 shows that the remaining few municipalities in the first phase of decentralization
receive around 90 thousand MKD per class, with some variation. The equity in the second
phase has however worsened. We register about double variation of per class allocation for
some groups of municipalities.
It thus seems that the progress of decentralization shifted some problematic municipalities,
that is municipalities with reasonable density and very small class sizes, from the first phase
to the second phase. Basic problems of equity have not been resolved by this process.
To conclude, we see that the allocation process, including the formula and the buffers, does
indeed reward municipalities with smaller classes, but this is not done consistency and does
not ensure equity. Not all municipalities with small average class sizes are equally supported.
Education stakeholders in Macedonia should be engaged in public discussions regarding the
reasons for this, in order to identify key issues and adopt some measures to strengthen equity.
0
30 000
60 000
90 000
120 000
150 000
180 000
210 000
9 11 13 15 17 19 21 23 25 27 29
Categorical 2011 per class
400 000
600 000
800 000
1 000 000
1 200 000
9 11 13 15 17 19 21 23 25 27 29
Block 2011 per class
Jan Herczyński Financing Decentralized Education in Macedonia
Page 38/49
3. Education grants and education expenditures
In the preceding section we have reviewed in some detail the allocation of education grants in
the first and in the second phase of decentralization. This means we have reviewed the
application of the allocation formulas (or of their parts, such as the lump sum and the buffers),
as expressed in the allocation at the beginning of the fiscal year, and set in the budget laws.
The analysis of education expenditures is a rather different task, because we need to take into
consideration not just the budget law, but at the same time actual revenues of municipalities
from the grants received throughout the fiscal year and actual expenditures done throughout
the fiscal year. For that reason we limit our review to the last year for which complete data are
available, namely 2010, as well as to total expenditures (without taking into account their
division on salaries and related costs, on material, energy and similar). Unfortunately, as we
had already discussed above (see section 2.2), 2010 was a year of financial constraints, which
inevitably will appear in the analysis.
We first note that because of the staggered movement to the second phase, a number of
municipalities have received both categorical grants and block grants in 2010. This happens
when on January 1 a municipality is in phase 1, and then it moves to the second phase. The
budget law, of course, allocates it a categorical grant (or perhaps two categorical grants, for
primary and secondary education), and this is what the municipality receives for the first few
months. When in the middle of the fiscal year the municipality moves to the second phase, it
stops receiving the categorical grant and begins to receive much larger block grants. As a
result, in the budget reports it lists both types of grants in its revenues. In 2010 this happens
for 6 municipalities.
An aside question concerns the allocation of these block grants for a part of the fiscal year.
Clearly, the allocation formula no longer applies, since it is designed to allocate full year’s
funding. One can assume that the amounts of the block grant in such cases are composed of
the remaining categorical grant for the coming months, not yet transferred to the municipality,
and the remaining funds planned for the salaries of the school staff, also for the coming
months. Such an approach would provide stability of funding without the need to devise
complex formulas, but we do not know if it has in fact been adopted.
In any case, for the municipalities which have moved to the second phase in the middle of the
fiscal year the analysis of expenditures is complicated and is not undertaken here.
Our first step is the review of the allocated education grants and the grants transferred to
municipalities. We consider municipalities which remained in the same phase throughout the
year 2010, these are 10 municipalities in phase 1 and 68 municipalities in phase 2 (this
includes the city of Skopje). We use the data from the MLGA/USAID Municipal Finance
Database, populated with the data coming from the Treasury Department of the Ministry of
Finance and based on yearly budget reports. These budget reports list actual revenues and
expenditures of all municipalities by sector and by economic classification.
It turns out that all 10 municipalities in phase 1 received through the categorical grants less
funds than was allocated to them in the budget law. The shortfall was almost uniformly 9.5%
of the allocated funds (in a few cases for grants for primary education the shortfall was lesser,
between 5.5% and 8.2%). It therefore seems that the Ministry of Finance conducted a
systematic policy of cutting the allocated categorical grants by 9.5%. Certainly this reduction
was defined in one of budget amendments during 2010.

Jan Herczyński Financing Decentralized Education in Macedonia
Page 39/49
For the 68 municipalities in phase 2 the situation is different. For primary education, all of
these municipalities received more funds than was allocated to them in the budget law. The
surplus was usually 3.2% (28 municipalities) or 5.2% (27 municipalities), with the rest
receiving surplus between these two values (two exceptional municipalities received less than
3.2% surplus). For secondary education, all the municipalities which have secondary schools
(there are 26 of them) received less funds than was allocated, with the shortfall equal to 1.3%.
In order to understand this situation, we have to go back to our analysis of the lump sums
(Table 6, Table 11) and the buffers (Table 8). We have argued that in 2010 the allocation of
the categorical grants was decreased in response to financial crisis, while allocation of the
block grants was maintained in order to protect the salaries. It seems that the crisis was more
severe than the Ministry of Finance anticipated when drafting the budget law, and this forced
even greater reduction of the categorical grants than originally planned (additional reduction
of 9.5%). The very small shortfall for secondary schools and the surplus for primary schools
of the block grants show that the Ministry of Finance maintained its policy during the fiscal
year.
It is thus evident that the expenditures should be compared not to the grant allocation, stated
in the budget laws, but to education grants actually transferred to municipalities.
In order to review the expenditures it is necessary to recall that Macedonia budget
classification provides the division of the budget funds into so called accounts (smetka in
Macedonian), a specific feature of budget classification used in Macedonia, which allows to
align expenditures with revenues. The main accounts used in education are grants, the funds
allocated from the grants received by the municipality, budget, the funds allocated from the
municipal budget, and self-financing, the funds received by various institutions for services
they render (in education, typically from the renting of property, for secondary schools from
so called participation fee, and in case of vocational schools also from the sale of services and
products). The funds from self-financing are typically used by the schools themselves, but the
municipality knows these revenues and could take them into account in deciding on the levels
of financing of its schools. In our review therefore we take into account all three accounts, to
reflect the contribution from the central budget (categorical or block grants), from the
municipal budget and from own revenues of the schools.
The overall level of contributions from the municipal budget is about 1.6% of expenditures on
primary education, and from own revenues of schools – about 2.9%. This is very little, of
course. However, the distribution of these funds is highly non-uniform, which means that in
some municipalities they are very significant.
The following tables provide the numbers of municipalities, separately in phase 1 and in
phase 2 throughout the 2010 year, depending on how their expenditures differed from the
received funds. First we note that the number of municipalities which had spent less than
received in grants, and thus had to return some funds back to the Ministry of Finance at the
end of the year, is very small indeed (Table 27 takes into account only grant account).
Table 27 Number of municipalities which spent less than received in 2010
Education expenditures as % of received grants Phase 1 Phase 2
Between 96% and 97% 3 1
Between 99% and 100% 1

Jan Herczyński Financing Decentralized Education in Macedonia
Page 40/49
Table 27 is quite important because it shows that contrary to what many local government
officials believe, the practice of under-spending and returning the funds back to the Ministry
is very limited.
The following table, unlike Table 27, includes contributions from budget account and from
self-financing account.
Table 28 Number of municipalities which spent more than received in 2010
Education expenditures as % of received grants Phase 1 Phase 2
Between 100% and 101% 2 11
Between 101% and 102% 0 19
Between 102% and 103% 1 10
Between 103% and 105% 2 10
Between 105% and 110% 0 11
Between 110% and 120% 0 4
Above 120% 1 0
The one municipality which contributed above 20%, listed in the last row of Table 28, is in
fact Ohrid, which contributed over 70% of the received grant, almost exclusively from the
budget account. This is a special case, of course, because it is a rich city which is still in the
first phase of decentralization, so the value of the categorical grant it receives is not very high.
In monetary terms, Ohrid contributes less than very rich Skopje municipalities, but it is more
in relative terms.
The municipalities which contribute the most are rich cities. For example, Karposh
contributes 20% of the grant it receives, Centar 17% (both are municipalities in Skopje), and
Berovo 11%. It is interesting to note that while overall levels of local contributions to
received grants is very small, in phase 2 there are 15 municipalities which contribute more
than 5% and 4 which contribute more than 10%. It seems fair to conclude that there is a clear
commitment to provide students with improved education, constrained on the one hand by the
lack of sufficient disposable resources (see Levitas 2009), and on the other hand by
limitations of managerial powers of municipalities (which we discuss in the following
section).
Finally, we consider the situation of small, rural municipalities. Based on the preceding
analysis, we should expect that their local contributions are very small. The following graph
provides for each municipality the average class size (X-axis) and the education expenditures
as % of the received grants. We limit the review to municipalities with small classes (under 16
students in the class).

Jan Herczyński Financing Decentralized Education in Macedonia
Page 41/49
Graph 19 Class sizes and local contributions to received grants, 2010
We see that municipalities with small class sizes contribute to the received education grants,
sometimes very significantly. These are usually poor municipalities, and find it much more
difficult to find the required funds in their budgets than, for example, Skopje municipalities.
However, at the same time these are the municipalities which often receive insufficient per
class allocation, as we have seen in Graph 18. This raises the possibility that relatively high
local contributions, much higher than the national averages, are the effect of inadequate
allocation of the grants. It may be the case that these municipalities are forced to supplement
education grants with own funding, even though they are poor. This worrying prospect, like
many issues which were raised in the present report, needs to be addressed by Macedonian
experts in public discussions and through scrutiny of available data.
4. The limitations of the second phase of education decentralization
As discussed from the very beginning of the present report, decentralization process in
Macedonia is proceeding in two phases. The first phase is much more limited, because it
includes only material expenditures, in contrast to the second phase, when decentralized
functions include also salaries. This difference is especially significant in education, where
teacher salaries are the dominant part of school budgets. As we have argued in the
introduction, the movement to the block grants should be accompanied by greater authority of
the municipality to efficiently manage all education assets, including teachers and other staff.
It therefore seems reasonable to expect that the impact of the first phase on the functioning of
the sector was much smaller than the impact of the second phase. However, it seems that the
contrary is actually occurring.
The entry of Macedonia into the first phase of decentralization meant, despite the clear
limitations of the categorical grants, that municipalities became responsible for a large
number of important education functions:
• Management of buildings, including facility ownership. The transfer of ownership was
a long and slow process, but it brought real change in the relations between the
municipalities and the schools. As legal owners of buildings and equipment, local
95%
100%
105%
110%
115%
8 9 10 11 12 13 14 15 16

Jan Herczyński Financing Decentralized Education in Macedonia
Page 42/49
governments can undertake now many activities, for which they were not responsible
before, including maintenance, small repairs, changing the way the facilities are being
used, restructuring of some areas of school buildings and of school land. Through this
they have assumed a much stronger position vis-à-vis the school directors, who were
used to dealing only with the Ministry in Skopje.
• Strong influence on the process of selection of school directors. Although limited by
legal procedures, the mayor is the key figure now when the selection process for new
school director begins. Over time, the school directors are going to be increasingly
responsive to mayoral decisions and expectations.
• Network of schools. This is an extremely important education function, and it
includes, in particular, maintaining or consolidation of small rural schools, as well as
decisions on vocational profiles in secondary education. Again there are legal
limitations to municipal power, for example the decision to close a school must be
approved by the Ministry. Nevertheless, with these new responsibilities municipalities
have become more active and forward looking owners of schools.
• Student transportation, including the right to select service providers, change the
routes and schedule of transportation, and adjust the services every year to the
changing needs of students. This is especially important if the municipality considers
school network consolidation.
We thus see that the first phase of decentralization was accompanied by real and significant
increase of powers of municipalities. These new managerial responsibilities of local
governments, as opposed to purely financial responsibilities (still limited with the categorical
grants), had meant that the beginning of the first phase was a real breakthrough, in line with
the provisions of the Ohrid agreement.
No such change in the management responsibility of local governments in education occurred
as the country moved towards the second phase, despite high expectations. Indeed, the
following are the main new responsibilities which could have been expected to be entrusted to
municipalities in the second phase:
• The right to decide on the staffing levels of schools, including the right to hire new
specialists (psychologists, speech therapists, social assistance staff etc.) within the
available budgets.
• The right to augment, within legally prescribed limits, teacher and non-teacher
salaries.
• The right to freely decide – and later change that decision if necessary – how to use
the block grants, in particular what proportion of the grants should go for salaries and
what for material expenditures.
These expectations have not been fulfilled. As a result, although it seems rather strange to say
this, the second phase of decentralization process in Macedonia was no accompanied by a real
increase of managerial authorities of local governments in education. The key two areas of
new responsibilities, namely teacher employment and teacher remuneration, are still
controlled very tightly through the Ministry of Finance (through the services on the national
employment agency) and the national treasury system, respectively. The role of local
governments in these two areas is largely reduced to maintaining the staff registry and being
formal payment agency for salaries.

Jan Herczyński Financing Decentralized Education in Macedonia
Page 43/49
Local governments complain, for example, that if a teacher retires, they are not allowed to
hire a replacement, and the funds planned for her or his salaries cannot be utilized by the
municipality (and will be returned to the central budget at the end of the fiscal year). The
Ministry of Finance (using the State Agency for Employment) exercises strict control over
employment levels in all schools. The Treasury System is an effective control mechanism
limiting the decision making powers of municipalities. This means that legal conditions
regulating the functioning of decentralized sectors are still tuned to a very strongly centralized
approach and leave little room for local decision making. But even more importantly, this
means that the entry into the second phase of decentralization changed very little in the local
management of schools.
These serious limitations of the decentralization process are not merely formal. Indeed, one of
key benefits of education decentralization is the ability of local governments to use the
available resources more efficiently. There are two necessary steps to achieve such efficiency:
network consolidation and employment restructuring. By consolidating the network, local
government can free resources which before were very inefficiently used to provide inferior
teaching to very small groups of children. By restructuring the staffing levels, local
governments may find better and more efficient use for these freed resources. The principle of
per student grants is to support these related activities: as the grant is based on the number of
students, not on the number of facilities or teachers, consolidation of the network does not
lead to a decrease of the allocated funds. This means that the freed funds should stay at the
local level and may be put to more efficient use. Very unfortunately, the municipalities are
allowed to consolidate school networks but not to restructure school employment. In a word,
this legal regulation defeats the purpose of decentralization.
This brief review of the limitations of the second phase of decentralization leads us to the
conclusion that what Macedonia really needs now is the third phase of decentralization. By
this we means a phase in which the increased financial responsibilities of local governments,
achieved during the second phase through the block grants, will be complemented by the
relevant managerial responsibilities.
The design of the third phase of decentralization, clearly, falls outside the scope of the present
report. It can be stipulated, however, that this design must take into account the experience of
decentralization in every sector, not only in education, because new rules of the game should
be common to different sectors and institutions. Education is of course very important in this
respect, because it accounts for a very large proportion of block grants and of municipal staff.
But it is important to identify and understand the specific limitations of the second phase of
decentralization in the areas of culture and social assistance. The slow and staggered progress
of the second phase (see section 1) also supports the idea to design the third phase without any
preconditions, so that all municipalities can enter it at the same time. Thus the design of the
third phase, unlike the design of the first and second phases, should build upon the actual
experience – both positive and negative – of the 7 year long decentralization process in
Macedonia.
5. Education finance in Macedonia in international perspective
In the present chapter we provide a brief comparison of education expenditures in Macedonia
to expenditures in OECD countries. Of course, each country faces its own challenges and
problems, and needs to find appropriate responses using its own standards and procedures. In

Jan Herczyński Financing Decentralized Education in Macedonia
Page 44/49
the case of Macedonian education finance, this includes the specific traditions of management
and financing of schools (including the so called participation fee charged by all secondary
schools in Macedonia), the fiscal challenges of the prolonged transition period (with special
emphasis on the fiscal crisis of 2010, as discussed in previous sections), as well as the
decentralization process (discussed in the previous section). Nevertheless, it is useful to
review some basic indicators in the international context.
We review three such indicators. The share of GDP spent on primary and secondary education
indicates overall financial commitment of the country to providing education to its children
and youth. High share shows that a country spends relatively large funds on education, while
a low share suggests that the country is relatively under-financing the sector. The indicator is
relative to the wealth of the country, so it is comparable across countries with very different
levels of economic development. However, it may be biased because of different age structure
of different populations (countries with fewer children need to spend on education relatively
less). A more precise and specific indicator is therefore average per student expenditures for
primary and secondary education, expressed as percentage of GDP per capita. The final
indicator we review concerns the per student expenditures on secondary education compared
to expenditures on primary education. This indicator allows to assess relative financing of
different levels of education. It would be very useful to include also tertiary education in these
comparisons, but this topic falls outside the present report. The source for international
comparison used here is annual OECD publication, Education at a Glance, see OECD 201115.
The following Table provides percentages of GDP spend on primary and secondary education
in Macedonia in recent years (data for 1998 and 2003 from Herczyński et al. 2009, data for
2010 calculated on the basis of data from the Ministry of Finance).
Table 29 Public expenditure on education in Macedonia relative to GDP (%)
Year Education
Primary Secondary Total
1998 2.31 0.88 3.19
2003 2.05 0.79 2.84
2010 1.83 0.87 2.70
To put above information into proper international perspective, we provide selected data from
OECD education indicators (OECD 2010). Data refer to year 2007.
Table 30 Public expenditure on education in selected OECD countries relative to GDP (%)
Country Education
Primary Secondary Total
Poland 2.4 0.9 3.3
Hungary 2.0 1.0 3.0
United Kingdom 2.8 1.5 4.3
Germany 1.9 1.0 2.9
OECD average 2.4 1.2 3.6
15 Education at a Glance is an established international benchmark for education indicators. Another important
set of indicators is provided in Europe in figures – Eurostat yearbook, published every year by Eurostat, the
European statistical office, and available at http://epp.eurostat.ec.europa.eu.
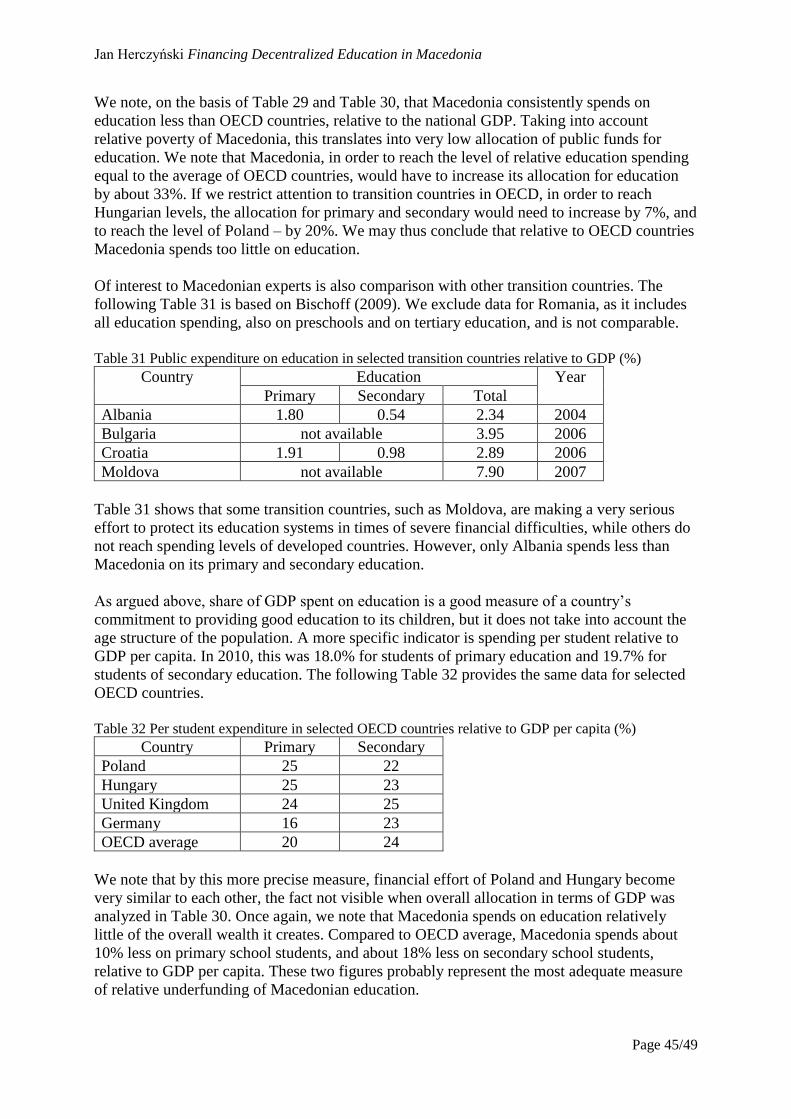
Jan Herczyński Financing Decentralized Education in Macedonia
Page 45/49
We note, on the basis of Table 29 and Table 30, that Macedonia consistently spends on
education less than OECD countries, relative to the national GDP. Taking into account
relative poverty of Macedonia, this translates into very low allocation of public funds for
education. We note that Macedonia, in order to reach the level of relative education spending
equal to the average of OECD countries, would have to increase its allocation for education
by about 33%. If we restrict attention to transition countries in OECD, in order to reach
Hungarian levels, the allocation for primary and secondary would need to increase by 7%, and
to reach the level of Poland – by 20%. We may thus conclude that relative to OECD countries
Macedonia spends too little on education.
Of interest to Macedonian experts is also comparison with other transition countries. The
following Table 31 is based on Bischoff (2009). We exclude data for Romania, as it includes
all education spending, also on preschools and on tertiary education, and is not comparable.
Table 31 Public expenditure on education in selected transition countries relative to GDP (%)
Country Education Year
Primary Secondary Total
Albania 1.80 0.54 2.34 2004
Bulgaria not available 3.95 2006
Croatia 1.91 0.98 2.89 2006
Moldova not available 7.90 2007
Table 31 shows that some transition countries, such as Moldova, are making a very serious
effort to protect its education systems in times of severe financial difficulties, while others do
not reach spending levels of developed countries. However, only Albania spends less than
Macedonia on its primary and secondary education.
As argued above, share of GDP spent on education is a good measure of a country’s
commitment to providing good education to its children, but it does not take into account the
age structure of the population. A more specific indicator is spending per student relative to
GDP per capita. In 2010, this was 18.0% for students of primary education and 19.7% for
students of secondary education. The following Table 32 provides the same data for selected
OECD countries.
Table 32 Per student expenditure in selected OECD countries relative to GDP per capita (%)
Country Primary Secondary
Poland 25 22
Hungary 25 23
United Kingdom 24 25
Germany 16 23
OECD average 20 24
We note that by this more precise measure, financial effort of Poland and Hungary become
very similar to each other, the fact not visible when overall allocation in terms of GDP was
analyzed in Table 30. Once again, we note that Macedonia spends on education relatively
little of the overall wealth it creates. Compared to OECD average, Macedonia spends about
10% less on primary school students, and about 18% less on secondary school students,
relative to GDP per capita. These two figures probably represent the most adequate measure
of relative underfunding of Macedonian education.

Jan Herczyński Financing Decentralized Education in Macedonia
Page 46/49
Finally, we turn to the comparison of per student expenditures on secondary education
relative to per student expenditures for primary education. Macedonia spends on the student
of secondary schools about 109% of what it spends on the student of primary education. The
following Table 33 provides this indicator for selected OECD countries.
Table 33 Relative per student expenditure for secondary education in OECD countries (%)
Per student expenditures on secondary education relative
to per student expenditures for primary education
Poland 88
Hungary 92
United Kingdom 104
Germany 144
OECD average 120
We see that on average OECD countries spend about 20% more on students of secondary
education than on students on primary education (as measured on per student basis).
However, Poland and Hungary, for historical reasons, spend less on secondary schools
students (see for example Levitas, Herczyński 2002).
We note that the additional spending on students of secondary schools in Macedonia
compared to spending on students of primary schools is somewhat smaller than the OECD
average, but is in line with many OECD countries. Unlike Poland and Hungary, therefore,
there is no need for Macedonia to reconsider its relative financing of primary and secondary
education.
Conclusions and recommendations
We consider three groups of recommendations: procedural, substantive and strategic.
Procedures recommendations regard the problem of timing of the formula ordinances, as
discussed in section 2.1. Substantive recommendations are focused on the issue of equity,
discussed in section 3. The strategic recommendations propose ways to overcome the
limitations of the second phase of decentralization, as discussed in section 4, by arguing for
the necessity of the third phase.
Procedural recommendations:
• Organize the public discussions of the ordinances with the allocation formulas in
September and October (section 2.1). This will require a change in the Law on Local
Government Finance, which stipulates that the discussions regarding the criteria,
procedures and timeframes for the allocation of grants are to be held in April. Such a
change will allow all concerned to use the current student numbers (collected from the
schools in mid-October) and the budget limits provided by the Ministry of Finance in
its Budget Circular letter in September.
• Public discussions of the allocation formulas should include all elements of the
formula, which means not just the coefficients as happens now, but also the lump
sums, per student amounts and the buffers. The debate should be conducted using
simulators prepared by the Ministry of Education or by ZELS. Values of all education
grants to all municipalities, under various assumptions and scenarios should be

Jan Herczyński Financing Decentralized Education in Macedonia
Page 47/49
available for scrutiny.
• As long as upper and lower buffers are used, the impact of the buffers on
municipalities should be assessed and discussed (section 2.3). Special consideration
should be given to municipalities which receive funds according to upper or lower
buffer. ZELS experts should be able to assess what happens to the allocation of funds
to municipalities if the buffers are increased or lowered.
Substantive recommendations:
• Review the cases of municipalities with relatively standard density and small class
sizes. If it is clear that the class sizes there can be increased through network
consolidation, the formula need not be adjusted. In the case that network consolidation
in these municipalities is either impossible or strategically undesirable consider
introducing new factors into the formula, beyond population density. Potential
candidates are elevation above the sea level, average size of the settlements, or
average distance between the schools (to name but a few options).
• Reduce the lump sum in the formula considerably, and direct more funds through the
coefficients based on population density and on possible new factors (such as ones
listed in the point above).
Strategic recommendations:
• Compared to OECD countries, and even to neighboring transition countries,
Macedonia spends relatively little on the education of its students, relative to its GDP
per capita. The underfunding may be assessed to be about 10% for primary education
and about 18% for secondary education. The Ministry should propose a strategy for
gradual increase of per student spending. In particular, the Ministry should resist any
significant expansion of secondary education without a corresponding increase of
allocation for these schools. While this may seem contrary to the goal of increasing
participation rates in full secondary education, the alternative strategies risk creating
very weak and academically inadequate secondary schools.
Certainly, part of this necessary additional allocation for education will be used to
increase teacher salaries, to make the professional more competitive and to attract and
retain qualified teachers. However, care should be taken to devise strategies how this
additional spending is used as an instrument to improve the quality of education, to
provide students with better equipment, with better books and teaching aids. A shift
away from teacher salaries towards other school expenditures should be planned.
• As the movement to the second phase of the decentralization process in Macedonia is
nearing completion, there is a need to plan the next steps. The second phase failed to
bring the expected transfer of managerial responsibilities for human resources in
education, and presumably in other sectors as well (section 4). On this basis it may be
recommended to start designing the third phase of decentralization, during which the
increased financial responsibilities of local governments will be matched by new
managerial responsibilities.

Jan Herczyński Financing Decentralized Education in Macedonia
Page 48/49
• The third phase of decentralization in Macedonia should be designed on the basis of
experience of all decentralized sectors, not only on that of education. However, to
avoid slow and staggered progress of the second phase (see section 1), it would be a
good idea to start it for all municipalities at the same time, and without cumbersome
pre-conditions which characterized the second phase.
• The key to successful design and implementation of the third phase of decentralization
is good identification of achievements and limitations of the second phase. The main
principle should be to allow municipalities more freedom to deliver decentralized
functions effectively and efficiently, within the context of their specific situation.

Jan Herczyński Financing Decentralized Education in Macedonia
Page 49/49
References
J. Alonso, A. Sanchez (eds.), Reforming Education Finance in Transition Countries. Six Case
Studies in Per capita Financing Systems, World Bank, Washington, 2011 (forthcoming)
C. Bischoff (ed.), Public Money for Public schools. Financing Education in South Eastern
Europe, OSI, Budapest 2009,
C. Bischoff, J. Herczyński, Financing Education in Romania. The Legacy of Incomplete
Reforms, in Public Money for Public schools. Financing Education in South Eastern Europe,
C. Bischoff (ed.), OSI, Budapest 2009,
J. Herczyński, J. Vidanovska and N. Lacka, The First Careful Step. Education
Decentralization and Finance in the Republic of Macedonia, in: C. Bischoff (ed.), Public
Money for Public Schools, Local Government Initiative, Budapest, 2009
J. Herczyński, Challenges of the Second Phase of Education Decentralization, processed text
MDW/USAID, Skopje, February 2007,
T. Levitas, Local Government Finance in Macedonia Today: Possible Reform for Tomorrow,
processed text MLGA/USAID, Skopje 2009
T. Levitas, J. Herczyński, Decentralization, Local Governments and Education Reform in
Post-Communist Poland, in Balancing National and Local Responsibilities. Education
Management and Finance in Four Central European Countries, K. J. Davey (ed.), OSI,
Budapest 2002,
T. Levitas, G. Peteri, Second phase of fiscal decentralization in FYROM. Strategy paper on
issues for 2008-2010, processed text, Skopje 2007
OECD, Education at a Glance 2010, Paris 2010 (available at www.oecd.org/edu/eag2010)
Sobranje na Republika Makedonija, Law on Local Government Finance of September 6,
2004. Skopje 2004
Urban Rural Consulting (URC), Report on the Fiscal Decentralization Process in the
Republic of Macedonia, processed text, Skopje 2007