
Predicting Mass Transfer in Liquid–Liquid Extraction Columns
17
Citation: Fells, A.; De Santis, A.; Colombo, M.; Theobald, D.W.; Fairweather, M.; Muller, F.; Hanson, B. Predicting Mass Transfer in Liquid–Liquid Extraction Columns. Processes 2022, 10, 968. https://doi.org/10.3390/pr10050968 Academic Editor: Agnieszka Zgola-Grze´ skowiak Received: 31 March 2022 Accepted: 11 May 2022 Published: 12 May 2022 Publisher’s Note: MDPI stays neutral with regard to jurisdictional claims in published maps and institutional affil- iations. Copyright: © 2022 by the authors. Licensee MDPI, Basel, Switzerland. This article is an open access article distributed under the terms and conditions of the Creative Commons Attribution (CC BY) license (https:// creativecommons.org/licenses/by/ 4.0/). processes Article Predicting Mass Transfer in Liquid–Liquid Extraction Columns Alex Fells 1, * , Andrea De Santis 1 , Marco Colombo 2 , Daniel W. Theobald 1 , Michael Fairweather 1 , Frans Muller 1 and Bruce Hanson 1 1 School of Chemical and Process Engineering, University of Leeds, Leeds LS2 9JT, UK; [email protected] (A.D.S.); [email protected] (D.W.T.); [email protected] (M.F.); [email protected] (F.M.); [email protected] (B.H.) 2 Department of Mechanical Engineering, University of Sheffield, Sir Frederick Mappin Building, Mappin Street, Sheffield S1 3JD, UK; m.colombo@sheffield.ac.uk * Correspondence: [email protected] Abstract: In this work, the GEneralised Multifluid Modelling Approach (GEMMA) is applied to the simulation of liquid–liquid extraction in a Rotating Disc Column (RDC) and a Pulsed Sieve-plate Extraction Column (PSEC). A mass transfer modelling methodology is developed, in which the multi- phase flows, droplet size distribution and dispersed phase holdup predicted with computational fluid dynamics are coupled to mass transfer correlations to predict the overall mass transfer. The numerical results for the stage-averaged dispersed phase holdup, Sauter mean droplet diameter and axial solute concentration in the RDC and PSEC agree with experimental observations. The proposed modelling method provides an accurate predictive tool for complex multiphase flows, such as those observed in intensified liquid–liquid extraction, and provides an alternative approach to column design using empirical correlations or pilot plant study. Keywords: multiphase flows; computational fluid dynamics; mass transfer; liquid–liquid extraction; solvent extraction; droplet population balance; pulsed column; pulsed sieve-plate extraction column; rotating disc column 1. Introduction Multiphase flows are found in countless industrial applications, spanning from power generation and chemical processes to food production and biomedical applications. In the context of the nuclear industry, multiphase flows also play a crucial role in current and advanced reprocessing technologies foreseen for the next generation of nuclear power plants [1]. Therefore, predicting the local and global transient evolution of multiphase flows is recognised to be of paramount importance for the nuclear industry at large [2]. Computational fluid dynamics (CFD) has the potential to provide improved pre- dictive capability of multiphase flows. This, however, is hindered by the complexity of the multiphase flows that are of interest to industrial applications. In particular, most multiphase flows of practical interest exhibit a broad range of interfacial scales, ranging from small dispersed phase elements (DPEs), such as particles, droplets or bubbles embed- ded in a continuous phase, to large interfaces observed in segregated free-surface flows. Off-the-shelf multiphase flow numerical models generally assume either small or large interfacial scales, resulting in the so-called interface-averaging and interface-resolving ap- proaches [3,4]. The former method is mainly used for dispersed flows where the interfacial scales are smaller than the size of the numerical grid; scale separation is assumed, and the governing equations are conditionally-averaged, resulting in the so-called multifluid formulation. Due to the averaging operation, suitable closures are needed to account for the interfacial transfer of momentum, heat and mass. Conversely, the interface-resolving approach assumes that the mesh size is small enough to allow for an adequate resolution of the morphology of the interface, which generally applies to large segregated interfaces; Processes 2022, 10, 968. https://doi.org/10.3390/pr10050968 https://www.mdpi.com/journal/processes
-
Upload
khangminh22 -
Category
Documents
-
view
3 -
download
0
Transcript of Predicting Mass Transfer in Liquid–Liquid Extraction Columns
Citation: Fells, A.; De Santis, A.;
Colombo, M.; Theobald, D.W.;
Fairweather, M.; Muller, F.;
Hanson, B. Predicting Mass Transfer
in Liquid–Liquid Extraction
Columns. Processes 2022, 10, 968.
https://doi.org/10.3390/pr10050968
Academic Editor:
Agnieszka Zgoła-Grzeskowiak
Received: 31 March 2022
Accepted: 11 May 2022
Published: 12 May 2022
Publisher’s Note: MDPI stays neutral
with regard to jurisdictional claims in
published maps and institutional affil-
iations.
Copyright: © 2022 by the authors.
Licensee MDPI, Basel, Switzerland.
This article is an open access article
distributed under the terms and
conditions of the Creative Commons
Attribution (CC BY) license (https://
creativecommons.org/licenses/by/
4.0/).
processes
Article
Predicting Mass Transfer in Liquid–Liquid Extraction ColumnsAlex Fells 1,* , Andrea De Santis 1, Marco Colombo 2 , Daniel W. Theobald 1, Michael Fairweather 1,Frans Muller 1 and Bruce Hanson 1
1 School of Chemical and Process Engineering, University of Leeds, Leeds LS2 9JT, UK;[email protected] (A.D.S.); [email protected] (D.W.T.); [email protected] (M.F.);[email protected] (F.M.); [email protected] (B.H.)
2 Department of Mechanical Engineering, University of Sheffield, Sir Frederick Mappin Building,Mappin Street, Sheffield S1 3JD, UK; [email protected]
* Correspondence: [email protected]
Abstract: In this work, the GEneralised Multifluid Modelling Approach (GEMMA) is applied to thesimulation of liquid–liquid extraction in a Rotating Disc Column (RDC) and a Pulsed Sieve-plateExtraction Column (PSEC). A mass transfer modelling methodology is developed, in which the multi-phase flows, droplet size distribution and dispersed phase holdup predicted with computational fluiddynamics are coupled to mass transfer correlations to predict the overall mass transfer. The numericalresults for the stage-averaged dispersed phase holdup, Sauter mean droplet diameter and axial soluteconcentration in the RDC and PSEC agree with experimental observations. The proposed modellingmethod provides an accurate predictive tool for complex multiphase flows, such as those observed inintensified liquid–liquid extraction, and provides an alternative approach to column design usingempirical correlations or pilot plant study.
Keywords: multiphase flows; computational fluid dynamics; mass transfer; liquid–liquid extraction;solvent extraction; droplet population balance; pulsed column; pulsed sieve-plate extraction column;rotating disc column
1. Introduction
Multiphase flows are found in countless industrial applications, spanning from powergeneration and chemical processes to food production and biomedical applications. In thecontext of the nuclear industry, multiphase flows also play a crucial role in current andadvanced reprocessing technologies foreseen for the next generation of nuclear powerplants [1]. Therefore, predicting the local and global transient evolution of multiphaseflows is recognised to be of paramount importance for the nuclear industry at large [2].
Computational fluid dynamics (CFD) has the potential to provide improved pre-dictive capability of multiphase flows. This, however, is hindered by the complexity ofthe multiphase flows that are of interest to industrial applications. In particular, mostmultiphase flows of practical interest exhibit a broad range of interfacial scales, rangingfrom small dispersed phase elements (DPEs), such as particles, droplets or bubbles embed-ded in a continuous phase, to large interfaces observed in segregated free-surface flows.Off-the-shelf multiphase flow numerical models generally assume either small or largeinterfacial scales, resulting in the so-called interface-averaging and interface-resolving ap-proaches [3,4]. The former method is mainly used for dispersed flows where the interfacialscales are smaller than the size of the numerical grid; scale separation is assumed, andthe governing equations are conditionally-averaged, resulting in the so-called multifluidformulation. Due to the averaging operation, suitable closures are needed to account forthe interfacial transfer of momentum, heat and mass. Conversely, the interface-resolvingapproach assumes that the mesh size is small enough to allow for an adequate resolutionof the morphology of the interface, which generally applies to large segregated interfaces;
Processes 2022, 10, 968. https://doi.org/10.3390/pr10050968 https://www.mdpi.com/journal/processes
Processes 2022, 10, 968 2 of 17
this approach leads to interface-tracking and interface-capturing models. In the former, theinterface position is tracked in a Lagrangian fashion, whilst in the latter, it is reconstructedfrom a known indicator function; the well-known Volume of Fluid (VoF) approach [5] is anexample of an interface-capturing model.
From the discussion above, it is clear that most multiphase flows of practical interestexhibit a marked multiscale behaviour, whilst standard multiphase modelling approachesassume the presence of either “small” dispersed interfacial scales or “large” segregatedinterfacial scales. In the numerical simulation context, the terms “small” and “large” aredefined with respect to the size of the numerical grid. Therefore, it is evident that there is aneed for a generalised multiphase modelling approach capable of handling the presence ofa broad range of interfacial scales in the same computational domain; a number of these ap-proaches have been proposed, mainly following the idea of embedding some form of largeinterface resolution within a standard multifluid framework [6]. However, most of theseapproaches either rely on a priori regime maps based on the local volume fraction [6–8] orlack the capability of adapting to the local flow regime altogether [9].
To overcome these shortcomings, the GEneralised Multifluid Modelling Approach(GEMMA) for the simulation of multiscale multiphase flows has been recently devel-oped [10]. The approach adapts its formulation to the local resolution of the interfacialscales. The GEMMA approach reduces to a standard multifluid formulation suitable forsmall/dispersed interfaces in the numerical cells where the interfacial scales are smallcompared to the mesh size. In the cells where the mesh size is fine enough to guarantee anacceptable resolution of the interfacial morphology, a novel multifluid formulation suitablefor the simulation of large/segregated interfaces is introduced; the latter formulation aimsat mimicking the behaviour of an interface resolving approach such as VoF within themultifluid framework. However, given that the model is based on a multifluid description,dedicated closures for interfacial momentum transfer and surface tension remain necessaryto describe the underlying physics of interfacial momentum exchange in large interfaceregions. The model has been assessed against different fundamental test cases in [10],where it has been shown that it is as accurate as the VoF approach for cases characterisedby large/segregated interfaces, whilst a standard multifluid behaviour is recovered indispersed flows; in the same work, the authors demonstrated the capability of the approachto adapt its formulation locally in a prototypical multiscale flow, i.e., a water jet plungingin a quiescent pool.
Furthermore, it has been demonstrated that the GEMMA approach can accuratelyrepresent the complex multiphase hydrodynamics encountered in liquid–liquid extractiondevices [11,12]. Liquid–liquid extraction is when a solute is transferred between twoimmiscible fluids, typically a polar aqueous phase and a non-polar organic phase, withseparation occurring based on relative solubility or chemical reaction at the interface.Liquid–liquid extraction can be performed batch-wise, where phases are sequentiallycontacted and then separated; however, this is often impractical when performing theprocess at scale. Performing liquid–liquid extraction at scale has traditionally employedlarge columns where the heavy phase enters the top before flowing down and exiting viathe base. The less-dense phase of the two phases enters the column at the bottom, where ittravels upwards before leaving at the top. A large surface-area-to-volume ratio between thetwo phases is desirable to ensure a high mass transfer rate, necessitating a small dispersedphase diameter; however, droplets must be sufficiently large to prevent entrainment andsubsequent column flooding. By controlling the amount of turbulence within the column,it is possible to optimise the mass transfer performance. In the case of a rotating disccolumn (RDC), this is achieved by rotating discs attached to a central shaft using a variablespeed motor, while in a pulse sieve-plate extraction column (PSEC), the column fluid iscyclically pulsed upwards and downwards through sieve-plates, resulting in jetting anddroplet formation.
Traditionally, the design of liquid–liquid extraction columns has relied upon utilisingsome of the many published empirical correlations; however, these often perform poorly,
Processes 2022, 10, 968 3 of 17
resulting in large, expensive over-designed columns. Providing suitable time and researchfacilities are available, a pilot plant can be used to determine extraction as a function ofcolumn height and cross-section, which is then scaled accordingly. However, scaleup is acomplicated process that can result in expensive overdesigned columns. Due to the inherentuncertainty associated with the empirical or pilot plant design of extraction columns,developing and utilising a modelling and simulation approach to design is desirable.
To date, there have been several investigations into CFD informed mass transfermodelling in liquid–liquid extraction columns, with several studies looking at applicationwithin an RDC [13,14] and a PSEC [15]. However, these were done with models unableto distinguish between the flow regimes. Instead, results in [11,12] demonstrated how anapproach such as GEMMA can make available the key hydrodynamic parameters neededto characterise mass transfer in these applications. Although implementing mass transferdirectly with GEMMA would provide a detailed understanding of performance, doingso would be computationally expensive as it requires solving the relevant mass transfercalculations in each cell in the computational domain. The present work builds on previousfindings [11,12] and presents a modelling framework to evaluate the global mass transferperformance in complex multiphase systems. The mass transfer modelling frameworkrelies on input from GEMMA to evaluate the hydrodynamic parameters that influencemass transfer; successively, a surrogate reduced-order model of the system is created basedon the hydrodynamic information obtained from the CFD model. This surrogate modelis used to infer the global mass transfer performance of the system. This is significantlyquicker as mass transfer performance is only calculated in a small number of compart-ments as opposed to every cell within the mesh, and, therefore, it requires much lesscomputational resource.
The paper is organised as follows: the GEMMA modelling approach and the integralmass transfer modelling methodology are described in Section 2; their application to anRDC and a PSEC are reported in Section 3. Finally, conclusions and future work are outlinedin Section 4.
2. Numerical Modelling2.1. Hydrodynamic Modelling
The GEMMA approach has been implemented in the well-known open-source CFDcode OpenFOAM v7.0 [16,17], and a detailed description can be found in [10]. A high-leveloverview of the approach is provided here.
The GEMMA approach has been built on top of the standard multifluid modellingframework suitable for small/dispersed interfaces given by the OpenFOAM native re-actingMultiphaseEulerFoam solver. GEMMA introduces two different formulations withinthe multifluid framework; in each cell of the computational domain, one of the two ap-proaches is selected based on the numerical grid’s local capability to resolve the interface’smorphology. The two formulations are:
(1) A standard multifluid formulation, suitable for small/dispersed interfacial scales:this approach is used in the cells where the local mesh size is larger than the localinterfacial scales, and, therefore, it is not possible to directly resolve the morphologyof the interface.
(2) An ad-hoc multifluid formulation suitable for large/segregated interfacial scales: thisapproach is used in the cells where the local mesh size is smaller than the local interfa-cial scales and the mesh resolution is fine enough to guarantee an adequate resolutionof the interface. This formulation aims to provide a form of interface resolution,similar to interface-resolving approaches, in the context of the multifluid framework.
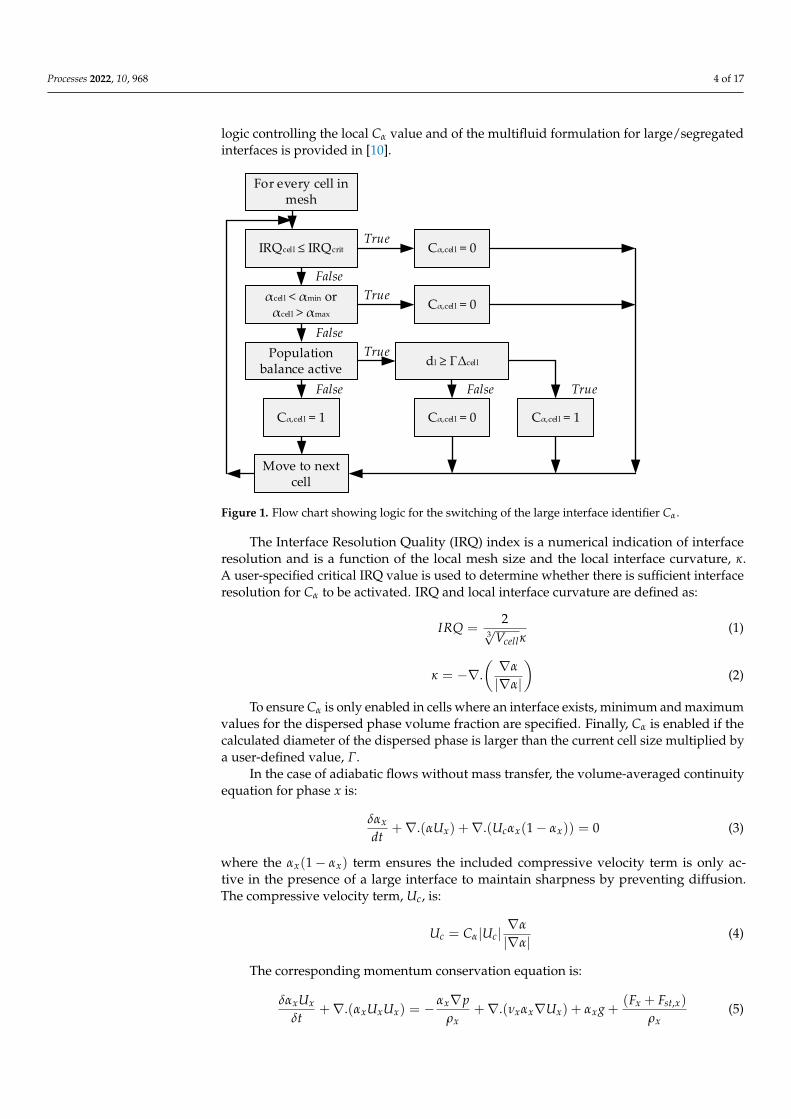
A large interface identifier Cα is introduced to identify which formulation is used ineach cell. Cα is equal to zero in the cells where the dispersed formulation is employed andis instead equal to one in the cells where the large interface formulation is used. A flowdiagram describing the switching logic is shown in Figure 1. A detailed description of the
Processes 2022, 10, 968 4 of 17
logic controlling the local Cα value and of the multifluid formulation for large/segregatedinterfaces is provided in [10].
Processes 2022, 10, x FOR PEER REVIEW 4 of 17
and is instead equal to one in the cells where the large interface formulation is used. A
flow diagram describing the switching logic is shown in Figure 1. A detailed description
of the logic controlling the local 𝐶𝛼 value and of the multifluid formulation for large/seg-
regated interfaces is provided in [10].
Figure 1. Flow chart showing logic for the switching of the large interface identifier 𝐶𝛼.
The Interface Resolution Quality (IRQ) index is a numerical indication of interface
resolution and is a function of the local mesh size and the local interface curvature, 𝜅. A
user-specified critical IRQ value is used to determine whether there is sufficient interface
resolution for 𝐶𝛼 to be activated. IRQ and local interface curvature are defined as:
𝐼𝑅𝑄 =2
√𝑉𝑐𝑒𝑙𝑙3 𝜅
(1)
𝜅 = −∇. (∇𝛼
|∇𝛼|) (2)
To ensure 𝐶𝛼 is only enabled in cells where an interface exists, minimum and maxi-
mum values for the dispersed phase volume fraction are specified. Finally, 𝐶𝛼 is enabled
if the calculated diameter of the dispersed phase is larger than the current cell size multi-
plied by a user-defined value, 𝛤.
In the case of adiabatic flows without mass transfer, the volume-averaged continuity
equation for phase 𝑥 is:
𝛿𝛼𝑥
𝑑𝑡+ ∇. (𝛼𝑈𝑥) + ∇. (𝑈𝑐𝛼𝑥(1 − 𝛼𝑥)) = 0 (3)
where the 𝛼𝑥(1 − 𝛼𝑥) term ensures the included compressive velocity term is only active
in the presence of a large interface to maintain sharpness by preventing diffusion. The
compressive velocity term, 𝑈𝑐, is:
𝑈𝑐 = 𝐶𝛼|𝑈𝑐|∇𝛼
|∇𝛼| (4)
The corresponding momentum conservation equation is:
For every cell in mesh
IRQcell IRQcrit
Cα,cell = 0αcell < αmin or αcell > αmax
Population balance active
Cα,cell = 1
Move to next cell
Cα,cell = 0
Cα,cell = 1Cα,cell = 0
False
False
Truedl ΓΔcell
TrueFalse
True
True
False
Figure 1. Flow chart showing logic for the switching of the large interface identifier Cα.
The Interface Resolution Quality (IRQ) index is a numerical indication of interfaceresolution and is a function of the local mesh size and the local interface curvature, κ.A user-specified critical IRQ value is used to determine whether there is sufficient interfaceresolution for Cα to be activated. IRQ and local interface curvature are defined as:
IRQ =2
3√
Vcellκ(1)
κ = −∇.(∇α
|∇α|
)(2)
To ensure Cα is only enabled in cells where an interface exists, minimum and maximumvalues for the dispersed phase volume fraction are specified. Finally, Cα is enabled if thecalculated diameter of the dispersed phase is larger than the current cell size multiplied bya user-defined value, Γ.
In the case of adiabatic flows without mass transfer, the volume-averaged continuityequation for phase x is:
δαx
dt+∇.(αUx) +∇.(Ucαx(1− αx)) = 0 (3)
where the αx(1− αx) term ensures the included compressive velocity term is only ac-tive in the presence of a large interface to maintain sharpness by preventing diffusion.The compressive velocity term, Uc, is:
Uc = Cα|Uc|∇α
|∇α| (4)
The corresponding momentum conservation equation is:
δαxUx
δt+∇.(αxUxUx) = −
αx∇pρx
+∇.(νxαx∇Ux) + αxg +(Fx + Fst,x)
ρx(5)
Processes 2022, 10, 968 5 of 17
where the interfacial exchange is described via the momentum exchange force, Fx, andthe surface tension force, Fst,x. The underpinning phenomena for these are differentdepending on if the fluid is dispersed or segregated, and these are formulated accordingly.The formulation for a generic force is as follows:
F = (1− (1− Cα) fx − (1− Cα) fz)FLI + (1− Cα) fxFxy + (1− Cα) fzFzx (6)
The surface tension force, Fst,x, is formulated as:
Fst,k = αx
nk
∑i=1
(Cαk,i σk,iαsmooth∇α
2ρ
∇ρk,i
)(7)
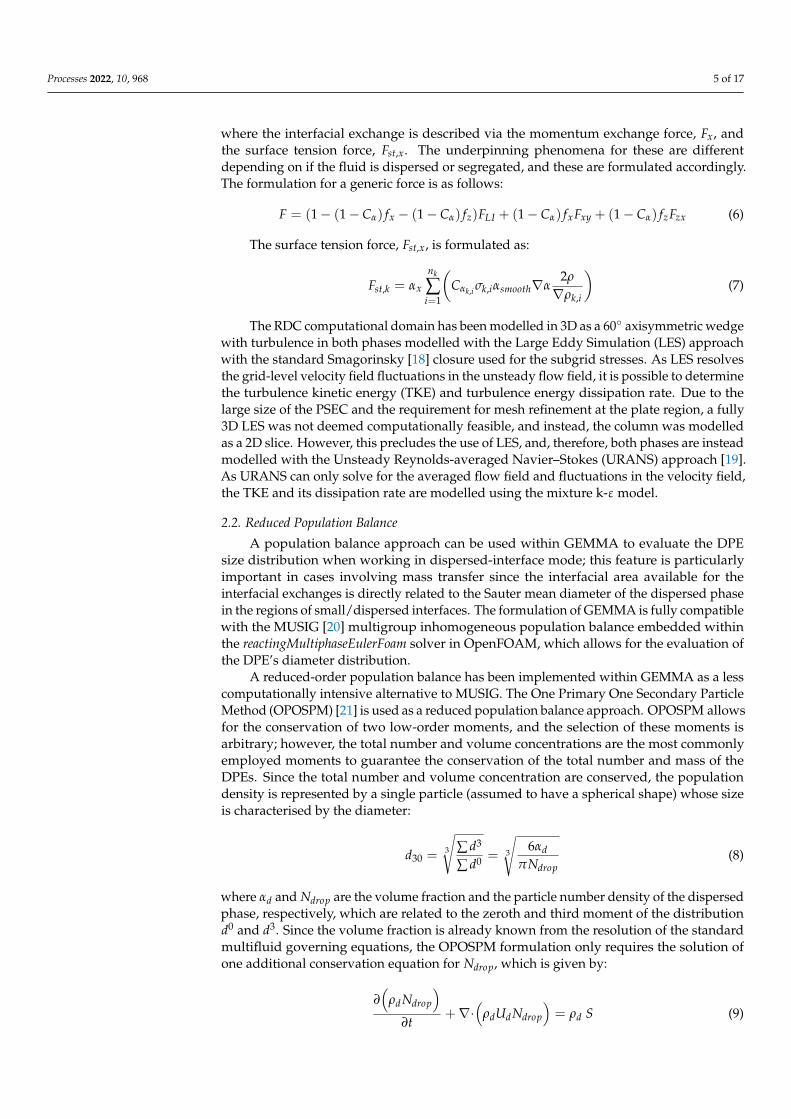
The RDC computational domain has been modelled in 3D as a 60◦ axisymmetric wedgewith turbulence in both phases modelled with the Large Eddy Simulation (LES) approachwith the standard Smagorinsky [18] closure used for the subgrid stresses. As LES resolvesthe grid-level velocity field fluctuations in the unsteady flow field, it is possible to determinethe turbulence kinetic energy (TKE) and turbulence energy dissipation rate. Due to thelarge size of the PSEC and the requirement for mesh refinement at the plate region, a fully3D LES was not deemed computationally feasible, and instead, the column was modelledas a 2D slice. However, this precludes the use of LES, and, therefore, both phases are insteadmodelled with the Unsteady Reynolds-averaged Navier–Stokes (URANS) approach [19].As URANS can only solve for the averaged flow field and fluctuations in the velocity field,the TKE and its dissipation rate are modelled using the mixture k-ε model.
2.2. Reduced Population Balance
A population balance approach can be used within GEMMA to evaluate the DPEsize distribution when working in dispersed-interface mode; this feature is particularlyimportant in cases involving mass transfer since the interfacial area available for theinterfacial exchanges is directly related to the Sauter mean diameter of the dispersed phasein the regions of small/dispersed interfaces. The formulation of GEMMA is fully compatiblewith the MUSIG [20] multigroup inhomogeneous population balance embedded withinthe reactingMultiphaseEulerFoam solver in OpenFOAM, which allows for the evaluation ofthe DPE’s diameter distribution.
A reduced-order population balance has been implemented within GEMMA as a lesscomputationally intensive alternative to MUSIG. The One Primary One Secondary ParticleMethod (OPOSPM) [21] is used as a reduced population balance approach. OPOSPM allowsfor the conservation of two low-order moments, and the selection of these moments isarbitrary; however, the total number and volume concentrations are the most commonlyemployed moments to guarantee the conservation of the total number and mass of theDPEs. Since the total number and volume concentration are conserved, the populationdensity is represented by a single particle (assumed to have a spherical shape) whose sizeis characterised by the diameter:
d30 = 3
√∑ d3
∑ d0 = 3
√6αd
πNdrop(8)
where αd and Ndrop are the volume fraction and the particle number density of the dispersedphase, respectively, which are related to the zeroth and third moment of the distributiond0 and d3. Since the volume fraction is already known from the resolution of the standardmultifluid governing equations, the OPOSPM formulation only requires the solution ofone additional conservation equation for Ndrop, which is given by:
∂(
ρdNdrop
)∂t
+∇·(
ρdUdNdrop
)= ρd S (9)
Processes 2022, 10, 968 6 of 17
where the source term, S, is:
S =(
ndaughter − 1)
rbreakageNdrop −12
rcoalescenceN2drop (10)
Within the source term, droplet formation due to breakage is described as a functionof the mean number of daughter droplets, ndaughter, which is assumed to be 2, and thebreakage rate, rbreakage, given by the break-up model of Martinez-Bazan et al. [22]:
rbreakage =
√8.2(εd30)
23 − 12σ
ρcd30
4d30(11)
Finally, droplet coalescence rate, rcoalescence, is modelled using the coalescence modelof Prince and Blanch [23], where the initial film thickness, h0, and final film thickness, h f ,are assumed to be 10−4 and 10−8 m, respectively [23]:
rcoalescence = 1.409ε13 d
1330 exp
−(d30
2
) 56 ρ
12c ε
13
4σ12
ln
(h0
h f
) (12)
The OPOSPM formulation described above allows for the evaluation of d30; however,knowledge of the Sauter mean diameter d32 also allows evaluation of the interfacial areadensity as:
a =6αdd32
(13)
In the context of liquid–liquid extraction, Wardle [24] followed the approach of es-timating the ratio d30/d32 from known DPE size distributions and combined this withthe d30 evaluated with the reduced population balance to infer the Sauter mean diameter.For liquid–liquid dispersions in Annular Centrifugal Contactors (ACCs), it has been ob-served that the d30/d32 ratio is consistently in the range of 0.75–0.8. Consistent with [24], avalue of 0.76 is used throughout the simulations presented in this work.
2.3. Mass Transfer Modelling Approach
The GEMMA approach makes it possible to obtain key information on the hydro-dynamic behaviour of complex multiscale multiphase flows that are of interest to thenuclear industry, as demonstrated in [11] for the case of intensified liquid–liquid extrac-tion in ACCs and in [12] for pulsed sieve-plate extraction columns (PSECs). This sectiondescribes a methodology to predict the global mass transfer rates in these flows based onthe hydrodynamic information provided by a detailed CFD model based on the GEMMAapproach. A continuously stirred tank reactor (CSTR) represents a reasonable approxima-tion for a single compartment of an extraction column, such as a PSEC and an RDC [25,26].These systems operate in counter-current flow, and therefore, the resolution of a system ofone-dimensional differential equations is needed to characterise them along their entireactive length and account for effects such as backflow and axial dispersion. The modelrequires the molar flow rates and solute concentration for both phases at the inlet as inputparameters. The description provided below is aimed at liquid–liquid extraction appli-cations, but the methodology applies to any multiphase flow presenting mass transferphenomena driven by concentration gradients.
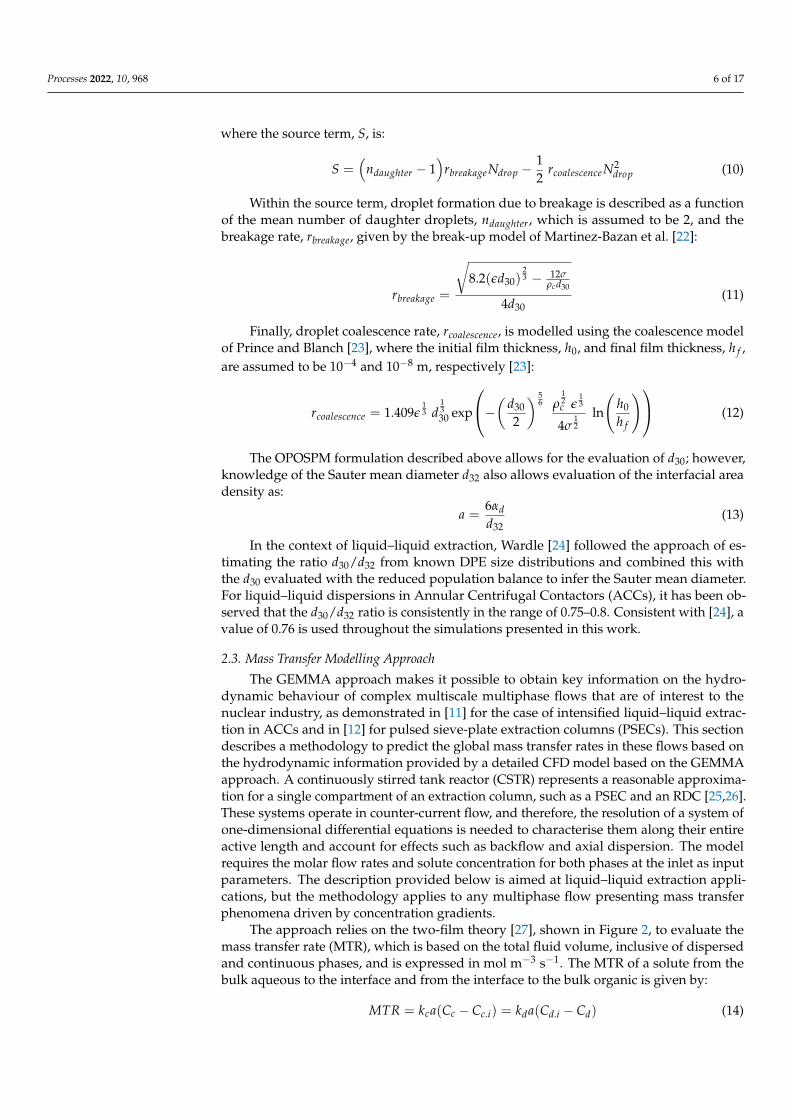
The approach relies on the two-film theory [27], shown in Figure 2, to evaluate themass transfer rate (MTR), which is based on the total fluid volume, inclusive of dispersedand continuous phases, and is expressed in mol m−3 s−1. The MTR of a solute from thebulk aqueous to the interface and from the interface to the bulk organic is given by:
MTR = kca(Cc − Cc.i) = kda(Cd.i − Cd) (14)
Processes 2022, 10, 968 7 of 17
where kc and kd are the mass transfer coefficients expressed in ms−1 of the continuous anddispersed phases, respectively, a is the interfacial area per unit volume of reactor in m2 m−3
and C is the solute concentration in mol m−3, with the subscripts c and d denoting if theconcentration refers to the aqueous or dispersed phase and the subscript i indicating if theconcentration refers to the interface.
Processes 2022, 10, x FOR PEER REVIEW 7 of 17
𝑀𝑇𝑅 = 𝑘𝑐𝑎(𝐶𝑐 − 𝐶𝑐.𝑖) = 𝑘𝑑𝑎(𝐶𝑑.𝑖 − 𝐶𝑑) (14)
where 𝑘𝑐 and 𝑘𝑑 are the mass transfer coefficients expressed in ms−1 of the continuous
and dispersed phases, respectively, 𝑎 is the interfacial area per unit volume of reactor in
m2m−3 and 𝐶 is the solute concentration in mol m−3, with the subscripts 𝑐 and 𝑑 denot-
ing if the concentration refers to the aqueous or dispersed phase and the subscript 𝑖 indi-
cating if the concentration refers to the interface.
Figure 2. Schematic representation of two-film theory.
Assuming there is negligible resistance to mass transfer at the interface, the equilib-
rium distribution 𝐾𝑒𝑞 can be calculated using Equation (15) below. The equilibrium as-
sumption is frequently valid and is justified in most absorption applications; on the other
hand, interfacial chemical reactions can be the limiting step in extraction with chemical
reaction. Despite this, the equilibrium assumption is used in the present modelling meth-
odology, and the inclusion of finite-rate interfacial chemistry will be part of future model
development:
𝐾𝑒𝑞 =𝐶𝑑,𝑖
𝐶𝑐,𝑖
(15)
Rearrangement and substitution of Equations (14) and (15) give Equation (16) for the
rate of interphase mass transfer:
𝑀𝑇𝑅 = (1
𝐾𝑒𝑞
𝑘𝑐+
1𝑘𝑑
) 𝑎(𝐾𝑒𝑞𝐶𝑐 − 𝐶𝑑) (16)
It can be noted that a first coupling between the mass transfer and the CFD model is
represented by the interfacial area density required in Equation (16), which is evaluated
as the product of the interfacial area density 𝑎 and the volume of the reactor 𝑉. The in-
terfacial area density is evaluated through the CFD model via Equation (13). Different
correlations are available in the literature to evaluate the phase-specific mass transfer co-
efficients 𝑘𝑑 and 𝑘𝑐, which are usually expressed as a function of the Sherwood number
𝑆ℎ; good reviews of such correlations are given in [25,26], and more details on this are
presented in Section 3.
The correlations express the Sherwood number as a function of the physical proper-
ties of the fluids (e.g., density, viscosity, diffusion coefficient) as well as a function of the
hydrodynamic conditions within the system (e.g., droplet Reynolds number, the diameter
Figure 2. Schematic representation of two-film theory.
Assuming there is negligible resistance to mass transfer at the interface, the equilibriumdistribution Keq can be calculated using Equation (15) below. The equilibrium assumptionis frequently valid and is justified in most absorption applications; on the other hand,interfacial chemical reactions can be the limiting step in extraction with chemical reaction.Despite this, the equilibrium assumption is used in the present modelling methodology, andthe inclusion of finite-rate interfacial chemistry will be part of future model development:
Keq =Cd,i
Cc,i(15)
Rearrangement and substitution of Equations (14) and (15) give Equation (16) for therate of interphase mass transfer:
MTR =
1Keqkc
+ 1kd
a(KeqCc − Cd
)(16)
It can be noted that a first coupling between the mass transfer and the CFD model isrepresented by the interfacial area density required in Equation (16), which is evaluated asthe product of the interfacial area density a and the volume of the reactor V. The interfacialarea density is evaluated through the CFD model via Equation (13). Different correlationsare available in the literature to evaluate the phase-specific mass transfer coefficients kd andkc, which are usually expressed as a function of the Sherwood number Sh; good reviews ofsuch correlations are given in [25,26], and more details on this are presented in Section 3.
The correlations express the Sherwood number as a function of the physical propertiesof the fluids (e.g., density, viscosity, diffusion coefficient) as well as a function of thehydrodynamic conditions within the system (e.g., droplet Reynolds number, the diameter ofthe dispersed phase, relative velocity between the two phases). An accurate hydrodynamicmodel of the system is needed to evaluate the latter parameters; this represents anotherlevel of coupling between the CFD and the mass transfer modelling methodology.
The above set of equations is applied to the extraction of acetone in a water/toluene/acetonesystem in an RDC and a PSEC. These cases are then used to validate the mass transfer
Processes 2022, 10, 968 8 of 17
modelling methodology against the experimental measurements of [25]. A compartmentmodelling approach will be utilised, with the unit operations being modelled as a networkof well-mixed sub-volumes, with each stage represented by a single CSTR [28]. Due to thelow solute concentrations and simple extraction mechanism based on relative solubility,the main assumptions underlying the integral mass transfer modelling approach describedabove are that:
(1) The hydrodynamic behaviour of the system is not significantly impacted by mass transfer.(2) The interfacial chemistry is infinitely fast, i.e., interfacial concentrations are assumed
to be equilibrium concentrations.(3) The saturation of the solvent is neglected.
3. Results and Discussion3.1. Simulation of a Rotating Disc Column
The RDC considered in this simulation is taken from Garthe [24]. The column hasa diameter of 0.08 m, consists of 59 compartments and each compartment has a heightof 0.05 m, resulting in a total active length of 2.95 m. The continuous phase is water,the dispersed phase is toluene and the solute is acetone; the physical properties of thesecomponents are reported in [25]. The organic and aqueous phases have a volumetric flowrate of 1.33 × 10⁻⁵ and 1.11 × 10⁻⁵ m3s−1, respectively. The stirrer speed was 6.67 s−1.
A simplified CFD model of the RDC with the operating conditions listed above wascreated following the approach used by [29]; a schematic representation of the computa-tional domain is shown in Figure 3. The domain is three-dimensional and axisymmetricand comprises 59 compartments. A cut-cell mesh having a bulk size of 0.002 m and a sizeat the walls of 0.0008 m is used to discretise the computational domain, resulting in a totalof 117,615 quadrilateral cells. A velocity inlet boundary condition was used at the bottomfor both phases, whilst a pressure outlet condition was used at the top. For the volumefraction, values proportional to the volumetric flow rate of each phase were imposed atthe bottom, and an inletOulet condition was used at the top; likewise, a fixed value ofNdrop, corresponding to an inlet Sauter diameter equal to 3 × 10⁻³ m for toluene, wasspecified at the bottom, and a zero gradient condition was used at the top. The stirrer wallrotates around the axis with a rotating speed of 6.67 s−1, whilst the stator wall is stationary;both walls were treated as no-slip walls. Interphase momentum transfer of dispersion ismodelled with the drag model of Schiller and Naumann [30] and the lift model of Legendreand Magnaudet [31], whilst interphase momentum transfer between large interfaces is notmodelled. Both phases were assumed to be turbulent and simulated with a wall-modelledLarge Eddy Simulation (LES) approach with the standard Smagorinsky [18] closure for thesubgrid stresses and a wall function [32] to relax mesh requirements at the walls.
The GEMMA approach was used to simulate the multiphase flow within the column;given the relatively coarse mesh size compared to the droplet size expected within thesystem (known from the experiments of [25]), it was expected that the Cα identifier willbe equal to zero everywhere in the domain, effectively reducing GEMMA to a standarddispersed multifluid formulation. Therefore, the logical switching of Cα was disabled. Theorganic phase droplet size was evaluated using the reduced OPOSPM population balancedescribed above.
The compartment-averaged organic phase holdup and Sauter mean diameter obtainedalong the column are compared with the experimental measurements of [25] in Figure 4.Overall, the CFD model is in good agreement with the experiments, with an average errorof 9.2% for the organic phase holdup and 6.5% for the Sauter mean diameter, suggestingthat a good representation of the hydrodynamic behaviour of the system has been obtained.
Processes 2022, 10, 968 9 of 17
Processes 2022, 10, x FOR PEER REVIEW 9 of 17
Figure 4. Overall, the CFD model is in good agreement with the experiments, with an
average error of 9.2% for the organic phase holdup and 6.5% for the Sauter mean diameter,
suggesting that a good representation of the hydrodynamic behaviour of the system has
been obtained.
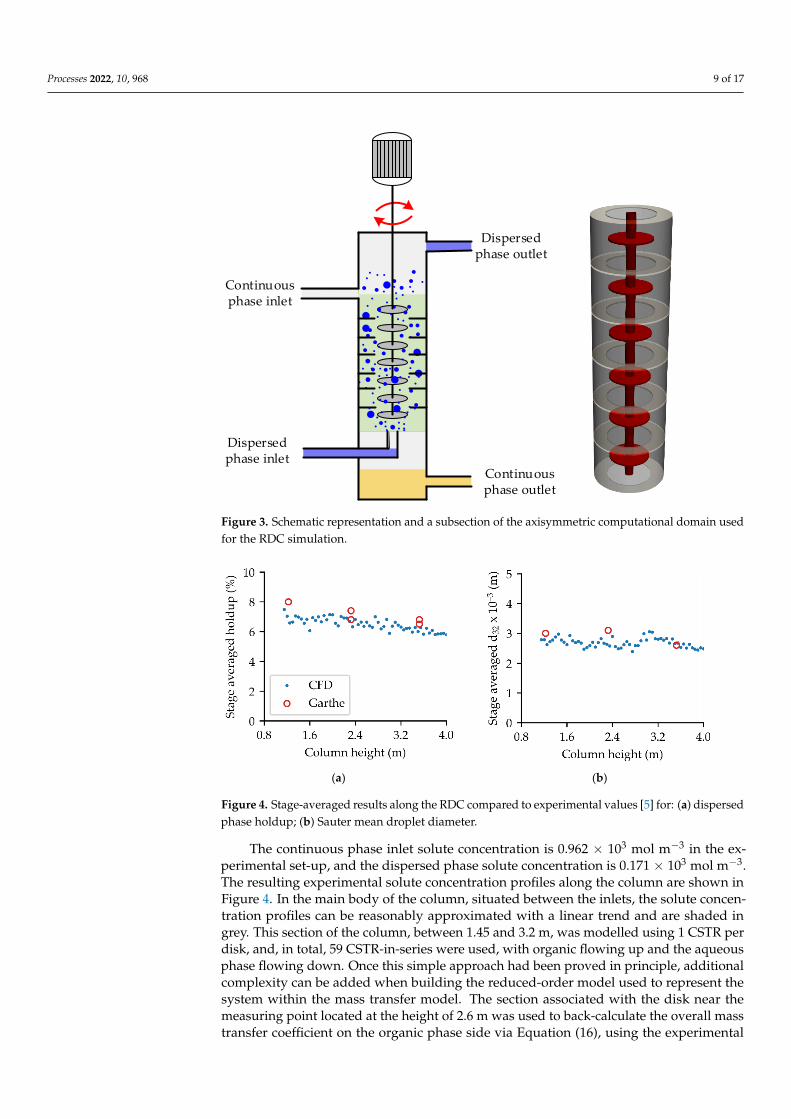
Figure 3. Schematic representation and a subsection of the axisymmetric computational domain
used for the RDC simulation.
(a) (b)
Figure 4. Stage-averaged results along the RDC compared to experimental values [5] for: (a) dis-
persed phase holdup; (b) Sauter mean droplet diameter.
The continuous phase inlet solute concentration is 0.962 × 10³ mol m−3 in the experi-
mental set-up, and the dispersed phase solute concentration is 0.171 × 10³ mol m−3. The
resulting experimental solute concentration profiles along the column are shown in Figure
4. In the main body of the column, situated between the inlets, the solute concentration
profiles can be reasonably approximated with a linear trend and are shaded in grey. This
section of the column, between 1.45 and 3.2 m, was modelled using 1 CSTR per disk, and,
in total, 59 CSTR-in-series were used, with organic flowing up and the aqueous phase
Dispersed phase outlet
Dispersed phase inlet
Continuous phase outlet
Continuous phase inlet
Figure 3. Schematic representation and a subsection of the axisymmetric computational domain usedfor the RDC simulation.
Processes 2022, 10, x FOR PEER REVIEW 9 of 17
Figure 4. Overall, the CFD model is in good agreement with the experiments, with an
average error of 9.2% for the organic phase holdup and 6.5% for the Sauter mean diameter,
suggesting that a good representation of the hydrodynamic behaviour of the system has
been obtained.
Figure 3. Schematic representation and a subsection of the axisymmetric computational domain
used for the RDC simulation.
(a) (b)
Figure 4. Stage-averaged results along the RDC compared to experimental values [5] for: (a) dis-
persed phase holdup; (b) Sauter mean droplet diameter.
The continuous phase inlet solute concentration is 0.962 × 10³ mol m−3 in the experi-
mental set-up, and the dispersed phase solute concentration is 0.171 × 10³ mol m−3. The
resulting experimental solute concentration profiles along the column are shown in Figure
4. In the main body of the column, situated between the inlets, the solute concentration
profiles can be reasonably approximated with a linear trend and are shaded in grey. This
section of the column, between 1.45 and 3.2 m, was modelled using 1 CSTR per disk, and,
in total, 59 CSTR-in-series were used, with organic flowing up and the aqueous phase
Dispersed phase outlet
Dispersed phase inlet
Continuous phase outlet
Continuous phase inlet
Figure 4. Stage-averaged results along the RDC compared to experimental values [5] for: (a) dispersedphase holdup; (b) Sauter mean droplet diameter.
The continuous phase inlet solute concentration is 0.962 × 10³ mol m−3 in the ex-perimental set-up, and the dispersed phase solute concentration is 0.171 × 10³ mol m−3.The resulting experimental solute concentration profiles along the column are shown inFigure 4. In the main body of the column, situated between the inlets, the solute concen-tration profiles can be reasonably approximated with a linear trend and are shaded ingrey. This section of the column, between 1.45 and 3.2 m, was modelled using 1 CSTR perdisk, and, in total, 59 CSTR-in-series were used, with organic flowing up and the aqueousphase flowing down. Once this simple approach had been proved in principle, additionalcomplexity can be added when building the reduced-order model used to represent thesystem within the mass transfer model. The section associated with the disk near themeasuring point located at the height of 2.6 m was used to back-calculate the overall masstransfer coefficient on the organic phase side via Equation (16), using the experimental
Processes 2022, 10, 968 10 of 17
values available for droplet size, holdup, Cd and Cc; the resulting experimental kov valueis equal to 1.99 × 10⁻⁵ ms−1. This value is used below as a benchmark for the kov valuescalculated with the hydrodynamic parameters obtained from the CFD results and using dif-ferent correlations available in the literature for the phase-specific mass transfer coefficientskd and kc. A review of correlations used for the prediction of multiphase mass transfercoefficients was published by Attarakiha et al. [26] and is summarised in Table 1.
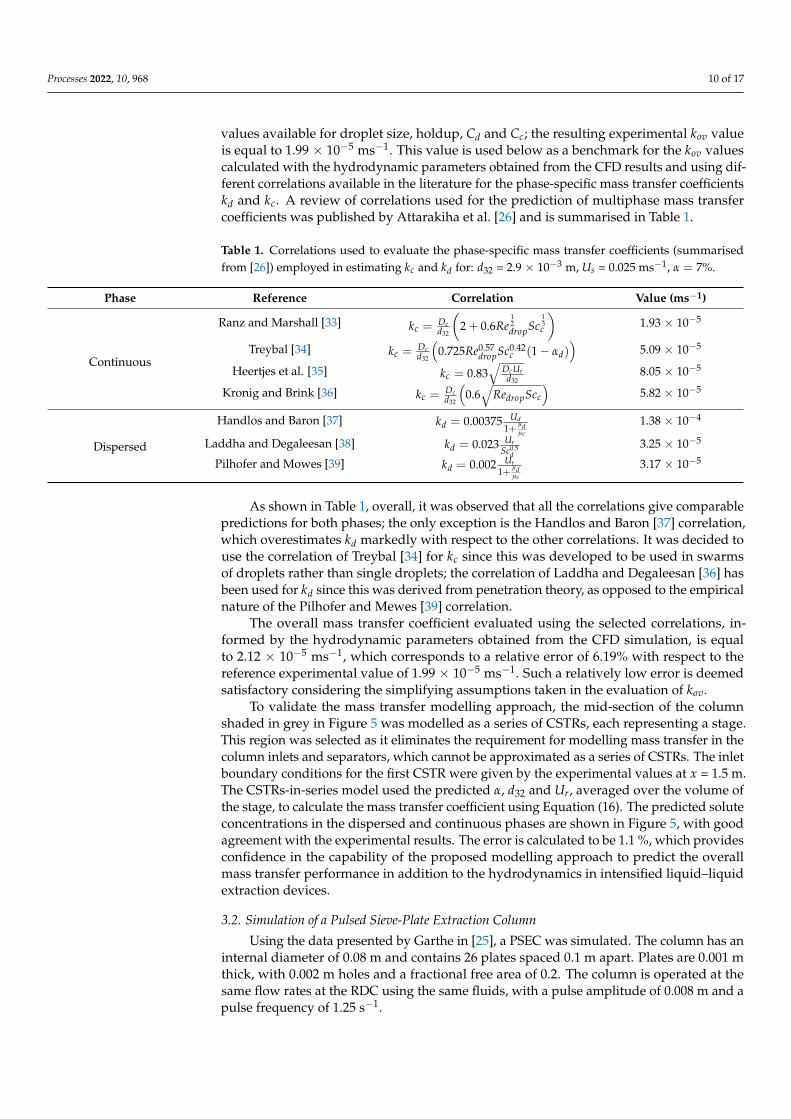
Table 1. Correlations used to evaluate the phase-specific mass transfer coefficients (summarisedfrom [26]) employed in estimating kc and kd for: d32 = 2.9 × 10⁻³ m, Us = 0.025 ms−1, α = 7%.
Phase Reference Correlation Value (ms−1)
Continuous
Ranz and Marshall [33] kc =Dcd32
(2 + 0.6Re
12dropSc
13c
)1.93 × 10⁻⁵
Treybal [34] kc =Dcd32
(0.725Re0.57
dropSc0.42c (1− αd)
)5.09 × 10⁻⁵
Heertjes et al. [35] kc = 0.83√
DcUrd32
8.05 × 10⁻⁵
Kronig and Brink [36] kc =Dcd32
(0.6√
RedropScc
)5.82 × 10⁻⁵
Dispersed
Handlos and Baron [37] kd = 0.00375 Ud1+ µd
µc
1.38 × 10⁻⁴
Laddha and Degaleesan [38] kd = 0.023 UrSc0.5
d3.25 × 10−5
Pilhofer and Mowes [39] kd = 0.002 Ur1+ µd
µc
3.17 × 10⁻⁵
As shown in Table 1, overall, it was observed that all the correlations give comparablepredictions for both phases; the only exception is the Handlos and Baron [37] correlation,which overestimates kd markedly with respect to the other correlations. It was decided touse the correlation of Treybal [34] for kc since this was developed to be used in swarmsof droplets rather than single droplets; the correlation of Laddha and Degaleesan [36] hasbeen used for kd since this was derived from penetration theory, as opposed to the empiricalnature of the Pilhofer and Mewes [39] correlation.
The overall mass transfer coefficient evaluated using the selected correlations, in-formed by the hydrodynamic parameters obtained from the CFD simulation, is equalto 2.12 × 10⁻⁵ ms−1, which corresponds to a relative error of 6.19% with respect to thereference experimental value of 1.99 × 10⁻⁵ ms−1. Such a relatively low error is deemedsatisfactory considering the simplifying assumptions taken in the evaluation of kov.
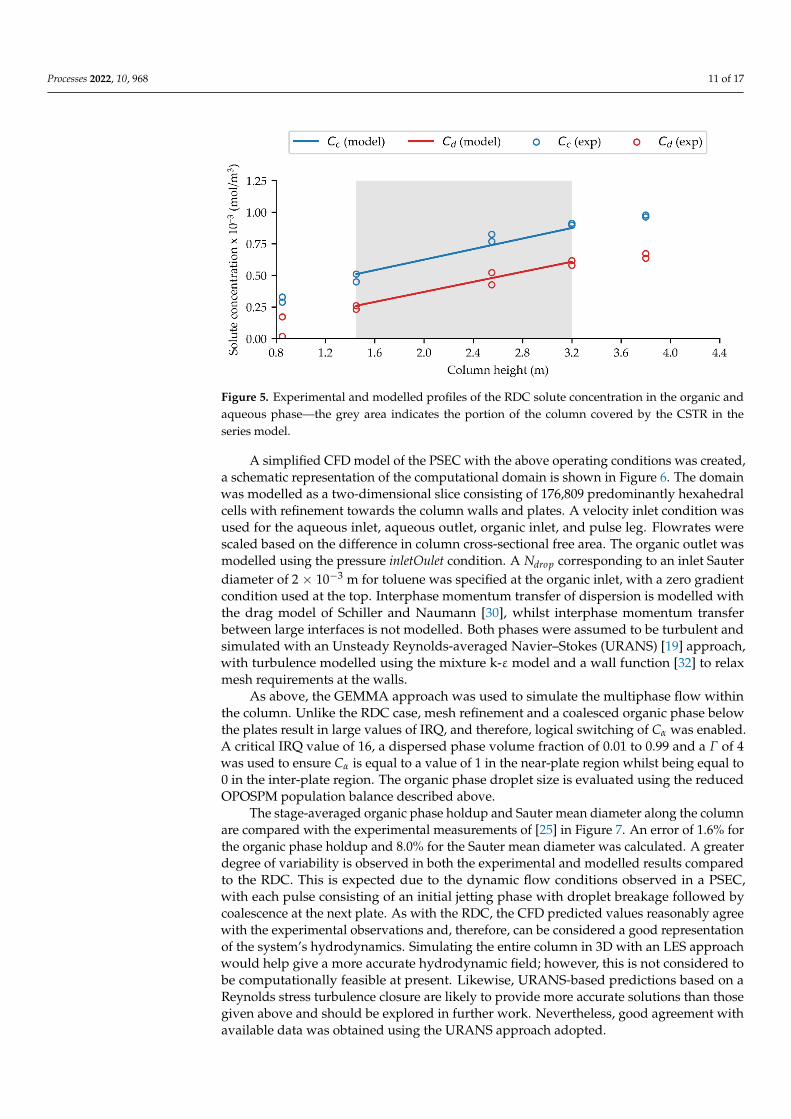
To validate the mass transfer modelling approach, the mid-section of the columnshaded in grey in Figure 5 was modelled as a series of CSTRs, each representing a stage.This region was selected as it eliminates the requirement for modelling mass transfer in thecolumn inlets and separators, which cannot be approximated as a series of CSTRs. The inletboundary conditions for the first CSTR were given by the experimental values at x = 1.5 m.The CSTRs-in-series model used the predicted α, d32 and Ur, averaged over the volume ofthe stage, to calculate the mass transfer coefficient using Equation (16). The predicted soluteconcentrations in the dispersed and continuous phases are shown in Figure 5, with goodagreement with the experimental results. The error is calculated to be 1.1 %, which providesconfidence in the capability of the proposed modelling approach to predict the overallmass transfer performance in addition to the hydrodynamics in intensified liquid–liquidextraction devices.
3.2. Simulation of a Pulsed Sieve-Plate Extraction Column
Using the data presented by Garthe in [25], a PSEC was simulated. The column has aninternal diameter of 0.08 m and contains 26 plates spaced 0.1 m apart. Plates are 0.001 mthick, with 0.002 m holes and a fractional free area of 0.2. The column is operated at thesame flow rates at the RDC using the same fluids, with a pulse amplitude of 0.008 m and apulse frequency of 1.25 s−1.
Processes 2022, 10, 968 11 of 17
Processes 2022, 10, x FOR PEER REVIEW 11 of 17
1.1 %, which provides confidence in the capability of the proposed modelling approach to
predict the overall mass transfer performance in addition to the hydrodynamics in inten-
sified liquid–liquid extraction devices.
Figure 5. Experimental and modelled profiles of the RDC solute concentration in the organic and
aqueous phase—the grey area indicates the portion of the column covered by the CSTR in the series
model.
3.2. Simulation of a Pulsed Sieve-Plate Extraction Column
Using the data presented by Garthe in [25], a PSEC was simulated. The column has
an internal diameter of 0.08 m and contains 26 plates spaced 0.1 m apart. Plates are 0.001
m thick, with 0.002 m holes and a fractional free area of 0.2. The column is operated at the
same flow rates at the RDC using the same fluids, with a pulse amplitude of 0.008 m and
a pulse frequency of 1.25 s−1.
A simplified CFD model of the PSEC with the above operating conditions was cre-
ated, a schematic representation of the computational domain is shown in Figure 6. The
domain was modelled as a two-dimensional slice consisting of 176,809 predominantly
hexahedral cells with refinement towards the column walls and plates. A velocity inlet
condition was used for the aqueous inlet, aqueous outlet, organic inlet, and pulse leg.
Flowrates were scaled based on the difference in column cross-sectional free area. The
organic outlet was modelled using the pressure inletOulet condition. A 𝑁𝑑𝑟𝑜𝑝 correspond-
ing to an inlet Sauter diameter of 2 × 10⁻³ m for toluene was specified at the organic inlet,
with a zero gradient condition used at the top. Interphase momentum transfer of disper-
sion is modelled with the drag model of Schiller and Naumann [30], whilst interphase
momentum transfer between large interfaces is not modelled. Both phases were assumed
to be turbulent and simulated with an Unsteady Reynolds-averaged Navier–Stokes
(URANS) [19] approach, with turbulence modelled using the mixture k-ε model and a
wall function [32] to relax mesh requirements at the walls.
Figure 5. Experimental and modelled profiles of the RDC solute concentration in the organic andaqueous phase—the grey area indicates the portion of the column covered by the CSTR in theseries model.
A simplified CFD model of the PSEC with the above operating conditions was created,a schematic representation of the computational domain is shown in Figure 6. The domainwas modelled as a two-dimensional slice consisting of 176,809 predominantly hexahedralcells with refinement towards the column walls and plates. A velocity inlet condition wasused for the aqueous inlet, aqueous outlet, organic inlet, and pulse leg. Flowrates werescaled based on the difference in column cross-sectional free area. The organic outlet wasmodelled using the pressure inletOulet condition. A Ndrop corresponding to an inlet Sauterdiameter of 2 × 10⁻³ m for toluene was specified at the organic inlet, with a zero gradientcondition used at the top. Interphase momentum transfer of dispersion is modelled withthe drag model of Schiller and Naumann [30], whilst interphase momentum transferbetween large interfaces is not modelled. Both phases were assumed to be turbulent andsimulated with an Unsteady Reynolds-averaged Navier–Stokes (URANS) [19] approach,with turbulence modelled using the mixture k-ε model and a wall function [32] to relaxmesh requirements at the walls.
As above, the GEMMA approach was used to simulate the multiphase flow withinthe column. Unlike the RDC case, mesh refinement and a coalesced organic phase belowthe plates result in large values of IRQ, and therefore, logical switching of Cα was enabled.A critical IRQ value of 16, a dispersed phase volume fraction of 0.01 to 0.99 and a Γ of 4was used to ensure Cα is equal to a value of 1 in the near-plate region whilst being equal to0 in the inter-plate region. The organic phase droplet size is evaluated using the reducedOPOSPM population balance described above.
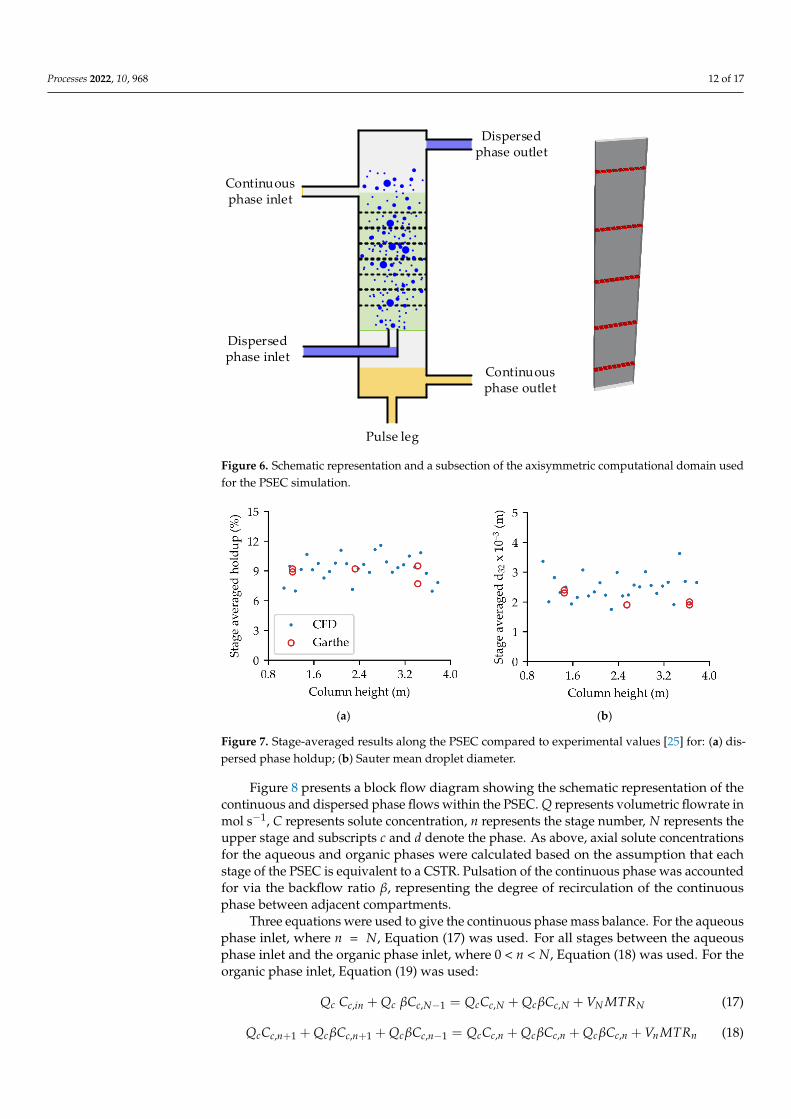
The stage-averaged organic phase holdup and Sauter mean diameter along the columnare compared with the experimental measurements of [25] in Figure 7. An error of 1.6% forthe organic phase holdup and 8.0% for the Sauter mean diameter was calculated. A greaterdegree of variability is observed in both the experimental and modelled results comparedto the RDC. This is expected due to the dynamic flow conditions observed in a PSEC,with each pulse consisting of an initial jetting phase with droplet breakage followed bycoalescence at the next plate. As with the RDC, the CFD predicted values reasonably agreewith the experimental observations and, therefore, can be considered a good representationof the system’s hydrodynamics. Simulating the entire column in 3D with an LES approachwould help give a more accurate hydrodynamic field; however, this is not considered tobe computationally feasible at present. Likewise, URANS-based predictions based on aReynolds stress turbulence closure are likely to provide more accurate solutions than thosegiven above and should be explored in further work. Nevertheless, good agreement withavailable data was obtained using the URANS approach adopted.
Processes 2022, 10, 968 12 of 17Processes 2022, 10, x FOR PEER REVIEW 12 of 17
Figure 6. Schematic representation and a subsection of the axisymmetric computational domain
used for the PSEC simulation.
As above, the GEMMA approach was used to simulate the multiphase flow within
the column. Unlike the RDC case, mesh refinement and a coalesced organic phase below
the plates result in large values of IRQ, and therefore, logical switching of 𝐶𝛼 was ena-
bled. A critical IRQ value of 16, a dispersed phase volume fraction of 0.01 to 0.99 and a 𝛤
of 4 was used to ensure 𝐶𝛼 is equal to a value of 1 in the near-plate region whilst being
equal to 0 in the inter-plate region. The organic phase droplet size is evaluated using the
reduced OPOSPM population balance described above.
The stage-averaged organic phase holdup and Sauter mean diameter along the col-
umn are compared with the experimental measurements of [25] in Figure 7. An error of
1.6% for the organic phase holdup and 8.0% for the Sauter mean diameter was calculated.
A greater degree of variability is observed in both the experimental and modelled results
compared to the RDC. This is expected due to the dynamic flow conditions observed in a
PSEC, with each pulse consisting of an initial jetting phase with droplet breakage followed
by coalescence at the next plate. As with the RDC, the CFD predicted values reasonably
agree with the experimental observations and, therefore, can be considered a good repre-
sentation of the system’s hydrodynamics. Simulating the entire column in 3D with an LES
approach would help give a more accurate hydrodynamic field; however, this is not con-
sidered to be computationally feasible at present. Likewise, URANS-based predictions
based on a Reynolds stress turbulence closure are likely to provide more accurate solu-
tions than those given above and should be explored in further work. Nevertheless, good
agreement with available data was obtained using the URANS approach adopted.
Dispersed phase outlet
Dispersed phase inlet
Continuous phase outlet
Continuous phase inlet
Pulse leg
Figure 6. Schematic representation and a subsection of the axisymmetric computational domain usedfor the PSEC simulation.
Processes 2022, 10, x FOR PEER REVIEW 13 of 17
(a) (b)
Figure 7. Stage-averaged results along the PSEC compared to experimental values [25] for: (a) dis-
persed phase holdup; (b) Sauter mean droplet diameter.
Figure 8 presents a block flow diagram showing the schematic representation of the
continuous and dispersed phase flows within the PSEC. 𝑄 represents volumetric
flowrate in mol s−1, 𝐶 represents solute concentration, 𝑛 represents the stage number, 𝑁
represents the upper stage and subscripts 𝑐 and 𝑑 denote the phase. As above, axial so-
lute concentrations for the aqueous and organic phases were calculated based on the as-
sumption that each stage of the PSEC is equivalent to a CSTR. Pulsation of the continuous
phase was accounted for via the backflow ratio 𝛽, representing the degree of recirculation
of the continuous phase between adjacent compartments.
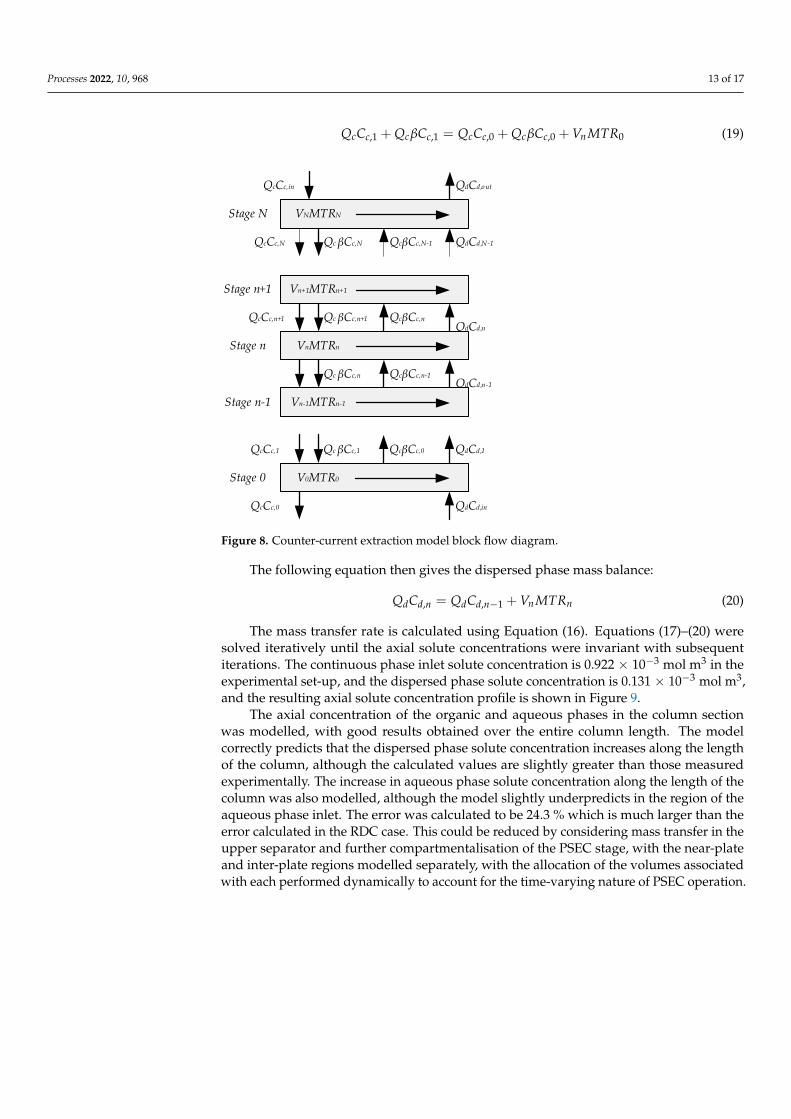
Figure 8. Counter-current extraction model block flow diagram.
Three equations were used to give the continuous phase mass balance. For the aque-
ous phase inlet, where 𝑛 = 𝑁, Equation (17) was used. For all stages between the aqueous
phase inlet and the organic phase inlet, where 0 < 𝑛 < 𝑁, Equation (18) was used. For the
organic phase inlet, Equation (19) was used:
Stage N VNMTRN
QdCd,out
QdCd,N-1
QcCc,in
QcCc,n+1
QcβCc,N-1Qc βCc,N
Stage n+1 Vn+1MTRn+1
QdCd,n
QcβCc,nQc βCc,n+1
Stage n VnMTRn
QdCd,n-1
QcβCc,n-1
Stage n-1 Vn-1MTRn-1
QdCd,1QcβCc,0Qc βCc,1
Stage 0 V0MTR0
QdCd,in
QcCc,N
Qc βCc,n
QcCc,1
QcCc,0
Figure 7. Stage-averaged results along the PSEC compared to experimental values [25] for: (a) dis-persed phase holdup; (b) Sauter mean droplet diameter.
Figure 8 presents a block flow diagram showing the schematic representation of thecontinuous and dispersed phase flows within the PSEC. Q represents volumetric flowrate inmol s−1, C represents solute concentration, n represents the stage number, N represents theupper stage and subscripts c and d denote the phase. As above, axial solute concentrationsfor the aqueous and organic phases were calculated based on the assumption that eachstage of the PSEC is equivalent to a CSTR. Pulsation of the continuous phase was accountedfor via the backflow ratio β, representing the degree of recirculation of the continuousphase between adjacent compartments.
Three equations were used to give the continuous phase mass balance. For the aqueousphase inlet, where n = N, Equation (17) was used. For all stages between the aqueousphase inlet and the organic phase inlet, where 0 < n < N, Equation (18) was used. For theorganic phase inlet, Equation (19) was used:
Qc Cc,in + Qc βCc,N−1 = QcCc,N + QcβCc,N + VN MTRN (17)
QcCc,n+1 + QcβCc,n+1 + QcβCc,n−1 = QcCc,n + QcβCc,n + QcβCc,n + Vn MTRn (18)
Processes 2022, 10, 968 13 of 17
QcCc,1 + QcβCc,1 = QcCc,0 + QcβCc,0 + Vn MTR0 (19)
Processes 2022, 10, x FOR PEER REVIEW 13 of 17
(a) (b)
Figure 7. Stage-averaged results along the PSEC compared to experimental values [25] for: (a) dis-
persed phase holdup; (b) Sauter mean droplet diameter.
Figure 8 presents a block flow diagram showing the schematic representation of the
continuous and dispersed phase flows within the PSEC. 𝑄 represents volumetric
flowrate in mol s−1, 𝐶 represents solute concentration, 𝑛 represents the stage number, 𝑁
represents the upper stage and subscripts 𝑐 and 𝑑 denote the phase. As above, axial so-
lute concentrations for the aqueous and organic phases were calculated based on the as-
sumption that each stage of the PSEC is equivalent to a CSTR. Pulsation of the continuous
phase was accounted for via the backflow ratio 𝛽, representing the degree of recirculation
of the continuous phase between adjacent compartments.
Figure 8. Counter-current extraction model block flow diagram.
Three equations were used to give the continuous phase mass balance. For the aque-
ous phase inlet, where 𝑛 = 𝑁, Equation (17) was used. For all stages between the aqueous
phase inlet and the organic phase inlet, where 0 < 𝑛 < 𝑁, Equation (18) was used. For the
organic phase inlet, Equation (19) was used:
Stage N VNMTRN
QdCd,out
QdCd,N-1
QcCc,in
QcCc,n+1
QcβCc,N-1Qc βCc,N
Stage n+1 Vn+1MTRn+1
QdCd,n
QcβCc,nQc βCc,n+1
Stage n VnMTRn
QdCd,n-1
QcβCc,n-1
Stage n-1 Vn-1MTRn-1
QdCd,1QcβCc,0Qc βCc,1
Stage 0 V0MTR0
QdCd,in
QcCc,N
Qc βCc,n
QcCc,1
QcCc,0
Figure 8. Counter-current extraction model block flow diagram.
The following equation then gives the dispersed phase mass balance:
QdCd,n = QdCd,n−1 + Vn MTRn (20)
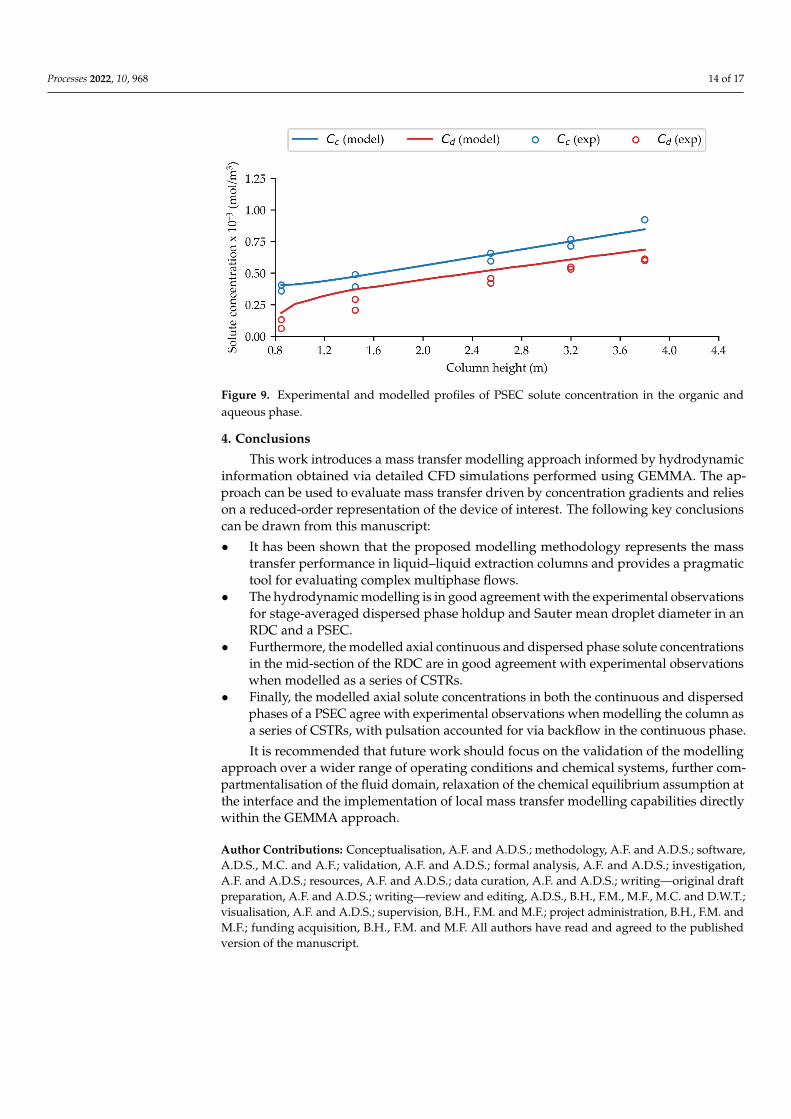
The mass transfer rate is calculated using Equation (16). Equations (17)–(20) weresolved iteratively until the axial solute concentrations were invariant with subsequentiterations. The continuous phase inlet solute concentration is 0.922 × 10⁻³ mol m3 in theexperimental set-up, and the dispersed phase solute concentration is 0.131 × 10⁻³ mol m3,and the resulting axial solute concentration profile is shown in Figure 9.
The axial concentration of the organic and aqueous phases in the column sectionwas modelled, with good results obtained over the entire column length. The modelcorrectly predicts that the dispersed phase solute concentration increases along the lengthof the column, although the calculated values are slightly greater than those measuredexperimentally. The increase in aqueous phase solute concentration along the length of thecolumn was also modelled, although the model slightly underpredicts in the region of theaqueous phase inlet. The error was calculated to be 24.3 % which is much larger than theerror calculated in the RDC case. This could be reduced by considering mass transfer in theupper separator and further compartmentalisation of the PSEC stage, with the near-plateand inter-plate regions modelled separately, with the allocation of the volumes associatedwith each performed dynamically to account for the time-varying nature of PSEC operation.
Processes 2022, 10, 968 14 of 17
Processes 2022, 10, x FOR PEER REVIEW 14 of 17
𝑄𝑐 𝐶𝑐,𝑖𝑛 + 𝑄𝑐 𝛽𝐶𝑐,𝑁−1 = 𝑄𝑐𝐶𝑐,𝑁 + 𝑄𝑐𝛽𝐶𝑐,𝑁 + 𝑉𝑁𝑀𝑇𝑅𝑁 (17)
𝑄𝑐𝐶𝑐,𝑛+1 + 𝑄𝑐𝛽𝐶𝑐,𝑛+1 + 𝑄𝑐𝛽𝐶𝑐,𝑛−1 = 𝑄𝑐𝐶𝑐,𝑛 + 𝑄𝑐𝛽𝐶𝑐,𝑛 + 𝑄𝑐𝛽𝐶𝑐,𝑛 + 𝑉𝑛𝑀𝑇𝑅𝑛 (18)
𝑄𝑐𝐶𝑐,1 + 𝑄𝑐𝛽𝐶𝑐,1 = 𝑄𝑐𝐶𝑐,0 + 𝑄𝑐𝛽𝐶𝑐,0 + 𝑉𝑛𝑀𝑇𝑅0 (19)
The following equation then gives the dispersed phase mass balance:
𝑄𝑑𝐶𝑑,𝑛 = 𝑄𝑑𝐶𝑑,𝑛−1 + 𝑉𝑛𝑀𝑇𝑅𝑛 (20)
The mass transfer rate is calculated using Equation (16). Equations (17)–(20) were
solved iteratively until the axial solute concentrations were invariant with subsequent it-
erations. The continuous phase inlet solute concentration is 0.922 × 10⁻³ mol m3 in the ex-
perimental set-up, and the dispersed phase solute concentration is 0.131 × 10⁻³ mol m3, and
the resulting axial solute concentration profile is shown in Figure 9.
Figure 9. Experimental and modelled profiles of PSEC solute concentration in the organic and aque-
ous phase.
The axial concentration of the organic and aqueous phases in the column section was
modelled, with good results obtained over the entire column length. The model correctly
predicts that the dispersed phase solute concentration increases along the length of the
column, although the calculated values are slightly greater than those measured experi-
mentally. The increase in aqueous phase solute concentration along the length of the col-
umn was also modelled, although the model slightly underpredicts in the region of the
aqueous phase inlet. The error was calculated to be 24.3 % which is much larger than the
error calculated in the RDC case. This could be reduced by considering mass transfer in
the upper separator and further compartmentalisation of the PSEC stage, with the near-
plate and inter-plate regions modelled separately, with the allocation of the volumes as-
sociated with each performed dynamically to account for the time-varying nature of PSEC
operation.
4. Conclusions
This work introduces a mass transfer modelling approach informed by hydrody-
namic information obtained via detailed CFD simulations performed using GEMMA. The
approach can be used to evaluate mass transfer driven by concentration gradients and
relies on a reduced-order representation of the device of interest. The following key con-
clusions can be drawn from this manuscript:
Figure 9. Experimental and modelled profiles of PSEC solute concentration in the organic andaqueous phase.
4. Conclusions
This work introduces a mass transfer modelling approach informed by hydrodynamicinformation obtained via detailed CFD simulations performed using GEMMA. The ap-proach can be used to evaluate mass transfer driven by concentration gradients and relieson a reduced-order representation of the device of interest. The following key conclusionscan be drawn from this manuscript:
• It has been shown that the proposed modelling methodology represents the masstransfer performance in liquid–liquid extraction columns and provides a pragmatictool for evaluating complex multiphase flows.
• The hydrodynamic modelling is in good agreement with the experimental observationsfor stage-averaged dispersed phase holdup and Sauter mean droplet diameter in anRDC and a PSEC.
• Furthermore, the modelled axial continuous and dispersed phase solute concentrationsin the mid-section of the RDC are in good agreement with experimental observationswhen modelled as a series of CSTRs.
• Finally, the modelled axial solute concentrations in both the continuous and dispersedphases of a PSEC agree with experimental observations when modelling the column asa series of CSTRs, with pulsation accounted for via backflow in the continuous phase.
It is recommended that future work should focus on the validation of the modellingapproach over a wider range of operating conditions and chemical systems, further com-partmentalisation of the fluid domain, relaxation of the chemical equilibrium assumption atthe interface and the implementation of local mass transfer modelling capabilities directlywithin the GEMMA approach.
Author Contributions: Conceptualisation, A.F. and A.D.S.; methodology, A.F. and A.D.S.; software,A.D.S., M.C. and A.F.; validation, A.F. and A.D.S.; formal analysis, A.F. and A.D.S.; investigation,A.F. and A.D.S.; resources, A.F. and A.D.S.; data curation, A.F. and A.D.S.; writing—original draftpreparation, A.F. and A.D.S.; writing—review and editing, A.D.S., B.H., F.M., M.F., M.C. and D.W.T.;visualisation, A.F. and A.D.S.; supervision, B.H., F.M. and M.F.; project administration, B.H., F.M. andM.F.; funding acquisition, B.H., F.M. and M.F. All authors have read and agreed to the publishedversion of the manuscript.
Processes 2022, 10, 968 15 of 17
Funding: This research was funded by the EPSRC through grant EP/R513258/1 and by the UKDepartment for Business, Energy and Industrial Strategies (BEIS) through the Advanced Fuel CycleProgramme (AFCP), which is a cooperation agreement between BEIS and the National NuclearLaboratory (NNL). The University of Leeds was funded by the NNL under contract PO1017418. Thiswork was undertaken on ARC4, part of the High Performance Computing facilities at the Universityof Leeds, UK.
Data Availability Statement: The data presented in this study are available on request from thecorresponding author.
Conflicts of Interest: The authors declare no conflict of interest.
Nomenclature
a interfacial area per unit volume, m2m−3
C concentration, mol m−3
C∗d dispersed phase concentration driving force, C∗d = KeqCcCα large interface identifierd droplet diameter, md30 volume mean droplet diameter, md32 Sauter mean droplet diameter, mD molecular diffusion coefficient, m2s−1
F Force, kgms−2
h0 initial film thickness, assumed to be 1× 10⁻⁴m in [23]h f finial film thickness, assumed to be 1× 10⁻⁸m in [23]IRQ interface resolution qualitykc continuous phase mass transfer coefficient, ms−1
kd mass transfer coefficient, ms−1
kov mass transfer coefficient, ms−1
Keq equilibrium distribution of soluteMTR mass transfer rate, mol m−3s−1
Ndrop drop number density, m−3
ndaughter mean number of daughter dropsQ volumetric flow rate, m3s−1
rbreakage droplet break-up ratercoalescence droplet coalescence rateRe Reynolds number for multi-particle system, Re = d32Usρx/µxRedrop Reynolds number for single droplet system, Re = dUsρx/µxS source termScx phase x Schmidt number, Scx = µx/ρxDxShx phase x Sherwood number, Shx = kxd32/Dxt time, sU velocity, ms−1
Uc compressive velocity, ms−1
Us slip velocity, ms−1
U r relative velocity, ms−1
V volume, m3
Vcell cell volume, m3
α volume fractionβ ratio of backflow to net forward flowΓ user-defined valueε turbulence dissipation rate, m2s−3
π 3.1416ρ density, kgm−3
µ dynamic viscosity, Nsm−2
σ interfacial tension, Jm−2
Processes 2022, 10, 968 16 of 17
Subscriptc continuous phased dispersed phasei interfacein inletmin minimum valuemax maximum valueN upper stagen stage numberout outletov overallx generic phase x
References1. Hanson, B. Process engineering and design for spent nuclear fuel reprocessing and recycling plants. In Reprocessing and Recycling
of Spent Nuclear Fuel; Taylor, R., Ed.; Woodhead Publishing: Oxford, UK, 2015; pp. 125–151.2. D’Auria, F. Prioritisation of nuclear thermal-hydraulics researches. Nucl. Eng. Des. 2018, 340, 105–111. [CrossRef]3. Marschall, H. Towards the Numerical Simulation of Multi-Scale Two-Phase Flows. Ph.D. Thesis, Lehrstuhl für Technische Chemie,
Technische Universität München, Munich, Germany, 2011.4. Prosperetti, A.; Tryggvason, G. Computational Methods for Multiphase Flow; Cambridge University Press: Cambridge, UK, 2007.5. Hirt, C.W.; Nichols, B.D. Volume of fluid VOF method for the dynamics of free boundaries. J. Comput. Phys. 1981, 39, 201–225.
[CrossRef]6. Strubelj, L.; Tiselj, I. Two-fluid model with interface sharpening. Int. J. Numer. Methods Eng. 2011, 85, 575–590. [CrossRef]7. Hänsch, S.; Lucas, D.; Krepper, E.; Höhne, T. A multi-field two-fluid concept for transitions between different scales of interfacial
structures. Int. J. Multiph. Flow 2012, 47, 171–182. [CrossRef]8. Mathur, A.; Dovizio, D.; Frederix, E.M.A.; Komen, E.M.J. A Hybrid Dispersed-Large Interface Solver for multiscale two-phase
flow modelling. Nucl. Eng. Des. 2019, 344, 69–82. [CrossRef]9. Marschall, H.; Hinrichsen, O. Numerical simulation of multiscale two-phase flows using a hybrid interface-resolving two-fluid
model (HIRES-TFM). J. Chem. Eng. Jpn. 2013, 46, 517–523. [CrossRef]10. de Santis, A.; Colombo, M.; Hanson, B.C.; Fairweather, M. A generalised multiphase modelling approach for multiscale flows.
J. Comput. Phys. 2021, 436, 110321. [CrossRef]11. De Santis, A.; Hanson, B.C.; Fairweather, M. Hydrodynamics of Annular Centrifugal Contactors: A CFD analysis using a novel
multiphase flow modelling approach. Chem. Eng. Sci. 2021, 242, 116729. [CrossRef]12. Theobald, D. Computational Engineering for Nuclear Solvent Extraction Equipment. Ph.D. Thesis, University of Leeds, Leeds,
UK, 2020.13. Hlawitschka, M.W.; Bart, H.J. CFD-mass transfer simulation of an RDC column. In Computer Aided Chemical Engineering; Elsevier:
Amsterdam, The Netherlands, 2012; Volume 31, pp. 920–924.14. Attarakih, M.; Hlawitschka, M.W.; Abu-Khader, M.; Al-Zyod, S.; Bart, H.J. CFD-population balance modeling and simulation of
coupled hydrodynamics and mass transfer in liquid extraction columns. Appl. Math. Model. 2015, 39, 5105–5120. [CrossRef]15. Alzyod, S.; Attarakih, M.; Bart, H.J. CFD modelling of pulsed sieve plate liquid extraction columns using OPOSPM as a reduced
population balance model: Hydrodynamics and mass transfer. In Computer Aided Chemical Engineering; Elsevier: Amsterdam,The Netherlands, 2018; Volume 43, pp. 451–456.
16. The OpenFOAM Foundation. OpenFOAM-User Guide. 2019. Available online: https://www.openfoam.com (accessed on31 March 2022).
17. Weller, H.G.; Tabor, G.; Jasak, H.; Fureby, C. A tensorial approach to computational continuum mechanics using object-orientedtechniques. Comput. Phys. 1998, 12, 620–631. [CrossRef]
18. Smagorinsky, J. General Circulation Experiments With the Primitive Equations. Mon. Weather Rev. 1963, 91, 99–164. [CrossRef]19. Behzadi, A.; Issa, R.; Rusche, H. Modelling of dispersed bubble and droplet flow at high phase fractions. Chem. Eng. Sci. 2004, 59,
759–770. [CrossRef]20. Krepper, E.; Lucas, D.; Frank, T.; Prasser, H.-M.; Zwart, P.J. The inhomogeneous MUSIG model for the simulation of polydispersed
flows. Nucl. Eng. Des. 2008, 238, 1690–1702. [CrossRef]21. Drumm, C.; Attarakih, M.; Hlawitschka, M.W.; Bart, H.-J. One-Group Reduced Population Balance Model for CFD Simulation of
a Pilot-Plant Extraction Column. Ind. Eng. Chem. Res. 2010, 49, 3442–3451. [CrossRef]22. Martinez-Bazan, C.; Montanes, J.L.; Lasheras, J.C. On the breakup of an air bubble injected into a fully developed turbulent flow.
J. Fluid Mech. 1999, 401, 157–182. [CrossRef]23. Prince, M.J.; Blanch, H.W. Bubble coalescence and break-up in air-sparged bubble columns. AIChE J. 1990, 36, 1485–1499.
[CrossRef]
Processes 2022, 10, 968 17 of 17
24. Wardle, K.E. Hybrid multiphase CFD simulation for liquid-liquid interfacial area prediction in annular centrifugal contactors. InProceedings of the Global 2013, Salt Lake City, UT, USA, 29 September–30 October 2013.
25. Garthe, D. Fluid-Dynamics and Mass Transfer of Single Particles and Swarm of Particles in Extraction Columns. Ph.D. Thesis,Lehrstuhl für Fluidverfahrenstechnik, Technische Universität München, Munich, Germany, 2006.
26. Attarakih, M.; Al-Zyod, S.; Abu-Khader, M.; Bart, H.J. PPBLAB: A New Multivariate Population Balance Environment forParticulate System Modelling and Simulation. Procedia Eng. 2012, 42, 1445–1462. [CrossRef]
27. Lewis, W.K.; Whitman, W.G. Principles of Gas Absorption. Ind. Eng. Chem. 1924, 16, 1215–1220. [CrossRef]28. Jourdan, N.; Neveux, T.; Potier, O.; Kanniche, M.; Wicks, J.; Nopens, I.; Rehman, U.; Le Moullec, Y. Compartmental Modelling in
chemical engineering: A critical review. Chem. Eng. Sci. 2019, 210, 115196. [CrossRef]29. Attarakih, M.M.; Drumm, C.; Bart, H. Solution of the population balance equation using the sectional quadrature method of
moments (SQMOM). Chem. Eng. Sci. 2009, 64, 742–752. [CrossRef]30. Yilmaz, F.; Gundogdu, Y.M. Analysis of conventional drag and lift models for multiphase CFD modeling of blood flow. Korea-Aust.
Rheol. J. 2009, 21, 161–173.31. Legendre, D.; Magnaudet, J. The lift force on a spherical bubble in a viscous linear shear flow. J. Fluid Mech. 1998, 368, 81–126.
[CrossRef]32. Launder, B.E.; Spalding, D.B. The numerical computation of turbulent flows. Comput. Methods Appl. Mech. Eng. 1974, 3, 269–289.
[CrossRef]33. Ranz, W.E.; Marshall, W.R. Evaporation from drosp. Chem. Eng. Prog. 1952, 48, 141–146.34. Treybal, R.R. Liquid Extraction; McGraw Hill: New York, NY, USA, 1963.35. Heertjes, P.M.; Holve, P.M.; Talsma, H. Mass transfer between isobutanol and water in a spray-column. Chem. Eng. Sci. 1954, 3,
122–142. [CrossRef]36. Kronig, R.; Brink, J. On the theory of extraction from falling droplets. Appl. Sci. Res. 1954, 2, 142–154. [CrossRef]37. Handlos, A.E.; Baron, T. Mass and heat transfer from drops in liquid-liquid extraction. AIChE J. 1957, 3, 127–136. [CrossRef]38. Laddha, G.S.; Degaleesan, T.E. Transport Phenomena in Liquid Extraction; Tata–McGraw Hill: New York, NY, USA, 1976.39. Pilhofer, T.; Mowes, D. Siebboden Extraktionkolonnen; VCH: Vancouver, BC, Canada, 1979.