Aromatic nitrations by mixed acid. Fast liquid-liquid reaction regime
Journal of Non-Crystalline Solids 332 (2003) 166–172
www.elsevier.com/locate/jnoncrysol
Liquid–liquid phase separation in alkali-borosilicate glass.
An impedance spectroscopy study
M.O. Prado *, A.A. Campos Jr., P.C. Soares, A.C.M. Rodrigues, E.D. Zanotto
LaMaV – Vitreous Materials Laboratory, Department of Materials Engineering, Federal University of S~aao Carlos – UFSCar,
CEP 13.565-905, S~aao Carlos SP, Brazil
Received 19 March 2003
Abstract
We followed the first stages of liquid–liquid phase separation in an alkali-borosilicate glass by complex impedance
spectroscopy at constant temperatures below and above the glass transition temperature, Tg. We found a new feature of
the electrical conductivity behavior: at temperatures below Tg, the electrical conductivity, r, diminished with time, while
above Tg, the electrical conductivity increased. The activation energy, Ea, for electrical conductivity was largest for
samples heat-treated below Tg. Other techniques, such as simultaneous small angle X-ray scattering (SAXS), wide angle
X-ray scattering (WAXS), and transmission electron microscopy (TEM) were also used. After annealing the glass inside
the immiscibility gap, TEM shows a structure with a few Angstroms in size. Above and below the glass transition
temperature, in situ SAXS isothermal experiments show an increase of the scattered intensity with time, while WAXS
confirms that no crystallization occurred. These facts suggest that glass heat treated below Tg develops a SiO2 rich
matrix with lower electrical conductivity and isolated sodium- rich regions. Annealing above Tg (of the quenched glass)
seems to produce an interconnected Na-rich phase, which dominates the electrical conductivity.
� 2003 Elsevier B.V. All rights reserved.
1. Introduction
Liquid–liquid phase separation (PS) kineticsand morphology of borosilicate glasses have been
thoroughly studied by several techniques [1–3], but
only few works using impedance spectroscopy are
dedicated to this subject. For example, Ravagnani
et al. [4] determined by this technique the critical
* Corresponding author. Present address: Comisi�oon Nacional
de Energ�ııa At�oomica-Centro, At�oomico Bariloche (8400), San
Carlos de Bariloche (RN), Argentina. Tel.: +54-2944 445230;
fax: +54-2944 445299.
E-mail address: [email protected] (M.O. Prado).
0022-3093/$ - see front matter � 2003 Elsevier B.V. All rights reserv
doi:10.1016/j.jnoncrysol.2003.09.031
temperature under which a sodium borosilicate
glass is phase-separated. PS was also evidenced by
impedance spectroscopy in a polycrystallineLa0:3Pr0:4Ca0:3MnO3 manganite [5].
In this paper we use complex impedance spec-
troscopy to follow PS during isothermal heat
treatments below and above the glass transition
temperature, Tg, of the homogeneous glass (before
PS), and make an attempt to correlate the electri-
cal behavior with structural changes.
Borosilicate glasses are model glasses to studythe kinetics of transformation due to their high
viscosity. Thus, for certain compositions and
cooling path, PS free samples can be produced by
ed.
M.O. Prado et al. / Journal of Non-Crystalline Solids 332 (2003) 166–172 167
splat cooling. Moreover, when applied to the studyof PS kinetics, impedance spectroscopy has some
advantages, in comparison, for example, to direct
transmission electron microscopy (TEM) obser-
vation such as: (i) negligible energy is dissipated in
the sample by the technique, thus one can easily
control the sample temperature by simple putting
it in a furnace; and (ii) the electrical conductivity is
very sensitive to the glass structure and composi-tion.
This work covers the following aspects: (a) the
chosen material is an important alkali-borosilicate
glass, candidate for nuclear wastes immobilization
[6,7] and PS can deteriorate its corrosion resis-
tance; (b) the main technique used here for the
study of the PS kinetics is impedance spectroscopy,
but small angle X-ray scattering (SAXS), wideangle X-ray scattering (WAXS) and TEM data are
also presented; (c) PS kinetics below Tg is also in-
vestigated; (d) the information gathered allows one
to propose which structural changes take place
during PS; (e) we confirmed by SAXS that vitreous
phases having different electronic density develop
during annealing above and below Tg. Simulta-
neous WAXS ruled out concurrent crystallization.
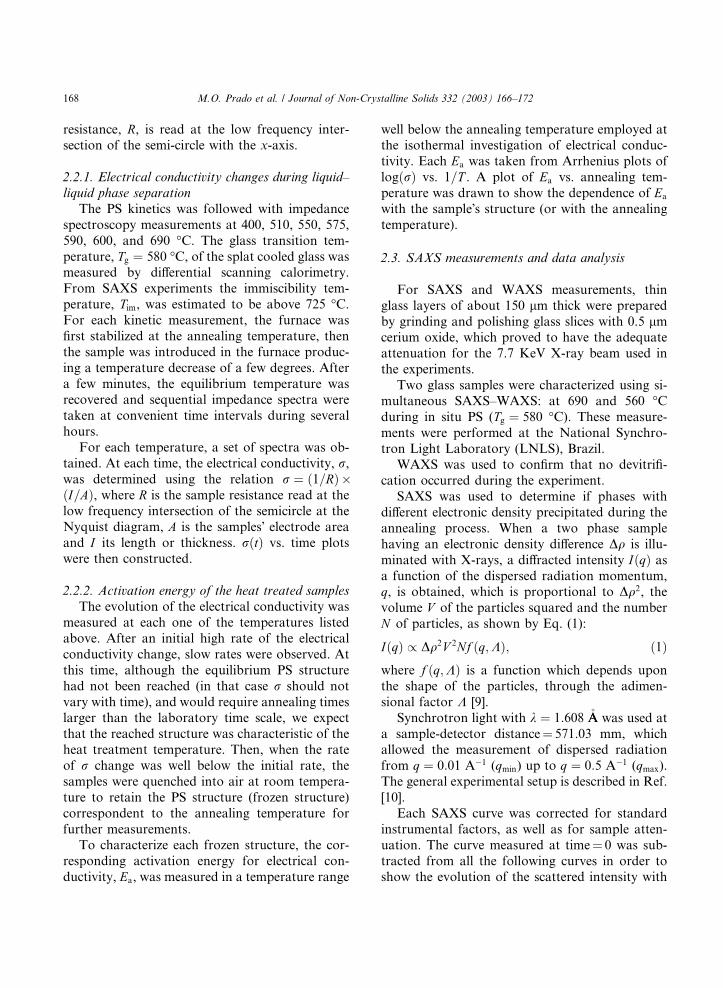
Fig. 1. (a) Sequential Nyquist diagrams obtained during an-
nealing a splat cooled sample at 400 �C; (b) sequential Nyquist
diagrams obtained during annealing a splat cooled sample at
590 �C.
2. Experimental methods
2.1. Glass preparation
We investigated an alkali-alumino-borosilicate
glass with the following composition: SiO2: 71.7,B2O3: 8.33, A12O3: 8.56, MgO: 1.00, CaO: 2.67,
Na2O: 7.44 wt% that is of interest for nuclear
waste immobilization [6]. The glass was melted for
2 h at 1600 �C. Samples were prepared by splat
cooling a liquid between two stainless steel plates
at room temperature. This procedure allowed us to
minimize bubbles, and PS during cooling. Trans-
parent, colorless, few millimeters thick specimenswere then obtained.
2.2. Impedance spectroscopy
Impedance measurements were made on 2 mm
thick, 1 · 1 cm2 flat samples. Both sides were pol-
ished with 0.5 lm cerium oxide. Platinum elec-
trodes were deposited by sputtering on bothsample faces as electrical contacts for impedance
measurements. Measurements were made with a
computer controlled HP 4192 LA impedance
meter. This equipment allows the frequency f to
be varied from 5 to 13 · 106 Hz, and can measure
impedances up to 6 MX.
Complex impedance data may be represented in
several correlated formalisms, such as impedanceZ vs. f , admittance Y vs. f , or the Bode plots [8].
However, for poor conductors, the Nyquist plot
(the opposite of the imaginary part of impedance
(�ImðZÞ) at the y-axis, and the real part ReðZÞ in
the x axis) is the most frequently employed repre-
sentation. In a Nyquist plot (Fig. 1) the material�s
168 M.O. Prado et al. / Journal of Non-Crystalline Solids 332 (2003) 166–172
resistance, R, is read at the low frequency inter-section of the semi-circle with the x-axis.
2.2.1. Electrical conductivity changes during liquid–
liquid phase separation
The PS kinetics was followed with impedance
spectroscopy measurements at 400, 510, 550, 575,
590, 600, and 690 �C. The glass transition tem-
perature, Tg ¼ 580 �C, of the splat cooled glass wasmeasured by differential scanning calorimetry.
From SAXS experiments the immiscibility tem-
perature, Tim, was estimated to be above 725 �C.
For each kinetic measurement, the furnace was
first stabilized at the annealing temperature, then
the sample was introduced in the furnace produc-
ing a temperature decrease of a few degrees. After
a few minutes, the equilibrium temperature wasrecovered and sequential impedance spectra were
taken at convenient time intervals during several
hours.
For each temperature, a set of spectra was ob-
tained. At each time, the electrical conductivity, r,was determined using the relation r ¼ ð1=RÞ�ðI=AÞ, where R is the sample resistance read at the
low frequency intersection of the semicircle at theNyquist diagram, A is the samples� electrode area
and I its length or thickness. rðtÞ vs. time plots
were then constructed.
2.2.2. Activation energy of the heat treated samples
The evolution of the electrical conductivity was
measured at each one of the temperatures listed
above. After an initial high rate of the electrical
conductivity change, slow rates were observed. At
this time, although the equilibrium PS structure
had not been reached (in that case r should not
vary with time), and would require annealing timeslarger than the laboratory time scale, we expect
that the reached structure was characteristic of the
heat treatment temperature. Then, when the rate
of r change was well below the initial rate, the
samples were quenched into air at room tempera-
ture to retain the PS structure (frozen structure)
correspondent to the annealing temperature for
further measurements.To characterize each frozen structure, the cor-
responding activation energy for electrical con-
ductivity, Ea, was measured in a temperature range
well below the annealing temperature employed atthe isothermal investigation of electrical conduc-
tivity. Each Ea was taken from Arrhenius plots of
logðrÞ vs. 1=T . A plot of Ea vs. annealing tem-
perature was drawn to show the dependence of Ea
with the sample�s structure (or with the annealing
temperature).
2.3. SAXS measurements and data analysis
For SAXS and WAXS measurements, thin
glass layers of about 150 lm thick were prepared
by grinding and polishing glass slices with 0.5 lmcerium oxide, which proved to have the adequate
attenuation for the 7.7 KeV X-ray beam used in
the experiments.
Two glass samples were characterized using si-
multaneous SAXS–WAXS: at 690 and 560 �Cduring in situ PS (Tg ¼ 580 �C). These measure-
ments were performed at the National Synchro-
tron Light Laboratory (LNLS), Brazil.WAXS was used to confirm that no devitrifi-
cation occurred during the experiment.
SAXS was used to determine if phases with
different electronic density precipitated during the
annealing process. When a two phase sample
having an electronic density difference Dq is illu-
minated with X-rays, a diffracted intensity IðqÞ as
a function of the dispersed radiation momentum,q, is obtained, which is proportional to Dq2, the
volume V of the particles squared and the number
N of particles, as shown by Eq. (1):
IðqÞ / Dq2V 2Nf ðq;KÞ; ð1Þwhere f ðq;KÞ is a function which depends upon
the shape of the particles, through the adimen-
sional factor K [9].
Synchrotron light with k ¼ 1:608 �AA was used at
a sample-detector distance¼ 571.03 mm, whichallowed the measurement of dispersed radiation
from q ¼ 0:01 A�1 (qmin) up to q ¼ 0:5 A�1 (qmax).
The general experimental setup is described in Ref.
[10].
Each SAXS curve was corrected for standard
instrumental factors, as well as for sample atten-
uation. The curve measured at time¼ 0 was sub-
tracted from all the following curves in order toshow the evolution of the scattered intensity with
M.O. Prado et al. / Journal of Non-Crystalline Solids 332 (2003) 166–172 169
time. The sequential measured spectra were ana-lyzed.
SAXS curves were measured during several
hours at 5 or 10 min intervals. The evolution of the
Porod invariant Q with time was calculated using
Eq. (2).
Q ¼Z 1
0
IðqÞq2d: ð2Þ
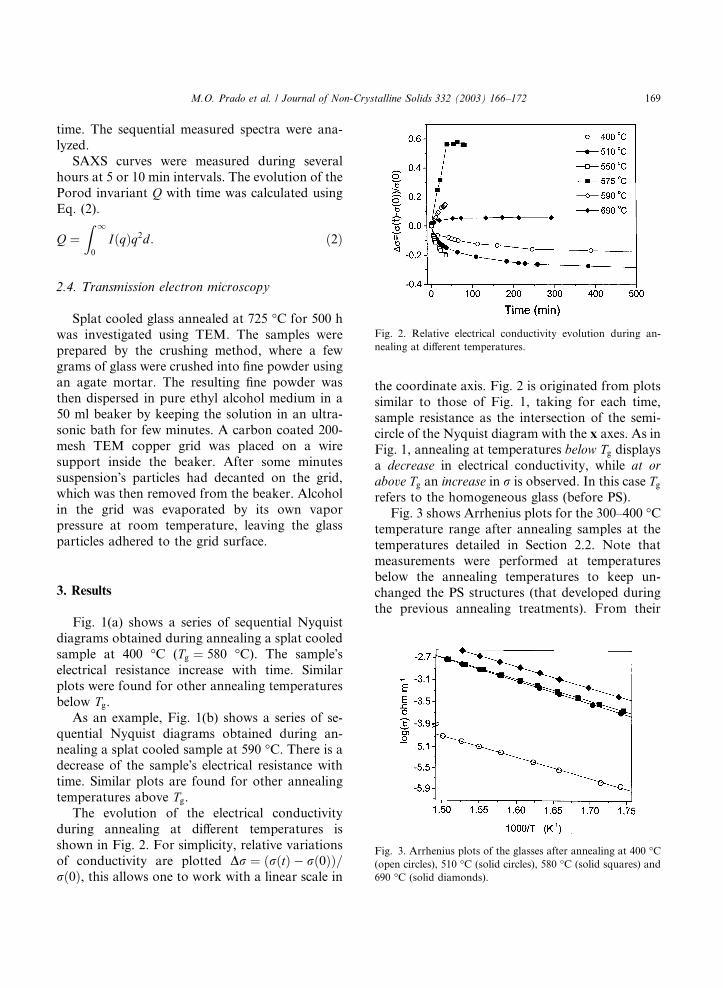
Fig. 2. Relative electrical conductivity evolution during an-
nealing at different temperatures.
2.4. Transmission electron microscopy
Splat cooled glass annealed at 725 �C for 500 h
was investigated using TEM. The samples were
prepared by the crushing method, where a fewgrams of glass were crushed into fine powder using
an agate mortar. The resulting fine powder was
then dispersed in pure ethyl alcohol medium in a
50 ml beaker by keeping the solution in an ultra-
sonic bath for few minutes. A carbon coated 200-
mesh TEM copper grid was placed on a wire
support inside the beaker. After some minutes
suspension�s particles had decanted on the grid,which was then removed from the beaker. Alcohol
in the grid was evaporated by its own vapor
pressure at room temperature, leaving the glass
particles adhered to the grid surface.
Fig. 3. Arrhenius plots of the glasses after annealing at 400 �C(open circles), 510 �C (solid circles), 580 �C (solid squares) and
690 �C (solid diamonds).
3. Results
Fig. 1(a) shows a series of sequential Nyquist
diagrams obtained during annealing a splat cooled
sample at 400 �C (Tg ¼ 580 �C). The sample�selectrical resistance increase with time. Similar
plots were found for other annealing temperatures
below Tg.
As an example, Fig. 1(b) shows a series of se-
quential Nyquist diagrams obtained during an-nealing a splat cooled sample at 590 �C. There is a
decrease of the sample�s electrical resistance with
time. Similar plots are found for other annealing
temperatures above Tg.
The evolution of the electrical conductivity
during annealing at different temperatures is
shown in Fig. 2. For simplicity, relative variations
of conductivity are plotted Dr ¼ ðrðtÞ � rð0ÞÞ=rð0Þ, this allows one to work with a linear scale in
the coordinate axis. Fig. 2 is originated from plots
similar to those of Fig. 1, taking for each time,
sample resistance as the intersection of the semi-
circle of the Nyquist diagram with the x axes. As inFig. 1, annealing at temperatures below Tg displays
a decrease in electrical conductivity, while at or
above Tg an increase in r is observed. In this case Tg
refers to the homogeneous glass (before PS).
Fig. 3 shows Arrhenius plots for the 300–400 �Ctemperature range after annealing samples at the
temperatures detailed in Section 2.2. Note that
measurements were performed at temperaturesbelow the annealing temperatures to keep un-
changed the PS structures (that developed during
the previous annealing treatments). From their
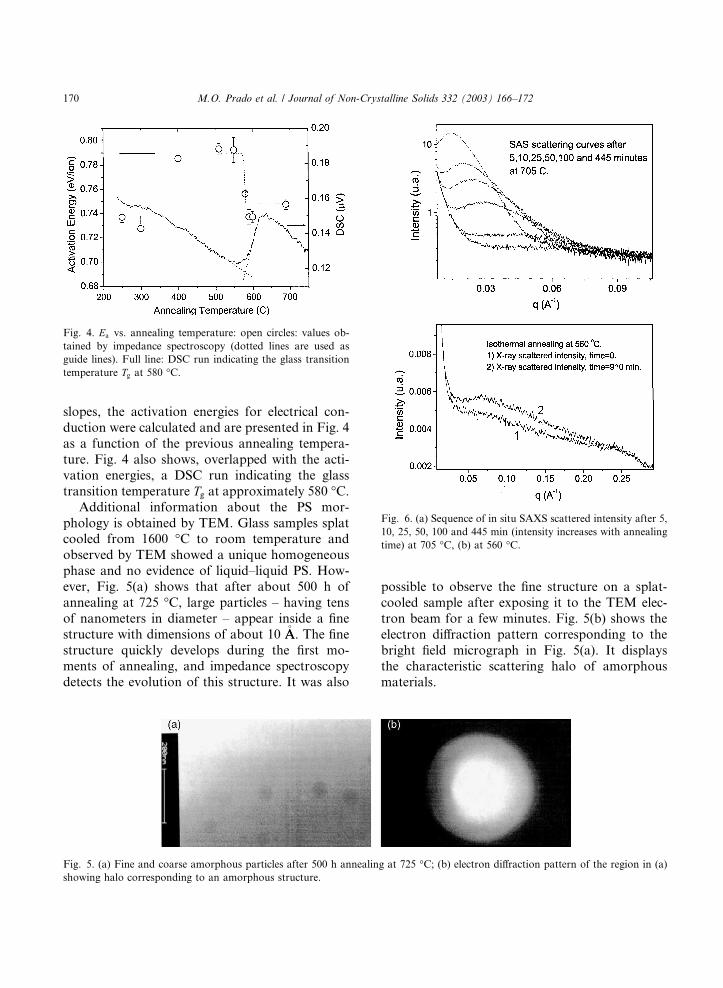
Fig. 4. Ea vs. annealing temperature: open circles: values ob-
tained by impedance spectroscopy (dotted lines are used as
guide lines). Full line: DSC run indicating the glass transition
temperature Tg at 580 �C.
Fig. 6. (a) Sequence of in situ SAXS scattered intensity after 5,
10, 25, 50, 100 and 445 min (intensity increases with annealing
time) at 705 �C, (b) at 560 �C.
170 M.O. Prado et al. / Journal of Non-Crystalline Solids 332 (2003) 166–172
slopes, the activation energies for electrical con-
duction were calculated and are presented in Fig. 4
as a function of the previous annealing tempera-
ture. Fig. 4 also shows, overlapped with the acti-
vation energies, a DSC run indicating the glass
transition temperature Tg at approximately 580 �C.
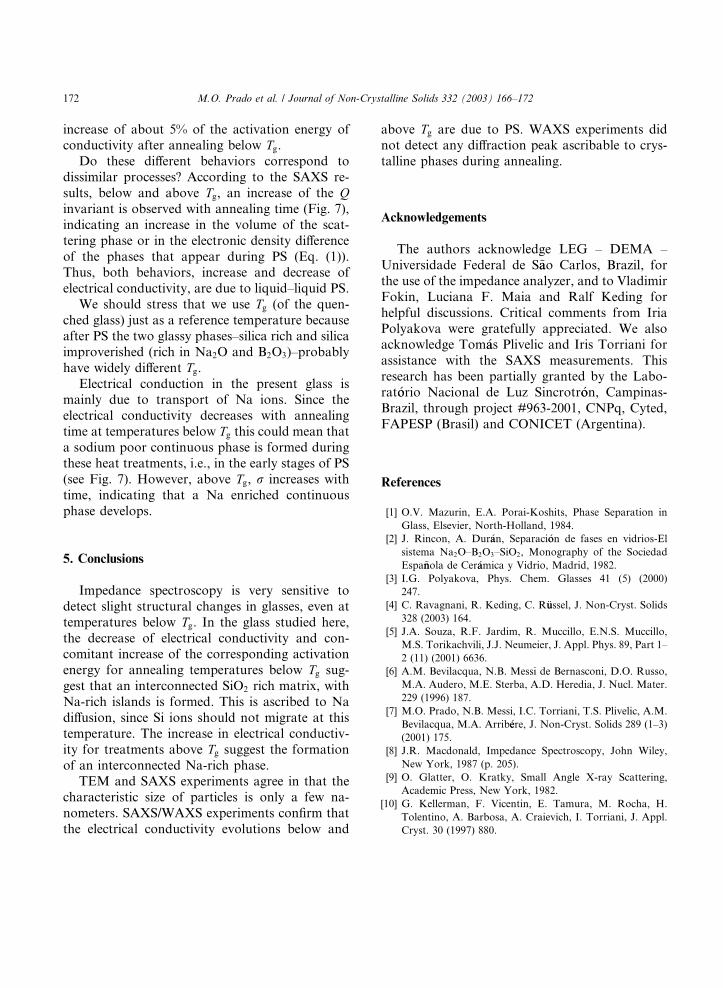
Additional information about the PS mor-
phology is obtained by TEM. Glass samples splatcooled from 1600 �C to room temperature and
observed by TEM showed a unique homogeneous
phase and no evidence of liquid–liquid PS. How-
ever, Fig. 5(a) shows that after about 500 h of
annealing at 725 �C, large particles – having tens
of nanometers in diameter – appear inside a fine
structure with dimensions of about 10 �AA. The fine
structure quickly develops during the first mo-ments of annealing, and impedance spectroscopy
detects the evolution of this structure. It was also
Fig. 5. (a) Fine and coarse amorphous particles after 500 h annealin
showing halo corresponding to an amorphous structure.
possible to observe the fine structure on a splat-
cooled sample after exposing it to the TEM elec-
tron beam for a few minutes. Fig. 5(b) shows the
electron diffraction pattern corresponding to the
bright field micrograph in Fig. 5(a). It displaysthe characteristic scattering halo of amorphous
materials.
g at 725 �C; (b) electron diffraction pattern of the region in (a)

Fig. 7. Evolution of the invariant Q (see Eq. (2)) during an-
nealing at different temperatures.
M.O. Prado et al. / Journal of Non-Crystalline Solids 332 (2003) 166–172 171
In situ SAXS measurements confirm the pres-ence of phases having different electronic densities
at least in the temperature range 510–705 �C,
which includes Tg. Fig. 6 shows a strong increase of
the scattered intensity with time and a shift of the
maximum of the scattered intensity towards lower
q. Fig. 7 shows the evolution of the Porod in-
variant Q, which monotonically increases with
time for all the temperatures, below or above theglass transition temperature. Fig. 8 shows that
WAXS could not detect crystalline phases for all
heat treatments.
4. Discussion
Figs. 5(b) and 8 indicate the absence of crys-talline phases during annealing. Moreover, the
Fig. 8. WAXS of a glass sample after 500 h annealing at 705
�C. The peaks correspond to alumina used as a standard. No
crystallization is observed after a long heat treatment.
increase of the SAXS invariant Q in Fig. 7 denotesthe existence of phases with different electronic
densities, which evolve with time during annealing
near Tg. TEM, SAXS and impedance spectroscopy
show changes in the glass properties during an-
nealing. However, each technique provides com-
plementary information.
TEM shows that after short annealing times (a
few minutes) fine size PS, with typical dimensionsof about 10 �AA takes place. Long time (longer than
100 h) annealing at 705 �C produces a similar fine
structure, but a new phase of larger particles,
having tens of nanometers in diameter (see Fig.
5(a)), also appears. The problem with TEM ex-
periments is that the sample�s temperature is not
controlled during exposition to the electron beam.
However, during SAXS, WAXS and impedancespectroscopy experiments, the heat dissipated by
the X-ray beam or the electron current is negligi-
ble, thus the sample�s temperature is easily con-
trolled by a furnace.
The most interesting finding of this work is that
the electrical conductivity shows a different be-
havior below and above Tg (of the quenched, single
phase glass), during isothermal annealing. Theelectrical conductivity increases during annealing
at temperatures at or above Tg, and decreases
below Tg (Fig. 2). A cut in Fig. 2 at time¼ 25 min,
shows the striking different behaviors below and
above Tg (see Fig. 9). Moreover, there is an
Fig. 9. Relative change in electrical conductivity, Dr, after 25
min at different temperatures. Tg taken from Fig. 4 is also
shown.
172 M.O. Prado et al. / Journal of Non-Crystalline Solids 332 (2003) 166–172
increase of about 5% of the activation energy ofconductivity after annealing below Tg.
Do these different behaviors correspond to
dissimilar processes? According to the SAXS re-
sults, below and above Tg, an increase of the Qinvariant is observed with annealing time (Fig. 7),
indicating an increase in the volume of the scat-
tering phase or in the electronic density difference
of the phases that appear during PS (Eq. (1)).Thus, both behaviors, increase and decrease of
electrical conductivity, are due to liquid–liquid PS.
We should stress that we use Tg (of the quen-
ched glass) just as a reference temperature because
after PS the two glassy phases–silica rich and silica
improverished (rich in Na2O and B2O3)–probably
have widely different Tg.
Electrical conduction in the present glass ismainly due to transport of Na ions. Since the
electrical conductivity decreases with annealing
time at temperatures below Tg this could mean that
a sodium poor continuous phase is formed during
these heat treatments, i.e., in the early stages of PS
(see Fig. 7). However, above Tg, r increases with
time, indicating that a Na enriched continuous
phase develops.
5. Conclusions
Impedance spectroscopy is very sensitive to
detect slight structural changes in glasses, even at
temperatures below Tg. In the glass studied here,
the decrease of electrical conductivity and con-comitant increase of the corresponding activation
energy for annealing temperatures below Tg sug-
gest that an interconnected SiO2 rich matrix, with
Na-rich islands is formed. This is ascribed to Na
diffusion, since Si ions should not migrate at this
temperature. The increase in electrical conductiv-
ity for treatments above Tg suggest the formation
of an interconnected Na-rich phase.TEM and SAXS experiments agree in that the
characteristic size of particles is only a few na-
nometers. SAXS/WAXS experiments confirm that
the electrical conductivity evolutions below and
above Tg are due to PS. WAXS experiments didnot detect any diffraction peak ascribable to crys-
talline phases during annealing.
Acknowledgements
The authors acknowledge LEG – DEMA –
Universidade Federal de S~aao Carlos, Brazil, for
the use of the impedance analyzer, and to Vladimir
Fokin, Luciana F. Maia and Ralf Keding for
helpful discussions. Critical comments from Iria
Polyakova were gratefully appreciated. We alsoacknowledge Tom�aas Plivelic and Iris Torriani for
assistance with the SAXS measurements. This
research has been partially granted by the Labo-
rat�oorio Nacional de Luz Sincrotr�oon, Campinas-
Brazil, through project #963-2001, CNPq, Cyted,
FAPESP (Brasil) and CONICET (Argentina).
References
[1] O.V. Mazurin, E.A. Porai-Koshits, Phase Separation in
Glass, Elsevier, North-Holland, 1984.
[2] J. Rincon, A. Dur�aan, Separaci�oon de fases en vidrios-El
sistema Na2O–B2O3–SiO2, Monography of the Sociedad
Espa~nnola de Cer�aamica y Vidrio, Madrid, 1982.
[3] I.G. Polyakova, Phys. Chem. Glasses 41 (5) (2000)
247.
[4] C. Ravagnani, R. Keding, C. R€uussel, J. Non-Cryst. Solids
328 (2003) 164.
[5] J.A. Souza, R.F. Jardim, R. Muccillo, E.N.S. Muccillo,
M.S. Torikachvili, J.J. Neumeier, J. Appl. Phys. 89, Part 1–
2 (11) (2001) 6636.
[6] A.M. Bevilacqua, N.B. Messi de Bernasconi, D.O. Russo,
M.A. Audero, M.E. Sterba, A.D. Heredia, J. Nucl. Mater.
229 (1996) 187.
[7] M.O. Prado, N.B. Messi, I.C. Torriani, T.S. Plivelic, A.M.
Bevilacqua, M.A. Arrib�eere, J. Non-Cryst. Solids 289 (1–3)
(2001) 175.
[8] J.R. Macdonald, Impedance Spectroscopy, John Wiley,
New York, 1987 (p. 205).
[9] O. Glatter, O. Kratky, Small Angle X-ray Scattering,
Academic Press, New York, 1982.
[10] G. Kellerman, F. Vicentin, E. Tamura, M. Rocha, H.
Tolentino, A. Barbosa, A. Craievich, I. Torriani, J. Appl.
Cryst. 30 (1997) 880.
Copyright © 2022 FDOKUMEN