Predicting Mass Transfer in Liquid–Liquid Extraction Columns
Upload
khangminh22Category
view
1download
0
'JOURNAL OF LIQUID CBROMATOGRAPBY VOLUME 18 NUMBER 5
Editor: DR. JACK CAZES Associate Editors: DR. HALEEM J. ISSAQ
DR. STEVEN H. WONG
1995

JOURNAL OF L1QUJJ) CIIROMATOGRAPIIY
Marl'll 1995
Aims and s..·ope. The journal publishes papers involving thr: applications of liquid chromatography to the solution of problems in all areas of sciencf', find technology, both analytical and preparative, as well as papers that deal specifically with liquid chromatography as a sCI.cnce within itself. Included will lw thill lay',,!' chromatography and all l11(llkls of liquid chromatognlphy,
Identification Statement. Journal of Liquid Chromatography (ISSN: 0 148-3fJ I fJ) is published selllimonthly exceplll10nthly in May, August, October, alld [k;eclIIbel fIll the institutional rate of $1,450.00 and the individual rate of $72).00 by Marcel Dekker, Inc., P.O. Box 5005, Monticello, NY 12701-5185. Second Class postage paid at Monticello, NY. POSTMASTER: Send address changes to Joumal of Liquid Chromatography, P.O. Box 5005, Monticello, NY 12701-5185.
Volume Issues
18 20
Individual Professionals'
Institutional and Student Rate Rate
$1,450.00 $'l25.00
Airmail Surface to Europe
$'1(WO $110.00
Airmail to Asia
$130.00
Individual professionals' and student orders must be prepaid by personal check or may be charged to MasterCard, VISA, or American Express. Please mail payment with your order to: Marcel Dekker Journals, P.O. Box 5017, Monticello, New York 12701-5176.
CODEN: JLCHD8 18(5) i-iv, 837-1046 (1995) ISSN: 0148-3919
Printed in the U.S.A.

Subscribe Today!
Use the cards below to subscribe to the Journal of Liquid Chromatography or to recommend the journal to your library for acquisition.
I Order Form Journal of Liquid Chromatography I
I
Please enter my SUbscription to Vol. 18,20 Numbers, 1995 at the 0 institutional rate of $1450.00; 0 individual rate of $725.00. Individual subscriptions must be prepaid in American currency by personal check or credit card. Please add $3.50 per issue (number) for shipping outside the U.S. For airmail to Europe, add $5.50 per issue; to Asia, add $6.50 per issue. Canadian customers please add 7% GST.
Please send me a proforma invoice. -- Check enclosed made payable to Marcel Dekker, Inc. = Charge my: 0 MasterCard 0 Visa 0 American Express
Card No. ____________________ ---CExp. Date ____ _
Signature ____________________________ _
Name __________________________________ _
Address _____________________________________ _
City/State/Zip _________________________________ _
Does your library subscribe to the Journal of Liquid Chromatography? Just complete this card and submit it to your librarian or department head.
Attention: Librarian/Department Head: I have examined the Journal of Liquid Chromatography and would like to recommend the journal for acquisition.
Signature _____________________________________ Date ___________ _
Name ______________________________ Department _______________ _
Journal of Liquid Chromatography Volwne 18, 20 Nwnbers, 1995: $1450.00 ISSN: 0148-3919 CODEN: JLCHD8
I Sample copy and proforma invoice available upon request.
Please contact the Promotion Department at: Marcel Dekker, Inc. 270 Madison Avenue New York, NY 10016 (212) 696-9000 phone (212) 685-4540 fax

Subscribe Today!
Use the cards below to subscribe to the Journal of Liquid Chromatography or to recommend the journal to your library for acquisition.
I I BUSINESS REPLY MAIL FIRST CLASS PERMIT NO. 2863 NEW YORK, NY
POSTAGE WILL BE PAID BY ADDRESSEE
Promotion Department MARCEL DEKKER. INC. 270 Madison Avenue New York. NY 10016-0601
1'111111 •••••• 11.1.1.1 ••• 1 ••• 111.1 •••• 1.11 •• 1 •• 11 •• 1
Journal of Liquid Chromatography
Editor: JACK CAZES Cheny Hill. New Jersey
NO POSTAGE NECESSARY
IF MAILED IN THE
UNITED STATES
The Journal of Liquid Chromatography contains an outstanding selection of critical, analytical, and preparative papers involving the application of liquid chromatography to the solution of problems in all areas of science and technology, as well as papers that deal specifically with liquid chromatography as a science within itself. The coverage spans such areas as paper and thin layer chromatography and all modes of liquid column chromatography, including classical and HPLC. On a regular basis, entire issues are devoted to special topics in liquid chromatography, including an annual directory of LC manufacturers, suppliers, and services. In addition, each issue offers book reviews, liquid chromatography news, and a calendar of meetings and exhibitions.

JOURNAL OF LIOMD CHROMATOGRAPHY
Editor: Editorial Secretary: DR. JACK CAZES ELEANOR CAZES
P. O. Box 2180 Cherry Hill, New Jersey 08034
Associate Editors:
DR. HALEEM J. ISSAQ NCI-Frederick Cancer Research
& Development Center Frederick, Maryland
DR. STEVEN H. WONG Medical College of Wisconsin Department of Pathology 8700 West Wisconsin Ave. Milwaukee, WI 53226
Editorial Board
H.Y. ABOUL-ENEIN, King Faisal Specialist Hospital & Research Centre, Riyadh, Saudi Arabia
V.K. AGARWAL, Miles Inc., West Haven, Connecticut J.G. ALVAREZ, Harvard University, Boston, Massachusetts D.W. ARMSTRONG, University of Missouri, Roila, Missouri A. BERTHOD, Universite Claude Bernard-Lyoll 1, Villeurbanne, France U.A.TH. BRINKMAN, The Free University, Amsterdam, The Netherlands P.R. BROWN, University of Rhode Island, Kingston, Rhode Island W.B. CALDWELL, Princeton Chromatography, Inc., Cranbury, New Jersey R. DEMURO, Shimadzu Scientific Instruments, Inc., Columbia, Maryland J.G. DORSEY, University of Cincinnati, Cincinnati, Ohio Z. EL RASSI, Oklahoma State University, Stillwater, Oklahoma J.C. GIDDINGS, University of Utah, Salt Lake City, Utah G. GUIOCHON, University of Tennessee, Knoxville, Tennessee N.A. GUZMAN, R. W. Johnson Pharm. Res. Inst., Raritan, New Jersey S. HARA, Tokyo College of Pharmacy, Tokyo, Japan G.L. HAWK, The Cardinal Instrument Co., Inc., Bristol, Pennsylvania W.L. HINZE, Wake Forest University, Winston-Salem, North Carolina
(continued)

.JOURNAL OF LlOUID CHROMATOGRAPHY
Editorial Board (continued)
C. HORVATH, Yale University, New Haven, Connecticut W.J. HURST, Hershey Foods Technical Center, Hershey, Pennsylvania J. JANCA, Universite de la Rochelle, La Rochelle, France G.M. JANINI, NCI-Frederick Cancer R&D Center, Frederick, Maryland M. JARONlEC, Kent State University, Kent, Ohio K. JINNO, Toyohashi University of Technology, Toyohashi, Japan P.T. KISSINGER, Purdue University, West Lafayette, Indiana J. LESEC, Ecole Superieure de Physique et de Chemie, Paris, France F. LYABAYA, Shimadzu Scientific Instruments, Inc., Columbia, Maryland H.M. MC NAIR, Virginia Polytechnic Institute, Blacksburg, Virginia R.B. MILLER, Fujisawa USA, Inc., Melrose Park, Illinois S. MORI, Mie University, Tsu, Mie, Japan M. MOSKOVITZ, Consultant, Atlanta, Georgia LN. PAPADOYANNlS, Aristotelian University of Thessaloniki, Thessaloniki,
Greece L.A. PAPAZIAN, Consultant, Cranbury, New Jersey W.H. PIRKLE, University of Illinois, Urbana, Illinois F .M. RABEL, E-M Separations, Inc., Gibbstown, New Jersey D.A. ROSTON, Searle Research & Development, Skokie, Illinois C.G. SCOTT, Retired, East Stroudsburg, Pennsylvania R.P.W. SCOTT, Consultant, Avon, Connecticut Z.K. SHIHABI, Bowman Gray School of Medicine, Winston, Salem, North
Carolina J.H.M. van den BERG, Solvay Duphar BV, Weesp, The Netherlands R. WEINBERGER, CE Technologies, Chappaqua, New York

JOURNAL OF LIQUID CHROMATOGRAPHY
Indexing and Abstracting Services. Articles published in Journal of Liquid Chromatography are selectively indexed or abstracted in:
- Abstracts Journal of the Institute for Scientific Information of the Russian Academy of Sciences - Analytical Abstracts - ASCA - Berichte Pathologie - BioSciences Information Service of Biological Abstracts (BIOSIS) - CAB International -Cambridge Scientific Abstracts - Chemical Abstracts - Chemical Reactions Documentation Service - Current Awareness in Biological Sciences - Current Contents/Life Sciences - Current Contents/Physical and Chemical Sciences -Engineering Index - Excerpta Medica - Physikalische Berichte - Reference Update - Saltykov-Shchedrin State Public Library - Science Citation Index
Manuscript Preparation and Submission. See end of issue.
Copyright ~ 1995 by Marcel Dekker, Inc. All rights reserved. Neither this work nor any part may be reproduced or transmitted in any form or by any means, electronic or mechanical, microfilming and recording, or by any information storage and retrieval systems without permission in writing from the publisher.
This journal is also available on CD-ROM through ADONIS™ beginning with the 1991 volume year. For information contact: ADONIS, Marketing Services, P.O. Box 839, Molenwerf 1, 1000 AV Amsterdam, The Netherlands, Tel: +31-20-6842206, Fax: +31-20-6880241.
The journals of Marcel Dekker, Inc. are available in microform from: University Microfilms, Inc., 300 North Zeeb Road, Ann Arbor, Michigan 48106-1346, Telephone: 800-521-0600; Fax: (313) 761-1203.
Authorization to photocopy items for internal or personal use, or the internal or personal use of specific clients, is granted by Marcel Dekker, Inc., for users registered with the Copyright Clearance Center (Ccq Transactional Reporting Service, provided that the fee of $10.00 per article is paid directly to CCC, 222 Rosewood Drive, Danvers, MA 01923. For those organizations that have been granted a photocopy license by CCC, a separate system of payment has been arranged.
Contributions to this journal are published free of charge.
Effective with Volume 6, Number 11, this journal is printed on acid-free paper.


JOURNAL OF LIQUID CHROMATOGRAPHY, 18(5),837-848 (1995)
DISPLACEMENT THIN-LAYER CHROMATOGRAPHY OF SOME
ECDYSTEROIDS
H. KALAszl, MARIA BATHOru2, AND I. MATHt2 1 Department of Pharmacology
Semmelweis University of Medicine Budapest, Hungary
2 Department of Pharmacognosy A. Szent-Gyorgyi Medical University
Szeged, Hungary
ABSTRACT
The essential steps of displacement thin-layer chromatography and its applications for separation of ecdysterolds are outlined. Finding adequate conditions of displacement thin-layer chromatography for plant ecdysteroids is detailed including the optimisation of mobile phase composition, mobile phase flow rate, and preelution before displacement development Application of preelution before displacement chromatography has an importance in the case of planar chromatography, both exploring and achieving the displacement separations by HPLC.
INTRODUCTION
Chromatography with elution type of developments IS generally
performed at the linear parts of the Langmuir isotherms, while
displacement chromatography operates with high load, that is at
concentrations that are at the non-linear parts of the isotherms [1].
837
Copyright © 1995 by Marcel Dekker, Inc.

838 KALAsz, BATHOR!, AND MATHE
Displacement chromatography has served to improve both analytical and
preparative separations. Modern variations of chromatography with
displacement type of developments include high performance (column
liquid) displacement chromatography [1, 2] and planar (thin-layer)
displacement chromatography [3, 4].
Using displacement chromatography, there are two mobile phases.
One of them is the carrier which is adequate for non-movement (or very
slow movement) of the compounds to be purified. The other one is the
displacer, that is displacing the sample components from the stationary
phase, therefore, pushing them forward. In the case of displacement thin
layer chromatography (D-TLC), the displacer is dissolved in the carrier.
There are two fronts of the mobile phase running forward, the carrier front
(first front) and the displacer front (the second one). The sample
components to be purified have to move in front of the displacer. As the
thin-layer chromatogram has been developed, the displaced component
forms a well defined, very sharp zone before the displacer front, it can be
easily detected and removed for preparative purposes [4].
Ecdysteroids are insect hormones found in insects, in various other
animals and also in plants. In insects, ecdysteroids are moulting
hormones, in plants their role is not well explained. However, some plants
can be the raw materials for the isolation of ecdysteroids because of their
high concentration (up to 3.3% which is much higher than in insects).
Among several other types of organic compounds (amines, phenyl alkyl
compounds, steroids, etc.), ecdysteroids have also been the subject of
our displacement chromatographic separations using planar
arrangements of the stationary phase [5-8].
New methods for displacement thin-layer chromatography of plant
ecdysteroids have been recently developed [6, 7]. In this paper,
optimization of conditions of displacement development by using various
carriers, displacers, as well as multiple developments will be detailed.
MATERIALS AND METHODS
Pre-coated TLC plates silica gel 60 F-254 (Merck, Darmstadt,
Germany), solvents and chemicals from commercial sources were used.

DISPLACEMENT 'ILC OF ECDYSTEROIDS 839
2-Deoxy-20-hydroxyecdysone (db) and 20-hydroxyecdysone (b)
were the kind gift of Dr. D. H. S. Horn (Acherone, Victoria, Australia). The
extraction of Silene otites (L.) Wib. (ex), and the isolation of 2-
deoxyecdysone (a), 20-hydroxyecdysone-22-acetate (ae) and
integristerone (i) have been described elsewhere [9].
TLC plates were developed in Desaga (Heidelberg, Germany)
chambers using non-saturated vapour phase. Solvent systems are
detailed in Table 1.
Cnrompres 10 (forced-flow TLC equipment) was purchased from
Laberte (Budapest, Hungary).
TABLE 1.
SOLVENT SYSTEMS FOR DEVELOPMENT OF TLC PLATES
dichloromethane--i.propanol--3-dimethylaminopropylamine (220:20:5) (dkm--i.PrOH-DAPA)
dichloromethane--i.propanol--3-dimethylaminopropylamine (160:20:5) (dkm--i.PrOH-DAPA)
dichloromethane--i. propanol--3-di methylam inopropylami ne (140: 20: 5) (dkm--i.PrOH-DAPA)
d ichloromethane--i. propanol--3-dimethylami nopropylamine (140: 30: 5) (dkm--i.PrOH-DAPA)
dichloromethane--i. propanol--3-dimethylaminopropylamine (110:40: 5) (dkm--i.PrOH-DAPA)
dichloromethane--i. propanol--3-dimethylami nopropylamine (80: 30: 5) (dkm--i.PrOH-DAPA)
d ichloromethane--i. propanol (dkm--i.PrOH)
ethyl acetate--methanol--ammonia (EtAc--MeOH--NH3)
(140:20)
(85:10:5)

840 KALAsz, BATHORI, AND MATHE
RESULTS
Fig. 1 presents the alteration of displacement chromatogram when
the ratio of dichloromethane was changed from 140:20 to 110:40, and
thereby the 2-deoxy-20-hydroxyecdysone left the displacement front and
became eluted by the carrier itself, however, the 20-hydroxyecdysone
became part of the displacement train. For comparison, the extract of
Silene atites (L.) Wib. was also spotted, that extract contained both 2-
deoxy-20-hydroxyecdysone and 20-hydroxyecdysone.
Preelution before displacement TLC can improve the separation.
Fig. 2 shows the TLC chromatogram after preelution but before
displacement (left side) and after performing the displacement separation
(right side). With preelution, 20-hydroxyecdysone can be well separated
from the overwhelming majority of other components of Silene atites (L.)
Wib. extract, including the removal of 2-deoxy-20-hydroxyecdysone.
Other arrangements, such as using dichloromethane--i.propanol-3-
dimethylaminopropylamine (220:20:5) ratio makes possible the selective
concentration of 2-deoxy-20-hydroxyecdysone in the displacement train,
as it is demonstrated in Fig. 3.
Also, preelution with ethyl acetate--methanol--ammonia (85: 1 0:5)
followed with displacement chromatography (using dichloromethane-
i.propanol--3-dimethylaminopropylamine (160:20: 1 0» makes possible the
concentration of both 2-deoxy-20-hydroxyecdysone and 20-hydroxy
ecdysone in the displacement train (Fig. 4.).
Results of displacement thin-layer chromatography with forced-flow
developments depend on the flow rate of the mobile phase. This
phenomenon is given in Figs 5 and 6 where the plates were developed
with 0.7 and 0.45 mllmin flow rate, thereby both the eluent and the
displacer fronts showed peculiar characteristics.
DISCUSSION
Although preparative separation of ecdysteroids is generally done
by a combination of various chromatographic procedures [9], efforts have

d k
m--
i. P
rOH
--D
AP
A
(140
:20:
5)
r---------Ifro
nt
----
----
--
--
--
o 0
;~Ub
Fig
ure
1,
dis
pla
cer
fron
t
star
t
dk
m--
i.P
rOH
--D
AP
A
(11
0:4
0:5
) f----------Ilfro
nt
~)
':==.
.)
------
---
),:~
:~~?
t'l~
?X'
'tf~lb
n¥'~~~
dis
pla
cer
fron
t
,sta
rt
Dis
plac
emen
t th
in-l
ayer
chr
omat
ogra
phy
of 2
-deo
xy-2
0-hy
drox
yecd
yson
e (d
b),
20-h
ydro
xyec
dyso
ne (
b) a
nd t
he
extr
act
of S
ilene
otit
es (
L,)
(ex)
is
give
n on
TLC
pla
tes
silic
a ge
l 60
F-2
54 u
sing
the
mob
ile p
hase
s su
ch a
s di
chlo
rom
etha
ne--
i, pr
opan
ol--
3-di
met
hyla
min
opro
pyla
min
e (1
40:2
0 5)
and
di
chlo
rom
etha
ne--
i,pro
pano
l--3
-dim
ethy
lam
inop
ropy
lam
ine
(11
04
0:5
) on
th
e le
ft s
ide
plat
e an
d on
the
rig
ht s
ide
plat
e, r
espe
ctiv
ely,
t1
(;j
'"d ~ I ~ o >T
j
tI1 g >< Vl t;l :;.l o 8 Vl
~
>-'

dkm
--i.
PrO
H
(140
:20)
d
km--
i.P
rOH
--D
AP
A
(140
:20:
5)
I---------ilfro
nt
I fro
nt
c=
:>
~->
____
____
____
_ J
dis
pla
cer
fro
nt
tV"
rt
star
t
Fig
ure
2.
Thi
n-la
yer
chro
mat
ogra
phy
follo
wed
by
di
spla
cem
ent
thin
-laye
r ch
rom
atog
raph
y of
2-
deox
y-20
-hyd
roxy
ecdy
sone
(d
b),
20-
hydr
oxye
cdys
one
(b)
and
the
extr
act
of S
ilene
otlt
es (
L.)
(ex)
is
give
n on
T
LC
plat
e si
lica
gel
60
F-2
54
usin
g th
e m
obile
ph
ases
su
ch
as
dich
loro
met
hane
--i.p
ropa
nol
(140
:20)
and
dic
hlor
omet
hane
--i.p
ropa
nol--
3-di
met
hyla
min
o-pr
opyl
amin
e (1
40
20
:5)
on t
he l
eft
side
pla
te a
nd
on t
he
right
sid
e pl
ate,
res
pect
ivel
y.
00
.j:
>.
N ~- (/J oN
td
;1>- ~ ~ r ~ i

DISPLACEMENT nc OF ECDYSTEROIDS
dkm--i.PrOH--DAPA (220:20:5)
~------------------Ifront
-------------o
'-'40
Figure 3.
displacer front
Displacement thin-layer chromatography of 2-deoxy-20-hydroxyecdysone (db), 20-hydroxyecdysone (b) and the extract of Silene otltes (L.) (ex) is given on TLC plate Silica gel 60 F-254 using the mobile phase dichloromethane--i.propanol--3-dimethylaminopropylamine (220:20:5).
843
been made to circumvent the difficulties of the muitistep separations. One
of these methods is the high-performance displacement chromatography
[1] and its variation, the displacement thin-layer chromatography [2-8].
Elution-type developments work with concentrations where the so called
adsorption isotherms are linear, thereby the load is limited. At the same
time, displacement chromatography works at higher concentration
(several mg/ml) which allows the separation of amines, amino acids,
peptides, proteins, steroids, generally with good yield.
Displacement thin-layer chromatography of ecdysteroids have
been described in our earlier publications, when the Influence of the
saturation of the chamber and other conditions were investigated [6, 7].
EtA
c--
Me
OH
--N
H3
(85:
10:5
) 1
----------1
fro
nt
O
'" .
U
(-' .. )
Fig
ure
4.
o
star
t
dkm
--i.
PrO
H--
DA
PA
(1
60:2
0:10
)
I fr
on
t
-.. -
-.. -
-_
_ -
-1ld
isP
lace
r fr
on
t
star
t
Th
in-l
aye
r ch
rom
atog
raph
y fo
llow
ed
by
disp
lace
men
t th
in-la
yer
chro
mat
ogra
phy
of
2-de
oxy-
20-h
ydro
xyec
dyso
ne
(db)
, 20
-hy
drox
yecd
yson
e (b
) an
d th
e ex
trac
t of
Sile
ne o
tites
(L.
) (e
x) i
s gi
ven
on
TLC
pl
ate
silic
a ge
l 60
F
-254
us
ing
the
mob
ile
phas
es
such
as
et
hyl
acet
ate-
-met
hano
l--am
mon
ia (
85: 1
0:5)
and
dic
hlor
omet
hane
--i.
prop
anol
--3-
dim
ethy
lam
inop
ropy
lam
lne
(16
02
0 1
0) a
re g
iven
on
the
left
side
an
d on
the
rig
ht s
ide,
res
pect
ivel
y
00
.j
:..
.j:.
. ~, Vl
yN
t:J:1 >, ~ o ~
y ..... ~ ~, ~ tr}

DISPLACEMENT TLC OF ECDYSTEROIDS
dkm--i.PrOH--DABA (80:30:5)
~------------------------------------------------------------------------~front
r _-"
r =.1 / \
\ J
"::::/
845
------------------.. --~------ displacer front
Figure 5.
,-," C> C> ,-'" ,-"
start
Forced-flow displacement thin-layer chromatography of 2-deoxyecdysone (a), 2-deoxy-20-hydroxyecdysone (db), 20-hydroxyecdysone-22-acetate (ac), 20-hydroxyecdysone (b), the extraction of Silene otites (L.) (ex), and integristerone (i) is given on TLC plate silica gel 60 F-254 using the mobile phase dichloromethane--i. propanol--3-dimethylaminopropylamine (80:30:5) with flow rate of 0.7 mllmin.
Effective separations were found when two-dimensional (elution
displacement) chromatography was used.
In this paper displacement separations are described, when the
preelution and displacement chromatography are performed in the same
direction, but elution-type of development precedes displacement,
thereby, effective removal of contaminants is possible. Moreover,
preelution also influences the development of displacement train. The
composition of the system, used for preelution, also determines the

846 KALAsz, BATHORI, AND MATHE
~------~~~------------~~ {3 front
-- , -, \
/-,1
------------------... --... ------c::> c::>
, -_J ,--"' , --' , --'
Figure 6.
ex displacer {3 front
start
Forced-flow displacement thin-layer chromatography of 2-deoxyecdysone (a), 2-deoxy-20-hydroxyecdysone (db), 20-hydroxyecdysone-22-acetate (ac), 20-hydroxyecdysone (b), the extraction of Silene otltes (L.) (ex), and integristerone (i) is given on TLC plate silica gel 60 F-254 using the mobile phase dichloromethane--i.propanol--3-dimethylaminopropylamine (8030:5) with flow rate of 0.45 ml/min.
members of the displacement train. These results can give the basis of
ecdysteroid separations by displacement HPLC, as has been shown
before [6,9,11-13].
Thin-layer displacement chromatography can also be performed in
a forced-flow system [7]. While the movement of developing solvents in
classical planar chromatography is propagated by capillary forces, forced
flow TLC uses pumps to deliver the mobile phase. Thereby, the speed of
development can be regulated [7, 10, 11], just as it has been done in the

DISPLACEMENT 1LC OF ECDYSTEROIDS 847
case of HPLC. For optimal separations, the flow rate should be chosen
over a certain limit (Figs. 5, 6). The displacement thin-layer
chromatography requires a definite speed of development to reach
optimised and reproducible separations.
ACKNOWLEDGEMENTS
This work was supported by grant No 14445 of the Hungarian
Academy of SCiences for HK.
We thank Dr. J. M. Varga for his valuable advices.
REFERENCES
1. Cs. Horvath, A Nahum and J. F. Frenz, "High-performance displacement chromatography", J. Chromatogr., 218 365-393 (1981)
2. H. Kalasz, H. and Cs. Horvath, "Preparative scale separation of polimyxin B's by high-performance displacement chromatography", J. Chromatogr., 215 295-302 (1981)
3. H. Kalasz and Cs Horvath, "High-performance displacement chromatography of corticosteroids. Scouting for displacer and analysis of the effluent by thin-layer chromatography", J. Chromatogr, 239: 423-438 (1982)
4. H. Kalasz, M. Bathori and B. Matkovics, "Spacer and spacerdisplacement thin-layer chromatography". J. Chromatogr., 520: 287-293 (1990)
5. H. Kalasz, M. Bathori and L. S. Ettre, "Optimization of displacement development by planar chromatography", J. Planar Chromatogr., ;2.: 210-216 (1990)
6. H. Kalasz, M. Bathori, L. Kerecsen and L. T6th, "Displacement thin-layer chromatography of some plant ecdysterolds", J. Planar Chromatogr., §: 38-42 (1993)
7. H. Kalasz, M. Bathori, L. S. Ettre and B. Polyak, "Displacement thin-layer chromatography of some plant ecdysteroids with forced-flow thin-layer chromatography", J. Planar Chromatogr., § 481-486 (1993)

848 KALAsz, BATHORI, AND MATHE
8. H. Kalasz, "The role of spacers in displacement thin-layer chromatography", J. Liquid Chromatogr., 11: 1371-1386 (1988)
9. J. -Po Girault, M. Bathori, E. Varga, K. Szendrei and R. Lafont, "Isolation and identification of new ecdysteroids from the Caryophyllaceae", J. Nat. Products, 52: 279-293 (1990)
i O. E. Mincsovics, E. Tyihak and A. M. Siouffi, "Comparison of off-line and on-line overpressured layer chromatography (OPLC)", J. Planar Chromatogr.,1: 141-145 (1988)
11. G. C. Zogg, SZ. Nyiredy and O. Sticher, "Influence of the operating parameters in preparative overpressured layer chromatography (OPLC)", J. Planar Chromatogr., 1: 261-264 (1988)
12. H. Kalasz, L. Kerecsen and M. Bathori, "Application of spacers in displacement TLC - Experiments and calculations", in Proceedings of the 4th International Symposium on Instrumentalized Thin-Layer Chromatography, H. Traltler, A. Studer and R.E Kaiser, eds., Institute for Chromatography, Bad Durkheim, 1987, pp. 265-275.
13 H. Kalasz, L. Kerecsen and M. Bathori, "Displacement chromatography of steroids", in Steroid Analysis '87, S Gbrbg, ed, Akademlai Kiad6, Budapest, 1988, pp. 405-410.
Received: October 18, 1994 Accepted: November 2,1994

JOURNAL OF LIQUID CHROMATOGRAPHY, 18(5), 849-858 (1995)
QUANTITATIVE THIN LAYER CHROMATOGRAPHY OF INDOLE ALKALOIDS. II.
CATHARANTHINE AND VINDOLINE
MAl NGOC TAM, B. NIKOLOVA-DAMYANOVA, AND B. PYUSKYULEV*
Laboratory of Natural Products Institute of Organic Chemistry with Center of Phytochemistry
Bulgarian Academy of Sciences 1113 Sofia, Bulgaria
ABSTRACT A method is described for the densitometric determination of the indole alkaloids catharanthine and vindoline in plant extract. The alkaloids were separated from each other and from the rest of the components by three-fold development with a mobile phase of petroleum ether / ethyl ether / acetone / ethanol (70+10+20+1, v/v/v/v). Catharanthine was scanned at 280 nm and vindoline - at 310 nm. The calibration curves were linear in the interval 1 J1.91 per spot -5 J1.g/per spot. A standard deviation of less than 0.1 J1.g per spot and a relative error not exceeding 3% were found.
INTRODUCTION
Until recently, the plant Catharanthus roseus (L. ) G. Don has been the only natural source for the production of the medicinally
important binary indole alkaloids vinblastine and vincristine. Unfortunately, the content of these two alkaloids in the plant is very
849
Copyright © 1995 by Marcel Dekker, Inc.

850 TAM, NIKOLOVA-DAMYANOVA, AND PYUSKYULEV
low, causing serious complications in their isolation. Obviously these factors influence unfavourably the cost of the final product [1]. The high clinical effect of the vinblastine and vincristine as antitumour agents on one hand and their limited availability on the other provoked an increasing scientific interest in their synthesis. A great number of vinblastine analogues has been synthesized. Some of them have been applied in the chemotherapy of cancer [2, 3]. The alkaloids catharanthine (I) and vindoline (II), Figure 1, have been preferably used as starting materials in these syntheses. They are also present in Catharanthus roseus , in amounts exceeding 10 - 40 times that of vinblastine and vincristine [4]. Reliable analytical methods are required for the evaluation of the analytical purity of I and II as well as for the determination of their content in the crude plant material and in the appropriate reaction mixture. Different
©cC2N
H
II
FIGURE 1. The chemical structure of the indole alkaloids catharanthine (I) and vindoline (II)

INDOLE ALKALOIDS. II 851
procedures and techniques have been proposed for the quantitation of indole alkaloids and particularly those of Catharanthus rose us [4].
among them HPLC being rather advantageous [5]. The experience gained in this laboratory in the analysis of Vinca
alkaloids has shown that TLC densitometric analysis combined with suitable pre treatment of the sample could be successfully applied to
a routine simultaneous determination of the indole alkaloids tabersonine and 11-methoxytabersonine in plant extracts [6].
Presently, we reported about a simplified analytical TLC method
for routine densitometric quantitation of catharanthine and vindoline.
EXPERIMENTAL
Materials
All reagents and solvents were of analytical grade and were used without further purification. Petroleum ether had b. p. 40-60 0C.
20 x 20 cm precoated glass TLC plates Silica gel 60 F254 (Merck Art. 5715) were used.
Catharanthine and vindoline were isolated in this laboratory from leaves of Catharanthus rose us and purified by column chromatography on aluminium oxide 90, Brockmann II-III, 0.063 0.200 mm (Merck, Art. 1097). The crude catharanthine was recrystallized in acetone, while vindoline in ethyl ether. The purity of the isolated material was checked by TLC, melting point, UV, NMR, IR spectroscopy and mass spectrometry.
Stock solutions of the pure alkaloids were prepared by dissolving
12.88 mg of catharanthine and 12.80 mg of vindoline, respectively in abs. ethanol in 25 ml volumetric flasks. Five working solutions of each alkaloid with concentrations in the range 0.512-0.103 mg/ml catharanthine and 0.512-0.1024 mg/ml vindoline, were prepared by dilution and used to plot the calibration graphs.
852 TAM, NIKOLOVA-DAMYANOVA, AND PYUSKYULEV
Isolation of Total Alkaloids from Catharanthus roseus
The finely ground dry plant material (4 g) was extracted repeatedly with five portions of 10 ml each methanol 2N citric acid (1:1, v/v). Duration of each extraction was 30 min. The combined extracts (50 ml) were concentrated under vacuum to a volume of 10 ml and the solution adjusted with ammonia to pH 8-9. The alkaloids were then extracted with 5 successive 15 ml portions of ethyl acetate. The combined extracts were washed with 3 ml of distilled water, dried over anhydrous sodium sulphate and evaporated to dryness (vacuum evaporator, 350 C). The residue was dissolved in abs. ethanol (5 ml) and solvent evaporated as described above. The resulting residue was dried at 400 C under vacuum for 1 h, the residue was weighed, transferred quantitatively into a 25 ml volumetric flask and brought to volume with abs. ethanol. 1 0 ~I
aliquots of this solution were subjected to chromatography.
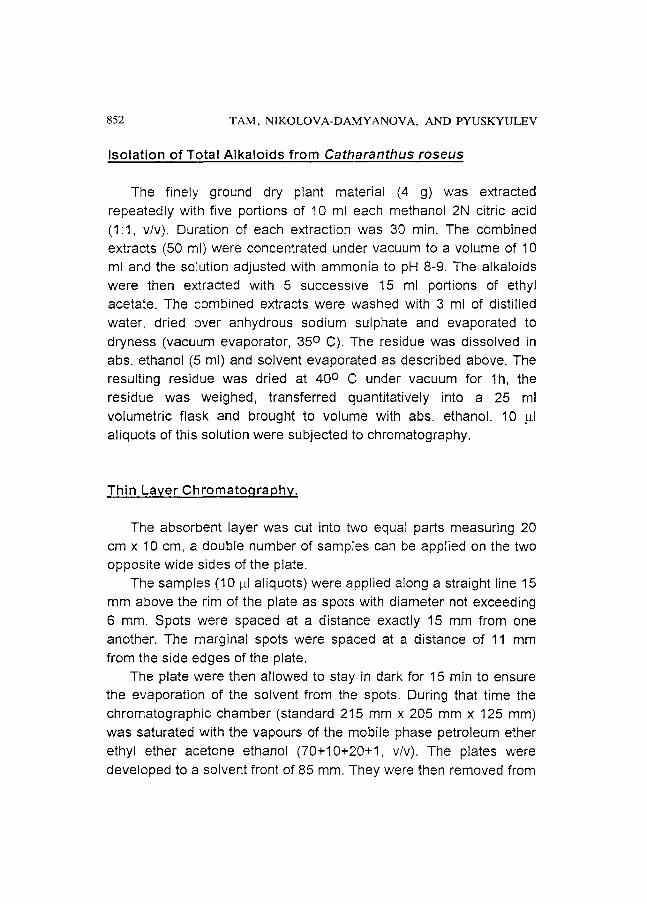
Thin Layer Chromatography.
The absorbent layer was cut into two equal parts measuring 20 cm x 10 cm, a double number of samples can be applied on the two opposite wide sides of the plate.
The samples (10 ill aliquots) were applied along a straight line 15 mm above the rim of the plate as spots with diameter not exceeding 6 mm. Spots were spaced at a distance exactly 15 mm from one another. The marginal spots were spaced at a distance of 11 mm from the side edges of the plate.
The plate were then allowed to stay in dark for 15 min to ensure the evaporation of the solvent from the spots. During that time the chromatographic chamber (standard 215 mm x 205 mm x 125 mm) was saturated with the vapours of the mobile phase petroleum ether ethyl ether acetone ethanol (70+10+20+1, v/v). The plates were developed to a solvent front of 85 mm. They were then removed from

INDOLE ALKALOIDS. II 853
the chamber, flushed with cold air for 1 min and allowed to stay in
dark at room temperature for 30 min. The developing procedure was repeated three times.
Apparatus
Densitometric measurements were performed on Shimadzu CS
930 dual wavelength scanner equipped with Shimadzu DR 2 data recorder, in zigzag refection mode with a slit size of 1.2 mm x 1.2
mm.
RESULTS AND DISCUSSION.
Thin Layer Chromatography
It is well known that the extracts containing alkaloids isolated
from a plant material comprise a great number of individual compounds. More than 90 alkaloids have been isolated, for example, from extracts of Catharanthus roseus [7]. A lot of them have similar physico chemical properties and chromatographic behaviour. Generally, the alkaloids of Catharanthus roseus can be classified into two main groups: monomeric and bis (or binary) indole alkaloids
[7, 8]. Catharanthine and vindoline belong to the monomeric group. They are distinguished from the corresponding bis indole constituents for their relatively low polarity.
Precoated glass Merck TLC Silica gel 60 F254 20 cm x 20 cm were preferred in this study due to our experience and conviction in their high chromatographic quality and reproducible results (see also [9]). It is worth noticing that small differences were observed between separate batches but they had negligible effect on the final results. As a matter of fact excellent results have been obtained on aluminium oxide 60 F254 type E (Merck, Art. 5715) plates as well.

854 TAM, NIKOLOVA-DAMYANOVA, AND PYUSKYULEV
Silica gel plates were, however, preferred because of their convenience and wider use in practice.
The composition of the mobile phase was established empirically. The chromatographic behaviour of catharanthine and vindoline as well as of bis indole alkaloids vinblastine and leurosine against each constituent of the proposed solvent mixture has been
studied. With pure ethyl ether a tailing of some alkaloid spots was observed, the spots being spread. Acetone and ethanol did not cause tailing but was not selective as vindorosine could not be resolved from vindoline, the former migrating just ahead. Petroleum ether alone could not move the components from the origine and was, therefore suitable modifier. Thus, a mobile phase of petroleum ether/ethyl ether/ acetonel ethanol in proportions 70: 1 0:20: 1 (v/v/v/v) was used and it provided reliable chromatographic result: well shaped round spots, clear separation of catharanthine and vindoline from the accompanying components, reasonable distances between the spots satisfying the densitometric requirements. Moreover, under these the bis indole alkaloids remained at the start (or close to it), while catharanthine and vindoline were the main spots with Rf values 0.39 and 0.20 respectively. A lot of non polar minor components, which formed series of well defined spots, were spaced between catharanthine and vindoline but were clearly separated and did not interfere with the quantitative densitometric measurements.
Densitometric quantitation
As already shown [6] the indole alkaloids have strong UV chromofors and can be quantified by measuring the absorbance of the spots directly on the plate via scanning denSitometry. In order to determine the optimal wavelength, the respective in situ UV spectra were recorded. Catharanthine and vindoline had maxima at different wavelengths: 280 nm (catharantine) and 310 nm (vindoline) and these were chosen for the quantitative measurements. Thus, the

INDOLE ALKALOIDS. II 855
I
A B
1.600- I- 1.600
- i-
0.800- 0.800
- I-
0.000- )\ '\.1- 0.000
I 34.0 62.0 40.0 62.0
FIGURE 2. Densitograms of Catharntine (A) and vindoline (8) in extracts of Catharanthus roseus applaied on silica gel G plates and developed with mobile phase petroleum ether / ethyl ether / acetone / ethanol (70+10+20+1, v/v/v/v).
respective spots were measured separately, each at its characteristic
wavelength the scanned distance being about 20-25 mm, Figure 2.
Plates were scanned not longer than 45 min after development.
This time was enough for the mobile phase solvents to evaporate
while the densitometric signals did not show any significant decrease
or increase of the recorded values.
Calibration graphs were constructed by using series of standard
solutions of each alkaloid (see EXPERIMENTAL). Standards were spotted in triplicate and peak areas (as derived from the integrator)
were plotted against the respective amounts per spot. Both graphs
were linear in the interval 1 ~g -5 ~g per spot, Figure 3. The correlation coefficients were 0.998 (catharantine) and 0.995 (
vindoline).

CIl <lJ Co
15
-"" 5 CIl <lJ
0...
2 3
Vindoline
Catharanthine
4 5 6 7 8
~kg per spot
FIGURE 3. The peak area vs per spot amounts of catharantine (1-.=280 nm and vindoline (I-. = 310 nm) as measured by scanning densitometry
Table 1
Acuracy and Precision of the Densitometric Determination of Catharnthine and Windoline by Silica gel Thin Layer
Chromatography
Known, Found, Relative error, a
Alkaloid ~g/per spot ~g /per spot b %
1.03 1.00±0.03 2.9
Catharanthine 309 3.06±0.03 0.9
5.15 5.05±0.10 1.9
1.03 1.02±0.01 0.9
Vindoline 3.07 3.08±0.01 0.3
5.12 5.13±0.01 0.2
a mean ± standard deviation, N=2.
b 1 xl - I al I a * 100, where x is the mean value and a is the
known value.

INDOLE ALKALOIDS. II 857
In order to determine the accuracy and the precision of the
densitometric measurements catharantine and vindoline were spotted in three different per spots amounts on two different plates.
The respective standards, in concentrations of 2.0 iJ.g/per spot and
4.0 iJ.g/per spot were also applied alongside each plate. Plates were developed as described above and scanned in the automatic
external standard mode. The results (in I1g per spot as derived from the integrator) are shown in Table 1. It is evident that the standard deviation did not exceed 0.1 I1g/per spot and the relative error was
not higher than 3%. This approach has been in use in our laboratory for more than
two years and is suitable, in our opinion, for phytochemical screening of plant extracts since it answers all requirements for a reliable analytical method.
ACKNOWLEDGEMENT This research was partially supported by the Bulgarian National
Research Foundation under contract No X-95. The authors are indebted to Ms K.Chervenkova for the skilful technical assistance
REFERENCES
1. M.E.Kuehne and I.Marko, Synthesis of Vinblastine-Type Alkaloids, in: ABrossi and M.Suffness (editors), The Alkaloids, vol. 37, Academic Press, San Diego,(1990), 77-135.
2. H.L.Pearce, Medicinal Chemistry of Bisindole Alkaloids from Catharanthus, in: ABrossi and M.Suffness (editors), The Alkaloids, vol. 37, Academic Press, San Diego, (1990), pp. 145-204.
3. N.Nues, Therapeutic Use of Bisindole Alkaloids from Catharanthus in: ABrossi and M. Suffness (editors), The Alkaloids, vol. 37, Academic Press, San Diego, (1990), pp. 229-240.
4. P. Horvath and G.lvanyi, Acta Pharm. Hung., 52, (1988) pp.1S0-1S7.

858 TAM, NIKOLOVA-DAMYANOVA, AND PYUSKYULEV
5. T. Naaranlahti, M. Nordstr.50.1 m, A. Huhtikangas and M. Lounasmaa, J. Chromatogr., 410, 488-493 (1987).
6. B.Nikolova-Damyanova, Mai Ngoc Tam and B.Pyuskyulev, J. Planar Chromatogr., 5, 271-274 (1992).
7. G. Blasko and G A. Cordell, Isolation, Structure Elucidation and Biosynthesis of the Bisindole Alkaloids of Catharanthus in: A. Brossi and M. Suffness (editors), The Alkaloids, vol. 37, Academic Press, San Diego, (1990), pp. 1-76.
8. G. Svoboda and David A. Blake, The phytochemistry and Pharmacology of Catharanthus roseus (L) G. Don, in: W. I. Taylor and N. R.Farnsworth (edditors), The Catharanthus Alkaloids, Marsel Dekker, Inc., New York, (1975), pp. 45-84.
9. Geoffrey A. Cordell, Introduction to Alkaloids- A Biogenetic
Approach John Wilei & Sons, Inc., New York, (1981), pp. 9-21.
Received: August 16, 1994 Accepted: August 29, 1994

JOURNAL OF LIQUID CHROMATOGRAPHY, 18(5), 859-872 (1995)
DETERMINATION OF MOLECULAR SPECIES OF TRIACYLGLYCEROLS FROM HIGHLY
UNSATURATED PLANT OILS BY SUCCESSIVE APPLICATION OF SILVER ION AND
REVERSED PHASE TLC
R. TARANDJIISKA, I. MAREKOV, B. NIKOLOVA-DAMYANOVA, AND B. AMIDZHIN
Laboratory of Lipid Chemistry Institute of Organic Chemistry with Center of Phytochemistry
Bulgarian Academy of Sciences 1113 Sofia, Bulgaria
ABSTRACT
A method for the quantitative determination of molecular species of triacylglycerols in highly unsaturated plant oils by consecutive use of different TLC techniques is described. Silver ion TLC in both analytical and preparative mode has been followed by reversed phase TLC to give results compatible with those obtained with RP-HPLC and capillary GLC. The method has been applied to corn and cotton seed oils. The number of the separated and quantified triacylglycerol species in these oils prevails those reported in the literature.
INTRODUCTION
The detailed determination of the triacylglycerol (TAG) composition of natural fats
and oils has always been one of the most important but difficult tasks in the lipid
analysis. The analyte is a complex mixture of molecular species with very similar
chemical properties and chromatographic separation is absolutely necessary in
859
Copyright © 1995 by Marcel Dekker, Inc.

860 TARANDJIISKA ET AL.
order to obtain reasonable results. It is accepted now that there is no single
chromatographic method capable to provide complete resolution of all components
of a natural TAG mixture. A properly chosen sequence of chromatographic
separations provides much more detailed and unambiguous information on sample
composition [I] than does any single method irrespectively of the principles and
instrumentation used. Among the chromatographic techniques available, silver ion
chromatography has a key position in that it separates triglycerides on the basis of
a single molecule property - degree of unsaturation [2]. Subsequent fractionation
by high temperature gas liquid chromatography (GLC) reversed-phase thin-layer
chromatography (TLC) or reversed-phase high performance liquid chromatography
(RP-HPLC) is based on the different chain-length or overall polarity of the TAG
molecules.
The great value of the complementary separations of TAG by silver ion
chromatography and reversed phase chromatography was recognised long ago and
the achievements has been recently reviewed [3]. Naturally, in the early seventies
most attention was paid to the combination of silver ion TLC (Ag-TLC) and
reversed-phase TLC (RP-TLC). Unfortunately, in those days both Ag-TLC and
RP-TLC were messy techniques that were not easy to control. The results were
mainly qualitative [2]. In situ quantitation was examined [4] but found no wide
application and messy procedures which included scrapping, elution and
transmethylation of the zones, and GC analysis of the component fatty acids were
usually applied. Most of the drawbacks of both Ag-TLC and RP-TLC were,
however, successfully overcomed and at present a well established procedures
which include in sitll quantitation by densitometry are available [4-9]. On the other
hand, for a long period, RP-HPLC was considered as the only technique capable to
solve all problems of the TAG analysis. However identification of dienoic and
trienoic plant TAG was and definitely is neither easy nor complete and detection
problems hampered the quantitative analysis in great extent. Thus, the sequential
application of Ag-TLC and RP-TLC, provided the most detailed quantitative
information on the TAG structure of sunflower oil, olive oil and peanut oil [7,9]
before the successful utilization of a stable silver ion column by Christie [10]
converted the powerful combination of Ag-HPLC and RP-HPLC into a handy and
convenient analytical procedure [11,12,13]. However, a limited number of natural
TAG mixtures has been analysed by the complementary application of these two
methods at present and most of the published results relayed on RP-HPLC only.

MOLECULAR SPECIES OF TRIACYLGL YCEROLS 861
Obviously, TLC techniques can not compete in speed with the HPLC, but are
efficient alternatives to the more expensive and sophisticated HPLC procedures. In
the preparative mode presented bellow Ag-TLC can be a successful aid to
subsequent RP-HPLC. Moreover, it is demonstrated in this work that the
combination of silver ion TLC and reverse phase TLC is capable to resolve
complex mixtures of unsaturated seed oils TAG such as corn and cotton. The
number of the separated and quantified TAGs species in these oils prevails those
reported in the literature.
EXPERIMENTAL
Materials, Chemicals and Samples
All reagents and solvents were analytical grade. Solvents were distilled before
use. Petroleum ether was a b.p. 40-60oC fraction. Diethyl ether was peroxide-free,
and chloroform, when used as a mobile phase component, was treated to remove
the stabilizing alcohol. Dimethyldichlorosilane (DMDS) was purchased from Fluka
(Switzerland) and was used as a silanizing reagent. Kieselguhr G and silica gel G
were obtained from Merck (Germany). Sulfuryl chloride (Merck, Germany) and
50% solution of sulfuric acid in ethanol were used as charring reagents.
Corn and cotton oils were purchased from local suppliers.
TAG fraction was isolated by preparative silica gel TLC (l mm thick layer)
with a mobile phase of petroleum ether - acetone, 100:10 (v/v). The purified TAG
were dissolved in hexane to give a 0.5% solution.
A standard mixture was prepared by mixing equal quantities of purified TAGs
from lard and sunflower oils purified as described above; added to this mixture was
certain amount of tristearine in order to increase the proportion of the trisaturated
TAG (SSS, S, for saturated fatty acid moiety) to a reasonable value. This mixture
was used to identify the TAGs from SSS to DDD (D-dienoic fatty acid moieties).
A pure TAG fraction from tangerine oil with known composition [14, I 5] was used
to identify TAGs which contained linolenic acid (trienoic fatty acid or T).
Ag-TLC
Quantitative mode
The procedure is described in details elsewhere [5,14, 5]. Briefly, TAG
classes differing in unsaturation were separated on 19 x 4 cm glass plates, coated

862 TARANDJIISKA ET AL.
with ca 0.2 mm silica gel G layer and impregnated by dipping with a 0.5%
methanolic solution of silver nitrate. An aliquot of 5-1 0 III of the sample (about 20-
40 Ilg) was applied to a plate. Plate was developed with a defined volume of the
mobile phase in open cylindrical tanks (24 cm x 5 cm i.d) and the whole volume
was allowed to pass through the plate. It was then dried (1 hour at 110°C), and
treated consecutively with bromine and sulphuryl chloride vapours (30 min each, in
closed tanks and in fume-cupboard). The separated TAG classes were finally
charred by heating at ISO-200°C on temperature-controlled metal plate.
Preparative mode
Preparative Ag-TLC was carried out as described in [6]. Namely, TAG classes
were separated on 20x20 cm home-made glass plates covered with ca. 1 mm thick
silica gel G layer which contained 5% silver nitrate. Plates were sprayed with 2',7'
dichlorofluorescein and TAG zones were vizualised under UV light. They were
scrapped, transferred to small chromatographic columns and eluted with diethyl
ether. The purity and identity of each zone was checked by analytical Ag-TLC after
cochromatographing with the reference TAG mixture and the source oil, applied
alongside. The solvent was removed by evaporation under nitrogen and samples
were redissolved in hexane to give a 0.1 % solution.
Quantitative RP-TLC
The procedure described in reference [9] was applied. In brief, 19 x 4 cm glass
plates covered with ca. 0.2 mm thick Kieselguhr G layer were first treated for 6
hours with vapours of DMDS and then washed by a single elution with methanol.
A 5-10 III aliquot of the 0.1 % TAGs chloroform solution was applied on the plate
and developed twice in closed cylindrical tank (dimensions as shown above), each
time with fresh 3 ml of the mobile phase to a solvent front of 17 cm. A mixture of
acetone/acetonitrile/water was used as a mobile phase. The ratio
acetone/acetonitrile was kept constant, 7/3 (v/v), while the proportion of water
was varied depending on the TAG composition.
Plates were dried (at 110°C for 1 hour) and separated TAG species were
vizualized by spraying with 50% ethanolic sulphuric acid and heating at 200-220oC
for about 5 min over a temperature-controlled metal plate.

MOLECULAR SPECIES OF TRIACYLGLYCEROLS 863
Densitometry.
The densities of the charred spots were measured by a Shimadzu CS-930
densitometer, equipped with DR-2 Shimadzu integrator, in the zigzag reflection
mode at 450 nm. Beam-slit was varied from OAxOA mm to l.2x1.2 mm depending
on the separation achieved. The quantity of each spot was presented as relative
area percent, as derived from the integrator.
Two sets of densitometric results were obtained: Ag-TLC provided the
quantitative data for the TAG classes differing in un saturation and RP-TLC - for
the TAG species differing in chain-length within a given class. Obviously, the Ag
TLC results were of vital importance as they were used as a base to recalculate the
RP-TLC results and to produce the final data for the TAG composition of the
sample.
RESULTS AND DISCUSSION
Ag-TLC
Cotton and corn oil are of certain industrial interest and have been intensively
studied by Ag-TLC [16,17,18,19] and RP-HPLC [20,21]. Therefore, they were
used in this study to demonstrate the ability of the combination of Ag-TLC and
RP-TLC in TAG analysis, as it was possible to compare our results with those
obtained by others.
Our experience in Ag-TLC revealed that three different developments on three
different plates are necessary in case linolenic acid is present in the sample, even at
contents lower than 1% [14,22]. The chromatographic conditions are presented in
Table l.
The first column presents the condition suitable for separation and
determination of the SSS, SSM (M, for monoenoic fatty acid moiety) and SMM
classes (Fig. I-A). SSS was not found in the examined oils even by heavy
overloading. The SMM/SSM ratio was determined under this conditions.
On a separate plate, under the conditions presented in the second column we
were able to separate all TAGs but SSM (Fig. IB). These conditions did not
provide satisfactory resolution of TAG classes with higher unsaturation than SDD.
These TAG classes (denoted further in the text as "SPUTAG" (Sum of the
Polyunsaturated TAG)) therefore were quantified as a sum. The critical point at

864 TARANDJIISKA ET AL.
TABLE 1.
Chromatographic Conditions for the Separation of TAG Classes by Silver Ion TLC'
Separation of Separation of TAG from Separation of the poly-S3, SM2 and S2M S2M to T3 unsaturated TAGs (1:p.u.)
mobile volume sample mobile volume sample mobile volume
Oil sample phase (ml) (1"9) phase (ml) (1"9) phase (ml) (,,0) (v/v) (v/v/v) (v/v/v)
PE:A PE:A:EA PE:A:EA cottonseed 35 100:5 7 30 100:4:2 12 20 100:4:2 12
corn
Fig.1A
35-40 PE:A 7 30-35 100:5
• PE - petroleum ether (b.p. 40-600 C) A - acetone EA - ethyl acetate
Fig.1B Fig.1C PE:A PE:A 100:8 5 25-30 100:8
+ + 100:5 6 100:5
S - saturated, M - monoenoic, 0 - dienoic and T - trienoic fatty acid moieties
5
6
this stage was the sample size. Overload in densitometry leads to systematically
lower results for the overloaded components. We used the ratio SPUTAGIMMD
as a criterion to keep overload under control. The sample size which ensured
maximal value of the ratio was considered suitable. Quantitation was considered
correct in these cases only when SPUT AGIMMD remained constant.
A third plate was used to resolve the components of SPUT AG (Table 1, third
column, Fig. lC). The resolution was complete and enabled correct densitometric
determination.
The mobile phase we usually use in Ag-TLC is binary with light petroleum and
acetone being mixed in different proportions [5,14,15,22]. This mixture was
suitable for corn but not for cotton TAGs. The specific TAG composition of
cotton oil required a third component. Ethyl acetate was found suitable as it
ensured the separation of TAGs which normally formed critical pair.
RP-TLC
Table 2 presents the chromatographic conditions used to resolve the TAG
species within a TAG class by RP-TLC. Obviously, since the oils contained only
one monoenoic - oleic, one dienoic - linoleic, and one trienoic fatty acid - linolenic,
TAG chain length was determined by the chain-length of the saturated fatty acids.

MOLECULAR SPECIES OF TRIACYLGLYCEROLS
~------~v~-------SPUTAG
c ::!! <II
FIGURE 1
865
@
©
Typical resolution of the TG groups of cottonseed oil. For the experimental conditions see Table 1.

866 TARANDJIlSKA ET AL.
TABLE 2.
Water Proportion in the Mobile Phase acetone/acetonitrile/water, 70:30:X for the Separation of Triacylglycerol Classes
into Molecular Species by RP-TLC
TG class. TG speciesb PNC waler proportion, by volume
S2M PPO, PStO, StStO 48,50,52 12 SM2 POO, SIOO 48, 50 14 S2D PPL, PStL, StSIL 46,48,50 12 SMD POL, SIOL 46,48 18 SD2 PLL, SILL 44,46 20
a For the abreviations see the footnote to Table 1 bThe order of designation does not indicate positional isomers, P - palmitic;
St - stearic; 0 - oleic; L - linoleic fatty acid moieties C Partition number PN=C-2n; C - number of carbon atoms
n - number of double bonds
A three component mobile phase was used. Acetone/acetonitrile ratio was
kept constant, 7:3 (v/v). Water was suitable modifier [6] and its proportion in the
mobile phase was gradually increased with increasing overall unsaturation of the
TAG class. In a previous study a simple approach to predict the water proportion
necessary for a good separation was established [6].
Quantitation.
It is a well known that while the fatty acid composition of a given seed oil can
vary depending on the climate, genetic or variety factors [23,3], the TAG
composition varies little, with the proportion between the different unsaturation
classes remaining roughly constant and unique [24].
The TAG compositions of cotton and corn oils, as being determined in this
study, are presented in Table 3. As already noticed, (see Experimental) resolution
and quantitative results obtained by Ag-TLC were the core of the whole analysis.
The quantitative result for a given TAG class was taken to recalculate the data for
the component molecular species obtained by RP-TLC. Measures were taken to
ensure the necessary accuracy and precision of the analysis (see [8] where this
problem was studied in details).

MOLECULAR SPECIES OF TRIACYLGLYCEROLS 867
TABLE 3.
TG Composition of Cotton and Corn Oils as Determined by Successive Application of Ag-TLC and RP-TLC'
TG classes (number of double
bonds)
s, (0)
S,M
(1)
SM, (2)
S,O
(2)
SMO (3)
so, (4)
S,T
(3) MO, (5)
M,T
(5)
MDT
6 D,T
(7)
TG MOLECULAR SPECIES
P?P 16:0 16:0 16;0
PPS 16:0 16:0 18.0
MlPO 14:0 16:0 16:1
PPO 16;0 16.0 18:1
PStO 16:0 18.0 18.1
StStO 18;0 18-0 16:1
StAO 18:0 20;0 18:1
P~Q 16:0 18:1 18:1 StOO 18:0 18:1 18:1
ACO 20;0 18:1 16.1
MiPL 14.0 16;0 18"2
PPL 16.0 16:0 18"2
PStL 16;0 18:0 18:2
PAL 16.0 20:0 18:2
000 18:1 18;1 16:1
POL 16:0 18:1 18:2 StOL 18:0 18:1 18:2 AOL 20:0 18:1 18:2
DOL 18:1 18:1 182
MiLL 140 18:2 182
PLL 16:0 18:2 18:2 StLL 18:0 18.2 18.2 ALL 20:0 18:2 16:2
PPLn 16,0 160 18.3
PoLL 16:1 182 182
OLL 18:1 18-2 18:2 OOLn 18:1 18:1 18:3
LLL 18:2 18:2 18:2
OLLn 18:1 18:2 16-3
LLLn 18:2 18:2 18:3
Ag-TLC
RPTLC
0.4
2.3
0.9
tr.
1.4
1.4
0.9
11.8
1.2
0.7
13.4 2
5.5
20.5 4.5
tr.
17.4
0.3
0.2
COTTON
CGC
ret20
0.5
0.1
0.6
6.2
1.2
0.2
4.4 0.6
17
8.1
2.3
2.6
104 1.3
6.1
11
20.8 17
0.1
141
15.9
RPHPLC
ref.20
1.5
0.5
2 0.7
0.6
7.7
11
16
10,9 0.9
5.1
24.5 1.1
1.4
0.3
15.4
23.2
1.5
RP- Ag-TLC HPLC
ref.21
0.4
4.4
0.3
2.4 0.2
158
14
12.8 1
4.7
25.4 1.8
11.8
156
RP-TLC
0.6
0.3
0.2
0.1
3.5 0.6
0.2
1.3
0.8
0.5
5.5
10.7 1.9 0.7
13.7
8.4 1.7 0.2
19.2
1.7
1.2
CORN
CGC
ref.20
1.g
3.9
0.5
0.3
4 0.7
19
41
13.8 1.7
11.2
17.1 2.1
18.8
17.7
0.3
RPHPLC
ref.20
0.4
1.5
0.1
2.5 0.3
2.8
3.1
10.4 1.2
10.9
16.4 1.9
0.1
22.5 0.3
25.6
0.6
1.2
RPHPLC
ref.21
2.2
1.7
37
99 1.5
104
15.2 18
26.1
25.2
2.1
• For the abreviations see the footnotes to Table 1 and 2; Mi and 14:0 - myristic acid; 16:0 - palmitic acid; 18:0 - stearic acid; A and 20:0 - arachidic acid; Band 22:0 - behenic acid; Po and 16:1 - palmitoleic acid: 18:1 - oleic acid; 18:2 - linoleic acid; 18:3 - linolenic acid moieties.

868 TARANDJlISKA ET AL.
Results obtained in this work were compared with those reported by others
where chromatographic methods, like gradient RP-HPLC and capillary GLC
[20,21] were employed. Between the numerous papers only these were chosen
where the TAG composition has been determined experimentally and not by
calculations [25].
Cotton oil. This oil is widely used for nutrition purposes either alone or in
mixtures with soybean oil [26] and was, therefore, intensively studied and analyzed
[16-21]. It has a relatively high content of saturated fatty acids (25-30%) which is
not typical for the most abundant seed oils. In total, 19 molecular species have
been determined in this study. Minor components such as MiPO, PStO, MiPL,
000, OLLn, LLLn, and MiPO have been determined. Of these, MiPO has been
determined with capillary GLC only [20] and OLLn has not been found at all. Our
results are in a good general agreement with those works where Ag-TLC followed
by GLC have been applied [16-19].
Corn oil. A specific feature of this oil is the relatively high content of the
symmetric positionally isomeric DMD TAG as found by enzyme hydrolysis [17]. It
has been found that the high DMD content hampers the clear resolution of the
SD2iMD2 classes by Ag-TLC [22,27]. To avoid the partial resolution of the
positionally isomeric TAG, the plate was given two successive developments; the
second mobile phase being oflower polarity (Table 1, columns two and three).
There is a good agreement between our quantitative Ag-TLC results and those
reported previously, with one exception: the SD2 and MD2 classes. While the sum
of these TAGs coincide very well with the published results, we found a higher
quantity ofMD2 and lower for SD2 then the reported. The reason might be that in
[16] and [17] a combination of preparative Ag-TLC with GLC was used. Under
the reported conditions of preparative Ag-TLC both TAGs migrate as two, not
clearly resolved, zones and were isolated together. The high content of silver
nitrate in the layer (13%) usually hampers strongly the detection under UV.
Presumably, the zones haven't been precisely located and differentiated.
We determined 22 TAG species in corn oil and this number is higher than has
been achieved by any chromatographic method so far. Recent communications
employing RP-HPLC reported 19 [20] and 12 [21] species (Table 3). In some
extent, the differences are due to the presence of low percents of stearic and

MOLECULAR SPECIES OF TRIACYLGLYCEROLS 869
arichidic acids in corn oil. Exactly the minor TAG components containing these
acids, were not resolved and determined by RP-HPLC. This is an obvious result
since the total sample was injected onto the column, mixed peaks were inevitably
formed and the minor component were presumably lost.
On the other hand, while the sum of PLL and OLL found in this work equals
that in [20], we determined a much lower PLL content (Table 3). Under the
conditions of [20], PLL and OLL differ by 0.51 ECN (0.64 TCN). These values
seem to be not a sufficient difference for a base-line resolution of the two
neighboring TAG. In the sequence of methods used in the present work PLL and
OLL appeared in different unsaturation fractions and were quantified separately.
We assume, therefore, that in the present work their proportion had been correctly
determined.
Based on the TAG composition of the samples, their fatty acid compositions
were calculated. The values obtained are compared with those determined directly
by GLC in Table 4. There is a very good agreement especially if one takes into
account that 19, respectively 22, TAG species were used to calculate the fatty acid
composition. This is an evidence for the high accuracy of the analysis.
TABLE 4.
Comparison of the Calculated from TAG Data Fatty Acid Compositions of Cottonseed and Corn Oils with those Determined Directly by GLC *
Fatty acid Cottonseed oil Corn oil cornoosition
GC calcul. from TG GC calcul. from TG 14:0 0.9 0.4 <0.1 -16:0 22.9 22.5 10.8 9.9 16:1 0.5 - <0.1 -18:0 1.9 3.3 1.5 1.9 18:1 16.8 17.9 29.0 31.3 18:2 56.4 55.5 57.5 55.4 18:3 0.3 0.2 0.6 0.9 20:0 0.2 - 0.2 0.5
20:1 - - 0.1 -22:0 0.1 - <0.1 -
* Saturated fatty acids under 0.2% and monoenoic fatty acids under 1.0% could not be determined by the RP-TLC procedure used.

870 TARANDJIISKA ET AL.
We assume that the results reported here are an illustration that the detailed
TAG analysis requires preliminary fractionation by silver ion chromatography.
Moreover, since it determines the accuracy of the final results, it is of vital
importance for this resolution to be as complete and precize as possible. The
second chromatographic stage in the analysis, irrespective of the technique applied
(RP-TLC, GLC, RP-HPLC), uses then samples with simpler composition. Minor
components could be unambiguously resolved, identified and determined as their
proportions in the fraction are favourably changed.
Weare convinced that the results presented here clearly show that despite its
simplicity, TLC is able to provide results which are comparable and even superior
to those obtained so far by HPLC.
We also believe that TLC has a certain advantage: the chromatogram on the
plate, like a photograph, presents the real state of resolution under the chosen
experimental conditions which helps a lot to change them toward the desirable
direction. Moreover, identification of the components is much easier and
unambiguous since a cochromatography with standards of known composition is
always possible.
ACKNOWLEDGEl\1ENTS
This work was supported In part by the National Foundation for Scientific
Research.
REFERENCES
1. A.Kuksis, LMarai, llMyher, lChromatogr., 273, 43-66 (1983)
2. B.Nikolova-Damyanova, "Silver Ion Chromatography and Lipids", in "Advances in Lipid Methodology - One", W.W.Christie ed., The Oily Press, Ayr, 1992, pp.181-227
3. C.Litchfield, "Analysis of Triglycerides", Academic Press, New York and London, 1972
4. C.B.Barrett, M.S.Dallas, F.B.Padley, lAm. Oil Chern. Soc., 40, 580-584 (1963)

MOLECULAR SPECIES OF TRIACYLGLYCEROLS 871
5. D.Chobanov, RTarandjiiska, RChobanova, lAm. Oil Chem.Soc., 53, 48-51 (1976).
6. B.Nikolova-Damyanova, B.Amidzhin, lChromatogr., 446, 283-291 (1988).
7. B.Amidzhin, B.Nikolova-Damyanova, J.Chromatogr., 446, 259-266 (1988)
8. B.Nikolova-Damyanova, B.Amidzhin, lPlanar Chromatogr. - Modern TLC, 1,397-401 (1991)
9. D.Chobanov, B.Amidzhin, B.Nikolova-Damyanova, Riv.Ita1.Sost.Grasse, 68, 357-362 (1991)
10. W.W.Christie, lHigh Resolut.Chromatogr.Chromatogr.Commun., lQ, 148-150 (1987)
11. B.Nikolova-Damyanova, W.W.Christie, B.Herslof, lAm. Oil Chern. Soc., 67, 503-507 (1990)
12. P.Laakso, W.W.Christie, lAm.Oil Chern. Soc., 68, 213-223 (1991)
13. L.Bruhl, E.Schulte, H.P.Thier, Fat Sci.Techno1., 95, 370-376 (1993)
14. RTarandjiiska, Hien Nguen, Riv.ItaI.Sost.Grasse, 65, 489-492 (1988)
15. RTarandjiiska, Hien Nguen, Riv.Ita1.Sost.Grasse, 66, 99-102 (1989)
16. F.D.Gunstone, M.Ilyas Quereshi, lAm. Oil Chern. Soc., 42, 961-965 (1965)
17. M.L.Blank, O.S.Privett, Lipids, 1, 27-30 (1966)
18. G.Jurriens, AC.lKroesen, lAm.Oil Chem.Soc., 42, 9-14 (1965)
19. MAOuedraogo, JABezard, Rev.Fr.Corps Gras, 29, 11-15 (1982)
20. T.Rezanka, P.Mares, J.Chromatogr., 542,145-159 (1991)
21. M.AM.Zeiton, WENeff, E.Selke, T.L.Mounts, J.Liq.Chromatogr., H, 2685-2698 (1991)
22. RTarandjiiska, H.Nguen, V.Lichev, Riv.Ita1.Sost.Grasse, 68, 309-312 (1991)
23. T.P.Hilditch, P.N.Williams, "The Chemical Constitution of Natural Fats", Chapman and Hall, 4th ed., London, 1964
24. F.D.Gunstone, F.B.Padley, lAm Oil Chern. Soc., 42, 957-961 (1965)

872 TARANDJIISKA ET AL.
25. S.Fiad, lAm. Oil Chem.Soc., 68, 23-25 (1991)
26. AKuksis ed. "Fatty Acids and Glycerides", Plenum Press, New York and London, 1978, pp.341-375
27. B.Nikolova-Damyanova, D.Chobanov, S.Dimov, lLiq.Chromatogr., 16, 3997-4008 (1993)
Received: August 6, 1994 Accepted: October 20, 1994

JOURNAL OF LIQUID CHROMATOGRAPHY, 18(5), 873-885 (1995)
QUANTITATIVE ANALYSIS OF ALACHLOR AND ATRAZINE IN POLYMERIC MICROCAPSULES
DETERMINED BY REVERSE-PHASE HIGH PERFORMANCE THIN LAYER CHROMATOG
RAPHY WITH DENSITOMETRY
OLIVER D. DAILEY, JR*. AND RICHARD M. JOHNSON USDA, ARS, Southern Regional Research Center
P.O. Box 19687 New Orleans, Louisiana 70179
ABSTRACT
A method to analyze polymeric microcapsules of the herbicides alachlor and atrazine by reverse-phase high performance thin layer chromatography (RP-HPTLC) has been developed. The herbicidal concentration is determined by densitometry. The method is rapid and reproducible and offers a practical alternative to determination of alachlor and atrazine by elemental analyses. Impurities, metabolites, and decomposition products which may yield falsely high percentages of herbicidal content as determined by elemental analyses are readily detected by RP-HPTLC and are not sources of error.
INrRODUCTION
Recently, concern over the pesticide contamination of
groundwater has mounted. Selected pesticides have been
detected at extremely low levels in groundwater in isolated
873
Copyright © 1995 by Marcel Dekker, Inc.

874 DAILEY AND JOHNSON
locations across the United States. In 1986. the U. S.
Environmental Protection Agency disclosed that at least 17
pesticides used in agriculture had been found in groundwater in
23 states (1). According to a 1988 interim report. 74 different
pesticides have been detected in the groundwater of 38 states from
all sources. Contamination attributable to normal agricultural use
has been confirmed for 46 different pesticides detected in 26 states
(2).
The chief objectives of our research are to develop pesticide
formulations that will maintain or increase efficacy against target
organisms and that will not adversely impact on the groundwater.
Microencapsulation is one method for obtaining this goal (3. 4).
Microencapsulated pesticides should be safer to handle. exhibit
controlled-release properties (thus possibly reducing the total
amount of pestiCide used). and have reduced potential for leaching
in the soil profile while maintaining effective biological activity.
The herbiCides alachlor and atrazine frequently have been
implicated in groundwater contamination (1.2). Previously. we
reported the preparation of polymeric microcapsules of atrazine
and the evaluation of their efficacy as herbiCides under greenhouse
conditions (5). Polymeric microcapsules of alachlor have also
been prepared and evaluated in the greenhouse (0. D. Dailey. Jr.
and C. C. Dowler. unpublished results).
In our continuing evaluation of polymeric microcapsules of
atrazine and alachlor for long-term stability. volatility. and
leaching properties. we sought an inexpensive. rapid. accurate.
and reproducible method for determination of herbicidal content.
In the past. herbicidal content was determined by the relatively
expensive elemental analysis performed by a commercial
laboratory. Often the percentage active ingredient determined
ALACHLOR AND ATRAZINE IN MICROCAPSULES 875
from N microanalysis did not agree with that obtained from Cl
microanalysis, and resubmittal of samples was necessary. We
have investigated high performance thin layer chromatography
(HPTLC) with densitometry (6-8) to determine herbicidal content of
polymeric microcapsules of alachlor and atrazine. HPTLC has
been used for the quantitfication of atrazine and simazine in water
(7) and reverse-phase HPTLC (RP-HPTLC) has been used as a
simple and direct method of analysis of soils for atrazine and its
metabolites (8).
MATERIALS AND METHODS
Chemicals and Reagents.
Technical atrazine [mp 175-177 DC; lit mp: 176°C (9)] was
provided by CIBA, Greensboro, North Carolina. Technical alachlor
(provided by Monsanto, St. Louis, Missouri) was recrystallized from
95% ethanol affording material ofmp 39.1-41.9 °C (lit mp: 39.5-
41.5°C) (9). Samples of the 88% hydrolyzed polyvinyl alcohols
Airvol 205 (low viscosity) and Airvol 523 (medium viscosity) were
provided by Air Products and Chemicals, Inc., Allentown,
Pennsylvania. Stock 0.5% solutions of Airvo1205 and 523 were
prepared by adding the polyvinyl alcohol to the vortex of stirred
cold water in a steady stream followed by heating at 85°C for
about 30 minutes. The following polymers were purchased from
Aldrich Chemical Company, Inc.: cellulose acetate butyrate,
butyryl content 17%, Tm 235°C (CAB); ethyl cellulose, ethoxyl
content 48%, viscosity (5% solution in 80/20 toluene/ethanol) 22
centipoises [EC22]; ethyl cellulose, ethoxyl content 48%, viscosity
100 cps (EClOO); poly(methyl methacrylate). low molecular weight
(PMML); poly(methyl methacrylate), medium molecular weight

876 DAILEY AND JOHNSON
(PMMM). HPLC Reagent grade dichloromethane (DCM) and
methanol (MeOH) were used as solvents.
Preparation of Polymeric Microcapsules.
Atrazine and alachlor were microencapsulated within cellulose
acetate butyrate, ethyl cellulose of two different viscosities, and
low and medium molecular weight poly(methyl methacrylate) by
the solvent evaporation process using two different emulSifiers as
previously reported (5).
In subsequent discussions, a polymeric microcapsule
formulation will be referred to in abbreviated form, such as CAB-
205, indicating the use of the polymer cellulose acetate butyrate
and the emulSifier Airvol 205.
The herbicidal content of all the polymeric microcapsules
prepared was determined by elemental analysis at the time of
preparation. Based upon the amounts of materials used, each of
the polymeric microcapsule formulations should contain 20%
active ingredient. Determination of the herbiCidal content of the
CAB, EC22, and ECIOO-523 atrazine formulations was based
upon nitrogen and chlorine microanalyses. The atrazine content
of the PMML, PMMM, and EC 100-205 formulations was
determined from nitrogen microanalyses only. High values for the
chlorine content of the PMML-523 and PMMM-523 formulations
suggested the presence of reSidual dichloromethane. Chlorine
microanalysis for PMML-205, PMMM-205, and ECIOO-205 were
not done due to sample insolubility.
Preparation of Samples for Thin Layer Chromatography.
Standard solutions of alachlor (1.008 pg/pl) and atrazine
(1.000 pg/pl) were prepared in methanol. Solutions of

ALACHLOR AND ATRAZINE IN MICROCAPSULES 877
microcapsule formulations were typically prepared by dissolving
250.0 mg of microcapsules in 100 ml of methanol or DCM giving
an effective microcapsule concentration of 10.00 pg/4pl. All
polymeric formulations dissolved readily in DCM, but only EC
formulations dissolved completely in methanol. At least 24 hours
were allowed for complete dissolution of alachlor or atrazine from
the partially soluble CAB, PMML, and PMMM formulations. Blank
solutions were prepared by dissolving 200.0 mg of each of the
polymers in 100 ml of DCM. None of the polymers were detectable
at the UV wavelengths used.
Thin Layer Chromatography.
TLC was performed on C-18 high performance reverse-phase
Uniplates (10 X 20 cm, 150 micron thickness, scored, RP18F;
Analtech Inc., Newark, Delaware). Standards and sample extracts
or solutions were drawn into microcapillruy pipets (1.0, 2.0, and
4.0 pI) and applied with a Nanomat III (Camag, Inc.). The mobile
phase for alachlor experiments was MeOH:H20 (85: 15), and for
atrazine experiments it was MeOH:H20 (70:30). Each plate was
spotted with 1.0, 2.0, 3.0 and 4.0 pI of the applicable standard
solution and with 4.0 pI of each of seven sample solutions in
duplicate. In a few instances, the seventh sample was spotted in
triplicate. Spotted plates were equilibrated in a development tank
containing the mobile phase for 20 min. prior to development.
Plates were developed for a distance of 10 cm, dried for at least 15
min .• and scanned at 200 nm for alachlor or 220 nm for atrazine
with a variable wavelength Shimadzu CS9000U Dual-Wavelength
Flying Spot Scanner. Development time was 25 min. for alachlor
experiments and 30 min. for atrazine experiments.

878 DAILEY AND JOHNSON
Statistical Analysis.
The RP-HPTLC standard curves were analyzed by linear
regression analysis (10). The mean alachlor or atrazine
concentration in each sample was determined in micrograms and
converted to a percentage (based on weight). Variance components
were computed using the Maximum Likelihood method available in
Proc Varcomp (10) to compare variability among HPTLC runs to
variability between duplicate samplings of the same formulation.
The t tests (10) were conducted separately on data collected for
each formulation, using averages of duplicate samples as a run, to
determine whether or not solvent significantly affected the result.
Standard errors were calculated for determinations by HPTLC
runs, using averages of duplicate samples as a run, and compared
to the standard error of % N and % CI determinations combined,
using the homogeneity of variance test (10). The average of HPTLC
runs collected for each formulation was paired with the % N (% CI)
result and a paired t-test (10) across all formulations was
conducted to determine how closely HPTLC and % N (% CI) results
agreed.
RESULTS AND DISCUSSION
The results of the determination of alachlor content of
polymeric microcapsules is given in Table 1. The alachlor content
in each formulation is given as a percentage (wjw). The
percentage alachlor as determined by elemental analysis (based on
% N and on % Cl) is given for comparison purposes. All samples
listed under the same formulation heading were prepared from the
same batch of polymeric microcapsules. Samples denoted by the
A, C, and D prefixes were prepared from fresh microcapsules.

TAB
LE
I
Dete
rmin
ati
on
o
f H
erb
icid
al
Co
nte
nt
of
Po
lym
eri
c A
lach
lor
Mic
rocap
sule
s b
y
RP
-HP
TL
C
an
d
Den
sito
metr
yl
Fo
rmu
lati
on
S
amp
le
So
lven
t
EC
10
0-2
05
A
1,
A2
DCM
C1
, D
2 M
eOH
EC
22
-20
5
A3,
A
4 D
CM
C2
, D
1 M
eOH
CA
B-2
05
A5,
A
6 D
CM
D3,
D
4 M
eOH
EC
10
0-2
05
B
1,
B2
DCM
EC
22
-20
5
B3,
B
4 D
CM
CA
B-5
23
B5,
B
6 D
CM
PMM
L-5
23
B7
DCM
Fro
m
RP-
HPT
LC
M
ean
SE
17
.52
3 0
.39
18
.11
3 0
.20
17
.65
30
.32
17
.88
30
.28
18
.88
3 0
.32
20
.12
3 0
.40
16
.28
5 0
.24
16
.46
6 0
.37
19
.17
5 0
.31
19
.83
7 0
.45
Fro
m E
lem
en
tal
An
aly
sis
Mea
n S
tan
dard
E
rro
r
18
.45
4 2
.85
18
.45
4 2
.85
20
.75
4 2
.35
20
.75
4 2
.35
16
.25
4 6
.15
16
.25
4 6
.15
20
.20
4 1
.20
19
.70
4 2
.90
21
.35
4 0
.55
24
.80
4 0
.30
p-v
alu
e2
Mea
n V
aria
nce
0.5
26
5
0.01
73
0.0
27
3
0.01
70
o . 3
27
9
0.00
00
0.0
01
6
0.07
00
0.0
59
3
0.01
18
0.0
13
0
0.70
99
0.0
04
1
0.72
06
lAla
ch
lor
co
nte
nt
in
each
fo
rmu
lati
on
is
g
iven
as
a p
erc
en
tag
e
(w/w
).
2p
-Val
ue
<0
.05
in
dic
ate
s
a sig
nif
ican
t d
iffe
ren
ce
betw
een
th
e
RP-
HPT
LC
m
eth
od
an
d
ele
men
tal
an
aly
ses.
3Mea
n an
d sta
nd
ard
err
or
(SE
) b
ase
d
on
n
= 8
ru
ns.
4M
ean
an
d
SE
base
d
on
n
= 2
ru
ns.
5M
ean
an
d
SE
base
d
on
n
= 6
ru
ns.
6M
ean
an
d
SE
base
d
on
n
= 7
ru
ns.
7 M
ean
an
d
SE
base
d
on
i :0 ~ i z ~ ~ o ~ U
'l ~ U'l
n =
3
run
s.
00
-.
.l
\D

880 DAILEY AND JOHNSON
Samples prepared from 4-year old microcapsules are denoted by
the B prefIx. Duplicate samplings (e. g., Al and A2 and Cl and
02) were taken from the same batch of microcapsules to test for
homogeneity. Samples prepared in dichloromethane (DCM)
solution are deSignated by the prefIxes A and B, and preparations
in methanol (MeOH) solution are deSignated by C and D. There
were a total of 13 separate HPrLC plate developments or runs.
Samples denoted by A were spotted on the same plate, B samples
were spotted on the same plate, and C and D samples were
spotted together on the same plate. Each individual sample was
spotted on at least three different plates. None of the developed
TLC plates showed any impurities or decomposition products,
indicating long-term stability of the microcapsules.
The following data were obtained from the 13 plate
developments. The R-square for the alachlor standard curve
varied between 0.990 and 0.999 with a mean of 0.996. The
coefficient of variation (%CV) for the duplicate spottings was
always under 10%, under 5% ninety-two percent of the time, and
under 2% sixty-two percent of the time. These data indicate very
high reproducibility in the spotting technique. There was no
signifIcant difference in %CV between methanol solutions and
DCM solutions, indicating that the higher volatility of DCM was
not a source of error in the spotting.
Statistical analysis of the data in Table I leads to the following
conclUSions. Variability among HPrLC runs is greater than
Variability between duplicate samplings of the same formulation,
as indicated by variance component estimates (4.20 and 0.34
respectively). There is no statistical difference (p>.19) between the
results obtained with the two solvents, DCM (A samples) and
MeOH (C and D samples), as shown by the t-test conducted for

AlACHLOR AND ATRAZINE IN MICROCAPSULES 881
each formulation. The variability among percentage alachlor
determinations by HPTLC runs is significantly less than that
between the determinations based on % N and on % CI for CAB-
205 only; however, numerically the variability is smaller for the
RP-HPTLC method in every case except for PMML-523. Additional
elemental analyses would be required to make more thorough
variability comparisons. It must be noted that of a total of ten
different formulations, the four 4-year old alachlor formulations
chosen for examination had the lowest variability between % N and
% CI determination of herbicidal content. Finally, the RP-HPTLC
results are generally more in agreement with percentage
determination based on % N (p=.9935) than on % CI (p=.OOOl),
as shown by paired t tests.
The results of the determination of atrazine content of 4.5- year
old polymeric microcapsules is given in Table 2. Samples
dissolved in methanol are denoted by the prefix E and those
dissolved in DCM are denoted by the prefix F. The numerical
suffixes denote the same polymeric formulation. The five
formulations listed showed no evidence of impurities or
decomposition products. Four unlisted formulations (EC22-205,
EC22-523, ECIOO-205, and EClOO-523) showed predominantly
atrazine (Rf 0.414-0.44), but there was a significant amount of a
second compound (Rf 0.501-0.53). The tenth formulation (PMMM-
205) showed a compound with Rf 0.475, but no atrazine. Neither
of these two unknowns is deethylatrazine, deisopropylatrazine, or
hydroxyatrazine, as demonstrated by spotting of authentic
samples of these three metabolites and comparison of Rf values
(8).
The following data were obtained from the six plate
developments employed. The R-square for the atrazine standard

TA
BL
E II
Dete
rmin
ati
on
o
f H
erb
icid
al
Co
nte
nt
of
Po
lym
eri
c A
trazin
e M
icro
cap
sule
s b
y
RP
-HP
TL
C
an
d
Den
sito
metr
yl
Fo
rmu
lati
on
S
amp
le
So
lven
t
CA
B-5
23
E1
MeO
H
CA
B-2
05
E2
MeO
H
PMM
L-2
05
E6
MeO
H
PMM
L-5
23
E7
MeO
H
PMM
M-5
23
E9
MeO
H
CA
B-5
23
F1
DCM
CA
B-2
05
F2
DCM
PMM
L-2
05
F6
DCM
PMM
L-5
23
F7
DCM
PMM
M-5
23
F9
DCM
Fro
m R
P-H
PT
LC
M
ean
SE
20
.l3
3 0
.32
19
.57
3 0
.19
2l.
l33
0.6
3
22
.53
3 0
.50
2l.
07
3 0
.60
15
.57
3 0
.62
15
.07
3 0
.32
16
.23
3 0
.51
17
.33
3 0
.18
15
.70
3 0
.50
Fro
m E
lem
en
tal
An
aly
sis
Mea
n S
tan
dard
E
rro
r
20
.40
4 l.
10
20
.00
4 l.
80
20
.15
19
.75
18
.85
20
.40
4 l.
10
20
.00
4 l.
80
20
.15
19
.75
18
.85
p-v
alu
e2
Me
an
v
aria
nce
0.7
90
1
0.21
16
0.7
71
4
0.03
11
0.5
00
3
0.1
04
5
0.0
82
8
0.0
24
2
0.56
59
0.0
36
30
.03
11
0.0
22
7
0.0
21
5
0.1
04
5
lAtr
azin
e
co
nte
nt
in
each
fo
rmu
lati
on
is
g
iven
as
a p
erc
en
tag
e
(w/w
).
2p
-Val
ue
<0
.05
in
dic
ate
s
a sig
nif
ican
t d
iffe
ren
ce b
etw
een
th
e
RP-
HPT
LC
m
eth
od
an
d ele
men
tal
an
aly
ses.
3Mea
n an
d s
tan
dard
err
or
(SE
) b
ase
d o
n n
=
4 ru
ns.
4M
ean
an
d S
E b
ase
d o
n n
=
2
run
s (n
itro
gen
an
d ch
lori
ne m
icro
an
aly
ses).
5
Nit
rog
en
mic
roan
aly
sis
on
ly.
00
0
0
N o ~ ~ o ~ ~

ALACHLOR AND ATRAZINE IN MICROCAPSULES
curve varied between 0.991 and 0.999 for 5 plates and was 0.971
for the sixth. The %CV for the duplicate spottings was always
under 10%, under 5% eighty-five percent of the time, and under
2% forty-one percent of the time. These data indicate high
reproducibility in the spotting technique.
In contrast to the results obtained for alachlor solutions, the
percentage atrazine as determined with DCM solutions of the
polymeric microcapsules was uniformly and markedly lower
(p<.0028) than that determined with methanol solutions.
883
However, the mean percentage of atrazine as determined with
methanol solutions was in excellent agreement with the theoretical
percentage of 20% and with the percentage derived from % N
microanalysis.
CONCLUSIONS
A method employing reverse-phase high performance thin layer
chromatography with densitometry in the determination of
herbicidal content of alachlor and atrazine polymeric microcapsule
formulations has been developed. The method is rapid, accurate,
reproducible, and inexpensive (on a per sample basis) and has the
added advantage in that impurities, metabolites, and
decomposition products (which may yield falsely high percentages
of herbicidal content when determined by elemental analyses) are
readily detected. In the determination of the herbicidal content of
alachlor formulations dissolution of samples in either methanol or
dichloromethane gives comparable results. Methanol is the
solvent of chOice in the analySiS of polymeric atrazine
formulations. The method should be adaptable to the analysis of
formulations of other UV -active herbiCides, such as metribuzin
and cyanazine.

884 DAILEY AND JOHNSON
ACKNOWLEDGMENTS
The authors thank Julio Mayorga for technical assistance and
Bryan Vinyard for assistance with statistical analyses.
Microanalyses were perfonned by Galbraith Laboratories, Inc.,
Knoxville, TN and Oneida Research Services, Inc., Whitesboro, NY.
Mention of a trademark, proprietary product or vendor does not
constitute a guarantee or warranty of the product by the U. S.
Department of Agriculture and does not imply its approval to the
exclusion of other products or vendors that may also be suitable.
REFERENCES
1. S. Z. Cohen, C. Eiden, M. N. Lorber, "Monitoring Ground Water for Pesticides," in Evaluation of Pesticides in Ground Water, W. Y. Gamer, R. C. Honeycutt, H. N. Nigg, eds.; ACS Symposium Series, No. 315, American Chemical Society, Washington, D. C., 1986, pp 170-196.
2. W. M. Williams, P. W. Holden, D. W. Parsons, M. N. Lorber, Pesticides in Ground Water Data Base: 1988 Interim Report, U.S.E.P.A., Office of Pesticide Programs, Environmental Fate and Effects Division, Washington, D. C., 1988.
3. M. Bahadir, G. pfister, "Controlled Release Fonnulations of Pesticides," in Controlled Release. Biochemical Effects of Pesticides, Inhibition of Plant Pathogenic Fungi, G. Haug, H, Hoffmann, W. S. Bowers, W. Ebing, D, Martin, R. Wegler, eds., Springer-Verlag, Berlin, 1990,
4. D. Seaman, Pestic. Sci., 29: 437-449 (1990)
5. O. D. Dailey, Jr., C. C. Dowler, B. G. Mullinix, Jr., J. Agric. Food Chern., 41: 1517-1522 (1993)
6. J. De Jong, H. J. van Nieuwkerk, A. H. M. T. Scholten, U. A. Th. Brinkman, R. W.Frei, J. Chromatogr., 166: 233-244 (1978)

ALACHLOR AND ATRAZINE IN MICROCAPSULES
7. J. Shenna, N. T. Miller, J. Liq. Chromatogr., 3(6): 901-910 (1980)
8. R. M. Johnson, F. Halaweish, J. J. Fuhnnann, J. Liq. Chromatogr., 15(17): 2941-2957 (1992)
9. Hartley, D., Kidd, H. eds. The Agrochemicals Handbook, 2nd ed., The Royal SOCiety of ChemistIy, Nottingham, England, 1987.
885
10. SAS Institute, Inc. SAS(STAT User's Guide. Version 6, Fourth Edition, SAS Institute, Inc., Cary, NC, 1989; Volume 2,846 pp.
Received: September 17, 1994 Accepted: September 29, 1994


JOURNAL OF LIQUID CHROMATOGRAPHY, 18(5),887-894 (1995)
TWO-DIMENSIONAL T.L.C. ON MECHANICALLY BLENDED SILICA-BASED BONDED PHASES.
EVALUATION OF THE BEHAVIORS OF C8-DIOL MIXTURES USING POLYNUCLEAR AROMATIC
HYDROCARBONS AND COMPARISON WITH C18-CYANO MIXTURES
Z. HAJOUJ1, J. THOMAS1., AND A. M. SIOUFFI2
lLaboratoire de Chimie Faculte des Sciences et Techniques
Parc de Grandmont, Tours 37200, France 2Laboratoire de Genie Chimique et Chimie Appliquee
Faculte des Sciences et Techniques Saint-Ier6me Avenue Escadrille Normandie-Niemen
Marseille 13397, France
ABSTRACT
C8-diol mixed phases for two-dimensional T.L.C. were prepared by mechanical mixing of silica-based bonded phases. Their properties in terms of retention and mechanisms developed were determined using polynuclear aromatic hydrocarbons as the compounds analyzed. Comparisons carried out with C18-cyano mixed phases revealed both similar behaviors and appreciably different behaviors, which we have explained.
INTRODUCTION
Two-dimensional thin-layer chromatography (T.L.C.) using two
separation mechanisms can be carried out on juxtaposed phases (1).
* To whom correspondence should be addressed
887
Copyright © 1995 by Marcel Dekker, Inc.

888 HAJOUJ, TIfOMAS, AND SIOUFFI
When the compounds analyzed are polynuclear aromatic hydrocarbons
(P.A.H.), the occupation of the whole layer is difficult. In fact,
the retention in the normal mode increases with their resonance
energy (2), and similarly in the inverse mode as the
hydrophobicity is directly related to the number of fused rings.
It was interesting to study whether the mixed phases might be more
attractive for the analysis of these environmental pollutants. We
have therefore studied some combinations of apolar bonded phases
and polar bonded phases, mixed mechanically. The properties of
C18/ cyano mixed phases have been published recently (3). In this
note, we report those of C8/diol mixed phases, not previously
studied, and compare them with the results from the earlier work.
MATERIALS
The P.A.H. analyzed were : anthracene (Aldrich) 99.9 % pure,
fluoranthene (Aldrich) 98 % pure, benz[a]anthracene (Aldrich) 99 %
pure, benzo[blfluo:r'anthene (Aldrich) 99 % pure, and indeno[l,2,3-
c,d]pyrene (Alltech) 98 % pure.
The mechanically mixed C8/diol phases were prepared in
various mass compositlons from the following two commercial
products: Hyperprep 120 octyl (Shandon), d p (particle diameter) =
12 j.lm, S (specific surface area) = 200 m'" .g->-, % C = 7, bonding
ratlo
j.lm, S
3.6 j.lmole.m-'" and Hyperprep 120 diol (Shandon), d p = 12
200 m2.g-~, % C = 2,88, bonding ratio = 1.3 j.lmole.m- 2•
METHODS
Preparation of phase mixtures and plates, and development
and detection techniques, were all as previously described (3).

SILICA-BASED BONDED PHASES 889
All the results are the mean of three experiments.
RESULTS AND DISCUSSION
~~:~~~~~~-~!-~~~-~:~:~:-~~~~~~~~~-~~~~-~~~-~~~~-~~~~~~~~~~-~!-~~~ Diol Phase
The RM = f (mass % of diol phase) graphs given in Figure 1
show the effect of the percentage of the polar phase on the
retentions of various P.A.H. in two-dimensional T.L.C. :
- with hexane as solvent in the first direction, the elution mode
was normal. In the composition range 30 to 100 % of the dlOl phase
(Fig la), the retentlon increased linearly with the increase in
percentage of the diol phase, whatever the P.A.H. (the correlation
coefficients, r, had values : ranLhraccrl.O = 0.9925 ; rrluoran~hono
= 0.9875 ; r.bcnzanthracon.o = 0.9890 i rbcnzo£luorantl:"l.on,<.' = 0.9793;
rindcnopyronc = 0.9937).
with a 90/10 CH30H/H20 mixture as eluent in the second
dir'ection, the mode was of the inverse type. In the composition
range 10 to 90 % in diol phase (Fig. Ib), 'the retention decreased
linearly with the lncrease in percentage of the diol phase,
whatever the P.A.H. (ranLhracono = - 0.9828 rS:luoran.thon..:-
0.9854 rbc:n.Za.:n"Lhraccno 0.9934
0.9864 ; rindc:n.opyrono - 0.9846).
§~~~¥_~!_~~~_~~~~~~~~~~_~~~~!~p~~_~¥_~~~_~~!!~~~~~_~§i~~~!_~~~~~
~~~~~~-~~~~~~~~~-~~-~~~-~~!~~~~¥-~~-~!-~~~-~~~~!~-~~~~~.
The graphs in Figure 2 show R~ f (P'), P' being the
polarity as defined by Snyder (4). They correspond to the two
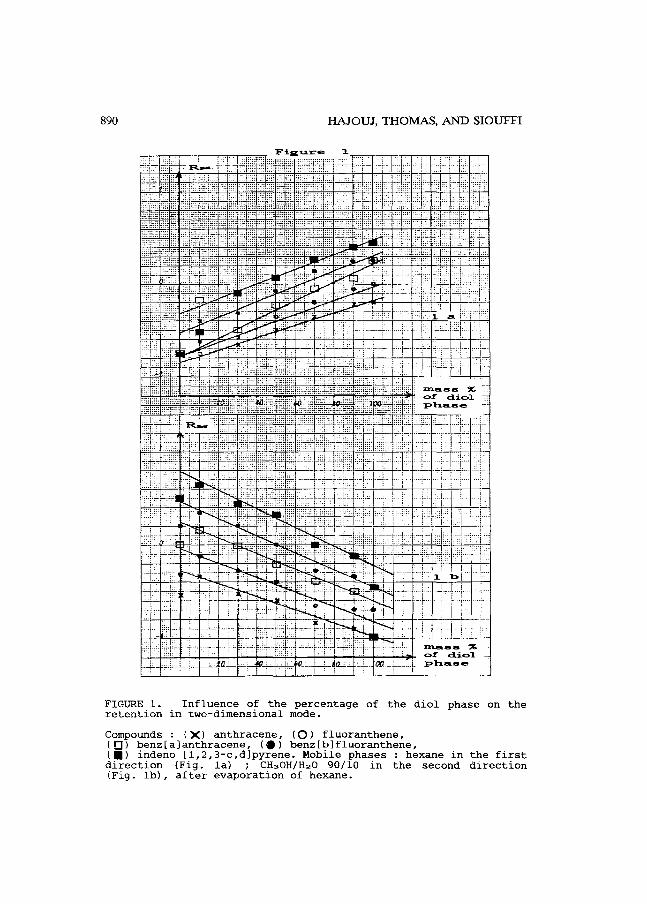
890 HAJOUJ, THOMAS, AND SIOUFFI
FIGURE 1. Influence of the percentage of the diol phase on the retention in two-dimensional mode.
Compounds ( X) anthracene, (0) fluoranthene, (0) benz[a)anthracene, (.) benz[b)fluoranthene, ( .) indeno [1,2,3 -c, d) pyrene. Mobile phases : hexane in the first direction (Fig. la) ; CH 3 0H/H20 90/10 in the second direction (Fig. lb), after evaporation of hexane.
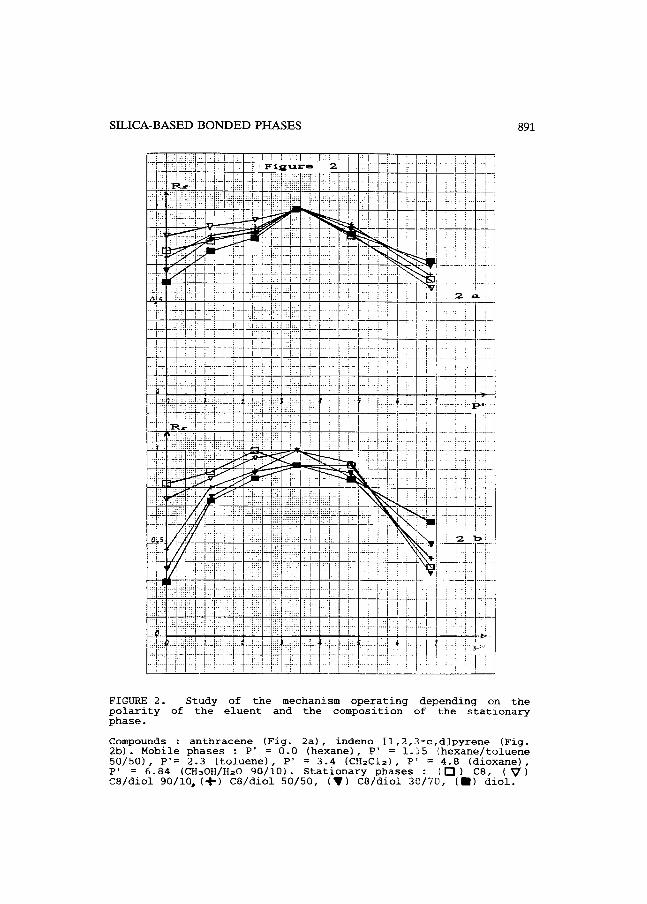
SILICA· BASED BONDED PHASES 891
FIGURE 2. Study of the mechanism operating depending on the polarity of the eluent and the composition of the stationary phase.
Compounds: anthracene (Fig. 2a), indeno [1,2,3-c,d)pyrene (Fig. 2b). Mobile phases: P' = 0.0 (hexane), P' = 1.15 (hexane/toluene 50/50), P'= 2.3 (toluene), P' = 3.4 (CH"Cl,,), P' = 4.S (dioxane), P' = 6.S4 (CH30H/H"O 90/10). Stationary phases : (0) CS, (") CS/diol 90/10# (+) CS/diol 50/50, (~) CS/diol 30/70, (.) diol.

892 HAJOUJ, TIlOMAS, AND SIOUFFI
P.A.IL having the greatest differences In retention. The most
significant results were those obtained for the most highly
retained compound, indeno[1,2,3-c,d)pyrene (Fig. 2b). This was
because of a too weak retention of anthracene leading to the Rr
observed being too similar as much by modifying P' as the C8/diol
mass composition. We observed
- the existence of a maximum for each curve corresponding to a
given mass composition. This maximum, P'=ax, corresponded to the
inversion of the mechanism normal phase polarity mechanism or
inverse phase polarity mechanism according to whether P' was less
than or greater than P'=ax
the value of P'=ax was close to 3.5 for all C8/diol
compositions, as well as for the pure diol phase.
- at low polarity, in the range 50-100 % of diol phase, the mixed
phases behaved like the diol phase. At high polarity, over the
whole compositlon range, the behavior type was less clear cut, but
more resembled that of the C8 phase.
~~~p~:~~~~-~:~~~~~-~~:-~~~~~~~-~~~~~-~~~~~~-~~~-!~~-~~~~~¥~~~ Mixed Phases
The polarity zones in the mobile phase where the normal
phase and the inverse phase mechanisms respectively apply were
very comparable. In fact, the whole of the C8/diol mixed phases,
and the C18/cyano mixed phases containing at least 50 % of the
cyano phase (3), both had a P'=ax close to 3.5. This was a little
unexpected considering the only moderate polarity generally
attributed to the cyanopropyl phase.

SILICA-BASED BONDED PHASES 893
In normal phase polarities, i.e. P' < 3.5, we will first
consider the range 50-100 % in polar phase. On the one hand, the
retentions obtained for the P.A.H. on the C8/ diol mixed phases
were fairly comparable to those obtained on the C18/ cyano mixed
phases for corresponding mass compositions. On the other hand, the
behaviors of these mlxed phases were very close to the behaviors
of the pure cyano and diol polar phases respectively, themselves
also very close. The selectivity triangle for hydrophilic bonded
stationary phases (5) shows that the essential property of a cyano
phase is the orientation of the dipoles. As for the diol phase, it
does not have a dominant acid character, but behaves somewhat
oddly as an orienter of the dipoles (5). The retention of the
P.A.H., compounds which are not very polar but very polarizable,
is essentially governed by Debye-type interactions, which with the
cyano and diol phases would lead to similar interaction energies.
In inverse phases polarities, i.e. P' > 3.5, the C8/diol
mixed phases showed lower retentions for the P.A.H than those
obtained with the C18/cyano mixed phases of corresponding mass
composi tions. This is explained on the one hand by the higher
hydrophobic nature of the C18 group compared to the C8 group (610g
P = 5.190 determined by Rekker's calculation method (6) in the
revised system, P being the partition coefficient in the n
octanol/water system), combined on the other hand with the greater
hydrophobic nature of the cyanopropyl group compared to the diol
group (610g P = 1.181). In addition, for a given polarity of the
mobile phase (for example P' 6.5), the range of retentions

894 HAJOUJ, THOMAS, AND SIOUFFI
corresponding to the different mass compositions was much narrower
for the C8/diol mixed phases than for the C18/cyano mixed phases.
This must result from the smaller difference in hydrophobic nature
between the individual C8 and diol groups (b. log P = 5.012) than
that between the lndividual C18 and cyanopropyl groups (b.log P =
9.021) •
REFERENCES
(1) H. Matsuhita, Y. Suzuki, Bull. Chern. Soc. Jap., 42, 460-464, (1969) .
(2) E. Stahl, Thin-layer chromato9raphy. A laboratory handbook, E. Stahl, ed., sd ed., Sprlnger-Verlag, New-York, 1969, p. 669.
(3) Z. Hajouj, J. Thomas, A.M. Siouffi, Analusis, accepted for publication.
(4) L.R. Snyder, J. Chromatogr., 92, 223-230, (1974).
(5) P.L. Smith, W.T. Cooper, Chromatographia, 25, 55-60, (1988).
(6) R.F. Rekker, R. Mannhold, Calculation of drug lipophilicity. The hydrophobic fragmental constant approach, VCH, Weinstein, 1992.
Received: July 26, 1994 Accepted: August 29, 1994

JOURNAL OF LIQUID CHROMATOGRAPHY, 18(5), 895-902 (1995)
SIMPLE HPLC METHOD FOR THE DETERMINATION OF THYMOQUINONE IN BLACK SEED OIL (NIGELLA SATIVA LINN)
HASSAN Y. ABOUL-ENEIN* AND LAlLA I. ABOU-BASHA Bioanalytical Drug Development Laboratory
Biological and Medical Research Department (MBC-03) King Faisal Specialist Hospital and Research Centre
P.o. Box 3354, Riyadh 112111, Kingdom of Saudi Arabia
ABS1RACf
A simple and reliable isocratic normal phase HPLC method for the determination of
thymoquinone in black seed oil (NigeZZa Sativa Linn, Ranculaceae) is described. After oil
extraction with methanol, thymoquinone is analyzed using Econosphere CN column. The
mobile phase consists of hexane:2 propanol (99:1 v/v), thymoquinone is monitored by UV
detection at 295 nm. This method is quite specific and sufficiently sensitive with a lower limit
of 5 nmoles/ml, within day and between-day assays showed variation coefficient below 5%.
INTRODUCTION
NigeZZa Sativa Linn (Ranculaceae), grows in Mediterranean countries and is cultivated in
others. The black seed oil has a long history of folklore medicine in Arabian and other
countries for the treatment of various diseases (1,2) such as; asthma, respiratory appression,
cough, headache, diuretic, lactagogue and others. The main constituents of black seed oil are
fixed oil, volatile oil and alkaloids .
• Authors to whom correspondence should be addressed
895
Copyright © 1995 by Marcel Dekker, Inc.

896 ABOUL-ENEIN AND ABOU-BASHA
Investigators attributed the pharmacological activities of black seed oil to its thymoquinone
content (the main constituent of the volatile oil) which represents 18.4 - 24% w/w of the
volatile oil (3,4). Other constituents detected in black seed oil were thymol, dithymoquinone
(thymoquinone dimer), monoterpenes, phenols and some ester (5,6).
EI-Tayeb (7) described his own experience in folk medicine and the success he had achieved
in treatment of various systemic and dermatological diseases following treatment of patients
which extract of the black seed oil or seeds powder either alone or mixed with some other
natural products. Abou-Basha et al (8) recently reported a thin layer chromatography
quantitative assay of thymoquinone in black seed oil with a limit of detection of 100
nrnoles/rnl.
Accordingly, we describe here a simple, reliable, more sensitive, and rapid HPLC assay for
thymoquinone in black seed oil that could be routinely performed in most laboratories.
MATERIALS AND METHOD
Chemicals
Thymoquinone authentic with 99.9% purity was purchased from Aldrich Chemical Co.,
Milwaukee, WI, USA. Hexane and 2 propanol were HPLC grade (Springfield, New Jersey,
USA). The two black seed oil analysed were obtained from the local market.
Chromatography
The HPLC system consisted of a Bio-Rad 1350 solvent delivery pump, a Rheodyne model
7125 injector, a Waters Lambda Max 481 variable wavelength detector set at 295 nrn and a
Hewlett-Packard 3394 A integrator. The column used was CN normal phase (250 mm x 4.6
mm J.D., Econosphere'" CN, particle size 10 J.I.) purchased from Alltech Associates, Inc,
Deerfield,IL,USA.
Sample preparation
1 rnl of methanol was added to 1 rnl of oil (commercial black seed oil) in a glass centrifuge
tube with cover. Vortex mix for 2 mins. The methanol top layer was transferred to a glass

THYMOQUINONE IN BLACK SEED OIL 897
tube. The methanol was evaporated under nitrogen stream. The residue was reconstituted
with 1 ml of mobile phase and 20 J.L I injected into HPLC system.
RESULT AND DISCUSSION
Chromatograms
A typical chromatogram of thymoquinone was presented in Figure 1, Chromatogram of
thymoquinone in oil was shown in Figure 2.
Thymoquinone has retention time of R, 4.48 min at 295 nm. At this wave length there is no
interference neither from dithymoquinone (thymoquinone dimer) nor from thymol.
Dithymoquinone and thymol were detected at 260 and 275 nm respectively.
Linearity
The calibration curve of thymoquinone were constructed over the range of 0.1-30 nmoles with
a correlation coefficient 0.999 (n=6). Each determination (n=6) of the thymoquinone
content of black seed oil consisting of calibration curve and oil extracts of interest, were done
on the same setting. The lower limit of detection was 5 nmoles/ml.
Variability and percentage recovery
High and low valued quality control sample (30 and 0.5 nmoles) were assayed six times a day
on the same day and several days during a two-weeks period, to evaluate the precision of the
assay. The within day variability (coefficient of variation) were 2.0 and 3.0 respectively for 30
and 0.5 nmoles. The day to day variation 3.5 for both values. The black seed oil sample 3
(1 ml) spiked with 500 nmol internal thymoquinone standard. The spiked sample extracted as
in sample preparation and 20 J.LI injected into HPLC system. The spiked sample assayed 6
times during two weeks period. The recovery of thymoquinone from spiked sample 3 was
100% with a coefficient of variation 2.5%.
Table 1 summarizes the results for the quantitative assay of thymoquinone as the main active
constituent of the volatile oil in black seed oil.

898 ABOUL-ENEIN AND ABOU-BASHA
(L
o t;:;
Figure 1. Chromatogram of thymoquinone authentic sample. Column CN (25cm x 4.6mm i.d., Econosphere CN, particle size 10/1); mobile phase: hexane:2-propanol (99:1 v/v); flow rate: 1 ml/min; chart speed; O.Scm/min; temperature: 23° C; detector; UV 295nm; sensitivity: 0.01 aufs; sample quantity: 10 nmol.
It has been shown that the volatile oil revealed some pharmacological activities such as
bronchodilators (9, 10, 11), increases bile flow and concentration of bile salts (12) and
decreases blood pressure in dogs (13) and in rats (14). Indeed, Marozzi et al (15) claimed
that the pharmacological activities of black seed oil is due to its thyrnoquinone contents which
varies according to the method of manufacturing the oil. This is verified by the results shown

SAM
PLE
1
I Q<
~ V1
L/)
<:I"
<:I"
SAM
PLE
2 L
/)
<:I"
<:I"
(L
o 1;;;
Fig
ure
2.
Chr
omat
ogra
m o
f 01
1 sa
mpl
e I
an
d 2
. C
olum
n C
N (
25cm
x 4
.6m
m i
.d.,
Eco
nosp
here
CN
, pa
rtic
le s
ifze
1 O~)
; m
obile
pha
se:
he
xan
e:
2-pr
opan
ol (
99: 1
v/v
); f
low
rat
e: 1
ml/
min
; ch
art
spee
d: O
.5cm
lmin
; te
mpe
ratu
re 2
3°C
; de
tect
or U
V 2
95
nm
; se
nsiti
vity
: 0.
01 a
ufs.
~ 2 z o ~ Z
b:J ~ ~ o p ~
\0

900 ABOUL-ENEIN AND ABOU-BASHA
Table 1. Analysis ofthymoquinone content in commercial black seed oils and
sample 3 spiked with thymoquinone internal standard
Black seed oil
Sample # 1
Sample # 2
Sample # 3
Sample # 3 spiked
" Mean of 6 determinations
Mean" ± S.D.
nmoles/20 /.d
55.5 ± 1.78
16.1 ± 0.58
undetected
1O.0± 0.25
CV Thymoquinone
% nmoles/ml
3.2 8.3 x 10³
3.6 2.4 x 10³
<5
2.5 0.1 x 10²
in Table 1. Oil sample #1 has a higher thymoquinone content than oil sample #2 while
thymoquinone is not detected in oil sample # 3. This requires the drug regulatory authorities
to set up a standard limit for this active constituent (thymoquinone) in black seed oil, in order
to set up a quality control criteria for this preparation.
CONCLUSION
A simple and reliable method for rapid determination of thymoquinone in black seed oil have
been developed.
The HPLC procedure is sensitive with a lower limit of 5 nmoles/ml and a coefficient of
variation less than 5% The method is suitable for routine analysis or thymoquinone in black
seed oil.
ACKNOWLEDGEMENTS
The authors wish to thank the Administration of the King Faisal Specialist Hospital and
Research Centre for their continuous support to the Bioanalytical and Drug Development
research programme.

THYMOQUINONE IN BLACK SEED OIL
REFERENCES
1. Nadkarni, A.K Indian Materia Medica; Popular Prakashan: Bombay 1,854 (1976).
2. Chopra, R.N., Nayar, S.L., Chopra, I.e. Glossary of Indian Medicinal Plants; CSIR,
New Delhi, 175 (1956).
901
3. Canonica, L., Jommi, G., Scolastico, e., and Bonati, A. The pharmacologically active
principle in Nigella sativa. Gazz. Chim. Ital.,.23, 11, 1404-1407, (1963).
4. El-Dakhakny, M. Studies on the chemical constitution of Egyptian Nigella Sativa L.
seed II. The essential oil. Planta Med . .11, 41, 465-470 (1963).
5. El-Alfy, T.S., El-Fatatry, H.M., Toama, M.A. Isolation and structure assignment of an
antimicrobial principle from the volatile oil of Nigella sativa L. seeds. Pharmazie 10, 2,
109-111 (1975).
6. Aboutabl, E.A., El-Azzouny, A.A., Hammerschmidi, F.J. Aroma volatiles of Nigella
sativa L. seeds. Prog. Essent. Oil-Res., Proc. Int. Symp, Essent. Oils, 16th, 49-55 (1986).
7. El-Tayeb, T.A., Al-Shija Fi Al-Habbah Al-Sawda. Cure in black seed: Experiments
and evidence. 2nd Edition (ed. El-Tayeb), 1988.
8. Abou-Basha, L.I., Aboul-Enein, H.Y. and Rashed, M. lLC assay of thymoquinone in
black seed oil (Nigella Sativa Linn) and identification of dithymoquinone and thymol.
J. Liq. Chromatogr. (In press).
9. Mahfouz, M., Abdel-Maguid, R. and El-Dakhakny, M. The effects of "Nigellone
therapy" on the histominopexic power of blood sera of asthmatic patients. Arzneimm.
Forsch (Drug Res.) 1.1, 1230-1232 (1965).
10. Badr-El-Din, M.K Anti-asthmatic activity of "Nigellone". Gazette of the Egyptian
Paed. Assoc.ll, 864-866 (1960).
11. El-Tahir, KE.H., Ashour, M.M.S., Al-Harbi, M.M. The respiratory effect of the
volatile oil of the black seed (Nigella Sativa L.) in guinea pigs; elucidation of

902 ABOUL-ENEIN AND ABOU-BASHA
mechanism of action. Gen. Pharmac. 24, 5,1115-1122 (1993).
12. El-Dakhakny, M. Studies on the Egyptian Nigella Sativa L. IV. Some pharmacological
properties of the seed's active principle in comparison to its dihydrocompound and its
pollymer. Arzneim. Forsch. (Drug Res.), 15, 1227-1229 (1965).
13. Mahfouz, M., El-Dakbakny, M., Gemel, A., and Moussa, H. Choleretic action of
Nigella sativa L. seed oil. Egyptian Pharm. Bull., 44, 225-229 (1962).
14. El-Tahir, K.E.H., Ashour, M.M.S., Al-Harbi, M.M. The cardiovascular actions of the
volatile oil of the black seed (Nigella Sativa L.) in rats; elucidation of the mechanism of
action. Gen. Pharmac. 24, 5, 1123-1131 (1993).
15. Marozzi, F.J., Kocialski, A.B. and Malone, M.H. Studies on the antihistaminic effects
of thy moquin one and quercetin. Arzneim. Forsch. (Drug Res.).1O, 1574-1577 (1970).
Received: October 18, 1994 Accepted: October 31, 1994

JOURNAL OF LIQUID CHROMATOGRAPHY, 18(5), 903-916 (1995)
ANALYSIS OF BENZOQUINOLINES AND ACRIDINES IN A BRAZILIAN DIESEL OIL
BY PARTICLE BEAM LC/MS AND HPLC/UV
JOHN MAOl ,2*, CARLOS R. PACHECOl ,), DANIEL D. TRAFICANTEl ,4, AND WILLIAM ROSENl
1 Department of Chemistry University of Rhode Island
Kingston, Rhode Island 02881 2 Springborn Laboratories, Inc.
790 Main Street Wareham, Massachusetts 02571
3Chemistry Division of Petrobras/Cenpes Rio de Janeiro, Brazil
4NMR Concepts University of Rhode Island
Kingston, Rhode Island 02881
ABSTRACT
Nitrogen bases were isolated from a Brazilian diesel distillate by acid extraction. With minimum sample preparation and clean-up, nitrogen bases were analyzed by particle beam LC/MS and HPLC with photo diode-array detection using reversed phase chromatography. Benzoquinolines were identified as the m<\ior nitrogen containing compounds in this basic fraction. By using neutral mobile phases, benzoquinoline homologues were separated, enabling rapid class characterization as well as preparative HPLC isolation of individual benzoquinoline homologues. Acidified mobile phases, however, exhibited greater resolution for individual isomers. UV spectroscopy was used to differentiate various types of benzoquinolines (e.g. benzo[f]quinolines, benzo[h]quinolines, and acridines). Acridines can be easily distinguished from benzo[h]- or benzo[f]quinolines by its different UV absorption spectrum. Benzo[h]- and benzo[f]quinolines were differentiated by the differences in the first derivative of the absorbance (dA/dA) vs. wavelength. To confirm the identification, nitrogen bases were also analyzed by conventional GC/MS methods.
* To whom correspondence should be addressed.
903
Copyright © 1995 by Marcel Dekker, Inc.
904 MAOET AL.
INTRODUCTION
Interest in understanding the organic nitrogen bases that are found in petroleum is
associated with several of their undesirable physical and chemical propertiesl. The adverse effects
of nitrogen bases in petroleum products are mainly in three areas: a) they poison the catalysts used
in the cracking and hydrocracking reforming processes2• 3, b) they contribute to the instability of
fuels during storage4. 7, and c) they possess potentially carcinogenic and mutagenic activities8•
The nitrogen bases found in petroleum generally occur as complex mixtures of alkylazaarenes
(nitrogenated polyaromatic hydrocarbons) containing mainly one nitrogen atom9• 10. Alkyl
substituted quinolines and benzoquinolines have been reported as major basic nitrogen compounds
in crude petroleum7• lli. Although much work has been done with regard to the characterization
of these compounds in petroleum products, the determination of the precise location of the
nitrogen atom in these polyaromatic molecules remains a challenge1o. 11. It is also of importance
to distinguish different classes of azaarenes and to study the distributions of individual isomers
because of the information that can be gained relating to the geochemical formation pathways of
petroleum lO• For instance, it is known that the distribution of homologous alkyl-substituted
aromatic nitrogen compounds differ widely in their origins and geochemical histories lO• The
toxicity of these nitrogen compounds can also be related to the location of the nitrogen atom lO•
In addition, many of these compounds represent key links in identifying the higher molecular
weight nitrogen compounds that are invariably present in petroleum.
Previously, we reported the fractionation and characterization of basic and neutral nitrogen
compounds from a Brazilian diesel oil sample12. We emphasize in this paper a more complete
characterization of the basic nitrogen compounds through an analytical sequence involving
complementary chromatographic and spectroscopic techniques. By a combination of LC/MS,
GC/MS, and HPLC with online photo diode-array detection, we demonstrate an analytical
approach that can be utilized for rapid characterization of organic nitrogen bases. Because of the
extreme complexity of diesel oils, no single analytical technique can provide the identification of
the position of the nitrogen atom in individual azaarene isomers. Although mass spectrometry is
widely used as a structure elucidation tool for petroleum products, it is not very useful in
determining the position of the nitrogen atom due to the lack of fragmentation patterns in the mass
spectra of molecules having more than two fused aromatic rings l3. 14. UV spectrometry has been
used successfully to identify di- and triaromatic azaareneslO and is applied in this work to

BENZOQUINOLINES AND ACRIDINES 905
differentiate various classes of benzoquinolines. Also discussed is the development of HPLC
systems to separate these closely related nitrogen bases and the usefulness of the LC/MS technique
as an alternative to conventional GC/MS methods.
MATERIALS AND METHODS
Materials:
The diesel oil sample was provided by Petrobras of Brazil. It was laboratory distilled at
Petrobras and had a boiling point range of 200 - 400 °C. The total nitrogen content of this sample
was approximately 700 ppm. Neutral aluminum oxide powder was obtained from J .T. Baker, Inc.
and was of chromatography grade. Reference standards of benzo[h]quinoline and acridine were
purchased from Aldrich Chemical Company and were analytical grade. Chemical structures of
benzo[h]-, benzo[f]quinoline, and acridine are shown in Figure 1. All other chemicals were
obtained from commercial sources and were at a minimum reagent grade. All solvents were
HPLC grade.
Eractionation of basic nitrogellLOillpo.unds:
Experimental procedures for the fractionation of basic nitrogen compounds in the Brazilian
diesel sample are detailed in our previous work12• Briefly, approximately 500 mL of the diesel
oil sample was dissolved in 500 mL of hexane and partitioned with 3 X 300 mL of 10% sulphuric
acid and then with 300 mL of20% sulphuric acid. The aqueous acid extracts were combined and
washed with dichloromethane. After raising the pH to 12 - 13 with sodium hydroxide, the
aqueous fraction was extracted with dichloromethane. The combined dichloromethane extracts
were washed with water, dried over anhydrous sodium sulphate, and the solvent was removed by
rotary evaporation. This sample was labeled as the basic fraction and an aliquot of it was dissolved
in methanol for HPLC separations and/or LC/MS analysis.
Highl'erformance I iquid£hromatogr.aplLJ'-{HELQ:
HPLC instruments included a Hewlett Packard 1050 gradient solvent pump, a Hewlett
Packard 1050 autosampler, a Kratos 757 UV detector, and a Hewlett Packard 3396A integrator.
LCIMS analyses were conducted using a Hewlett Packard 5989A MS Engine equipped with a
particle beam interface. Full scan electron impact (EI) mass spectra were obtained using 70 eV
electron energy at a source temperature of 250°C. HPLC-UV analyses were conducted using

906
J6I6J CQT 'N'
W
MAOETAL.
acridine
benzo[hjquinoline
benzo[flquinoline
Figure 1. Chemical structures of acridine, benzo[h]quinoline, and benzo[l1quinoline.
online photo diode-array detection (Hewlett Packard 1040A). The UV scan range was 220 to 400
nm.
Two reversed phase chromatographic systems were developed for the separation of the
basic fraction. Both systems utilized a MetaChem Nucleosil CIS (5 ,urn, 150 X 2.0 mm) column
with gradient elution at 0.4 mLiminute. System I used neutral mobile phases (A: 40/60
acetonitrile/water; B: acetonitrile). The linear gradient program was: 0 min, 100A; 40 min,
50A/50B; 60 min, 100B. System II used acidified mobile phases (A: 10/90/0.2
acetonitrile/water/acetic acid; B: 80/20/0.1 acetonitrile/water/acetic acid). The linear gradient
program was: 0 min, 100A; 60 min, 100B.
Capillary Gas Chromatograpby (GC)'
GC/MS analysis was conducted using a Hewlett Packard model 5890 series II gas
chromatograph coupled to a Hewlett Packard model 597lA mass selective detector (MSD).
Experimental conditions were:
column: Restek Rtx-1 (crossbonded 100% dimethyl pOlysiloxane, 30m x
0.25mm)
carrier gas:
ionization:
acquisition mode:
temperature program:
helium
electron impact (EI) at 70 eV
scan (60 - 300 amu)
initial - 70°C; initial time - 1 minutes; rate - 2°C/minute; final -
250°C; final time - 1 minutes
MSD was turned on 3 minutes after sample injection (solvent delay).

BENZOQUINOLINES AND ACRIDINES
(ractlon 112
'"
zu-
" " 162-0>
;1 "
" " 7\-
" " "' ~
"' " " -,
'!2
CrDclionllJ
907
" It
5 '" '" "
" " u n ., ." " "
Figure 2. HPLC/UV (254 run) chromatogram of the basic fraction using chromatographic system I. Also shown is the HPLC isolation scheme.
HPI C i sol atiaILOLhenzoqllinoline...hmnolngu.es:
Major components of the basic fraction were isolated by HPLC using a semi-preparative
HPLC column (Nucleosil C18, 5 ,um, 250 x 10 mm), The isocratic mobile phase consisted of A:
40/60 acetonitrile/water and B: acetonitrile at a ratio of 50%A and 50%B, The flow rate was 5
mLiminute, The isolated fractions were concentrated to small volumes and then partitioned with
ethyl acetate, Ethyl acetate extracts were separated, concentrated to dryness, and residues
reconstituted in methanol. To check peak purity, the methanol solutions were reinjected onto an
analytical Cl8 column using chromatographic system I.
RESULTS AND DISCUSSION
HPLC..separation of henzoquinolines
We reported previousJi2 that the basic nitrogen fraction of the Brazilian sample contained
mostly alkyl substituted benzoquinoline homologues (C2- to C4 - benzoquinolines), Similar to the

" m
" '" U,
" -'
m U> u.
~.
'" "' e'
" -,
Figure 3.
(a)
(b)
.n ~HI HQ JQ" J2a lIli H~ I~ '\11 Ik (nlll
" " " " , . • >
" " " "
" UO
~"-,.--------- u;;, -r---~_____;t--.r.--,.r__.;'.,--~---,~;_--~.---.. ',,-----.,l.;------
lN21.2]] [iii dl rEBIBaan.D
He 2U 2911 loa lHI JU ]&13 )as HU~ H.vllen II< '"011
" I,
E
" ,. " ..
L ., " "
HPLC separation of the basic fraction using acidified mobile phases chromatographic system II). (a) - 250 nm, (b) - 270 nm. (insert to (a) - UV spectrum of acridine, insert to (b) - UV spectrum of benzo[h]quinoline)

BENZOQUINOLINES AND ACRIDINES 909
TIC of dec932704_bsb1.d TIC of dcc932701.d RUn at 01 :42 PM EST on Mon Dec 27. 1993
Abundance Run at 10:49 AM EST on Mon Dec 27.1993
Abundance
30000
20000
10000
10 20
Time (min.)
TIC of dec932702_bsbl.d
BOOOOO
600000
qoOOOO
200000
30
Time (min.)
TiC of janOB0601006.d Run at 11:40 AM EST on Mon Dec 27. 1993 1293-19-04; Run at04:1S PM EST on Sat Jan DB. 1994
Abundance Abundance
100000
BOOOO
60000
qoooo
20000
Figure 4.
60000 (d)
50000
qoOOO
30000
20000
10000
10
Time (min.)
20 30
Time (min.)
so
LC/MS total ion chromatograms of (a) the isolated C2- acridines (HPLC fraction isolated #1); (b) the isolated C2- benzo[hlquinolines (HPLC isolated fraction #2); (c) the isolated C3- benzo[hlquinolines (HPLC isolated fraction #3); and (d) the isolated C4- benzo[hlquinolines (HPLC isolated fraction #4). Scan range: 70 - 300 amu.
neutral nitrogen fraction (mostly carbazole homologues)I2, the HPLC separation of the basic
fraction using neutral mobile phases was adequate for various benzoquinoline homologues. Using
this condition, well resolved benzoquinoline homologues could be readily isolated preparatively
for further characterization. However, the resolution of individual isomers using a neutral mobile
phase was poor. By using acidified mobile phases, the resolution of individual isomers was
greatl y improved. Figures 2 and 3 ill ustrate the effect of acid on the separation of
benzoquinolines. Based on the UV signal ratios at 250 and 270 nm (Figure 3), it was evident that
this sample contained at least two classes of benzoquinolines - acridines and benzo[hlquinolines.
(UV spectra of authentic standards of benzo[hlquinoline and acridine are shown in Figure 3.) The
UV identification of benzo[hlquinolines and acridines was also supported by LC/MS. It should

910 MAOETAL.
Average of 15.340 to 15.500 min. from dec932704_bsb1.d Average 0(21.741 to 21.946 min. from dec932701.d
Abundance Abundance
10000 207 207 250000
(a) (b) BOOO 200000
6000 150000
<lOOO 100000 165
165 2000 139 "'- 190 242 285 50000 " 139 "'- 190 285 82 103
"'- ),~II \ \ 103
\ 1:'1 221 246 / / / / /
/ \ 0 0
100 150 200 250 100 150 200 250
Mass/Charge Mass/Charge
Average of24.000 to 24.137 min. from dec932702_bsb1.d Average of27.682 to 27.8-44 min. from Jan080601006.d
Abundance Abundance
25000 221 ,
235 ,
12000 (d) 20000 (e)
10000
15000 BOOO
6000 10000 236
<lOOO
2~4 J /
SOOO 110 152 ;78 223 76 115
'~5/ II. 285 117 176 76
"'-I \ 2000 \
96 139':2 / / 251 \ / / / 265
/ / / 0 0
100 150 200 250 100 150 200 250
Mass/Charge Mass/Charge
Figure 5. LC/MS EI mass spectra of (a) C2- acridine, (b) C2- benzo[h]quinoline (c) C3-
benzo[h]quinoline, and (d) C.- benzo[h]quinoline identified in HPLC isolated fractions #1, #2, #3, and #4, respectively.
be noted that benzo[h]quinolines and acridines showed quite different chromatographic behaviors.
Under acidic mobile phase conditions, acridines eluted much earlier than benzo[h]quinolines and
showed significantly broader peaks. Since their mass spectra are nearly identical,
benzo[h]quinolines and acridines are difficult to differentiate by conventional GC/MS methods.
The combination of HPLC with photo diode-array detection and LC/MS enabled the identification
of these two different classes of benzoquinolines.
Analysi.s..of.indiyjduaLb.enzoquinoline..homologues
One of our research interests is to study the distribution of individual nitrogen base isomers
that are found in petroleum and to explore their geochemical formation pathways IS. To investigate
individual benzoquinoline homologues, major components of the basic fraction were isolated via
repetitive HPLC injections on a semi-preparative column. The isolation scheme is shown in
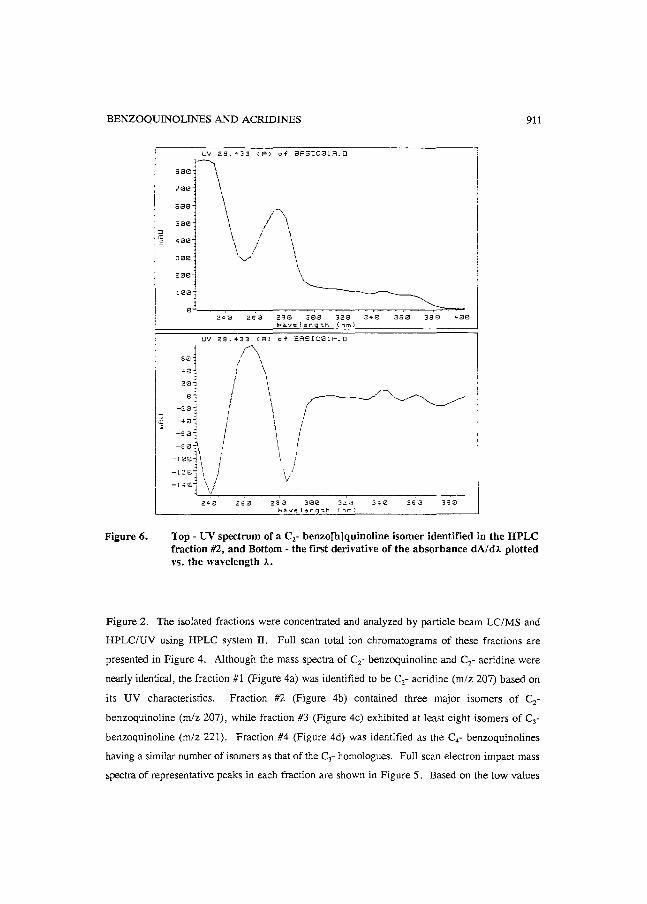
BENZOQUINOLINES AND ACRIDINES 911
I Figure 6.
UV 29.433 (A) of BASICBLA.D
1---------see] \ lee 1 see \ ::: \ r 3ara ',/'
2ara
le:j ____ ~ ____ ----~--__ ----__ --__ ------__ -.~--~_r~~~ 240 260 2'310 38e 32!21 348 36e 380 4.0.0
r.la.velength (nm)
UV 28.433 (R) OT BRSIC81A.D
j 1"', / \
::1 f \ -2:~ / \\ =::~ ;1 -8e~ I
-i 001\ / \ -
12er" I -14<11 \! 1 __ \~/ __________________________________________ __
280 280 388 328 340 Wa.ve leng'th (nm)
36 B 38 e
Top - UV spectrum of a Cz- benzo[h]quinoline isomer identified in the HPLC fraction #2, and Bottom - the fIrSt derivative of the absorbance dA/dl plotted vs. the wavelength 1.
Figure 2. The isolated fractions were concentrated and analyzed by particle beam LC/MS and
HPLC/UV using HPLC system II. Full scan total ion chromatograms of these fractions are
presented in Figure 4. Although the mass spectra of Cz- benzoquinoline and Cz- acridine were
nearly identical, the fraction #1 (Figure 4a) was identified to be Cz- acridine (mlz 207) based on
its UV characteristics. Fraction #2 (Figure 4b) contained three major isomers of Cz-
benzoquinoline (mlz 207), while fraction #3 (Figure 4c) exhibited at least eight isomers of C3-
benzoquinoline (mlz 221). Fraction #4 (Figure 4d) was identified as the C4 - benzoquinolines
having a similar number of isomers as that of the C3- homologues. Full scan electron impact mass
spectra of representative peaks in each fraction are shown in Figure 5. Based on the low values

912
bundance
4000000
J500000
3000000
2500000-
2000000·
1500000
1000000
500000
Pime -> 30.00
Figure 7.
MAOETAL.
TIC: 02942002.D
Cl - C4 b nzoquinolines
C2 - C7 quinolines
GC/MS total ion chromatogram of the basic fraction showing the separation of quinoline and benzoquinoline homologues. Scan range: 60 - 300 amu.
(e.g. < 0.4) of the two separate ratios of ions (M-H)+/M+ and (M-CH3)+ IM+\ as well as the
absence of rearrangement ions, it is likely that the benzoquinolines are polymethylated (rather than
ethyl, propyl, or butyl substituted). This conclusion is consistent with previous results I5-
19•
The other possible classes of benzoquinolines, besides the benzo[h]quinolines, that might
be present are the benzo[f]quinolines. Since their mass spectra as well as UV spectra are almost
indistinguishable, the identification of benzo[h]- and benzo[f]quinolines presented significant
difficulties. However, by plotting the first derivative of the absorbance (dAldA) vs. the
wavelength, the two classes of compounds can be distinquished2o• The ratio of the absorbance in
the vicinity of 240 and 280 nm is close to 1 for benzo[h]quinolines and greater than 3 for
benzo[f]quinolinesIO. Thus, this fingerprinting technique can significantly simplify the recognition
patterns for isomeric types of azaarene molecules. The usefulness of this technique is illustrated
in Figure 6. Based on similar UV data, it was concluded that benzo[h]quinolines were the major
components in the HPLC isolated fractions #2 - #4.
GCLM&.anaL}'Sis_oLthellasicJraction
To assist in the characterization scheme and to compare to the particle beam LC/MS
technique, the basic fraction was also analyzed by GC/MS using full scan electron impact

BENZOQUINOLINES AND ACRIDINES
undance Ion 19].00: 02942002.0
1.000000 methyl benzoquinoline
500000
~ I /I'ime -> .L..,.5-5L!,-0-0~'--"~~60-,-' 0-0--~-6-5-: 0-0"""---7-0"'-, -Oo----7-5~:-0-0---1
55.00 65.00 75.00
Ion 221.00: 02942002.0
1.me -> 55~OO 60:00 65.00 70.00 75:00 ]Abundance Ion 235.00: 02942002.0 , '
lOOOOOQ ..:
i : i C4-benzoquinoline
I 500000 1 I o~i __ ~--~~~~------~------~-=-~~~~='~~~V~\)~~~,~,~----bime 55:00 '60:00 65:00 70.00 75.00
913
Figure 8. GC/MS extracted ion chromatograms of Cc to C4- benzoquinolines (m/z 193, 207,221, and 235).
ionization. The total ion chromatogram of this sample is presented in Figure 7. Extracted ion
chromatograms (mlz 193, 207, 221, and 235) are presented in Figure 8 showing benzoquinoline
homologues and the separation of individual isomers. As shown, the separation obtained on a
capillary GC column was significantly improved compared to HPLC. The other noticeable
difference is the strong signals for the quinoline homologues (C2- to C7 -). Extracted ion
chromatograms (mlz 157, 171, 185, 199,213, and 227) are presented in Figure 9. Quinolines
were also detected by particle beam LC/MS but at much lower signals compared to
benzoquinolines. This was partially attributable to the higher volatility of quinolines which
resulted in lower sensitivity by particle beam LC/MS. (Volatile compounds are often pumped
away in the interface region prior to reaching the ion source.) Under reversed phase HPLC
conditions, quinolines elute earlier than benzoquinolines. HPLC-UV analysis at both 250 and 270

914 MAOETAL.
'"::::, 0
ime -> 1I..bundance
",000: I lme -> bundance
200000 I 0
~ime -> rbundancej 200000 ~
! J Time -> IAbundance
I 20000°1
o I
200000 ~ j
{je:.
35.00
0 I
Ml 35.00
I 35.00
35.00
I 35.00
Ion 157.00: 02942002. D
{J,L 40~OO
!:::,.tJ T
45~OO 50~OO 55~OO Ion 171.00: 02942002.D
Q6:, a [;, " NG~ 40 ~ 00 45.00 50.00 55.00 Ion 185.00: 02942002.D
AII~ J\ L~{'>AA~1A ~JJi~ 40.00 45.00 50.00 55.00 Ion 199. DO: 02942002.0
, , Af )~ tAfibJiJL ~L 40.00 45.00 50.00 55.00 Ion 213.00: 02942002.0
45:00 50.00 55.00 Ion 227.00: 02942002.D
r
~~~~d~~ce!
oli---------rI--------4o-."o-o~~~4-5'.'-0~0~--~-,,~~--~"~"TT~~.~~", [I'ime -> 35.00 50.00 55.00
I
Figure 9. GC/MS extracted ion chromatograms of Cz- to C7- quinolines (m/z 157,171, 185, 199, 213, and 227).
nm showed that quinolines were minor components in the sample, which supported LC/MS data.
On the other hand, GC/MS was much more sensitive to quinolines (because of their high
volatilities) and intense signals were acquired. We should point out that under GC/MS conditions
nitrogen species probably co-eluted with several polyaromatic hydrocarbons from the sample
matrix. As a result, interpretations of some of the mass spectra were difficult. Nevertheless, both
techniques (GC/MS and LC/MS) showed their effectiveness in characterizing complex samples
such as diesel oils. Because of the direct correlation of LC/MS to HPLC/uV, difficult tasks such
as distinguishing different types of alkylazaaerenes can be resolved. Such an advantage clearly
places LC/MS among the attractive alternatives to conventional GC/MS methods as well as being
a convenient method for direct analysis of some of these complex mixtures20•

BENZOQUINOLINES AND ACRIDINES 915
ACKNOWLEDGMENT
The authors would like to thank Petrobras for providing the diesel oil samples. This
project was funded by Petrobras, Springborn Laboratories, Inc., and NMR Concepts as a
cooperative venture.
REFERENCES
1. L. Chan, J. Ellis, P. T. Crisp, J. Chromatogr.,222: 355-368 (1984)
2. H. V. Drushel, A. L. Sommers, Anal. Chern., 3&: 19-28 (1966)
3. E. Furimsky, Erdi:il Kohle, 32: 383-390 (1979)
4. J. W. Frankenfeld, W. F. Taylor, Am. Chern. Soc., Div. Feul Chern., 23: 205-214 (1978)
5. C. D. Ford, S. A. Holmes, L. F. Thompson, D. R. Latham, Anal. Chern., 53: 831-836 (1981)
6. M. Dorbon, C. Bernasconi, Fuel, 68: 1067-1074 (1989)
7. J. F. McKay, J. H. Weber, D. R. Latham, Anal. Chern., dB: 891-898 (1976)
8. B. A. Tomkins, C. -h. Ho, Anal. Chern., 54: 91-96 (1982)
9. S. 1. Marshman, Fuel, 10: 967-969 (1991)
10. J. M. Schmitter, H. Colin, J. L. Excoffier, P. Arpino, G. Gulochon, Anal. Chern., 54: 769-772 (1982)
11. M. Li, S. R. Larter, D. Stoddart, M. Bjor0y, Anal. Chern., 64: 1337-1344 (1992)
12. J.Mao, C. R. Pacheco, D. D. Traficante, W. Rosen, Fuel, in press (1994)
13. J. M. Schmitter, I. Ignatiadis, P. J. Arpino, Geochimica et Cosmochimica Acta, 41: 1975-1984 (1983)
14. P. Burchill, A. A. Herod, E. Pritchard, J. Chromatogr., 246: 271-295 (1982)
15. J. M. Schmitter, Z. Vajta, P. J. Arpino, In Advances in Organi.c..Deoch.emisu)' 1979, A. G. Douglas, J. R. Maxwell, eds., Pergamon Press, Oxford, 1980, pp. 67-76.
16. J. M. Schmitter, I. Ignatiadis, G. Guiochon, J. Chromatogr., 24.8: 203-216 (1982)
916 MAO ET AL.
17. S. D. Sample, D. A. Lightner, O. Buchardt, C. Djerassi, J. Org. Chern., 32: 997-1005 (1967)
18. P. M. Draper, D. B. McLean, Can. J. Chern., 46: 1487-1497 (1968)
19. M. Novotny, R. Kurnp, F. Meril, L. Todd, J. Anal. Chern.,.52: 401-406 (1980)
20. J. Mao, C. R. Pacheco, D. D. Traficante, W. Rosen, J.Chrornatogr., in press (1994)
Received: August 26, 1994 Accepted: September 7, 1994

JOURNAL OF LIQUID CHROMATOGRAPHY, 18(5), 917-923 (1995)
DETERMINATION OF SULFAMATE AND SULFATE AS DEGRADATION PRODUCTS IN
AN ANTI EPILEPTIC DRUG USING ION CHROMATOGRAPHY AND INDIRECT
UV DETECTION
W. LI AND T. M. ROSSI Analytical R&D
The R W. Johnson Pharmaceutical Research Institute Spring House, Pennsylvania 19446
ABSTRACT
Topiramate (bis-O-(l-methylethylidene)-fructopyranose sulfamate) is a potent antieplleptic drug currently in phase III clinical trials. Sulfamate and sulfate have been found to be two stoichiometrically formed degradation products in toptramate. An ion chromatographic method with indirect UV detection has been developed to assay sulfamate and/or sulfate in topiramate drug substance and formulated products. When used in combination with an HPLC assay method. this method is stability-indicating and can be used as a regulatory method.
INTRODUCTION
Traditionally carbohydrates and derivatives are not conSidered good
candidates for pharmacological development. In the last few years. however.
new evidence of pharmacological activity for some carbohydrates has excited
many scientists in the pharmaceutical industry. Currently. carbohydrates are
being investigated by pharmaceutical companies and academic institutes alike
in many therapeutic areas including rheumatoid arthritis. ulcer. tumor. tissue
917
Copyright © 1995 by Marcel Dekker, Inc.

918 LI AND ROSSI
repair. cardiovascular. and inflammatory diseases [1-3[. Topiramate. a
sulfamate derivative of fructose developed by the R.W. Johnson Pharmaceutical
Research Institute. is a potent antiepileptic drug currently in Phase III clinical
trials [4[.
In the process of developing regulatory analytical methodology. the
analytical chemists faced several problems that have been proven to be very
interesting and challenging. Like most other carbohydrates. topiramate and
most related impurities do not have a chromophore active above 190 nm. This
limits the chOices of detection techniques if an HPLC method needs to be
developed. Also, topiramate. the process impurities and degradation products
cover a wide range of polarity. This makes it very difficult to select the right
column. elution mode and mobile phase which is compatible with the detector.
Another problem was to achieve mass balance in the stability studies. Insoluble
residues were formed in some stability samples and mass balance was not
observed for those samples uSing conventional HPLC or capillary GC methods
by assaying the major and organiC degradation products.
This paper deSCribes a simple ion chromatographic method which is
stability-indicating when used in combination with an HPLC assay method.
EXPERIMENTAL
Materials
Topiramate drug substance was prepared by the R.W. Johnson
Pharmaceutical Research Institute as previously reported [4[. HPLC grade
methanol and water were used to prepare the mobile phase. p-Hydroxybenzoic
acid was obtained from Sigma (St. Louis. Missouri).
Apparatus
An HPLC system conSisting of a Waters 600E pump. a WISP 712
automatic injector and an Applied Biosystems 783A programmable UV detector
was used. Data acquisition was done using a Hewlett Packard 3357 laboratory
automation system via a 18652AA/D converter.
HPLC Conditions
The method utilizes a polymer based anion-exchange column (PRP-XI00.
10/.lm particle size. 15 cm x 4.6 mm I. D.) purchased from Hamilton (Reno.

SULFAMATE AND SULFATE AS DEGRADATION PRODUCTS 919
Nevada) and indirect IN detection at 310 nrn [51. The mobile phase was a
mixture of 5.8 roM p-hydroxybenzoic acid and 2.5% methanol and was adjusted
to pH 9.4 ±. 0.1 using sodium hydroxide. All analyses were performed
isocraticalIyat 40 °c ± 0.1 with a flow rate of 1.5 mL/min. The injection volume
was 100 J.!L.
Sample Preparation
For drug substance. accurately weigh about 40.0 mg sample into a 0.5 oz
bottle. Pipette 10.0 mL of mobile phase into the bottle and shake for one hour.
Visually inspect each sample solution. If insoluble particles are found in the
solution. fllter the sample through a 0.45 IJl1l Nylon 66 Whatman fllter (Clifton.
NJ). discarding the first 5 mL of flltrate.
For tablets ( 100 mg strength). place 10 tablets into a 250 mL volumetric
flask. Add 200 mL of mobile phase into the flask and shake for one hour. Dilute
to volume with mobile phase and shake well. Filter each diluted sample
through a 0.45 IJl1l Nylon 66 Whatman filter. discarding the first 5 mL of filtrate.
RESULT AND DISCUSSIQN
The method was validated for monitoring sulfate in topiramate tablets
and sulfamate and sulfate in topiramate drug substance. Validation studies.
inclUding specificity. solution stability-indicating ability. recovery. linearity.
precision. sensitivity. and ruggedness. were performed. The results are
summarized in Table 1.
Topiramate (Scheme 1) in the solid state is very stable at ambient
temperature. In fact. several batches of topiramate have been stored at room
temperature for several years with no noticeable degradation detected. At
elevated temperatures. however. degradation was observed for drug substance
and formulated products. Interestingly. when degraded samples were assayed by
a reversed-phase HPLC method [61. a decrease in topiramate assay values was
observed. but no proportional amount of degradation products could be detected.
Meanwhile. insoluble black particles were found in the degraded samples. An
elemental analysiS was performed for one of the degraded samples and the result
indicated that black carbon was present which implied that a mass balance
would not be achieved by assaying topiramate and the organic mOieties of the

920 LI AND ROSSI
Table 1: Selected Method Validation Results
Specificity - Specificity of this method is determined by resolving sulfamate and/or sulfate from system peaks
Linearity - The assay response was linear from 0.25 to 18.8 mole percent for sulfate and 0.25 to 6.3 mole percent for sulfamate
Precision - The method precision (ten replicates). expressed as relative standard deviation (RSD%). was 6.1% for sulfamate at the 0.7 mole percent level and 5.8% for sulfate at the 1.5 mole percent level.
Sensitivity- The limit of detection was determined to be 0.1 mole percent for both sulfamate and sulfate (signal/noise = 2). The limit of quantitation was determined to be 0.3 mole percent for sulfamate and sulfate with an RSD%.::;; 10%.
Solution Stability - Sample solutions are stable at ambient temperatures for 2 days
Recovery - The recovery of sulfamate and sulfate from degraded drug substance samples and the recovery of sulfate from degraded tablet samples. both contained insoluble black particles. was determined by exhaustive extraction followed by Ie analysis. A range of extraction times from 1 hour to 22 hours was studies and did not affect the recovery.
Ruggedness - Data generated to study the method ruggedness indicate that the method is rugged. Mobile phase composition and pH. column temperature and length were varied.
Sulfate
+ Unknown
t Sulfamate
Topiramate + Unknown
Scheme 1. Topiramate Degradation

SULFAMATE AND SULFATE AS DEGRADATION PRODUCTS 921
degradation products. In probe stability studies, it was found that the degraded
drug substance and tablets contained considerable amount of acids. For
example, a 10 mg/mL suspension of topiramate drug substance sample stressed
at 90 0c and uncontrolled hUmidity for about 19 hours had a pH of 1.9. The
initial pH for undegraded samples was about 6. Based on literature references
[7] and the above observations, we proposed a degradation pathway for
topiramate in Scheme 1. The Simplified scheme is used to develop an analytical
strategy rather than to desCribe topiramate degradation.
Degradation studies were carried out to confirm the proposed scheme.
Topiramate drug substances were stressed at 70 and 90 °c and uncontrolled
relative humidity. Samples pulled at different time pOints were assayed for
sulfamate and sulfate using this ion chromatographic method and for
topiramate remainings using a reversed-phase HPLC method [6J. The results are
presented in Table 2. Sulfamate and sulfate were detected in the drug substance
samples stressed at 90 DC after 11 hours. At 15 hours, the concentration of
sulfamate reached a maximum of 5.7% (mole) then started decreasing whereas
the concentration of sulfate increased steadily as toplramate assay values
decreased. A Similar pattern was observed for samples stressed at 70 °c except
that the maximum concentration of sulfamate was only 1.3% (mole) observed
at 120 and 144 hours .
The mass balance (recovery) data are also presented in Table 2. For the
90 °c samples, the total recovery decreased with time and was 71.0% when
about 44.1 % topiramate was degraded. The lack of total recovery with these
samples indicated a possibility of several parallel degradation reactions for
topiramate at this temperature. The degradation reactions may generate
sulfamate, sulfate, black carbon and some unknown organic degradation
products to which the sulfamate functionality was still attached. Therefore,
Scheme 1 is not a complete description for toplramate degradation at 90 °c. For
the 70 °c samples, the improved recovery (96.6% - 98.3%) was time-independent
and acceptable for practical purposes. The best recovery results were observed
for three batches of degraded topiramate tablets which had been stored in three
different containers at 40 0c for 9 months. Different amounts of desiccant were
present in two of those containers. These samples were analyzed USing this
method for sulfamate and sulfate. The method had to be modified to assay
sulfamate because of interference from the excipients [8]. It is interesting that

922 LIAND ROSSI
Table 2: Weight Percent Assay Values for Toplramate and Degradation Products Observed in Stressed Drug Substance and Tablets
Stress Condo Sulfamate Sulfate Topiramate Recovery °C/hour (mole%) (mole%) (o/qJ (%)
--------------------------------------------------------
Drug Substance
90/7 0.0
90/11 0.4
90/13 2.0
90/15 5.7
90/17 4.0
70/120 l.3
70/144 1.3
70/168 0.6
70/192 0.5
70/240 0.9
Tablets
40/9 month(a N/A
40/9 month(b N/A
40/9 month(c N/A
a - No desiccant in container b - 1 g desiccant in container c - 10 g deSiccant in container
0.0 100.4 100.4
0.2 98.7 99.3
0.5 91.6 94.1
3.5 72.1 81.3
11.1 55.9 71.0
2.0 93.9 97.2
6.4 90.0 97.7
9.7 86.3 96.6
10.4 87.4 98.3
13.8 83.1 97.8
13.4 86.3 99.7
7.3 93.0 100.3
0.7 100.7 101.4
only sulfate was detected in these samples. and that the stability of toplramate
is related to the amount of desiccant present in the containers.
In summary, for topiramate drug substance and tablets exposed to
elevated temperatures (5,.70 0C), sulfamate and/or sulfate are the
stoichiometrically formed degradation products. Therefore, the assay of
sulfamate and/or sulfate is equivalent to assaying the total organic moieties of
degradation products that do not contain sulfur. This strategy takes advantage

SULFAMATE AND SULFATE AS DEGRADATION PRODUcrS 923
of the fact that sulfamate and sulfate are stable and nonvolatile chemical
entities, while the disadvantage is that two assay methods are needed (one for
the active drug and one for the degradation products) for the release testing and
stability monitoring of the drug substance and tablets. Currently at the R W.
Johnson Pharmaceutical Research Institute, this strategy has been
incorporated into the offiCial stability testing program for topiramate. Many
drug substance and tablet samples stressed at 40 or 50 °C have been assayed.
Good mass balance has been observed for all samples assayed.
REFERENCES
1. H. Yamada, M. Hirano, H. Kiyohara, Carbohydr. Res., 219,173-192 (1991). 2. S. Demleitner, J. Kraus, G. Franz, Carbohydr. Res., 226, 239-246 (1992). 3. L. Marshall., The Scientist, Feb. 3, (1992J. 4. B. E. Maryanoff, S. O. Nortey, J. F. Gardocki, R P. Shank, S. P. Dodgson, J. Med. Chern.,;m, 880-887 (1987). 5. H. Small, T. E. Miller, Jr .. Anal. Chern., M, 462-469 (1982) 6. w. U, Unpublished results. 7. J.R Turvey, "Sulfate of the Simple Sugars", in Advances in Carbohydrate Chemistry, M.L. Wolfrom, RS. Tipson, eds, AcademiC Press, New York and London, 1965, pp 183-218 and the references cited herein. 8. W. U, Unpublished results
Received: August 1, 1994 Accepted: August 10, 1994


JOURNAL OF LIQUID CHROMATOGRAPHY, 18(5), 925-939 (1995)
LIQUID CHROMATOGRAPHIC ASSAY FOR THE SEPARATION OF SINGLE- AND DOUBLE
STRANDED DNA BY USING UV AND UV DIODE-ARRAY DETECTORS AND
HYDROXYLAPATITE COLUMN
K. M. S. SUNDARAM AND L. SLOANE Natural Resources Canada, Canadian Forest Service
Forest Pest Management Institute 1219 Queen Street East, Box 490
Sault Ste. Marie, Ontario, Canada P6A 5M7
ABSTRACT
A high-performance liquid chromatographic (HPLC) method, using UV and UV diodearray (DA) detection, is reported for the separation of single-stranded (s.s.) and doublestranded (d.s.) DNA molecules. Commercially available calf thymus DNA was used as the standard, to develop and optimize necessary analytical procedures and chromatographic parameters. Bio-Gel® hydroxylapatite was used as the column packing and the sorbed polynucleotides on the column matrix were separated by using an ionic strength gradient system consisting of phosphate buffer at pH 6.8. The stationary phase was stable and proved sufficiently reliable in the separation and resolution of s.s. and d.s. DNA molecules in the standard. Pointedly, the DA detector was more sensitive to the analytes than the UV detector. The response of both detectors was higher for the s.s. DNA compared to the d.s. DNA. Minimum quantification limits (MOL) for the s.s. DNA molecules by the DA and UV detectors were, respectively, 0.10 and 0.50 IJ.g in 10 IJ.L injections. The corresponding value for the d.s. DNA, using both detectors, was 1.0 IJ.g. The plot log (lJ.g of DNA) vs absorbance (mAU) was linear for the d.s. DNA. The MOL, using both detectors, was 0.10 IJ.g in 10 IJ.L injection volume. Extension of the method to separate the viral DNA molecules showed some promise. However, problems associated with sample purity and homogeneity, peak characterization, quantification of the analytes etc. were encountered and these drawbacks are discussed.
925
Copyright © 1995 by Marcel Dekker, Inc.

926 SUNDARAM AND SLOANE
INTRODUCTION
The use of high-performance liquid chromatography (HPLC) is gaining importance in
the separation and analysis of nucleic acids over the conventional electrophoresis method
because of its reproducibility and quantitative accuracy (1,2). The introduction of several
novel column packing materials enhanced the isolation and analysis of nucleic acids and
their fragments with excellent resolution (3-9). In normal phase chromatography, organic
resins used previously have been replaced by micro particle silica gels, improving resolution,
sensitivity and speed (2). On the reverse phase columns, the introduction of alkylated
supports, such as Cs or C1S bonded nonporous silica gel and silica gel-based weak anion
and cation exchangers, is finding extensive use in the separation process of different types
of biopolymers (2).
The use of microcrystalline hydroxylapatite [Ca1Q(p04)6(OHhl as stationary phase in
HPLC has been documented earlier and used for the rapid and quantitative separation and
purification of nucleic acids (10-12). The analyte molecules bind to hydroxylapatite by
electrostatic interactions between the ci+ ions in the stationary phase and PO 4 3- ions in
the polynucleotides (13). Elution of the analyte is achieved by the competition of PO 43- ions
in the eluate buffer, for hydroxylapatite binding sites (14).
Recently, we investigated the separation patterns of s.s. and d.s. nucleic acid
components of a denatured nuclear polyhedrosis virus (NPV), isolated from the insect pest,
gypsy moth (Lymantria dispar L.) (GM), by using a high-resolution hydroxylapatite column
linked separately to two liquid chromatographs, one containing an ordinary UV detector and
the other a UV diode-array (DA) detector. Prior to the injection of GM-NPV solutions, we
used commercially available denatured calf thymus DNA, containing both single-stranded

SINGLE- AND DOUBLE-STRANDED DNA 927
(s.s.) and double-stranded (d.s.) DNA, as standard (15) to establish the necessary
experimental conditions and instrumental parameters required forthe successful completion
of the experiment. Results of this study are reported in this paper.
Chemicals and Reagents
DNA Standard
MATERIALS AND METHODS
Native, heat-denatured calf thymus DNA (50.0 mg/mL), containing both s.s. and d.s.
DNA, was obtained from Boehringer-Mannheim (201 Boulevard Armand Frappier, Laval,
Quebec, Canada, H7V 4A2). A stock solution containing 5.0 mg/mL was prepared in 0.50
M sodium phosphate buffer (pH 6.80 ± 0.05) containing 0.02 % sodium azide and 0.01 mM
calcium chloride. The standard solutions. ranging in concentration from 10 I-lg/mL to 500
l-lg/mL, were prepared by the serial dilution of the stock solution using deionized Milli-Q®
purified water.
GM-NPV DNA
Two samples (labeled as X and Y) of denatured and purified DNA isolated from the
NPV of GM, containing 0.043 mg/mL (X) and 0.066 mg/mL (Y) in 0.4 M sodium phosphate
buffer, were used in this study after filtering through Millipore® 0.20 I-lm filters.
Mobile Phase
The mobile phase solvents, A and B, used in HPLC were phosphate buffers (pH 6.80
± 0.05) containing HP042- and H2P04- The 0.5 M buffer (B) was prepared according to the
procedure of Efiok (16) by using equimolar quantities of ACS grade N~HP04 and NaH2P04,

928 SUNDARAM AND SLOANE
and deionized Milli-O® purified water. The 10 mM buffer (A) was prepared by diluting
aliquots of buffer B fifty times with Milli-O®purified water. The pH of the buffers were
checked with a pH meter and if slight adjustments were required, they were done by adding,
dropwise, concentrated Hel or NaOH. Each buffer also contained 0.02% NaN3 and 0.01
mM CaCI2. They were filtered (Millipore® 0.20 ~m filter) and degassed prior to use and
refrigerated immediately afterwards. No detectable deterioration in DNA resolution of the
standards occurred with monthly aged buffers; nevertheless, fresh preparations were made
every two weeks as a precaution
HPLC Instrumentation
Two liq uid chromatographs, Hewlett-Packard (H P) Model 1 080 fitted with a UV variable
wavelength detector and HP Model 1090 fitted with a DA detector, were used in the study.
Both instruments had Rheodyne® injectors equipped with 10 to 1 00 ~L loops and computing
facilities to extract the necessary analytical data from the chromatograms generated. Full
descriptions of these two instruments are published elsewhere (17, 18). The parameters
used for the two instruments were similar. A flow rate of 1.0 mUmin was used and the
adsorbed DNA was eluted and separated by the stepwise use of a binary gradient system
conSisting of two phosphate buffers, one with low (buffer B, 10 mM) and the other with high
(buffer A, 0.5 M) ionic strength (14). The UV and DA detectors were set at 260 nm (4 nm
bandwidth) for the sample wavelength and 400 nm (50 nm bandwidth) for the reference
wavelength. The column used was a Bio-Gel® HPHT column (100 x 7.8 mm, 4.8 mL bed
volume) packed with Bio-Rad's hydroxylapatite, preceded by a guard column (50 x 4.0 mm)
(both columns from BioRad Labs Canada Ltd., Mississauga, Ontario, L4W 2A6) containing
inert hydrophilic polymer particles of 10 ~m size. The column was thoroughly equilibrated

SINGLE- AND DOUBLE-STRANDED DNA 929
in the starting buffer prior to sample injection. The oven temperature and column pressure
were maintained at 50°C and approx. 1.4 x 10⁴ kPa, respectively, and the total run time for
each injection was 20 min.
The ionic strength of the buffer was increased, stepwise, by starting initially at 40% of
buffer B for 3 min, increasing it to 45% for the next 4 min and then switching completely to
100% B for the remaining 13 min. Most of the instrumental parameters and operating
conditions listed in this study were painstakingly arrived at by trial-and-error, and eventually
optimized to attain precision and accuracy in measurements.
HPlC Analysis
During calibration of the instruments using calf thymus DNA as standard, 10 III
volumes, containing 0.1 to 5.0 Ilg of the analyte, were injected (in triplicate) in each
instrument and the corresponding detector response was recorded. Calibration curves were
prepared for the s.s. and d.s. DNA by plotting the average peak area (y-axis) against the
mass of DNA injected (x-axis). The standard deviation (SO) of the peak area for each
concentration at 1.0 Ilg in 10 III and above was found to be roughly proportional to its
mean, however this was not the case for concentrations below the 1.0 Ilg/10 III level,
wherein the SO was high. The average retention times (RTs) for the s.s. and d.s. calf
thymus DNA were found to be 8.1 (range 8.0 to 8.2) and 11.9 (range 11.7 to 12.1) min,
respectively.
Aliquots of the two test solutions, X and Y, containing the GM-NPV DNA were then
injected and the peak areas were computed from the chromatograms obtained.
Unfortunately, none of the RTs of the peaks obtained corresponded to those of the
standards. The peaks with RTs 10.1 and 15.3 min in sample X and 10.8 and 15.9 min in

930 SUNDARAM AND SLOANE
sample Y, of the GM-NPV, were assumed to correspond to the s.s and d.s. DNAs,
respectively. Their relative concentrations in the two samples were computed using the
calibration curves generated for the calf thymus standard.
RESULTS AND DISCUSSION
Response of UV and DA Detectors to DNA Standard
Under the HPlC parameters used and from the calibration curves (Figure 1), it is
apparent that both the UV and DA detectors responded satisfactorily to the s.s. and d.s.
DNA molecules. It is evident that the response of the DA detector to the s.s. DNA was linear
over the concentration range of 0.1 to 5.0 /1g in 10 /1l injection volume. However, the
response of the UV detector to the s.s. DNA was generally low and was linear only from 0.5
to 5.0 /1g. Below 0.5 /1g, the detector response was rather erratic. Within these ranges, the
reproducibility of peak area measurements in both detectors was 93.5% as determined by
10 repeat injections. The linear regression equations for the two calibration curves for the
s.s. DNA, from the DA and UV detectors, and the correlation coefficients (R2) for them are:
DA detector: s.s. DNA y = 1053 x - 14.70, R2 = 0.999
UV detector: s.s. DNA y = 692.7 x - 141.6, R2 = 0.989
From the standard curves in Figure 1, it is apparent that the DA detector is more sensitive
(higher slope) to the s.s. DNA than the UV detector. The minimum quantification limits
(MOL) for the s.s. DNA standard in the DA and UV detectors, as assessed from the
respective standard curves, were 0.10 and 0.50 Ilg, respectively.
The standard curves obtained (Figure 1) for the d.s. DNA using the DA and UV

SINGLE- AND DOUBLE-STRANDED DNA 931
S-« .s co Ql
-< -'" co Ql
D...
FIGURE 1.
6000,--------------------------------------------.
4000
2000
0
600
400
200
• 0
0
5.5. DNA:
• HP 1090 - DA detector y=1053x-14.70, R2=0.999
• HP 1080 - UV detector y=692.7x-141.6, R2=0.989
•
• • • •
•
• •
d.s. DNA:
• HP 1090 - DA detector • y=74.76x+434.9, R2=0.914 • • HP 1080 - UV detector
y=74.06x+384.6, R2=0.933
2 3 4 5
Mass of DNA (ug) injected in 10 uL
6
Calibration of HP 1080 and HP 1090 using calf thymus DNA - single and double strands.

932 SUNDARAM AND SLOANE
detectors were not overly influenced by the analyte concentration. Concomitantly, the
response of both detectors was very low, indicating their low sensitivity to the d.s. DNA.
Linearity of the detectors, by plotting Ilg of DNA vs absorbance (mAU), was observed only
over the concentration range from 1.0 to 5.0 Ilg in 10 III injection volume. Moreover, the
standard curves did not pass through the origin and their slopes were low. The
reproducibility of peak area measurements was about 91 % as determined by 15 repeat
injections. The linear regression equations for the two calibration curves for the d.s. DNA,
from the DA and UV detectors, and the corresponding correlation coefficients are:
DA detector: d.s. DNA y = 74.76 x + 434.9 , R2 = 0.914
UV detector: d.s. DNA y = 74.06 x + 384.6 , R2 = 0.933
The MOL established for the d.s. DNA standard, from the calibration curves of both
detectors, was 1.0 Ilg.
The plot of log (Ilg of DNA) vs absorbance (mAU) was linear for the d.s. DNA, for both
detectors over the concentration range of 0.10 to 5.0 Ilg in 10 III injection volume. The
linear regression equations and corresponding correlation coefficients are:
DA detector: d.s. DNA y = 438.1 x + 471.3, R2 = 0.985
UV detector: d.s. DNA 2 Y = 412.4 x + 430.6, R = 0.982
The MOL for the d.s. DNA standard, using linear regression equations from plotting log (Ilg
of DNA) vs absorbance (mAU), was 0.10 Ilg in 10 III injection volume for both detectors.
HPlC Chromatogram of the DNA Standard
A typical chromatogram of the calf thymus DNA standard, obtained by injecting (in
triplicate) 2.5 Ilg in 10 III onto the hydroxylapatite column connected to the HP 1080 and

SINGLE- AND DOUBLE-STRANDED DNA 933
FIGURE 2.
2 HP 1090 - DA Detector
3
2 ., 6 8 10 12
Time (min)
Chromatographic trace of calf thymus DNA standard, 2.5 ~g and 10 ~L injection. Peak 1: low molecular weight materials; peak 2: s.s. DNA (RT, 8.1 min); peak 3: d.s. DNA (RT, 11.9 min). Chromatographic conditions are given in the text.

934 SUNDARAM AND SLOANE
HP 1090 liquid chromatographs, is shown in Figure 2. As afore-mentioned, the DA detector
in HP 1090 HPLC was more sensitive to the s.s. DNA (peak area 2740 ±45 mAU, n=3) than
the UV detector in HP 1080 instrument (peak area 1812 ± 50 mAU, n=3). In contrast, the
response of both detectors to the d.s. DNA was nearly the same, yielding a similar degree
of resolution and sensitivity. This is further corroborated by comparing the peak areas
obtained in both instruments. The peak area in HP 1090 for the standard (d.s. DNA) was
667 ± 40 mAU, whereas in HP 1080, it was 622 ± 32 mAU.
The chromatographic peaks corresponding to the s.s. (RT = 8.1 min) and d.s. (RT =
11.9 min) DNA molecules in the standard are well resolved and symmetrical. The low RT
of the s.s. DNA is presumably the consequence of weak interactions between the Ca2+ ions
in the stationary phase (hydroxylapatite) and shielded PO/ ions in the flexible, disordered
and sterically hindered s.s. DNA molecules (19). On the contrary, the higher RT of the d.s.
DNA (11.9 min) is most likely due to the unfolding and de rotating of the rigid and ordered
double helix, which resulted in exposing more PO 4 3- ions for strong interaction and binding
with ci+ ions on the sorbent surface. Because of the resultant strong electrostatic
interaction, the d.s. DNA molecules are eluted later, giving a higher RT (19). The two small
peaks appearing close to the solvent front could be due to low molecular weight nucleotides.
Chromatograms of the Viral DNA
Initial injections of samples X and Y, at 40 to 70 I-lL range, in both HPLCs, did not
produce consistent detector responses and the peak area measurements varied
considerably. Increasing the injection volume to 100 I-lL gave reduced fluctuations and
reasonably consistent detector responses. Typical chromatograms obtained in HP 1090 are

SINGLE- AND DOUBLE-STRANDED DNA 935
shown in Figure 3. The chromatograms contained three large peaks and a number of small
peaks of different sizes and shapes, indicating the heterogeneity of DNA moieties and the
presence of UV-absorbing impurities in the two samples. The distinct separation of the large
peaks indicated that the instrumental and operational parameters used to separate the DNA
and other components in the samples were reliable and could be pursued in the future, with
necessary modifications, for the purposes of isolation, separation and purification of DNA
type biopolymers.
Examination of Figures 2 and 3 show that none of the peak RTs in Figure 3
matched with the peak RTs of DNA standard in Figure 2. Furthermore, the RTs of the peaks
and their shapes (narrow vs. broad) in sample X and Y (Figure 3) are different from one
another and none of them matched, indicating that the composition of the DNA moieties in
the two samples are probably different. The two large peaks (RTs, 2.5 and 2.9 min in Figure
3) near the solvent front, could be due to low molecular weight DNA fragments (20). The
next two smaller peaks are likely caused by the partly denatured and hybrid nucleic acid
molecules, which displayed low affinities for hydroxylapatite (19). Comparing the
chromatograms of the DNA standard (Figure 2), we assume that the peaks with RT of 10.1
min (sample X) and 10.8 min (sample Y) (Figure 3), could correspond to the s.s. viral DNA
molecules. We are making this assumption, of course, with very little experimental evidence,
aside from the fact that elution behavior is: (1) controlled by the interaction between the
ci+ and P043- ions of the adsorbent and adsorbate, respectively; and (2) separation, as
aforementioned, is size- and strand-dependent. Similarly, the peaks with RTs of 15.3 min
(sample X) and 15.9 min (sample Y) (Figure 3) are assumed to belong to the d.s. viral DNA
molecules, although as pointed out above, we have very little experimental basis for these

936
FIGURE 3.
LowM.W.DNA RT
2.5 min
3 6
LowM.W.DNA RT
2.9 min
3 6
SUNDARAM AND SLOANE
I Sample X I
50S. DNA RT
10.1 min doS. DNA RT
153 min
9 12 15
Time (min]
I Sample Y I
50S. DNA RT
10.8 min
9 12
Time (min]
15
LL 18
18
Chromatographic trace of viral DNA after injecting 100 ~L sample, using the HP 1090 equipped with the DA detector.

SINGLE- AND DOUBLE-STRANDED DNA 937
assumptions, albeit the appearance of two well defined peaks (narrow in sample X and
broad in sample Y) around the elution times of the standards, shown in Figure 2.
Using the calibration curves for the DNA standard in Figure 2 and assuming that the
two pairs of peaks with RTs of 10.1 and 15.3 min (sample X), and 10.8 and 15.9 min
(sample V), shown in Figure 3, are due to the s.s. and d.s. viral DNA molecules,
respectively, we calculated their concentrations in the two samples. The values obtained in
HP 1090 were: s.s. viral DNA, 0.611lg/100 III and d.s. viral DNA, 0.70 Ilg/100 Ill; or total
viral DNA of 13.1 Ilg/ml in sample X. The values obtained for sample Y were: s.s. viral
DNA, 1.29 1lg/100 Ill, and d.s. viral DNA 1.39 Ilg/100 Ill; or total viral DNA of 26.8 Ilg/ml.
These values are low and corresponded to only 30.5% and 40.6% of the total viral DNA
concentrations expected to be present in the samples X and Y, respectively. Similar
calculations, using the peak areas obtained for the analytes in HP 1080 HPlC
(chromatograms not shown in figure), gave concentrations which were about 20% less than
the HP 1090 values.
CONCLUSIONS
This paper describes a practical and sufficiently sensitive H PlC method to isolate and
separate the s.s. and d.s. DNA molecules present in calf thymus DNA standard by using Bio
Gel hydroxylapatite column and phosphate buffer at pH 6.8 as the mobile phase. The
column was stable and proved reliable in the separation of DNA molecules. Extension of
the method to separate the s.s. and d.s. DNA molecules in two viral DNA preparations
yielded chromatograms containing more than seven peaks with different RTs, peak shapes
and peak areas for both samples. This indicated not only the heterogeneity in the DNA

938 SUNDARAM AND SLOANE
composition, but also of the variability in their concentration. QualITy maintenance and
optimization of methods used in the isolation and preparative purification of the s.s. and d.s.
DNA molecules from viral preparations could yield consistency in product excellence,
consequently resulting in good chromatographic resolution and analyte separation.
Nevertheless, the study succeeded in demonstrating the suitability of the method to isolate
and separate nucleic acid moieties found in biological samples. Lack of authentic standards
for the viral DNA molecules precluded the absolute quantification of the analytes in the two
viral preparations.
ACKNOWLEDGEMENT
The authors wish to express their sincere thanks to Dr. W.J. Kaupp for his support and
interest in this work.
REFERENCES
1. Krstulovic (Ed.), CRC Handbook of Chromatography, Nucleic Acids and Related Compounds, CRC Press, ~oca Raton, FL, U.S.A., 1987.
2. O. Mikes, High-performance Liquid Chromatography of Biopolymers and Biooligomers, J. Chromotogr. Library, Elsevier, Amsterdam, Vol. 41B: B177-B238 (1988)
3. J.D. Pearson, F.E. Regnier, J. Chromatogr., 255: 137-149 (1983)
4. R. Bischoff, L. McLaughlin, J. Chromatogr., 296: 329-337 (1983)
5. M. Colpan, D. Reisner, J. Chromatogr., 296: 339-348 (1984)
6. Y. Kato, T. Kitamura, A. Mituji, Y. Yamasaki, T. Hashimoto, T. Murotsu, S. Fukushige, K. Matsubara, J. Chromatogr., 448: 212-220 (1988)
7. T. Veda, Y. Ishida, J. Chromatogr., 386: 273-282 (1987)
8. Y. Baba, M. Fukuda, N. Yoza, J. Chromatogr., 458: 385-394 (1988)

SINGLE- AND DOUBLE-STRANDED DNA 939
9. H. Sawai, J. Chromatogr., 481: 201-210 (1989)
10. T. Johnson, J Ilan, Biochem., 132: 20 (1983)
11. P. Geek, I. Nasz, Biochem., 135: 264 (1983)
12. A. Colman, M.J Byers, S.B. Primrose, A. Lyons, Enr. J. Biochem., ~1,: 303 (1978)
13. G. Bernardi, Nature, 206: 779 (1965)
14. Y. Miyazawa, C.A. Thomas, Jr., J. Mol. Bioi., 11,: 223 (1965)
15. Bio-Rad, "Bio-Gel@ HPHT for Protein and Nucleic Acid HPLC: New High Performance Hydroxylapatite Column" in Bulletin No. 1115, Bio-Rad Labs, 1414 Harbour Way South, Richmond, CA 94804, p. 4, 1986.
16. B.J.S. Efiok, Basic Calculations for Chemical and Biological Analysis, AOAC Internat., 2200 Wilson Blvd., Arlington, VA 22201, U.S.A., 1993.
17. K.M.S. Sundaram, C. Feng, J Broks, J. Liquid Chromatogr., 8(14): 2579 (1985)
18. K.M.S. Sundaram, Z. Jiusheng, R. Nott, J AOAC Intemat., 76 (3): 668 (1993)
19. Ow. Sutton, JD. Kemp, Biochem.,.1§.: 3153 (1976)
20. K. Grohmann, L.H. Smith, RL Sinsheiner, Biochem.,.1±: 1961 (1975)
Received: August 17, 1994 Accepted: October 18, 1994


JOURNAL OF LIQUID CHROMATOGRAPHY, 18(5),941-964 (1995)
CHROMATOGRAPHIC STUDIES ON THE RACEMIZATION OF THIOPEPTIDES
, , 1 1 ' 1 GY. SZOKAN *, ZS. MAJER, E. KOLLAT , M. KAJTARli, M. HOLLOSI1, AND M. PEREDY-KAJTAR2
lDepartment of Organic Chemistry Eotvos University
H-1518 Budapest 112 P.O. Box 32, Hungary
2Central Research Institute for Chemistry of the Hungarian Academy of Sciences H-1515 Budapest
P.O. Box 17, Hungary
ABSTRACT
It was found by chromatographic, CD and NMR methods, that the thionation of piperazine-2,5-diones [cyclo(Aaa1-Aaa2) ->
cyclo (Aaat1-AaaP (Aaa = -NH-CHR-CO-; Aaat = -NH-CHR-CS-)] or piperazine-2,5-onthiones [cyclo(Aaatl-Aaa2) -> cyclo (Aaat1-AaaP)] and, occasionally, even the sfontaneous cyclization of endothiodipeptide esters [H-Aaat1-Aaa -OR] result in enantiomeric (Aaa1 or Aaa2 = Gly) or diastereomeric mixtures of piperazine monothiones or dithiones. The diastereoisomers were separated by semipreparative HPLC and their quantitative product distribution was determined by an optimized HPLC method on Hypersil-silica column with CH2Cl2-EtOAc eluent mixtures. Isocratic RP-HPLC on ODS-Hypersil column and pre-column derivatization with I-fluoro-2,4-dinitrophenyl-5-L-alanine amide (Marfey's reagent) were used to monitor the racemization of Ala and Pro residues and to de-
t Deceased 1991.
941
Copyright © 1995 by Marcel Dekker, Inc.

942 sz6KAN ET AL.
termine the ratio of enantiomers. Thionation of urethane protected dipeptide esters or dethionation of the corresponding endothiodipeptide derivatives were not found to result in significant racemization. However, during the thionation of cyclic dipeptides or thiopeptides or isolation of piperazine-2,5- mono- or dithiones a partial or complete racemization could always be detected. Moreover, the acidic hydrolysis of thiopeptides was also accompanied by racemization and resulted in partially racemized amino (oxo )acids.
INTRODUCTION
There is a growing interest in peptides containing one or
more thioamide groups (1-10). Lawesson's reagent (LR) can be
used for the conversion of amides into thioamides under mild con-
ditions [heating in benzene or toluene at 30-80'C for 0.5-2 hrsl (9,
11-13). In an effort to study the chiroptical properties, and H-bond
forming ability of thiopeptides, a great number of protected endo
thiopeptides and thionated acyl amino acid and dipeptide methyl
amides have been prepared in our laboratory (13-19). They were
characterized chromatographically by TLC, LC and HPLC; by IH
and 13C NMR, uv, CD and IR spectroscopy, and also by MS 03-19).
It has become generally accepted that LR converts the trans (2) ro
tameric form of the amide group of urethane protected dipeptide es
ters to the corresponding thioamides selectively and without signif
icant racemization (9, 13, 20).
Based on preliminary CD spectroscopic studies, the thiona
tion of piperazine 2,5-diones (I), featuring cis (E) amide groups re-

RACEMIZATION OF TIHOPEPTIDES 943
suIts, however, in partially or fully racemized piperazine-2,5-
dithiones (14,16).
A violet-coloured crystal of cyclo(thioprolyl-thioprolyl),
[cyclo(Prot-Prot), (III)]; prepared from optically pure L-proline di
ketopiperazine [cycloCL-Pro-L-Pro)] has been reported to show crys
tallographic disorder (24) which was explained by the presence of
co-crystallized enantiomorphous pairs in the sample (24). Com
parative circular dichroism (CD), as well as IH and 13C NMR stud
ies have indicated that the sample, in addition to the L,L form (ca.
80%) contained ca. 20% enantiomeric (D,D) but no diastereomeric
(L,D) form (14, 24).
Prompted by these findings, a number of single- and double
thionated diketopiperazines have been prepared (14, 16) to clarify
the mechanism and conditions of their racemization. Herein we
report results of comparative chromatographic studies on the
racemization of linear and cyclic thiodipeptides and their non
thionated linear precursors.
MATERIALS
Starting from Z- or Boc-protected linear endothiopeptide es
ters, (13, 14) a series (Table IV) of piperazine-2,5-onthiones and
2,5-dithiones has been synthesized according to Scheme 1. (14) 400
MHz IH NMR and IR spectroscopy was used to characterize the
cyclic thioamides. Details of the syntheses have been reported earli
er (13,14,16).

SY
NT
HE
SIS
Rou
te A
(Z)
Boe
-A
nnl-A
aa2
-O
Me
LR
*, (
0_5
Mol
e)
80 O
C, 2
hrs
, to
luen
e
(Z)
Bo
e -
Aaa
l l-Ana
2-O
Me
j Dep
rote
etio
n C
ycli
zati
on
cAaall~
Ana
2 LR
*, (
0.5
Mol
e)
30 o
C,
2-10
hrs
, to
luen
e
Rou
te B
(Z)
Boe
A
aal-A
na2-
OM
e
Dep
rote
etio
n C
ycli
znti
on
c
Aaa
Aaal~ ,
Mol
e)
LR
* (I
_ __
J2
20 D
C I
A."
' 1
0,24
1m
t
I
· L"
'-I
' ",,"
" A
aal ~
2
S
*LR
~ Law
csso
n's
reag
ent (1IJCO--O--~~~1i--O--OClI))
S
Aaa
l an
r) A
al\Z
.= L
;D A
la,
Pro
, Gly
Sch
eme
1.
\0
.j::>
.j:
:>
C/l ~ ~, ~ ~

RACEMIZATION OF THIOPEPTIDES 945
cisoid transoid
x x Possible stereo isomers
configuratIOns
c C 3 6
cisoid L L D D
.~~X H .H*. X H R·· R·· , .. ··R 1 R
H .. 2 H '. 2
H H
transoid L D (mesoidif D L R 1=R2 and
X,Y=O orS)
Y Y
Figure 1. Possible stereoisomers of piperazine 2,5-onthiones (X = 0, Y = S), 2,5-thion ones (X = S, Y = 0) and 2,5-dithiones (X, Y =S).
The abbreviations used follow the recommendations of the
IUPAC-illB Joint Commission on Biochemical Nomenclature (25).
Aaat(e.g. Alat, Glyt, etc.) means a thioamino acid residue:
-NH-CH-CI II R S
METHODS
High Performance Liquid Chromatography
Separations were performed on a laboratory-assembled in
strument consisting of a reciprocating piston pump (Model 1515,

946 sz6KAN ET AL.
Orlita, FRG), a variable wavelength UV monitor fitted to an 8 III
flow-cell (Model 212, Cecil, UK) and a sample injector (Rheodyne,
USA), or on a Knauer HPLC-system consisting of two pumps
Model 64 with analytical or preparative pumpheads, a gradient
programmer Model 50 B, an injection valve with 20 1-11 sample loop
and a spectral photometer with analytical and preparative flow
cells (Knauer-GmbH, FRG).
Column effluents were monitored at 250, 254, 270, 279 or 281
nm (for thiopeptides) and at 340 nm (for Marfey's amino acid
derivatives).
The packing materials were Hypersil-silica, Hypersil ODS-6
(Shandon Southern Products, UK), LiChroprep-silica (Merck,
FRG) and Partisil M-9 silica (Whatman Ltd, UK). Peaks were
recorded on a Model OH-31411 chart recorder (Radelkis, Hungary)
and the areas under them were calculated using programmed
Simpson's rule. The chromatographs were operated isocratically
with flow rates between 0.8 and 1.2 cm3/min (analytical mode) and
between 2.0 and 4 cm3/min (preparative mode) at ambient tempera
ture.
Hydrolysis
The linear protected and cyclic thiopeptides were subjected to
acidic hydrolysis. The samples were treated at 105°C with 6 M hy
drochloric acid for 48 hrs in sealed tubes. The acid was removed in
vacuo, samples were neutralized and reacted with Marfey's
reagent.
RACEMIZATION OF TIIIOPEPTIDES 947
Derivatization
Derivatization was carried out according to Marfey (26) with
1-fluoro-2,4-dinitrophenyl-5-L-alanine amide (Pierce, USA). The
hydrolysate prepared from 2-5 ).lmol starting thiopeptide was dis
solved in 100 ).ll of 0.5 M N aRC03 solution and 200 ).ll of 1% solution
of Marfey's reagent in acetone was added. The solution was incu
bated at 40'C for 90 min and cooled; then 25 ).ll of 2 M HCI was
added at room temperature. After 20 fold dilution with methanol or
eluant, 10-20 ).ll aliquots were used for HPLC injection on Hypersil
ODS-6 column (27-28).
NMR studies
lH NMR measurements were performed on a VARIAN 400
spectrometer at ambient temperature, c = 4-8 mglmL. Solvents:
DMSO-d6 and CDC13. The assignment of the peaks is based on lH_
lH COSY experiments. Data are summarized in Table VIII.
CD measurements
CD spectra were recorded on Jobin-Yvon Dichrographs
Mark III and V. D. Mark III is operated by an IBM AT computer.
Spectograde solvents (Uvasol, E. Merck, Darmstadt) were used.
Measurements were taken in 0.02-1.00 cm cells.

948 sz6KAN ET AL.
RESULTS AND DISCUSSION
Racemization is one of the major side reactions that may
occur during peptide synthesis or in solution in the presence of
bases (29). Piperazine-2,5-onthiones or -thionones and 2,5-di
thiones, built up from two different chiral amino acid residues
(R l =I' R2 =I' H) have four stereoisomeric forms (Fig. 1). The number
of stereoisomers is decreased by structural factors (incorporation of
one glycine or two identical residues). However, steric factors may
also lead to the decrease of stereoisomers. For example, the
dithione cyclo(Prot-Prot), similarly to the parent dioxopiperazine
cyclo(Pro-Pro), cannot exist in L, D meso form (24). Contrary to
this, cyclo(Alat-Alat) was found to be present as a roughly 1:1 mix
ture of the enantiomeric (L, L + D, D) and mesoid (L, D) forms
(Table 11.). Preliminary CD spectroscopic and theoretical studies
(30) have indicated that it is the enhanced tendency for thione --+
thiol tautomerisation of the piperazine-2,5-onthiones or 2,5-
dithiones which explains the racemization of cyclic thioamides
(30).
The strategy of the synthesis of piperazine-2,5-onthiones and
2,5-dithiones is shown in Scheme 1. The crude products were first
pre-purified by chromatography on Kieselgel 60 columns using
dichloromethane-ethylacetate mixtures (95:5, 98:2 v/v) as eluant.
The diastereomeric mixtures were separated (see Table 1) by
semipreparative and preparative HPLC and their product distribu
tion was determined (see Table II) by an optimized HPLC method

TA
BL
E I
H
PL
C S
epar
atio
n C
ondi
tion
s fo
r D
iast
ereo
isom
eric
Pip
eraz
ine 2,5~Onthioncs
and
Dit
hio
nes
Co
lum
n
Pac
kin
g
Det
ecti
on
Elu
ant:
1.
CH
2Cl T
EtO
Ac
2~ E
tOA
c-M
eOH
-C
H2C
l 2
3. D
iiso
prop
ilae
ther
-CH
2CI 2
-EtO
Ac
Ana
lyti
cal
250
x4
mm
I-Iypersil~silica
6 11
m
250,
254
, 27
0 nr
n
98:2
4. D
iiso
prop
ilae
ther
-i-p
ropa
nol-
cycl
ohex
ane
Flo
w r
ate
Inst
rum
ent
Sam
ple
Sol
vent
Is
olat
ion
Pur
ity
chec
kin
g
0.8
mL
min
! Knauer~system
5 y/
!JL
UV
, C
D,N
MR
Sem
ipre
para
Uve
500
x8
mm
L
iChr
opre
p si
lica
25-
40 p
rn
250
nrn
95:5
(v/
v)
49.5
:0.5
:50
40:1
0:10
5:
1:6
0 4
mL
min
! K
naue
r-sy
stem
1
mg/
200
pL
E
luan
t +
DM
F
Fra
ctio
n e
vapo
rati
on
anal
. H
PL
C
Pre
par
ativ
e
M 9
10/
25 W
hat
man
P
arti
sil-
sili
ca 1
0 !J
m
250
nrn
5:1:
80
2 m
L m
in!
Knauer~system
30 m
g/50
0!J
L
anal
. H
PL
C
~ ~ ~ o z ~ ~ H ~ ~ tTI
til '£. 1.0

950 sz6KAN ET AL.
on Hypersil silica column with the same type of eluants (a. = 1.2 -
1.6). UV detection at 250, 254, 270, 279 or 281 run (at the absorption
maxima of the cyclic thioamides) was used in the HPLC measure
ments. The semipreparative normal phase separation of dia
stereoisomers was performed on Lichroprep and Partisil M-9 silica
columns with eluants 1 - 4: [dichloromethane - ethylacetate -
methanol or diisopropyl ether and i-propanol - cyclohexane - diiso
propyl ether eluant mixtures] (Table D. The purity (usually> 94-
95%) of the crystalline endproducts was checked by the above ana
lytical HPLC system.
The diastereoisomers (in the order of elution: I and II, see
Table II) were identified by UV, IH and 13C NMR, CD and IR spec
troscopy (14). Chromatographic conditions were optimized to
achieve high resolution and baseline separation. Best results were
obtained on Hypersil-silica columns. Fig 2. shows the typical chro
matographic pattern for the separation of a diastereoisomeric
cyclic dithioamide mixture.
The scale up of analytical separations was performed on
preparative silica columns, silica packings of 63-125 11m and 48-63
!J m were not efficient enough. The separation was improved by ap
plying silica with 25-40 !Jm size. The best resolution was achieved
on 10!Jm silica column.
Due to the low tendency of shift reagents to form complexes
with linear or cyclic thioamides, NMR spectroscopy could not be
used for determining the LID or L,L/D,D ratio of enantiomeric mix
tures. Thus, comparative racemization studies were performed on

TABLE II Diastereomeric Distribution of Cyclic Thiopeptides
Compound Preparation method (Route)
D iastereomers k'
Cl. Distribution Eluants % from
cyclo(Alat-Alat) B cyclo(Alat-Prot)* B cyclo(Alat-Prot) A
crude product after preparative purification by HPLC (one-step)
I II
2.4 2_9 1.0 1.5 2.2 2_5
*N 0 separation in the eluent system 2_ **1 = L, L + D, D
II=L,D+D,L
HPLC IH-NMR
1.21 49.2:50.8 53:47 1_50 49.1:50.9 41:59 1.14 49.0:51.0 45:35
39.1:60_9 40:60
5.1:94.9 (II)"" 3:97 92.3:7.7 m 98:2
(I and II elution order of diastereoisomers; the compounds I and II were identified by CD and NMR)
0.05
II
o 8 16 24 t(min)
1 3 4
Figure 2_ Analytical separation of diastereoisomeric cyclo-endothiopeptides. Col.: Hypersil-silica 250x4 mm; eluant: diisopropylaether-i-propanol-cyclohexane 5:1:60 v/v; flow rate: 0.80 ml min-I; detection 270 nm; pressure 650 psi; sample: cycloCL-Alat-L-Alat) PE 194 (I mixture of L,L and D,D enantiomers, II meso compound).

952 sz6KAN ET AL.
the amino acid mixtures obtained by acidic hydrolysis of linear and
cyclic thiopeptides and on their (oxo)peptide precursors. The acidic
hydrolysis using standard conditions (6M HCI, 48 hrs at 105·C in
sealed glass tubes) was accompanied with complete dethionation.
Isocratic reversed phase HPLC on ODS-Hypersil column with
MeOH-CH3CN or THF-NaOAc buffer (O.02M, pH 4) mobile phases
and pre-col umn deri vatization with 1-fl uoro -2,4-dini trophenyl-5-L
alanine amide (Marfey's reagent) were used to determine the ratio
of D and L amino acids. Chromatographic data on Marfey's deriva
tives of amino acids contained in the models are summarized in
Table III. The D/L amino acid ratio and rate of racemization of lin
ear and cyclic thiopeptides and oxopeptides are given in Tables N.
and V
We were able to monitor racemization for Ala and Pro
residues and to determine the ratio of enantiomers by separation of
the derivatized enantiomeric amino (oxo)acids (a = 1.5-4.2, Rs = 6.2-
12.9) (26-28). For cyclo(L-Alat-L-Alat), Fig. 3 shows the separation
of D and L-Ala derivatives. The hydrolysis is also a potential source
of racemization (27) so that this step was also carefully monitored.
As expected (29), the parent Z- or Boc-protected dipeptide es
ters and piperazine-2,5-diones prepared from them (see Table N
and V) were not found to suffer significant racemization during
peptide synthesis, cyclization and acidic hydrolysis.
As reported earlier, the CD spectra of urethane protected en
dothiodipeptide esters of types Z(Boc)-Aaat1-Aaa2-OR and Z(Boc)
A aat-Gly-OR did not show dependence on the conditions (sol vent,
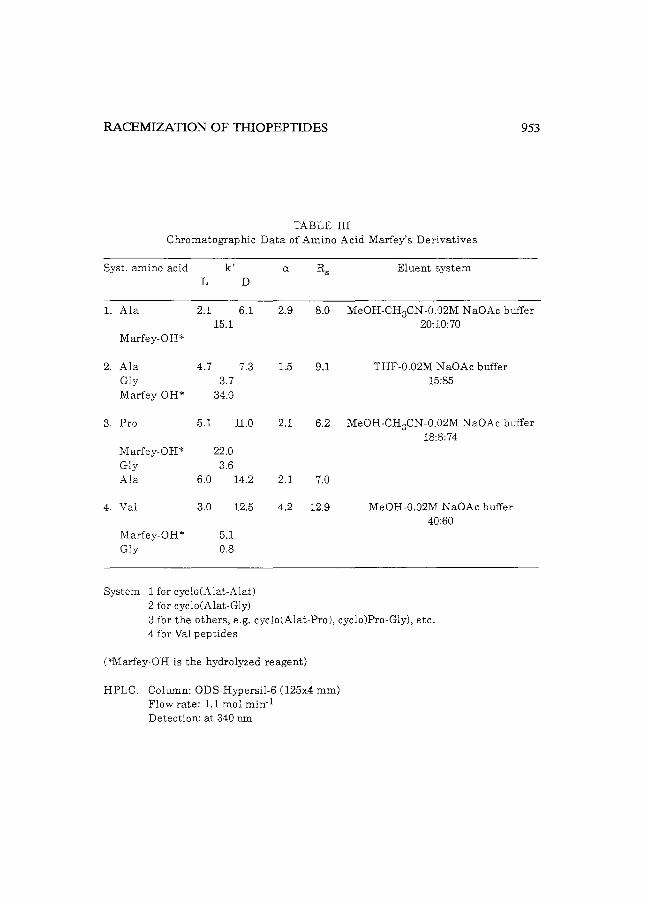
RACEMIZATION OF THIOPEPTIDES 953
TABLE III ChromatogTaphic Data of Amino Acid Marley's Derivatives
Syst. amino acid k' a Eluent system L D
l. Ala 2.1 6.1 2.9 8.0 MeOH-CH3CN-0.02M NaOAc buffer 15.1 20:10:70
Marfey-OH"
2. Ala 4.7 7.3 1.5 9.1 THF-0.02M NaOAc buffer Gly 3.7 15:85 Marfey-OH" 34.0
3. Pro 5.1 11.0 2.1 6.2 MeOH-CH3CN-0.02M NaOAc buffer
Marfey-OH" 22.0 Gly 3.6 Ala 6.0 14.2
4. Val 3.0 12.5
Marfey-OH" 5.1 Gly 0.8
System 1 for cycloCAlat-Alatl 2 for cycloCAlat-Gly)
18:8:74
2.1 7.0
4.2 12.9 MeOH-0.02M NaOAc buffer 40:60
3 for the others, e.g. cyc!oCAlat-Pro), cyclolPro-Glyl, etc. 4 for Val pep tides
C~Marley-OH is the hydrolyzed reagent)
HPLC. Column: ODS-Hypersil-6 (l25x4 mm) Flow rate: 1.1 mol min· 1
Detection: at 340 nm

954 sz6KAN ET AL.
TABLE IV Racemization Data of diketopiperazines
Diketopiperazines D/L amino acid ratio Rate of racemization %
without* with without* with** correction correction
cycloCAla·Ala) 6.6:93.4 1.8:98.2 13.2 3.6 cycloCAla-Gly) 2.69:97.4 0.05:99.95 5.2 0.1 cyclo(Pro-Ala) 7.4:92.6 (Pro) 0.5:99.5 14.8 1.0
5.5:94.5 (Ala) 0.7:99.3 11.0 1.4 cycloCPro-Gly) 7.6:92.4 0.7:99.3 15.2 1.4
*Without correction, the values are together with the background racemization of single amino acid components.
**These data are in good correlation with ones of Morinobu (31).
temperature, reaction time etc.) of thionation (Scheme 1) (13, 14).
Similarly, IH and 13C NMR studies did not reveal significant
amounts (> 1-2%) of diasteroisomeric impurities in samples of
ZCBocl-Aaat1-Aaa2-OR thiopeptides (13, 15l. Most importantly, the
oxopeptide Z-Val-Gly-OEt obtained from Z-Valt-Gly-OEt by dethia
tion with Ag20 in a dioxane/water mixture (13), gives 99.7% L- and
only 0.3% D-valine after acidic hydrolysis, while its precursor, Z
Valt-Gly-OEt, results in 11.5% D-valine.
A comparison of the above data leads to the conclusion that,
contrary to (oxo)peptides, linear protected thiopeptides suffer sig
nificant racemization during acidic hydrolysis. In the isomeric en
dothiopeptides Z-CBocl-Prot-Gly-OMe and ZCBoc)-Glyt-Pro-OMe, the
chiral center preceding the thioamide bond is less sensitive to

RACEMIZATION OF TIHOPEPTIDES
TABLE V Racemization Data of Linear Thiopeptides*
Linear endothiopeptides
Z-Ala-Ala-OEt Z-Alat-Ala-OEt Z-Val-Gly-OEt Z-Valt-Gly-OEt "Z-Valt-Gly-OEt"*** Z-Prot-Pro-OMe Z-Alat-Gly-OEt Z-Glyt-Pro-OMe Z-Prot-Gly-OMe Boc-Prot-Gly-OMe Boc-Glyt-Pro-OMe Boc-Pro-Gly-OMe Boc-Pro-Ala-OMe
Boc-Prot-Ala-OMe
Boc-Ala-Pro-OMe
D/L amino acid ratio Rate of racemization** %
1.0:99 2.0 24.5:75.5 49.0
0.2:99.8 0.4 11.5:88.5 23.0 0.3:99.7 0.6
20.0:80.0 40.0 1.5:98.5 3.0
23.0:77.0 46.0 6.0:94.0 12.0 2.0:98.0 4.0
28.0:72.0 56.0 1.1:98.9 2.2 0.5:99.95 (Pro) 0.1 0.05:99.55 (Ala) 0.1
33.0:67.0 (Pro) 66.0 28.0:72.0 (Ala) 56.0
0.05:99.25 (Pro) 0.1 1.4:98.6 (Ala) 2.8
*The data are corrected always with the background racemization of single amino acid components.
**Racemization rate (%) = {100 x [2D:(D+L)l}, where D and L are peak areas of isomers on the chromatograms. ***After dethiation. The physical properties (m.p., optical rotation) support this data, too.
955
racemization than the chiral center succeeding it (Table V). The
high racemization rates of both chiral residues in Boc-Prot Ala
OMe is in contradiction with this finding. A thioalanyl (-Alat-)
residue appears to be more resistant to racemization during hy
drolysis than a thioprolyl (Prot-) one.

956 sz6KAN ET AL.
o 8 16 t(mm)
Figure 3. Separation of Marfey's derivatives. Col.: ODS-Hypersil-6, 125x4 mm; eluant: MeOH-CH3CN-O,02M NaOAc buffer (pH 4); flow rate: 1.1 ml min-I; detection: 340 nm; recorder speed: 15 cm/hr; pressure: 1350 psi; hydrolyzed sample: cyclo(L-Alat-L-Alat); derivatization: Marfey's reagent; sample volume: 10 /11.
The data listed in Tables II, IV-VII and the results of pre
liminary X-ray crystallographic, NMR and CD spectroscopic
studes (14, 24) clearly indicate that piperazine-2,5-onthiones and
2,5-dithiones may undergo racemization not only during acidic hy
drolysis but also in the course of their preparation, isolation or pu-

RACEMIZATION OF TIlIOPEPTIDES 957
TABLE VI Racemization Data of Cyclic Thiopeptides*
Cycloendothiopeptides Preparation DIL Rate of
method amino acid ratio racemization** (Route) %
cyclo(Alat-Ala) A 23.0:77.0 46.0 cyclo(Alat-Alat) B 49.5:50.5 99.0 cyclo(Prot-Protl B 29.8:70.2 59.6 cyclo(Alat-Gly) A 44.0:56.0 88.0 cyclo(Alat-Glyt)* A 0.0:100 0.0 cyclo(Prot-Prol A 18.0:82.0 36.0 cyclo(Prot-Gly) A 46.7:53.3 93.4 cyclo( Glyt-Ala) A 5.5:94.5 11.0 cyclo(Glyt-Pro) A 30.0:70.0 60.0 cyclo(Prot-Ala) A 46.0:54.0 (Pro) 92.0
36.0:64.0 (Ala) 72.0 cyclo(Prot-Alat) B 49.5:50.5 (Pro) 99.0
*Preparation at 20·C.
rification. The thionation of piperazine-2,5-diones and piperazine-
2,5-onthiones is always accompanied with more or less extensive
racemization, depending on the structure of the parent cyclic pep
tide or monothiopeptide and the conditions of thionation. It should
be taken into account, that the formation of piperazine 2,5-diones
(diketopiperazines) proceeds with some racemization (29). Their
isomerization was studied theoretically and experimentally, too (21-
23). The rate constant for racemization of cyclo-CL-Ala-Gly) (dike-
topiperazine) was only 2 times that of H-Gly-Ala-OH and 7 times
the rate of H-Ala-Gly-OH; it racemized 20 times andH- Gly-Ala-OH

'D
Ul
TA
BL
E V
II
00
Sel
ecte
d 40
0 M
Hz
IH N
MR
Dat
a on
Pip
eraz
ine
Mon
o-an
d D
ith
ion
esa
c( A
laL
-Gly
t)b
dAla
t-A
la)C
c{
Ala
L-A
lat)
C
c(Pr
oL-G
lyJC
d
Gly
t)-p
ro)b
c{
Prot
-Ala
)C
c{P
rot-
Ala
t)c
LL
(DD
) L
D(D
L)
LL
(DD
) L
D(D
L)
L1(
DD
) L
D(D
L
L1(
DD
) L
D(D
L
Gly
(L)a
4.
28
3.72
4.
07
4.02
4.
28
Ala
a
3.94
4.
02
4.16
3.
85
Ala
B
1.34
1.
32
1.32
1.
33
Ala
t a
4.33
4.
18
4.18
4.
23
4.27
4.
31
4.35
Ala
t B
1.
58
1.47
1.
44
1.53
1.
51
1.54
1.
43
Pro
t a
4.31
4.
26
4.34
4.
44
4.49
4.
60
Pro
t B
2.
12
2{3H
) 2.
35
2.10
2.
38
1.75
-2.4
1.
75-2
. 2.
42
2.50
Pro
t y
1.8-
1.9
2.29
(lH
) 1.
9-2.
0 1.
9-2.
0 P
rot
6 3.
44
3.63
3.
60
3.65
3.
76
-3.4
-3
.4
3.83
3.
78
CO
NH
8.
2 8.
2 8.
35
CS
NH
10
.24
10.4
8 10
.46
10.6
4 10
.61
n.a
10
.52
10.6
0 10
.76
10.8
1
3JC
Ha
. NH
n
.a.
<1,
or
-2-
5 o
r-1
n
.a.
n.a
. T
I.a
5.0+
1.5
-2
4.1
<1
4.2
[IJ
N
0
aMp.
p.m
) re
lati
ve t
o in
tern
al T
MS
in
DM
SO
-d6
un
less
oth
erw
ise
stat
ed.
~, bS
olve
nt D
MSO
ds+
CD
Cl 3
~
cSol
vent
DM
SO d
s ~

RACEMIZATION OF THIOPEPTIDES 959
66 times faster than free alanine (23). Racemization may occur
during treatment of peptides with LR in dry benzene, toluene or
other solvents even at room temperature (Scheme 1). Considering
the rate of racemization encountered during the acidic hydrolysis
of linear thiopeptides, the data in Table V suggest that the prepara
tion of piperazine-2,5-onthiones of type cyclo(Aaatl-Aaa2) (Aaa2 ""
Gly) goes practically without racemization if the thionation takes
place prior to ring closure (Route A in Scheme 1). Glycine appears
to enhance the tendency for racemization, especially in Aaat-Gly
position. (Note, that during acidic hydrolysis of protected endoth
iopeptides, (Table V) glycine more promotes racemization in Glyt
Aaa position.) Apparently, the racemization may also take place
following the thionation reaction. Chemically and optically pure Z
or Boc-Prot-Gly-OMe can be N-deprotected without racemization.
The dipeptide ester H-Prot-Gly-OMe undergoes cyclization, in hot
alcohol, in the presence of 0.05 - 0.1 equiv. of a tertiary amine base.
Surprisingly, the monothione cycloCProt-Gly) was found to show
practically no optical activity. Optically active (or partially active)
product cannot be prepared even at extremely mild thionation and
isolation conditions. Acidic hydrolysis, derivatization with
Marfey's reagent and HPLC separation (28) proved that this
monothione suffers complete racemization during the cyclization
in alcohols or the subsequent chromatographic purification in
aqueous buffers (mono- and dithio derivatives of piperazine-2,5-
diones are not soluble in nonpolar solvents). Though in lower ex
tent, glycine also promotes racemization of alanine in Aaat-Gly po-

960 sz6K.AN ET AL.
sition. Contrary to these, the isomeric monothio derivatives
cycloCGlyt-Pro) and cycloCGlyt-Ala) can be obtained from CZ- or Boc)
Glyt-Pro-OMe or Glyt-Ala through the same steps in practically
pure L-enantiomeric form. Similarly to cycloCAlat-Ala) and
cycloCProt-Pro), the source of racemization here is the acidic hy
drolysis rather than the cyclization or purification of the product
Ccf. Table IV and V).
The racemization studies based on HPLC chromatographic
separation of diasteroisomeric cyclic thiodipeptides and the
Marfey's derivatives of their amino acid components lead to the fol
lowing conclusions:
1. In the case of dipeptides of type ZCBoc)-Aaatl-Aaa2-OR CR =
CH3, C2H5) thionation and subsequent nonhydrolytic dethionation
do not cause considerable racemization under standard conditions.
The spontaneous cyclization of dipeptide esters CH-Aaat1-Aaa2-OR)
also goes without significant racemization.
2. Acidic hydrolysis of thiopeptides results in partially
racemized amino acids. The rate of racemization is much higher
C25-45%) at endothiodipeptides CZ[Boc)-Aaatl-Aaa2-OR] than in the
corresponding (oxo )peptides C < 2%) [Table IV- V. ].
3. Thionation of piperazine-2,5-diones or piperazine-2,5-on
thiones is always accompanied by racemization. The ratio of di
astereoisomeric and/or enantiostereoisomeric products depends on
the structure of the parent cyclic peptide or thiopeptide and the con
ditions of thionation. Due to steric reasons, thionation of cycloCPro
Pro) proceeds with partial double racemization Csee Table VI). In
the case of cycloCAlat-Alat) the meso-compound is also formed to-

RACEMIZATION OF THIOPEPTIDES 961
gether with the racemic pair.
4. Cyclization of optically pure endothiodipeptide esters (H
Aaat1-Aaa2-OR; Aaa2 * Gly) gives rise to piperazine-2,5-onthiones
oftype cyclo(Aaat1-Aaa2). The comparison of chromatographic and
NMR-based racemization data suggests that the cyclization and
isolation of the products are free from racemization. partial racem
ization of the chiral amino acid residues occurs during the acidic
hydrolysis. Glycine has a special positional effect on racemization:
cyclo(Prot-Gly) and cyclo(Alat-Gly) suffer total racemization during
ring-closure and isolation while cyclo(Glyt-Pro) and cyclo(Glyt-Ala)
can be prepared in optically pure form.
5. The acidic hydrolysis of thiopeptides yields amino
(oxo)acids. Thus, the pre-column derivatization method with
Marfey's reagent followed by RP-HPLC can be applied for measure
ment of racemization also in the case of thiopeptides. The di
astereoisomeric cyclic thiodipeptides formed in consequence of
racemization can be separated efficiently by HPLC on silica
columns.
Starting from our observations the theoretical basis of stereo
chemical behaviour of cyclothiopeptides is discussed elsewhere
(30).
Acknowledgements
The authors thank Mrs Almas and Mrs P. Dacsev for excel
lent technical assistance in the preparative work, in the sample
preparations and in the HPLC analyses.
962 sz6KAN ET AL.
REFERENCES
1. W.C. Jones, Jr., J.J. Nestor, V. du Vigneaud, J. Am. Chem. Soc. 95: 5677-5681 (1973)
2. A.F. Spatola, N.S. Agarwal, A.L. Bettag, J.A. Yankeelov, C.Y. Bowers, W.W. Vale, Biochem. Biophys. Res. Commun. 97: 1014-1023 (1980)
3. PA. Bartlett, KL. Spear, N.E. Jacobson, Biochemistry, 21: 1608-1612 (1982)
4. K Clausen, A.F. Spatola, C. Lemieux, P Schiller, S.-O. Lawesson, Biochem. Biophys. Res. Commun. 120: 305-309 (1984)
5. K Clausen, M. Thorsen, S.-O. Lawesson, A.F. Spatola, J. Chem. Soc. Perkin Trans. I, 785-798 (1984)
6. G. Lajoie, F. Lepine, L. Maziak, B. Beleau, Tetrahedron Lett. 24: 3815-3818 (1983)
7. G. Lajoie, F. Lepine, S. Lemaire, F. Jolicoeur, C. Aube, A. Turcotte, B. Belleau, Int. J. Peptide Protein Res. 24: 316-321 (1984)
8. M. Kruszynski, G. Kupryszewski, U. Ragnarsson, M. Alexandrova, V Strbak, M.e. Tonon, J. Vaudry, Experientia, 41: 1576-1578 (1985)
9. M.P Cava, M.l. Levinson, Tetrahedron, 41:5061-5087 (1985)
10. D.B. Sherman, A.F. Spatola, J. Am. Chem. Soc. 112: 433-441 (1990)
11. K Clausen, M. Thorsen, S.O. Lawesson, Tetrahedron, 37: 3635-3639 (1981)
12. K. Clausen, M. Thorsen, S.O. Lawesson, Chem. Scripta a:l: 14-18 (1982)
13. M. Kajtar, M. Ho1l6si, J. Kajtar, Zs. Majer, KE. Kover, Tetrahedron, 42: 3931-3942 (1986)
14. M. Kajtar, M. Ho1l6si, J. Kajtar, Zs. Majer, A. Vass-Lakatos, in Proceedings of the F.E.C.S. International Conference on Circular Dichroism, Publ. House of the Bulgarian Academy of Sciences, Sofia, 1985, p. 126-132.

RACEMIZATION OF 1HIOPEPTIDES 963
15. M. Ho1l6si, Zs. Majer, M. Zewdu, F. Ruff, M. Kajtar, K.E. Kover, Tetrahedron, 44: 195-202 (1988)
16. M. Holl6si, J. Kajtar, Zs. Majer, M. Zewdu, M. Kajtar, in Proceedings of the F.E.C.S. Second International Conference on Circular Dichroism, Publ. Hungarian Acad. Sci., Budapest, 1987, p.93-114.
17. Zs. Majer, M. Zewdu, M. Holl6si, J. Seprodi, Zs. Vadasz, 1. Teplan, Biochem. Biophys. Res. Commun. 150: 1017-1021 (1988)
18. M. Holl6si, M. Zewdu, Zs. Majer, M. Kajtar, Gy. Batta, K. Kover, P. Sandor, Int. J. Peptide Protein Res. 33: 173-182 (1990)
19. M. Holl6si, E. Kollat, J. Kajtar, M. Kajtar, G.D. Fasman, Biopolymers 30: 1061-1072 (1990)
20. D.W. Brown, M.M. Campbell, C.v. Walker, Tetrahedron 39: 1075-1081 (1983)
21. G.G. Smith, R. Baum, J. Org. Chern. 52: 2248-2255 (1987)
22. C. Eguchi, A. Kakuta, J. Am. Chern. Soc. 96: 3985-3989 (1974)
23. U. Schmidt, A. Nikiforov, Monats. fUr Chemie, 106: 313-320 (1975)
24. L. Parkanyi, v. FUlop, M. Czugler, M. Ho1l6si, M. Zewdu, Zs. Majer, M. Kajtar, Acta Cryst. C43: 2356-2361 (1987)
25. IUPAC-IUB Joint Commission on Biochemical Nomenclature. European J. Biochem. 138: 9-37 (1984)
26. P. Marfey, Carlsberg Res. Commun. 49: 591-596 (1984)
27. Gy. Sz6kan, G. Mez6, F. Hudecz, J. Chromatogr. 444: 115-122 (1988)
28. Gy. Sz6kan, G. Mez6, F. Hudecz, 1. Schon, O. Nyeki, T. Szirtes, R. Dolling, J. Liquid Chromo 12: 2855-2875 (1989)
29. D.8. Kemp, in The Peptides, E. Gross, J. Meienhofer, eds. Vol. 1. Academic Press, New York, 1979, pp. 317-383.

964 sz6KAN ET AL.
30. O. Farkas, A. Perczel, Gy. Sz6kan, M. Holl6si, M. Kajtar, J. Mol. Struct. (Theochern) 286: 131-148 (1993)
31. S. Morinobu, Bull. Chern. Soc. Japan, 56: 568-574 (1983)
Received: August 1, 1994 Accepted: August 10, 1994
JOURNAL OF LIQUID CHROMATOGRAPHY, 18(5),965-976 (1995)
A SENSITIVE HIGH-PERFORMANCE LIQUID CHROMATOGRAPHIC METHOD FOR
DETECTING SULFONAMIDE RESIDUES IN SWINE SERUM AND TISSUES AFTER FLUORESCAMINE DERIVATIZATION
CHIN-EN TSAI AND FUSAO KONDO* Department of Veterinary Public Health
Faculty of Agriculture Miyazaki University
Kibanadai-Nishi, Gakuen Miyazaki-shi 889-21, Japan
ABSTRACT
A highly sensitive and rapid high-performance liquid chromatographic method for
determi ni ng sulfonamides (sulfadiazine, sulfamethazine, sulfamonomethoxine,
sulfamethoxazole and sulfadimethoxine) in swine serum and tissues is described. The
sulfonamides were extracted from the samples, derivatized with fluorescamine,
chromatographed on a Nova-Pak Cl8 column using acetonitrile-IO mM potaSSIUm
phosphate (30:70, v/v) as the mobile phase and detected spectrorIuororimetrically
(excitation 390 nm, emission 475 nm). The retention times were 7.1 to 18.2 min and
there was no mterference from any co-extractives. The detection limit for each standard
sulfonamide solution was 0.1 ng/ml and their calibration curves were linear between I
and 100 ng/m!. In the presence of sulfadiazine as an internal standard, sulfonamide
recovery from spiked serum, muscle, liver and kidney samples (10 ng/ml) was 94.0 ±
4.7 to 97.3 ± 5.9%,58.5 ± 3. I to 73.9 ± 5.7 o/i., 65.9 ± 7.1 to 86.9 ± 10.6% and 86.2
± 4.0 to 92.8 ± 6.4% respectively.
965
Copyright © 1995 by Marcel Dekker, Inc.

966 TSAI AND KONDO
INTRODUCTION
Antimicrobial agents are given to animals in subtherapeutic concentrations for three
reasons: (1) to prevent infectious diseases caused by bacteria or protozoa; (2) to decrease
the amount of feed needed and (3) to increase the rate of weight gain [1]. Sulfonamides
were the first chemotherapeutic agents used for the systematic control of bacterial
diseases in livestock [2], as they had a broad spectrum of activity and were cheap [3].
However, the use of antimicrobial agents in animals that end up as food for human
consumption results in the presence of illegal residues in meat (especially the liver and
kidneys) [I]. A study by the National Center for TOXIcological Research indicated that
sulfamethazine may be a thyroid carcinogen [4].
Various authors have published procedures for determimng diffcrent sulfonamides in
animal flUids and tissues, most of which involve reversed-phase high-performance liquid
chromatography (HPLC) with ultraviolet (UV) detectIon [2]. However, these methods
reqUire elaborate and lime-consuming clean-up procedures or have low detection
sensIlivi tIes. Japanese food safety laws have established a zero residual level for all
antimicrobial agents In edible animal tissues [5]. Therefore, improved analytical
proccdures are nccded to monitor them for sulfonamide, and other antibiotic, residues.
FluorescamInc \\ as first reported to be a means of generating Iluorescent derivatives
of pnmary amino aCids [6J. Sigel el al. [7] detected sulfadiazine after derivatization with
l1uorescamine solution using a thin-layer chromatographic (TLC) method and recently,
several TLC methods [3,8,9] for analyzing sulfonamides at ppb levels in animal tissues
USIng a nuorescamine solution for derivatization have been described. Although van
Haaster el al. [!OJ developed a highly sensitive HPLC method for determining histamine
and 3-mcthylhistamine in biological samples using fluorescamine as the derivatizing
agent. So far, to our knowledge, no reports of methods for identifying sulfonamide
residues In ammal tissues USIng HPLC with I"luorescamine derivatization have been
published. The obJeclIve of thIS study was to develop a rapid and sensitive screening
method for sulfonamide residues In swine serum and tissues using HPLC with
f1uorcscamine as the derivatizmg agent.
SULFONAMIDE RESIDUES IN SWINE SERUM
EXPERIMENT AL
Materials
967
Sulfadiazine (SDZ), sulfamethazine (SMT), sulfamonomethoxine (SMM) and
sulfadimethoxine (SDM) were purchased from Sigma (St. LOUIS, MO, USA) and
sulfamethoxazole (SMX) was obtained from Shionogi Pharmaceutical, Osaka, Japan.
Acetonitrile, potassium dihydrogen phosphate (PDP) and N,N'-dimethylformamide were
obtained from Wako Pure Chemical Industries, Tokyo, trichloroacetic acid (TCA,
analytical reagent grade) was from Yoneyama Yakuhin Kogyo, Osaka, Japan,
fluorescamme was obtained from Sigma and HPLC-grade water was produced in a Milli
Q purification system (Millipore, Milford, MA, USA). Stock sulfonamide solutions (l
mg/ml) were prepared by dissolvmg 10 mg each standard compound with 1 ml N,N'
dimethylrormamide and diluting them to 10 ml with distilled water. The stock solutions
were diluted to the desIred concentrations (1,5, 10,50 and 100 ng/ml) with 0.01 % TCA
solution for calibration curve study. Sulfadiazine (10 ng/ml) was added to the assay
solution as an intemal standard.
Extraction procedure
Serum
A O.I-ml aliquot of each sulfonamide solution (100 ng/ml) was added to 0.9 ml swine
serum (spiked 10 ng/m!), then kept in the refrigerator (4°C) overnight to allow drug
incorporation into the serum, after which 4 ml acetonitrile was added for extraction and
deproteinization, the mixture was stirred with a vortex stirrer and centrifuged for 15 min
at 1,000 g. The supernatant was evaporated to dryness under a stream of nitrogen gas
using a 40°C water bath, the residue was dissolved in 0.05 ml water and mixed
vigorously, I ml acetonitrile was added to the mixture, which was for centrifuged IS min
at 1,000 g and the resulting upper layer was evaporated to dryness. The residue was
dissolved in 1.0 ml 0.01 o/c (w/v) TCA solution containing 10 ng/ml sulfadiazine (intemal
standard) and shaken, 0.1 ml hexane was added to the solution, which was shaken again

968 TSAI AND KONDO
and centrifuged at 1,000 g for IS min, after which, a O.5-ml aliquot of the clear layer was
collected carefully with a Pasteur pippet and used for derivatization.
Tissues
Swine kidney, muscle and liver tissues (100-200 g) were cut into small pieces and
homogenized in a blender. The ground tissues were stored at -30°C until analyzed, when
1.0 g was placed In a lO-ml centrifuge tube, 0.1 ml sulfonamide mixture (100 ng/ml) was
added to producc !O ng/ml spiked samples, which were kept in thc refrigerator (4°C)
overnight to allow drug incorporation into the llssues, after which, the extraction
procedure was earned out as described for serum.
Derivatization
A O.l-ml aliquot of freshly prepared fluorescamine solution in acetonitrile (l mg/ml)
was added to each LUbe contaIning O.S-ml purified samples, which were shaken by hand
I min, and a SO-~d aliquot of each derivatized sample was injected into the HPLC
column.
HPLC analysis
The HPLC system comprised a Model600E multisolvent delivery pump connected to
a U6K injector (Waters Associates, Milford, MA) and a Hitachi F-IOSO fluorescence
spectrophotometnc detector (Hitachi, Tokyo, Japan) operating at excitation (Ex) and
emission (Em) wavelengths of 390 and 47S nm respectively. The separation procedure
was performed using a Nova-Pack CIS column (prepacked, lO-!-lm particle size, 300 mm
x 3.9 mm rD, Waters Associates), the chromatographic data system used was
Chromatopac C-R6A (Shimadzu Seisaku, Kyoto, Japan), the mobile phase comprised
acetonitrile-IO mM potassium dihydrogen phosphate (30:70, v/v) at room temperature,
which was degassed using an ultrasonic bath and the flow-rate was 1.0 ml min-I.

SULFONAMIDE RESIDUES IN SWINE SERUM 969
Calculation
A standard calibration curve (four replicates each) for each of the four sulfonamides
of then peak-height (h) to that of the Internal standard (IS) ratios against their
concentrations (I, 5,10,50, 100 ng/ml) was plotted using the follOWing equations: Y =
aX + band Y = h (of each sulfonamide)/h (IS); X = concentrations; a = slope; b =
intercept. The recovery of each sulfonamide from each spiked sample was calculated by
comparing ItS peak-height ratIO with those of the standard control solutions under
identical HPLC analytical conditions.
RESUL TS and DISCUSSION
Linearity and stability
The linearity of thefluorescencc intensity of the sulfonamide mixture solution was
evaluated by analynng a concentratIOn range of 1 to 100 nglml of the mixture of four
sulfonamldcs. The chromatogram of 0.5 ml standard sulfonamide mixture solution (l
ngiml) containing 10 ng/ml sulfadlaLine (internal standard) derivatized with 0.1 ml
f1uorescamine (I mg/ml) IS shown in Fig. l. Each peak was symmetrical and the
retention lImes of SDZ, SMT, SMM, SMX and SDM respectively \\ere 7.1, 7,9, 9.1.
14.1 and 18.2 min.
The standard calibration curves (four replicates) for the four sulfonamides were linear
with correlation coeffiCients in excess of 0.99 as follows: SMT: Y=(O.1383 ± 0.(033)X
+ (0.1315 ± 0.(617), r=0.9993 ± 0.0005; SMM: Y=(O.1033 ± O'(l037)X + (0.1202 ±
0.0671), r=0.9977 ± 0.0025; SMX: Y=(O.0544 ± 0.(032)X + (0.079 ± 0.(546),
r=0.9987 ± 0.0014; SDM: Y=(0.0458 ± 0.0032)X + (0.0895 ± 0.(504), r=0.9974 ±
0.0029. In a standard solution, with a 50-fd Injection sample, 0.1 nglml sulfonamides
was the lowest concentration that could be detected. van Haaster 1'1 al. [10] detected 20
pg histamine and 3-methylhlstamine on their column at a slgnal-to-nOise ratio of 3: 1,
which was about the same senSItIvity as our method. They also demonstrated that only
10% of the fluorescence intensity \\as lost over a period of 7 days. In this study, we
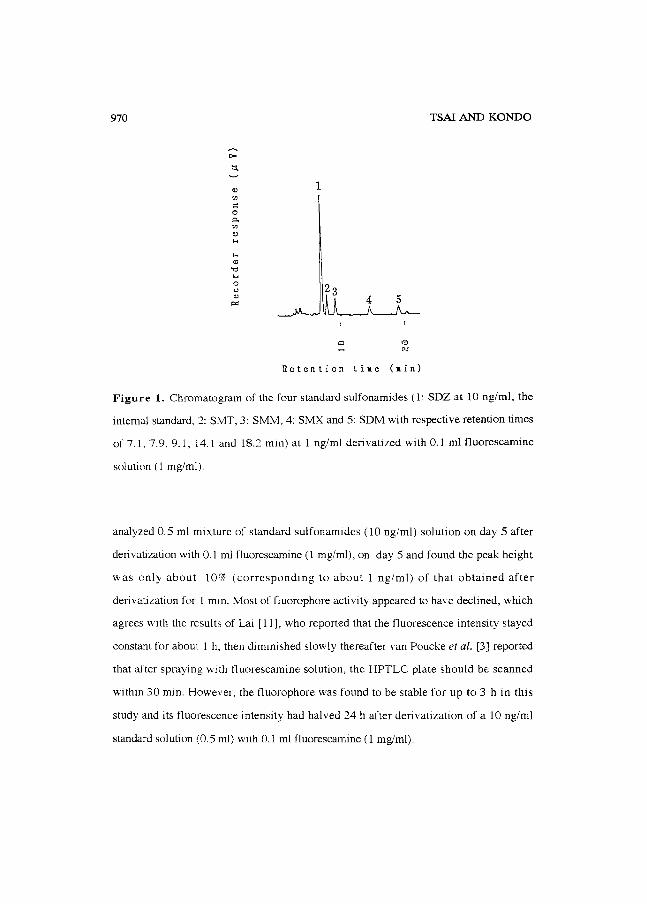
970
.... ::l.
C1l ttl
" 0 0. ttl
C1l .... .... C1l
"'" .... 0 u C1l
""
1
<!l OJ
TSAI AND KONDO
Figure 1. Chromatogram of the four standard sulfonamides (1: SDZ at 10 ng/ml, the
internal standard, 2: SMT, 3: SMM, 4: SMX and 5: SDM with respective retention times
of 7.1,7.9,9.1, 14.1 and 18.2 min) at 1 ng/ml derivatized with 0.1 ml fluorescamine
solution (1 mg/ml).
analyzed 0.5 ml mixture of standard sulfonamldes (10 ng/ml) solution on day 5 after
derivatization with 0.1 ml tluorescamine (l mg/ml), on day 5 and found the peak height
was only about 10% (corresponding to about 1 ng/ml) of that obtained after
derivatization for 1 mIn. Most of tluorophore activity appeared to have declined, which
agrees with the results of Lal [11], who reported that the fluorescence intensity stayed
constant for about 1 h, then dimInished slowly thereafter van Poucke el al. [3] reported
that after spraying with lluorescamine solution, the HPTLC plate should be scanned
within 30 min. However, the lluorophore was found to be stable for up to 3 h in this
study and its fluorescence intensity had halved 24 h after derivatization of a 10 ng/ml
standard solution (0.5 ml) with 0.1 ml fluorescamine (1 mg/ml).

SULFONAMIDE RESIDUES IN SWINE SERUM 971
Recovery
The sulfonamide recoveries from swine 10 nglml spiked serum and tissue samples
were determined using SIX replicates. The chromatograms of blank and spiked serum
samples after acetonitrile extraction and fluorescamine derivatization are shown in Fig. 2.
Thosc of the muscle, bver and kidney samples are shown In Figs. 3, 4 and 5
respectively. The recovery results for the four sulfonamides from swine spiked serum
and tissue samples are presented in Table I. The recovenes from muscle and liver were
lower than those from serum and kidney. This may be due to an unknown substance that
affected rIuorophore formation or the sulfonamides may have bound to these tissues.
Reimer and Suarez [8] demonstrated that low sulfonamide reco\cry from salmon muscle
tissue appeared to be related to its relatively high cholesterol level.
Derivatization
Usually, o-phthalaldehyde is used as the derivatizing agcnt for determining
sulfonamides with fluorescence detection. Morita el al. [121 analyzed sulfonamide
residues 111 livestock products using HPLC with spectrofluorometric detection (Ex 285
nm, Em 445 nm). They used the o-phthalaldehyde as the derivalizing agent and the
sample extracts had to be reacted with it for 30 min at 60°C. In this study, derivatization
was quickly and ea~!ly carned out at room temperature for I !TI111 before injection into the
HPLC column. Furthermore, Lai demonstrated that o-phthalaldehydc yielded
background fluorescence several fold hIgher than fluorescamine IlIJ. Fluorescamine
reacts WIth pepllde primary am1110 groups almost instantaneously at room temperature in
aqueous solution at pH 7.5-9 to form a fluorescent compound 1111. Initially, we used a
solution of this pH for the derivatization reaction, but obtained a large interference peak
that overlapped WIth the sulfonamides peaks. E\cntually, we used 0.01 % (w/v) TCA
solution (pH 3.6) to dissohe the residues after drying under nitrogen gas and then
derivatized them with tluorescamine for 1 min. The derivatized samples were eluted with
a mobile phase (pH 5.3) of acetonitrile-IO mM PDP (30:70, \/v). These were found to be

972 TSAI AND KONDO
~
t>-
::;. A B ., 1 ., " a
3 Po
'" ., .... .... 4 .,
"C .... a ~ tJ .,
"" "" c:J c:J c:J
(\J (~
R (! t (! n t I 0 n t i m (! ( m I n
Figure 2. Chromatogram of fluorescamine-derivatized acetonitrile extracts from (A)
blank serum and (8) a serum sample spiked with standard sulfonamides (10 ng/ml) and
the internal standard (10 ng/ml) sulfadiazine. The elution order is (1) SDZ, (2) SMT, (3)
SMM, (4) SMX and (5) SDM with respective retention times of7.1, 7.9, 9.1,14.1 and
18.2 min.
t>-
::l.
'" " B " A a 1 Po ., '" 2 .... .... 3 GO
""
~ 4 .... 5 a
tJ ., ""
c:J c:J '" '" (\J (.J
Retention time (min)
Figure 3. Chromatogram of fluorescamme-derivatized acetonitrile extracts from (A)
blank and (8) spiked muscle samples. Spiking data and retention times as Figure 2.

SULFONAMIDE RESIDUES IN SWINE SERUM
OJ
'" 1::1
0
0-
C/l
OJ
....
.... OJ
't:I
.... 0
u
OJ
0::
A
Ret c n
CD e·J
o n
973
B
tim c ( min)
Figure 4. Chromatogram of fluorescamine-derivatized acetonitrile extracts from (A)
blank and (B) spiked liver samples. Spiking data and retention times as Figure 2.
the best conditions for tluorophore formation and HPLC elution. Maybe owing to the
HPLC system could change the cIrcumstance for fluorophore formation.
Extraction
Usually, sulfonamides are extracted from solid samples, such as muscle and some
tissues, by homogenizing the sample in an extraction solvent [3,5,8,9, 12] and liquid
samples, for example serum, milk and urine, are treated similarly by multiple extraction
with orgamc solvents [2,3,12-14]. Both types of extract require additional clean-up

974 TSAr AND KONDO
>-:::t
" '" I:l
0
0.
'" " ...
... A B OJ
'0
12 ... 0 3 u
OJ
P:: 4 5
Retention tim c ( min)
Figure S. Chromatogram of fluorescamine-derivatized acetonItrile extracts from (A)
blank and (B) spiked kidney samples. Spikmg dala and retention times as Figure 2.
steps and concentrallon usmg C 18 packing material or another cartridge before they can
be assayed [3,5, 13] and these procedures are time-consuming. In this study, we
developed a highly sensitive method for detecting sulfonamide residues at ppb levels.
Only a small sample (I ml serum or I g ground tissue) needs to be treated to monitor any
residual sulfonamides and the extraction method IS easy, using only 5 ml acetonitrile.

SULFONAMIDE RESIDUES IN SWINE SERUM 975
TABLE 1. RECOVERY RESULTS FOR THE FOUR SULFONAMIDES FROM
SPIKED (10 ng/ml) SWINE SERUM AND TISSUES (n=6)
Drugs scrull .usclc livcr kidncy
SlIT 97.0± 1.9 58.5± 3. 1 65.9± 7.1 86.5± 4.3
SJdld 9.!.. 1 ± 2.4 64.1± 2.7 73.5± 9. 8 86.2± 4.0
SMX 97.3± 5. 9 69.6± 3.2 83.1± 8.2 90.4± 5.0
SDY 91. O± -1..7 73.9± 5.7 86.9±10.6 92.8± 6. -I.
CONCLUSION
A simple, sensitive and rapid HPLC analytical method for determining sulfonamide
residues in swine serum and tissues using f1uorescamine as thc derivatizing agent has
been described. The advantages of this method over the others currently available are that
a small sample only is needed, sulfonamide extraction is easy, derivatization with
f1uorescamine takes only I min at room temperature and at least four sulfonamides in a
sample can be detected simultaneously. Our method may be useful for regulatory
purposes for routine screening for some residual sulfonamides in ammal edible tissues.
However, further studies are necessary to evaluate the effectiveness of this system in
vivo.
REFERENCES
H. L. DuPont and J. H. Steele, Rev. Inject. Dis., 9,447 (1987)
2 D. V. Baer, A. Momberg, M. E. Carrera, R. Arriagada and M. R. Smith,
J. Pharm. Biomed. Anal., 9,925 (1991)
3 L. S. O. van Poucke, O. C. l. Depourcq and C. H. van Peteghem, J. Chromalogr.
Sci., 29,423, (1991)

976 TSAI AND KONDO
4 N. Littlefield, Technical Report, Chronic toxicity and Carcinogenicity Studies of
Sulfamethazinc In B6CFI Mice, National Ccnter for Toxicological Research,
Jefferson, AR. 1988.
5 K. Takatsuki and T. Kikuchi, l. Assoc. Off. Anal. Chem., 73, 886, (1990)
6 M. Welgeie, S. L. DeBernardo, 1. P. Tengi and W. Leimgruber, l. Amer. Chem.
Soc., 94, 5927, (1972)
7 C. W. Sigel, J. L. Woollcy and C. A. J. Nichol, Pharmaceulical Sci., 64 (1975) 973.
8 O. J. Reimer and A. Suarez, l. Chromatogr., 555,315, (1991)
9 J. Unruh, D. P. Schwam and R. A. Barford, l. Assoc. Off. Anal. Chem., 76,335,
(1993)
10 C. M. C. J. van Haaster, W. Engels, P. J. M. R. Lemmens, O. Hornstra and G. J.
van der Vussc, l. Chromatogr., 617,233, (1993)
11 C. Y. Lai, Melhods En~ymol., 47, 236, (1977)
12 Y. Morita, Y. Nakasone, T. Araki, F. Fukuda, H. Matsumoto, O. Kurihara, N.
Matsumoto and Y. lizuka, J. lpn. Vel. Med. Assoc., 45, 339, (1992)
13 A. R. Long, C. R. Short and S. A. Barker, 1. Chromatogr., 502,87, (1990)
14 J. D. Weber and M. D. Smedley, l. Assoc. Oil Anal. Chem., 72,445, (1989)
Received: August 2, 1994 Accepted: August 10, 1994

JOURNAL OF LIQUID CHROMATOGRAPHY, 18(5), 977-987 (1995)
ANALYSIS OF PRAZOSIN IN PLASMA BY HIGH-PERFORMANCE LIQUID
CHROMATOGRAPHY USING FLUORESCENCE DETECTION
E. M. NIAZY, Y. M. EL-SAYED, AND S. H. KHIDR Department of Pharmaceutics
College of Pharmacy King Saud University
P.D. Box 2457 Riyadh 11451, Saudi Arabia
ABSTRACT
A high-performance liquid chromatographic procedure using fluorescence detection has been developed for the determination of prazosin in plasma. Propylhydroxybenzoate was used as the internal standard. The chromatography was performed using adsorbsphere phenyl column; the mobile phase consisted of 30: 70% acetonitrile to 0.05 M phosphate buffer and was adjusted to pH 3.3-3.4 using phosphoric acid; a flow rate of 1.5 ml/min; and the effluent was monitored at excitation and emission wavelengths of 247 and 394 nm, respectively. The retention times for prazosin and the internal standard were 4.0 and 6.0 min., respectively. The intra day coefficients of variation (CV) ranged from 1.15 to 4.96% at three different concentrations and the interday CVs varied from 0.05 to 8.99%. The mean (± SD) absolute and relative recovery of prazosin were found to be 97.4±3.14 and 100.68±2.19, respectively. stability tests showed that prazosin is stable for at least 2 weeks in plasma after freezing. The minimum detectable concentration of prazosin by this method was
977
Copyright © 1995 by Marcel Dekker, Inc.

978 NIAZY, EL-SAYED, AND KHIDR
0.5 ng/ml. The sensitivity obtained should enable the use of this method in future bioequivalency and/or pharmacokinetic studies.
INTRODUCTION
Prazosin is a quinazoline derivative with a selec-
tive alpha1-adrenoceptor blocking properties (1-3) that
is widely used in the treatment of hypertension and
heart failure (4-7). The usual initial dose of prazosin
is 0.5 mg two or three times daily. The determination
of plasma drug levels after such low doses required an
assay capable of measuring levels below 1 ng/ml sample.
Numerous analytical methods have been described
for assaying prazosin. These include spectroflurometry
(8-11) and high-performance liquid chromatography (12-
14). Generally, however, prazosin assays previously
reported are time consuming involved double extraction
steps and some of them suffer from a lack of sen-
sitivity.
In this report a simple, rapid, sensitive, ac-
curate and reproducible high-performance liquid
chromatographic assay for the quantitative determina-
tion of prazosin in plasma is described. The method re-
quires only 0.2 ml of plasma and involves a single ex-
traction step, eliminating the tedious and time-
consuming procedures required by the previously
reported methods.

PRAZOSIN IN PLASMA 979
MATERIALS
Prazosin HCl was obtained from Sigma Chern. Co.
(st. Louis, MO, USA) and propylhydroxybenzoate
(internal standard) was obtained from E. Merck AG
(Darmstadt, Germany). Acetonitrile and diethylether
(BDH Chern. Ltd., Poole, U.K.) were HPLC grade. Sodium
dihydrogen phosphate and disodium hydrogen phosphate
and phosphoric acid (Riedel-De-Haen AG, Seelze, Han
nover, Germany) were of analytical grade.
METHODS
Instruments
The following instruments were used:
A model LC-10AD solvent delivery pump (Shimadzu Cor
poration, Koyato, Japan), a model 470 fluorescence
detector (Waters Associates, Milford, MA, U.S.A.), a
model SIN 206003 chart recorder (Esterline Angus
Instrument Corp., Indianapolis, IN, U.S.A.), and a
model 7010 Rheodyne injector (Rheodyne Inc., catati,
CA, U.S.A.). Chromatographic separation was performed
using a stainless steel adsorbsphere phenyl column, 150
mm length x 4.6 mm i.d., 5 ~m particles (Alltech).
Standard Solutions
Prazosin HCl (10 mg) and propylhydroxybenzoate (10
mg) were dissolved in methanol in two separate 100 ml

980 NIAZY, EL-SA YED, AND KHIDR
volumetric flasks to give standard stock solutions of
100 Mg/ml.
Chromatographic Conditions
The mobile phase consisted of acetonitrile:0.05 M
phosphate buffer (30:70% v/v) adjusted to pH 3.3-3.4
with phosphoric acid. The mobile phase was degassed by
pass ing it through a 0.45 Mm membrane f i 1 ter
(Millipore, Bedford, MA, U.S.A.) and pumped isocrati
cally at a flow rate of 1.5 ml/minute, at ambient tem
perature. The effluent was monitored at excitation and
emission wavelengths of 247 and 394 nm, respectively.
The chart speed was 0.25 Cm/min.
Procedure
In a screw-capped glass centrifuge tube (10 ml),
0.2 ml plasma sample, 0.2 ml of 1 N NaOH, 12.5 Ml of
the internal standard solution and 7 ml diethylether
were added. The mixture was shaken on a vortex mixer
for 1 minute, and centrifuged for 2 min, at 3000 rpm.
The ether layer was transferred into another glass
centrifuge tube and evaporated to dryness. The residue
was reconstituted in 0.4 ml of the mobile phase. An ap
propriate aliquot was then injected directly into the
loop injector.

PRAZOSIN IN PLASMA 981
RESULTS AND DISCUSSION
The mobile phase reported herein (acetonitrile:
0.05 M phosphate buffer, 30:70% v/v, pH 3.3-3.4) was
optimized for a rapid and interference-free
chromatograms. The selected chromatographic conditions
provided optimum resolution of prazosin and the inter
nal standard. The retention times for prazosin and the
internal standard were 4.0 and 6.0 min., respectively.
Figure 1 shows chromatograms from a drug-free
blank plasma and plasma sample spiked with the drug and
the internal standard.
Quantification
The quantification of the chromatogram was per
formed using peak-height ratios of the drug to the in-
ternal standard. standard curves were constructed
routinely from spiked plasma samples and mobile phase
containing 0, 1.0, 2.5, 5.0, 10.0, 20.0 and 40.0 ng/ml
of prazosin. Four standard plots were obtained from
plasma samples and six from the mobile phase. Least
squares linear regression analysis of the calibration
curves resulted in the following equations:
y -0.0210 + 0.1350 X, r 0.999 (Mobile phase)
y 0.0070 + 0.1309 X, r 0.999 (Plasma)

982 NIAZY, EL-SA YED, AND KHIDR
I
o Time(min)
II o
I 4
I.S
Figure 1 : Chromatograms of Blank Plasma (I) and Plasma Containing Prazosin and the Internal Standard (II) Key: 0 : Prazosin
I.S. : Internal Standard.
standard curves of prazosin in plasma and mobile phase
were constructed on different days to determine the
variability of the slopes and intercepts. The results
showed little day-to-day variability of slopes and in-
tercepts as well as good linearity (r>O.99) over the
concentration range studied. The coefficients of varia-
tion for the slopes were 1.33% and 4.58% for the mobile
phase and plasma, respectively.
Precision
The intraday precision was evaluated by replicate
analysis of pooled plasma samples containing prazosin

PRAZOSIN IN PLASMA 983
Table 1 : Intraday and Interday Precision of Prazosin
in Plasma.
Intraday* Interday* *
Added Measured Bias···
I
Added Measured Bias· ...... Cone. Cone. % Cone. Cone. % (ng/mll (ng/mll (ng/mll (ng/mll
7.5 7.5 Mean 7.4 -1.3 Mean 7.52 0.2 S.D. O.OS S.D. 0.01
C.V. % 1.15 C.V.% 8.S9
15 15 Mean 14.8 -1.33 Mean 15.1 0.66 S.D. 0.71 S.D. 0.01
C.V.% 4.S6 C.V.% 0.05
30 30 Mean 2S.7 -0.01 Mean 31 3.33 S.D. 0.S1 S.D. 0.72
C.V.% 3.03 C.V.% 2.4
* Mean values represent eight different plasma samples for each concentration.
** Interday reproducibility was determined From 8 different runs over 15-day period for the three concentrations.
*** Bias = 100 X (measured conc. - added conc. ) / added
conc.
at three different concentrations (low, medium and
high). The intraday precision showed a coefficient of
variation (CV) of 1.15% to 4.96% (Table 1). The inter-
day precision was similarly evaluated over a 2-week
period. The interday CVs ranged from 0.05% to 8.99%
(Table 1).

984 NIAZY, EL-SAYED, AND KHIDR
Recovery
The absolute recovery of prazosin and the internal
standard from plasma were assessed by comparing the
peak height in plasma samples versus samples prepared
in the mobile phase. The absolute recoveries ranged
from 94% to 100.2% (Table 2). The relative recovery was
calculated by comparing the concentrations obtained
from the drug-supplemented plasma to the actual added
concentrations. Eight comparisons at three different
concentrations were made. As shown in Table 2, the mean
relative recovery of prazosin from plasma ranged from
98.3% to 102.6%.
stability
stability studies of plasma spiked with prazosin
(7.5, 15.0 and 30.0 ng/ml) were performed over a 15-day
period (Table 3). Plasma samples were stored in the
freezer at -20°C until the time of analysis. The
results demonstrate that prazosin can be stored frozen
in plasma for 2 weeks without degradation.
sensitivity
The limit of quantitation for this method was
found to be 0.5 ng/ml.

Table 2 : Absolute and Relative Recovery of Prazosin from Plasma* .
Conc. Mean Peak Heights Absolute Relative Range
(ng/mll (cm) Recovery Recovery Relative
% % Recovery
Aqueous Plasma Mean ±SD %
7.5 1.98±0.09 1.86±0.05 94 101.15±2.1 96·104.16
15 3.97±0.07 3.90±0.09 98 102.6±5.1 95·108.1
30 7.86±0.38 7.90±0.09 100.2 98.3±2.19 95.2·104.3
I.S. 1.8±0.06 1.76±0.08 97.8
2.5Ilg/ml
• Eight replicate analyses of each concentration.
Table 3 : Effect of Frozen Storage on Prazosin Stability in Plasma
Added Percent Recovery *
Conc. Days
(ng/ml) 0 5 10 15
7.5 98.0 101.0 96.0 98.0
15 95.0 98.0 101.0 101.0
30 102.0 101.0 98.0 103.0
* {Measured Conc. I (Added Conc.) X 100

986 NIAZY, EL-SA YED, AND KHIDR
Conclusion
The developed HPLC assay in this study has the
sensitivity, rapidity, simplicity and reproducibility
which makes it a potentially valuable tool in many ap-
plications such as drug level monitoring, drug-drug in-
teractions, pharmacokinetic and bioequivalence studies.
ACKNOWLEDGEMENT
The authors would like to thank King Abdulaziz
city for Science and Technology (KACST) (Project No:
AR-12-52) for supporting this investigation.
REFERENCES
1. D. Cambridge, M. Dowey, R. Massigham, Br. J. Clin. Pharmacol., 59:514P-515P (1977).
2. R.M. Graham, H.P. Oates, L.M. Stoker, G.S. Stokes, J. Pharmacol. EXp. Ther., 201:747-752 (1977).
3. J.C. Doxey, C.F. Smith, Pharmacol., 60:91-96 (1977).
J.M. Walker, J.
4. R.N. Brogden, R.C. Heel, T.M. Speight, G.S. Avery, Drugs, 14:163-197 (1977).
5. N.A. Awan, M.K. Evenson, K.E. Needham, D.T. Mason, Am. Heart J., 102:626-634 (1981).
6. R.M. Graham, Am. J. Cardiol., 2l:16a-20a (1984).
7. T.B. Levine, Am. J. Cardiol., 55:32a-35a (1985).
8. A.J. Wood, P. Bolli, F.O. simpson, Br. J. Clin. Pharmacol., 2:199-201 (1976).

PRAZOSIN IN PlASMA 987
9. I.S. Collins, P. Pek, Clin. EXp. Pharmacol. Physiol., ~:445-446 (1976).
10. F.O. Simpson, P. Bolli, A.J. Wood, Med. J. Aust., 2 (Suppl.) :17-22 (1977).
11. R. Verbesselt, A. Mullie, T.B. Tjandramaga, P.J. deSchepper, P.Dessian, Acta Therapeutica, £:27-39 (1976) •
12. T.M. Twomey, D.C. Hobbs, J. Pharm. Sci., 67:1468-1469 (1978).
13. Y.G. Yee, P.C. Rubin, P. Meffin, J. Chromatogr., 172:313-318 (1979).
14. J. Dokladova, S.J. Coco, P.R. Lemke, G.T. Quercia, J.J. Korst, J. Chromatogr., 224:33-41 (1981).
Received: July 26, 1994 Accepted: September 7, 1994


JOURNAL OF LIQUID CHROMATOGRAPHY, 18(5), 989-1000 (1995)
DETERMINATION OF WATER-SOLUBLE INORGANIC PHOSPHATES IN FRESH
VEGETABLES BY ION CHROMATOGRAPHY
E. RUIZ, M. I. SANTILLANA, M. T. NIETO, AND I. SASTRE
Secci6n de Componentes y Aditivos II Centro Nacional de Alimentacion
Instituto de Salud Carlos III Ctra. Majadahonda-Pozuelo, Km.2,2
28220 Madrid, Spain
ABSTRACT
An alternative Ion Chromatographic method has been developed for selective separation and quantitation of water-soluble inorganic phosphate in aqueous extracts of vegetables, based on the use of an anion-exchange poly methacrylate column, borate/gluconate as eluent and conductivity detection. The method shows a good detection limit as well as a high chromatographic resolution. It is also applicable to the detection of phosphates in fresh vegetables.
INTRODUCTION
Phosphate determination is of increasing importance in environmental
matters regarding eutrophization phenomena in the biomedical fields, as well as
in the food and beverage industry for effluent control.
989
Copyright © 1995 by Marcel Dekker, Inc.

990 RUIZET AL.
Recent studies show a considerable increase in daily phosphate intake
(1,000-1,500 mg), due to changes in dietary habits (Recommended phosphate
intake: 800 mg/day) (1). This increase leads to a PICa ratio higher than 2, with
possible harmful effects on the mineral metabolism (osteoporosis, osteomalacia,
decreased Mg absorption, ... ) (2,3,4,5).
Generally, vegetables have high phosphorus contents due to inorganic
fertilizers used in agriculture in order to obtain a higher yield and quality of
these products (6) and for the purpose of antioxidant or protection from
browning (7,8).
We considered the need for an analytical method which permits the study
of residual inorganic phosphate in spanish vegetable produce in view of the
increase in phosphate concentration levels in it, and the lack of data in the
reference literature available.
Different techniques are routinely used for the determination of phosphate
in foodstuffs. These include spectrophotometry (9,10), voltammetry (11) and
flow injection analysis (12), but these methods suffer from various drawbacks,
such as cumbersome sample preparation and long analysis time.
Ion Chromatography offers the opportunity to analyze ion species. Several
applications of Ion Chromatography in analysis of phosphate in water (l3), soil
(14), fertilizers (15) and vegetables (16,17), have appeared in the literature.
In this work, we chose as working method an anion-exchange with
conductivity detection and borate/gluconate as eluent to determine water-soluble
inorganic phosphates in aqueous extracts of fresh vegetables.
MATERIAL AND METHOD
Samples
Analyzed samples were purchased from local food stores. Vegetables were
kept refrigerated until assayed. Celery, chard, spinach and lettuce samples were
analyzed within one day of purchase.
WA1ER-SOLUBLE INORGANIC PHOSPHA1ES 991
Reagents
All the reagents used were of analytic-reagent grade (Merck, D-6100
Damstadt, Germany). Organic solvents of high purity grade for HPLC (BDH,
Poole, Dorset, UK). Ultrapure water with conductivity < 1 IlS (DI water) was
obtained from a Milli-Q (Millipore Corp., Bedford M.A. 01730, USA) four
bowl deionization system.
Phosphate stock standard solution was prepared at 1,000 ppm concentration
by dissolving 0.1432 g of potassium dihydrogen phosphate (K H2 PO.) per 100
ml in DI water. Working standard solutions were prepared daily by appropiate
dilution of the stock solution with DI water.
Sodium Borate/gluconate concentrate solution was prepared with 16 g
sodium gluconate, 18 g boric acid, 25 g sodium tetraborate decahydrate and
250 ml glycerin per 1,000 ml in DI water (concentrate may be stored for up to
six months).
Sodium Borate/gluconate Eluent (conductivity 270 IlS, pH 8.5) was prepared
with 20 ml borate gluconate concentrate, 20 ml n-butanol and 120 ml
acetonitrile to 1,000 ml. It was filtered through a 0.22 Ilm Durapore membrane
(GVWP-Millipore), and degassed by ultrasonication before use.
Equipment
Chromatographic analysis was performed on an Ion Chromatography System
ILC-l (Waters Chromatography Division; Milford, MA, USA): ManualInjector
with a 100 III loop, Conductivity Detector (430), Programmable Solvent
Delivery Module (590), Data Module Integrator (745). Precolumn Guard-Pak
with IC-Pak anion inserts and 4.6 cm x 75 mm IC-Pak anion HR column (also
Waters).
Method
250 g of each of the representative vegetable samples was cut into pieces
and chopped in a domestic mincer. The marrow and onion samples had had their

992 RUIZET AL.
skins peeled off previously. A subsample of 10.00 ± 0.1 g (5.00 ± 0.1 g in the
case of samples with phosphate concentration higher than 1,000 /Lg/g, so that
they were within the lineal range of this method) was homogenized with 100 ml
of destilled water pre-heated to 70°C in a household mixer for 2 minutes. The
mixture was heated on a boiling water bath for 15 minutes with repeated
shaking, to denature and precipate the proteins.
The resulting extract solution was cooled, made up to 200 ml with water in
a volumetric flask and filtered through Whatman nO 44 paper. Aliquots of
5 ml of the extracts were filtered through a 0.45 /Lm membrane filter (Millex
HV - Millipore) to clarify them.
The purification was carried out applying this solution to a classic short
body cartridge for solid phase extraction Sep-Pak CIS (Millipore - Waters),
which was pretreated with 5 ml of methanol and 5 ml of water. The first 2 ml
eluated were discarded and aliquots of 100 /LI were injected into the
chromatograph.
High Performance Ion Chromatography was carried out under the following
conditions: conductivity detection; eluent, Sodium Borate/Gluconate pH S.5
(conductivity 270 /LS); flow rate, 0.9 mllmin.; chart speed, 0.5 cm/min;
attenuation, 512; gain, 0.01.
RESULTS AND DISCUSSION
Ion Chromatography with conductivity detection is suitable for the
determination of water-soluble inorganic phosphate (IS, 19 Y 20). Figure 1
shows the chromatogram of a standard solution containing 20 /Lg/ml of
dihydrogen phosphate obtained under the chromatographic conditions previously
described in the method.
Linearity and sensitivity of the method were calculated from a series of
standard solutions from 1 to 50 /Lg/ml. Relationship between peak area and

WATER-SOLUBLE INORGANIC PHOSPHATES 993
o 2 4 6 8 10 12 14 16
Time (min)
FIGURE 1: Chromatogram of a standard solution of dihydrogen phosphate (20 j.tg/ml). Conditions: Water IC-Pak HR anion column with Sodium Borate/Gluconate pH = 8.5 eluent; conductivity detection; flow rate: 0.9 ml/min; injection volume: 100 j.tl.
994 RUIZET AL.
dihydrogen phosphate concentration was found to be linear over the I-50 /-tg/ml
concentration range. Equation of the least squares regression line was
y = 0.23 - 0.26 x with a correlation coefficient of 0.999.
The limit of quantitation was 0.6 /-tg/ml allowing a signal noise ratio of 10.
The limit of detection was estimated at 0.2 JLg/ml to a signal noise ratio of 3.
The mean recoveries of standards in the 1-50 /-tg/ml range were 100.5
(a = 4.6; n = 10).
Although Busman et al (14) suggest that the use of Ion Chromatography
with conductivity detection in plant anion analysis was restricted by the presence
of the organic compounds or by the high levels of salts, in the Ion Chromato
graphy method developed in our laboratory and applied to water-soluble
inorganic phosphate determination in aqueous extracts of several fresh
vegetables, no interferences have been found from salts (chloride, nitrite, nitrate,
sulphate) and organic compounds. Figure 2 shows the chromatogram of a
standard solution of Cl-, N02-, NO)-, H2PO.-, SO/ anions, obtained under the
chromatographic conditions described_
Figure 3 shows a typical chromatograms obtained from several samples of
fresh vegetables (tomato, lettuce and marrow), where no chromatographic
interferences can be observed.
Only in samples containing high levels of nitrate, the water-soluble inorganic
phosphate couldn't be correctly quantified because resulting nitrate peak masks
the phosphate peak. Figure 4 shows a chromatogram of a vegetable sample
(chard) with a high nitrate concentration (4,500 /-tg/g), where it can appreciate
that, though the nitrate concentration is very high, the phosphate peak is well
resolved.
Furthermore Grunau et al (17) found that phosphate quantitation in
vegetables aqueous extracts is less precise than other anions, due to the potential
interference from proteins in plant extracts. To minimize the problem we have

WATER-SOLUBLE INORGANIC PHOSPHATES 995
NOi
o 2 4 6 8 10 12 14 16
Time (min)
FIGURE 2: Chromatogram of a mixture of chloride, mtnte, nitrate, dihydrogen phosphate and sulphate standards (2, 4, 4, 6 and 4 respectly) . Conditions: Water IC-Pak HR anion column with Sodium Borate/Gluconate pH = 8.5 eluent; conductivity detection; flow rate: 0.9 ml/min; injection volume: 100 Ill.

996
o 2 4 6 B 10 12 14 16
Time emi")
RUIZET AL.
0)
b)
c)
FIGURE 3: Typical chromatograms obtained from: tomato (a), lettuce (b) and marrow (c); using the proposed chromatographic method.

WATER-SOLUBLE INORGANIC PHOSPHATES 997
o 2 4 6 8 10 12 14 16
Time (min)
FIGURE 4: Chromatogram of a chard sample with high nitrate concentration (4,500 p.g/g), obtained under the chromatographic conditions described.
chosen to desproteinize vegetable extracts routinely by boiling, primarily to
avoid possible interferences and to prevent the column from clogging.
Recovery studies were performed on several fresh vegetable samples by
adding known quantities of dihydrogen phosphate to the sample solution prior
to the initial homogenization step. The results shown on Table 1, indicate that
satisfactory recoveries were achieved for the samples tested.
A total of 76 different commercial fresh vegetable samples were analyzed:
mushroom (8), celery (9), cauliflower (5), tomato (6), marrow (7), chard (8),
onion (11), lettuce (10) and carrot (12). Water-soluble inorganic phosphate
contents are shown on Table 2, where we can appreciate that all analyzed
samples present high concentrations, the maximum amount reached being in the
mushroom samples (mean value: 1,681.3 ± 393.5). In the other vegetable

998 RUIZET AL.
TABLE 1
Percentage Recovery of Water-soluble Inorganic Phosphate from Fresh Vegetables after Extraction and IC Analysis
Food Amount Amount Added Recovered Recovery CV (Ilg/g) (Ilg/g) (%) (%)
Mean ± SD
Chard 20 19.20 ± 1.69 97.20 8.80 (n=lO) 40 41.18±4.12 99.80 10.00
Lettuce 20 19.02 ± 1.58 97.70 8.30 (n=3) 40 40.93 ± 0.59 101.80 1.44
Spinach 20 18.01 ± 1.78 90.2 9.80 (n=3) 40 35.58 ± 1.22 89.2 3.40
Carrot 20 19.61 ± 0.49 98.2 2.49 (n=6) 40 39.99 ± 1.11 97.5 2.84
Marrow 20 20.02 ± 0.38 100.1 1.89 (n=4) 40 39.66 ± 0.58 99.1 1.46
samples analyzed, the mean values found ranged from 623.2 ± 297 .4 (celery)
to 357.5 ± 164.6 (carrot). Similar phosphate concentrations have been found in
lettuce, spinach and tomato by Hertz et al (16).
To sum it up, several characteristics of the proposed method is a useful
analytical technique for the determination of water-soluble inorganic phosphates:
little sample preparation is required; it is not subject to organic, salts or protein
interferences, and the precision of the technique is adequate for routine analysis,
specially when the speed and cost-effectiveness of the method are considered.

WATER-SOLUBLE INORGANIC PHOSPHATES 999
TABLE 2
Water-soluble Inorganic Phosphate Contents in Commercial Samples
Sample n(') Mean SD Range (type) (p,g/g) (p,g/g) (p,g/g)
Mushroom 8 1681.3 393.5 1000-2174
Celery 9 623.2 297.4 222-1200
Cauliflower 5 612.2 246.6 228-925
Tomato 6 574.0 289.9 196-1060
Marrow 7 506.1 201.4 258-825
Chard 8 463.5 214.1 142-800
Onion 11 430.3 116.7 230-630
Lettuce 10 388.7 135.3 230-726
Carrot 12 357.5 164.6 156-608
(.) Duplicate determinations
REFERENCES
1. M. C. Linder, Nutrici6n y Metabolismo de los Elementos Mayoritarios. Nutrici6n: Aspectos Bioquimicos, Metab6licos y Clinicos, Ed. Eunsa, Pamplona, 1988.
2. H. F. Draper, Boll. RR. Adv. Nutr. Research, 2:90, 1980.
3. L. V. Avioli, Ann. Rev. Nutrition, :1:471-491, 1984.
1000 RUIZ ET AL.
4. J. Ritskes Hoinga, J. N. Mathot, J. Nutr., 122:1682-1692, 1992.
5. E. J. Brink, American Institute of Nutrition, 122 (3): 580-586, 1992.
6. P. G. Marais, 1. Deist, R. B. A. Harry, C. F. G. Heyns, Agrochemophysica, 2: 7-12, 1970.
7. Y. Hayasi, K. Tajima, I. Hirono, Eisei Kagaku, 35 (3): 206-211, 1989.
8. A. Ibe, Y. Tamura, H. Kamimura, Ann. Rep. Tokyo Metr. Res. Lab. P. H., 38: 216-221, 1987.
9. C. Matsubara, I. M. Fuji, K. Takamura, Eisei Kagaku, 3.1 (2): 123-127, 1988.
10. G. Graffmann, W. Schneider, L. Dinkioh, Anal. Chern., 301: 364, 1980.
11. L. Campanella, M. Cordatore, Food Chemistry, 44: 291-297, 1992.
12. K. B. Male, J. H. T. Loung, Biosens. Bioelectron., Q (7): 581-587, 1991.
13. M. A. Tabatabai, W. A. Dick, J. Environ. Qual., 12: 209-213, 1983.
14. L. N. Busman, R. P. Dick, M. A. Tabatabai, Soil Sci. Soc. Ann. J., 47: 1167-1170, 1983.
15. L. Brenman, G. Schmuckler, LC-GC INTL, ~ (10): 36-38, 1992.
16. J. Hertz, U. Baltensperger, A. Fresenius, Anal. Chern., ill: 121-123, 1984.
17. J. A. Gronau, J. M. Swiader, Commun. in Soil Sci. Plant Anal., 17 (3): 321-335, 1986.
18. Waters Ion Chromatography Cookbook, Method A-103, 1989.
19. D. S. Ryder, J. Chromatogr., 354: 438, 1986.
20. R. H. Smillie, B. Grant, J. Chromatogr., ill: 253-261, 1988.
Received: July 25,1994 Accepted: October 31, 1994

JOURNAL OF LIQUID CHROMATOGRAPHY, 18(5), 1001-1018 (1995)
EVALUATION OF SULFOPROPYL ION-EXCHANGE MEMBRANE CARTRIDGES FOR ISOLATION OF
PROTEINS FROM BOVINE WHEY
MARCILLE F. ZIETLOWl AND MARK R. ETZEL lh
1 Department of Chemical Engineering 1415 Johnson Drive
2Department of Food Science 1605 Linden Drive
University of Wisconsin Madison, Wisconsin 53706
ABSTRACT
Separated Cheddar cheese whey was micro filtered to remove residual fat, and adjusted to pH 3 prior to loading into two commercially available membrane cartridges. Minerals and non-protein nitrogen did not bind to the membranes. The mass of protein bound to the membranes increased as the loading volume of whey increased, while the percentage of protein isolated from the whey decreased. Not all of the protein bound to the membranes was eluted using pH 9 buffer. An economic analysis was used for comparison of the cartridges.
INTRODUCTION
Over 100 million pounds of whey protein concentrate (WPC) are used annually
as a functional ingredient in bakery, dairy, cereal, beverage and other food
*To whom correspondence should be addressed.
1001
Copyright © 1995 by Marcel Dekker, Inc.

1002 ZIETLOW AND ETZEL
products [1,2]. WPC is produced by ultrafiltration of whey. However, some
undesirable properties of WPC limit its use, such as high lipid and lactose content,
low foam formation, and poor foam stability [3]. These undesirable properties are
nearly eliminated for whey protein isolate (WPI), which is made by adsorption of
whey proteins onto ion-exchange (lEX) beads [3]. However, the cost of WPI is
higher than that of WPC, due primarily to higher capital costs for building the
lEX plant compared to the ultrafiltration plant [4]. In order to market WPI at a
lower cost, either the process efficiency and throughput must be increased, or the
capital cost must be decreased.
In commercial WPI manufacturing, whey proteins are adsorbed into lEX beads
while whey and beads mix in a large stainless steel tank, followed by draining,
washing, and elution of the adsorbed protein. The rate of protein isolation is
limited by the rate at which equilibrium between the whey and the lEX beads is
approached (5). For large beads, this rate is slow because of lengthy diffusion
times of protein into the lEX beads. Smaller beads decrease the diffusion time.
However, these are not used in the commercial process because smaller beads also
increase the time for liquid drainage from the tank.
lEX membranes are a new technology designed to overcome the limitations
encountered in commercial lEX processes [5,6). During adsorption, the whey
passes through the micron-sized pores of the membrane and the proteins adsorb
onto the lEX groups on the membrane surface. Diffusional limitations are
negligible because the whey flows by convection through the fine pores of the
membrane. Therefore, the lEX membrane process is expected to increase
efficiency and throughput compared to the existing lEX processes. Similarities
between lEX and ultrafiltration membrane equipment may permit existing WPC
manufacturers to convert to WPI production without investing in a new plant.
These factors may allow marketing WPI at a lower cost.
In this work, the feasibility of using lEX membranes for WPI production was
investigated. Protein production rates, binding capacities, percentage of recovery,
and processing parameters were evaluated for two membrane cartridges. The
results of this work are useful in establishing the principles underlying the lEX
membrane process, and in designing and operating new, more economical whey
protein isolation and fractionation processes.

PROTEINS FROM BOVINE WHEY 1003
MATERIALS AND METHODS
Microfiltration
Separated (defatted) Cheddar cheese whey (pH 6.2), obtained from Associated
Milk Producers, Inc. (Madison, WI) was cooled to O°C. The whey was
recirculated at 0-4°C through a hollow-fiber microfiltration membrane cartridge
(model CFP-4-D-4, A/G Technology Corp., Needham, MA) containing
polysulfone tubules with a pore size of 0.45 J.lm. The cartridge membrane area
was 0.046 m2. The pumping system consisted of a Masterflex® high-capacity
pump drive (model 7549-30) and pump head (model 7019-00) (Cole Parmer
Instrument Co., Chicago, IL). Raw whey (1500 mL) was recirculated until the
volume was reduced by 50%. The permeate was adjusted to pH 3.0 using 0.375 M
Hel and stored at 4°C. Four separate batches of whey were microfiltered, each
having slightly different compositions.
Protein and Mineral Binding Study
Two commercially-available sulfopropyl strong-acid cation-exchange
membrane cartridges were used to recover the whey proteins. One cartridge
(Productiv® S, model PSCIO-SP) was supplied by BPS Separations, Ltd.
(Spennymoor, County Durham, U.K.). The unit consisted of a stack of 5
regenerated cellulose membranes. The stack had a bed height of 2 cm and a bed
volume of 10 mL. Membrane pore size ranged from 50 to 300 J.lm. According to
the manufacturer, the membrane binding capacity for lysozyme was 1 g.
The other cartridge (MemSep® 1010, model CISP 15H 01) was supplied by
Millipore Corp. (Bedford, MA). The unit consisted of a stack of 72 SP
regenerated cellulose membranes. The stack had a bed height of 1 cm, and a bed
volume of 4.9 mL. The membranes had 85% void porosity, and 1.2 J.lm pore size.
The capacity of the cartridge was reported by the manufacturer to be 2.3 meq, and
the total binding capacity oflysozyme was 75-125 mg.
The protein recovery cycle consisted of equilibration, loading, washing, and
elution. All steps were carried out at a constant flow rate using a Masterflex®
drive (model 7520-25, Cole Parmer Instrument Co., Chicago, IL) and a FMI Lab

1004 ZIETLOW AND ETZEL
Pump Jr.® (model RHOCKC, Fluid Metering, Inc., Oyster Bay, NY).
Equilibration consisted of pumping 10 bed volumes ofthe loading/washing buffer
(L/W buffer) through the cartridge. Loading was accomplished by pumping whey
solution at pH 3.0 through the lEX cartridge to adsorb proteins to the membranes.
The LIW buffer was pumped through the unit to used to wash unbound materials
from the membrane surface. The cycle was completed by pumping elution buffer
(E buffer) through the unit to release bound proteins from the membranes.
When using the Productiv® S cartridge (PSC 1 0), the L/W buffer was 0.1 M
citric acid/sodium citrate pH 3.0, the E buffer was 0.2 M ammonium
hydroxide/ammonium chloride pH 9.0, and the flow rate was 9.4 mUmin (one
bed volume per min). When the MemSep® cartridge (CISP) was used, the LIW
buffer was 0.02 M sodium acetate pH 3.0, the E buffer was 0.375 M Tris buffer
pH 8.8, and the flow rate was 4.7 mUmin (one bed volume per min). The buffers
used with the CISP were vacuum filtered with a 0.2 !lm filter (model 66199,
Gelman Sciences, Inc., Ann Arbor, MI) prior to use.
Cartridges were cleaned after the elution step. Eight bed volumes of 0.2 M
NaOH solution at room temperature were pumped through the cartridge. The
cartridge was then submerged in a 6Q°C water bath. After 1 hr, the cartridge was
backfJushed with another 8 bed volumes of the NaOH while still in the water bath.
The cartridge was then removed from the water bath and backflushed with water
at room temperature until the pH of the effluent was less then 8.0. Cleaning was
completed by backflushing the cartridge with 16 bed volumes of 0.2 M HCI,
followed by water until the pH of the effluent rose above 4. The cartridge was
flushed with two bed volumes of L/W buffer prior to storage.
Cycle progress was monitored by a UV detector with a lO-!lL-volume, 2-mm
lightpath flow cuvette (model 111, Gilson Medical Electronics, Inc., Middleton,
WI) at a wavelength of 280 nm. The detector signal was recorded by a strip-chart
recorder and a datalogger (model 50, Electronic Controls Design, Inc., Milwaukie,
OR).
Seven separate cycles, each using a different loading volume of whey solution,
were performed using the PSClO to investigate the binding of total nitrogen (TN),
non-protein nitrogen (NPN), protein and minerals as a function of the volume of
whey solution loaded. In all these experiments, the volume of whey solution was
loaded into the PSCIO. Then the cartridge was flushed with UW buffer until the
detector signal returned to baseline. The detector signal from one experiment

PROTEINS FROM BOVINE WHEY 1005
using a loading volume of 250 mL was digitized and plotted as percent
absorbance vs effluent volume. The effluent from the cartridge was collected
continuously starting with loading of the whey solution, and ending with flushing
with UW buffer. It was then analyzed for TN, NPN and mineral composition. The
elution peak was also collected and analyzed for mineral composition, and
absorbance at 280 nm to determine total protein. Loading volumes of 10, 20, 30,
50, 100, 150, and 200 mL were used. One cycle using a loading volume of 50 mL
was repeated at a flow rate of 4.7 mUmin. The procedure was repeated using the
same PSClO cartridge and loading volumes of 10, 20, 30, 40, 60, 150, and 250
mL. Four of these loading volumes were duplicates of the first procedure, and
three were new. Only elution peaks were collected and analyzed in the later
procedure.
Next, the amount of protein and minerals recovered in the elution peak as a
function of the volume of whey loaded was determined for the CISP cartridge.
Nine separate cycles were performed using loading volumes of 5, 10, 15,20,30,
50, 75, 100, and 125 mL of whey solution. This procedure was later duplicated
using a different lot number CISP cartridge. The detector signal from the
experiment using a loading volume of 75 mL was digitized and plotted as percent
absorbance vs effluent volume. In each of these experiments, the elution peak was
collected and analyzed for protein and mineral composition.
Protein and Mineral Analyses
The NPN content of raw whey, whey solution, and effluents was determined as
follows: proteins were precipitated by adding 5 mL of 48 % (w/w) trichloroacetic
acid (TCA) solution to 15 mL of sample. Then the Kjeldahl TN content in the
filtrate from TCA precipitation, and in the untreated sample were determined by
the University of Wisconsin Soil and Plant Analysis Laboratory. The total protein
content of each sample was calculated as 6.38x(TN-NPN). The same laboratory
also determined the mineral content of the samples using atomic absorption
spectroscopy.
In order to convert the absorbance at 280 nm for each elution peak to total
protein concentration, a conversion factor was determined by dialyzing six elution
peak samples prior to measurement of total protein content. A 25-mL portion of

1006 ZIE1LOW AND ETZEL
each sample was dialyzed against 0.10 M phosphate buffer, pH 8.8, using 2000
molecular weight cut-off dialysis tubing (SpectraJPor@ 6, Spectrum, Houston,
TX). The TN content of the dialyzed sample was determined, and I part dialyzed
sample was diluted with 9 parts of 0.375 M Tris buffer pH 8.8 before
measurement of the absorbance at 280 nm. Based on the absorbance of each
dialyzed and diluted elution peak sample, and the total protein content calculated
from the TN content, a conversion factor of 0.7 mg protein/mUa.u.lcm was used
to convert the absorbances of the elution peak samples to protein concentration.
RESULTS AND DISCUSSION
M icrofiltration
Loading raw whey directly onto the CISP cartridge created a rapid pressure
increase, probably due to micron-sized particulates such as lipoproteins [7]. For
this reason, the raw whey was microfiltered using a 0.45-llm polysulfone hollow
fiber membrane prior to loading into the cartridges. The turbidity of the permeate
from microfiltration was less than that of the raw whey, probably due to a
reduction in the lipoprotein content.
Raw whey and whey permeate (the whey solutions) were analyzed for protein,
NPN and mineral content to determine if these components were reduced in
concentration by microfiltration. The results of the microfiltration of four separate
raw whey samples are contained in Table 1. The dilution factor which occurred on
adjustment of the pH was used in calculating the original permeate composition.
Based on these data, 70% of the total protein in the raw whey was recovered in
the microfiltration permeate. This value is only moderately lower than the 79-80%
recovery for a metallic microfiltration membrane at 50°C [8]. The permeate
contained 84% of the NPN in the raw whey. Microfiltration did not significantly
reduce the mineral content of the whey. The 30% reduction in total protein
content of the whey due to microfiltration may have resulted from removing
relatively more bovine immunoglobulin G and bovine serum albumin than a
lactalbumin and ~-lactoglobulin from the raw whey [8].

Vol
ume
(mL
)
NP
N(m
g/m
L)
Pro
tein
(T
N-N
PN)x
6.38
(m
g/m
L)
K (
mg/
mL
)
Na
(mg/
mL
)
Ca
(mg/
mL
)
Mg(
mg/
mL
)
t mea
n ±
st. d
ev.,
n =
4
TA
BL
E 1
Eff
ect o
f Mic
rofi
ltrat
ion
on W
hey
Com
posi
tion
Raw
1520
± 3
01
0.5
± 0
.2
6±
1
1.3
± 0
.2
0.37
±0.
02
0.42
± 0
.09
0.07
± 0
.01
Per
mea
te
75
0±
20
0.42
±0.
07
4.2
± 0
.4
1.18
± 0
.05
0.37
± 0
.02
0.38
± 0
.01
0.06
1 ±
0.0
06
"d
~ ~ ~ ~ o ~
to o ~ ~ ...... 8 -..
.J

1008 ZIETLOW AND ETZEL
Optimum pH for Protein Adsorption
In the commercial stirred-tank process, using cationic silica-based resins with
attached sulfonic groups (-S03-), the whey is adjusted to pH 4.5 or lower to
maximize protein adsorption [2,9J. For the lEX membrane process, the highest
protein adsorption occurred at pH 3.0. A decrease in protein binding was observed
when solutions of pH 3.5, 4.0 and 4.5 were used (data not shown). These findings
agree well with those for sulfopropyl ion-exchangers which adsorb whey proteins
efficiently from pH 1.5 to 3.5, with an optimum pH of 3.0 [4, I 0].
Composition of the Effluent when Loading Different Volumes of Whey Solution
Table 2 contains the amount of whey components in the loaded whey solution
and in the effluent solution from the PSCIO cartridge when loading different
volumes. These data were used to determine the degree of binding of each
compound to the membrane. For all seven whey loading volumes, the amounts of
NPN, potassium, calcium, and magnesium contained in the whey solution loaded
into the cartridge nearly equaled the amounts in the effluent solution. Thus, none
of these compounds bound to the membrane cartridge.
The amount of sodium loaded into the membrane cartridge came from both the
whey solution and the LlW buffer. The amount of sodium loaded into the
cartridge nearly equaled the amount in the effluent solution. Thus, sodium was not
significantly retained by the membrane cartridge.
Conversely, amounts of TN and total protein in the whey solution loaded into
the cartridge were substantially greater than amounts in the effluent solution. As
expected, protein strongly bound to the membrane cartridge.
For pure solutions of single proteins, all the protein loaded into an lEX
membrane binds until the saturation capacity is reached, at which point no more
protein is retained [6]. As a result, prior to saturation, the total amount of protein
bound to the cartridge should increase linearly with increasing loading volume.
In Fig. 1, however, the total amount of protein bound to the cartridge P (mg)
generally increased non-linearly with increasing loading volume V (mL). The
protein binding data (solid triangles) were fit by least-squares regression to the
equation:

"tI ~
0 til z en
"r1 ~
TA
BL
E 2
0
Con
tent
s of
Eff
luen
t vs
Loa
ding
Vol
ume
of W
hey
Solu
tion
Usi
ng a
PSC
10 C
artr
idge
~
tc
0 <:
Loa
ding
E
fflu
ent
Prot
ein
>-< Z
tIi
volu
me
volu
me
1N
N
PN
(TN
-NPN
)x6.
38
K
Ca
Mg
Na
~ (m
I.)
(mL)
(m
g)
(mg)
(m
g)
(mg)
(m
g)
(mg)
(m
g)
tIi
r)
E
L E
L
E
L E
L
E
L E
L
E
>-<
10
73
10
I 3
3 42
-1
5 10
13
3
3 79
73
20
58
19
5
6 5
83
4 21
24
7
6 52
52
30
10
1 29
7
10
2 12
5 32
31
36
10
10
2
2 95
82
50
10
7 49
23
16
19
20
8 24
51
59
17
16
3
3 84
76
10
0 16
2 97
45
32
34
41
6 72
10
3 97
34
30
6
5 10
6 12
0 15
0 21
0 14
6 95
48
49
62
4 29
3 15
4 17
0 52
47
9
9 12
1 12
3 20
0 26
0 19
4 13
1 64
74
83
1 36
1 20
6 21
4 69
71
12
12
13
7 13
5 5
0'
81
49
19
16
17
208
15
51
58
17
18
3 3
53
58
tL =
mg
load
ed i
nto
the
mem
bran
e ca
rtri
dge,
E =
mg
in e
fflu
ent s
olut
ion
*f1o
w r
ate
= 4.
7 m
Um
in
......
0 0 \0

1010
500
400
300
200
100
, , ,,'
. .... ,
Loading volume CmL)
"
ZIETLOW AND ETZEL
.' "
•
100
90
80
70
60
FIGURE 1. Protein bound to the PSClO, and protein in the elution peaks for the PSClO and CISP vs the volume of whey solution loaded. Also plotted is the percentage of whey protein loaded which bound to the PSClO. Error bars indicate ± st. dev., n = 2.
resulting in p = 890 mg, and v = 197 mL. The parameter p is the maximum
amount of protein that would bind to the cartridge at infinite loading volume. The
parameter v is the loading volume for binding of 50% of p.
The non-linear behavior of protein bound vs. volume loaded may have resulted
from competitive adsorption for membrane binding sites between the individual
proteins in whey. Competitive adsorption occurs for adsorption of whey proteins
to cation-exchange membranes [6], and for whey protein adsorption to columns
packed with Spherosil S cation-exchange beads [lO].
Using the non-linear fit from Eq. (1), the greatest amount of protein which
bound to the membrane was 450 mg for a loading volume of 200 mL. However,
PROTEINS FROM BOVINE WHEY 1011
as the loading volume increased, a smaller percentage of the protein in the whey
solution loaded bound to the membrane cartridge. Using Eq. (I), the percent
protein recovery was calculated and plotted in Fig. 1. Protein recovery was 87%
or more for loading volumes of 50 mL or less, but it decreased to 54% for the
highest loading volume of 200 mL. Therefore, there was a balance between
operating conditions at one extreme where the percent retention is highest, and the
other extreme where the amount of protein bound to the membrane was highest.
Composition of the Elution Peaks when Loading Different Volumes of Whey
Solution
In these experiments, the amounts of protein and minerals in the elution peaks
were determined after loading 10 to 250 mL of whey solution into the PSCIO
cartridge, and 5 to 125 mL of whey solution into the CISP cartridge. This range of
loading volumes for the PSClO and the CISP was from 1 to 25 bed volumes.
These loading volumes contained from less than 5% to over 100% of the amount
of protein able to bind to the cartridges as reported by the manufacturers.
Tables 3 and 4 contain the protein concentration and the amount of minerals in
the elution peaks for the PSClO and CISP cartridges, respectively. The amounts
of potassium, calcium, and magnesium in the elution peaks were negligible. These
results agree with the results of Table 2, where these minerals were found not to
bind to the cartridge. The amounts of sodium in the elution peaks were relatively
small and constant, but not negligible. The average amount of sodium in the
elution peaks was 25 mg for the PSClO, and 8 mg for the CISP. As mentioned
before, sodium was not retained by the PSCIO cartridge (Table 2). However,
before loading, the membrane cartridge was probably in the sodium form due to
the equilibration step with LIW buffer. The sodium in the elution peak may have
resulted from displacement of this sodium by the elution buffer.
The total amount of protein in the elution peak generally increased with
increasing loading volume for both the PSCIO and CISP (Fig. I). The data were
fit to Eq. (1) resulting in p = 345 mg, and v = 106 mL for the PSCIO (solid
circles), and p = 265 mg, and v = 117 mL for the CISP (solid squares). Using Eq.
(1), the greatest amount of protein eluted from the PSCI0 was 240 mg for a
loading volume of 250 mL (25 bed volumes). For the CISP, 140 mg was eluted

TA
BL
E 3
Con
tent
s of
Elu
tion
Peak
vs
Loa
ding
Vol
ume
of W
hey
Solu
tion
Usi
ng a
PSC
lO C
artr
idge
Loa
ding
E
luan
t
volu
me
volu
me
Prot
ein
K
Ca
Mg
(mL)
(m
L)
(mg/
mL
) (m
g)
(mg)
(m
g)
10
64
±4
' 0.
46 ±
0.0
2 0.
05 ±
0.06
0.
5 ±
0.2
0.
1 ±
0.0
20
54
±0
0.
95 ±
0.0
1 O
.13±
0.04
0.
8 ±
0.2
O
.15±
0.07
30
77
±6
1.
00±
0.0
2 0.
15±
0.0
6 0.
6±0.
0 0.
1 ±
0.0
40
79
1.20
0.
1 0.
3 0.
7
50
67
1.53
0.
2 0.
9 0.
2
60
67
1.90
0.
2 0.
7 0.
1
100
94
1.92
0.
1 0.
3 0.
1
150
93
±4
1.
91 ±
0.0
7 0.
4 ±
0.5
0.
3 ±
0.3
0.1
± 0
.0
200
125
2.07
0.
4 0.
5 0.
1
250
88
2.56
0.
2 0.
4 0.
1
50*
75
1.78
0.
2 1.
0 0.
2
tmea
n ±
st. d
ev.,
n=2
*f1o
w r
ate
= 4
.7 m
Um
in
Na
(mg)
29
±7
27
±5
24±
1
23
21
26
26
27
±4
25
21
30
.....
o .....
N N ~ ::il ~ ~ t11
t""'

TAB
LE 4
Con
tent
s of
Elu
tion
Peak
vs
Loa
ding
Vol
ume
of W
hey
Solu
tion
Usi
ng a
CIS
P C
artr
idge
Loa
ding
E
luan
t
volu
me
volu
me
Prot
ein
K
Ca
Mg
(mL)
(m
L)
(mg/
mL
) (m
g)
(mg)
(m
g)
5 l4
±4
t 0.
6 ±
0.1
0.
6 ±
0.7
0.01
±O
.Ol
0.00
6 ±
0.0
06
10
35
±4
0.
6 ±
0.2
4±
6
1 ±
1
0.2
±0.
3
15
30
±3
1.
0 ±
0.1
4
±5
1
± I
0.2
±0.
3
20
39
±5
1.
0 ±
0.3
2
±2
2
±2
0.
3 ±
0.2
30
42
±4
1.
4± 0
.1
I ±
I 2
±2
0.
25 ±
0.07
50
54.3
± 0
.4
1.5
± 0
.2
2±
2
2±
1
0.34
± 0
.08
75
73 ±
9
1.4
± 0
.1
1.0
± 0
.7
2±
1
0.27
±0.
03
100
81 ±
2
1.4
± O
J 0.
8 ±
0.4
3
±1
00
38 ±
0.0
5
125
116±
7 1.
3± 0
.4
1.3
± 0
.9
2.8
± 0
.4
0.4
± 0
.1
tmea
n ±
sl. d
ev.,
n=2
Na
(mg)
8±
4
8.60
± 0
.02
7.28
±0.
08
7.16
± 0
.02
8±
1
7.6
± 0
.4
9.5
±0.
8
8.0
± 0
.9
9±
1
'"d
:;0
0 til ...... z Vl ;a 0 s:::
to
0 <::
...... Z
tI1 ~ tI1
>< ......
o ......
w
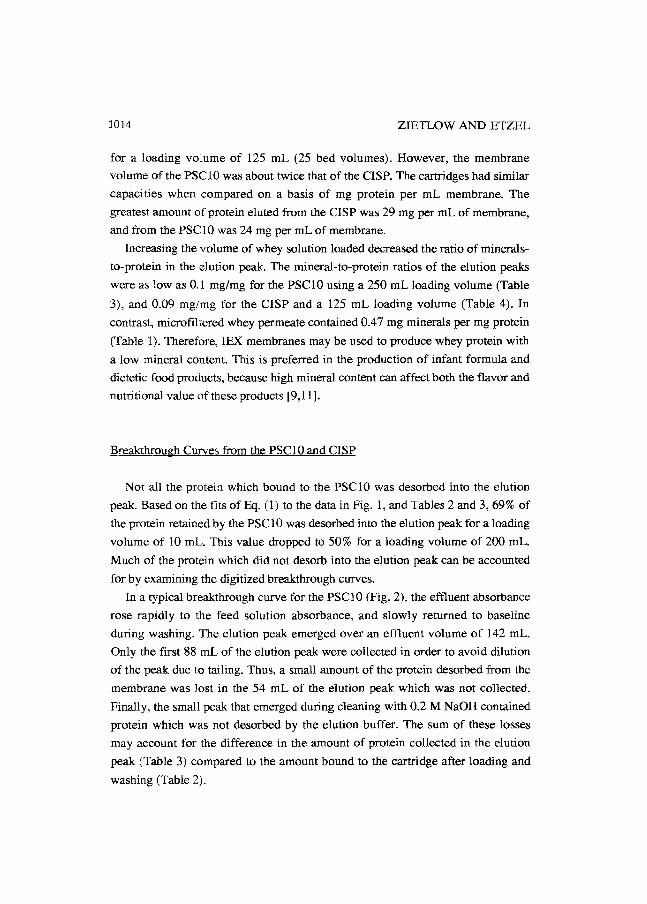
1014 ZIETLOW AND ETZEL
for a loading volume of 125 mL (25 bed volumes). However, the membrane
volume of the PSC 1 0 was about twice that of the CISP. The cartridges had similar
capacities when compared on a basis of mg protein per mL membrane. The
greatest amount of protein eluted from the CISP was 29 mg per mL of membrane,
and from the PSClO was 24 mg per mL of membrane.
Increasing the volume of whey solution loaded decreased the ratio of minerals
to-protein in the elution peak. The mineral-to-protein ratios of the elution peaks
were as low as 0.1 mg/mg for the PSClO using a 250 mL loading volume (Table
3), and 0.09 mg/mg for the CISP and a 125 mL loading volume (Table 4). In
contrast, microfiltered whey permeate contained 0.47 mg minerals per mg protein
(Table 1). Therefore, IEX membranes may be used to produce whey protein with
a low mineral content. This is preferred in the production of infant formula and
dietetic food products, because high mineral content can affect both the flavor and
nutritional value of these products [9,11].
Breakthrough Curves from the PSClO and CISP
Not all the protein which bound to the PSC10 was desorbed into the elution
peak. Based on the fits of Eq. (1) to the data in Fig. 1, and Tables 2 and 3,69% of
the protein retained by the PSC10 was desorbed into the elution peak for a loading
volume of 10 mL. This value dropped to 50% for a loading volume of 200 mL.
Much of the protein which did not desorb into the elution peak can be accounted
for by examining the digitized breakthrough curves.
In a typical breakthrough curve for the PSClO (Fig. 2), the effluent absorbance
rose rapidly to the feed solution absorbance, and slowly returned to baseline
during washing. The elution peak emerged over an effluent volume of 142 mL.
Only the first 88 mL of the elution peak were collected in order to avoid dilution
of the peak due to tailing. Thus, a small amount of the protein desorbed from the
membrane was lost in the 54 mL of the elution peak which was not collected.
Finally, the small peak that emerged during cleaning with 0.2 M NaOH contained
protein which was not desorbed by the elution buffer. The sum of these losses
may account for the difference in the amount of protein collected in the elution
peak (Table 3) compared to the amount bound to the cartridge after loading and
washing (Table 2).
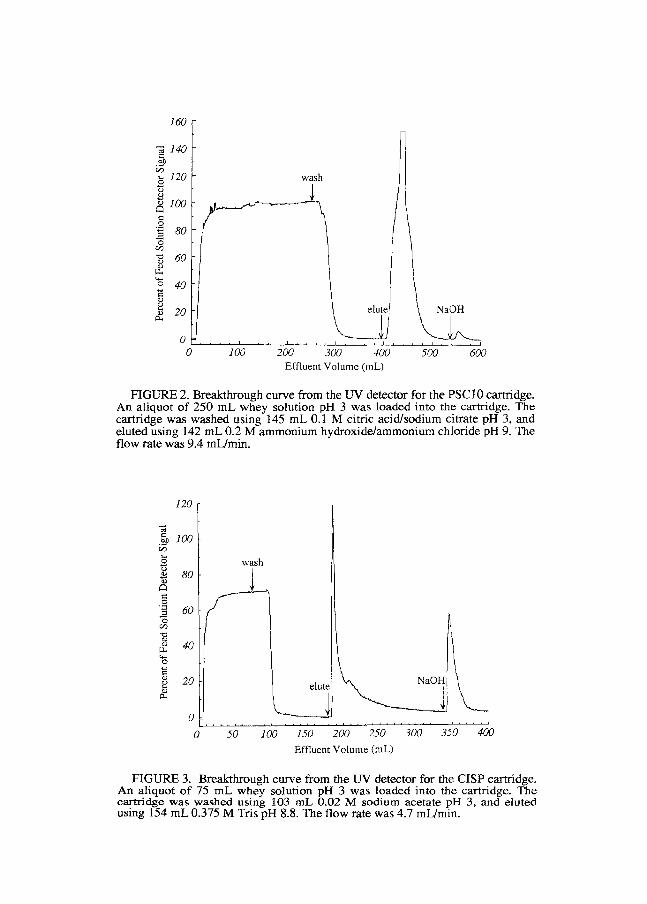
160
0; 140 = .!:Jl
"-' B 120 wash u <lJ
<>100 Q = 0
] 80 0
"-' "0 60 <lJ
<lJ u.. 4-0
C 40
<lJ
~ 20 ~
0 0 100 200 500 600
Effluent Volume (mL)
FIGURE 2. Breakthrough curve from the UV detector for the PSClO cartridge. An aliquot of 250 mL whey solution pH 3 was loaded into the cartridge. The cartridge was washed using 145 mL 0.1 M citric acid/sodium citrate pH 3, and eluted using 142 mL 0.2 M ammonium hydroxide/ammonium chloride pH 9. The flow rate was 9.4 mLlmin.
120
0; = 100 OJ)
[;j ... B wash u
80 B <lJ
Q 1 = 0 . .0 60 .E! 0
"-' "0
<lJ <lJ 40 u..
4-0
C <lJ 20 ~ <lJ
Il.
0
elute
1 0 50 100 150 200 250 300 350 400
Effluent Volume (mL)
FIGURE 3. Breakthrough curve from the UV detector for the CISP cartridge. An aliquot of 75 mL whey solution pH 3 was loaded into the cartridge. The cartridge was washed using 103 mL 0.02 M sodium acetate pH 3, and eluted using 154 mL 0.375 M Tris pH 8.8. The flow rate was 4.7 mLlmin.

1016 ZIETLOW AND ETZEL
In the breakthrough curve for the CISP (Fig. 3), the effluent absorbance
reached a plateau at 70% of the feed solution absorbance, and slowly returned to
baseline during washing. The elution peak emerged over an effluent volume of
154 mL. Because the elution peak had a long tail, only approximately the first 73
mL were collected. Thus, a significant amount of the desorbed protein was lost in
the 81 mL of the elution peak which was not collected. Finally, the peak that
emerged during cleaning with 0.2 M NaOH contained a large amount of protein
which was not desorbed by the elution buffer. Based on the breakthrough curves
in Figs. 2 and 3, the sum of the losses of protein for the CISP appears to be greater
than those for the PSClO.
The failure of the effluent absorbance from the CISP to reach the feed solution
absorbance in Fig. 3 could have resulted from removal of trace amounts of sub
micron particulates from the feed solution. The effluent from the CISP was visibly
less turbid than the feed solution. The effluent absorbance from the PSClO did
reach the feed solution absorbance in Fig. 2. The larger pore size of the PSClO
(50 to 300 J..lm) compared to the CISP (1.2 J..lm) probably resulted in negligible
removal of sub-micron particulates from the feed solution by the PSClO.
Effect of Flow Rate on Protein Recovery from the PSC 1 0
In order to determine if the results depended on flow rate, the cycle using a
loading volume of 50 mL was repeated at 4.7 mL/min, one half the standard
value. From Table 2, none of the NPN or minerals bound to the membrane
cartridge, in agreement with the results from the cycle using the standard flow
rate. Protein binding was 5% higher compared to the cycle using the standard
flow rate. However, this difference was within the normal range of variation of
the results and may not have been significant. From Table 3, the amounts of
minerals in the elution peak were nearly identical to those for the higher flow rate,
in agreement with all previous results on mineral retention. The amount of protein
in the elution peak for the lower flow rate was 30% higher than for the cycle using
the standard flow rate. However, this increase in amount of protein may have
resulted partly from the larger volume of the elution peak collected at the lower
flow rate (Table 3). Three conclusions can be made: (1) NPN and mineral binding
did not depend on flow rate, (2) the NPN and mineral binding data were highly
reproducible, (3) protein binding did not depend strongly on flow rate.

PROTEINS FROM BOVINE WHEY 1017
Economic Considerations
An economic analysis of the two membrane cartridges favors the PSCI O. The
selling price of the PSC 1 0 is 1.2 % of the selling price of the CISP for laboratory
scale cartridges on a per mL of membrane basis. However, the protein binding
capacities of the cartridges are similar on a per mL of membrane basis.
Microfiltration of the whey substantially adds to the overall processing costs
because it reduces the protein content of the whey by 30%, and it involves an
extra processing step. Microfiltration was required for the CISP because direct
loading of whey created a rapid increase in pressure. The larger pore size of the
PSClO (50 to 300 /Jm) compared to the CISP (1.2 /Jm) may allow for direct
loading of whey without microfiltration, and it reduces the pressure drop at a
given flow rate. The pressure drop was 10 psi at 9.4 mUmin for the PSC1O, and
30 psi at 4.9 mUmin for the CISP. Consequently, whey processing costs for the
PSClO may be lower than for the ClSP.
Because of low pressure drops at high flow rates, the cycling times for lEX
membranes would be much shorter than those for commercial stirred-tank
processes, and for packed-column processes, which have cycling times well over
an hour [10]. Shorter cycling times result in more efficient utilization of the lEX
groups on the membrane, which reduces the lEX capacity needed to achieve a
fixed protein output compared to stirred-tank processes. Reduced capacity
demands should translate into reduced capital costs for a new plant, especially if
lEX membranes can be retrofitted into existing ultrafiltration membrane
equipment. Based on these results, lEX membranes are a promising new method
for whey protein isolation.
ACKNOWLEDGMENTS
Funding for this work was provided by the Wisconsin Milk Marketing Board.
Millipore Corp. donated the MemSep® ion-exchange membrane cartridge. Nani
Jamihardja assisted with preliminary research. Shing-Yi Suen provided useful
technical advice while reviewing the manuscript.
1018 ZIE1LOW AND ETZEL
REFERENCES
1. l.N. De Wit, "Functional Properties of Whey Proteins," in Developments in Dairy Chemistry-4. P.F. Fox, ed., Elsevier Applied Science, New York, 1989, pp. 285-322.
2. C.V. Morr, "Whey Proteins: Manufacture," in Developments in Dairy Chemistry-4, P.F. Fox, ed., Elsevier Applied Science, New York, 1989, pp. 245-284.
3. l. Howell, R. Dove, T. Kuwata, "Manufacture and Use of High Protein Whey Products," Proceedings of the ADPI!CDR Dairy Products Technical Conference, Chicago,lllinois, 1990, pp. 43-59.
4. l.S. Ayers, D.P. Elgar, M.J. Petersen, N. Z. l. Dairy Sci. Technol., 21: 21-35 (1986).
5. M.R. Etzel, "Whey Protein Isolation and Fractionation Using Ion Exchangers," in Bioseparation Processes in Foods, R.K. Singh and S.S.H. Rizvi, eds., Marcel Dekker, New York, 1995, (accepted).
6. W.P. Weinbrenner, M.R. Etzel, l. Chromatogr., 662: 418-423 (1994).
7. R.l. Pearce, S.C. Marshall, 1.A. Dunkerley, "Reduction of Lipids in Whey Protein Concentrates by Microfiltration - Effect on Functional Properties," in New Applications of Membrane Processes. IDF Special Issue No. 9201, International Dairy Federation, Brussels, Belgium, 1992, pp. 118-129.
8. C. V. Morr, "Whey Pretreatment and Microfiltration," Proceedings of the Wisconsin Center for Dairy Research! American Dairy Products Institute Whey Protein Workshop, Madison, Wisconsin, 1991, pp. 113-115.
9. K.R. Marshall, "Industrial Isolation of Milk Proteins: Whey Proteins," in Developments in Dairy Chemistry-I. P.F. Fox, ed., Elsevier Applied Science, New York, 1982, pp. 339-373.
10. l.A.l. Schutyser, T.W. Buser, D. van Olden, T. Overeem, I. Liq. Chromatogr., 10: 2151-2175 (1987).
11. W.J. Harper, "Whey Proteins in Food Systems," Proceedings of the Wisconsin Center for Dairy Research!American Dairy Products Institute Whey Protein Workshop, Madison, Wisconsin, 1991, pp. 137-160.
Received: August 16, 1994 Accepted: August 29, 1994

JOURNAL OF LIQUID CHROMATOGRAPHY, 18(5), 1019-1034 (1995)
AN EVALUATION OF THE DIFFERENTIAL PARTITIONING AND SEPARATION OF C60 AND
C70 FULLERENES IN A BIPHASIC SYSTEM USING CENTRIFUGAL PARTITION
CHROMATOGRAPHY (CPC)
MARY P. GASPER, ALAIN BERTHODi, K.ARINE TALABARDONi, AND DANIEL W. ARMSTRONG*
Department of Chemistry University of Missouri-Rolla
Rolla, Missouri 6540]
ABSTRACT
The partition coefficients of C6 0 and C 70 fullerenes were measured in
several different organic, 2-phase (liquid-liquid) systems using centrifugal partition chromatography (CPC). The partition coefficients of C 60 and C70
were sufficiently different in some biphasic solvent systems to provide a
CPC separation of these fullerenes. A phase diagram was made of the best
2-phase system for fractionating C60 and C 70 fullerenes. This system
contained the solvents 1,2-dichlorobenzene, isooctane, and
dimethylformamide (DMF). The separation times, selectivity, and
efficiency are affected by the ratios of the major solvent components, the
addition of small amounts of a quaternary solvent, and the temperature (in
addition to the usual instrumental parameters). Preparative separations of
fullerenes were done and a maximum batch production was calculated for
* To whom correspondence should be addressed
t On leave from Laboratoire des Sciences Analytiques, Vniversite de Lyon-I,
V.A. CNRS 435, 69622 Villeurbanne, France.
1019
Copyright © 1995 by Marcel Dekker, Inc.

1020 GASPER ET AL.
one solvent system. It appears that a significantly greater amount of
fullerenes can be purified per run in this system than in corresponding HPLC systems. The rather unusual organic biphasic solvent systems
developed for the fractionation of fullerenes may be useful for future
separation and purification of more conventional organic compounds.
INTRODUCTION
Fullerene separations have been achieved in high performance liquid
chromatography (HPLC) using several types of stationary phases. Over
fifteen liquid chromatographic stationary phases have been evaluated
including silica gel l -3, alumina4, graphite 5 , monomeric and polymeric
C1s6.10, native and derivatized cyclodextrinslO-ll, gel permeation12.13, and
aromatic charge transfer14-21 stationary phases. To date C60, C70, higher
fullerenes (up to C96 ), fullerene isomers, fullerene derivatives, and most
recently, metal complexed fullerenes have been successfully isolated
chromatographically.1-24 Most of the aforementioned stationary phases can
baseline resolve eGO and C 70 without much difficulty provided the optimum
mobile phase composition for each stationary phase is used. The recent
demand for larger quantities of fullerenes has led to the challenge of
separating fullerenes on a preparative basis. One of the problems in the
area of preparative purification of fullerenes is that they have limited
solubilities in most HPLC eluents. Ruoff et. al. determined that only 0.043 mg/ml of CGIJ can be dissolved in n-hexane, 0.001 mg/ml in ethanol, and 0.00
mg/ml in acetonitrile. 2G Even toluene dissolves only 2.8 mg/ml of C60. 25
Fullerenes are known to be most soluble in chlorinated benzenes, carbon
disulfide, toluene, methylene chloride, and chloroform (in order of
decreasing solubility)25 The better fullerene solvents (CS2, chlorinated
benzenes, etc.) are not often used for HPLC because of their volatility, odor,
viscosity, and toxicity. Although both polar and nonpolar stationary phases
have been used for fullerene separations, the mobile phases are fairly
limited to the less polar solvents. Consequently, even though a reversed
phase stationary phase may be used, typical reversed phase mobile phases
(hydro-organic solvents) cannot be used.
Many early attempts at chromatographically separating fullerenes
on preparative basis involved overloading analytical (25 cm x 0.46 cm) and

C60 AND ~O FULLERENES 1021
semi-preparative (25 em x 1.0 em) length columns. In 1990, Hawkins and
coworkers reported that their semi-preparative 3,5-
dinitrobenzoylphenylglycine (DNBPG) column could only resolve 0.5 mg of
fullerene material per unit injection. 14 Welch and Pirkle later reported that a 1.5 m x 5 em preparative column containing the same DNBPG stationary
phase would separate 100 mg of C60 and C70. 19 In contrast, they indicated
that this stationary phase is capable of normally separating 20 g of a soluble
mixture of more "typical" organic compounds of the same selectivity.
Herren et. al., in 1993, claimed to improve preparative separations for C60
and C70 fullerenes using a chemically bonded
tetrachlorophthalimidopropyl-modified silica (TAPA).17 Approximately 1
mg could be separated per injection. Most of the HPLC stationary phases evaluated for large scale fullerene purifications were found to be
impractical because recovery yields were quite low. Other stationary
phases were found to be very costly because of the large diameter and length
columns needed in addition to the high cost of column hardware. Another
problem with preparative chromatography is the irreversible adsorption
and degradation of some fullerenes when they are associated with the
stationary phase.
Recently, we did a comparison study of the selectivity, resolution,
column deterioration, higher fullerene isolation, and preparative purification (loading ability) of CGO and C70 fullerenes using several
commercial aliphatic and aromatic stationary phases. 10 The general trend
found was that alkyl-chain bonded silica stationary phases seemed to be
best for the analytical separation of fullerenes. Conversely, aromatic
stationary phases were found to be better for purifying fullerenes on a
preparative basis. Between 2.5 and 3 mg of C 60 and C70 were resolved on the
aromatic analytical columns (25 em x 0.46 em) before the solubility of the
fullerenes in the sample solvent exceeded that of the mobile phase. Also
irreversible adsorption of fullerenes or associated degradation products
occurred on all of the columns tested. This results in significant decrease
in column performance for both analytical and preparative applications.
Ideally, the goal of preparative chromatography is to produce the
largest quantity product of the highest purity per unit time while keeping
the production cost low. Column loadability (amount that can be injected
per unit run), to a large extent, is dictated by the peak to peak separation or

1022 GASPER ET AL.
CI. value. 26· 27 The amount that can be injected affects the cost of purification
and, therefore, must be maximized. Numerous factors affect band
broadening In preparative HPLC from the physicochemical chromatographic parameters (i.e., the surface area of the stationary phase,
the temperature, the number of theoretical plates, and the chemical nature
of the mobile phase) to the type of distribution isotherm. 27 In general, if a
compound cannot be separated in a single run under optimum conditions,
the simplest and most routine method for improving the separation involves
increasing the bed length of the column. Guiochon and co-workers have
published a series of related studies on the theory and general optimization
parameters for preparative liquid chromatography.2s.3o
Because of the solubility limitation of fullerenes m common HPLC eluents, it is possible that an optimum separation method for the
purification of fullerenes would involve the principles of liquid-liquid
extraction and incorporate the
convenience of chromatography.
that utilizes these principles.
efficiency, resolving power, speed, and
There is a chromatographic technique
Centrifugal partition chromatography
allows one to do a series of liquid-liquid extractions in the chromatographic
mode. CPC is a variation of countercurrent chromatography. CPC has a
liquid mobile phase and a liquid stationary phase. Consequently, problems
with irreversible; adsorption or degradation by a solid stationary phase are
avoided. The liquid stationary phase is held in place by a centrifugal field while the liquid mobile phase is pumped through it. Detailed descriptions
of the CPC apparatus and theory have been published.31·34 Some of the
more common two phase liquid systems used to separate organic
compounds with the CPC apparatus are hydro-organic and water rich
systems such as octanollwater and methanollhexane/water.35·37
There are several advantages to using CPC over preparative liquid
chromatography such as the increased sample capacity obtained due to the
large stationary phase to mobile phase volume ratio and the elimination of
irreversible retention by use of the dual-mode of elution.31-38 Also, unlike other chromatographic methods, the efficiency of CPC increases at very
high flow rates.:J3 These characteristics makes CPC an ideal large-scale
separation or purification method. The effect of analyte concentration and
injection volume (as a means to increase mass load) in preparative CPC has been evaluated.35 Unlike preparative or analytical HPLC, increasing
the concentration of analyte injected (at constant volume) does not cause a

C60 AND C;o FULLERENES 1023
dramatic decrease in separation efficiency. Hence, in most cases, band
broadening that occurs from column overloading in HPLC is not as
significant in CPC. In order to purify large quantities of compounds by
HPLC, immense preparative columns are required. The only limitation
affecting mass load in CPC is the solubility of fullerenes in the mobile
phase.
In this work, we examine several organic liquid-liquid, two phase systems and evaluate the partitioning behavior of fullerenes in them.
Devising such two phase systems are not always straight forward since
fullerenes are insoluble or very poorly soluble in many of the more popular
chromatographic solvents (e.g., water, methanol, other alcohols,
acetonitrile, etc.) that are used to form liquid biphasic systems. The
fullerenes must be at least somewhat soluble in both liquid phases if the
system is to be used for separations. In addition the partition coefficient (K)
of various fullerenes between the liquid phases must be different. Also, for
large scale separations, the fullerenes must be appreciably soluble in at
least one of the phases. We demonstrate: (1) that fullerenes are amenable to such systems (2) that the selectivity of these systems can be altered or
optimized, and (3) that both separations and partition data can be obtained
in a liquid-liquid countercurrent chromatographic experiment.
EXPERIMENTAL
Materials. Isooctane, hexane, heptane, toluene, acetonit:rile, and
methyl-tert-butyl ether were of HPLC grade and obtained from Fisher
(Pittsburgh, PA). Aldrich Chemical Company (Milwaukee, WI) supplied
the dimethylformamide (DMF), dimethylsulfoxide (DMSO), N-methyl-2-
pyrrolidinone (NMP), y-butyrolactone, decalin, and 1,2-dichlorobenzene.
Pure fullerene standards of C60 and C70 were purchased from either
Polygon Enterprise (Waco, TX), Fluka (Ronkonkoma, NY), or provided by
IBM at the Almaden Research Center (San Jose, CAl.
Apparatus. All chromatographic experiments were performed on a Sanki Laboratories Inc. (Mount Laurel, NJ) Model CPC-NMF centrifugal
partition chromatograph equipped with an adjustable temperature
thermostat (from 15 to 35°C). The following Shimadzu (Columbia, MD)
equipment was also used: two LC-6A pumps, a SPD-6A UVNis variable
wavelength spectrophotometric detector with preparative flow cell, and a

1024 GASPER ET AL.
SCL-6B system controller. The system also included a Rheodyne injector
and switching valve (models 7125 and 7010, respectively) equipped with a 1
ml injection loop. A Recorder Company 4500 series strip chart recorder
(San Marcos, TX) was used to record the data. After elution, the C60 and
C 70 peaks were collected with an Isco Cygnet fraction collector (Lincoln,
NEJ.
The rotor of the CPC apparatus holds up to 12 cartridges although
either 3 or 6 cartridges were used in this study. A complete description of
the cartridges and the CPC system was given previously.32.35-36 Generally the cartridges are filled with the liquid stationary phase at high flow rates.
The centrifugal spin rate is chosen which generates the centrifugal field
and the mobile phase is slowly pumped through. When equilibrium is
e"tablished, the ducts are filled with the mobile phase, the channels are
filled with the stationary phase, and only the mobile phase exits the CPC
apparatus.
The CPC apparatus can be used in the ascending or the descending
elution mode. In the descending mode, the stationary phase is the upper or
less dense liquid and the mobile phase is the more dense liquid phase. In this case, the more dense liquid (i.e., the mobile phase) flows through the
stationary phase from the top of the apparatus to the bottom. When using
the ascending mode the opposite occurs. The most dense liquid becomes the
stationary phase and the less dense liquid is mobile phase which is pumped
up through the instrument from the bottom to the top of the centrifuge.
Both modes were used during the course of this study and are labeled
accordingly in the appropriate tables and figures.
Procedure. Numerous organic liquid systems were evaluated with
small 5 ml batch scale experiments to determine whether biphasic systems
were formed and if they could be used as stationary and mobile phases in CPC. Approximately, 1 mg of fullerenes were dissolved in each liquid
system and sonicated for 10 minutes. 10 ~l of each layer was injected onto a
liquid chromatograph equipped with a Astec C 18 (25 cm x 0.46 cm)
(Whippany, NJ) stationary phase. The peak areas of C 60 and C70 in one
phase were compared to the peak areas of C60 and C70 in the other phase.
The biphasic system giving the largest fullerene concentration difference
between the top and the bottom layers were further evaluated as stationary
and mobile phases for CPC.

C60 AND ~O FULLERENES 1025
All biphasic ternary liquid systems used in CPC were mixed on a
mechanical stirplate for 1 hour and then placed an additional 15 minutes in
a ultrasound bath to ensure complete mutual saturation. The appropriate
number of cartridges (i.e., the column in CPC) were filled at a high flowrate
with the liquid stationary phase in the proper elution mode. With the
centrifuge field spin rate between 700 and 1700 rpm in the opposite elution
mode, the mobile phase was pumped in at a flowrate between 0.2-1.0
ml/min. The system was equilibrated for 1-2 hours or until no more
stationary phase was displaced. The effluent is collected via a graduated cylinder so that the volume of stationary phase displaced can be measured.
Each analysis required only 400 ml of solvent because the mobile phase was
continuously recycled until the beginning of the first peak eluted. The most
frequently used 2-phase organic system was the
isooctane/dimethylformamide/l,2-dichlorobenzene. The more dense
dimethylformamide/l,2-dichlorobenzene layer was used as the stationary
phase while the less dense isooctane/l,2-dichlorobenzene mixture served as
the mobile phase. While this unusual biphasic solvent system was
determined to be an ideal system to differentially solubilize fullerenes, it is
not the best system to use with this model CPC apparatus since it also tends to accentuate the erosion of the graphite disc located within the rotary seals.
Optimum flowrates for this system were between 0.2 and 0.5 ml/min.
Between 50 - 500 ,.11 of a 5 or 15 mg/ml concentration of the C60 and C70
dissolved in 1,2-dichlorobenzene was injected. Detection was set at 384 nm
because Guiochon and co-workers reported that C60 and C70 have the same
extinction coefficients at that wavelength. 9
The ternary phase diagram was determined by weighing specific
amounts of each of the three liquids, vigorously shaking, and then allowing
them to thermally equilibrate for 15 minutes. The solvent system was found
to be biphasic by visual examination of the meniscus. The precise
composition of each phase was ascertained by gas chromatography
utilizing thermal conductivity detection.
RESULTS AND DISCUSSION
Table 1 lists several of the organic, biphasic solvent systems and experimental parameters that were varied to find an optimum liquid-liquid
system to fractionate C60 and C70. Many more solvent systems were
prepared and evaluated than are shown in Table 1. However, little or no

Tab
le 1
. P
arti
tion
Coe
ffic
ient
Det
erm
inat
ion
of C
60 a
nd 0
0 in
Var
ious
Sol
vent
Sys
tem
s
good
FUII~~:::r
:~~ven' S
Y5,e::
r po
or '(:~'
I cK e
'
II ~ 1~IGV~bO V1
f:-J,'
00
C
70
(m')
, (m
l) 'I
IL
--Il
% v
·y _
% v
v
_ _
% v
v
% v
v
_ (m
l) _
(ml)
L-.J
1
lolu
cnfo
! I
I 3
11Cp
l ~DMF
22
0
96
0
96
lG
4
6
24
4
7
j j
I ~-
I 2
lolu
en
e
1 ~
1 D
MS
OI-
----
----
;-0
-I-J
;;-I--
--;-n
~I-~ -,
----
s-~~
1--1
_ _
_,
11----
--1 --
--r-
----
----1
---+
---1
1--
~I~r;;) _
__
__
__
_ '~ _
__
__
-'~
I-"~_~ _~_
"___
6_0 _
_ 2_4_~-
-'
3 d
eca
2 lo
luc'
lo
.! Ol
~lr:
2
Dhl
SO
1
7
76
2
83
8 I
31
2
34
0
30
6
7
I 1
: ::::
~ :::~:~
F ---~:;'
:~ -?D
r,'S
O
--;-
: ~fl
r-;:J~
r-~-:-
~-;~-'
~-,62-
77-~1
----I~
-------
_I _
_ l~_~~~~: _
__
~
02
°'0
\ B
ier ~ _
6 __
!_ ~~ ~~
30
CB
1
0d
eca
BDI,~F
1
7
04
1
II 0
46
~
12
0
11
0
30
6
7
r 1
12
_~-_~_~-
_~==-__ ~-,
~-_:-':-: _--_-
___ :_
:_::;~
-----
::-J~:I-
_~:-5_}_-r
---==~=~=:
--~:~
:: :~ -
r :;~
1 O
C[3
6
!SO
O
'I D
IJF
I
9 2.
08
2.27
7
7 7
3
30
1
27
-'0-C
B--
-,'-,s
o-o-
--2m
:;;:
'5 --2.-33--:;;--43-5---4-,-1~-6-7
1,16
~.~ ~~ -
2 Q
(.,lF
0
l%\·
mIC
I 1
7 .-
--;-
" .-
~;-j
--:_I,,"
1,,6'-1_
''o3,,7-
l_'''B'-
-jI--'6'
'7,->-,
1-'2C'.
2 --I-~-
I O
eD
<1
ISO
O
20
1.W
0
~)O/'"Wi
ller
~? _
_ ~?_I
!~?_
~ _
1_4 7 _
_ ~ ~\~_
2 D
r,1F
I 0
8%
1'I,
llcf
17
2.
13
2.33
7
6
72
3
0
12
71
10
9
20
1§
-~~~-;-;; ~ -1-1-4---'-32-1~~-'-2
2D
11
F I
l~le
CN
15
1
15
12
1 61
5
9
22
67
l' 0
6
~
I 2
0U
' ~--'-5-
2~;-
--;-
;--'
-'-0
-16s
-17-
-671
~ ---
---
---
------
------~--
2D
h1
r 5%
11TI
3E
15
2
29
2
82
1
03
1
18
3
9
67
1
23
C
I "o~
l-~1-
-;~20-
-;;!r-
;;;;-
133
"6
10
67
@
a A a
nd D
cor
resp
ond
to t
he
asce
ndin
g an
d de
scen
ding
mod
e o
f elu
tion
, re
spec
tivel
y. I
n th
e as
cend
ing
mod
e th
e st
atio
nary
pha
se is
the
mor
e de
nse
liqu
id p
hase
an
d th
e m
obile
pha
se i
s th
e le
ss d
ense
liq
uid
laye
r. T
he o
ppos
ite
is t
rue
for
the
desc
endi
ng e
luti
on m
ode
(See
Exp
erim
enta
l).
bn
te s
olve
nt t
hat
diss
olve
s th
e gr
eate
st q
uant
ity
of
Ceo
and
C 70 in
eac
h sy
stem
is
refe
red
to a
s a
IIgo
od"
full
eren
e so
lven
t. "P
oor"
ful
lere
ne s
olve
nts
do n
ot
solu
biliz
e C
oo a
nd C
70, w
here
as "
mod
erat
ell so
lven
ts d
isso
lve
smal
l am
ount
s of
Cao
and
C70
. T
he
abbr
evia
tion
s ar
e as
fol
low
s: h
ept =
hep
tane
, D
MF
= di
m
ethy
lfor
mam
ide,
DM
SO
=
dim
ethy
lsul
foxi
de, d
eca
= de
cali
n, i
soo
= i
sooc
tane
, M
eCN
= a
ceto
nitr
ile,
MT
BE
= m
ethy
l-te
rt-b
utyl
-eth
er,
and
DC
B =
1,2
-di
chlo
robe
nzen
e.
1b
e p
arti
tion
coe
ffic
ient
s (K
=
(ful
lere
nes]
sp/[
full
eren
esjm
p) w
ere
calc
ulat
ed w
ith t
he l
iqui
d la
yer
solu
biliz
ing
the
grea
test
qua
ntit
y o
f fu
ller
enes
as
the
stat
iona
ry p
hase
. d V
r1 a
nd V
r2 a
re t
he r
eten
tion
vol
ume
in m
l o
f C
aD a
nd C
70'
resp
ectiv
ely,
V
0 is
the
vol
ume
(in
ml)
of
the
mob
ile p
hase
and
Vt
is t
he
tota
l vo
lum
e in
ml
of t
he e
pe a
ppar
atus
(w
hich
is
depe
nden
t up
on t
he n
umbe
r of
car
trid
ges
used
).
~e s
elec
tivity
fac
tors
wer
e ca
lcul
ated
by
the
follo
win
g eq
uati
on:
a: =
Kz'K
1'
J-'
o ~ ~ "d m
:;0 ~ ~

C60 AND ~O FULLERENES 1027
fractionation of Cso and C70 was observed in these systems. A few examples
of the "unsuccessful" systems are included in Table 1 for illustrative
purposes (i.e., system numbers 1-3 and 7 in Table 1). In each biphasic,
ternary liquid system, a well known "good" fullerene solvent is combined
with a "moderate" and/or "poor" fullerene solvent. The liquid in each
ternary solvent system that dissolves the greatest quantity of fullerenes is
denoted as the "good" fullerene solvent. Examples of "good" fullerene
solvents are 1,2-dichlorobenzene, decalin, and toluene. The "poor"
fullerene solvents are polar aprotic solvents such as dimethylformamide and dimethylsulfoxide. "Poor" fullerene solvents are necessary in order to
obtain a two phase system and to impart selectivity to the systems. It should
be noted that other polar protic and aprotic solvents such as methanol and
acetonitrile also can be used to form biphasic organic systems with "good"
fullerene solvents. However, these systems are not included since there was little encouraging evidence of fullerene fractionation in the early
studies mentioned previously. The liquid phase in which the fullerenes
were most soluble (Table 1) was always used as the stationary phase.
We previously reported on the use of CPC to determine the partition coefficients of a variety organic compounds in many liquid-liquid two phase
systems.31 The basic CPC retention equation can be rearranged so that the
partition coefficient is easily determined:
K = [(Vr - Vt)/ Vs] + 1 [IJ
where Vr is the retention volume in ml of the compound of interest, Vt is
the total internal volume of the CPC instrument in ml, Vs is the stationary
phase volume in ml, and K is the partition coefficient of the compound
between the stationary phase and the mobile phase. This equation applies
to the ascending elution mode. Therefore, the reciprocal (IlK) is used to
determine the partition coefficient when using the descending mode of elution.
The partition coefficients of Cso and C 70 fullerenes in a large number
of biphasic systems also are shown in Table 1. As can be seen from this
data, the various solvent systems generated a wide variety of partition
coefficients. Hence the partition coefficients of C GO and C70 can be varied
over an order of magnitude if desired. The highest partition coefficient
measured was 8.38 and the lowest was 0.16. There does not appear to be any

1028 GASPER ET AL.
correlation between the size of the fullerene's partition coefficient (K) and
their selectivity (i.e., the a-values in Table 1). For example, system 4 which
yields larger partition coefficients does not necessarily provide any greater
selectivity than system 12 which gives small partition coefficient values.
Systems 1 through 12 are representative of the initial experiments in which
we hoped to find a "highly" selective system for the fullerenes. The 1,2-
dichlorobenzenelisooctanelDMF solvent combination in trial 10 afforded the largest selectivity value for any three component system tested. However, as can be seen from the data in Table 1, adding small amounts of additional
components or modifiers can cause the a values to change. Hence
attempts were made to improve the selectivity and/or efficiency by adding
different minor components. For example, the 1,2-
dichlorobenzenelisooctane/DMF biphasic system is sensitive to small
amounts of water. In trials 14-16, the ratio of water was varied from 0.1
percent to just under 1 percent. No basic trends were observed when
attempting to improve selectivity by adding either small or large increments
of water. The optimum water amount was found to be 0.5 % and provided
an a-value of l.23. Small quantities of methyl-tert-butyl-ether was added to
the 1,2-dichlorobenzene/isooctane/dimethylformamide system as well. A trend similar to that for water was observed. The optimum methyl-tert
butyl-ether content was found to be between 0.5 % and 5 %. 1 % of methyl
tert-butyl-ether added to the previously determined optimum biphasic
system and gave the largest selectivity value in this study (system 18, Table
1). Methyl-tert-butyl ether was chosen because it greatly enhanced the
separation efficiency of monoterpenes hydrocarbons in reverse phase liquid
chromatography.:39 It was one of the few additives studied that also seemed
to enhance the efficiency of the fullerene separation.
In some cases, changing the temperature appeared to alter the retention and selectivity of the fullerenes (Table 1). Unlike HPLC, the
mobile and stationary phase in CPC can alter their composition with a
change in temperature (see the ternary phase diagram in Figure 1). As
discussed in the preceding paragraph, even a small change in solvent
composition can significantly affect the elution of fullerenes. Consequently
the influence of temperature on retention and selectivity (ex) is not as
straight-forward in CPC as it is in HPLC (where the stationary and mobile
phase composition do not change with temperature). Since the solvent
composition and temperature effects are coupled in CPC, there is no way to

20
60 -10
\
40 (f (' ,60 ----------.
80 6() 40 20
Dimclhy Il'orl11umid ~
Figure 1.
o
Figure 2.
Ternary mass phase diagram for the isooctane/dimethylformamide/ 1,2-dichlorobenzene system at two temperatures, 0 oC the dotted curve and 20 oC the darkened curve. The region above the temperature curves indicates the miscible monophasic area and the region below designates the region where two layers are formed or the biphasic solution region. The tie lines were established for the 5 different chemical compositions shown in Table 2 at 20 DC.
5 12 T [ [.[ E, [I R S.
CPC ascending mode chromatogram showing the separation between C60 and C70 . The conditions were as follows: solvent system = 4:2:1 isooctanelDMFIDCB (v/v/v) + 1% MTBE; the isooctane-rich mobile phase ascended; flowrate 0.3 mllmin; rotation rate 1000 rpm; cartidge number 3; wavelength 384 nm; temperature 15 oC, injected volume 150 fll of a 15 mg/ml solution; and charts peed 2 cmlhr.

1030 GASPER ET AL.
predict a priori whether lowering the temperature will increase selectivity
(a) and retention. However, the best separation in this work was obtained at
15°C as opposed to higher temperatures (Experiment 18, Table 1, and
Figure 2).
The ternary mass diagram for the isooctane/DMF/l,2-
dichlorobenzene solvent system (the "optimum" system as determined from
the data in Table 1) is found in Figure 1. The regions above the dashed and
solid curved lines designates the monophasic area or homogeneous region
(for the respective temperatures). Obviously these solvent compositions
would be useless for any separation by countercurrent chromatography or liquid-liquid extraction. The region below the solid and dashed curved lines
corresponds to the biphasic region which is suitable for the CPC apparatus.
The dashed line designates the biphasic boundary at 0 DC and the solid line
indicates the biphasic boundary at 20 DC. The tie lines are calculated
according to the lever rule which is described in detail elsewhere.37 These
tie lines allow one to precisely quantitate the composition of the two phases
obtained when ternary liquids become saturated with one another. As can
be seen, the 1,2-dichlorobenzene partitions almost equally between the
upper and lower phases. The exact compositions of the tie lines (in mass
percentages or g/100g) of the two phase liquid-liquid mixtures are found in
Table 2. The optimum solvent composition that was the focus of most of this study is indicated by point one. The composition is 46.4% isooctane, 31.7%
DMF, and 21.9 % 1,2-dichlorobenzene (w/w).
The ternary phase diagram also shows that the waterless
isooctane/DMF/l,2-dichlorobenzene system used is critically temperature
dependent. It was observed that the two phases in this system become
homogeneous at temperatures _ 30 DC. As noted in the experimental
section, the lower (more dense) layer of this biphasic system consists
mainly of DMF and 1,2-dichlorobenzene. The denser lower layer dissolves
fullerenes better than the isooctane-rich upper layer. The fullerene
partition coefficients (Ks) are higher than 2.0 (See Table 1). Therefore,
when the two phases are equilibrated, the fullerer,e concentration is more
than 2 times greater in the lower DMF-rich stationary phase than in the
upper isooctane-l,2-dichlorobenzene mobile phase. When this system is
warmed, the bottom layer increases in volume at the expense of the top
layer. This decreases the difference in the C60 and C 70 partition coefficients

C60 AND ~O FULLERENES
Table 2. Chemical ComposItIOn of Ternary Phase Diagram Tie Lmes
POInt" I
DeB I
Isoctane I
DMF I
Soiubl!JZ3.tlOn
% w/w % w/w S"o w/w Tcmpcratur<: 'cb
1 ! 21.9 I 46.4 31.7 I 31
2 I 15 I 51 34 I 56 I
3 I 10 I 53 :n 60
4 I 5 i 56 39 67
5 I 0 I 60 40 75
0. Numbers correspond to the those on Figure 1 (ternary phase diagram) Pomt 1 refers to the volume ratio 1:4.2 DCB/isooctanelDMF (V/V/VI.
b The biphasic system becomes monophasic at the solublization temperature.
1031
although both fullerenes are still more soluble in the lower DMF-1,2-
dichlorobenzene phase. Temperature changes also are known to alter the
physicochemical properties of liquids including their density, viscosity,
vapor pressure, and the partition coefficients of dissolved solutes.31,33,37-38
All of these factors previously have been shown to affect CPC separations.
A model has been developed by Cretier and Rocca which enables one
to predict the maximum sample capacity on a given preparative silica based
packed stationary phase.40-41 We have used an analogous model for CPC.35
It was extended so that one can estimate the maximum injection volume,
V max, in CPC, taking into account peak symmetry and the absence of mass
overload by:
V max = Vr2 - Vrl- [(W2 + WI) / 2] [2]
where Vr is the retention volume, W is the width of the peak at the base,
and the subscripts 1 and 2 corresponds to C60 and C 70, respectively.35 Using
the retention volume data from Figure 2 and solving for Vrnax , one obtains:
V max = 164.6 ml - 117.6 ml- [(37.8 ml + 36.9 ml) / 2] = 9.65 ml [3]
Therefore, the maximum amount that can be separated as indicated
by equation 3 is 144.8 mg (9.65 ml x 15 mg/mll of a fullerene solution with
100 % recovery and purity per run. The above calculation was done using data generated with 3 cartridges, however, up to 12 cartridges can be loaded

1032 GASPER ET AL.
into the CPC apparatus. Therefore, theoretically the quantity of fullerenes can be further increased provided the pressure limits of the system are not
exceeded and the allowed degree of peak overlap does not change.
CONCLUSIONS
It is possible to formulate a variety of different liquid, organic, biphasic solvent systems that can be used to fractionate fullerenes. When
used in conjunction with centrifugal partition chromatography (a type of
countercurrent chromatography) one can measure partition coefficients
and carry out preparative-scale separations. The current CPC separation can purify approximately 50 times the amount of fullerenes (per batch) as
compared to previously reported HPLC methods. The relative mildness of this technique could make it useful in isolating greater percentages of the
more labile fullerenes such as those containing metals. These novel liquidliquid systems may be useful for separating more conventional organic
compounds as well.
ACKNOWLEDGEMENT
Support of this work by the Department of Energy, Offices of Basic Science (DE FG02 88ER13819) and IBM are gratefully acknowledged.
REFERENCES
1. F. Diederich, RL. Whetten, Acc. Chem. Res., 25: 119 (1992)
2. H. Ajie, H.M. Alvarez, S.J. Anz, RD. Beck, R Diederich, K Fostiropoulos, D.R Huffman, W. Kratschmer, Y. Rubin, KE. Schriver, D. Sensharma, RL. Whetten, J. Phys. Chem., 94: 8630 (1990)
3. F. Diederich, F. Ettl, Y. Rubin, RL. Whetten, R Beak, M. Alvarez, S. Anz, D. Sensharma, F. Wudl, KC. Khemani, A. Koch, Science, 252: 548 (1991)
4. P. Bhyrappa, A. Penicaud, M. Kawamoto, C.A. Reed, J. Chem. Soc. Chemn. Commun., 936 (1992)
5. A.M. Vassallo, A.J. Palmisano, S.K Pang, M.A. Wilson, J. Chem Soc., Chem. Commun., 60 (1992)
6. F. Diederich, RL. Whetten, C. Thilgen, F. Ettl, I. Choa, M. Alvarez, Science, 254: 1768 (1991)

C60 AND ~O FULLERENES 1033
7. J.F. Anacleto, M.A. Quilliam, Anal. Chem., 65: 2236 (1993)
8. K. Jinno, T. Vemura, H. Ohta, H. Nagashima, K. Itoh, Anal. Chem., 63: 2650 (1993)
9. M. Diack, RL. Hettich, RN. Compton, G. Guiochon, Anal. Chem., 64: 2143 (1992)
10. M.P. Gasper, D.W. Armstrong, J. Liq. Chromatogr., in press.
11. K. Cabrera, G. Wieland, M. Schafer, J. Chromatogr., 644: 396 (1993)
12. M.S. Meier, J.P. Selegue, J. Org. Chem., 57: 1924 (1990)
13. A. Gugel, M. Becker, D. Hammel, L. Mindach, J. Rader, T. Simon, M. Wagmer, K. Mullen, Angew. Chem., Int. Ed. Engl., 31(5): 644 (1992)
14. J.M. Hawkins, T.A. Lewis, S.D. Loren, A. Meyer, J.R Heath, Y. Shibato, RJ. Saykally, J. Org. Chem., 55: 6250 (1990)
15. D.M. Cox, S. Behal, M. Disko, S.M. Gorun, M. Greaney, C.S. Hsu, E.B. Killin, J. Miller, J. Robbins, W. Robbins, RD. Sherwood, P. Tindall, J. Am. Chem. Soc., 113: 2940 (1991)
16. K. Jinno, K. Yamamoto, T. Veda, H. Nagashima, K. Itoh, J.C. Fetzer, W.R Giggs, J. Chromatogr., 594: 105 (1992)
17. D. Herren, C. Thilgen, G. Calzanferri, F. Diederich, J. Chromatogr., 644: 188 (1993)
18. M. Diack, RN. Compton, G. Guiochon, J. Chromatogr., 639: 129 (1993)
19. W.H. Pirkle, C.J. Welch, J. Org. Chem., 56: 6973 (1991)
20. C.J. Welch, W.H. Pirkle, J. Chromatogr., 609: 89 (1992)
21. C.E. Kibbey, M.R Savina, B.K. Parseghian, P.H. Francis, M.E. Meyerhoff, Anal. Chem., 65: 3717 (1993)
22. H. Shinohara, H. Yamaguchi, N. Hayshi, H. Sato, M. Ohkohchi, Y. Ando, Y. Saito, J. of Phy. Chem., 97: 4259 (1993)
23. S. Stevenson, H.C. Dorn, P. Burbank, K. Harich, J. Haynes, Jr., C.H. Kiang, J.R Salem, M.S. DeVries, P.H.M. van Loosdrecht, RD. Johnson, C.S. Yannoni, D.S. Bethune, Anal. Chem., 66: 2675 (1994)
24. S. Stevenson, H.C. Dorn, P. Burbank, K. Harich, Z. Sun, C.H. Kiang, J.R Salem, M.S. DeVries, P.H.M. van Loosedrecht, RD. Johnson, C.S. Yannoni, D.S. Bethune, Anal. Chem., 66: 2680 (1994)

1034 GASPER ET AL.
25. RS. Ruoff, D. Tae, R Malhotra, D.C. Lorents, J. Phys. Chem., 97(13): 3379 (1993)
26. M. Verzele, Anal. Chem., 62: 265A (1990)
27. H. Colin, Large-Scale High-Performance Preparative Liquid Chromatgraphy in Preparative and Production Scale Chromatography, Marcel Dekker, Eds. G. Ganetsos, P.E. Barker, New York, 1993, Ch. 2, p. 11-45.
28. A. Katti, G. Guiochon, Anal. Chem., 61: 982 (1989)
39. S. Golshan-Shirazi, G. Guiochon, Anal. Chem., 61: 1368 (1989)
30. G. Guiochon, S. Ghodbane, J. Phys. Chem., 92: 3682 (1988)
31. D.W. Armstrong, J. af Liq. Chramatgraphy, 11(12): 2433 (1988)
32. A. Berthod, D.W. Armstrong, J. af Liq. Chromatagr., 11(3): 54 (1988)
33. D.W. Armstrong, G.L. Bertrand, A. Berthod, Anal. Chem., 60: 2513 (1988)
34. RA. Menges, L.A. Spino, D.W. Armstrong, Anal. Chem., 65: 2873 (1993)
35. A. Berthod, D.W. Armstrong, J. af Liq. Chromatagr., 11(6): 1187 (1988)
36. A. Berthod, Y. Han, D.W. Armstong, J. af Liq. Chramatagr., 11(7): 1441 (1988)
37. A. Berthod, J.D. Duncan, D.W. Armstrong, J. af Liq. Chromatagr., 11(6): 1171 (1988)
38. A. Berthod, D.W. Armstrong, J. af Liq. Chramatagr., 11(7): 1457 (1988)
39. D.W. Armstrong, J. Zukowski, J. afChramatagr. A, 666: 445 (1994)
40. G. Cretier, J.L. Rocca, Chromatagraphia, 21: 143 (1986)
41. G. Cretier, J.L. Rocca, Chromatagraphia, 20: 461 (1985)
Received: December 1, 1994 Accepted: December 11, 1994

JOURNAL OF LIQUID CHROMATOGRAPHY, 18(5), 1035-1036 (1995)
MEETING REPORT
SIXTEENTH INTERNATIONAL SYMPOSIUM ON CAPILLARY CHROMATOGRAPHY
September 27-30, 1994 Riva del Garda, Italy
The above symposium, which was held at the Palazzo dei Congressi in Riva, on the shores of Lake Garda, was a highly successful one. It was attended by about 700 conferees. The conference opened with a welcoming address by Professor Pat Sandra (Chairman), then the presentation of the Golay Award to Professor JW. Jorgenson (well deserved), followed by an award address entitled, "Microcolumn Separations and Complex Mixture Analysis," which was clearly presented and well received.
The presentations were divided into plenary lectures, oral presentations, workshops, seminars and poster presentations There were a total of 37 lectures, dealing with different microcolumn separations (GC, LC, CE and SFC). Over 370 posters were divided into a) General Theory; b) Column Technology - Stationary Phases; c) Environmental Applications; d) Natural Products and Food Research; e) Biomedical and Pharmaceutical Applications; f) Industrial Applications; g) Sampling and Trace Analysis; h) Multidimensional and Hyphenated Techniques; i) Micro LC and Applications; j) SFC and Applications, k) SFE and Applications; I) Electromigration Methods and Applications; and m) Last Minute Contributions.
The combination of a few lectures in a session allowed ample time for poster viewing and discussion among the conferees. Overall, the meeting was very successful and Professor Sandra and the Scientific Committee and organizers should be comnlended on a job well done.
Next year's conference will be held in the United States on May 7-11, 1995 at Wintergreen in a most beautiful setting in Virginia For information, contact the Symposium Coordinator, Joy Wise, PO Box 4153, Frederick, Maryland 21705-4153 or Dr. Milton L Lee (Chairman), Brigham Young University, Provo, Utah 84602-4672 All those who are
1035

1036 MEETING REPORT
interested in micro separations, be it GC, HPLC, SFC, SFE or CE should attend this important scientific and truly international conference.
The 18th Conference will be held again in Riva on May 20-24, 1996
Reviewed by Haleem 1. Issaq, PhD Associate Editor

JOURNAL OF LIQUID CHROMATOGRAPHY, 18(5), 1037-1038 (1995)
THE BOOK CORNER
ADVANCES IN CHROMATOGRAPHY, Volume 34, Edited by PRo Brown and E. Grushka, Marcel Dekker, Inc., New York, NY, 456 pages, 1994. Price $165.00.
The present volume of this excellent and prestigious series is made up of seven chapters, written by experts in their respective areas. Although the series is entitled, "Advances in Chromatography," Volume 34 contains two chapters dealing with capillary electrophoresis (CE), which is an electromigration separation technique. In the future, we will probably see more and more reviews dealing with this new and powerful microseparation technique with an efficiency exceeding one million theoretical plates. The two CE chapters selected deal with very important topics: serum and plasma proteins, and carbohydrates. These two reviews give a wealth of information and are well written and illustrated.
The other 5 chapters are well balanced Chapters 3 and 7 are theoretical representations of peak overlap and optimization of quantitative analysis in separation science. Chapter 2 deals with analysis of natural products, which is a very interesting and important topic, considering the fact that many modern drugs and pharmaceuticals are the result of natural products research. Another interesting topic is discussed in Chapter 5, which deals with environmental applications of supercritical fluid chromatography, a technique which did not perform commercially and is not as well accepted as it should have been. However, its use in the analysis of environmental samples is useful and should be encouraged. Chapter 6 deals with the HPLC separation of organic ions. A discussion of reversed phase,
ion-exchange, and ion-exclusion is given, with excellent illustrations including figures, tables and up-to-date references.
Volume 34 is a welcome addition to the separation science library. In light of the success of CE, may we recommend to the editors to change the title of the series to " Advances in Chromatography and Electrophoresis."
Table of Contents:
High-Performance Capillary Electrophoresis of Human Serum and Plasma Proteins, 0 W. Reif, R. Lausch and R. Freitag, (J)
1037

1038 THE BOOK CORNER
2. Analysis of Natural Products by Gas ChromatographylMatrix IsolationlInfrared Spectrometry, W M. Coleman III and B. M. Gordon, (57).
3. Statistical Theories of Peak Overlap in Chromatography, 1. M. Davis, (109).
4. Capillary Electrophoresis of Carbohydrates, Z. EI Rassi, (177).
5. Environmental Applications of Supercritical Fluid Chromatography, L. 1. Mulcahey, C L. Rankin and M. E. P. McNally, (251).
6. HPLC of Homologous Series of Simple Organic Anions and Cations, N. E. Hoffinan, (309).
7. Uncertainty Structure, Information Theory, and Optimization of Quantitative Analysis in Separation Science, Y. Hayashi and R Matsuda, (347).
Reviewed by Haleem 1. Issaq Ncr-Frederick Cancer Research Center Frederick, Maryland 21701-1201

JOURNAL OF LIQUID CHROMATOGRAPHY, 18(5), 1039 (1995)
ANNOUNCEMENT
BASIC PRINCIPLES OF HPLC and
HPLC SYSTEM TROUBLESHOOTING
One-Day & Two-Day In-House Training Courses
The courses, which are offered for presentation at corporate laboratories, are aimed at chemists and technicians who work with HPLC. They cover HPLC fundamentals and method development, as well as systematic diagnosis and solution of HPLC module and system problems.
The following topics are covered in depth:
• Introduction to HPLC Theory • Modes of HPLC Separation
• Developing and Controlling Resolution • Mobile Phase Selection & Optimization
• Ion-Pairing Principles • Gradient Elution Techniques
• Calibration & Quantitation • Logical HPLC Troubleshooting
The instructor for the courses, Dr. Jack Cazes, is Editor-in-Chief of the Journal of Liquid Chromatography, of Instrumentation Science & Technology journal, and of the Chromatographic Science Book Series. He has been intimately involved with liquid chromatography for more than 30 years; he pioneered the development of modern HPLC technology. Dr. Cazes was also Professor-inCharge of the ACS short course and the ACS audio course on Gel Permeation Chromatography for many years.
Details of these in-house courses may be obtained from Dr. Jack Cazes, Post Office Box 2180, Cherry Hill, NJ 08034-0162, USA; Tel (609) 424-3505; FAX: (609) 751-8724.
1039

JOURNAL OF LIQUID CHROMATOGRAPHY, 18(5), 1041-1046 (1995)
LIQUID CHROMATOGRAPHY CALENDAR
1995
FEBRUARY 13 - 15: PrepTech '95, Sheraton Meadowlands Hotel, East Rutherford, New Jersey. Contact: Dr. Brian Howard, ISC Technical Conferences, Inc., 30 Controls Drive, Shelton, CT 06484-0559, USA
MARCH 6 - 10: PittCon'95: Pittsburgh Conference on Analytical Chemistry & Applied Spectroscopy, New Orleans, Louisiana. Contact: Pittsburgh Conference, Suite 332, 300 Penn Center Blvd., Pittsburgh, PA 15235-9962, USA
APRIL 2 - 7: 209th ACS National Meeting, Anaheim, Calif Contact: ACS Meetings, ACS, 1155 16th Street, NW, Washington, DC 20036-4899, USA
MAY 21: Techniques for Polymer Analysis and Characterization, a short course, Sanibel Island, Florida. Contact: ISPAC Registration, 815 Don Gaspar, Santa Fe, NM 87501, USA
MA Y 22 - 24: 8th International Symposium on Polymer Analysis and Characterization, Sanibel Island, Florida. Contact: ISPAC Registration, 815 Don Gaspar, Santa Fe, NM 87501, USA
APRIL 25 - 28: Biochemische Analytik '95, Leipzig Contact: Prof Dr. H. feldmann, Inst. fur Physiologische Chemie der Universitat, Goethestrasse 33, D-80336 Munchen, Germany.
MAY 23: Miniaturization in Liquid Chromatography versus Capillary Electrophoresis, Pharmaceutical Institute, University of Ghent, Ghent, Belgium. Contact: Dr. W. R. G. Baeyens, Univ of Ghent, Pharmaceutical Inst, Harelbekestraat 72, B-9000 Ghent, Belgium.
1041

1042 LIQUID CHROMATOGRAPHY CALENDAR
MAY 28 - JUNE 2: HPLC' 95, 19th International Symposium on Column Liquid Chromatography, Convention Center, Innsbruck, Austria. Contact: HPLC'95 Secretariat, Tyrol Congress, Marktgraben 2, A-6020 Innsbruck, Austria.
MAY 31 - JUNE 2: 27th Central Regional Meeting, ACS, Akron Section. Contact 1 Visintainer, Goodyear Research, D415A, 142 Goodyear Blvd, Akron, OH 44236, USA
JUNE 6 - 8: 28th Great Lakes Regional ACS Meeting, LaCrosse-Winona Section. Contact: M. Collins, Chern. Dept., Viterbo College, La Crosse, WI 54601, USA
JUNE 11 - 14: 1995 International Symposium and Exhibit on Preparative Chromatography, Washington, DC. Contact: Janet Cunningham, Barr Enterprises, P. 0 Box 279, Walkersville, MD 21793, USA
JUNE 13 - 16: Capillary Electrophoresis, Routine Method for the Quality Control of Drugs: Practical Approach (in English); L'Electrophorese Capillaire, Methode de Routine pour Ie Controle de Qualite des Medicaments: Approche Pratique (in French), Monpellier, France. Contact: Prof. H. Fabre, Lab. de Chimie Analytique, Inst. Europeen des Sciences Pharmaceutiques Industrielles de Montpellier, Ave. Charles Flahault, 34060 Montpellier Cedex 1, France.
JUNE 14 - 16: 50th Northwest/12th Rocky Mountain Regional Meeting, ACS, Park City, Utah. Contact: 1 Boerio-Goates, Chern Dept, 139C-ESC, Brigham Young Univ, Provo, UT 84602, USA
JULY 9 - 15: SAC'95, The University of Hull, UK, sponsored by the Analytical Division, The Royal Society of Chemistry. Contact: The Royal Society of Chemistry, Burlington House, Picadilly, London WIV OBN, UK.
JULY 7 - 8: FFF Workshop, University of Utah, Salt Lake City, UT. Contact: Ms. Julie Westwood, FFF Research Center, Dept. of Chern., University of Utah, Salt Lake City, UT 84112, USA
JULY 10 - 12: FFF'95, Fifth International Symposium on Field-Flow Fractionation, Park City, Utah. Contact: Ms. Julie Westwood, FFF Researcvh Center, Dept. of Chern. Univ of Utah, Salt Lake City, UT 84112, USA
AUGUST 20 - 25: 210th ACS National Meeting, Chicago, Illinois. Contact: ACS Meetings, ACS, 1155 16th Street, NW, Washington, DC 20036-4899, USA

LIQUID CHROMATOGRAPHY CALENDAR 1043
SEPTEMBER 4 - 7: 13th International Symposium on Biomedical Applications of Chromatography and Electrophoresis and International Symposium on the Applications of HPLC in Enzyme Chemistry, Prague, Czech Republic. Contact: Prof Z. Dey1, Institute of Physiology, Videnska 1083, CZ-14220 Prague 4, Czech Republic.
SEPTEMBER 12 - 15: 5th International Symposium on Drug Analysis, Leuven, Belgium. Contact: Prof J. Hoogmartens, Inst. of Pharmaceutical Sciences, Van Evenstraat 4, B-3000 Leuven, Belgium
OCTOBER 18 - 21: 31st Western Regional Meeting, ACS, San Diego, Calif. Contact: S Blackburn, General Dynamics, P. O. Box 179094, San Diego, CA
92177-2094, USA.
OCTOBER 22 - 25: 25th Northeastern Regional Meeting, ACS, Rochester, New York Contact: T. Smith, Xerox Corp, Webster Res Center, MIS 0128-28E, 800 Phillips Rd, Webster, NY 14580, USA.
NOVEMBER 1 - 3: 30th Midwestern Regional ACS Meeting, Joplin, Missouri. Contact: J. H. Adams, 1519 Washington Dr., Miami, OK 74354-3854, USA.
NOVEMBER 1 - 4: 31st Western Regional ACS Meeting, San Diego, California. Contact: T. Lobi, Tanabe Research Labs, 4450 Town Center Ct, San Diego, CA 92121, USA.
NOVEMBER 5 - 7: 30th Midwestern Regional Meeting, ACS, Joplin, Missouri. Contact: 1. H. Adams, 1519 Washington Dr, Miami, OK 74354, USA.
NOVEMBER 29 - DECEMBER 1: Joint 51st Southwestern/47th Southeastern Regional Meeting, ACS, Peabody Hotel, Memphis, Tenn. Contact: P.K Bridson, Chern Dept, Memphis State Univ, Memphis, TN 38152, USA.
DECEMBER 17 - 22: 1995 International Chemical Congress of Pacific Basin Societies, Honolulu, Hawaii. Contact ACS Meetings, 1155 16th Street, NW, Washington, DC 20036-4899, USA.
1996
FEBRUARY 26 - MARCH 1: PittCon'96: Pittsburgh Conference on Analytical Chemistry & Applied Spectroscopy, Chicago, Illinois. Contact: Pittsburgh Conference, Suite 332, 300 Penn Center Blvd, Pittsburgh, PA 15235-9962, USA.

1044 LIQUID CHROMATOGRAPHY CALENDAR
MARCH 24 - 29: 21lth ACS National Meeting, New Orleans, LA. Contact: ACS Meetings, ACS, 1155 16th Street, NW, Washington, DC 20036-4899, USA.
MARCH 31 - APRIL 4: 7th International Symposium on Supercritical Fluid Chromatography and Extraction, Indianapolis, Indiana. Contact: Janet Cunningham, Barr Enterprises, PO. Box 279, Walkersville, MD 21793, USA.
MAY 7 - 9: VIIth International Symposium on Luminescence Spectrometry in Biomedical Analysis - Detection Techniques and Applications in Chromatography and Capillary Electrophoresis, Monte Carlo, Monaco .. Contact: Prof Willy R. G. Baeyens, University of Ghent, Pharmaceutical Institute, Harelbekestraat 72, B-9000 Ghent, Belgium.
JUNE 16 - 21: "HPLC '96: Twentieth International Symposium on High Performance Liquid Chromatography," San Francisco Marriott Hotel, San Francisco, California. Contact: Mrs. Janet Cunningham, Barr Enterprises, P. O. Box 279, Walkersville, MD 21793, USA.
AUGUST 18 - 23: 212th ACS National Meeting, Boston, Mass. Contact: ACS Meetings, 1155 16th Street, NW, Washington, DC 20036-4899, USA.
OCTOBER 16 - 19: 52nd Southwest Regional ACS Meeting, Houston, Texas. Contact: J. W. Hightower, Dept. Chern. Eng., Rice University, Houston, TX 77251, USA.
OCTOBER 24 - 26: 52nd Southwestern Regional Meeting, ACS, Houston, Texas. Contact: J. W. Hightower, Chern Eng Dept, Rice Univ, Houston, TX 77251, USA.
NOVEMBER 6 - 8: 31st Midwestern Regional Meeting, ACS, Sioux Falls, South Dakota. Contact: 1 Rice, Chern Dept, S Dakota State Univ, Shepard Hall Box 2202, Brookings, SD 57007-2202, USA.
NOVEMBER 9 - 12: 48th Southeast Regional ACS Meeting, Greenville, South Carolina. Contact: H. C. Ramsey, BASF Corp., P. O. Drawer 3025, Anderson, SC 29624-3025, USA.
1997
APRIL 6 - 11: 213th ACS National Meeting, San Antonio, Texas. Contact: ACS Meetings, ACS, 1155 16th Street, NW, Washington, DC 20036-4899, USA.

LIQUID CHROMATOGRAPHY CALENDAR 1045
SEPTEMBER 7 - 12: 214th ACS National Meeting, Las Vegas, Nevada. Contact: ACS Meetings, 1155 16th Street, NW, Washington, DC 20036-4899, USA
1998
MARCH 29 - APRIL 3: 215th ACS National Meeting, St. Louis, Missouri. Contact ACS Meetings, 1155 16th Street, NW, Washington, DC 20036-4899, USA
AUGUST 23 - 28: 216th ACS National Meeting, Orlando, Florida. Contact: ACS Meetings, 1155 16th Street, NW, Washington, DC 20036-4899, USA
1999
MARCH 21 - 26: 217th ACS National Meeting, Anaheim, Calif. Contact: ACS Meetings, 1155 16th Street, NW, Washington, DC 20036-4899, USA
AUGUST 22 - 27: 218th ACS National Meeting, New Orleans, Louisiana. Contact: ACS Meetings, 1155 16th Street, NW, Washington, DC 20036-4899, USA
2000
MARCH 26 - 31: 219th ACS National Meeting, Las Vegas, Nevada. Contact ACS Meetings, 1155 16th Street, NW, Washington, DC 20036-4899, USA
AUGUST 20 - 25: 220th ACS National Meeting, Washington, DC Contact: ACS Meetings, 1155 16th Street, NW, Washington, DC 20036-4899, USA
2001
APRIL 1 - 6: 221st ACS National Meeting, San Francisco, Calif. Contact: ACS Meetings, 1155 16th Street, NW, Washington, DC 20036-4899, USA

1046 LIQUID CHROMATOGRAPHY CALENDAR
AUGUST 19 - 24: 222nd ACS National Meeting, Chicago, lIIinois. Contact: ACS Meetings, 1155 16th Street, NW, Washington, DC 20036-4899, USA.
2002
APRIL 7 - 12: 223rd ACS National Meeting, Orlando, Florida. Contact: ACS Meetings, 1155 16th Street, NW, Washington, DC 20036-4899, USA.
SEPTEMBER 8 - 13: 224th ACS National Meeting, Boston, Mass. Contact: ACS Meetings, 1155 16th Street, NW, Washington, DC 20036-4899, USA
The Journal of Liquid Chromatography will publish, at no charge, announcements of interest to liquid chromatographers in every issue of the Journal. To be listed in the Liquid Chromatography Calendar, we will need to know:
a) Name of the meeting or symposium,
b) Sponsoring organization,
c) When and where it will be held, and
d) Whom to contact for additional details.
Incomplete information will not be published. You are invited to send announcements to Dr. Jack Cazes, Editor, Journal of Liquid Chromatography, P.O. Box 2180, Cherry Hill, NJ 08034-0162, USA.

Gain illSighl inlo novel, highly reliable countercurrent chronUltographic techniques and apply them in your work with . ..
Centrifugal Partition hron1atography
(Chroma.togrJ.pruc SCience Series/68)
edited try
ALAIN P. FOUCAULT Centre National de 10 Recherche Scientijique, Panos, France
September, 1994 432 pages, illustrated
$150.00
This outstanding guide introduces centrifugal partition chromatography (CPC) for any biphasic system-{)ffering in-depth coverage of instrumentation, theory, liquid-liquid partition coefficients, and CPC in organic and inorganic chemistry.
Contains aver SO diagralT1s for three-solvent systSM'lS that can be applied to virtually all partitioning. separation. and purification situations!
Written by international experts from North America, Europe, and Japan, Centrifugal Partition Chromatograpby
• examines chromatographic properties, illustrates practical oper.l.tions, and gives examples of CPC solutions to real experimental problems
• highlights the distinction between CPC and highperformance liquid chromatography
• explalns hydrostatiC, hydrodynamic, and overall pressure drops
• discusses solvent systems, strategies for solvent selection, and ule elution mode in CPC
• shows how to design solvent systems for CPC of complex organic mixtures
• describes carrier-alded CPC for preparative-scale separations and the use of CPC as a multistage liqUid-membrane transport system
• and much more!
With nearly 800 references, tables, equations, and figures, Centrifugal Partition Cbr071latograpby is an incomparable resource for analytical and pharnlaceutical chemists and biochemiStS, separation SCientists, phartnacologiSls, and upper-level undergraduate and graduate students in these disciplines.
Contents Operating the Centrifugal Partition Chromatograph,
Alain Berthod, Chau-Dung Chang, and Daniel W. Armstrong
Theory of Centrifugal Partition Chromatography, Alain P. Foucault
Pressure Drop in Centrifugal Partition Chromatography, M.j van Bue!, l. A. M. van der Wielen, and K. Ch. A. M. Luyben
Solvent Systems in Centrifugal Partition Chromatography, Alain P. Foucault
Fractionation of Plant Polyphenols, Takuo Okuda, Takashi Yoshida, and Tsutomu Hatano
Centrifugal Partition Chromatography in Assay-Guided Isolation of 1(atural Products: A Case Study of Inununosuppressive Components of Tripterygiurn wi!fordii,janA. Glinski and Gary 0. Caviness
Liquid-Liquid Partition Coefficients: The Particular Case of OctanolWater CoeffiCients, Alain Berthod
Centrifugal Partition Chromatography for the Deternlination of Octanol-Water Partition CoeffiCients, Steven] Gluck, Eric Martin, and Marguerite Healy Benko
Mutual Separation of Lanthanoid Eiemenl' by Centrifugal Partition Chromatography, Kenichi Akiba
Separator-Aided Centrifugal Partition Chromatography, TakeoAraki
Centrifugal Partition Chromatographic SeparJtions of Metal Ions, S. Muralidharan and H Freiser
Preparative Centrifugal Partition Chromatography, Rodolphe Margraf!
Appendix I: Various Ways to Fill a CPC
Appendix II: CPC Instrumentation
Appendix III: Ternary Diagrams ISBN: 0-82<17-9257-2
7'hls book i .• prill/cd QJllJcidjT(x' paper
Marcel Dekker, Inc. 270 Madison Avenue, New York, NY 10016
(212) 696-9000
HutgOISse 4, I)ostiach 812, CH-4001 Ba.'ici. Switzerland Tel. 061-261-8482

Also in the Chromatographic Science Series ...
Handbook of Affinity Chromatography ediled by TONI KLINE, Bnstol·J!),ers SqlllbbPharmaceutlCal
Research Institute, Princeton, IVewJersey
344 pages, illuStraled/ $150.00
Presenting new techniques and applications that affect the planning of research strategies, this practical reference focuses on harnessing the biochemistry of bioorganic compounds in order to separate them.
Contents Techniques of Affinity Chromatography Overview, Ricbard Vi/kms and Peter Toollui.: Support Materials for AffinHy Chroma.tograph~l, Per-Olo/Larsson
Preparative Applications of AffinilJ' Chromatography Affinity Chromatography of Enzymes, f'e!i.," fnedberg alld Allell R. Rhoads Affinity ChromatogiJ.phy of RegulalOry and Signal-Transducing Proteins,
Allen R. Rboads and Felix Friedberg Purification of MembiJIle Transpon Proteins and ReceplOrs by Immobilized-Ligand
Affinity ChromJtogr.lphy, Malcolm G. P Page Purification of Nucleic Acid-Binding Protein~ by Affinity Chromatography,
Vincent h/ollcollill CJ1Jdjean M Egly Nucleic Add and IlS DeriY'J.tives, Ht.'rbert Schou
Research on Biorecognttton Affinity Chromawgf"J.phy in Biology and Biotechnology: Probing Macromolecular
Int~rJ.ctions Using Immobilized Ug:mds, Iru.:ill Chaiken Surface Plasmon Resonance Detection in AfiiJ1lty Technologies. BL\core,
Lars G Ftigers/mll and Dallit!lj O'Sballlles.9' Detemunation of Bindmg Constants by QUillllitative Affinity Chromatography: Current
and Futur~ Applications, Donald). Willzor and Craig.11 jackson Weak Affinity ChromalOgmphy, Stell Oblsoll mltl David Zop! lnvestigaung SpecificlIY \1a Affinity Chromatography.i..all'rellce M. K/wvar ISSN: 0-82'i7-8939-3
r--MailfOday/,'Order Form--------, I I I Maji to: Promotion Dept., MARCEL DEKKER, INC. I I 270 Madison Avenue, New York, N. Y IOU 16 I I Q PJe'..LSC send me __ cuPY(les) uf Cenlrlfugdl Pdr/llion CbrolMlograpbJ' (.'<hted by I I Al:un P Foucauh at $1 SO 00 per volume. I I 0 Please send mC __ l:opy(lcs) of Handbook of A.Qi"Jly Cbromalograpby cditL'([ by I I TolU Kline :.11 S 15U 00 per volume I
Ct Please send mc __ copy(ics) of Preparalim! Iwd Production Jcale CbrollJiJlogra- I
pby ~tcd ~~':~~;Q~I~:'::~~"::r~:~:~: ~~:::::::rs'uklQld) S 75 I I
I enclose payment lfi the OUIlOUn! of $ ___ by :.J check ::J money order Q Vi~a I
Q MasterCard ( .. ·Jlg.!! tnterbank no ______ ) 0 AmJ-:Xp
Card :\o ___________ Exp Ihle __ _
Preparative and Production Scale Chromatography ediled bv G. GANETSOS, Borax Consolidated Limited, wndan,
• and Aston Universil)', Birmingham, England
P. E. BARKER, Asfon University, Birmingham, EI/gumd
808 pages, illustrated / $215.00
. . represents the most up·to·date information on the subject area ... unquestionably complete." -Chromatograph'a
Partial Contents Cocurrent Chromatography DevelopmenlS in Large-Scale Batch Chromawgraphy, C. Ganetsos and P. E. Barker Large-Scale High-Perform:Ulce Prepanltive liqUid Chromalogf'J.phy, Henri Colill
Ilydrodynamics of Preparative Chromatography Columns, R. M. Nicoud and /rI. Perru!
Continuous Cross-Current Chromatography Continuous Cross·Currenl Chromatogntphic Refiners, S. Bridges and P. E. Barker Continuous Rotating Annular Chromatography, Sbigeo Golo and Youicbi Takahashi
Continuous Countercurrent Chromatography: Moving·Bed/Column Systems Continuous Moving-Column ChromatogrJ.pb.ic Systems, P. E Barker and G. Ganetsos Biosepaf"J.tiom; in the Magnclically Stabilized Fluidized Bed, David] Graves
Continuous Countercurrent Chromatography: Simulated Moving·Column Systems SemiCOIllUlUOUS CounterCllrrenl Chromatographic Refincrs,
G'. Galletsos and P. J::. Barker Sorbex: Industrial-Scale Adsorptive Separation,
james A. johnsoll and Ralpb G. Kabza Op~r:.ltion aud De$ign of Simuhttcd Moving-Ued Ailiiorbers,
Kenji Hasbimolo, Shuji Adacbi, Yosbibito Shirai, and Mitsugu /rIonsbita From Balch Elution to Simulated Countercurrent Chromalography,
B. Bak:llmec and G. Hotwr
Chromatographic Reaction·Separation Balch and Continuous Chromalogmphic Systems as Combined Bioreaclor-Separators,
G. Ganelsos, P. E. Barker, and). N. Ajongwen Development of New Bioreactors of a Simulated Mo\oing·Bed Type,
Kenji H~hil1loto, Shuji Adachi, and Yoshihito Shirai Continuous Re-Jction Chromalography, Rober' W. Carr Gas and uquid Chromalogl"Jphic Re'JClors, jo~i Coca, GerardoAdrio, Cbawn-Yingjeng, and Siank!), H. langer
Preparative fixed-Bcd Chromatogr.lphic Reactor, Michel Sardin, Dalliel Schweicb, and jacques Villennau."l:
Chromatography in the Biochemical Field Large-SCale ChromarogrJphy of PrOieins,jan-Christer Janson and Torbjiim Pettersson Ion-Exchange Production Chromatogf"Jphy of Proteins,
jolm R. COllder and Geoffrey Leaver Affinity Chromatographic Reactor, Osa/o MiJ'awaki
Modeling of Chromatographic Processes Modeling of Chromatographic Processes, Douglas.1J. Rul/Jt-'en and C B. Ching Modeling of Counlercurrcm A~orptiOn Processes,
Giuseppe Storti, Maurizw Masi, aJld.HclSsimo Morbidellz Modeling of ChromatogrJ.phic Processes: A Chemical Engineering Approach,
jacques Vi/Jermau:r, Dalliel Schweicb, and Michel Sardin D}nanlks of Adsorptive Reactors,
jost}}"I. Loureiro, Rui C S()(It'f!S, tmdAlfrioE Rodrigues
ISBN: 0--8247-8738-2
eet an in-depth view of the principles, pmctices, and applications of thin-layer and high-performance thin-layer chroJliot()gmphy with the new edition of. FurnIshes over 850 hterature
c.tatlons and more than ~OO helpful tables, drawmgs, and photographs' Thin-Layer
Chromatography Techniques and Applications Third Edition, Revised and Expanded
(Chromatographic SCIence Scries!66)
Praise for the Previous Editions ... " .. The treatment of the subject is compact and caters well for the needs of those who wish La carry forward their analytical skills from an elementary level... " ... There .is a good deal of experience distilled into these pages."
-Chemistry and Industry
.. a worthwhile purchase both for beginners and for experienced chromatographers with an interest in thin-layer chromatographic separations." -Analyst
" ... an excellent, well-illustrated, practically oriented text, with a detailed overview of current TLC equipment world-wide, and up-ta-date literature coverage." -Analytic" Chimica Acta
Maintaining and enhancing the features that made the previous editions so successful, this valuable, completely updated Third Edition discusses all phases of thin-layer chromatography (TLC), including the preparation of biological samples prior to TLC, general practices of TLC, unci applications based on compound types_
Details various qualitative and quantitative densito-metric TLC experiulents on organic dyes, lipids, alnino acids, carbohydrates, natural pignlents, vitanlins, nucleic acid derivatives, steroids, plw.rnw.ceuticals, organic acids, antibiotics, and insecticides!
Reflecting the many recent developments in TLC. Thin-Layer Chromatography, Third Edition
• stresses practical rather than theoretlcal aspects of TLC
• compares modern TLC with other separation methods. especially gas and column-liquid chromatogrJphy
• contains extensive coverage of sample preparation methods
• surveys the latest instrumentation for high-performance and overpressured TLC
• covers current principles and techniques such as the optimization of separations and densitometry
• and morel
Providing a handy source of information For any scientist currently using or planning to use TLC, Thin-Layer Chromatography, Third Edition is an essential resuurce for anakricai chemiSts, biochemists. clinical chemists, laboratorv .mJ medical biotcch~ologist$, phurmacL'utical scientists. chemical and civil e'ngineers, zoologists, horanists, parasitologists. microbiologists, and upper-level undergraduate and graduate students in these diSCiplines.
. BERNARD FRIED "nd
I t~I~~;(~L~:!~~~PL'Il1Js)'h'allia i ]elnLlarV, 1994
464 pa"ge::;, illustrated S 16500
Contents i General Practices of TLC II Introduction and History
:\l~chanism and Theon: Sorbcnts, Layers, and i\ccoated Plates Obtaining iVlaterial [or TLC and Sample
Preparation Application of Samples Solvent Systems D~vclol)ment Techniques Ddcctlon and Visualization QU<lIJt~t~ivc Evaluation and
Documentation Quantification Reproducibility of Results Prepdfative Layer Chromatography
I R.dJiochcmical Techniques
I Applications ofTLC to Different , Compound Types
Basic T:""C DeSign and TLC of Orgamc Dyes LiPIJs Amino Acids C<lrbohyJr<.ltcs N~llur<.d Pigments Vitamin:' N :.Iclcl(" Acid Derivatives St:.:rOlds and Tcrpinoids Pharmdceuticals I'vllscellaneous Applications
Directory of Manufacturers and Sources of Standards, Sample
i Preparation SUE,plies, and TLC I Instruments, Pates, and Reagents
; Glossary ISBN: 0---8247-9171-1
Marcel Dekker, Inc. 270 l'vladison Avenue ~ew York, NY 10016 ,. 2. J ]:) 696-9000
Hutgasse 4, Postfach 812 CH-4001 Basel, Swi.tzerland Tel. 061-261-~482

Also of interest ..
Handbook of Thin-Layer Chromatography (Chromatographic Science Scril!s/55)
edited by
JOSEPH SHERMA and BERNARD FRIED
2nd PrintiHg! 1080 pages. illustrated $199.00
.. The wealth of practical det8il can potentially save many hours of labordtory experimentation. The purchase price is easily covered by just one hour of saved labour." -Chromatographia
.. overall this book should sen'e for many years as the source of informa-
tion on TLC~An!'lytica Chimica Acta
" ... one of the best practical books in this field." -lntemationaljo,,,,,,ul of
E,wironmental twd Analytical Chemistry
Contents Principles and Practice of ThinLayer Chromatography BUSIC T cchnigucs. l'vlatcnals, and
Apparatus. Joseph Shernul Theorv and Mechanism of Thin-Layer Chr~matography. Teresa Kowalska
Optimization, Bart AI. j. De Spiegeleer I Sorbcnts and Precoated Layers in Thin~
Layer Chromatography, Heinz E. Hauck, i\lIargot i'vlack, and Willi Jost
Instrumental Thin·Layer Chromatography, DIeter E jaenchen
Gradient Development in Thin~Laver Chromatography, \VIadys/aU' GolkieU'ic:
Overpressured Layer Chromatography, Kat,,/ill Ferenczi·Podor, Emil Mincsovics, ow.! Ernb Tl'iluih
Thin-Layer Chromatography Coupled with i\'Iass Spectrometry, Kenneth L. Busch
I
r - .a,) ;l.) ~ if i') il,'1 f.Mailtoday! ~- - - -,:
Mail to: Promotion Dept., MARCEL DEKKER, INC. 270 Madison Avenue, Ne\\ York, N. Y 10016
o Please send me ___ COpy(I~S) of 111in-Layer Chromatography, Third Edition by Bernard Fried and Joseph Sherm.l <.It $165.00 p(.:r volume
o Please send me ___ copy(ks) of the Handbook of Thin· Layer Chromatography edited by Joseph Shcrma and Bernard ~ncd at $199.00 per volume. .
Pk·1IM wld S I ,() Jor I~"'''~' ""J I",,,,J/"'II pc, ",II''''~ rJII 1"~I~"J ",d,·" ",/J ,'''') S ;,
I enclose payment in the amount of $ _____ by Q check Q money order
Q Visa 0 tvias[crCard (4~dlgit interbank no _______ ) 0 Am.Exp.
Card No. ____________ Exp. Date ____ _
Pledse bill my cnmpllnl'. PO No ------------ 5<;;':= I ~~~ID Signa[ure _________ ~-~-~~------: ~~~ I'
"",,' I. "~,,,·,JI'" ,,,,I,, '''''/1",''''<111 II Q f:g r;-~~:a OJ"TI
g:'~2.5.Q Name _____________________ _
Addrcss ____________________ --1
Cny/SlatefLlp __________________ _ ,"\' l" " .. ,,,I~,,,, ",,<I' "dJ "1'1""1""'" "d,·, ,," c.,,,,,,,!,.,, w"how""ucc
~o-a.C":I.,,~ ~R"l=55:::;("O ~~2:gg.§:
~~~~~~ ~-i:n~~~c. ~=~.~
Form No. 039402 Printed in U.S.A, ~ en - : L ____________________ ~'
PhotographIc Documentation of Thin· Layer Chromatograms, Richard K. Vitcl~
Theoretical Foundations of OptICal QuamitaLion, Viktor A. Polltd~
Preparative Layer Chromatography, Szabolcs Nyiredy
Thin~Layer Radiochromatography, Seth D. Shulman Clnd Larry E. Weaner
Applications of Flame Ionization Detectors in Thin·Layer Chromatography, Kumar D. Mukherjee
Applications of Thin-Layer Chromatography Amino Acids and Their Derivatives,
R. Bhushan Peptides and Proteins,
R. Bhushan and j Martens AntibIOtics, Franz Kreu:ig Carbohydrates, i\lJirlw ProSek, lvlarlw PH/d,
mui K~tarina jamnlh Inorganics and Organometallics,
Ali Mohammad and Krishna C. Varshne), EnantlOmer Separations, Kurt Giiltther Lipids, Bernard Fried
;\latural Pigments. hlorten Isaksen Pesticides, Katalin Fodor-Csorba
Pharmaceuticals and Drugs, Linda L. Ng Phenols, Aromatic Carboxvlic Acids, and Indolc~,john f-l. P. TpllaJn
Polymers and Oligomers, E. S. Cankina and B. G. Belenkij
Application of TLC and H PTLC for the Detection of Aberrant Purine and Pyrimidine Metabolism in Man, Albert H. van Gennip, Nico C. C. M. Abeling, and Dirk de Korte
Steroids, Gabor Szepesi and Maria Gazdag Synthetic Dyes. Vinod K. Gupta Toxins, Michael E. Stuck Hydrophilic Vitamins, Bernard Fried Llp~rhiiIc Vitamins, Andre P. De Leellheer,
Wtlly E. Lambert, cmd Hans J Nelis
Glossary
Selective Directory of Manufacturers and Suppliers of Instruments and Products for Thin-Layer Chromatography
ISBN,0-8247-8335-2
Apply the latest advances in analysis techniques to both drugs of abuse and athletically banned substances with... Co FurniShes.
ANAl VlSIS OF ~~~~~~;f!:::~~?;na, L I I ll1erlca, and ca, SOuth Europe!
ADDICTIVE AND MISUSED DRUGS
edited by JOHN A.ADAMOVICS Cytogen Corporation, Princeton, New Jersey
October, 1994 800 pages. illustrated $195.00
This state-of-the-art resource examines the chromatographic and nonchromatographic methods available to identify. measure, and screen for nonmedical drug use--highlighting the latest technologies in immunochernical analysis. biosensors, thin-layer gas chromatography, high-performance liquid chromatography, and capillary electrophoresis.
Provides a comprehensive alphabetic listing of over 400 controlled-use drugs, including the drug name, sample matrix, handling procedure, and mode of detection.
Uniquely integrating the testing for drugs of abuse with the testing for banned substances in athletes, Analysis of Addictive and Misused Drugs • discusses a paper chromatographic technique employed
extensively to screen for drugs in biological matrices
• addresses the use of underivatized silica gel with polar solvents
• presents a simple and sensitive identification system for the detection of a broad spectrum of drugs
• evaluates the applicability of capillary electrophoresis for the separation of illicit drugs
• describes the most up-to-date robotics technology • delineates an extensive sports drug testing program • suggests approaches to solving forensic problems in
developing countries with limited resources
• and more! Containing over 1700 bibliographie citations and some 200 tables, figures, and equations, Analysis of Addictive and Misused Drugs is a practical day-to-day guide for analytical, clinical, forensic. and pharmaceutical chemists and biochemists; pharmacologists; chemical engineers; biotechnologists; clinical toxicologists; and upper-level undergraduate and graduate students in these disciplines.
CONTENTS Enzyme Immunoassays
Thomas Foley Biosensors Jean-Michel Kauffmann and George G. Guilbault
Thin-Layer Chromatography Using the Toxi-Lab System Sheldon D. Brunk
Reversed-Phase High-Performance Liquid Chromatography Analysis of Drugs of Forensic Interest
Ira S. Lurie
High-Performance Liquid Chromatography Using Unmodified Silica with Polar Solvents
Steven R. Binder
Analysis of Seized Drugs by Capillary Electrophoresis Ira S. Lurie
Thin-Layer Chromatographic Screening and Gas Chromatographic/Mass Spectrometric Confirmation in the Analysis of Abused Drugs
Pirjo VI/sunde and Taimi Korte Robotics and the Analysis of Drugs of Abuse John de Kanel and Tim Korbar
Drug Testing of Athletes Sui C. Chan and Jitka Petruzelka
Drug Analysis in South America Juan Carlos Garcia Fernandez
AppendiX: Supplementary Applications and Information ISBN: 0-8247-9238--6
Thj~ book IS printed on oCICI-(ree paper
Marcel Dekker, Inc. 270 Madison Avenue. New York. NY 10016 • (212) 696-9000
Hutgasse 4, Postfach 812, CH.400 I Basel. Switzerland • Tel. 061-261-8482

,Jf related interest ...
CHROMATOGRAPHIC ANALYSIS OF PHARMACEUTICALS
(Chromatographic Science Series/49)
edited by JOHN A. ADAMOVICS
2nd Printing! I 680 pages, illustrated I $165.00
" ... an excellent reference for those who are involved in the chromatographic analysis of pharmaceutical compounds and their formulations .... "
" ... concentrates on concise, practical information which is relevant to a specific area of endeavor."
-Journol of Pharmaceutical Sciences
"There is no doubt that this bOOK should have wide appeal to all those interested in pharmaceutical analysis." -Analyst
For Credit Card ~ .. «:i.'_iiiiril~~ and Purchase Orders, - - and Customer Service
CALL TOLL-FREE 1-800-228-1160 Mon.-Fri., 8:30 a.m. to 5:45 p.m. (EST) or FAX your order to 914-796-1772
Mail todoy!
ORDER FORM
Mail to: Promotion Dept •• MARCEL DEKKER,INC. 270 Madison Avenue. New York. N. Y. 100 J 6
CONTENTS Regulatory Considerations Regulatory Considerations for the Chromatographer John A Adamovics
Sample Treatment Sample Pretreatment John A Adamovics
Robotics in the Pharmaceutical Laboratory M. L Robinson
Chromatography Thin-Layer Chromatography John A Adomovics
Gas Chromatography Doug/os Both
Headspace Analysis of Pharmaceuticals Robert L Barnes
High-Performance liquid Chromatography John A Adomovics
Applications
ISBN: 0-8247-7953-3
o Please send me ___ copy(ies) of Analysis of Addictive and Misused Drugs edited by John A. Adamovics at $195.00 per volume.
D Please send me ___ copy(les) of Chromatographic Analysis of Pharmaceuticals edited by John A Adamovics at $ J 65.00 per volume. Plto~e add $1 50 (orpo$!GfeOlldllondl.n,r>ervoillrtlC,on prepo/don:!eI'J add only $ 75
I enclose payment in the amount of $ _________ by:
Q check Q money order OVisa Q MasterCard (4·digit interbank nO. _______ -I o Am.Exp.
CaroN~ ________________________________ __
Exp. Date
Please bill my company: P.O. No. ____________ _
Signature -----,=_c::.:;:"":-:"'=':::oI""ro::c,,=..,,"',,-::w="'c::'''=m=.'::;''--------
Name
Address ____________________ _
City/State/Zip __________________ _
N. Y. reiidents mllit odd QPproptiof.e iOles ta.Ir. Conod!cm wst/Jmo!l'J add 7% GST. Prices Oil! wbf«t ttl dlonre WlthoutnoXJce
Form No. 099418 Printed In U.S.A.

Obtain the best possible results by understanding the essentials involved in the chromatographic process with. ..
RAYMOND P. W. SCOTT GeorgclOwlI University, Washingtoll, D.C.. and Birbeck College. University of LOlldon. United Killgdom
January, 1994 344 pages. illustrated $75.00
~r his practical guide provides a clear presentation of the chromatographic process-demonstrating the functions of all associated instrumentation alld the procedures necessary to obtain accurate qualitative and quantitative results.
Supplies a host of applications from a variety of sources to help identify the best equipment, the most appropriate columns, and the most suitable phase systems for specific samples!
Written by an international expen with over 45 years of industrial and academic experience, Liquid Chromatography for the Analyst
• covers essential fundamental theory • explains the chromatographic process using established physical
chemical terminology • illustrates chromatographic behavior with current practices • gives useful examples to aid in applying principles to actual
problems
• furnishes supporting experimental evidence for theoretical explanations
• and much more!
With its direct, jargon-free style that permits easy access to infonnation, Liquid Chromatography for the AlZalyst is an invaluable resource for analytical chemists. laboratory technicians. and upperlevel undergraduate, graduate, and continuing-education cour~es in analytical chemistry or separation science.
COl'rrEl'rrS An btroduction to
Chromatography Resolution, Retention, and
Selectivity Liquid Chromatography
Phase Systems The Liquid
Chromatography Column The Liquid Chromatograph Liquid Chromatography
Detectors Sample Preparation Qualitative and Quantitative
Analysis LC Applications ISBl'i: 0--8247-!H1i4-3
[IllS book. IS pmllt:J 011 acid-jr.>" PO!',,-'f.
27U Ma(2ison A venue New Yo::-k, NY 10016 (2 I 2) 696-9000
Hutgasse 4, Postfach 812 CH~400} Basel, Switzerbnd Tel. 061-261-8482

ELECTRONIC MANUSCRIPT SUBMISSION
Effective immediately, manuscripts will be accepted on computer diskettes. A printed manuscript must accompany the diskette. For approximately one year, the diskettes will be used, on an experimental basis, to produce typeset-quality papers for publication in the Journal of Liquid Chromatography. Diskettes must be in an IBM-compatible format with MS-DOS Version 3.0 or greater. The following word processing formats can be accommodated:
ASCII EBCDIC Framework III 1.0, 1.1 Microsoft Word 3.0, 3.1, 4.0, 5.0 Multimate Advantage 3.6 Navy DIF Peach Text 5000 2.12 PFS:Write Ver C Q&A Write 3.0 Samna Word IV & IV+ 1.0,2.0 Volkswriter 3, 4 Wang PC Ver 3 WordStar 3.3,3.31,3.45,4.0,
5.0, 5.5, 6.0
DisplayWrite Native Enable 1.0, 2.0, 2.15 IBM Writing Assistant Multimate 3.3 Multimate Advantage II 3.7 Office Writer 4.0, 5.0, 6.0, 6.1 PFS:First Choice 1.0, 2.0 Professional Write 1.0, 2.0, 2.1 RapidFile (Memo Writer) 1.2 Total Word 1.2, 1.3 Volkswriter Deluxe 2.2 WordPerfect 4.1,4.2,5.0,5.1* XyWrite III XyWrite 111+
* The preferred word processor is WordPerfect 5.1.
Manuscripts and diskettes should be prepared in accordance with the Instructions for Authors given at the back of this issue of the Journal. They should be sent to the Editor:
Dr. Jack Cazes Journal of Liquid Chromatography
P. O. Box 2180 Cherry Hill, NJ 08034

INSTRUCTIONS TO AUTHORS
Journal of Liquid Chromatography is published in the English language for the rapid communication of research in liquid chromatography and its related sciences and technologies.
Directions for Submission
One typewritten manuscript, suitable for direct reproduction, and two (2) clear copies with figures must be submitted. Since the Journal is produced by direct photography of the manuscripts, typing and format instructions must be strictly followed. Non-compliance will result in return of the manuscript to the author and will delay its publication. To avoid creasing, manuscripts should be placed between heavy cardboards before mailing.
Manuscripts may also be submitted on computer diskettes. A printed manuscript must also be submitted with diskettes because, at the present time, we are experimenting with manuscripts on diskettes. Diskettes must be readable with an I BM-compatible computer (Madntosh or other type not acceptable) and must be formatted with MS~DOS 3.1 or greater. Be sure to indicate the word processing software that was used to prepare the manuscript diskette.
Manuscripts and computer diskettes should be mailed to the Editor:
Reprints
Dr. Jack Cazes Journal of liquid Chromatography P. O. Box 2180 Cherry Hill, NJ 08034
Due to the short production time for papers III this journal, it is essential to order reprints immediately upon receiving notificatIon of acceptance of the manuscript. A reprint order form will be sent to the author with the letter of acceptance for the manuscript. Reprints are available in quantities of 100 and multiples thereof. Twenty (20) free reprints will be included with orders of 100 or more reprints.
Format of the Manuscript
1. The general format of the manuscript should be: Title Author(s)' names and full addresses Abstract Text Discussion References
2. Title & Authors: The entire title should be in capital letters and centered within the width of the typing area, located at least 2 inches (5.1 cm) from the top of the page. This should be followed by 3 lines of space, then by the names and addresses of the authors, also centered, in the follOWing manner:
A SEMI-AUTOMATIC TECHNIQUE FOR THE SEPARATION AND DETERMINATION OF BARIUM AND STRONTIUM IN WATER
BY ION EXCHANGE CHROMATOGRAPHY AND
ATOMIC EMISSiON SPECTROMETRY
F. D. Pierce and H. R. Brown Utah Biomedical Test Laboratory
520 Wakara Way Salt Lake City, Utah 84108
3. Abstract: The title ABSTRACT should be typed, capitalized and centered, 3 lines below the addresses. This should be followed by a single-spaced, concise abstract. Allow 3 lines of 'pace below the abstract before beginning the text of the manuscript.
4. Text Discussion: Whenever possible, the text discussion should be div'lded into major sections such as
INTRODUCTION MATERIALS METHODS RESULTS DISCUSSION ACKNOWLEDGEMENTS REFERENCES
These major headings should be separated from the text by two lines of space above and one line of space below. Each major heading should be typed in capital letters, centered and underlined.
Secondary headings, if any, should be placed flush with the left margin, underlined and have the first letter of main words capitalized. Leave two lines of space above and one line of space below secondary headings.
5. The first word of each paragraph within the body of the text should be indented five spaces.
6. Acknowledgements, sources of research funds and address changes for 3uthors should be listed in a separate sectIon at the end of the manuscript, immediately preceding the references
7. References should be numbered consecutively and placed in a separate section at the end of the manuscript. They should be typed single-spaced, with one line space between each reference. Each reference should contain names of all authors (with initials of their first and middle names); do not use et al. for a list of authors. Abbreviations of journal titles will follow the American Chemical Society'S Chemical Abstracts List of Periodicals. The word REFERENCES should be capitalized and centered above the reference list.
Following are accepta~le reference formats:
Journal:
Book.
1 D. K. Morgan, N. D. Danielson, J. E. Katon, Anal. Lett., l§.: i 979-1998 (1985)
1 L. R. Snvder, J. J. Kirkland, Introduction to Modern liquid Chromatographv, John Wiley & Sons, Inc., New York, 1979.
2. C. T. Mant, R S. Hodges, "HPLC of Peptides: in HPLC of Biological Macromolecules, K. M.

Gooding, F. E. Regnier, eds., Marcel Dekker, Inc., New York, 1990, pp. 301-332.
8. Each page of manuscript should be numbered lightly, with a light blue pencil, at the bottom of the page.
9. Only standard symbols and nomenclature, approved by the International Union of Pure and Applied Chemistry (I UPAC) should be used.
10. Material that cannot be typed, such as Greek symbols, script letters and structural formulae, should be drawn carefully with dark black India ink. Do not use any other color ink.
Additional Typing Instructions
1. The manuscript must be prepared on good quality white bond paper, measuring approximately 8,/, x 11 inches (21.6 cm x 27.9 cm). The typing area of the first page, including the title and authors, should be 5,/, inches wide by 7 inches high (14 cm x 18 cm). The typing area of all other pages should be no more than 5,/, inches wide by 8,/, inches high (14 cm x 21.6 cm).
2. The title, abstract, tables and references are typed single-spaced. All other text should be typed l'/,-line spaced or double line spaced.
3. It is essential to use dark black typewriter or printer ribbon so that clean, clear, solid characters are produced. Characters produced with a dot/matrix printer are not acceptable, even if they are "near letter quality" or "letter quality." Erasure marks, smudges, hand~drawn corrections and creases are not acceptable.
4. Tables should be typed on separate pages, one table to a page. A table may not be longer than one page. If a table is larger than one page, it should be divided into more than one table. The word TABLE (capitalized and followed by an Arabic number) should precede the table and should be centered above the table. The title of the table should have the first letters of all main words in capitals. Table titles should be typed single line spaced, across the full width of the table.
5. Figures (drawings, graphs, etc.) should be professionally drawn in black India ink on separate sheets of white paper, and should be placed at the end of the text. They should not be inserted in the body of the text. They should not be reduced to a small Size. Preferred size for figures is from 5 inches x 7 inches (12.7 cm x 17.8 cm) to 8,/, inches by 11 inches (21.6 cm x 27.9 cm). Photographs should be professionally prepared glossy prints. A typewriter or lettering set should be used for all labels on the figures or photographs; they may not be hand drawn.
Captions for figures should be typed Single-spaced on a separate sheet of white paper, along the full width of the type page, and should be preceded with the word FIGURE and an Arabic numeral. All figures and lettering must be of a size that will remain legible after a 20% reduction from the original size. Figure numbers" name of senior author and an arrow indicating "top" should be written in light blue pencil on the back of the figure. I ndicate the approximate placement for each figure in the text with a note written with a light blue pencil in the margin of the manuscript page.
6. The reference list should be typed single-spaced. A single line space should be inserted after each reference. The format for references should be as given above.

JOURNAL OF LIQUID CIIROMATO(;RAPIlY, 13(5), (199<;)
COI/fents Continued
Deknninatioll of Sulfamate and Sulfate as Degradation Produ('(s in an Antiepileptk Ikug Using 1011 Chnllllutog" raplay and Indirect lJV Dl'tl'dioll ... 0 •••
IV. 1,/ and T M. Rossi
Liquid Chromatogmphic. Assay for the Separation of Single- and Double-Stranded DNA by Using lJV and lJV Diode-Army Detectors and Hydroxylapatite Column K. M. S. Sundaram and L. Sloane
Chromatogmphic Studies on the Racemization of
')17
925
Thiopeptides . . . . . . . . . . . . . . . . . . . . . . . . . . . . . . . . . . .. 941 Gy. Sz6kdn, Z,;,. Majer, E. Kallal, M. Kajlar, M. lloll6si, and M. Peredy-Kajtar
A Sensitive High-Perfonnance Liquid Chromatogmphic Method for Detecting Sulfonamide Residues in Swine Se.'um and Tissues After Fluorcscamine Dcl'ivatization C. -E. Tsai and F. Kondo
Analysis of Prazosin in Plasma by lIigh-Perfonnance
96S
Liquid Chromatogmphy Using Fluorescence Detectioll . . . . . . . .. 977 E. M. Niazy, Y. M. El-Sayed, and S. ll. Khidr
Detenllination of Water-Soluble Inorganic Phosphates in Fresh Vegetables by Ion Chromatography . . . . . . . . . . . . . . . .. 989 E. Ruiz, M. I. Samillano, M. T Nieto, and I. Sastre
Evaluation of Sulfopropyl lon-Exchange Membrane Cartridges for Isolation of Proteins from Bovine Whey ........ 1001 M. F. Zietlow and M. R. Etzel
An Evaluation of the Differential Partitioning and Separation of C60 and C70 Fullerenes in a Biphasic System Using Centrifugal Partition Chromatography (CPC) ....•..... 1019 M. P. Gasper, A. Berthod, K. Talabardon, and D. W. Armstrong
Meeting Report . . . . . . . . • . . . . . . . . . • . . . . . . . . . . . . . .. 1035
The Book Corner ................................. 1037
AnnounceIl1ent ........•............•............ 1039
Liquid Chromatography Calendar ....................•. 1041

JOURNAL OF LIQUID CHROMATOGRAPHY
Volume 18, Number 5, 1995
CONTENTS
Displacement Thin-Layer Chromatography of Some Ecdysteroids . . . . . . . . . . . . . . . . . . . . . . . . . . . . . . . . . . .. 837 H. Kaldsz, M. Bathori, and 1. Mathe
Quantitative Thin Layer Chromatography of Indole Alkaloids. D. Catharanthine and Vindoline • • • • • • • • • • • • • •• 849 M. N. Tam, B. Nikolova Damyanova, and B. Pyuskyulev
Detennination of Molecular Species of Triacylglycerols from Highly Unsaturated Plant Oils by Successive Application of Silver Ion and Reversed Phase TLC • • • • • • • • • •• 859 R. Tarandjiiska, 1. Marekov, B. Nikolova-Damyanova, and B. Amidzhin
Quantitative Analysis of Alachlor and Atrazine in Polymeric Microcapsules Determined by Reverse-Phase High Perfonnance Thin Layer Chromatography with DellSitometry ................................... 873 O. D. Dailey, Jr. and R. M. Johnson
Two-Dimensional T.L.C. on Mechanically Blended SilicaBased Bonded Phases. Evaluation of the Behaviors of C8-Diol Mixtures Using Polyduclear Aromatic Hydrocarbons and Comparison with Cl8-Cyano Mixtures •••••• 887 Z. Hajouj, J. Thomas, and A. M. Siouffi
Simple HPLC Method for the Detennination of Thymoquinone in Black Seed Oil (Nigella Sativa Linn) H. Y. Aboul-Enein and L. 1. Abou-Basha
Analysis of Benzoquinolines and Acridines in a Brazilian
895
Diesel Oil by Particle Beam LC/MS and HPLC/uV •••••••••• 903 J. Mao, C. R. Pacheco, D. D. Traficante, and W. Rosen
(continued on inside back cover)
MARCEL DEKKER, INC. New York, Basel, Hong Kong Contributions to this journal are published free of charge
Copyright © 2022 FDOKUMEN