3D Printed Alkali-Activated Sensors for Civil Infrastructure
304
3D Printed Alkali-Activated Sensors for Civil Infrastructure Christos Vlachakis Civil and Environmental Engineering University of Strathclyde Glasgow, United Kingdom Thesis submitted in fulfillment for requirements of the degree of Doctor of Philosophy June 2021
-
Upload
khangminh22 -
Category
Documents
-
view
3 -
download
0
Transcript of 3D Printed Alkali-Activated Sensors for Civil Infrastructure

3D Printed Alkali-Activated Sensors for
Civil Infrastructure
Christos Vlachakis
Civil and Environmental Engineering
University of Strathclyde
Glasgow, United Kingdom
Thesis submitted in fulfillment for requirements of the degree of
Doctor of Philosophy
June 2021


Declaration of Authenticity and Author’s Rights
This thesis is the result of the author’s original research. It has been composed by the
author and has not been previously submitted for examination which has led to the award
of a degree.
The copyright of this thesis belongs to the author under the terms of the United Kingdom
Copyright Acts as qualified by University of Strathclyde Regulation 3.50. Due
acknowledgement must always be made of the use of any material contained in, or derived
from, this thesis.
Signed:
Date: 24 May, 2021

To my family for their everlasting love and support.

‘Man - a being in search of meaning.’
Plato

i
Abstract
Multifunctional cement-based materials have seen increasing interest in structural
health monitoring due to their high sensing performance. While these materials typically
involve the fabrication of large construction elements, smaller sensing patches can be
deployed onto existing surfaces as an alternative means of monitoring.
This thesis presents the development of 3D printed self-sensing alkali-activated material
patches for monitoring the strain and temperature of concrete substrates. Changes in the
inherent ionic conductivity of metakaolin-based alkali-activated material patches are used
to demonstrate sensing and monitoring of infrastructure without the need to use
electrically conductive fillers. The additive manufacturing, meanwhile, presents a
convenient method of improving the repeatability and economic viability of deploying
self-sensing materials in construction contexts.
The work in this thesis includes first time demonstration of 3D printed alkali-activated
sensors for temperature and strain monitoring and outlines the current state of the art on
self-sensing alkali activated materials. The fabrication, development, automated
deployment, and sensing performance in strain and temperature of these novel materials
are investigated throughout this thesis and the final printing design requirements are
compared to applications that use additive manufacturing to produce construction
elements.
By combining a monitoring and maintenance technology with an automated approach to
deployment, the work carried out as part of this thesis addresses important barriers to the
implementation of civil structural health monitoring & maintenance technologies. It is the
author’s hope that the work outlined here eventually leads to an enhanced uptake of
structural health monitoring by the construction sector. This will allow for prioritised
maintenance of the ageing and degrading civil assets that currently underpin
infrastructures across Europe and the US.

ii
Acknowledgments
A PhD is an amazing adventure, maybe not exactly like the ones you read in books or you
see in movies but it sure has its steep and rocky roads and, at least from personal
experience, feels like you are lost the majority of the time just to reach the end when you
least expect it.
Just like all journeys, this thesis would not have been possible without the help of many
individuals whether that was technical support when experiments did not work or moral
support in low spirits.
First and foremost massive, particular, special thanks to my supervisor Dr. Marcus Perry
for providing me with this opportunity and for his continuous support and guidance
throughout my PhD. His help was invaluable and cannot be described in words alone. I
would like to thank Marcus for always coming up with a solution to any sort of research
or non-research related problem, for pulling me out my endless thoughts and doubts and
for trusting in me when I did not.
I would like to particularly thank Dr. Lorena Biondi for her support over the years and
being the guide I needed during my PhD. Her dedication and hard work were truly
inspirational. While the hours working together in the lab felt endless at times, I believe it
is something we can both happily look back on as a sign of great teamwork and friendship.
Many thanks to Dr. Jack McAlorum for his help and for sharing his knowledge and
experience with me allowing me to overcome hurdles I would not have been able to do so
alone and for cheering me up when I felt all hope was lost.
Thanks also to Dr. Andrea Hamilton for the time she devoted in supporting me in my lab
work.
I would also like to acknowledge the support and assistance provided by the lab crew at
the Civil and Environmental Engineering Department. Many thanks to Mara Knapp, for
all her help and ensuring the labs ran properly despite the circumstances. I would also like
to thank Gavin Gibson, Derek McNee and Jim Francis for their technical support in the

iii
lab. No matter how wacky my requests seemed at times, they always found a way to pull
it off.
A special thanks goes to all my friends for being there for me and letting me talk about
something other than research. Particular thanks to all the people at the Civil and
Environmental Engineering Department at the University of Strathclyde for all the fun
times and laughs we’ve shared.
I would like to thank my parents, Kostas and Panagiota, my sister Sotiria and brother
Apostolis for their unwavering support over the years.
Last but not least, I would also like to thank God and the universe for letting me roam
around in this cosmos.
Thank you all.

iv
Table of Contents
Abstract .............................................................................................................................. i
Acknowledgments ........................................................................................................... ii
List of Figures ................................................................................................................ xii
List of Tables ................................................................................................................. xix
Abbreviations ................................................................................................................ xxi
Chapter 1 Introduction .................................................................................................... 1
1.1 Introduction .............................................................................................................. 1
1.2 Research contribution ............................................................................................... 3
1.3 Thesis outline ........................................................................................................... 4
1.4 Research output ........................................................................................................ 5
1.5 Journal articles .......................................................................................................... 5
1.6 Conference papers .................................................................................................... 5
1.7 Funding ..................................................................................................................... 6
Chapter 2 Literature review ........................................................................................... 8
2.1 Introduction .............................................................................................................. 8
2.2 Alkali activated materials ......................................................................................... 8
2.2.1 Introduction ........................................................................................................ 8
2.2.2 Alkali activated materials and geopolymers ...................................................... 9
2.2.3 ΑΑΜ Production.............................................................................................. 11
2.2.3.1 Precursor ................................................................................................... 12
2.2.3.2 Kaolin calcination ..................................................................................... 14
2.2.3.3 Alkaline solution ....................................................................................... 15
2.2.3.4 Alkaline activation .................................................................................... 16
2.2.3.5 Classifying AAM ...................................................................................... 17
2.2.4 Molecular composition .................................................................................... 18

v
2.2.4.1 Common molar ratios ................................................................................ 19
2.2.4.1.1 Metakaolin AAM ............................................................................... 21
2.2.5 Mixing sequence .............................................................................................. 22
2.2.5.1 One-part mixes .......................................................................................... 25
2.2.6 Curing .............................................................................................................. 26
2.2.7 Overview and caveats of AAM formulation.................................................... 27
2.2.8 Summary of alkali activated materials ............................................................. 28
2.3 Self-sensing alkali-activated materials ................................................................... 29
2.3.1 Introduction ...................................................................................................... 29
2.3.2 Alkali activated material sensors ..................................................................... 30
2.3.2.1 Fabrication, fillers and additives ............................................................... 30
2.3.2.1.1 Sensor fabrication ............................................................................... 32
2.3.2.2 Electrical (ionic) conductivity: mechanisms ............................................. 34
2.3.2.2.1 Overview of mechanisms ................................................................... 34
2.3.2.2.2 Equivalent circuits .............................................................................. 34
2.3.2.2.3 The impact of conductive fillers ......................................................... 37
2.3.2.3 Electrical impedance ................................................................................. 38
2.3.2.4 Electrical (ionic) conductivity: reported magnitudes ................................ 39
2.3.2.4.1 Without conductive fillers .................................................................. 43
2.3.2.4.2 With conductive fillers ....................................................................... 44
2.3.2.5 Electrode layout ........................................................................................ 46
2.3.2.5.1 Serial arrangement .............................................................................. 48
2.3.2.5.2 Van der Pauw arrangement ................................................................ 49
2.3.2.5.3 Embed or surface mount ..................................................................... 50
2.3.2.5.4 Electrode-less measurement ............................................................... 50
2.3.2.6 Sensor interrogation .................................................................................. 50
2.3.3 Strain sensing ................................................................................................... 51
2.3.3.1 Loading schemes ....................................................................................... 51
2.3.3.1.1 Monotonic loading ............................................................................. 52
2.3.3.1.2 Cyclic loading ..................................................................................... 54
2.3.3.1.3 Other strain responses in AAM samples ............................................ 55

vi
2.3.3.2 Gauge factors ............................................................................................ 56
2.3.3.3 Conductive filler applications ................................................................... 62
2.3.3.4 Filler free applications............................................................................... 63
2.3.4 Temperature sensing ........................................................................................ 68
2.3.4.1 Overview ................................................................................................... 68
2.3.4.2 Sensing behavior at different temperatures ............................................... 69
2.3.4.3 Temperature sensing: characterization equation ....................................... 71
2.3.4.4 Temperature sensitivity values .................................................................. 73
2.3.5 Moisture sensing .............................................................................................. 76
2.3.6 Future work and recommendations.................................................................. 78
2.3.7 Summary of self-sensing alkali activated materials. ....................................... 81
2.4 3D printing cementitious materials ........................................................................ 82
2.4.1 Introduction ...................................................................................................... 82
2.4.2 Cementitious printing ...................................................................................... 82
2.4.3 Printing terminology ........................................................................................ 85
2.4.4 Printing requirements ....................................................................................... 86
2.4.4.1 Buildability ................................................................................................ 87
2.4.4.2 Extrudability .............................................................................................. 90
2.4.4.3 Workability-flowability-pumpability ........................................................ 91
2.4.4.4 Open time .................................................................................................. 92
2.4.4.5 Additional parameters ............................................................................... 92
2.4.5 Printing alkali activated materials.................................................................... 94
2.4.5.1 Printing AAM at elevated temperatures .................................................... 94
2.4.5.2 Molecular composition effect on printing parameters .............................. 95
2.4.5.3 Additional parameters to be addressed ..................................................... 97
2.4.6 Summary of 3D printing .................................................................................. 97
2.5 Conclusions ............................................................................................................ 97
Chapter 3 Alkali activated materials............................................................................ 99
3.1 Introduction ............................................................................................................ 99
3.2 Experimental procedure ....................................................................................... 100

vii
3.2.1 Raw materials ................................................................................................ 100
3.2.2 Mix design ..................................................................................................... 101
3.2.3 Mix procedure and curing .............................................................................. 102
3.3 Experimental testing ............................................................................................. 103
3.3.1 X-Ray Diffraction Analysis ........................................................................... 104
3.3.2 Compression testing ....................................................................................... 104
3.3.3 Flexural testing .............................................................................................. 104
3.3.4 Isothermal calorimetry ................................................................................... 104
3.4 Results and Discussion ......................................................................................... 105
3.4.1 XRD analysis ................................................................................................. 105
3.4.2 The effect of solid to liquid ratio ................................................................... 107
3.4.3 Heat curing ..................................................................................................... 110
3.4.4 Flexural strength ............................................................................................ 112
3.4.5 Heat release .................................................................................................... 113
3.4.6 Effect of alkaline solution .............................................................................. 117
3.5 Conclusions .......................................................................................................... 118
Chapter 4 3D printing of alkali activated materials ................................................. 120
4.1 Introduction .......................................................................................................... 120
4.2 Experimental investigation ................................................................................... 124
4.2.1 Materials and mixing ..................................................................................... 124
4.2.2 3D printing ..................................................................................................... 125
4.2.3 Data preparation ............................................................................................. 126
4.2.4 Printing parameters ........................................................................................ 127
4.2.4.1 Extrudability ............................................................................................ 127
4.2.4.2 Printability window ................................................................................. 127
4.2.4.3 Buildability .............................................................................................. 127
4.2.4.4 Open time ................................................................................................ 130
4.2.4.5 Adhesion ................................................................................................. 130
4.2.4.6 Conductivity ............................................................................................ 132
4.3 Results and discussion .......................................................................................... 133

viii
4.3.1 Extrudability .................................................................................................. 133
4.3.2 Printability window........................................................................................ 135
4.3.3 Buildability .................................................................................................... 136
4.3.4 Open time ....................................................................................................... 140
4.3.5 Adhesion ........................................................................................................ 141
4.3.6 Conductivity-sensing capacity ....................................................................... 144
4.3.7 Workability .................................................................................................... 145
4.4 Conclusions .......................................................................................................... 145
Chapter 5 3D printed temperature-sensing coatings for concrete structures ........ 147
5.1 Introduction .......................................................................................................... 147
5.2 Methodology ........................................................................................................ 148
5.2.1 Materials and mixing ..................................................................................... 149
5.2.2 3D Printing overview ..................................................................................... 149
5.2.2.1 Data preparation ...................................................................................... 151
5.2.2.2 Concrete surface preparation................................................................... 152
5.2.2.3 Filament mixing and loading .................................................................. 153
5.2.2.4 Electrode insertion .................................................................................. 153
5.2.2.5 Curing ...................................................................................................... 154
5.2.3 Sensor testing ................................................................................................. 154
5.2.4 Adhesion testing ............................................................................................ 156
5.2.5 3D printing: tuning and improvement ........................................................... 156
5.2.6 The concrete substrate ................................................................................... 157
5.2.7 Shrinkage control ........................................................................................... 159
5.2.8 Electrode insertion ......................................................................................... 162
5.3 Results and discussion .......................................................................................... 163
5.3.1 Equivalent circuit modelling .......................................................................... 163
5.3.2 Printed sensor: impedance response to temperature ...................................... 165
5.3.3 Adhesion results ............................................................................................. 170
5.4 Conclusions .......................................................................................................... 173
Chapter 6 3D printed strain-sensing coatings for concrete structures ................... 175

ix
6.1 Introduction .......................................................................................................... 175
6.2 Types of self-sensing cementitious materials ....................................................... 176
6.2.1 Structural elements ........................................................................................ 176
6.2.2 Embedded cement-based sensors................................................................... 176
6.2.3 Cementitious sensing coatings ....................................................................... 176
6.3 Methodology ........................................................................................................ 178
6.3.1 Substrate preparation ..................................................................................... 179
6.3.1.1 Concrete substrates.................................................................................. 179
6.3.1.2 Glass fiber reinforced plastic sheets ........................................................ 179
6.3.2 3D printing and data preparation ................................................................... 180
6.3.3 Electrodes and curing..................................................................................... 181
6.3.4 Electrode configuration.................................................................................. 182
6.3.5 Loading schemes and data acquisition ........................................................... 184
6.3.5.1 Displacement controlled load cell ........................................................... 185
6.3.5.1.1 Segment 1 ......................................................................................... 186
6.3.5.1.2 Segment 2 ......................................................................................... 187
6.3.5.1.3 Segment 3 ......................................................................................... 188
6.3.5.2 Loading schemes and data acquisition for force controlled loading cell 188
6.3.6 Sensing response ............................................................................................ 189
6.4 Results and discussion .......................................................................................... 190
6.4.1 Sensing response ............................................................................................ 190
6.4.1.1 Initial sensing response of printed AAM coatings .................................. 190
6.4.1.2 Compression ............................................................................................ 191
6.4.1.2.1 50 mm cubes ..................................................................................... 191
6.4.1.2.2 100 mm cubes ................................................................................... 194
6.4.1.2.3 Adhesion effects ............................................................................... 196
6.4.1.2.4 Electrode configuration .................................................................... 199
6.4.1.3 Tension .................................................................................................... 203
6.4.1.4 4-point bending ....................................................................................... 207
6.4.2 Strain sensing evaluation ............................................................................... 211
6.4.2.1 Sensing performance ............................................................................... 211

x
6.4.2.2 Limitations of experimental setup ........................................................... 213
6.4.3 AAM sensors for damage detection ............................................................... 214
6.4.4 3D printing effects on sensing performance .................................................. 216
6.5 Conclusions .......................................................................................................... 217
Chapter 7 Deployment methods ................................................................................. 219
7.1 Introduction .......................................................................................................... 219
7.2 Methods of deployment ........................................................................................ 220
7.2.1 Gantry 3D printer ........................................................................................... 220
7.2.2 Robotic arm.................................................................................................... 222
7.3 Electrode placement ............................................................................................. 223
7.4 Sensing interrogation ............................................................................................ 223
7.5 Conclusions .......................................................................................................... 224
Chapter 8 Conclusions and future work .................................................................... 225
8.1 Conclusions .......................................................................................................... 225
8.2 Future work .......................................................................................................... 228
8.2.1 Understanding sensing performance .............................................................. 228
8.2.2 Improving sensing performance .................................................................... 228
8.2.3 Sensor size and placement ............................................................................. 229
8.2.4 Additional sensing applications ..................................................................... 229
8.2.5 Improving sensor fabrication ......................................................................... 230
8.2.6 3D printing ..................................................................................................... 231
8.2.7 Field and industrial application...................................................................... 231
8.2.7.1 Upgrading printing system ...................................................................... 231
8.2.7.2 Data interrogation and acquisition .......................................................... 232
8.2.7.3 Material properties .................................................................................. 232
Appendix ....................................................................................................................... 233
A.1 Calculation of molar ratios ................................................................................... 233
A.2 3D Printing ............................................................................................................. 236

xi
A.3 Repeatability of sensor .......................................................................................... 239
A.4 Strain sensing of alkali activated overlays .......................................................... 240
References ..................................................................................................................... 242

xii
List of Figures
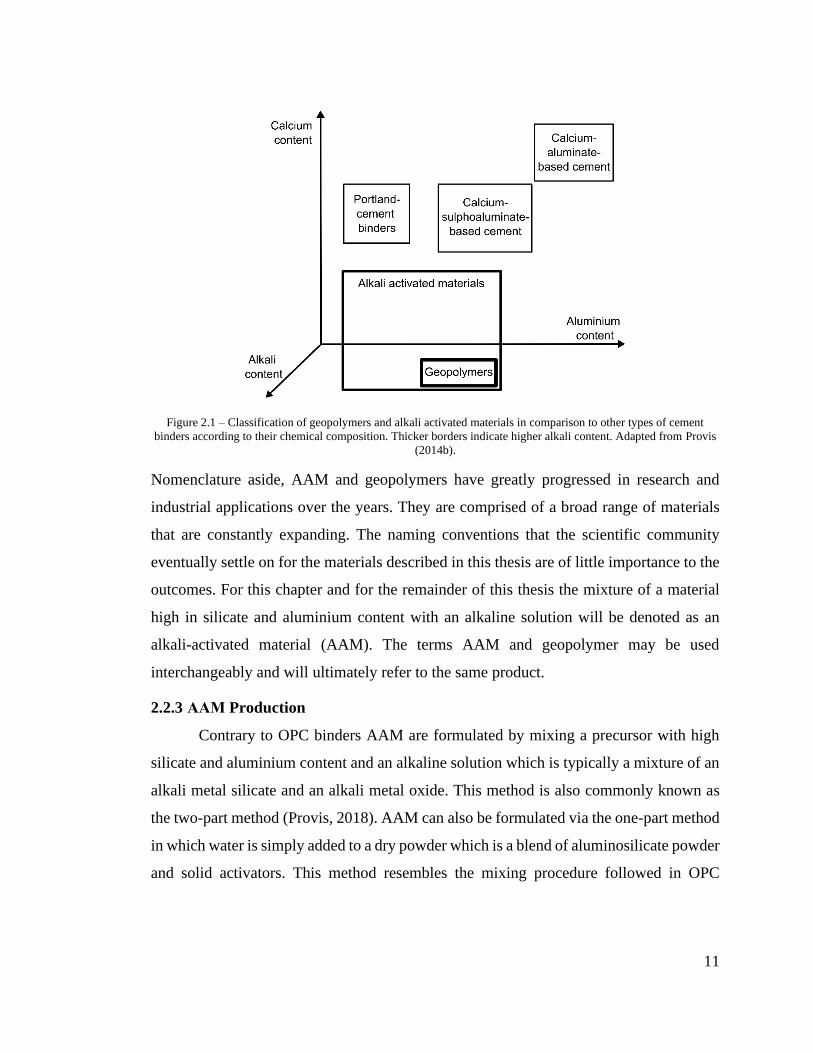
Figure 2.1 – Classification of geopolymers and alkali activated materials in comparison
to other types of cement binders according to their chemical composition. Thicker borders
indicate higher alkali content. Adapted from Provis (2014b). ......................................... 11
Figure 2.2 – Alkali activation and reaction products for low calcium and high calcium
binders. Adapted from (Provis and Bernal, 2014). .......................................................... 17
Figure 2.3 – Self-sensing AAM substrates a) metakaolin AAM with wound wires (Lamuta
et al., 2017) b) metakaolin AAM printed coating with stainless steel wires (Vlachakis et
al., 2020) c) fly ash AAM with stainless steel wires (Biondi et al., 2020). ..................... 33
Figure 2.4 – Equivalent Randles circuit. Adapted from Bard and Faulkner (2001). ....... 35
Figure 2.5 – Typical Nyquist plot (left) and Bode plot (right). Adapted from Bard and
Faulkner (2001). ............................................................................................................... 35
Figure 2.6 – Equivalent circuit of AAM (Biondi et al., 2020). ........................................ 37
Figure 2.7 – Electrode array for AAM sensing a) serial arrangement b) Van der Pauw
arrangement. ..................................................................................................................... 49
Figure 2.8 – Diagram of typical response of AAM under a) compression b) tension; The
x-axis represents the force, stress, or strain applied to the binder. The y-axis displays the
fractional change in resistance (or impedance) in relation to the external factors applied.
.......................................................................................................................................... 52
Figure 2.9 – Fractional change in resistivity of slag AAM under monotonic compression
for three filler contents, example adapted from Rovnaník et al. (2019a). ....................... 54
Figure 2.10 – Fractional change in resistivity of slag AAM under cyclic flexural loading,
example adapted from Rovnaník et al. (2019b). .............................................................. 55
Figure 2.11 – Schematic representation of model proposed for the direct piezoelectric
effect in AAM. The amorphous network is built from SiO4 and AlO4 tetrahedrons, which
are joined at the corners with oxygen. The distancing between the cations and the
framework (indicated by dashed lines) causes charge imbalance and the formation of local
dipoles. Adapted from Lamuta et al. (2016). ................................................................... 64

xiii
Figure 2.12 – 3D crystal structure of AAM and ion hopping of alkali metal under electric
field, adapted from Saafi et al. (2016).............................................................................. 65
Figure 2.13 – Self-sensing mechanism in AAM a) AAM sensor under stress, b) ion
diffusion pathway in the matrix and energy landscape, c) effect of the compressive stress
on the activation energy and hopping distance d; adapted from Saafi et al. (2018). ....... 65
Figure 2.14 – Fractional change in impedance-frequency response for 3D printed
metakaolin AAM between 10oC-30oC, adapted from Vlachakis et al. (2020). ............... 69
Figure 2.15 – Normalized impedance response of metakaolin 3D printed AAM patch to
temperature during four temperature cycles. Zmod is the modulus impedance at a given
temperature and Zmod,0 the initial modulus impedance at 10oC (Vlachakis et al., 2020). 72
Figure 2.16 – Characterization of temperature sensing response for OPC and AAM
binders. M refers to the reported electrical measurand (resistance, resistivity or impedance)
and M0 the value at 20 oC. ................................................................................................ 76
Figure 2.17 – A 3D calibration curve for a fly ash AAM, showing sensor response to both
moisture and temperature (Biondi et al., 2020)................................................................ 78
Figure 2.18 – Data preparation sequence for 3D printing. ............................................... 83
Figure 2.19 – Dispenser mounted onto x-y gantry system of commercial 3D printer. .... 84
Figure 3.1 – Mixing sequence of AAM formulation. .................................................... 103
Figure 3.2 – a) Top - X-ray diffractogram of kaolin. b) Bottom X-ray diffractogram of
metakaolin. Stick plots - Green is kaolinite, red is muscovite mica, blue is quartz, black is
halloysite, magenta is rutile, cyan is feldspar (albite). ................................................... 107
Figure 3.3 – Compressive strength for Mix 1 and Mix 2 for days 1, 7 and 28. Errors bars
represent standard deviation of compression tests for 5 samples. ................................. 108
Figure 3.4 – Compressive strength for Mix 2 for ambient cured and heat cured binders at
days 1, 7 and 28. Errors bars represent standard deviation of compression tests for 5
samples. .......................................................................................................................... 110
Figure 3.5 – Flexural strength for Mix 2 for ambient cured samples at days 1, 7 and 28.
Errors bars represent standard deviation of flexural tests for 3 samples........................ 113

xiv
Figure 3.6 – The average rate of heat release of metakaolin AAM over 3 hours (inset) and
over 72 hours. ................................................................................................................. 115
Figure 3.7 – Cumulative heat release of metakaolin AAM over 72 hours. ................... 116
Figure 4.1 – Flow chart of printing procedure. .............................................................. 124
Figure 4.2 – Cavity dispenser installed onto x-y gantry of commercial 3D printer....... 126
Figure 4.3 – G-Code representation of a) buildability ring and b) overlay for concrete
substrate.......................................................................................................................... 127
Figure 4.4 – Buildability investigation a) 30 layer buildability rings with 1 minute (left)
and 3 minute (right) time delay; b) 60 layer buildability rings with 1 minute (left) and 3
minute (right) time delay. ............................................................................................... 129
Figure 4.5 – Printed objects with different surface quality due head distance issues (head
distance increases from left to right). ............................................................................. 130
Figure 4.6 – Printed overlay for adhesion test a) schematic drawing of sample b) picture
of sample. ....................................................................................................................... 132
Figure 4.7 – Electrode configuration of printed coating. ............................................... 133
Figure 4.8 – Extrudability assessment of mix design by printing three 200 mm lines. . 135
Figure 4.9 – Printability window test for 120 minutes at 10 minute intervals. .............. 136
Figure 4.10 – Degree of buildability for buildability rings between 2-10 layers with a time
delay between layers 1 minute. Errors bars represent standard deviation of 10
measurements per sample for 10 samples. ..................................................................... 138
Figure 4.11 – Ten layer printed buildability ring. .......................................................... 139
Figure 4.12 – Comparison of degree of buildability for buildability rings between 5-10
layers with time delays between layers 1 and 3 minutes. Errors bars represent standard
deviation of 10 measurements per sample for 10 samples. ............................................ 139
Figure 4.13 – Variations in concrete surfaces after wire brushing a) rough surface with
exposed aggregates b) polished surface. ........................................................................ 142
Figure 4.14 – Typical printed coating deposited onto concrete cube. ........................... 143
Figure 4.15 – Adhesion strength of printed overlays at days 6, 28 & 97. Errors bars
represent standard deviation of measurements for 3 samples. ....................................... 143
xv
Figure 5.1 – 3D printing setup showing the dispensing unit and an empty pressurized feed
cartridge.......................................................................................................................... 150
Figure 5.2 – Flow chart of printing and fine-tuning process. ........................................ 151
Figure 5.3 – G-Code representation of patch. ................................................................ 152
Figure 5.4 – a) Schematic diagram and b) photograph of AAM being extruded onto
concrete slab. .................................................................................................................. 153
Figure 5.5 – Printed sensor on a concrete substrate. ...................................................... 155
Figure 5.6 – Time-temperature series for temperature characterization. ....................... 156
Figure 5.7 – Examples of adverse print quality due to uneven concrete surface and head
distance. .......................................................................................................................... 159
Figure 5.8 – Cracked patch printed onto dry concrete substrate. ................................... 160
Figure 5.9 – Poor printing due to increased print speed: a) printing at 100 mm/s, and b)
printing at 50 mm/s. ....................................................................................................... 162
Figure 5.10 – Electrode insertion methods can be a) prearranged, or b) inserted after
printing. .......................................................................................................................... 163
Figure 5.11 – Equivalent circuit for AAM patches on concrete substrates (Biondi, 2020).
........................................................................................................................................ 164
Figure 5.12 – Typical Nyquist plot for the frequency range 10 Hz – 100 kHz of a) printed
patch. Inset displays magnified version of plot b) metakaolin AAM cube. ................... 167
Figure 5.13 – Nyquist plot for each temperature during a down cycle. ......................... 168
Figure 5.14 – Bode plot for each of temperature during a down cycle. ......................... 169
Figure 5.15 – Normalised impedance response of AAM patch to temperature during four
temperature cycles. Shaded region shows the 95% confidence interval of the fit for 10
impedance measurements for one sample. ..................................................................... 170
Figure 5.16 – Adhesion strength of ambient cured and heat cured coatings. Error bars
represent standard deviation of measurements acquired from 3 ambient cured samples and
5 heat cured samples. ..................................................................................................... 171
Figure 5.17 – Non-uniform contact due to the rough surface of the concrete substrate.
........................................................................................................................................ 173

xvi
Figure 6.1 – Schematic drawing of glass reinforced fiber plastic tensile tester piece. .. 180
Figure 6.2 – Patch placement and 4-point bending setup. ............................................. 181
Figure 6.3 – Electrode orientation of patches a) under compression, layout 1 voltage and
current are parallel to applied force (left), layout 2 voltage and current are perpendicular
to applied force (right) b) under tension, voltage and current are parallel to applied force.
........................................................................................................................................ 183
Figure 6.4 – Electrode arrangement for patches printed on concrete beams. Voltage and
current were applied on the longer dimension of the patch. .......................................... 184
Figure 6.5 – Diagram of mechanical tests conducted. ................................................... 185
Figure 6.6 – Qualitative representation of step loading pattern of patches for six cycles.
........................................................................................................................................ 187
Figure 6.7 – Qualitative representation of cyclic loading pattern of samples for 40 cycles.
........................................................................................................................................ 188
Figure 6.8 – Compression and tensile behavior of patches printed on GFRP sheets under
loading Segment 1. ......................................................................................................... 191
Figure 6.9 – Sensing response of patch printed on 50 mm cube under compression for
loading: (top) Segment 1 (cycles 1-6) and (bottom) loading Segment 3 (cycles 47-52).
........................................................................................................................................ 192
Figure 6.10 – Hysteresis plot for one patch under compression for all six loading cycles
of loading Segment 3. .................................................................................................... 193
Figure 6.11 – Average fractional change in impedance versus strain for patches under
compression for six load cycles in segment 3. Error bars represent standard deviation of
six load cycles with three impedance measurements per cycle for one sample. ............ 194
Figure 6.12 – Fractional change in impedance versus time for patches printed on 100 mm
cubes. .............................................................................................................................. 195
Figure 6.13 – Average fractional change in impedance versus applied stress for 100 mm
concrete cubes for 6 load cycles. Error bars represent standard deviation of six load cycles
with three impedance measurements per cycle for one sample. .................................... 196
Figure 6.14 – Slightly debonded patch printed on concrete cube. ................................. 197

xvii
Figure 6.15 – Fractional change in impedance versus time for one slightly debonded patch
printed on 100 mm concrete cube. ................................................................................. 198
Figure 6.16 – Fractional change in impedance against time for one sample with clear
debonding for loads up to 7 MPa. .................................................................................. 199
Figure 6.17 – Fractional change in impedance under compression for samples employing
electrode layout 2. .......................................................................................................... 201
Figure 6.18 – Average fractional change in impedance versus applied stress for samples
for 3 load cycles while using electrode layout 2. Error bars represent standard deviation
of six load cycles with three impedance measurements per cycle for one sample. ....... 202
Figure 6.19 – Sensing response of patch printed on GFRP sheet under tension for (top)
loading Segment 1 (cycles 1-6) and (bottom) loading Segment 3 (cycles 47-52). ........ 204
Figure 6.20 – Typical hysteresis plot of fractional change in impedance versus
displacement for 3 load cycles under tension for one patch printed on GFRP sheets. .. 205
Figure 6.21 – Average fractional change in impedance versus tensile strain for patch
printed on GFRP sheet for 3 load cycles. Error bars represent standard deviation of six
load cycles with three impedance measurements per cycle for one sample. ................. 206
Figure 6.22 – Nonlinear sensing response of one patch printed on GFRP sheet under high
loads under tensile strain. ............................................................................................... 207
Figure 6.23 – Sensing response of patch printed on concrete beam under 4-point bending
for (top) loading Segment 1 (cycles 1-6) and (bottom) loading Segment 3 (cycles 47-52).
........................................................................................................................................ 208
Figure 6.24 – Fractional change in impedance versus applied strain under linear region for
one patch under 4-point bending for last load cycle of Segment 3. ............................... 210
Figure 6.25 – Nonlinear response of one patch printed on a concrete beam under 4-point
bending for one load cycle. ............................................................................................ 211
Figure 6.26 – Change in impedance for damaged patch under compression................. 216
Figure 7.1 – Patch printed onto 200 mm × 200 mm concrete slab. ............................... 220

xviii
Figure 7.2 – Extrusion of patch onto 1000 mm concrete beam with the use of stationary
3D printer. The walls of the printer were removed and supports were used to accommodate
the size and weight requirements of this application. .................................................... 222
Figure 7.3 – Robotic dispensing system at Civil Automation Group - Photo courtesy of
Jack McAlorum. ............................................................................................................. 223
Figure A.1 – Extrudability issues due to high liquid mix. ............................................. 236
Figure A.2 – Patches with rounded corners due to high liquid content. ........................ 237
Figure A.3 – Solidification of alkali activated mix inside dispenser. ............................ 237
Figure A.4 – Dried interface due to prolong delay time between layers. ...................... 238
Figure A.5 – Delamination of patch during coring for adhesion tests. .......................... 238
Figure A.6 – Temperature and humidity conditions of testing environment for standard
working hours. ............................................................................................................... 240
Figure A.7 – Loading segment 2 for patch in tension. ................................................... 241

xix
List of Tables
Table 2.1 – Effect of molar ratio and impact on metakaolin AAM binders. ................... 20
Table 2.2 – Reported studies on mixing sequence of AAM. ........................................... 23
Table 2.3 – Reported conductivity for AAM under ambient-near ambient conditions.
Notations- sodium silicate (Na2SiO3), sodium hydroxide (NaOH), potassium silicate
(K2SiO3), potassium hydroxide (KOH), silicon (Si), aluminium (Al), sodium (Na),
potassium (K), Phosphorus (P). ....................................................................................... 40
Table 2.4 – Electrode configuration for AAM sensing applications. .............................. 46
Table 2.5 – Strain sensing performance of AAM. Notations-sodium silicate (Na2SiO3),
sodium hydroxide (NaOH), sodium carbonate (Na₂CO₃), potassium silicate (K2SiO3),
potassium hydroxide (KOH). ........................................................................................... 59
Table 2.6 – Strain sensing performance of AAM with no conductive filler. Notations-
sodium silicate (Na2SiO3), sodium hydroxide (NaOH), potassium silicate (K2SiO3),
potassium hydroxide (KOH). ........................................................................................... 67
Table 2.7 – Temperature sensing response of AAM. ...................................................... 74
Table 2.8 – Parametric constants for the fits for temperature characterization of OPC and
AAM binders. ................................................................................................................... 75
Table 2.9 – Could literature be found that demonstrated sensing techniques in OPC and
AAM? ............................................................................................................................... 79
Table 2.10 – Common terminology used in printing applications ................................... 85
Table 3.1 – Chemical composition of kaolin and silica fume is as provided by suppliers
and metakaolin through XRD analysis. ......................................................................... 101
Table 3.2 – Mass ratios of mixing constituents.............................................................. 101
Table 3.3 – Molecular composition of Mix design 1 and Mix design 2 ........................ 102
Table 3.4 – wt% mineral phase assemblage for kaolin powder ..................................... 105
Table 3.5 – Mass ratio and percentage of water content in Mix 1 and Mix 2................ 109

xx
Table 4.1 – Printing parameter relevance. ..................................................................... 123
Table 4.2 – Concrete mix design for adhesion test. ....................................................... 131
Table 5.1 – Functional requirements for 3D printed self-sensing materials. ................. 157
Table 6.1 – Comparison between 'supportive' sensing elements. .................................. 177
Table 6.2 – Specifications of glass reinforced fiber sheet as provided by manufacturer.
........................................................................................................................................ 180
Table 6.3 – Sensing performance of AAM coatings. ..................................................... 212

xxi
Abbreviations
AAM Alkali activated materials
AC Alternating current
ASTM American Society for Testing and Materials
BET Brunauer–Emmett–Teller
BS British Standard
CAD Computer-aided design
CF Correction factor
DC Direct current
DIW Direct ink writing
EN European Standard
GF Gauge factor
GFRP Glass fiber reinforced plastic
GGBFS Ground granulated blast-furnace slag
LVDT Linear variable differential transformer
OGTC Oil & Gas Technology Centre
OPC Ordinary Portland cement
PP Polypropylene
PVA Polyvinyl alcohol
RILEM Réunion Internationale des Laboratoires et Experts
des Matériaux, systèmes de construction et ouvrages

xxii
SSC Stress sensitivity coefficient
STL Stereolithography
UK United Kingdom
US United States
VDP Van der Pauw
XRD X-ray diffraction
XRF X-ray fluorescence

1
Chapter 1 Introduction
1.1 Introduction
Structural health monitoring of ageing civil assets can inform timely maintenance
and ensure ongoing infrastructure resilience. Structural heath monitoring data are obtained
by the deployment of sensing devices such as transducers, strain gauges and fiber optic
sensors onto civil infrastructure (Cawley, 2018). This allows frequent auditing and
evaluation of civil infrastructure under external stimulants such as strain, temperature and
moisture.
Recent approaches to acquiring the data for structural health monitoring have made use of
self-sensing cementitious materials. These materials are considered ‘smart materials’ as
they behave as structural elements (e.g. slabs and beams) and sensing elements at the same
time. This multifunctional behavior is advantageous as it can to reduce the number of steps
involved in the deployment of an instrumented asset (Chung, 2021; Ding et al., 2019a; Z.
Tian et al., 2019). One of the drawbacks associated with self-sensing materials though is
their reliance on conductive fillers. This significantly increases cost, particularly in large
scale civil engineering applications.
An efficient means of approaching this problem would be to apply self-sensing
cementitious overlays or coatings onto specific areas of interest for localized health
monitoring. Such cementitious overlays could even act as a localized repair. This would

2
reduce the cost and volume of material required and avoid the added complexities of
formulating self-sensing mix designs at large volumes.
Alkali activated materials (AAM) are ideal candidates for self-sensing overlays for
concrete structures. Their chemical microstructure provides them with enhanced electrical
properties when compared to conventional ordinary Portland cement (OPC) binders and
they therefore do not require conductive fillers to be used in sensing applications (Lamuta
et al., 2016; Saafi et al., 2018). This minimizes costs and improves the scaleability of these
materials when compared to conductive filler-based self-sensing cements.
Self-sensing materials alone, however, will not lead to wider deployment of structural
health monitoring. The construction sector has seen a decline in its available workforce
(Juricic et al., 2021), as construction sites are harsh and hazardous working environments
that pose significant risks to workers (Eaves et al., 2016; Peng and Chan, 2020). These
factors are already impacting the construction sector’s ability to deliver traditional work,
let alone the deployment of new monitoring methods. Alternatives to manual labour need
to be sought. Additive manufacturing of cementitious materials has seen great rise over
the past years. Construction elements can be fabricated in a layer-by-layer process without
relying on the use of additional formwork. This method is able to significantly increase
consistency, minimize construction time, labor costs and waste material while at the same
time providing greater accessibility and a safer means of construction (Hossain et al., 2020;
Manuel et al., 2019; Mohammad et al., 2020; Wong et al., 2018). Moreover, additive
manufacturing follows similar fabrication approaches for onsite and offsite applications
when compared to existing in-situ and ex-situ castings methods.
The work described in this thesis aims to develop and deploy self-sensing AAM overlays
using additive manufacturing methods. This will allow for the remote, automated
deployment of an inherently multi-functional material. It is the author’s hope that this will
lead to the provision of a scaleable and sustainable alternative monitoring approach for
existing and newly developed civil infrastructure, and lead to a greater uptake of structural
health monitoring across the construction sector.

3
1.2 Research contribution
The research contributions of the work carried out in this thesis are briefly summarized as
follows:
• Review of alkali activated materials and subsequent experimental investigation of
printable metakaolin AAM binders. The experimental investigation demonstrates
the successful fabrication of AAM. The procedures followed in this analysis will
be used for the development of AAM sensors.
• Review of the reported sensing applications of alkali activated materials and an
analysis of the current state-of-the-art in strain, temperature and moisture AAM
sensing. The review provides the current understanding of AAM sensors and
outlines common experimental methodologies that are followed. The extent and
limitations of this technology are highlighted and recommendations for future
applications are also made.
• Review of 3D printing cement-based materials and the experimental investigation
of printing AAM overlays/patches onto concrete substrates. The review outlines
standard experimental methodologies that are followed in cementitious printing.
These methodologies are adjusted and assessed accordingly to meet the fabrication
requirements of AAM sensing overlays.
• Experimental investigation of the temperature sensing response of AAM patches.
This examines the feasibility of using AAM as temperature sensors. This also
provides a greater understanding of the behaviour of AAM sensors which can
allow for further monitoring investigations in the future.
• Exploring the potential of using AAM patches as strain sensors. The behaviour
under common strain conditions is examined and additional factors that may affect
sensing performance are also addressed. Assessing the strain behavior of AAM
sensors paves the way for future field and industrial applications.

4
1.3 Thesis outline
The outline of this thesis follows:
Chapter 2 reviews the literature on AAM, self-sensing AAM and 3D printing cementitious
materials. An overview of these scientific fields is presented. The extents and current
limitations are highlighted and recommendations are also provided. The experimental
investigation in subsequent chapters of this thesis will be based on the theory provided in
this chapter.
Chapter 3 presents the experimental investigation of AAM. This chapter focuses on the
fabrication of these materials and their mechanical properties. This ensures the proper
performance of AAM and allows for further investigations in the following chapters.
Chapter 4 focuses on 3D printing AAM overlays that aim to be used in sensing
applications. The design process is based on existing guidelines that have been reported for
cementitious printing applications. These design requirements were tailored and expanded
accordingly to fit the mix design requirements for this application.
Chapter 5 outlines the temperature sensing behavior of printed AAM patches. The
temperature sensing relationship and mechanical bond strength of the overlays to the concrete
substrate are described. Factors affecting the integrity of the patches are also explored in
this chapter.
Chapter 6 investigates the potential of using printed AAM overlays as strain sensors under
compression, tension and 4-point bending. Considerations that must be made in sensing
overlays are mentioned and potential avenues for future work are described.
Chapter 7 discusses potential applications and deployment methods for printed self-
sensing AAM patches. Potential means of upscaling this technology are also presented.
Chapter 8 presents the conclusions and future work for this thesis. Recommendations on
improving the technology are made, and pathways for future research and applications are
outlined.
5
1.4 Research output
The research output derived from this thesis and related scientific work the author of this
thesis has taken part in is depicted below.
1.5 Journal articles
Biondi, L.; Perry, M.; Vlachakis, C.; Wu, Z.; Hamilton, A.; McAlorum, J. Ambient Cured
Fly Ash Geopolymer Coatings for Concrete. Materials (Basel). 2019, 12, 923,
doi:10.3390/ma12060923.
Biondi, L.; Perry, M.; McAlorum, J.; Vlachakis, C.; Hamilton, A. Geopolymer-based
moisture sensors for reinforced concrete health monitoring. Sensors Actuators, B Chem.
2020, 309, 127775, doi:10.1016/j.snb.2020.127775.
Vlachakis, C.; Perry, M.; Biondi, L.; Mcalorum, J. 3D printed temperature-sensing repairs
for concrete structures. Addit. Manuf. 2020, 34, 101238,
doi:10.1016/j.addma.2020.101238.
Vlachakis, C.; Perry, M.; Biondi, L. Self-Sensing Alkali-Activated Materials : A Review.
Minerals 2020, 10, 885, doi:10.3390/min10100885.
McAlorum, J.; Perry, M.; Vlachakis, C.; Biondi, L.; Lavoie, B. Robotic spray coating of
self sensing metakaolin geopolymer for concrete monitoring. Autom. Constr. 2021, 121,
103415, doi:10.1016/j.autcon.2020.103415.
Biondi, L.; Perry, M.; McAlorum, J.; Vlachakis, C.; Hamilton, A., Lo. H, Alkali-activated
cement sensors for sodium chloride monitoring. IEEE Sensors. 2021, in review for minor
revisions.
1.6 Conference papers
Biondi, L.; Perry, M.; Vlachakis, C.; Hamilton, A. Smart cements: repairs and sensors for
concrete assets, Proceedings SPIE 10598, Sensors and Smart Structures Technologies for
Civil, Mechanical, and Aerospace Systems 2018, Denver, Colorado, USA.

6
Vlachakis, C.; Biondi, L.; Perry, M. 3D printed smart repairs for civil infrastructure, 9th
European Workshop on Structural Health Monitoring Series (EWSHM) 2018, Manchester,
UK.
McAlorum, J.; Perry, M.; Vlachakis, C.; Biondi, L. Autonomous Application of Smart
Cement Sensor-repairs, 12th International Workshop on Structural Health Monitoring
(IWSHM) 2019, Stanford, California, USA.
Vlachakis, C.; Biondi, L.; McAlorum J.; Perry, M. Self-Sensing 3D Printed Repair for
Concrete Substrates, 12th International Workshop on Structural Health Monitoring 2019
(IWSHM), Stanford, California, USA.
McAlorum, J.; Vlachakis, C.; Perry, M. A Low-Cost Electrical Impedance Analyser for
Interrogating Self-Sensing Cement Repairs, IEEE International Instrumentation and
Measurement Technology Conference (I2MTC) 2021, Glasgow UK.
Tshimbombo, T.; Perry, M.; Hoy, C., Tzoura, E.; Vlachakis, C.; McAlorum, J. "Robotic
Installation of Wireless Strain Gauges into Precast Concrete Elements, IEEE International
Instrumentation and Measurement Technology Conference (I2MTC) 2021, Glasgow UK.
Perry, M.; Biondi, L.; McAlorum, J.; Vlachakis, C. Self-Sensing Concrete Repairs Based
on Alkali-Activated Materials: Recent Progress, IEEE International Instrumentation and
Measurement Technology Conference (I2MTC) 2021, Glasgow UK.
Vlachakis, C.; Perry, M.; McAlorum, J. 3D Printed Self-Sensing Alkali-Activated
Coatings for Civil Infrastructure, IEEE International Instrumentation and Measurement
Technology Conference (I2MTC) 2021, Glasgow UK.
1.7 Funding
This work was supported in part by the Royal Society (grant number RG160748) and the
Oil & Gas Technology Centre (OGTC).

7
8
Chapter 2 Literature review
In this chapter a literature review on alkali activated materials, self-sensing alkali activated
materials1 and 3D printing cementitious materials is presented. The theory covered in this
chapter will be used for the development of 3D printed AAM sensors for concrete
structures in Chapters 3, 4, 5 & 6.
2.1 Introduction
3D printing AAM sensors for concrete structures is a multidisciplinary field that
consists of alkali activated materials, self-sensing alkali activated materials and 3D
printing cementitious materials. Adequate understanding in each of these fields is required
to ensure the proper development of this technology. In this chapter literature on alkali
activated materials, self-sensing alkali activated materials and 3D printing cementitious
materials is presented. The purpose of this chapter is to cover the necessary theory behind
each respective area to allow for the successful experimental investigation of 3D printed
AAM sensors in the upcoming chapters.
2.2 Alkali activated materials
2.2.1 Introduction
Alkali activated materials (AAM) are an emerging alternative to ordinary Portland
cements which have gained intensive interest over the past decades. AAM concretes attain
1 The section on self-sensing alkali activated materials was published in the Special Issue Alkali Activated Materials:
Advances, Innovations, Future Trends Vlachakis, C.; Perry, M.; Biondi, L. Self-Sensing Alkali-Activated Materials: A
Review. Minerals 2020, 10, 885. https://doi.org/10.3390/min10100885. Minor changes have been made to follow the
updated literature in this field.

9
similar mechanical properties to ordinary Portland cement (OPC) concretes, but are
thought to be more sustainable due to their lower embodied carbon (Habert and Ouellet-
Plamondon, 2016). While these materials have already seen use in industrial applications,
the widespread use of these materials is somewhat hindered by the specialist knowledge
required for fabrication, high alkalinity of the materials used and workability issues
particularly at large volumes. Nevertheless, extensive research on AAM has been
conducted in recent years. A considerable number of reviews on AAM are available at the
time of writing (Assi et al., 2020; Bernal and Provis, 2014; Farhan et al., 2020; Mabroum
et al., 2020; Mendes et al., 2021; Provis, 2018, 2014a; Provis and Bernal, 2014; A. Wang
et al., 2020). Research in this field is ongoing and reviews are being published at a high
pace to keep up with the current state of the art. Therefore, the purpose of this section is
to not provide a full in-depth review of AAM but rather present a general overview on
what AAM are and how they are formulated, so that the steps in designing printed AAM
sensors are clear.
2.2.2 Alkali activated materials and geopolymers
The use of alkali-activated materials within construction is not a new concept.
Multiple studies on the formation of binders with the use of alkaline solutions were carried
out throughout the 20th century (Krivenko, 2017). Claims have also been made that a
primal form of this technology was present in historical monuments dating back to 600
A.D (Davidovits et al., 2019). Prominent research in this field was carried out by
Davidovits in the 1970s in which calcined clay (metakaolin) was mixed with alkaline
solutions to develop heat resistant inorganic materials (Davidovits, 1991). Davidovits
coined the term ‘geopolymer’ which was then regarded as a material with an amorphous
to semi-crystalline three-dimensional silico-aluminate structure of the following types:
Poly(sialate) (Si-O-Al-O-)
Poly(sialate-sixolo) (Si-O-Al-O-Si-O)
Poly(sialate-disixolo) (Si-O-Al-O-Si-O-)

10
The composition of geopolymers was represented by the empirical formula equation (2.1):
Mn(SiO2)z – AlO2n·wH2O (2.1)
Where M is the alkali metal cation, usually Na+ or K+; ‘n’ is the degree of
polycondenstation; z is the oligomeric building unit (Si/Al ratio):1,2,3; and w is the molar
ratio of water and the alkali cation.
The term geopolymer derived from the word polymer as the material was able to transform,
polycondense and adopt a shape at temperatures below 100 oC. At the same time it is a
mineral material which is hard, weather resistant and can withstand high temperature, thus
it was named a ‘geo’ - polymer (Davidovits, 1991, 1989). The term geopolymer was quite
popular and is still used today, albeit in a rather more generic manner than its initial
meaning.
Following the research carried out by Davidovits (1991), research in geopolymers
progressed quite rapidly. Extensive research was carried out by van Deventer, Duxson,
Provis and colleagues at the University of Melbourne, Australia (Duxson et al., 2005b,
2007a; Provis et al., 2005a; Provis et al., 2005b). As research in geopolymers expanded,
confusion and disagreements started to arise as to what should be regarded as a
geopolymer and what should not. Various names have been used, and are still used today,
to characterize the mixture of a materials high in silicate and aluminium content with an
alkaline solution. Such names include inorganic binders, green cements, alkali activated
cements, aluminosilicate binders, alkali activated binders, alkali activated materials etc.
In recent years, geopolymers have been considered to represent a small category of
materials in a larger group of materials called ‘alkali activated materials’ and in particular
‘low calcium alkali activated materials’. Figure 2.1 portrays the characterization of alkali-
activated materials, geopolymers and various types of cements in regards to calcium,
aluminium and alkali content.
11
Figure 2.1 – Classification of geopolymers and alkali activated materials in comparison to other types of cement
binders according to their chemical composition. Thicker borders indicate higher alkali content. Adapted from Provis
(2014b).
Nomenclature aside, AAM and geopolymers have greatly progressed in research and
industrial applications over the years. They are comprised of a broad range of materials
that are constantly expanding. The naming conventions that the scientific community
eventually settle on for the materials described in this thesis are of little importance to the
outcomes. For this chapter and for the remainder of this thesis the mixture of a material
high in silicate and aluminium content with an alkaline solution will be denoted as an
alkali-activated material (AAM). The terms AAM and geopolymer may be used
interchangeably and will ultimately refer to the same product.
2.2.3 ΑΑΜ Production
Contrary to OPC binders AAM are formulated by mixing a precursor with high
silicate and aluminium content and an alkaline solution which is typically a mixture of an
alkali metal silicate and an alkali metal oxide. This method is also commonly known as
the two-part method (Provis, 2018). AAM can also be formulated via the one-part method
in which water is simply added to a dry powder which is a blend of aluminosilicate powder
and solid activators. This method resembles the mixing procedure followed in OPC

12
binders in which water is added to cement. While the two-part approach has seen most
study over the years, extensive focus has been given on the one-part method which is
expected to be the prominent method for future, particularly onsite, applications.
When designing two-part AAM the following factors need to be considered:
• Precursor
• Calcination if kaolin is used
• Alkaline solution
• Molecular composition
• Mixing sequence
• Curing
These aspects will be explored in the following chapters to allow for the development of
a functional AAM binder that will be used for sensing and printing purposes in the
following chapters.
2.2.3.1 Precursor
The main precursors that have been used in the production of AAM are metakaolin
(calcined clay), fly ash and ground granulated blast-furnace slag (GGBFS) (Provis, 2018).
They have seen arguably the most research out of all the potential AAM precursors. They
are also the prime materials used in the round robin tests conducted by the RILEM
technical committee in durability testing of AAM (Gluth et al., 2020; Provis et al., 2019;
Winnefeld et al., 2020).
Over the years the precursors used in AAM production have considerably expanded.
Examples of more recently used precursors are glass powder (Khan et al., 2021),
construction demolition waste (Komnitsas et al., 2015), volcanic ash (Zhou et al., 2021),
palm oil fuel ash (Ranjbar et al., 2014) and rice husk ash (Nuaklong et al., 2020).
Furthermore, blends of precursors are also common in AAM formulation (Alanazi et al.,
2019; Bernal et al., 2012; Vogt et al., 2019). Broadly, literature has mostly focused on
AAM formulated from:

13
• Fly ash: an industrial by-product of the combustion of pulverized coal (Amran et
al., 2021). According to American Standard ASTM C618 (ASTM C618-19, 2015)
fly ash can be classified as type C and type F. Class F consists a minimum of 70%
SiO2+Al2O3+Fe2O3 and up to 18% CaO (lower calcium content) whereas class C
fly ash consists of at least 50% SiO2+Al2O3+Fe2O3 and over 18% of CaO (high
calcium content). Both Class F and Class C can be used in AAM formulation (Guo
et al., 2010; Luan et al., 2020). The composition of fly ash displays high variability
as it depends on the source of the coal, degree of pulverization, combustion
conditions, collection of ash, handling and disposal methods. All these aspects
vary from plant to plant and show high variability (Amran et al., 2021).
• Slag: a waste product of the production of different types of metals comprising of
mainly silicate, alumina, calcium and magnesium. Depending on the cooling
method used slag can be air-cooled, expanded or granulated. The cooling method
that will be used will ultimately affect the chemical and mineral composition of
the slag produced. Blast-furnace slag is typically used in OPC and AAM
production. Typical chemical compositions that can be found in blast-furnace slag
are the following: 27-45% SiO2, 7-24% Al2O3, 31-50% CaO and 1-18% MgO
(Awoyera and Adesina, 2019; Wang, 2016).
• Metakaolin: derived from naturally available clay (as opposed to fly ash and slag
which are by-products). Metakaolin is pozzolanic material that is produced
through the calcination of kaolin clay. Metakaolin contains high aluminosilicate
content about 50–55% SiO2 and 40–45% Al2O3 (Rashad, 2013). According to
ASTM 618-19 (ASTM C618-19, 2015) metakaolin complies with the
requirements as Class N, natural pozzolan (SiO2 + Al2O3+Fe2O3≥ 70%).
Metakaolin was selected as the precursor for AAM formulation in the work
described in this thesis. It is considered a favorable precursor as its composition
contains low amounts of impurities allowing a more predictable design (Duxson
et al., 2007a). It is also obtained from a raw material that does not rely on additional
industrial processes thus making it more accessible to use.

14
2.2.3.2 Kaolin calcination
Metakaolin is attained from the dehydroxylation of kaolin clay, a material with
high content of kaolinite (Al2O3·SiO2·2H2O) in the temperature range of 450 oC-850 oC.
Calcining at lower temperatures results into an incomplete dehydroxylation of kaolin
whereas calcining at temperatures over 900 oC may result into the recrystallization of
kaolin into mullite. During the transformation phase the weight of the powder is reduced
by about 14% due to the removal of hydroxyl ions. The weight reduction is due to the
following reaction equation (2.2) (Rashad, 2013):
2SiO2·Al
2O
3·2H
2O → 2SiO
2·Al
2O
3 + 2H
2O ↑ (2.2)
Kaolin calcination is normally carried out with the use of an electric muffle furnace, a
rotary kiln or flash calcination in which clay passes through a flame for a few seconds
(Rashad, 2013). While flash calcination and rotary kilns present a robust methodology,
the results from using a muffle furnace are less repeatable. The basic approach when using
a furnace is quite straightforward, the furnace is set at peak temperature for a specific
amount of time. However, a universal standard does not exist due to the variety of material
compositions. Key factors that need to be taken into account when calcining kaolin are
the following:
• The conversion from kaolin to metakaolin is considered complete when all the
traces of kaolinite have been removed from the substance. This can be validated
through X-ray diffraction (XRD) analysis (Tironi et al., 2012).
• Calcination processes are frequently based on previous literature and typically
range between 650-800 oC for 2-24 hours (Rashad, 2013; Zhang et al., 2016).
• Different chemical compositions of the source kaolin can lead to different
temperatures and calcination durations (Badogiannis et al., 2005; Moodi et al.,
2011; Tironi et al., 2012).
• Factors such as rate of calcination can assist in better decomposition of kaolin
resulting into a higher quality metakaolin (Kenne Diffo et al., 2015).

15
• The means of calcination- furnace, rotary kiln or flash calcination- may also
impact the reactivity (Autef et al., 2013) and the workability of the resulting
metakaolin (Pouhet and Cyr, 2016).
Calcination methods are assessed via reactivity tests on the calcined clay. Such tests
include the Chapelle test2, Frattini test3, strength activity index4, isothermal calorimetry
and mechanical properties of binders. In most cases a combination of these tests is
practical as single tests may provide limited results (Alujas et al., 2015; Avet et al., 2016;
Tironi et al., 2013). It is important to point out thought that the Chappelle, Frattini and
strength activity index tests evaluate metakaolin’s ability to react with calcium with the
intention of serving as a supplementary material for OPC concrete. These tests though
may not provide an accurate representation of the effects of calcination on alkaline
activation. Wan et al. (2017a) stated dehydroxylation and recrystallization (and thus the
formation of mullite-an undesired effect) of metakaolin should be considered when
calcining clay for AAM formulation. It was also mentioned by the authors that similar
compressive strength was observed for metakaolin AAM for calcination temperatures
between 650-850 oC. In the current study assessing kaolin calcination was conducted
through XRD analysis in which the dehydroxylation of the source material and any
presence of mullite was investigated. If both these parameters were met, the calcination
process was deemed sufficient.
2.2.3.3 Alkaline solution
As mentioned in Section 2.2.3 the alkaline solution is a mixture of an alkali oxide-
MOH-and an alkali silicate-M2O∙rSiO2 where M is either Na+ or K+ (Provis, 2009). While
most applications involve a mixture of these two constituents, solutions using only silicate
2 1 g of metakaolin is mixed with 1 g of Ca(OH)2 and 100ml of water. The suspension is boiled for 16 h and the free
Ca(OH)2 is determined by means of sucrose extraction and titration with a HCl solution. 3 A blend of Portland cement and metakaolin is mixed with water. The sample is placed in an oven at 40 oC for a givn
time period. Samples are then vacuum filtered and allowed to cool down. The filtrate is then analysed for [OH-] and
[Ca2+]. The [Ca2+] and [OH-] contained in an aqueous solution that covers the hydrated sample at 40 °C for a given time
is compared with the solubility curve for calcium hydroxide in an alkaline solution at the same temperature. Test results
below this curve indicate removal of Ca2+ from solution which is attributed to pozzolanic activity. 4 Control Portland cement and blended Portland cement and metakaolin samples for compression testing are prepared.
Strength activity ratio is the ratio of strength of the control samples by the strength of the blended samples at the same
day. SAI>0.75 indicates high pozzolanic activity.

16
(Sun and Vollpracht, 2019) or hydroxide (Billong et al., 2018) have also been explored.
In general, an alkaline solution must have a suitable pH to initiate the alkaline activation
process (Duxson et al., 2007a). A high pH is required for the activation of metakaolin and
fly ash. Blast furnace slag requires a solution with a more moderate pH and can therefore
be activated with a larger variety of solutions (Provis, 2014a). Such solutions include
sodium carbonate (Bernal et al., 2014b) and sodium sulfate (Mobasher et al., 2016). Other
potential alkaline solutions include mixtures of sodium and potassium solutions (Palmero
et al., 2015) and phosphate activators (Y. S. Wang et al., 2018).
The activator plays a vital role in the production of AAM. Contrary to the precursor, it can
be tailored to meet the required molecular composition of the binder to achieve desired
performance.
2.2.3.4 Alkaline activation
Mixing the solid precursor with the alkaline solution initiates a series of reactions.
These reactions fall under the term alkaline activation5.
Multiple studies have been carried out focusing on the kinetics of alkaline activation
(Provis et al., 2008; Provis and van Deventer, 2007a,b; Zhang et al., 2012, 2013). The
initial models focused primarily on metakaolin and fly ash AAM (Provis and van Deventer,
2007a,b). Later models that were developed expanded and incorporated slag based AAM
as well (Provis and Bernal, 2014). Alkaline activation is a complex reaction that can be
broken down into smaller phases namely dissolution, gelation, reorganization and
hardening-strength development (Duxson et al., 2007a). Depending on the composition
and potential contaminants in AAM additional reactions may also occur (Duxson et al.,
2007a). In general, alkaline activation starts with the dissolution of the solid
aluminosilicate source by alkaline hydrolysis which in turn produces aluminate and
silicate species. Dissolution then results to the formation of a gel depending on the type
of AAM, sodium aluminosilicate hydrate (N-A-S-H), calcium aluminosilicate hydrate (C-
5 The reaction was initially labelled as ‘geopolymerisation’ deriving from the term geopolymer. Similar to how alkali
activated materials became the more prominent term to characterize these materials, alkaline activation has been adapted
as the more generic term.

17
A-S-H) etc. The product continues to rearrange and reorganize after gelation reaching a
hardened state and commences strength development (Duxson et al., 2007a; Provis et al.,
2008; Provis and van Deventer, 2007a). Alkali activation is affected by numerous factors
such as the silica-aluminium content, alkali cation, temperature, salts present (Provis et
al., 2008; Provis and van Deventer, 2007a,b; White et al., 2012; Zhang et al., 2012, 2013).
Figure 2.2 portrays the reaction products of alkali activation for both low calcium and high
calcium AAM.
Figure 2.2 – Alkali activation and reaction products for low calcium and high calcium binders. Adapted from (Provis
and Bernal, 2014).
2.2.3.5 Classifying AAM
AAM consist of an expanding group of materials which are difficult to classify. In
general, AAM are classified according to their calcium content and subsequently by the
notation introduced by Engelhardt (1989), Qn(mAl), where 0 ≤m ≤n ≤ 4, species. Q refers
to the silicon atom, n = 0–4 refers to the bridging oxygen atoms, and m the number of Al
neighbors. The notation Qn(mAl) is used to describe the connectivity of a silicon

18
tetrahedron bridged through oxygen to aluminum and to other silicon centers (Bernal and
Provis, 2014; Duxson et al., 2005b).
The two main groups are ‘low-calcium’ AAM and ‘high-calcium’ AAM. The former
group includes AAM made with metakaolin (which is almost if not entirely calcium free)
and fly ash (small amounts of calcium). In the latter group lies BFS and high calcium fly
ash AAM. High calcium AAM binders can be classified when the Ca/(Si + Al) ratio is
roughly 1 (Provis and Bernal, 2014). Low calcium AAM leads to N-A-S-H or potassium
aluminosilicate hydrates-K-A-S-H gels. This type of gel is structurally disordered and has
a highly cross-linked Q4-structure (Provis et al., 2005c), whereas high calcium-slag AAM
results in C-A-S-H gels similar to the calcium-silicate-hydrate (C-S-H) gels in OPC. The
gel contains silicate chains comprising Q1 and Q2 environments and low concentration of
Q3 sites in chain-bridging roles. In the cases of high calcium fly ash, certain types of slag
or blended precursors (e.g. metakaolin-slag, metakaolin-fly ash etc.) the resulting gel is
more complex. The nature of the gel is calcium-sodium-aluminosilicate-hydrate (C–N–
A–S–H) but can lead to the formation of C–A–S–H gel with secondary products (Bernal
and Provis, 2014; Ismail et al., 2014). The AAM used in this work is low-calcium AAM,
therefore the gel is expected to result in a N-A-S-H gel with structurally disordered and a
cross-linked Q4-structure. This allows for a more straightforward reaction avoiding any
potential secondary reactions in the binder.
2.2.4 Molecular composition
One of the most important differences between OPC and AAM binders is that the
former is a mixture of cement and water whereas the latter requires a precursor that is rich
in silica and aluminium and an alkaline solution. OPC mix designs are relatively simple
when compared to AAM as the mixing constituents have been well defined and
investigated over centuries. This has led to a strong understanding of the material allowing
users to reliably predict the performance of various mix designs. As a result, mass ratios
are almost exclusively used in OPC. The same cannot be said about AAM. While mass
ratios are easier to use and can provide, to a certain extent, adequate results, the available
source materials (precursor and solution) for the fabrication of AAM are quite broad.
19
Solely relying on mass ratios may not provide the entire picture of the AAM binder and
this will affect repeatability and reproducibility. As a result, molar ratios are an additional
consideration for AAM, as this provides more context on the composition of the binder
(Provis, 2014a). To date a standard mix design for AAM binders does not exist. Mix
designs are based on previous literature, RILEM recommendations and trial and error with
the available resources at hand.
2.2.4.1 Common molar ratios
The most common molar ratios that have been investigated in AAM are SiO2/Na2O
primarily in solution but also in binder, H2O/Na2O in solution, Na2O/Al2O3 in binder and
SiO2/Al2O3 in binder. Frequently Na/Al and Si/Al are also used in place of the Na2O/Al2O3
and SiO2/Al2O3 respectively. If a potassium-based solution is used, then Na2O and Na are
substituted with K2O and K respectively. Other ratios such as Ca/Si, CaO/SiO2,
CaO/Al2O3, MgO/Al2O3 may also be examined depending on the composition of the
binder.
Various studies have been conducted that examined the effects of molar ratios on the
performance and microstructure of AAM. This has allowed the progression and better
understanding of the materials. In general, the chemical composition of the alkaline
solution is what will ultimately influence the outcome of the binder. Over the years there
have been multiple studies to identify which ratios play the most important role in AAM
fabrication.
Table 2.1 displays the molar ratios that have been identified as the most impactful on
metakaolin AAM binders as reported in existing studies. For example, Lahoti et al. (2017)
conducted a comprehensive study on various molar ratios of metakaolin AAM. The results
showed that the Si/Al ratio is the most significant parameter in determining compressive
strength of AAM followed by the Al/Na ratio. It was also stated that unlike OPC, the
water/solids ratio is not a significant factor governing the compressive strength of the
binders. Riahi et al. (2020) stated that the Na2O/Al2O3 could be considered the most
important ratio in terms of mass loss and drying shrinkage. Similarly, Zhang et al. (2013,
2012) stated that the Na/Al has a more pronounced influence on the extent of alkaline
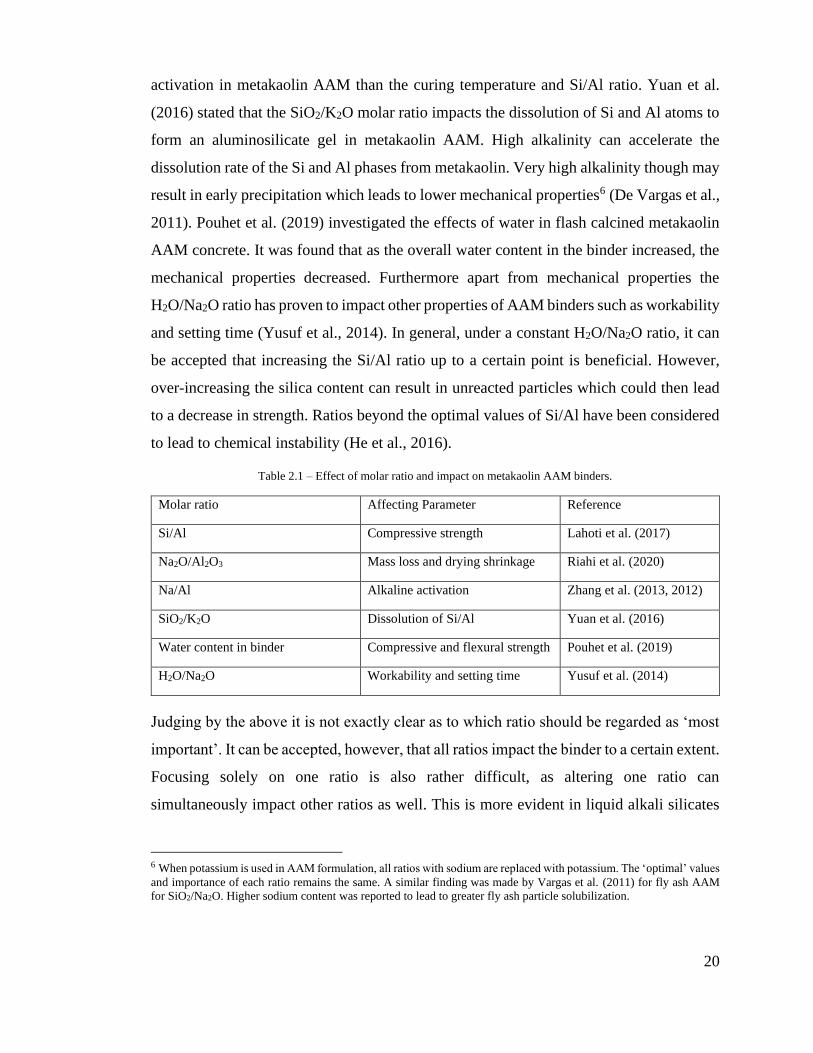
20
activation in metakaolin AAM than the curing temperature and Si/Al ratio. Yuan et al.
(2016) stated that the SiO2/K2O molar ratio impacts the dissolution of Si and Al atoms to
form an aluminosilicate gel in metakaolin AAM. High alkalinity can accelerate the
dissolution rate of the Si and Al phases from metakaolin. Very high alkalinity though may
result in early precipitation which leads to lower mechanical properties6 (De Vargas et al.,
2011). Pouhet et al. (2019) investigated the effects of water in flash calcined metakaolin
AAM concrete. It was found that as the overall water content in the binder increased, the
mechanical properties decreased. Furthermore apart from mechanical properties the
H2O/Na2O ratio has proven to impact other properties of AAM binders such as workability
and setting time (Yusuf et al., 2014). In general, under a constant H2O/Na2O ratio, it can
be accepted that increasing the Si/Al ratio up to a certain point is beneficial. However,
over-increasing the silica content can result in unreacted particles which could then lead
to a decrease in strength. Ratios beyond the optimal values of Si/Al have been considered
to lead to chemical instability (He et al., 2016).
Table 2.1 – Effect of molar ratio and impact on metakaolin AAM binders.
Molar ratio Affecting Parameter Reference
Si/Al Compressive strength Lahoti et al. (2017)
Na2O/Al2O3 Mass loss and drying shrinkage Riahi et al. (2020)
Na/Al Alkaline activation Zhang et al. (2013, 2012)
SiO2/K2O Dissolution of Si/Al Yuan et al. (2016)
Water content in binder Compressive and flexural strength Pouhet et al. (2019)
H2O/Na2O Workability and setting time Yusuf et al. (2014)
Judging by the above it is not exactly clear as to which ratio should be regarded as ‘most
important’. It can be accepted, however, that all ratios impact the binder to a certain extent.
Focusing solely on one ratio is also rather difficult, as altering one ratio can
simultaneously impact other ratios as well. This is more evident in liquid alkali silicates
6 When potassium is used in AAM formulation, all ratios with sodium are replaced with potassium. The ‘optimal’ values
and importance of each ratio remains the same. A similar finding was made by Vargas et al. (2011) for fly ash AAM
for SiO2/Na2O. Higher sodium content was reported to lead to greater fly ash particle solubilization.

21
and hydroxides. Certain ratios may unachievable due to the composition of the liquids.
For example, in order to increase the silica content of the solution, more liquid silicate
will be required to be added to the alkaline solution. By doing so, apart from the
Na2O/SiO2 ratio this will affect the H2O/Na2O ratio of the solution as well as the silicate
itself contains high content of water. For this reason, studies that focus on the chemical
composition of AAM typically use both solid and liquid activators as this approach allows
more freedom in achieving the desired molar ratios (Bernal et al., 2012; Duxson et al.,
2005a; Lahoti et al., 2017). However, silicates and hydroxides both in liquid form are
simpler and more convenient to use. It is also important to point out that different molar
ratios apply to different precursors. In continuation, different ratios may also apply to the
same precursor depending on its chemical composition e.g. low calcium fly ash and high
calcium fly ash, Mg content in blast furnace slag etc. The work outlined in this thesis aims
to develop a simple yet consistent binder that will be used in sensing and printing
applications. As a result metakaolin AAM was used for this investigation. A combination
of both molar and mass ratios will be used to assess the performance of the binder.
2.2.4.1.1 Metakaolin AAM
In the case of metakaolin AAM, the desired molecular composition is rather
clearer when compared to fly ash and slag AAM7. Metakaolin based binders have seen
optimal performance for molar ratios around Si/Al=2 (SiO2/Al2O3=3.0-3.6), Na/Al=1
(Na2O/Al2O3=1), SiO2/Na2O (in solution)=1.5-2, SiO2/Na2O (in binder)=4.0,
H2O/Na2O=11-12 (Batista et al., 2019; Bernal et al., 2012; Borges et al., 2017; Duxson et
al., 2007b; He et al., 2016; Kamseu et al., 2017; Liu et al., 2020; Ozer and Soyer-Uzun,
2015; Pouhet and Cyr, 2016; Riahi et al., 2020; Rocha et al., 2018; Sarkar and Dana, 2021;
7 Different ratios apply for other types of precursors. Molar ratios that have been used for Class F fly ash are Si/Al=2.40-
3.0, SiO2/Na2O (in solution)=1.5-2.3 (Bocullo et al., 2021; Fan et al., 2018; Provis et al., 2019; Zhou et al., 2016). Molar
ratios for GGBFS are not as clear. Several studies have focused on the modulus of the solution (Jiao et al., 2018;
Mobasher et al., 2016; Sisol et al., 2019). Slag AAM is also influenced by the Mg and TiO2 content (Bernal et al., 2014d;
Haha et al., 2011; Park et al., 2020) and the type of alkali activation e.g. sulphate and carbonate activation (Bernal et al.,
2016, 2014a). In red clay brick waste AAM applications the SiO2/Al2O3 ratios have exceeded 7 (Mahmoodi et al., 2020;
Robayo et al., 2016). For AAM with blends of red clay brick and tungsten mining waste with Si/Al ratios between 1.36-
2.16, the highest compressive strength was viewed at Si/Al=1.36 (Sedira et al., 2018).
22
Silva et al., 2007; Wan et al., 2017b; Zhang et al., 2017) . Common liquid-solid ratios
range between 0.8-1.2 (Batista et al., 2019; Bature et al., 2021; Cai et al., 2020a).
2.2.5 Mixing sequence
Studies investigating the mixing sequence of AAM are few and far between. The
difficulty in selecting an optimal mix sequence primarily derives from the point of
introduction of the alkaline solution. As mentioned in Section 2.2.3.3 the alkaline solution
consists of a silicate and a hydroxide. These can be both in liquid or solid form or a
combination of the two. In most studies it is common for the alkaline solution to be
prepared beforehand. However, these two solutions can also be added to the binder
separately as well. Ways of assessing the mixing sequence involve assessing the
mechanical properties of the binder, workability and cost (Junaid et al., 2015). Table 2.2
displays various sequences that have been explored in mixing sequence investigations8.
8 Mixes with multiple precursors or filler were not covered in the studies in Table 2.2. When multiple precursors are
employed, they are first dry mixed for a few minutes to ensure a homogeneous distribution. The solids and liquids are
then added together and mixed accordingly (Luan et al., 2020; Xu et al., 2017; Zaheer et al., 2016). Depending on the
type of filler, it can be added in water or the solution and sonicated to achieve uniform dispersion (Candamano et al.,
2019; Deng et al., 2019) or added directly to the mix (Batista et al., 2019).

23
Table 2.2 – Reported studies on mixing sequence of AAM.
Mixing sequence No. Ref
Alkaline solution->precursor+aggregates (if required)-> Mix liquids and solids 1 (Junaid et al.,
2015),
(Suwan and
Fan, 2017)
(Dassekpo et
al., 2017)
Alkaline solution (no cooldown)-> precursor+aggregates (if required)-> Mix
liquids and solids
2 (Dassekpo et
al., 2017)
Precursor+hydroxide->silicate->aggregates (if present)->water if needed 3 (Junaid et al.,
2015),
(Suwan and
Fan, 2017)
Aggregates+precursor+silicate->hydroxide->water 4 (Dassekpo et
al., 2017)
Aggregates+precursor->silicate->hydroxide->water 5 (Junaid et al.,
2015)
Aggregates+precursor+hydroxide -> silicate ->water 6 (Dassekpo et
al., 2017)
Silicate+hydroxide (solid)-> precursor->water 7 (Kobera et
al., 2011)
Hydroxide solution->silicate->precursor 8 (Kobera et
al., 2011)
Precursor+silicate (solid) + hydroxide (solid)->water 9 (Suwan and
Fan, 2017)
According to the studies presented in Table 2.2, the mixing method did not have a major
impact on the strength of the binder when the alkaline solution was added in liquid form
(sequences 1, 3, 4 & 5) (Dassekpo et al., 2017; Junaid et al., 2015; Suwan and Fan, 2017).
The only time it did have an adverse effect was in Dassekpo et al. (2017), who investigated
adding the alkaline solution to the binder without allowing the solution to cool down
(sequence 2). When the silicate and hydroxide are mixed together, heat is generated. It
was found that the increased temperature resulted in lower strength compared to the other
mixing methods of that study. Cooling the alkaline solution prior to mixing is important
for consistency: it affects reaction rates, but the viscosity of solutions can also decrease at
higher temperatures (Yang et al., 2008). The viscosity of the solution has an immediate
effect on the workability of the resulting binder (Favier et al., 2014), and using solutions
at elevated temperatures may also present solubility issues (Provis, 2009).

24
Junaid et al. (2015) stated that sequence 5 (aggregates + precursor -> silicate -> hydroxide
-> water) was preferred as it did not involve any preparation prior to mixing, while it also
resembled the procedure followed in OPC binders. Incorporating silicates first, however,
may lead to early workability issues as they tend to have higher viscosity than hydroxides
(Provis and Bernal, 2014). This could be a particular problem for metakaolin based AAM,
which possess inherent low workability and greater liquid demand (Favier et al., 2014;
Provis et al., 2010).
Kobera et al. (2011) found that mixing sequence 7 (silicate + hydroxide (solid) ->
precursor -> water) resulted in a binder with double the compressive strength compared
to sequence 8. The difference in strength was attributed to the point of introduction of
water, as it was stated to affect the hydration and in turn the structural stability and strength
of the binder. It has been posited that the rate of the condensation/polymerisation increases
in the presence of additional water under low water conditions during alkaline activation.
While water is required for the hydration of the alkali metal cations, it was hypothesized
that the cations will instead bind strongly to dissolved anionic species to account for the
lack of water in the system. When water is eventually provided the binding between the
alkali metal cations and the small anions is weakened as a result accelerating the
condensation reactions (Provis and van Deventer, 2007a).
While several combinations of the sequence of the materials can be concocted the primary
aim of the mixing order should be to ensure a homogenous slurry leading to a binder with
consistent performance. Due to the different workability properties of the available
precursors not all mixing approaches may be applicable in every application. In
construction based applications, a mixing procedure similar to OPC is favorable as it
allows transferring previous practice into newer technology and thus an easier transition
from OPC to AAM binders. The work described in this thesis though focuses on a more
niche application in which following an OPC-based mixing procedure is not currently
required. The aim of the mixing sequence for this application focuses on ensuring a
homogenous mix with a repeatable performance while satisfying other requirements that
25
will be explored in the following chapters. Mixing sequence 1 presents a more generic
procedure that meets these criteria in this regard.
2.2.5.1 One-part mixes
One-part AAM mixes are presented for completeness. This method of formulation
has been promoted as a more applicable approach for onsite applications. The main
concept behind this method is to reduce handling of hazardous chemical compounds and
adapt the ‘just add water’ mentality, resembling the methodology followed in OPC binders.
While studies in two-part AAM have been conducted for decades, research in one-part
mixes has seen rapid growth within just the last few years (Abdollahnejad et al., 2020a;
Coppola et al., 2020).
One-part AAM mixes consist of solid precursors and activators which are first dry-mixed
and then water is added to formulate the binder. In some cases, the solids may be present
in raw form (Hajimohammadi and van Deventer, 2017; Nematollahi et al., 2015). In other
instances, the solids may contain pulverized AAM. In this case AAM are premade with
the two-part mix, crushed and pulverized for reuse in the one part method (Liew et al.,
2017). The mixing order for one-part mixes is fairly straightforward compared to two-part
mixes. The solids are first dry mixed, then water is added. Lastly additives and filler are
usually added after a slurry has been formed (Abdollahnejad et al., 2020a; Shah et al.,
2020a). One-part mixes may result to larger heat generation compared to two-part mixes,
however studies have shown that the intensity and duration of the heat liberation is not
able to be sustained to such a degree for it to beneficially impact alkaline activation
(Suwan and Fan, 2017). Lastly, similar to two-part AAM, one-part AAM are also
influenced by the molecular composition of the binder (Hajimohammadi and van
Deventer, 2017), source material (Choo et al., 2016; Nematollahi et al., 2015; Yousefi
Oderji et al., 2019), the curing regime (Shah et al., 2020b), fiber content (Abdollahnejad
et al., 2020b; Shah et al., 2020a) etc. The application in this thesis is primarily aimed at
precast elements rather than onsite applications considering the printing process that is
followed. As a result, the need for one-part mixes is not currently necessary and does not
provide any essential advantages to the formulation of AAM.

26
2.2.6 Curing
Similar to all other aspects of AAM, a definitive curing regime does not exist. In
most cases, curing follows accepted methodologies based on existing literature. The
approach to curing followed in AAM is slightly different than that for OPC binders. AAM
binders are required to be kept under sealed conditions to avoid liquid loss due to excessive
drying. Curing AAM in water tanks is also not favorable as this could cause leaching of
the alkaline solution and negatively impact the properties of the binder (Chi, 2012; Provis,
2018). While not that common, AAM binders can also be cured in alkaline solutions
(Bernal and Provis, 2014), and the mechanical properties of the binder can be enhanced
depending on the solution employed (Xia and Sanjayan, 2018). Furthermore, curing at an
elevated temperature is also quite common to accelerate alkaline activation (Bernal and
Provis, 2014).
Various studies have been conducted investigating the optimal temperature and duration
for AAM curing. The typical temperature range for curing is between 40 oC and 80 oC.
Higher temperatures have been mentioned to lead to moisture loss which then negatively
impact the mechanical properties of the binder (Chen et al., 2016; Duxson et al., 2007b;
Mahmoodi et al., 2020; Mo et al., 2014; Yuan et al., 2016). In most cases the samples are
heat cured for about 24-48h (Bernal et al., 2012; Borges et al., 2017; Cheng et al., 2015;
Duxson et al., 2007b; Gao et al., 2014). However, extended periods (up to 7 days) of
continuous heat curing (Chen et al., 2016; Yuan et al., 2016) and short periods (up to 8
hours) (Aydin and Baradan, 2012; Rovnaník, 2010) have also been investigated. It has
been mentioned that prolonged heat curing could be detrimental for the binder and lead to
decreased mechanical properties over time (Ozer and Soyer-Uzun, 2015; Zhang et al.,
2009).
After heat curing, the samples are then removed from their current conditions and stored
under ambient conditions to continue curing. Heat curing essentially allows the
acceleration of alkaline activation, which in turn leads to high strength in AAM samples
at early ages.

27
Heat curing does not, however, have the same effect across all AAM. In regards to
metakaolin AAM, studies have shown ambient cured binders are able to reach strength
values close to their 28 day strength after 7 days of ambient curing (Provis et al., 2019;
Rocha et al., 2018; Rovnaník, 2010). This signifies that heat curing is not essential for
metakaolin AAM, which was considered standard practice in earlier stages of AAM
research9.
Furthermore, there has been a debate in the AAM community if the curing duration of 28-
days for OPC should be applied for AAM as well (Provis et al., 2019). As previously
mentioned, the compressive strength ambient cured metakaolin AAM at 7 days was fairy
comparable to the strength reached at 28 days (Provis et al., 2019; Rocha et al., 2018). On
the other hand, ambient cured fly ash has a slower reaction rate and thus sees strength
increase past 28 days (Ma et al., 2016; Sun and Vollpracht, 2019). Therefore, it can be
accepted that the 28-day target may not be as applicable to all AAM binders as cases could
be made that this duration should be shorter for some binders and longer for others.
2.2.7 Overview and caveats of AAM formulation
While extensive research in AAM formulation has been carried out outliers and
alternative approaches exist. Even though a consensus around the optimal molar
composition of metakaolin AAM exists serviceable performance can be achieved outside
the molar ratios stated in Section 2.2.4.1 (Bature et al., 2021) or by simply focusing on the
mass ratios of the constituents (Albidah et al., 2021; Mohseni, 2018; Vogt et al., 2019;
Zulkifly et al., 2021). Furthermore, reproducibility also appears to pose an issue in AAM.
Variability in results of the same mix design and methodology is quite common. This has
been also pointed out in the round robin tests carried out by the RILEM technical
committee ‘Durability Testing of Alkali-Activated Materials’ (Provis et al., 2019). These
differences have been speculated to occur due to variances in source materials, the
9 The same does not apply though to binders with slower reaction rates, such as fly ash AAM (Alanazi et al., 2019). Fly
ash AAM have slower reaction rates and thus slower strength development. Therefore, heat curing is beneficial in this
aspect (Sun and Vollpracht, 2019). In situations in which fly ash is activated only with a hydroxide, the reaction rates
in that situation are very slow in which at that point heat curing is necessary to achieving a hardened binder (Criado et
al., 2005). Moreover, heat curing may negatively impact slag AAM as well. High temperature may interfere with the
development of the C-A-S-H gel therefore leading to a porous matrix (Huseien et al., 2016; Kubba et al., 2018).

28
compatibility of the aggregates with the binders and with minor differences in curing
techniques. The source (whether in liquid or solid form) of key components such as of
silica (Hajimohammadi et al., 2011) and alumina (Hajimohammadi et al., 2010) can also
influence the performance of the binder. It is also important to point out that the molar
ratios presented in studies are primarily based on calculated ratios. The actual composition
of the binder may vary due to unreacted particles (Tian et al., 2019).
On another note, comparisons between mix designs may also not be that straightforward.
AAM have been investigated as paste, mortar and concrete in which a direct comparison
between the three cannot always be made. For example, while the addition of fine
aggregate sand is beneficial in terms of drying shrinkage (Koutník et al., 2020; Kuenzel
et al., 2014; Wang et al., 2020) it is rather unclear if it can lead to higher compressive
strength. Cases have been made for it having a positive (Kuenzel et al., 2014; Riahi et al.,
2020) and negative (Li et al., 2018; Sarkar and Dana, 2021; Wang et al., 2020) impact on
the binder. Part of this disagreement can originate from the manner sand is added to the
binder or depending on the additional filler present. Sand may be substituted into the
binder at the expense of the precursor (precursor is removed to add sand), rather than it
being added as a direct proportion to the precursor (precursor content remains the same
irrespective of the amount of sand added).
2.2.8 Summary of alkali activated materials
Overall AAM are a diverse group of construction materials with numerous
fabrication techniques that are able provide a sustainable approach for future construction
applications. Alkali activated materials though require a different means of design and
fabrication compared to the conventional ordinary Portland cement binders: much of the
knowledge associated with OPC is not easily transferable to AAM. Taking into account
the literature presented in this section fabricating AAM is possible as the approach and
procedures to key parameters in AAM formulation outlined below have been identified:
• Fabrication process and mixing sequence for two-part AAM.
• Calcination approaches and evaluation of kaolin to produce metakaolin.

29
• Expected molar composition and solid-liquid ratios for fabricating metakaolin
AAM binders.
• Curing regimes for metakaolin AAM binders.
These methods will be followed to fabricate AAM binders in the experimental
investigation of this thesis
2.3 Self-sensing alkali-activated materials
2.3.1 Introduction
Monitoring and surveillance of civil infrastructure is required to ensure structural
health and resilience in the face of degradation. While sensors can provide adequate
localized measurements, self-sensing ‘smart’ materials have gained popularity over the
years. In a civil engineering context, self-sensing materials are components that can
simultaneously detect measurands without the need of additional sensing instruments.
Such materials include self-sensing cementitious materials (Ding et al., 2019a; Z. Tian et
al., 2019), bricks (Downey et al., 2018; Meoni et al., 2020), aggregates (Kong et al., 2017;
Zhao et al., 2019) and pavements (Arabzadeh et al., 2018; Han et al., 2013). In terms of
self-sensing cementitious materials, extensive research has been carried out in both
ordinary Portland cement (OPC) and alkali activated materials (AAM).
AAM are multifunctional materials that have gained extensive interest over that past
decades, predominantly as an emerging, low-carbon alternative to OPC in concrete
production (Zhang et al., 2020). AAM display similar mechanical properties to OPC, and
have been reported to attain high early age strength under both heat curing (Assi et al.,
2016) and ambient curing (Provis et al., 2019) regimes. They also present higher thermal
(Khan and Sarker, 2020) and chemical resistances (Aguirre-Guerrero et al., 2021) when
compared to conventional OPC systems. AAM applications have been demonstrated in
waste immobilization (Komljenović et al., 2020), repairs (Nunes et al., 2019), coatings
(Biondi et al., 2019) and in additive manufacturing (Panda and Tan, 2018), and they have
also been shown to demonstrate self-healing (Kan et al., 2019) and self-compacting
(Huseien and Shah, 2020) properties.

30
In the realm of smart materials, AAM were initially used as bonding agents (He et al.,
2011) and as encapsulants (Suweni Muntini and Ahmadi, 2018) for conventional sensors.
However, as the understanding and the technology of AAM progresses, the need for these
additional sensing devices has diminished: interrogation of changes in the electrolytic
conductivity of AAM allow them to be directly used as a sensing tool in their own right
(Lamuta et al., 2016). As a result AAM have increased the number of supporting roles in
structural health monitoring and maintenance, being used as both structural self-sensing
elements (e.g. AAM concrete cubes and beams) (Bi et al., 2017; Saafi et al., 2016;
Vilaplana et al., 2013), and as self-sensing coatings for OPC concrete substrates (Perry et
al., 2015; Vlachakis et al., 2020).
There are already numerous reviews on self-sensing cementitious materials in general
(Ding et al., 2019a; Dong et al., 2019; Tian et al., 2019), and on multifunctional AAM
(Tang et al., 2019), but there are currently no reviews that detail the self-sensing aspects
of AAM. This review covers the sensing applications reported for AAM, specifically
strain, temperature and moisture sensing. Materials denoted as ‘alkali activated materials’,
‘geopolymers’ and any other derivatives originating from these terms will be considered
for this review, without focusing on debates over their terminology. Our hope is that this
review will shed light on areas where further work on self-sensing AAM is required.
2.3.2 Alkali activated material sensors
2.3.2.1 Fabrication, fillers and additives
AAM sensors follow the same fabrication procedure as conventional AAM
binders components as outlined in Section 2.2.3. As with OPC systems, AAMs can be
mixed with sand and aggregates to produce:
a) Pastes / binders: precursor + alkaline solution
b) Mortars: precursor + alkaline solution + fine aggregate (typically sand)
c) Concretes: precursor + alkaline solution + fine aggregate + coarse aggregate
Although it is not required to produce a self-sensing material, electrically conductive
additives can also be added to an AAM binder to improve electrical conductivity. Fillers
31
must be properly dispersed to achieve a homogenous mix and avoid agglomeration (Kim
et al., 2017). For two-part mixes the main ways of achieving this are:
A. Filler in aqueous solution: The conductive filler can be added to an aqueous
solution and sonicated. Following this, the filler is added to the alkaline solution
which is again mixed and/or sonicated. The precursor is subsequently added and
mixed (Candamano et al., 2019; Deng et al., 2019; Rovnaník et al., 2019a,b;
Vilaplana et al., 2013).
B. Filler in sodium hydroxide: The conductive filler is added only to the sodium
hydroxide solution, which is subsequently mixed and sonicated. The silicate-based
solution and the precursor are added from there on (Lamuta et al., 2017; Payakaniti
et al., 2017; Saafi et al., 2015, 2014).
Cases have also been reported in which the filler is sonicated but added to the mix at a
later stage, particularly after the alkaline solution and the precursor have been mixed
together (Behera et al., 2018; Saafi et al., 2013). However, the recommended process is to
disperse the fillers in the alkaline solution (prior to mixing with the solid precursor), as
this has been reported to lead to greater dispersion and uniform density in the matrix and
therefore leading to increased electrical performance (Candamano et al., 2019;
Hanjitsuwan et al., 2014; Saafi et al., 2013). Fillers can also be chemically manipulated to
enhance their dispersion, for example, carbon nanotubes coated with SiO2 demonstrated
enhanced dispersion, owing to a chemical reaction between the coated filler and the
alkaline solution (Bi et al., 2017).
Reported one-part self-sensing filler AAM applications are quite limited. The fabrication
of such binders though is rather straightforward. In a study by D’Alessandro et al., (2020)
the following mixing process was employed: The solid material (precursor and activator)
were first dry mixed together. Water was then added to the solids and mixed until a
homogenous mix was achieved. Conductive filler was sonicated in the water for greater
dispersion prior to the addition to the solids.

32
2.3.2.1.1 Sensor fabrication
Regardless of whether a conductive filler is used, electrodes can be prearranged
within the binder, either in a mold or on the surface of a substrate. The AAM can then be
cured. During curing, temperature and humidity may need to be adjusted to control
reaction rates and water transport within the system. Alternatively, electrodes can be
attached to cured specimens using conductive paint. Examples of AAM components and
coatings are shown in Figure 2.3.

33
(a)
(b)
(c)
Figure 2.3 – Self-sensing AAM substrates a) metakaolin AAM with wound wires (Lamuta et al., 2017) b) metakaolin
AAM printed coating with stainless steel wires (Vlachakis et al., 2020) c) fly ash AAM with stainless steel wires
(Biondi et al., 2020).
AAM sensing essentially relies on measuring changes in electrical conductivity in
response to environmental variables. To interrogate conductivity, an electrical current (or
voltage) is applied across the specimen, and the voltage (or current) response is measured.
This allows the electrical conductivity, σ, to be calculated via equation (2.3):
σ=I
V.L
A
(2.3)
where V is the voltage, I is the current, L is the distance between the electrodes, and A is
the shared cross-sectional area of sample between the electrodes. Studies will sometimes
quote the resistivity of AAM samples, ρ = 1/ σ.

34
2.3.2.2 Electrical (ionic) conductivity: mechanisms
2.3.2.2.1 Overview of mechanisms
Ionic conduction of AAM and OPC materials is associated with the mobility of
free ions in the pore solution, primarily Ca2+, K+, Na+, Si4+, Fe2+, Al3+ and OH- (Hansson
and Hansson, 1985). In OPC, ionic conductivity is attributed to the mobility of the Ca2+
and OH- ions in the pore solution. This form of ionic conduction is highly dependent on
the amount of free water in the matrix, and usually results in an electrical conductivity
that is too low to be of use for deploying a sensing solution. OPC substrates are effectively
electrical insulators unless they are wet (Xu et al., 2010).
Ionic conductivity is stronger in AAM. Ionic conductivity originates from the structure of
AAM, as the alkali cations (Na+ or K+) in the matrix charge balance the aluminium (III)
in the tetrahedral AlO4- group (Duxson et al., 2007a; Provis, 2014a). Cations are either
bonded to the matrix via Al-O or Si-O bonds, or are present in the framework cavities to
maintain electrical charge balance. Ions that are not bound to the structure are “free ions”
that are able to move through the pore network to enhance electrical conductivity (Cui et
al., 2008).
2.3.2.2.2 Equivalent circuits
The current best understanding of AAM electrical conductivity states that it is
mainly a function of three components, the resistance of the electrolyte, ion transport of
the connected and unconnected pores, and the effect of the electrodes on the matrix. In
fact, these three components can be modeled as a circuit, made up of serial and parallel
combinations of standard electronic components (e.g. resistors, inductors, capacitors)
(Biondi et al., 2020; Dong et al., 2015; Ravikumar and Neithalath, 2013). There are several
of these so-called “equivalent circuits” that can be used to model the electrical response
of AAM. One of the most common equivalent circuits used in electrochemistry is the
Randles circuit, as displayed in Figure 2.4. The Randles circuits leads to ideal Nyquist and
Bode plots illustrated in Figure 2.5. The components that are used to model the Randles
circuit are the following (Bard and Faulkner, 2001):

35
i. Solution resistance RΩ: refers to the series element in which all the current
(faradaic process and double-layer charging) passes through.
ii. Faradic impedance Zf: refers to the faradaic process which can also be expressed
as a series combination comprising the series resistance, Rs (also treated as
polarization resistance) and the pseudocapacitance, Cs whose values are
independent of frequency.
iii. Double capacitance Cd: refers to the nearly pure capacitive behavior of the circuit.
Figure 2.4 – Equivalent Randles circuit. Adapted from Bard and Faulkner (2001).
(a) (b)
Figure 2.5 – Typical Nyquist plot (left) and Bode plot (right). Adapted from Bard and Faulkner (2001).
Conventional circuits though such as the Randles circuit cannot encompass the complexity
of AAM systems. AAM can have partial or fully saturated pore solution and double phase
regions. Furthermore, potential chemical reactions can alter the charge transfer and
diffusion in the sample (Dong et al., 2015). As such more complex circuits are considered
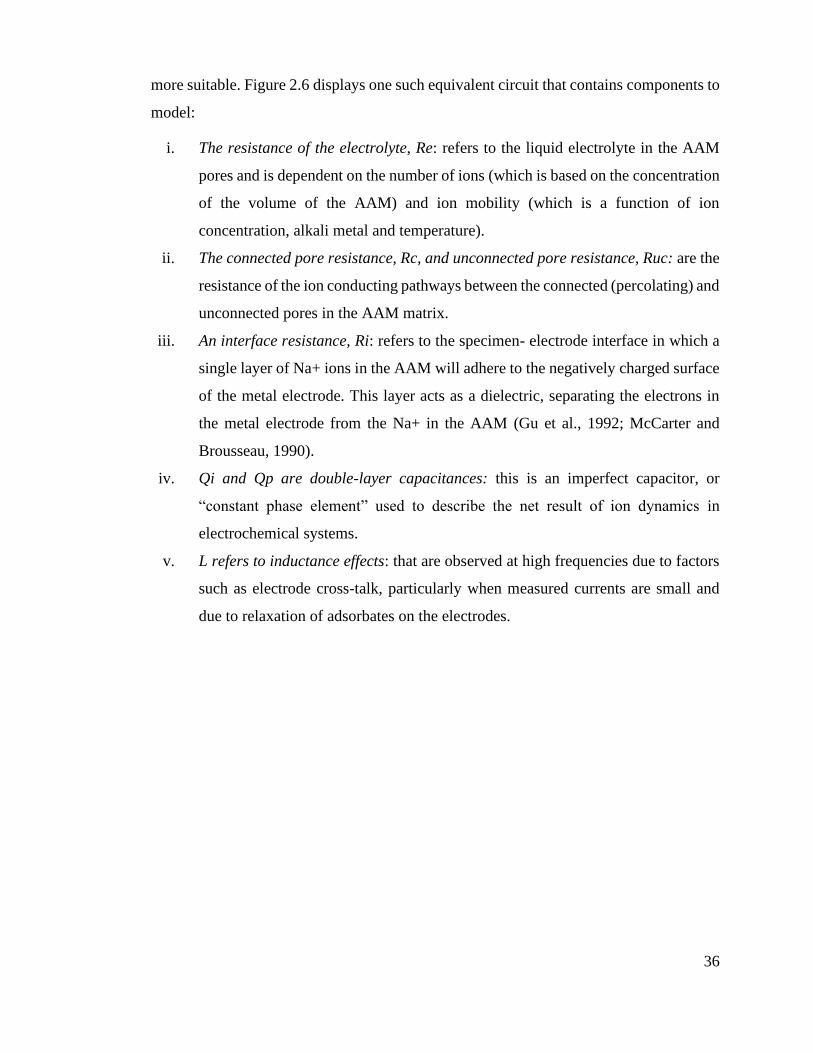
36
more suitable. Figure 2.6 displays one such equivalent circuit that contains components to
model:
i. The resistance of the electrolyte, Re: refers to the liquid electrolyte in the AAM
pores and is dependent on the number of ions (which is based on the concentration
of the volume of the AAM) and ion mobility (which is a function of ion
concentration, alkali metal and temperature).
ii. The connected pore resistance, Rc, and unconnected pore resistance, Ruc: are the
resistance of the ion conducting pathways between the connected (percolating) and
unconnected pores in the AAM matrix.
iii. An interface resistance, Ri: refers to the specimen- electrode interface in which a
single layer of Na+ ions in the AAM will adhere to the negatively charged surface
of the metal electrode. This layer acts as a dielectric, separating the electrons in
the metal electrode from the Na+ in the AAM (Gu et al., 1992; McCarter and
Brousseau, 1990).
iv. Qi and Qp are double-layer capacitances: this is an imperfect capacitor, or
“constant phase element” used to describe the net result of ion dynamics in
electrochemical systems.
v. L refers to inductance effects: that are observed at high frequencies due to factors
such as electrode cross-talk, particularly when measured currents are small and
due to relaxation of adsorbates on the electrodes.
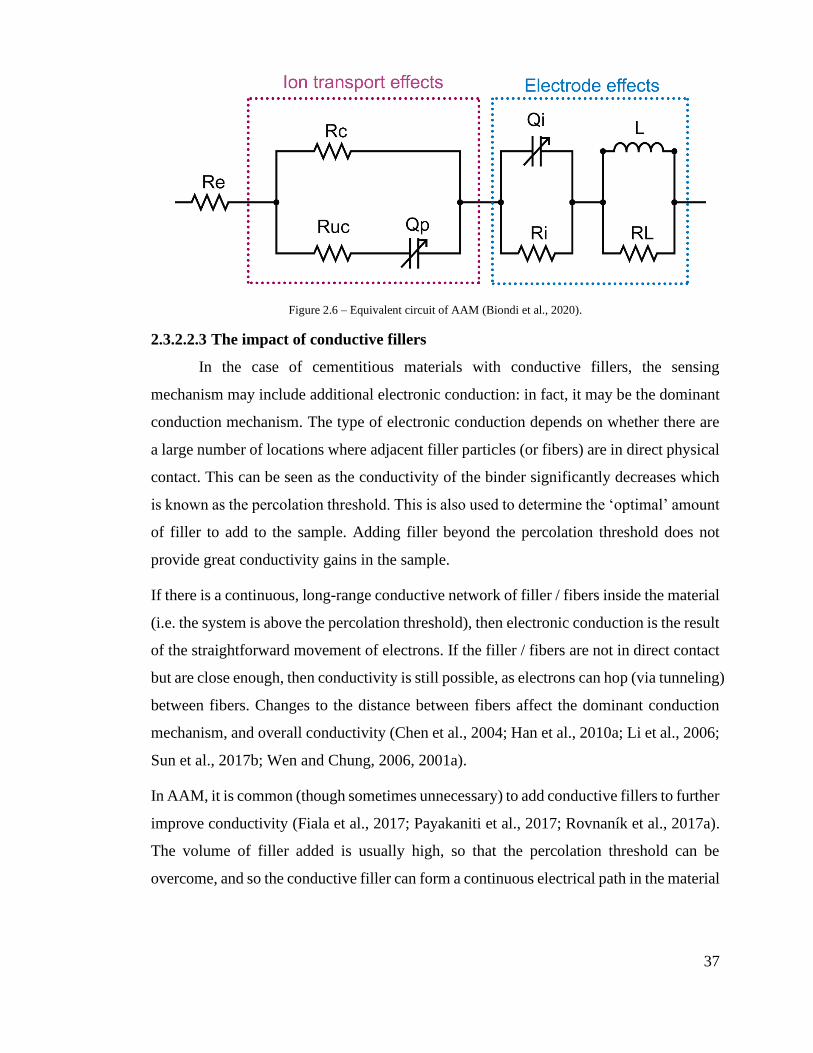
37
Figure 2.6 – Equivalent circuit of AAM (Biondi et al., 2020).
2.3.2.2.3 The impact of conductive fillers
In the case of cementitious materials with conductive fillers, the sensing
mechanism may include additional electronic conduction: in fact, it may be the dominant
conduction mechanism. The type of electronic conduction depends on whether there are
a large number of locations where adjacent filler particles (or fibers) are in direct physical
contact. This can be seen as the conductivity of the binder significantly decreases which
is known as the percolation threshold. This is also used to determine the ‘optimal’ amount
of filler to add to the sample. Adding filler beyond the percolation threshold does not
provide great conductivity gains in the sample.
If there is a continuous, long-range conductive network of filler / fibers inside the material
(i.e. the system is above the percolation threshold), then electronic conduction is the result
of the straightforward movement of electrons. If the filler / fibers are not in direct contact
but are close enough, then conductivity is still possible, as electrons can hop (via tunneling)
between fibers. Changes to the distance between fibers affect the dominant conduction
mechanism, and overall conductivity (Chen et al., 2004; Han et al., 2010a; Li et al., 2006;
Sun et al., 2017b; Wen and Chung, 2006, 2001a).
In AAM, it is common (though sometimes unnecessary) to add conductive fillers to further
improve conductivity (Fiala et al., 2017; Payakaniti et al., 2017; Rovnaník et al., 2017a).
The volume of filler added is usually high, so that the percolation threshold can be
overcome, and so the conductive filler can form a continuous electrical path in the material

38
(Al-Dahawi et al., 2016; Chung, 2002). It has been reported that conduction is a
combination of both ionic and electronic conduction, as ions are still mobile while the
filler allows the shortening of the conduction path in the matrix (Payakaniti et al., 2017),
but there have not yet been many in-depth studies on this topic within AAM.
2.3.2.3 Electrical impedance
Direct current (DC) and alternating current (AC) have been both been used to
interrogate AAM conductivity. If DC is used, the electrical resistance, R, of the sample is
calculated via equation (2.4):
R=V
I
(2.4)
This equation assumes the material obeys Ohm’s Law, but AAM are electrolytic cells,
and so the use of DC has significant drawbacks. Similar to salt water solutions, applying
DC will result in electrolysis. Ions within the AAM cannot travel within the electrodes
(which conduct via electrons), and so the conducting cations within the AAM migrate
towards and react with the cathode. This results in a so-called “polarization resistance”,
that gradually increases in magnitude over time. The effect is likely less pronounced when
conductive fillers are used to set up an electronic conduction path, but issues with
electrolysis may still arise in the long-term if even a small part of the conduction is ionic
(Pour-Ghaz et al., 2009; Song, 2000; Wen and Chung, 2001b).
To prevent electrolysis, AC is preferred (the direction, or polarity, of the applied current
is frequently switched) (Han et al., 2012; Rovnaník et al., 2019a). Using AC allows one
to determine the electrical impedance of a sample, Z. In this case, a sinusoidal voltage of
magnitude V and frequency f, is applied to the sample and the current response, I is
measured. This allows the impedance to be calculated by using equation (2.5) (Lasia,
2014):
Z =V
Iei(ϕV-ϕI)
(2.5)
where ФV – ФI is the phase difference between the applied voltage and measured current
and the impedance is a complex number of the form in equation (2.6) (Lasia, 2014):

39
Z =Zeiarg(Z) (2.6)
where Z and arg(Z) are the impedance’s magnitude and argument. In AAM, the phase
difference between the current and voltage results from capacitive effects in the material.
Electrical impedance is frequency dependent, and so sweeping the frequency can lead to
a rich dataset for sensor characterization. The AC frequency can be selected to minimize
or maximize the measurement of capacitive or resistive effects in the sample, depending
on the application (Perry et al., 2015; Saafi et al., 2016, 2014) and allows for the
elimination of polarization if desired (Perry et al., 2015; Rovnaník et al., 2019c; Rovnaník
et al., 2019a). Overall, however, frequency tends to be selected to produce the highest
sensitivity to measurands during characterization (Lamuta et al., 2017; Saafi et al., 2016).
2.3.2.4 Electrical (ionic) conductivity: reported magnitudes
AAM possess a higher conductivity than OPC at room temperature due to the
alkali metal ions in their matrix. The electrical properties of AAM tend to vary as they are
influenced by mix ratios, chemical composition, and environment. Table 2.3 summarizes
reported conductivities for AAM composites with and without conductive fillers.
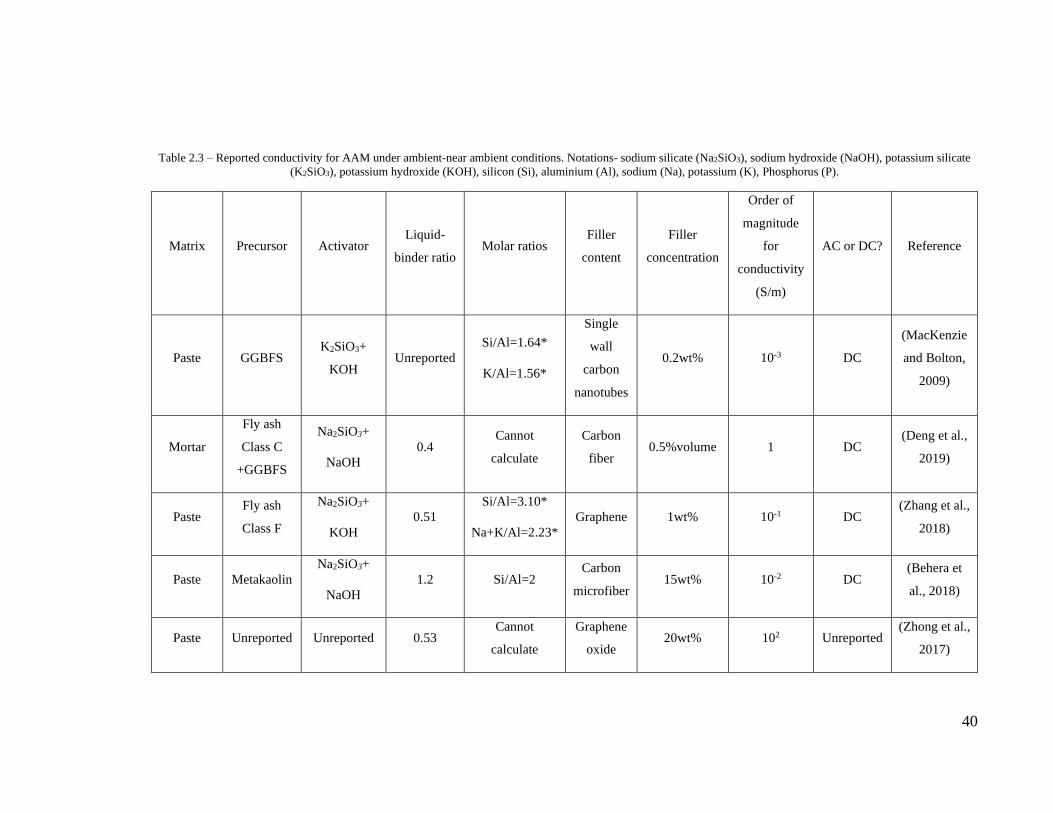
40
Table 2.3 – Reported conductivity for AAM under ambient-near ambient conditions. Notations- sodium silicate (Na2SiO3), sodium hydroxide (NaOH), potassium silicate
(K2SiO3), potassium hydroxide (KOH), silicon (Si), aluminium (Al), sodium (Na), potassium (K), Phosphorus (P).
Matrix Precursor Activator Liquid-
binder ratio Molar ratios
Filler
content
Filler
concentration
Order of
magnitude
for
conductivity
(S/m)
AC or DC? Reference
Paste GGBFS K2SiO3+
KOH Unreported
Si/Al=1.64*
K/Al=1.56*
Single
wall
carbon
nanotubes
0.2wt% 10-3 DC
(MacKenzie
and Bolton,
2009)
Mortar
Fly ash
Class C
+GGBFS
Na2SiO3+
NaOH
0.4 Cannot
calculate
Carbon
fiber 0.5%volume 1 DC
(Deng et al.,
2019)
Paste Fly ash
Class F
Na2SiO3+
KOH
0.51
Si/Al=3.10*
Na+K/Al=2.23*
Graphene 1wt% 10-1 DC (Zhang et al.,
2018)
Paste Metakaolin
Na2SiO3+
NaOH
1.2 Si/Al=2 Carbon
microfiber 15wt% 10-2 DC
(Behera et
al., 2018)
Paste Unreported Unreported 0.53 Cannot
calculate
Graphene
oxide 20wt% 102 Unreported
(Zhong et al.,
2017)

41
Mortar GGBFS Na2SiO3 0.84 Cannot
calculate
Carbon
black 2.25wt% 10-1 DC
(Fiala et al.,
2019)
Paste GGBFS
Na2SiO3+
NaOH
0.43 Si/Al=3.20*
Na/Al=1.19*
Carbon
fiber 0.76wt% 101 Unreported
(Vilaplana et
al., 2013)
Paste Fly ash
Class F
Na2SiO3+
NaOH
0.39 Cannot
calculate
Graphene
oxide 0.35wt% 1 AC
(Saafi et al.,
2014)
Mortar Fly ash
Class F
Na2SiO3+
NaOH
0.36 Si/Al=1.57*
Na/Al=0.27*
Multiwall
carbon
nanotubes
1wt% 1 AC (Saafi et al.,
2013)
Paste Fly ash
Class C
Na2SiO3+
NaOH
0.5 Si/Al=2.05*
Na/Al=0.85*
Carbon
fiber 0.5wt% 101 AC
(Payakaniti
et al., 2017)
Paste Fly ash
Class C
Na2SiO3+
NaOH
0.4 Si/Al=1.93*
Na/Al=0.51* No filler - 10-1 AC
(Hanjitsuwan
et al., 2011)
Paste Fly ash
Class F
Na2SiO3+
NaOH
0.37 Si/Al=near 2 No filler - 10-2 AC (Saafi et al.,
2016)
Paste Fly ash
Class F K2SiO3 0.6 Si/Al=1.17 No filler - 10-1 AC
(Saafi et al.,
2018)
Paste Fly ash
Class F Na2SiO3+ 0.4
Si/Al=2.15*
Na/Al=1.18* No filler - 1 AC
(Hanjitsuwan
et al., 2014)

42
NaOH
Mortar GGBFS
Na2SiO3+
NaOH
0.61 Cannot
calculate
Carbon
nanotubes 2.5wt% 10-6 AC
(Kusak and
Lunak, 2017)
Mortar GGBFS Na2SiO3 0.36 Si/Al=6.71*
Na/Al=1.11*
Graphite
powder 30wt% 10-4 AC
(Rovnaník et
al., 2019a),
(Rovnaník et
al., 2019c)
Mortar GGBFS Na2SiO3 0.61 Si/Al=6.71*
Na/Al=1.11* No filler - 10-6 AC
(Rovnaník et
al., 2019c),
(Rovnaník et
al., 2019a)
Paste Metakaolin Na2SiO3 Unreported
Si/Al=1.04*
Na/Al=0.17*
No filler - 10-4 AC (Cui et al.,
2008)
Paste Metakaolin Phosphoric
acid Unreported Si/P=1 No filler - 10-7 AC
(Sellami et
al., 2019)
*Not provided by authors, calculated from data available in cited paper (s)

43
2.3.2.4.1 Without conductive fillers
The conductivity of AAM without conductive fillers has been reported to range
from 10-4 S/m (Cui et al., 2008) to 1 S/m (Hanjitsuwan et al., 2014). In general, the
conductivity of AAM increases with increasing alkali metal concentration (Cai et al.,
2020b; Hanjitsuwan et al., 2014), and with higher liquid-to-binder ratios (Payakaniti et al.,
2017). Too much liquid in an AAM can, however, lead to highly porous binders which in
turn can affect conductivity. While increased porosity has been reportedly linked to higher
conductivity (Liang et al., 2017; Liu et al., 2019; Salem and Ragai, 2001), it has also been
linked to reduced conductivity (Hanjitsuwan et al., 2011; Kultayeva et al., 2020). Having
reviewed this literature, the authors of the present review believe that increasing porosity
likely leads to higher conductivities, up until a point: the dominant conduction mechanism
in AAM is, after all, accepted to be via pore solution, the volume of which would be higher
with more pore space. This hypothesis is also supported by the fact that when interrogating
at moderate-to-low AC frequencies, maximum conductivity tends to coincide with high
liquid-to-solid ratios: at moderate-to-low AC frequencies, the conduction mechanism that
dominates is related to bulk pore solution conductivity. It should be pointed out though
that at low AC frequencies, the conduction mechanism of the binder is influenced by the
electrodes rather than the bulk pore solution (Gu et al., 1993; McCarter and Brousseau,
1990). As a result careful consideration is required to distinguish between the two regions
to ensure proper data interpretation. This also makes it clear that the dominant conduction
mechanisms that occur at different AC frequencies could be better used to probe and make
sense of behavior.
Results from Cai et al. (2020b) show that metakaolin AAM have a higher conductivity
than fly ash AAM. It was again speculated that the difference in conductivities was due to
the higher liquid-to-solid ratio used for metakolin AAM. The same authors also reported
that incorporating different types of precursors in the same mix can create a denser matrix,
which subsequently leads to decreased conductivity (Cai et al., 2020b). This is all further
evidence for our hypothesis. Comparisons are, however, still often challenging, because

44
precursors of the same type, but from different sources, can also present variable behavior
due to their dissimilar chemical composition (Zeng et al., 2016).
For samples with low to no conductive filler content, the resistance of the matrix continues
to increase over time due to the progress of the geopolymerization process (Payakaniti et
al., 2017; Zeng et al., 2016). Under the same curing and alkaline conditions, it has been
reported that the resistance of metakaolin-based AAM stabilizes over a quicker period of
time due to their quicker geopolymerization and higher chemical activity when compared
to low calcium fly ash AAM (Cai et al., 2020b).
While not as common, high water contents in the binder during fabrication have been
reported to have a negative impact on the conductivity of AAM. In a study carried out by
Cui et al. (2008) it was mentioned that even when increasing Na2O/Al2O3 ratios the
conductivity did not increase as expected. It was explained by Cui et al. that the excess
water was overriding the effect of the free ions in the matrix. By removing the water
through drying, the conductivity of AAM was reported to increase with increasing sodium
content. That said, it can be observed that for the same Na2O/Al2O3 ratios, drying led to
decreased conductivity. Moreover, based on the molecular composition of this study, the
highest Na/Al ratio is approximately 0.55-0.60. The sodium ions in this situation are not
enough to charge balance the aluminium ions (Provis et al., 2005c). Therefore, increasing
sodium content will have a direct impact on the overall chemistry and structure of the
binder. Subsequently, this will also influence ion mobility. Bearing all this in mind,
additional factors need to be taken into account before a definitive claim on the impact of
water in this investigation could be made.
2.3.2.4.2 With conductive fillers
Conductive fillers can increase electrical conductivity of the composite by several
orders of magnitude. Comparing conductivity of AAM is somewhat difficult due to the
broad nature of available materials, the conductive fillers employed and the type of current
(AC or DC) used.
From the data available in Table 2.3, it can be seen that the addition of graphene-based
filler and carbon fiber has led to high conductivities between 10-1 – 102 S/m and

45
10-2 – 101 S/m respectively. However it can be easily observed that the range of reported
conductivities is quite vast and varies significantly. For example:
• By adding 0.5% by volume carbon fibers to fly ash AAM, Deng et al. (2019)
reported an increase in conductivity from 10-2 S/m to 1 S/m. Payakaniti et al. (2017)
found similar results.
• On the contrary, Behera et al. (2018) added over 10% by volume carbon microfiber
to metakaolin AAM, and found conductivity only increased from 10-3 S/m to
10-2 S/m.
While we do wish to posit a mechanism, these are seemingly contradictory results that
might suggest there is some turning point in the conductivity gains produced by fiber
addition. The difference could, on the other hand, stem from the fact that Deng et al. and
Payakaniti et al. dispersed their carbon fibers in the alkaline solution, whereas Behera et
al. dispersed the carbon microfiber in deionized water.
The literature underpinning Table 2.3 also shows that fiber size impacts conductivity, with
longer fibers able to form conductive paths more easily than short fibers. This suggests
the percolation threshold is an important consideration when adding fibers (Chen et al.,
2004; Chuang et al., 2017; Wang et al., 2002). If this is the case, it means that the
difference in dispersion techniques could potentially be the primary source of the
differences in reported conductivities.
Graphite powders are an alternative to carbon fibers. By adding 10wt% graphite powder
to slag AAM Rovnanik et al. (2019a) reported conductivities of order 10-5-10-4 S/m.
Conductive filler in powder form (carbon black, or graphite powder) has been speculated
to result in lower conductivity gains compared to fiber fillers due to the formation of
shorter conductive pathways (Ding et al., 2019a). This is indeed supported by the results
presented in Table 2.3.
While the information in Table 2.3 is relevant to sensor design, binder conductivity does
not alone determine how the material will perform as a sensor. Powder fillers may not
generally present the highest conductivity gains, but they have proven highly beneficial

46
for strain sensing applications (Han et al., 2010b, 2009). The interrogating electronics, the
spacing between electrodes, the volume of the sample, and even the requirements of the
application: these are all just examples of variables that can be tuned to deliver adequate
sensing performance with almost any AAM formulation.
The addition of conductive filler does however, provide other important benefits: when
added in appropriate quantities they can significantly enhance the mechanical properties
of the composites (Abbasi et al., 2016; Behera et al., 2018; Khater and Abd El Gawaad,
2016; Saafi et al., 2015; Vilaplana et al., 2016). One of their only major downsides is that
they increase cost, and the additional costs can be significant when scaled to the volumes
of material required in a civil engineering context.
2.3.2.5 Electrode layout
The electrode layout used to apply electrical excitation and measure the response
of an AAM plays an important role in the behavior of the electrical system, and hence the
sensing capabilities. AAM follow a similar principal to OPC in this regard. Table 2.4
summarizes the electrode configuration of reported AAM sensing applications.
Table 2.4 – Electrode configuration for AAM sensing applications.
Matrix Precursor Number of
probes
Material of
probe
Attachment
method Reference
Paste Fly ash 2-probe Graphene Embedded (Saafi et al.,
2016)
Paste Fly ash 4-probe Copper Embedded
(Saafi et al.,
2014),
(Saafi et al.,
2013)
Paste Fly ash 2-probe Steel mesh Embedded (Saafi et al.,
2018)
Paste Fly ash 4-probe Copper fibers Embedded (Perry et al.,
2015)

47
Paste Fly ash 4-probe Stainless steel
wires Embedded
(Biondi et
al., 2020)
Paste Fly ash 4-probe Brass plates Embedded (Payakaniti
et al., 2017)
Paste Metakaolin 2-probe Copper wires Embedded (Bi et al.,
2017)
Paste Metakaolin 4-probe Stainless steel
wires Embedded
(Vlachakis
et al., 2020)
Paste GGBFS 4-probe Copper wires
Wound around
substrate with
conductive silver
paint
(Vilaplana
et al., 2013)
Mortar Metakaolin 2-probe Copper foils Attached
(Lamuta et
al., 2016),
(Candamano
et al., 2019)
Mortar Metakaolin 4-probe Copper wires
Wound around
substrate with
conductive paste
(Lamuta et
al., 2017)
Mortar GGBFS 2-probe Copper mesh Embedded
(Rovnaník
et al.,
2019a),
(Rovnaník
et al.,
2019c)
Mortar GGBFS 4-probe Self-adhesive
copper tape
Attached with
graphite
conductive paste
(Rovnaník
et al.,
2019b)
Mortar GGBFS+ fly ash 4-probe Titanium
mesh Embedded
(Deng et al.,
2019)
48
Concrete Fly ash 2-probe Copper wires
Wound around
substrate with
conductive silver
paste
(Vaidya and
Allouche,
2011)
As shown in Figure 2.3 interrogation can be achieved with two-probe or four-probe
electrode layouts. While two-probe sensing provides a simpler setup, this method means
that the contact resistances and lead resistances of the electrodes contribute to the
resistance measurement. Four-probe sensing, on the other hand, significantly reduces the
contribution of lead and contact resistances, allowing only the AAM specimen itself to be
measured.
Four probe sensing can either be in a serial arrangement (i.e. a linear configuration, as
shown in Figure 2.3a & Figure 2.7a or in a rectangular arrangement with the electrodes
placed at the corners of the specimen, also known as the Van der Pauw (VDP)
configuration (Figure 2.3c, Figure 2.3d & Figure 2.7b). Both these applications have
merits and can be advantageous in various situations when used accordingly.
2.3.2.5.1 Serial arrangement
Linear layouts, shown in Figure 2.7a, are the most commonly used electrode
configuration in AAM and OPC sensing. This layout is applicable to the majority of
cementitious sensing applications. The electrodes are usually equally spaced or in
proportionate distances and are symmetrical in reference to the center of the substrate. The
electrodes are divided as ‘inner’ electrodes and ‘outer’ electrodes, as depicted in Figure
2.7a, in which voltage or current are applied and measured respectively.
Careful consideration must be given primarily in strain sensing as the response of the
substrate is dependent on the direction of the applied load. In uniaxial compression and
tension the load is typically parallel to the electrodes. Under flexural tests, the load is
primarily perpendicular to the electrodes. Altering the measuring configuration can
ultimately impact the response of the specimen (Liu et al., 2018). Furthermore, in a linear
setup the current density is concentrated between the electrodes, this essentially provides
a more localized sensing capability for the entire substrate.

49
(a) (b)
Figure 2.7 – Electrode array for AAM sensing a) serial arrangement b) Van der Pauw arrangement.
2.3.2.5.2 Van der Pauw arrangement
In the Van der Pauw configuration, shown in Figure 2.7b, the electrodes are placed
at the corners of the specimen (van der Pauw, 1958). This approach measures the overall
average resistance of the sample as the voltage and current are applied / measured over
the entire span of the sample’s surface. The layout is also beneficial as it minimizes the
concentrated stresses that can be developed near the electrodes during curing (Yao et al.,
2017). This occurs as shrinkage during curing creates stresses at the electrode-material
interface that can cause cracking and delamination, particularly in thin samples. The use
of VDP is thought to reduce and spread stress, and it is what allows electrodes to be
embedded successfully in these thin samples, rather than attached onto the substrate with
conductive paint.
While the VDP method is typically employed in samples with low thickness, it can also
be used in larger specimens as well (Biondi et al., 2020). The distances between electrodes
are essentially predefined by the geometry of the sample. The application and
measurement of the electrical properties are carried out over a larger area allowing for an
average measurement of substrate resistance (not local as with the linear layout) (Yao et
al., 2017). This method provides multiple options in terms of the direction of voltage
application. As a result, consistency in probe connections is required for repeatability and
proper interpretation of the sensor’s response.
Under strain sensing, in order to mirror the performance of the linear configuration, for
uniaxial compression and tension, the voltage and current should be measured and applied

50
parallel to the applied load. Similarly, these two measurands should be perpendicular to
the applied load under flexure.
2.3.2.5.3 Embed or surface mount
Embedding electrodes has shown more consistent and reliable results than surface-
mounting electrodes with conductive paint (Chiarello and Zinno, 2005; Han et al., 2007).
However, embedding can result in additional stresses to the AAM matrix, resulting in
cracking during curing (Han et al., 2007; Tang et al., 2016). Embedding thin wires (rather
than large electrodes) can reduce stress concentration and minimize the mechanical impact
of the electrodes on the AAM during curing (Biondi et al., 2020; Vlachakis et al., 2020).
2.3.2.5.4 Electrode-less measurement
In a recent study, Zhuang et al. (2021) used an electrodeless system to monitor the
early age reactions of slag AAM. The authors employed a coil-transformer system that
was able to generate an electric and magnetic field inducing voltage and current. The
current setup of this system though limits its application particularly in strain-sensing but
has the potential to pave the road for newer electrode configurations in future applications.
2.3.2.6 Sensor interrogation
In general sensor interrogation of self-sensing systems is based on measuring the
change of electrical properties of the sample (in this case AAM) in response to an applied
external factor e.g. strain, temperature, water content.
A general sensor characterization equation for AAM has the form of equation (2.7):
ΔM
M0
=f(ε)+g(ΔT)+h(Δw) (2.7)
where M is the electrical response variable measured (e.g. conductivity, resistivity,
resistance, impedance, or capacitance), M0 is the response variable with no applied strain,
temperature change or moisture change, ΔM = M – M0, and f, g and h are functions that
parameterize the response to changes in strain, ε, temperature, ΔT, and moisture, Δw. The
functions f, g, h, and their constants are what need to be parameterized. The methods and
results of this parameterization are outlined in detail in the following sections.

51
2.3.3 Strain sensing
2.3.3.1 Loading schemes
Strain sensing is the most prominent application for AAM sensors. The electrical
response of AAM components to strain is similar to OPC components. When the applied
load is colinear to the serial electrode configuration of the substrate, under compression
the resistance (and impedance) of the sample decreases. Likewise, under tension the
resistance of the specimen increases. This behavior has been widely reported in both AAM
(Perry et al., 2015; Rovnaník et al., 2019a; Saafi et al., 2018, 2016, 2014; Vilaplana et al.,
2013) and OPC (Azhari and Banthia, 2012; Han et al., 2017, 2009; Xiao et al., 2011; Yoo
et al., 2018a) strain sensing. Figure 2.8a and b display a typical sensing response for AAM
under compression and tension under constant temperature and humidity for ambient
working conditions. The effects of temperature and humidity on the strain response of
AAM have not been studied. Based on previous OPC studies it can be inferred that a
similar response will occur under different conditions however further study is required
to investigate the behavior in greater depth. The loading schemes for the strain
characterization of cementitious materials typically employ monotonic or cyclic loading.

52
(a) (b)
Figure 2.8 – Diagram of typical response of AAM under a) compression b) tension; The x-axis represents the force,
stress, or strain applied to the binder. The y-axis displays the fractional change in resistance (or impedance) in relation
to the external factors applied.
2.3.3.1.1 Monotonic loading
Under monotonic loading, a load is applied at a constant rate to the AAM and is
removed once the test has terminated. The sensing response is different for tension and
compression: not just in its sign. Under tension, resistance tends to increase in a quasi-
linear manner (Yoo et al., 2018a). In compression, however, the response of the substrate
differs and can be typically broken down into three regions depending on the loading
amplitude, as illustrated in Figure 2.8a and Figure 2.9:
1) Elastic: The first region of monotonic loading coincides with the elastic region of
the substrate. In this zone, the relationship between change in resistance and
applied strain is considered to be linear (Li et al., 2006; Sun et al., 2014) or of a
linear-like function (Ding et al., 2019c; Han and Ou, 2007). The sensor’s
performance is usually at its peak within this region. In various cases, a nonlinear
segment with low sensitivity at the very early stages of loading has been detected
(Lamuta et al., 2017; Rovnaník et al., 2019c) which has also been regarded as a
separate region in monotonic compression altogether (Galao et al., 2014). This has
led to applications commencing above zero (Lamuta et al., 2017; Rovnaník et al.,
2019c; Saafi et al., 2016). While this has been attributed to contact resistance
between the substrate and electrodes in two-probe sensing (Rovnaník et al., 2019c),

53
this behavior has also been observed in four-probe sensing applications as well
(Lamuta et al., 2017).
2) Non-linear: In the second region of monotonic loading, the resistance of the
materials continues to change, however the sensing performance is generally lower
and the response at this stage is nonlinear which eventually plateaus (small-no
change for load applied) (Azhari and Banthia, 2012; Yoo et al., 2018b). At this
stage damage to the matrix has begun in the form of cracks and defects. This leads
to the destruction and reconstruction of the conductive network and ultimately
reaching a state of balance (Tian et al., 2019; Wang et al., 2008).
3) Severe damage: Lastly, the third region of monotonic compression is associated
with severe damage to the matrix as the cracks continue to expand and the
performance is being compromised. At this juncture an abrupt increase in
resistance is typically expected with increasing load (Wang et al., 2008). The
substrate in this instance essentially loses its sensing capabilities, and resistance
may not even begin to return to its original baseline value once load is removed
(Han et al., 2015; Wang et al., 2008).
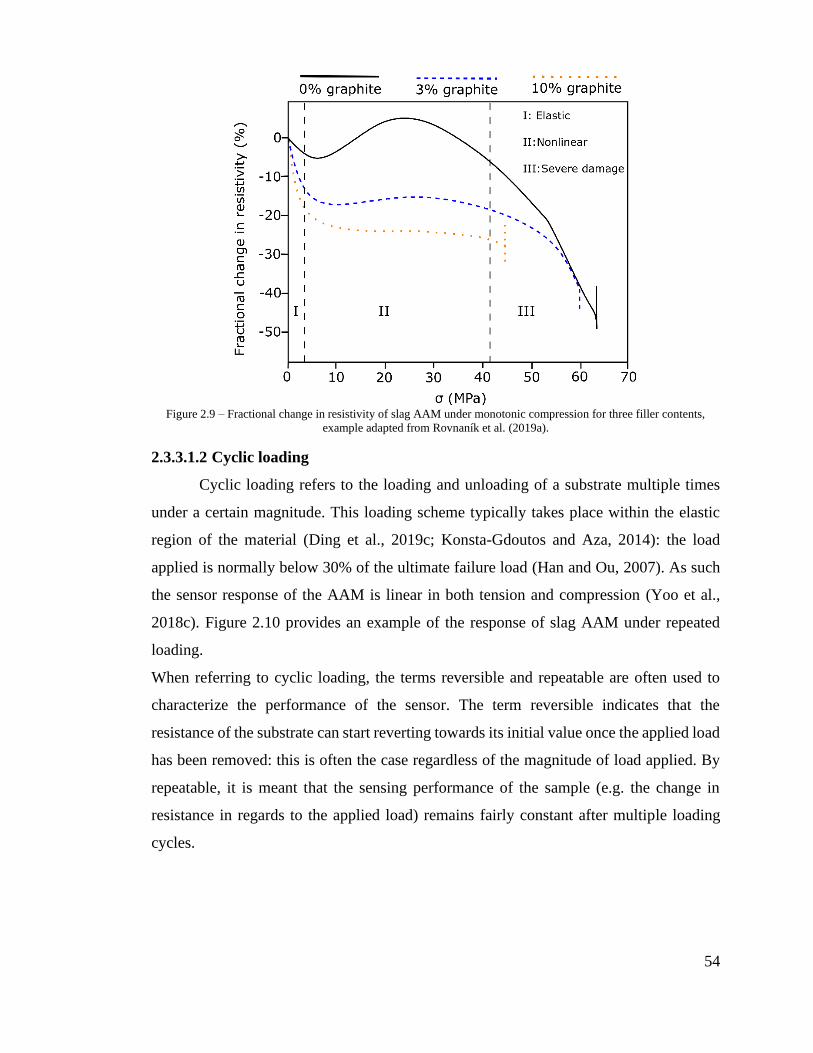
54
Figure 2.9 – Fractional change in resistivity of slag AAM under monotonic compression for three filler contents,
example adapted from Rovnaník et al. (2019a).
2.3.3.1.2 Cyclic loading
Cyclic loading refers to the loading and unloading of a substrate multiple times
under a certain magnitude. This loading scheme typically takes place within the elastic
region of the material (Ding et al., 2019c; Konsta-Gdoutos and Aza, 2014): the load
applied is normally below 30% of the ultimate failure load (Han and Ou, 2007). As such
the sensor response of the AAM is linear in both tension and compression (Yoo et al.,
2018c). Figure 2.10 provides an example of the response of slag AAM under repeated
loading.
When referring to cyclic loading, the terms reversible and repeatable are often used to
characterize the performance of the sensor. The term reversible indicates that the
resistance of the substrate can start reverting towards its initial value once the applied load
has been removed: this is often the case regardless of the magnitude of load applied. By
repeatable, it is meant that the sensing performance of the sample (e.g. the change in
resistance in regards to the applied load) remains fairly constant after multiple loading
cycles.

55
The resistance of the material at the beginning of the sensing test is usually referred to as
the ‘baseline resistance’ or ‘initial resistance’, and is denoted as Ro. Since the test is taking
place within the elastic region, according to Hooke’s Law the sample behaves elastically
and reverts to its initial state (Beer et al., 2009). Subsequently, the resistance is also
expected to change reversibly close to its initial value (Konsta-Gdoutos and Aza, 2014;
Sun et al., 2017a). That said, AAM like OPC is only ever quasi-linear: due to the internal
changes inside the matrix upon every load cycle, repeatable strain sensing can be difficult
to achieve (Fu and Chung, 1996; Sun et al., 2014), even in the linear region (if the material
enters the plastic region, repeatable sensing is not achievable, as there is a reconstruction
of the conductive network inside the matrix upon load removal (Han et al., 2017).
Figure 2.10 – Fractional change in resistivity of slag AAM under cyclic flexural loading, example adapted from
Rovnaník et al. (2019b).
2.3.3.1.3 Other strain responses in AAM samples
While most sensing applications follow the above behaviors, self-sensing
cementitious materials are comprised of a diverse and broad range of available materials
and system layouts, and therefore exceptions to the rules above are actually rather
common.

56
To provide a few examples, in a monotonic compression AAM application by Bi et al.
(2017) it was reported that upon load the change in resistance in the sample continuously
increased rather than decreased. It was posited that the formation of cracks in the matrix
hindered ion migration. While this is a justifiable explanation, it was also mentioned by
the authors that the binders were fabricated with the electrodes perpendicular to the
applied load and on different planes. This approach differs from the conventional
orientation employed in these circumstances (Han et al., 2007) and could have ultimately
influenced the sensing response of the sample (Liu et al., 2018; Wen and Chung, 2000).
In a similar application for AAM under monotonic compression, as can be seen in Figure
2.9, Rovnanik et al. (2019) mentioned that upon loading the resistance of the matrix
initially decreased as expected in the elastic zone, however as the load increased, the
resistance began increasing until it started decreasing again up until failure. This behavior
was explained due to the initial formation of cracks and the destruction of the conductive
network and the subsequent reconstruction of the conductive network due to the healing
of the defects.
Finally, Vaidya and Allouche (2011) reported a fluctuation in the electrical response of
carbon fiber AAM cylinders under compression. It was mentioned that this behavior could
be attributed to the simultaneous densification of the AAM paste and the development of
micro-cracks as both these occurrences have opposite effects on the resistance of the
sample.
2.3.3.2 Gauge factors
The performance of a strain sensing material is generally evaluated by the change
in resistance compared to the applied strain. The most common approach used in these
applications is the strain sensitivity coefficient, otherwise known as the gauge factor (GF)
which is also used in commercial strain gauges. The GF is calculated by the fractional
change in resistance divided by the applied strain, equation (2.8).
GF= (Ri-R0) R0⁄ ε⁄ (2.8)
where R0=resistance at start of the test, Ri=resistance at given strain, ε=applied strain.
Alternative methods of assessing strain capability similar to the gauge factor include

57
expressing the change in resistance per unit of stress, equation (2.9), e.g. 100Ω/MPa or by
displaying the resolution of the sensor in terms of strain sensitivity e.g. 1000με.
(Ri-R0) σ⁄ (2.9)
Where σ=applied stress. The strain response may differ between loading cycles due to
repeatability issues resulting from microcracks and deformations in the matrix (Yoo et al.,
2019) or due to polarization effects (Deng et al., 2019).
Table 2.5 below displays the reported strain sensing performances and GFs of AAM.
AAM showcase similar strain sensitivity to OPC exhibiting GFs within similar orders of
magnitude in respective applications (Baeza et al., 2013; D’Alessandro et al., 2016; Han
et al., 2017; Liu et al., 2018; Materazzi et al., 2013; Sun et al., 2017b). The highest reported
GF for AAM is 2610 in a GGBFS+fly ash ceramsite-carbon fiber application (Ma et al.,
2020). In the same study the report GF for binders without ceramiste remained high, 2027,
albeit with a different mix design. This sensing performance is comparable with a study
on OPC with nickel powder that reported GF = 1930 (Han et al., 2009). Table 2.5 also
presents strain sensing values such as resistance per unit stress (Ω/MPa), electric charge
per unit force (pC/N) and the fractional change in resistance (ΔR/R0). While these values
provide important information in their own respect, a comparison with other applications
is difficult to make with these values alone. Therefore it is recommended that the GF is
used in these instances to allow for simpler comparisons with other strain sensing
applications. If other strain sensing values are used then information such as strain,
modulus of elasticity of binder and conversion into common electrical units should be
provided to allow for the calculation of the GF.
Note that AAM strain performance presented in Table 2.5 is based on ‘standard’ testing
conditions i.e. at room temperature and once the substrate has reached moisture
equilibrium. The influence of additional factors such as moisture and temperature on strain
performance have not yet been accounted for in AAM apart from certain niche
applications (Lamuta et al., 2016). In comparison, the effects of moisture (Demircilioğlu
et al., 2019; Zhang et al., 2019) and temperature (Hong et al., 2018) on OPC strain sensing
have already been reported. While the literature available is fairly limited, it can be viewed

58
that metakaolin and ground granulated blast furnace slag based AAM have the potential
of showcasing high sensing capabilities compared to fly ash AAM. Lastly, as can be seen
in Table 2.5, compared to OPC, AAM also exhibit sensing capabilities without the use of
conductive filler.
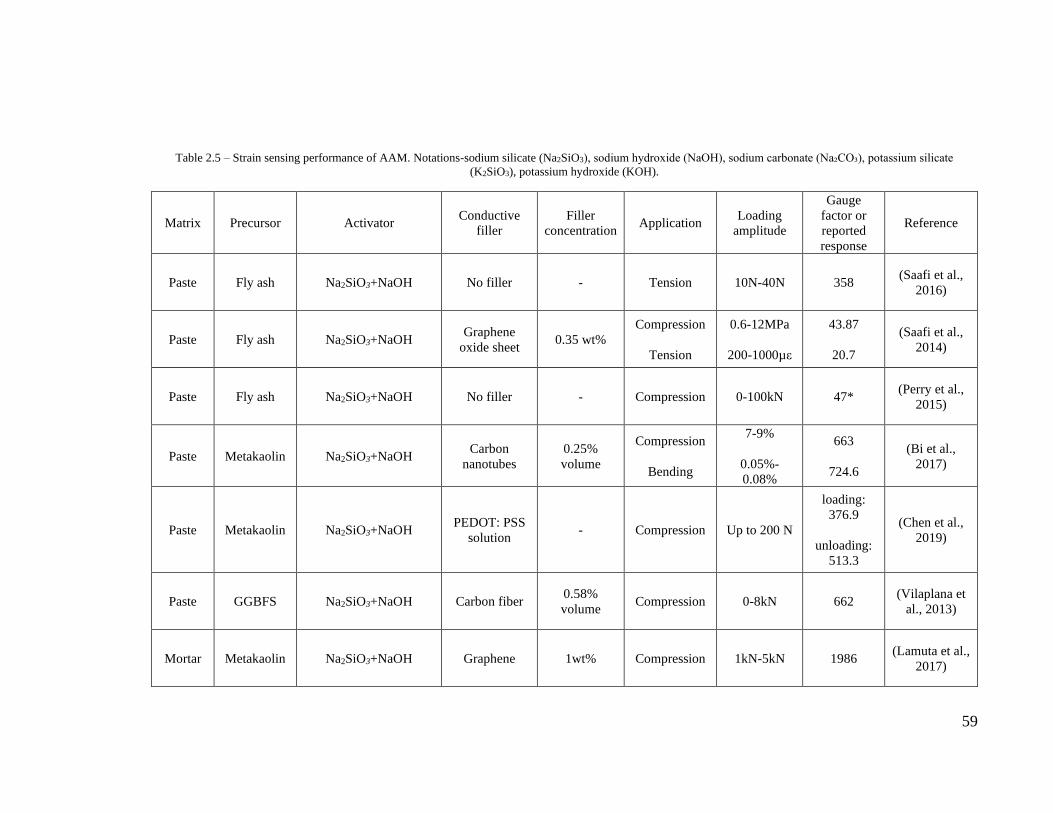
59
Table 2.5 – Strain sensing performance of AAM. Notations-sodium silicate (Na2SiO3), sodium hydroxide (NaOH), sodium carbonate (Na₂CO₃), potassium silicate
(K2SiO3), potassium hydroxide (KOH).
Matrix Precursor Activator Conductive
filler
Filler
concentration Application
Loading
amplitude
Gauge
factor or
reported
response
Reference
Paste Fly ash Na2SiO3+NaOH No filler - Tension 10N-40N 358 (Saafi et al.,
2016)
Paste Fly ash Na2SiO3+NaOH Graphene
oxide sheet 0.35 wt%
Compression
Tension
0.6-12MPa
200-1000µε
43.87
20.7
(Saafi et al.,
2014)
Paste Fly ash Na2SiO3+NaOH No filler - Compression 0-100kN 47* (Perry et al.,
2015)
Paste Metakaolin Na2SiO3+NaOH Carbon
nanotubes
0.25%
volume
Compression
Bending
7-9%
0.05%-
0.08%
663
724.6
(Bi et al.,
2017)
Paste Metakaolin Na2SiO3+NaOH PEDOT: PSS
solution - Compression Up to 200 N
loading:
376.9
unloading:
513.3
(Chen et al.,
2019)
Paste GGBFS Na2SiO3+NaOH Carbon fiber 0.58%
volume Compression 0-8kN 662
(Vilaplana et
al., 2013)
Mortar Metakaolin Na2SiO3+NaOH Graphene 1wt% Compression 1kN-5kN 1986 (Lamuta et al.,
2017)

60
Mortar GGBFS Na2SiO3 No filler - Compression 5-50kN
97.13
Ω /MPa;
35*
(Rovnaník et
al., 2019c)
Mortar GGBFS Na2SiO3 Graphite
powder 30wt% Compression 5-50kN 292*
(Rovnaník et
al., 2019a),
(Rovnaník et
al., 2017b)
Mortar GGBFS Na2SiO3 Carbon black 4%wt Flexure 0.07-0.50kN ≈1300* (Rovnaník et
al., 2019b)
Mortar GGBFS Na2SiO3+KOH+Na₂CO₃
(solid)
Carbon
nanofibers
/Carbon
black/graphene
nanoplatelets
1%wt Compression 1-3kN 62/65/39 (D’Alessandro
et al., 2020)
Mortar Fly
ash+GGBFS Na2SiO3+NaOH
Carbon fiber+
ceramsite 0.3wt%-35% Compression
6.25-18.75
MPa 2610
(Ma et al.,
2020)
Paste Fly ash K2SiO3 No filler - Compression 0-15kN 11 Ω/MPa (Saafi et al.,
2018)
Mortar Metakaolin Na2SiO3+NaOH No filler - Compression 0-2500 N 4.02 ± 0.49
pC/N
(Lamuta et al.,
2016)
Mortar Metakaolin Na2SiO3+NaOH Graphene 1wt% Compression 0-2500 N 11.99 pC/N (Candamano
et al., 2019)
Mortar GGBFS+
fly ash Na2SiO3+NaOH Carbon fiber
0.1%
volume Compression
6.25-18.75
MPa ΔR/R0=0.11
(Deng et al.,
2019)
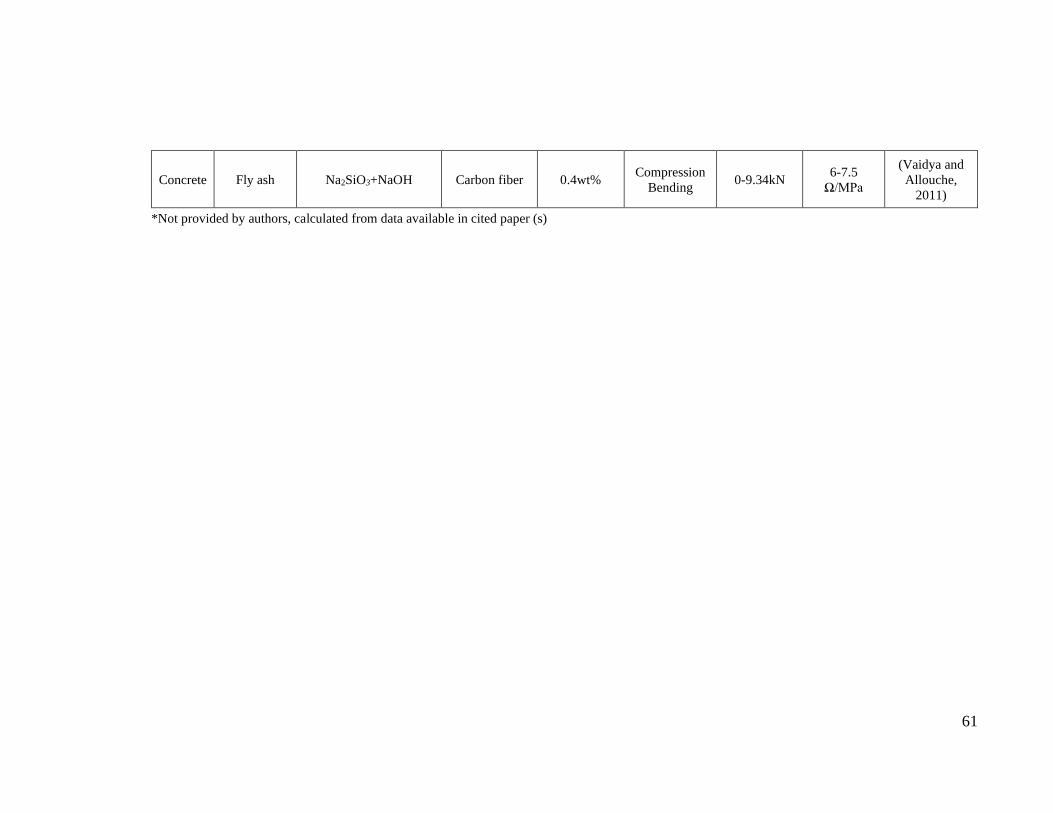
61
Concrete Fly ash Na2SiO3+NaOH Carbon fiber 0.4wt% Compression
Bending 0-9.34kN
6-7.5
Ω/MPa
(Vaidya and
Allouche,
2011)
*Not provided by authors, calculated from data available in cited paper (s)
62
2.3.3.3 Conductive filler applications
As mentioned in Section 2.3.2.1, conductive filler is added to cementitious
materials to increase their conductivity thus making them more suitable for large
area/volume sensing applications. When AAM are loaded with conductive fillers, the
sensing mechanism is attributed to both ionic and electronic conduction (Payakaniti et al.,
2017). Under strain tests, the response is dominated by conduction within the filler, and
the change of the conductive network inside the matrix. In situations in which the applied
load generates cracks in the sample, the resistance is expected to abruptly increase due to
the destruction of the conductive network (Deng et al., 2019; Rovnaník et al., 2019a,
2019b; Saafi et al., 2013).
The types of conductive filler that have been used in AAM strain sensing include carbon
fiber (Deng et al., 2019; Vaidya and Allouche, 2011; Vilaplana et al., 2013), graphene
(Lamuta et al., 2017; Saafi et al., 2016), graphite powder (Rovnaník et al., 2019a), carbon
nanotubes (Bi et al., 2017; Saafi et al., 2013) and carbon black (Rovnaník et al., 2019b):
• With respect to carbon fiber, the change in resistance has been attributed to the
reduction in the conduction length due to physical shortening of the compression
surface (Vaidya and Allouche, 2011), and the change of the proximity between
fibers (Deng et al., 2019).
• For a graphene-based application, Saafi et al. (2014) reported that the electrical
response of graphene composites is attributed to the contact resistance of the
overlapped graphene filler. When the contact area between the graphene sheets
increased under compression, the resistance of the material would decrease.
Similar behavior was also reported by Lamuta et al. (2017) in a graphene
metakaolin-based application under compression.
• Similar to carbon fibers, in carbon nanotube applications the resistance of the
matrix is influenced by the distances between the filler under mechanical load (Bi
et al., 2017; Saafi et al., 2013). Coating carbon nanotubes with SiO2 was reported
to result into a better conductive network, due to greater dispersion, allowing for
the greater detection of cracks (Bi et al., 2017).
63
• For graphite powder and carbon black the changes in resistance have been
attributed to changes in the conductive path the current follows in the matrix
(Rovnaník et al., 2019a,b). Chen et al. (2019) coated metakaolin AAM with a
conductive polymer PEDOT: PSS solution. The sample was subjected to natural
and artificial cracking and tested under uniaxial compression. The conducting
mechanism proposed by Chen et al. was coupled-mechanical-conductive contact
mechanism based on the Hertizan contact model between cracks.
2.3.3.4 Filler free applications
As mentioned in Section 2.3.3.2, AAM have seen multiple applications without
the use of conductive filler due to ionic conductivity of the alkali metals in the matrix. In
simple terms, most researchers accept that strain affects the mechanisms responsible for
hopping of the Na+ or K+ ions in the matrix (Bi et al., 2017; Padma Kumar and Yashonath,
2006; Saafi et al., 2018, 2016). The exact mechanisms are not completely understood,
however. For strain-sensing applications the following more elaborate mechanisms have
been provided by authors to explain the change in electrical properties of AAM:
I. Lamuta et al. (2016) proposed a chemical-physical model to explain the
piezoelectric effect of AAM based on ionic mobility due to the presence of water.
This effect is promoted by the migration of mobile hydrated cations under loading
in the pores of the AAM matrix, thus creating a charge imbalance and local dipoles.
The Na+ ions balance the single negative charge associated with aluminium (III)
in tetrahedral coordination. In completely dry samples, the AAM did not exhibit
any piezoelectric effect due to the absence of water. Hydration reduces the cation–
lattice electrostatic interaction through cation–water interaction, thus resulting in
a weaker bond that promotes the Na+ migration away from the framework wall
during mechanical loading and therefore creates the charge imbalance. Figure 2.11
presents a schematic representation of this model.
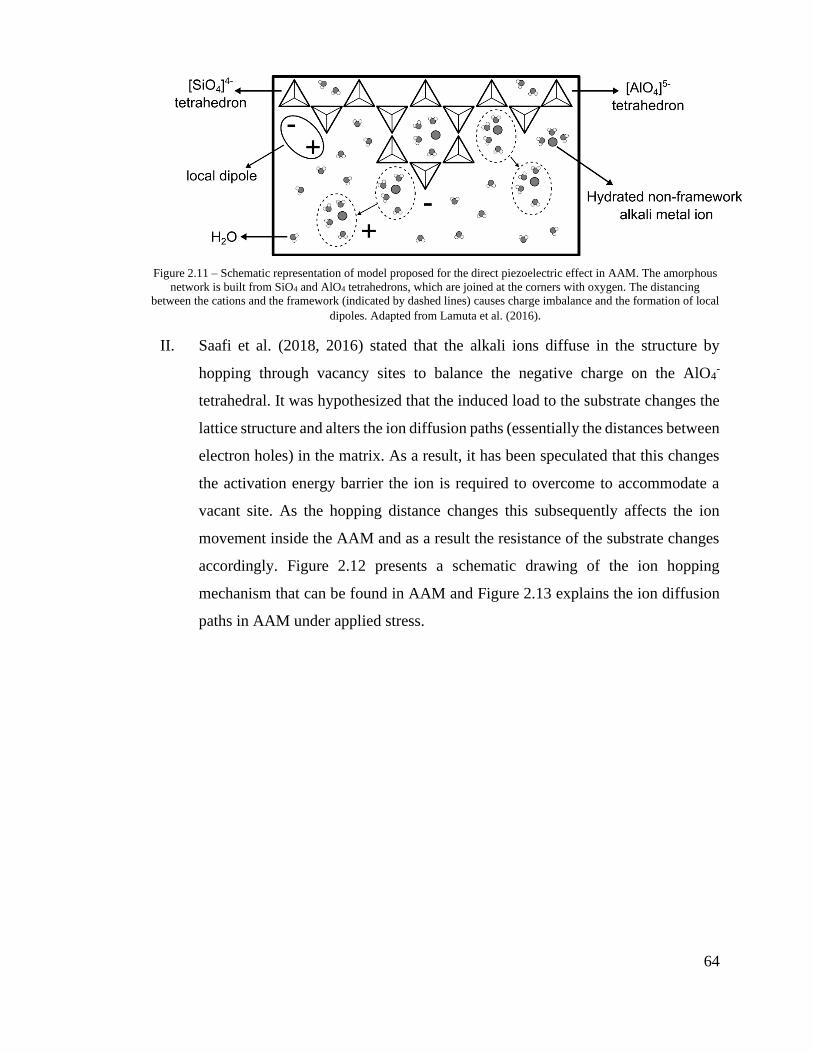
64
Figure 2.11 – Schematic representation of model proposed for the direct piezoelectric effect in AAM. The amorphous
network is built from SiO4 and AlO4 tetrahedrons, which are joined at the corners with oxygen. The distancing
between the cations and the framework (indicated by dashed lines) causes charge imbalance and the formation of local
dipoles. Adapted from Lamuta et al. (2016).
II. Saafi et al. (2018, 2016) stated that the alkali ions diffuse in the structure by
hopping through vacancy sites to balance the negative charge on the AlO4-
tetrahedral. It was hypothesized that the induced load to the substrate changes the
lattice structure and alters the ion diffusion paths (essentially the distances between
electron holes) in the matrix. As a result, it has been speculated that this changes
the activation energy barrier the ion is required to overcome to accommodate a
vacant site. As the hopping distance changes this subsequently affects the ion
movement inside the AAM and as a result the resistance of the substrate changes
accordingly. Figure 2.12 presents a schematic drawing of the ion hopping
mechanism that can be found in AAM and Figure 2.13 explains the ion diffusion
paths in AAM under applied stress.

65
Figure 2.12 – 3D crystal structure of AAM and ion hopping of alkali metal under electric field, adapted from Saafi et
al. (2016).
Figure 2.13 – Self-sensing mechanism in AAM a) AAM sensor under stress, b) ion diffusion pathway in the matrix
and energy landscape, c) effect of the compressive stress on the activation energy and hopping distance d; adapted
from Saafi et al. (2018).
III. Bi et al. (2017) mentioned that the water in the matrix facilitates the migration of
Na+ ions within the framework during mechanical loading which leads into ionic
conduction. As ionic conduction is associated with the movement of hydrated Na+
ions, the formation of the cracks in the substrate during loading potentially
hindered the migration process.

66
IV. Moreover, in the case of slag-based AAM it was reported by Rovanik et al. (2019)
that apart from the alkali metals ions in the matrix, the Fe ions found in the
precursor also have a positive effect on the sensing capability of the substrate. This
ultimately led to a combination of ionic, contact and tunneling conduction. This
was explained due to the fact that the Fe content in the slag precursor does not
always contribute to the overall chemistry of the binder and is passivated in the
pore solution (Bernal et al., 2014c). However, that is not to say that all Fe does not
contribute to alkaline activation. Slag with high Fe content has seen successful
applications in the formulation of AAM (Machiels et al., 2014; Peys et al., 2019,
2018). As a result, this conduction mechanism remains unproven.
While AAM have been effectively used in sensing applications without conductive filler,
situations exist in which filler free samples did not present similar performance. In
particular, cases have been reported where AAM failed to showcase any sensing response
(Deng et al., 2019) and in which AAM have been rendered unsuitable for certain types of
applications due to repeatability and reversibility issues (Rovnaník et al., 2019b). As a
result, conductive filler was required in both cases to allow for more reliable sensing
performances. Furthermore, even in the cases in which substrates absent of filler saw
successful applications, the sensing performance of the substrate undoubtedly benefited
from the addition of conductive filler (Bi et al., 2017; D’Alessandro et al., 2020; Rovnaník
et al., 2019a; Saafi et al., 2014). Table 2.6 showcases filler free applications of AAM and
their respective performances.
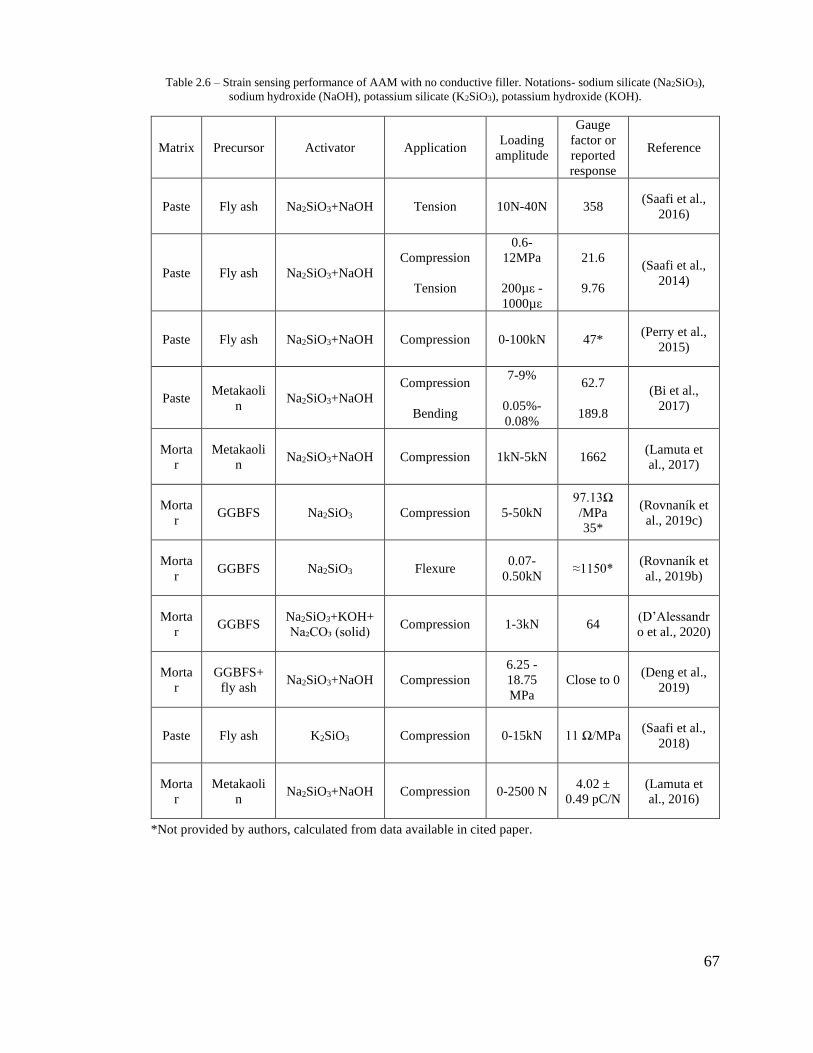
67
Table 2.6 – Strain sensing performance of AAM with no conductive filler. Notations- sodium silicate (Na2SiO3),
sodium hydroxide (NaOH), potassium silicate (K2SiO3), potassium hydroxide (KOH).
Matrix Precursor Activator Application Loading
amplitude
Gauge
factor or
reported
response
Reference
Paste Fly ash Na2SiO3+NaOH Tension 10N-40N 358 (Saafi et al.,
2016)
Paste Fly ash Na2SiO3+NaOH
Compression
Tension
0.6-
12MPa
200µε -
1000µε
21.6
9.76
(Saafi et al.,
2014)
Paste Fly ash Na2SiO3+NaOH Compression 0-100kN 47* (Perry et al.,
2015)
Paste Metakaoli
n Na2SiO3+NaOH
Compression
Bending
7-9%
0.05%-
0.08%
62.7
189.8
(Bi et al.,
2017)
Morta
r
Metakaoli
n Na2SiO3+NaOH Compression 1kN-5kN 1662
(Lamuta et
al., 2017)
Morta
r GGBFS Na2SiO3 Compression 5-50kN
97.13Ω
/MPa
35*
(Rovnaník et
al., 2019c)
Morta
r GGBFS Na2SiO3 Flexure
0.07-
0.50kN ≈1150*
(Rovnaník et
al., 2019b)
Morta
r GGBFS
Na2SiO3+KOH+
Na₂CO₃ (solid) Compression 1-3kN 64
(D’Alessandr
o et al., 2020)
Morta
r
GGBFS+
fly ash Na2SiO3+NaOH Compression
6.25 -
18.75
MPa
Close to 0 (Deng et al.,
2019)
Paste Fly ash K2SiO3 Compression 0-15kN 11 Ω/MPa (Saafi et al.,
2018)
Morta
r
Metakaoli
n Na2SiO3+NaOH Compression 0-2500 N
4.02 ±
0.49 pC/N
(Lamuta et
al., 2016)
*Not provided by authors, calculated from data available in cited paper.

68
2.3.4 Temperature sensing
2.3.4.1 Overview
Temperature sensing using AAM is less frequently explored, but is critical:
without knowledge of the sensor’s response to thermal effects, its strain behavior cannot
be decoupled.
The response of cementitious materials to temperature tends to be more complicated when
compared to strain sensing. This is because elevated temperatures tend to cause
evaporation, and so changes to environmental humidity and AAM matrix moisture (effects
which are discussed separately in Section 2.3.5 of this chapter). The result is that
temperature characterization must be conducted in a sealed environment with controlled
or monitored moisture and humidity conditions.
For the most part the behavior of AAM and OPC under temperature change is fairly
similar. As a rule of thumb, as the temperature increases, the resistance of the sample
decreases due to increased ion mobility at high temperatures (Biondi et al., 2020). Figure
2.14 displays the fractional change in impedance of AAM for various temperatures. Based
on the existing literature in both OPC and AAM, the behavior of cementitious materials
under temperature change can be divided into three primary regions. Compared to strain
sensing though, these regions are not as distinctly defined and overlapping among regions
is quite common.

69
Figure 2.14 – Fractional change in impedance-frequency response for 3D printed metakaolin AAM between
10oC-30oC, adapted from Vlachakis et al. (2020).
2.3.4.2 Sensing behavior at different temperatures
The first region of temperature sensing of reported applications is situated
approximately between -30oC up to around 50oC. This section encapsulates most of the
temperature sensing tests that have been carried out, and corresponds to the majority of
field and civil engineering applications. The behavior for this temperature range is fairly
straightforward as when the temperature increases, the resistance of the material decreases
(Biondi et al., 2020; Chang et al., 2013; Dehghanpour and Yilmaz, 2020; Demircilioğlu
et al., 2019; Lee et al., 2019; MacKenzie and Bolton, 2009; Perry et al., 2015; Saafi et al.,
2016; Sun et al., 2017a; Vlachakis et al., 2020).
The second region typically lies between 50oC – 110oC. In this region, the response of the
materials begins to showcase somewhat irregular behavior depending on the testing
conditions. For metakaolin AAM, it was reported by MacKenzie and Bolton (2009) that
as the temperature increased up to 80oC the resistance of the sample started to increase as
well due to the depletion of water in the matrix. On the contrary though, in an OPC based
investigation conducted by Demircilioglu et al. (2019) under sealed conditions the

70
resistance of the sample between 50oC – 115oC remained fairly constant due to the
equilibrium of water vapor as a result of the sealed environment. Similarly, in another
OPC based application under sealed conditions Teomete (2016) reported small changes
in resistance between 50 oC up until 200 oC.
The third region has so far been loosely defined as “the temperature at which the behavior
of the sample begins to change once again”. This point is usually found to lie between
80oC - 200oC. In AAM, MacKenzie and Bolton (2009) pointed out that beyond 80oC the
mobile charge-carrying hydrous species were depleted and other charge carrying
mechanisms were more significant at this point. Up until 290oC after the water has been
removed, the resistance of the material decreased as a function of the added conductive
filler content and temperature. Similarly, Gulicovski et al. (2020) noted that at greatly
elevated temperatures (500 oC – 700 oC) the impedance of AAM decreased as the
temperature increased. This was explained due dehydration and dehydroxylation of the
AAM, introducing new conduction pathways in the matrix. In addition, Sellami et al.
(2019) mentioned that for temperatures beyond 575 oC the AAM underwent structure
rearrangement which ultimately led to the improved alkali metal ion transfer rate and
electrical conductivity (decrease in resistance). Under sealed conditions in OPC
applications by Teomete (2016) and Demircilioglu et al. (2019) it was reported that
beyond a certain point the resistance of the sample started to increase significantly. It was
explained by the authors that this rapid increase in resistance was due to the mismatch in
behaviors between the cement paste and the aggregates and conductive fiber at elevated
temperatures. The cement paste contracted while the aggregates and conductive fiber
elongated causing tensile stresses to develop and thus damage inside the matrix. In general,
the third region of temperature sensing is highly complex due to the simultaneous
occurrence of multiple phenomena. The increased temperature can cause depletion of
moisture in the pores of the binder (Lo Monte et al., 2019). Moreover, as previously
mentioned, the increased temperature can also cause the expansion of aggregates. Both
can lead to cracks in the binder and thus an increase in resistance. At the same time though,
elevated temperature increases ion mobility which leads to decreased resistance. In this
region applications only for AAM pastes have been reported, in which a decrease in

71
resistance was observed. It can be inferred that AAM with aggregates will showcase a
different response. This region requires greater in-depth analysis to determine the
dominant factor affecting resistance for each type of AAM binder.
2.3.4.3 Temperature sensing: characterization equation
Most temperature applications of AAM are conducted at around ambient
temperatures, in the first region of temperature sensing. Similar to strain tests, a material’s
temperature behavior is normally examined by investigating the change in
resistance/impedance against the applied temperature. The relationship in this case is not
as clearly defined as it is in strain sensing applications as the reported responses tend to
vary.
In a fly ash AAM study by Saafi et al. (2016) conducted between -10oC – 35oC, a linear
relationship between the change in impedance and temperature was presented, although
with a low coefficient of determination (0.802-0.904). Moreover Perry et al. (2016) also
reported a linear response between change in impedance and temperature change for fly
ash AAM, albeit under a small temperature range (ΔT=3oC) where a linear approximation
can be made. A linear change in resistance has also been identified in OPC for
temperatures between 25oC – 50oC (Demircilioğlu et al., 2019).
In contrast, Perry et al. (2015) reported a polynomial relationship between change in
impedance and temperature change between 10oC – 30oC in a fly ash AAM investigation.
More recent and in-depth work on filler free AAM applications between 5 oC – 30oC and
10 oC – 30oC conducted by Biondi et al. (2020) and Vlachakis et al. (2020) respectively
showcased that the change in impedance in relation to temperature follows an exponential
trend, equation (2.10), expressed by Van Meurs (1958) such that:
Zi Z0=e(AT
+BT+C)⁄ (2.10)
where Z0=impedance at start of the test, Zi=impedance at given temperature,
T=temperature and A, B and C are constants. Figure 2.15 illustrates the temperature
response of printed metakaolin AAM following equation (2.10). Similarly, in OPC based
studies carried out by Lee et al. (2019) between 5 °C to 40 °C, Chang et al. (2013)

72
between -15oC – 20oC and Sun et al. (2017a) between -30 oC – 60oC, while the response
was not characterized, it can be easily observed by the graphs provided that the
relationship between resistance and temperature was nonlinear in both instances.
Figure 2.15 – Normalized impedance response of metakaolin 3D printed AAM patch to temperature during four
temperature cycles. Zmod is the modulus impedance at a given temperature and Zmod,0 the initial modulus impedance at
10oC (Vlachakis et al., 2020).
Crucially, equation (2.10) is underpinned by accepted physical explanations of the
mechanisms responsible for changes in cementitious material conductivity. The
temperature response of AAM can be described using the time-temperature superposition
principle (Funke and Banhatti, 2006). While this is described in detail by Biondi et al.
(2020), the time-temperature superposition principle states that increasing the temperature
of an AAM is completely equivalent to speeding up the motion of its ions and conduction
mechanisms. In order to produce an electrical current, an ion within the AAM must hop
from its existing site to an adjacent site, and that site must relax to accommodate the ion.
The longer it takes for an ion to be accommodated, the greater the probability of a
backwards hop. Increasing temperature speeds up relaxation, and essentially accelerates
ion hopping.

73
2.3.4.4 Temperature sensitivity values
The temperature response of various AAM applications is presented in Table 2.7.
As the characterization equation describing the relationship between temperature and
impedance/resistance has historically been poorly defined, the sensitivity values of AAM
during temperature characterization has varied.
Saafi et al. (2016) reported a linear temperature sensitivity of kT = 0.02 oC-1 (21.5kΩ/C)
for AAM with graphene-based electrodes. Perry et al. (2016, 2015) in a fly ash-based
coating applications showcased a sensor with a sensitivities ranging from kT = of 0.08 oC-1
to 0.5 oC-1. Cai et al. (2020c) also investigated the Seebeck effect for both fly ash and
metakaolin AAM, and quoted their sensitivities as -6.31 μV/oC for fly ash AAM, and -
15.12 μV/oC for metakaolin AAM. The Seebeck effect for metakaolin AAM was also
investigated by Li et al. (2021). The sensitivity values in that study ranged between 1736–
2170 μV/oC, several orders of magnitude higher than what was presented in Cai et al.
(2020c). Both studies attributed the response of the samples to AAM microstructure and
alkali ions in the matrix. Potential reasons for this vast difference could originate from the
fact that Cai et al. (2020c) tested samples after 28 days of curing whereas Li et al. (2021)
cured the samples for 7 days. The different moisture content in the samples at the age of
testing could lead to different response. Studies have shown that moisture content can
heavily impact the sensing response of the AAM (Biondi et al., 2020). Further
considerations could include sample sizes and the different alkaline solutions used.
Biondi et al. (2020) explored the temperature response for fly ash AAM for various water
content ratios. The temperature sensitivity ranged between 0.06 oC-1 to 0.18 oC-1 and with
a repeatability of 1-2% deviation. Additionally, in a 3D printed AAM coating application
Vlachakis et al. (2020) reported a temperature sensitivity of 0.1 oC-1 and a repeatability of
0.3 oC. In a robotic sprayable AAM application. McAlorum et al. (2021) reported the
temperature sensing precision of sprayed patches as δT = 0.2 oC.

74
Table 2.7 – Temperature sensing response of AAM.
Matrix Precursor Conductive
filler
Temperature
range
Reported
response Reference
Paste Fly ash No filler -10oC - 35oC 21.5kΩ oC-1 (Saafi et al.,
2016)
Paste Fly ash No filler 10oC - 30oC 0.5oC-1 (Perry et al.,
2015)
Paste Fly ash No filler 5oC - 30oC 0.1oC-1 (Biondi et al.,
2020)
Paste Fly ash Magnetite ΔT=3oC 0.0781oC-1* (Perry et al.,
2016)
Paste Metakaolin
Graphite,
single wall
carbon
nanotube
Up to 340oC
Conductivity
function of
temperature
(MacKenzie
and Bolton,
2009)
Paste Metakaolin No filler 10oC - 30oC 0.1oC-1 (Vlachakis et
al., 2020)
Paste Metakaolin No filler 10oC - 30oC 0.2oC-1 (McAlorum et
al., 2021a)
Paste Metakaolin
Fly ash No filler ΔT=45oC
-15.12μV/oC
-6.31 μV/oC
(Cai et al.,
2020c)
Paste Metakaolin No Filler ΔT=16oC 1736-
2170 μV/oC (Li et al.,
2021)
*Not provided by authors, calculated from data available in cited paper
Making a clear comparison between AAM and OPC binders is challenging. While the
resistance for OPC binders has been reported for various temperatures, the sensing
response has not been characterized as it has for AAMs. Figure 2.16 provides temperature
characterization curves for conductive-fiber laced OPC composites reported in (Chang et
al., 2013; Demircilioğlu et al., 2019; Lee et al., 2019; Sun et al., 2017a). These data were
not explicitly included in the original references, but were determined based on the
reported dependencies of electrical resistance, resistivity, or impedance, on temperature.
In Figure 2.16, M is the reported electrical quantity measured (e.g. resistance, resistivity,
or impedance), and M0 is the value of that measurand at 20 oC. Normalization using M/M0
is performed to make fractional shifts in resistance and resistivity comparable, as the

75
normalization reduces the impact of geometric effects. The fits shown all use an equation
of the form, equation (2.11):
ln M M0=-ax+b⁄ (2.11)
Where the parametric constants, a and b, for each study are listed in Table 2.8.
Table 2.8 – Parametric constants for the fits for temperature characterization of OPC and AAM binders.
Application a b Reference
OPC 0.054 1.01 (Chang et al., 2013)
OPC 0.050 1.00 (Lee et al., 2019)
OPC 0.040 0.86 (Sun et al., 2017a)
OPC 0.030 0.68 (Demircilioğlu et al.,
2019)
AAM 0.028 0.58 (Vlachakis et al., 2020)
An AAM study by Vlachakis et al. (2020) is also included in Figure 2.16 for comparison.
As shown, the temperature response of OPC and AAM binders is comparable. However,
temperature sensing is affected by numerous factors such as saturation of the binder
(Biondi et al., 2020) and therefore a definitive claim cannot be made with these data alone.

76
Figure 2.16 – Characterization of temperature sensing response for OPC and AAM binders. M refers to the reported
electrical measurand (resistance, resistivity or impedance) and M0 the value at 20 oC.
2.3.5 Moisture sensing
Moisture sensing is infrequently explored in AAM, but is important even in strain
sensing applications due to moisture’s significant impact on AAM electrical conductivity.
Moisture is here defined as the water content inside the matrix: this is something which
can be impacted by environmental humidity condensing in AAM pores or existing in a
vapor phase. It is universally acknowledged that increasing the water content, whether
AAM or OPC, increases the sample’s conductivity (Brantervik et al., 1990). The
relationship between resistance and moisture content is typically expressed as an
exponential (Saleem et al., 1996) or by a power law correlation (Brantervik et al., 1990;
Nguyen et al., 2017).
A study was carried out by Biondi et al. (2020) in fly ash based AAM for water content
ranging between 25.5–87.7%. It was shown that similar to temperature, increasing water
content in the matrix increases the ion hopping mechanism described in Section 2.3.3.4.
Water was explained to increase the connectivity of the pore network and the volume of
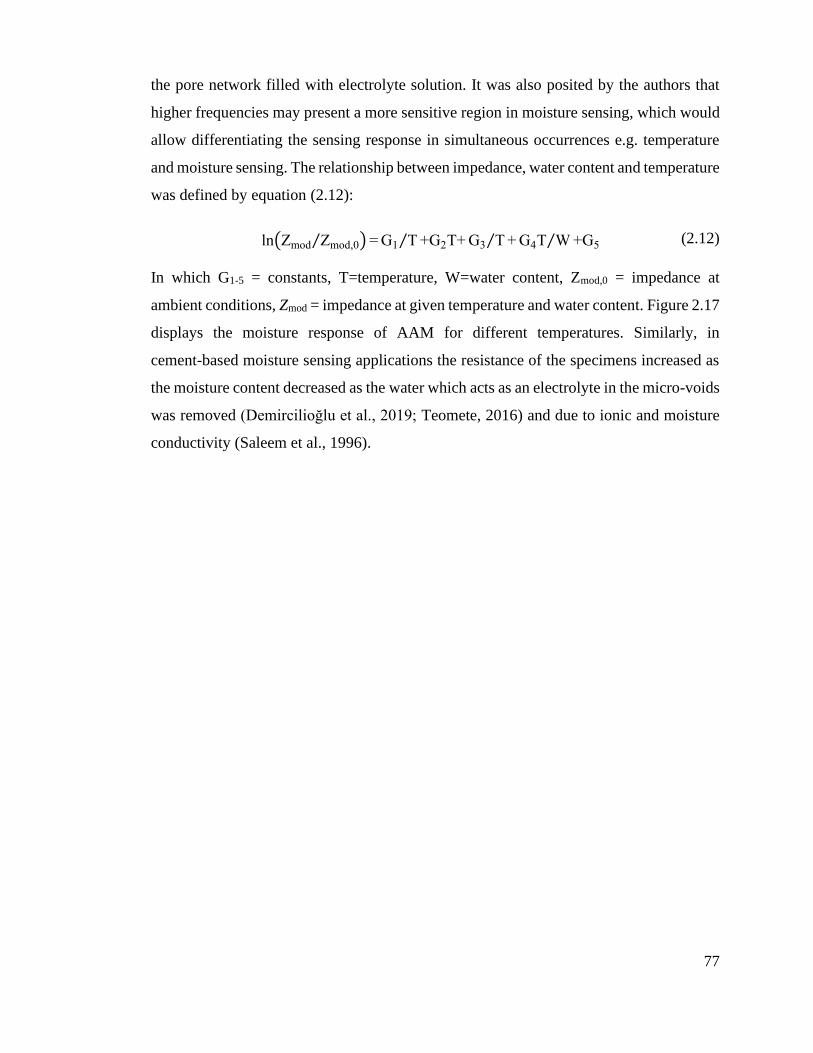
77
the pore network filled with electrolyte solution. It was also posited by the authors that
higher frequencies may present a more sensitive region in moisture sensing, which would
allow differentiating the sensing response in simultaneous occurrences e.g. temperature
and moisture sensing. The relationship between impedance, water content and temperature
was defined by equation (2.12):
ln(Zmod Zmod,0⁄ ) = G1 T⁄ +G2T+ G3 T⁄ + G4T W⁄ +G5 (2.12)
In which G1-5 = constants, T=temperature, W=water content, Zmod,0 = impedance at
ambient conditions, Zmod = impedance at given temperature and water content. Figure 2.17
displays the moisture response of AAM for different temperatures. Similarly, in
cement-based moisture sensing applications the resistance of the specimens increased as
the moisture content decreased as the water which acts as an electrolyte in the micro-voids
was removed (Demircilioğlu et al., 2019; Teomete, 2016) and due to ionic and moisture
conductivity (Saleem et al., 1996).

78
Figure 2.17 – A 3D calibration curve for a fly ash AAM, showing sensor response to both moisture and temperature
(Biondi et al., 2020).
2.3.6 Future work and recommendations
While extensive research has been carried out in self-sensing AAM, Table 2.9
highlights that the extent of study is very limited compared to the body of work for OPC.
This is simply because AAM are relatively new, and OPC concretes are still the most
widely used construction material today. This will change as civil engineers strive to meet
climate targets, and it will be important to bear in mind that the work from OPC will not
always be translatable to AAM.
Table 2.9 reveals the gaps in knowledge that need to be filled in future work:
• AAM sensor response to humidity has not been investigated
• while strain applications exist, they have primarily focused on uniaxial loading:
multiaxial applications are quite limited.
• the combined effects of multiple phenomena on the sensing performance of AAM
have not been looked into apart from combined moisture and temperature. The
impact of both moisture and temperature on strain sensitivity have not yet been
explored.

79
AAM sensing is also currently limited in its applications: most papers are focused on
concrete structural health monitoring. Broader applications such as traffic detection would
be feasible but are currently absent in AAM literature.
AAM sensing is also limited in the number of techniques it employs. OPC sensing, for
example, has already explored small-sized self-sensing composites embedded in larger
substrates (Baeza et al., 2013; Liu et al., 2018; Sun et al., 2014). While applications with
a similar purpose have been explored in AAM in the form of coatings (McAlorum et al.,
2021a; Perry et al., 2016, 2015; Vlachakis et al., 2020), the number of applications and
available literature is still quite limited.
Table 2.9 – Could literature be found that demonstrated sensing techniques in OPC and AAM?
Material Strain Temperature Moisture Humidity Strain-
Temperature
Strain-
Moisture
Temperature-
Moisture
AAM
Uniaxial,
multiaxial
limited
Yes Yes No No No Yes
OPC Yes Yes Yes Yes Yes Yes No
As mentioned in Section 2.3.3.4 the sensing mechanism for filler-free AAM is not fully
understood but various explanations have been given. A more in-depth explanation of this
mechanism is required to further progress in AAM sensing applications.
It has been acknowledged that the performance of AAM is governed by molar ratios rather
than the mass ratios that are typically used in OPC (Provis, 2014a). While studies have
focused on the effect of the chemical composition and mix design on the conductivity of
AAM (Cai et al., 2020b; Cui et al., 2008; Hanjitsuwan et al., 2014, 2011; Payakaniti et al.,
2017) a direct translation between molar ratios and sensing capability, apart from very
specific applications (Cai et al., 2020c), translation between molar ratios and sensing
capability, apart from very specific applications (Li et al., 2021), is currently absent. As
can been seen in Table 2.5 and Table 2.6 the reported sensing performances of AAM are
quite vast and broad. Correlating the molecular composition with the sensing performance
may potentially pave the road for more repeatable and consistent results. With that in mind,

80
it can be accepted that altering the chemistry of AAM to fit research requirements and
performing a proper analysis may be associated with more challenges compared to an
OPC mix design.
AAM can be fabricated with different types of precursors, each with a different molar
composition. While the reported applications have focused on using fly ash, metakaolin
and ground granulated blast furnace slag, the range of available precursors for AAM keeps
on increasing. Materials such as rice husk ash, palm fuel ash, red mud etc. have seen
applications in AAM fabrication (Provis et al., 2015). This can open the path to new
research and development possibilities and perspectives on AAM sensing. Sensing
applications have primarily focused on the standard two-part mix of AAM. It has been
posited that one-part mixes may provide a more approachable route in future applications
of AAM (Provis, 2018). Therefore, exploring one-part AAM mixes may allow a more
straightforward approach allowing the material to be more easily deployed in the field.
Finally, while standards for AAM fabrication and sensing applications do not currently
exist, a unified approach or common sensing setup for general cementitious sensing is
required to allow for more convenient and accurate comparison between applications. A
universal methodology will be essential for laying the groundwork for industrial
applications. Recommendations that can be considered in future applications follow:
• The chemical composition of all constituents should be reported where possible.
A thorough mix design with both solid-liquid ratios and molar ratios of AAM
should be included. The curing regime should also be clearly stated e.g., heated
cured, sealed conditions etc.
• Gauge factors or common equivalent sensing performance units should be
reported in all applications. For strain applications the applied strain and/or
modulus of elasticity should also be provided where possible to allow for further
analysis and comparisons in future applications.
• An average gauge factor/sensing performance with standard deviation and
coefficient of determination should be provided instead of reporting the highest
sensing performance values achieved.

81
• The surrounding conditions e.g., temperature and humidity should be monitored
with an external sensing device to ensure a relatively constant testing environment.
Strain sensing in particular can be impacted by fluctuations in temperature and
humidity.
• The number of samples tested and number of measurements per sample should be
reported.
• Proper insulation between the binder and the surrounding environment must be
ensured throughout the entire duration of the experiment.
• The type of current, direct or alternating, should be explicitly mentioned. The
frequency and sampling rate should also be reported if alternating current is used.
• The orientation of the electrodes should be consistent throughout subsequent tests.
For strain sensing, the direction of the electrodes should reflect the anticipated
behaviour of the sample e.g., current and voltage are parallel to the applied load
for compression and perpendicular for tension.
• A period of stabilization should be allowed for samples prior to testing.
• The state of the binder e.g., dried, saturated, unsaturated etc. and the testing
conditions, sealed or unsealed, should be stated.
2.3.7 Summary of self-sensing alkali activated materials.
This section provided an overview of the current state-of-the-art in sensing using
alkali activated materials. As our understanding of these materials progresses, agreement
between studies will hopefully begin to converge. As alkali-activated materials provide
the benefits of being an economically viable and environmentally friendly alternative to
OPC, we anticipate this field of research will grow as their use becomes more common.
AAM have already seen some successful applications in strain, temperature and moisture
sensing either as the main structural material or as a self-sensing coating applied to
existing infrastructure. Drawing on the literature outlined in this section the following
considerations for the upcoming sensing investigations in this thesis are made:

82
• AAM can be used in self-sensing applications without relying on the use of
electrically conductive filler. This is a key parameter to consider as the presence
of filler can pose limitations in 3D printing applications.
• The AAM sensor fabrication, testing and evaluation methods outlined in this
chapter will be followed for the temperature and strain characterization of AAM
sensors.
• The expected response of AAM under strain, temperature and moisture sensing is
established and will be considered in the experimental phase of this thesis.
2.4 3D printing cementitious materials
2.4.1 Introduction
Additive manufacturing, otherwise known as 3D printing, is a layer-by-layer
process that enables deposition of a material through a nozzle. 3D printing has seen
numerous applications in biomedical engineering (Ghilan et al., 2020), electronics (Espera
et al., 2019), and the food industry (Baiano, 2020). Over the past decade, 3D printing has
seen rapid growth in the construction sector as well (Buswell et al., 2018; Li et al., 2020;
Lim et al., 2012; Salet et al., 2018). This means of fabrication has gained interest as it
allows construction without the use of additional formwork allowing for greater
construction efficiency, reduced labor costs and less waste production (El-Sayegh et al.,
2020; Weng et al., 2020).
Over the years printing methodologies have been proposed for cementitious materials. In
this chapter, existing practices are investigated and additional methods are examined to
successfully carry out the requirements of this thesis.
2.4.2 Cementitious printing
Common names for the extrusion of cement-based materials include digital
concrete construction (Mechtcherine et al., 2019) and concrete printing (Lim et al., 2012).
For this chapter we will use the term cementitious printing to refer to the extrusion of
ordinary Portland cement (OPC) and alkali activated materials (AAM) paste, mortar and
concrete. The first step in 3D printing is data preparation. This involves the drawing of
the intended design with the use of computer-aided design (CAD) software and the
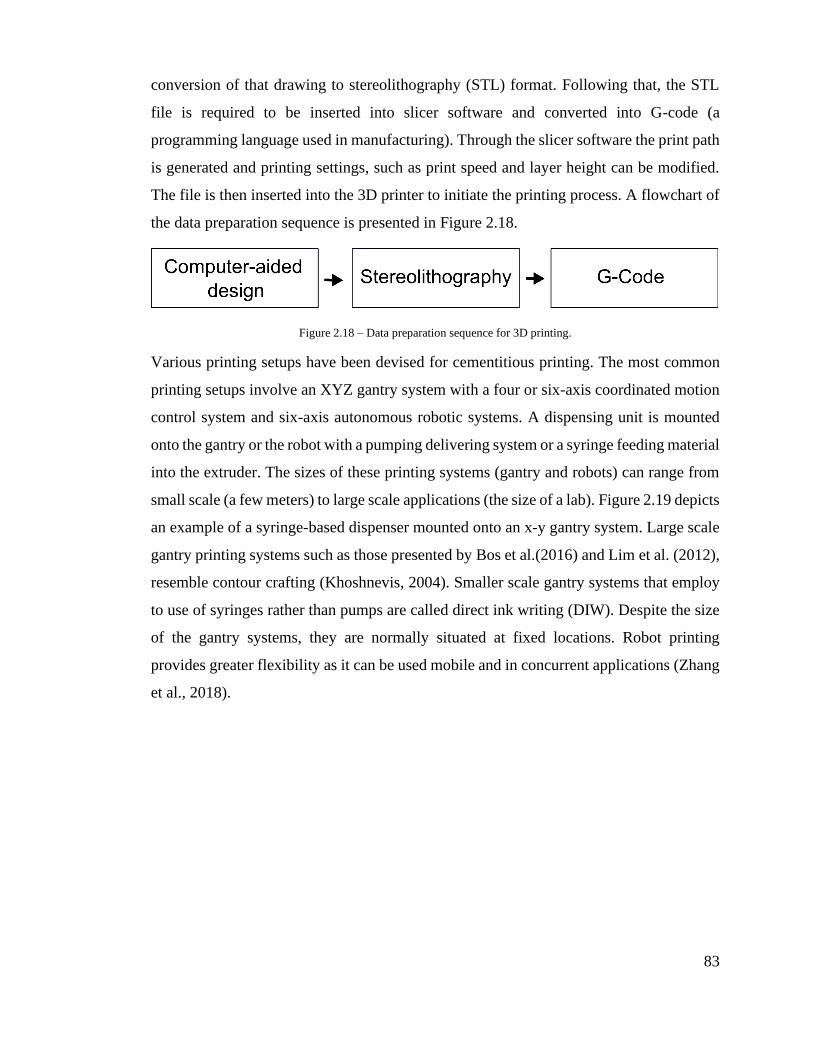
83
conversion of that drawing to stereolithography (STL) format. Following that, the STL
file is required to be inserted into slicer software and converted into G-code (a
programming language used in manufacturing). Through the slicer software the print path
is generated and printing settings, such as print speed and layer height can be modified.
The file is then inserted into the 3D printer to initiate the printing process. A flowchart of
the data preparation sequence is presented in Figure 2.18.
Figure 2.18 – Data preparation sequence for 3D printing.
Various printing setups have been devised for cementitious printing. The most common
printing setups involve an XYZ gantry system with a four or six-axis coordinated motion
control system and six-axis autonomous robotic systems. A dispensing unit is mounted
onto the gantry or the robot with a pumping delivering system or a syringe feeding material
into the extruder. The sizes of these printing systems (gantry and robots) can range from
small scale (a few meters) to large scale applications (the size of a lab). Figure 2.19 depicts
an example of a syringe-based dispenser mounted onto an x-y gantry system. Large scale
gantry printing systems such as those presented by Bos et al.(2016) and Lim et al. (2012),
resemble contour crafting (Khoshnevis, 2004). Smaller scale gantry systems that employ
to use of syringes rather than pumps are called direct ink writing (DIW). Despite the size
of the gantry systems, they are normally situated at fixed locations. Robot printing
provides greater flexibility as it can be used mobile and in concurrent applications (Zhang
et al., 2018).

84
Figure 2.19 – Dispenser mounted onto x-y gantry system of commercial 3D printer.
The uniqueness and intricacies of printing systems reported in existing literature makes it
challenging to directly compare them. Analyzing additive manufacturing with the printing
system alone does not provide a complete picture on the method followed. Nerella et al.
(2020) classified cementitious printing as full width printing and filament printing. In full
width printing the nozzle opening is normally the size of the width of the object. As such
a single ‘filament’ would be extruded for each layer. Common printing features such as
infill and perimeters are absent in this printing method. In filament printing, the size of
the nozzle is multiple times smaller than the intended width of the object. Therefore, one
layer would require multiple ‘filaments’ to be completed, along with perimeters and infill.
The printing method selected will be based on the intended application. For example,
beams or panels are most likely to be extruded using full width printing. It is more
common for larger printing setups to employ full width printing due to the larger volume
of material and equipment. Filament printing is more likely to be encountered in DIW
systems due to the small nozzle openings.

85
The size of the printing system affects the efficacy of the printing method. For instance,
two gantry systems with different nozzle openings (e.g. 1 mm and 10 mm) that employ
the same printing method may not be able to produce the same quality (refer to Table 2.10
for definition) objects. Furthermore, filament printing of larger scale systems may only
require a few ‘filaments’ compared to DIW systems where filament printing may require
tens or hundreds of filaments per layer. The interactions and drying effect between
filaments will impact the final result. As such while defining the printing method is useful
to provide more context in printing, it is more beneficial when used to compare
applications of similar printing setups.
2.4.3 Printing terminology
Cementitious printing employs similar printing terminology to that found in plastic
printing. Slight adjustments to the definition of certain terms have been made to account
for the nuances of cementitious printing. Common printing terms used in research studies
(Bos et al., 2016; Buswell et al., 2018; Labonnote et al., 2016; Panda et al., 2018; Wangler
et al., 2019; Zhang et al., 2018) are presented in Table 2.10:
Table 2.10 – Common terminology used in printing applications
Term Definition
Object The printed specimen.
Filament/ink The extrudable cementitious mix
Print bed The surface in which the filament is printed on.
Print head The dispensing unit including the nozzle
Layer height
The distance the print bed (primarily in 4-axis
applications) or print head (in six-axis
applications) moves once a layer has been
deposited. The layer height is typically equal to or
less than the size of the nozzle
Standoff distance/head distance/print head/nozzle
distance
The distance between the nozzle and the previous
layer (or print bed for first layer). This distance is
typically equal to or less than the size of the nozzle.
Print/tool path The path the nozzle follows during printing.
Print speed The speed in which the layer is printed. Common
units are mm/s.
Quality
Refers to the combined effects of voids, surface
texture and ability to meet intended shape. High
quality objects have no voids, smooth surface
texture and are able to meet their intended shape.
Perimeter
The outer printed filament of the object. In cement-
printing this may be omitted depending on the
application
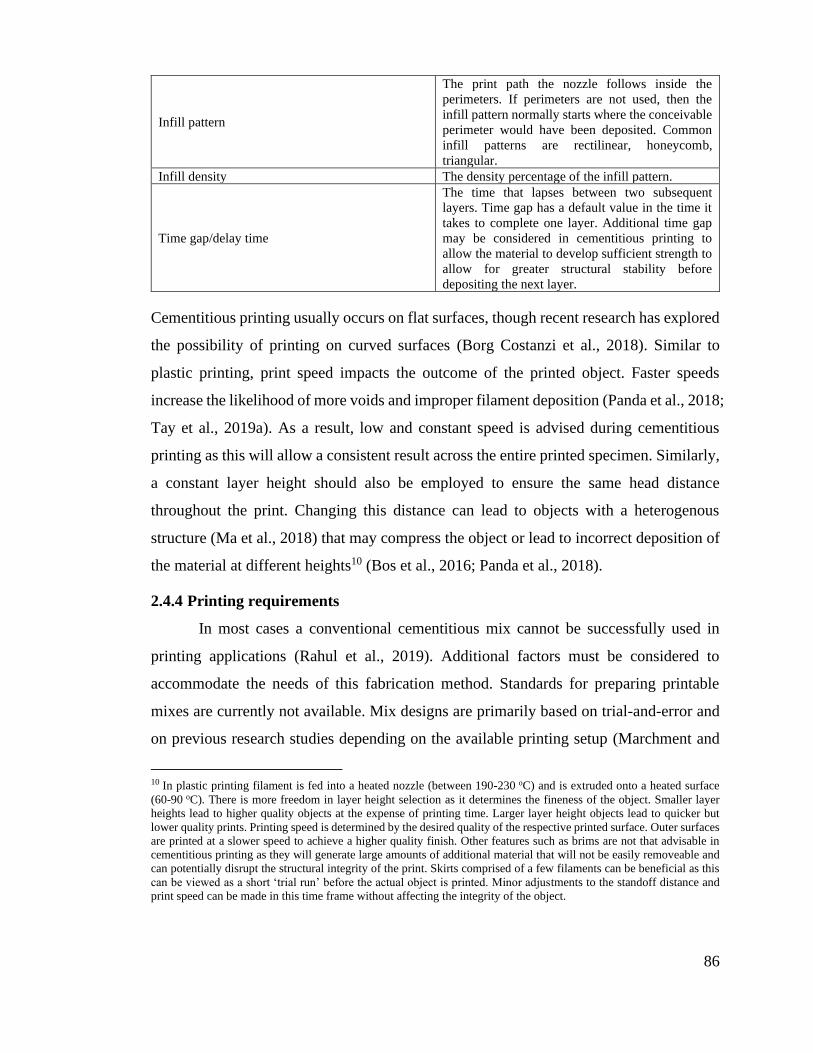
86
Infill pattern
The print path the nozzle follows inside the
perimeters. If perimeters are not used, then the
infill pattern normally starts where the conceivable
perimeter would have been deposited. Common
infill patterns are rectilinear, honeycomb,
triangular.
Infill density The density percentage of the infill pattern.
Time gap/delay time
The time that lapses between two subsequent
layers. Time gap has a default value in the time it
takes to complete one layer. Additional time gap
may be considered in cementitious printing to
allow the material to develop sufficient strength to
allow for greater structural stability before
depositing the next layer.
Cementitious printing usually occurs on flat surfaces, though recent research has explored
the possibility of printing on curved surfaces (Borg Costanzi et al., 2018). Similar to
plastic printing, print speed impacts the outcome of the printed object. Faster speeds
increase the likelihood of more voids and improper filament deposition (Panda et al., 2018;
Tay et al., 2019a). As a result, low and constant speed is advised during cementitious
printing as this will allow a consistent result across the entire printed specimen. Similarly,
a constant layer height should also be employed to ensure the same head distance
throughout the print. Changing this distance can lead to objects with a heterogenous
structure (Ma et al., 2018) that may compress the object or lead to incorrect deposition of
the material at different heights10 (Bos et al., 2016; Panda et al., 2018).
2.4.4 Printing requirements
In most cases a conventional cementitious mix cannot be successfully used in
printing applications (Rahul et al., 2019). Additional factors must be considered to
accommodate the needs of this fabrication method. Standards for preparing printable
mixes are currently not available. Mix designs are primarily based on trial-and-error and
on previous research studies depending on the available printing setup (Marchment and
10 In plastic printing filament is fed into a heated nozzle (between 190-230 oC) and is extruded onto a heated surface
(60-90 oC). There is more freedom in layer height selection as it determines the fineness of the object. Smaller layer
heights lead to higher quality objects at the expense of printing time. Larger layer height objects lead to quicker but
lower quality prints. Printing speed is determined by the desired quality of the respective printed surface. Outer surfaces
are printed at a slower speed to achieve a higher quality finish. Other features such as brims are not that advisable in
cementitious printing as they will generate large amounts of additional material that will not be easily removeable and
can potentially disrupt the structural integrity of the print. Skirts comprised of a few filaments can be beneficial as this
can be viewed as a short ‘trial run’ before the actual object is printed. Minor adjustments to the standoff distance and
print speed can be made in this time frame without affecting the integrity of the object.

87
Sanjayan, 2020; Panda and Tan, 2018; Wangler et al., 2019). A strong foundation on 3D
printing was laid out by Le et al. (2012) that outlined the properties a mix design must
attain in order to be used in 3D printing. Namely, these properties were
extrudability/printability, buildability, workability/pumpability and open time.
Extrudability and buildability were new terms that were introduced to cementitious
fabrication. A short description of each of these parameters is presented below.
• Extrudability/printability: The ability of a mix to be continuously extruded as a
continuous filament from a dispensing unit.
• Buildability: The number of layers that can be ‘stacked’ without any noticeable
deformation, or the ability of a material to maintain its self-weight and the weight
of subsequent layers.
• Workability/pumpability: The ease with which the mix can move through a
pumping system or be deposited into the dosing system.
• Open time: The time window in which the mix attains the above features and
remains useable for printing.
A more detailed description of the printing parameters introduced by Le et al. (2012) and
methods of assessments follows.
2.4.4.1 Buildability
Buildability is considered one of the two most important factors of 3D printing as
this property essentially eliminates the use of formwork (Paul et al., 2018). In simple terms
buildability refers to a mix’s ability to meet its design shape with minimal deformation.
In order for a material to be considered buildable it should be able to maintain its self-
weight (green strength), and possess high enough strength to withstand the deposition of
additional layers (shape stability or retention) (Kazemian et al., 2017).
Buildability can be achieved when a mix is in a pseudo-solid state (Roussel, 2018) and
attains a high material stiffness (Bos et al., 2016). Printable mixes are usually associated
with high solid content (Romagnoli et al., 2012). In most cases though, high solid content
alone is not enough to meet this requirement. Employing additives such as nanoclay

88
(Panda et al., 2020, 2019d), silica fume (Kondepudi and Subramaniam, 2021; Panda and
Tan, 2018), nanosilica (Mendoza Reales et al., 2019), attapulgite clay (Panda et al., 2019b)
and filler such as polyvinyl alcohol (PVA) fibers (Chougan et al., 2021), polypropylene
(PP) fibers (Nematollahi et al., 2018), glass fibers (Archez et al., 2021) and nanographite
(Chougan et al., 2020) have been reported to substantially improve buildability.
Buildability can also be achieved with the use of plasticizers (Valentini et al., 2020) and
viscosity modifiers (Guo et al., 2020; Kondepudi and Subramaniam, 2021; Sun et al.,
2020). Keeping the mix at rest can also result in high buildability (Perrot et al., 2015),
however this increases the risk of adding voids to the object at prolonged times (Tay et al.,
2018).
Common tests of assessing buildability involve the conventional slump-cone or mini
slump-cone tests. In most cases low slump values have been stated to be required for
printable mixes (Alghamdi and Neithalath, 2019; Archez et al., 2021; Nematollahi et al.,
2018). Slump cone tests though provide limited information on a material’s buildability.
Buildability can also be assessed using a more practical approach. In particular a mix’s
buildability can be defined by the number of layers that can be extruded or ‘stacked’
without major deformation or collapse of the printed object (Albar et al., 2020;
Mechtcherine et al., 2019; Panda and Tan, 2018; Sun et al., 2020). This ultimately leads
to cases in which mixes are defined by a number of layers, such as mix A being able to
print X amount of layers while mix B is capable of printing Y amount of layers. An
effective way of increasing the buildability of a mix by using this method is by increasing
the time gap between layers (Sanjayan et al., 2018; Tay et al., 2018). This essentially
allows the mix to sufficiently harden and thus be able to support the weight of the
subsequent deposited layers. This is similar to the structural buildup of a mix in which the
building rate (print speed) should be equal to the amount of time a mix requires to harden
such that it is able to sustain the weight of the subsequent layer while still achieving an
optimal bond with the previous layer (Perrot et al., 2016). Irrespective of the type of test
small deformations may be allowable (Chen et al., 2020; Nair et al., 2019; Tay et al.,
2019b).

89
While quantifying the number of layers is convenient in providing a numerical value to
buildability, comparisons between other mixes cannot be easily made. In most cases
comparisons are only valid when referring to the same or a very similar printing system.
The mix designs and the number of ‘stacked’ layers used in larger printing systems cannot
be replicated by smaller sized syringe-based printers. Large printers have a larger variety
of additives, filler and aggregates to select from to include in the mix design, whereas
syringed based printers are limited to lower percentages of filler or exclusion of certain
materials due to potential blockage in the smaller nozzle size and delivery system.
Furthermore, the maximum printable height an object can achieve is also confined by
equipment limitations. Indeed, what is considered ‘buildable’ is quite a subjective term.
To give an example, in a fly ash AAM printing application, Panda and Tan. (2018) deemed
a mix buildable when it was able to achieve a height of 600 mm. In a syringe-based
application, Sun et al. (2019) stated their mix was able to attain high buildability for a total
height of 10 mm. Both these studies considered their mix ‘buildable’ for two vastly
different values. A point that is not often mentioned though is that buildability is not
always put into proper context. In this situation, the former application was aimed at
construction purposes whereas the latter was intended for electronic packaging. In certain
cases, an extreme number of stacked layers does not provide any essential advantage as it
does not fit the intended application of the printed object. This would inevitability lead to
overdesigning and waste of material (Nerella et al., 2020). Therefore, while the number
of layers may provide some insight on the buildability of the mix, the printing system and
the intended application is something that must always be considered when comparing the
buildability of materials.
More recent studies have also focused on defining buildability through the development
of rheology models (Kruger et al., 2020; Perrot et al., 2016; Sun et al., 2020; Sun et al.,
2020). While this may provide a more universal approach to assessing buildability, one of
the issues with these models is that they rely heavily on the rheology of mixes which can
present large variability between batches and within the same batch over time.

90
2.4.4.2 Extrudability
Extrudability can be defined as the ability of a cementitious filament to be
continuously extruded through a nozzle without any defects (Lim et al., 2012; Rahul et al.,
2019) Extrudability and printability were initially used as interchangeable terms (Lim et
al., 2012) however over time these two terms started to diverge. Printability has been
regarded as the combination of extrudability and buildability/shape retention (Alghamdi
and Neithalath, 2019; Moeini et al., 2020; Nerella et al., 2019). In essence it provides a
more rounded evaluation on how well the two key parameters of 3D printing interact with
each other. In some cases printability may be assessed separately or simply considered as
an extension of extrudability or buildability.
Extrudability is the second key parameter of 3D printing applications. It can be easily
accepted that if a mix cannot be extruded, then it cannot be 3D printed. The most common
approach to assess extrudability is to extrude a few single layers of filament and assess
the printed object either by measuring the filaments or via visual inspection. If the layer
is free from voids and does not have any dimensional variations it ‘passes’ the
extrudability test and is deemed acceptable for printing. If discontinuities are formed or if
the layer presents a large spread and does not meet the intended shape and size, then this
would mean the mix ‘failed’ the extrudability test. Similar to buildability, satisfying
extrudability requirements essentially requires a series of trial-and-error investigations by
taking into account the printing limitations imposed by the equipment available.
Extrudability assessments can be considered rather generic as they only take into account
the state of the mix at a specific time. As time progresses cementitious materials stiffen
and thus extrudability can be compromised. As a result, extrudability tests have been
developed that expand beyond the conventional ‘extrudable’ or ‘not extrudable’
investigations11.
11 The standard test can be viewed as the first step in extrusion investigation as this ensures the mix design meets
equipment limitations. There is no meaning in conducting an in-depth extrudability analysis if the filament cannot be
extruded at all.

91
Such tests include the following: Long et al. (2019) defined extrudability as a combination
of rheology tests and shape stability. Tay et al. (2019b) defined printable regions in terms
of buildability and pumpability. Chen et al. (2019) investigated the extrusion pressure
required to maintain extrudability over time. Weng et al. (2019) investigated extrudability
in combination with rheology tests concluding that low torque values resulted into
extrudable filaments. Nair et al. (2019) investigated extrudability in regards to rheology
and extruder geometry. Tay et al. (2019a) identified extrudable regions in regards to flow
rate and printing speed. Mechtcherine et al. (2019) defined extrudability by printing a mix
at different time intervals (up to 90 minutes). Nerella et al. (2019) defined extrudability in
terms of energy consumption and flowrate.
Overall, extrudability can be investigated individually or in combination with other
printing factors. Combining extrudability with other parameters can be more beneficial as
it provides more meaningful insight on the mix.
2.4.4.3 Workability-flowability-pumpability
The terms workability and pumpability/flowability are grouped in one category as
they are dependent on the printing setup. In some cases, these properties may be assessed
separately or not examined at all. As their names suggest, these properties focus on the
workability and the rheological properties of a mix. The assessment of these requirements
is rather straightforward as their testing methods are based on existing national standards
such as slump tests and flow table tests (Nematollahi et al., 2018; Tay et al., 2019b) and
rheology models (Bingham plastic and Herschel-Bulkley) (Guo et al., 2020; Moeini et al.,
2020). Extrudable mixes favor high workability whereas buildable mixes are associated
with low workability (Panda et al., 2019a). Therefore, as previously mentioned, the
rheological properties of a mix can be examined in conjunction with extrudability or
buildability (Panda et al., 2019d; Panda and Tan, 2019; Zhang et al., 2019). Workability
assesses the ease of material can move in a delivery system which ultimately determines
a mix’s suitability for printing.
Flowability and pumpability are relevant parameters in printing setups that use pumps to
feed the material into the dispenser. In syringe-based setups these parameters are not
92
considered as the air pressure feeds the material into the dispensing unit. Overall
workability is not a substantial factor on its own but provides more context when used
properly. In certain cases, this parameter can be omitted and considered in tandem with
other factors such as extrudability and buildability.
2.4.4.4 Open time
Open time was initially defined as the period in which a mix maintained sufficient
workability such that it was still useable for printing. Open time is commonly associated
with the Vicat needle apparatus (British Standards Institution, 2016). The information
provided by this test though is limited to the initial and final setting time of the mix. This
time frame alone cannot determine if and how a mix can be useable for printing. As a
result additional tests are conducted such as:
• Thixotropic open time, in which the thixotropy (rheology) of the mix is measured
over time (Panda and Tan, 2018);
• Extrudability over a set time frame/printability window, in which the time a mix
meets extrusion/printability requirements is investigated (Alghamdi et al., 2019;
Kazemian et al., 2017; Ma et al., 2018; Mechtcherine et al., 2019; Rahul et al.,
2019)
Open time can also be affected by equipment limitations such as heating up of equipment
or gradual material clogging in the dispenser (Diggs-McGee et al., 2019). As a result, the
setting time observed by the Vicat needle test and the actual printing time may differ
(Chougan et al., 2020). Therefore, examining the open time as an extension of
extrudability over the course of time can provide a more accurate representation of the
actual extrudability time of a mix.
2.4.4.5 Additional parameters
The printing requirements provided by Le et al (2012) are able to provide a good
starting point for cementitious 3D printing. One of the issues with these requirements,
however, is their reliance on testing methods that were not developed for 3D printing and
their limited uses outside of construction purposes. Over the years, additional printing
considerations have been suggested by other authors to encapsulate the 3D printing

93
requirements for cementitious mixes. For example, Kazemian et al. (2017) stated that a
cementitious filament should attain the following properties:
• Print quality: Layer free of defects, visible layer edges and dimension consistency
and conformity.
• Shape stability: Zero deformation whether that may occur from self-weight,
weight of subsequent layers or extrusion pressure.
• Printability window: time limit in which the mix is printable and no blockage
occurs.
In essence these considerations refer to the same concept as mentioned by Le et al (2012).
The main difference is that these requirements are based on a more empirical approach
that focus more on the printing process. The limitations of printing setups may differ and
this cannot be realized by standard testing methods alone. That said, solely relying on
empirical methods can also make comparisons difficult and can be viewed as a roadblock
to standardization. As both these approaches have their merits a combination of both can
allow mix designs to be tailored to specific printing setups while also enabling
comparisons with other applications12.
Over the years additional factors have been considered in 3D printing. A key property that
is often investigated is the interlayer adhesion of the printed object. It has been well
studied that the layer-by-layer fabrication technique leads to anisotropic behavior which
affects the structural integrity of the objects (Nerella et al., 2019; Panda et al., 2017;
Sanjayan et al., 2018). Interlayer adhesion can be directly influenced by factors such as
buildability and workability. As mentioned in Section 2.4.4.1, buildability can be
improved by increasing the time delay between layers, but this may have an inverse effect
on interlayer adhesion (Panda et al., 2019a; Wolfs et al., 2019). Furthermore, mixes with
poor workability also result in poor interlayer adhesion strength. One way to avoid weak
bonds between layers is to avoid overdesigning, and to instead tailor the mix design to just
12 In fact, 3D printing can be carried out without relying on either set of printing requirements. Printing optimization
studies have been conducted that do not refer to any of the parameters above and mainly focus on investigating the
rheology of the mix designs (Franchin et al., 2017; Zhou et al., 2020).

94
meet its required needs. For example, if the buildability requirements of an object are low
employing a more workable mix or a mix with less solid content can improve the bond
between layers (Nerella et al., 2020) while fulfilling its intended use. Interlayer adhesion
can also be improved by incorporating bonding agents (Marchment et al., 2019) or adding
layers of mortar (Ma et al., 2020) or aggregates (Yu et al., 2020) between layers to improve
surface contact. These methods though are not always effective as they may interfere with
the stability or with the homogeneity of the printed object. In general interlayer adhesion
is primarily investigated in full-with printing systems rather than in filament printing.
Further considerations that have been made in printing outside of mix properties include
economic viability (Nerella et al., 2020) and energy consumption (Nerella et al., 2019).
As research in the preparation of printable mixes matures, incorporating such elements
can bring about new perspectives in cementitious 3D printing. Overall how the printed
objects will be used will influence which parameters will be investigated in the end. As a
result, while some requirements may remain the same from a generic 3D printing point of
view, different applications may see different requirements.
2.4.5 Printing alkali activated materials
Similar to OPC mixes, AAM have seen multiple applications in additive
manufacturing in both the two-part and one-part formulation methods (Archez et al., 2021;
Franchin et al., 2017; Muthukrishnan et al., 2021; Nematollahi et al., 2018; Panda et al.,
2019c; Paul et al., 2018; Zhong et al., 2017). The printing requirements for OPC and AAM
mixes are essentially same. As mentioned in Section 2.2.3 and 2.2.6 binder formulation
and curing regimes differ in AAM than in OPC binders. This has led to authors
investigating alternative methods in 3D printing to make use of the uniqueness of AAM
in this aspect.
2.4.5.1 Printing AAM at elevated temperatures
A common theme in recent AAM printing applications is introducing a source of
heat to the overall system as heat can accelerate alkali activation and solidification. For
example, Sun et al. (2020) printed AAM directly into a heat box to increase solidification
of the printed filament. This allowed the deposited layers to harden and develop sufficient

95
strength to bear the weight of subsequent layers. While this method can bypass buildability
barriers, it also induces quicker moisture evaporation in the printed object which
inevitably results in higher shrinkage. In a similar study Souza et al. (2021) printed
metakaolin AAM while using a heated nozzle. This allowed greater control of the
rheology of the mixes investigated. This approach essentially was able to convert mixes
with low buildability and high workability to mixes with high buildability. One of the
drawbacks of this method is that it may induce a shorter printing window and cause
extrudability issues if the mix is overheated and starts to solidify.
In another AAM printing application, Muthukrishnan et al. (2020) microwaved AAM
filament as a means of quick heat application. This concept is similar to the printed box
employed by Sun et al. (2020). It can also be viewed as a means of circumventing
prolonged time delays between layers. Microwaving the filament was stated by the authors
to allow the mix design to achieve greater buildability and interlayer adhesion. Excessive
microwave heating though can result in moisture loss that can cause a negative effect on
the properties of printed object. While microwave heating is not a new concept in AAM
(Kastiukas et al., 2020; Tan et al., 2020), this technique limits the scalability of printing
applications and may affect the dimensional integrity of an object if it is constantly
transferred in the middle of printing. Moreover, the concept of microwaving AAM may
be associated with unknown behavior that has not yet become evident.
2.4.5.2 Molecular composition effect on printing parameters
Printing applications are primarily based on mass ratios (Archez et al., 2021; Panda
and Tan, 2018). As mentioned in Section 2.2.3 it is well known that the alkali solution
greatly influences the workability of AAM binders. Few studies have focused on the
impact of the molecular composition of AAM on printing properties. Dai et al. (2020)
studied the impacts of the solution modulus (SiO2/Na2O) and the fly ash and slag content
in regards to structural buildup and setting times. Increasing the solution modulus and
decreasing fly ash content led to decreased setting times. This is quite expected as the
silicate content in the solution affects reactivity of the mix (Bernal et al., 2012) and fly
ash is a precursor will lower reactivity compared to metakaolin and slag which leads to

96
longer setting times (Nedeljkovic et al., 2018). In regards to the precursor, increasing slag
content led to increased structural buildup. Likewise this is expected as slag is associated
with lower slump values and quicker setting than fly ash (Nedeljkovic et al., 2018). The
solution’s influence on structural buildup though was not as clear as it resulted in delayed
and then increased structural buildup. While this study provides useful information on
considerations in AAM printing, it did not involve actual extrusion. Therefore, a
conclusion on the overall impact these factors have on printing cannot be made. For
example, solutions with high silicate content can lead to sticky pastes. This could pose an
issue in extrusion if filament cannot be deposited properly and ‘drags’ previously
deposited layers. In a study conducted by Bong et al. (2019) the effects of the alkaline
solution on AAM printing were examined. In this study it was found that sodium-based
solutions were more suitable for printing as they were able to attain a higher shape
retention compared to potassium-based solutions. Furthermore, among the sodium-based
solutions examined sodium silicate with a modulus of 3.22 was deemed optimal when
compared to sodium silicate solutions with a modulus of 2.00. It is important to mention
that mixes employing the latter solution resulted in higher compressive strength. This
requires further consideration as it may limit a mix’s useability in future construction
applications. In a similar study, Panda et al. (2019d) investigated the effects of two
different potassium-based solutions with a modulus of 2 and 1.8. A higher shape retention
was observed in printed objects that employed a solution with a modulus of 2. This was
attributed to the higher viscosity linked with the solution. Zhang et al. (2018) investigated
the Si/Na ratio of the alkaline solution for AAM formulation in regards to buildability and
rebuilding behavior (ability to regain viscosity after mixing). It was found that employing
solutions with lower Si/Na ratios were more suitable for printing applications. Similar to
Bong et al. (2019), the ‘printable’ mixes in this investigation were also those that attained
lower mechanical properties.
Judging by the studies at hand a definitive claim on the activator’s impact cannot be made.
It can be inferred that a correct balance between the alkali metal and the silicate must be
found prior to printing. Furthermore, the above applications focused on fly ash and slag
precursors. The findings in these studies will most likely not be applicable to metakaolin
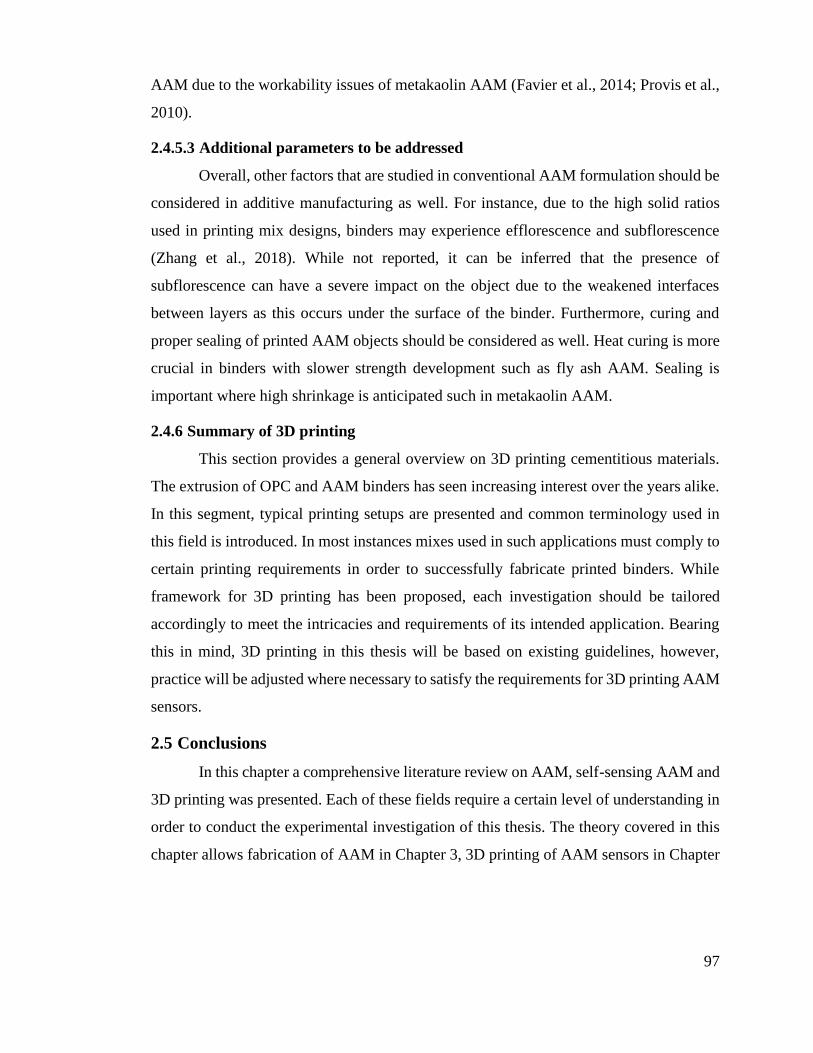
97
AAM due to the workability issues of metakaolin AAM (Favier et al., 2014; Provis et al.,
2010).
2.4.5.3 Additional parameters to be addressed
Overall, other factors that are studied in conventional AAM formulation should be
considered in additive manufacturing as well. For instance, due to the high solid ratios
used in printing mix designs, binders may experience efflorescence and subflorescence
(Zhang et al., 2018). While not reported, it can be inferred that the presence of
subflorescence can have a severe impact on the object due to the weakened interfaces
between layers as this occurs under the surface of the binder. Furthermore, curing and
proper sealing of printed AAM objects should be considered as well. Heat curing is more
crucial in binders with slower strength development such as fly ash AAM. Sealing is
important where high shrinkage is anticipated such in metakaolin AAM.
2.4.6 Summary of 3D printing
This section provides a general overview on 3D printing cementitious materials.
The extrusion of OPC and AAM binders has seen increasing interest over the years alike.
In this segment, typical printing setups are presented and common terminology used in
this field is introduced. In most instances mixes used in such applications must comply to
certain printing requirements in order to successfully fabricate printed binders. While
framework for 3D printing has been proposed, each investigation should be tailored
accordingly to meet the intricacies and requirements of its intended application. Bearing
this in mind, 3D printing in this thesis will be based on existing guidelines, however,
practice will be adjusted where necessary to satisfy the requirements for 3D printing AAM
sensors.
2.5 Conclusions
In this chapter a comprehensive literature review on AAM, self-sensing AAM and
3D printing was presented. Each of these fields require a certain level of understanding in
order to conduct the experimental investigation of this thesis. The theory covered in this
chapter allows fabrication of AAM in Chapter 3, 3D printing of AAM sensors in Chapter

98
4 and assessment of the temperature and strain sensing capabilities of printed AAM in
Chapters 5 & 6 respectively.

99
Chapter 3 Alkali activated materials
In this chapter alkali activated materials will be explored. The mechanical properties of
these materials are investigated in support for the development of sensors that will be
investigated in Chapters 4, 5 and 6.
3.1 Introduction
When developing AAM sensors, the material is required to simultaneously behave
as a sensor and an AAM binder. To ensure the standard performance of an AAM binder
the proper formulation process needs to be followed. Formulation alone though does not
guarantee satisfactory sensing results. For example, sensing applications involve
monitoring structures under various strain conditions. This requires the sensors to possess
adequate strength to endure the strain that is applied. Therefore the mechanical properties
of AAM need to be investigated as well.
In this chapter AAM are investigated. As mentioned in Section 2.2 AAM comprise of a
broad range of materials with various design approaches. The performance of AAM is
influenced by numerous factors such as molar ratios, solid-liquid ratios and curing regimes.
As such these parameters will be investigated in order to establish a suitable design
approach for AAM formulation that will be followed for the remainder of this thesis.
Therefore, drawing on the literature on AAM presented in Section 2.2, the following
investigation was carried out:
i. Calcined kaolin was analyzed through X-ray diffraction analysis to assess its
suitability as a precursor for AAM formulation.

100
ii. The compressive strength of two mix designs was examined. The first was based
on ‘optimal’ fabrication following AAM theory and the second was tailored for
printing AAM overlays.
iii. In order to explore potential means of deployment for AAM sensors (in-situ and
ex-situ fabrication) the compressive strength of AAM for two heat treatments,
ambient curing and heat curing, were investigated.
iv. To demonstrate the suitability of the material in strain sensing tests, apart from
compressive strength, the flexural strength of AAM for ambient cured samples
was also assessed.
v. The kinetic reactions of the AAM mix were verified via isothermal calorimetry
tests to ensure the expected reactions transpire in the mix.
vi. Avenues for further research in terms of AAM formulation are presented. The
impact of the alkaline solution on the compressive strength is examined and its
drawbacks in printing are addressed.
By assessing the parameters above the successful fabrication of AAM binders can be
confirmed. The methodology employed in this chapter will thereafter be used in Chapter
4 for 3D printing AAM overlays and in Chapters 5 and 6 for the development of AAM
sensors.
3.2 Experimental procedure
The following sections outline original experimental work conducted as part of
this thesis, drawing on the scientific literature outlined in Section 2.2.
3.2.1 Raw materials
In the work outlined in this thesis, commercially supplied kaolin originating from
Southwest England was calcined at 800 oC for 2h at peak temperature in an electric
furnace. The calcined clay (metakaolin) was left inside the furnace to cool down before
being taken out and stored in sealed containers. Densified silica fume 90% was added to
the mix as a high source of silica content. This allows the increase of the silica content in
the matrix allowing a higher molecular composition to be achieved as outlined in Section
2.2.4. Polyvinyl alcohol (PVA) fibers (3mm) were also added to the matrix due to their

101
positive effect on adhesion and shape stability: these are important requirements for
printing that will be further explored in subsequent chapters.
The mass ratios of the solid materials in this mix are as follows: metakaolin 95% w/w,
silica fume 5%w/w and PVA fibers 0.5% w/w. The chemical composition of kaolin,
metakaolin and silica fume are presented in Table 3.1. The chemical composition of kaolin
and silica fume is provided by the supplier, while the amorphous content of metakaolin
was distinguished from the author’s own X-ray diffraction analysis. The exact SiO2 and
Al2O3 content could not be calculated with the XRD analysis alone: this would require
access to quantitative X-ray fluorescence (XRF).
Table 3.1 – Chemical composition of kaolin and silica fume is as provided by suppliers and metakaolin through XRD
analysis.
Material SiO2 (%) Al2O3 (%)
Kaolin 47 38
Metakaolin 87%
Silica fume 92.85 0.27
Sodium silicate with a chemical composition of 27.8% SiO2, 8.5% Na2O and 63.7% H2O
and sodium hydroxide (10M solution) were used to make the alkaline activator. The
modulus of the silicate (SiO2/Na2O) is 3.3 and is therefore too high to be used in AAM
fabrication alone. As a result, sodium hydroxide (10M) was added to the solution to allow
for a more suitable modulus to be reached. The mass ratio of sodium silicate with sodium
hydroxide was set at 2. The resulting solution had a modulus of 1.42 and H2O/Na2O=17.4.
The alkaline solution was left to cool down for at least 24 hours prior to use. The mass
ratios are presented in Table 3.2.
Table 3.2 – Mass ratios of mixing constituents.
Metakaolin Silica fume PVA (3mm) Sodium silicate:
Sodium hydroxide
w/w (%) 95 5 0.5 2
3.2.2 Mix design
In this study, two mix designs were investigated denoted as ‘Mix 1’ and ‘Mix 2’.
Mix 1 had a solid-liquid ratio of 0.55 and Mix 2 had a solid-liquid ratio of 0.9. The ratio
for Mix 1 was selected as it was able to achieve an Si/Al and Na/Al ratio closer to the

102
optimal range reported for metakaolin AAM as depicted in Section 2.2.4. Mix 2 was
selected as this mix design was within the range of solid-liquid ratios than have been
employed in AAM formulation as mentioned in Section 2.2.4.1.1. Mix 2 can also be used
in printing applications owing to its higher solid-liquid ratio. The solid content includes
the mass of metakaolin and silica fume as they are able to react with the alkaline solution
and take part in alkaline activation. The liquid content is referred as the mass of the
alkaline solution (sodium silicate and sodium hydroxide once mixed and cooled down).
The mass percentages of the solid and liquid content were kept constant. Irrespective of
the mix, the total solid content of each mix consisted of metakaolin 95% w/w, silica fume
5%w/w and PVA fibers 0.5% w/w. The molecular composition and mass ratio of each
mix are presented in Table 3.3. As mentioned the SiO2 and Al2O3 content of the
metakaolin was not able to be exactly quantified. The amorphous content was 85% and
87% in kaolin and metakaolin respectively. The additional 2% of amorphous content in
the metakaolin was equally divided among SiO2 and Al2O3. Therefore for the calculations
of the binder the SiO2 content was regarded as 48% and the Al2O3 content as 39%.
Table 3.3 – Molecular composition of Mix design 1 and Mix design 2
Mix Solid-liquid Si/Al Na/Al SiO2/Na2O
(solution)
SiO2/Na2O
(paste)
H2O/Na2O
(solution)
Mix 1 0.55 2.00 0.92 1.42 3.54 17.42
Mix 2 0.90 1.69 0.56 1.42 4.89 17.42
3.2.3 Mix procedure and curing
The mixing procedure followed in this study resembled mixing sequence 1
mentioned in Table 3.1. Metakaolin, silica fume and PVA fibers were dry mixed for 2
minutes. The alkaline solution was then poured into the dry materials and mixing was
continued for another 10 minutes. Figure 3.1 displays the mixing sequence followed in
this study.
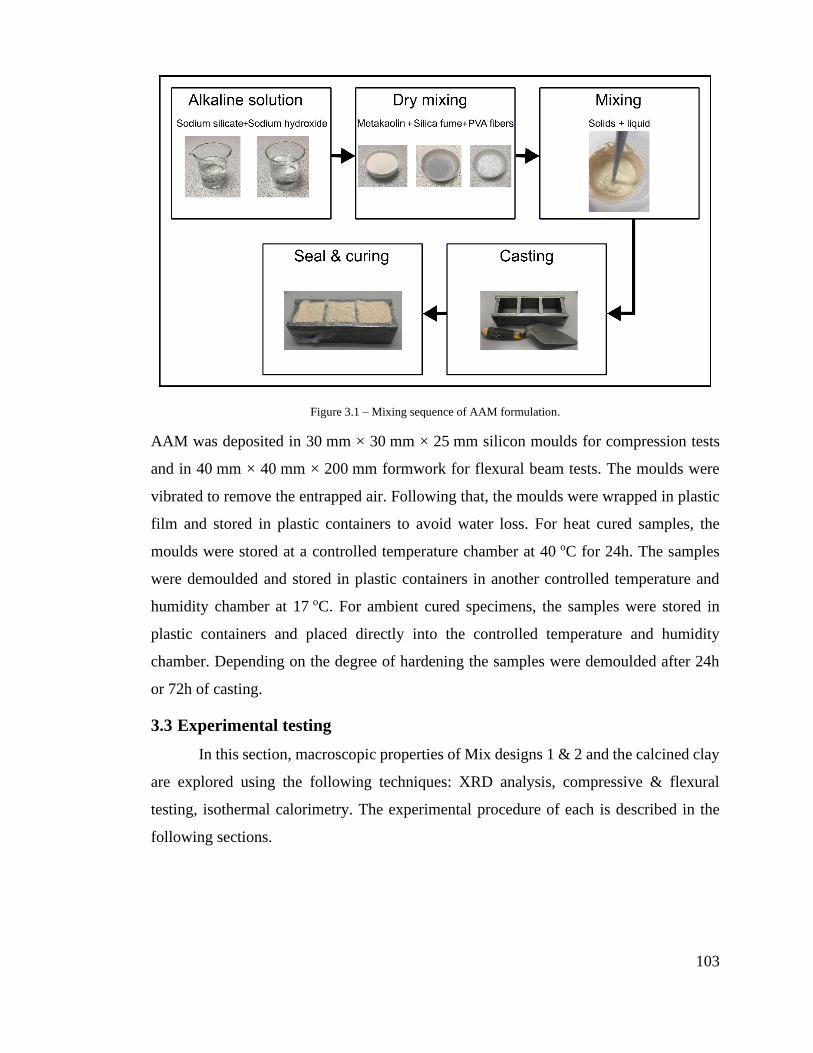
103
Figure 3.1 – Mixing sequence of AAM formulation.
AAM was deposited in 30 mm × 30 mm × 25 mm silicon moulds for compression tests
and in 40 mm × 40 mm × 200 mm formwork for flexural beam tests. The moulds were
vibrated to remove the entrapped air. Following that, the moulds were wrapped in plastic
film and stored in plastic containers to avoid water loss. For heat cured samples, the
moulds were stored at a controlled temperature chamber at 40 oC for 24h. The samples
were demoulded and stored in plastic containers in another controlled temperature and
humidity chamber at 17 oC. For ambient cured specimens, the samples were stored in
plastic containers and placed directly into the controlled temperature and humidity
chamber. Depending on the degree of hardening the samples were demoulded after 24h
or 72h of casting.
3.3 Experimental testing
In this section, macroscopic properties of Mix designs 1 & 2 and the calcined clay
are explored using the following techniques: XRD analysis, compressive & flexural
testing, isothermal calorimetry. The experimental procedure of each is described in the
following sections.

104
3.3.1 X-Ray Diffraction Analysis
X-ray diffraction (XRD) analysis was carried out on the calcined clay. XRD data
was collected using a Bruker D8 Advance instrument. Data for Rietveld refinement was
collected in Bragg-Brentano geometry from 12–75 2theta with an increment of 0.02 /s
and a step time of 0.8 s. using a divergence slit of 0.23. A Ni β filter was placed in the
incident beam path. The sample was rotating at 30 rpm and a knife edge collimator was
used to reduce air scattering.
3.3.2 Compression testing
Compression tests were carried out on 30 mm × 30 mm × 25 mm samples using a
universal loading cell with a maximum loading capacity of 50 kN. The load was applied
on the 30 mm × 25 mm face of the specimens at a displacement rate of 0.5 mm/s. The
compressive strength was calculated as the force divided by the area it was applied on.
The ultimate strength was the average of at least five samples.
3.3.3 Flexural testing
3-point bending tests were carried out on 40 mm × 40 mm × 200 mm samples
using a universal loading cell with a maximum loading capacity of 25 kN. The flexural
stress was calculated using equation (3.1):
σ=3PL
2bd2 (3.1)
Where σ=stress, P=force at failure, L=distance of beam between supports, b=width of
beam and d=depth of beam. The distance from the edge of the beam to the support was
40 mm. A total of three specimens were tested for each day.
3.3.4 Isothermal calorimetry
A thermal analysis was conducted using an isothermal calorimeter (Calmetrix, I-
CAL 4000 HPC) to measure the heat release of AAM pastes produced by the exothermic
reactions occurring during alkaline activation. The raw materials and the alkaline solution
were mixed outside the calorimeter. Shortly after mixing, 20 g of AAM was inserted into
sealed plastic containers and then placed in the calorimeter for testing. The test was
conducted at 20 oC. All materials were at room temperature to keep consistent with the

105
testing temperature. Measurements were conducted every 60 seconds for 72 hours. Four
samples for each batch were tested, for a total of two batches. The heat release was
normalized by the total amount of paste. The average heat curve and average cumulative
heat release is presented in the results.
3.4 Results and Discussion
3.4.1 XRD analysis
XRD shows that the starting material is composed of kaolinite and muscovite mica
(layered phyllosilicate) with quartz (SiO2), halloysite (aluminosilicate clay), feldspar
(sodium aluminium silicate) and minor rutile (TiO2). The composition is detailed in Table
3.4.
Table 3.4 – wt% mineral phase assemblage for kaolin powder
Mineral kaolin (wt%) metakaolin (wt%)
Kaolinite (kaolin)/amorphous content (metakaolin) 83.9 87
muscovite mica 11.9 9.5
rutile 0.65 0.9
halloysite 1.52 –
quartz 2.07 2.6
The main secondary minerals are mica and quartz which are also present in the
dehydroxylated (metakaolin) sample. Metakaolin is usually produced by heating at 600 –
800 oC and it appears that the sample has been heated enough to remove all of the kaolin
with a detection limit of 1 wt% but the diffractogram in Figure 3.2b shows that several of
the secondary minerals are still present (quartz, mica, rutile). The influence of secondary
minerals in the metakaolin sample is notable as they do not fully participate in the alkaline
activation process. It was noted by Zibouche et al. (2009) that AAM made from impure
metakaolin may result in more cracks at the surface. That said, it was also stated that
impure metakaolin was still able to produce an AAM binder, with the advantage of using
a readily available resource.
Referring to Figure 3.2b, the broad ‘hump’ at 15 – 35 degrees 2theta is characteristic of
metakaolin, and the Bragg peaks represent the secondary minerals which remain present
after kaolinite dehydroxylation. As displayed in Table 3.4, the wt% content of secondary

106
minerals of kaolin and metakaolin is about 15.5% and 13% respectively. The content of
the secondary materials was slightly reduced. Further decomposition of these secondary
materials can be possible if a lower calcination rate (i.e. longer calcination period) method
is employed (Kenne Diffo et al., 2015). Taking into account what was mentioned in
Section 2.2.3.2, as dehydroxylation was complete and mullite was not present in the
composition of metakaolin, calcining kaolin at 800 oC for 2 hours was sufficient to
produce metakaolin for AAM formulation.

107
Figure 3.2 – a) Top - X-ray diffractogram of kaolin. b) Bottom X-ray diffractogram of metakaolin. Stick plots - Green
is kaolinite, red is muscovite mica, blue is quartz, black is halloysite, magenta is rutile, cyan is feldspar (albite).
3.4.2 The effect of solid to liquid ratio
Figure 3.3 displays the compressive strength for ambient cured samples for Mix 1
(low solid-liquid ratio) and Mix 2 (high solid-liquid ratio) for days 1,7 and 28 of curing.
Mix 1 had not completely hardened in 24h and therefore this test could not be conducted.
The compressive strength after 28 days for Mixes 1 and 2 are 22.5 MPa and 34 MPa
respectively. Mix 2 achieved higher compressive strength for both 7 and 28 days. On one
hand this is expected as higher solid content can lead to improved mechanical properties
for metakaolin AAM (Bature et al., 2021; Vogt et al., 2019; Zulkifly et al., 2021). On the
10 15 20 25 30 35 40 45 500
100
200
300
400
500
600
700
800
degrees 2
Counts
Kaolin (k), Metakaolin (b)
10 15 20 25 30 35 40 45 50 55
20
40
60
80
100
120
140
160
180
degrees 2
Counts
Metakaolin (b)

108
other hand this outcome can be regarded as somewhat contradictory despite Mix 1 meeting
some of the stated “important molar requirements” of AAM (see Section 2.2.4) better than
Mix 2.
Figure 3.3 – Compressive strength for Mix 1 and Mix 2 for days 1, 7 and 28. Errors bars represent standard deviation
of compression tests for 5 samples.
One of the main drawbacks when utilizing molar ratios is that the overall water content in
the binder is not always clear. High liquid contents can affect the polycondensation rate
of the gel by hindering the diffusion of dissolved species (Bature et al., 2021) and can lead
to binders with high porosity (Borges et al., 2017). This initial work conducted as part of
this thesis aimed to establish a robust mix design based on existing scientific literature.
The difficulty in achieving this with the information available has allowed the author to
propose recommendations about how results in the literature could be better reported to
improve mix reproducibility:
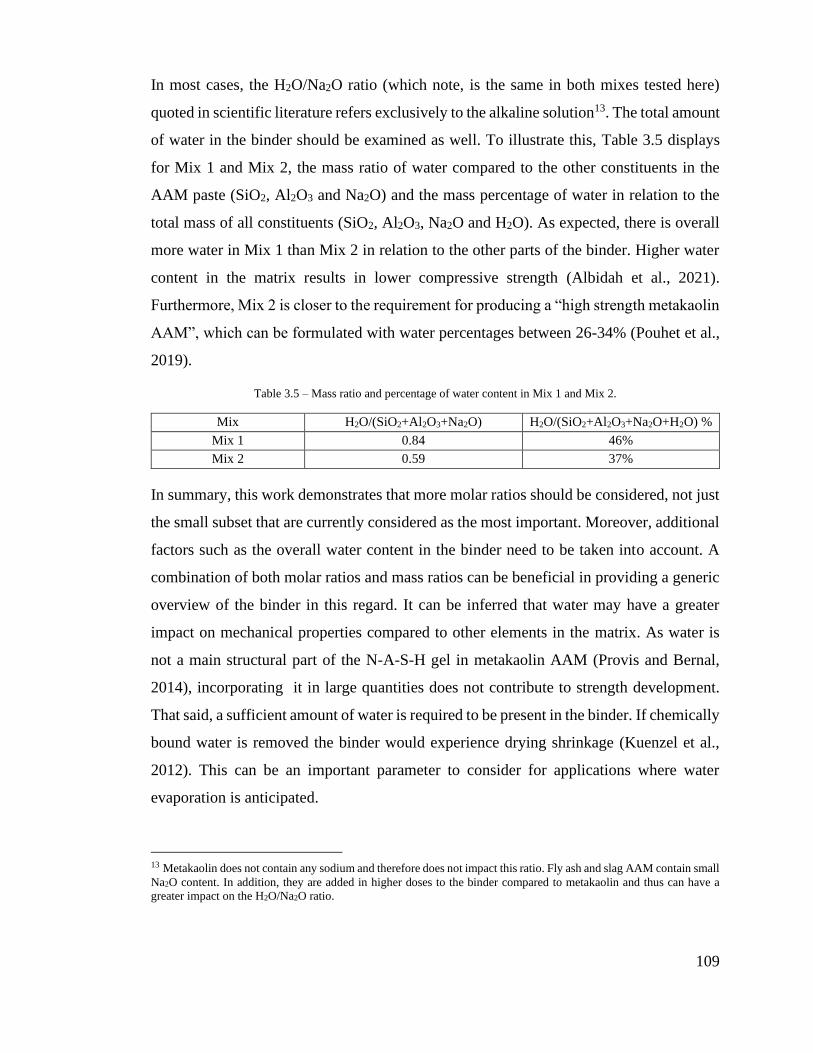
109
In most cases, the H2O/Na2O ratio (which note, is the same in both mixes tested here)
quoted in scientific literature refers exclusively to the alkaline solution13. The total amount
of water in the binder should be examined as well. To illustrate this, Table 3.5 displays
for Mix 1 and Mix 2, the mass ratio of water compared to the other constituents in the
AAM paste (SiO2, Al2O3 and Na2O) and the mass percentage of water in relation to the
total mass of all constituents (SiO2, Al2O3, Na2O and H2O). As expected, there is overall
more water in Mix 1 than Mix 2 in relation to the other parts of the binder. Higher water
content in the matrix results in lower compressive strength (Albidah et al., 2021).
Furthermore, Mix 2 is closer to the requirement for producing a “high strength metakaolin
AAM”, which can be formulated with water percentages between 26-34% (Pouhet et al.,
2019).
Table 3.5 – Mass ratio and percentage of water content in Mix 1 and Mix 2.
Mix H2O/(SiO2+Al2O3+Na2O) H2O/(SiO2+Al2O3+Na2O+H2O) %
Mix 1 0.84 46%
Mix 2 0.59 37%
In summary, this work demonstrates that more molar ratios should be considered, not just
the small subset that are currently considered as the most important. Moreover, additional
factors such as the overall water content in the binder need to be taken into account. A
combination of both molar ratios and mass ratios can be beneficial in providing a generic
overview of the binder in this regard. It can be inferred that water may have a greater
impact on mechanical properties compared to other elements in the matrix. As water is
not a main structural part of the N-A-S-H gel in metakaolin AAM (Provis and Bernal,
2014), incorporating it in large quantities does not contribute to strength development.
That said, a sufficient amount of water is required to be present in the binder. If chemically
bound water is removed the binder would experience drying shrinkage (Kuenzel et al.,
2012). This can be an important parameter to consider for applications where water
evaporation is anticipated.
13 Metakaolin does not contain any sodium and therefore does not impact this ratio. Fly ash and slag AAM contain small
Na2O content. In addition, they are added in higher doses to the binder compared to metakaolin and thus can have a
greater impact on the H2O/Na2O ratio.

110
3.4.3 Heat curing
Figure 3.4 presents the compressive strength for ambient cured (17 oC) and heat
cured samples for Mix 2 for days 1, 7 & 28. From what can be seen, a high degree of
strength development was achieved within 1 day for heat cured samples and 7 days for
ambient cured samples. These results are in line with the expected behavior of the
respective curing regimes.
Figure 3.4 – Compressive strength for Mix 2 for ambient cured and heat cured binders at days 1, 7 and 28. Errors bars
represent standard deviation of compression tests for 5 samples.
In regards to ambient curing, the samples presented low strength 24 hours after casting
(6.8 MPa). Following that, the binder was able to achieve high strength after 7 days of
casting (29 MPa) with a slight increase thereafter at 28 days (33 MPa). This demonstrates
that metakaolin is a highly reactive material with a high rate of strength development even
in ambient conditions. It is able to achieve 88% of its 28-day-strength within the first 7
days of curing. This is in line with the expected outcome of ambient cured metakaolin
111
AAM (Provis et al., 2019; Rocha et al., 2018). It shows that metakaolin AAM can be used
in applications that are incompatible with heat curing.
When it pertains to heat curing, however, the compressive strength at day 1 was 22 MPa,
and the strength of the binder slightly increased thereafter to 30 MPa at day 28. Heat
curing allows the acceleration of alkaline activation. In the current study, curing at 40 oC
is able to achieve a substantial degree of strength very rapidly: within 1 day, 73% of the
28-day-strength is achieved14.
As can be seen in Figure 3.4, the strength at 7 and 28 days was higher for ambient cured
samples than in heat cured samples. This is somewhat of an unexpected outcome for
metakaolin AAM as the consensus is that heat curing is beneficial for the binder (Chen et
al., 2016): usually, binders see an increase in strength even after being thermally cured. In
a study conducted by Rovnanik (2010) it was found that the mechanical properties of
ambient cured metakaolin AAM at 28 days were similar or higher in some cases compared
to heat cured samples. It was stated that the binders cured at lower temperatures were able
to develop higher quality reaction products and result in lower porosity compared to heat
cured samples. can cause water in the binder to evaporate and therefore resulting in a
weaker matrix. Secondly, the source of silica (solid or liquid form) plays an important role
in reactions that will follow in the binder. Solid silica will first have to dissolve in order
to react with the aluminium content in the precursor to generate a stable nucleus for further
gel growth. Higher extent of dissolution of silica particles is expected in areas where
soluble silica is present-essentially in the activator and further from unreacted particles in
solid form. The differences in silica source can cause different concentration gradients of
silicon and therefore impact silica dissolution in terms of silica availability
(Hajimohammadi et al., 2011). In this mix design, silica fume was added as a dry
component to the mix to increase the silica content in the binder. Silica fume though can
also be added directly to the activator for greater dissolution (Batista et al., 2019).
Considering the above, it can be hypothesized that the slower reactions associated with
14 It should be considered though that as the strength of the binder was relatively low, the impact of curing at 40 oC may
be different for higher strength metakaolin binders or for fly ash AAM that has a slower reaction rate.

112
ambient curing can allow more time for the silica fume to properly dissolve. Heat curing
may prevent proper dissolution of the silica fume due to accelerated curing, leading to
unreacted silica particles that do not take part in alkaline activation. The small difference
in strength suggests that only a small portion of silica fume has not reacted, therefore not
having a significant impact on the final result. Further investigation is, however, required
to make a definitive claim. Considering all the above, heat curing allows the potential of
high strength as soon as day 1. However, curing under ambient conditions results in high
strength development within 7 days. Ambient curing allows for a simpler curing approach
and avoids any inconsistent behavior in the matrix while achieving greater mechanical
properties. Therefore, ambient cured samples will be explored in the remaining
experiments of this chapter. The effects of heat curing on AAM overlays though will be
explored in subsequent chapters.
3.4.4 Flexural strength
Figure 3.5 presents the flexural strength of Mix 2 for day 1, 7 and 28. From what
can be seen, the mix attained a low flexural strength at day 1 of 0.41 MPa. Rapid strength
increases were seen at day 7 in which strength reached 3.81 MPa. The flexural strength at
28 days was recorded as 3.38 MPa. Similar to compressive strength, the flexural strength
was somewhat low compared to other studies (Uysal et al., 2018) which can be in most
part due to the reasons mentioned in Section 3.4.2. Furthermore, higher doses of PVA
fibers (closer to 2%) are required compared to those used in this experiment (0.5% w/w)
to provide an impactful contribution to flexural strength (Borges et al., 2017). In addition
long fibers (8 and 12 mm) are also able to contribute to higher flexural strength as well
(Xu et al., 2017). Larger fibers and higher doses of fibers are favorable in manual
applications. They can pose printing issues though that will be explored in the following
chapters and can therefore not be employed in the work described in this thesis.
The flexural strength of this mix decreased from day 7 to day 28. In this investigation
strength loss was not observed in the compression test conducted for the same curing
duration. Considering the decrease in flexural strength was relatively low, 0.43 MPa and
that low strength gains past 7 days have been reported in previous studies it could be

113
inferred that this apparent decrease is simply within error bars, or could be due to mixing
heterogeneities in casting rather than any changes in the microstructure of the binder
within this time period15.
Figure 3.5 – Flexural strength for Mix 2 for ambient cured samples at days 1, 7 and 28. Errors bars represent standard
deviation of flexural tests for 3 samples.
3.4.5 Heat release
The amorphous content in AAM is that which takes part in alkaline activation. The
PVA fibers that were added to the mix do not take part in this reaction though. Isothermal
calorimetry is an effective means of investigating AAM kinetics. Figure 3.6 and Figure
3.7 present the heat release for Mix 2 and the total energy consumption for 72 hours after
15 Previous studies have indeed shown that there is low increase or even decrease in flexural strength between 7 days
and 28 days for metakaolin AAM (Pacheco-Torgal et al., 2011; Rovnaník, 2010; Uysal et al., 2018). Decreases in
strength over time have been associated with microstructural changes in the matrix which lead to the formation of large
pores in chemically unstable binders (Lloyd, 2009). This strength loss though is usually observed in later stages of
curing (56 days and onwards) and has been disputed in more recent studies (Provis et al., 2019).

114
mixing respectively. In Figure 3.6 it can be seen that a sharp peak is developed within the
first 15 minutes which then immediately drops from that point forward. A smaller and
much broader peak can be observed at around 10 hours and spans until 40 hours after
mixing. The first sharp peak has been attributed to the dissolution of metakaolin and the
release of Al and Si when in contact with the solution. The second peak involves the
polymerization between the dissolved Al and Si and the silicate monomers present in the
activator. When dissolution reaches a critical level and exceeds saturation conditions,
polymerization becomes the dominant reaction and the second exothermic peak appears
(Zhang et al., 2013). These steps of alkaline activation are also presented in Figure 2.2.
As testing temperatures increase the extent of both peaks increases and the duration of the
second peak shortens. In addition, as the modulus (SiO2/Na2O) of the solution decreases
(therefore more alkaline species) the heat release of the second peak increases. In this
study the second peak is quite small as a consequence of the testing temperature (20 oC)
and the modulus of the solution (1.42). From the study conducted by Zhang et al. (2013),
activating metakaolin with solutions with a modulus between 1.4-1.6 results in a relatively
flat second peak.

115
Figure 3.6 – The average rate of heat release of metakaolin AAM over 3 hours (inset) and over 72 hours.

116
Figure 3.7 – Cumulative heat release of metakaolin AAM over 72 hours.
In regards to the cumulative energy released, cumulative energy release saw a constant
increase with evidence of slight plateauing at around 60 hours of testing. This can also be
seen in Figure 3.6 where the heat release at around the same period, while subtle, starts
decreasing after the second peak. Similarly, this occurrence can be attributed to the testing
temperature. Calorimetry tests conducted at ambient temperatures result in a slower
energy release compared to higher temperatures (40-60 oC) due to the slower reactions
that occur in the matrix (Elahi et al., 2020; Sun and Vollpracht, 2019).
In the current study initial peak heat release of the paste was calculated as 5.5 mW/g. The
intensity of heat release is relatively lower than other reported metakaolin AAM pastes,
common values typically range between 10-20 mW/g (Cai et al., 2020a; Sun and
Vollpracht, 2019). The cumulative heat release at 72 h on the other hand was relatively
high, 103 J/g compared to initial heat release. This indicates a continuous reaction in the
117
paste owing to the high reactivity of metakaolin. This is somewhat expected when
considering the molecular composition of the binder. The modulus of the solution used in
this study was 1.42, solutions with a lower modulus, thus high alkalinity lead to higher
heat release (Elahi et al., 2020; Zhang et al., 2013). Moreover, the paste that was
investigated in isothermal calorimetry contained PVA fibers which do not take part in
alkaline activation and could therefore affect the heat release of the specimen. Judging by
the calorimeter results, the binder follows the expected reactions of AAM even with the
addition of fibers. It can therefore be effectively used in AAM applications.
3.4.6 Effect of alkaline solution
As mentioned in Section 3.4.3, the mechanical properties of Mix 2 are relatively
low when compared to other applications. This was primarily attributed to the high water
content in the alkaline solution. When it pertains to molecular composition, while the
Si/Al ratio is within a reasonable range to the required value, 1.69, the matrix appears to
be somewhat sodium deficient (low alkalinity). The Na/Al and SiO2/Na2O (in binder)
ratios are 0.59 and 4.89 respectively. Ideally these ratios should be closer to 1 and 4. Small
changes in the Na/Al ratio can lead to a high increase in mechanical properties (Liu et al.,
2020).
With the current resources used in this study it is relatively difficult to increase sodium
content without adding high amounts of water into the binder. The silicate solution
contains 63.7 % water and the sodium hydroxide 10M solution is 77% water. In this
situation options to increase the alkalinity of the binder are the following:
1. Use sodium silicate solution with lower water content, and subsequently higher
SiO2 and Na2O content; Use sodium hydroxide with higher molarity.
2. Use sodium hydroxide pellets rather than solution and add them directly to the
silicate solution as illustrated in (Pouhet et al., 2019).
In a preliminary study, option 2 was briefly investigated. This approach reduces the water
content originating from the hydroxide while maintaining high degree of alkalinity.
Sodium hydroxide pellets were added to the sodium silicate with some slight water to

118
assist in dissolution. The ratios added were sodium hydroxide: sodium silicate: additional
water=1.0:9.8:0.13 by mass.
Metakaolin AAM samples were formulated for compression tests using Mix design 2
outlined in Section 3.2.2. The samples were cured at 40 oC. The compressive strength for
day 1 was measured as 41.8 ±5.3 MPa. The strength is much higher than the previous
specimens. Judging by the previous results in heat curing, it could be suggested that the
strength would continue increasing by 28 days. The drawbacks when employing this
solution were the large workability issues and the c presented compared to the previous
solution which is a result of the overall low water content in the matrix and the high
viscosity of the solution (Favier et al., 2014; Vitola et al., 2020). In summary, a stronger
mix can be achieved, but there are sacrifices, some of which would make printing with
this material impossible with the author’s current printing set up.
3.5 Conclusions
In this chapter an investigation of alkali activated materials is presented. The
experimental work conducted allows the successful fabrication of AAM and enables this
methodology to be used in the subsequent chapters of the thesis. The findings of this
chapter are the following:
• Calcining kaolin at 800 oC for 2 hours at peak temperature is able to produce
metakaolin that can be used in the production of AAM.
• Mix design 2 achieved higher compressive strength than Mix design 1 due to
higher solid content despite having lower molar ratios than those reported in AAM
literature. As a result, adequate or high strength binders can be achieved without
heavily relying on molar ratios.
• Ambient curing AAM has been found to result to adequate compressive stress,
34 MPa and flexural stress 3.38 MPa at 28 days. Heat curing, while still able to
produce adequate AAM, was not found to be essential in the production of AAM.
• The reactions of the AAM paste followed the expected behavior reported in similar
applications. This verifies the current mix design can be used in AAM applications.

119
• The compressive strength of AAM binders can be increased by reducing the water
content in the alkaline solution. This however comes at the expense of workability
and severely limits potential 3D printing applications.
Taking all this into consideration, the groundwork for AAM fabrication has been laid out,
it has been displayed that AAM can be successfully formulated with the procedures
outlined in this chapter. Mix design 2 presented in this chapter will be used in Chapters 4,
5 & 6 to develop printed AAM overlays.
Future work outside of the scope of this thesis should involve optimizing the binder for a
designated application rather than arbitrarily formulating mix designs. The optimization
method could involve the following: increase alkalinity of solution, identify ‘optimal’
ratios in terms of metakaolin.

120
Chapter 4 3D printing of alkali
activated materials
In this chapter 3D printing of alkali activated materials is explored. A novel mix design
verification process for printing is presented. The importance of the intended printing
application and the additional factors that must be considered are also outlined.
4.1 Introduction
Over the years printing methodologies have been proposed for cementitious
materials. Despite the extensive research that has been carried out in cementitious printing,
applications such as 3D printed cementitious overlays and self-sensing materials have not
been addressed. 3D printing technology has been used to develop plastic moulds to be
filled with repairing mortar to replicate the shape of damaged or cracked surfaces (Yeon
et al., 2018). This method though presents quite a few limitations as it requires a
sufficiently large and damaged surface. It also cannot provide any preventive protection
to the surface in advance. In regards to sensing materials, conductive AAM have been
extruded in the past (Zhong et al., 2017; Zhou et al., 2020) however their sensing
performance was not been tested.
In this chapter we aim to print AAM patches onto concrete substrates that can serve as a
sensing mechanism (without relying on the use of additional electronics) while also acting
as a protective coating to the substrate. This will require investigating the mix’s printing
properties as depicted by Le et al. (2012). The author of this thesis notes that existing

121
printing requirements though do not account for the additional requirements that sensors
and coatings should obtain to be efficiently used in this application. As a result adhesion
and conductivity/sensing will also added to the properties the mix design must attain to be
successfully used as a self-sensing coating. Out of the referred printing parameters
mentioned in Section 2.4.4, the ones that will be assessed in the work conducted in this
thesis are the following:
• Extrudability
• Printability window
• Buildability
• Adhesion
• Conductivity
• Open time
Not all the printing requirements bear the same importance though. In this thesis printing
parameters were categorized as ‘Essential’ and ‘Can be omitted’. A short definition of
each follows:
• Essential – These parameters must be investigated and met to a certain degree to
ensure printing is carried out properly. Not assessing these parameters properly will
lead to experimental failure.
• Can omit – Printing can be conducted without considering these parameters and other
parameters can be considered in their place.
The parameters classified as ‘Essential’ can be further divided into ‘Mix-based’ and
‘Application-based’. While both these parameters must be still considered, they are
influenced by different factors:
• Mix-based – These parameters are met by focusing primarily on the mix design.
• Application-based – Apart from the mix design these parameters are also influenced
by external factors that must be taken into account.
Table 4.1 depicts the overall significance of the referred requirements in this application.
Extrudability, printability window and buildability are categorized as ‘Essential’ and are

122
‘Mix-based’ parameters. By buildability it is meant that the material can achieve the
necessary degree of buildability (see Section 4.2.4.3) to meet its application’s
requirements (not ‘high buildability’ as in an arbitrary number of stacked layers).
Adhesion and conductivity/sensing were categorized as ‘Essential’ and are
‘Application-based’ parameters. It must be ensured that these parameters are met but
considerations outside the mix design must also be made. For example, adhesion could be
increased by altering the surface preparation method or by including bonding agents;
sensing responses can be adjusted with changes to interrogation systems and curing
regimes. Meeting these requirements for adhesion and conductivity/sensing may require
the addition of specific filler to the mix design which can directly impact the extrudability
of the mix. For instance, if the conductivity of an overlay needs to be improved conductive
filler can be added. A common filler such as carbon fiber though may present extrudability
issues. As such alternative solutions can be sought out such as carbon nanofibers or
graphene oxides which would then require the investigation of extrudability, printability
window and buildability anew.
Workability and open time were classified as ‘Can be omitted’. Both these parameters can
be substituted by the printability window which effectively provides the same information
in a more empirical manner. Open time may be more relevant in certain applications as it
can provide an allowable delay between mixing, filament loading and printing initiation.
Overall, while some parameters retain constant significance throughout additive
manufacturing (i.e. extrudability), whether other or additional parameters should be
assessed is rather application dependent. Figure 4.1 displays a flow chart on the mix design
procedure followed.

123
Table 4.1 – Printing parameter relevance.
Printing property Significance Type of parameter
Extrudability Essential Mix-based
Printability window Essential Mix-based
Buildability Essential Mix-based
Adhesion Essential Application-based
Conductivity/Sensing Essential Application-based
Workability Can be omitted –
Open time Can be omitted –
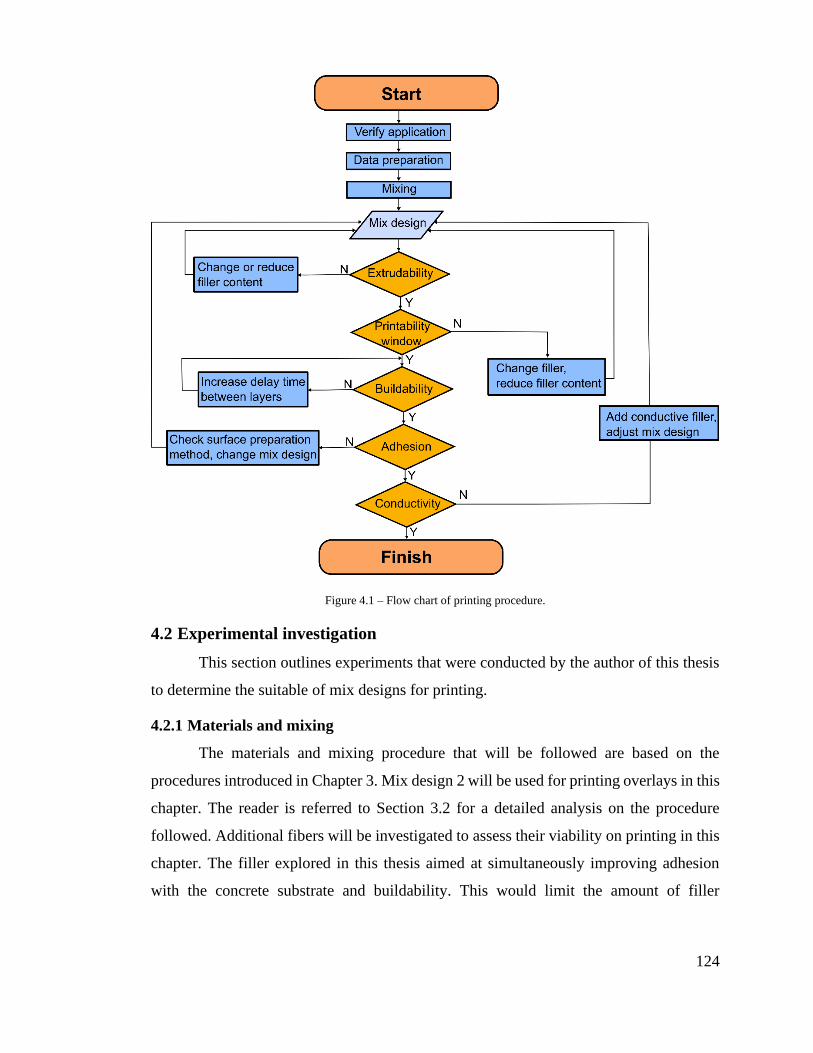
124
Figure 4.1 – Flow chart of printing procedure.
4.2 Experimental investigation
This section outlines experiments that were conducted by the author of this thesis
to determine the suitable of mix designs for printing.
4.2.1 Materials and mixing
The materials and mixing procedure that will be followed are based on the
procedures introduced in Chapter 3. Mix design 2 will be used for printing overlays in this
chapter. The reader is referred to Section 3.2 for a detailed analysis on the procedure
followed. Additional fibers will be investigated to assess their viability on printing in this
chapter. The filler explored in this thesis aimed at simultaneously improving adhesion
with the concrete substrate and buildability. This would limit the amount of filler

125
incorporated and avoid having a heavily heterogeneous mix. For this reason viscosity
modifiers were not investigated as they would not provide additional adhesion capabilities.
Fibers that meet these parameters are PVA (Chaves Figueiredo et al., 2019; Zanotti et al.,
2017), PP (Nematollahi et al., 2018; Nunes et al., 2019) and carbon fibres16 (Feng et al.,
2020; Kosson et al., 2020). Therefore, apart from PVA (3mm) fibers, PVA (6 mm), PP
and carbon fibers were also investigated in the mix design and their printability was
assessed.
4.2.2 3D printing
A screw cavity extruder with a nozzle size of 18 G (0.84 mm) was mounted onto
a commercial 3D printer with an x-y gantry axis. The AAM mix was added in the syringe
barrel and air pressure of 2 bar was applied to syringe to force the material to flow into
the dispensing unit. The print speed was set at 30 mm/s and the flowrate of the mix during
printing was 2 mL/min. Printing was carried out either on the printing bed or on concrete
cubes. A picture of the setup is presented in Figure 4.2.
16 Carbon fibers are also able to increase the electrical conductivity but this is of secondary importance as
AAM are innately electrically conductive. Therefore, they will be regarded in the same light as PVA and
PP fibers. Graphene may present dispersion issues compared to fibers. It will also substantially increase the
cost of the mix and was therefore not considered. Other conductive filler such as multi-wall nanotubes have
been mentioned to not impact buildability (Sun et al., 2020) and were therefore not suitable for this
application.

126
Figure 4.2 – Cavity dispenser installed onto x-y gantry of commercial 3D printer.
4.2.3 Data preparation
A 3D CAD file of the intended objects was exported in stereolithography (STL)
file format. Slicer software (Slic3r) was used to generate the required G-Code from the
STL file, which defines the print paths and extrusion rates. Adjustments to the G-Code to
include time gaps were made by editing the code in NotePad++. A constant print speed
was set at 30 mm/s. The buildability rings were single layers printed one on top of the
other. The patches printed for adhesion consisted of multiple filaments with a rectilinear
infill density of 100 % and a 90o crosshatched infill pattern. A single perimeter was also
added to close potential gaps at the object’s edges caused by the infill path. This also
allowed greater interlocking between the infill and the outer shell (Zareiyan and
Khoshnevis, 2017). Stepover between layers was not required as filament setting was
expected to occur such that it will allow for sufficient overlap between the inner filaments.
Each patch consisted of two layers with a layer height of 0.66 mm. The layer height was
selected to be smaller than the nozzle size to allow for greater compaction between layers
and with the substrate. The head distance of the nozzle was equal to the layer height. For
the concrete cubes, the distance was measured from the highest point of the surface to
avoid nozzle obstruction. Figure 4.3 presents a typical data file for a buildability ring and
the overlay.

127
(a) (b)
Figure 4.3 – G-Code representation of a) buildability ring and b) overlay for concrete substrate.
4.2.4 Printing parameters
4.2.4.1 Extrudability
The author of this thesis broke down the investigation of extrudability into two
parts, the ‘preliminary investigation’ and the actual investigation. The preliminary
investigation involved examining if the mix design was compatible with the dispensing
unit. Therefore, a small amount of filament was extruded for 10 seconds. If the filament
was extruded continuously then the mix passed the preliminary test. The actual
investigation involved printing three lines of filament with a length of 200 mm and 4 mm
apart. If the lines were free from defects and had a consistent shape the mix was deemed
extrudable.
4.2.4.2 Printability window
Once the mix was deemed as extrudable, the printability window was assessed.
The printability window determines how long a particular mix can be extruded without
any discontinuities or gaps. Three lines with a length of 200 mm and 4 mm apart were
printed over the course of 120 minutes at a 10-minute interval.
4.2.4.3 Buildability
Buildability was assessed by extruding cylinders with a diameter of 60 mm
denoted as ‘buildability rings’. A preliminary assessment of 60 layers was conducted.
Buildability was at first assessed by determining the amount of layers that could be
‘stacked’ prior to the collapse of the object. Initially 60-layer buildability rings were
printed with a one-minute time gap between layers. A total of four rings were tested for

128
this investigation. This testing method led to poor results. Out of the four samples, two
collapsed at the 42nd and 47th layer. When it pertains to the remaining two, as the layer
height was kept constant throughout printing, the head distance continuously increased
beyond a certain point which led to poor filament deposition. It was evident that neither
objects were able to meet their intended shape. Following the above, the total height of
the rings was reduced to 30 layers with the same time delay. In this occasion all four
printed specimens remained intact, but similar to the 60-layer test, it could be visually
accepted that the objects still maintained relatively poor quality.
Instead of changing the mix design, an effective means of increasing buildability is by
increasing the time delay between layers to allow for greater strength development of the
filament. Therefore, the gap between layers was increased to 3 minutes and the same
investigation for 30 and 60 layer rings was carried out again. The effect of the increased
delay between layers for both ring tests was evident. While all samples were able to
maintain their shape without collapsing printing issues still persisted. Figure 4.4 presents
30 and 60 layer cylinders printed with a one minute and three minute time gap. Visually
the 30-layer rings with a 3 minute time delay were able to achieve their intended shape to
a greater extent compared to the rest of the samples. However, a different surface texture
can be observed at the higher ends of this sample which signals poor filament deposition
due to increasing head distance. In addition, even though the 60-layer samples did not
collapse they resulted in uneven surfaces and gaps in the object which is a combined effect
of extrudability issues due to the prolonged print run and head distance issues. Overall, it
was evident that the objects were not able to meet their intended shape and therefore they
were regarded as ‘failed’ trials.

129
(a)
(b)
Figure 4.4 – Buildability investigation a) 30 layer buildability rings with 1 minute (left) and 3 minute (right) time
delay; b) 60 layer buildability rings with 1 minute (left) and 3 minute (right) time delay.
Taking everything into consideration, this means of assessing buildability was not deemed
efficient and was not able to provide meaningful information on the buildability of the
mix. As a result a different approach to buildability was followed17.
Two sets of tests were conducted for rings between 2 and 10 layers. The two sets of tests
employed different time gap between layers. The first test has a time gap of 1 minute and
the second 3 minutes. Ten rings were printed for each layer test and 10 height
measurements were made for each ring. The height of each ring was measured with a
digital caliper. Following that the author of this thesis has defined a new metric to counter
limitations of existing practice. The ‘degree of buildability18, was calculated for each ring
using equation (4.1). In this case the extent in which a ring’s actual height meets the design
17 Another option to overcome buildability issues is with the use of ‘adaptive slicing’. In this scenario a
variable layer height is used which is proportional to the setting of the object. In order to use this method
the structural buildup of the filament and the deformation upon each layer must be known. These factors
were not investigated in this thesis as the height requirement of the patches were low. This approach can be
considered in future printing applications particularly those with greater height requirements. 18 This was implied by Nerella et al. (2020) but was not explicitly nor numerically stated.

130
height is assessed. This will allow to quantitatively determine the maximum allowable
height an object can achieve within acceptable deformations.
degree of buildability=Actual height
Design height ×100% (4.1)
When investigating the degree of buildability, it is important to keep a constant head
distance between all objects. Different head distances can lead to different quality objects
and ultimately different heights as well. Figure 4.5 presents 4 identical rings with different
head distances. As can be seen, as the nozzle’s distance from the bed increases the quality
of the object decreases. As a result, the head distance was kept constant (equal to the layer
height) for the investigation of degree of buildability to avoid inconsistencies between
tests.
Figure 4.5 – Printed objects with different surface quality due head distance issues (head distance increases from left
to right).
4.2.4.4 Open time
The open time of the AAM mix was measured using a Vicat needle apparatus as
outlined in BS EN 196-3:2016 (British Standards Institution, 2016) in order to define the
workable time a mix can be used. AAM paste was inserted in a conical mould with a
height of 40 mm, bottom diameter of 70 mm and top diameter of 60 mm. The mould was
placed underneath the needle with a thickness of 1 mm of the Vicat apparatus. The needle
was dropped every 15 minutes and the penetration reading was acquired. The initial setting
time is calculated from the point where the AAM constituents are mixed until the
penetration reading reaches 25 mm. The final setting time is the time in which the needle
does not leave a mark on the mix in the mould.
4.2.4.5 Adhesion
Double layered 90 mm × 90 mm patches were printed onto 100 mm concrete
cubes. The mix design used for the concrete cubes is illustrated in Table 4.2. In order to
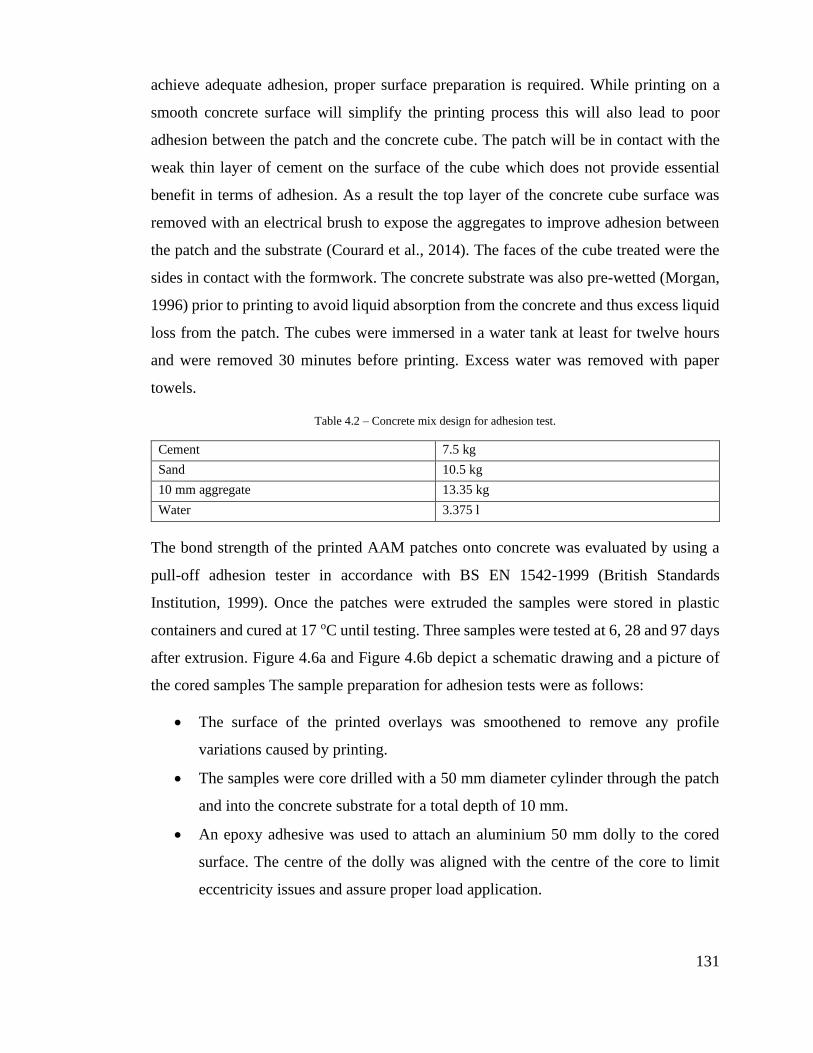
131
achieve adequate adhesion, proper surface preparation is required. While printing on a
smooth concrete surface will simplify the printing process this will also lead to poor
adhesion between the patch and the concrete cube. The patch will be in contact with the
weak thin layer of cement on the surface of the cube which does not provide essential
benefit in terms of adhesion. As a result the top layer of the concrete cube surface was
removed with an electrical brush to expose the aggregates to improve adhesion between
the patch and the substrate (Courard et al., 2014). The faces of the cube treated were the
sides in contact with the formwork. The concrete substrate was also pre-wetted (Morgan,
1996) prior to printing to avoid liquid absorption from the concrete and thus excess liquid
loss from the patch. The cubes were immersed in a water tank at least for twelve hours
and were removed 30 minutes before printing. Excess water was removed with paper
towels.
Table 4.2 – Concrete mix design for adhesion test.
Cement 7.5 kg
Sand 10.5 kg
10 mm aggregate 13.35 kg
Water 3.375 l
The bond strength of the printed AAM patches onto concrete was evaluated by using a
pull-off adhesion tester in accordance with BS EN 1542-1999 (British Standards
Institution, 1999). Once the patches were extruded the samples were stored in plastic
containers and cured at 17 oC until testing. Three samples were tested at 6, 28 and 97 days
after extrusion. Figure 4.6a and Figure 4.6b depict a schematic drawing and a picture of
the cored samples The sample preparation for adhesion tests were as follows:
• The surface of the printed overlays was smoothened to remove any profile
variations caused by printing.
• The samples were core drilled with a 50 mm diameter cylinder through the patch
and into the concrete substrate for a total depth of 10 mm.
• An epoxy adhesive was used to attach an aluminium 50 mm dolly to the cored
surface. The centre of the dolly was aligned with the centre of the core to limit
eccentricity issues and assure proper load application.

132
• The epoxy was left to dry as per manufacturer requirements. The adhesion tester
was then fastened onto the dolly for pull-off testing. The nut of the tester was
tightened to evenly apply force to the dolly and subsequently stress to the coating.
The nut was tightened until the dolly was detached from the substrate and a reading
was taken for each sample.
(a) (b)
Figure 4.6 – Printed overlay for adhesion test a) schematic drawing of sample b) picture of sample.
The surface roughness (Ra) of the concrete substrates was measured by 3D laser scanning
(using a Micro Epsilon Scan Control 2700-100, an exposure time of 1 millisecond, 56
profiles per second, and 1600 buffered profiles). The values for surface roughness were
determined by analysing the root mean square deviation of the point cloud from a mean
plane, which represents the fitting plane of the cloud of points.
4.2.4.6 Conductivity
Four stainless steel electrodes were placed at the corners of double layered
90 mm × 90 mm patches employing the van der Pauw electrode configuration (van der
Pauw, 1958). Voltage (V) 10 mV was applied with an impedance analyzer (Gamry
Interface 1000) at an alternate current frequency between 1 kHz – 10 kHz and a current
(I) was measured. Impedance was calculated via equation (4.2). The conductivity of the
sample for this frequency range was measured using equation (4.3).

133
Z=V
I (4.2)
Where: Z=Impedance; V=voltage and I=current.
σ=L
Z·ACF
(4.3)
Where: σ=conductivity, L=length between applied voltage, Z=impedance measurement
at a given frequency, A=the area of electrodes and CF=correction factor (between 0.5-1.0)
applied to conductivity when employing the van der Pauw electrode configuration (Weiss,
2011). Figure 4.7 presents a printed patch with embedded electrodes. The conductivity
and sensing performance of the printed patches will be assessed in greater detail in
Chapters 5 & 6.
Figure 4.7 – Electrode configuration of printed coating.
4.3 Results and discussion
4.3.1 Extrudability
In order to formerly assess extrudability, a preliminary test was required which
would determine the mix design that would be used going forward. This essentially
investigates the compatibility of the various mix designs with the current printing setup.
In order for fibers to have a strong impact on adhesion, a minimum content of 0.5 wt% is
normally required (Albidah et al., 2020; Bhutta et al., 2019; Nunes et al., 2019; Zanotti et
al., 2017). As a result, the initial mix designs included 0.5 wt% of PVA (3 mm), PP and
carbon fibers of in the mix. Out of the three fillers only PVA fibers were extrudable at this

134
amount as they are more malleable due to their flexible nature. PP and carbon fibers are
stiffer fibers and caused clogging in the nozzle and thus were unable to be continuously
extruded. The solid content would have to be lowered to provide greater flowability of the
paste in the dispensing unit and thus extrudability. However, this would come at the
expense of buildability. While the mix does not require high extents of buildability (see
Section 4.3.3) it still requires a certain degree of consistency to maintain its shape and
prevent the mix from spreading onto the concrete surface. Bearing all this in mind PVA
fibers will continue being investigated in extrudability.
Considering the nature of PVA fibers, two addition investigations were carried out. The
first involved increasing the quantity of PVA fibers to 1 wt%. The second was to
incorporate larger sized PVA fibers of 6 mm. Both these mixes though did not pass the
preliminary extrudability investigation as they led to discontinuities in extrusion. As a
result PVA (3 mm) fibers at 0.5 wt% were used as filler for the remainder of the thesis.
The preliminary investigation enabled us to narrow down the available mix design options
for extrudability. Extrudability can now be formally assessed by printing three straight
lines. Figure 4.8 depicts the outcome of this test for this mix design. As can be seen, the
three lines maintained a fairly consistent shape and were free from defects. Slight
variations in dimensions were due to slight leveling issues and entrapped air which caused
less material to be extruded in certain areas and more in others. This however can be
adjusted by calibrating the dispenser and print bed accordingly. The impact this had on
the extrudability test though was minimal and did not affect the extrudability integrity of
the mix. Taking all this into account the mix was deemed extrudable and can be assessed
for further printing parameters.
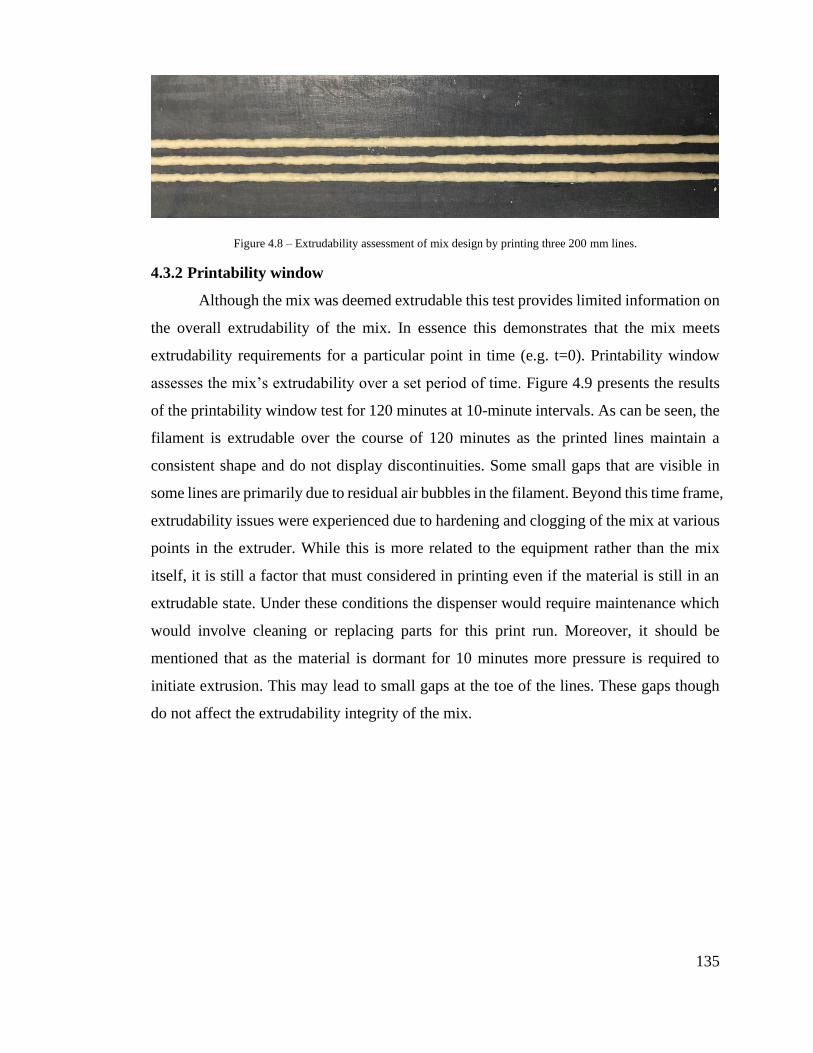
135
Figure 4.8 – Extrudability assessment of mix design by printing three 200 mm lines.
4.3.2 Printability window
Although the mix was deemed extrudable this test provides limited information on
the overall extrudability of the mix. In essence this demonstrates that the mix meets
extrudability requirements for a particular point in time (e.g. t=0). Printability window
assesses the mix’s extrudability over a set period of time. Figure 4.9 presents the results
of the printability window test for 120 minutes at 10-minute intervals. As can be seen, the
filament is extrudable over the course of 120 minutes as the printed lines maintain a
consistent shape and do not display discontinuities. Some small gaps that are visible in
some lines are primarily due to residual air bubbles in the filament. Beyond this time frame,
extrudability issues were experienced due to hardening and clogging of the mix at various
points in the extruder. While this is more related to the equipment rather than the mix
itself, it is still a factor that must considered in printing even if the material is still in an
extrudable state. Under these conditions the dispenser would require maintenance which
would involve cleaning or replacing parts for this print run. Moreover, it should be
mentioned that as the material is dormant for 10 minutes more pressure is required to
initiate extrusion. This may lead to small gaps at the toe of the lines. These gaps though
do not affect the extrudability integrity of the mix.

136
Figure 4.9 – Printability window test for 120 minutes at 10 minute intervals.
4.3.3 Buildability
For this thesis, 3D printing will be used to apply overlays onto concrete substrates.
This will require relatively large spans in the x and y directions only a few layers in the
z-direction. While this still includes the use of a gantry system and a dispensing unit
extruding a cementitious filament in a layer-by-layer manner, it can also be viewed as
2.5D printing due to its low thickness19 (Leech et al., 2020). Nonetheless, the mix must
still undergo the verification process to ensure it meets printing requirements to be
compatible for its intended use. Therefore while 2.5D printing can provide some insight
on the shape and size of the printed objects, the name of the extrusion process is of
secondary importance.
Following the methodology presented in Section 4.2.4.3 buildability rings were extruded
between 2 to 10 layers with a time gap of 1 minute and the degree of buildability was
19 Authors have also considered contour crafting as 2.5D printing as extrusion was described as a vertical extension of
a plane shape and is essentially unable to print complex shapes (Gosselin et al., 2016). This is not considered as 2.5D
printing in this study. Cementitious printing has been given various names over the course of time that attempt to define
the uniqueness of each printing application. For example, cementitious printing has also been regarded as 4D printing
to account for the fourth dimension of time (Franchin et al., 2017).

137
calculated for each ring using equation (4.1). Figure 4.10 depicts the degree of buildability
for these specimens. The degree of buildability in this case ranged between 73% and 98%
for rings between 10 to 2 layers respectively. The degree of buildability continuously
decreased with the deposition of additional layers. This signals that the previous layers are
unable to fully support the weight of the newly deposited layers. This results in
deformation and subsequently incorrect filament deposition due to the increasing head
distance. Maximum deformation allowed in buildability and shape retention tests ranges
between 80-90% with structural applications being at the higher end of this spectrum
(Chen et al., 2020; Nair et al., 2019; Tay et al., 2019). Considering the low thickness
requirements of the coatings and in order to allow proper interlocking with the substrate,
a maximum deformation of up to 80% was deemed acceptable irrespective of the number
of layers object.

138
Figure 4.10 – Degree of buildability for buildability rings between 2-10 layers with a time delay between layers 1
minute. Errors bars represent standard deviation of 10 measurements per sample for 10 samples.
Considering the above, only rings with layers between 2-4 are able to securely meet the
80% deformation threshold. In order to allow the filament to withstand the weight of
additional layers the time delay was increased to 3 minutes for buildability rings between
5 and 10 layers. Figure 4.11 presents a typical buildability ring with 10 layers. Figure 4.12
presents a comparison of the degree of buildability between the rings between 5 and 10
layers with a time gap of 1 and 3 minutes. Increasing the time gap was beneficial for the
shape of these objects. The degree of buildability ranged from 85% to 92% for rings
between 10 and 5 layers respectively. Under these conditions, the mix is able to be print
objects up to 10 layers within deformation limits.

139
Figure 4.11 – Ten layer printed buildability ring.
Figure 4.12 – Comparison of degree of buildability for buildability rings between 5-10 layers with time delays
between layers 1 and 3 minutes. Errors bars represent standard deviation of 10 measurements per sample for 10
samples.
Buildability is a relatively abstract term to address due to the different printing setups and
applications. As mentioned in Section 2.4.4.1, buildability is associated with low-
deformation mixes. This however does not depict the entire picture of printing in the civil

140
engineering. The importance defining buildability in the proper context was pointed by
Nerella et al. (2020). It was stated by the authors that deformations and tolerances should
be allowed depending on the application to avoid the risk of overdesigning. In the current
application, the intention is to produce coatings on substrates. Deformation is allowable
in this application as coatings are required to spread onto the concrete surface and anchor
into the concrete capillaries to achieve a greater bond (Courard and Degeimbre, 2004). In
like manner, this mix will not be suitable for construction purposes with great height
demands. Achieving a greater height or improving the degree of buildability of the
existing rings is possible by extending the delay time even further. This however would
be counterproductive as the delay time will significantly outweigh the printing time and
thus altering the mix design would be a better option. Furthermore, developing objects
with such capabilities lies beyond the scope of this thesis.
4.3.4 Open time
The initial setting of the mix was recorded as 16 hours and the final setting time
as 20 hours. The setting time in this test was quite long compared to mixes used in most
printing applications in the literature, but mixes with prolonged setting times (Chaves
Figueiredo et al., 2019) are still usable. In general the setting time of mixes is short (less
than an hour) in mixes with a high solid content, filler and thickening agents (Chougan et
al., 2020; Panda et al., 2019). The current mix did not employ a large amount of filler nor
did it involve any additional agents, therefore the long setting time is anticipated. While
short setting times may be common for construction elements (short setting time can be
associated with high viscosity which is a common trait in several printable mixes) having
a long setting time is beneficial for coating applications due to the larger surface areas that
are required to be covered. Moreover, it was shown in Section 4.2.4.3 and Section 4.3.3
that slight modifications in extrusion settings can increase a mix’s printing potential if
required. The setting time of the mix should be primarily used as an indication on the
workability window of a mix.
Open time is the only printing parameter directly referring to time by provided by Le et
al. (2012). However, it only covers a small aspect of time in 3D printing. Diggs-McGee
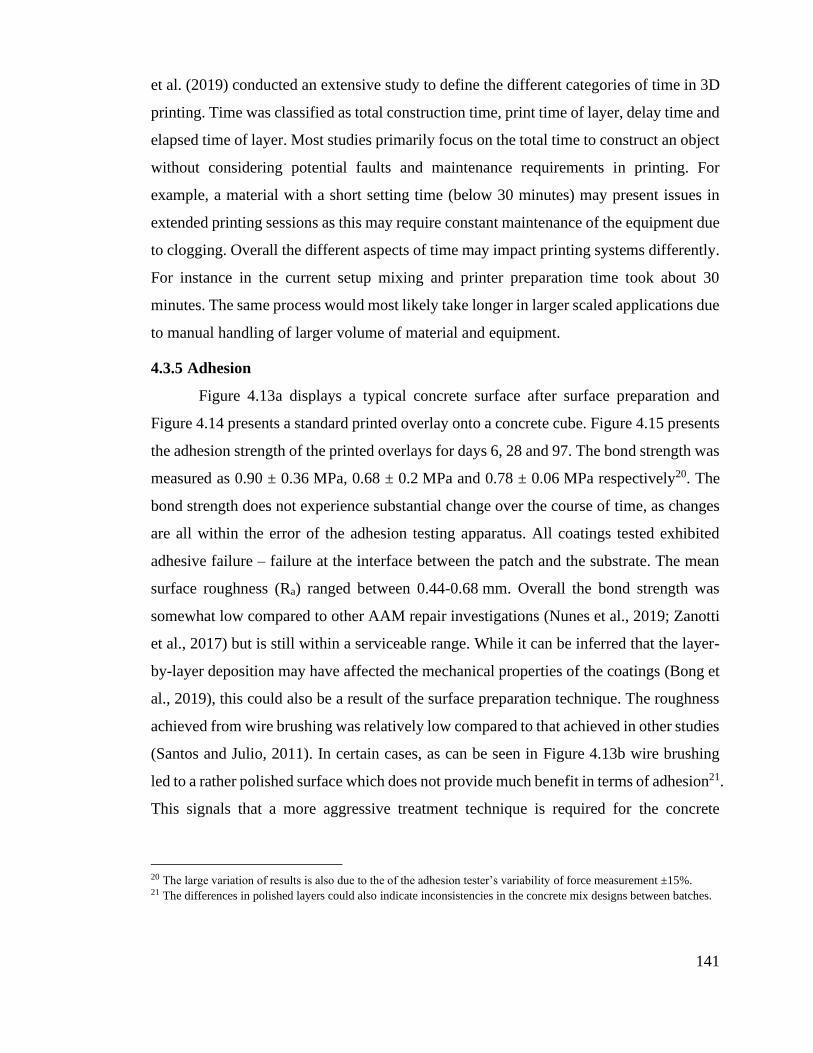
141
et al. (2019) conducted an extensive study to define the different categories of time in 3D
printing. Time was classified as total construction time, print time of layer, delay time and
elapsed time of layer. Most studies primarily focus on the total time to construct an object
without considering potential faults and maintenance requirements in printing. For
example, a material with a short setting time (below 30 minutes) may present issues in
extended printing sessions as this may require constant maintenance of the equipment due
to clogging. Overall the different aspects of time may impact printing systems differently.
For instance in the current setup mixing and printer preparation time took about 30
minutes. The same process would most likely take longer in larger scaled applications due
to manual handling of larger volume of material and equipment.
4.3.5 Adhesion
Figure 4.13a displays a typical concrete surface after surface preparation and
Figure 4.14 presents a standard printed overlay onto a concrete cube. Figure 4.15 presents
the adhesion strength of the printed overlays for days 6, 28 and 97. The bond strength was
measured as 0.90 ± 0.36 MPa, 0.68 ± 0.2 MPa and 0.78 ± 0.06 MPa respectively20. The
bond strength does not experience substantial change over the course of time, as changes
are all within the error of the adhesion testing apparatus. All coatings tested exhibited
adhesive failure – failure at the interface between the patch and the substrate. The mean
surface roughness (Ra) ranged between 0.44-0.68 mm. Overall the bond strength was
somewhat low compared to other AAM repair investigations (Nunes et al., 2019; Zanotti
et al., 2017) but is still within a serviceable range. While it can be inferred that the layer-
by-layer deposition may have affected the mechanical properties of the coatings (Bong et
al., 2019), this could also be a result of the surface preparation technique. The roughness
achieved from wire brushing was relatively low compared to that achieved in other studies
(Santos and Julio, 2011). In certain cases, as can be seen in Figure 4.13b wire brushing
led to a rather polished surface which does not provide much benefit in terms of adhesion21.
This signals that a more aggressive treatment technique is required for the concrete
20 The large variation of results is also due to the of the adhesion tester’s variability of force measurement ±15%. 21 The differences in polished layers could also indicate inconsistencies in the concrete mix designs between batches.

142
substrates used in this thesis. Employing a more suitable surface preparation technique
such as sandblasting can increase the surface profile between the patch and the substrate
and improve the adhesion through mechanical interlocking (Courard et al., 2014). This
would require additional layers to be extruded to allow for proper levelling of the coating.
(a)
(b)
Figure 4.13 – Variations in concrete surfaces after wire brushing a) rough surface with exposed aggregates b) polished
surface.

143
Figure 4.14 – Typical printed coating deposited onto concrete cube.
Figure 4.15 – Adhesion strength of printed overlays at days 6, 28 & 97. Errors bars represent standard deviation of
measurements for 3 samples.
In this study interlayer adhesion is not assessed as this is normally examined in objects
fabricated using the full width printing technique (Panda et al., 2018). While the

144
‘buildability rings’ are considered full width objects, their size is too small to be accurately
tested. Furthermore, as the primary objective is to print coatings, adhesion between two
single layers does not provide essential information for this application with the current
setup. Additionally, considering adhesive failure occurred in all bond strength tests, this
indicates that the tensile strength in the overlays was greater than the bond strength
achieved.
Adhesion and interlayer adhesion have been mentioned to share some similarities (Wolfs
et al., 2019). The author of this thesis considers that they should be regarded and dealt as
two separate concepts in 3D printing. Adhesion involves a freshly deposited material onto
an already cured surface of another material which has undergone proper treatment
(surface preparation and prewetting) to promote greater adhesion between the two
materials. Interlayer adhesion involves the bond strength of two layers of the same
material within a relatively short time frame which is something that cannot always be
achieved in adhesion.
4.3.6 Conductivity-sensing capacity
AAM possess inherent electrical properties due to the alkali ions in their matrix
and thus can be used in sensing applications via ionic conduction. The reader is referred
to Section 2.3 for a more in-depth review on conductivity and sensing performance of
alkali activated materials. The impedance of the sample remained relatively stable for
frequencies between 1 kHz - 10 kHz. The conductivity of a printed patch in this frequency
range was measured in the range of 10‒5 – 10‒4 S/m. This value is within the range of
conductivity of cementitious materials used in previous sensing applications. As
mentioned in Section 2.3.2.4 though, while the binder must showcase some form of
conductivity in order to be used in sensing applications, high conductivity does not always
translate to high sensing capabilities. The following step in this requirement would be to
characterize the sensing response of the material. Section 2.3 presents testing methods for
strain, temperature and moisture sensing. The sensing characterization in terms of
temperature and strain of the printed patches is presented in Chapters 5 & 6.

145
The conductivity and sensing requirement for sensing overlays is achieved by the source
material being an alkali activated material. As mentioned in Section 2.3.3.2 AAM are able
to be used in sensing applications without relying on the use of conductive filler (Biondi
et al., 2020; Saafi et al., 2018). If an OPC mix was used, this requirement would require
greater investigation as the main conduction mechanism in OPC binders is through
electronic conduction which demands conductive filler.
Overall, conductivity and sensing should not be viewed in the same lens as other printing
requirements, because they are not only influenced by the mix design and printing
parameters. However, they are important as they are prerequisites for the intended
application outlined in this thesis.
4.3.7 Workability
In this work, workability-flowability was not assessed. The material was manually
inserted into the syringe barrel as shown in Figure 4.2. If the mix was not able to be
inserted, then it would automatically be disregarded for printing. Furthermore, the material
is required to flow through the syringe barrel and into the dispensing unit as illustrated in
Figure 4.2. In the event where flowability was an issue, this would have a direct impact
on extrudability. Therefore, extrudability and printability window can be used to indirectly
provide information on the workability-flowability of the mix.
4.4 Conclusions
In this chapter the 3D printing of cementitious materials is presented. Sets of
guidelines and requirements have been developed over the years to assess a mix’s
suitability for printing. These requirements have expanded and been modified by the
author of this thesis to adapt to the requirements and the intended application of the printed
object. In this chapter the printing requirements were tailored to allow the extrusion of
self-sensing overlays for concrete substrates. This led to examining the following
parameters: extrudability/printability window, buildability, open time, adhesion and
conductivity/sensing. The testing method and results for each are presented and their
significance in printing is also outlined. The key findings of this chapter are the following:

146
• PVA fibers present greater extrudability for syringe-based printing setups. PP and
carbon fibers are not as effective as they cluster inside the dispensing unit causing
extrudability issues.
• Printability window is an effective means of providing essential information on
the extrudability, open time and workability of a mix in a single investigation. The
printability window of the mix design was 120 minutes. This time frame allows
the extrusion of multiple sensing patches. Extruding beyond the printability
window could lead to printed objects with poor quality.
• Buildability and shape stability can be achieved to a greater degree by allowing
the filament sufficient time to solidify and develop adequate strength before
depositing additional layers. Increasing the time gap from 1 minute to 3 minutes
between layers led to significantly increased print quality and degree of
buildability.
• Adhesion and conductivity are added requirements that must be met to ensure
proper functionality of self-sensing overlays. These parameters must be
considered when developing AAM sensors as they may influence the mix design
and preparation steps required for printing sensing patches. The conductivity of
the patches was measured as 10-5 – 10-4 S/m. Adhesion between the printed patches
and the substrate was determined between 0.68 MPa – 0.90 MPa.
The temperature sensing capabilities of the sensing coatings produced by following the
methodology outlined in this chapter will be explored in Chapter 5.

147
Chapter 5 3D printed
temperature-sensing coatings for
concrete structures
In this chapter the temperature sensing response of printed coatings is investigated. The
coatings are fabricated following the printing methodology presented in Chapter 4. Other
factors such as adhesion and printing settings are also investigated22.
5.1 Introduction
Following the literature on AAM sensing and the development of AAM patches,
this chapter focuses on the temperature sensing response of printed metakaolin AAM
patches onto concrete substrates. We discuss and test the adhesion of the patch, its
temperature-sensing capability, and the challenges in development. As far as we are aware,
this is the first time that 3D printable self-sensing repairs for concrete substrates have been
demonstrated. In this chapter the following investigation is carried out:
• The impedance and repeatability of AAM for temperatures between 10 oC – 30 oC
for two temperature cycles is examined.
22 This chapter was published in the August 2020 issue of the Additive Manufacturing journal Vlachakis, C., Perry, M.,
Biondi, L., & Mcalorum, J. (2020). 3D printed temperature-sensing repairs for concrete structures. Additive
Manufacturing, 34(August), 101238. https://doi.org/10.1016/j.addma.2020.101238 Minor changes have been made to
this chapter to include data acquired after the publication of the manuscript and to update figures and literature.

148
• The temperature sensing behavior of the AAM patch is characterized.
• An equivalent circuit model for AAM patches on concrete substrates is presented.
• The effect of heat curing on the adhesion of printed patches is explored.
• Factors affecting the quality of the printed patches are also highlighted.
Applications for this technology include remotely-deployable, retrofitted repairs and
continuous monitoring solutions for existing structures in hazardous construction, nuclear
or oil and gas environments. Due to the fabrication steps involved, this technology is better
positioned to be deployed onto precast elements for installation in structures in the
aforementioned environments. In order for the AAM patch to function as a temperature
sensor, both the substrate and the patch should be situated in an environment where
relatively stable conditions are anticipated. This is necessary as AAM require a
considerable amount of time to stabilize due to low thermal conductivity (Prałat et al.,
2021). Having the concrete substrate and AAM patch exposed to different environments
(e.g. AAM is indoor and part of the substrate is outdoor) can lead to simultaneous
temperature effects on the system which can cause sensing interference and inaccurate
readings.
It is important to point out that while simpler methods for temperature sensing exist (i.e.
thermocouples) it remains essential that the temperature behavior of AAM is characterized.
This will allow for the investigation of more complex testing conditions in future
applications such as strain tests at various temperatures. The temperature behavior of
AAM can also assist in distinguishing behaviors that may occur in prolonged monitoring
applications such as creep or even electrolysis. Overall facilitating cheap, low-risk,
continuous data acquisition could contribute to a clearer understanding of concrete
structural health and design.
5.2 Methodology
The following sections outline the experimental procedure that is carried out to
investigate the temperature sensing response of coatings. The sensing procedure was
drawn on the scientific literature presented in Section 2.3. Material preparation was based
on the methodology presented in Section 3.2 on alkali activated materials and the printing

149
process was based on the investigation carried out in Chapter 4. The reader is advised to
revisit those chapters for more detailed explanations in each of the respective areas.
5.2.1 Materials and mixing
The AAM constituents and mixing procedure used in this chapter is based on Mix
design 2 outlined in Section 3.2.
5.2.2 3D Printing overview
The 3D printing process followed in this chapter is based on the procedure
introduced in Chapter 4. Figure 5.1 depicts the printing setup as a reminder to the reader.
The steps in the 3D printing were extended from Le et al. (2012a) to encompass: 1) data
preparation, 2) concrete surface preparation, 3) filament mixing and loading, 4) printing,
5) electrode insertion, and 6) curing. The printing process is outlined as a flowchart in
Figure 5.2. It essentially explains the iterative process in 3D printing. Similar to other
cement-printing flow charts, the data files are prepared by using a slicing software and the
filament is prepared and printed (Panda and Tan, 2018). Compared to other flowcharts in
3D printing, the main differences are the addition of concrete surface preparation,
electrode insertion and curing. In most cases these factors are absent, however in the
current application these parameters must be investigated as they are paramount factors in
ensuring proper function of sensing repairs. The printing process is explained in further
detail in the Sections 5.2.2.1, 5.2.2.2 and 5.2.2.3.

150
Figure 5.1 – 3D printing setup showing the dispensing unit and an empty pressurized feed cartridge.

151
Figure 5.2 – Flow chart of printing and fine-tuning process.
5.2.2.1 Data preparation
Data preparation followed the same procedure as in Section 4.2.3. In this
investigation double layered 90 mm × 90 mm patches were extruded at a print speed of
50 mm/s and a layer height of 0.66 mm. Figure 5.3 depicts the sliced model for a standard
AAM patch.

152
Figure 5.3 – G-Code representation of patch.
5.2.2.2 Concrete surface preparation
In this work, AAM patches were printed onto concrete slabs (70 mm × 20 mm ×
20 mm) and cubes (side 100 mm). The former substrate was used for temperature sensing
purposes and the latter for adhesion testing. Smaller substrates were selected for
temperature sensing tests as larger concrete substrates exhibit high thermal inertia leading
to longer stabilization periods for the AAM overlay. Both concrete substrates employed
the same mix design presented in Table 4.2. Likewise, the surface preparation technique
presented in Section 4.2.4.5 is followed in this chapter. As a recap, the top layer of the
cube surface was removed with an electrical brush to expose the aggregates and improve
adhesion between substrate and patch (Courard et al., 2014). This is standard practice
when repairing a concrete structure. In order to avoid liquid absorption, the concrete
substrate was then pre-wetted (Morgan, 1996) prior to printing to avoid excess liquid loss
from the patch. The substrates were immersed in water at least for twelve hours and were
removed shortly before printing. Excess water was removed with paper towels. Long print
runs may lead to concrete surface drying and induce high levels of shrinkage in the patch.
The longest printing duration lasted about 20 minutes for the 100 mm concrete cubes. This
printing time was not deemed long enough to cause excessive drying in the concrete
substrate. This was empirically confirmed as patches printed on prewetted substrates did
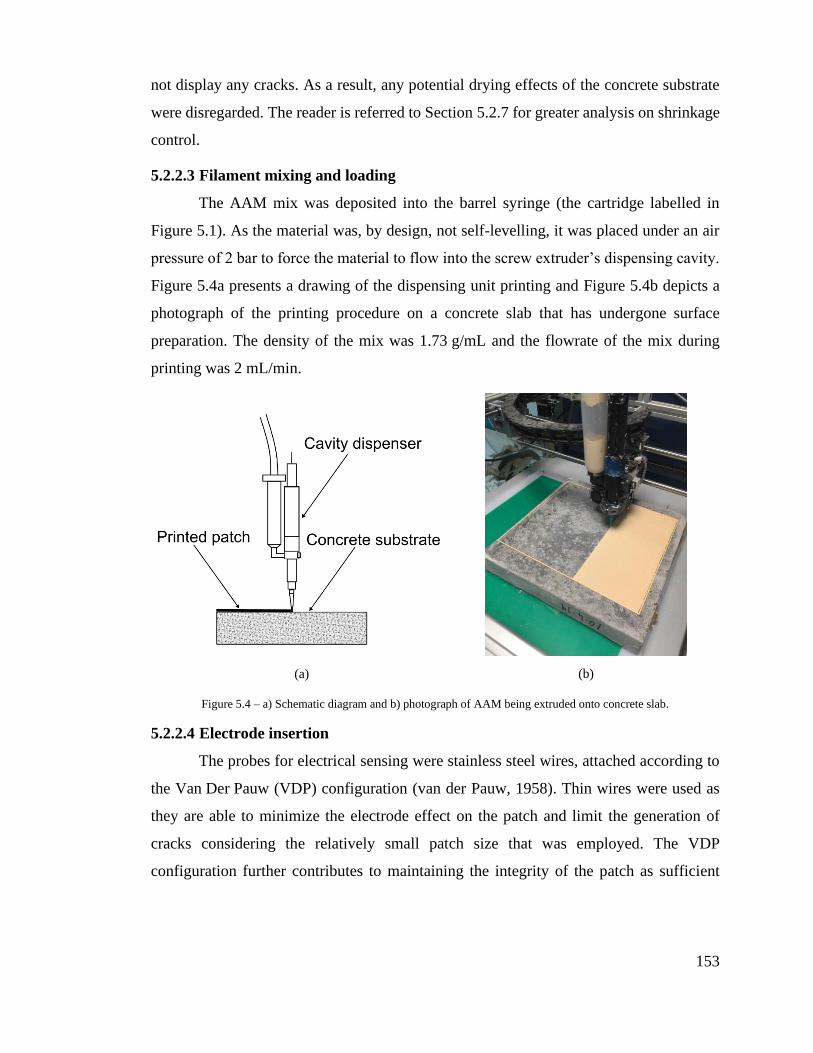
153
not display any cracks. As a result, any potential drying effects of the concrete substrate
were disregarded. The reader is referred to Section 5.2.7 for greater analysis on shrinkage
control.
5.2.2.3 Filament mixing and loading
The AAM mix was deposited into the barrel syringe (the cartridge labelled in
Figure 5.1). As the material was, by design, not self-levelling, it was placed under an air
pressure of 2 bar to force the material to flow into the screw extruder’s dispensing cavity.
Figure 5.4a presents a drawing of the dispensing unit printing and Figure 5.4b depicts a
photograph of the printing procedure on a concrete slab that has undergone surface
preparation. The density of the mix was 1.73 g/mL and the flowrate of the mix during
printing was 2 mL/min.
(a) (b)
Figure 5.4 – a) Schematic diagram and b) photograph of AAM being extruded onto concrete slab.
5.2.2.4 Electrode insertion
The probes for electrical sensing were stainless steel wires, attached according to
the Van Der Pauw (VDP) configuration (van der Pauw, 1958). Thin wires were used as
they are able to minimize the electrode effect on the patch and limit the generation of
cracks considering the relatively small patch size that was employed. The VDP
configuration further contributes to maintaining the integrity of the patch as sufficient

154
distance is maintained between the electrodes avoiding high levels of stresses being
developed. By maintaining a sufficient distance between the electrodes, inductance due to
electrode cross-talk can also be avoided to a certain degree. Moreover the VDP
configuration also provides an average (rather than localised) measurement of the patch’s
overall impedance. Two methods of incorporating the electrodes were tested in this work:
• Method 1: was to pre-arrange the probes on the concrete substrate and print
directly over them.
• Method 2: probes were inserted into the patch after the patch was printed.
5.2.2.5 Curing
The samples were then stored in sealed, plastic containers to maintain moisture
and cured at 40 °C for 24 hours. The elevated temperature is not mandatory (Biondi et al.,
2019) but accelerates the alkaline activation process. The samples were then kept under
ambient conditions until testing.
5.2.3 Sensor testing
The electrical properties of the patch were analysed with an electrical impedance
analyser (Gamry Interface 1000) running in potentiostatic mode. The impedance of the
samples was measured by applying 10 mV voltage for frequencies between 10 Hz and
100 kHz and measuring the electrical current response. The impedance was then
determined using equations (2.5) and (2.6) listed in Section 2.3.2.3. The electrical
configuration is depicted in Figure 5.5. The voltage was applied across electrodes 1 and 4
and the current was measured across electrodes 2 and 3.

155
Figure 5.5 – Printed sensor on a concrete substrate.
In order to avoid humidity fluctuations during temperature experiments, samples were
placed in a controlled environmental chamber. The chamber set the temperature at 30 °C
and then reduced it to 10 °C in 5 °C steps: we denote this the “down cycle”. It then
performed an “up cycle”, increasing temperatures from 10 °C to 30 °C in 5 °C steps. When
target temperatures were reached, they were held for 135 minutes to ensure thermal
stabilisation of the patch and the concrete substrate. Following this, temperatures were
held for a further 15 minutes and measurements of impedance were taken. This allowed
for extraction of average values of impedance components over this time period. Note that
this long measurement period is not something that would be required during sensor
operation, but it does improve measurement confidence during characterisation. The
temperature steps as recorded by an external sensor are presented in Figure 5.6.

156
Figure 5.6 – Time-temperature series for temperature characterization.
5.2.4 Adhesion testing
In this chapter the effect of heat curing on printed patches was investigated. Double
layered 90 mm × 90 mm patches were printed onto concrete substrates. The mix design
for the substrates is depicted in Table 4.2. The surface of the substrates was prepared and
adhesion was assessed following the methodologies and testing procedure outlined in
Section 4.2.4.5.
5.2.5 3D printing: tuning and improvement
The mix design used in this chapter has been verified that it is suitable for printing
AAM overlays for concrete substrates following the investigation conducted in Chapter 4.
Out of the parameters requirements examined in Chapter 4, buildability adhesion and
conductivity sensing are further analyzed in this chapter.
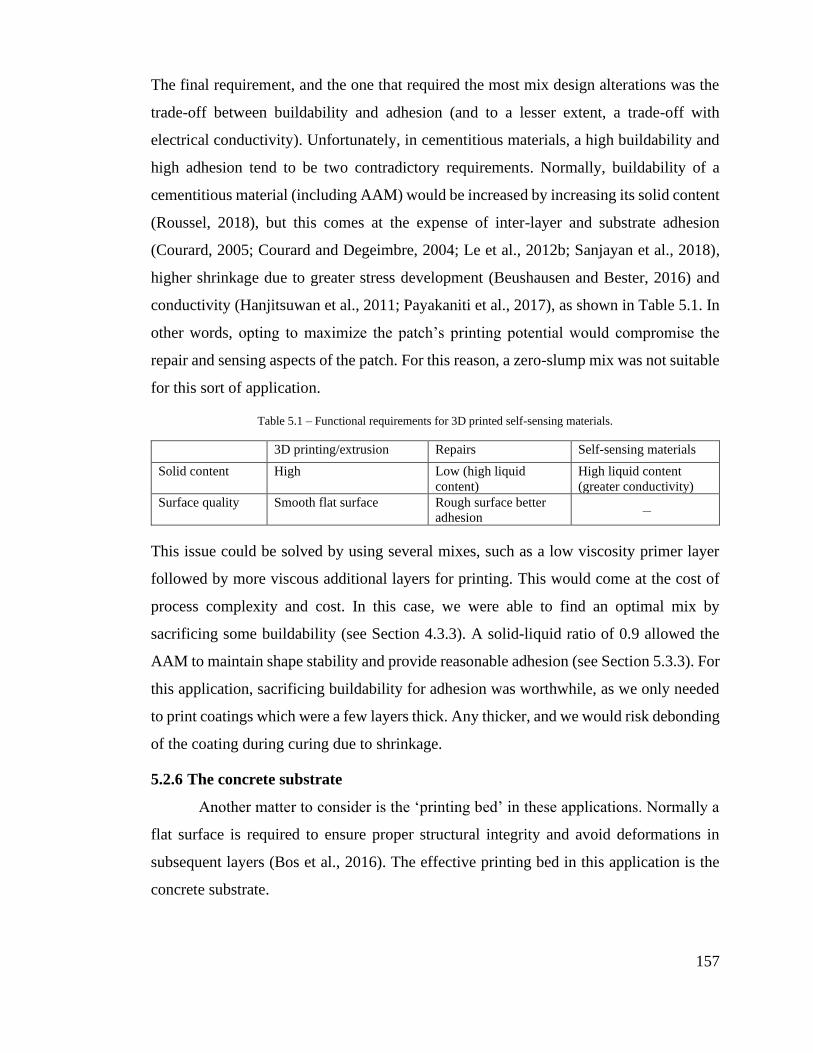
157
The final requirement, and the one that required the most mix design alterations was the
trade-off between buildability and adhesion (and to a lesser extent, a trade-off with
electrical conductivity). Unfortunately, in cementitious materials, a high buildability and
high adhesion tend to be two contradictory requirements. Normally, buildability of a
cementitious material (including AAM) would be increased by increasing its solid content
(Roussel, 2018), but this comes at the expense of inter-layer and substrate adhesion
(Courard, 2005; Courard and Degeimbre, 2004; Le et al., 2012b; Sanjayan et al., 2018),
higher shrinkage due to greater stress development (Beushausen and Bester, 2016) and
conductivity (Hanjitsuwan et al., 2011; Payakaniti et al., 2017), as shown in Table 5.1. In
other words, opting to maximize the patch’s printing potential would compromise the
repair and sensing aspects of the patch. For this reason, a zero-slump mix was not suitable
for this sort of application.
Table 5.1 – Functional requirements for 3D printed self-sensing materials.
3D printing/extrusion Repairs Self-sensing materials
Solid content High Low (high liquid
content)
High liquid content
(greater conductivity)
Surface quality Smooth flat surface Rough surface better
adhesion –
This issue could be solved by using several mixes, such as a low viscosity primer layer
followed by more viscous additional layers for printing. This would come at the cost of
process complexity and cost. In this case, we were able to find an optimal mix by
sacrificing some buildability (see Section 4.3.3). A solid-liquid ratio of 0.9 allowed the
AAM to maintain shape stability and provide reasonable adhesion (see Section 5.3.3). For
this application, sacrificing buildability for adhesion was worthwhile, as we only needed
to print coatings which were a few layers thick. Any thicker, and we would risk debonding
of the coating during curing due to shrinkage.
5.2.6 The concrete substrate
Another matter to consider is the ‘printing bed’ in these applications. Normally a
flat surface is required to ensure proper structural integrity and avoid deformations in
subsequent layers (Bos et al., 2016). The effective printing bed in this application is the
concrete substrate.

158
For repairs a rough surface is preferred to ensure proper adhesion and interlocking
between repair and substrate (Morgan, 1996). However, this could pose various issues in
printing especially when small nozzle sizes are employed. Firstly, this could result to
nozzle obstruction if proper head distance (distance between substrate and nozzle) is not
considered. Secondly, if a large head distance is selected to avoid any potential
interferences, the unevenly distributed surface can result in a printed object with
ununiform quality. Figure 5.7a and Figure 5.7b present an example of such an effect. It
could be viewed that the area with a higher head distance resulted in poorer quality and
gaps in printing in comparison to the area with a shorter head distance. The higher distance
prevented proper interlocking with the substrate, which led to dragging of the filament
and inaccurate deposition creating a mismatch between previous and subsequent printing
paths.

159
(a) (b)
Figure 5.7 – Examples of adverse print quality due to uneven concrete surface and head distance.
5.2.7 Shrinkage control
Shrinkage in this system is a vital point of consideration and thus proper shrinkage
control is required to avoid the formation of cracks. Tensile stresses develop between the
substrate and the repair which could result into cracks (Zhou et al., 2008). Moreover,
metakaolin based repairs are prone to delamination (Nunes et al., 2019) and cracks
(Vasconcelos et al., 2011) primarily due to high levels of shrinkage. For this reason,
incorporating additives to deal with these issues is necessary. PP (Aguirre-Guerrero et al.,
2017; Zhang et al., 2012) and PVA (Zanotti et al., 2017) fibres could provide a solution
to high restrained shrinkage. Water loss in the system is also an issue to tackle. Figure 5.8
presents a square patch printed onto a dry substrate. As can be seen, depositing patches on
dry surfaces led to crack generation, this is a result of liquid absorption from the concrete
substrate. As such, pre-wetting the substrate is required as it prevents loss of liquid in the
patch (Morgan, 1996). Furthermore, sealing the sample prevents water evaporation during
Large head distance
Small head distance

160
thermal curing (Zhang et al., 2009). It should be added that thermally curing also leads to
reduced cracks and increased bond strength (Zanotti et al., 2017). In this thesis shrinkage
was assessed via visual inspection. If cracks were visible the overall preparation process
was deemed unsuitable for fabricating AAM patches and a new shrinkage control
approach was required.
Figure 5.8 – Cracked patch printed onto dry concrete substrate.
In order to counter shrinkage issues, the use of fibre additives was employed. However,
having tested PP fibres, extrudability was found to be poor even at 0.5-1% w/w, as the
inflexible fibres would cluster near the nozzle and cause congestion. Short (3 mm) PVA
fibres, being more flexible, did not cause extrudability issues at 0.5 % w/w (6 mm fibres
compromised extrudability). The inclusion of PVA fibres enhances shape stability
(Chaves Figueiredo et al., 2019). In addition, according to Zanotti et al. (2017), PVA fibres
also increase the bond strength of repairs, as they decrease repair cracking and
delamination due to restrained shrinkage, and enhance interfacial failure resistance with
the patch and the concrete substrate. The fibres are able to bridge the gaps of cracks while
carrying the induced tensile loads (Soltan and Li, 2018).
Another factor that may be overlooked for shrinkage control when printing overlays for
repairing purposes is the total print time. Rapid drying can occur when large surface areas
are being repaired with relatively thin overlays. This is relevant in 3D printing applications
especially when the extrusion rate is low. This can subsequently prolong the total print
run and delay proper curing leading to potential moisture loss. (Vaysburd et al., 2011).
The repair application must be quick enough to avoid material hardening and developing

161
high viscosity. Low viscosity is desired as it would be able to spread on the surface and
enable penetration into the capillaries (Courard and Degeimbre, 2004). In order to
accomplish this in the current application, increasing the print speed was an option.
However, as could be seen in Figure 5.9a and Figure 5.9b, increasing print speed from
50mm/s to 100mm/s had a negative impact on the quality of the print leading to multiple
gaps and thus poor printing. This is mainly because the volume of material that can be
extruded per second (and therefore per mm) is limited in our setup. In essence the same
amount of filament is being extruded per second despite the faster movement of the
extruder. This ultimately results in thinner filaments at higher print speeds. In order to
have accurate deposition at higher speeds, the flowrate of the dispenser will be required
to be increased as well. Based on the flowrate used for 50 mm/s (2 mL/min), it can be
inferred that the flowrate should be increased to 3.5 – 4.5 mL/min to avoid gaps in printing.
Taking everything into account when extruding for repairing purposes the printing
duration, speed and any delays, should be such that does not negatively impact the repair
quality but at the same time is quick enough to maintain adequate viscosity and to allow
proper sealing and curing to avoid moisture loss. In essence, the open time in repair
applications can be viewed as not by the time a mix is printable but in which the time a
mix can achieve adequate adhesion while avoiding excessive shrinkage. This, however, is
closely linked to equipment limitations which can cause variations in the final time.
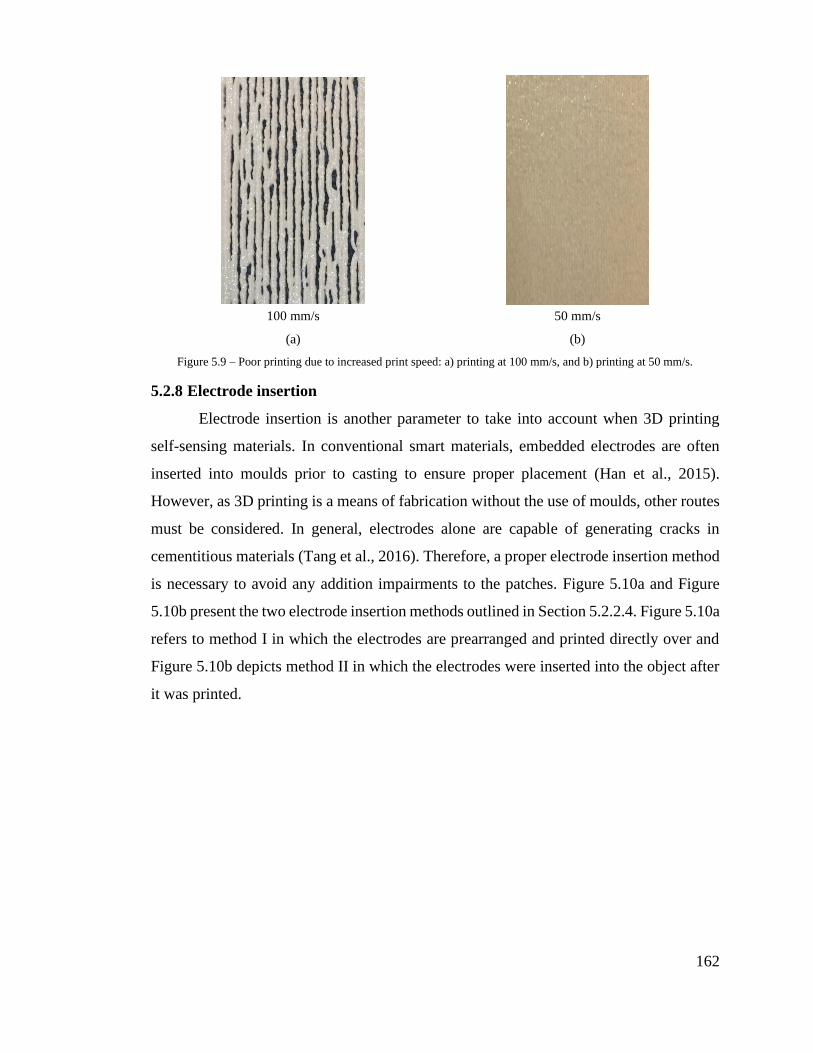
162
100 mm/s 50 mm/s
(a) (b)
Figure 5.9 – Poor printing due to increased print speed: a) printing at 100 mm/s, and b) printing at 50 mm/s.
5.2.8 Electrode insertion
Electrode insertion is another parameter to take into account when 3D printing
self-sensing materials. In conventional smart materials, embedded electrodes are often
inserted into moulds prior to casting to ensure proper placement (Han et al., 2015).
However, as 3D printing is a means of fabrication without the use of moulds, other routes
must be considered. In general, electrodes alone are capable of generating cracks in
cementitious materials (Tang et al., 2016). Therefore, a proper electrode insertion method
is necessary to avoid any addition impairments to the patches. Figure 5.10a and Figure
5.10b present the two electrode insertion methods outlined in Section 5.2.2.4. Figure 5.10a
refers to method I in which the electrodes are prearranged and printed directly over and
Figure 5.10b depicts method II in which the electrodes were inserted into the object after
it was printed.

163
Method I Method II
(a) (b)
Figure 5.10 – Electrode insertion methods can be a) prearranged, or b) inserted after printing.
It is evident that inserting the electrodes after printing causes impairments to the printed
object compared to printing directly onto them in a prearranged manner. When using
method II the patch is still in a relatively fresh state and it is still susceptible to
deformations. Any unaccounted interferences can impair the shape of the printed object,
which in turn will carry over to the hardened state of the material. This could pose an issue
as this practice could generate undesired cavities making it prone to water and chloride
ingress. Furthermore, depending on the electrode size and impairment caused, the
geometrical and mechanical properties of the patch could be affected, and this can have
knock-on effects on sensor performance and reliability.
5.3 Results and discussion
5.3.1 Equivalent circuit modelling
Equivalent circuit modelling of self-sensing cementitious materials is an effective
method of understanding, predicting and characterizing the electrical response of the
binders. In this thesis, the equivalent circuit of AAM patches printed onto concrete
substrates was based on previous applications in similar AAM-OPC systems (Biondi,
2020). Figure 5.11 depicts such an equivalent circuit.
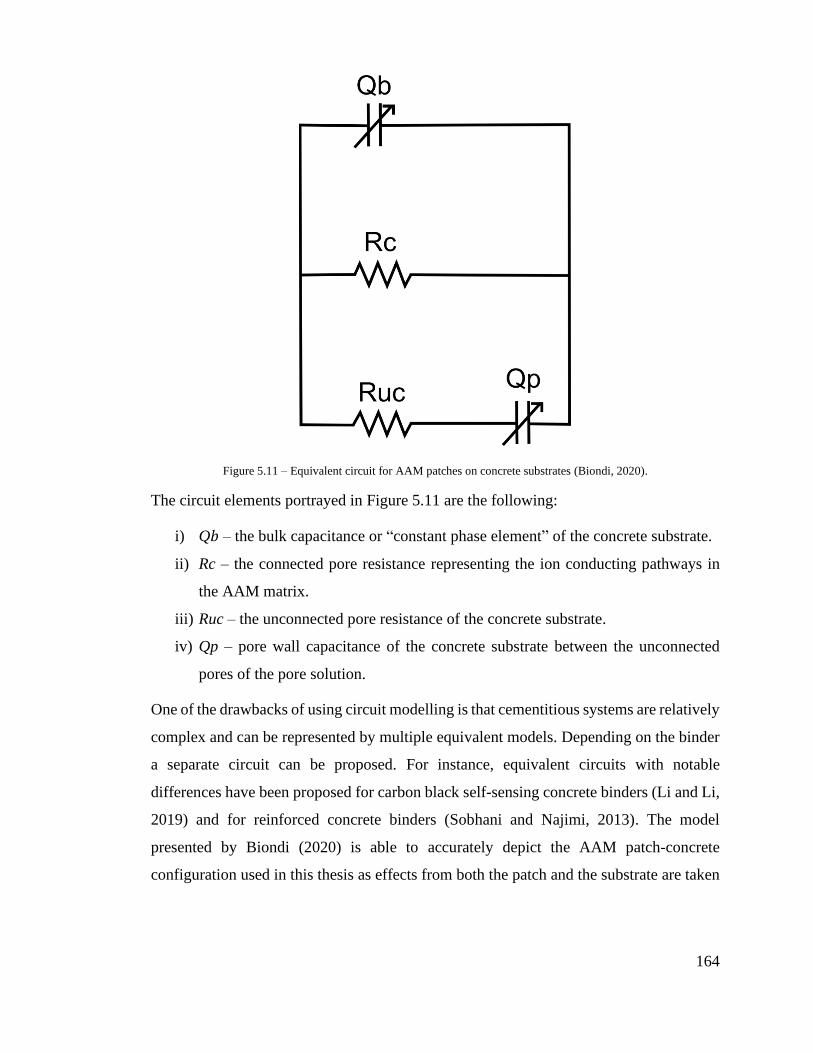
164
Figure 5.11 – Equivalent circuit for AAM patches on concrete substrates (Biondi, 2020).
The circuit elements portrayed in Figure 5.11 are the following:
i) Q𝑏 – the bulk capacitance or “constant phase element” of the concrete substrate.
ii) Rc – the connected pore resistance representing the ion conducting pathways in
the AAM matrix.
iii) Ruc – the unconnected pore resistance of the concrete substrate.
iv) Qp – pore wall capacitance of the concrete substrate between the unconnected
pores of the pore solution.
One of the drawbacks of using circuit modelling is that cementitious systems are relatively
complex and can be represented by multiple equivalent models. Depending on the binder
a separate circuit can be proposed. For instance, equivalent circuits with notable
differences have been proposed for carbon black self-sensing concrete binders (Li and Li,
2019) and for reinforced concrete binders (Sobhani and Najimi, 2013). The model
presented by Biondi (2020) is able to accurately depict the AAM patch-concrete
configuration used in this thesis as effects from both the patch and the substrate are taken

165
into account. Additional circuit elements can be added though to incorporate cement
hydration products at the interface between the patch and the substrate similar to concrete-
steel models that have been proposed by Sobhani and Najimi (2013). Overall while
equivalent circuits allow for better understanding of AAM patches, this could result in
complex models with multiple circuit elements that may ultimately play a small role in
the actual sensing performance of the patch.
5.3.2 Printed sensor: impedance response to temperature
Impedance measurements are affected by the frequency voltage is applied.
Commercial impedance interrogators provide a large range of available frequencies
(10 μHz – 1 MHz) that can be applied in electrochemical impedance spectroscopy. The
frequency range that was selected in this thesis was based on the repeatability and
consistency of the impedance readings between sensing cycles. The investigation for the
‘optimal’ frequency range was based on a series of trial and error. After multiple trials it
was found that data contained noise at frequencies below 10 Hz. This can be explained by
electrical interference by devices that are in same vicinity as the impedance interrogator.
Low frequencies can also cause electrolysis promoting ion migration to one electrode thus
causing corrosive chemical reactions. Moreover, it was observed that frequencies above
100 kHz often led to scattered results which can be explained due to inductance from
electrode cross-talk. Taking all this into account the frequencies that were used for
temperature sensing were between 10 Hz – 100 kHz.
Figure 5.12a and Figure 5.12b present a typical Nyquist plot for a printed patch and an
AAM cube at room temperature (20 °C), for frequencies between 10 Hz and 100 kHz
respectively. The Nyquist plot for the AAM cube is similar to the conventional Nyquist
plot displayed in Figure 2.5. On the contrary, as can be seen the AAM patch does not
exhibit the same behavior. In this case, a semi-circle is not present and the imaginary
impedance of the sensor is almost negligible. Therefore, the patch displays low
capacitance behavior and essentially act as a pure resistor in this frequency range. This
signals that there is small difference in the phase between the applied voltage and
measured current and that the material possess poor energy storage characteristics. This is

166
somewhat unexpected as AAM have been reported to attain high capacitance and have
been used as supercapacitors (Xu and Zhang, 2017) and as energy storage units (Saafi et
al., 2018). That said the aforementioned applications focused on standalone AAM binders
rather than overlays applied onto concrete substrates. Capacitance has been mentioned to
be affected by the moisture content in cementitious binders (Chung, 2021). As such low
capacitance in this investigation could indicate high moisture content in the AAM patch
(Biondi et al., 2020). This could be a result of excess water that remained on the concrete
surface after pre-wetting. It could also be hypothesized that the capacitance and the
Nyquist plot (e.g. no semi-circle) are influenced by hydration products that are developed
at the interface between the patch and the concrete substrate, similar to what has been
reported in concrete-steel interfaces (Sobhani and Najimi, 2013). These however, are
speculations and additional research is required. Overall the capacitance of the AAM
patch is of secondary importance as the main focus of this thesis is to analyze the AAM
sensor using the real or modulus impedance. AC voltage has been selected to prevent
electrolysis rather than exploring additional functions of AAM sensors. Even though it is
not as ideal, DC voltage could also be used to conduct this experiment. While
multifunctionality of AAM is within the realm of the work that is carried out, investigating
the capacitance behavior of AAM sensors currently lies outside the scope of this thesis.

167
(a) (b)
Figure 5.12 – Typical Nyquist plot for the frequency range 10 Hz – 100 kHz of a) printed patch. Inset displays
magnified version of plot b) metakaolin AAM cube.
Figure 5.13 and Figure 5.14 depict the Nyquist and Bode plot respectively for frequencies
between 10 Hz – 105 Hz for the down cycle (see Section 5.2.3 for definition of down
cycle). As shown, a clear shift in impedance can be observed for the different temperatures
in both the Nyquist and Bode plot for each cycle. The sensor’s response is in accordance
to the expected behaviour of AAM under these circumstances. In specific, the impedance
decreased with increasing temperature and increased when the temperature decreased. The
change in impedance under these conditions can be attributed to ion mobility in the pores
of the patch. This behaviour is in accordance to previous authors (MacKenzie and Bolton,
2009; Perry et al., 2015; Saafi et al., 2016).

168
Figure 5.13 – Nyquist plot for each temperature during a down cycle.
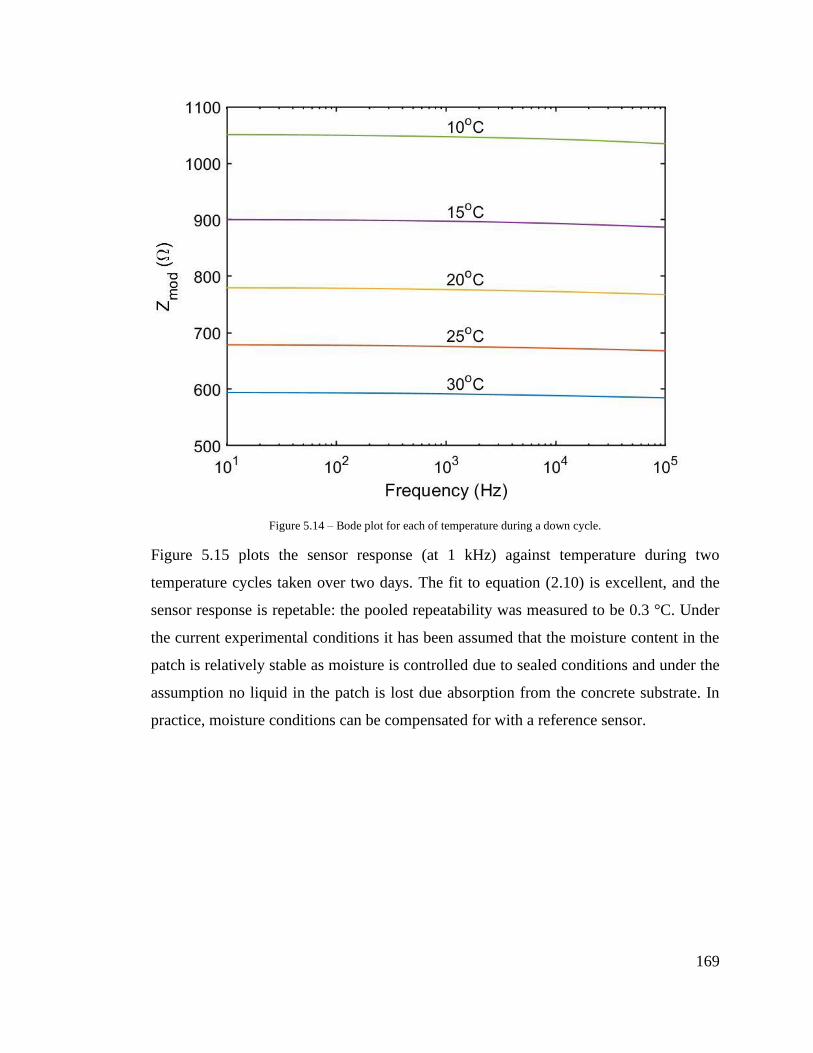
169
Figure 5.14 – Bode plot for each of temperature during a down cycle.
Figure 5.15 plots the sensor response (at 1 kHz) against temperature during two
temperature cycles taken over two days. The fit to equation (2.10) is excellent, and the
sensor response is repetable: the pooled repeatability was measured to be 0.3 °C. Under
the current experimental conditions it has been assumed that the moisture content in the
patch is relatively stable as moisture is controlled due to sealed conditions and under the
assumption no liquid in the patch is lost due absorption from the concrete substrate. In
practice, moisture conditions can be compensated for with a reference sensor.

170
Figure 5.15 – Normalised impedance response of AAM patch to temperature during four temperature cycles. Shaded
region shows the 95% confidence interval of the fit for 10 impedance measurements for one sample.
5.3.3 Adhesion results
The average bond strength between heat cured printed patches on concrete
substrates for 5 samples was 0.6 ±0.16 MPa. The failure type in all AAM overlays was
adhesion failure (failure at the interface between the substrate and the repair). The bond
strength between heat cured samples and ambient cured samples investigated in Chapter
4 was relatively similar for 6 days of curing. Figure 5.16 presents the bond strength for
heat cured and ambient cured overlays. Ambient cured samples presented slightly higher
strength, which again could be due to the curing issues explained in Section 3.4.3.
Considering that heat curing does not provide any additional benefits, it can be concluded
both heat and ambient curing can be equally considered when deploying the patches.
Overall though the strength was relatively low with high variability and therefore a
definitive claim on the adhesion strength cannot be made.
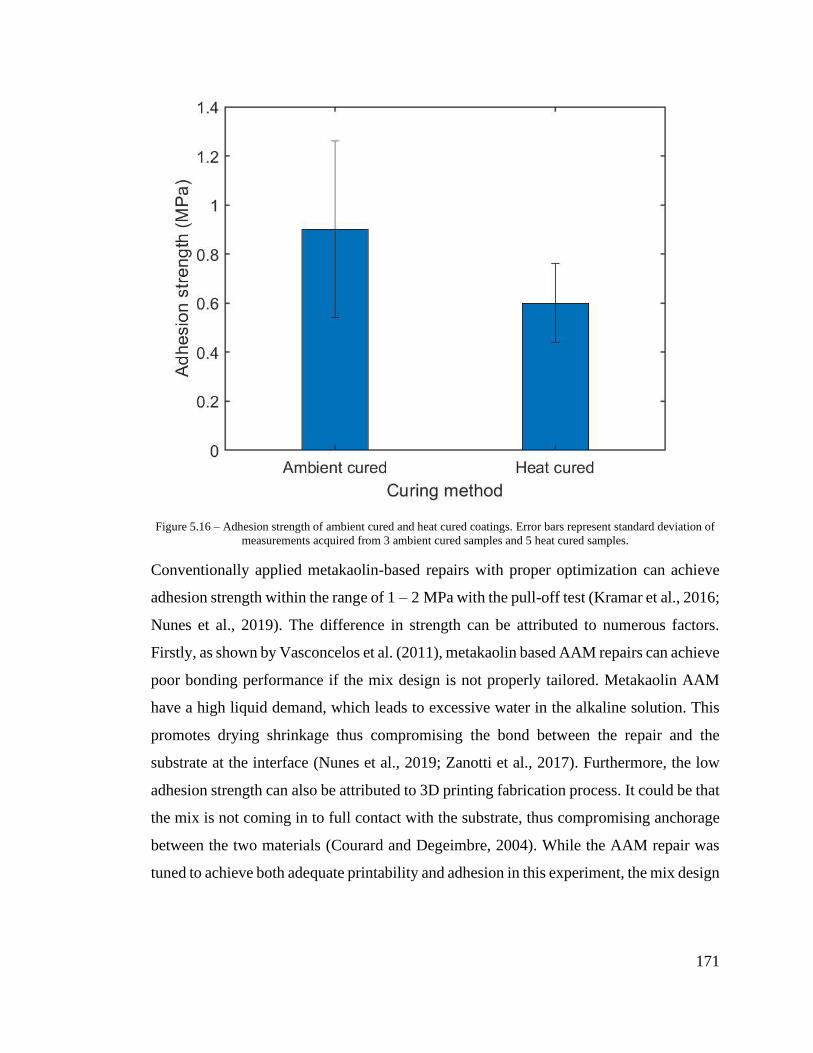
171
Figure 5.16 – Adhesion strength of ambient cured and heat cured coatings. Error bars represent standard deviation of
measurements acquired from 3 ambient cured samples and 5 heat cured samples.
Conventionally applied metakaolin-based repairs with proper optimization can achieve
adhesion strength within the range of 1 – 2 MPa with the pull-off test (Kramar et al., 2016;
Nunes et al., 2019). The difference in strength can be attributed to numerous factors.
Firstly, as shown by Vasconcelos et al. (2011), metakaolin based AAM repairs can achieve
poor bonding performance if the mix design is not properly tailored. Metakaolin AAM
have a high liquid demand, which leads to excessive water in the alkaline solution. This
promotes drying shrinkage thus compromising the bond between the repair and the
substrate at the interface (Nunes et al., 2019; Zanotti et al., 2017). Furthermore, the low
adhesion strength can also be attributed to 3D printing fabrication process. It could be that
the mix is not coming in to full contact with the substrate, thus compromising anchorage
between the two materials (Courard and Degeimbre, 2004). While the AAM repair was
tuned to achieve both adequate printability and adhesion in this experiment, the mix design
172
was not optimized for achieving maximum levels of bond strength, due to the trade-offs
discussed in Section 5.2.5.
Another crucial factor that needs to be taken into account is the concrete substrate. In
typical 3D printing applications, the printing bed should be level and smooth to ensure
proper stability during printing. In the current application, the effective printing bed is the
concrete substrate, which as previously mentioned in Section 5.2.6, was wired brushed to
increase surface roughness to promote greater adhesion between the repair and the
substrate. Even though wire brushing could lead to inconsistencies in surface profiles (see
Figure 4.13), in samples where a rough surface was achieved, this practice could
simultaneously compromise adhesion in extrusion applications. As the head distance is
measured from the highest peak of the surface in order to avoid nozzle obstruction, apart
from gaps in printing as mentioned in Section 5.2.7, the contact between the two materials
will not be uniform. This issue is even more prevalent the rougher the surface is. As
illustrated in Figure 5.17 the AAM filament may not come into full contact with the
substrate when the material is deposited onto a valley (area between two peaks on the
surface). This could result into air pockets in the repair and due to the lack of compaction
in the extrusion process this could cause an adverse effect on its bonding performance
(Silfwerbrand et al., 2011).

173
Figure 5.17 – Non-uniform contact due to the rough surface of the concrete substrate.
A potential solution to work around rough surfaces would be to employ a nozzle with a
diameter larger than to the height difference between the highest and lowest peak of the
surface to avoid the formation of air pockets. Moreover, this allows greater surface
coverage which would minimize layers and print paths thus lessening the formation of
gaps in the material formed due to printing and subsequently leading to a stronger object
(Lim et al., 2016; Zareiyan and Khoshnevis, 2017). In addition, setting a smaller layer
height than the nozzle diameter allows for greater compaction between layers (Bos et al.,
2016) which could enable greater contact between the patch and the substrate. Finally,
digitally scanning the surface profile and creating a respective G-code file could properly
tailor the repair to the respective substrate. Further investigation is required to optimize
the mix design and printing process to allow for a more suitable repair solution.
5.4 Conclusions
In this chapter a 3D printed, multifunctional AAM sensor-repair for concrete
structures was presented. The temperature sensing response of the printed sensor was
outlined and adhesion was investigated. The key findings of this chapter are the following:
• An equivalent circuit for the AAM sensor was proposed. The circuit contained
resistors and capacitors to account for the AAM patch and concrete substrate in
the system.

174
• Extruding objects onto uneven concrete surfaces and increasing print speed led to
low print quality. The method of electrode installment could also impact the
integrity of the AAM patch.
• The performance of the sensor was in accordance with the expected behaviour of
AAM dependence to temperature. The impedance of the AAM patch decreases as
temperature increases and the impedance increases as temperature decreases.
• The temperature sensing performance of the patch was characterized using an
exponential fit. The resolution of the AAM sensor was 0.1 °C with a repeatability
of 0.3 °C.
• The adhesion of the printed patch to the concrete substrate was 0.6 MPa. It was
found that heat curing did not improve the bond strength when compared to
ambient curing. Overall, the bond strength achieved was lower than a typical AAM
repair due to low surface roughness and limitations in the 3D printing process itself.
Further investigation is required to optimize 3D printing for repair and sensing
applications. Chapter 6 will explore the strain sensing capabilities of the printed coatings.

175
Chapter 6 3D printed strain-sensing
coatings for concrete structures
In this chapter the strain sensing response of printed alkali activated coatings is
investigated. Their sensing capability under compression, tension and 4-point bending are
presented. The importance of adhesion and electrode effects are also discussed.
6.1 Introduction
Continuing from Chapter 5, this chapter expands on the author’s research into self-
sensing alkali activated materials (AAM). Historically, applications have primarily
focused on the fabrication of new construction elements. Developing cementitious
materials to monitor existing infrastructure is uncommon. Conventional sensing
applications involve the fabrication of structural elements such as beams and cubes.
Alternative types of cementitious sensing techniques such as embedded cement-based
sensors (Azhari and Banthia, 2012; Ding et al., 2019a; Saldarriaga et al., 2021) and
sensing overlays (Baeza et al., 2013; McAlorum et al., 2021; Perry et al., 2015; Vlachakis
et al., 2020) have also been investigated in this field. A short description of each type of
sensor follows.

176
6.2 Types of self-sensing cementitious materials
6.2.1 Structural elements
This category encompasses the majority of cement-based strain sensing
applications for both OPC and AAM sensing applications. In this scenario, the structural
element and the sensing element refer to the same object. These applications focus
primarily on the fabrication of concrete cubes and beams (Abedi et al., 2020;
D’Alessandro et al., 2020; Sun et al., 2017).
6.2.2 Embedded cement-based sensors
In regards to embedded cement-based sensors, the sensor and the structural
element refer to two different objects (Han and Ou, 2007). This approach involves
embedding a cement-based sensor (typically a small cube or beam) inside a larger cement-
based element (such as a larger cube, beam or column), which has not been designed for
sensing purposes. The embedded sensor is fabricated beforehand and placed inside the
mould of the substrate during casting. Once the new substrate has fully cured (with the
sensor embedded), the sensor is able to detect strain variations as it will undergo similar
strain changes as the parent substrate. The sensing performance of the embedded sensor
as a standalone object and as an embedded sensor may differ due to the interaction and
confined deformation from the concrete element (Ding et al., 2019a; Wang et al., 2018).
While adjusting the embedded sensor to match the properties of the substrate is not
essential, mismatch between the properties of the two elements can cause additional
stresses to occur under uniaxial loading (Ding et al., 2019b; Xiao et al., 2011). To the best
of the author’s knowledge, only OPC based applications have been reported for this
application.
6.2.3 Cementitious sensing coatings
Cementitious sensing coatings can be considered as cement-based sensing sheets
used primarily for strain sensing rather than damage localization. Instead of adhering a
manufactured sheet onto a surface, an overlay with sensing properties is applied onto an
existing structure. The overlay is able to detect strain in the substrate from strain
transferring from one element to the other. Strain transfer and thus the sensing

177
performance of these coatings is governed by the degree of adhesion between the two
materials. Higher strain transmission can be achieved with a stronger bond (Gerber et al.,
2018). Higher sensing performance can also be achieved in cement-based sensing overlays
with low thickness (Baeza et al., 2013).
Table 6.1 presents a comparison between sensing cementitious coatings, embedded
cement-based sensors and sensing sheets. Compared to other types of cementitious
sensing materials, coatings can provide multiple advantages. The primary focus of sensing
coating is to monitor existing infrastructure. As a result, rather than constructing structural
members with sensing capabilities, coatings can be applied onto designated areas for
monitoring purposes while using less material and reducing costs. Furthermore, compared
to embedded sensors, coatings provide a simpler means of installation for both existing
and new infrastructure. Their field of application is also wider as they can be applied onto
steel structures (Temuujin et al., 2011) and pavements (Alanazi et al., 2016) if tailored
accordingly. Lastly sensing coatings can also provide flexibility in terms of monitoring as
apart from strain sensing, they can be applied onto larger areas with relative ease and used
for damage detection.
Table 6.1 – Comparison between 'supportive' sensing elements.
Sensing coating Embedded sensor Sensing sheet
Material Cementitious Cementitious Carbon/Epoxy/Plastic
Fabrication sequence After parenting
substrate
Before parenting
substrate
After parenting
substrate
Substrate Concrete/pavement/steel Concrete/pavement Concrete/pavement/steel
Tailoring Essential Ideal No
Application Strain/damage Strain/damage Damage
Additional functions Nonstructural repair – Coating
Bond Chemical/mechanical Embedded Epoxy
The importance of material preparation is crucial in sensing overlays. As mentioned in
Chapter 4 & 5, if coatings are not properly tailored, this can result in high levels of
shrinkage which could lead to either delamination or cracks. This in turn can compromise

178
the sensing integrity of the coatings. Compared to the aforementioned sensing elements,
cementitious sensing overlays have not been investigated in great depth. In this chapter
the following experimental investigation is carried out:
• The strain sensing of AAM patches under compression, tension and 4-point
bending is explored.
• Repeatability issues of AAM patches are addressed.
• The strain sensing performance of AAM patches is characterized.
• Parameters affecting strain sensing are pointed out recommendations for this
technology are made.
6.3 Methodology
The following sections outline the experimental procedure followed to fabricate
AAM coatings and investigate their strain sensing performance. Material fabrication (Mix
design 2) and mixing sequence were based on the methodology outlined in Chapter 3.
As mentioned in Section 2.3.3 the loading rate, temperature and humidity impact the strain
sensing performance of AAM binders. In OPC applications it is common to dry the
samples prior to testing to remove the excess water in the matrix to avoid polarization and
increase sensing performance (Dong et al., 2019; Hong et al., 2018; Siad et al., 2018). For
AAM, water has been speculated to be necessary to facilitate ion migration. Completely
dry AAM samples have been stated to be incapable of showcasing a sensing response
(Lamuta et al., 2016). Therefore, drying samples is not a common practice in AAM
sensing. Considering the above the following considerations were made in the
experimental investigation:
• Loading rate was kept constant.
• Experiments were conducted in a testing environment with stable temperature and
humidity.
• Samples were not dried and were wrapped in plastic film to avoid liquid
evaporation from the sample over the course of the tests.

179
Even if these precautions are taken though, the sensing response of AAM can present great
variability. Very high sensitivities – gauge factors between 1000-2000 (Lamuta et al.,
2017; Ma et al., 2020) and at the same time much lower sensitivities – gauge factors
between 10-60 (D’Alessandro et al., 2020; Saafi et al., 2014) have both been reported for
filler free applications (as a reminder, filler free refers applications refer to binders that do
not employ electrically conductive filler e.g. carbon fiber).
6.3.1 Substrate preparation
AAM patches were printed onto concrete and glass fiber reinforced plastic (GFRP)
substrates following the methodology presented in Chapter 4. Prior to printing the surfaces
were required to be properly prepared to ensure adhesion with the printed patches.
6.3.1.1 Concrete substrates
The concrete substrates that were used in this chapter were 100 mm cubes, 50 mm
cubes and 40 mm × 40 mm × 200 mm single reinforced beams of the same concrete mix
design presented in Table 4.2. A single steel rod with 6 mm thickness was used as
reinforcement for the beams. AAM chemically bond with OPC concrete as the calcium
ions in the substrate are able to charge balance the aluminium ions in the AAM binder.
(Pacheco-Torgal et al., 2008). The substrates were prepared following the surface
preparation procedure presented in Section 4.2.4.5.
6.3.1.2 Glass fiber reinforced plastic sheets
GFRP sheets were cut into suitable tensile testing pieces. The dimensions of the
GFRP substrates are presented in Figure 6.1. The material properties as provided by the
manufacturer are displayed in Table 6.2. GFRP was selected as it is a nonconductive
material and presents a linear stress-strain response in the loading range investigated in
this chapter (Zhang et al., 2018). While a steel substrate is a more traditional route to
tensile testing, complete electrical insulation between a steel substrate and an AAM layer
is difficult to achieve. Current flow in a steel test piece (and indeed the grips of the tensile
tester and the load cell) would make these part of the sensing system. AAM and GFRP
sheets present poor adhesion compatibility, therefore sand was epoxied onto the ‘neck’ of
the tester (area between A × W as portrayed in Figure 6.1) in which the patches were to

180
be deposited. This allowed the AAM patches to mechanically interlock with the sand and
was achieve an adequate bond with the GFRP sheets23. The sand-epoxy layer was kept
thin (2 mm – 3 mm) to avoid as much strain loss as possible.
Figure 6.1 – Schematic drawing of glass reinforced fiber plastic tensile tester piece.
Where: A=60 mm, B=50 mm, C=50 mm, L=200 mm, T=8 mm and W=35 mm.
Table 6.2 – Specifications of glass reinforced fiber sheet as provided by manufacturer.
Modulus of elasticity Tensile strength Elongation Density
5.5 GPa 160 MPa 3.5-5% 1.35 g/cm3
6.3.2 3D printing and data preparation
3D printing and data preparation in the chapter were based on the procedures
outlined in the Chapters 4 and 5. With that in mind, the following data files were prepared:
• Square patch: 90 mm × 90 mm for 100 mm concrete cubes
• Square patch: 45 mm × 45 mm for 50 mm concrete cubes
• Rectangular patch: 35 mm × 50 mm for GFRP and concrete beams.
Each patch consisted of two layers, a single perimeter and was printed with 100%
rectilinear density. The print speed was set at 30 mm/s and the layer height was 0.66 mm.
The following considerations were made when printing on each individual substrate:
23 The purpose of this approach is to showcase the sensing capability of AAM rather than presenting the compatibility
between AAM and GFRP.

181
Concrete cubes: Patches were extruded while avoiding printing close to the edges. This
was to ensure that strain applied to the patch occurred solely from load transferring from
the concrete cube rather than being directly loaded from the testing apparatus.
GFRP: Patches were printed onto the ‘neck’ of the specimen, within regions A × W, as
displayed in Figure 6.1 to ensure that maximum tensile strain was being detected.
Concrete beams: The patches were printed in the region where maximum displacement
occurs according to bending theory for a rectangular beam under 4-point bending. An
illustration of the position of the patches in relation to the 4-point bending setup is
presented in Figure 6.2.
Figure 6.2 – Patch placement and 4-point bending setup.
Where L=150 mm, a=25 mm and d=40 mm.
6.3.3 Electrodes and curing
Once each patch was extruded onto the substrates mentioned in Section 6.3.1,
stainless steel electrodes were inserted according to the Van der Pauw (VDP)
configuration (van der Pauw, 1958). As the VDP method is able to provide average
measurements, this can also reduce the effects of potential uneven stress distributions in
the substrate and thus eliminate any sort of localized behavior. In this chapter, stainless
steel tape was used as probes instead of wires as in Chapter 5. Tape allowed greater contact
with the impedance analyzer’s connecting clips thus preventing potential slippage during
testing. Moreover, as larger patches were printed for strain interrogation compared to

182
temperature sensing, there was greater distance between electrodes. This reduced the risk
of tensile stresses developing from the tape such that would affect the structural integrity
of the patch.
Literature suggests that both heat cured (Saafi et al., 2018) and ambient cured
(D’Alessandro et al., 2020) binders can be used in strain sensing applications. Therefore,
once the electrodes were inserted, the samples were stored in sealed containers and two
curing regimes were followed:
• Cured in an oven at 40 oC for 24h to accelerate alkaline activation and then
transferred to an environmental chamber at 17 oC until testing.
• Cured in an environmental chamber at 17 oC for at least 28 days until testing.
6.3.4 Electrode configuration
Electrode connection is critical when using the VDP method as it will have a direct
impact on the electrical response of the samples (Yao et al., 2017). Under compression
and tension, the probes were connected such that the applied voltage and measured current
were parallel to the applied load. This will allow the proper interpretation of the sensing
results following the current understanding of self-sensing materials. Figure 6.3a displays
the typical electrode configuration for compression and tension. Voltage was applied
across electrodes 1 and 4 and the current was measured across electrodes 2 and 3. This
electrode orientation was denoted as ‘Layout 1’.
Under compression a second layout orientation, denoted as ‘Layout 2’ was investigated
in which the voltage and current were both perpendicular to the applied load. Figure 6.3b
displays electrode layout 2 in which voltage is applied across electrodes 1 and 2 and the
current is measured across 3 and 4.

183
(a)
(b)
Figure 6.3 – Electrode orientation of patches a) under compression, layout 1 voltage and current are parallel to applied
force (left), layout 2 voltage and current are perpendicular to applied force (right) b) under tension, voltage and
current are parallel to applied force.
Figure 6.4 presents the electrode connection for patches printed onto concrete beams.
Under 4-point bending, the voltage and measured current were applied across the longer
dimension of the patch. This was to ensure that the measurement followed the maximum
deformation of the beam under 4-point bending.

184
Figure 6.4 – Electrode arrangement for patches printed on concrete beams. Voltage and current were applied on the
longer dimension of the patch.
6.3.5 Loading schemes and data acquisition
Prior to testing, the samples were wrapped in a thin plastic film to reduce moisture
fluctuations during testing. The samples were also removed from the plastic containers
and were placed in the same vicinity as the loading cell for at least 12h before testing to
allow for greater stabilization. Due to the prolonged time of the strain sensing tests, the
temperature of the testing area was measured with an external temperature and humidity
sensor to ensure a constant testing environment. The mechanical tests conducted in this
chapter are portrayed in Figure 6.5.
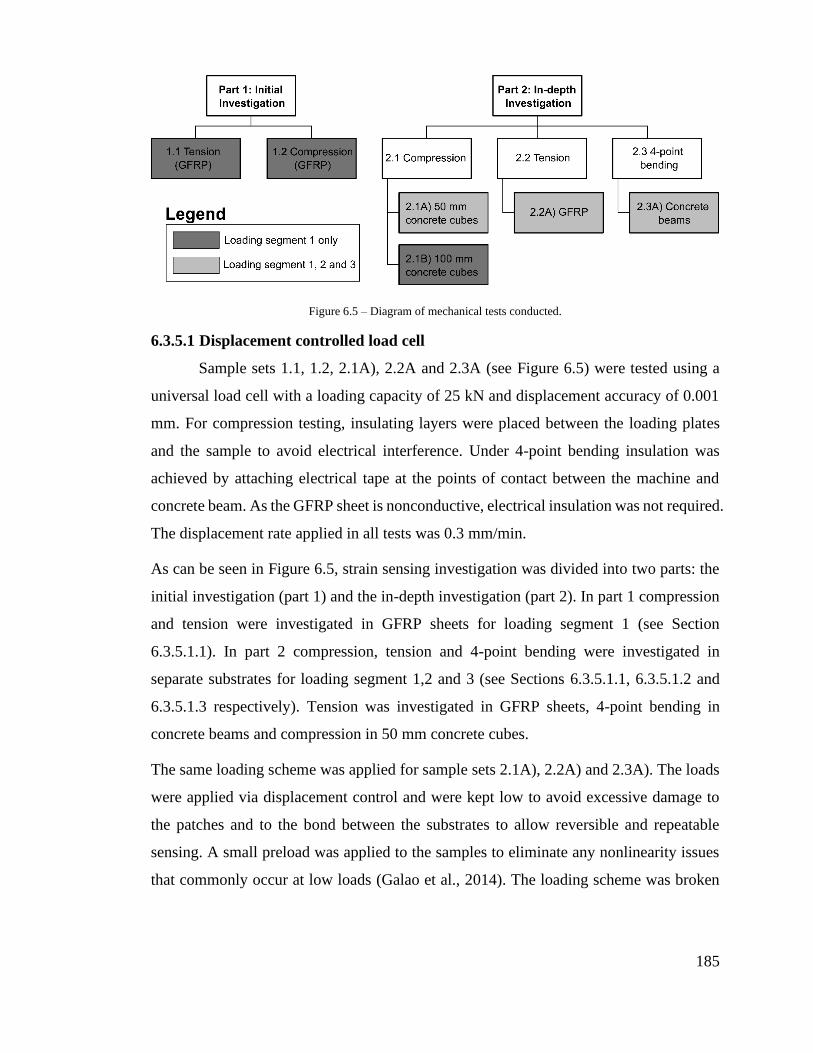
185
Figure 6.5 – Diagram of mechanical tests conducted.
6.3.5.1 Displacement controlled load cell
Sample sets 1.1, 1.2, 2.1A), 2.2A and 2.3A (see Figure 6.5) were tested using a
universal load cell with a loading capacity of 25 kN and displacement accuracy of 0.001
mm. For compression testing, insulating layers were placed between the loading plates
and the sample to avoid electrical interference. Under 4-point bending insulation was
achieved by attaching electrical tape at the points of contact between the machine and
concrete beam. As the GFRP sheet is nonconductive, electrical insulation was not required.
The displacement rate applied in all tests was 0.3 mm/min.
As can be seen in Figure 6.5, strain sensing investigation was divided into two parts: the
initial investigation (part 1) and the in-depth investigation (part 2). In part 1 compression
and tension were investigated in GFRP sheets for loading segment 1 (see Section
6.3.5.1.1). In part 2 compression, tension and 4-point bending were investigated in
separate substrates for loading segment 1,2 and 3 (see Sections 6.3.5.1.1, 6.3.5.1.2 and
6.3.5.1.3 respectively). Tension was investigated in GFRP sheets, 4-point bending in
concrete beams and compression in 50 mm concrete cubes.
The same loading scheme was applied for sample sets 2.1A), 2.2A) and 2.3A). The loads
were applied via displacement control and were kept low to avoid excessive damage to
the patches and to the bond between the substrates to allow reversible and repeatable
sensing. A small preload was applied to the samples to eliminate any nonlinearity issues
that commonly occur at low loads (Galao et al., 2014). The loading scheme was broken

186
down into three sequential segments, Segment 1, Segment 2 and Segment 3. An
explanation of each loading pattern follows.
6.3.5.1.1 Segment 1
A qualitative representation of the loading pattern followed in Segment 1 is
presented in Figure 6.6. The samples were loaded in 5-step increments and then unloaded
in 5-step increments. This sequence was regarded as one cycle. The load cell paused at
each load for 1 minute to allow the data analyser (Gamry Interface 1000) to acquire the
necessary data. During each load, the analyser ran in potentiostatic mode in which the
impedance of the samples was measured by applying 10 mV voltage for frequencies
between 1000 Hz and 10 kHz. Three measurements were acquired for each load and an
average value for each frequency was able to be extracted. Segment 1 consisted of 6 cycles.
The loads applied for each substrate follow:
• Compression (50 mm cube), four-point bending and tension: 0 – 0.10 mm – 0 with
a step of 0.02 mm.
• Tension: 0 – 0.04 mm – 0 with a step of 0.008 mm.
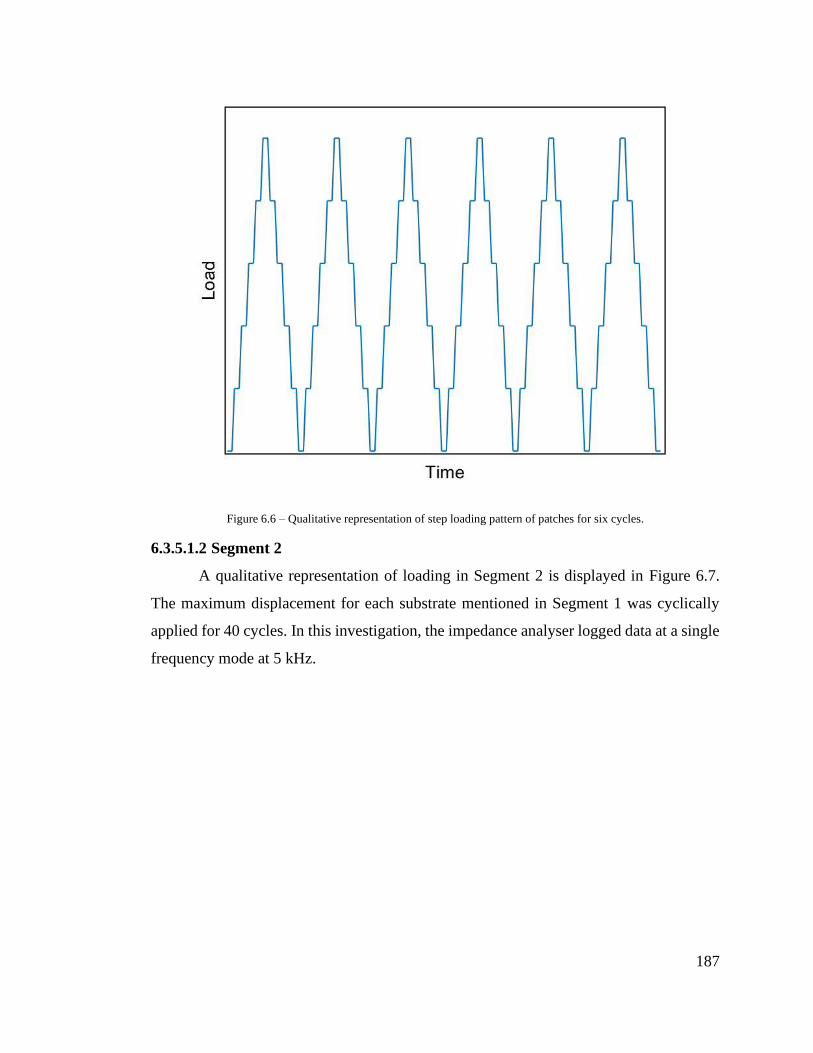
187
Figure 6.6 – Qualitative representation of step loading pattern of patches for six cycles.
6.3.5.1.2 Segment 2
A qualitative representation of loading in Segment 2 is displayed in Figure 6.7.
The maximum displacement for each substrate mentioned in Segment 1 was cyclically
applied for 40 cycles. In this investigation, the impedance analyser logged data at a single
frequency mode at 5 kHz.

188
Figure 6.7 – Qualitative representation of cyclic loading pattern of samples for 40 cycles.
6.3.5.1.3 Segment 3
The loading pattern and electrical application followed in Segment 1 is repeated
for this loading segment.
6.3.5.2 Loading schemes and data acquisition for force controlled loading cell
Patches printed on 100 mm cubes (sample set 2.1B)) were tested using a force
controlled hydraulic compression tester with a loading capacity of 500 kN and 2 kN
accuracy. The load measurements in this case were verified with a separate load cell. Two
nonconductive plates were placed between the sample and loadings plates for insulation.
The loading pattern and data acquisition in this application is based on loading Segment
1 mentioned in 6.3.5.1. The main difference in this application is the magnitude of the
applied load and the total number of cycles. The load patterns and their applications are
presented below. All loads were applied with a step of 10 kN.

189
• Strain sensing, loading scheme similar to Segment 1: 0 – 50kN – 0 for 6 cycles.
• Electrode effects: 0 – 40kN – 0 for 3 cycles.
• Adhesion effects: 0 – 100 kN – 0 for 3 cycles; 0 – 70 kN – 0 for 1 cycle.
6.3.6 Sensing response
The strain sensing capabilities of the samples were measured using the gauge
factor Equation (6.1) for the displacement-controlled tests. The strain for the 50 mm cubes
and GFRP sheets was calculated using Equation (6.2). The strain for the concrete beams
under 4-point bending was calculated using Equation (6.3).
GF= (Zi‒Z0) Z0⁄ ε⁄ , (6.1)
where Z0 = impedance at start of the test, Zi = impedance after a given strain change, and
ε = applied strain change.
ε=ΔL
L (6.2)
Where: ΔL=displacement acquired from loading apparatus; L=length of sample.
Where: δ=deflection acquired from loading apparatus; h=height of beam; L=length of
beam; a=distance between support and load point.
The stress sensing coefficient Equation (6.4) was calculated for the force-controlled tests.
Stress was calculated via Equation (6.5).
SSC= (Mi‒ M0) M0⁄ σ⁄ (6.4)
where σ = applied stress.
Where: F=applied force, A=cross-sectional area.
ε=12δh
(3L2‒ 4a2) (6.3)
σ=F
A (6.5)

190
In samples where repeatability was not achieved in loading Segment 3, the sensing
performance was evaluated using only the cycles that showcased repeatability. If a
constant change in impedance was not able to be achieved at all, the sensing performance
was evaluated taking into account only last load cycle. The number of cycles considered
for assessing the sensing performance for each application will be clearly stated.
6.4 Results and discussion
6.4.1 Sensing response
Heat cured samples were initially tested under compressive strain testing. Under
these circumstances, the samples did not showcase a response to the applied load. This
behavior was initially not expected as heat cured AAM binders have been used in sensing
applications before (Lamuta et al., 2017; Saafi et al., 2018). Considering that dry samples
have been stated to not showcase a response under load (Lamuta et al., 2016), it can be
speculated that water was driven out of the samples during curing and thus a better means
of sealing is required. As shown in Chapter 5, the bond strength is not significantly
influenced by the curing method. Taking this into consideration, heat cured samples were
not investigated and ambient curing is used for the remainder of this thesis.
6.4.1.1 Initial sensing response of printed AAM coatings
Figure 6.8 displays the change in impedance over time for sample set 1.1 and 1.2.
The reader is referred to Figure 6.5 for a recap of how sample sets are defined. The change
in impedance aligned the expected behavior of AAM in both loading directions; the
impedance increased in tension and decreased in compression (see Section 2.3.3). Under
both loading directions, repeatability and reversibility issues were evident. The impedance
of the sample at zero load increased upon each load cycle. In order to properly assess the
sensing performance of the patches a repeatable sensing performance is required.
Therefore, additional load cycles were applied the samples as this is able to lead to more
consistent behavior (Deng et al., 2019). Tension was assessed through GFRP sheets and
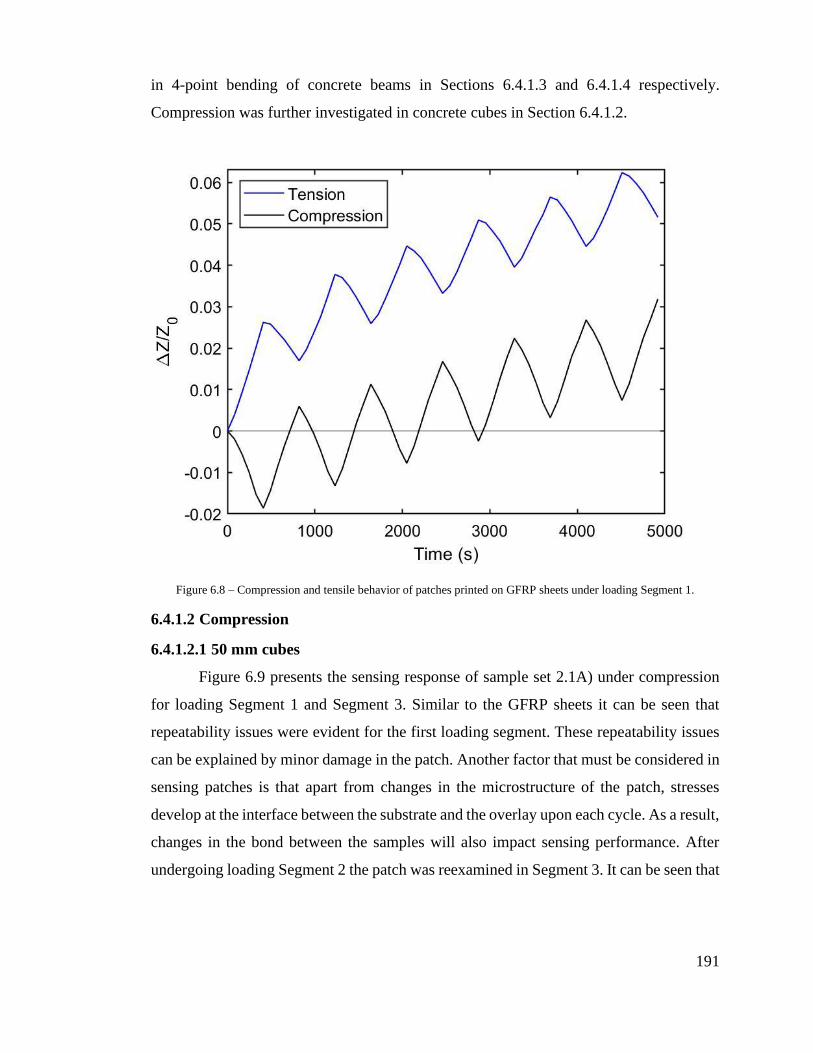
191
in 4-point bending of concrete beams in Sections 6.4.1.3 and 6.4.1.4 respectively.
Compression was further investigated in concrete cubes in Section 6.4.1.2.
Figure 6.8 – Compression and tensile behavior of patches printed on GFRP sheets under loading Segment 1.
6.4.1.2 Compression
6.4.1.2.1 50 mm cubes
Figure 6.9 presents the sensing response of sample set 2.1A) under compression
for loading Segment 1 and Segment 3. Similar to the GFRP sheets it can be seen that
repeatability issues were evident for the first loading segment. These repeatability issues
can be explained by minor damage in the patch. Another factor that must be considered in
sensing patches is that apart from changes in the microstructure of the patch, stresses
develop at the interface between the substrate and the overlay upon each cycle. As a result,
changes in the bond between the samples will also impact sensing performance. After
undergoing loading Segment 2 the patch was reexamined in Segment 3. It can be seen that

192
the sensing performance is able to reach stability within this loading segment. Compared
to standalone sensing objects, it can be speculated that a higher number of cycles is
required in patches as the sensing behavior is influenced by the patch, substrate and bond
between the two. This phenomenon is similar in embedded sensors in which the sensors
require multiple cycles to conform to the parenting substrate (Sun et al., 2014).
Nonlinear behavior can be detected at early loading stages and near the peak of the
maximum load applied. At high strain values this behavior could indicate that the total
load applied is exceeding the elastic region of the patch. Nonlinear behavior is quite
common at low loads (Rovnaník et al., 2019a; Sun et al., 2014). This may indicate that a
higher preload was required.
Figure 6.9 – Sensing response of patch printed on 50 mm cube under compression for loading: (top) Segment 1
(cycles 1-6) and (bottom) loading Segment 3 (cycles 47-52).
Figure 6.10 presents the change in impedance as a function of applied displacement for
all six load cycles in Segment 3 for the sample presented in Figure 6.9. It can be seen that

193
despite the multiple loading cycles, the patches showcased hysteresis in upward and
downward loading. This is quite common in filler free samples compared to binders with
conductive additives (D’Alessandro et al., 2020).
Figure 6.10 – Hysteresis plot for one patch under compression for all six loading cycles of loading Segment 3.
Figure 6.11 displays the average fractional change in impedance against applied strain for
all six load cycles in Segment 3, the error bars are calculated using the standard deviation
of the three impedance measurements for each strain point for 6 total load cycles. The
gauge factor was calculated via the slope of the plot. The GF for this sample was measured
as 10. The change in impedance is not zero for zero strain due to slight offsets of the
patch’s impedance at the start of each load cycle. The average gauge factor for 2 samples
under compression was measured as 8.59±1.55.

194
Figure 6.11 – Average fractional change in impedance versus strain for patches under compression for six load cycles
in segment 3. Error bars represent standard deviation of six load cycles with three impedance measurements per cycle
for one sample.
6.4.1.2.2 100 mm cubes
The compressive strain response of larger concrete cubes was also investigated.
Figure 6.12 presents the electrical response of sample set 2.2B) under compressive load
(0-5 MPa) for 6 load cycles. The change in impedance remained fairly constant in this
application. As displacement measurements were not able to be acquired with this loading
apparatus, the stress sensitivity coefficient was used to characterize the sensing
performance of the patches. Figure 6.13 presents the change in impedance vs the applied
stress. The average sensing performance of 3 samples for this configuration was measured
as 0.033 ±0.008 MPa-1. When converting the GF in Figure 6.11 to SSC, the average
sensing performance is 0.014 MPa-1. A greater sensing capability can be observed for the
larger concrete substrates.

195
Figure 6.12 – Fractional change in impedance versus time for patches printed on 100 mm cubes.

196
Figure 6.13 – Average fractional change in impedance versus applied stress for 100 mm concrete cubes for 6 load
cycles. Error bars represent standard deviation of six load cycles with three impedance measurements per cycle for
one sample.
6.4.1.2.3 Adhesion effects
Adhesion plays a significant role in sensing coatings. While the patch may remain
intact, poor adhesion that can occur due to delamination which may decrease strain
transfer from the substrate to the sensing patch.
Figure 6.14 presents a patch that displays slight delamination at the corners. Figure 6.15
presents the change in impedance of the referred sample incrementally loaded up to
10 MPa and then incrementally unloaded for three load cycles. The sensing response of
this sample differed compared to samples presented in Figure 6.12. The change in
impedance at the beginning of each cycle initially increased which is opposite to what is
expected in compression. The sample was initially required to be loaded up to 4 MPa in
order for it to start behaving in an expected manner. Upon subsequent load cycles though,
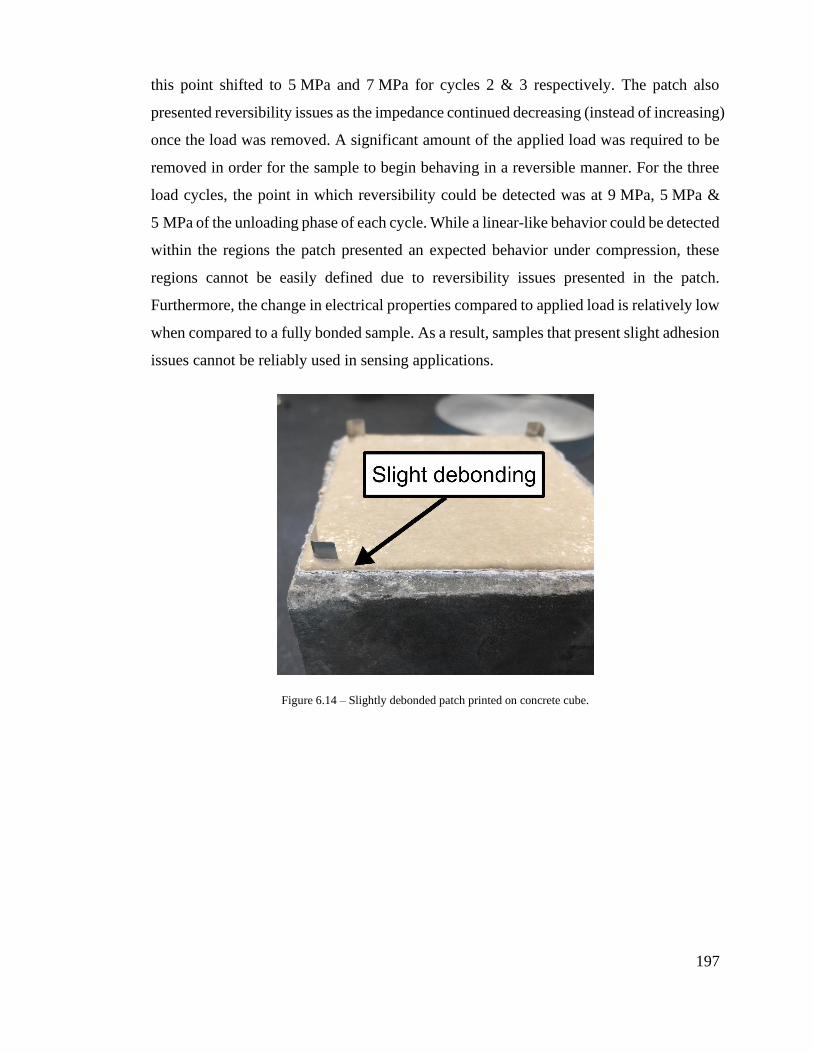
197
this point shifted to 5 MPa and 7 MPa for cycles 2 & 3 respectively. The patch also
presented reversibility issues as the impedance continued decreasing (instead of increasing)
once the load was removed. A significant amount of the applied load was required to be
removed in order for the sample to begin behaving in a reversible manner. For the three
load cycles, the point in which reversibility could be detected was at 9 MPa, 5 MPa &
5 MPa of the unloading phase of each cycle. While a linear-like behavior could be detected
within the regions the patch presented an expected behavior under compression, these
regions cannot be easily defined due to reversibility issues presented in the patch.
Furthermore, the change in electrical properties compared to applied load is relatively low
when compared to a fully bonded sample. As a result, samples that present slight adhesion
issues cannot be reliably used in sensing applications.
Figure 6.14 – Slightly debonded patch printed on concrete cube.

198
Figure 6.15 – Fractional change in impedance versus time for one slightly debonded patch printed on 100 mm
concrete cube.
Samples that present major debonding issues do not showcase a strain sensing response.
Figure 6.16 displays the sensing response for such samples. One of the disadvantages of
sensing coatings is failure may not always be evident. As shown in this example, load is
being applied to the substrate but the patch is not able to indicate any external interference
due to delamination.
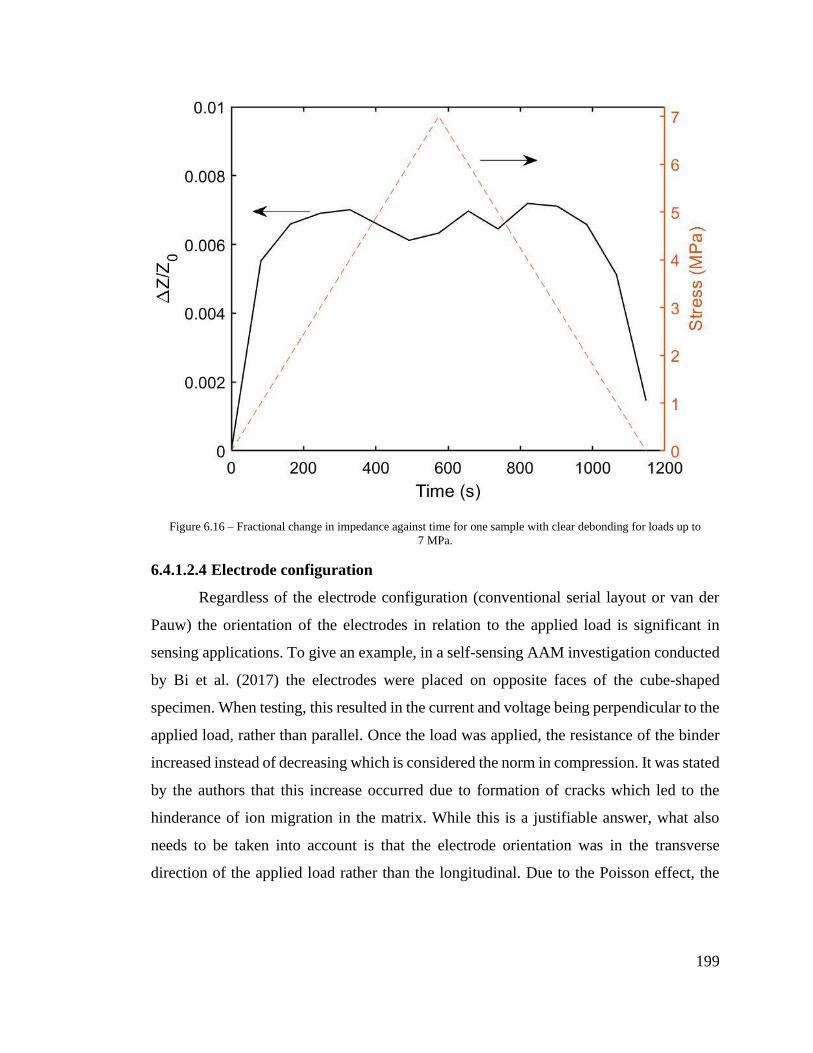
199
Figure 6.16 – Fractional change in impedance against time for one sample with clear debonding for loads up to
7 MPa.
6.4.1.2.4 Electrode configuration
Regardless of the electrode configuration (conventional serial layout or van der
Pauw) the orientation of the electrodes in relation to the applied load is significant in
sensing applications. To give an example, in a self-sensing AAM investigation conducted
by Bi et al. (2017) the electrodes were placed on opposite faces of the cube-shaped
specimen. When testing, this resulted in the current and voltage being perpendicular to the
applied load, rather than parallel. Once the load was applied, the resistance of the binder
increased instead of decreasing which is considered the norm in compression. It was stated
by the authors that this increase occurred due to formation of cracks which led to the
hinderance of ion migration in the matrix. While this is a justifiable answer, what also
needs to be taken into account is that the electrode orientation was in the transverse
direction of the applied load rather than the longitudinal. Due to the Poisson effect, the

200
transverse direction of the cube is in tension. Therefore, it can be speculated that the
electrodes were measuring the tensile behavior of the sample in which an increase in
resistance would be anticipated24.
In this investigation, the electrodes were connected using the Layout 2 configuration as
specified in Section 6.3.4. In this layout, the applied voltage and measured current were
perpendicular to the applied load. As can be seen in Figure 6.17, even though the sample
is under compression, the impedance increased as the current is flowing in the tensile
direction. For this investigation the maximum stress applied was 4 MPa and was only
tested for 3 cycles as this configuration led to measurement errors. For the 3 load cycles,
the maximum change in impedance remained fairly constant. Figure 6.18 presents the
fractional change in impedance versus the applied stress. The average sensing
performance for this configuration was measured as 0.014 MPa-1. This value is lower than
the compressive strain response of the patches.
24 This conclusion is drawn assuming the authors of the respective study fully insulated the testing specimens.

201
Figure 6.17 – Fractional change in impedance under compression for samples employing electrode layout 2.
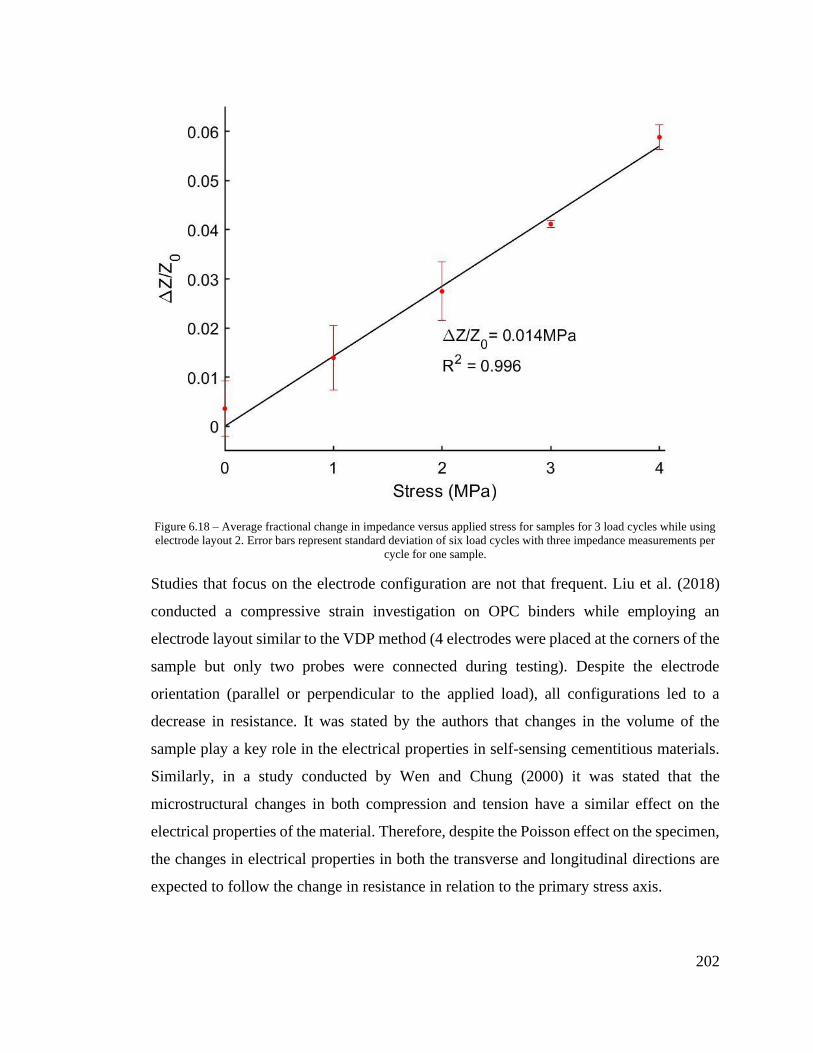
202
Figure 6.18 – Average fractional change in impedance versus applied stress for samples for 3 load cycles while using
electrode layout 2. Error bars represent standard deviation of six load cycles with three impedance measurements per
cycle for one sample.
Studies that focus on the electrode configuration are not that frequent. Liu et al. (2018)
conducted a compressive strain investigation on OPC binders while employing an
electrode layout similar to the VDP method (4 electrodes were placed at the corners of the
sample but only two probes were connected during testing). Despite the electrode
orientation (parallel or perpendicular to the applied load), all configurations led to a
decrease in resistance. It was stated by the authors that changes in the volume of the
sample play a key role in the electrical properties in self-sensing cementitious materials.
Similarly, in a study conducted by Wen and Chung (2000) it was stated that the
microstructural changes in both compression and tension have a similar effect on the
electrical properties of the material. Therefore, despite the Poisson effect on the specimen,
the changes in electrical properties in both the transverse and longitudinal directions are
expected to follow the change in resistance in relation to the primary stress axis.

203
The literature available is quite limited and a decisive conclusion cannot be made. The
study conducted in this thesis is based on overlays rather than structural objects and thus
direct parallels cannot be easily drawn. For this investigation the electrical response of
Layout 2 followed the expected change in regards to the Poisson effect. The VDP
electrode configuration was used in this investigation which allows for a greater coverage
of the surface when compared to serial arrangements. It can be speculated that the larger
coverage and average measurement provided by the VDP method compared to the serial
arrangement allows for more accurate sensing of overall element behaviour, as it
eliminates any localized effects on the electrical response. This subject does, however,
warrant further investigation in future work.
6.4.1.3 Tension
Figure 6.19 presents the tensile behavior for sample set 2.2A) for loading Segment
1 and 3. Similar to Figure 6.9, these samples presented repeatability issues in loading
Segment 1. Upon being subjected to multiple cycles, it can be seen that the sensing
performance of the patches stabilizes.
Similar to compression, a nonlinear response can be detected at low strain values for
tension. Likewise this can be avoided by increasing the preload of the sample. However,
greater attention is required to avoid damaging the sample due to the inherently weaker
tensile behavior of cementitious materials.

204
Figure 6.19 – Sensing response of patch printed on GFRP sheet under tension for (top) loading Segment 1 (cycles 1-6)
and (bottom) loading Segment 3 (cycles 47-52).
Figure 6.20 presents the change in impedance in regards to the applied displacement.
Similar to compression, hysteresis between loading and unloading can be observed in the
sample. This phenomenon in cementitious strain sensing is not well understood and is
usually countered with incorporating sufficient doses of conductive filler (D’Alessandro
et al., 2020; Wang et al., 2018). In other sensing applications outside of cementitious
materials hysteresis has been found to be dependent on the pre-strain applied (De Focatiis
et al., 2012). It can be hypothesized that the weakened interface upon each cycle may also
contribute to higher degree of hysteresis. Overall this area of study requires greater
investigation.

205
Figure 6.20 – Typical hysteresis plot of fractional change in impedance versus displacement for 3 load cycles under
tension for one patch printed on GFRP sheets.
Figure 6.21 presents the average fractional change in impedance of a patch against tensile
strain for the GFRP sample depicted in Figure 6.20 for 3 load cycles. The average GF
under tension for 5 samples was calculated as 38.4±21.6. While repeatability in the same
sample can be detected, the maximum sensing performance between samples presented
great variability. This could be in part due to the manner in which adhesion between the
AAM overlay and the GFRP sheet was achieved. Inconsistencies in the sand-epoxy layer
could result in different thicknesses which in turn could impact strain transfer from the
GFRP sheet to the patch. The sensing performance of the patches is comparable to GFs
reported in other filler free AAM applications under tension (Saafi et al., 2014).

206
Figure 6.21 – Average fractional change in impedance versus tensile strain for patch printed on GFRP sheet for 3 load
cycles. Error bars represent standard deviation of six load cycles with three impedance measurements per cycle for
one sample.

207
Samples that exceeded the loading limits presented in Section 6.3.5 resulted in nonlinear
and nonrepeatable behavior. Figure 6.22 displays the sensing response of patches under
high tensile strain25. The response under these conditions was nonlinear as depicted in
(Yoo et al., 2018a). Applying high loads compromised the structural integrity of the
patches which apart from poor sensing capabilities also led to cracks and debonding.
Figure 6.22 – Nonlinear sensing response of one patch printed on GFRP sheet under high loads under tensile strain.
6.4.1.4 4-point bending
Figure 6.23 presents the sensing behavior of sample set 2.3A) for loading
Segments 1 & 3. Contrary to tension and compression, the sensing performance of the
samples did not stabilize under this loading scheme as an increase in the initial impedance
25 Applying close to 6000 με to a plain AAM sample will most likely lead to material failure at an earlier load. It can
be speculated that low strain transfer occurs due to the presence of the glue and sand that were used to achieve adequate
adhesion with the GFRP sheet. This phenomenon is similar to that found in sensing sheets (Gerber et al., 2018). If a
greater bond was achieved, the patch would experience a larger portion of the applied load.

208
upon each load cycle can be viewed. 4-point bending also led to frequent debonding of
the patches under loading. Both these occurrences have been speculated to occur due to
weakening of the bond upon each loading cycle due to fatigue and differential curvature
of the substrate and the patch (Turatsinze et al., 2011).
Figure 6.23 – Sensing response of patch printed on concrete beam under 4-point bending for (top) loading Segment 1
(cycles 1-6) and (bottom) loading Segment 3 (cycles 47-52).
As mentioned in Section 6.3.2 the patches for this investigation were printed between the
two load points to ensure a constant strain following the behavior of beams under 4-point
bending. The patches were also situated on the bottom face of the beam rather than the
lateral face to ensure the patch was completely in tension to avoid any irregular behavior
due to the measurement of simultaneous compression and tension in the sample. Taking
these factors into account, the impedance of the sample was initially expected to increase.
Despite this hypothesis, the impedance of the sample decreased as load was applied.

209
The impedance response of AAM under flexural loading is quite conflicted in the
literature, being reported to both increase (Saafi et al., 2014) and decrease (Rovnaník et
al., 2019b). In the current setup, the author of this thesis posits that the reason for the
decrease in impedance during 4-point bending is that part of the electrical current flows
through the concrete substrate during impedance measurement. As the load increases,
deflection of the beam presents a larger cross-sectional area for the current to flow
between two points. This means more current can flow, and this would lead to a decrease
in impedance.
The sensing performance of the patches under 4-point bending was relatively difficult to
characterize due to their variable and nonrepeatable behavior. In regards to the sample
depicted in Figure 6.23, while the strain response was nonlinear, linear regions can be
detected. As a result, the sensing performance was determined using only the linear region
of the last cycle (therefore the first two loading points were removed).

210
Figure 6.24 – Fractional change in impedance versus applied strain under linear region for one patch under 4-point
bending for last load cycle of Segment 3.
The gauge factor for the last load cycle was calculated as 21.7, as can be seen in Figure
6.24.
In certain load trials, linear regions were not able to be detected. In this scenario the
sensing response was characterized using a second-degree polynomial equation. Figure
6.25 presents an example of samples with nonlinear sensing behavior for all load points
for one load cycle. In this situation though it can be seen that the maximum change in
impedance is lower (0.009) for higher applied strain (830 με) compared to Figure 6.24
(maximum change in impedance 0.011 for 500 με). This difference could be a result of
poorer adhesion in the former sample. Overall, accurately investigating beams under
4-point bending is currently a limitation of the technology presented in this thesis.
Compared to compression and tension, this sensing approach was not as successful. Apart
from better adhesion, different patch placement may be required to avoid excessive

211
damage in adhesion to allow repeatable sensing. These issues can be addressed in future
work.
Figure 6.25 – Nonlinear response of one patch printed on a concrete beam under 4-point bending for one load cycle.
6.4.2 Strain sensing evaluation
6.4.2.1 Sensing performance
The AAM patches investigated were able to showcase sensing capabilities without
relying on the use of conductive filler. This reiterates the benefits of employing AAM in
sensing applications. The sensing performance of the sensing coatings examined in this
chapter is presented in Table 6.3. The coatings were able to present the expected behavior
under tension and compression e.g. increase in impedance in tension and decrease in
impedance in compression. The response for this loading type was characterized as a
linear behavior in terms of the applied strain or stress with high coefficients of
determination. The sensing performance in tension (38.4±21.6) was comparable to GFs

212
reported in other filler free AAM applications under tension (D’Alessandro et al., 2020;
Saafi et al., 2014). The sensing performance of the patches under compression (8.59±1.55)
was lower compared to filler free applications reported by other authors where GFs range
between 20-65 (D’Alessandro et al., 2020; Rovnaník et al., 2019c; Saafi et al., 2014). It
can be speculated that the bond between the samples affects the strain sensing capacity.
Overall as mentioned in Chapter 4 & 5, adhesion between the printed overlays and the
concrete cubes was relatively low (0.6 MPa). This could be in part due to the low the
roughness index achieved with wire brushing. It can be inferred that by employing a more
effective means of surface preparation such as sandblasting can not only increase adhesion
but also the sensing performance as well.
Table 6.3 – Sensing performance of AAM coatings.
Loading type Sensing performance Repeatability
Compression (50 mm cubes) 8.59±1.55 Good
Compression (100 mm cubes) 0.033 ±0.008 MPa-1 Good
Tension 38.4±21.6 Good
4-point bending 21.7 Poor
In regards to 4-point bending the sensing performance of the patches was again quite low
when compared with other applications. The GF calculated in this study was 21.7 with
poor repeatability. Studies on the GF on general flexural loading (3-point and 4-point)
have ranged between 150-1100 (Bi et al., 2017; Rovnaník et al., 2019b). Considering the
frequent debonding of samples and the variable response presented (both linear and
nonlinear) in 4-point bending it can be inferred that greater material preparation for the
coatings and concrete surface preparation is required. Incorporating conductive filler can
increase the gauge factor and the repeatability of the samples (D’Alessandro et al., 2020;
Deng et al., 2019; Ma et al., 2020; Rovnaník et al., 2019a).
One of the main drawbacks of AAM sensors absent of conductive filler is their variable
sensing behavior between samples. As mentioned in Section 2.3.3.4 reported gauge
factors for such applications have ranged between 20 – 2000 without a detailed
explanation (D’Alessandro et al., 2020; Lamuta et al., 2017; Ma et al., 2020; Saafi et al.,
2014). While studies on ion exchange and ion conductivity in AAM have been carried out

213
(Biondi et al., 2020; Lamuta et al., 2016; Skorina, 2014) this concept is not understood to
the extent where sensing performance of AAM binders can be reliably predicted. As the
main form of conduction is ionic conduction, it can be hypothesized that one means of
increasing sensing performance could be achieved by increasing the alkali ions (Na+ and
K+) in the AAM matrix. However, as strain sensing is influenced by numerous factors,
such claims cannot be easily made. Overall, despite the research that has been carried out,
further investigation is required in this field to better comprehend this concept.
6.4.2.2 Limitations of experimental setup
An important point to mention is that the displacement values used in the
displacement-controlled tests were obtained from the sensor in the load cell of the testing
apparatus rather than with the use of external sensors. This obviously induces certain
limitations in the investigation carried out. The displacement that is applied and the actual
displacement experienced in the substrates most likely differs. Under compression testing,
the applied displacement is distributed throughout the loading plates, the insulation plates
and the concrete substrate. Similarly, in tensile testing the displacement is applied to the
GFRP sheet which is then transferred to the layer of epoxy and sand before reaching the
AAM patch. As a result, the actual displacement in the substrates will be affected by
potential contact issues and strain transfer between the aforementioned components. This
assumption can be verified by comparing the results of sample sets 2.1 A) and 2.1 B)
(50 mm and 100 mm concrete cubes respectively). The SSC of the 100 mm cubes can be
converted into GF by using the stress-strain relationship σ=εE. Assuming a modulus of
elasticity for concrete between 20 – 30 GPa, this would lead to a GF between 660-990 for
the average SSC. The GF for the 50 mm cubes though was calculated as 8.59. These
results differ by two orders of magnitude. Looking at these results through a different lens,
the SSC of the 50 mm concrete cubes was calculated as 0.014 MPa-1. This value is within
the same order of magnitude as the SSC of the 100 mm samples, 0.033 MPa-1. In addition,
by assessing the stress-strain plot acquired from the load cell the modulus of elasticity of
the concrete cubes was calculated as 0.65 GPa. This is much smaller compared to
conventional values for concrete. This further supports the claim that the displacement

214
that is applied to the concrete substrate is lower and is likely affected by the experimental
setup.
For this thesis the GF was calculated using the nominal displacement values from the load
cell. We acknowledge that this is an issue, however this is currently a limitation of the
current setup that cannot be overcome. It should also be mentioned that the displacement
applied to substrate and the displacement that is experienced in the patch may also differ
as strain transfer is governed by the bond between the two materials. The displacement
that is actually applied to the substrate and the patch can be verified in future work with
an additional linear variable differential transformer (LVDT) and/or a strain gauge.
6.4.3 AAM sensors for damage detection
As can be seen in Section 6.4.1, AAM patches require a large number of cycles
before a repeatable response can be achieved. This limits immediate deployment as
additional calibration steps are required. If repeatable behavior is not achieved this can
lead to the incorrect interpretation of sensor’s response. Even though mechanical cycling
is common practice in achieving repeatability in self-sensing cementitious sensors, an
increased number of cycles was required in this application compared to standalone AAM
binders (Ma et al., 2020). This could indicate slight damage at the interface between the
patch and the substrate upon each load cycle, owing to the low bond strength that was
achieved. Apart from sensing performance, it can be inferred that improving adhesion may
also limit the number of cycles required to achieve sensing repeatability.
Despite the numerous cycles applied, the change in impedance remains within the same
order of magnitude. If the patches are damaged during mechanical loading, this will cause
an immediate spike in the impedance of the AAM sensor. In this scenario whether
repeatability has been achieved or not is of minor importance as the changes due to
damage override the changes in cyclic loading. Figure 6.26 depicts the change in
impedance for an AAM patch under compression. The sample at first displayed the
expected response of AAM in compression as shown in Section 6.4.1.2. After a few cycles
the change in impedance increased dramatically from ΔZ/Z0=0.01-0.015 to 6-7. This was
a clear indication of damage in the patch. Delamination is not considered is it would have

215
led to the opposite result e.g. no change in impedance as load is applied. In this scenario,
the patch entered the ‘damaged’ state of strain sensing as described in Section 2.3.3.1, in
which an abrupt change in impedance can be observed. While the patch is no longer able
to function as a strain sensor, it was able to immediately detect damage. Once the sample
was removed from the testing apparatus this hypothesis was confirmed as cracks were
detected on the surface of the patch.
This behavior of printed AAM sensors allows immediate deployment of the current
technology and provides new routes for future applications. Furthermore, rather than
depositing patches over large areas, these sensors can also be printed over smaller and
designated areas of concrete structures for targeted monitoring. This can also allow AAM
patches to see applications in the tomography of concrete. Overall, assessing the strain
and damage behavior of AAM sensors can provide a greater understanding of these
materials for future field and industrial applications.

216
Figure 6.26 – Change in impedance for damaged patch under compression.
6.4.4 3D printing effects on sensing performance
To the best of the author’s knowledge, the effect of 3D printing on sensing
performance has not been studied. Printed cementitious materials present anisotropic
behaviour due to the weakened interface between layers and are thus affected by the
direction of the applied load in comparison to the direction of layers (Bong et al., 2019;
Panda et al., 2017). In this application, the patches been printed following a 90o
crosshatched infill pattern (the first layer is deposited vertically, second layer horizontally).
This was done in an attempt to create a more ‘uniform’ patch in order to minimize the
effect of the direction of load in contrast to the filament orientation. As the weakest point
of an overlay is usually at the interface between the two materials (Turatsinze et al., 2011)
an argument could be made that the orientation of the first layer in association with the
direction of load could have a greater impact on the behaviour of the patch. However, the
overlay was required to maintain a level of workability to achieve adhesion with the
217
concrete substrate. This additional workability also promotes greater interlayer adhesion
between the extruded filaments compared to stiffer mixes therefore minimizing the
printing effects on the patch (Tay et al., 2018). Recent studies have also stated that the
rheological properties of a mix play a more important role on the mechanical performance
of printed binders rather the printing orientation compared to the applied load (Heras
Murcia et al., 2020). It should be pointed out that if the mix design for the patches had
poorer workability, apart from potentially introducing anisotropic behavior, this would
also comprise adhesion with the concrete substrate (Courard et al., 2014). As a result, stiff
mix designs are not ideal in this type of investigation and require greater investigation if
employed.
6.5 Conclusions
In this chapter, the strain sensing response of printed AAM coatings onto concrete
and glass fiber reinforced plastic sheets under compression, tension and 4-point bending
was investigated. The key findings of this chapter are the following:
• Filler-free coatings presented the expected sensing response under compression
and tension. The samples showcased linear behavior in regards to the applied loads.
• Sensing coatings require multiple loading cycles before a repeatable response can
be achieved.
• Samples presented hysteresis between loading and unloading despite being
subjected to multiple load cycles.
• Adhesion plays an important role in sensing overlays. Poorer adhesion can lead to
compromised sensing integrity.
• Electrode configuration is critical when employing the van der Pauw electrode
configuration.
• Repeatability under 4-point bending was not able to be achieved due to damage of
the bond between the two samples. The sensing response was characterized as both
linear and nonlinear.
• Damage in the patch can cause sharp spikes in the change in impedance.

218
Overall, the patches were able to present a repeatable sensing response under compression
and tension, however this was compromised under 4-point bending. The repeatability and
sensitivity coefficients of the samples can be improved by increasing adhesion with the
substrates. Further research in self-sensing coatings includes using additive manufacturing
to deposit coatings onto designated areas of substrates for localized sensing and
investigating the strain behaviour of patches under biaxial loading and various
temperature and moisture conditions. Early results also show that AAM sensors could be
used in damage detection applications.

219
Chapter 7 Deployment methods
In this chapter potential methods of deploying the technology presented in this thesis will
be briefly discussed. The focus is primarily on deploying the technology onto precast
concrete elements, as the environment of a prefabrication factory couples well with the
requirements and limitations of the 3D printing technique employed in this thesis.
Methods of improving the deployment are also presented.
7.1 Introduction
Deployment of self-sensing materials is an important aspect in the development of
‘smart’ infrastructure. In its current state, the 3D printing methodology presented in this
thesis would be difficult to apply in an onsite construction environment. It is, however,
already quite compatible with precast applications as:
• The two-part AAM fabrication method requires additional mixing steps which is
better situated in a controlled environment rather than in-situ.
• Precast elements allow more time for surface preparation and proper curing of the
printed objects to ensure greater sensing performance.
• Sensing probes can be installed with greater precision.
• Gantry 3D printers which print downwards can be situated in fixed locations.

220
7.2 Methods of deployment
One of the constraints in deploying extruded elements is the type of printing
system employed. Two means of deploying sensing patches will be presented in this
section: a gantry 3D printer, and a robotic arm.
7.2.1 Gantry 3D printer
Gantry printing systems can provide an efficient means of printing patches onto
precast elements. The allowable size of substrates that could be used is governed by the
size of the printing system. The print bed in the printing setup used throughout this thesis
is 300 mm × 300 mm. This was able to satisfy the size requirements for the substrates
investigated in this project. The largest substrate that was examined in sensing was
100 mm concrete cubes with 90 mm × 90 mm patches. While not electrically interrogated
in this work, larger overlays were also printable. Figure 7.1 presents a patch being
extruded onto a 200 mm × 200 mm concrete slab.
Figure 7.1 – Patch printed onto 200 mm × 200 mm concrete slab.
Substrates that are larger than the printing bed in one dimension (e.g. a 1000 mm long
concrete beam) can also be used in this printing configuration by feeding the substrate
through the open sides of the printer. Figure 7.2 presents the printer used in this thesis

221
extruding a sensing patch onto a 1000 mm beam. This is essentially an upscaled version
of the printing process used in Chapter 626. As can be seen the beam must be supported
with additional supports, as the frame and bed of the printer could not sustain the weight
of the concrete beam. In this configuration, the steps in the z-axis are controlled by the
print bed rather than the print head. This prevents multilayer objects from being fabricated
as the z-axis is nullified. This poses limitations in the size of the patches that can be
extruded as the thickness of the overlays is controlled by the nozzle size and head distance.
These limitations are, however, a feature of this particular printer, and a gantry and
extruder system could be designed specifically for precast applications.
26 Larger substrates may require a different electrode configuration than what was used in previous chapters
to ensure the current can flow between the electrodes. Detailed consideration of this aspect is outside of the
scope of this thesis.

222
Figure 7.2 – Extrusion of patch onto 1000 mm concrete beam with the use of stationary 3D printer. The walls of the
printer were removed and supports were used to accommodate the size and weight requirements of this application.
7.2.2 Robotic arm
Using a six-axis robotic arm could expand the number printing applications that
can be achieved. This can replicate the printing process used in this thesis while bypassing
size limitations imposed by the size of the printer and substrate. A six-axis robot also
enables the extrusion of objects with multiple layers as all print movements are controlled
by the print head. In a similar application conducted by the author’s research group a
sprayer was mounted onto a robotic arm to produce AAM overlays via spraying
(McAlorum et al., 2021a). Figure 7.3 presents a picture of the referred setup. The same
system can be used for filament printing as well by substituting the sprayer with the cavity
dispenser used in this thesis. The use of robotics paves the way for onsite applications,
particularly in areas with limited access. Further development would be required to
streamline robotic printing methods, and to allow for printing on vertical, curved and
overhanging surfaces.

223
Figure 7.3 – Robotic dispensing system at Civil Automation Group - Photo courtesy of Jack McAlorum.
7.3 Electrode placement
In the work described in this thesis, once a patch was successfully printed onto a
substrate, thin stainless steel wires or stainless steel tape were manually inserted in the
patches as electrodes. This enabled the interrogation of the sensing patches. A means of
improving consistency and allowing a simpler design for electrode placement could
involve a prefabricated electrode mould. Apart from greater consistency in electrode
placement, this allows a larger variety of electrodes to be used that would otherwise
present installation issues. Such electrodes include carbon fiber tow (carbon fiber
filaments that are woven into fabric).
7.4 Sensing interrogation
Sensing interrogation was carried out with a commercial electrical impedance
analyzer. While this is able to present rich datasets, these systems are expensive and
operate from mains power. Currently low-cost impedance analyzers are being developed
within the author’s group at the University of Strathclyde (McAlorum et al., 2021b). These
224
interrogators are able to replicate the functionality of commercial systems within 5.2% of
error. This allows a more efficient means of monitoring patches particularly when multiple
elements are being deployed. Moreover, while data transmission was conducted via cable
connections in this thesis, data can also be wirelessly transmitted to avoid connection
complexities. Lastly, additional reference sensors will be required when sensing patches
are installed for temperature and humidity compensation.
7.5 Conclusions
In this chapter a brief overview of the challenges and opportunities facing the
deployment of current system are presented. The sensing patches presented in this thesis
are, for now, aimed at precast applications due to the Gantry-like methodology followed
throughout this thesis. Deployment of sensing patches can be improved by upscaling to
robotic deployment methods, by employing lower cost and wireless interrogation systems,
and by using moulds for more consistent electrode placement.

225
Chapter 8 Conclusions and future
work
This chapter provides a synopsis on printing alkali activated sensors for concrete
structures. An overview of the thesis is presented, the significant findings are pointed out
and avenues for future work in this field are proposed
8.1 Conclusions
In this thesis cementitious patches were printed onto substrates as a new means of
combining the structural health monitoring & maintenance of concrete infrastructure. The
PhD has enabled:
• The automated extrusion of overlays onto concrete substrates and glass fiber
reinforced plastic sheets.
• Temperature and strain characterization of filler-free alkali activated material
patches.
This thesis began with a literature review introducing alkali activated materials (AAM),
AAM as self-sensing materials and 3D printing cementitious materials. A general
overview on the theory and background behind AAM is initially provided. The current
understanding of AAM as strain, temperature and moisture sensors along with reported
applications follows. While AAM are ideal candidates for self-sensing materials they are
relatively under-researched when compared to ordinary Portland cement (OPC) binders.

226
Lastly, literature on 3D printing cementitious materials is presented. The printing process
and printing requirements for cementitious mixes are depicted. Common printing
terminology, printing configurations and intricacies in cementitious printing are also
outlined.
Chapter 3 provides experimental results on the mechanical properties of AAM. It was
found that ambient cured metakaolin AAM binders are able to achieve adequate strength
at 28 days (compressive strength – 34 MPa and flexural strength – 3.3 MPa) with the
majority of strength being reached after 7 days of curing.
The development of 3D printed overlays for concrete substrates follows. Current
guidelines in 3D printing cementitious materials do not cover the requirements that must
be considered for the extrusion of coatings. In this thesis the existing printing guidelines
were expanded to accommodate the needs for this application. The requirements defined
for sensing patches are the following: extrudability, buildability (degree of buildability),
printability window, adhesion and conductivity/sensing capability. Extrudability and
printability window are intrinsically linked as they are able to define whether and how
long a mix can be extruded respectively. Buildability is associated with the degree an
object can achieve its intended shape without major deformation. As overlays are much
thinner than structural materials the buildability requirements for this application are much
lower than in conventional cementitious applications. The patches must also be able to
achieve adequate adhesion with the substrate to ensure proper functionality. This requires
proper surface preparation and filler to increase adhesion between the two elements.
Lastly, as these patches are intended for sensing applications they must be electrically
conductive and be able to showcase temperature and strain sensing response. Due to their
chemical microstructure these properties are innately fulfilled.
The temperature sensing capability of these patches was investigated between 10 oC –
30 oC – 10 oC for two cycles. The patches were able to present the expected change in
electrical properties of AAM under these circumstances. Increasing temperature
accelerates the movement of ions in the AAM matrix thus led to lower impedance.
Similarly, ions move slower at lower temperatures which resulted in the impedance

227
increasing. The change in impedance in response to temperature change was characterized
as an exponential equation. Furthermore it was also determined that frequency played a
minor role in the sensing response of the samples. Between the two temperature cycles
the patches presented a resolution of 0.1 °C and a repeatability of 0.3 °C.
Following temperature sensing, the strain sensing response of the overlays was
investigated. The samples were tested under compression, tension and 4-point bending.
The experimental results confirmed that AAM can be used in strain sensing applications
without relying on the use of conductive filler. The response of the patches in compression
and tension was according to the behavior outlined in the sensing review. Impedance
decreased in compression and increased in tension. Similar to temperature sensing this
behavior is attributed to the movement of the ions in the matrix. As the sample is
compressed the distances ions must travel is shortened which results in lower impedance.
Analogously these distances increase as tension is applied to the sample which increases
impedance. The samples required multiple load cycles before a repeatable response could
be achieved. The change in impedance in regards to the applied strain displayed a linear
relationship. The gauge factor was calculated as 8.59±1.55 in compression and 38.4±21.6
in tension. Poor adhesion between the patch and the substrate led to compromised sensing
performance. Damage in the patch resulted in an abrupt increase in the sample’s
impedance. Furthermore, the direction the electrical properties are being measured
compared to the applied load influences electrical measurements despite the type of load
being applied to the substrate. Compared to compression and tension, patches under 4-
point bending presented sensing issues. Frequent delamination of patches occurred which
could be a direct result of the difference in mechanical response between the two elements.
Repeatability was not able to be achieved despite samples being subjected to multiple load
cycles. In turn this led to difficulties in the characterization of their electrical performance
in which both linear and nonlinear responses were detected.
In Chapter 7, potential means of deployment of sensing patches is presented. The manner
in which the technology in this thesis is developed is more suitable for precast elements.
The AAM fabrication and printing setup are better situated in a controlled environment

228
rather than onsite applications. The development of sensing patches can be easily upscaled
to larger sized applications based on work that is currently being developed within the
author’s research group.
8.2 Future work
3D printing self-sensing overlays is a novel multidisciplinary field of study. The
experiments conducted in this thesis were therefore naturally limited by available time
and equipment. Recommendations on future work in this area of study follow.
8.2.1 Understanding sensing performance
Despite the research that has been carried out in AAM sensing, the mechanisms
behind the changes in electrical impedance are not fully understood. Large differences in
investigations have been reported which makes predicting the performance of these
sensors quite difficult. The variance in results could be attributed to additional effects that
are not always accounted for in the evaluation of these sensors. Such factors include
geometry, molecular composition, degree of saturation and testing environment
(temperature and humidity), and variations in the substrate. These parameters must be
taken into greater consideration to allow for the accurate characterization and design of
these sensors.
8.2.2 Improving sensing performance
In this thesis the temperature and strain sensing performance of AAM patches was
characterized, however, potential means of improving the sensing response were not
assessed. In regards to strain sensing, the adhesion investigation conducted suggests that
the sensing performance of the patches can be improved by increasing the bond strength
between the patch and the substrate. This could be achieved by increasing the surface
roughness of the substrate, incorporating additional filler to enhance adhesion or by
applying bonding agents. Once a higher bond is achieved, the overall impact adhesion
plays on sensing could be investigated. This would involve assessing patches of different
bond strengths and determining the strain transferred from the substrate to the patch with
the use of strain sensors. A correlation between bond strength and sensing response (gauge

229
factor) could then be drawn. This will provide greater insight on the utility of cement-
based overlays as strain sensors.
When it pertains to temperature sensing, the patches can initially be assessed for a larger
temperature range to imitate temperature conditions in site applications, with a safety
factor. Moreover, it is rather unclear if adhesion will impact the temperature response to
the same degree as strain sensing. As stated in Chapter 2 temperature sensing is affected
by moisture content and by the chemical composition of the binder. In this scenario it
would be more fitting to focus on these parameters to improve temperature sensing
response.
8.2.3 Sensor size and placement
In this thesis, patches were printed onto the entire surface of concrete cubes and
onto areas where maximum strain was expected in concrete beams and glass reinforced
fiber sheets. Replicating this in larger structures though may not be feasible. As a result
strategic deployment of patches would be required for more effective monitoring. To
provide an example, smaller patches or even objects containing few ‘filaments’ can be
extruded for temperature sensing applications. This will allow for quicker stabilization of
the sensor and require overall less printing setup (e.g. less surface preparation for
substrates and shorter printing duration). Moreover, similar to the tensile and 4-point
bending investigation, patches can be printed in critical areas of larger structures for
targeted strain sensing.
8.2.4 Additional sensing applications
In this thesis, temperature and strain sensing were assessed separately. It is likely
that multiple effects may simultaneously occur in field and industrial applications.
Therefore, a better understanding on how AAM respond under multiple measurands is
necessary. The combined effects of sensing though should not be limited to these
measurands alone. How sensors behave under different temperature, strain, moisture and
loading conditions should be better understood to allow proper functionality and
interpretation of the response of these materials.

230
One of the drawbacks of employing AAM patches as strain sensors is the high number of
cycles required to reach a repeatable sensing response. Preliminary results of this thesis
show that AAM patches could also be used for damage detection. Whether sensing
repeatability is achieved in this scenario is of minor importance as the change in
impedance is instantaneous and of greater magnitude compared to the impedance shifts
between loading cycles. This allows for immediate deployment of this technology by-
passing the current limitations presented in strain sensing. Moreover, by focusing on
damage detection, smaller patches can be deployed over large spans in structures for
distributed monitoring rather than relying on a single patch to monitor an entire surface.
While the fabrication of such patches is relatively straightforward, additional electrodes
and data processing will be required to deliver a distributed measurement system.
8.2.5 Improving sensor fabrication
While the technology presented in this thesis is suitable for precast elements,
simplifying the fabrication of sensing patches is greatly beneficial nonetheless. This can
improve repeatability of the sensors while at the same time broadening potential
applications. A first step in improving this system would be by converting AAM
fabrication from the two-part mixing method to the one-part method. This change is
advantageous as the same end-product can be achieved by reducing the number of steps
required in mixing while also minimizing prior knowledge in the chemical background of
AAM.
A further step that can be taken to simplify the design process is to use small pins as
electrodes rather than tape or wires. This can minimize the impact the sensing probes have
on patches (e.g. cracks) while also avoiding instalment issues such as electrodes falling
out. In turn the pins can be inserted with the use of prefabricated moulds for consistent
spacing. The probes could then be extended by soldering wires to fit application needs.
This features a more consistent technique in electrode placement by eliminating any
potential electrode effects during testing.

231
8.2.6 3D printing
In this project, the printing requirements were based on existing guidelines and
were expanded where necessary. These were made based on author’s judgement and need
for an expanded set of design guidelines to deliver the printed sensors. The same
application though may be approached differently by other researchers based on equally
viable methods. As printing applications progress it will be relatively difficult to keep
track of how printing could be approached primarily by new researchers entering this field.
Guidelines on printing setups, developing mixes and assessing their properties should be
developed to allow for greater unification of existing applications. This will provide a
strong foundation for 3D printing applications going forward. Furthermore, printable
mixes should be classified according to their application. This can avoid confusion and
misconceptions in the scientific community that all mixes must adhere to the same set of
rules to the same degree.
8.2.7 Field and industrial application
Despite the research that has been carried out field applications in self-sensing
materials are very limited. Rather than being confined solely to laboratory applications,
these materials should also be tested in field and industrial environments. This will also
allow better understanding of how these materials behave under realistic site conditions.
Even failure would provide useful information on how the development of these materials
should continue going forward. In order for sensing patches presented in this thesis to be
deployed in field and industrial applications the following steps must be taken.
8.2.7.1 Upgrading printing system
In its current state this technology can only be used in precast elements of limited
size. Upscaling from a gantry printer to an autonomous robotic system will by-pass the
size limitations imposed by the current printing setup. This will provide greater flexibility
in the patches than can be printed and allow for the extrusion of additional layers to cover
any potential inconsistencies in larger and/or field applications.

232
8.2.7.2 Data interrogation and acquisition
Data acquisition and processing is an important feature in sensing applications. In
this thesis data were acquired with the use of a commercial impedance analyzer which
were then analyzed after the completion of testing. This process though should be more
user-friendly for applications outside the lab. Currently, commercial interrogators are not
suitable for onsite applications due to their high costs. Low-cost interrogation systems that
can be easily deployed with low power requirements should be used instead. Furthermore,
a more automated system of data acquisition and analysis is required for the assessment
of real time occurrences. This can be achieved by wireless transmission of data and
through the development of software that is automatically able to process data and provide
information on the condition of the structure the patch is monitoring.
8.2.7.3 Material properties
While the mechanical properties of the patches in this thesis were examined, not
all tests were carried out according to existing standards. Certain experiments were also
adjusted to meet material and equipment limitations while others were not considered due
to the nature of the investigation involved. As a result, reevaluation and additional tests
will be required to be carried according to existing repair standards. In all, the
recommendations made are in hope that this technology will provide an additional solution
to structural health monitoring applications in the future.

233
Appendix
A.1 Calculation of molar ratios
The steps for calculating the molar ratios of alkali activated materials (AAM) in
this thesis are outlined below.
1. Calculation of mass of total solids and liquids.
2. Calculation of mass of each constituent in solids and liquids.
3. Calculation of Si, Al and Na in precursor.
4. Calculation of Si, Na in sodium silicate and sodium hydroxide.
5. Calculation of Si/Al, Na/Al ratios in AAM binder.
The molar and molecular weight of typical chemical compounds found in constituents for
AAM formulation used in this thesis are displayed in Table A.1.
Table A.1 – Molar and molecular weight of typical chemical compounds and elements found in constituents for AAM
formulation used in this thesis.
Chemical compound or element Molecular/molar weight
SiO2 60.0843 g/mol
Na2O 61.97894 g/mol
K2O 94.2 g/mol
Al2O3 101.961276 g/mol
H2O 18.01528 g/mol
Si 28.085 g/mol
Na 22.98977 g/mol
K 39.0983 g/mol
Al 26.981538 g/mol
A.1.1 Step 1
Calculations begin by assuming 100g of liquid and determining the total solid
content via the solid-liquid ratio (s/l) used in each application (A.1).
Solids=s
l × 100g (A.1)

234
A.1.2 Step 2
The percentage of each constituent in the solids and liquids is calculated e.g.
percentage of metakaolin in precursor or sodium silicate in alkaline activator (A.2).
Mass of constituent= percentage of constituent × mass of solid or liquid (A.2)
A.1.3 Step 3
The percentage of SiO2, Al2O3, Na2O and Si, Al and Na respectively in each
constituent in the precursor is calculated (A.3)(A.4)(A.5). An example of SiO2 in
metakaolin is provided.
mass of SiO2 in metakaolin= SiO2 % in metakaolin × mass of metakaolin
100 (A.3)
Moles of SiO2 =
mass(SiO2) in metakaolin
molecular weight of SiO2
(A.4)
Mass of Si = moles of SiO2 × molar weight of Si; (A.5)
A.1.4 Step 4
The same process as outlined in Step 3 is followed for the sodium silicate in the
alkaline activator. When it pertains to the sodium hydroxide (NaOH) a different procedure
is followed (A.6)(A.7)(A.8)(A.9).
Volume of NaOH =mass of NaOH
density of NaOH (A.6)
Moles of NaOH= Molarity of NaOH
1000 × volume of NaOH
(A.7)
Moles of Na2O* =
moles of NaOH
2
(A.8)
*From 2NaOH + H2O = Na2O + 2H2O

235
Mass of Na = 2 × moles of Na2O × molar weight of Na (A.9)
A.1.5 Step 5
The molar ratios for the AAM binder are calculated by dividing the sum of the
mass of the desired elements (A.10). An example for Si/Al is provided.
Si/Al= Σ(mass of Si)/Σ(mass of Al) (A.10)
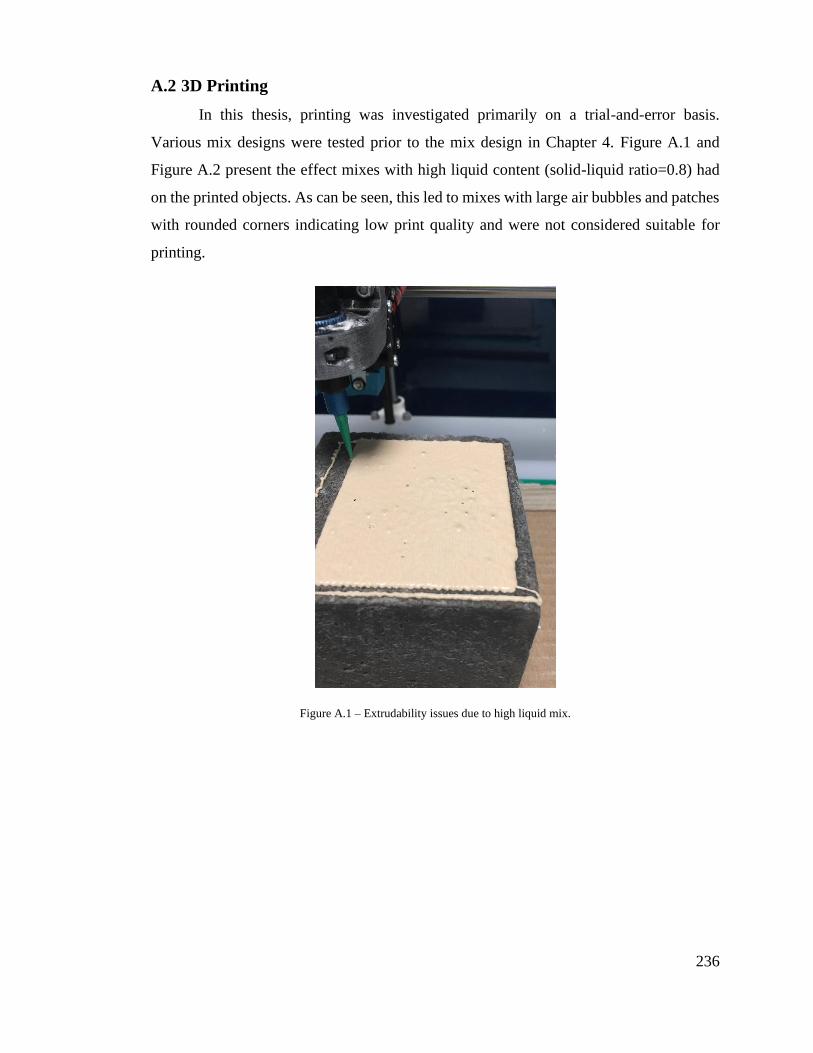
236
A.2 3D Printing
In this thesis, printing was investigated primarily on a trial-and-error basis.
Various mix designs were tested prior to the mix design in Chapter 4. Figure A.1 and
Figure A.2 present the effect mixes with high liquid content (solid-liquid ratio=0.8) had
on the printed objects. As can be seen, this led to mixes with large air bubbles and patches
with rounded corners indicating low print quality and were not considered suitable for
printing.
Figure A.1 – Extrudability issues due to high liquid mix.

237
Figure A.2 – Patches with rounded corners due to high liquid content.
Extrudability and the printability window of mixes were assessed by printing straight lines.
In certain cases poor extrudability was a result of the paste solidifying in the dispenser
due to the generation of heat in prolonged printing sessions, Figure A.3. In printing
applications where a large time delay took place between layers due to large surfaces
and/or low print speed, drying effects at the interface were observed, Figure A.4. While
this is more prominent in full-width printing, as such the delay time and print speed were
adjusted accordingly to avoid potential interlayer adhesion issues in the patches.
Figure A.3 – Solidification of alkali activated mix inside dispenser.

238
Figure A.4 – Dried interface due to prolong delay time between layers.
As mentioned in Chapter 4, the bond strength of the printed patches was relatively low
(0.6 MPa) compared to other studies. The low strength was attributed in part due to the
low roughness index achieved with wire brushing. In certain cases wire brushing was
unable to provide adequately roughened surfaces. This led to weak adhesion which
resulted in delamination of patches during coring of the samples for adhesion testing,
Figure A.5. This reiterates the need for a more effective surface preparation technique.
Figure A.5 – Delamination of patch during coring for adhesion tests.

239
A.3 Repeatability of sensor
In temperature sensing the AAM patches were tested under two temperature cycles.
The response of the patch at a given point was calculated as R=Zmod/Zmod,0. The
repeatability of the sensor for both cycles was assessed by the following process, (A.11).
𝑅𝑟𝑒𝑝𝑒𝑎𝑡𝑎𝑏𝑖𝑙𝑖𝑡𝑦 = √∑ (𝑚𝑖 − 1)𝑝
𝑖=1 𝑠𝑖2
(∑ 𝑚𝑖𝑝𝑖=1 ) − 𝑝
(A.11)
Where: mi=number of cycles, p=number of points, si=standard deviation (A.12)
𝑠 = √∑ (𝑅𝑖 − 𝑅𝑚𝑒𝑎𝑛)2𝑚
𝑖=1
𝑚 − 1
(A.12)
Where Ri is the response for all the cycles.

240
A.4 Strain sensing of alkali activated overlays
In order to ensure a constant testing environment during strain testing, the
temperature and humidity were measured with an external sensor. As can be seen in Figure
A.6 the temperature and humidity conditions in the lab were stable at 21 oC and 35%
relative humidity during standard working hours.
Figure A.6 – Temperature and humidity conditions of testing environment for standard working hours.
In regards to strain sensing, the patches were subjected to 3 loading schemes, Segments 1,
2 and 3. The response of loading segments 1 and 3 is depicted in Chapter 6. Figure A.7
presents the typical response of the change in impedance for patches for loading segment
2.

241
Figure A.7 – Loading segment 2 for patch in tension.

242
References
Abbasi, S.M., Ahmadi, H., Khalaj, G., Ghasemi, B., 2016. Microstructure and mechanical
properties of a metakaolinite-based geopolymer nanocomposite reinforced with
carbon nanotubes. Ceram. Int. 42, 15171–15176.
https://doi.org/10.1016/j.ceramint.2016.06.080
Abdollahnejad, Z., Mastali, M., Falah, M., Shaad, K.M., Luukkonen, T., Illikainen, M.,
2020a. Durability of the Reinforced One-Part Alkali-Activated Slag Mortars with
Different Fibers. Waste and Biomass Valorization. https://doi.org/10.1007/s12649-
020-00958-x
Abdollahnejad, Z., Mastali, M., Woof, B., Illikainen, M., 2020b. High strength fiber
reinforced one-part alkali activated slag/fly ash binders with ceramic aggregates:
Microscopic analysis, mechanical properties, drying shrinkage, and freeze-thaw
resistance. Constr. Build. Mater. 241, 118129.
https://doi.org/10.1016/j.conbuildmat.2020.118129
Abedi, M., Fangueiro, R., Gomes, A.C., 2020. Ultra-Sensitive Affordable Cementitious
Composite with High Mechanical and Microstructural Performances by Hybrid
CNT/GNP. Materials (Basel). 13, 3484. https://doi.org/10.3390/ma13163484
Aguirre-Guerrero, A.M., Robayo-Salazar, R.A., de Gutiérrez, R.M., 2017. A novel
geopolymer application: Coatings to protect reinforced concrete against corrosion.
Appl. Clay Sci. 135, 437–446. https://doi.org/10.1016/j.clay.2016.10.029
Aguirre-Guerrero, A.M., Robayo-Salazar, R.A., Mejía de Gutiérrez, R., 2021. Corrosion
resistance of alkali-activated binary reinforced concrete based on natural volcanic
pozzolan exposed to chlorides. J. Build. Eng. 33, 101593.
https://doi.org/10.1016/j.jobe.2020.101593
Al-Dahawi, A., Sarwary, M.H., Öztürk, O., Yildirim, G., Akin, A., Şahmaran, M.,
Lachemi, M., 2016. Electrical percolation threshold of cementitious composites
possessing self-sensing functionality incorporating different carbon-based materials.
Smart Mater. Struct. 25. https://doi.org/10.1088/0964-1726/25/10/105005
Alanazi, H., Hu, J., Kim, Y.R., 2019. Effect of slag, silica fume, and metakaolin on
properties and performance of alkali-activated fly ash cured at ambient temperature.
Constr. Build. Mater. 197, 747–756.
https://doi.org/10.1016/j.conbuildmat.2018.11.172
Alanazi, H., Yang, M., Zhang, D., Gao, Z., 2016. Bond strength of PCC pavement repairs
using metakaolin-based geopolymer mortar. Cem. Concr. Compos. 65, 75–82.
https://doi.org/10.1016/j.cemconcomp.2015.10.009
Albar, A., Chougan, M., Al- Kheetan, M.J., Swash, M.R., Ghaffar, S.H., 2020. Effective
extrusion-based 3D printing system design for cementitious-based materials. Results
Eng. 6. https://doi.org/10.1016/j.rineng.2020.100135
243
Albidah, A., Abadel, A., Alrshoudi, F., Altheeb, A., Abbas, H., Al-Salloum, Y., 2020.
Bond strength between concrete substrate and metakaolin geopolymer repair mortars
at ambient and elevated temperatures. J. Mater. Res. Technol. 9, 10732–10745.
https://doi.org/10.1016/j.jmrt.2020.07.092
Albidah, A., Alghannam, M., Abbas, H., Almusallam, T., Al-Salloum, Y., 2021.
Characteristics of metakaolin-based geopolymer concrete for different mix design
parameters. J. Mater. Res. Technol. 10, 84–98.
https://doi.org/10.1016/j.jmrt.2020.11.104
Alghamdi, H., Nair, S.A.O., Neithalath, N., 2019. Insights into material design, extrusion
rheology, and properties of 3D-printable alkali-activated fly ash-based binders.
Mater. Des. 167, 107634. https://doi.org/10.1016/j.matdes.2019.107634
Alghamdi, H., Neithalath, N., 2019. Synthesis and characterization of 3D-printable
geopolymeric foams for thermally efficient building envelope materials. Cem. Concr.
Compos. 104, 103377. https://doi.org/10.1016/j.cemconcomp.2019.103377.
Alujas, A., Fernández, R., Quintana, R., Scrivener, K.L., Martirena, F., 2015. Pozzolanic
reactivity of low grade kaolinitic clays: Influence of calcination temperature and
impact of calcination products on OPC hydration. Appl. Clay Sci. 108, 94–101.
https://doi.org/10.1016/j.clay.2015.01.028
Amran, M., Debbarma, S., Ozbakkaloglu, T., 2021. Fly ash-based eco-friendly
geopolymer concrete: A critical review of the long-term durability properties. Constr.
Build. Mater. 270, 121857. https://doi.org/10.1016/j.conbuildmat.2020.121857
Arabzadeh, A., Ceylan, H., Kim, S., Sassani, A., Gopalakrishnan, K., Mina, M., 2018.
Electrically-conductive asphalt mastic: Temperature dependence and heating
efficiency. Mater. Des. 157, 303–313. https://doi.org/10.1016/j.matdes.2018.07.059
Archez, J., Texier-mandoki, N., Bourbon, X., Caron, J.F., Rossignol, S., 2021. Shaping of
geopolymer composites by 3D printing. J. Build. Eng. 34, 101894.
https://doi.org/10.1016/j.jobe.2020.101894
Assi, L.N., Deaver, E., Elbatanouny, M.K., Ziehl, P., 2016. Investigation of early
compressive strength of fly ash-based geopolymer concrete. Constr. Build. Mater.
112, 807–815. https://doi.org/10.1016/j.conbuildmat.2016.03.008
Assi, L.N., Carter, K., Deaver, E., Ziehl, P., 2020. Review of availability of source
materials for geopolymer/sustainable concrete. J. Clean. Prod. 263, 121477.
https://doi.org/10.1016/j.jclepro.2020.121477
ASTM C618-19, 2015. Standard Specification for Coal Fly Ash and Raw or Calcined
Natural Pozzolan for Use, Annual Book of ASTM Standards. West Conshohocken,
PA. https://doi.org/10.1520/C0618-19.2
Autef, A., Joussein, E., Gasgnier, G., Pronier, S., Sobrados, I., Sanz, J., Rossignol, S.,
2013. Role of metakaolin dehydroxylation in geopolymer synthesis. Powder Technol.
250, 33–39. https://doi.org/10.1016/j.powtec.2013.09.022

244
Avet, F., Snellings, R., Alujas Diaz, A., Ben Haha, M., Scrivener, K., 2016. Development
of a new rapid, relevant and reliable (R3) test method to evaluate the pozzolanic
reactivity of calcined kaolinitic clays. Cem. Concr. Res. 85, 1–11.
https://doi.org/10.1016/j.cemconres.2016.02.015
Awoyera, P., Adesina, A., 2019. A critical review on application of alkali activated slag
as a sustainable composite binder. Case Stud. Constr. Mater. 11, e00268.
https://doi.org/10.1016/j.cscm.2019.e00268
Aydin, S., Baradan, B., 2012. Mechanical and microstructural properties of heat cured
alkali-activated slag mortars. Mater. Des. 35, 374–383.
https://doi.org/10.1016/j.matdes.2011.10.005
Azhari, F., Banthia, N., 2012. Cement-based sensors with carbon fibers and carbon
nanotubes for piezoresistive sensing. Cem. Concr. Compos. 34, 866–873.
https://doi.org/10.1016/j.cemconcomp.2012.04.007
Badogiannis, E., Kakali, G., Tsivilis, S., 2005. Metakaolin as supplementary cementitious
material : Optimization of kaolin to metakaolin conversion. J. Therm. Anal. Calorim.
81, 457–462. https://doi.org/10.1007/s10973-005-0806-3
Baeza, F.J., Galao, O., Zornoza, E., Garcés, P., 2013. Multifunctional Cement Composites
Strain and Damage Sensors Applied on Reinforced Concrete (RC) Structural
Elements 841–855. https://doi.org/10.3390/ma6030841
Baiano, A., 2020. 3D Printed Foods: A Comprehensive Review on Technologies,
Nutritional Value, Safety, Consumer Attitude, Regulatory Framework, and
Economic and Sustainability Issues, Food Reviews International. Taylor & Francis.
https://doi.org/10.1080/87559129.2020.1762091
Bard, A.J., Faulkner, L.R., 2001. Electrochemical Methods: Fundamentals and
Applications, 2nd ed. John Wiley & Sons, Inc.
Batista, R.P., Trindade, A.C.C., Borges, P.H.R., Silva, F. de A., 2019. Silica Fume as
Precursor in the Development of Sustainable and High-Performance MK-Based
Alkali-Activated Materials Reinforced With Short PVA Fibers. Front. Mater. 6, 1–
15. https://doi.org/10.3389/fmats.2019.00077
Bature, A.S., Khorami, M., Ganjian, E., Tyrer, M., 2021. Influence of alkali activator type
and proportion on strength performance of calcined clay geopolymer mortar. Constr.
Build. Mater. 267, 120446. https://doi.org/10.1016/j.conbuildmat.2020.120446
Beer, F.P., Johnston, E.R.J., DeWolf, J.T., Mazurek, D.F., 2009. Mechanics of Materials,
5th ed. McGraw-Hill, New York.
Behera, P., Baheti, V., Militky, J., Naeem, S., 2018. Microstructure and mechanical
properties of carbon microfiber reinforced geopolymers at elevated temperatures.
Constr. Build. Mater. 160, 733–743.
https://doi.org/10.1016/j.conbuildmat.2017.11.109
Bernal, S.A., Rodríguez, E.D., Mejia De Gutiérrez, R., Provis, J.L., Delvasto, S., 2012.

245
Activation of metakaolin/slag blends using alkaline solutions based on chemically
modified silica fume and rice husk ash. Waste and Biomass Valorization 3, 99–108.
https://doi.org/10.1007/s12649-011-9093-3
Bernal, S.A., Provis, J.L., 2014. Durability of alkali-activated materials: Progress and
perspectives. J. Am. Ceram. Soc. 97, 997–1008. https://doi.org/10.1111/jace.12831
Bernal, S.A., Provis, J.L., Fernández-Jiménez, Ana Krivenko, P. V., Kavalerova, E.,
Palacios, M., Shi, C., 2014a. Binder Chemistry – High-Calcium Alkali- Activated
Materials, in: Provis, J.L., van Deventer, J.S.J. (Eds.), Alkali Activated Materials
State-of-the-Art Report, RILEM TC 224-AAM. RILEM, Dordrecht Heidelberg New
York London, pp. 59–91. https://doi.org/10.1007/978-94-007-7672-2
Bernal, S.A., Provis, J.L., Myers, R.J., San Nicolas, R., van Deventer, J.S.J., 2014b. Role
of carbonates in the chemical evolution of sodium carbonate-activated slag binders.
Mater. Struct. Constr. 48, 517–529. https://doi.org/10.1617/s11527-014-0412-6
Bernal, S.A., Rose, V., Provis, J.L., 2014c. The fate of iron in blast furnace slag particles
during alkali-activation. Mater. Chem. Phys. 146, 1–5.
https://doi.org/10.1016/j.matchemphys.2014.03.017
Bernal, S.A., San Nicolas, R., Myers, R.J., Mejía De Gutiérrez, R., Puertas, F., Van
Deventer, J.S.J., Provis, J.L., 2014d. MgO content of slag controls phase evolution
and structural changes induced by accelerated carbonation in alkali-activated binders.
Cem. Concr. Res. 57, 33–43. https://doi.org/10.1016/j.cemconres.2013.12.003
Bernal, S.A., San Nicolas, R., Van Deventer, J.S.J., Provis, J.L., 2016. Alkali-activated
slag cements produced with a blended sodium carbonate/sodium silicate activator.
Adv. Cem. Res. 28, 262–273. https://doi.org/10.1680/jadcr.15.00013
Beushausen, H., Bester, N., 2016. The influence of curing on restrained shrinkage
cracking of bonded concrete overlays. Cem. Concr. Res. 87, 87–96.
https://doi.org/10.1016/j.cemconres.2016.05.007
Bhutta, A., Farooq, M., Banthia, N., 2019. Performance characteristics of micro fiber-
reinforced geopolymer mortars for repair. Constr. Build. Mater. 215, 605–612.
https://doi.org/10.1016/j.conbuildmat.2019.04.210
Bi, S., Liu, M., Shen, J., Hu, X.M., Zhang, L., 2017. Ultrahigh Self-Sensing Performance
of Geopolymer Nanocomposites via Unique Interface Engineering. ACS Appl. Mater.
Interfaces 9, 12851–12858. https://doi.org/10.1021/acsami.7b00419
Billong, N., Kinuthia, J., Oti, J., Melo, U.C., 2018. Performance of sodium silicate free
geopolymers from metakaolin (MK) and Rice Husk Ash (RHA): Effect on tensile
strength and microstructure. Constr. Build. Mater. 189, 307–313.
https://doi.org/10.1016/j.conbuildmat.2018.09.001
Biondi, L., Perry, M., Vlachakis, C., Wu, Z., Hamilton, A., McAlorum, J., 2019. Ambient
Cured Fly Ash Geopolymer Coatings for Concrete. Materials (Basel). 12, 923.
https://doi.org/10.3390/ma12060923

246
Biondi, L., 2020. Geopolymer-based moisture and chloride sensors for nuclear concrete
structures. University of Strathclyde.
Biondi, L., Perry, M., McAlorum, J., Vlachakis, C., Hamilton, A., 2020. Geopolymer-
based moisture sensors for reinforced concrete health monitoring. Sensors Actuators,
B Chem. 309, 127775. https://doi.org/10.1016/j.snb.2020.127775
Bocullo, V., Vitola, L., Vaiciukyniene, D., Kantautas, A., Bajare, D., 2021. The influence
of the SiO2/Na2O ratio on the low calcium alkali activated binder based on fly ash.
Mater. Chem. Phys. 258, 123846.
https://doi.org/10.1016/j.matchemphys.2020.123846
Borg Costanzi, C., Ahmed, Z.Y., Schipper, H.R., Bos, F.P., Knaack, U., Wolfs, R.J.M.,
2018. 3D Printing Concrete on temporary surfaces: The design and fabrication of a
concrete shell structure. Autom. Constr. 94, 395–404.
https://doi.org/10.1016/j.autcon.2018.06.013
Bong, S.H., Nematollahi, B., Nazari, A., Xia, M., Sanjayan, J., 2019. Method of
optimisation for ambient temperature cured sustainable geopolymers for 3D printing
construction applications. Materials (Basel). 12, 902.
https://doi.org/10.3390/ma12060902
Borges, P.H.R., Bhutta, A., Bavuzo, L.T., Banthia, N., 2017. Effect of SiO2/Al2O3 molar
ratio on mechanical behavior and capillary sorption of MK-based alkali-activated
composites reinforced with PVA fibers. Mater. Struct. Constr. 50, 1–12.
https://doi.org/10.1617/s11527-017-1021-y
Bos, F., Wolfs, R., Ahmed, Z., Salet, T., 2016. Additive manufacturing of concrete in
construction: potentials and challenges of 3D concrete printing. Virtual Phys.
Prototyp. 11, 209–225. https://doi.org/10.1080/17452759.2016.1209867
Brantervik, K., Berg, A., Niklasson, G.A., Hedberg, B., Nilsson, L.O., 1990. Percolation
effects in the electrical conductivity of porous cement mortar. Epl 13, 549–554.
https://doi.org/10.1209/0295-5075/13/6/013
British Standards Institution, 1999. Products and systems for the protection and repair of
concrete structures - Test methods - Measurement of bond strength by pull-off.
British Standards Institution, 2016. BS EN 196-3:2016 Methods of Testing Cement. Part
3: Determination of Setting Time and Soundness. London.
Buswell, R.A., Silva, W.R.L. De, Jones, S.Z., Dirrenberger, J., 2018. 3D printing using
concrete extrusion : A roadmap for research. Cem. Concr. Res. 112, 37–49.
https://doi.org/10.1016/j.cemconres.2018.05.006
Cai, J., Li, X., Tan, J., Vandevyvere, B., 2020a. Thermal and compressive behaviors of
fly ash and metakaolin-based geopolymer. J. Build. Eng. 30, 101307.
https://doi.org/10.1016/j.jobe.2020.101307
Cai, J., Pan, J., Li, X., Tan, J., Li, J., 2020b. Electrical resistivity of fly ash and metakaolin
based geopolymers. Constr. Build. Mater. 234, 117868.

247
https://doi.org/10.1016/j.conbuildmat.2019.117868
Cai, J., Tan, J., Li, X., 2020c. Thermoelectric behaviors of fly ash and metakaolin based
geopolymer. Constr. Build. Mater. 237, 117757.
https://doi.org/10.1016/j.conbuildmat.2019.117757
Candamano, S., Sgambitterra, E., Lamuta, C., Pagnotta, L., Chakraborty, S., Crea, F.,
2019. Graphene nanoplatelets in geopolymeric systems: A new dimension of
nanocomposites. Mater. Lett. 236, 550–553.
https://doi.org/10.1016/j.matlet.2018.11.022
Cawley, P., 2018. Structural health monitoring : Closing the gap between research and
industrial deployment. Struct. Heal. Monit. 175, 1225–1244.
https://doi.org/10.1177/1475921717750047
Chang, C., Song, G., Gao, D., Mo, Y.L., 2013. Temperature and mixing effects on
electrical resistivity of carbon fiber enhanced concrete. Smart Mater. Struct. 22.
https://doi.org/10.1088/0964-1726/22/3/035021
Chaves Figueiredo, S., Romero Rodríguez, C., Ahmed, Z.Y., Bos, D.H., Xu, Y., Salet,
T.M., Çopuroğlu, O., Schlangen, E., Bos, F.P., 2019. An approach to develop
printable strain hardening cementitious composites. Mater. Des. 169, 107651.
https://doi.org/10.1016/j.matdes.2019.107651
Chen, B., Wu, K., Yao, W., 2004. Conductivity of carbon fiber reinforced cement-based
composites. Cem. Concr. Compos. 26, 291–297. https://doi.org/10.1016/S0958-
9465(02)00138-5
Chen, L., Wang, Z., Wang, Y., Feng, J., 2016. Preparation and properties of alkali
activated metakaolin-based geopolymer. Materials (Basel). 9, 1–12.
https://doi.org/10.3390/ma9090767
Chen, M., Li, L., Wang, J., Huang, Y., Wang, S., Zhao, P., Lu, L., Cheng, X., 2020.
Rheological parameters and building time of 3D printing sulphoaluminate cement
paste modified by retarder and diatomite. Constr. Build. Mater. 234.
https://doi.org/10.1016/j.conbuildmat.2019.117391
Chen, S., Li, Y., Yan, D., Wu, C., Leventis, N., 2019. Piezoresistive geopolymer enabled
by crack-surface coating. Mater. Lett. 255, 1–4.
https://doi.org/10.1016/j.matlet.2019.126582
Chen, Y., Li, Z., Figueiredo, S.C., Çopuroğlu, O., Veer, F., Schlangen, E., 2019.
Limestone and Calcined Clay-Based Sustainable Cementitious Materials for 3D
Concrete Printing: A Fundamental Study of Extrudability and Early-Age Strength
Development. Appl. Sci. 9. https://doi.org/10.3390/app9091809
Cheng, H., Lin, K.-L., Cui, R., Hwang, C.-L., Chang, Y.-M., Cheng, T.-W., 2015. The
effects of SiO2/Na2O molar ratio on the characteristics of alkali-activated waste
catalyst–metakaolin based geopolymers. Constr. Build. Mater. 95, 710–720.
https://doi.org/10.1016/J.CONBUILDMAT.2015.07.028

248
Chi, M., 2012. Effects of dosage of alkali-activated solution and curing conditions on the
properties and durability of alkali-activated slag concrete. Constr. Build. Mater. 35,
240–245. https://doi.org/10.1016/j.conbuildmat.2012.04.005
Chiarello, M., Zinno, R., 2005. Electrical conductivity of self-monitoring CFRC. Cem.
Concr. Compos. 27, 463–469. https://doi.org/10.1016/j.cemconcomp.2004.09.001
Choo, H., Lim, S., Lee, W., Lee, C., 2016. Compressive strength of one-part alkali
activated fly ash using red mud as alkali supplier. Constr. Build. Mater. 125, 21–28.
https://doi.org/10.1016/j.conbuildmat.2016.08.015
Chougan, M., Hamidreza Ghaffar, S., Jahanzat, M., Albar, A., Mujaddedi, N., Swash, R.,
2020. The influence of nano-additives in strengthening mechanical performance of
3D printed multi-binder geopolymer composites. Constr. Build. Mater. 250, 118928.
https://doi.org/10.1016/j.conbuildmat.2020.118928
Chougan, M., Ghaffar, S.H., Sikora, P., Chung, S., Rucinska, T., Stephan, D., Albar, A.,
Swash, M.R., 2021. Investigation of additive incorporation on rheological ,
microstructural and mechanical properties of 3D printable alkali-activated materials.
Mater. Des. 202, 109574. https://doi.org/10.1016/j.matdes.2021.109574
Chuang, W., Geng-sheng, J., Bing-liang, L., Lei, P., Ying, F., Ni, G., Ke-zhi, L., 2017.
Dispersion of carbon fibers and conductivity of carbon fiber-reinforced cement-
based composites. Ceram. Int. 43, 15122–15132.
https://doi.org/10.1016/j.ceramint.2017.08.041
Chung, D.D.L., 2021. Self-sensing concrete: from resistance-based sensing to
capacitance-based sensing. Int. J. Smart Nano Mater. 12, 1–19.
https://doi.org/10.1080/19475411.2020.1843560
Chung, D.D.L., 2002. Piezoresistive cement-based materials for strain sensing. J. Intell.
Mater. Syst. Struct. 13, 599–609. https://doi.org/10.1106/104538902031861
Coppola, L., Coffetti, D., Crotti, E., Gazzaniga, G., Pastore, T., 2020. The durability of
one-part alkali-activated slag-based mortars in different environments. Sustain. 12.
https://doi.org/10.3390/SU12093561
Courard, L., Degeimbre, R., 2004. A capillary action test for the investigation of adhesion
in repair technology. Can. J. Civ. Eng. 30, 1101–1110. https://doi.org/10.1139/l03-
061
Courard, L., 2005. Adhesion of repair systems to concrete : influence of interfacial
topography and transport phenomena. Mag. Concr. Res. 57, 273–282.
https://doi.org/10.1680/macr.57.5.273.64285
Courard, L., Piotrowski, T., Garbacz, A., 2014. Near-to-surface properties affecting bond
strength in concrete repair. Cem. Concr. Compos. 46, 73–80.
https://doi.org/10.1016/j.cemconcomp.2013.11.005
Criado, M., Palomo, A., Ferna, A., 2005. Alkali activation of fly ashes . Part 1 : Effect of
curing conditions on the carbonation of the reaction products. Fuel 84, 2048–2054.

249
https://doi.org/10.1016/j.fuel.2005.03.030
Cui, X.M., Zheng, G.J., Han, Y.C., Su, F., Zhou, J., 2008. A study on electrical
conductivity of chemosynthetic Al2O3-2SiO2geoploymer materials. J. Power
Sources 184, 652–656. https://doi.org/10.1016/j.jpowsour.2008.03.021
D’Alessandro, A., Coffetti, D., Crotti, E., Coppola, L., Meoni, A., Ubertini, F., 2020. Self-
Sensing Properties of Green Alkali-Activated Binders with Carbon-Based
Nanoinclusions. Sustainabiilityy 12, 9916.
https://doi.org/doi.org/10.3390/su12239916
D’Alessandro, A., Rallini, M., Ubertini, F., Materazzi, A.L., Kenny, J.M., 2016.
Investigations on scalable fabrication procedures for self-sensing carbon nanotube
cement-matrix composites for SHM applications. Cem. Concr. Compos. 65, 200–
213. https://doi.org/10.1016/j.cemconcomp.2015.11.001
Dai, X., Aydın, S., Yardimci, M.Y., Lesage, K., Schutter, G. De, 2020. Effects of activator
properties and GGBFS/FA ratio on the structural build-up and rheology of AAC.
Cem. Concr. Res. 138, 106253. https://doi.org/10.1016/j.cemconres.2020.106253
Dassekpo, J.M., Zha, X., Zhan, J., Ning, J., 2017. The effects of the sequential addition of
synthesis parameters on the performance of alkali activated fly ash mortar. Results
Phys. 7, 1506–1512. https://doi.org/10.1016/j.rinp.2017.04.019
Davidovits, J., 1989. Geopolymers and geopolymeric materials. J. Therm. Anal. 35, 429–
441. https://doi.org/10.1007/BF01904446
Davidovits, J., 1991. Geopolymers: inorganic polymeric new materials. J. Therm. Anal.
37, 1633–1656. https://doi.org/10.1007/BF01912193
Davidovits, J., Huaman, L., Davidovits, R., 2019. Ancient geopolymer in south-American
monument. SEM and petrographic evidence. Mater. Lett. 235, 120–124.
https://doi.org/10.1016/j.matlet.2018.10.033
De Focatiis, D.S.A., Hull, D., Sanchez-Valencia, A., 2012. Roles of prestrain and
hysteresis on piezoresistance in conductive elastomers for strain sensor applications.
Plast. Rubber Compos. 41, 301–309.
https://doi.org/10.1179/1743289812Y.0000000022
De Vargas, A.S., Dal Molin, D.C.C., Vilela, A.C.F., Silva, F.J. Da, Pavão, B., Veit, H.,
2011. The effects of Na2O/SiO2 molar ratio, curing temperature and age on
compressive strength, morphology and microstructure of alkali-activated fly ash-
based geopolymers. Cem. Concr. Compos. 33, 653–660.
https://doi.org/10.1016/j.cemconcomp.2011.03.006
Dehghanpour, H., Yilmaz, K., 2020. Investigation of specimen size, geometry and
temperature effects on resistivity of electrically conductive concretes. Constr. Build.
Mater. 250, 118864. https://doi.org/10.1016/j.conbuildmat.2020.118864
Demircilioğlu, E., Teomete, E., Schlangen, E., Baeza, F.J., 2019. Temperature and
moisture effects on electrical resistance and strain sensitivity of smart concrete.

250
Constr. Build. Mater. 224, 420–427.
https://doi.org/10.1016/j.conbuildmat.2019.07.091
Deng, L., Ma, Y., Hu, J., Yin, S., Ouyang, X., Fu, J., Liu, A., Zhang, Z., 2019. Preparation
and piezoresistive properties of carbon fiber-reinforced alkali-activated fly ash/slag
mortar. Constr. Build. Mater. 222, 738–749.
https://doi.org/10.1016/j.conbuildmat.2019.06.134
Diggs-McGee, B.N., Kreiger, E.L., Kreiger, M.A., Case, M.P., 2019. Print time vs.
elapsed time: A temporal analysis of a continuous printing operation for additive
constructed concrete. Addit. Manuf. 28, 205–214.
https://doi.org/10.1016/j.addma.2019.04.008
Ding, S., Dong, S., Ashour, A., Han, B., 2019a. Development of sensing concrete:
Principles, properties and its applications. J. Appl. Phys. 126.
https://doi.org/10.1063/1.5128242
Ding, S., Ruan, Y., Yu, X., Han, B., Ni, Y., 2019b. Self-monitoring of smart concrete
column incorporating CNT/NCB composite fillers modified cementitious sensors.
Constr. Build. Mater. 201, 127–137.
https://doi.org/10.1016/j.conbuildmat.2018.12.203
Ding, S., Ruan, Y., Yu, X., Han, B., Ni, Y.Q., 2019c. Self-monitoring of smart concrete
column incorporating CNT/NCB composite fillers modified cementitious sensors.
Constr. Build. Mater. 201, 127–137.
https://doi.org/10.1016/j.conbuildmat.2018.12.203
Dong, B., Qiu, Q., Xiang, J., Huang, C., Sun, H., Xing, F., Liu, W., 2015. Electrochemical
impedance interpretation of the carbonation behavior for fly ash – slag – cement
materials 93, 933–942. https://doi.org/10.1016/j.conbuildmat.2015.05.066
Dong, W., Li, W., Lu, N., Qu, F., Vessalas, K., Sheng, D., 2019a. Piezoresistive
behaviours of cement-based sensor with carbon black subjected to various
temperature and water content. Compos. Part B Eng. 178.
https://doi.org/10.1016/j.compositesb.2019.107488
Dong, W., Li, W., Tao, Z., Wang, K., 2019b. Piezoresistive properties of cement-based
sensors : Review and perspective. Constr. Build. Mater. 203, 146–163.
https://doi.org/10.1016/j.conbuildmat.2019.01.081
Downey, A., D’Alessandro, A., Laflamme, S., Ubertini, F., 2018. Smart bricks for strain
sensing and crack detection in masonry structures. Smart Mater. Struct. 27.
https://doi.org/10.1088/1361-665X/aa98c2
Duxson, P., Provis, J.L., Lukey, G.C., Mallicoat, S.W., Kriven, W.M., Van Deventer,
J.S.J., 2005a. Understanding the relationship between geopolymer composition,
microstructure and mechanical properties. Colloids Surfaces A Physicochem. Eng.
Asp. 269, 47–58. https://doi.org/10.1016/j.colsurfa.2005.06.060
Duxson, P., Provis, J.L., Lukey, G.C., Separovic, F., Van Deventer, J.S.J., 2005b. 29Si
NMR study of structural ordering in aluminosilicate geopolymer gels. Langmuir 21,
251
3028–3036. https://doi.org/10.1021/la047336x
Duxson, P., Fernández-Jiménez, A., Provis, J.L., Lukey, G.C., Palomo, A., Van Deventer,
J.S.J., 2007a. Geopolymer technology: The current state of the art. J. Mater. Sci. 42,
2917–2933. https://doi.org/10.1007/s10853-006-0637-z
Duxson, P., Mallicoat, S.W., Lukey, G.C., Kriven, W.M., van Deventer, J.S.J., 2007b.
The effect of alkali and Si/Al ratio on the development of mechanical properties of
metakaolin-based geopolymers. Colloids Surfaces A Physicochem. Eng. Asp. 292,
8–20. https://doi.org/10.1016/j.colsurfa.2006.05.044
Eaves, S., Gyi, D.E., Gibb, A.G.F., 2016. Building healthy construction workers: Their
views on health, wellbeing and better workplace design. Appl. Ergon. 54, 10–18.
https://doi.org/10.1016/j.apergo.2015.11.004
El-Sayegh, S., Romdhane, L., Manjikian, S., 2020. A critical review of 3D printing in
construction: benefits, challenges, and risks. Arch. Civ. Mech. Eng. 20, 1–25.
https://doi.org/10.1007/s43452-020-00038-w
Elahi, M.M.A., Hossain, M.M., Karim, M.R., Zain, M.F.M., Shearer, C., 2020. A review
on alkali-activated binders: Materials composition and fresh properties of concrete.
Constr. Build. Mater. 260, 119788.
https://doi.org/10.1016/j.conbuildmat.2020.119788
Engelhardt, G., 1989. Multinuclear solid-state NMR in silicate and zeolite chemistry.
Trends Anal. Chem. 8, 343–347. https://doi.org/10.1016/0165-9936(89)87043-8
Espera, A.H., Dizon, J.R.C., Chen, Q., Advincula, R.C., 2019. 3D-printing and advanced
manufacturing for electronics. Prog. Addit. Manuf. 4, 245–267.
https://doi.org/10.1007/s40964-019-00077-7
Fan, F., Liu, Z., Xu, G., Peng, H., Cai, C.S., 2018. Mechanical and thermal properties of
fly ash based geopolymers. Constr. Build. Mater. 160, 66–81.
https://doi.org/10.1016/j.conbuildmat.2017.11.023
Farhan, K.Z., Johari, M.A.M., Demirboğa, R., 2020. Assessment of important parameters
involved in the synthesis of geopolymer composites: A review. Constr. Build. Mater.
264. https://doi.org/10.1016/j.conbuildmat.2020.120276
Favier, A., Hot, J., Habert, G., Roussel, N., d’Espinose de Lacaillerie, J.-B., 2014. Flow
properties of MK-based geopolymer pastes. A comparative study with standard
Portland cement pastes. Soft Matter 10, 1134. https://doi.org/10.1039/c3sm51889b
Feng, S., Xiao, H., Zhang, R., Yang, C., 2020. Bond performance between substrate
concrete and repair mortar: Effect of carbon fibre and expansive agent. Constr. Build.
Mater. 250, 118830. https://doi.org/10.1016/j.conbuildmat.2020.118830
Fiala, L., Jerman, M., Rovnaník, P., Černý, R., 2017. Basic physical, mechanical and
electrical properties of electrically enhanced alkali-activated aluminosilicates. Mater.
Tehnol. 51, 1005–1009. https://doi.org/10.17222/mit.2017.051
Fiala, L., Petříková, M., Lin, W.T., Podolka, L., Černý, R., 2019. Self-heating ability of

252
geopolymers enhanced by carbon black admixtures at different voltage loads.
Energies 12. https://doi.org/10.3390/en12214121
Franchin, G., Scanferla, P., Zeffiro, L., Elsayed, H., Baliello, A., Giacomello, G., Pasetto,
M., Colombo, P., 2017. Direct ink writing of geopolymeric inks. J. Eur. Ceram. Soc.
37, 2481–2489. https://doi.org/10.1016/j.jeurceramsoc.2017.01.030
Fu, X., Chung, D.D.L., 1996. Self-monitoring of fatigue damage in carbon fiber reinforced
cement. Cem. Concr. Res. 26, 15–20.
Funke, K., Banhatti, R.D., 2006. Ionic motion in materials with disordered structures.
Solid State Ionics 177, 1551–1557. https://doi.org/10.1016/j.ssi.2005.12.037
Galao, O., Baeza, F.J., Zornoza, E., Garcés, P., 2014. Strain and damage sensing
properties on multifunctional cement composites with CNF admixture. Cem. Concr.
Compos. 46, 90–98. https://doi.org/10.1016/j.cemconcomp.2013.11.009
Gao, K., Lin, K.L., Wang, D., Hwang, C.L., Shiu, H.S., Chang, Y.M., Cheng, T.W., 2014.
Effects SiO2/Na2O molar ratio on mechanical properties and the microstructure of
nano-SiO2 metakaolin-based geopolymers. Constr. Build. Mater. 53, 503–510.
https://doi.org/10.1016/j.conbuildmat.2013.12.003
Gerber, M., Weaver, C., Aygun, L.E., Verma, N., Sturm, J.C., Glišić, B., 2018. Strain
transfer for optimal performance of sensing sheet. Sensors 18, 1–16.
https://doi.org/10.3390/s18061907
Ghilan, A., Chiriac, A.P., Nita, L.E., Rusu, A.G., Neamtu, I., Chiriac, V.M., 2020. Trends
in 3D Printing Processes for Biomedical Field: Opportunities and Challenges. J.
Polym. Environ. 28, 1345–1367. https://doi.org/10.1007/s10924-020-01722-x
Gluth, G.J.G., Arbi, K., Bernal, S.A., Bondar, D., Castel, A., Chithiraputhiran, S.,
Dehghan, A., Dombrowski-Daube, K., Dubey, A., Ducman, V., Peterson, K.,
Pipilikaki, P., Valcke, S.L.A., Ye, G., Zuo, Y., Provis, J.L., 2020. RILEM TC 247-
DTA round robin test: carbonation and chloride penetration testing of alkali-activated
concretes. Mater. Struct. Constr. 53, 1–17. https://doi.org/10.1617/s11527-020-
1449-3
Gosselin, C., Duballet, R., Roux, P., Gaudillière, N., Dirrenberger, J., Morel, P., 2016.
Large-scale 3D printing of ultra-high performance concrete - a new processing route
for architects and builders. Mater. Des. 100, 102–109.
https://doi.org/10.1016/j.matdes.2016.03.097
Gu, P., Xie, P., Beaudoin, J.J., Brousseau, R., 1992. A.C. impedance spectroscopy (I): A
new equivalent circuit model for hydrated portland cement paste. Cem. Concr. Res.
22, 833–840. https://doi.org/10.1016/0008-8846(92)90107-7
Gu, P., Xie, P., Beaudoin, J.J., Brousseau, R., 1993. A.C. impedance spectroscopy (II):
Microstructural characterization of hydrating cement-silica fume systems. Cem.
Concr. Res. 23, 157–168. https://doi.org/10.1016/0008-8846(93)90147-2
Gulicovski, J., Nenadovic, S., Kljajevic, L., Mirkovic, M., Nišavic, M., Kragovic, M.,

253
Stojmenovic, M., 2020. Geopolymer/CeO2 as Solid Electrolyte for IT-SOFC.
Polymers (Basel). 12.
Guo, X., Shi, H., Chen, L., Dick, W.A., 2010. Alkali-activated complex binders from class
C fly ash and Ca-containing admixtures 173, 480–486.
https://doi.org/10.1016/j.jhazmat.2009.08.110
Guo, X., Yang, J., Xiong, G., 2020. Influence of supplementary cementitious materials on
rheological properties of 3D printed fly ash based geopolymer. Cem. Concr. Compos.
114, 103820. https://doi.org/10.1016/j.cemconcomp.2020.103820
Habert, G., Ouellet-Plamondon, C., 2016. Recent update on the environmental impact of
geopolymers. RILEM Tech. Lett. 1, 17. https://doi.org/10.21809/rilemtechlett.v1.6
Haha, M. Ben, Lothenbach, B., Le Saout, G., Winnefeld, F., 2011. Influence of slag
chemistry on the hydration of alkali-activated blast-furnace slag - Part I: Effect of
MgO. Cem. Concr. Res. 41, 955–963.
https://doi.org/10.1016/j.cemconres.2011.05.002
Hajimohammadi, A., Provis, J.L., Van Deventer, J.S.J., 2010. Effect of alumina release
rate on the mechanism of geopolymer gel formation. Chem. Mater. 22, 5199–5208.
https://doi.org/10.1021/cm101151n
Hajimohammadi, A., Provis, J.L., Van Deventer, J.S.J., 2011. The effect of silica
availability on the mechanism of geopolymerisation. Cem. Concr. Res. 41, 210–216.
https://doi.org/10.1016/j.cemconres.2011.02.001
Hajimohammadi, A., van Deventer, J.S.J., 2017. Characterisation of One-Part
Geopolymer Binders Made from Fly Ash. Waste and Biomass Valorization 8, 225–
233. https://doi.org/10.1007/s12649-016-9582-5
Han, B., Ou, J., 2007. Embedded piezoresistive cement-based stress/strain sensor. Sensors
Actuators, A Phys. 138, 294–298. https://doi.org/10.1016/j.sna.2007.05.011
Han, B., Guan, X., Ou, J., 2007. Electrode design, measuring method and data acquisition
system of carbon fiber cement paste piezoresistive sensors. Sensors Actuators, A
Phys. 135, 360–369. https://doi.org/10.1016/j.sna.2006.08.003
Han, B.G., Han, B.Z., Ou, J.P., 2009. Experimental study on use of nickel powder-filled
Portland cement-based composite for fabrication of piezoresistive sensors with high
sensitivity. Sensors Actuators, A Phys. 149, 51–55.
https://doi.org/10.1016/j.sna.2008.10.001
Han, B., Yu, X., Ou, J., 2010a. Effect of water content on the piezoresistivity of
MWNT/cement composites. J. Mater. Sci. 45, 3714–3719.
https://doi.org/10.1007/s10853-010-4414-7
Han, B., Zhang, L., Ou, J., 2010b. Influence of water content on conductivity and
piezoresistivity of cement-based material with both carbon fiber and carbon black. J.
Wuhan Univ. Technol. Mater. Sci. Ed. 25, 147–151. https://doi.org/10.1007/s11595-
010-1147-z

254
Han, B., Zhang, K., Yu, X., Kwon, E., Ou, J., 2012. Electrical characteristics and pressure-
sensitive response measurements of carboxyl MWNT/cement composites. Cem.
Concr. Compos. 34, 794–800. https://doi.org/10.1016/j.cemconcomp.2012.02.012
Han, B., Zhang, K., Burnham, T., Kwon, E., Yu, X., 2013. Integration and road tests of a
self-sensing CNT concrete pavement system for traffic detection. Smart Mater. Struct.
22. https://doi.org/10.1088/0964-1726/22/1/015020
Han, B., Ding, S., Yu, X., 2015. Intrinsic self-sensing concrete and structures: A review.
Meas. J. Int. Meas. Confed. 59, 110–128.
https://doi.org/10.1016/j.measurement.2014.09.048
Han, B., Wang, Y., Ding, S., Yu, X., Zhang, L., Li, Z., Ou, J., 2017. Self-sensing
cementitious composites incorporated with botryoid hybrid nano-carbon materials
for smart infrastructures. J. Intell. Mater. Syst. Struct. 28, 699–727.
https://doi.org/10.1177/1045389X16657416
Hanjitsuwan, S., Chindaprasirt, P., Pimraksa, K., 2011. Electrical conductivity and
dielectric property of fly ash geopolymer pastes. Int. J. Miner. Metall. Mater. 18, 94–
99. https://doi.org/10.1007/s12613-011-0406-0
Hanjitsuwan, S., Hunpratub, S., Thongbai, P., Maensiri, S., Sata, V., Chindaprasirt, P.,
2014. Effects of NaOH concentrations on physical and electrical properties of high
calcium fly ash geopolymer paste. Cem. Concr. Compos. 45, 9–14.
https://doi.org/10.1016/j.cemconcomp.2013.09.012
Hansson, I.L.H., Hansson, C.M., 1985. Ion-conduction in cement-based materials. Cem.
Concr. Res. 15, 201–212. https://doi.org/10.1016/0008-8846(85)90031-6
He, J., Zhang, G., Hou, S., Cai, C.S., 2011. Geopolymer-Based Smart Adhesives for
Infrastructure Health Monitoring: Concept and Feasibility. J. Mater. Civ. Eng. 23,
100–109. https://doi.org/10.1061/(ASCE)MT.1943-5533.0000140
He, P., Wang, M., Fu, S., Jia, D., Yan, S., Yuan, J., Xu, J., Wang, P., Zhou, Y., 2016.
Effects of Si/Al ratio on the structure and properties of metakaolin based geopolymer.
Ceram. Int. 42, 14416–14422. https://doi.org/10.1016/j.ceramint.2016.06.033
Heras Murcia, D., Genedy, M., Reda Taha, M.M., 2020. Examining the significance of
infill printing pattern on the anisotropy of 3D printed concrete. Constr. Build. Mater.
262, 120559. https://doi.org/10.1016/j.conbuildmat.2020.120559
Hong, Y., Li, Z., Qiao, G., Ou, J., Cheng, W., 2018. Pressure sensitivity of multiscale
carbon-admixtures–enhanced cement-based composites. Nanomater. Nanotechnol. 8,
1–8. https://doi.org/10.1177/1847980418793529
Hossain, M.A., Zhumabekova, A., Paul, S.C., Kim, J.R., 2020. A review of 3D printing
in construction and its impact on the labor market. Sustainability 12, 8492.
https://doi.org/10.3390/su12208492
Huseien, G.F., Mirza, J., Ismail, M., Hussin, M.W., 2016. Influence of different curing
temperatures and alkali activators on properties of GBFS geopolymer mortars

255
containing fly ash and palm-oil fuel ash. Constr. Build. Mater. 125, 1229–1240.
https://doi.org/10.1016/j.conbuildmat.2016.08.153
Huseien, G.F., Shah, K.W., 2020. Durability and life cycle evaluation of self-compacting
concrete containing fly ash as GBFS replacement with alkali activation. Constr.
Build. Mater. 235, 117458. https://doi.org/10.1016/j.conbuildmat.2019.117458
Ismail, I., Bernal, S.A., Provis, J.L., San Nicolas, R., Hamdan, S., Van Deventer, J.S.J.,
2014. Modification of phase evolution in alkali-activated blast furnace slag by the
incorporation of fly ash. Cem. Concr. Compos. 45, 125–135.
https://doi.org/10.1016/j.cemconcomp.2013.09.006
Jiao, Z., Wang, Y., Zheng, W., Huang, W., 2018. Effect of Dosage of Alkaline Activator
on the Properties of Alkali-Activated Slag Pastes. Adv. Mater. Sci. Eng. 2018, 10–
12. https://doi.org/10.1155/2018/8407380
Junaid, M.T., Kayali, O., Khennane, A., Black, J., 2015. A mix design procedure for low
calcium alkali activated fly ash-based concretes. Constr. Build. Mater. 79, 301–310.
https://doi.org/10.1016/j.conbuildmat.2015.01.048
Juricic, B.B., Galic, M., Marenjak, S., 2021. Review of the Construction Labour Demand
and Shortages in the EU. Buildings 11, 17.
https://doi.org/10.3390/buildings11010017
Kamseu, E., Beleuk à Moungam, L.M., Cannio, M., Billong, N., Chaysuwan, D., Melo,
U.C., Leonelli, C., 2017. Substitution of sodium silicate with rice husk ash-NaOH
solution in metakaolin based geopolymer cement concerning reduction in global
warming. J. Clean. Prod. 142, 3050–3060.
https://doi.org/10.1016/j.jclepro.2016.10.164
Kan, L. li, Lv, J. wei, Duan, B. bei, Wu, M., 2019. Self-healing of Engineered Geopolymer
Composites prepared by fly ash and metakaolin. Cem. Concr. Res. 125, 105895.
https://doi.org/10.1016/j.cemconres.2019.105895
Kastiukas, G., Ruan, S., Liang, S., Zhou, X., 2020. Development of precast geopolymer
concrete via oven and microwave radiation curing with an environmental assessment.
J. Clean. Prod. 255, 120290. https://doi.org/10.1016/j.jclepro.2020.120290
Kazemian, A., Yuan, X., Cochran, E., Khoshnevis, B., 2017. Cementitious materials for
construction-scale 3D printing: Laboratory testing of fresh printing mixture. Constr.
Build. Mater. 145, 639–647. https://doi.org/10.1016/j.conbuildmat.2017.04.015
Kenne Diffo, B.B., Elimbi, A., Cyr, M., Dika Manga, J., Tchakoute Kouamo, H., 2015.
Effect of the rate of calcination of kaolin on the properties of metakaolin-based
geopolymers. J. Asian Ceram. Soc. 3, 130–138.
https://doi.org/10.1016/j.jascer.2014.12.003
Khan, M.N.N., Sarker, P.K., 2020. Effect of waste glass fine aggregate on the strength,
durability and high temperature resistance of alkali-activated fly ash and GGBFS
blended mortar. Constr. Build. Mater. 263, 120177.
https://doi.org/10.1016/j.conbuildmat.2020.120177

256
Khater, H.M., Abd El Gawaad, H.A., 2016. Characterization of alkali activated
geopolymer mortar doped with MWCNT. Constr. Build. Mater. 102, 329–337.
https://doi.org/10.1016/j.conbuildmat.2015.10.121
Khan, M.N.N., Kuri, J.C., Sarker, P.K., 2021. Effect of waste glass powder as a partial
precursor in ambient cured alkali activated fly ash and fly ash-GGBFS mortars. J.
Build. Eng. 34, 101934. https://doi.org/10.1016/j.jobe.2020.101934
Khoshnevis, B., 2004. Automated construction by contour crafting - Related robotics and
information technologies. Autom. Constr. 13, 5–19.
https://doi.org/10.1016/j.autcon.2003.08.012
Kim, G.M., Yang, B.J., Cho, K.J., Kim, E.M., Lee, H.K., 2017. Influences of CNT
dispersion and pore characteristics on the electrical performance of cementitious
composites. Compos. Struct. 164, 32–42.
https://doi.org/10.1016/j.compstruct.2016.12.049
Kobera, L., Slavík, R., Koloušek, D., Urbanová, M., Kotek, J., Brus, J., 2011. Structural
stability of aluminosilicate inorganic polymers: Influence of the preparation
procedure. Ceram. - Silikaty 55, 343–354.
Komljenović, M., Tanasijević, G., Džunuzović, N., Provis, J.L., 2020. Immobilization of
cesium with alkali-activated blast furnace slag. J. Hazard. Mater. 388.
https://doi.org/10.1016/j.jhazmat.2019.121765
Komnitsas, K., Zaharaki, D., Vlachou, A., Bartzas, G., Galetakis, M., 2015. Effect of
synthesis parameters on the quality of construction and demolition wastes (CDW)
geopolymers. Adv. Powder Technol. 26, 368–376.
https://doi.org/10.1016/j.apt.2014.11.012
Kondepudi, K., Subramaniam, K.V.L., 2021. Formulation of alkali-activated fly ash-slag
binders for 3D concrete printing. Cem. Concr. Compos. 119, 103983.
https://doi.org/10.1016/j.cemconcomp.2021.103983
Kong, Q., Fan, S., Bai, X., Mo, Y.L., Song, G., 2017. A novel embeddable spherical smart
aggregate for structural health monitoring: Part I. Fabrication and electrical
characterization. Smart Mater. Struct. 26. https://doi.org/10.1088/1361-665X/aa80bc
Konsta-Gdoutos, M.S., Aza, C.A., 2014. Self sensing carbon nanotube (CNT) and
nanofiber (CNF) cementitious composites for real time damage assessment in smart
structures. Cem. Concr. Compos. 53, 162–169.
https://doi.org/10.1016/j.cemconcomp.2014.07.003
Kosson, M., Brown, L., Sanchez, F., 2020. Early-Age Performance of 3D Printed Carbon
Nanofiber and Carbon Microfiber Cement Composites. Transp. Res. Rec. 2674, 10–
20. https://doi.org/10.1177/0361198120902704
Koutník, P., Soukup, A., Bezucha, P., Šafář, J., Kohout, J., 2020. Low viscosity
metakaolinite based geopolymer binders. Constr. Build. Mater. 230.
https://doi.org/10.1016/j.conbuildmat.2019.116978

257
Kramar, S., Šajna, A., Ducman, V., 2016. Assessment of alkali activated mortars based
on different precursors with regard to their suitability for concrete repair. Constr.
Build. Mater. 124, 937–944. https://doi.org/10.1016/j.conbuildmat.2016.08.018
Krivenko, P., 2017. Why alkaline activation - 60 years of the theory and practice of alkali-
activated materials. J. Ceram. Sci. Technol. 8, 323–333.
https://doi.org/10.4416/JCST2017-00042
Kruger, J., Cho, S., Zeranka, S., Viljoen, C., van Zijl, G., 2020. 3D concrete printer
parameter optimisation for high rate digital construction avoiding plastic collapse.
Compos. Part B Eng. 183. https://doi.org/10.1016/j.compositesb.2019.107660
Kubba, Z., Fahim Huseien, G., Sam, A.R.M., Shah, K.W., Asaad, M.A., Ismail, M., Tahir,
M.M., Mirza, J., 2018. Impact of curing temperatures and alkaline activators on
compressive strength and porosity of ternary blended geopolymer mortars. Case Stud.
Constr. Mater. 9, e00205. https://doi.org/10.1016/j.cscm.2018.e00205
Kuenzel, C., Vandeperre, L.J., Donatello, S., Boccaccini, A.R., Cheeseman, C., 2012.
Ambient temperature drying shrinkage and cracking in metakaolin-based
geopolymers. J. Am. Ceram. Soc. 95, 3270–3277. https://doi.org/10.1111/j.1551-
2916.2012.05380.x
Kuenzel, C., Li, L., Vandeperre, L., Boccaccini, A.R., Cheeseman, C.R., 2014. Influence
of sand on the mechanical properties of metakaolin geopolymers. Constr. Build.
Mater. 66, 442–446. https://doi.org/10.1016/j.conbuildmat.2014.05.058
Kultayeva, S., Ha, J.H., Malik, R., Kim, Y.W., Kim, K.J., 2020. Effects of porosity on
electrical and thermal conductivities of porous SiC ceramics. J. Eur. Ceram. Soc. 40,
996–1004. https://doi.org/10.1016/j.jeurceramsoc.2019.11.045
Kusak, I., Lunak, M., 2017. On the effect of addition of carbon nanotubes on the electric
conductivity of alkali-activated slag mortars. IOP Conf. Ser. Mater. Sci. Eng. 246,
012044. https://doi.org/10.1088/1757-899X/246/1/012044
Labonnote, N., Rønnquist, A., Manum, B., Rüther, P., 2016. Additive construction: State-
of-the-art, challenges and opportunities. Autom. Constr. 72, 347–366.
https://doi.org/10.1016/j.autcon.2016.08.026
Lahoti, M., Narang, P., Tan, K.H., Yang, E.H., 2017. Mix design factors and strength
prediction of metakaolin-based geopolymer. Ceram. Int. 43, 11433–11441.
https://doi.org/10.1016/j.ceramint.2017.06.006
Lamuta, C., Candamano, S., Crea, F., Pagnotta, L., 2016. Direct piezoelectric effect in
geopolymeric mortars. Mater. Des. 107, 57–64.
https://doi.org/10.1016/j.matdes.2016.05.108
Lamuta, C., Bruno, L., Candamano, S., Pagnotta, L., 2017. Piezoresistive characterization
of graphene/metakaolin based geopolymeric mortar composites. MRS Adv. 2, 3773–
3779. https://doi.org/10.1557/adv.2017.595
Lasia, A., 2014. Electrochemical Impedance Spectroscopy and its Applications. Springer.

258
https://doi.org/10.1007/978-1-4614-8933-7
Le, T.T., Austin, S.A., Lim, S., Buswell, R.A., Gibb, A.G.F., Thorpe, T., 2012a. Mix
design and fresh properties for high-performance printing concrete. Mater. Struct.
Constr. 45, 1221–1232. https://doi.org/10.1617/s11527-012-9828-z
Le, T.T., Austin, S.A., Lim, S., Buswell, R.A., Law, R., Gibb, A.G.F., Thorpe, T., 2012b.
Hardened properties of high-performance printing concrete. Cem. Concr. Res. 42,
558–566. https://doi.org/10.1016/j.cemconres.2011.12.003
Lee, S.Y., Le, H.V., Kim, D.J., 2019. Self-stress sensing smart concrete containing fine
steel slag aggregates and steel fibers under high compressive stress. Constr. Build.
Mater. 220, 149–160. https://doi.org/10.1016/j.conbuildmat.2019.05.197
Leech D.J., Guy, W., Klein, S., 2020. The polychromatic woodburytype—colour tracking
in translucent, patterned gelatin/pigment films. Molecules 25.
https://doi.org/10.3390/molecules25112468
Li, H., Xiao, H., Ou, J., 2006. Effect of compressive strain on electrical resistivity of
carbon black-filled cement-based composites. Cem. Concr. Compos. 28, 824–828.
https://doi.org/10.1016/j.cemconcomp.2006.05.004
Li, J., Wee, B., Tay, Y., Lei, J., Yang, E., 2021. Experimental investigation of Seebeck
effect in metakaolin-based geopolymer. Constr. Build. Mater. 272, 121615.
https://doi.org/10.1016/j.conbuildmat.2020.121615
Li, X., Li, M., 2019. Multifunctional self-sensing and ductile cementitious materials. Cem.
Concr. Res. 123, 105714. https://doi.org/10.1016/j.cemconres.2019.03.008
Li, X., Rao, F., Song, S., Corona-Arroyo, M.A., Ortiz-Lara, N., Aguilar-Reyes, E.A., 2018.
Effects of aggregates on the mechanical properties and microstructure of geothermal
metakaolin-based geopolymers. Results Phys. 11, 267–273.
https://doi.org/10.1016/j.rinp.2018.09.018
Li, Z., Hojati, M., Wu, Z., Piasente, J., Ashrafi, N., Duarte, J.P., Nazarian, S., Bilen, S.G.,
Memari, A.M., Radlinska, A., 2020. Fresh and Hardened Properties of Extrusion-
Based 3D-Printed Cementitious Materials: A Review. Sustainability 12, 1–33.
https://doi.org/10.3390/su12145628
Liang, K., Zeng, X., Zhou, X., Qu, F., Wang, P., 2017. A new model for the electrical
conductivity of cement-based material by considering pore size distribution. Mag.
Concr. Res. 69, 1067–1078. https://doi.org/10.1680/jmacr.16.00535
Liew, Y.M., Heah, C.Y., Li, L. yuan, Jaya, N.A., Abdullah, M.M.A.B., Tan, S.J., Hussin,
K., 2017. Formation of one-part-mixing geopolymers and geopolymer ceramics from
geopolymer powder. Constr. Build. Mater. 156, 9–18.
https://doi.org/10.1016/j.conbuildmat.2017.08.110
Lim, S., Buswell, R.A., Le, T.T., Austin, S.A., Gibb, A.G.F., Thorpe, T., 2012.
Developments in construction-scale additive manufacturing processes. Autom.
Constr. 21, 262–268. https://doi.org/10.1016/j.autcon.2011.06.010

259
Lim, S., Buswell, R.A., Valentine, P.J., Piker, D., Austin, S.A., De Kestelier, X., 2016.
Modelling curved-layered printing paths for fabricating large-scale construction
components. Addit. Manuf. 12, 216–230.
https://doi.org/10.1016/j.addma.2016.06.004
Liu, J., Li, X., Lu, Y., Bai, X., 2020. Effects of Na/Al ratio on mechanical properties and
microstructure of red mud-coal metakaolin geopolymer. Constr. Build. Mater. 263,
120653. https://doi.org/10.1016/j.conbuildmat.2020.120653
Liu, K., Cheng, X., Li, J., Gao, X., Cao, Y., Guo, X., Zhuang, J., Zhang, C., 2019. Effects
of microstructure and pore water on electrical conductivity of cement slurry during
early hydration. Compos. Part B Eng. 177, 107435.
https://doi.org/10.1016/j.compositesb.2019.107435
Liu, Q., Gao, R., Tam, V.W.Y., Li, W., Xiao, J., 2018. Strain monitoring for a bending
concrete beam by using piezoresistive cement-based sensors. Constr. Build. Mater.
167, 338–347. https://doi.org/10.1016/j.conbuildmat.2018.02.048
Lloyd, R.R., 2009. Accelerated ageing of geopolymers, in: Provis, J.L., van Deventer,
J.S.J. (Eds.), Geopolymers Structure, Processing, Properties and Industrial
Applications. Woodhead Publishing Limited, pp. 139–166.
Lo Monte, F., Felicetti, R., Miah, M.J., 2019. The influence of pore pressure on fracture
behaviour of Normal-Strength and High-Performance Concretes at high temperature.
Cem. Concr. Compos. 104, 103388.
https://doi.org/10.1016/j.cemconcomp.2019.103388
Long, W.J., Tao, J.L., Lin, C., Gu, Y. cun, Mei, L., Duan, H.B., Xing, F., 2019. Rheology
and buildability of sustainable cement-based composites containing micro-
crystalline cellulose for 3D-printing. J. Clean. Prod. 239.
https://doi.org/10.1016/j.jclepro.2019.118054
Luan, C., Shi, X., Zhang, K., Utashev, N., Yang, F., Dai, J., Wang, Q., 2020. A mix design
method of fly ash geopolymer concrete based on factors analysis. Constr. Build.
Mater. 121612. https://doi.org/10.1016/j.conbuildmat.2020.121612
Ma, G., Li, Z., Wang, L., 2018. Printable properties of cementitious material containing
copper tailings for extrusion based 3D printing. Constr. Build. Mater. 162, 613–627.
https://doi.org/10.1016/j.conbuildmat.2017.12.051
Ma, G., Salman, N.M., Wang, L., Wang, F., 2020. A novel additive mortar leveraging
internal curing for enhancing interlayer bonding of cementitious composite for 3D
printing. Constr. Build. Mater. 244, 118305.
https://doi.org/10.1016/j.conbuildmat.2020.118305
Ma, X., Zhang, Z., Wang, A., 2016. The transition of fly ash-based geopolymer gels into
ordered structures and the effect on the compressive strength. Constr. Build. Mater.
104, 25–33. https://doi.org/10.1016/j.conbuildmat.2015.12.049
Ma, Y., Liu, W., Hu, J., Fu, J., Zhang, Z., Wang, H., 2020. Optimization on the
piezoresistivity of alkali-activated fly ash/slag mortar by using conductive aggregates

260
and carbon fibers. Cem. Concr. Compos. 114, 103735.
https://doi.org/10.1016/j.cemconcomp.2020.103735
Mabroum, S., Moukannaa, S., El Machi, A., Taha, Y., Benzaazoua, M., Hakkou, R., 2020.
Mine wastes based geopolymers: A critical review. Clean. Eng. Technol. 1, 100014.
https://doi.org/10.1016/j.clet.2020.100014
Machiels, L., Arnout, L., Jones, P.T., Blanpain, B., Pontikes, Y., 2014. Inorganic polymer
cement from fe-silicate glasses: Varying the activating solution to glass ratio. Waste
and Biomass Valorization 5, 411–428. https://doi.org/10.1007/s12649-014-9296-5
MacKenzie, K.J.D., Bolton, M.J., 2009. Electrical and mechanical properties of
aluminosilicate inorganic polymer composites with carbon nanotubes. J. Mater. Sci.
44, 2851–2857. https://doi.org/10.1007/s10853-009-3377-z
Mahmoodi, O., Siad, H., Lachemi, M., Dadsetan, S., Sahmaran, M., 2020. Optimization
of brick waste-based geopolymer binders at ambient temperature and pre-targeted
chemical parameters. J. Clean. Prod. 268, 122285.
https://doi.org/10.1016/j.jclepro.2020.122285
Manuel, J., Delgado, D., Oyedele, L., Ajayi, A., Akanbi, L., Akinade, O., Bilal, M.,
Owolabi, H., 2019. Robotics and automated systems in construction : Understanding
industry- specific challenges for adoption. J. Build. Eng. 26, 100868.
https://doi.org/10.1016/j.jobe.2019.100868
Marchment, T., Sanjayan, J., 2020. Mesh reinforcing method for 3D Concrete Printing.
Autom. Constr. 109. https://doi.org/10.1016/j.autcon.2019.102992
Marchment, T., Sanjayan, J., Xia, M., 2019. Method of enhancing interlayer bond strength
in construction scale 3D printing with mortar by effective bond area amplification.
Mater. Des. 169, 107684. https://doi.org/10.1016/j.matdes.2019.107684
Materazzi, A.L., Ubertini, F., D’Alessandro, A., 2013. Carbon nanotube cement-based
transducers for dynamic sensing of strain. Cem. Concr. Compos. 37, 2–11.
https://doi.org/10.1016/j.cemconcomp.2012.12.013
McAlorum, J., Perry, M., Vlachakis, C., Biondi, L., Lavoie, B., 2021a. Robotic spray
coating of self-sensing metakaolin geopolymer for concrete monitoring. Autom.
Constr. 121, 103415. https://doi.org/10.1016/j.autcon.2020.103415
McAlorum, J., Vlachakis, C., Perry, M., 2021b. A low-cost electrical impedance analyser
for interrogating self-sensing cement repairs, in: IEEE International Instrumentation
and Measurement Technology Conference. IEEE, Glasgow, pp. 1–6.
McCarter, W.J., Brousseau, R., 1990. The A.C. response of hardened cement paste. Cem.
Concr. Res. 20, 891–900. https://doi.org/10.1016/0008-8846(90)90051-X
Mechtcherine, V., Nerella, V.N., Will, F., Näther, M., Otto, J., Krause, M., 2019. Large-
scale digital concrete construction – CONPrint3D concept for on-site, monolithic
3D-printing. Autom. Constr. 107. https://doi.org/10.1016/j.autcon.2019.102933
Mendes, B.C., Pedroti, L.G., Vieira, C.M.F., Marvila, M., Azevedo, A.R.G., de Carvalho,
261
J.M.F., Ribeiro, J.C.L., 2021. Application of eco-friendly alternative activators in
alkali-activated materials: A review. J. Build. Eng. 35, 102010.
https://doi.org/10.1016/j.jobe.2020.102010
Mendoza Reales, O.A., Duda, P., Silva, E.C.C.M., Paiva, M.D.M., Filho, R.D.T., 2019.
Nanosilica particles as structural buildup agents for 3D printing with Portland cement
pastes. Constr. Build. Mater. 219, 91–100.
https://doi.org/10.1016/j.conbuildmat.2019.05.174
Meoni, A., D’Alessandro, A., Ubertini, F., 2020. Characterization of the strain-sensing
behavior of smart bricks: A new theoretical model and its application for monitoring
of masonry structural elements. Constr. Build. Mater. 250, 118907.
https://doi.org/10.1016/j.conbuildmat.2020.118907
Mo, B.H., Zhu, H., Cui, X.M., He, Y., Gong, S.Y., 2014. Effect of curing temperature on
geopolymerization of metakaolin-based geopolymers. Appl. Clay Sci. 99, 144–148.
https://doi.org/10.1016/j.clay.2014.06.024
Mobasher, N., Bernal, S.A., Provis, J.L., 2016. Structural evolution of an alkali sulfate
activated slag cement. J. Nucl. Mater. 468, 97–104.
https://doi.org/10.1016/j.jnucmat.2015.11.016
Moeini, M.A., Hosseinpoor, M., Yahia, A., 2020. Effectiveness of the rheometric methods
to evaluate the build-up of cementitious mortars used for 3D printing. Constr. Build.
Mater. 257, 119551. https://doi.org/10.1016/j.conbuildmat.2020.119551
Mohammad, M., Masad, E., Al-Ghamdi, S.G., 2020. 3D Concrete Printing Sustainability:
A Comparative Life Cycle Assessment of Four Construction Method Scenarios.
Buildings 10, 245. https://doi.org/10.3390/buildings10120245
Mohseni, E., 2018. Assessment of Na2SiO3 to NaOH ratio impact on the performance of
polypropylene fiber-reinforced geopolymer composites. Constr. Build. Mater. 186,
904–911. https://doi.org/10.1016/j.conbuildmat.2018.08.032
Moodi, F., Ramezanianpour, A.A., Safavizadeh, A.S., 2011. Evaluation of the optimal
process of thermal activation of kaolins. Sci. Iran. 18, 906–912.
https://doi.org/10.1016/j.scient.2011.07.011
Morgan, D.R., 1996. Compatibility of concrete repair materials and systems. Constr. Build.
Mater. 10, 57–67. https://doi.org/10.1016/0950-0618(95)00060-7
Muthukrishnan, S., Ramakrishnan, S., Sanjayan, J., 2021. Effect of alkali reactions on the
rheology of one-part 3D printable geopolymer concrete. Cem. Concr. Compos. 116,
103899. https://doi.org/10.1016/j.cemconcomp.2020.103899
Muthukrishnan, S., Ramakrishnan, S., Sanjayan, J., 2020. Effect of microwave heating on
interlayer bonding and buildability of geopolymer 3D concrete printing. Constr.
Build. Mater. 265, 120786. https://doi.org/10.1016/j.conbuildmat.2020.120786
Nair, S.A.O., Alghamdi, H., Arora, A., Mehdipour, I., Sant, G., Neithalath, N., 2019.
Linking fresh paste microstructure, rheology and extrusion characteristics of

262
cementitious binders for 3D printing. J. Am. Ceram. Soc. 102, 3951–3964.
https://doi.org/10.1111/jace.16305
Nedeljkovic, M., Li, Z., Ye, G., 2018. Setting, Strength, and Autogenous Shrinkage of
Alkali-Activated Fly Ash and Slag Pastes: Effect of Slag Content. Materials (Basel).
11, 2121. https://doi.org/10.3390/ma11112121
Nematollahi, B., Sanjayan, J., Shaikh, F.U.A., 2015. Synthesis of heat and ambient cured
one-part geopolymer mixes with different grades of sodium silicate. Ceram. Int. 41,
5696–5704. https://doi.org/10.1016/j.ceramint.2014.12.154
Nematollahi, B., Vijay, P., Sanjayan, J., Nazari, A., Xia, M., Nerella, V.N., Mechtcherine,
V., 2018. Effect of polypropylene fibre addition on properties of geopolymers made
by 3D printing for digital construction. Materials (Basel). 11.
https://doi.org/10.3390/ma11122352
Nerella, V. N., Hempel, S., Mechtcherine, V., 2019. Effects of layer-interface properties
on mechanical performance of concrete elements produced by extrusion-based 3D-
printing. Constr. Build. Mater. 104, 261–270.
https://doi.org/10.1016/j.matdes.2019.107651
Nerella, V.N., Näther, M., Iqbal, A., Butler, M., Mechtcherine, V., 2019. Inline
quantification of extrudability of cementitious materials for digital construction. Cem.
Concr. Compos. 95, 260–270. https://doi.org/10.1016/j.cemconcomp.2018.09.015
Nerella, V.N., Krause, M., Mechtcherine, V., 2020. Direct printing test for buildability of
3D-printable concrete considering economic viability. Autom. Constr. 109, 102986.
https://doi.org/10.1016/j.autcon.2019.102986
Nguyen, A.Q., Klysz, G., Deby, F., Balayssac, J.P., 2017. Evaluation of water content
gradient using a new configuration of linear array four-point probe for electrical
resistivity measurement. Cem. Concr. Compos. 83, 308–322.
https://doi.org/10.1016/j.cemconcomp.2017.07.020
Nuaklong, P., Jongvivatsakul, P., Pothisiri, T., Sata, V., Chindaprasirt, P., 2020. Influence
of rice husk ash on mechanical properties and fire resistance of recycled aggregate
high-calcium fly ash geopolymer concrete. J. Clean. Prod. 252, 119797.
https://doi.org/10.1016/j.jclepro.2019.119797
Nunes, V.A., Borges, P.H.R., Zanotti, C., 2019. Mechanical compatibility and adhesion
between alkali-activated repair mortars and Portland cement concrete substrate.
Constr. Build. Mater. 215, 569–581.
https://doi.org/10.1016/j.conbuildmat.2019.04.189
Ozer, I., Soyer-Uzun, S., 2015. Relations between the structural characteristics and
compressive strength in metakaolin based geopolymers with different molar Si/Al
ratios. Ceram. Int. 41, 10192–10198. https://doi.org/10.1016/j.ceramint.2015.04.125
Pacheco-Torgal, F., Castro-Gomes, J.P., Jalali, S., 2008. Adhesion characterization of
tungsten mine waste geopolymeric binder. Influence of OPC concrete substrate
surface treatment. Constr. Build. Mater. 22, 154–161.
263
https://doi.org/10.1016/j.conbuildmat.2006.10.005
Pacheco-Torgal, F., Moura, D., Ding, Y., Jalali, S., 2011. Composition, strength and
workability of alkali-activated metakaolin based mortars. Constr. Build. Mater. 25,
3732–3745. https://doi.org/10.1016/j.conbuildmat.2011.04.017
Padma Kumar, P., Yashonath, S., 2006. Ionic Conduction in the Solid State. ChemInform
37, 135–154. https://doi.org/10.1002/chin.200624229
Palmero, P., Formia, A., Antonaci, P., Brini, S., Tulliani, J.M., 2015. Geopolymer
technology for application-oriented dense and lightened materials. Elaboration and
characterization. Ceram. Int. 41, 12967–12979.
https://doi.org/10.1016/j.ceramint.2015.06.140
Panda, B., Chandra Paul, S., Jen Tan, M., 2017a. Anisotropic mechanical performance of
3D printed fiber reinforced sustainable construction material. Mater. Lett. 209, 146–
149. https://doi.org/10.1016/j.matlet.2017.07.123
Panda, B., Paul, S.C., Hui, L.J., Tay, Y.W.D., Tan, M.J., 2017b. Additive manufacturing
of geopolymer for sustainable built environment. J. Clean. Prod. 167, 281–288.
https://doi.org/10.1016/j.jclepro.2017.08.165
Panda, B., Tan, M.J., 2018. Experimental study on mix proportion and fresh properties of
fly ash based geopolymer for 3D concrete printing. Ceram. Int. 44, 10258–10265.
https://doi.org/10.1016/j.ceramint.2018.03.031
Panda, B., Paul, S.C., Mohamed, N.A.N., Tay, Y.W.D., Tan, M.J., 2018. Measurement of
tensile bond strength of 3D printed geopolymer mortar. Meas. J. Int. Meas. Confed.
113, 108–116. https://doi.org/10.1016/j.measurement.2017.08.051
Panda, B., Tan, M.J., 2019. Rheological behavior of high volume fly ash mixtures
containing micro silica for digital construction application. Mater. Lett. 237, 348–
351. https://doi.org/10.1016/j.matlet.2018.11.131
Panda, B., Mohamed, N.A.N., Paul, S.C., Singh, G.V.P.B., Tan, M.J., Šavija, B., 2019a.
The effect of material fresh properties and process parameters on buildability and
interlayer adhesion of 3D printed concrete. Materials (Basel). 12.
https://doi.org/10.3390/ma12132149
Panda, B., Ruan, S., Unluer, C., Tan, M.J., 2019b. Improving the 3D printability of high
volume fly ash mixtures via the use of nano attapulgite clay. Compos. Part B Eng.
165, 75–83. https://doi.org/10.1016/j.compositesb.2018.11.109
Panda, B., Singh, G.B., Unluer, C., Tan, M.J., 2019c. Synthesis and characterization of
one-part geopolymers for extrusion based 3D concrete printing. J. Clean. Prod. 220,
610–619. https://doi.org/10.1016/j.jclepro.2019.02.185
Panda, B., Unluer, C., Tan, M.J., 2019d. Extrusion and rheology characterization of
geopolymer nanocomposites used in 3D printing. Compos. Part B Eng. 176.
https://doi.org/10.1016/j.compositesb.2019.107290
Panda, B., Ruan, S., Unluer, C., Jen, M., 2020. Investigation of the properties of alkali-

264
activated slag mixes involving the use of nanoclay and nucleation seeds for 3D
printing. Compos. Part B 186, 107826.
https://doi.org/10.1016/j.compositesb.2020.107826
Park, S., Park, H.M., Yoon, H.N., Seo, J., Yang, C.-M., Provis, J.L., Yang, B., 2020.
Hydration kinetics and products of MgO-activated blast furnace slag. Constr. Build.
Mater. 249, 118700. https://doi.org/10.1016/j.conbuildmat.2020.118700
Paul, S.C., Tay, Y.W.D., Panda, B., Tan, M.J., 2018. Fresh and hardened properties of 3D
printable cementitious materials for building and construction. Arch. Civ. Mech. Eng.
18, 311–319. https://doi.org/10.1016/j.acme.2017.02.008
Payakaniti, P., Pinitsoontorn, S., Thongbai, P., Amornkitbamrung, V., 2017. Electrical
conductivity and compressive strength of carbon fiber reinforced fly ash
geopolymeric composites. Constr. Build. Mater. 135, 164–176.
https://doi.org/10.1016/j.conbuildmat.2016.12.198
Peng, L., Chan, A.H.S., 2020. Adjusting work conditions to meet the declined health and
functional capacity of older construction workers in Hong Kong. Saf. Sci. 127,
104711. https://doi.org/10.1016/j.ssci.2020.104711
Perrot, A., Pierre, A., Vitaloni, S., Picandet, V., 2015. Prediction of lateral form pressure
exerted by concrete at low casting rates. Mater. Struct. Constr. 48, 2315–2322.
https://doi.org/10.1617/s11527-014-0313-8
Perrot, A., Rangeard, D., Pierre, A., 2016. Structural built-up of cement-based materials
used for 3D-printing extrusion techniques. Mater. Struct. Constr. 49, 1213–1220.
https://doi.org/10.1617/s11527-015-0571-0
Perry, M., Saafi, M., Fusiek, G., Niewczas, P., 2015. Hybrid optical-fibre/geopolymer
sensors for structural health monitoring of concrete structures. Smart Mater. Struct.
24, 045011. https://doi.org/10.1088/0964-1726/24/4/045011
Perry, M., Saafi, M., Fusiek, G., Niewczas, P., 2016. Geopolymeric thermal conductivity
sensors for surface-mounting onto concrete structures, in: Environment, Efficiency
and Economic Challenges for Concrete. University of Dundee.
Peys, A., White, C.E., Olds, D., Rahier, H., Blanpain, B., Pontikes, Y., 2018. Molecular
structure of CaO–FeOx–SiO2 glassy slags and resultant inorganic polymer binders.
J. Am. Ceram. Soc. 101, 5846–5857. https://doi.org/10.1111/jace.15880
Peys, A., Douvalis, A.P., Hallet, V., Rahier, H., Blanpain, B., Pontikes, Y., 2019.
Inorganic Polymers From CaO-FeOx-SiO2 Slag: The Start of Oxidation of Fe and
the Formation of a Mixed Valence Binder. Front. Mater. 6, 1–10.
https://doi.org/10.3389/fmats.2019.00212
Pouhet, R., Cyr, M., 2016. Formulation and performance of flash metakaolin geopolymer
concretes. Constr. Build. Mater. 120, 150–160.
https://doi.org/10.1016/j.conbuildmat.2016.05.061
Pouhet, R., Cyr, M., Bucher, R., 2019. Influence of the initial water content in flash

265
calcined metakaolin-based geopolymer. Constr. Build. Mater. 201, 421–429.
https://doi.org/10.1016/j.conbuildmat.2018.12.201
Pour-Ghaz, M., Isgor, O.B., Ghods, P., 2009. The effect of temperature on the corrosion
of steel in concrete. Part 1: Simulated polarization resistance tests and model
development. Corros. Sci. 51, 415–425. https://doi.org/10.1016/j.corsci.2008.10.034
Prałat, K., Ciemnicka, J., Koper, A., Buczkowska, K.E., Łoś, P., 2021. Comparison of the
thermal properties of geopolymer and modified gypsum. Polymers (Basel). 13, 1–18.
https://doi.org/10.3390/polym13081220
Provis, J.L., Duxson, P., van Deventer, J.S.J., Lukey, G.C., 2005a. The role of
mathematical modelling and gel chemistry in advancing geopolymer technology.
Chem. Eng. Res. Des. 83, 853–860. https://doi.org/10.1205/cherd.04329
Provis, J.L., Duxson, P., Lukey, G.C., Van Deventer, J.S.J., 2005b. Statistical
thermodynamic model for Si/Al ordering in amorphous aluminosilicates. Chem.
Mater. 17, 2976–2986. https://doi.org/10.1021/cm050219i
Provis, J.L., Lukey, G.C., Van Deventer, J.S.J., 2005c. Do geopolymers actually contain
nanocrystalline zeolites? a reexamination of existing results. Chem. Mater. 17, 3075–
3085. https://doi.org/10.1021/cm050230i
Provis, J.L., van Deventer, J.S.J., 2007a. Geopolymerisation kinetics. 1. In situ energy-
dispersive X-ray diffractometry. Chem. Eng. Sci. 62, 2309–2317.
https://doi.org/10.1016/j.ces.2007.01.027
Provis, J.L., van Deventer, J.S.J., 2007b. Geopolymerisation kinetics. 2. Reaction kinetic
modelling. Chem. Eng. Sci. 62, 2318–2329.
https://doi.org/10.1016/j.ces.2007.01.028
Provis, J.L., Walls, P.A., van Deventer, J.S.J., 2008. Geopolymerisation kinetics. 3.
Effects of Cs and Sr salts. Chem. Eng. Sci. 63, 4480–4489.
https://doi.org/10.1016/j.ces.2008.06.008
Provis, J.L., 2009. Activating solution chemistry for geopolymers. In: Geopolymers:
Structure, processing, properties and industrial applications. Woodhead, Cambridge.
Provis, J.L., Duxson, P., van Deventer, J.S.J., 2010. The role of particle technology in
developing sustainable construction materials. Adv. Powder Technol. 21, 2–7.
https://doi.org/10.1016/j.apt.2009.10.006
Provis, J.L., 2014a. Geopolymers and other alkali activated materials: Why, how, and
what? Mater. Struct. Constr. 47, 11–25. https://doi.org/10.1617/s11527-013-0211-5
Provis, J.L., 2014b. Introduction and Scope, in: Provis, J.L., van Deventer, J.S.J. (Eds.),
Alkali Activated Materials State-of-the-Art Report, RILEM TC 224-AAM. RILEM,
pp. 1–10. https://doi.org/10.1007/978-94-007-7672-2
Provis, J.L., Bernal, S.A., 2014. Geopolymers and Related Alkali-Activated Materials.
Annu. Rev. Mater. Res. 44, 299–327. https://doi.org/10.1146/annurev-matsci-
070813-113515

266
Provis, J.L., Palomo, A., Shi, C., 2015. Advances in understanding alkali-activated
materials. Cem. Concr. Res. 78, 110–125.
https://doi.org/10.1016/j.cemconres.2015.04.013
Provis, J.L., 2018. Alkali-activated materials. Cem. Concr. Res. 114, 40–48.
https://doi.org/10.1016/j.cemconres.2017.02.009
Provis, J.L., Arbi, K., Bernal, S.A., Bondar, D., Buchwald, A., Castel, A., Chithiraputhiran,
S., Cyr, M., Dehghan, A., Dombrowski-Daube, K., Dubey, A., Ducman, V., Gluth,
G.J.G., Nanukuttan, S., Peterson, K., Puertas, F., van Riessen, A., Torres-Carrasco,
M., Ye, G., Zuo, Y., 2019. RILEM TC 247-DTA round robin test: mix design and
reproducibility of compressive strength of alkali-activated concretes. Mater. Struct.
Constr. 52, 1–13. https://doi.org/10.1617/s11527-019-1396-z
Rahul, A. V., Santhanam, M., Meena, H., Ghani, Z., 2019. 3D printable concrete: Mixture
design and test methods. Cem. Concr. Compos. 97, 13–23.
https://doi.org/10.1016/j.cemconcomp.2018.12.014
Ranjbar, N., Mehrali, M., Behnia, A., Alengaram, U.J., Jumaat, M.Z., 2014. Compressive
strength and microstructural analysis of fly ash/palm oil fuel ash based geopolymer
mortar. Mater. Des. 59, 532–539. https://doi.org/10.1016/j.matdes.2014.03.037
Rashad, A.M., 2013. Metakaolin as cementitious material: History, scours, production and
composition-A comprehensive overview. Constr. Build. Mater. 41, 303–318.
https://doi.org/10.1016/j.conbuildmat.2012.12.001
Ravikumar, D., Neithalath, N., 2013. An electrical impedance investigation into the
chloride ion transport resistance of alkali silicate powder activated slag concretes.
Cem. Concr. Compos. 44, 58–68.
https://doi.org/10.1016/j.cemconcomp.2013.06.002
Riahi, S., Nemati, A., Khodabandeh, A.R., Baghshahi, S., 2020. The effect of mixing
molar ratios and sand particles on microstructure and mechanical properties of
metakaolin-based geopolymers. Mater. Chem. Phys. 240, 122223.
https://doi.org/10.1016/j.matchemphys.2019.122223
Robayo, R.A., Mulford, A., Munera, J., Mejía de Gutiérrez, R., 2016. Alternative cements
based on alkali-activated red clay brick waste. Constr. Build. Mater. 128, 163–169.
https://doi.org/10.1016/j.conbuildmat.2016.10.023
Rocha, T. da S., Dias, D.P., França, F.C.C., Guerra, R.R. de S., Marques, L.R. da C. de
O., 2018. Metakaolin-based geopolymer mortars with different alkaline activators
(Na+ and K+). Constr. Build. Mater. 178, 453–461.
https://doi.org/10.1016/j.conbuildmat.2018.05.172
Romagnoli, M., Leonelli, C., Kamse, E., Lassinantti Gualtieri, M., 2012. Rheology of
geopolymer by DOE approach. Constr. Build. Mater. 36, 251–258.
https://doi.org/10.1016/j.conbuildmat.2012.04.122
Roussel, N., 2018. Rheological requirements for printable concretes. Cem. Concr. Res.
112, 76–85. https://doi.org/10.1016/j.cemconres.2018.04.005

267
Rovnaník, P., 2010. Effect of curing temperature on the development of hard structure of
metakaolin-based geopolymer. Constr. Build. Mater. 24, 1176–1183.
https://doi.org/10.1016/j.conbuildmat.2009.12.023
Rovnaník, P., Míková, M., Kusák, I., 2017a. Electrical properties of alkali-activated slag
mortar with carbon fibres. Mater. Sci. Forum 908 MSF, 100–105.
https://doi.org/10.4028/www.scientific.net/MSF.908.100
Rovnaník, P., Šimonová, H., Topolář, L., Keršner, Z., 2017b. Mechanical Fracture
Properties of Alkali-Activated Slag with Graphite Filler. Procedia Eng. 190, 43–48.
https://doi.org/10.1016/j.proeng.2017.05.305
Rovnaník, P., Kusák, I., Bayer, P., Schmid, P., Fiala, L., 2019a. Electrical and self-sensing
properties of alkali-activated slag composite with graphite filler. Materials (Basel).
12, 1–16. https://doi.org/10.3390/ma12101616
Rovnaník, P., Mizerová, C., Kusák, I., Schmid, P., 2019b. Self-sensing properties of
alkali-activated slag composite with carbon black during bending test. Solid State
Phenom. 296 SSP, 167–172.
https://doi.org/10.4028/www.scientific.net/SSP.296.167
Rovnaník, P., Kusák, I., Bayer, P., Schmid, P., Fiala, L., 2019c. Comparison of electrical
and self-sensing properties of Portland cement and alkali-activated slag mortars. Cem.
Concr. Res. 118, 84–91. https://doi.org/10.1016/j.cemconres.2019.02.009
Saafi, M., Andrew, K., Tang, P.L., McGhon, D., Taylor, S., Rahman, M., Yang, S., Zhou,
X., 2013. Multifunctional properties of carbon nanotube/fly ash geopolymeric
nanocomposites. Constr. Build. Mater. 49, 46–55.
https://doi.org/10.1016/j.conbuildmat.2013.08.007
Saafi, M., Tang, L., Fung, J., Rahman, M., Sillars, F., Liggat, J., Zhou, X., 2014.
Graphene/fly ash geopolymeric composites as self-sensing structural materials.
Smart Mater. Struct. 23, 065006. https://doi.org/10.1088/0964-1726/23/6/065006
Saafi, M., Tang, L., Fung, J., Rahman, M., Liggat, J., 2015. Enhanced properties of
graphene/fly ash geopolymeric composite cement. Cem. Concr. Res. 67, 292–299.
https://doi.org/10.1016/j.cemconres.2014.08.011
Saafi, M., Piukovics, G., Ye, J., 2016. Hybrid graphene/geopolymeric cement as a
superionic conductor for structural health monitoring applications. Smart Mater.
Struct. 25. https://doi.org/10.1088/0964-1726/25/10/105018
Saafi, M., Gullane, A., Huang, B., Sadeghi, H., Ye, J., Sadeghi, F., 2018. Inherently
multifunctional geopolymeric cementitious composite as electrical energy storage
and self-sensing structural material. Compos. Struct. 201, 766–778.
https://doi.org/10.1016/j.compstruct.2018.06.101
Saldarriaga, D.L.C., Montoya, J.A., Tejada, V.M., 2021. Toward Structural Health
Monitoring of Civil Structures Based on Self‑Sensing Concrete Nanocomposites : A
Validation in a Reinforced‑Concrete Beam. Int. J. Concr. Struct. Mater. 15.
https://doi.org/10.1186/s40069-020-00451-8
268
Saleem, M., Shameem, M., Hussain, S.E., Maslehuddin, M., 1996. Effect of moisture,
chloride and sulphate contamination on the electrical resistivity of Portland cement
concrete. Constr. Build. Mater. 10, 209–214. https://doi.org/10.1016/0950-
0618(95)00078-X
Salem, T.M., Ragai, S.M., 2001. Electrical conductivity of granulated slag cement kiln
dust-silica fume pastes at different porosities. Cem. Concr. Res. 31, 781–787.
https://doi.org/10.1016/S0008-8846(01)00461-6
Salet, T.A.M., Ahmed, Z.Y., Bos, F.P., Laagland, H.L.M., 2018. Design of a 3D printed
concrete bridge by testing. Virtual Phys. Prototyp. 2759, 1–15.
https://doi.org/10.1080/17452759.2018.1476064
Sanjayan, J.G., Nematollahi, B., Xia, M., Marchment, T., 2018. Effect of surface moisture
on inter-layer strength of 3D printed concrete. Constr. Build. Mater. 172, 468–475.
https://doi.org/10.1016/j.conbuildmat.2018.03.232
Santos, P.M.D., Julio, N.B.S., 2011. Comparison of Methods for Texture Assessment of
Concrete Surfaces. ACI Mater. J. 107, 433–440.
Sarkar, M., Dana, K., 2021. Partial replacement of metakaolin with red ceramic waste in
geopolymer. Ceram. Int. 47, 3473–3483.
https://doi.org/10.1016/j.ceramint.2020.09.191
Sedira, N., Castro-Gomes, J., Magrinho, M., 2018. Red clay brick and tungsten mining
waste-based alkali-activated binder: Microstructural and mechanical properties.
Constr. Build. Mater. 190, 1034–1048.
https://doi.org/10.1016/j.conbuildmat.2018.09.153
Sellami, M., Barre, M., Toumi, M., 2019. Synthesis, thermal properties and electrical
conductivity of phosphoric acid-based geopolymer with metakaolin. Appl. Clay Sci.
180, 105192. https://doi.org/10.1016/j.clay.2019.105192
Shah, S.F.A., Chen, B., Oderji, S.Y., Aminul Haque, M., Ahmad, M.R., 2020a.
Comparative study on the effect of fiber type and content on the performance of one-
part alkali-activated mortar. Constr. Build. Mater. 243, 118221.
https://doi.org/10.1016/j.conbuildmat.2020.118221
Shah, S.F.A., Chen, B., Oderji, S.Y., Haque, M.A., Ahmad, M.R., 2020b. Improvement
of early strength of fly ash-slag based one-part alkali activated mortar. Constr. Build.
Mater. 246, 118533. https://doi.org/10.1016/j.conbuildmat.2020.118533
Siad, H., Lachemi, M., Sahmaran, M., Mesbah, H.A., Hossain, K.A., 2018. Advanced
engineered cementitious composites with combined self-sensing and self-healing
functionalities. Constr. Build. Mater. 176, 313–322.
https://doi.org/10.1016/j.conbuildmat.2018.05.026
Silfwerbrand, J., Beushausen, H., Courard, L., 2011. Bond, in: Bissonnette, B., Courard,
Luc, Fowler, D.W., Granju, J.-L. (Eds.), Bonded Cement-Based Material Overlays
for the Repair, the Lining or the Strengthening of Slabs or Pavements, RILEM State-
of-the-Art Reports 3. Springer, Dordrecht Heidelberg London New York, pp. 51–79.

269
https://doi.org/10.1007/978-94-007-1239-3
Silva, P. De, Sagoe-Crenstil, K., Sirivivatnanon, V., 2007. Kinetics of geopolymerization:
Role of Al2O3 and SiO2. Cem. Concr. Res. 37, 512–518.
https://doi.org/10.1016/j.cemconres.2007.01.003
Sisol, M., Kudelas, D., Marcin, M., Holub, T., Varga, P., 2019. Statistical evaluation of
mechanical properties of slag based alkali-activated material. Sustain. 11.
https://doi.org/10.3390/su11215935
Skorina, T., 2014. Ion exchange in amorphous alkali-activated aluminosilicates:
Potassium based geopolymers. Appl. Clay Sci. 87, 205–211.
https://doi.org/10.1016/j.clay.2013.11.003
Sobhani, J., Najimi, M., 2013. Electrochemical impedance behavior and transport
properties of silica fume contained concrete. Constr. Build. Mater. 47, 910–918.
https://doi.org/10.1016/j.conbuildmat.2013.05.010
Soltan, D.G., Li, V.C., 2018. A self-reinforced cementitious composite for building-scale
3D printing. Cem. Concr. Compos. 90, 1–13.
https://doi.org/10.1016/j.cemconcomp.2018.03.017
Song, G., 2000. Theoretical analysis of the measurement of polarization resistance in
reinforced concrete. Cem. Concr. Compos. 22, 407–415.
https://doi.org/10.1016/S0958-9465(00)00040-8
Souza, M.T., Simão, L., Moraes, E.G. De, Senff, L., Renato, J., Pessôa, D.C., Ribeiro,
M.J., Oliveira, P.N. De, 2021. Role of temperature in 3D printed geopolymers:
evaluating rheology and buildability. Mater. Lett. 293, 129680.
https://doi.org/10.1016/j.matlet.2021.129680
Sun, C., Xiang, J., Xu, M., He, Y., Tong, Z., Cui, X., 2020. 3D extrusion free forming of
geopolymer composites: Materials modification and processing optimization. J.
Clean. Prod. 258, 120986. https://doi.org/10.1016/j.jclepro.2020.120986
Sun, M.Q., Liew, R.J.Y., Zhang, M.H., Li, W., 2014. Development of cement-based strain
sensor for health monitoring of ultra high strength concrete. Constr. Build. Mater. 65,
630–637. https://doi.org/10.1016/j.conbuildmat.2014.04.105
Sun, Q., Peng, Y., Cheng, H., Mou, Y., Yang, Z., Liang, D., 2019. Direct ink writing of
3D cavities for direct plated copper ceramic substrates with kaolin suspensions.
Ceram. Int. 45, 12535–12543. https://doi.org/10.1016/j.ceramint.2019.03.191
Sun, Q., Peng, Y., Georgolamprou, X., Li, D., Kiebach, R., 2020. Synthesis and
characterization of a geopolymer/hexagonal‑boron nitride composite for free
forming 3D extrusion-based printing. Appl. Clay Sci. 199, 105870.
https://doi.org/10.1016/j.clay.2020.105870
Sun, S., Ding, S., Han, B., Dong, S., Yu, X., Zhou, D., Ou, J., 2017a. Multi-layer
graphene-engineered cementitious composites with multifunctionality/intelligence.
Compos. Part B Eng. 129, 221–232.

270
https://doi.org/10.1016/j.compositesb.2017.07.063
Sun, S., Han, B., Jiang, S., Yu, X., Wang, Y., Li, H., Ou, J., 2017b. Nano graphite
platelets-enabled piezoresistive cementitious composites for structural health
monitoring. Constr. Build. Mater. 136, 314–328.
https://doi.org/10.1016/j.conbuildmat.2017.01.006
Sun, X., Wang, Q., Wang, H., Chen, L., 2020. Influence of multi-walled nanotubes on the
fresh and hardened properties of a 3D printing PVA mortar ink. Constr. Build. Mater.
247, 118590. https://doi.org/10.1016/j.conbuildmat.2020.118590
Sun, Z., Vollpracht, A., 2019. One year geopolymerisation of sodium silicate activated fly
ash and metakaolin geopolymers. Cem. Concr. Compos. 95, 98–110.
https://doi.org/10.1016/j.cemconcomp.2018.10.014
Suwan, T., Fan, M., 2017. Effect of manufacturing process on the mechanisms and
mechanical properties of fly ash-based geopolymer in ambient curing temperature.
Mater. Manuf. Process. 32, 461–467.
https://doi.org/10.1080/10426914.2016.1198013
Suweni Muntini, M., Ahmadi, H., 2018. Performance of metakaolin geopolymer ceramic
for fiber optic temperature sensor. Mater. Today Proc. 5, 15137–15142.
https://doi.org/10.1016/j.matpr.2018.04.071
Tan, J., Cai, J., Huang, L., Yang, Q., Mao, M., Li, J., 2020. Feasibility of using microwave
curing to enhance the compressive strength of mixed recycled aggregate powder
based geopolymer. Constr. Build. Mater. 262, 120897.
https://doi.org/10.1016/j.conbuildmat.2020.120897
Tang, S.W., Cai, X.H., He, Z., Zhou, W., Shao, H.Y., Li, Z.J., Wu, T., Chen, E., 2016.
The review of pore structure evaluation in cementitious materials by electrical
methods. Constr. Build. Mater. 117, 273–284.
https://doi.org/10.1016/j.conbuildmat.2016.05.037
Tang, Z., Li, W., Hu, Y., Zhou, J.L., Tam, V.W.Y., 2019. Review on designs and
properties of multifunctional alkali-activated materials (AAMs). Constr. Build.
Mater. 200, 474–489. https://doi.org/10.1016/j.conbuildmat.2018.12.157
Tay, Y.W.D., Ting, G.H.A., Qian, Y., Panda, B., He, L., Tan, M.J., 2018. Time gap effect
on bond strength of 3D-printed concrete. Virtual Phys. Prototyp. 0, 1–10.
https://doi.org/10.1080/17452759.2018.1500420
Tay, Y.W.D., Li, M.Y., Tan, M.J., 2019a. Effect of printing parameters in 3D concrete
printing: Printing region and support structures. J. Mater. Process. Technol. 271,
261–270. https://doi.org/10.1016/j.jmatprotec.2019.04.007
Tay, Y.W.D., Qian, Y., Tan, M.J., 2019b. Printability region for 3D concrete printing
using slump and slump flow test. Compos. Part B Eng. 174.
https://doi.org/10.1016/j.compositesb.2019.106968
Temuujin, J., Rickard, W., Lee, M., Van Riessen, A., 2011. Preparation and thermal

271
properties of fire resistant metakaolin-based geopolymer-type coatings. J. Non. Cryst.
Solids 357, 1399–1404. https://doi.org/10.1016/j.jnoncrysol.2010.09.063
Teomete, E., 2016. The effect of temperature and moisture on electrical resistance, strain
sensitivity and crack sensitivity of steel fiber reinforced smart cement composite.
Smart Mater. Struct. 25. https://doi.org/10.1088/0964-1726/25/7/075024
Tian, Q., Nakama, S., Sasaki, K., 2019. Immobilization of cesium in fly ash-silica fume
based geopolymers with different Si/Al molar ratios. Sci. Total Environ. 687, 1127–
1137. https://doi.org/10.1016/j.scitotenv.2019.06.095
Tian, Z., Li, Y., Zheng, J., Wang, S., 2019. A state-of-the-art on self-sensing concrete :
Materials , fabrication and properties. Compos. Part B 177, 107437.
https://doi.org/10.1016/j.compositesb.2019.107437
Tironi, A., Trezza, M.A., Scian, A.N., Irassar, E.F., 2012. Kaolinitic calcined clays:
Factors affecting its performance as pozzolans. Constr. Build. Mater. 28, 276–281.
https://doi.org/10.1016/j.conbuildmat.2011.08.064
Tironi, A., Trezza, M.A., Scian, A.N., Irassar, E.F., 2013. Assessment of pozzolanic
activity of different calcined clays. Cem. Concr. Compos. 37, 319–327.
https://doi.org/10.1016/j.cemconcomp.2013.01.002
Turatsinze, A., Beushausen, H., Gagné, R., Granju, J.L., Silfwerbrand, J., Walter, R., 2011.
Debonding, in: Bissonnette, B., Courard, L., Fowler, D.W., Granju, J.-L. (Eds.),
Bonded Cement-Based Material Overlays for the Repair, the Lining or the
Strengthening of Slabs or Pavements. Springer, Dordrecht Heidelberg London New
York, pp. 107–139. https://doi.org/10.1007/978-94-007-1239-3
Uysal, M., Al-mashhadani, M.M., Aygörmez, Y., Canpolat, O., 2018. Effect of using
colemanite waste and silica fume as partial replacement on the performance of
metakaolin-based geopolymer mortars. Constr. Build. Mater. 176, 271–282.
https://doi.org/10.1016/j.conbuildmat.2018.05.034
Vaidya, S., Allouche, E.N., 2011. Strain sensing of carbon fiber reinforced geopolymer
concrete. Mater. Struct. 44, 1467–1475. https://doi.org/10.1617/s11527-011-9711-3
Valentini, L., Pilehvar, S., Arnhof, M., Kjøniksen, A., 2020. Utilization of urea as an
accessible superplasticizer on the moon for lunar geopolymer mixtures. J. Clean.
Prod. 247, 119177. https://doi.org/10.1016/j.jclepro.2019.119177
van der Pauw, L.J., 1958. A method of measuring specific resistivity and and Hall effect
of discs of arbitrary shape. Philips Res. Reports 13, 1–9.
Van Meurs, N., 1958. Temperature Dependence of the Conductivity of Electrolyte
Solutions. Nature 182, 1532–1533. https://doi.org/10.1038/1821532a0
Vasconcelos, E., Fernandes, S., Barroso De Aguiar, J.L., Pacheco-Torgal, F., 2011.
Concrete retrofitting using metakaolin geopolymer mortars and CFRP. Constr. Build.
Mater. 25, 3213–3221. https://doi.org/10.1016/j.conbuildmat.2011.03.006
Vaysburd, M., Bissonnette, B., Morin, R., 2011. Practice and Quality Assurance, in:
272
Bissonnette, Benoît, Courard, L., Fowler, D.W., Granju, J.-L. (Eds.), Bonded
Cement-Based Material Overlays for the Repair, the Lining or the Strengthening of
Slabs or Pavements. Springer, Dordrecht Heidelberg London New York, pp. 157–
170. https://doi.org/10.1007/978-94-007-1239-3
Vilaplana, J.L., Baeza, F.J., Galao, O., Zornoza, E., Garcés, P., 2013. Self-sensing
properties of alkali activated blast furnace slag (BFS) composites reinforced with
carbon fibers. Materials (Basel). 6, 4776–4786. https://doi.org/10.3390/ma6104776
Vilaplana, J.L., Baeza, F.J., Galao, O., Alcocel, E.G., Zornoza, E., Garcés, P., 2016.
Mechanical properties of alkali activated blast furnace slag pastes reinforced with
carbon fibers. Constr. Build. Mater. 116, 63–71.
https://doi.org/10.1016/j.conbuildmat.2016.04.066
Vitola, L., Pundiene, I., Pranckeviciene, J., Bajare, D., 2020. The impact of the amount of
water used in activation solution and the initial temperature of paste on the
rheological behaviour and structural evolution of metakaolin-based geopolymer
pastes. Sustainability 12. https://doi.org/10.3390/su12198216
Vlachakis, C., Perry, M., Biondi, L., Mcalorum, J., 2020. 3D printed temperature-sensing
repairs for concrete structures. Addit. Manuf. 34, 101238.
https://doi.org/10.1016/j.addma.2020.101238
Vogt, O., Ukrainczyk, N., Ballschmiede, C., Koenders, E., 2019. Reactivity and
microstructure of metakaolin based geopolymers: Effect of fly Ash and liquid/solid
contents. Materials (Basel). 12, 1–21. https://doi.org/10.3390/ma12213485
Wan, Q., Rao, F., Song, S., 2017a. Reexamining calcination of kaolinite for the synthesis
of metakaolin geopolymers - roles of dehydroxylation and recrystallization. J. Non.
Cryst. Solids 460, 74–80. https://doi.org/10.1016/j.jnoncrysol.2017.01.024
Wan, Q., Rao, F., Song, S., García, R.E., Estrella, R.M., Patiño, C.L., Zhang, Y., 2017b.
Geopolymerization reaction, microstructure and simulation of metakaolin-based
geopolymers at extended Si/Al ratios. Cem. Concr. Compos. 79, 45–52.
https://doi.org/10.1016/j.cemconcomp.2017.01.014
Wang, A., Zheng, Y., Zhang, Z., Liu, K., Li, Y., Shi, L., Sun, D., 2020. The Durability of
Alkali-Activated Materials in Comparison with Ordinary Portland Cements and
Concretes: A Review. Engineering 6, 695–706.
https://doi.org/10.1016/j.eng.2019.08.019
Wang, G.C., 2016. Ferrous metal production and ferrous slags, in: The Utilization of Slag
in Civil Infrastructure Construction. Woodhead Publishing Limited, pp. 9–33.
Wang, W., Dai, H., Wu, S., 2008. Mechanical behavior and electrical property of CFRC-
strengthened RC beams under fatigue and monotonic loading 479, 191–196.
https://doi.org/10.1016/j.msea.2007.06.046
Wang, X., Wang, Y., Jin, Z., 2002. Electrical conductivity characterization and variation
of carbon fiber reinforced cement composite. J. Mater. Sci. 37, 223–227.
https://doi.org/10.1023/A:1013107623281
273
Wang, Y.S., Provis, J.L., Dai, J.G., 2018. Role of soluble aluminum species in the
activating solution for synthesis of silico-aluminophosphate geopolymers. Cem.
Concr. Compos. 93, 186–195. https://doi.org/10.1016/j.cemconcomp.2018.07.011
Wang, Y., Wang, Y., Han, B., Wan, B., Cai, G., Li, Z., 2018. Strain monitoring of concrete
components using embedded carbon nanofibers/epoxy sensors. Constr. Build. Mater.
186, 367–378. https://doi.org/10.1016/j.conbuildmat.2018.07.147
Wang, Y., Wang, Y., Zhang, M., 2020. Effect of sand content on engineering properties
of fly ash-slag based strain hardening geopolymer composites. J. Build. Eng. 34,
101951. https://doi.org/10.1016/j.jobe.2020.101951
Wangler, T., Roussel, N., Bos, F.P., Salet, T.A.M., Flatt, R.J., 2019. Digital Concrete: A
Review. Cem. Concr. Res. 123, 105780.
https://doi.org/10.1016/j.cemconres.2019.105780
Weiss, J.D., 2011. Generalization of the van der Pauw relationship derived from
electrostatics. Solid. State. Electron. 62, 123–127.
https://doi.org/10.1016/j.sse.2011.04.006
Wen, S., Chung, D.D.L., 2000. Uniaxial compression in carbon fiber reinforced cement,
sensed by electrical resistivity measurement in longitudinal and transverse directions.
Cem. Concr. Res. 30, 1289–1294. https://doi.org/10.1016/S0008-8846(00)00304-5
Wen, S., Chung, D.D.L., 2001a. Effect of carbon fiber grade on the electrical behavior of
carbon fiber reinforced cement. Carbon N. Y. 39, 369–373.
https://doi.org/10.1016/S0008-6223(00)00127-5
Wen, S., Chung, D.D.L., 2001b. Electric polarization in carbon fiber-reinforced cement.
Cem. Concr. Res. 31, 141–147. https://doi.org/10.1016/S0008-8846(00)00382-3
Wen, S., Chung, D.D.L., 2006. The role of electronic and ionic conduction in the electrical
conductivity of carbon fiber reinforced cement. Carbon N. Y. 44, 2130–2138.
https://doi.org/10.1016/j.carbon.2006.03.013
Weng, Y., Li, M., Ruan, S., Neng, T., Jen, M., Leong, K., Yeong, O., Qian, S., 2020.
Comparative economic , environmental and productivity assessment of a concrete
bathroom unit fabricated through 3D printing and a precast approach. J. Clean. Prod.
261, 121245. https://doi.org/10.1016/j.jclepro.2020.121245
Weng, Y., Ruan, S., Li, M., Mo, L., Unluer, C., Tan, M.J., Qian, S., 2019. Feasibility study
on sustainable magnesium potassium phosphate cement paste for 3D printing. Constr.
Build. Mater. 221, 595–603. https://doi.org/10.1016/j.conbuildmat.2019.05.053
White, C.E., Provis, J.L., Proffen, T., van Deventer, J.S.J., 2012. Molecular Mechanisms
Responsible for the Structural ChangesOccurring During Geopolymerization:
Multiscale Simulation. AIChE J. 59, 215–228. https://doi.org/10.1002/aic
Winnefeld, F., Gluth, G.J.G., Bernal, S.A., Bignozzi, M.C., Carabba, L., Chithiraputhiran,
S., Dehghan, A., Dolenec, S., Dubey, A., Ducman, V., Jin, Y., Peterson, K., Stephan,
D., Provis, J.L., 2020. RILEM TC REPORT RILEM TC 247-DTA round robin test :

274
sulfate resistance , alkali-silica reaction and freeze – thaw resistance of alkali-
activated concretes. Mater. Struct. 0. https://doi.org/10.1617/s11527-020-01562-0
Wolfs, R.J.M., Bos, F.P., Salet, T.A.M., 2019. Hardened properties of 3D printed concrete:
The influence of process parameters on interlayer adhesion. Cem. Concr. Res. 119,
132–140. https://doi.org/10.1016/j.cemconres.2019.02.017
Wong, C., Yang, E., Yan, X.-T., Gu, D., 2018. Autonomous robots for harsh environments:
a holistic overview of current solutions and ongoing challenges. Syst. Sci. Control
Eng. 6, 213–219. https://doi.org/10.1080/21642583.2018.1477634
Xia, M., Sanjayan, J.G., 2018. Methods of enhancing strength of geopolymer produced
from powder-based 3D printing process. Mater. Lett. 227, 281–283.
https://doi.org/10.1016/j.matlet.2018.05.100
Xiao, H., Li, H., Ou, J., 2011. Strain sensing properties of cement-based sensors embedded
at various stress zones in a bending concrete beam. Sensors Actuators, A Phys. 167,
581–587. https://doi.org/10.1016/j.sna.2011.03.012
Xu, F., Deng, X., Peng, C., Zhu, J., Chen, J., 2017. Mix design and flexural toughness of
PVA fiber reinforced fly ash-geopolymer composites. Constr. Build. Mater. 150,
179–189. https://doi.org/10.1016/j.conbuildmat.2017.05.172
Xu, J., Zhang, D., 2017. Multifunctional structural supercapacitor based on graphene and
geopolymer. Electrochim. Acta 224, 105–112.
https://doi.org/10.1016/j.electacta.2016.12.045
Xu, J., Zhong, W., Yao, W., 2010. Modeling of conductivity in carbon fiber-reinforced
cement-based composite. J. Mater. Sci. 45, 3538–3546.
https://doi.org/10.1007/s10853-010-4396-5
Yang, X., Zhu, W., Yang, Q., 2008. The viscosity properties of sodium silicate solutions.
J. Solution Chem. 37, 73–83. https://doi.org/10.1007/s10953-007-9214-6
Yao, Y., Duan, X., Luo, J., Liu, T., 2017. Two-probe versus van der Pauw method in
studying the piezoresistivity of single-wall carbon nanotube thin films.
Nanotechnology 28. https://doi.org/10.1088/1361-6528/aa8585
Yeon, J., Kang, J., Yan, W., 2018. Spall damage repair using 3D printing technology.
Autom. Constr. 89, 266–274. https://doi.org/10.1016/j.autcon.2018.02.003
Yoo, D.Y., Kim, S., Lee, S.H., 2018a. Self-sensing capability of ultra-high-performance
concrete containing steel fibers and carbon nanotubes under tension. Sensors
Actuators A Phys. 276, 125–136. https://doi.org/10.1016/j.sna.2018.04.009
Yoo, D.Y., You, I., Youn, H., Lee, S.J., 2018b. Electrical and piezoresistive properties of
cement composites with carbon nanomaterials. J. Compos. Mater. 52, 3325–3340.
https://doi.org/10.1177/0021998318764809
Yoo, D.Y., You, I., Lee, S.J., 2018c. Electrical and piezoresistive sensing capacities of
cement paste with multi-walled carbon nanotubes. Arch. Civ. Mech. Eng. 18, 371–
384. https://doi.org/10.1016/j.acme.2017.09.007

275
Yoo, D.Y., I., Zi, G., Lee, S., 2019. Effects of carbon nanomaterial type and amount on
self-sensing capacity of cement paste. Measurement 134, 750–761.
https://doi.org/10.1016/j.measurement.2018.11.024
Yousefi Oderji, S., Chen, B., Ahmad, M.R., Shah, S.F.A., 2019. Fresh and hardened
properties of one-part fly ash-based geopolymer binders cured at room temperature:
Effect of slag and alkali activators. J. Clean. Prod. 225, 1–10.
https://doi.org/10.1016/j.jclepro.2019.03.290
Yu, S., Du, H., Sanjayan, J., 2020. Aggregate-bed 3D concrete printing with cement paste
binder. Cem. Concr. Res. 136, 106169.
https://doi.org/10.1016/j.cemconres.2020.106169
Yuan, J., He, P., Jia, D., Yang, C., Zhang, Y., Yan, S., Yang, Z., Duan, X., Wang, S., Zhou,
Y., 2016. Effect of curing temperature and SiO2/K2O molar ratio on the performance
of metakaolin-based geopolymers. Ceram. Int. 42, 16184–16190.
https://doi.org/10.1016/j.ceramint.2016.07.139
Yusuf, M.O., Megat Johari, M.A., Ahmad, Z.A., Maslehuddin, M., 2014. Effects of
H2O/Na2O molar ratio on the strength of alkaline activated ground slag/ultrafine
palm oil fuel ash based concrete. Mater. Struct. Constr. 56, 158–164.
https://doi.org/10.1617/s11527-014-0318-3
Zaheer, M., Khan, N., Shaikh, A., Hao, Y., Hao, H., 2016. Synthesis of high strength
ambient cured geopolymer composite by using low calcium fly ash. Constr. Build.
Mater. 125, 809–820. https://doi.org/10.1016/j.conbuildmat.2016.08.097
Zanotti, C., Borges, P.H.R., Bhutta, A., Banthia, N., 2017. Bond strength between
concrete substrate and metakaolin geopolymer repair mortar: Effect of curing regime
and PVA fiber reinforcement. Cem. Concr. Compos. 80, 307–316.
https://doi.org/10.1016/j.cemconcomp.2016.12.014
Zareiyan, B., Khoshnevis, B., 2017a. Effects of interlocking on interlayer adhesion and
strength of structures in 3D printing of concrete. Autom. Constr. 83, 212–221.
https://doi.org/10.1016/j.autcon.2017.08.019
Zareiyan, B., Khoshnevis, B., 2017b. Interlayer adhesion and strength of structures in
Contour Crafting - Effects of aggregate size, extrusion rate, and layer thickness.
Autom. Constr. 81, 112–121. https://doi.org/10.1016/j.autcon.2017.06.013
Zeng, S., Wang, J., Lake, M., 2016. Characterization of mechanical and electric properties
of geopolymers synthesized using four locally available fly ashes. Constr. Build.
Mater. 121, 386–399. https://doi.org/10.1016/j.conbuildmat.2016.06.011
Zhang, C., Hou, Z., Chen, C., Zhang, Y., Mechtcherine, V., Sun, Z., 2019. Design of 3D
printable concrete based on the relationship between flowability of cement paste and
optimum aggregate content. Cem. Concr. Compos. 104, 1–10.
https://doi.org/10.1016/j.cemconcomp.2019.103406
Zhang, D.W., Wang, D., Lin, X.-Q., Zhang, T., 2018. The study of the structure rebuilding
and yield stress of 3D printing geopolymer pastes. Constr. Build. Mater. 184, 575–
276
580. https://doi.org/10.1016/j.conbuildmat.2018.06.233
Zhang, F., Zhang, L., Liu, M., Mu, C., Liang, Y.N., Hu, X., 2017. Role of alkali cation in
compressive strength of metakaolin based geopolymers. Ceram. Int. 43, 3811–3817.
https://doi.org/10.1016/j.ceramint.2016.12.034
Zhang, G., Yang, H., Ju, C., Yang, Y., 2020. Novel selection of environment-friendly
cementitious materials for winter construction: Alkali-activated slag/Portland cement.
J. Clean. Prod. 258, 120592. https://doi.org/10.1016/j.jclepro.2020.120592
Zhang, L., Ding, S., Han, B., Yu, X., Ni, Y.Q., 2019. Effect of water content on the
piezoresistive property of smart cement-based materials with carbon
nanotube/nanocarbon black composite filler. Compos. Part A Appl. Sci. Manuf. 119,
8–20. https://doi.org/10.1016/j.compositesa.2019.01.010
Zhang, S., Caprani, C.C., Heidarpour, A., 2018. Strain rate studies of pultruded glass fibre
reinforced polymer material properties: A literature review. Constr. Build. Mater.
171, 984–1004. https://doi.org/10.1016/j.conbuildmat.2018.03.113
Zhang, X., Li, M., Lim, J.H., Weng, Y., Tay, Y.W.D., Pham, H., Pham, Q.C., 2018. Large-
scale 3D printing by a team of mobile robots. Autom. Constr. 95, 98–106.
https://doi.org/10.1016/j.autcon.2018.08.004
Zhang, Y.J., He, P.Y., Zhang, Y.X., Chen, H., 2018. A novel electroconductive
graphene/fly ash-based geopolymer composite and its photocatalytic performance.
Chem. Eng. J. 334, 2459–2466. https://doi.org/10.1016/j.cej.2017.11.171
Zhang, Y., Zhang, Yunsheng, Liu, G., Yang, Y., Wu, M., Pang, B., 2018. Fresh properties
of a novel 3D printing concrete ink. Constr. Build. Mater. 174, 263–271.
https://doi.org/10.1016/j.conbuildmat.2018.04.115
Zhang, Z., Xiao, Y., Huajun, Z., Yue, C., 2009. Role of water in the synthesis of calcined
kaolin-based geopolymer. Appl. Clay Sci. 43, 218–223.
https://doi.org/10.1016/j.clay.2008.09.003
Zhang, Z., Wang, H., Provis, J.L., Bullen, F., Reid, A., Zhu, Y., 2012a. Quantitative
kinetic and structural analysis of geopolymers. Part 1. The activation of metakaolin
with sodium hydroxide. Thermochim. Acta 539, 23–33.
https://doi.org/10.1016/J.TCA.2012.03.021
Zhang, Z., Yao, X., Wang, H., 2012b. Potential application of geopolymers as protection
coatings for marine concrete III. Field experiment. Appl. Clay Sci. 67–68, 57–60.
https://doi.org/10.1016/j.clay.2012.05.008
Zhang, Z., Provis, J.L., Wang, H., Bullen, F., Reid, A., 2013. Quantitative kinetic and
structural analysis of geopolymers. Part 2. Thermodynamics of sodium silicate
activation of metakaolin. Thermochim. Acta 565, 163–171.
https://doi.org/10.1016/J.TCA.2013.01.040
Zhang, Z.H., Zhu, H.J., Zhou, C.H., Wang, H., 2016. Geopolymer from kaolin in China:
An overview. Appl. Clay Sci. 119, 31–41. https://doi.org/10.1016/j.clay.2015.04.023

277
Zhang, Z., Provis, J.L., Ma, X., Reid, A., Wang, H., 2018. Efflorescence and
subflorescence induced microstructural and mechanical evolution in fly ash-based
geopolymers. Cem. Concr. Compos. 92, 165–177.
https://doi.org/10.1016/j.cemconcomp.2018.06.010
Zhao, S., Fan, S., Yang, J., Kitipornchai, S., 2019. A spherical smart aggregate sensor
based electro-mechanical impedance method for quantitative damage evaluation of
concrete. Struct. Heal. Monit. https://doi.org/10.1177/1475921719888963
Zhong, J., Zhou, G.X., He, P.G., Yang, Z.H., Jia, D.C., 2017. 3D printing strong and
conductive geo-polymer nanocomposite structures modified by graphene oxide.
Carbon N. Y. 117, 421–426. https://doi.org/10.1016/j.carbon.2017.02.102
Zhou, G.X., Li, C., Zhao, Z., Qi, Y.Z., Yang, Z.H., Jia, D.C., Zhong, J., Zhou, Y., 2020.
3D printing geopolymer nanocomposites structure: Graphene oxide size effects on a
reactive matrix. Carbon N. Y. 164, 215–223.
https://doi.org/10.1016/j.carbon.2020.02.021
Zhou, J., Ye, G., Schlangen, E., van Breugel, K., 2008. Modelling of stresses and strains
in bonded concrete overlays subjected to differential volume changes. Theor. Appl.
Fract. Mech. 49, 199–205. https://doi.org/10.1016/j.tafmec.2007.11.006
Zhou, S., Lu, C., Zhu, X., Li, F., 2021. Upcycling of natural volcanic resources for
geopolymer: Comparative study on synthesis, reaction mechanism and rheological
behavior. Constr. Build. Mater. 268, 121184.
https://doi.org/10.1016/j.conbuildmat.2020.121184
Zhou, W., Yan, C., Duan, P., Liu, Y., Zhang, Z., Qiu, X., Li, D., 2016. A comparative
study of high- and low-Al2O3 fl y ash based-geopolymers : The role of mix
proportion factors and curing temperature. Mater. Des. 95, 63–74.
https://doi.org/10.1016/j.matdes.2016.01.084
Zhuang, K., Liu, B., Fang, Y., Guo, Y., Shuai, L., Dong, B., Long, W., Xing, F., 2021. Is
electrodeless resistivity method suitable for monitoring the early-age reaction of
Na2SiO3-activated slag? Mechanism and application. Constr. Build. Mater. 272,
121719. https://doi.org/10.1016/j.conbuildmat.2020.121719
Zibouche, F., Kerdjoudj, H., de Lacaillerie, J.-B. d’Espinose, Van Damme, H., 2009.
Geopolymers from Algerian metakaolin. Influence of secondary minerals. Appl.
Clay Sci. 43, 453–458. https://doi.org/10.1016/J.CLAY.2008.11.001
Zulkifly, K., Cheng-yong, H., Yun-ming, L., Mustafa, M., Bakri, A., Shee-ween, O.,
Suhaimi, M., Khalid, B., 2021. Effect of phosphate addition on room-temperature-
cured fly ash-metakaolin blend geopolymers. Constr. Build. Mater. 270, 121486.
https://doi.org/10.1016/j.conbuildmat.2020.121486