
Performance assessment of chemometric resolution methods utilized for extraction of pure components...
36
Accepted Manuscript Title: Performance assessment of chemometric resolution methods utilized for extraction of pure components from overlapped signals in gas chromatography-mass spectrometry Author: Hooman Seifi Saeed Masoum Soodabe Seifi PII: S0021-9673(14)01377-6 DOI: http://dx.doi.org/doi:10.1016/j.chroma.2014.08.095 Reference: CHROMA 355786 To appear in: Journal of Chromatography A Received date: 11-2-2014 Revised date: 22-8-2014 Accepted date: 27-8-2014 Please cite this article as: H. Seifi, S. Masoum, S. Seifi, Performance assessment of chemometric resolution methods utilized for extraction of pure components from overlapped signals in gas chromatography-mass spectrometry, Journal of Chromatography A (2014), http://dx.doi.org/10.1016/j.chroma.2014.08.095 This is a PDF file of an unedited manuscript that has been accepted for publication. As a service to our customers we are providing this early version of the manuscript. The manuscript will undergo copyediting, typesetting, and review of the resulting proof before it is published in its final form. Please note that during the production process errors may be discovered which could affect the content, and all legal disclaimers that apply to the journal pertain.
Transcript of Performance assessment of chemometric resolution methods utilized for extraction of pure components...
Accepted Manuscript
Title: Performance assessment of chemometric resolutionmethods utilized for extraction of pure components fromoverlapped signals in gas chromatography-mass spectrometry
Author: Hooman Seifi Saeed Masoum Soodabe Seifi
PII: S0021-9673(14)01377-6DOI: http://dx.doi.org/doi:10.1016/j.chroma.2014.08.095Reference: CHROMA 355786
To appear in: Journal of Chromatography A
Received date: 11-2-2014Revised date: 22-8-2014Accepted date: 27-8-2014
Please cite this article as: H. Seifi, S. Masoum, S. Seifi, Performance assessmentof chemometric resolution methods utilized for extraction of pure componentsfrom overlapped signals in gas chromatography-mass spectrometry, Journal ofChromatography A (2014), http://dx.doi.org/10.1016/j.chroma.2014.08.095
This is a PDF file of an unedited manuscript that has been accepted for publication.As a service to our customers we are providing this early version of the manuscript.The manuscript will undergo copyediting, typesetting, and review of the resulting proofbefore it is published in its final form. Please note that during the production processerrors may be discovered which could affect the content, and all legal disclaimers thatapply to the journal pertain.
Downloaded from http://www.elearnica.ir

Page 1 of 35
Accep
ted
Man
uscr
ipt
Performance assessment of chemometric resolution methods utilized for extraction of pure 1
components from overlapped signals in gas chromatography-mass spectrometry2
3
Hooman Seifi a, Saeed Masoum *a, Soodabe Seifi b4
a Department of Analytical Chemistry, Faculty of Chemistry, University of Kashan, Kashan, Iran5
b Technical and Vocational University of Kermanshah, Girl's Technical College, Kermanshah, Iran6
Corresponding author Tel.: +98 361 5912338; fax: +98 361 5912397.7
E-mail address: [email protected] (Saeed Masoum)8
Abstract9
Multivariate resolution technique is a set of mathematical tools that uncovers the underlying profiles from 10
a set of measurements of time evolving chemical systems. This technique was proposed for resolving the 11
overlapping GC-MS peaks into pure chromatogram and mass spectra. In this paper, several common 12
resolution chemometric techniques in GC-MS resolution such as mean field-independent component 13
analysis (MF-ICA), multivariate curve resolution-alternating least squares (MCR-ALS) and multivariate 14
curve resolution-objective function minimization (MCR-FMIN) were investigated. The obtained solutions 15
using chemometric methods are assessed by lack of fit (LOF) and R2. Results show that all solutions by 16
fulfillment the same constraints, have same performance in resolving high overlapping peaks. Also, the 17
differences obtained in each case should be related to the unresolved rotational ambiguity.18
Among of the different ambiguities such as intensity, permutation and rotation in resolution methods,19
rotational ambiguity is the most difficult and critical one. Because of rotational ambiguity, there is a set of 20
feasible MCR solutions, which explain equally well the observed experimental data, and fulfill 21
sufficiently the imposed constraints of the system. So in these methods, a range of feasible solutions exist. 22

Page 2 of 35
Accep
ted
Man
uscr
ipt
The rotational ambiguities of the profiles are a challenging fact which complicates the development of 23
stable and universal self-modeling curve resolution (SMCR) algorithms. The relative component 24
contribution (RCC) function values for the component profiles obtained by the different methods are 25
calculated by MCR-BANDS. The values of RCC for these three methods are equivalence. Rotational 26
ambiguities of the solutions of SMCR methods can be reduced by applying suitable constraints. The 27
obtained results show, using data sets, which are arranged in a single augmented data matrix could be the 28
best solution for reducing or removing of rotational ambiguity.29
Keywords: Chemometric resolution methods, Rotational ambiguities, Co-elution, Gas chromatography–30
mass spectrometry, Augmentation31
32

Page 3 of 35
Accep
ted
Man
uscr
ipt
1. Introduction32
Historically, analysis of essential oil is a significant challenge to analytical chemists and pharmacologists. 33
Hyphenated chromatographic techniques such as high performance liquid chromatography-mass 34
spectrometry (HPLC-MS) and gas chromatography-mass spectrometry (GC-MS) have been the powerful 35
tools in the analysis of essential oils [1]. However, in GC-MS analysis of EOs, even under the best 36
experimental conditions, there are various problems such as baseline drift, low signal to noise (S/N) ratio, 37
different types of noise, co-elution [2-7]. In practice, peak tailing and fronting as other problems appear in 38
some of the total ion chromatograms (TIC). The main reasons for this phenomenon may be the bad 39
column cutting and related to the high concentration of corresponding components. These difficulties can 40
be arisen from the complexity of EOs and the variability of GC-MS systems such as detection system, 41
chromatographic device and experimental conditions. Among these problems, co-elution (overlapped 42
and/or embedded peaks) is one of the most observed chromatographic difficulties that is due to 43
complexity of samples, inadequate peak capacity and need to faster chromatographic analysis. There are 44
two main approaches for solving the co-elution problem. In one hand, scientists attempt to reach perfect 45
separation by improving the temperature programming, stationary phase composition (generally classical 46
chromatographic parameters). In another hand, the co-eluted peaks are decomposed into the contribution 47
of the pure components using chemometric resolution methods. However, the first approach is time 48
consuming and, it is common to find some co-eluted chromatographic peaks that still remain after re-49
programming of the methods. Also, the second approach depends on the selective nature of the 50
chromatographic profiles [3,8-10].51
Chemometric resolution techniques based on bilinear models try to resolve the chemical constituents in a 52
mixture by mathematical resolution of their signal contribution. The goal of these techniques is to 53
mathematically decompose an instrumental response of a mixture into the pure contribution of each 54
component involved in the system [11-15]. The chemometric resolution methods are divided into two 55
groups. The first group is non-iterative methods such as evolving factor analysis (EFA), evolving window 56
orthogonal projection (EWOP), orthogonal projection resolution (OPR), sub-window factor analysis 57

Page 4 of 35
Accep
ted
Man
uscr
ipt
(SFA), window factor analysis (WFA) and heuristic evolving latent projections (HELP). The second 58
group is iterative methods such as multivariate curve resolution-alternating least squares (MCR-ALS), 59
mean field-independent component analysis (MF-ICA), multivariate curve resolution-objective function 60
minimization (MCR-FMIN) [14,16-23].61
Because of randomly generated initial values and local minimization problem, different results may be 62
produced through different runs of the MF-ICA and MCR-ALS procedures. Furthermore, sometimes MF-63
ICA and MCR-ALS cannot be converged and suitable results may not be achieved [24]. There are 64
numerous reasons for this problem, that one of them is the substantial dependency to the initial estimates 65
of the spectral or concentration profiles. So, these algorithms reach local minima instead of global 66
minima. Stuck in local minima can cause insufficient curve resolution. One powerful solution for this 67
problem is using the non-linear optimization techniques. These approaches are applied extensively for 68
finding the best solution in the SMCR techniques. MCR-FMIN is one of these methods that recently has 69
been proposed by Tauler [18]. 70
For run of the iterative resolution methods, initial estimates of concentration or spectral profiles are 71
needed. These can be helpful for faster convergence, obtaining the reproducible results and avoiding to be 72
stuck in local minima [24-26]. Hence, methods, which are based on pure variable selection such as OPA 73
and SIMPLISMA and also approaches that are based on evolutionary nature of data such as EFA are used 74
as initial estimation [27-29].75
However, though chemometric resolution solutions have sufficient physical meaning and easy 76
explanation, but they are not “unique” in general case, and they have an unknown amount of ambiguity. 77
Three types of ambiguities are distinguished in multivariate curve resolution techniques such as: 78
permutation (exchangeable order of the constituents in the row and columns of results), intensity and 79
rotational ambiguities. The permutation and intensity ambiguities are eliminated by aware of analyst and 80
external calibration information, respectively. Rotational ambiguity is a more significant problem in the 81
application of soft-modeling techniques, and this is the chief reason for “non-unique” solutions. 82
Rotational ambiguity is reduced and totally avoided in some cases by intelligent use of data structure and 83
Page 5 of 35
Accep
ted
Man
uscr
ipt
imposing appropriate constraints [30]. Constraints like unimodality, non-negativity, selectivity, local rank 84
and equality or inequality have been proposed to limit rotational ambiguity [17,31-33]. In the absence of 85
this rotational ambiguity, all multivariate resolution techniques should give the same unique solution 86
which should be equal to the true one [34]. The calculative (and sometimes analytical) determination of 87
the range of feasible solutions has an advantage in the analysis of chemical systems.88
The range of acceptable solutions for a two-component system (F=2) was partially analyzed by Lawton 89
and Sylvestre [35]. In addition, Maeder et al. [36, 37] and Rajko and Istvan [36,37] in their papers 90
investigated two-component systems. For F > 2, a comparable analysis gets much harder. Borgen and his 91
coworkers contributed to this topic, did pioneering work for three-component systems [38,39]. The 92
analytical solution for these systems with computer tools was improved by Rajko et al. [40,41]. A new 93
approach to calculate the boundaries of the set of solutions for these systems has been proposed by 94
Abdollahi et al. [42].95
Essential oils (EOs) are complex mixtures of volatile organic compounds produced (as secondary 96
metabolites) in plants. EOs are constituted by hydrocarbons (terpenes and sesquiterpenes) and oxygenated 97
compounds (ethers, alcohols, esters, aldehydes, lactones, ketones, phenols and phenol ethers) [43-45]. A98
comprehensive knowledge of components of an EO will lead to a safe and better application of it, because 99
characteristics and properties of EOs are directly related to their compositions. Nevertheless, such a 100
comprehensive knowledge can only be obtained by utilizing appropriate extraction techniques and 101
accurately performed chromatographic analysis [43,46,47]. In another word, the effects of herb are 102
according to synergic effect (components that exist in each essential oil of herb if not a direct activity, at 103
least have a synergic effect on activities of others), so comprehensive knowledge is needed to correct 104
application in biological, pharmacological and food applications.105
In this study, volatile constituents of essential oils extracted from six Myrtus communis L. were analyzed 106
by GC-MS, and their components were identified assisted by chemometric methods. Then reliability of 107
results from several multivariate curve resolution methods in presence of rotational ambiguities was 108

Page 6 of 35
Accep
ted
Man
uscr
ipt
investigated and the effects of applying constraints and multi-set configurations on reducing ambiguity of 109
GC-MS data were surveyed. 110
2. Material and instrumentation111
2.1. Reagents112
All reagents and chemicals that were used in this work were of analytical grade. Anhydrous sodium 113
sulphate was purchased from Merck. Normal alkanes' standards were purchased from ULTRA Scientific 114
(North Kingstown, USA).115
2.2. Sample preparation116
Green parts of Myrtus communis L. were collected during September of 2011 from different area 117
(Noorabadand and Khoramabad) of Iran and confirming specimen of the plant was executed in the Barij 118
Essence Company (Kashan, Iran).119
Two of three samples (W: Noorabad Wild and K: Khoramabad Wild) were collected from hillsides that 120
grow wildly and third sample (E: cultivated from Noorabadand) was collected from cultivation area at 121
stead. In the next step, each sample was classified into two groups as fresh (F) and dried by sun (D). The 122
volatile constituents of Myrtus communis L. were extracted using Clevenger-type apparatus as proposed 123
by the European Pharmacopoeia [48]. The obtained essential oils were dried over anhydrous sodium 124
sulphate and after filtration, stored in a dark glass at low temperature (4 °C) prior to analysis.125
2.3. Gas chromatography–mass spectrometry126
Samples were analyzed with an Agilent HP-6890 gas-chromatograph combined to an Agilent HP-5973 127
mass spectrometer (that was supplied with an electron ionization and quadrupole analyzer) on a HP-5MS 128
capillary fused silica column (30 m×0.25 mm i. d. 0.25µm film thickness). The temperature of the ion 129
source was set at 230°C. Helium was used as carrier gas with a total flow of 5 ml/min. Interface 130
temperature was set at 280 °C. The mass scan range was from 40-300 amu (Ionization energy: 70 eV). A 131
split injection (split ratio, 1:20) and injector temperature of 250 °C were employed. The oven temperature 132
Page 7 of 35
Accep
ted
Man
uscr
ipt
was programmed to increase from 50 to 250 °C at a rate of 3 °C/min, and for post run step, kept constant 133
at 280 °C for 10 min.134
2.4. Data analysis135
Data analysis was carried out on a 4-GHz Pentium IV personal computer; all programs were coded in 136
MATLAB 7.14 for windows. Resolved spectra were identified by matching against the standard mass 137
spectral NIST 05 database, which contains 209311 compounds.138
3. Theory and methodology139
3.1. Theory140
The basic assumption of bilinear models is that multivariate experimental data is a linear sum of the pure 141
singular contributions of the different chemical components in the system. Contributions of each 142
component can be depicted by the product of two factors, one related to its pure spectrum and another one 143
related to the concentration.144
The two way data matrix X obtained from GC-MS can be represented by bilinear models as follows:145
MCR-ALS: TMCR ALS MCR ALS MCR ALSX X E CS E (1)146
MF-ICA: TMF ICA MF ICA MF ICAX X E AS E (2)147
MCR-FMIN: TMCR FMIN MCR FMIN MCR FMINX X E CS E (3)148
Where XMCR-ALS, XMF-ICA and XMCR-FMIN are the reconstructed data matrices by MCR-ALS, MF-ICA and 149
MCR-FMIN, respectively. C and A are the concentration profiles, and ST is the spectral profile obtained 150
by these three methods. EMCR-ALS and EMCR-FMIN are residual matrices with the data variance unexplained 151
by CST. EMF-ICA is a residual matrix with the data independent unexplained by AST. The dimensions of 152
matrices are: X (m×n), C and A (m×p), ST (p×n) and E (m×n); in GC-MS data, m is the time points in 153
chromatographic direction (the number of rows), n is mass-to-charge (m/z) values in spectral direction 154
(the number of columns of X), and p is the number of chemical constituents. The difference between 155
Page 8 of 35
Accep
ted
Man
uscr
ipt
MCR and ICA is that MCR methods attempt to maximize the data variance explained by the different 156
constituents under a set of constraints (i.e. non-negativity and other constraints in MCR method); in 157
another side, ICA attempts to maximize the independence among the resolved constituents with a 158
minimum loss of information [49].159
Assessment of the solutions of chemometric resolution methods is the main step in the chemometric 160
resolution analysis of analytical data, such as GC–MS. There are five different methods for evaluating the 161
chemometric resolution solutions for a GC–MS data: (1) main important aspect from the analytical 162
chemistry point of view is chromatographic shape recovery, (2) statistical parameters of lack of fit (LOF) 163
and variance explained (R2), (3) reverse match factor (RMF) for assessment of the resolved mass spectra 164
with the relative standards in the MS database, (4) assessment of the extent of rotational ambiguities, and 165
(5) co-injection (injection of the standards of recognized components at the similar instrumental 166
conditions and contrast of the retention indices) [8]. Among these methods, using chromatographic shape 167
recovery, statistical parameters and RMF are the most prevalent for the assessment of the resolved 168
profiles by chemometric resolution methods in the GC–MS analysis of EOs. Because of the application of 169
the proposed methods only for two- and/or three-component systems with a low quantity of artifacts, 170
investigating the feasible regions of MCR results of real data is limited. Co-injection is also a reliable 171
method to approve the results of chemometric resolution techniques; though, there are some limitations in 172
the accessibility of the standards for the EOs components.173
The lack of fit (LOF) and R2 parameters have used for satisfactory test of the results. LOF and R2 can be 174
calculated using Eqs. (4) and (5), respectively.175
2,1 1
2,1 1
,( ) 100
i jI J
i ji j
I J
i ji j
d dLOF
d
(4)176
2
,1 12
2,1
,
1
1 100
I J
i ji j
I J
i ji j
i jd dR
d
(5)177
Page 9 of 35
Accep
ted
Man
uscr
ipt
where di,j is the element of the original data matrix and ljd is the recovered value using resolution 178
techniques. The sums are extended to i=1, . . ., I rows and j=1, . . ., J columns of the data matrix d. The 179
closer the lack of fit and R2 are, respectively, to zero and one, the best model fitting of the experimental 180
data has been achieved. The mathematical solutions of Eqs. (1), (2) and (3) for C (or A) and ST are 181
obviously “not unique” if no additional information is available. In other word, the decomposition of 182
matrix X according to these equations has been ambiguous. Here, rotational ambiguity of MCR solutions 183
was described (rotational ambiguity of ICA is similar to rotational ambiguity of MCR and describing of 184
it, was eliminated for brevity). Physical constraints such as non-negativity or other natural constraints like 185
closure, unimodality, and selectivity and especially local rank, significantly reduce the range of possible 186
solutions [30,34,40,50,51]. Rotational ambiguities can be described using the following equation:187
** 1 ( ) T Told newX X E CS E C T S E X ET (6)188
In this equation, from initial solutions C and ST, a new set of solutions C* and (ST)* can be obtained by 189
linear combination of the latter using a nonsingular matrix T, the so-called transformation (rotation) 190
matrix T. All C and ST solution fit the data matrix X equally well; they result in the same matrix Xold. For 191
a system that has no unique solution due to the presence of rotational ambiguity, a range of feasible MCR 192
solutions can be obtained via a range of different matrices T, and there is no way to be sure that one 193
solution is better than another one, i.e., that one particular solution is the true one, unless more 194
information is provided to the system [11,52].195
3.2. Methodology196
For studying the performance of chemometric resolution methods the following steps were performed:197
1. Data preprocessing: Since GC-MS data obtained in full scan mode includes many noise channels; 198
therefore, deleting these channels would result in a quicker computation. Noises channels consist of 199
random signals. Shen et al. [53] have proposed methods based on the frequency difference between 200

Page 10 of 35
Accep
ted
Man
uscr
ipt
the noise and the signal to distinguish the noises and the signal channels in GC-MS data. This 201
method is the so-called morphological score. It was used for decreasing the hemoscedastic noises in 202
GC-MS data. Also, Savitsky–Golay filter [54] which is a smoothing filter based on least squares for 203
smoothing and differentiating data, was used for decreasing the heteroscedastic noises in GC-MS 204
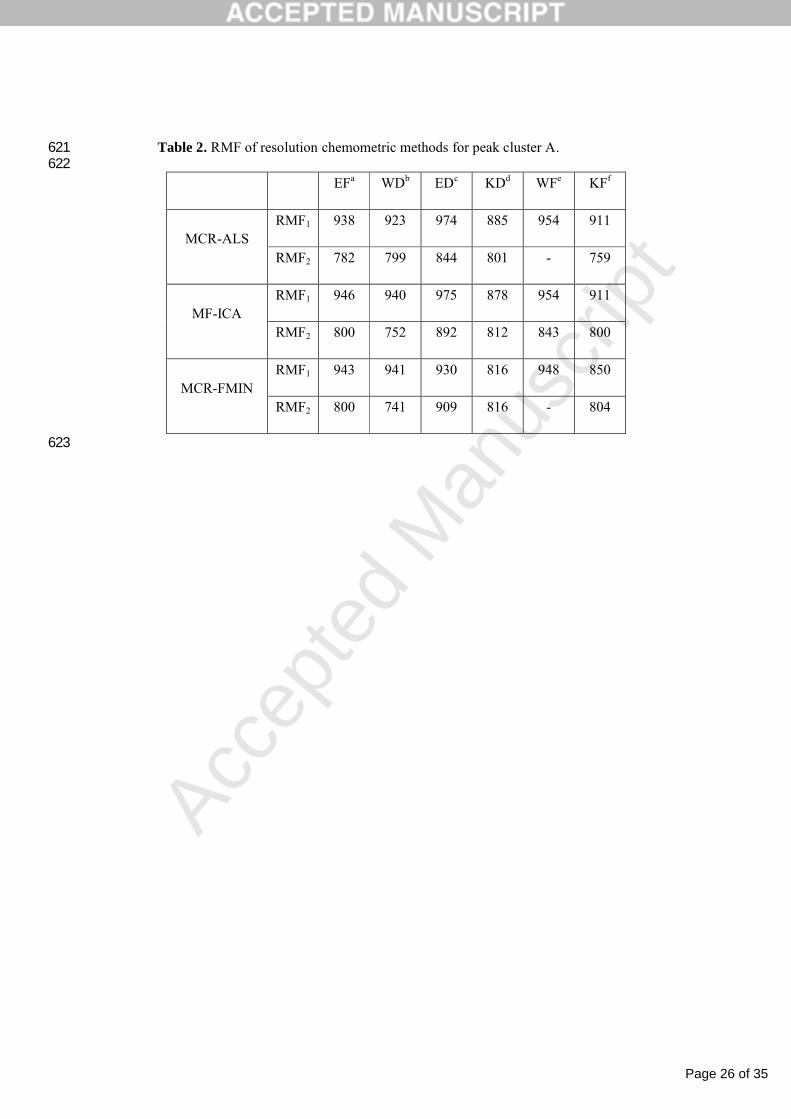
data. Baseline drift during the chromatographic elution is another problem in GC–MS analysis. 205
Presence of baseline drift in GC-MS analysis leads to requiring more complicated analysis to resolve 206
the data [55]. There are several methods that can deal with the difficulties of spectral background and 207
baseline drift, simultaneously. Congruence analysis method and least-squares fitting for correcting 208
the baseline drift and spectral background, have been developed by Liang et al. [56]. In another 209
preprocessing step, each data matrix is scaled to have a maximum signal intensity of 1.0.210
2. Determination of chemical constituents: Determination of chemical rank was performed by 211
morphological score method. In this technique key spectra are used instead of full rank matrices. 212
Therefore, the obtained results are more reliable [53].213
3. Chemometrics resolution: Using chemometric resolution methods, the pure profiles 214
(chromatographic and spectral profiles) of the constituents will be recovered.215
4. Valuation of the results: To confirm the reliability and quality of results, the similarity match with 216
MS database was used. The obtained results using these methods are evaluated by the statistical 217
parameters such as lack of fit (LOF) and variance explained (R2). When the LOF and R2 are close to 218
zero and one, respectively, the best model fitting of the multivariate instrumental measurements has 219
been achieved.220
5. Verifying of rotational ambiguities: Tauler showed that the MCR solutions are within the boundaries 221
which estimated by MCR-BANDS [18] and also he expressed that Gemperline’s concept was equal 222
to minimize and maximize the function in this Eq. [57]:223
Page 11 of 35
Accep
ted
Man
uscr
ipt
( )T
p p
p T
C Sf T
CS (7)224
Where T is the rotation (transformation) matrix; p represents the number of chemical constituents. The 225
optimization of this function (either maximized or minimized) will give the maximum and the minimum 226
boundary, respectively. For a particular species, these boundaries will describe the feasible concentration 227
and spectral profiles, executing the constraints of the problem and giving a maximum and a minimum 228
signal contribution [18,50,51,58].229
4. Results and discussion230
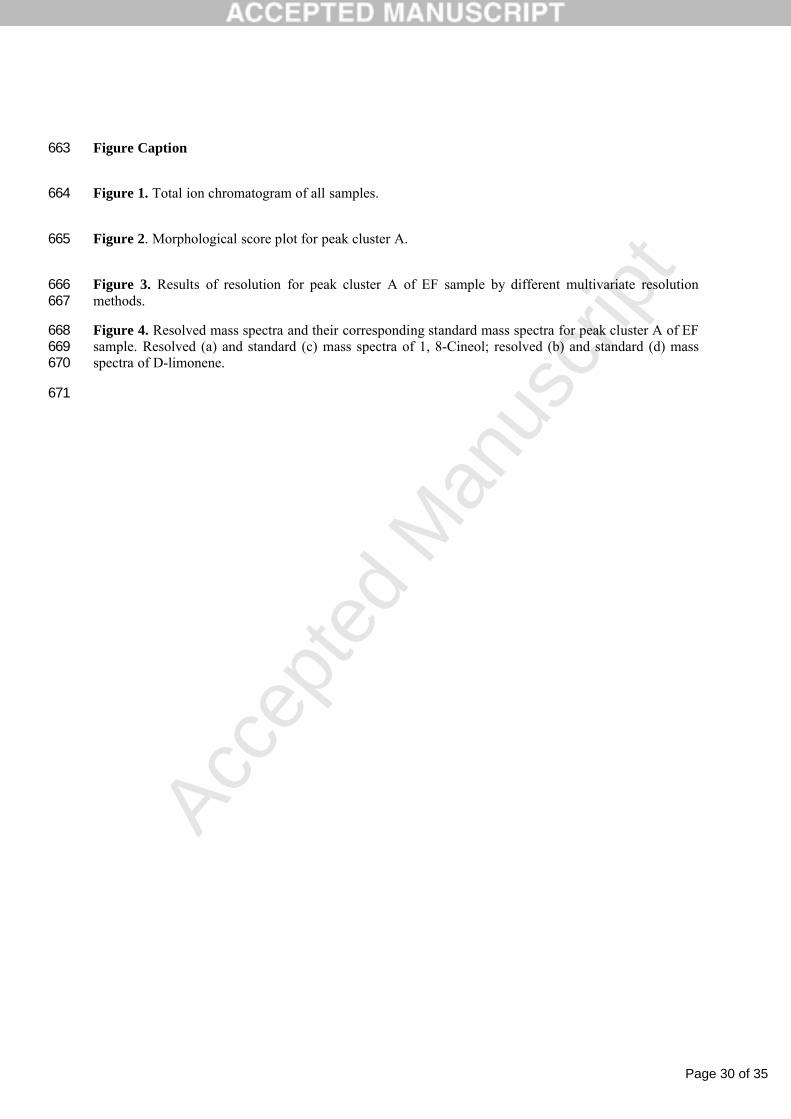
The six total ionic chromatograms (TICs) of essential oils from Myrtus communis L. are shown in Figure 231
1. The TICs show that some parts of the peaks practically overlap with each other. However, the 232
similarity indices (SIs) obtained from direct searching with the MS database, are very low for many 233
chromatographic peaks. Also, the same component is possibly searched at different chromatographic scan 234
points. In this study, as examples, three peak clusters (labeled by A, B, and C) are presented to show the 235
efficiency and performance of chemometric resolution methods for extracting more information from the 236
multi-component overlapping GC–MS data of essential oils. Here, the results of the peak cluster A 237
(Figures and Tables) are selected to display the chemometrics steps. Also, Tables of peak clusters B and 238
C are available as supplementary data. The aim of selecting these specific peak clusters are showing 239
performance and then assessment application of chemometric resolution methods in two- and three 240
components systems with various in degree in overlapping.241
Figure 1242
Steps of resolution process are shown by peak cluster A from EF sample. It seems that there is one 243
component in peak cluster A, but inspection of mass spectra of different part of the cluster indicates that 244
there could be more than one component or severe noises. As a result of the co-elution problems, 245

Page 12 of 35
Accep
ted
Man
uscr
ipt
presence of noises (heteroscedastic and homoscedastic) and baseline drift in these peak clusters; similarity 246
indices for simple search through the MS database were low. So, preprocessing was performed for each 247
data matrix, as first step in the resolution process. Critical step for reducing the complexity of the data 248
matrix is removing of the chromatogram baseline drift. In this study, the baseline correction was done by 249
using the methodology that was proposed by Liang et al.[56]. Therefore, morphological score method 250
[53] and Savitzky-Golay filter [54] were used for removing the homoscedastic and the heteroscedastic 251
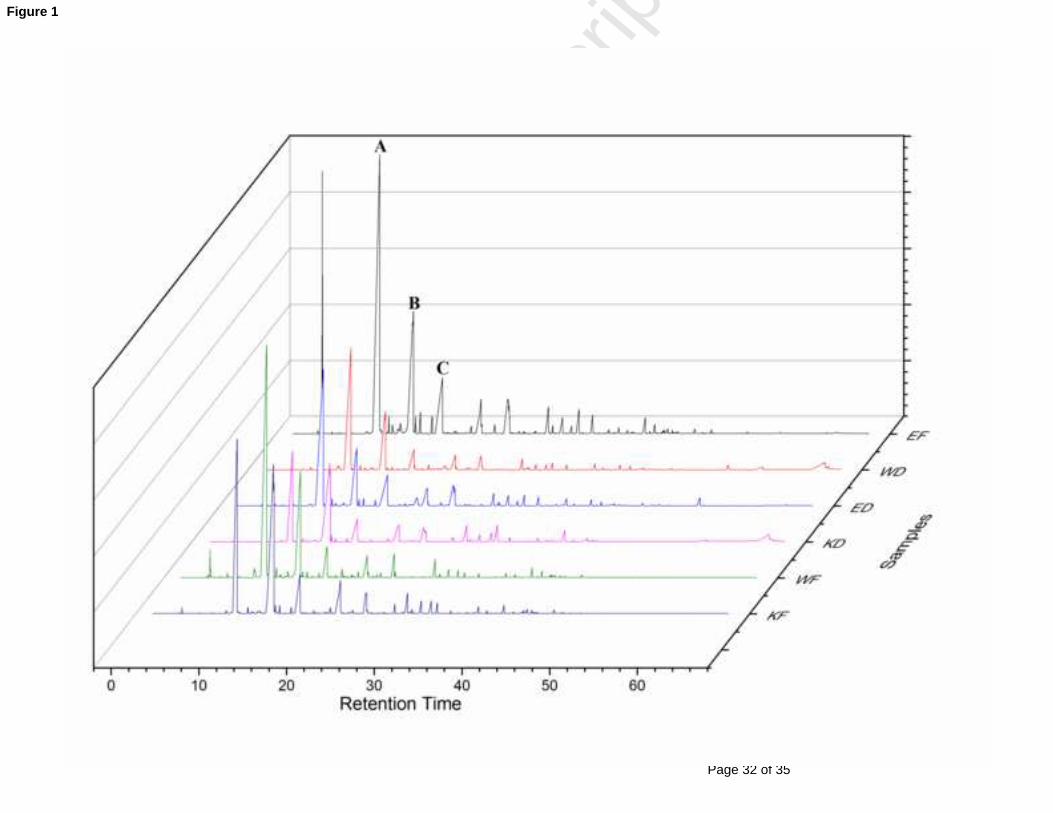
noises in this peak cluster, respectively. In second step, chemical rank is determined. For this objective, 252
morphological score method was used. In this method, the numbers of constituents were concluded by 253
counting the number of singular vectors with morphological scores upper than noise levels. In Figure 2, 254
the result of morphological score method is shown. Results of morphological score show the presence of 255
two components in this peak cluster. Also, results of morphological score method show that the peak 256
cluster B and C contain two and three components, respectively (results are not shown).257
Figure 2258
In the next step, reliability of MCR-ALS method by changing initial estimation methods was surveyed. In 259
this study, SIMPLISMA, EFA and OPA [57] were used as an initial estimate in an iterative process. 260
SMCR process starts with the estimation of initial pure variables, such as concentration and or pure 261
spectral profile. ALS procedure is carried out using the initial set of estimates, either concentration or 262
spectral profile. Several studies have claimed that while a poor initial estimate has used, ALS algorithm 263
reaches the suboptimal local minimum (reach to local minima can cause inadequate curve resolution) and 264
using strong initial estimate, ALS algorithm reaches the global minimum [24,25].265
Because of inevitable experimental uncertainties (noise, etc.), this decomposition is not perfect, and the 266
differences between the measured data and their decomposition are collected in a matrix of error E (or 267
residuals). By comparing the results of different samples can find out that these three initial estimation 268
methods (SIMPLISMA, EFA and OPA) extract the same value of signal contribution and lose the same 269
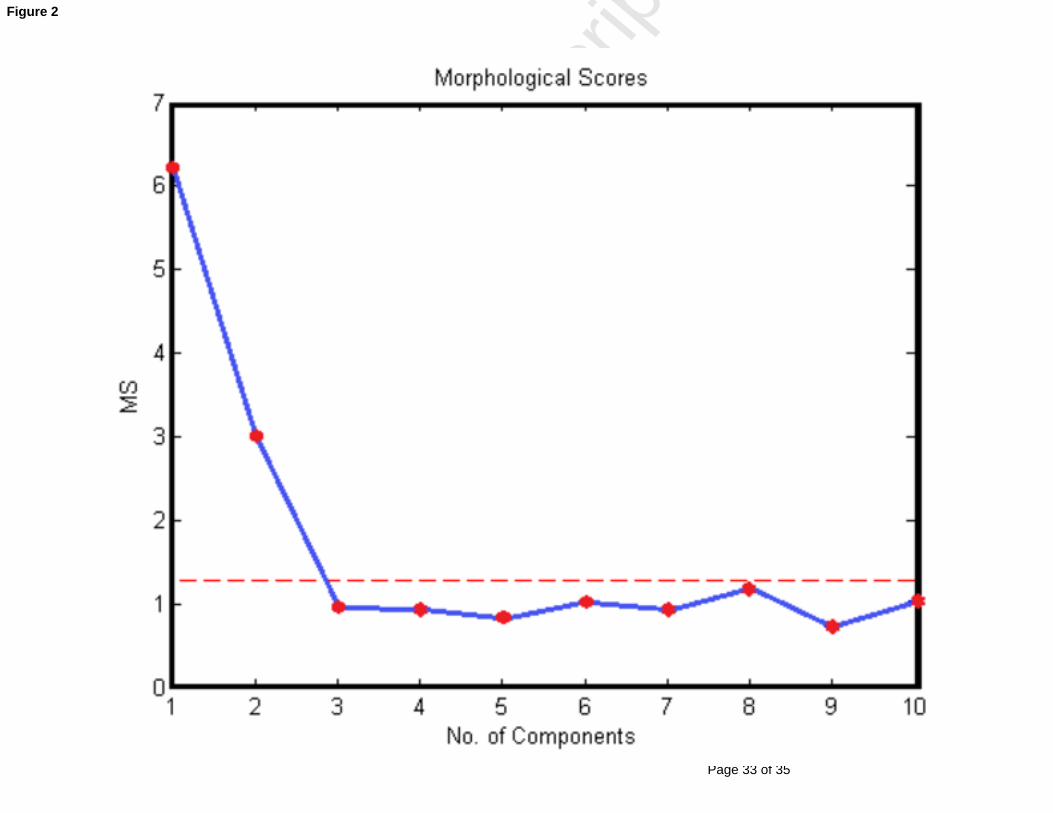
value of information (that presumably are noises). Table 1 and Figure 3 show the results of changing the 270
Page 13 of 35
Accep
ted
Man
uscr
ipt
initial estimation methods for peak cluster A. Also, results of changing the initial estimation methods for 271
peak cluster B and C are available in supplementary data (Table S1B and Table S1C, respectively).272
Table 1273
These results confirm that the various types of initial estimation methods using in an iterative process of 274
MCR-ALS have been used to prevent it from likely getting stuck in the local minima as well as using 275
different types of initial estimation techniques lead to the same results (in terms of statistical parameters 276
such as LOF and R2) but due to presence of rotational ambiguities, RMF of constituents is different.277
Allowing the analysis to reach convergence is so important. Results show that SIMPLISMA method can 278
be helpful for faster convergence compared to the other initial estimation methods (results are not shown).279
For resolving the peak clusters, chemometric resolution methods such as MCR-ALS [17], MF-ICA [16]280
and MCR-FMIN [18] were applied. Required initial estimates for MCR-ALS and MF-ICA were obtained 281
by SIMPLISMA [59] and also required initial estimate for MCR-FMIN as a basic theory of this method 282
was obtained from PCA [18]. Non-negativity on chromatograms and spectral profiles and normalization 283
on spectral profiles as constraints were used. Results of these decompositions for peak cluster A are 284
shown in Table 2. Also, results of these chemometric resolution methods for peak cluster B and C are 285
available in supplementary data (Table S2B and Table S2C, respectively). Figure 3 shows the pure 286
concentration profiles for peak cluster A from EF sample.287
Figure 3288
Because of sever co-elution and only applying non-negativity and normalization as constraints, the 289
resolved profiles have peak shapes that are far from ideal, for example, they have more than one 290
maximum for their concentration profiles of their components. In this figure, resolved concentration 291
profiles of both components from SIMPLISMA-MCR-ALS and OPA-MCR-ALS with the blue dotted-292
line and orange triangle-line indicate the concentration profiles of 1,8-Cineol and D-limonene, 293
respectively. From EFA-MCR-ALS method, blue stared-line and blue circled-line show the concentration 294
Page 14 of 35
Accep
ted
Man
uscr
ipt
profiles of 1,8-Cineol and D-limonene, respectively. For solutions of MF-ICA, red dash-dot-line indicates 295
the concentration profile of 1,8-Cineol and blue crossed-line shows the concentration profile of D-296
limonene and for solutions of MCR-FMIN, violet solid-line shows the concentration profile of 1,8-Cineol 297
and green rhombic-line indicates the concentration profile of D-limonene.298
Table 2299
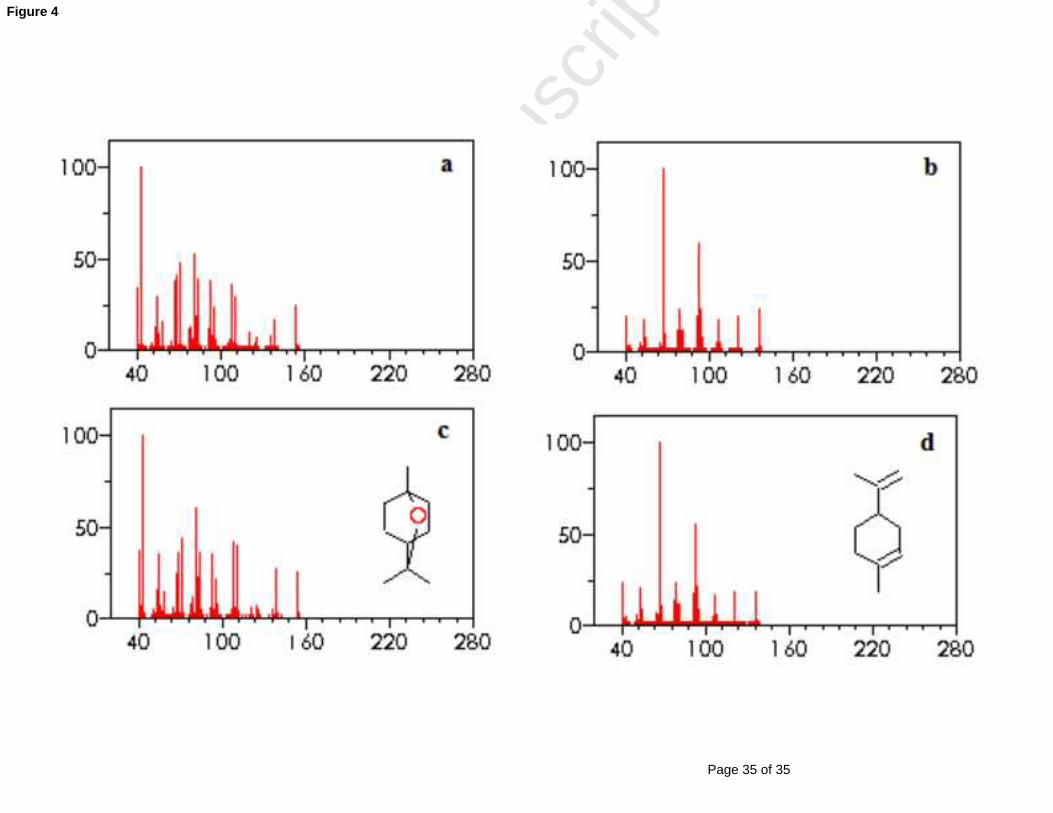
When each pure spectrum was obtained, then the constituents can be identified by similarity searches 300
using the NIST mass database and can be confirmed with retention indices [60]. In Figure 4 the mass 301
spectra and their relative standard spectra of constituents in peak cluster A from EF sample are shown 302
(obtained by SIMPLISMA-MCR-ALS). The library searches showed that the constituents of D-limonene 303
and 1, 8-Cineol are present in the peak cluster A, the constituents of Linalool and Hotrienol are existed in 304
peak cluster B; and the components of α-Terpineol, Estragole, and Myrtenol in peak cluster C. Also, the 305
reliability of the results was confirmed by comparing the Kovats retention indices of the resolved 306
components with those of the pure ones. 307
Figure 4308
In this study, Tauler’s algorithm [30] called MCR-BANDS was used for computing the minimum and the 309
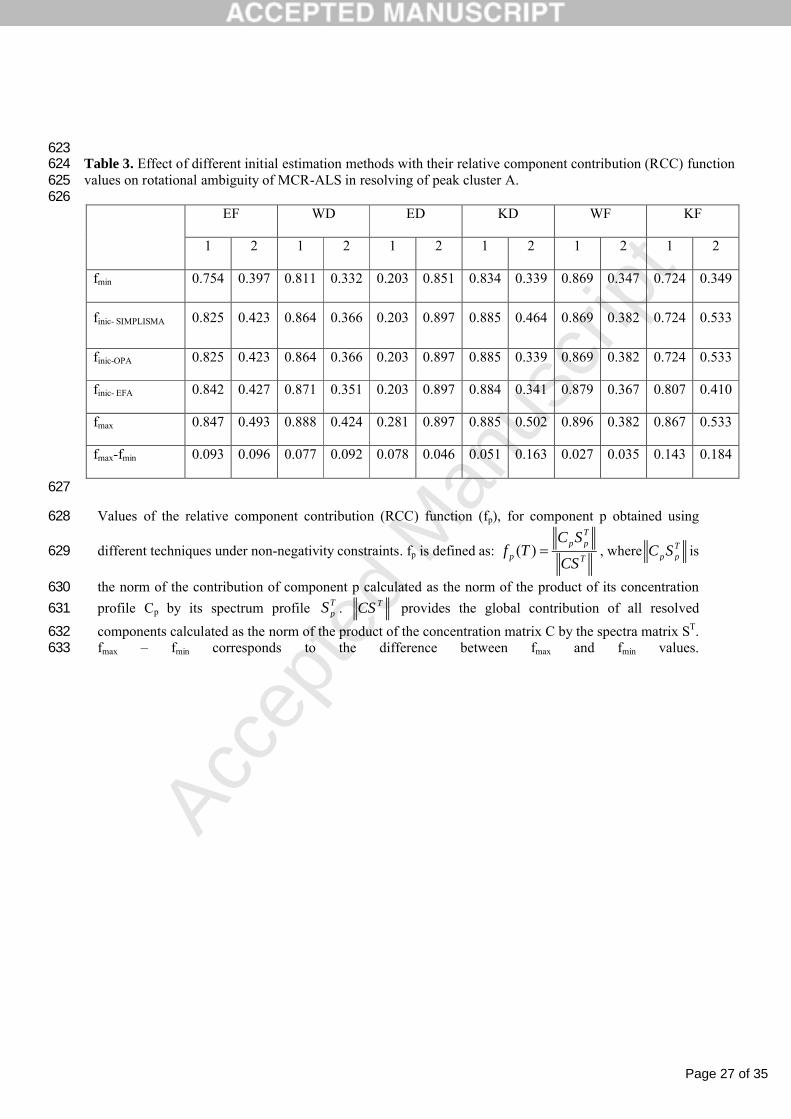
maximum boundaries. Effect of different initial estimation methods on rotational ambiguity of MCR-ALS 310
in resolving of peak cluster A is shown in Table 3 with their relative component contribution (RCC) 311
function values (see caption) when only non-negativity and spectral normalization constraints were 312
applied (Table S3B and Table S3C for peak clusters B and C, respectively). In these Tables, for each 313
component, the function values for the initial profiles (finic), the maximum (fmax), minimum (fmin) 314
optimized functions and the difference between them (fmax-fmin) are given that allow an easy inspection of 315
the extent of remaining rotational ambiguities. When the difference is close to zero, it means that 316
practically there is no remaining rotational ambiguity.317
Table 3318
Page 15 of 35
Accep
ted
Man
uscr
ipt
In all cases, solutions of MCR-ALS with different initial estimates are going to the same loss of 319
experimental data value (lack of fitting) and the same value of ambiguity (feasible region), but the values 320
of qualitative analysis of final solutions with different initial estimates are not same and resolved 321
components have different RMF (finish in different feasible solutions).322
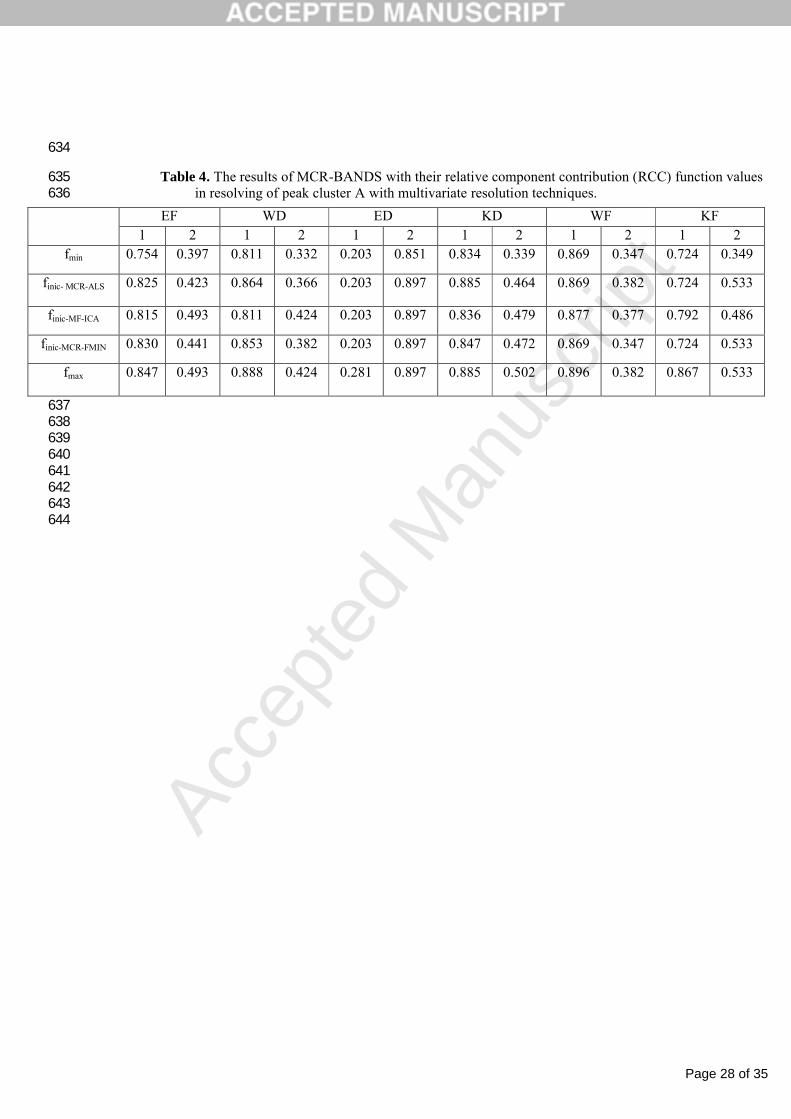
Table 4 shows the values of rotational ambiguities in SMCR methods for peak cluster A. Results of 323
SMCR methods for peak cluster B and C are available in supplementary data (Table S4B and Table S4C, 324
respectively). Results show that the performance of multivariate resolution techniques could be 325
influenced by level of overlapping or embedding and noise of dataset (these peak clusters in each sample 326
have different value of noise and degree of overlapping). Abdollahi and Tauler have claimed that in the 327
presence of rotational ambiguity and under a special set of constraints, the obtained solution by the 328
different multivariate curve resolution methods can differ among them and also from the true solution, 329
depending on the applies algorithm and initial estimates [42, 46]. But results of our research show that, all 330
iterative chemometric resolution methods with applied non-negativity on chromatogram and spectral 331
profiles and normalization on spectral profiles have the same and large values of rotational ambiguities. 332
Tauler reported that the maximum and the minimum band boundaries calculated for the solutions of 333
MCR-ALS and MCR-FMIN were different [18]. But, Rajko acclaim that the difference between the 334
maximum and the minimum band boundaries calculated for the solutions of MCR-ALS and MCR-FMIN 335
is impossible, because the rotational ambiguity belongs to the data matrix and is independent of the 336
algorithms of the curve resolution [51]. From comparison of RCC values in Table 4 for Peak cluster 337
A (peak cluster B and C in Table S4B and Table S4C, respectively), it is observed that each 338
solution of methods has RCC value in same feasible solution regions. For example, Fmin for peak 339
cluster A in EF sample by any of the three investigated methods are 0.754 and 0.397 for the first 340
and second components, respectively. Also, Fmax for peak cluster A in EA sample by any of the 341
three studied methods are 0.847 and 0.493 for the first and second components, respectively. In 342
other words, the range of the feasible region for this data set is independent of the algorithms that 343

Page 16 of 35
Accep
ted
Man
uscr
ipt
were used for resolution (0.093 and 0.096 for the first and second components, respectively). 344
One can see from Tables 3, S3B, S3C, 4, S4B and S4C that Fmin and Fmax values are rather 345
similar when the same system was investigated by any of the three methods (MCR-ALS, MFICA 346
or MCR-FMIN). The results of this study approve the Rajko acclaim, that the maximum and the 347
minimum band boundaries calculated for the solutions of MF-ICA, MCR-ALS and MCR-FMIN 348
are the same, in other words, rotational ambiguity belongs to the data matrix is independent of 349
the algorithms of the curve resolution.350
NIST library by comparing the fragmentation patterns composed of all fragment ions of unknown 351
component with its standards (supported by both reasonably good spectral matches and close time 352
matching with a database) lists the formula and name of the most likely compound. While one or more of 353
resolving fragmentation ions (abundance or pattern in spectral profile) are affected with each of common 354
problems, such as rotational ambiguity and noise, different component may be characterized. For 355
example, in peak cluster A of WF sample, in spite of obtaining good values of LOF and R2, similarity 356
index (RMF2) is poor (noted by (-) in Tables 1 and 2). This means that the model fits well the data but the 357
solutions are not the true ones, because rotational ambiguities are still present. Existence of rotational 358
ambiguities had led to obtaining odd profiles for peak cluster A of WF sample that does not pertain to D-359
limonene or 1, 8-Cineol, and the obtained profile could not be identified. As another example, in peak 360
cluster B of EF sample, in spite of obtaining good values of LOF and R2, similarity index (RMF4) is poor 361
(noted by (-) in Tables S1B and S2B in supplementary data). As mentioned above, this means that 362
rotational ambiguities are still present. Results show that, SMCR methods by non-negativity and 363
normalization as constraints are not reliable for quantitative and qualitative analysis.364
Table 4365
Iterative techniques try to find a rational solution. The important differences between the iterative 366
approaches can be related to the initial estimates used, the sort of profiles that are iteratively optimized, or 367

Page 17 of 35
Accep
ted
Man
uscr
ipt
the nature and application of the constraints. In these methods, at each cycle of an optimization process, 368
some constraints such as non-negativity, normalization, unimodality, local rank/selectivity, are exerted on 369
the algorithms to obtaining meaningful solutions. Constraints force the profiles in C and/or ST to comply 370
some predefined mathematical or chemical properties. In MF-ICA, MCR-ALS and MCR-FMIN some 371
constraints such as non-negativity and normalization are common. But algorithms of MCR-ALS and 372
MCR-FMIN have an advantage that they could impose other constraints such as unimodality, local 373
rank/selectivity, trilinearity (MF-ICA algorithm could not comply these important constraints). Also, in 374
contrast to MF-ICA algorithm, resolution of augmentation data is another MCR algorithms advantage. In 375
another word, MCR algorithms are proffered to resolution of several runs and or several samples.376
Several factors such as intense of complexity, intense of components, and value of noises have effect on 377
ambiguity of resolved results [42]. Therefore, each type of chromatograms, which has the diverse nature 378
of the data set, has a different amount of rotational ambiguity. 379
Because of unknown concentrations of components in GC-MS, the constraint of equal unit concentration 380
profile (closure) cannot be used. So non-negativity, unimodality, and selectivity play a major role in these 381
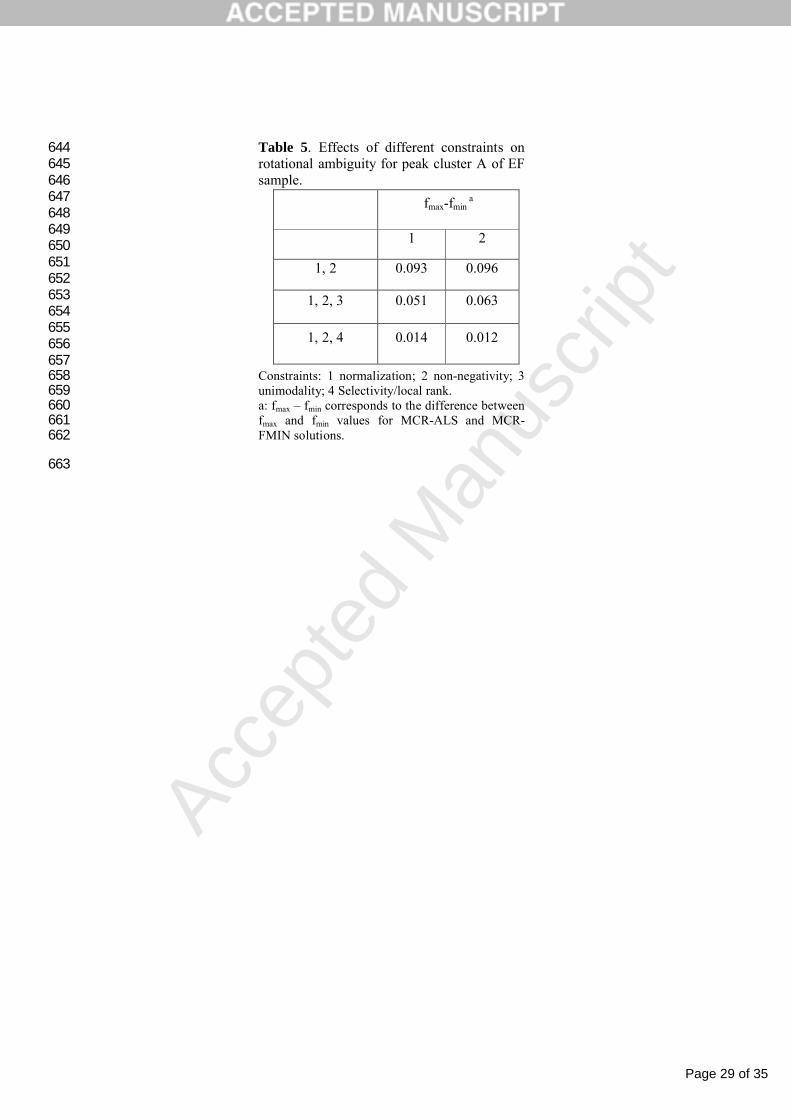
analysis [52,61]. In this paper, for reducing rotational ambiguity the following constraints have been 382
applied; non-negativity for the concentration and spectral profiles, unimodality and selectivity for the 383
concentration profile and normalization for the spectral profile. In this case, for the analysis of 384
experimental systems, the information needed for the application of the local rank/selectivity constraints 385
can be obtained from preliminary evolving factor analysis (EFA) of the data sets [62]. Results of peak 386
cluster A of EF sample are shown in Table 5. In supplementary data, Tables S5B and S5C have shown the 387
results of applying constraints on peak cluster B and C of EF sample, respectively.388
Table 5389
Results show that rotational ambiguities are reduced by applying appropriate constraints. Imposing of 390
only non-negativity and normalization constraints leave a wide range of possible elution profiles (see 391
Tables 3, S3B and S3C, Tables 4, S4B and S4C). Also, the spectral profiles can be very different if only 392

Page 18 of 35
Accep
ted
Man
uscr
ipt
these constraints were applied. When unimodality was applied, this range of possible solutions was 393
narrowed (see Tables 5, S5B and S5C), and when local rank constraint was applied, this range of possible 394
solutions was narrowed significantly. From these results can be clearly concluded that imposing any 395
additional information on the chemical system could be reduced the rotational ambiguity of the solutions 396
of a SMCR method [57,61]. Results show that, MCR-ALS and MCR-FMIN did not produce the unique 397
solutions because rotational ambiguity could not be totally solved in these cases by the proposed 398
constraints.399
As mentioned above, the first possible strategy to decrease or overcome on the influence of rotational 400
ambiguities could be the use of additional information (applying constraints) for each of the co-eluted 401
components. The second strategy is arranging data sets in a single augmented data matrix (data 402
augmentation of the several samples or runs). Data can be augmented by the three options of matrix 403
augmentation (column-wise, row-wise or column- and row-wise augmented data matrix). When the data 404
matrix is arranged in a row - or a column -wise augmented matrix, the algorithm is started by spectral or 405
concentration profile as an initial estimate, respectively [42]. GC-MS data, including those of essential 406
oils are naturally three-way (samples × retention time × m/z) and therefore, are candidates for analysis by 407
chemometric resolution methods.408
From the fact that the positions and shapes of the elution of the two co-eluted components in peak clusters 409
A (as well as B) and the three co-eluted components in peak cluster C are different in the six different 410
samples and can be found out that they could not be described by only two elution profiles for peak 411
clusters A (as well as B) and only three elution profiles for peak clusters C. In the other words, each 412
component in each sample needs a specific concentration profile to describe its elution profile. In this 413
study, because of using several samples, matrices of experimental data have some deviation from tri-414
linearity. MCR-ALS belongs to the methods that could work even with some deviation from tri-linearity 415
in data set. MCR-ALS works with the unfolding three-way data array which breaks the tri-linear 416
structure in the data set [63].417

Page 19 of 35
Accep
ted
Man
uscr
ipt
Results from augmentation of these six samples proven that the peak cluster A includes two components, 418
D-limonene and 1, 8-Cineol. The RMF of D-limonene and 1, 8-Cineol are 880 and 945, respectively. 419
Results from augmentation of these samples confirmed that the peak cluster B includes two components, 420
Linalool and Hotrienol. The RMF of Linalool and Hotrienol are 925 and 931, respectively. Also, results 421
from augmentation of these samples confirmed that the peak cluster C includes three components such as 422
α-Terpineol, Estragole, and Myrtenol. The RMF of α-Terpineol, Estragole, and Myrtenol are 945, 932 and 423
905, respectively. By augmentation of datasets from only six samples, the value of rotational ambiguity 424
reaches to zero. This proves the importance of using augmentation data to get optimal solutions in MCR 425
analysis. Thus, by applying the strategy of augmentation, the concentration and spectral profiles of the 426
main components were obtained truly. Therefore, using augmentation of datasets is one of the best 427
solutions for reducing or removing the rotational ambiguity.428
5. Conclusion429
Gas chromatography-mass spectrometry is common hyphenated chromatography technique for 430
identification volatile constituents of essential oils, but because of baseline drift, noises and co-elution, 431
this technique has unreliable performance. Chemometric resolution methods for resolving overlapping 432
peaks into pure profiles were applied. In this work, several results of common resolution techniques such 433
as MF-ICA, MCR-ALS and MCR-FMIN have been surveyed. Self-modeling curve resolution techniques 434
are hard model-free methods in a sense that no a-priori information on the chemical system is needed for 435
the construction of profiles. These results confirm that, when non-negativity and normalization are 436
applied, results of these three methods almost were the same. In general, because of the so-called 437
rotational ambiguity, a range of feasible solutions exist. The rotational ambiguities of the profiles are a 438
challenging fact which complicates the development of stable and universal SMCR algorithms. The 439
calculative determination of the range of feasible solution has an advantage in the analysis of chemical 440
systems. These results approve that, chemometric resolution techniques with imposed non-negativity and 441
normalization as constraints have much value of ambiguities on rotational ambiguities that approximately 442

Page 20 of 35
Accep
ted
Man
uscr
ipt
is the same for all methods. Also, results show that using additional information on the chemical system 443
can be reduced the rotational ambiguity of the solutions of chemometric resolution techniques. From the 444
obtained results, it is deduced that augmentation of data decreases considerably the extent of rotational 445
ambiguities in multivariate resolution methods. So, using augmented data with MCR-ALS technique by 446
applying appropriate constraints is the best solution for obtaining resolved profiles that are most similar to 447
the true profiles..448
6. Acknowledgements449
The authors are grateful to University of Kashan for supporting this work by Grant NO. 256727/1 and 450
would like to thank from Dr. Hadi Parastar from Department of Chemistry, Sharif University of 451
Technology for his helpful discussion and thankful to Barij Essence Pharmaceutical Company (Kashan, 452
Iran) for help us in preparing samples.453
454

Page 21 of 35
Accep
ted
Man
uscr
ipt
References454
455
[1] M. Jalali-Heravi, B. Zekavat, H. Sereshti, Use of gas chromatography–mass spectrometry 456combined with resolution methods to characterize the essential oil components of Iranian cumin 457and caraway, J. Chromatogr. A 1143 (2007) 215-226.458
[2] C. Brunelli, C. Bicchi, A. Di Stilo, A. Salomone, M. Vincenti, High‐speed gas chromatography in 459
doping control: Fast‐GC and fast‐GC/MS determination of β‐adrenoceptor ligands and diuretics, 460
J. Sep. Sci. 29 (2006) 2765-2771.461[3] J.M. Amigo, M.J. Popielarz, R.M. Callejón, M.L. Morales, A.M. Troncoso, M.A. Petersen, T.B. 462
Toldam-Andersen, Comprehensive analysis of chromatographic data by using PARAFAC2 and 463principal components analysis, J. Chromatogr. A 1217 (2010) 4422-4429.464
[4] X. Shao, G. Wang, S. Wang, Q. Su, Extraction of mass spectra and chromatographic profiles 465from overlapping GC/MS signal with background, Anal. Chem. 76 (2004) 5143-5148.466
[5] W. Windig, J.M. Phalp, A.W. Payne, A noise and background reduction method for component 467detection in liquid chromatography/mass spectrometry, Anal. Chem. 68 (1996) 3602-3606.468
[6] C.-J. Xu, Y.-Z. Liang, F.-T. Chau, Identification of essential components of Houttuynia cordata 469by gas chromatography/mass spectrometry and the integrated chemometric approach, Talanta 68 470(2005) 108-115.471
[7] L.W. Hantao, H.G. Aleme, M.P. Pedroso, G.P. Sabin, R.J. Poppi, F. Augusto, Multivariate curve 472resolution combined with gas chromatography to enhance analytical separation in complex 473samples: A review, Anal. Chim. Acta 731 (2012) 11-23.474
[8] M. Jalali-Heravi, H. Parastar, Recent trends in application of multivariate curve resolution 475approaches for improving gas chromatography–mass spectrometry analysis of essential oils, 476Talanta 85 (2011) 835-849.477
[9] J.M. Amigo, T. Skov, R. Bro, ChroMATHography: solving chromatographic issues with 478mathematical models and intuitive graphics, Chem. Rev. 110 (2010) 4582-4605.479
[10] G. Lubec, L. Afjehi-Sadat, Limitations and pitfalls in protein identification by mass spectrometry, 480Chemical Reviews-Columbus 107 (2007) 3568-3584.481
[11] A. de Juan, R.A. Tauler, Multivariate curve resolution (MCR) from 2000: progress in concepts 482and applications, Crit. Rev. Anal. Chem. 36 (2006) 163-176.483
[12] M. Garrido, F. Rius, M. Larrechi, Multivariate curve resolution–alternating least squares (MCR-484ALS) applied to spectroscopic data from monitoring chemical reactions processes, Anal. Bioanal. 485Chem. 390 (2008) 2059-2066.486
[13] J.-H. Jiang, Y. Liang, Y. Ozaki, Principles and methodologies in self-modeling curve resolution, 487Chemom. Intell. Lab. Syst. 71 (2004) 1-12.488
[14] S. Masoum, H. Ghasemi-Estarki, H. Seifi, E.H. Ebrahimabadi, H. Parastar, Analysis of the 489volatile chemical constituents in Mindium laevigatum by Gas chromatography–Mass 490spectrometry and correlative chemometric resolution methods, Microchem. J. (2012) 276-281.491
[15] H. Seifi, S. Masoum, S. Seifi, E.H. Ebrahimabadi, Chemometric Resolution Approaches in 492Characterisation of Volatile Constituents in Plantago ovata Seeds using Gas Chromatography–493
Page 22 of 35
Accep
ted
Man
uscr
ipt
Mass Spectrometry: Methodology and Performance Assessment, Phytochem. Anal. 25 (2014) 494273–281.495
[16] A. Hyvärinen, E. Oja, Independent component analysis: algorithms and applications, Neural 496networks 13 (2000) 411-430.497
[17] J. Jaumot, R. Gargallo, A. de Juan, R. Tauler, A graphical user-friendly interface for MCR-ALS: 498a new tool for multivariate curve resolution in MATLAB, Chemom. Intell. Lab. Syst. 76 (2005) 499101-110.500
[18] R. Tauler, Application of non-linear optimization methods to the estimation of multivariate curve 501resolution solutions and of their feasible band boundaries in the investigation of two chemical and 502environmental simulated data sets, Anal. Chim. Acta 595 (2007) 289-298.503
[19] H. Li, J. Hou, K. Wang, F. Zhang, Resolution of multicomponent overlapped peaks: A 504comparison of several curve resolution methods, Talanta 70 (2006) 336-343.505
[20] S. Masoum, H. Seifi, E.H. Ebrahimabadi, Characterization of volatile components in calligonum 506comosum by coupling gas chromatography-mass spectrometry and mean field approach 507independent component analysis, Anal. Methods 5 (2013) 4639-4647.508
[21] M. Jalali-Heravi, B. Zekavat, H. Sereshti, Characterization of essential oil components of Iranian 509geranium oil using gas chromatography–mass spectrometry combined with chemometric 510resolution techniques, J. Chromatogr. A 1114 (2006) 154-163.511
[22] G. Wang, W. Cai, X. Shao, A primary study on resolution of overlapping GC-MS signal using 512mean-field approach independent component analysis, Chemom. Intell. Lab. Syst. 82 (2006) 137-513144.514
[23] M. Vosough, Using mean field approach independent component analysis to fatty acid 515characterization with overlapped GC–MS signals, Anal. Chim. Acta 598 (2007) 219-226.516
[24] M. Jalali-Heravi, H. Parastar, H. Ebrahimi-Najafabadi, Self-modeling curve resolution techniques 517applied to comparative analysis of volatile components of Iranian saffron from different regions, 518Anal. Chim. Acta 662 (2010) 143-154.519
[25] M. Jalali-Heravi, H. Parastar, Assessment of the co-elution problem in gas chromatography-mass 520spectrometry using non-linear optimization techniques, Chemom. Intell. Lab. Syst. 101 (2010) 1-52113.522
[26] A. Cichocki, R. Zdunek, Advances in Neural Networks, Springer, 2007.523[27] S. Navea, R. Tauler, A. de Juan, Monitoring and modeling of protein processes using mass 524
spectrometry, circular dichroism, and multivariate curve resolution methods, Anal. Chem. 78 525(2006) 4768-4778.526
[28] A. de Juan, M. Maeder, T. Hancewicz, R. Tauler, Use of local rank‐based spatial information for 527
resolution of spectroscopic images, J. Chemometrics 22 (2008) 291-298.528[29] T. Azzouz, R. Tauler, Application of multivariate curve resolution alternating least squares 529
(MCR-ALS) to the quantitative analysis of pharmaceutical and agricultural samples, Talanta 74 530(2008) 1201-1210.531
[30] J. Jaumot, R. Tauler, MCR-BANDS: A user friendly MATLAB program for the evaluation of 532rotation ambiguities in Multivariate Curve Resolution, Chemom. Intell. Lab. Syst. 103 (2010) 96-533107.534
[31] M.H. Van Benthem, M.R. Keenan, D.M. Haaland, Application of equality constraints on 535variables during alternating least squares procedures, J. Chemometrics 16 (2002) 613-622.536
[32] A. de Juan, M. Maeder, M. Martı́nez, R. Tauler, Combining hard-and soft-modelling to solve 537kinetic problems, Chemom. Intell. Lab. Syst. 54 (2000) 123-141.538
Page 23 of 35
Accep
ted
Man
uscr
ipt
[33] M. Sawall, C. Fischer, D. Heller, K. Neymeyr, Reduction of the rotational ambiguity of curve 539resolution techniques under partial knowledge of the factors. Complementarity and coupling 540theorems, J. Chemometrics 26 (2012) 526-537.541
[34] H. Abdollahi, R. Tauler, Uniqueness and rotation ambiguities in Multivariate Curve Resolution 542methods, Chemom. Intell. Lab. Syst. 108 (2011) 100-111.543
[35] W.H. Lawton, E.A. Sylvestre, Self modeling curve resolution, Technometrics 13 (1971) 617-633.544[36] R. Rajkó, Additional knowledge for determining and interpreting feasible band boundaries in 545
self-modeling/multivariate curve resolution of two-component systems, Anal. Chim. Acta 661 546(2010) 129-132.547
[37] R.b. Rajkó, Comments on Near-Infrared Hyperspectral Unmixing Based on a Minimum Volume 548Criterion for Fast and Accurate Chemometric Characterization of Counterfeit Tablets, Anal. 549Chem. 82 (2010) 8750-8752.550
[38] O.S. Borgen, N. Davidsen, Z. Mingyang, Ø. Øyen, The multivariate N-component resolution 551problem with minimum assumptions, Microchim. Acta 89 (1986) 63-73.552
[39] O.S. Borgen, B.R. Kowalski, An extension of the multivariate component-resolution method to 553three components, Anal. Chim. Acta 174 (1985) 1-26.554
[40] R. Rajkó, Some surprising properties of multivariate curve resolution‐alternating least squares 555
(MCR‐ALS) algorithms, J. Chemometrics 23 (2009) 172-178.556
[41] R. Rajkó, Studies on the adaptability of different Borgen norms applied in self‐modeling curve 557
resolution (SMCR) method, J. Chemometrics 23 (2009) 265-274.558[42] A. Golshan, H. Abdollahi, M. Maeder, Resolution of rotational ambiguity for three-component 559
systems, Anal. Chem. 83 (2011) 836-841.560[43] S. Burt, Essential oils: their antibacterial properties and potential applications in foods—a review, 561
Int. J. Food Microbiol. 94 (2004) 223-253.562[44] L.S. Nerio, J. Olivero-Verbel, E. Stashenko, Repellent activity of essential oils: a review, 563
Bioresour. Technol. 101 (2010) 372-378.564[45] E. Guenther, The production of essential oils, The essential oils 1 (1972) 87-226.565[46] D.J. Charles, J.E. Simon, Comparison of extraction methods for the rapid determination of 566
essential oil content and composition of basil, J. Am. Soc. Hortic. Sci. 115 (1990) 458-462.567[47] M. Godefroot, P. Sandra, M. Verzele, New method for quantitative essential oil analysis, J. 568
Chromatogr. A 203 (1981) 325-335.569[48] S. A. Maisonneuve, European Pharmacopoeia, Sainte-Ruffine, France 3 (1975) 68-80.570[49] H. Parastar, M. Jalali-Heravi, R. Tauler, Is independent component analysis appropriate for 571
multivariate resolution in analytical chemistry?, TrAC, Trends Anal. Chem. 31 (2012) 134-143.572[50] H. Abdollahi, M. Maeder, R. Tauler, Calculation and meaning of feasible band boundaries in 573
multivariate curve resolution of a two-component system, Anal. Chem. 81 (2009) 2115-2122.574[51] R. Rajkó, Computation of the range (band boundaries) of feasible solutions and measure of the 575
rotational ambiguity in self-modeling/multivariate curve resolution, Anal. Chim. Acta 645 (2009) 57618-24.577
Page 24 of 35
Accep
ted
Man
uscr
ipt
[52] R. Tauler, Multivariate curve resolution applied to second order data, Chemom. Intell. Lab. Syst. 57830 (1995) 133-146.579
[53] H. Shen, L. Stordrange, R. Manne, O.M. Kvalheim, Y. Liang, The morphological score and its 580application to chemical rank determination, Chemom. Intell. Lab. Syst. 51 (2000) 37-47.581
[54] A. Savitzky, M.J.E. Golay, Smoothing and differentiation of data by simplified least squares 582procedures, Anal. Chem. 36 (1964) 1627-1639.583
[55] P.H.C. Eilers, Parametric time warping, Anal. Chem. 76 (2004) 404-411.584[56] Y.Z. Liang, O.M. Kvalheim, A. Rahmani, R.G. Brereton, A two-way procedure for background 585
correction of chromatographic/spectroscopic data by congruence analysis and least-squares fit of 586the zero-component regions: comparison with double-centering, Chemom. Intell. Lab. Syst. 18 587(1993) 265-279.588
[57] R. Tauler, Calculation of maximum and minimum band boundaries of feasible solutions for 589species profiles obtained by multivariate curve resolution, J. Chemometrics 15 (2001) 627-646.590
[58] G. Ahmadi, H. Abdollahi, A systematic study on the accuracy of chemical quantitative analysis 591using soft modeling methods, Chemom. Intell. Lab. Syst. 120 (2012) 59-70.592
[59] W. Windig, C. Heckler, F. Agblevor, R. Evans, Self-modeling mixture analysis of categorized 593pyrolysis mass spectral data with the SIMPLISMA approach, Chemom. Intell. Lab. Syst. 14 594(1992) 195-207.595
[60] R.P. Adams, Identification of essential oil components by gas chromatography/mass 596spectrometry, B R.P. Adams (Ed.), Allured Publishing Corporation, 2007.597
[61] R. Tauler, A. Smilde, B. Kowalski, Selectivity, local rank, three‐way data analysis and ambiguity 598
in multivariate curve resolution, J. Chemometrics 9 (1995) 31-58.599[62] M. Maeder, A.D. Zuberbuehler, The resolution of overlapping chromatographic peaks by 600
evolving factor analysis, Anal. Chim. Acta 181 (1986) 287-291.601[63] A. Olivieri, G. Escandar, A. Peña, Second-order and higher-order multivariate calibration 602
methods applied to non-multilinear data using different algorithms, TrAC Trends in Anal. Chem. 60330 (2011) 607-617.604
605
606

Page 25 of 35
Accep
ted
Man
uscr
ipt
606
Table 1. Effects of different initial estimation methods to launch MCR-ALS 607algorithm in resolving of peak cluster A.608
EFa WDb EDc KDd WFe KFf
RMF1 938 923 974 885 954 911
RMF2 782 799 844 801 - 759
LOF 8.79 7.27 5.44 9.56 10.55 12.45SIMPLISMA
R2 99.23 99.47 99.70 99.09 99.89 98.45
RMF1 938 906 974 885 954 911
RMF2 799 798 844 801 - 759
LOF 8.79 7.27 5.44 9.56 10.55 12.45
OPA
R2 99.23 99.47 99.70 99.09 99.89 98.45
RMF1 938 902 974 885 954 911
RMF2 782 799 844 801 - 759
LOF 8.79 7.27 5.44 9.56 10.55 12.45EFA
R2 99.23 99.47 99.70 99.09 99.89 98.45
a Fresh sample cultivated in Noorabad; b Dried sample collected from hillsides of 609Noorabad; c Dried sample cultivated in Noorabad; d Dried sample collected from hillsides 610of Khoramabad; e Fresh sample collected from hillsides of Noorabad; f Fresh sample 611collected from hillsides of Khoramabad.612The database lists the name and formula of the most likely compound in accordance with 613the NIST search that matches an unknown compound and how similar the two compounds 614are in terms of their peaks (match/ reverse match factor). Reverse match factor (RMF) is a 615peak comparison between the unknown and the known spectra. As a general guide, 900 or 616greater is an excellent match; 800–900, a good match; 700–800, a fair match. Less than 600 617is a very poor match. RMF1 and RMF2 show reverse match factor (RMF) of 1, 8-Cineol and 618D-limonene, respectively.619b LOF and R2 values are calculated according to Equation (4) and (5), respectively.620
Page 26 of 35
Accep
ted
Man
uscr
ipt
Table 2. RMF of resolution chemometric methods for peak cluster A.621622
EFa WDb EDc KDd WFe KFf
RMF1 938 923 974 885 954 911MCR-ALS
RMF2 782 799 844 801 - 759
RMF1 946 940 975 878 954 911MF-ICA
RMF2 800 752 892 812 843 800
RMF1 943 941 930 816 948 850MCR-FMIN
RMF2 800 741 909 816 - 804
623
Page 27 of 35
Accep
ted
Man
uscr
ipt
623Table 3. Effect of different initial estimation methods with their relative component contribution (RCC) function 624values on rotational ambiguity of MCR-ALS in resolving of peak cluster A.625
626EF WD ED KD WF KF
1 2 1 2 1 2 1 2 1 2 1 2
fmin 0.754 0.397 0.811 0.332 0.203 0.851 0.834 0.339 0.869 0.347 0.724 0.349
finic- SIMPLISMA 0.825 0.423 0.864 0.366 0.203 0.897 0.885 0.464 0.869 0.382 0.724 0.533
finic-OPA 0.825 0.423 0.864 0.366 0.203 0.897 0.885 0.339 0.869 0.382 0.724 0.533
finic- EFA 0.842 0.427 0.871 0.351 0.203 0.897 0.884 0.341 0.879 0.367 0.807 0.410
fmax 0.847 0.493 0.888 0.424 0.281 0.897 0.885 0.502 0.896 0.382 0.867 0.533
fmax-fmin 0.093 0.096 0.077 0.092 0.078 0.046 0.051 0.163 0.027 0.035 0.143 0.184
627
Values of the relative component contribution (RCC) function (fp), for component p obtained using 628
different techniques under non-negativity constraints. fp is defined as: ( )T
p p
p T
C Sf T
CS , where T
p pC S is 629
the norm of the contribution of component p calculated as the norm of the product of its concentration 630profile Cp by its spectrum profile T
pS . TCS provides the global contribution of all resolved 631
components calculated as the norm of the product of the concentration matrix C by the spectra matrix ST. 632fmax – fmin corresponds to the difference between fmax and fmin values.633
Page 28 of 35
Accep
ted
Man
uscr
ipt
634
Table 4. The results of MCR-BANDS with their relative component contribution (RCC) function values635in resolving of peak cluster A with multivariate resolution techniques.636
637638639640641642643644
EF WD ED KD WF KF1 2 1 2 1 2 1 2 1 2 1 2
fmin 0.754 0.397 0.811 0.332 0.203 0.851 0.834 0.339 0.869 0.347 0.724 0.349
finic- MCR-ALS 0.825 0.423 0.864 0.366 0.203 0.897 0.885 0.464 0.869 0.382 0.724 0.533
finic-MF-ICA 0.815 0.493 0.811 0.424 0.203 0.897 0.836 0.479 0.877 0.377 0.792 0.486
finic-MCR-FMIN 0.830 0.441 0.853 0.382 0.203 0.897 0.847 0.472 0.869 0.347 0.724 0.533
fmax 0.847 0.493 0.888 0.424 0.281 0.897 0.885 0.502 0.896 0.382 0.867 0.533
Page 29 of 35
Accep
ted
Man
uscr
ipt
Table 5. Effects of different constraints on 644rotational ambiguity for peak cluster A of EF 645sample.646
647648649650651652653654655656657
Constraints: 1 normalization; 2 non-negativity; 3 658unimodality; 4 Selectivity/local rank.659a: fmax – fmin corresponds to the difference between 660fmax and fmin values for MCR-ALS and MCR-661FMIN solutions.662
663
fmax-fmin a
1 2
1, 2 0.093 0.096
1, 2, 3 0.051 0.063
1, 2, 4 0.014 0.012
Page 30 of 35
Accep
ted
Man
uscr
ipt
Figure Caption663
Figure 1. Total ion chromatogram of all samples.664
Figure 2. Morphological score plot for peak cluster A.665
Figure 3. Results of resolution for peak cluster A of EF sample by different multivariate resolution 666methods.667
Figure 4. Resolved mass spectra and their corresponding standard mass spectra for peak cluster A of EF 668sample. Resolved (a) and standard (c) mass spectra of 1, 8-Cineol; resolved (b) and standard (d) mass 669spectra of D-limonene.670
671

Page 31 of 35
Accep
ted
Man
uscr
ipt
Highlights:
Initial estimates have no effect on extraction of information from overlapped signals.
MCR-ALS results are favorably compared to results obtained by MF-ICA and MCR-FMIN.
Physical constraints were implemented to reduce the rotational ambiguities.
Using augmentation data is the best way to overcome on rotational ambiguity.
*Highlights (for review)
Page 32 of 35
Accep
ted
Man
uscr
ipt
Figure 1
Page 33 of 35
Accep
ted
Man
uscr
ipt
Figure 2

Page 34 of 35
Accep
ted
Man
uscr
ipt
Figure 3
Page 35 of 35
Accep
ted
Man
uscr
ipt
Figure 4