Chemometric data analysis of pollutants in wastewater—a case study
11
Analytica Chimica Acta 532 (2005) 15–25 Chemometric data analysis of pollutants in wastewater—a case study Kunwar P. Singh a,∗ , Amrita Malik a , Dinesh Mohan a , Sarita Sinha b , Vinod K. Singh a a Environmental Chemistry Section, Industrial Toxicology Research Centre, P.O. Box 80, MG Marg, Lucknow 226 001, India b National Botanical Research Institute, Rana Pratap Marg, Lucknow 226 001, India Received 3 April 2004; received in revised form 18 October 2004; accepted 18 October 2004 Available online 24 December 2004 Abstract In this study, chemometric techniques such as cluster analysis (CA), discriminant analysis (DA), principal component analysis (PCA) and partial least squares (PLS) were used to analyse the wastewater dataset to identify the factors which affect the composition of sewage of domestic origin, spatial and temporal variations, similarity/dissimilarity among the wastewater characteristics of cis- and trans-drains and discriminating variables. Samples collected from 24 wastewater drains in Lucknow city and from three sites on Gomti river in the month of January/February, May, August and November during the period of 5 years (1994–1999) were characterized for 32 parameters. The multivariate techniques successfully described the similarities/dissimilarities among the sewage drains on the basis of their wastewater characteristics and sources signifying the effect of routine domestic/commercial activities in respective drainage areas. Spatial and seasonal variations in wastewater composition were also determined successfully. CA generated six groups of drains on the basis of similar wastewater characteristic. PCA provided information on seasonal influence and compositional differences in sewage generated by domestic and industrial waste dominated drains and showed that drains influenced by mixed industrial effluents have high organic pollution load. DA rendered six variables (TDS, alkalinity, F, TKN, Cd and Cr) discriminating between cis- and trans-drains. PLS–DA showed dominance of Cd, Cr, NO 3 , PO 4 and F in cis-drains wastewater. The results suggest that biological-process based STPs could treat wastewater both from the cis- as well as trans-drains, however, prior removal of toxic metals will be required from the cis-drains sewage. Further, seasonal variations in wastewater composition and pollution load could be the guiding factor for determining the STPs design parameters. The information generated would be useful in selection of process type and in designing of the proposed sewage treatment plants (STPs) for safe disposal of wastewater. © 2004 Elsevier B.V. All rights reserved. Keywords: Wastewater; Sewage treatment; Multivariate analysis; Cluster analysis; Principal component; Discriminant analysis; Partial least squares 1. Introduction Safe disposal of domestic and industrial wastewater is an essential requirement under the Environmental Protec- tion Act, which establishes maximum permissible levels of various pollutants for discharge onto land and into the sur- face waters [1]. This emphasizes for proper treatment of sewage/wastewater prior to its final disposal. For selection of appropriate treatment process and design parameters to main- tain stable conditions for achieving optimum performance of the sewage treatment plants (STPs) round the year, a detailed ∗ Corresponding author. Tel.: +91 522 2508916; fax: +91 522 2228227. E-mail address: kpsingh [email protected] (K.P. Singh). information about the sources, composition and levels of pol- lutants in wastewater is needed. Lucknow, the State capital of Uttar Pradesh (India), is a city of over three and half million residents. The city spread over an area of about 400 km 2 is situated on the banks of Gomti river, a major tributary of the Ganga river. Out of the total about 550 million liter per day (mld) of the domestic and industrial sewage generated by the town, only a small fraction (about 40 mld) is currently treated by a recently established sewage treatment plant (STP) and major fraction of the rest of untreated sewage (510 mld) is discharged to the Gomti river through some 26 wastewater drains within a stretch of about 12 km. Among these, 14 drains collect sewage from the cis- side, while, another 12 from the trans-side of the river. The 0003-2670/$ – see front matter © 2004 Elsevier B.V. All rights reserved. doi:10.1016/j.aca.2004.10.043
-
Upload
independent -
Category
Documents
-
view
4 -
download
0
Transcript of Chemometric data analysis of pollutants in wastewater—a case study

Analytica Chimica Acta 532 (2005) 15–25
Chemometric data analysis of pollutants in wastewater—a case study
Kunwar P. Singha,∗, Amrita Malika, Dinesh Mohana, Sarita Sinhab, Vinod K. Singha
a Environmental Chemistry Section, Industrial Toxicology Research Centre, P.O. Box 80, MG Marg, Lucknow 226 001, Indiab National Botanical Research Institute, Rana Pratap Marg, Lucknow 226 001, India
Received 3 April 2004; received in revised form 18 October 2004; accepted 18 October 2004Available online 24 December 2004
Abstract
In this study, chemometric techniques such as cluster analysis (CA), discriminant analysis (DA), principal component analysis (PCA)and partial least squares (PLS) were used to analyse the wastewater dataset to identify the factors which affect the composition of sewageof domestic origin, spatial and temporal variations, similarity/dissimilarity among the wastewater characteristics ofcis- and trans-drainsand discriminating variables. Samples collected from 24 wastewater drains in Lucknow city and from three sites on Gomti river in themonth of January/February, May, August and November during the period of 5 years (1994–1999) were characterized for 32 parameters.T wastewaterc nd seasonalv wastewaterc nd industrialw ndered sixv OPa waterc d would beu ter.©
K res
1
atvfsatt
pol-
is aeadofthend
ctionhedst ofriverbout
e
0d
he multivariate techniques successfully described the similarities/dissimilarities among the sewage drains on the basis of theirharacteristics and sources signifying the effect of routine domestic/commercial activities in respective drainage areas. Spatial aariations in wastewater composition were also determined successfully. CA generated six groups of drains on the basis of similarharacteristic. PCA provided information on seasonal influence and compositional differences in sewage generated by domestic aaste dominated drains and showed that drains influenced by mixed industrial effluents have high organic pollution load. DA reariables (TDS, alkalinity, F, TKN, Cd and Cr) discriminating betweencis- andtrans-drains. PLS–DA showed dominance of Cd, Cr, N3,O4 and F incis-drains wastewater. The results suggest that biological-process based STPs could treat wastewater both from thecis- as wellstrans-drains, however, prior removal of toxic metals will be required from thecis-drains sewage. Further, seasonal variations in wasteomposition and pollution load could be the guiding factor for determining the STPs design parameters. The information generateseful in selection of process type and in designing of the proposed sewage treatment plants (STPs) for safe disposal of wastewa2004 Elsevier B.V. All rights reserved.
eywords:Wastewater; Sewage treatment; Multivariate analysis; Cluster analysis; Principal component; Discriminant analysis; Partial least squa
. Introduction
Safe disposal of domestic and industrial wastewater isn essential requirement under the Environmental Protec-
ion Act, which establishes maximum permissible levels ofarious pollutants for discharge onto land and into the sur-ace waters[1]. This emphasizes for proper treatment ofewage/wastewater prior to its final disposal. For selection ofppropriate treatment process and design parameters to main-
ain stable conditions for achieving optimum performance ofhe sewage treatment plants (STPs) round the year, a detailed
∗ Corresponding author. Tel.: +91 522 2508916; fax: +91 522 2228227.E-mail address:[email protected] (K.P. Singh).
information about the sources, composition and levels oflutants in wastewater is needed.
Lucknow, the State capital of Uttar Pradesh (India),city of over three and half million residents. The city sprover an area of about 400 km2 is situated on the banksGomti river, a major tributary of the Ganga river. Out oftotal about 550 million liter per day (mld) of the domestic aindustrial sewage generated by the town, only a small fra(about 40 mld) is currently treated by a recently establissewage treatment plant (STP) and major fraction of the reuntreated sewage (510 mld) is discharged to the Gomtithrough some 26 wastewater drains within a stretch of a12 km. Among these, 14 drains collect sewage from thecis-side, while, another 12 from thetrans-side of the river. Th
003-2670/$ – see front matter © 2004 Elsevier B.V. All rights reserved.oi:10.1016/j.aca.2004.10.043

16 K.P. Singh et al. / Analytica Chimica Acta 532 (2005) 15–25
cis-side of the river covers the old, densely populated area ofthe city with poor sewerage system, whereas, thetrans-sideis well planned, newly inhabited area with proper seweragenetwork. The Gomti river, which receives untreated sewagefrom the city also serves as a major source of the domestic wa-ter supply meeting about half of the total water demand. Twopumping stations drawing water from the river are locatedjust upstream of the city. To ensure regular abstraction, thewater level in the river is maintained by intercepting the riverflow through a barrage constructed within the city at about10 km downstream of the pumping stations. Most of thesedrains empty into the river within the stretch between pump-ing stations and barrage. In this stretch, the river is highlypolluted. In addition to high organic pollution load, the riveris contaminated with several toxic chemical pollutants suchas heavy metals, pesticides and polycyclic aromatic hydro-carbons[2]. River contamination with toxic chemicals maypose health risk to the local population. The State Authoritieshave been planning for setting up STPs in Lucknow. Selectionof appropriate type of STP requires complete knowledge ofsewage characteristics, their variability, and nature and typeof hazardous chemicals entering the sewer system. Further, tooptimize the STP performance, a detailed knowledge aboutsewage composition and the sources of the pollutants mustbe obtained[3].
thel omd ea-s andd ewagec de-t Theb typea esenti rfor-m inor-g con-s an-n inet mayi Ps, iti nti-a rainsa STP.S veralo dataa inanta par-t f thed use-f si-t theird f ap-p be effi ntal,c
2. Methods
2.1. Study area and sampling program
The sampling network and strategy were designed to covera wide range of determinants at key sites, which reason-ably represent the sewage characteristics of the town. In thisstudy, the representative sampling sites were chosen in orderto cover diverse residential area. Although there is no clear-cut demarcation of domestic and industrial wastewater drainsin the town, the gathered background information providessufficient details on these. The catchments boundaries foreach selected site confirmed from the sewer maps suggestedthat the majority of them had drainage areas contributingmainly domestic wastewater. However, those representingmixed domestic and industrial inputs were identified prior tostudy.
Twenty-four sampling sites (D-1 to D-24) were selectedon the sewage drains before their respective confluence pointswith the river (Fig. 1). Brief description of the sewage drainsis given in Table 1. In addition, three sampling sites werealso selected on the Gomti river, one just before the firstdrain pours into (Gaughat, R-1), the second in the middleof town (mid-Lucknow, R-2) and the third just after the lastdrain joins the river (Pipraghat, R-3). Twenty-four hourly-i nos.)w -1 toR uarya dur-i 99).T d to-t of 5y
2
ram-e aturew r. Allo ingt fort lin-i Ca-H otals atiles icalo -tp( lc er( andn pH,a l.T stan-d d and
In this study, the main objective was to characterizeevels of pollutants in wastewater, originating mainly fromestic and industrial activities in Lucknow and their sonal variations as to help in selection of process typeesign of the proposed STPs to handle the sewage. Somposition and its variability round the year largelyermine the efficiency of biological process based STP.iological process based STPs are very sensitive to thend composition of sewage, e.g., pH and toxicants pr
n sewage may adversely affect the efficiency and peance of treatment process. The wastewater containinganic pollutants needs removal or detoxification of suchtituents prior to its conventional treatment. Moreover, theual variation in pollution load is a key variable to determ
he design parameters of the STPs, as the overloadingmpair the process performance. Therefore, to set up STs essential to identify the variables/factors which differete between the composition of the sewage of different dnd treating the sewage of similar composition at sameince, the data obtained had multivariate nature and sef the variables were correlated, multivariate statisticalnalysis methods such as cluster analysis (CA), discrimnalysis (DA), principal component analysis (PCA) and
ial least squares (PLS) were used for the interpretation oata. The results of these chemometric techniques will be
ul in identifying the drains with similar wastewater compoion, seasonal variations and discriminating variables foriversion to proposed STPs for treatment and selection oropriate process type. These techniques have proven tocient methods for analyzing large data sets, environmehemical, biological and ecotoxicological case studies[4–7].
-
ntegrated samples of river (3 nos.) and wastewater (24ere collected from the selected sites (D-1 to D-24 and R-3) in different seasons: twice in winter (January/Febrnd November), summer (May) and monsoon (August)
ng a period of 5 years (February 1994 to January 19hus, 27 samples were collected four times in a year an
al number of samples was 540 during the study periodears.
.2. Measured parameters and analytical methods
The measured variables included the characteristic paters of sewage and selected priority pollutants. Temperas measured on the site using mercury thermometether parameters were determined in laboratory follow
he standard protocols[8]. The samples were analysedhe following 31 parameters, which include, pH, total alkaty (T-Alk), total hardness (T-Hard), calcium hardness (ard), total solids (TS), total dissolved solids (TDS), tuspended solids (TSS), total fixed solids (TFS), total vololids (TVS), biochemical oxygen demand (BOD), chemxygen demand (COD), nitrate (NO3–N), total kjeldahl ni
rogen (TKN), chloride (Cl−), fluoride (F−), sulfate (SO42−),hosphate (PO43−), sodium (Na+), potassium (K+), calciumCa2+), magnesium (Mg2+), total coliforms (T-Coli), fecaoliforms (F-Coli), cadmium (Cd), chromium (Cr), coppCu), iron (Fe), manganese (Mn), lead (Pb), zinc (Zn)ickel (Ni). All the physico-chemical parameters, exceptre reported in mg l−1 and the coliforms as MPN/100 mhe analytical data quality was ensured through carefulardization, procedural blank measurements, and spike

K.P. Singh et al. / Analytica Chimica Acta 532 (2005) 15–25 17
Fig. 1. Map showing the network of drains and sampling sites under the study region.
duplicate samples. The laboratory also participates in regularnational program on analytical quality control (AQC).
2.3. Multivariate modeling
Multivariate analysis of the sewage data set was performedthrough CA, DA, PCA and PLS techniques[7,9–11]. CA,PCA and PLS were performed on experimental data stan-dardized throughz-scale transformation in order to avoidmisclassification due to wide differences in data dimen-sionality [9,12]. Thez-scale transformation renders the datanormalized with mean and variance of zero and one, re-spectively. Standardization tends to increase the influenceof variables whose variance is small and reduce the influ-ence of variables whose variance is large. Furthermore, thestandardization procedure eliminates the influence of dif-ferent units of measurement and renders the data dimen-sionless. All the statistical and mathematical calculationswere made using Excel 97, SPSS 10.1 and Unscrambler 8.0software.
2.4. Cluster analysis
Cluster analysis is an unsupervised pattern recognitiontechnique that uncovers intrinsic structure or underlying be-haviour of a data set without making a priori assumptionabout the data, in order to classify the objects of the systeminto categories or clusters based on their nearness or similarity[13]. Hierarchical clustering is the most common approach inwhich clusters are formed sequentially, by starting with themost similar pair of objects and forming higher clusters stepby step. The Euclidean distance usually gives the similar-ity between two samples and a ‘distance’ can be representedby the ‘difference’ between analytical values from both thesamples[14]. Hierarchical agglomerative CA was performedon the normalized data set by means of the Ward’s method,using Euclidean distances as a measure of similarity. Thismethod uses the analysis of variance approach to evaluatethe distances between clusters, attempting to minimize thesum of squares of any two clusters that can be formed at eachstep. CA was applied to the data set with a view to groupthe similar sampling sites (spatial variability) spread over the

18 K.P. Singh et al. / Analytica Chimica Acta 532 (2005) 15–25
Table 1A brief description of the sewage drains of Lucknow city
S. No. Drain Drain code Region drained Discharge (mld) Population
1 Gaughat U/s D-1 cis-Side 10.1 444002 Sarkata D-2 cis-Side 40.0 2646003 U/s Pakka Bridge D-3 cis-Side – –4 Pata D-4 cis-Side 26.73 1054005 D/s Pakka Bridge D-5 cis-Side – –6 Mohan Meakins D-6 trans-Side 5.74 362007 U/s NER D-7 cis-Side 1.50 102008 D/s NER D-8 cis-Side 1.46 92009 Daliganj-1 D-9 trans-Side 7.37 63500
10 Wazirganj D-10 cis-Side 14.0 38140011 Daliganj-2 D-11 trans-Side 1.47 2190012 Arts College D-12 trans-Side 1.73 1520013 Ghasiarimandi D-13 cis-Side 13.50 12390014 China Bazar D-14 cis-Side 2.94 1850015 Hanuman Setu D-15 trans-Side 6.28 3960016 La Place D-16 cis-Side 1.60 2530017 Police Line D-17 trans-Side 1.66 4710018 New Hydrabad D-18 trans-Side 3.20 2020019 Nishat Ganj D-19 trans-Side 1.66 1040020 Mahanagar D-20 trans-Side 3.20 2020021 Joppling Road D-21 cis-Side 0.91 10070022 Kukrail D-22 trans-Side 97.75 66890023 GH Canal D-23 cis-Side 142.56 89880024 Pipraghat D-24 cis-Side – –
sewage drains. The linkage distance is reported asDlink/Dmax,which represent the quotient between the linkage distance fora particular case divided by the maximal distance, multipliedby 100 as a way to standardize the linkage distance repre-sented ony-axis [10,11]. CA was performed to group thewastewater drains in significant clusters for their similaritiesor dissimilarities in sewage characteristics during the wholestudy period with a view to generate information for their in-terception and diversion to individual STPs. Drains groupedtogether on the basis of similarity in characteristics of theirwastewater can be diverted and joined together for combinedtreatment by a common STP.
2.5. Principal component analysis
Principal component analysis is a bilinear projection tech-nique where the originalm-dimensional measurement spacedescribed by matrixX (nsamples×mvariables) is projectedinto a lower,A-dimensional space by decomposing theX-matrix into a sample score matrixT, variable loading matrixPwhose product models the systematic variation in the dataand into a residual matrixE, which in ideal case contains onlythe measurement errors[15,16]. Plot of two columns of thescore matrix,T against each other gives a two-dimensionalprojection of the original data set, whereas, plot of the rowso na
, ob-t itht s are
weighted linear combinations of the original variables. PCprovides information on the most meaningful parameters,which describe whole data set affording data reduction withminimum loss of original information[10,13,17]. It is a pow-erful technique for pattern recognition that attempts to ex-plain the variance of a large set of inter-correlated variablesand transforming into a smaller set of independent (uncorre-lated) variables (principal components). PCA performed oncorrelation matrix of individually rearranged data explainsthe structure of the underlying data set. The correlation co-efficient matrix measures how well the variance of each con-stituent can be explained by relationship with each of theothers[12].
Here, PCA was performed on normalized variables to ex-tract significant principal components (PCs) from data setsof wastewater from all the drains,cis- andtrans-drains andwastewater data sets pertaining to summer, winter and mon-soon seasons with a view to assess differences in sewagecomposition, spatial and seasonal variations in wastewatercharacteristics, which would possibly help in designing theSTPs.
2.6. Discriminant analysis
DA is used to determine the variables, which discrimi-n ince,t upsi ari-a sultsa rat-
f the variables loading matrix,P displays the correlatiomong the variables.
The PCs are the uncorrelated (orthogonal) variablesained by multiplying the original correlated variables whe eigenvector (loadings or weightings). Thus, the PC
ate between two or more naturally occurring groups. She significance of difference between two or more gros judged in terms of the means of the discriminating vbles, it operates on raw data without affecting the rend comparability with other multivariate techniques ope

K.P. Singh et al. / Analytica Chimica Acta 532 (2005) 15–25 19
ing on standardized data. DA constructs a discriminant func-tion for each group[7,10,18]as below:
f (Gi) = ki +n∑
j=1
wijpij
wherei is the number of groups (G), ki the constant inherentto each group,n the number of parameters used to classify aset of data into a given group andwj is the weight coefficient,assigned by DA to a given selected parameter (pj).
In this study, three groups for temporal (three seasons)and two groups for spatial (cis- andtrans-drains) evaluationshave been selected and the number of analytical parametersused to assign a measure from a monitoring site into a group(season or area) has been taken asn. DA was applied to rawdata by using the standard, forward stepwise and backwardstepwise modes to construct discriminant functions (DFs) toevaluate both the spatial and temporal variations in sewagecharacteristics. The site (spatial) and the season (temporal)were the grouping (dependent) variables, while all the mea-sured parameters constituted the independent variables.
2.7. Partial least squares modeling
Partial least squares modeling is multivariate iterative pro-j pen-d -e les(d ndles hed )v ip isa mod-ec e co-v sX ricesT
ad-i PLSw thel e thed ari-a esc st set[ sionm thanv n thei
), as lesa thek rm s asm ation
set, i.e., each class has a column inY. Each class variable isassigned a value 1 or 0 depending into which class an objectbelongs. Here PLS–DA was performed to clarify the differ-ences in sewage composition found during different seasons(winter, summer and monsoon) and to assess the differencesbetween the sewage generated from the old (cis) and new(trans) townships.
To guard against over-fitting, cross-validation was used forselecting the dimension of PLS models. The cross-validationcoefficient of determination (Q2), which indicates the vari-ance captured in cross-validation, was used as an indicator ofover-fitting. The values of coefficient of determination (R2),which indicates the variance captured with the model are pre-sented in the relevant figures.
3. Results and discussion
The main purpose of this study was to characterize the con-tribution of domestic and industrial pollutants to the sewage,their seasonal and spatial variation trends and to identify thedrains in terms of their dominance to generate informationfor STPs designing parameters. The biological process basedSTPs are known to be very sensitive to the composition andloading of raw sewage. Drains with differences in compo-s xics itho signp w ofs ptedd abo-r . CA,D tliersb set.
3
aged eirw binet ren-d ixs .T withc uster3 , 13,1 ) andc haves ypes.I -c botht net e ofd ighp s-t he
ection method for modeling a relationship between a deent variable (Y) and an independent variable (X). PLS modls bothX andY simultaneously to find the latent variabLVs) in X that will predict the latent variables inY. PLS1eals with only one response at a time, while PLS2 can haeveral responses (Y), simultaneously. In PLS modeling, tata is divided into two groups of variables,X (descriptorariables andY (response) variables. A causal relationshssumed to exist between them. The objective in PLSling is to modelX in such a way that the information inYan be predicted as well as possible. PLS maximizes thariance between matricesX andY. The two data matriceandY are decomposed into corresponding score matandU and loading matricesP andQ [9].In contrast to PCA, there are two different types of lo
ngs in PLS, the equivalent to the PCA loadings and theeights (W). The loading weights are orthogonal while
oadings are not. The loading weights are used becausecomposition in PLS is rotated in order to maximize covnce betweenX andY. An optimal number of latent variablan be estimated by using cross-validation or separate te19]. The PLS method, in contrast to several other regresethods, is suitable for data sets with fewer observations
ariables and a high degree of inter-correlation betweendependent variables.
Partial least squares–discriminant analysis (PLS–DApecial form of PLS modeling aims to find the variabnd directions in multivariate space, which discriminatenown classes in calibration set. In PLS–DA, an indicatoYatrix of category variables is constructed which containany columns as there are known classes in the calibr
s
ition of their wastewater with particular reference to toubstances would require their removal prior to mixing wther drains treated by common STP. Moreover, the dearameters of the STPs are carefully determined in vieeasonal variations of pollution load delivered by intercerains. This was done by interpreting the results of the latory measurements using chemometric methods, vizA, PCA and PLS. The data set was checked for the ouy residualQstatistics. There were no outliers in the data
.1. Similarities in sewage drains
Cluster analysis was performed to identify the sewrains on the basis of similarities/dissimilarities in thastewater characteristics, so as to group them to com
heir wastewater for treatment by the proposed STPs. CAered a dendrogram (Fig. 2) grouping all the 24 drains into statistically significant clusters at (Dlink/Dmax) × 100 < 100he clustering procedure generated six groups of drainsluster 1 (drains 1 and 5), cluster 2 (drains 2, 4 and 21), cl(drains 7, 16, 20 and 24), cluster 4 (drains 9, 10, 11, 124, 15, 19, 22 and 23), cluster 5 (drains 3, 8, 17 and 18luster 6 (drain 6 alone), as the drains in these groupsimilar characteristic features and background source tt is notable that the clusters 1–3 grouped onlycis-drains (exept drain 20 in cluster 3), clusters 4 and 5 containedhecis- andtrans-drains, while, cluster 6 contained only orans-drain known for mixed wastewater and dominancistillery effluents. It may be noted that the old city with hopulation density resides on thecis-side and the dome
ic water supply in this part of the town is mainly from t

20 K.P. Singh et al. / Analytica Chimica Acta 532 (2005) 15–25
Fig. 2. Dendrogram showing clustering of wastewater drains of Lucknowcity.
Gomti river. The major sewage drains from this part carrystrong sewage with high BOD load throughout the year. Thetrans-side of the town is relatively newly inhabited mostlywith planned inhabitation having adequate sewerage system.Domestic water supply in this part of the town is from thegroundwater sources.
3.2. Differences between sample types
PCA was applied to the normalized data to compare thecompositional patterns between the analyzed samples andto identify the factors that influence each one. Differencesbetween sewage samples of domestic origin, industrially af-fected sewage and river water samples were studied by PCAperformed on complete data set (5 years). PCA evolved eightPCs with eigenvalues >1 explaining about 73% of the to-tal variance in the data set. The scores and loadings ofthe first two principal components (PCs) are presented inFig. 3. Although, the first two PCs explained only 41% ofthe total variance,Fig. 3 reflected the main groupings in thedata set.
The PC1 illustrated the variation of overall pollution lev-els in the samples. The domestic waste dominated samplescontained overall higher pollution levels than those collectedfrom the river sites, which in turn, were lower than exhib-i scorep rainsfl ft nla ll in-d eas.D e ofi D-1 int m-i iffer-e rainsi y
Fig. 3. PCA (a) loadings and (b) scores for the first two principal componentsobtained for all wastewater samples.
mixed industrial effluents have relatively high pollution loadas shown by sewage characteristic variables such as solids,BOD, COD and TKN.
3.3. Differences between sewage drains
Interception of drains with identical sewage characteris-tics exhibiting lesser compositional variation round the yearto combine their wastewater for diversion to proposed STPhas been one of the objectives to optimize the treatment effi-ciencies. Spatial DA was performed with the 2 years raw dataset of wastewater comprised of 29 parameters after groupinginto two classes ofcis- and trans-drains. The site (cis andtrans) was the grouping (dependent) variable, while all themeasured parameters constituted the independent variables.The standard DA mode constructs DFs including 29 param-eters, the coliform bacteria group coefficients are zero. Boththe standard and forward stepwise mode DFs using 29 and6 discriminant parameters, respectively, rendered the corre-sponding classification matrices (CMs) assigning 74 and 70%cases correctly. Forward stepwise DA shows that TDS, alka-linity, F, TKN, Cd and Cr are the discriminating parame-ters in space. The correct assignations (70–74%) by DA for
ted by the industrial waste contaminated samples. Thelot also suggested visible differentiation between the dowing from thecis andtransareas of the city. Majority ohe drains fromcis-side displayed relatively higher pollutioevels. This is due to the fact that the old city (cis) drainsre complex in nature due to mixed domestic and smaustrial activities in their less differentiated drainage arrains having strong and mixed sewage with dominanc
ndustrial wastewater (D-5, D-6, D-7, D-13, D-15, D-16,7, D-19, D-20 and D-21) showed clear differentiation
he score plot. Mainly solids, COD, BOD and TKN donated the wastewater samples from these drains. A dnce between the samples collected from the river and d
s clearly visible in score plot (Fig. 3). Drains influenced b

K.P. Singh et al. / Analytica Chimica Acta 532 (2005) 15–25 21
Fig. 4. PCA (a) loadings and (b) scores for the first two principal componentsobtained for the wastewater samples fromcis-drains.
two different site drains (cis and trans) further confirmedthe adequacy of DA and the grouping pattern coincides withour previous spatial CA. Both CA and DA predicted impor-tant differences in sewage quality due to impact from Luc-know city. DA shows that there are significant differencesbetween the drains carrying sewage from these two regions(cis and trans) that are expressed in terms of six discrimi-nating parameters. Hence, DA rendered a considerable datareduction.
The difference between the wastewater composition car-ried by cis- and trans-drains was further assessed throughperforming PCA separately on two databases (cis- andtrans-drains) of the sewage characteristics. PCA evolved eight PCswith eigenvalues >1 for each of the two datasets explaining81 and 78% variances of thecis- and trans-drains datasets,respectively. The scores and loadings of the first two PCsobtained for two databases are presented inFigs. 4 and 5,respectively. Although, the first two PCs forcis and transdata matrices explained 44 and 45% of the respective to-tal variances, the corresponding figures (Figs. 4 and 5) re-flected the main groupings in the data set. Among the total24-wastewater drains, 14 collect wastewater from thecis-sideand 10 from thetrans-side of the town.Figs. 4 and 5clearly
Fig. 5. PCA (a) loadings and (b) scores for the first two principal componentsobtained for the wastewater samples fromtrans-drains.
show that the wastewater samples collected both from thecis-andtrans-side drains during the summer and winter seasonsexhibited higher pollution as compared to monsoon season.The probable reason seems to be the heavy rains during mon-soon leading to several fold dilution of the wastewater. Duringthe summers and winters, the flow reduces several times andconcentrates the pollutants to their elevated levels. Further,higher level of pollution can be observed during winters ascompared to summers. Relatively higher temperature duringsummers leads to enhanced degradation kinetic rate of or-ganic pollutants as compared to the winters.
Differences in composition of sewage fromcis- andtrans-side drains were also studied through PLS–DA. The loadingsand scores plots of first two latent variables (LVs) are pre-sented inFig. 6. The loadings plots show clear cut groupingsof thecis andtransside drains, whereas spatial distributionpattern of variables pertaining to two groups of drains aredisplayed in the corresponding scores plot. Mainly metals,NO3, PO4, F and pH dominated the wastewater samples cor-responding to thecisdrains, whereas, the samples collectedfrom the trans drains were dominated by solids, alkalinity,hardness, major anions and organic pollution indicator pa-rameters. The composition of wastewater fromcis- andtrans-

22 K.P. Singh et al. / Analytica Chimica Acta 532 (2005) 15–25
Fig. 6. PLS–DA (a) scores and (b) loadings for the first two latent variablesfor all the wastewater samples fromcis- andtrans-drains.
drains as described by PLS is in accordance with expectedlines. Thetrans-side drains are more open to adjoining agri-cultural land and carry a lot of runoff from these areas inaddition to the domestic sewage. Moreover, there are severalsmall and medium scale industrial units in this region, whichadd industrial wastewater to the drains.
3.4. The influence of season
Season influences the composition of sewage and the de-sign parameters of the STP need its due consideration. Inthis study, the wastewater composition also depended on theweather conditions at the time of sampling.
Seasonal variations in sewage characteristics were evalu-ated through DA. Seasonal DA was performed on raw dataafter dividing the whole data set into three seasonal groups(winter, summer and monsoon). The standard DA mode con-structs DFs including 29 parameters. The coefficients for thecoliform bacteria group were zero. Both the standard andforward stepwise mode DFs using 29 and 18 discriminantvariables, respectively, rendered the corresponding CMs as-signing 81 and 76% cases correctly. However, in backwardstepwise mode DA gave CMs with 64% correct assignations
using only two discriminant parameters. Forward stepwiseDA showed that pH, TDS, TFS, TVS, alkalinity, Ca-hardness,BOD, COD, F, SO4, PO4, NO3–N, TKN, Ca, Cu, Mn, Ni andK are followed by a second parameter group formed by al-kalinity and calcium, but less significant as could be seenfrom the difference in percentage of correct assignations be-tween the backward and forward DA modes. Further, a muchless significant third group of remaining 11 parameters isevident from the standard mode DA assignations. Thus, thetemporal DA results suggest that alkalinity and calcium arethe most significant parameters to discriminate between thethree different seasons, which means that these two param-eters account for most of the expected temporal variationsin the wastewater characteristics. This also suggests that themost of the wastewater characteristic parameters in sewagedrains do not discriminate between the seasons and have reg-ular sources throughout the year. The trend obtained was alsosupported by the analysis of the results on the raw data set.
Influence of weather on sewage composition was alsoassessed through PCA performed on individual seasonaldatabases. All the seven PCs (eigenvalue >1) obtained foreach of the three datasets, viz. winter, summer and monsoon,explained 78, 80 and 79% of their variances, respectively.
Fig. 7. PCA (a) loadings and (b) scores for the first two principal componentsobtained for the wastewater samples of winter season.

K.P. Singh et al. / Analytica Chimica Acta 532 (2005) 15–25 23
Fig. 8. PCA (a) loadings and (b) scores for the first two principal componentsobtained for the wastewater samples of summer season.
The scores and loadings of the first two PCs obtained for thedatabases pertaining to winter, summer and monsoon sea-sons are presented inFigs. 7–9, respectively. The first twoPCs for three seasons, although, explained 41, 44 and 49%of the total variances in respective data sets, the correspond-ing figures (Figs. 7–9) reflected the main groupings in therespective data set.Fig. 7clearly shows that during the win-ter seasons, the wastewater samples collected mostly fromthecis-side drains exhibited relatively higher pollution levelas compared to those from thetrans-side drains. Further, thedifferentiating variables are mainly organic pollution indica-tor and metals. This observation is convincing as during thewinters, a relatively low temperature leads to lower degrada-tion kinetics rate of organic pollutants. During the summers(Fig. 8), major differentiating drains are mainly those withindustrial influence. The relative magnitude of differentiat-ing organic pollution indicator variables was low. This is dueto higher temperature during the summers leading to theirenhanced degradation rate resulting in their declined levels.The loadings and scores plots of first two PCs obtained forthe monsoon data set (Fig. 9) show that the drains knownfor strong sewage and those with industrial influences are themost differentiating ones despite several fold dilution due to
Fig. 9. PCA (a) loadings and (b) scores for the first two principal componentsobtained for the wastewater samples of monsoon season.
rains. Among all the three seasons, the river sites exhibitedseparate groupings (Figs. 7–9).
The season dependence of the sewage composition wasalso studied performing PLS–DA on wastewater data set.The PLS–DA loadings and scores for the first two latent vari-ables (LVs) are presented inFig. 10. The first latent variable(LV1) described the main influence, that of temperature, onsewage composition. In the score plot, three major groupsof wastewater samples collected from drains during variousseasons (winter, summer and monsoon) are clearly differenti-ated showing the influence of weather. The scores plot showsgrouping of wastewater samples collected during summersin the first quadrant. Those collected during winters weregrouped in second and third quadrants, whereas, wastewa-ter samples corresponding to the monsoon season groupedin the fourth quadrant of the plot. The spatial distribution ofvariables corresponding to the two LVs is shown inFig. 10b.The wastewater samples corresponding to winter season weredominated by TS, TFS, TDS, BOD, COD, hardness, TKN,NO3–N, Na, K, Ca, Mg, anions such as Cl, F, SO4 and met-als. On the other hand, the samples collected during the sum-mer season reflected relatively lower levels of these pollu-tants and were dominated by alkalinity, TSS, TVS and PO4.
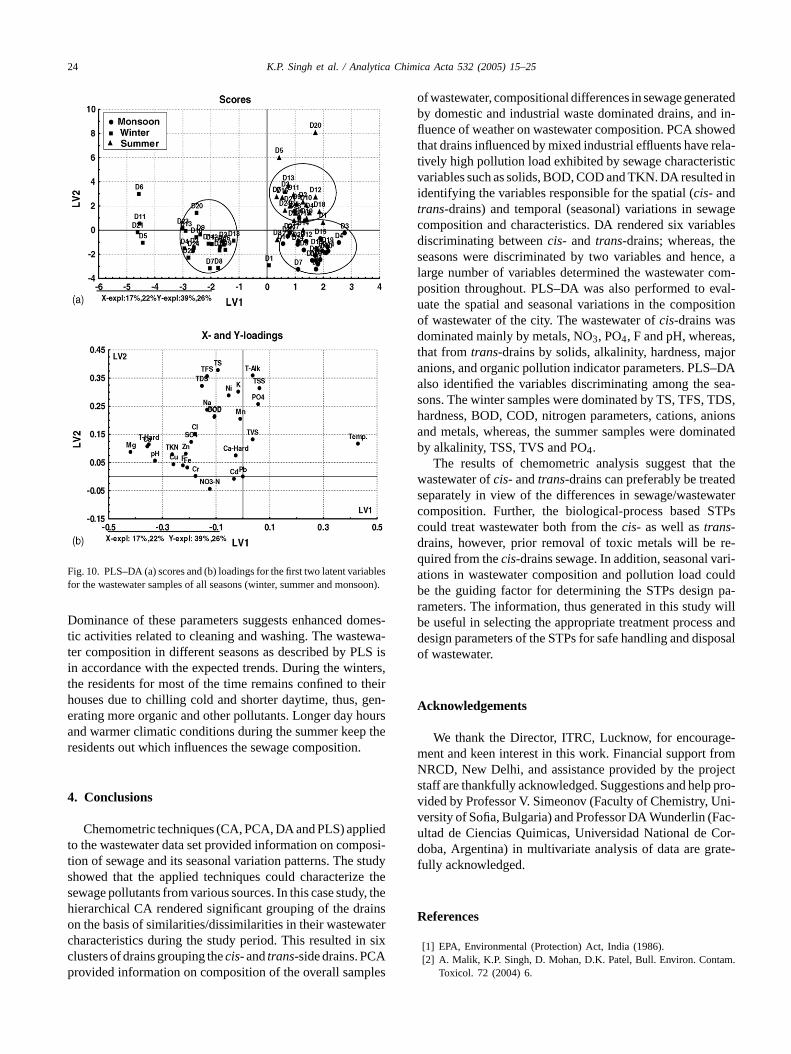
24 K.P. Singh et al. / Analytica Chimica Acta 532 (2005) 15–25
Fig. 10. PLS–DA (a) scores and (b) loadings for the first two latent variablesfor the wastewater samples of all seasons (winter, summer and monsoon).
Dominance of these parameters suggests enhanced domestic activities related to cleaning and washing. The wastewa-ter composition in different seasons as described by PLS isin accordance with the expected trends. During the winters,the residents for most of the time remains confined to theirhouses due to chilling cold and shorter daytime, thus, gen-erating more organic and other pollutants. Longer day hoursand warmer climatic conditions during the summer keep theresidents out which influences the sewage composition.
4. Conclusions
Chemometric techniques (CA, PCA, DA and PLS) appliedto the wastewater data set provided information on composi-tion of sewage and its seasonal variation patterns. The studyshowed that the applied techniques could characterize thesewage pollutants from various sources. In this case study, thehierarchical CA rendered significant grouping of the drainson the basis of similarities/dissimilarities in their wastewatercharacteristics during the study period. This resulted in sixclusters of drains grouping thecis- andtrans-side drains. PCAprovided information on composition of the overall samples
of wastewater, compositional differences in sewage generatedby domestic and industrial waste dominated drains, and in-fluence of weather on wastewater composition. PCA showedthat drains influenced by mixed industrial effluents have rela-tively high pollution load exhibited by sewage characteristicvariables such as solids, BOD, COD and TKN. DA resulted inidentifying the variables responsible for the spatial (cis- andtrans-drains) and temporal (seasonal) variations in sewagecomposition and characteristics. DA rendered six variablesdiscriminating betweencis- and trans-drains; whereas, theseasons were discriminated by two variables and hence, alarge number of variables determined the wastewater com-position throughout. PLS–DA was also performed to eval-uate the spatial and seasonal variations in the compositionof wastewater of the city. The wastewater ofcis-drains wasdominated mainly by metals, NO3, PO4, F and pH, whereas,that fromtrans-drains by solids, alkalinity, hardness, majoranions, and organic pollution indicator parameters. PLS–DAalso identified the variables discriminating among the sea-sons. The winter samples were dominated by TS, TFS, TDS,hardness, BOD, COD, nitrogen parameters, cations, anionsand metals, whereas, the summer samples were dominatedby alkalinity, TSS, TVS and PO4.
The results of chemometric analysis suggest that thewastewater ofcis- andtrans-drains can preferably be treateds aterc TPscd re-q ari-a ouldb pa-r willb s andd posalo
A
ge-m romN jects pro-v ni-v ac-u Cor-d ate-f
R
m.
-
eparately in view of the differences in sewage/wastewomposition. Further, the biological-process based Sould treat wastewater both from thecis- as well astrans-rains, however, prior removal of toxic metals will beuired from thecis-drains sewage. In addition, seasonal vtions in wastewater composition and pollution load ce the guiding factor for determining the STPs designameters. The information, thus generated in this studye useful in selecting the appropriate treatment procesesign parameters of the STPs for safe handling and disf wastewater.
cknowledgements
We thank the Director, ITRC, Lucknow, for encouraent and keen interest in this work. Financial support fRCD, New Delhi, and assistance provided by the protaff are thankfully acknowledged. Suggestions and helpided by Professor V. Simeonov (Faculty of Chemistry, Uersity of Sofia, Bulgaria) and Professor DA Wunderlin (Fltad de Ciencias Quimicas, Universidad National deoba, Argentina) in multivariate analysis of data are gr
ully acknowledged.
eferences
[1] EPA, Environmental (Protection) Act, India (1986).[2] A. Malik, K.P. Singh, D. Mohan, D.K. Patel, Bull. Environ. Conta
Toxicol. 72 (2004) 6.

K.P. Singh et al. / Analytica Chimica Acta 532 (2005) 15–25 25
[3] P.J. Wilkie, G. Hatzimihalis, P. Koutouhides, A. Connor, Water Sci.Technol. 34 (1996) 63.
[4] S.P. Mujunen, P. Minkkinen, B. Holmbom, A. Oikari, J. Chemom.10 (1996) 411.
[5] C. Palmborg, L. Bringmark, A. Bringmark, A. Nordgern, Ambio 27(1998) 53.
[6] C. Andren, B. Eklund, E. Gravefors, Z. Kukulska, M. Tarkpea, En-viron. Toxicol. Chem. 17 (1998) 228.
[7] K.P. Singh, A. Malik, D. Mohan, S. Sinha, Water Res. 38 (2004)3980.
[8] APHA, Standard Methods for the Examination of Water and Wastew-ater, 18th ed., American Public Health Association, Washington, DC,1992.
[9] M.P. Kellio, S.P. Mujunen, G. Hatzimihalis, P. Koutoufides, P.Minkkinen, P.J. Wilkie, M.A. Connor, Anal. Chim. Acta 393 (1999)181.
[10] D.A. Wunderlin, M.P. Diaz, M.V. Ame, S.F. Pesce, A.C. Hued, M.A.Bistoni, Water Res. 35 (2001) 2881.
[11] V. Simeonov, J.A. Stratis, C. Samara, G. Zachariadis, D. Voutsa,A. Anthemidis, M. Sofoniou, T.H. Kouimtzis, Water Res. 37 (2003)4119.
[12] C.W. Liu, K.H. Lin, Y.M. Kuo, Sci. Total Environ. 313 (2003) 77.[13] M. Vega, R. Pardo, E. Barrado, L. Deban, Water Res. 32 (1998)
3581.[14] M. Otto, Multivariate methods, in: R. Kellner, J.M. Mermet, M. Otto,
H.M. Widmer (Eds.), Analytical Chemistry, Wiley-VCH, Weinheim,Germany, 1998, p. 916.
[15] S. Wold, Chemom. Intell. Lab. Syst. 2 (1987) 37.[16] H. Martens, T. Naes, Multivariate Calibration, John Wiley, UK,
1989.[17] B. Helena, R. Pardo, M. Vega, E. Barrado, J.M. Fernandez, L. Fer-
nandez, Water Res. 34 (2000) 807.[18] R.A. Johnson, D.W. Wichern, Applied Multivariate Statistical Anal-
ysis, third ed., Prentice-Hall International, Englewood Cliffs, NewJersey, USA, 1992, p. 642.
[19] P. Geladi, B.R. Kowalski, Anal. Chim. Acta 185 (1986) 1.