![Palynological survey in honeys of Bahia (Brazil) [Original title: Prospecção palinológica em méis da Bahia]](https://static.fdokumen.com/doc/165x107/6341f6b0e8d6d6284d07e1db/palynological-survey-in-honeys-of-bahia-brazil-original-title-prospeccao-palinologica.jpg)
63 Physicochemical and antioxidant properties of Malaysian honeys by Apis cerana, Apis dorsata and...
12
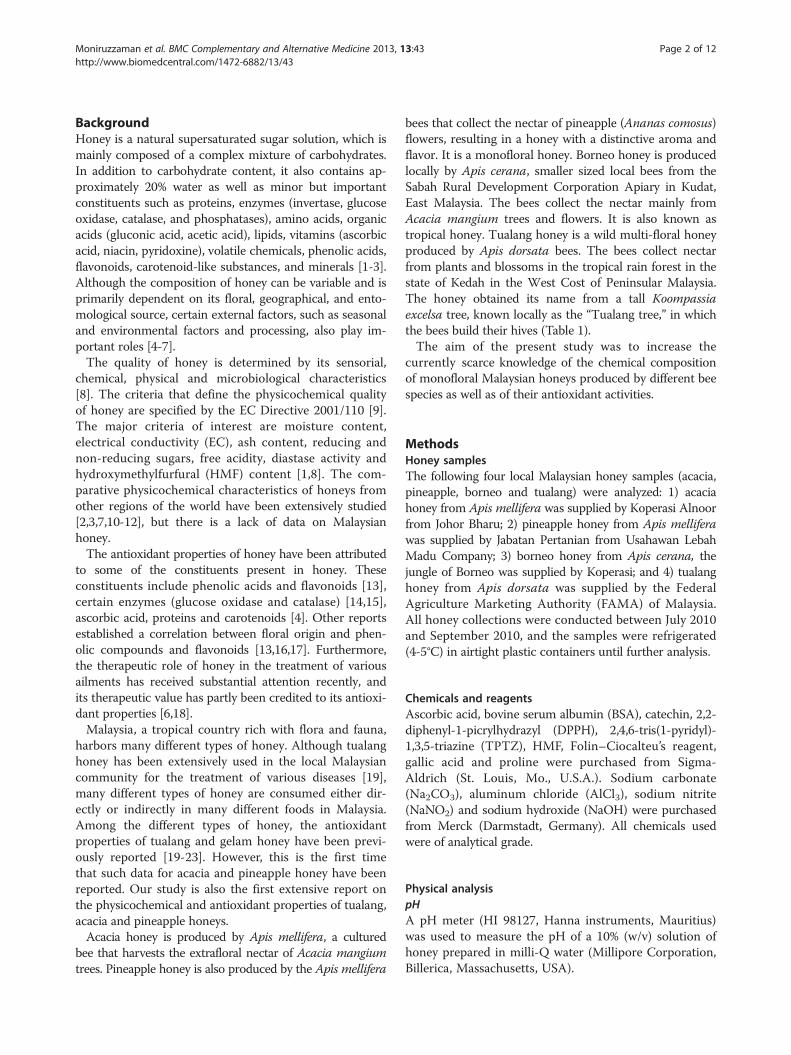
RESEARCH ARTICLE Open Access Physicochemical and antioxidant properties of Malaysian honeys produced by Apis cerana, Apis dorsata and Apis mellifera Mohammed Moniruzzaman 1 , Md Ibrahim Khalil 1 , Siti Amrah Sulaiman 1 and Siew Hua Gan 2* Abstract Background: The aim of the present study was to evaluate the physicochemical and antioxidant properties of Malaysian monofloral honey samples—acacia, pineapple and borneo honey—and compare them with tualang honey. Acacia and pineapple honey are produced by Apis mellifera bees while borneo and tualang honey are produced by Apis cerana and Apis dorsata bees, respectively. Methods: The physical parameters of honey, such as pH, moisture content, electrical conductivity (EC), total dissolved solids (TDS), color intensity, total sugar and apparent sucrose content, were measured. Hydroxymethylfurfural (HMF) was measured using high performance liquid chromatography, and a number of biochemical and antioxidant tests were performed to determine the antioxidant properties of the honey samples. Results: Acacia honey was the most acidic (pH 3.53), whereas pineapple honey had the lowest moisture content (14.86%), indicating that both types of honey can resist microbial spoilage more effectively when compared to tualang honey (pH 3.80 and 17.53% moisture content). Acacia honey contained the highest EC (0.76 mS/cm), whereas borneo honey had the highest (377 ppm) TDS. The mean HMF content in Malaysian honey was 35.98 mg/kg. Tualang honey, which is amber color, had the highest color intensity (544.33 mAU). Acacia honey is the sweetest, and contained the highest concentration of total sugar, reducing sugar and apparent sucrose. Tualang honey had the highest concentration of phenolic compounds (352.73 ± 0.81 mg galic acid/kg), flavonoids (65.65 ± 0.74 mg catechin/kg), DPPH (59.89%), FRAP values (576.91 ± 0.64 μM Fe (II)/100 g) and protein content (4.83 ± 0.02 g/kg) as well as the lowest AEAC values (244.10 ± 5.24 mg/kg), indicating its strong antioxidant properties. Proline, an important amino acid that is present in honey was also measured in the present study and it was found at the highest concentration in pineapple honey. Several strong correlations were found among the biochemical and antioxidant parameters of all the Malaysian honeys. Conclusion: Although Malaysian honeys are of good quality, tualang honey contains the strongest antioxidant properties by far. Keywords: Acacia honey, Pineapple honey, Tualang honey, Antioxidants, Apis cerana, Apis dorsata, Apis mellifera * Correspondence: [email protected] 2 Human Genome Centre, School of Medical Sciences, Universiti Sains Malaysia, Kubang Kerian, Kelantan 16150, Malaysia Full list of author information is available at the end of the article © 2013 Moniruzzaman et al.; licensee BioMed Central Ltd. This is an Open Access article distributed under the terms of the Creative Commons Attribution License (http://creativecommons.org/licenses/by/2.0), which permits unrestricted use, distribution, and reproduction in any medium, provided the original work is properly cited. Moniruzzaman et al. BMC Complementary and Alternative Medicine 2013, 13:43 http://www.biomedcentral.com/1472-6882/13/43
-
Upload
umonash-my -
Category
Documents
-
view
1 -
download
0
Transcript of 63 Physicochemical and antioxidant properties of Malaysian honeys by Apis cerana, Apis dorsata and...

Moniruzzaman et al. BMC Complementary and Alternative Medicine 2013, 13:43http://www.biomedcentral.com/1472-6882/13/43
RESEARCH ARTICLE Open Access
Physicochemical and antioxidant properties ofMalaysian honeys produced by Apis cerana, Apisdorsata and Apis melliferaMohammed Moniruzzaman1, Md Ibrahim Khalil1, Siti Amrah Sulaiman1 and Siew Hua Gan2*
Abstract
Background: The aim of the present study was to evaluate the physicochemical and antioxidant properties ofMalaysian monofloral honey samples—acacia, pineapple and borneo honey—and compare them with tualanghoney. Acacia and pineapple honey are produced by Apis mellifera bees while borneo and tualang honey areproduced by Apis cerana and Apis dorsata bees, respectively.
Methods: The physical parameters of honey, such as pH, moisture content, electrical conductivity (EC), totaldissolved solids (TDS), color intensity, total sugar and apparent sucrose content, were measured.Hydroxymethylfurfural (HMF) was measured using high performance liquid chromatography, and a number ofbiochemical and antioxidant tests were performed to determine the antioxidant properties of the honey samples.
Results: Acacia honey was the most acidic (pH 3.53), whereas pineapple honey had the lowest moisture content(14.86%), indicating that both types of honey can resist microbial spoilage more effectively when compared totualang honey (pH 3.80 and 17.53% moisture content). Acacia honey contained the highest EC (0.76 mS/cm),whereas borneo honey had the highest (377 ppm) TDS. The mean HMF content in Malaysian honey was 35.98 mg/kg.Tualang honey, which is amber color, had the highest color intensity (544.33 mAU). Acacia honey is the sweetest, andcontained the highest concentration of total sugar, reducing sugar and apparent sucrose. Tualang honey had thehighest concentration of phenolic compounds (352.73 ± 0.81 mg galic acid/kg), flavonoids (65.65 ± 0.74 mgcatechin/kg), DPPH (59.89%), FRAP values (576.91 ± 0.64 μM Fe (II)/100 g) and protein content (4.83 ± 0.02 g/kg) aswell as the lowest AEAC values (244.10 ± 5.24 mg/kg), indicating its strong antioxidant properties. Proline, animportant amino acid that is present in honey was also measured in the present study and it was found at thehighest concentration in pineapple honey. Several strong correlations were found among the biochemical andantioxidant parameters of all the Malaysian honeys.
Conclusion: Although Malaysian honeys are of good quality, tualang honey contains the strongest antioxidantproperties by far.
Keywords: Acacia honey, Pineapple honey, Tualang honey, Antioxidants, Apis cerana, Apis dorsata, Apis mellifera
* Correspondence: [email protected] Genome Centre, School of Medical Sciences, Universiti SainsMalaysia, Kubang Kerian, Kelantan 16150, MalaysiaFull list of author information is available at the end of the article
© 2013 Moniruzzaman et al.; licensee BioMed Central Ltd. This is an Open Access article distributed under the terms of theCreative Commons Attribution License (http://creativecommons.org/licenses/by/2.0), which permits unrestricted use,distribution, and reproduction in any medium, provided the original work is properly cited.
Moniruzzaman et al. BMC Complementary and Alternative Medicine 2013, 13:43 Page 2 of 12http://www.biomedcentral.com/1472-6882/13/43
BackgroundHoney is a natural supersaturated sugar solution, which ismainly composed of a complex mixture of carbohydrates.In addition to carbohydrate content, it also contains ap-proximately 20% water as well as minor but importantconstituents such as proteins, enzymes (invertase, glucoseoxidase, catalase, and phosphatases), amino acids, organicacids (gluconic acid, acetic acid), lipids, vitamins (ascorbicacid, niacin, pyridoxine), volatile chemicals, phenolic acids,flavonoids, carotenoid-like substances, and minerals [1-3].Although the composition of honey can be variable and isprimarily dependent on its floral, geographical, and ento-mological source, certain external factors, such as seasonaland environmental factors and processing, also play im-portant roles [4-7].The quality of honey is determined by its sensorial,
chemical, physical and microbiological characteristics[8]. The criteria that define the physicochemical qualityof honey are specified by the EC Directive 2001/110 [9].The major criteria of interest are moisture content,electrical conductivity (EC), ash content, reducing andnon-reducing sugars, free acidity, diastase activity andhydroxymethylfurfural (HMF) content [1,8]. The com-parative physicochemical characteristics of honeys fromother regions of the world have been extensively studied[2,3,7,10-12], but there is a lack of data on Malaysianhoney.The antioxidant properties of honey have been attributed
to some of the constituents present in honey. Theseconstituents include phenolic acids and flavonoids [13],certain enzymes (glucose oxidase and catalase) [14,15],ascorbic acid, proteins and carotenoids [4]. Other reportsestablished a correlation between floral origin and phen-olic compounds and flavonoids [13,16,17]. Furthermore,the therapeutic role of honey in the treatment of variousailments has received substantial attention recently, andits therapeutic value has partly been credited to its antioxi-dant properties [6,18].Malaysia, a tropical country rich with flora and fauna,
harbors many different types of honey. Although tualanghoney has been extensively used in the local Malaysiancommunity for the treatment of various diseases [19],many different types of honey are consumed either dir-ectly or indirectly in many different foods in Malaysia.Among the different types of honey, the antioxidantproperties of tualang and gelam honey have been previ-ously reported [19-23]. However, this is the first timethat such data for acacia and pineapple honey have beenreported. Our study is also the first extensive report onthe physicochemical and antioxidant properties of tualang,acacia and pineapple honeys.Acacia honey is produced by Apis mellifera, a cultured
bee that harvests the extrafloral nectar of Acacia mangiumtrees. Pineapple honey is also produced by the Apis mellifera
bees that collect the nectar of pineapple (Ananas comosus)flowers, resulting in a honey with a distinctive aroma andflavor. It is a monofloral honey. Borneo honey is producedlocally by Apis cerana, smaller sized local bees from theSabah Rural Development Corporation Apiary in Kudat,East Malaysia. The bees collect the nectar mainly fromAcacia mangium trees and flowers. It is also known astropical honey. Tualang honey is a wild multi-floral honeyproduced by Apis dorsata bees. The bees collect nectarfrom plants and blossoms in the tropical rain forest in thestate of Kedah in the West Cost of Peninsular Malaysia.The honey obtained its name from a tall Koompassiaexcelsa tree, known locally as the “Tualang tree,” in whichthe bees build their hives (Table 1).The aim of the present study was to increase the
currently scarce knowledge of the chemical compositionof monofloral Malaysian honeys produced by different beespecies as well as of their antioxidant activities.
MethodsHoney samplesThe following four local Malaysian honey samples (acacia,pineapple, borneo and tualang) were analyzed: 1) acaciahoney from Apis mellifera was supplied by Koperasi Alnoorfrom Johor Bharu; 2) pineapple honey from Apis melliferawas supplied by Jabatan Pertanian from Usahawan LebahMadu Company; 3) borneo honey from Apis cerana, thejungle of Borneo was supplied by Koperasi; and 4) tualanghoney from Apis dorsata was supplied by the FederalAgriculture Marketing Authority (FAMA) of Malaysia.All honey collections were conducted between July 2010and September 2010, and the samples were refrigerated(4-5°C) in airtight plastic containers until further analysis.
Chemicals and reagentsAscorbic acid, bovine serum albumin (BSA), catechin, 2,2-diphenyl-1-picrylhydrazyl (DPPH), 2,4,6-tris(1-pyridyl)-1,3,5-triazine (TPTZ), HMF, Folin–Ciocalteu’s reagent,gallic acid and proline were purchased from Sigma-Aldrich (St. Louis, Mo., U.S.A.). Sodium carbonate(Na2CO3), aluminum chloride (AlCl3), sodium nitrite(NaNO2) and sodium hydroxide (NaOH) were purchasedfrom Merck (Darmstadt, Germany). All chemicals usedwere of analytical grade.
Physical analysispHA pH meter (HI 98127, Hanna instruments, Mauritius)was used to measure the pH of a 10% (w/v) solution ofhoney prepared in milli-Q water (Millipore Corporation,Billerica, Massachusetts, USA).

Table 1 Malaysian honey, floral type and sources
Name Floral type (bee species) Local (scientific) tree name
Acacia honey Monofloral (Apis mellifera) Forest Mangrove or Mangium tree (Acacia mangium)
Pineapple honey Monofloral (Apis mellifera) Pineapple (Ananas comosus)
Borneo honey Monofloral (Apis cerana) Forest mangrove or Mangium tree (Acacia mangium)
Tualang honey Multifloral (Apis dorsata) Tualang tree (Koompassia excelsa)
Moniruzzaman et al. BMC Complementary and Alternative Medicine 2013, 13:43 Page 3 of 12http://www.biomedcentral.com/1472-6882/13/43
Moisture contentThe moisture content was determined using a refracto-metric method. In general, the refractive index increaseswith an increase in the solid content of a sample. Therefractive indices of honey samples were measured atambient temperature using an Atago handheld refract-ometer (KRUSS, HRH30, Hamburg, Germany), andmeasurements were further corrected for the standardtemperature of 20°C by adding a correction factor of0.00023/°C. The moisture content was measured intriplicate, and the percentage of moisture content thatcorresponds to the corrected refractive index wascalculated using Wedmore’s table [24].
Total sugar contentHoney was suspended in milli-Q water to make a 25%(w/v) solution. The total sugar content of each honeysample was determined using a refractometric method(Atago handheld refractometer, ATAGO, N-1α, Tokyo,Japan). The percentage of sucrose content was measuredper g/mL of honey.
Electrical conductivity and total dissolved solidsElectrical conductivity and total dissolved solids weremeasured using an HI 98311 conductivity meter (HannaInstruments, Mauritius) and a 20% (w/v) solution ofhoney suspended in milli-Q water [25]. The electricalconductivity of the milli-Q water was determined to beless than 10 μS/cm. The electrical conductivity and totaldissolved solids of each sample were analyzed in tripli-cate, and the mean values were expressed in mS/cm andppm, respectively.
Honey color analysisThe color intensity of honey samples was measuredaccording to the Pfund classifier. Briefly, homogeneoushoney samples devoid of air bubbles were transferredinto a cuvette with a 10 mm light path until the cuvettewas approximately half full. The cuvette was insertedinto a color photometer (HI 96785, Hanna Instruments,Cluj County, Romania). Color grades were expressed inmillimeter (mm) Pfund grades when compared to ananalytical-grade glycerol standard. Measurements wereperformed in triplicate for each sample using the approvedcolor standards of the United States Department ofAgriculture (USDA) [26].
Color intensity (ABS450)The mean absorbance of honey samples was determinedusing the method of Beretta et al. [27]. Briefly, honeysamples were diluted to 50% (w/v) with warm (45 - 50°C)milli-Q water, and the resulting solution was filtered usinga 0.45 μm filter to remove large particles. The absorbancewas measured at 450 and 720 nm using a spectropho-tometer, and the difference in absorbance was expressedas mAU.
Determination of HMF by high-performance liquidchromatography (HPLC)HMF concentrations were determined using an HPLCmethod based on the method published by the Inter-national Honey Commission (IHC) [28]. Briefly, honeysamples (10 g each) were diluted to 50 mL with distilledwater, filtered using a 0.45 μm nylon membrane filterand injected (20 μl) into an HPLC system (Waters 2695,Milford, MA, USA) equipped with a Photodiode ArrayDetector (PDA) (Waters 2996). The HPLC column usedwas a Merck Purospher Star RP-18e (150 × 4.6 mm,5 μm) fitted with a guard cartridge packed with a similarstationary phase (Merck, Germany).The HPLC method included an isocratic mobile phase
of 90% water and 10% methanol with a flow rate of1.0 mL/min. All solvents used were of HPLC grade.The detection wavelength was 200–450 nm, with specificmonitoring at 285 nm. The HMF concentrations in thesamples were calculated by comparing the correspondingpeak areas of the sample and HMF standard solutions(Sigma-Aldrich, USA) after correcting for the dilution ofhoney samples. A linear relationship (r2 = 0.9997) wasdetermined between the concentration and the area ofHMF peaks (results are expressed in mg/kg).
Analysis of antioxidant propertiesDetermination of total phenolic compoundsThe concentration of phenolic compounds in honeysamples was estimated using a modified spectrophoto-metric Folin-Ciocalteu method [29]. Briefly, 1 mL ofhoney extract was mixed with 1 mL of Folin andCiocalteu’s phenol reagent. After 3 min, 1 mL of 10%Na2CO3 solution was added to the mixture and adjustedto 10 mL with distilled water. The reaction was kept inthe dark for 90 min, after which the absorbance wasread at 725 nm using a T 60 UV/VIS spectrophotometer

Moniruzzaman et al. BMC Complementary and Alternative Medicine 2013, 13:43 Page 4 of 12http://www.biomedcentral.com/1472-6882/13/43
(PG Instruments Ltd, UK). Gallic acid was used to cal-culate a standard curve (20, 40, 60, 80 and 100 μg/mL;r2 = 0.9970). The concentration of phenolic compoundswas measured in triplicate. The results were reported asthe mean ± standard deviation and expressed as mg ofgallic acid equivalents (GAEs) per kg of honey.
Determination of total flavonoid contentThe total flavonoid content in each honey sample wasmeasured using the colorimetric assay developed byZhishen et al. [30]. Honey extract (1 mL) was mixedwith 4 mL of distilled water. At the baseline, 0.3 mLof NaNO2 (5%, w/v) was added. After five min, 0.3 mL ofAlCl3 (10% w/v) was added, followed by the addition of2 mL of NaOH (1 M) 6 min later. The volume was thenincreased to 10 mL by the addition of 2.4 mL distilledwater. The mixture was vigorously shaken to ensureadequate mixing, and the absorbance was read at510 nm. A calibration curve was created using a standardsolution of catechin (20, 40, 60, 80 and 100 μg/mL; r2 =0.9880). The results were expressed as mg catechinequivalents (CEQ) per kg of honey.
DPPH free radical-scavenging activityThe antioxidant properties of each honey sample werealso studied by evaluating the free radical-scavengingactivity of the DPPH radical, which was based on themethod proposed by Ferreira et al. [31]. Briefly, honeyextract (0.5 mL) was mixed with 2.7 mL of methanolicsolution containing DPPH radicals (0.024 mg/mL). Themixture was vigorously shaken and left to stand for15 min in the dark (until their absorbance stabilized).The reduction of the DPPH radical was determinedby measuring the absorbance of the mixture at 517 nm(Hatano et al., 1988).Butylated hydroxytoluene (BHT) was used as a reference.
The radical-scavenging activity (RSA) was calculated asthe percentage of DPPH discoloration using the followingequation: % RSA = ([ADPPH– AS]/ADPPH) × 100, whereAS is the absorbance of the solution when the sampleextract has been added at a particular level and ADPPH isthe absorbance of the DPPH solution.
Ferric reducing-antioxidant power assay (FRAP assay)The FRAP assay was performed according to a modifiedmethod described by Benzie and Strain [32]. Briefly,200 μL of properly diluted honey (0.1 g/mL) was mixedwith 1.5 mL of FRAP reagent. Then, the reaction mix-ture was incubated at 37°C for 4 min, and its absorb-ance was read at 593 nm against a blank that wasprepared with distilled water. Fresh FRAP reagent wasprepared by mixing 10 volumes of 300 mM/L acetatebuffer (pH 3.6) with 1 volume of 10 mM TPTZ solu-tion in 40 mM/L HCl containing 1 volume of 20 mM
ferric chloride (FeCl3.6H2O). The resulting mixture wasthen pre-warmed at 37°C. A calibration curve wasprepared using an aqueous solution of ferrous sulfate(FeSO4.7H2O) at 100, 200, 400, 600 and 1000 μM/L.FRAP values were expressed as micromoles of ferrousequivalent (μM Fe [II]) per kg of honey.
Determination of ascorbic acid contentThe ascorbic acid content was measured using the methoddescribed by Ferreira et al. [31]. Briefly, the sample (100mg) was extracted with 10 mL of 1% metaphosphoric acidat room temperature for 45 min and filtered throughWhatman No. 4 filter paper. The filtrate (1 mL) was mixedwith 9 mL of 0.005% 2,6-dichlorophenolindophenol (DCPIP),and the absorbance of the mixture was measured within30 min at 515 nm against a blank. The ascorbic acidcontent was calculated based on a calibration curve ofauthentic L-ascorbic acid (50, 100, 200 and 400 μg/mL;Y = 3.2453X - 0.0703; r2 = 0.9440). The results wereexpressed as mg of ascorbic acid per kg of honey.
Antioxidant contentThe antioxidant content was determined by measuringAEAC (Ascorbic acid Equivalent Antioxidant Capacity)values using the method of Meda et al. [13]. Briefly,honey samples were dissolved in methanol to a finalconcentration of 0.03 g/mL. A 0.75 mL aliquot of themethanolic honey solution was then mixed with 1.50 mLof a 0.02 mg/mL DPPH solution prepared in methanol.The mixture was incubated at room temperature for15 min, and the absorbance was measured at 517 nmusing a spectrophotometer. The blank was composedof 0.75 mL of a methanolic honey solution mixed with1.5 mL of methanol. Ascorbic acid standard solutions(1, 2, 4, 6 and 8 μg/mL) prepared in milli-Q waterwere used to form a calibration curve. Measurementswere performed in triplicate, and the mean value wasexpressed as mg of ascorbic acid equivalent antioxi-dant content per 100 g of honey.
Proline contentThe proline content in honey samples was measuredusing a method established by the IHC [33]. Briefly, BSAsolutions were prepared by diluting a stock solution of1 mg/mL as appropriate and final concentrations rangedfrom 0.05 to 1.00 mg/mL. From the dilutions, 0.2 mL ofthe protein solution was transferred to different test tubes,and 2 mL of alkaline copper sulfate reagent (analyticalreagent) was added, followed by thorough mixing. Theresulting solution was incubated at room temperaturefor 10 min. Then, 0.2 mL of Folin Ciocalteau solutionwas added to each tube and incubated for 30 min. Theabsorbance was measured at 660 nm.

Moniruzzaman et al. BMC Complementary and Alternative Medicine 2013, 13:43 Page 5 of 12http://www.biomedcentral.com/1472-6882/13/43
Biochemical analysesProtein contentThe protein content of the honey was measuredaccording to Lowry’s method [33]. Briefly, BSA solutionswere prepared by diluting a stock solution of 1 mg/mL asappropriate and final concentrations ranged from 0.05 to1.00 mg/mL. dilutions, 0.2 mL of protein solution wasplaced in different test tubes, and 2 mL of alkaline coppersulfate reagent (analytical reagent) was added. After theresulting solution was mixed properly, it was incubated atroom temperature for 10 min. Then, 0.2 mL of reagentFolin Ciocalteau solution was added to each tube andincubated for 30 min. The colorimeter was calibrated witha blank, and the absorbance was measured at 660 nm.
Reducing sugar assayThe total reducing sugar content was measured using3,5-dinitrosalicylic acid (DNSA). In principle, the redu-cing sugar reduces DNSA to 3-amino-5-nitrosalicylicacid, resulting in a solution with reddish-orange color-ation that is measured spectrophotometrically at 540 nm[2]. The honey solution (0.1 g/mL) was diluted 100-foldwith milli-Q water. A 1 mL aliquot of this diluted solu-tion was mixed with equal amounts of DNSA solutionand incubated in a boiling water bath for 10 min. Themixture was allowed to cool to ambient temperature for10 min and was then mixed with 7.5 mL of milli-Qwater; then, the absorbance was measured at 540 nmusing a spectrophotometer. A glucose solution of knownconcentrations (100, 200, 400 and 600 μg/mL) was usedas a standard.
Statistical analysisAssays were performed in triplicate, and the results wereexpressed as mean values with standard deviations (SD).The significant differences, represented by letters, wereobtained by a one-way analysis of variance (ANOVA),followed by Tukey’s honestly significant difference (HSD)post hoc test (p < 0.05). Correlations were establishedusing Pearson’s correlation coefficient (r) in bivariate linear
Table 2 Physical parameters (pH, moisture content, electricalcolor intensity) of Malaysian honey samples
Sample pH Moisture content (%)mean ± SD
EC (mmea
Acacia (A. mellifera) 3.53 ± 0.06c 15.16 ± 0.10c 0.76
Pineapple (A. mellifera) 3.73 ± 0.06b 14.86 ± 0.20c 0.35 ±
Borneo (A. cerana) 4.03 ± 0.06a 16.99 ± 0.31b 0.75
Tualang (A. dorsata) 3.80 ± 0.0b 17.53 ± 0.12a 0.75
Mean ± SD 3.78 ± 0.21 16.14 ± 1.33 0.65
Means were compared by using a one-way ANOVA with post hoc multiple comparisignificant differences (p < 0.05).
correlations (p < 0.01). These correlations were calculatedusing Microsoft Office Excel 2007 and SPSS version 16.0(IBM corporation, New York, USA).
Results and discussionPhysical analysespH and moisture contentAll of the investigated Malaysian honey samples wereacidic (pH 3.53 - 4.03) (Table 2) and were within thelimit (pH 3.4 to 6.1) that indicates freshness. Among allthe honey types, acacia honey was the most acidic (pH3.53 ± 0.06). The pH values of Malaysian honey sampleswere similar to those previously reported in Indian,Algerian, Brazilian, Spanish and Turkish honeys (be-tween pH 3.49 and 4.70) [2,10,12,34]. The high acidityof honey is an indication of the fermentation of sugarspresent in the honey into organic acid, which is re-sponsible for two important characteristics of honey:flavor and stability against microbial spoilage [35].Moisture content is an important parameter of honey
quality and defines the amount of water present inhoney. In the present study, the percentage moisturecontent was between 14.86 and 17.53%, which is underthe limit of ≤20% set by the international regulations forhoney quality [9,36] (Table 2). There were significantdifferences in the moisture content between the acaciaand pineapple honey samples when compared withtualang and borneo honey (one-way ANOVA; p< 0.05).Tualang honey had the highest moisture content (17.53%),whereas pineapple honey had the lowest moisture content(14.86%), indicating that pineapple honey is the mostresistant to microbial growth because water is an essen-tial component for microbial growth.Generally, the moisture contents for Malaysian honeys
were lower than those of other honeys, such as Portuguesehoney (15.9-17.2%) [37], Anatolian honey (17.0-19.4%)[38]), Romanian honey (15.4-20.0%) [39] and Indian honey(17.2-21.6%) [2]. The moisture content present in honeysamples is important as it contributes to its ability to resistfermentation and granulation during storage [40]. Low
conductivity, total dissolved solids concentrations and
S/cm)n ± SD
TDS (ppm)mean ± SD
HMF (mg/kg)mean ± SD
ABS450 (mAU; 50 w/v)mean ± SD
± 0.005a 375.00 ± 2.5a 0.26 ± 0.2d 320.33 ± 2.8b
0.002b 176.00 ± 1.0c 68.99 ± 0.44a 312.33 ± 12.34b
± 0.006a 377.00 ± 2.0a 28.50 ± 1.05c 338.33 ± 17.10b
± 0.003a 371.00 ± 1.3b 46.17 ± 1.59b 544.33 ± 11.68a
± 0.20 324.75 ± 99.0 35.98 ± 0.77 378.83 ± 1110.87
sons. In each column, values with different letters (superscripts) indicate

Moniruzzaman et al. BMC Complementary and Alternative Medicine 2013, 13:43 Page 6 of 12http://www.biomedcentral.com/1472-6882/13/43
moisture content also helps to promote longer shelf lifeduring storage [41]. Overall, the low moisture contentin our honey samples indicates their good storage abilityand quality.
Electrical conductivity (EC) and total dissolved solids (TDS)EC is one of the important factors in the determin-ation of the physical characteristics of honey [42]. TheEC values of all Malaysian honey samples were 0.35-0.76 mS/cm (Table 2) and were within the allowedparameters (lower than 0.8 mS/cm) set by CodexAlimentarius [36]. Acacia honey, which showed thehighest EC value (0.76 mS/cm), contained the highestamount of minerals, as opposed to pineapple honey,which had the lowest EC value (0.35 mS/cm). Bothtualang and borneo honey showed similar EC values,indicating the presence of similar amounts of minerals.Furthermore, the EC value changes when the amountof plant pollen decreases [43]. Overall, the Malaysianhoney samples had similar EC values to those reportedfor honey samples from Uruguay [44]; Andalusia, Spain[42]; India [2]; and Morocco [41].TDS assesses the combined content of both inorganic
and organic substances present in honey, includingmolecular, ionized and micro-granular suspended forms.In our study, borneo honey exhibited the highest TDSvalue (377 ppm), whereas pineapple honey showed thelowest (176 ppm). There was a positive correlation be-tween the EC and TDS values; for example, pineapplehoney, which showed the lowest EC value, had the lowestTDS value.
Total sugar contentThe mean total sugar content of Malaysian honey sampleswas 65.53 ± 2.48% g/mL of honey (Table 3). None of thesamples exceeded the highest limit for the total sugar con-tent of honeys established by the European communitydirective [9]. Our result is similar to that reported forsome of the Algerian honeys (62-70%) [3] and honeysamples from Bangladesh (42.80 to 60.67%) [45]. The highsugar content of the investigated honey samples can beattributed to its high acidity and low moisture content,
Table 3 Reducing and non-reducing sugar content of Malaysi
Sample Total sugar content (g/100 g honey) Red
mean ± SD
Acacia (A. mellifera) 68.40 ± 0.80a
Pineapple (A. mellifera) 63.33 ± 0.92b
Borneo (A. cerana) 66.80 ± 0.80a
Tualang (A. dorsata) 63.60 ± 0.80b
Mean ± SD 65.53 ± 2.48
Means were compared using a one way ANOVA with post hoc multiple comparisonsignificant differences (p < 0.05).
which inhibits the formation of HMF from sugars, espe-cially glucose and fructose. The highest total sugar content(68.40%) was from acacia honey, indicating its high naturalsweetness, which was confirmed when the honey wasphysically tasted. Indian [2] and Estonian honey samples[46] reportedly have relatively higher total sugar contents(78.4-82.4% and 62.88- 78.32%).
Color characteristicsColor is the primary characteristic for honey classifica-tion according to the USDA-approved color standards[26]. Honey’s color naturally varies over a wide range oftones, ranging from light yellow to amber, dark amberand, in extreme cases, it may be black. Occasionally,even green or red hues may occur [3,45]. The color ofuntreated honey depends on its botanical origins. Forthis reason, color is very important in the classificationof monofloral honeys for commercial activities.In the present study, tualang honey is classified as
amber according to the USDA-approved color standards[26], and it also exhibited the highest Pfund value (113.00)(Figure 1), which was similar to the mean Pfund valuereported for Algerian honey samples (114.00) [3] but waslower than that reported for Bangladeshi honey samples[45]. However, acacia and borneo honey are light amber incolor and have lower Pfund values. The higher Pfundvalues may indicate a higher antioxidant potential and thepresence of different pigment compounds, such as phen-olic compounds, flavonoids and carotenoids.
Color intensity ABS450The color intensity of the honey is represented by theABS450, which also indicates the presence of pigmentssuch as carotenoids and flavonoids, which are known tohave antioxidant properties [36]. In the present study,ABS450 values ranged from 312 to 544 mAU (Table 2).Tualang honey, which had the highest Pfund values,also showed the highest color intensity (544.33 ± 11.68mAU). Previously reported Pfund values for tualanghoney were also high (489.5 ± 1.7 mAU) [19]. The colorintensity of the acacia, pineapple and borneo honeys wasmuch lower (312.33 - 338.33 mAU), indicating lower
an honey samples
ucing sugar (g/100 g honey) Apparent sucrose (g/100 g honey)
mean ± SD mean ± SD
63.89 ± 0.25a 4.51 ± 1.05a
61.17 ± 0.17b 2.17 ± 0.94b
63.06 ± 0.54a 3.74 ± 1.03a
61.94 ± 0.75b 1.66 ± 0.73b
62.51 ± 1.20 3.02 ± 1.33
s. In each column, values with different letters (superscripts) indicate

76.00, Light Amber
107.33, Amber
78.33, Light Amber
113.00, Amber
0 20 40 60 80 100 120
Acacia (A.mellifera)
Pineapple (A.mellifera)
Borneo (A.cerana)
Tualang (A.dorsata)
mm Pfund values
Mal
aysi
an h
oney
Figure 1 Color characteristics of Malaysian honey.
Moniruzzaman et al. BMC Complementary and Alternative Medicine 2013, 13:43 Page 7 of 12http://www.biomedcentral.com/1472-6882/13/43
antioxidant properties. To our knowledge, these are thefirst reported Pfund values for acacia, pineapple and bor-neo honeys.
Determination of HMF concentrations by HPLCHMF is an important parameter used to indicate thepurity and freshness of honey [47]. HMF is usuallypresent in trace amounts in fresh honeys, but its levelstend to increase during processing and/or due toaging. For example, in a previous study conducted byKhalil et al. [47], the HMF level was reported to bevery high in Malaysian tualang honey, ranging from128.19–1131.76 mg/kg when the honeys were storedfor more than one year. HMF levels are also influenced byseveral other factors, such as pH, temperature, duration ofthe heating process, storage conditions and floral source;therefore, HMF levels provide an indication of overheatingand poor storage conditions [48].With the exception of pineapple honey, which contained
a relatively high HMF concentration (68.99 mg/kg), theHMF concentrations of honey samples ranged from 0.26to 46.17 mg/kg (Table 2). However, all values were stillwithin the recommended range (<80 mg/kg) set by theCodex Alimentarius [36]. The higher HMF concentrationin pineapple honey may also be due to the type of sugarcontent as well as its fructose:glucose ratio [49]. SomeAustralian honeys, namely rainforest, homebrand andmallee honey, were reported to have HMF concentrationsof 2.2, 17.7 and 34.0 mg/kg, respectively [48,50].
Antioxidant propertiesTotal phenolics compoundsThe mean total phenolics compounds of the testedhoneys was 243.01± 74.91 mg gallic acid/kg. The totalphenolic compounds is sensitive to phenol and polyphe-nol entities and other electron-donating antioxidantssuch as ascorbic acid and vitamin E. The phenolic com-pound in Malaysian honeys varied greatly depending on
the type of honey. Tualang honey contained the highestlevel (352.73 ± 0.81 mg/kg) (Table 4). These variationsmay be due to the different floral sources of the honeyanalyzed. The levels of phenolic compounds of tualanghoney in this study was higher than that previouslyreported for tualang honey (251.7 ± 7.9 mg gallic acid/kg)[19], but lower than that reported for some BurkinaFasan honey (74.38 ± 20.54 mg gallic acid/100 g) [13]and Manuka honey (52.63 ± 1.21 mg gallic acid/100 g)[22]. This indicates that both Burkina Fasan and Manukahoneys have higher antioxidant potential when comparedto tualang and other Malaysian honey samples.
Total flavonoid contentFlavonoids are low-molecular-weight phenolic compoundsthat affect the aroma and antioxidant properties of honey.The mean flavonoid content of the Malaysian honeysamples was 37.70 ± 19.75 mg catechin/kg (Table 4). Aswith phenolic compounds, the honey samples showed sig-nificant differences in flavonoid content. Similar to thepolyphenol content, tualang honey contained the highestamount (65.65 mg/kg) of flavonoids. The flavonoid con-tent in acacia honey was lower (21.95 mg/kg) whencompared to Croatian acacia honey (43.66 mg/kg) [51]and Burkina Fasan acacia honey (61.4 mg/kg) [13]. Thiscould be due to the different floral and geographicalorigins of the honey sources.Generally, the flavonoid content of Malaysian honeys
is lower than that reported for some Algerian honeys(27 to 71 mg/kg) [3] but higher than that reported forLinen vine honey (25.2 mg/kg); Christmas vine honey(10.9 mg/kg) [4]; eucalyptus honey (20–25 mg CE/kg);sunflower and rape honey (15–20 mg CE/kg); and fir,lavender, ivy and acacia honey (5–10 mg CE/kg), aspreviously reported [13,31]. The variations in the fla-vonoid levels could be due to the different honeytypes and their sources. It has been suggested thatmeasuring phenolic compounds and flavonoids levels

Table 4 Biochemical and antioxidant properties of Malaysian honey samples
Sample Total phenolicsmean ± SD
(mg galic acid/kg)
Total flavonoidsmean ± SD
(mg catechin/kg)
FRAP valuesmean ± SD
(μM Fe (II)/100 g)
Prolinemean ± SD(mg/kg)
Proteinmean ± SD
(g/kg)
Acacia (A. mellifera) 186.70 ± 0.84d 21.95 ± 1.73d 100.90 ± 2.44c 517.55 ± 1.48b 2.04 ± 0.01d
Pineapple (A. mellifera) 226.29 ± 1.18b 37.39 ± 0.90b 87.47 ± 1.10d 628.69 ± 3.75a 2.69 ± 0.01b
Borneo (A. cerana) 206.33 ± 1.05c 25.81 ± 0.64c 256.64 ± 0.60b 176.64 ± 2.31d 2.16 ± 0.02c
Tualang (A. dorsata) 352.73 ± 0.81a 65.65 ± 0.74a 576.91 ± 0.64a 248.53 ± 1.33c 4.83 ± 0.02a
Mean±SD 243.01 ± 74.91 37.70 ± 19.75 255.48 ± 227.63 392.85 ± 215.05 2.93 ± 1.30
Means were compared by using one-way ANOVA with post hoc multiple comparisons. In each column, values with different letters (superscripts) indicatesignificant differences (p < 0.05).
Moniruzzaman et al. BMC Complementary and Alternative Medicine 2013, 13:43 Page 8 of 12http://www.biomedcentral.com/1472-6882/13/43
could be used to study honey’s floral and geographicalorigins [17].
DPPH free radical-scavenging activityDPPH is an unwavering nitrogen-centered radical thathas been extensively used to test the free radical scaven-ging ability of various samples. In evaluating the radical-scavenging potential of honeys, the DPPH assay isfrequently used because the antioxidant potential ofhoney has been shown to be directly associated withits phenolic acid and flavonoid content [27], wherehigh DPPH scavenging activity confers superior anti-oxidant activity.When the DPPH radical scavenging activities of all honey
samples were measured at 10, 20, 40 and 60 mg/mL, thehighest percentage of inhibition was observed at 60 mg/mLfor all of the samples. Tualang honey exhibited the highestpercentage inhibition (59.89%), again indicating that it hasthe highest antioxidant potential (Figure 2). The percent-age of inhibition shown by tualang honey in this study ishigher than what was previously reported for tualanghoney (41.30%) [19] and also higher than that reportedfor Indian honey samples (57.5%) and Algerian honeysamples (44.55%) [3]. In the present study, the higher
0
10
20
30
40
50
60
70
0 20 40
Per
cent
age
(%)
of r
adic
al s
cave
ngin
g ac
tivi
ty
Concentration of honey
Figure 2 Percentage of inhibition of DPPH radical scavenging activity
concentrations of phenolic compounds and flavonoidspresent may have been responsible for the higher per-centage of radical-scavenging activity shown.
Determination of total antioxidant content by FRAP assayFRAP is a simple, direct test widely used for the determin-ation of antioxidant activity in many different substances,including honey [1,18,27,32,38,52]. It gives a direct esti-mation of the antioxidants or reductants present in asample based on its ability to reduce the ferric to ferrous(Fe3+/Fe2+) couple.The mean FRAP value of Malaysian honey samples was
255.48 ± 227.63 μM Fe [II]/100 g. Again, tualang honeyexhibited the highest FRAP value (576.91 ± 0.64 μMFe (II)/100 g) (Table 4). Our reported FRAP value fortualang honey is higher than that reported for Algerianhoneys (287.45 to 403.54 μM Fe (II)/100 g) [3]; (322.1 ±9.7 μM Fe [II]/100 g) [19] but lower than that reportedby Khalil et al. [22] for tualang honey (706.91 ±7.28 μMFe [II]/100 g). The higher FRAP values of tualang honeymay be due to its stronger antioxidant propertiescompared with all the other Malaysian honey samples,indicating a greater reduction of Fe3+ to Fe2+ ionscorresponding to samples with a higher reducing power
60 80
(mg/mL)
Acacia (A.mellifera)Pineapple (A.mellifera)Borneo (A.cerana)Tualang (A.dorsata)
at different concentrations of Malaysian honey.
Moniruzzaman et al. BMC Complementary and Alternative Medicine 2013, 13:43 Page 9 of 12http://www.biomedcentral.com/1472-6882/13/43
that increased in absorbance at 700 nm. The lowest FRAPvalue (87.47 μM Fe [II]/100 g) was exhibited by pineapplehoney, indicating its low antioxidant potential.
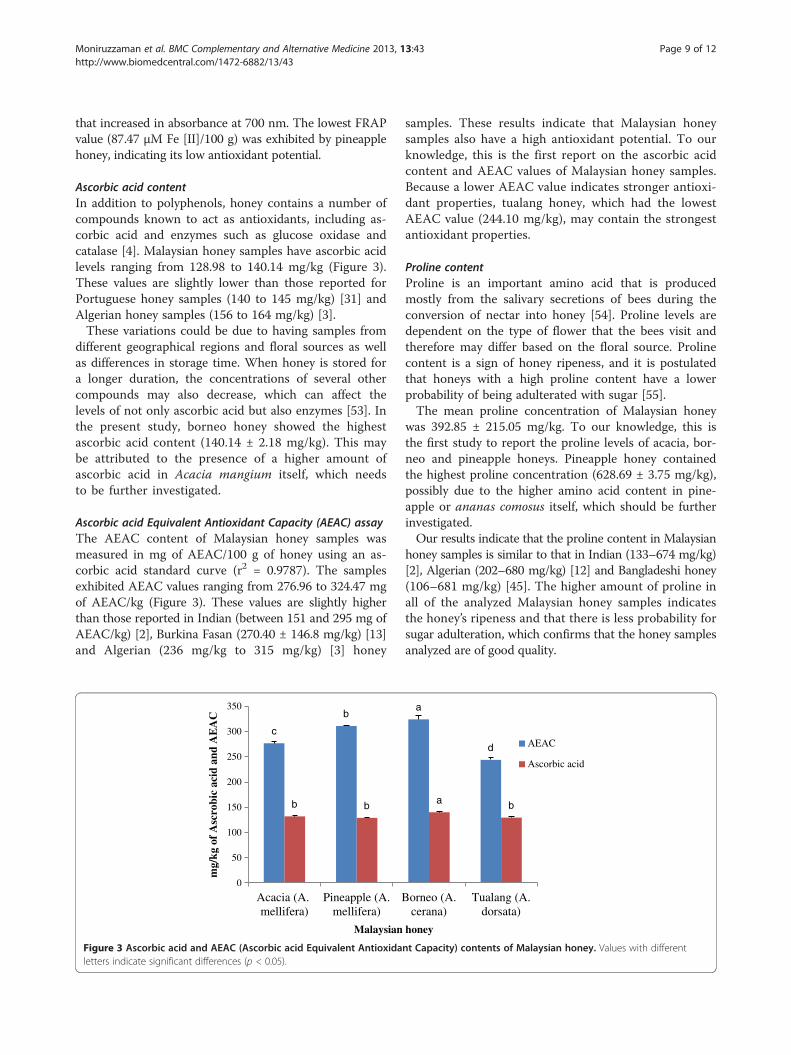
Ascorbic acid contentIn addition to polyphenols, honey contains a number ofcompounds known to act as antioxidants, including as-corbic acid and enzymes such as glucose oxidase andcatalase [4]. Malaysian honey samples have ascorbic acidlevels ranging from 128.98 to 140.14 mg/kg (Figure 3).These values are slightly lower than those reported forPortuguese honey samples (140 to 145 mg/kg) [31] andAlgerian honey samples (156 to 164 mg/kg) [3].These variations could be due to having samples from
different geographical regions and floral sources as wellas differences in storage time. When honey is stored fora longer duration, the concentrations of several othercompounds may also decrease, which can affect thelevels of not only ascorbic acid but also enzymes [53]. Inthe present study, borneo honey showed the highestascorbic acid content (140.14 ± 2.18 mg/kg). This maybe attributed to the presence of a higher amount ofascorbic acid in Acacia mangium itself, which needsto be further investigated.
Ascorbic acid Equivalent Antioxidant Capacity (AEAC) assayThe AEAC content of Malaysian honey samples wasmeasured in mg of AEAC/100 g of honey using an as-corbic acid standard curve (r2 = 0.9787). The samplesexhibited AEAC values ranging from 276.96 to 324.47 mgof AEAC/kg (Figure 3). These values are slightly higherthan those reported in Indian (between 151 and 295 mg ofAEAC/kg) [2], Burkina Fasan (270.40 ± 146.8 mg/kg) [13]and Algerian (236 mg/kg to 315 mg/kg) [3] honey
c
b
b b
0
50
100
150
200
250
300
350
Acacia (A.mellifera)
Pineapple (A.mellifera)
B
mg/
kg o
f A
scro
bic
acid
and
AE
AC
Malaysian
Figure 3 Ascorbic acid and AEAC (Ascorbic acid Equivalent Antioxidaletters indicate significant differences (p < 0.05).
samples. These results indicate that Malaysian honeysamples also have a high antioxidant potential. To ourknowledge, this is the first report on the ascorbic acidcontent and AEAC values of Malaysian honey samples.Because a lower AEAC value indicates stronger antioxi-dant properties, tualang honey, which had the lowestAEAC value (244.10 mg/kg), may contain the strongestantioxidant properties.
Proline contentProline is an important amino acid that is producedmostly from the salivary secretions of bees during theconversion of nectar into honey [54]. Proline levels aredependent on the type of flower that the bees visit andtherefore may differ based on the floral source. Prolinecontent is a sign of honey ripeness, and it is postulatedthat honeys with a high proline content have a lowerprobability of being adulterated with sugar [55].The mean proline concentration of Malaysian honey
was 392.85 ± 215.05 mg/kg. To our knowledge, this isthe first study to report the proline levels of acacia, bor-neo and pineapple honeys. Pineapple honey containedthe highest proline concentration (628.69 ± 3.75 mg/kg),possibly due to the higher amino acid content in pine-apple or ananas comosus itself, which should be furtherinvestigated.Our results indicate that the proline content in Malaysian
honey samples is similar to that in Indian (133–674 mg/kg)[2], Algerian (202–680 mg/kg) [12] and Bangladeshi honey(106–681 mg/kg) [45]. The higher amount of proline inall of the analyzed Malaysian honey samples indicatesthe honey’s ripeness and that there is less probability forsugar adulteration, which confirms that the honey samplesanalyzed are of good quality.
a
d
a b
orneo (A.cerana)
Tualang (A.dorsata)
honey
AEAC
Ascorbic acid
nt Capacity) contents of Malaysian honey. Values with different

Moniruzzaman et al. BMC Complementary and Alternative Medicine 2013, 13:43 Page 10 of 12http://www.biomedcentral.com/1472-6882/13/43
Biochemical analysesReducing sugar contentOur data indicate that reducing sugars are the mainsoluble sugars present in Malaysian honey because thetotal reducing sugar content in the samples was as highas 61.17 to 63.89% (Table 3). To our knowledge, this isthe first data reported for the total sugar, reducingsugar and sucrose contents in Malaysian honey. TheEC Directive 2001/110 mandates that the amount ofreducing sugars should be ≥60 g/100 g of honey, withthe exception of honeydew honey, which has a lowerallowable limit (≥45 g/100 g). Thus, our results meetthis standard and are similar to other published levelsof reducing sugars [2,3,37].The amount of non-reducing sugars, including the
sucrose content (%), was measured by subtracting theamount of reducing sugars present from the total sugarcontent. The sucrose content in Malaysian honey samplesranged from 1.66 to 4.51%, which is below 5.00%, themaximum prescribed limit set by the Codex standard [36].Our results show that Malaysian honey samples generallyhave higher non-reducing sugar content than Algerianhoneys (1.80 to 2.54%) [3]. As with the total sugar content,acacia honey contained the highest reducing sugar(63.89%) and sucrose content (4.51%), which contributesto its physical sweetness when compared to other typesof Malaysian honey.
Protein contentThe concentrations of proteins and amino acids inhoneys differ based on their botanical or geographicalorigin and storage time. Enzymes are the main proteinconstituents present in honey [56]. The bees also adddifferent enzymes during the honey ripening process,which can contribute to increased protein levels. Ingeneral, the protein content of honey ranges from 2 to5 g/kg [55]. The protein content in Malaysian honeysranged from 2.04 to 4.83 g/kg (Table 4). To our know-ledge, this is the first report regarding the protein con-tent of Malaysian honey samples.
Table 5 Correlation matrix showing the interrelation among pantioxidant power assay (FRAP), ascorbic acid, proline, Absor
Phenolics Flavonoids DPPH FR
Phenolics 1.000 0.989** 0.804** 0.9
Flavonoids 0.989** 1.000 0.782** 0.8
DPPH 0.804** 0.848** 1.000 0.7
FRAP 0.914** 0.848** 0.712** 1.
Ascorbic acid 0.411 0.512 0.598* 0.
Proline 0.390 0.274 0.131 0.7
ABS450 0.960** 0.915** 0.840** 0.9
Protein 0.997** 0.991** 0.834** 0.8
**Correlation is significant at the 0.01 level (2-tailed); *Correlation is significant at th
Tualang honey also contained the highest amountof protein (4.83 ± 0.02 g/kg), which was slightly higherthan that of some Algerian honeys [3]. However, in anotherstudy, relatively higher protein levels (3.7 to 9.4 g/kg) werereported in Algerian honey samples [12], whereas for honeysamples from India, the content was reported to be lower(0.48 to 2.29 g/kg) [2]. This could be due to differencesin the floral source as well as the geographical origins ofthe honey.
Correlation amongst biochemical parameters andantioxidant propertiesSeveral significant correlations between biochemical andantioxidant parameters are shown in Table 5. A strongcorrelation was found between the color intensity ofthe honey samples and their antioxidant parameters,phenolic compounds, flavonoids, FRAP values and pro-tein contents, at correlation coefficients of 0.960, 0.915,0.964, and 0.953 respectively. This indicates that colorpigments may have a role in the observed antioxidantactivities of Malaysian honey samples.Color intensity also increases with the increase in
phenolic compounds and flavonoid content of honey. Astrong correlation between the ABS450 and FRAP valuessuggests the involvement of pigments that grant theantioxidant properties to honey. The correlation coef-ficient between ABS450 and FRAP values was 0.83 inIndian honeys [2], whereas in some Slovenian honeys,it was 0.85 [5]. Thus, the higher correlation in ourstudy indicates that Malaysian honeys have a strongerantioxidant capacity compared to Indian and Slovenianhoneys.Phenolic compounds and flavonoids are the most
important determinants for the antioxidant propertiesof honey. A strong correlation exists between phenoliccompounds and FRAP values (r=0.914). The correl-ation value of our study was higher than that for Algerianhoney (r=0.668) [3] but similar to that for Indian honey(r=0.900) [2]. In addition, the correlation coefficientbetween the total flavonoids and FRAP values was
henolics, flavonoids, DPPH scavenging, Ferric reducing-bance at 450 nm (ABS450) and protein
AP Ascorbic acid Proline ABS450 Protein
14** 0.411 0.390 0.960** 0.997**
48** 0.512 0.274 0.915** 0.991**
12** 0.598* 0.131 0.840** 0.834**
000 0.056 0.719** 0.964** 0.889**
056 1.000 0.621* 0.267 0.471
19** 0.621* 1.000 0.530 0.329
64** 0.267 0.530 1.000 0.953**
89** 0.471 0.329 0.953** 1.000
e 0.05 level (2-tailed).

Moniruzzaman et al. BMC Complementary and Alternative Medicine 2013, 13:43 Page 11 of 12http://www.biomedcentral.com/1472-6882/13/43
0.848, which is slightly lower than that of Algerianhoney (r=0.893).A significant positive linear correlation was observed
between phenolic compounds and flavonoid content withDPPH and FRAP values (r=0.804, 0.782 and r=0.712),indicating that these are good indicators for antioxidantactivities and that both phenolic compounds and flavonoidscontribute to their radical scavenging activity.Proline is an important amino acid that also contributes
to the antioxidant properties of honey, and it was found tostrongly correlate with FRAP and ascorbic acid content.The most significant correlation was observed betweenthe proline content and FRAP values (r=0.721), which issimilar to the result reported for some Indian honeys(r=0.73) [2], indicating that the proline content alsocontributes to the antioxidant potential of Malaysian honey.Protein content was also strongly correlated with phen-
olic compounds (r=0.997), flavonoids (r=0.991), FRAP(r=0.889) and ABS450 (r=0.953). Ascorbic acid, an import-ant vitamin that is well known for its antioxidant proper-ties, was also significantly correlated with the prolinecontent (r=0.621), indicating that proline may contributeto antioxidant activities to some extent.The correlation analysis clearly demonstrates that the
overall antioxidant property in the investigated Malaysianhoneys can be attributed to various factors, includingphenolic compounds, flavonoids, proline and ascorbic acidcontents and color pigments. Overall, phenolic compoundsand flavonoid content are significant determinants of theantioxidant capacity of honey samples as well as their re-ducing ability and radical scavenging potential. Further-more, phenolic compounds and flavonoid content appearto be highly important for antioxidant activity, as shown bytheir correlation values. Several batches of tualang honeyshould be studied to further confirm these findingsin future.
ConclusionThis is the first extensive investigation of the physico-chemical and antioxidant properties of honeys from differ-ent botanical and entomological origin of Malaysian. Thisstudy showed that Malaysian honeys have good antioxidantpotential. Among the four different honey types, tualanghoney had the highest phenolic compound and flavonoidcontents with the highest ferric reducing power values aswell as the greatest color intensity, indicating that it has thehighest antioxidant potential. Acacia honey was the mostacidic and contained the highest total sugar, reducing sugarand apparent sucrose contents and the highest mineralcontent. Pineapple honey had the highest concentrationof proline, whereas borneo honey had the highest concen-tration of total dissolved solids. Our study is the first toextensively report on the chemical composition and anti-oxidant activities of four monofloral Malaysian honeys.
Competing interestsThere is no conflict of interest statement among the authors.
Authors’ contributionsMM carried out the experimental parts of this investigation and prepared themanuscript. MIK helped to conduct the study. SAS, and SHG supervised thework, evaluated the results and corrected the manuscript for publication. Allauthors read and approved the final manuscript.
AcknowledgmentsWe would like to acknowledge the Universiti Sains Malaysia for financialsupport from the RU grant (1001/PPSP/815058).
Author details1Department of Pharmacology, School of Medical Sciences, Universiti SainsMalaysia, Kubang Kerian, Kelantan 16150, Malaysia. 2Human Genome Centre,School of Medical Sciences, Universiti Sains Malaysia, Kubang Kerian, Kelantan16150, Malaysia.
Received: 13 October 2012 Accepted: 8 February 2013Published: 23 February 2013
References1. Blasa M, Candiracci M, Accorsi A, Piacentini MP, Albertini MC, Piatt E: Raw
millefiori honey is packed full of antioxidants. Food Chem 2006,97:217–222.
2. Saxena S, Gautam S, Sharma A: Physical, biochemical and antioxidantproperties of some Indian honeys. Food Chem 2010, 118(2):391–397.
3. Khalil MI, Moniruzzaman M, Boukraâ L, Benhanifia M, Islam MA, Islam MN,Sulaiman SA, Gan SH: Physicochemical and Antioxidant Properties ofAlgerian Honey. Molecules 2012, 17(9):11199–11215.
4. Alvarez-Suarez JM, GonzaLez-Parma AM, Santos-Buelga C, Battino M:Antioxidant Characterization of Native Monofloral Cuban Honeys. J AgricFood Chem 2010, 58:9817–9824.
5. Bertoncelj J, Dobersek U, Jamnik M, Golob T: Evaluation of the phenoliccontent, antioxidant activity and colour of Slovenian honey. Food Chem2007, 105:822–828.
6. Gheldof N, Xiao-Hong W, Engeseth N: Identification and quantification ofantioxidant components of honeys from various floral sources. J AgricFood Chem 2002, 50:5870–5877.
7. Guler A, Bakan A, Nisbet C, Yavuz O: Determination of importantbiochemical properties of honey to discriminate pure and adulteratedhoney with sucrose (Saccharum officinarum L.) syrup. Food Chem 2007,105(3):1119–1125.
8. Alvarez-Suarez JM, Tulipani S, DÃaz D, Estevez Y, Romandini S, Giampieri F,Damiani E, Astolfi P, Bompadre S, Battino M: Antioxidant and antimicrobialcapacity of several monofloral Cuban honeys and their correlation withcolor, polyphenol content and other chemical compounds. Food ChemToxicol 2010, 48(8):2490–2499.
9. Council Directive of the European Union: Council Directive 2001/110/EC of20 December 2001 relating to honey. Official Journal of the EuropeanCommunities 2002, L10:47–52.
10. Azeredo LC, Azeredo MAA, Souza SR, Dutra VML: Protein contents andphysicochemical properties in honey samples of Apis mellifera ofdifferent floral origins. Food Chem 2003, 80:249–254.
11. Finola MS, Lasagno MC, Marioli JM: Microbiological and chemicalcharacterization of honeys from central Argentina. Food Chem 2007,100(4):1649–1653.
12. Ouchemoukh S, Louaileche H, Schweitzer P: Physicochemicalcharacteristics and pollen spectrum of some Algerian honeys. FoodControl 2007, 18(1):52–58.
13. Meda A, Lamien CE, Romito M, Millogo J, Nacoulma OG: Determination ofthe total phenolic, flavonoid and proline contents in Burkina Fasanhoney, as well as their radical scavenging activiity. Food Chem 2005,91:571–577.
14. Molan PC: The antibacterial activity of honey. Bee World 1992, 73(2):59–76.15. Moniruzzaman M, Khalil M, Sulaiman S, Gan S: Advances in the Analytical
Methods for Determining the Antioxidant Properties of Honey: AReview. Afr J Tradit Complement Altern Med 2012, 9(1):36–42.
16. Gheldof N, Engeseth NJ: Antioxidant capacity of honeys from variousfloral sources based on the determination of oxygen radical absorbance

Moniruzzaman et al. BMC Complementary and Alternative Medicine 2013, 13:43 Page 12 of 12http://www.biomedcentral.com/1472-6882/13/43
capacity and inhibition of in vitro lipoprotein oxidation in human serumsamples. J Agric Food Chem 2002, 50:3050–3055.
17. Tomas-Barberan FA, Martos I, Ferreres F, Radovic BS, Anklam E: HPLCflavonoid profiles as markers for the botanical origin of Europeanunifloral honeys. J Sci Food Agric 2001, 81(5):485–496.
18. Aljadi AM, Kamaruddin MY: Evaluation of the phenolic contents andantioxidant capacities of two Malaysian floral honeys. Food Chem 2004,85(4):513–518.
19. Mohamed M, Sirajudeen K, Swamy M, Yaacob NS, Sulaiman SA: Studies onthe antioxidant properties of Tualang honey of Malaysia. Afr J TraditComplement Altern Med 2010, 7(1):59.
20. Aljadi AM, Yusoff KM: Isolation and identification of phenolic acids inMalaysian honey with antibacterial properties. Turkish Journal of Medicineand Sciences 2003, 33:229–236.
21. Hussein SZ, Yusoff KM, Makpol S, Yusof YAM: Antioxidant capacities andtotal phenolic contents increase with gamma irradiation in two types ofMalaysian honey. Molecules 2011, 16:6384.
22. Khalil M, Alam N, Moniruzzaman M, Sulaiman S, Gan S: Phenolic AcidComposition and Antioxidant Properties of Malaysian Honeys. J Food Sci2011, 76(6):C921–C928.
23. Kishore RK, Halim AS, Syazana MSN, Sirajudeen KNS: Tualang honey hashigher phenolic content and greater radical scavenging activitycompared with other honey sources. Nutr Res 2011, 31:322–325.
24. AOAC: In Official methods of analysis. 15th edition. Edited by Helrich K.Arlington, VA, USA: Association of official Analytical Chemists, Inc; 1990.
25. Bogdanov S, Martin P, Lüllmann C: Harmonised methods of the EuropeanHoney Commission. Apidologie 1997, 28((extra issue)):1–59.
26. USDA: United States Standards for Grades of Extracted Honey. InAgricultural Marketing Service Fruit and Vegetable Division Processed ProductsBranch. Washington, DC: US Department of Agriculture; 1985.
27. Beretta G, Granata P, Ferrero M, Maf, Orioli M: Standardization ofantioxidant properties of honey by a combination ofspectrophotometric/fluorimetric assays and chemometrics. Anal ChimActa 2005, 533:185–191.
28. Bogdanov S, Martin P, Lullmann C: Harmonised methods of the internationalhoney commission. FAM, Liebefeld: Swiss Bee Research Centre; 2002.
29. Singleton VL, Orthofer R, Lamuela-Raventos RM: Analysis of total phenolsand other oxidation substrates and antioxidants by means of Folin-Ciocalteu reagent. Methods Enzymol 1999, 299:152–178.
30. Zhishen J, Mengcheng T, Jianming W: The determination of flavonoidcontents in mulberry and their scavenging effects on superoxideradicals. Food Chem 1999, 64:555–559.
31. Ferreira ICFR, Aires E, Barreira JCM, Estevinho LM: Antioxidant activity ofPortuguese honey samples: Different contributions of the entire honeyand phenolic extract. Food Chem 2009, 114:1438–1443.
32. Benzie IFF, Strain JJ: Ferric reducing/antioxidant power assay: directmeasure of total antioxidant activity of biological fluids and modifiedversion for simultaneous measurement of total antioxidant power andascorbic acid concentration. Methods Enzymol 1999, 299:15–27.
33. Lowry OH, Rosebrough NJ, Farr AL, Randall RJ: Protein measurement withthe Folin phenol reagent. J BiolChem 1951, 193:265.
34. Kayacier A, Karaman S: Rheological and some physicochemicalcharacteristics of selected Turkish honeys. J Text Stud 2008, 39(1):17–27.
35. Bogdanov S, Jurendic T, Sieber R: Honey for nutrition and health: areview. Am J Coll Nutr 2008, 27:677–689.
36. Alimentarius C: Revised codex standard for honey. Codex stan 2001,12:1982.
37. Gomes S, Dias LG, Moreira LL, Rodrigues P, Estevinho L: Physicochemical,microbiological and antimicrobial properties of commercial honeys fromPortugal. Food Chem Toxicol 2010, 48(2):544–548.
38. Kücük M, Kolayli S, Karaoglu S, Ulusoy E, Baltaci C, Candan F: Biologicalactivities and chemical composition of three honeys of different typesfrom Anatolia. Food Chem 2007, 100:526–534.
39. Marghitas LA, Dezmirean DS, Pocol CB, Ilea M, Bobis O, Gergen I: Thedevelopment of a biochemical profile of acacia honey by identifyingbiochemical determinants of its quality. Not Bot Hort Agrobot Cluj 2010,38(2):84–90.
40. Singh N, Bath PK: Quality evaluation of different types of Indian honey.Food Chem 1997, 58(1–2):129–133.
41. Terrab A, Gonzále M, González A: Characterisation of Moroccan unifloralhoneys using multivariate analysis. Eur Food Res Technol 2003, 218:88–95.
42. Serrano S, Villarejo M, Espejo R, Jodral M: Chemical and physicalparameters of Andalusian honey: classification of Citrus and Eucalyptushoneys by discriminant analysis. Food Chem 2004, 87(4):619–625.
43. Kaskoniene V, Venskutonis P, Ceksteryte V: Carbohydrate composition andelectrical conductivity of different origin honeys from Lithuania. LWT-Food Sci Technol 2010, 43(5):801–807.
44. Corbella E, Cozzolino D: The use of visible and near infrared spectroscopyto classify the floral origin of honey samples produced in Uruguay.J Near Infrared Spectros 2005, 13(2):63–68.
45. Islam M, Islam MN, Moniruzzaman M, Mottalib M, Sulaiman SA, Gan SH,Khalil M: Physicochemical and antioxidant properties of Bangladeshihoneys stored for more than one year. BMC Complement Altern Med 2012,12(1):177.
46. Kirs E, Pall R, Martverk K, Laos K: Physicochemical and melissopalynologicalcharacterization of Estonian summer honeys. Procedia Food Science 2011,1:616–624.
47. Khalil MI, Sulaiman SA, Gan SH: High 5-hydroxymethylfurfuralconcentrations are found in Malaysian honey samples stored for morethan one year. Food Chem Toxicol 2010, 48(8–9):2388–2392.
48. Fallico B, Zappala M, Arena E, Verzera A: Effects of conditioning on HMFcontent in unifloral honeys. Food Chem 2004, 85(2):305–313.
49. Doner LW: The sugars of honey-a review. J Sci Food Agric 1977,28(5):443–456.
50. Ajlouni S, Sujirapinyokul P: Hydroxymethylfurfuraldehyde and amylasecontents in Australian honey. Food Chem 2010, 119(3):1000–1005.
51. Krpan M, Markovi K, ŠariĆ G, Skoko B, Hrušk ar M, Vahčić N: Antioxidantactivities and total phenolics af acacia honey. Czech J Food Sci 2009,27:246–247.
52. Taormina PJ, Niemira BA, Beuchat LR: Inhibitory activity of honey againstfoodborne pathogens as influenced by the presence of hydrogenperoxide and level of antioxidant power. Int J Food Microbiol 2001,69:217–225.
53. Wang XH, Gheldof N, Engeseth NJ: Effect of processing and storage onantioxidant capacity of honey. J Food Sci 2004, 69:96–101.
54. Bergner KG, Hahn H: Zum Phenylalaningehalt von Honigen. Z Ernahrungswiss1972, 11(1):47–54.
55. Bogdanov S: Book of Honey-Honey Composition. In Bee Product Science.2009:1–9. Available on http://fantasticflavour.com/yahoo_site_admin/assets/docs/CompositionHoney.20105942.pdf (Accessed on 26 July 2012).
56. White JW: Composition of honey. In Honey, a Comprehensive Survey. Editedby Crane E. New York: Crane, Russak; 1975:157–206.
doi:10.1186/1472-6882-13-43Cite this article as: Moniruzzaman et al.: Physicochemical andantioxidant properties of Malaysian honeys produced by Apis cerana,Apis dorsata and Apis mellifera. BMC Complementary and AlternativeMedicine 2013 13:43.
Submit your next manuscript to BioMed Centraland take full advantage of:
• Convenient online submission
• Thorough peer review
• No space constraints or color figure charges
• Immediate publication on acceptance
• Inclusion in PubMed, CAS, Scopus and Google Scholar
• Research which is freely available for redistribution
Submit your manuscript at www.biomedcentral.com/submit