A deterrent response in honeybee ( Apis mellifera) foragers: Dependence on disturbance and season
8
Pergamon 0022-1910(95)00129-S J. Insect Ph.vsiol. Vol. 42, No. 5, 463470, 1996 pp. Copyright 0 1996 Elsevier Science Ltd Printed in Great Britain. All rights reserved 0022-1910196 $15.00 + 0.00 A Deterrent Response in Honeybee (&is mellifera) Foragers: Dependence on Disturbance and Season NORBERTO BALDERRAMA,* JOSUB NMEZ,? MARTIN GIURFA,? JUAN TORREALBA,*ti EMERITA G. DE ALBORNOZ,* LOURDES 0. ALMEIDA*$ Received 28 June 199.5; revised and accepted 9 October 199.5 The release of scents by honeybees Apis mellijha was studied in an experimental design that involved two bees: one caught and disturbed in a confinement vial (A-bee) and another intro- duced in a matrass (B-bee) and afterwards confronted with the confinement vial while trying to escape to the light. The time needed by the B-bee to reach the vial bottom was recorded for different disturbances (delay response). Honeybees rejected the vial where another bee was confined; results are thus consistent with the release of deterrents by A-bees. The delay response of B-bees increased with the confinement time and with the pressure applied to A- bees. Pressing was more efficient in eliciting the release of deterrents. Both mandibular glands and sting chamber contributed to the delay response. Beheaded A-bees elicited a greater delay response; thus, the release of substances from the sting chamber may be under the control of a central inhibition that disappears when the head is removed. An annual fluctuation in the delay response occurred. Maximal values were attained shortly after the period of abun- dant nectar flow. Tests with head- or sting-chamber squashes reveal that such fluctuation was associated with deterrents from the head. These could have an adaptive value in a foraging context. Copyright 0 1996 Elsevier Science Ltd Honeybees Apis mellifera Deterrents Disturbance Pheromones INTRODUCTION Intraspecific communication through pheromones occurs in the honeybee Apis mellifera L. as related to different behavioural contexts (see Free, 1987 for review). Work- ers, in particular, are known to use attractants and deter- rents among a great variety of pheromones. Attractants may be roughly defined as substances that bring an insect to the source of odour (Kennedy, 1977). The best known examples of these substances in the honeybee are the ‘footprints’ (Butler et al., 1969; Fergu- son and Free, 1979), a scent-mark deposed on the sur- faces of places regularly visited (e.g. rewarding food sources, hive entrance) and the Nassonof pheromone (Sladen, 1901; Free and Butler, 1955; Both and Shearer, 1962), a scent mark released in the air and used to help flying honeybees in finding a desirable objective (a swarm, a hive entrance or a food source). In the same way, two components found in the sting chamber of for- agers, the (Z)-1 I-eicosen-l-01 (Free et al., 1982) and the 9-octadecen- l-01 (Free, 1987), proved to be attractive when associated with food sources. *Inst. 2001. Agricol., Fat. Agronomia, Universidad Central de Vene- zuela, Aptdo Postal 4579, Maracay 2 101, Aragua, Venezuela. §Present address: Institut Wr Neurobiologie, Freie Universitst Berlin, KGnigin-Luise-Str. 28/30, 14195 Berlin, Germany. ‘fDep. Cs. Biokgicas; FCEyN; Universidad Buenos Aires, 1428, Buenos Aires, Argentina. Deterrents, on the other hand, may be defined as sub- stances that elicit rejection of the source of odour (Kennedy, 1977). An example of a deterrent scent in honeybees is that used to mark recently visited and depleted flowers (NC&, 1967; Giurfa and Ntiiiez, 1992, 1993a,. 1993b; Giurfa, 1993; Giurfa, et al., 1994). It is likely that a relatively volatile pheromone is used but the source of such a pheromone is unknown. Possibly 2- heptanone secreted by the mandibular glands is respon- sible since its production is maximal in foragers (Both et al., 1970; Vallet et al., 1991) and it is known to repel foragers from food sources (Simpson, 1966; Butler, 1966; Ferguson and Free, 1979; Free and Williams, 1983; Free, 1987 p. 113; Vallet et al., 1991). fTo whom all correspondence should be addressed. Deterrence may also be seen by common observation: 463
-
Upload
independent -
Category
Documents
-
view
0 -
download
0
Transcript of A deterrent response in honeybee ( Apis mellifera) foragers: Dependence on disturbance and season

Pergamon
0022-1910(95)00129-S
J. Insect Ph.vsiol. Vol. 42, No. 5, 463470, 1996 pp. Copyright 0 1996 Elsevier Science Ltd
Printed in Great Britain. All rights reserved 0022-1910196 $15.00 + 0.00
A Deterrent Response in Honeybee (&is mellifera) Foragers: Dependence on Disturbance and Season NORBERTO BALDERRAMA,* JOSUB NMEZ,? MARTIN GIURFA,? JUAN TORREALBA,*ti EMERITA G. DE ALBORNOZ,* LOURDES 0. ALMEIDA*$
Received 28 June 199.5; revised and accepted 9 October 199.5
The release of scents by honeybees Apis mellijha was studied in an experimental design that involved two bees: one caught and disturbed in a confinement vial (A-bee) and another intro- duced in a matrass (B-bee) and afterwards confronted with the confinement vial while trying to escape to the light. The time needed by the B-bee to reach the vial bottom was recorded for different disturbances (delay response). Honeybees rejected the vial where another bee was confined; results are thus consistent with the release of deterrents by A-bees. The delay response of B-bees increased with the confinement time and with the pressure applied to A- bees. Pressing was more efficient in eliciting the release of deterrents. Both mandibular glands and sting chamber contributed to the delay response. Beheaded A-bees elicited a greater delay response; thus, the release of substances from the sting chamber may be under the control of a central inhibition that disappears when the head is removed. An annual fluctuation in the delay response occurred. Maximal values were attained shortly after the period of abun- dant nectar flow. Tests with head- or sting-chamber squashes reveal that such fluctuation was associated with deterrents from the head. These could have an adaptive value in a foraging context. Copyright 0 1996 Elsevier Science Ltd
Honeybees Apis mellifera Deterrents Disturbance Pheromones
INTRODUCTION
Intraspecific communication through pheromones occurs in the honeybee Apis mellifera L. as related to different behavioural contexts (see Free, 1987 for review). Work- ers, in particular, are known to use attractants and deter- rents among a great variety of pheromones.
Attractants may be roughly defined as substances that bring an insect to the source of odour (Kennedy, 1977). The best known examples of these substances in the honeybee are the ‘footprints’ (Butler et al., 1969; Fergu- son and Free, 1979), a scent-mark deposed on the sur- faces of places regularly visited (e.g. rewarding food sources, hive entrance) and the Nassonof pheromone (Sladen, 1901; Free and Butler, 1955; Both and Shearer,
1962), a scent mark released in the air and used to help flying honeybees in finding a desirable objective (a swarm, a hive entrance or a food source). In the same way, two components found in the sting chamber of for- agers, the (Z)-1 I-eicosen-l-01 (Free et al., 1982) and the 9-octadecen- l-01 (Free, 1987), proved to be attractive when associated with food sources.
*Inst. 2001. Agricol., Fat. Agronomia, Universidad Central de Vene-
zuela, Aptdo Postal 4579, Maracay 2 101, Aragua, Venezuela.
§Present address: Institut Wr Neurobiologie, Freie Universitst Berlin,
KGnigin-Luise-Str. 28/30, 14195 Berlin, Germany.
‘fDep. Cs. Biokgicas; FCEyN; Universidad Buenos Aires, 1428,
Buenos Aires, Argentina.
Deterrents, on the other hand, may be defined as sub- stances that elicit rejection of the source of odour (Kennedy, 1977). An example of a deterrent scent in honeybees is that used to mark recently visited and depleted flowers (NC&, 1967; Giurfa and Ntiiiez, 1992, 1993a,. 1993b; Giurfa, 1993; Giurfa, et al., 1994). It is likely that a relatively volatile pheromone is used but the source of such a pheromone is unknown. Possibly 2- heptanone secreted by the mandibular glands is respon- sible since its production is maximal in foragers (Both et al., 1970; Vallet et al., 1991) and it is known to repel foragers from food sources (Simpson, 1966; Butler, 1966; Ferguson and Free, 1979; Free and Williams, 1983; Free, 1987 p. 113; Vallet et al., 1991).
fTo whom all correspondence should be addressed. Deterrence may also be seen by common observation:
463

464 NORBERTO BALDERRAMA et al.
honeybees captured with a glass vial and retained in it for some minutes refuse to enter it afterwards. When given the choice, bees usually reject the used vial and prefer a clean one. Since no food uptake is involved in this context but rather a disturbing procedure, deterrence here may be drastically different from that involved in the scent-marking of exploited flowers.
The aim of this work was to provide the first quantifi- cation of this rejection behaviour in a simple and reliable experimental design. In particular, we raised the question as to whether or not honeybee foragers release deterrent substances as a result of disturbing procedures in con- finement vials. We also asked whether bees release dif- ferent deterrent substances according to the disturbing modality. After showing that deterrent substances were actually released as a result of the disturbing procedures, we searched for the body regions in which the glands responsible of their production may be localised. Since the responsiveness of bees to aversive stimuli may drasti- cally vary with the season of the year (Balderrama et al., 1987), we addressed the question of whether the response of honeybee foragers to deterrent substances.released in this experimental context varied throughout the year. Finally, we asked whether, in this experimental design, annual variations in responsiveness may be attributed to particular deterrent substances produced in different body parts.
MATERIALS AND METHODS
Experiments were conducted at the Instituto de Zoologia Agricola, Facultad de Agronomia, UCV, Maracay (10’ North; 67” West; 446m above sea level), Venezuela. Honeybees Apis mellifera ligustica Spinola (Starline, U.S.A.) from a hive approximately 100 m from the laboratory were used. They were trained to a feeder containing 50% wlw sucrose solution, placed in the lab- oratory. Bees were captured on their arrival at the feeder and before they could drink. In all cases, biossays involved two bees: one, the scent-source bee (A-bee), was caught and disturbed in a confinement vial, and the other, the test bee (B-bee), was introduced in a glass mat- rass to be confronted with the confinement vial.
The rationale of our experimental design makes use of the fact that caged bees show a spontaneous phototactic response when they try to escape, i.e. they orient to the light (Hess, 1913; Menzel and Greggers, 1985). If an escaping B-bee is confronted with a confinement vial, a delay in its escape response may be observed when com- pared with that occurring if confronted with a clean vial. It is thus unavoidable to assume that a scent having an informational value for the escaping bee was put inside the confinement vial. To test this hypothesis, a bioassay based either on confinement or application of a known pressure to bees in confinement vials was developed. In this way, we attempted to simulate two natural disturbing situations: capture of a bee and prevention of free escape (confinement in a vial) and seizure or grasping after cap-
ture (application of a given pressure in a confinement vial).
Procedure
Each A-bee was caged in a clean glass vial (15 mm in diameter and 45 mm high) having an hermetic cover and a disk of filter paper. A net hood prevented the A- bee from contacting the disk of filter paper [Fig. l(a): confinement vial]. It was disturbed either by retaining it therein during a particular confinement time or, in addition, by pressing it, with a known weight, against the bottom of the vial [Fig. l(b,c)]. The A-bee was thereafter eliminated and the vial was closed at once again. These two last steps never exceeded 5 sec. The resulting vial was immediately tested with a B-bee maintained for this purpose in the matrass. Controls were run with unused test vials.
The matrass (100 ml) in a horizontal position with the B-bee inside was illuminated from above by the labora- tory lights (150-200 lux intensity). The matrass neck was covered with a black cloth so that the B-bee remained in the illuminated body of the flask due to its natural photo- tactic response [Fig. l(d)]. The trial began after two min, when the. confinement vial was hermetically connected to the mouth of the matrass and the black cloth displaced, now covering the body of the flask. The B-bee now
FIGURE I. Experimental device. a) A-bee caged in a confinement
vial. b) A-bee caged in a confinement vial with a rubber cylinder and
a weight. c) A-bee pressed against the bottom of the confinement vial.
d) The matrass neck is covered with a black cloth: the B-bee remains
in the illuminated body of the flask. e) The black cloth is displaced,
covering the body of the flask and the confinement vial is connected
to the mouth of the matrass: the B-bee looks to escape after the illuminated neck and is confronted with the confinement vial.
A DETERRENT RESPONSE IN HONEYBEE FORAGERS 465
looked to escape from the illuminated neck and was con- fronted with the confinement vial [Fig. l(e)]. The escape response occurred in 100% of the trials.
We recorded the delay in the escape response (henceforth delay response), i.e. the time (set) needed by the B-bee to reach the bottom of the confinement vial. In all cases, the intensity of the response presented is the time obtained by subtracting the response to a clean vial (control) from that to the confinement vial used. Thus, each test consisted of the alternate presentation of a clean and a confinement vial.
All assays were performed at room temperature (25°C). Bees were randomly sampled during the course of the day between 7.00 and 19.00 hours and the results pooled. After each test, the B-bee used was caged to avoid retesting of the same individuals and the matrass and vials were carefully washed, rinsed with distilled water and dried in a 60°C oven overnight.
The experimental context of this work represents a simple and reliable design, allowing the study of the behavioural responses associated with possible release of deterrent substances in honeybee foragers. Though bees are obviously not caught in vials in natural situations, our experimental design attempts to reproduce two real situations: actual capture by an enemy and unexpected restriction of free escape. Thus, our set-up allows us to study the possible release of deterrent substances by honeybees in such situations and to obtain reproducible and accurate results on the response to such deterrent substances.
First experiment: the basic response
The effect of clean and used vials on the basic photo- tactic response was measured in the experimental device. For this, the same B-bees were tested in four successive assays, alternating clean and confinement vials. The latter were established by confining an A-bee in a vial and pressing it therein against the vial bottom with a weight of 5 g/cm2 (see below). In all cases, the delay (set) in the escape response (absolute values) was measured. The time interval between two consecutive presentations was 2 min. From one presentation to the other, the B-bee was transferred to a clean matrass.
Second experiment: the @feet of corzjinement time
Three groups of A-bees were maintained in confine- ment vials for three different times (1.5, 3 and 18 min). Each vial was afterwards presented to a B-bee and the delay (set) in the escape response measured. To calculate the intensity of the response, we subtracted from this value the delay measured for clean, control vials. Two experimental series were run in that way: one with A- bees caught in confinement vials in which a disk of filter paper impregnated with 50% KOH solution was placed and another without it. A net hood prevented the A-bee from contacting the disk of filter paper [Fig. l(a)]. An additional group of A-bees were confined for 20 min and subjected to the KOH treatment only in the last 5 min.
KOH solution was used to neutralise metabolic CO2 pro- duced.
Third experiment: the effect of pressure
A rubber cylinder, 1Omm in diameter and 1Omm high, and a weight were placed inside the confinement vial. The A-bee was caught and maintained therein for 2 minutes [Fig. l(b)]. In the last 30 set the vial was inverted and the bee was pressed against the bottom for 15 set [Fig. l(c)]. Pressures of 3.2, 6.4, 12.8 and 19.2 g/cm2 were applied. An additional group of A-bees was simultaneously subjected to a pressure of 6.4 g/cm’ and to the treatment with the 50% KOH solution. Each vial was afterwards presented to a B-bee and the delay (set) in the escape response measured. To calculate the inten- sity of the response, we subtracted from this value the delay measured for clean, control vials.
Fourth experiment: the effect of isolated body parts and
gland sealing
A-bees were previously immobilised by chilling them at 0°C and thereafter sectioned and/or partially sealed with wax by means of microcautery. After 5 mins recov- ery, the A-bee treated in this way was introduced into the confinement vial and subjected to a pressure of 6.4 g/cm2 as in the third experiment. For the selection of the body parts to be extirpated or sealed with wax, we considered those being the main sources of deterrent substances identified in adult honeybee workers of Apis
mellifera: the sting chamber and the mandibular glands (Maschwitz, 1964; Morse et al., 1967; Free, 1987).
Seven experimental groups were established:
l Group 1) Intact A-bees. l Group 2) A-bees with the mandibular glands sealed. l Group 3) A-bees with the abdomen extirpated. l Group 4) A-bees with the sting chamber sealed. l Group 5) A-bees with the mandibular glands and the
sting chamber sealed. l Group 6) A-bees beheaded and with the sting
chamber sealed. l Group 7) A-bees beheaded.
Vials were afterwards presented to B-bees and the delay (set) in the escape response measured. The delay measured for clean, control vials was subtracted from this value and the intensity of the escape response calculated.
Fifth experiment: the annual variation in the delay
response
Intact A-bees were maintained in confinement vials for 2 min. In the last 30 set the bee was subjected for 15 seconds to a pressure of 6.4 glcm2, as in the third exper- iment. The confinement vials were then presented to B- bees caged in the matrass and the delay (set) of the behavioural response recorded. The delay measured for clean, control vials was subtracted from this value and the intensity of the escape response calculated. The same

466 NORBERTO BALDERRAMA et al.
procedure was repeated throughout the year, for two years.
At the same time, groups with squashed body parts were tested. Foragers were caught, chilled at 0°C during 5-l 0 min and heads and/or sting chambers were carefully extirpated. These parts were put between two disks of filter paper (8 mm diameter) and squashed. The whole (squashed body part and filter papers) was introduced in the confinement vial and the response of B-bees to it was measured over two years. Again, the intensity of the B- bees’ response resulted from subtracting the response to clean vials from that to confinement vials.
RESULTS
First experiment: the basic response
Figure 2 depicts the results obtained. The variation observed was highly significant (One-Factor-ANOVA for repeated measurements: F = 5.93; df: 3,42; P = 0.002). A Newman-Keuls test modified for repeated measurements was used for the comparison between means. The response recorded in tests 1 and 3 and in tests 2 and 4 did not differ at the 0.05 level. Due to their phototactic response, B-bees rapidly reached the end of the clean vial (tests 1 and 3). However, when they were tested with a confinement vial where an A-bee was pressed against the bottom, they needed significantly more time to enter the vial (tests 2 and 4). This difference was due to an easily observable rejection behaviour: bees arrived at the vial entrance, introduced their antennae therein and rejected it immediately, thus increasing the time necessary to reach the end of the vial. This result is thus consistent with the presence of some repelling substance deposited in the confinement vial by the A-bees.
Second experiment: the effect of conjinement time
Figure 3 shows a significant variation in the dynamics of the response (Two-way-factor ANOVA) according to the confinement time (F = 52.24; df: 3,252; P < 0.000) and the experimental series (with or without 50% KOH
Test
FIGURE 2. The basic delay response (set). Absolute values are rep- resented. Each column represents the mean plus the SE. (n = 15).
250
0 5
Confinement tinYe (min) 20
FIGURE 3. Intensity of the delay response (set) in dependence on the confinement time (min). Values represented result from subtracting the delay in the escape response to a clean, control vial from that measured for the confinement vial tested. Empty squares: series without KOH solution; black squares: series with KOH solution; asterisk: experimen- tal group confined 15 min without KOH solution and where KOH was added during the last five min (total confinement time: 20 min). Sym- bols represent the mean plus the S.E.; n is indicated for each point
(values in parenthesis).
solution) (F = 28.40; df: 1;252; P < 0.000). The value at the confinement time t = 0 corresponds to a clean con- trol vial. The mean response obtained in both experimen- tal series (with or without KOH solution) progressively increased. In the series with KOH solution, this increase was limited to 1.5 to 3 mins, remaining afterwards con- stant (Newman-Keuls test at the 0.05 level). In all con- finement times the delay response without KOH solution was significantly greater than that with KOH solution (Newman-Keuls test; P < 0.01).
Again, the delayed response can be explained by the presence of repelling substances, deposited in the con- finement vial. Some of them are, however, quickly elim- inated by the 50% KOH solution as shown by the differ- ence between both curves of Fig. 3 and by the decrease in the delay response observed when this solution is added only in the five last mins after a confinement time of fifteen mins (Fig. 3). This is depicted by the control group at the confinement time t = 20 min. This short exposure was sufficient to reach the same level of response obtained with continuous exposure (compare t = 18 min with KOH against t = 20 min [KOH only in the last 5 min]: two-sample t-test: t = -0.11; df: 19; NS).
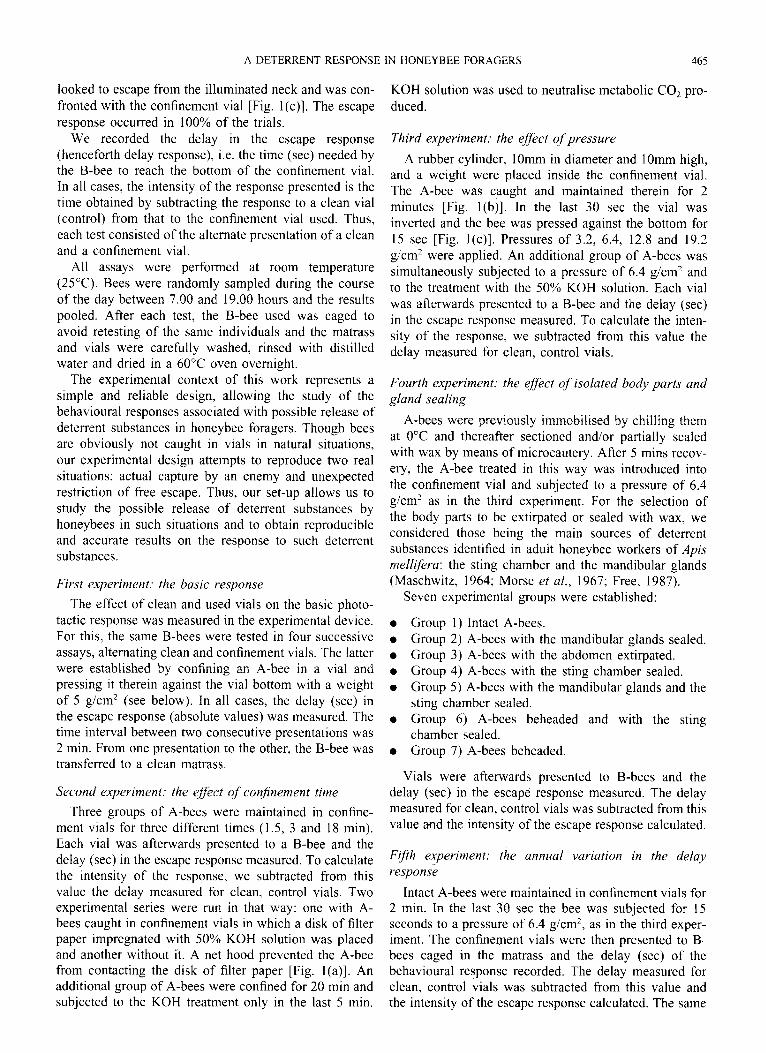
Third experiment: the effect of pressure
B-bees showed a significant variation in their response when confronted to vials where A-bees were subjected to different pressures (Fig. 4: One-Way-Factor ANOVA; F = 19.54; df: 3,152; P <O.OOO). The values at the press- ure P = 0 correspond to a control vial where an A-bee was confined for 1.5 mins without being pressed. Mean values corresponding to pressures of 6.4, 12.8 and 19.2 g/cm’ in the experimental series without KOH solution did not differ significantly after a Newman-Keuls test (a = 0.05).
A DETERRENT RESPONSE IN HONEYBEE FORAGERS 461
FIGURE 4. Intensity of the delay response (set) in dependence on the
pressure applied (g/cmz). Values represented result from subtracting
the delay in the escape response to a clean, control vial from that
measured for the confinement vial tested. Empty squares: series with-
out KOH solution; black squares: series with KOH solution. Symbols
represent the mean plus the SE. (n = 39).
The delay response to 6.4 g/cm2 without KOH solution was significantly greater than that with KOH solution (two-sample t-test: t = 5.49; df: 38; P < O.OOO), showing that part of the delay in entering the confinement vial was due to the presence of substances released by the A- bee and removed by the 50% KOH solution. Neverthe- less, the fact that the response to 6.4 g/cm2 with KOH solution was significantly greater than the control without pressure (P = 0) (two-sample t-test: t = 2.5; df: 38; P < 0.02) shows that deterrents were not totally removed. The effect of KOH solution is, however, more drastic here than in the second experiment (confinement time): KOH solution produced a decrease in the response of 80% in the pressure experiment (Fig. 4) whereas it reduced the response in 50% in the confinement time experiment (Fig. 3).
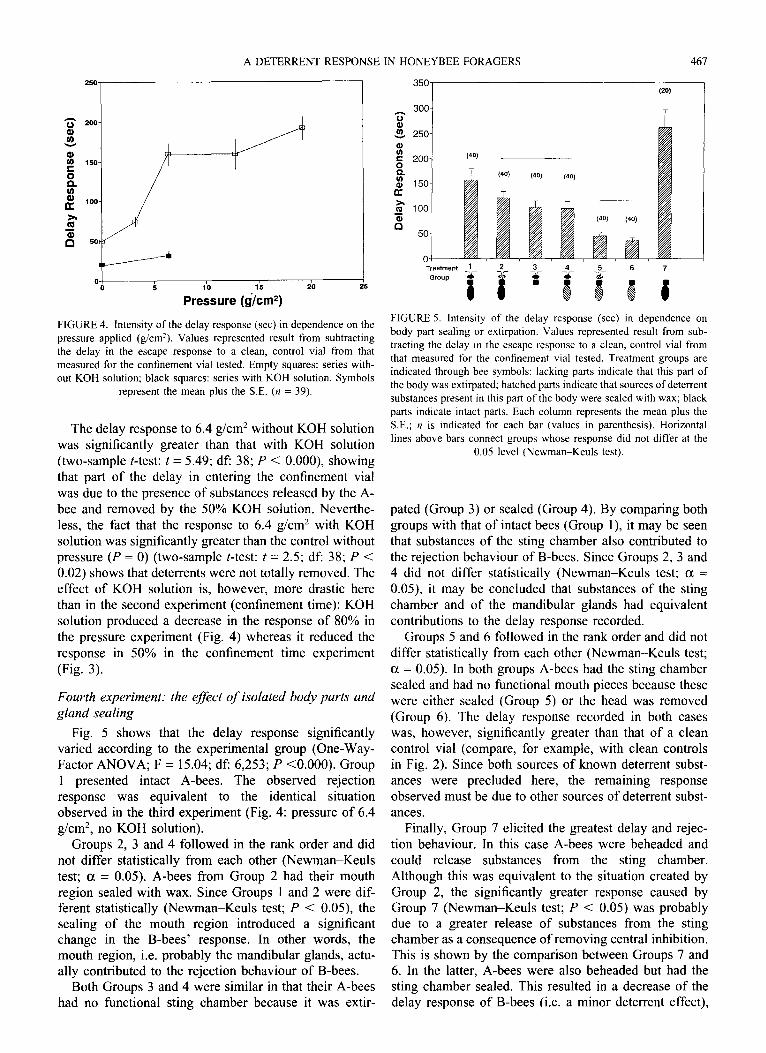
Fourth experiment: the effect of isolated body parts and gland sealing
Fig. 5 shows that the delay response significantly varied according to the experimental group (One-Way- Factor ANOVA; F = 15.04; df: 6,253; P <O.OOO). Group 1 presented intact A-bees. The observed rejection response was equivalent to the identical situation observed in the third experiment (Fig. 4: pressure of 6.4 g/cm2, no KOH solution).
Groups 2, 3 and 4 followed in the rank order and did not differ statistically from each other (Newman-Keuls test; a = 0.05). A-bees from Group 2 had their mouth region sealed with wax. Since Groups 1 and 2 were dif- ferent statistically (Newman-Keuls test; P < 0.05), the sealing of the mouth region introduced a significant change in the B-bees’ response. In other words, the mouth region, i.e. probably the mandibular glands, actu- ally contributed to the rejection behaviour of B-bees.
Both Groups 3 and 4 were similar in that their A-bees had no functional sting chamber because it was extir-
%+
300
3 250
Z g 200
s c? 150
% 100 5 0
50
FIGURE 5. Intensity of the delay response (set) in dependence on
body part sealing or extirpation. Values represented result from sub-
tracting the delay in the escape response to a clean, control vial from
that measured for the confinement vial tested. Treatment groups are
indicated through bee symbols: lacking parts indicate that this part of
the body was extirpated; hatched parts indicate that sources of deterrent
substances present in this part of the body were sealed with wax; black
parts indicate intact parts. Each column represents the mean plus the
S.E.; n is indicated for each bar (values in parenthesis). Horizontal
lines above bars connect groups whose response did not differ at the
0.05 level (Newman-Keuls test).
pated (Group 3) or sealed (Group 4). By comparing both groups with that of intact bees (Group l), it may be seen that substances of the sting chamber also contributed to the rejection behaviour of B-bees. Since Groups 2, 3 and 4 did not differ statistically (Newman-Keuls test; a = 0.05) it may be concluded that substances of the sting chamber and of the mandibular glands had equivalent contributions to the delay response recorded.
Groups 5 and 6 followed in the rank order and did not differ statistically from each other (Newman-Keuls test; a = 0.05). In both groups A-bees had the sting chamber sealed and had no functional mouth pieces because these were either sealed (Group 5) or the head was removed (Group 6). The delay response recorded in both cases was, however, significantly greater than that of a clean control vial (compare, for example, with clean controls in Fig. 2). Since both sources of known deterrent subst- ances were precluded here, the remaining response observed must be due to other sources of deterrent subst- ances.
Finally, Group 7 elicited the greatest delay and rejec- tion behaviour. In this case A-bees were beheaded and could release substances from the sting chamber. Although this was equivalent to the situation created by Group 2, the significantly greater response caused by Group 7 (Newman-Keuls test; P < 0.05) was probably due to a greater release of substances from the sting chamber as a consequence of removing central inhibition. This is shown by the comparison between Groups 7 and 6. In the latter, A-bees were also beheaded but had the sting chamber sealed. This resulted in a decrease of the delay response of B-bees (i.e. a minor deterrent effect),
468 NORBERTO BALDERRAMA et al.
thus showing that removal of the head acts on the release of sting chamber pheromone.
Thus, although the contribution of head or abdomen on the rejection response is similar (Groups 2 and 4), their surgical elimination seems to modify the intensity of response differentially. Removal of the head increases the release of sting chamber pheromone through the lack of central inhibition.
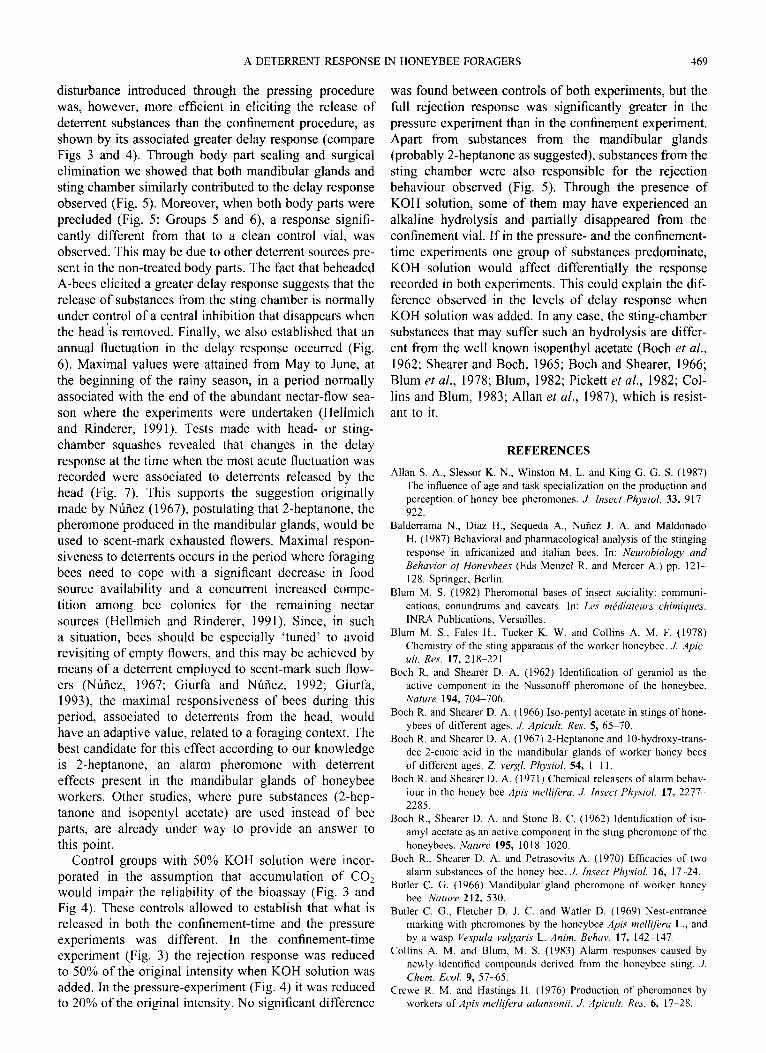
Fifth experiment: the annual variation in the delay response
Fig. 6 depicts the annual variation in the delay response of B-bees presented with confinement vials where an A-bee was subjected to a pressure of 6.4 g/cm2, as in the third experiment.
This annual variation was highly significant (One- Way-Factor ANOVA: F= 13.87; df: 18,621; P < 0.000). The delay response reached a maximum from May to June and remained low from July to April.
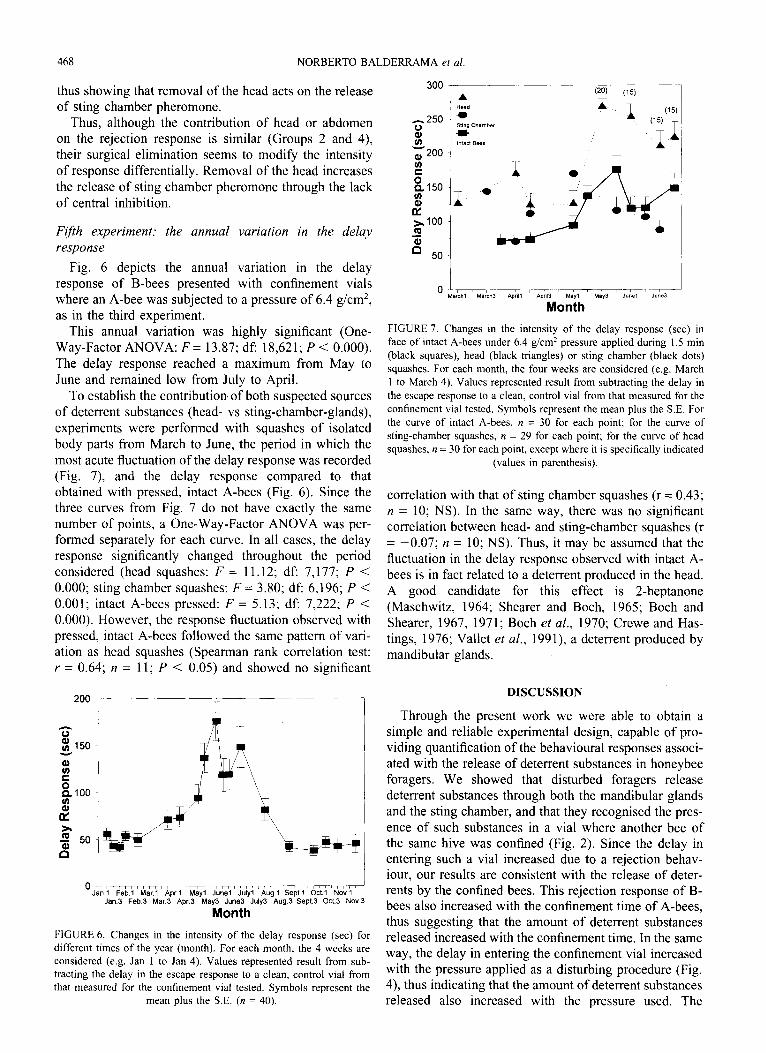
To establish the contribution of both suspected sources of deterrent substances (head- vs sting-chamber-glands), experiments were performed with squashes of isolated body parts from March to June, the period in which the most acute fluctuation of the delay response was recorded (Fig. 7), and the delay response compared to that obtained with pressed, intact A-bees (Fig. 6). Since the three curves from Fig. 7 do not have exactly the same number of points, a One-Way-Factor ANOVA was per- formed separately for each curve. In all cases, the delay response significantly changed throughout the period considered (head squashes: F = 11.12; df: 7,177; P -=c 0.000; sting chamber squashes: F = 3.80; df: 6,196; P < 0.001; intact A-bees pressed: F = 5.13; df: 7,222; P < 0.000). However, the response fluctuation observed with pressed, intact A-bees followed the same pattern of vari- ation as head squashes (Spearman rank correlation test: Y = 0.64; n = 11; P -=c 0.05) and showed no significant
1
ml --r Mar 1 1 Apr 1-1 1 r m- ’ Aug 1 Sept 1 Ott 1 s-lT1 Nov 4 1 Jan.3 Feb 3 Mar.3 Apr.3 May3 June3 July3 Aug.3 Sept 3 Oct.3 Nov3
Month
FIGURE 6. Changes in the intensity of the delay response (set) for
different times of the year (month). For each month, the 4 weeks are
considered (e.g. Jan 1 to Jan 4). Values represented result from sub-
tracting the delay in the escape response to a clean, control vial from
that measured for the confinement vial tested. Symbols represent the
mean plus the SE. (n = 40).
FIGURE 7. Changes in the intensity of the delay response (set) in
face of intact A-bees under 6.4 g/cm* pressure applied during 1.5 min
(black squares), head (black triangles) or sting chamber (black dots)
squashes. For each month, the four weeks are considered (e.g. March
I to March 4). Values represented result from subtracting the delay in
the escape response to a clean, control vial from that measured for the
confinement vial tested. Symbols represent the mean plus the S.E. For
the curve of intact A-bees, n = 30 for each point; for the curve of
sting-chamber squashes, n = 29 for each point; for the curve of head
squashes, n = 30 for each point, except where it is specifically indicated
(values in parenthesis).
correlation with that of sting chamber squashes (r = 0.43; n = 10; NS). In the same way, there was no significant correlation between head- and sting-chamber squashes (r = -0.07; n = 10; NS). Thus, it may be assumed that the fluctuation in the delay response observed with intact A- bees is in fact related to a deterrent produced in the head. A good candidate for this effect is 2-heptanone (Maschwitz, 1964; Shearer and Both, 1965; Both and Shearer, 1967, 197 1; Both et al., 1970; Crewe and Has- tings, 1976; Vallet et al., 1991), a deterrent produced by mandibular glands.
DISCUSSION
Through the present work we were able to obtain a simple and reliable experimental design, capable of pro- viding quantification of the behavioural responses associ- ated with the release of deterrent substances in honeybee foragers. We showed that disturbed foragers release deterrent substances through both the mandibular glands and the sting chamber, and that they recognised the pres- ence of such substances in a vial where another bee of the same hive was confined (Fig. 2). Since the delay in entering such a vial increased due to a rejection behav- iour, our results are consistent with the release of deter- rents by the confined bees. This rejection response of B- bees also increased with the confinement time of A-bees, thus suggesting that the amount of deterrent substances released increased with the confinement time. In the same way, the delay in entering the confinement vial increased with the pressure applied as a disturbing procedure (Fig. 4), thus indicating that the amount of deterrent substances released also increased with the pressure used. The
A DETERRENT RESPONSE IN HONEYBEE FORAGERS 469
disturbance introduced through the pressing procedure was, however, more efficient in eliciting the release of deterrent substances than the confinement procedure, as shown by its associated greater delay response (compare Figs 3 and 4). Through body part sealing and surgical elimination we showed that both mandibular glands and sting chamber similarly contributed to the delay response observed (Fig. 5). Moreover, when both body parts were precluded (Fig. 5: Groups 5 and 6), a response signifi- cantly different from that to a clean control vial, was observed. This may be due to other deterrent sources pre- sent in the non-treated body parts. The fact that beheaded A-bees elicited a greater delay response suggests that the release of substances from the sting chamber is normally under control of a central inhibition that disappears when the head is removed. Finally, we also established that an annual fluctuation in the delay response occurred (Fig. 6). Maximal values were attained from May to June, at the beginning of the rainy season, in a period normally associated with the end of the abundant nectar-flow sea- son where the experiments were undertaken (Hellmich and Rinderer, 1991). Tests made with head- or sting- chamber squashes revealed that changes in the delay response at the time when the most acute fluctuation was recorded were associated to deterrents released by the head (Fig. 7). This supports the suggestion originally made by Nufiez (1967), postulating that 2-heptanone, the pheromone produced in the mandibular glands, would be used to scent-mark exhausted flowers. Maximal respon- siveness to deterrents occurs in the period where foraging bees need to cope with a significant decrease in food source availability and a concurrent increased compe- tition among bee colonies for the remaining nectar sources (Hellmich and Rinderer, 1991). Since, in such a situation, bees should be especially ‘tuned’ to avoid revisiting of empty flowers, and this may be achieved by means of a deterrent employed to scent-mark such flow- ers (Nufiez, 1967; Giurfa and Nufiez, 1992; Giurfa, 1993) the maximal responsiveness of bees during this period, associated to deterrents from the head, would have an adaptive value, related to a foraging context. The best candidate for this effect according to our knowledge is 2-heptanone, an alarm pheromone with deterrent effects present in the mandibular glands of honeybee workers. Other studies, where pure substances (2-hep- tanone and isopentyl acetate) are used instead of bee parts, are already under way to provide an answer to this point.
Control groups with 50% KOH solution were incor- porated in the assumption that accumulation of CO, would impair the reliability of the bioassay (Fig. 3 and Fig 4). These controls allowed to establish that what is released in both the confinement-time and the pressure experiments was different. In the confinement-time experiment (Fig. 3) the rejection response was reduced to 50% of the original intensity when KOH solution was added. In the pressure-experiment (Fig. 4) it was reduced to 20% of the original intensity. No significant difference
was found between controls of both experiments, but the full rejection response was significantly greater in the pressure experiment than in the confinement experiment. Apart from substances from the mandibular glands (probably 2-heptanone as suggested), substances from the sting chamber were also responsible for the rejection behaviour observed (Fig. 5). Through the presence of KOH solution, some of them may have experienced an alkaline hydrolysis and partially disappeared from the confinement vial. If in the pressure- and the confinement- time experiments one group of substances predominate, KOH solution would affect differentially the response recorded in both experiments. This could explain the dif- ference observed in the levels of delay response when KOH solution was added. In any case, the sting-chamber substances that may suffer such an hydrolysis are differ- ent from the well known isopenthyl acetate (Both et al., 1962; Shearer and Both, 1965; Both and Shearer, 1966; Blum et al., 1978; Blum, 1982; Pickett et al., 1982; Col- lins and Blum, 1983; Allan et al., 1987), which is resist- ant to it.
REFERENCES
Allan S. A., Slessor K. N., Winston M. L. and King G. G. S. (1987)
The influence of age and task specialization on the production and
perception of honey bee pheromones. J. Insect Physiol. 33, 917-
922.
Balderrama N., Diaz H., Sequeda A., Nlinez J. A. and Maldonado
H. (1987) Behavioral and pharmacological analysis of the stinging
response in africanized and italian bees. In: Neurobiology and
Behavior of' Honeybees (Eds Menzel R. and Mercer A.) pp. l21-
128. Springer, Berlin.
Blum M. S. (1982) Pheromonal bases of insect sociality: communi-
cations, conundrums and caveats. In: Les mkdiateurs chimiques.
INRA Publications, Versailles.
Blum M. S., Fales H., Tucker K. W. and Collins A. M. F. (1978)
Chemistry of the sting apparatus of the worker honeybee. J. Epic-
ult. Rex 17, 2 18-22 I
Both R. and Shearer D. A. (1962) Identification of geraniol as the
active component in the Nassonoff pheromone of the honeybee.
Nature 194, 704706.
Both R. and Shearer D. A. (1966) Iso-pentyl acetate in stings of hone-
ybees of different ages. J. Apicult. Res. 5, 65-70.
Both R. and Shearer D. A. (1967) 2-Heptanone and 1 O-hydroxy-trans-
dec-2-enoic acid in the mandibular glands of worker honey bees
of different ages. Z. vevgl. Physiol. 54, 1-l I.
Both R. and Shearer D. A. (197 I) Chemical releasers of alarm behav-
iour in the honey bee Apis mekfera. J. Insect Physiol. 17, 2277-
2285.
Both R., Shearer D. A. and Stone B. C. (1962) Identification of iso-
amyl acetate as an active component in the sting pheromone of the
honeybees. Nature 195, 1018-1020.
Both R., Shearer D. A. and Petrasovits A. (1970) Efficacies of two
alarm substances of the honey bee. J. Insect Physiol. 16, 17-24.
Butler C. G. (1966) Mandibular gland pheromone of worker honey
bee. Nature 212, 530.
Butler C. G., Fletcher D. J. C. and Wader D. (1969) Nest-entrance
marking with pheromones by the honeybee Apis mellifera L., and
by a wasp Vespula vulgaris L. Anim. Behav. 17, 142-147.
Collins A. M. and Blum, M. S. (1983) Alarm responses caused by
newly identified compounds derived from the honeybee sting. J.
Chem. Ecol. 9, 57-65.
Crewe R. M. and Hastings H. (1976) Production of pheromones by
workers of Apis mrll~f~ra adansonii. J. Apicult. Res. 6, 17-28.

470 NORBERTO BALDERRAMA et al.
Ferguson A. W. and Free J. B. (1979) Production of a forage-marking pheromone by the honeybee. J. Apicult. Res. 18, 128-135.
Free J. B. (1987) Pheromones of Social Bees. Chapman and Hall, Lon- don.
Free J. B. and Butler C. G. (1955) An analysis of the factors involved in the formation of a cluster of honeybees (Apis mellifera). Behav- iour 7, 30443 16.
Free J. B. and Williams I. H. (1983) Scent-marking of flowers by honeybees. J. Apicult. Rex 22, 8690.
Free J. B., Williams I. H., Pickett J. A., Ferguson A. W. and Martin A. ( 1982) Attractiveness of (Z)- 11 -eicosen- l-01 to foraging honeybees Apis mellifera L. (Hymenoptera, Apidae). J. Apicult. Rex 21, 151-156.
Giurfa M. (1993) The repellent scent-mark of the honeybee Apis melli- fera ligustica and its role as communication cue during foraging. Insectes Sociaux 40, 5967.
Giurfa M. and Nufiez J. A. (1992) Honeybees mark with scent and reject recently visited flowers. Oecologia 89, 113-l 17.
Giurfa M. and Ntiez J. A. (1993) Efficient floret inspection by hone- ybees in capitula of Carduus acanthoides. Ecol. Entomol. 18, 116-122.
Giurfa M. and Nufiez J. A. (1993) Visual modulation of a scent-mark- ing activity in the honeybee Apis melltjera L. Naturwissenschafien 8, 376379.
Giurfa M., Nufiez J. A. and Backhaus W. (1994) Odour and colour information in the foraging choice behaviour of the honeybee. J. Camp. Physiol. A 175,773-779.
Maschwitz U. (1964) Gefabrenalarmstoffe und Gefahralarmierung bei sozialen Hymenopteren. Z. vergl. Physiol. 47, 596655.
Menzel R. and Greggers U. (1985) Natural phototaxis and its relation- ship to colour vision in honeybees. J. Camp. Physiol. A 157, 311-321.
Morse R. A., Shearer D. A., Both R. and Benton A. W. (1967) Obser- vations on alarm substances in the genus Apis. J. Apicult. Res. 6, 113-118.
NGiez J. A: (1967) Sammelbienen markieren versiegte Futterquellen durch Duft. Naturwissenschajien 54, 322-323.
Pickett J. A., Williams I. H. and Martin A. P. (1982) (Z)- 1 l-eicosen- l-01, an important new pheromonal component from the sting of the honey bee Apis melltfera L. (Hymenoptera: Apidae) J. Chem. Ecol. 8, 163-175.
Shearer D. A. and Both R. (1965) 2-heptanone in the mandibular gland secretion of the honey bee. Nature 206, 530.
Simpson J. ( 1966) Repellency of the mandibular gland scent of worker honey bees. Nature 209, 531-532.
Sladen F. W. L. (1901) A scent organ in the bee. British Bee J 29, 142, 143, 151-153.
Vallet A., Cassier P. and Lensky Y. (1991) Ontogeny of the fine struc- ture of the mandibular glands of the honeybee (Apis melltjera L.) workers and the pheromonal activity of 2-Heptanone. J. Insect Physiol. 37, 789-804.
Hellmich R. L. and Rinderer T. E. (1991) Beekeeping in Venezuela. In: The ‘African ’ Honey Bee (Eds Spivak M., Fletcher D. J. C. and Acknowledgements-We thank Claudio Lazzari and Walter Farina for Breed M. D.) pp. 3994 11. Westview Press, Boulder. corrections and comments on the manuscript. This work was supported
Hess C. (19 13) Experimentelle Untersuchungen iiber den angeblichen by grants from the Consejo de Desarrollo Cientifico y Humanistico Farbensinn der Bienen. Zool. Jb. Abt. Allg. Zool. Physiol. 34, (CDCH), UCV, Venezuela, to N. Balderrama (grant 01.38.224190 and 81-106. 92), from the International Foundation for Science (IFS), Sweden, to
Kennedy J. S. (1977) Behaviorally discriminating assays of attractants L. Almeida (grant B-1417-1) and to M. Giurfa (grants B-1704-1 and and repellents. In Chemical Control of Insect Behavior (Eds Shorey B-1704-2F) and from the Consejo de Investigaciones Cientificas y H. H. and McKelvey J. J. Jr.) pp. 215-229. Wiley, New York. Tecnicas (CONICET), Argentina, to J. Ntiez (PID 3-367 200/92).