Exact mass measurement of product ions for the structural confirmation and identification of unknown...
10
Exact Mass Measurement of Product Ions for the Structural Elucidation of Drug Metabolites with a Tandem Quadrupole Orthogonal- Acceleration Time-of-Flight Mass Spectrometer Ge ´rard Hopfgartner Department of Drug Metabolism and Kinetics, F. Hoffmann-La Roche Ltd., Basel, Switzerland Igor V. Chernushevich, Tom Covey, Jeffry B. Plomley, and Ron Bonner PE-Sciex, Concord, Ontario, Canada We herein report upon an approach whereby the interpretation of tandem mass spectrometry spectra can be both expedited and simplified via the accurate mass assignment of product ions utilizing a tandem quadrupole time-of-flight mass spectrometer (QqTOF). The applicability of the QqTOF in the drug metabolism laboratory is illustrated by the elucidation and differen- tiation of the dissociative pathways for Bosentan and its hydroxylated and demethylated metabolites. Target analyte fragmentation mechanisms were readily achieved by the measure- ment of product ions with a mass accuracy ,5 ppm, possible by single-point internal recalibration using the residual precursor ion as calibrant. Differentiation of both precursor and product ions from nominally isobaric matrix species derived from biological extracts is demonstrated by operation of the QqTOF at resolutions of ;8000 (m/Dm FWHM ). (J Am Soc Mass Spectrom 1999, 10, 1305–1314) © 1999 American Society for Mass Spectrometry M ass spectrometry with atmospheric pressure ionization, in particular electrospray ioniza- tion, has become an essential and recognized tool for both pharmacokinetic investigations and drug metabolism studies. Most often, collision induced dis- sociation (CID) techniques such as those offered by triple-stage quadrupole and quadrupole ion trap mass spectrometry are applied towards the characterization of drug biotransformation products [1–3]. However, difficulties may occur in the interpretation of CID spectra originating from three possible primary sources: (i) the structural rearrangement of fragment ions tran- spires in fashions not readily rationalized, (ii) compet- itive fragmentation occurs whereby a precursor ion experiences multiple decomposition pathways result- ing in spectra containing overlapping lineage, and (iii) the occurrence of isobaric parent ions of differing struc- ture results in overlapping, and therefore convoluted, product ion spectra. Mass spectrometric techniques offering multiple stages of mass spectrometry (i.e., MS n , where n . 2) are often used to facilitate CID spectral interpretation, be- cause they allow for the establishment of ion lineage. Ion traps allow selective precursor ion isolation for each stage of mass spectrometry, whereas triple-stage quad- rupoles employing CID in the atmosphere to vacuum transition region produce data containing information somewhat analogous to MS 3 , albeit with less selectivity. However, neither instrument currently has the capabil- ity to routinely assign, with high resolution, accurate product ion mass in order to establish elemental com- position. Until the advent of the hybrid quadrupole time-of- flight mass spectrometer [4, 5], or QqTOF, few instru- ments provided at a reasonable cost the capability of accurate product ion mass assignment. Because the mass accuracy of each of the triple-stage quadrupole, quadrupole ion trap, and magnetic sector is limited by the imposition of electric fields which vary during a mass scan, the inclusion of several internal reference ions is required in order to achieve mass accuracy in the low ppm (parts-per-million) range. As mass measure- ment with a time-of-flight analyzer is virtually simulta- neous, and because all ions are exposed to constant electric fields, mass calibration is linear over a broad dynamic range [6]. As a result, only two reference ions of known mass are required to calibrate a spectrum spanning several hundred Daltons [an advantage not Address reprint requests to Dr. Ge ´rard Hopfgartner, F. Hoffmann-La Roche Ltd., Department of Drug Metabolism and Kinetics, Pharmaceuticals Divi- sion, CH-4070 Basel, Switzerland. E-mail: [email protected] © 1999 American Society for Mass Spectrometry. Published by Elsevier Science Inc. Received March 30, 1999 1044-0305/99/$20.00 Revised July 1, 1999 PII S1044-0305(99)00097-5 Accepted July 5, 1999
-
Upload
independent -
Category
Documents
-
view
0 -
download
0
Transcript of Exact mass measurement of product ions for the structural confirmation and identification of unknown...
Exact Mass Measurement of Product Ions forthe Structural Elucidation of Drug Metaboliteswith a Tandem Quadrupole Orthogonal-Acceleration Time-of-Flight Mass Spectrometer
Gerard HopfgartnerDepartment of Drug Metabolism and Kinetics, F. Hoffmann-La Roche Ltd., Basel, Switzerland
Igor V. Chernushevich, Tom Covey, Jeffry B. Plomley, and Ron BonnerPE-Sciex, Concord, Ontario, Canada
We herein report upon an approach whereby the interpretation of tandem mass spectrometryspectra can be both expedited and simplified via the accurate mass assignment of product ionsutilizing a tandem quadrupole time-of-flight mass spectrometer (QqTOF). The applicability ofthe QqTOF in the drug metabolism laboratory is illustrated by the elucidation and differen-tiation of the dissociative pathways for Bosentan and its hydroxylated and demethylatedmetabolites. Target analyte fragmentation mechanisms were readily achieved by the measure-ment of product ions with a mass accuracy ,5 ppm, possible by single-point internalrecalibration using the residual precursor ion as calibrant. Differentiation of both precursorand product ions from nominally isobaric matrix species derived from biological extracts isdemonstrated by operation of the QqTOF at resolutions of ;8000 (m/DmFWHM). (J Am SocMass Spectrom 1999, 10, 1305–1314) © 1999 American Society for Mass Spectrometry
Mass spectrometry with atmospheric pressureionization, in particular electrospray ioniza-tion, has become an essential and recognized
tool for both pharmacokinetic investigations and drugmetabolism studies. Most often, collision induced dis-sociation (CID) techniques such as those offered bytriple-stage quadrupole and quadrupole ion trap massspectrometry are applied towards the characterizationof drug biotransformation products [1–3]. However,difficulties may occur in the interpretation of CIDspectra originating from three possible primary sources:(i) the structural rearrangement of fragment ions tran-spires in fashions not readily rationalized, (ii) compet-itive fragmentation occurs whereby a precursor ionexperiences multiple decomposition pathways result-ing in spectra containing overlapping lineage, and (iii)the occurrence of isobaric parent ions of differing struc-ture results in overlapping, and therefore convoluted,product ion spectra.
Mass spectrometric techniques offering multiplestages of mass spectrometry (i.e., MSn, where n . 2) areoften used to facilitate CID spectral interpretation, be-cause they allow for the establishment of ion lineage.Ion traps allow selective precursor ion isolation for each
stage of mass spectrometry, whereas triple-stage quad-rupoles employing CID in the atmosphere to vacuumtransition region produce data containing informationsomewhat analogous to MS3, albeit with less selectivity.However, neither instrument currently has the capabil-ity to routinely assign, with high resolution, accurateproduct ion mass in order to establish elemental com-position.
Until the advent of the hybrid quadrupole time-of-flight mass spectrometer [4, 5], or QqTOF, few instru-ments provided at a reasonable cost the capability ofaccurate product ion mass assignment. Because themass accuracy of each of the triple-stage quadrupole,quadrupole ion trap, and magnetic sector is limited bythe imposition of electric fields which vary during amass scan, the inclusion of several internal referenceions is required in order to achieve mass accuracy in thelow ppm (parts-per-million) range. As mass measure-ment with a time-of-flight analyzer is virtually simulta-neous, and because all ions are exposed to constantelectric fields, mass calibration is linear over a broaddynamic range [6]. As a result, only two reference ionsof known mass are required to calibrate a spectrumspanning several hundred Daltons [an advantage not
Address reprint requests to Dr. Gerard Hopfgartner, F. Hoffmann-La RocheLtd., Department of Drug Metabolism and Kinetics, Pharmaceuticals Divi-sion, CH-4070 Basel, Switzerland. E-mail: [email protected]
© 1999 American Society for Mass Spectrometry. Published by Elsevier Science Inc. Received March 30, 19991044-0305/99/$20.00 Revised July 1, 1999PII S1044-0305(99)00097-5 Accepted July 5, 1999

fully applicable to matrix-assisted laser desorption/ionization (MALDI) TOF instruments with delayedextraction and/or postsource decay]. Once the calibra-tion curve is established, only a single reference point isrequired to correct the slope of the line in order to adjustfor drift; slope correction is possible by utilizing theresidual precursor ion to calibrate an entire product ionspectrum. Product ion mass assignment with an accu-racy ,5 ppm is attainable when the precursor ion masscan be determined via calculation from its elementalcomposition. In the absence of precursor ion elementalcomposition information, precursor mass may be deter-mined in the full scan mode using added internalcalibrants; this measured mass may then be used for therecalibration of the product ion spectrum. However,associated with such independent measurements is thepropagation of error such that product ion mass accu-racy is diminished by a factor of ;=2. Regardless of thenature by which precursor ion mass is determined, thenecessity exists for the requirement of an internal ref-erence ion to compensate for long term mass calibrationdrift as a consequence of temperature fluctuationswhich can cause changes in flight tube length andapplied voltage. Occasional external recalibration (dai-ly) is sufficient to maintain mass accuracy within 30ppm.
High resolution helps to improve the mass accuracyby increasing the assurance that the mass of the ion tobe measured is not skewed by an underlying interfer-ence. TOF instruments with orthogonal extraction op-tics designed to accommodate continuous flow ionsources are demonstrating routine resolution capabili-ties in the 5000–10,000 (m/DmFWHM) range [4, 5, 7, 8], asignificant improvement over quadrupoles and iontraps that typically operate at a resolution of ;3 3mass [9]; notably, both sector and ion cyclotron reso-nance (ICR) configurations are superior to the currentcommercially available TOF instruments in this regard.The answer to the commonly posed question: “Howmuch resolution is sufficient to offer reasonable assur-ance of accurate mass measurement?” remains unan-swered because it is highly dependent upon chemicalbackground and target mass, both of which are vari-ables [13]. However, it may be demonstrated that aresolution in excess of 100,000 would be required whenworking in the 100–500 Da range in order to resolveinterferences from target analytes differing by 61 mDa(m/DmFWHM 5 100/0.001). In the MS/MS mode, virtu-ally all chemical interference is removed from theproduct ion spectrum with the exception of the masswindow transmitted around the precursor ion. Sincethe product ion spectrum is calibrated from the precur-sor ion, error propagation may occur unless the precur-sor ion is free of chemical interference.
A key goal in the current research effort was toexplore the utility of operation in the intermediateresolution range (i.e., 5000–10,000) for accurate massmeasurement of target analytes in sample matriceswhich typify those conditions under which drug me-
tabolite structure identification is performed. As ameans of illustrating the efficacy with which accurateproduct ion mass measurements may be utilized indrug metabolism studies, the structural features of keyproduct ions derived from the dissociation of the endo-thelin receptor antagonist Bosentan (Ro 47-0203) andassociated metabolites (Figure 1) were studied by directinfusion of plasma and bile extracts into an electrosprayionization source. In a previous study, a laborious andextensive investigation was required to elucidate thefragment ion structures of Bosentan using deuteriumexchange reactions, pseudo-MS3 studies, and exactmass determinations from a sector instrument [10]. Inthe study reported here, we demonstrate the degree towhich finding solutions to such structural problems canbe accelerated and rationalized by employing the highresolution and accurate mass measurement capabilitiesof the QqTOF.
Experimental
Materials and Reagents
Mass calibration standards CsI and the peptideALILTLVS were obtained from commercial sources(Sigma Chemical, St. Louis, MO), whereas Bosentan andall associated metabolites were prepared in-house.HPLC grade reagents were used for all biological ex-tractions and to prepare standard solutions. Mass cali-brants were dissolved in 1:1 (v/v) methanol/watercontaining 1% acetic acid, whereas Bosentan and me-tabolite standards were prepared in 1:1 (v/v) acetoni-trile/water containing 0.1% formic acid.
Sample Preparation
Following the oral administration of Bosentan, 500 mLaliquots each of plasma and bile were collected and themetabolites of Bosentan extracted with 2500 mL 4:1chloroform:isopropanol. The extracts were reconsti-tuted with 200 mL of 70:30 H2O:CH3CN (5 mMNH4OAc), diluted 103 with 50:50 CH3CN:H2O (0.1%HCO2H), and directly infused into the ion source of theQqTOF. The infused concentration range of the com-bined parent drug and metabolic products was 15–300pg/mL and 50–950 ng/mL, for plasma and bile extracts,respectively. Standard solutions were introduced at aconcentration of 1 ng/mL.
Mass Spectrometry
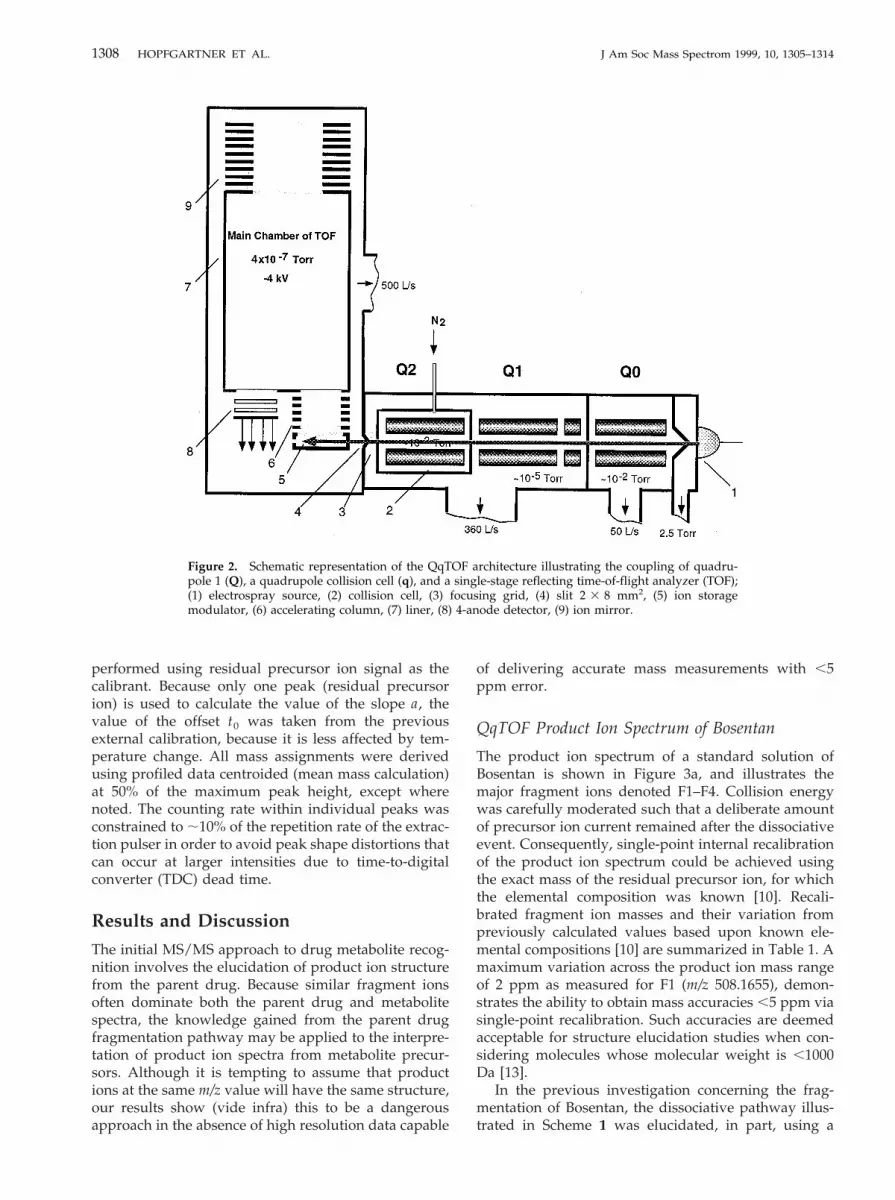
The QqTOF instrument used in the current investiga-tion was a prototype constructed from a PE-Sciex API365 triple-stage quadrupole platform with an orthogo-nally oriented TOF mass analyzer substituted for Q3(Figure 2). Details of the QqTOF architecture have beenpresented elsewhere [5], and so herein are only brieflydescribed. The pre-TOF ion path consists of three quad-rupoles: Q0, Q1, and Q2. Q0 and Q2 function as rf-only
1306 HOPFGARTNER ET AL. J Am Soc Mass Spectrom 1999, 10, 1305–1314

quadrupoles and thus serve as ion guides. When theQqTOF is operated in a full scan mode, Q1 also acts asan rf-only bandpass filter with the optimal rf voltagedependent upon the specified mass range. When a massrange greater than a factor of 10 was required, the rfvoltage was modulated (stepped between two or morerf levels) and each transmission window received anequivalent amount of dwell time. Tandem mass spec-trometric measurements were achieved by operatingQ1 in a resolving mode with 1 and 3 Da transmissionwindows for standard solutions and biological extracts,respectively. Argon collision gas was present in thecollision cell (2) for both full scan and product ionmeasurements. In the former, collision energy (in thelaboratory frame) was ,11 eV in order to minimizefragmentation, whereas all product ion spectra wereacquired using a collision energy of 30 eV. The presenceof collision gas in both full scan and MS/MS modes wasrequired in order to collisionally cool (thermalize) ionssuch that both spatial and kinetic energy distributionswere minimized, thereby improving ion transmissionefficiency and peak resolution [11, 12].
Ions exiting Q2 are re-accelerated to ;9 eV/charge.They are then focused through a slit (4) by a grid (3) intothe ion storage modulator (5). At the beginning of theinjection cycle, the TOF storage modulator is initiallyfield-free. After an ensemble of ions fills the storageregion, they are injected orthogonally to the acceleratorcolumn (6) via the application of a pulsed electric fieldin the ion storage modulator (5). In the current study, a
pulse frequency of 10 kHz was utilized for which theeffective upper m/z limit was 1000 Da. Ions exit theaccelerating column in the direction of a single-stageion mirror (9) with ;4 keV kinetic energy per charge,traversing a 2.5 m effective flight path before impingingupon a four-anode detector (8) with two microchannelplates (Galileo, MA) in a chevron configuration. A fourchannel time-to-digital converter (IonWerks, TX) with atime resolution of 625 ps was used to register all ions[14]. The pressure in the main TOF chamber wasmaintained at ;3 3 1027 torr using a Varian V 550macro torr turbomolecular pump.
Sample introduction was by continuous infusion at0.5 mL/min into an electrospray source (1) held at apotential of ;5 kV. Spectra were accumulated for ;20 son standards, but increased to a few minutes on biolog-ical extracts which produced weaker precursor ionsignals. Initially, a two point external calibration wasperformed in order to convert from linear time to linearmass. External calibrant ions were derived from amixture of 2 3 1026 M CsI (m/z 132.9054) and 2 3 1025
M of the octapeptide ALILTLVS (m/z 829.5398). Twopoint quadratic external calibration
Îm/z 5 a~t 2 t0! (1)
was performed by calculating the slope a and the offsett0 (eq 1) using the above two calibrant masses. Single-point internal recalibration of product ion spectra was
Figure 1. Structure of Bosentan (1) (C27H29N5O6S, [M 1 H]1 552.1917) and metabolites formed byoxidation (2) (C27H29N5O7S, [M 1 H]1 568.1866), demethylation (3) (C26H27N5O6S, [M 1 H]1
538.1760), and demethylation–oxidation (4) (C26H27N5O7S, [M 1 H]1 554.1709).
1307J Am Soc Mass Spectrom 1999, 10, 1305–1314 PRODUCT ION EXACT MASS MEASUREMENT BY Qq-TOF
performed using residual precursor ion signal as thecalibrant. Because only one peak (residual precursorion) is used to calculate the value of the slope a, thevalue of the offset t0 was taken from the previousexternal calibration, because it is less affected by tem-perature change. All mass assignments were derivedusing profiled data centroided (mean mass calculation)at 50% of the maximum peak height, except wherenoted. The counting rate within individual peaks wasconstrained to ;10% of the repetition rate of the extrac-tion pulser in order to avoid peak shape distortions thatcan occur at larger intensities due to time-to-digitalconverter (TDC) dead time.
Results and Discussion
The initial MS/MS approach to drug metabolite recog-nition involves the elucidation of product ion structurefrom the parent drug. Because similar fragment ionsoften dominate both the parent drug and metabolitespectra, the knowledge gained from the parent drugfragmentation pathway may be applied to the interpre-tation of product ion spectra from metabolite precur-sors. Although it is tempting to assume that productions at the same m/z value will have the same structure,our results show (vide infra) this to be a dangerousapproach in the absence of high resolution data capable
of delivering accurate mass measurements with ,5ppm error.
QqTOF Product Ion Spectrum of Bosentan
The product ion spectrum of a standard solution ofBosentan is shown in Figure 3a, and illustrates themajor fragment ions denoted F1–F4. Collision energywas carefully moderated such that a deliberate amountof precursor ion current remained after the dissociativeevent. Consequently, single-point internal recalibrationof the product ion spectrum could be achieved usingthe exact mass of the residual precursor ion, for whichthe elemental composition was known [10]. Recali-brated fragment ion masses and their variation frompreviously calculated values based upon known ele-mental compositions [10] are summarized in Table 1. Amaximum variation across the product ion mass rangeof 2 ppm as measured for F1 (m/z 508.1655), demon-strates the ability to obtain mass accuracies ,5 ppm viasingle-point recalibration. Such accuracies are deemedacceptable for structure elucidation studies when con-sidering molecules whose molecular weight is ,1000Da [13].
In the previous investigation concerning the frag-mentation of Bosentan, the dissociative pathway illus-trated in Scheme 1 was elucidated, in part, using a
Figure 2. Schematic representation of the QqTOF architecture illustrating the coupling of quadru-pole 1 (Q), a quadrupole collision cell (q), and a single-stage reflecting time-of-flight analyzer (TOF);(1) electrospray source, (2) collision cell, (3) focusing grid, (4) slit 2 3 8 mm2, (5) ion storagemodulator, (6) accelerating column, (7) liner, (8) 4-anode detector, (9) ion mirror.
1308 HOPFGARTNER ET AL. J Am Soc Mass Spectrom 1999, 10, 1305–1314

combination of orifice–skimmer CID and selective CID.From these studies it was concluded that F4 (m/z 202)and F3 (m/z 280) were generated from the same precur-sor ion at m/z 311 (F2). However, subsequent fragmen-tation of F3 failed to produce m/z 202. Thus, it wasconcluded that the formation of F4 was not due to theconsecutive decomposition of F23 F33 F4, but ratherwas a competitive pathway preferred over the forma-tion of F3 from F2 (based upon the relative abundanceratio of F3:F4). In the current study, the same conclusioncould be reached more readily and assuredly by utiliz-ing the accurate mass capabilities of the QqTOF.
To appreciate the significance of accurate production mass assignment in structure and fragmentationelucidation studies, it is important to recognize that
when alternative fragmentation pathways occur, lead-ing to structures of the same mass but different elemen-tal composition, the assignment of fragment ion struc-ture may be ambiguous at nominal mass resolution. Forexample, two fragmentation pathways in Scheme 1 arepostulated to rationalize a structure for the ion ofnominal m/z 202. The two elemental compositionsC10H8N3O2 (m/z 202.0617) and C9H8N5O (m/z 202.0729)have a calculated mass difference of 11.2 mDa (;55ppm). The measured m/z of F4 (after recalibration) was202.0725 Da, which clearly allows for the differentiationof the two fragmentation pathways (and structures)proposed in Scheme 1. Thus, in one simple experiment,the current QqTOF results corroborate the pseudo-MS3
results obtained in the previous investigation. Notably,the successful elucidation of the structure of F4 isfacilitated by an a priori knowledge of the elemental
Figure 3. Product ion spectra of (a) Bosentan (1, [M 1 H]1
552.1917), (b) hydroxy metabolite (2, [M 1 H]1 568.1866), (c)phenol metabolite (3, [M 1 H]1 538.1760), and (d) hydroxyphenolmetabolite (4, [M 1 H]1 554.1709) after single-point internal reca-libration with residual precursor ion calibrant.
Table 1. Mass accuracy measurements of Bosentan fragment ions after internal recalibration with residual precursor ion
Fragment Formula Exact mass Measured mass Mass error (mDa)
F1 C25H26N5O5S 508.1655 508.1663 0.8F2 C15H13N5O3 311.1018 311.1018 0.0F3 C14H10N5O2 280.0835 280.0835 0.0F4 C9H8N5O 202.0729 202.0725 0.4
Scheme 1. Proposed fragmentation pathway of Bosentan (1).
1309J Am Soc Mass Spectrom 1999, 10, 1305–1314 PRODUCT ION EXACT MASS MEASUREMENT BY Qq-TOF

composition of the precursor ion, which may be used tolimit, considerably, the elements from which F4 (or anyof the fragment ions) may be composed. Furthermore,the number of possible elemental compositions for agiven fragment ion is reduced as the mass accuracywith which the fragment is measured improves. Forexample, given a precursor ion elemental compositionof C27H29N5SO5, only one possible elemental composi-tion is obtained for fragment ion F4 (C9H8N5O) with aspecified mass accuracy of 5 ppm. When the massaccuracy for the measurement of F4 is relaxed to 10ppm, three elemental compositions may be derived:C8H12NO5, C9H8N5O, and C11H10N2O2. Clearly, a massaccuracy ,5 ppm is required in order to obtain only oneelemental composition proposal. Such product ion massaccuracy measurements are only possible by utilizingan internal calibrant, in this instance the exact mass ofresidual precursor ion.
Given both the F4 composition (C9H8N5O) and theknown parent ion structure, it is possible to corroboratethe structure for the F4 fragment with previously re-ported results which utilized chemical analogs and D2Oexchange [10]. The initial fragmentation study con-cluded that the F4 fragment ion must contain rings Aand B and the methyl group of ring C, but not theremainder of ring C where the difference between m/z311 and m/z 202 corresponded to the loss of a catecholradical. In order to justify this fragmentation, it wasassumed that initially a radical rearrangement of themethyl group to the spatially close 5-position of ring Boccurs, creating a distonic ion. In the next step, ahydrogen atom was rearranged from the methyl groupback to the phenoxy radical formed in the previousstep. Radical cleavage of the bond between ring B andthe oxygen atom of the catechol completed this frag-mentation step, yielding an even-electron ion and acatechol radical. The resulting postulated structure hada theoretical m/z of 202.0729, and appeared to be an ionwith reasonable stability, albeit with aromaticity lost inring B. Thus the current QqTOF product ion measure-ment of F4 (m/z 202.0725) supports the initially postu-lated fragmentation mechanism.
Product Ion Spectra of Bosentan Metabolites
The major metabolites of Bosentan (Figure 1) areformed primarily via oxidation (2), demethylation (3),and a combination of oxidation–demethylation (4). Theproduct ion spectra of these three major metaboliteswere characterized by a common nominal product ionat m/z 280 (Figure 3b–d). Close inspection of the exactmass assignment of the m/z 280 fragment ion (afterinternal single-point recalibration with the relevantprecursor ion) revealed a mass difference of some 20mDa between the demethylated metabolites (Figure 3c,d) and the nondemethylated (oxidized) metabolite (Fig-ure 3b). The product ion spectrum of Bosentan itself(Figure 3a) contains a fragment ion at m/z 280.0835,
differing in measured mass from the oxidized analog (4)by only 0.5 mDa.
The accurate mass assignment of the m/z 280 frag-ment ion observed in each product ion spectrum of(2)–(4) suggests that a significant difference exists be-tween the dissociation pathways of the demethylatedand nondemethylated metabolites. Postulated fragmen-tation pathways for both nondemethylated (2) anddemethylated (3) metabolites are outlined in Scheme 2a,b, respectively, and are based upon a number of obser-vations with respect to the detected metabolite productions in Figure 3b–d and the elucidated fragmentationpathway for Bosentan (Scheme 1). To explain, thenondemethylated metabolite (2) product ion spectrum(Figure 3b) shares fragments similar in mass to thoseobserved for Bosentan (also a nondemethylated precur-sor), namely fragments F2 (0), F3 (0.5), and F4 (0.1); notethat the number in parentheses refers to the differencein measured mass (in mDa) between the commonfragment ions of Bosentan and metabolite (2). Thus, thefragmentation pathway of the nondemethylated metab-olite (2) appeared to parallel that of Bosentan.
The product ion spectra of the demethylated metab-olites (Figure 3c, d) notably differed from the spectra ofBosentan and nondemethylated metabolite (2) by thepresence of an ion at m/z 297.0852. This species is theproposed demethylated analog of F2, denoted F2A inScheme 2b. Based upon the postulated structure forF2A, a theoretical m/z of 297.0862 may be calculated, a
Scheme 2. Fragmentation pathways for (a) demethylated, and(b) nondemethylated metabolites of Bosentan as represented by (2)and (3), respectively.
1310 HOPFGARTNER ET AL. J Am Soc Mass Spectrom 1999, 10, 1305–1314

difference of only 1.0 mDa (3.4 ppm) from measuredm/z values in Figure 3c, d. Agreement between thetheoretical and measured masses substantiates thestructure proposed for F2A. Further decomposition ofF2A via the loss of NH3 is expected to furnish theoxygen-containing analog of F3, F3A (theoretical m/z280.0596). The measured m/z ratios of 280.0628 and280.0633 for metabolites (3) and (4), respectively, sup-port the fragmentation pathway for the demethylatedmetabolites given in Scheme 2b. However, mass errorsof 3.2 mDa (3) and 3.7 mDa (4) for these measurementsare significantly larger than in all other cases; suchdiscrepancy is detailed in the section to follow.
The above example demonstrates that the inclinationto extrapolate the parent drug dissociative pathway toall metabolites is circumvented by the ability to assignproduct ion mass with a high degree of accuracy. In theabsence of accurate product ion mass assignment, thestructural differentiation of F3 from F3A would beimpossible, leading to the assumption that both F2 andF2A intermediates surreptitiously decompose to fur-nish the identical product ion, F3.
Accurate Mass Measurements from BiologicalExtracts
A primary objective of the current investigation was toevaluate the degree with which interferences frombiological matrices could affect product ion mass accu-racy. Consequently, crude extracts of plasma weredirectly infused, rather than chromatographed, in anattempt to maximize the probability of either a precur-sor or product ion interference. Significant suppressionof the molecular ion signal was anticipated, and ob-served, with this type of sample introduction. Despitepoor ion statistics however, sufficient signal was stillobtained for accurate mass measurements by accumu-lating spectra for periods of up to 120 s with a Q1bandpass of ;3 Da.
Although matrix ions were often detected within0.15 Da of selected precursor ions, TOF resolution(;8000 m/DmFWHM) was such that unfragmented targetparent ions were adequately differentiated from matrixinterferences, and thus could be used with a highdegree of confidence as internal calibrants. Becauseproduct ion mass accuracy results obtained from me-tabolite biological extracts matched the previous stan-dard solution results, effects of product ion interfer-ences were eliminated.
The product ion spectrum of Bosentan derived fromplasma extract is illustrated in Figure 4a, b, and clearlydemonstrates that the resolution of the TOF instrumentwas sufficient to resolve the monoisotopic peak ofBosentan (m/z 552.1916) from the ion at m/z 552.363, thelatter originating from plasma matrix. In order to de-termine the reproducibility of TOF mass accuracy mea-surements, 20 samples of Bosentan and its metaboliteswere run over an 8 h period. Of the 20 samples
analyzed, 12 were standards, 4 were plasma extracts,and 4 were bile extracts. After pooling all data, themaximum mass error observed (after single-point reca-libration) for fragments F2, F3, and F4 was 3.4 ppm,well within acceptable tolerances for elemental compo-sition determination.
Caveats of Product Ion Exact Mass Measurement
For small molecule structure elucidation (,1000 Da), ameasured mass within 5 ppm of the theoretical mass isgenerally accepted as adequate to confirm analyte com-position [13]. However, circumstances may arise whenthe accuracy of exact mass measurement may be com-promised. These involve occurrences of overlappingspectral peaks which may result in peak shape distor-tions such as splitting or peak skew (i.e., peak asymme-try). Large deviations between measured mass andtheoretical mass may occur when either the precursorion or product ion has an unresolved interference.
Precursor ion contamination. If a selected precursor ionhas an unresolved interference, then accurate massassignment of the target analyte will be compromisedby an amount dictated largely by the mass of theanalyte and the relative abundance of the interference;
Figure 4. Product ion spectra of Bosentan resulting from directinfusion of crude plasma extract measured over a mass range of(a) m/z 50–650 and (b) m/z 551–555.
1311J Am Soc Mass Spectrom 1999, 10, 1305–1314 PRODUCT ION EXACT MASS MEASUREMENT BY Qq-TOF

the sign of the mass shift (6) depends on whether themass of the interference is greater than or less than theanalyte. An unresolved precursor ion can be detrimen-tal if implemented as a calibrant for its own product ionspectrum, since the entire mass scale may be altered. Inone instance, when plasma and bile extracts wereinfused directly into the mass spectrometer, mass cali-bration errors of this type were noted. Such a spectrumfrom which mass calibration errors were derived isrepresented in Figure 5 by a bile extract containing theparent drug and the three target metabolites. All massesmeasured in this spectrum are within 3 ppm fromtheoretically predicted values, except for metabolite (4)(m/ztheor 5 554.1709) which gave a mass error of 8 ppm;such an error may be attributed to the fact that the13C2-isotopic peak of Bosentan (m/ztheor 5 554.1984) isnominally isobaric with the monoisotopic peak of me-tabolite (4). Notably, the response for Bosentan is abouttwice that of metabolite (4) (see Figure 5 inset). Thus the13C2-isotope contribution from Bosentan is expectedlysignificant enough to account for the poor mass accu-racy associated with the measurement of the monoiso-topic peak of metabolite (4), thus making the latterprecursor ion unsuitable for recalibration of the corre-sponding MS/MS spectrum. Appropriately, externalcalibration (performed immediately before the MS/MSexperiment) was used for fragment ion mass assign-ment in the case of metabolite (4).
In many other measurements ions close in exactmass to the precursor ions of interest were present, butwere sufficiently resolved by the TOF analyzer so as notto cause a calibration shift.
Product ion contamination. Product ion exact mass mea-surements may be compromised by the presence ofinterfering fragment ions resulting from (a) competitive
fragmentation pathways or (b) the simultaneous frag-mentation of isobaric precursor ions. Both situationswere observed in the current investigation.
(a) Competitive fragmentation: As previously noted,m/z ratios of 280.0628 and 280.0633 were obtained formetabolites (3) and (4), respectively, with mass errors of3.2 mDa (3) and 3.7 mDa (4) with respect to thetheoretically predicted mass of 280.0596 for fragmentF3A. These “above average” errors support the compet-itive fragmentation pathway for the demethylated me-tabolites given in Scheme 2b. To explain, the mecha-nism for the dissociation of the demethylatedmetabolites may be derived from the fact that thephenol on ring C is a good nucleophile, and thusrepresents a driving force for the formation of fragmentF3A via an intramolecular aryl nucleophilic substitutionwith elimination of NH3. The competitive fragmenta-tion pathway leading to the production of F3 from F2Avia the loss of a hydroxyl radical is also suspected tooccur, and may be rationalized from the observed massaccuracy of ;12 ppm for the measurement of F3A. Thatis, an error of ;12 ppm between the theoretical mass ofF3A and the measured m/z ratios of 280.0628 and280.0633 for metabolites (3) and (4), respectively, is dueto the competitive fragmentation of F2A 3 F3. Al-though the abundance of F3 relative to F3A was notpossible to ascertain, an error of ;3 mDa in the mea-surement of F3A suggests only a small contributionfrom F3. Comparison of the peak shapes of fragments atm/z 280 for Bosentan (Figure 6a) and for demethylatedmetabolite (3) (Figure 6b) revealed clear differences inpeak width and tailing which confirm the above expla-nation. In the case of Bosentan and the metaboliteswhich are not demethylated in ring C, no nucleophilicsubstitution is possible and fragment F3 is formed byloss of the methoxy radical.
(b) Fragmentation of isobaric precursors: In general,product ion mass measurements may be compromisedby the presence of interfering precursor ions transmit-ted by Q1, if dissociation of the interfering precursoraffords a product ion spectrum where some speciesoverlap with those of the analyte. Because Q1 can neverpractically transmit a precursor ion at the same resolu-tion that the TOF analyzer is capable of measuring it,multiple precursor ions may be passed to the collisioncell, thereby decreasing the selectivity of the MS/MStechnique. Such losses in precursor ion selectivity areonly compounded when a diminution in Q1 resolutionis necessary in order to either enhance sensitivity, ortransmit an isotopic cluster for qualitative purposes.Despite the shortcomings of limited Q1 selectivity,desired and undesired precursor ions are likely to beresolved via the TOF analyzer, thereby alerting theanalyst that the product ion spectrum may be com-posed of species from a number of different precursorions. Note that the presence of multiple precursor ionsfor a given Q1 bandpass may be ascertained by operat-ing in an MS/MS mode, but with a collision energywhich minimizes dissociation.
Figure 5. Crude bile extract containing Bosentan (m/z 552.1907),hydroxy metabolite (m/z 568.1864), phenol metabolite (m/z538.1770), and hydroxyphenol metabolite (m/z 554.1754). The insetdemonstrates a response for Bosentan approximately twice that ofthe hydroxyphenol metabolite (4).
1312 HOPFGARTNER ET AL. J Am Soc Mass Spectrom 1999, 10, 1305–1314

The extent of the deleterious effect of mass measure-ment error due to overlapping product ions from dif-ferent but isobaric precursor ions was noted in thecurrent investigation when both Bosentan ([M 1 H]1
m/z 552) and metabolite (4) ([M 1 H]1 m/z 554) wereboth present in a biological extract, a situation similar tothat described previously. To explain, the 13C2-isotopicpeak of Bosentan is nominally isobaric with the mo-noisotopic molecular ion of the demethylated metabo-lite (4). As a result, both compounds were transmittedthrough Q1 (bandpass ;3 Da) when either nominalmonoisotopic mass was selected as a precursor ion.Thus, although the product ion spectra from the puresolutions of Bosentan and metabolite (4) were more orless differentiated by structures F3 (m/z 280.0835) andF3A (m/z 280.0633) in Figure 6a, b, respectively, suchdifferentiation in samples containing both precursorswas convoluted. In fact, for the simultaneous dissocia-tion of 13C2-Bosentan with metabolite (4), the observedmean m/z of “F3” was 280.0684 Da, an error of 15 mDafrom the theoretical mass of F3, and 8.8 mDa from theexact mass of F3A. The fact that “F3” in this scenariowas composed of two ions is revealed by the distortionof the peak as a doublet (Figure 6c). Appropriate
centroiding of each partially resolved peak using thetop 10% of each profile revealed m/z assignments of280.0647 and 280.0830 Da, data which corroborates thetheoretical m/z of F3A and F3, respectively. Clearly,Figure 6c demonstrates the current TOF capabilities forresolving two product ions of equal intensity, separatedin mass by only 23 mDa.
Conclusions
The unique architecture of the QqTOF tandem instru-ment allowed for the mass measurement of productions with an accuracy better than 5 ppm when utilizingresidual precursor ion as a single-point internal cali-brant. The efficacy with which such mass accuracy maybe applied in the drug metabolism laboratory wasillustrated by the deconvolution of fragmentation path-ways for both Bosentan and its associated metabolites;notably, product ion genealogy was established ininstances where low resolution MSn furnished ambigu-ous results. Accurate mass measurements of the F2fragment ion from Bosentan corroborated previous re-sults, albeit in an expedited and less laborious fashion.Differentiation in the dissociation cascade between de-methylated and nondemethylated metabolites was pos-sible based upon accurate mass measurements whichsupported the postulated structures for the methylatedproduct ion analogs of Bosentan (i.e., F2A and F3A).Clearly, accurate mass assignment at high resolutionallows routine product ion elemental composition andprovides unique opportunities for the automated com-puter assisted interpretation of CID spectra of drugbiotransformation products.
Accurate product ion mass assignments were possi-ble from crude plasma or bile extracts, provided theprecursor ion was free of isobaric interferences (orinterferences were resolvable). As these extracts wereintroduced via direct infusion, high throughput, exactmass measurements were feasible, provided sufficientTOF resolution was available to detect any peak shapedistortion.
References1. Gelpi, E. J. Chromatogr. 1995, 32, 59.2. Yu, X.; Cui, D.; Davis, M. R. J. Am. Soc. Mass Spectrom. 1999, 10,
175.3. Fernandez-Metzler, C. L.; Owens, K. G.; Baillie, T. A.; King,
R. C. Drug Metab. Dispo. 1999, 27, 32.4. Morris, H. R.; Paxton, T.; Dell A.; Langhorne, J.; Berg, M.;
Bordoli, R. S., Hoyes, J.; Bareman, R. H. Rapid Commun. MassSpectrom. 1996, 10, 889.
5. Shevchenko, A.; Chernushevich, I.; Ens, W.; Standing, K. G.;Thompson, B.; Wilm, M.; Mann, M. Rapid Commun. MassSpectrom. 1997, 11, 1015.
6. Cotter, R. J. Time-of-Flight Mass Spectrometry: Instrumentationand Applications in Biological Research; ACS Professional Refer-ence Books: Washington, DC, 1997.
Figure 6. Expansion of the product ion spectrum at m/z 280derived from the precursor of (a) pure Bosentan (1), (b) puredemethylated metabolite (3), and (c) m/z 554 present in dog bile.
1313J Am Soc Mass Spectrom 1999, 10, 1305–1314 PRODUCT ION EXACT MASS MEASUREMENT BY Qq-TOF

7. Verentchikov, A. N.; Ens, W.; Standing, K. G. Anal. Chem. 1994,66, 126.
8. Chernushevich, I. V.; Ens, W.; Standing, K. G. In ElectrosprayIonization Mass Spectrometry; Cole, R. B., Ed.; Wiley–Inter-science: New York, 1997.
9. March, R. E. Int. J. Mass Spectrom. Ion Processes 1992, 118/119, 71.10. Hopfgartner, G.; Vetter, W.; Meister, W.; Ramuz, H. J. Mass
Spectrom. 1996, 31, 69.
11. Thomson, B. A.; Douglas, D. J.; Corr, J. J.; Hager, J. W.; Jolliffe,C. L. Anal. Chem. 1995, 67, 1696.
12. Krutchinsky, A. N.; Chernushevich, I. V.; Spicer, V. L.; Ens, W.;Standing, K. G. J. Am. Soc. Mass Spectrom. 1998, 9, 569.
13. Blom, K. F. J. Am. Soc. Mass Spectrom. 1998, 9, 789.14. Barbacci, D. C.; Russell, D. H.; Schultz, J. A.; Holocek, J.;
Ulrich, S.; Burton, W.; Stipdonk, M. Van J. Am. Soc. MassSpectrom. 1998, 9, 1328.
1314 HOPFGARTNER ET AL. J Am Soc Mass Spectrom 1999, 10, 1305–1314