
A synchrotron x-ray liquid surface spectrometer
13
A synchrotron x-ray liquid surface spectrometer Mark L. Schlossman a) Department of Physics and Department of Chemistry, University of Illinois at Chicago, 845 West Taylor Street, Chicago, Illinois 60607 Dennis Synal, Yongmin Guan, Mati Meron, and Grace Shea-McCarthy Center for Advanced Radiation Sources, University of Chicago, 5640 South Ellis Avenue, Chicago, Illinois 60637 Zhengqing Huang Center for Advanced Radiation Sources and James Franck Institute and Department of Chemistry, University of Chicago, 5640 South Ellis Avenue, Chicago, Illinois 60637 Anibal Acero James Franck Institute and Department of Chemistry, University of Chicago, 5640 South Ellis Avenue, Chicago, Illinois 60637 Scott M. Williams Department of Physics and Department of Chemistry, University of Illinois at Chicago, 845 West Taylor Street, Chicago, Illinois 60607 Stuart A. Rice James Franck Institute and Department of Chemistry, University of Chicago, 5640 South Ellis Avenue, Chicago, Illinois 60637 P. James Viccaro Center for Advanced Radiation Sources, University of Chicago, 5640 South Ellis Avenue, Chicago, Illinois 60637 ~Received 6 March 1997; accepted for publication 29 August 1997! The design of a synchrotron x-ray liquid surface spectrometer at beamline X19C at the National Synchrotron Light Source is described. This spectrometer is capable of performing the full range of x-ray surface scattering techniques. A few examples of measurements made using this spectrometer are presented, including studies of organic monolayers on the surface of water and of the structure of strongly fluctuating oil–microemulsion interfaces. The measurements discussed illustrate the accuracy, resolution, and capabilities of the spectrometer. © 1997 American Institute of Physics. @S0034-6748~97!00312-2# I. INTRODUCTION Liquid surfaces and interfaces are of scientific interest because of their use in probing and testing ideas of structure and phase behavior at interfaces and in inhomogeneous me- dia. They are of technological importance because of the many physical, chemical, and biological processes that occur at interfaces. Although studied for many years, fundamental questions remain concerning both the longitudinal ~out-of- plane! and transverse ~in-plane! structure of the interface. Recently, experimental techniques such as surface sensitive x-ray and neutron scattering 1–14 and nonlinear optical methods 15,16 have allowed these interfaces to be probed on the molecular length scale. In this article, we describe a syn- chrotron x-ray liquid surface spectrometer recently installed at beamline X19C at the National Synchrotron Light Source at Brookhaven National Laboratory ~NSLS! and mention a few recent results from this device. The X19C liquid surface spectrometer is capable of mea- suring x-ray reflection, grazing-incidence diffraction and fluorescence, surface diffuse scattering, and anomalous re- flection. It has the following features: ~a! the capacity to use large and heavy sample chambers; ~b! a sturdy design that allows for precise ~and accurate! specification of the Q vec- tor as well as enhanced sample stability ~important for liquid samples!; ~c! simple optics, a single-crystal monochromator or multilayer, to monochromate and steer the beam; and ~d! straightforward tuning of the x-ray wavelength ~from 6 to 17 keV! that allows for measurement of differential anomalous reflectivity and fluorescence, and grazing incidence anoma- lous x-ray scattering. To date, the experimental techniques exploited using the X19C spectrometer have included x-ray reflectivity, surface diffuse scattering, grazing-incidence diffraction, and reflec- tion standing-wave fluorescence. These have been used to study surfactant monolayers on the water surface, 17,18 liquid metal surfaces, 19 liquid–liquid interfaces in microemulsions, 20,21 and gold colloids in polymer thin films. 22 High-resolution coherent scattering has been used to study the propagation and scattering of partially coherent x-ray beams from surfaces of patterned optics. 23 II. SURFACE X-RAY SCATTERING TECHNIQUES AND KINEMATICS Surface x-ray scattering has been reviewed numerous times. 24–29 Here, we mention a few aspects necessary to un- derstand the design of a liquid surface spectrometer. The a! Electronic mail: [email protected] 4372 Rev. Sci. Instrum. 68 „12…, December 1997 0034-6748/97/68„12…/4372/13/$10.00 © 1997 American Institute of Physics
Transcript of A synchrotron x-ray liquid surface spectrometer

A synchrotron x-ray liquid surface spectrometerMark L. Schlossmana)
Department of Physics and Department of Chemistry, University of Illinois at Chicago,845 West Taylor Street, Chicago, Illinois 60607
Dennis Synal, Yongmin Guan, Mati Meron, and Grace Shea-McCarthyCenter for Advanced Radiation Sources, University of Chicago, 5640 South Ellis Avenue, Chicago,Illinois 60637
Zhengqing HuangCenter for Advanced Radiation Sources and James Franck Institute and Department of Chemistry,University of Chicago, 5640 South Ellis Avenue, Chicago, Illinois 60637
Anibal AceroJames Franck Institute and Department of Chemistry, University of Chicago, 5640 South Ellis Avenue,Chicago, Illinois 60637
Scott M. WilliamsDepartment of Physics and Department of Chemistry, University of Illinois at Chicago,845 West Taylor Street, Chicago, Illinois 60607
Stuart A. RiceJames Franck Institute and Department of Chemistry, University of Chicago, 5640 South Ellis Avenue,Chicago, Illinois 60637
P. James ViccaroCenter for Advanced Radiation Sources, University of Chicago, 5640 South Ellis Avenue, Chicago,Illinois 60637
~Received 6 March 1997; accepted for publication 29 August 1997!
The design of a synchrotron x-ray liquid surface spectrometer at beamline X19C at the NationalSynchrotron Light Source is described. This spectrometer is capable of performing the full range ofx-ray surface scattering techniques. A few examples of measurements made using this spectrometerare presented, including studies of organic monolayers on the surface of water and of the structureof strongly fluctuating oil–microemulsion interfaces. The measurements discussed illustrate theaccuracy, resolution, and capabilities of the spectrometer. ©1997 American Institute of Physics.@S0034-6748~97!00312-2#
estumth
ccnt
.it
loylerc
eand
t
or
usma-
thecec-d to
d toent
ousun-The
I. INTRODUCTION
Liquid surfaces and interfaces are of scientific interbecause of their use in probing and testing ideas of strucand phase behavior at interfaces and in inhomogeneousdia. They are of technological importance because ofmany physical, chemical, and biological processes that oat interfaces. Although studied for many years, fundamequestions remain concerning both the longitudinal~out-of-plane! and transverse~in-plane! structure of the interfaceRecently, experimental techniques such as surface sensx-ray and neutron scattering1–14 and nonlinear opticamethods15,16 have allowed these interfaces to be probedthe molecular length scale. In this article, we describe a schrotron x-ray liquid surface spectrometer recently instalat beamline X19C at the National Synchrotron Light Souat Brookhaven National Laboratory~NSLS! and mention afew recent results from this device.
The X19C liquid surface spectrometer is capable of msuring x-ray reflection, grazing-incidence diffraction afluorescence, surface diffuse scattering, and anomalousflection. It has the following features:~a! the capacity to uselarge and heavy sample chambers;~b! a sturdy design tha
a!Electronic mail: [email protected]
4372 Rev. Sci. Instrum. 68 „12…, December 1997 0034-6748/9
tree-eural
ive
nn-de
-
re-
allows for precise~and accurate! specification of theQ vec-tor as well as enhanced sample stability~important for liquidsamples!; ~c! simple optics, a single-crystal monochromator multilayer, to monochromate and steer the beam; and~d!straightforward tuning of the x-ray wavelength~from 6 to 17keV! that allows for measurement of differential anomaloreflectivity and fluorescence, and grazing incidence anolous x-ray scattering.
To date, the experimental techniques exploited usingX19C spectrometer have included x-ray reflectivity, surfadiffuse scattering, grazing-incidence diffraction, and refletion standing-wave fluorescence. These have been usestudy surfactant monolayers on the water surface,17,18 liquidmetal surfaces,19 liquid–liquid interfaces inmicroemulsions,20,21 and gold colloids in polymer thinfilms.22 High-resolution coherent scattering has been usestudy the propagation and scattering of partially coherx-ray beams from surfaces of patterned optics.23
II. SURFACE X-RAY SCATTERING TECHNIQUES ANDKINEMATICS
Surface x-ray scattering has been reviewed numertimes.24–29 Here, we mention a few aspects necessary toderstand the design of a liquid surface spectrometer.
7/68 „12…/4372/13/$10.00 © 1997 American Institute of Physics

rfathtem
ig
r o
-impriat
inac
-
e-n
in
nneity,-larp-
ed
er,and-
sity
e
tal
orhe
e-
-
file
ererm
ro-thehatllestcethelk,
olu-ot
three techniques discussed below, specular reflection, sudiffuse scattering, and grazing-incidence diffraction, areprimary techniques for studying liquid surfaces and demine most of the technical requirements for the spectroeter.
III. SPECULAR REFLECTION
The kinematics of surface scattering is illustrated in F1; note thata590° is normal to the surface. For arbitrarya,b, andw, the three components of the wave-vector transfethe scattered radiation,Q5kscat2k in , are
Qx5~2p/l!cos~b!sin~w!,
Qy5~2p/l!@cos~b!cos~w!2cos~a!#, ~1!
Qz5~2p/l!@sin~b!1sin~a!#.
Specular reflection occurs whena5b and w50 @Qx
5Qy50, Qz5(4p/l)sin(a)#. This reflection is usually measured at small angles where polarization effects are notportant. It is convenient to consider the special case oflarization parallel to the surface. For radiation in a mateof index of refractionn1 , incident on a plane surface awhich the index of refraction abruptly changes ton2 , thespecular reflectivity,RF(a), is given by the Fresnel formulaof classical optics30
RF~a!5Un1 sin a2An222n1
2 cos2 a
n1 sin a1An222n1
2 cos2 aU2
. ~2!
For x-ray energies greater than the material’s electronic bing energies, a simplified expression for the index of refrtion, n, can be written, namely,n512l2(rr e/2p)1 il(ma/4p), wherel is the x-ray wavelength,r is the elec-tron density in the material;r e5(e2/mc2)>2.818 fm is theclassical electron radius, andma is the x-ray linear absorption coefficient for intensity.27
If material 1 is air (n1>1), andn2,1 ~as it is for mostmaterials at x-ray wavelengths!, there is a critical angle forx-ray total reflection,ac5cos21(n2)>Arr el
2/p. For mostmaterials,ac is approximately 2–5 mrad for an x-ray wavlength of l50.154 nm. If absorption is neglected, theRF(a)51 when a,ac and RF(a)'(ac/2a)4 when a@ac . This functional form illustrates the rapid decreasereflected intensity as the incident angle increases.
FIG. 1. Kinematics of surface x-ray scattering:k in is the incoming wavevector,kscat is the scattered wave vector,Q is the wave-vector transfer withQxy5Qx1Qy in the plane andQz normal to the surface.
Rev. Sci. Instrum., Vol. 68, No. 12, December 1997
ceer--
.
f
-o-l
d--
With real interfaces, for which the index of refractioprofile normal to the interface changes smoothly from obulk phase to the other, the specularly reflected intensR(a), will deviate fromRF(a) in a manner that allows characterization of the index of refraction profile. X-ray specureflectivity is often interpreted in terms of the first Born aproximation. The principal result is given by24
R~a!
RF~a!>U 1
rbulkE dz
d^r~z!&dz
exp~ iQzz!U2
, ~3!
whered^r(z)&/dz is the electron density gradient averagover thex–y plane~parallel to the surface at constantz!, andrbulk is the electron density far below the surface. Howevthis approach neglects refraction and multiple scattering,Eq. ~3! is not accurate fora&4ac . Other methods of analysis are accurate at these small angles@see Eq.~21!#.26,31,32
The reflectivity can be used to measure the electron deninterfacial profile,^r(z)&, with resolution on the order of afraction of a nanometer.
The reflectivity from simple liquid surfaces can often bcharacterized by a roughness,s. For example, the reflectivityfrom a pure water surface for 4Qc<Qz<7.5 nm21 ~whereQc is the wave-vector transfer at the critical angle for toreflection, and for waterQc50.217 nm21! can be describedby
R~Qz!
RF~Qz!5exp~2Qz
2s2!, ~4!
corresponding to an electron density profile in Eq.~3! givenby
r~z!5 12~r l1rv!1 1
2~r l2rv!erf@z/s&#
with erf~z!52
ApE
0
z
e2t2dt, ~5!
wherer l andrv are the electron density for liquid and vapbulk phases. This interfacial profile is the prediction of tcapillary wave theory by Buff, Lovett, and Stillinger.33
Equation~4! shows that the reflectivity for a rough surfacdrops faster than the (ac/2a)4 drop-off for the smooth stepfunction interface.
As seen from Eq.~3!, the reflectivity measures the electron density averaged over the in-plane directions,x andy,of the surface. The spatial resolution of the density pronormal to the surface is approximately 2p/Qz . Better spatialresolution can result from analysis of an experiment if thare physical or chemical constraints on the functional foof the electron density profile.
Consideration of anticipated interfacial structures pvides the guideline for spectrometer design. To determinelargest Qz necessary, consider the smallest structure tneeds to be measured. In our experiments, this smastructure occurs in the case of liquid metals. This interfahas been shown to be stratified with layer spacing atinterface similar to nearest-neighbor spacing in the bu;0.25 nm. Therefore, the reflectivity contains a peak atQz
>25 nm21. This sets a lower limit on the maximumQz
needed for the spectrometer. Although higher spatial restion is always desirable in principle, in practice, it may n
4373Liquid surface spectrometer

rait
e
-atly
fesf
b
rf-
idicno
fie
dFoalecid-c
ram
itce
e
mtwin
erad
tee-atiolo2
ea-
on.
o-ing
nay
the
st
-eren-s of
yquaree
le,
c-vo-
c-
ringsary
be easy to obtain for two reasons:~1! larger values ofQz
require larger spectrometer motions, which may not be ptical; and 2! the surface roughness reduces the reflectivsignal. For example, a water surface has a roughness,s, of;0.27 nm resulting in a practical limitation on measurments toQz<7.5 nm21 ~for x-ray wavelengthl50.154 nm!.At larger values ofQz , the scattering from x rays that penetrate into the bulk water overwhelms the reflectivity signfrom the surface. Liquid metal surfaces are sufficiensmooth,s>0.09 nm, to allow for measurements out toQz
>25 nm21 or higher.19,34,35
The requirement on the smallest accessible values oQz
is determined by our experiments on liquid–liquid interfacThese interfaces may have a critical wave-vector transfertotal reflection as small asQc>0.05 nm21. To accuratelydetermine the reflectivity curve, it is advantageous to be ato measure down to slightly smaller values,Qz
>0.03 nm21. Since these systems also have a large intecial roughness,s>6 nm or larger, which limits the maximum accessibleQz to ;0.5 nm21, it is necessary to makedetailed measurements over this small range ofQz to get anyinformation about the interface.
The desired resolution inQz is ;0.01 nm21. This isnecessary to measure the reflectivity curve in the liquliquid systems and is also useful for measuring films as thas 100 nm. In the latter case, oscillations due to interferebetween the reflection from the top and bottom layersthese films can be clearly measured only with the speciresolution.
Measurements at smallQz also constrain the size andivergence of the x-ray beam incident on the sample.example, liquid–liquid interfaces often have relatively smflat regions, 10–20 mm long, that are most useful for refltion measurements~a region of the sample surface is consered to be macroscopically flat if it has a slope error musmaller than the angular acceptance of the detector!. At thesmallest reflection angles,;2.531024 rad, the beam sizemust be;10mm at the sample for the footprint to coveonly the flat region. Since the nearest distance of a bedefining slit to the center of our sample chamber is 12 cwe use a 5mm vertical slit gap. However, this small slalone is inadequate because the natural vertical divergenthe beam, 131024 rad, increases the beam size by 12mmover the 12 cm distance. To reduce the beam divergenc231025 rad, two 5mm slits placed;600 mm apart on theinput arm are used. These considerations set the approxisize of the input arm. Tracking the beam through thesefine slits also requires excellent angular control over theput arm.
Limitations similar to those just mentioned, for othexperiments that we considered at the time of design, hset the specifications for the spectrometer as a whole anindividual components.
In addition to scanning the spectrometer over a selecrange ofQz for Qx5Qy50, measurements of specular rflectivity also require determination of the background sctering that must be subtracted. The finite angular resoluof the spectrometer results in a broadening of a scan aQy through the specular condition, as illustrated in Fig.
4374 Rev. Sci. Instrum., Vol. 68, No. 12, December 1997
c-y
-
l
.or
le
a-
–kcefd
rl-
h
m,
of
to
ateo-
veits
d
t-n
ng.
The background for reflectivity measurements is often msured by offsetting the spectrometer far enough inQy to beseveral resolution widths away from the specular conditiSince DQy5sina(Dkin1Dkscat)>a(Dkin1Dkscat), forsmall a, it is possible to maintain the same number of reslution widths as a function of the incident angle by scannalong a line that connects~Qx50, Qy5Qz,1 /a, Qz5Qz,1! to(0,Qz,2 /a,Qz,2) where a is selected such that the positio(0,Qz /a,Qz) is a chosen number of resolution widths awfrom the specular condition~a is determined experimentallyby scanningQy at a fixedQz!. Alternatively, the backgroundcan be measured by scanning alongQz at a fixed offset inQy . However, this latter procedure does not maintainsame relative distance from the peak as a function ofQz .
The x-ray absorption length,ma21, at 8 keV (l
>0.15 nm) is approximately 1 mm in water and in moorganic fluids. Sincema}(Energy)23, use of high-energy xrays~such as 15 keV! greatly reduces the absorption, allowing the x rays to penetrate further into the bulk liquid. Highenergies are very useful when bulk liquid needs to be petrated to probe a buried interface, as occurs in our studieliquid–liquid interfaces.
FIG. 2. Resolution considerations for specular reflectivity for whicha5b. ~a! In theQy–Qz plane the width in incomingk vectors,Dkin , and thewidth in scatteredk vectors,Dkscat is shown. The widths are determined bslit sizes and the energy bandwidth. These widths may represent a swell transmission for which everyk vector whose arrowhead is on the linDkin ~or Dkscat! is allowed; if not on the line, thek vector is forbidden. Morerealistically, the widths represent the width of a distribution, for exampGaussian, of incoming and scattered wave vectors.~b! The convolution ofthe two resolution widths,Dkin andDkscat, yield a parallelogram resolutionarea in theQy–Qz plane. For the square well transmission, onlyQ vectors~whereQ5kscat2k in! within the parallelogram are scattered into the detetor. More realistically, the parallelogram schematically represents a conlution of distributions inkin andkscat. The resolution area reveals an effetive resolution for specular reflection in theQz direction, DQz , and aneffective width in theQy direction, DQy . This shows that for a chosenangular setting of the spectrometer, specular reflection from a range ofQz ,DQz , is received by the detector. Also, to measure background scattethat does not include a component of the specular reflection, it is necesto tune away from the specular condition by a width,DQy/2, in the Qy
direction.
Liquid surface spectrometer
in
nl-cuhech
infeif-ar
trula
thtd
i
-c-
-ldc
0
ctc
roefed
-
gingis
thecat-m-ure-
for
s an
ler-ple,ers
orthe
he
esave
s-al
rder
r-
ts.in-
Although specular reflection is the dominant scatterprocess in the direction ofb5a andw50, at anglesbÞaandwÞ0, far enough away from the specular reflection codition, scattering from the bulk liquid is dominant. By simutaneously measuring the angular dependence of the spereflectivity and bulk scattering, it is possible to monitor tstructure of the bulk liquid in the same experiment in whithe surface structure is studied.
IV. SURFACE DIFFUSE SCATTERING
Tuning off the condition for specular reflection resultsa nonzero in-plane component of the wave-vector transQxy[(Qx ,Qy) ~this scattering is referred to as surface dfuse scattering!. For small angle scattering off the speculcondition, if ua2bu!a!1 andw50, thenQz>(4p/l)a,Qx50 and Qy>(p/l)(a22b2)>(Qz/2)(a2b), resultingin values ofQy as small as 1027(2p/l). This allows formeasurements that are sensitive to long-wavelength stures at the interface, such as long-wavelength capilwaves. For example, ifa50.5°, a2b>0.1°, and l50.15 nm, then 2p/Qy>10mm, comparable to the smalleslength scales usually probed in scattering by visible lighowever, with x rays, the measurements can be extendelength scales that are orders of magnitude smaller.
If the surface or interface is not perfectly smooth andthe amplitude of the height fluctuations,z(x,y), are small incomparison with 1/Qz , the distorted wave Born approximation yields the following form for the differential cross setion for x-ray surface diffuse scattering:32,36–38
ds
dV5r e
2AxyuT~a!u2uT~b!u2E dx dyr2^zz~x,y!&eiQxy–r,
~6!
where r is the average electron density,Axy is the illumi-nated area of the sample, and^zz(x,y)& is the height–heightcorrelation function.T(q), q5a or b, is the Fresnel transmission coefficient for the amplitude of the total wave fieat the surface, polarized perpendicularly to the plane of indence, written as30
T~q!52n1 sin q
n1 sin q1@n222n1
2 cos2 q#1/2. ~7!
For small angles andn151, T(q)>2q/@(q1Aq22qc2#,
and uT(q)u2>(2q/qc)2ARF(q). The function uT(a)u2,
which is proportional to the square of the field, varies fromto 4, asa increases from 0 toac , and then falls to unity fora@ac . The factorT(b) appears because of a similar effein the coupling between the surface currents and the stered fields.36,39–43
The angular dependence of the two factors,T(a) andT(b), enables the surface scattering to be distinguished fother diffuse scattering processes. This is particularly usfor probing the height fluctuations due to thermally excitcapillary waves. In this case, the scattered intensity,I D , iswritten as37
Rev. Sci. Instrum., Vol. 68, No. 12, December 1997
g
-
lar
r,
c-ry
;to
f
i-
at-
mul
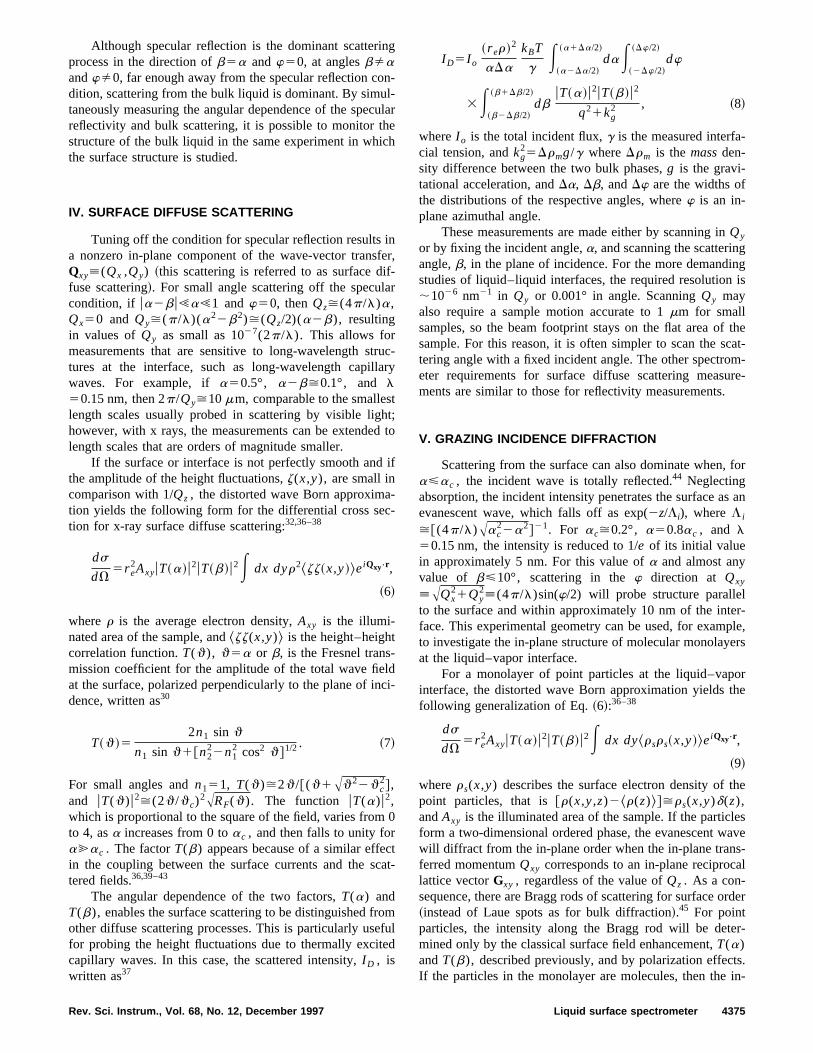
I D5I o
~r er!2
aDa
kBT
g E~a2Da/2!
~a1Da/2!
daE~2Dw/2!
~Dw/2!
dw
3E~b2Db/2!
~b1Db/2!
dbuT~a!u2uT~b!u2
q21kg2 , ~8!
whereI o is the total incident flux,g is the measured interfacial tension, andkg
25Drmg/g whereDrm is the massden-sity difference between the two bulk phases,g is the gravi-tational acceleration, andDa, Db, andDw are the widths ofthe distributions of the respective angles, wherew is an in-plane azimuthal angle.
These measurements are made either by scanning inQy
or by fixing the incident angle,a, and scanning the scatterinangle,b, in the plane of incidence. For the more demandstudies of liquid–liquid interfaces, the required resolution;1026 nm21 in Qy or 0.001° in angle. ScanningQy mayalso require a sample motion accurate to 1mm for smallsamples, so the beam footprint stays on the flat area ofsample. For this reason, it is often simpler to scan the stering angle with a fixed incident angle. The other spectroeter requirements for surface diffuse scattering measments are similar to those for reflectivity measurements.
V. GRAZING INCIDENCE DIFFRACTION
Scattering from the surface can also dominate when,a<ac , the incident wave is totally reflected.44 Neglectingabsorption, the incident intensity penetrates the surface aevanescent wave, which falls off as exp(2z/Li), whereL i
>@(4p/l)Aac22a2#21. For ac>0.2°, a50.8ac , and l
50.15 nm, the intensity is reduced to 1/e of its initial valuein approximately 5 nm. For this value ofa and almost anyvalue of b<10°, scattering in thew direction at Qxy
[AQx21Qy
2[(4p/l)sin(w/2) will probe structure paralleto the surface and within approximately 10 nm of the intface. This experimental geometry can be used, for examto investigate the in-plane structure of molecular monolayat the liquid–vapor interface.
For a monolayer of point particles at the liquid–vapinterface, the distorted wave Born approximation yieldsfollowing generalization of Eq.~6!:36–38
ds
dV5r e
2AxyuT~a!u2uT~b!u2E dx dy rsrs~x,y!&eiQxy–r,
~9!
wherers(x,y) describes the surface electron density of tpoint particles, that is@r(x,y,z)2^r(z)&#>rs(x,y)d(z),andAxy is the illuminated area of the sample. If the particlform a two-dimensional ordered phase, the evanescent wwill diffract from the in-plane order when the in-plane tranferred momentumQxy corresponds to an in-plane reciproclattice vectorGxy , regardless of the value ofQz . As a con-sequence, there are Bragg rods of scattering for surface o~instead of Laue spots as for bulk diffraction!.45 For pointparticles, the intensity along the Bragg rod will be detemined only by the classical surface field enhancement,T(a)andT(b), described previously, and by polarization effecIf the particles in the monolayer are molecules, then the
4375Liquid surface spectrometer

4376 Rev. Sci.
TABLE I. Spectrometer and beamline motors.
Name~mnemonic! Purpose Hardware Step size
Slit 1 vertical ~s1v! Vertical beam size before mirror NSLS design N/ASlit 2 horizontal~s1h! Horizontal beam size before mirror NSLS design N/AMirror bend ~mirb! Adjusts mirror focus vertically Custom 4.5mmMirror jack 1 ~mirj1! Vertical mirror motion Custom 3.5mmMirror jack 2 ~mirj2! Vertical mirror motion Custom 3.5mmMirror jack 3 ~mirj3! Vertical mirror motion Custom 3.5mmMirror translation 1~mirt1! Horizontal mirror motion Custom 4.0mmMirror translation 2~mirt2! Horizontal mirror motion Custom 4.0mmSlit 2 outer~s2o! Vertical beam size after mirror Custom 4.0mmSlit 2 inner ~s2i! Vertical beam size after mirror Custom 4.0mmSlit 2 left ~s2l! Horizontal beam size after mirror Custom 6.3mmSlit 2 right ~s2r! Horizontal beam size after mirror Custom 4.0mmMonochromator translation~monot!
Adjusts position of monochromatorwithin the 3-circle
Custom 4.0mm
Theta~th! Q, 3-circle theta stage formonochromator alignment
Huber 410 531023°
Chi ~chi! x, beam steering Huber 511.1 531024°Phi ~phi! F-stage setsuB , Bragg angle, for
beam energyHuber 511.1 531024°
Two theta~tth! 2u, spectrometer rotation Huber 440 531024°Input height~ih! Input arm vertical translation Anorad 7-6
~100 mmtravel!
1.3 mm
Input rotation~ir! a, input arm rotation Huber 414 531024°Sample height~sh! Sample vertical translation Custom 1.3mmSample theta~sth! Sample rotation Franke
PDM400M531023°
Detector theta~dth! w, detector rotation about samplecenter
FrankePDM400M
531023°
Output rotation~or! b, output arm rotation FrankePDM175M
531024°
Output height~oh! Output arm vertical translation Anorad 7-10~200 mmtravel!
1.3 mm
Spectrometer translation~yt! Translates entire spectrometer andmonochromator tank transverse~horizontal! to the beam
Custom 3.2mm
Hutch slit motors~s]b, s]ts]l, or s]r!
4-jaw slit motions in hutch,]identifies slit; t, b, l, or r identifiesjaw ~top, bottom, left, right!
Huber slits 0.6mmor1.2 mm
Hutch absorber~habs! Absorber wheel in hutch Custom N/ABeamline absorber~babs! Absorber foil in beamline Custom N/A
o-
o
reoityn
gege
s
u-
si-
a
he
he
Thisls
gycali-
tensity,I (Qz), along the Bragg rod is modulated by the mlecular structure factor normal to the surface,F(Gxy ,Qz),and is represented as
I ~Qz!}uT~a!u2uF~Gxy ,Qz!u2uT~b!u2. ~10!
For monolayers of long molecules that exhibit orderingthe molecular tilts, the factorF(Gxy ,Qz) is a function ofboth the molecular tilt and the intrinsic molecular structufactor. The intensity distribution along the Bragg rod prvides information analogous to that contained in reflectivmeasurements, but only for the ordered part of the molayer.
Scans in w using the detector theta rotation sta~‘‘dth’’ ! are used to determine the locations of the Brarods inQxy , thereby determining the reciprocal lattice of thin-plane order~see Table I!. Due to the weak scattering fromthe ordered structures of Langmuir monolayers, a Sollerwith in-plane angular resolution of 331023 rad is used tomaximize the signal.8 Structure along the Bragg rods is us
Instrum., Vol. 68, No. 12, December 1997
f
-
o-
g
lit
ally measured at X19C with a gas ionization position sentive wire detector ~Ordela, 200 mm long active wireregion!.46 A single measurement with this detector scansrange inQz of ;1 Å21 ~at an x-ray energy of 8 keV!. Therange inQz may be essentially doubled by translating tdetector with the ‘‘oh’’ stage~see Table I!. The minimumwidth of a peak along the Bragg rod is approximately tinverse of the monolayer thickness, typically, 1/20 Å21. Theresolution of the linear detector inQz is ;331024 rad, farexceeding that necessary to measure the peak widths.allows many~typically, 100–200! adjacent detector channeto be summed, improving the signal-to-background ratio.
VI. DESIGN
A. X19C beamline
The X19C beamline delivers radiation in the enerrange from 6 to 17 keV. The beam is focused in the vertiand horizontal by a cylindrically cut mirror that is mechan
Liquid surface spectrometer

is-
nab
llo
leir-tefo
-eaer
e
e
te.
ta
epl
gitysdflae
in
ar-ichedrli-
hex-
rs.
orthedonforted
d inam
entd in
ys
n
the
cally bent. The measured beam spot size~full width at half-maximum! near the focus in the experimental area0.4 mm31 mm (vertical3horizontal). The angular divergence of the beam is 100mrad in the vertical and 2 mrad inthe horizontal. The resultant x-ray fluxes from differemonochromators at two sample energies are listed in TII.
B. Spectrometer overview
There are several different methods for experimentaachieving the kinematic conditions needed for detectionscattering from liquid surfaces.3,5,13,47–50Reflection and sur-face diffuse scattering require the use of incident angmuch larger than the critical angle for reflection from a mror and, therefore, a monochromator crystal is used to sthe beam downward. Our spectrometer consists of thelowing major components:~1! a flat single-crystal monochromator to select the wavelength and steer the x-ray bdownward;~2! a rotary~2u! stage to orient the spectrometto intercept the x-ray beam of the chosen energy;~3! slits oninput and output~detector! arms to adjust the size of thbeam incident on the sample and set the resolution;~4! asample stage to adjust the vertical position of the samplappropriate for the desired angle of incidence; and~5! anoutput arm and detector that can be appropriately orienabout the sample to choose both theQ vector and resolution
The X19C spectrometer has the following features:
~i! Range inQz of 0.01 nm21<Qz<30 nm21. Resolu-tion in Qz is ;0.01 nm21 with a typical reproducibil-ity of better than 0.03 nm21.
~ii ! For grazing-incidence diffraction, the detector themotion is at least690°. The in-planeQ-space reso-lution is 0.07 nm21 ~using Soller slits! with a repro-ducibility of 0.015 nm21.
~iii ! For surface diffuse scattering, the resolution inQy is1025 nm21 with a typical reproducibility of betterthan 331025 nm21.
~iv! The capacity to use large and heavy sample chambas required for high-vacuum experiments. Samchambers of 100 kg~with a center of mass;0.3 mfrom the bottom! that can fit on a 0.6 m30.75 m tableare easily accommodated.
~v! Simple wavelength tuning from 6 to 17 keV, allowinfor measurement of differential anomalous reflectivand fluorescence, and grazing incidence anomalouray scattering~these techniques have yet to be use!.
~vi! Simple spectrometer optics consisting of a single,monochromator. The monochromator tank is designfor easy access to all components, thereby allow
TABLE II. Total flux measured after the steering monochromator~spot size;0.531 mm!.
Monochromator Energy~keV! Flux ~photons/s!
Si~111! 8 331011
Si~111! 15 231010
Multilayer ~17.5 Å 2d spacing! 8 .731012
Multilayer ~17.5 Å 2d spacing! 15 631011
Rev. Sci. Instrum., Vol. 68, No. 12, December 1997
tle
yf
s
erl-
m
as
d
rs,e
x-
tdg
for the easy replacement of monochromators for pticular experiments. For example, experiments whcan be carried out with lower resolution but nehigher flux will benefit from the use of multilayemonochromators. X19C currently has both sicon~111! and multilayer monochromators ofd spac-ing equal to 1.75 and 1.2 nm,51 see Table II.
~vii ! The spectrometer is permanently installed in tX19C hutch. This reduces the setup time for an eperiment in comparison with portable spectromete
C. Steering crystal monochromator
A single reflection off a flat monochromator crystalmultilayer is used to select the x-ray energy and to steerx-ray beam from its initial direction of approximately 9 mrafrom the horizontal to the desired incident reflection anglethe sample. Two useful rotation geometries are availablethis beam steering. In the first, the monochromator is rotaabout an axis along the length of the monochromator anthe plane of the monochromator. The monochromatic beis then steered in a plane at a fixed 2u @see Fig. 3~a!# with asmall change in x-ray energy as a function of the incidangle on the sample. This geometry has been describedetail by Pershanet al.6 and can be used when the x ra
FIG. 3. The axisz is out of the paper for parts~a! and~b!. The dashed linesin ~a! and ~b! are in thej–z plane.~a! Kinematics for beam steering whethe monochromator is rotated about its long axis.~b! Kinematics for beamsteering when the monochromator is rotated about an axis collinear withincoming x-ray beam.~c! Projection of kinematics in part~b! onto thej–zplane. The axish is into the paper.
4377Liquid surface spectrometer

nthmx
nd
inm
ine
Ththu
rerarinthtrre
e
hthi
tth
enhe
g
-
teh-
he
s
e-evi-hece
atoren
incident upon the monochromator have large enough bawidth to accommodate this energy variation and whenexperimental technique can permit it. An alternative geoetry uses a rotation of the monochromator about the acollinear with the incoming beam@see Fig. 3~b!#. This hasthe advantage that the x-ray energy is fixed as a functioincident angle. However, the beam is steered in a cone,manding that the spectrometer follow the beam by vary2u as the angle of incidence is varied. This alternative geoetry is necessary when monochromatic x rays~from a beam-line monochromator, as, for example, at NSLS beamlX22B! are incident on the steering monochromator or whthe experimental technique requires a fixed energy.X19C spectrometer is capable of either geometry, thoughlatter is usually used and will be described in this manscript.
At X19C, the x rays incident on the monochromator abroadband in energy with a horizontal divergence of 2 mand a vertical divergence of 0.1 mrad. The beam steegeometry mixes the horizontal and vertical divergence asmonochromator is rotated. This changes the shape ofbeam reflected from the monochromator and is particulanoticeable when using multilayer monochromators thatquire large rotation angles to achieve the desired angleincidence on the sample. Due to the large horizontal divgence,DE/E>331023 for the Si~111! monochromator andDE/E>531023 for the multilayer monochromator~at 8keV!, despite the much smaller natural bandwidth of tSi~111! crystal. The multilayer monochromator’s bandwidis well matched to the optics, resulting in an increasephoton flux by a factor of 25 over that from the Si~111!~Table II!. When using the Si~111! crystal, we calculate thaby reducing the horizontal beam divergence beforemonochromator, the energy bandwidth,DE, can be reducedto ;5 – 10 eV. Reduction ofDE to nearly this value hasbeen recently accomplished.52
Here, we review the relationship between the incidwave vector,k in,m , onto the steering monochromator and twave vector reflected from the monochromator,kref,m . Whenthe beam is not steered, the plane of incidence is thej–zplane, as shown in Fig. 3~c!. The incident angle is the Bragangle, uB . In ~j,h,z! space, k in,m5k(1,0,0), where k5uk in,mu52p/l, andl is the x-ray wavelength; the reciprocal lattice vectort5t@2cos(p/22uB),0,sin(p/22uB)#. Inthis case, the wavelength is the central wavelength demined by the monochromator and the incident angle. Trays drawn in Figs. 3~a!–3~c! are the central rays. The reflected wave vector is then written as
kref,m5k in,m1t5„k2t sin~uB!,0,t cos~uB!…. ~11!
The Bragg condition for diffraction~reflection, in this case!from a perfect crystal can be written ast52k sin(uB) lead-ing to kref,m5k„cos(2uB),0,sin(2uB)… as expected for simpleBragg reflection.
It is now easy to consider the effect of a rotation of tmonochromator through an anglex about thej axis, asshown in Fig. 3~b!. The reciprocal lattice vector is written a
t5t„2sin~uB!,cos~uB!sin~x!,cos~uB!cos~x!…, ~12!
4378 Rev. Sci. Instrum., Vol. 68, No. 12, December 1997
d-e-is
ofe-g-
enee-
dge
hely-ofr-
e
n
e
t
r-e
resulting in
kref,m5k„cos~2uB!,sin~2uB!sin~x!,sin~2uB!cos~x!….~13!
Note that thej component ofkref,m is independent ofx in-dicating thatkref,m rotates in a cone about thej axis. Thespectrometer has to vary 2u to follow kref,m . By projectingkref,m into thej–z plane, as shown in Fig. 3~c!, it is seen that
tan~2u!5kref,z
kref,j5
sin~2uB!cos~x!
cos~2uB!5tan~2uB!cos~x!.
~14!
The angle of incidence onto the sample,a, is determined bythe h component ofkref,m ~denotedkref,m,h! as
sin~a!5kref,m,h /k5sin~2uB!sin~x!, ~15!
or
x5sin21@sin~a!/sin~2uB!#, ~16!
which gives the monochromator rotation angle,x, for a de-sired angle of incidence,a @see Fig. 4~a!#.
At X19C, the geometry is slightly more complicated bcause the x-ray beam incident on the monochromator dates from the horizontal by approximately 9 mrad, but tsample, being liquid, maintains a fixed horizontal surfadetermined by gravity. Figure 4~b! identifies the mirror re-flection angle as 2um in the j–h plane. If we consider thej–h–z space to be attached to the steering monochrom~as used above! and a j8–h8–z8 space attached to thsample, thenkref,m in the primed coordinates can be writtein terms of a simple rotation about thez([z8) axis. Thisgives
S kref,m,j8kref,m,h8kref,m,z8
D5kS cos~2uB!cos~2um!2sin~2uB!sin~2um!sin x
cos~2uB!sin~2um!1sin~2uB!cos~2um!sin xsin~2uB!cosx
D ,
~17!
where thez8 component is unchanged. As before, 2u is de-termined by the projection onto thej8–z8 plane and is givenby
FIG. 4. ~a! X-ray beam steering onto sample at incident anglea. ~b! As inpart ~a! with the inclusion of the reflection angle from the mirror,um .
Liquid surface spectrometer

a-e
d
or
o
x
n
kn
th
ele
hisnkrt.
e
er-ge
thetionhairbeing
ank
tordis-
to
d x
nes-
tect
w.sedp-o
-
tru-adfrtair
taor
e
a
and
2u5tan21F tan~2uB!cosx
cos~2um!2tan~2uB!sin~2um!sin xG , ~18!
anda is determined by sin(a)5kref,m,h8 /k and is given by
sin a5cos~2uB!sin~2um!1sin~2uB!cos~2um!sin x.~19!
Use of Eq.~19! allows us to write the monochromator rottion angle, x, in terms of the angle of incidence on thsample,a, as
x5sin21Fsin a2cos~2uB!sin~2um!
cos~2um!sin~2uB! G . ~20!
Because of the mirror reflection,a50 does not corresponto x50.
To execute the necessary motions, the monochromatmounted on theF stage of a 3-circle goniometer~i.e., a4-circle geometry goniometer without the lowest, 2u, stage!.This custom 3-circle was assembled from Huber Model N410 and 511.1 by Blake Industries.53,54 The F stage is usedto set the x-ray energy by settinguB . Thex stage performsthe x motion described above. To align thex axis to becollinear with the incoming beam requires rotation of thexandF stages as a unit about an approximately vertical a~theh axis!. This rotation is performed by theQ stage of the3-circle. The alignment of thex axis also requires a rotatioabout a horizontal axis normal to the beam path~defined bythe x-ray direction incident upon the monochromator!. Thisrotation is possible because the entire monochromator tanmounted on kinematic mounts that allow for small rotatioabout thez axis through the monochromator~see Fig. 5!.Deviation from perfect alignment results in changes inx-ray energy as the beam is steered to different angles~seethe Appendix!.
The 2u stage~Huber 440! is not directly attached to the3-circle, but is displaced vertically downward by;1 m. The2u-axis and 3-circle rotation axes are aligned by using a tscope, that rotates concentrically with the 2u axis, to sight on
FIG. 5. Side view of liquid surface spectrometer~refer to Table I!: mt,monochromator tank; km, kinematic mount~only 1 of 3 mounting placesshown!; tel, alignment telescope mounting plate~telescope not shown!; w,monochromator tank window; ia, input arm; ic, input column; yt, horizonmotion ~transverse to the beam! for the spectrometer and monochromattank together; 2um , twice the mirror reflection angle; 2u TP, 2u tie plateconnecting the 2u stage to the rest of the spectrometer; sth, sample th~rotation!; dth, detector theta~rotation!; sh, sample height stage~verticalmotion!; vib, vibration isolation blocks; air, air bearings~total of 3!; atp, airbearing tie plate connecting the three air bearings; oc, output column;oa, output arm.
Rev. Sci. Instrum., Vol. 68, No. 12, December 1997
is
s.
is
iss
e
-
a cross hair placed at the center of the 3-circle rotation. Toptical alignment is performed with the monochromator taclosed, by sighting through four windows placed 90° apaNote that the entire 3-circle is tilted at;9 mrad (2um) withrespect to the 2u stage. The 2u stage rotates the rest of thspectrometer, including the sample, in a horizontal plane~seeFigs. 5 and 6!.
The monochromator is mounted directly on a watcooled block mounted on a linear translation sta~‘‘monot’’ ! that is then mounted on the 3-circle’sF stage.This stage is used to translate the monochromator out ofbeam and replace it with a cross hair centered on the rotaaxes of the 3-circle. Shining the x-ray beam on the crossallows the 3-circle and the rest of the spectrometer tocentered on the beam. This placement is effected by movthe entire spectrometer including the monochromator twith a translation stage~‘‘yt’’ ! placed below the 2u stage.The relative position of the center of the monochroma3-circle with respect to the spectrometer is, therefore, unturbed~see Figs. 5 and 6!.
The steel monochromator tank is pumped down1023 Torr, filled with helium, and then left with a small flowof helium during usage. The monochromated and steererays exit the tank through a large~8 cm324 cm!, flat, beryl-lium or kapton, window. A window cover is used whechanging the pressure in the tank to ensure that there issentially no pressure gradient across the window. To prothe beryllium window from oxidation, a thin layer~200 nm!of aluminum was deposited on the outside of the windoHowever, this deteriorated after exposure to the focuwhite beam. The beryllium window is now used with a katon window over it and a flow of helium gas between the twwindows.
D. Air bearing mechanism
When rotated by the Huber 440 2u stage, the spectrometer is supported by three air bearing pads~0.330.3 m2 areafor each! riding on a granite plate~1.9 m31.2 m30.15 m!.The air bearings and the truncated triangular tie plate~seeFig. 6! were engineered and manufactured by Dover Insment Corp.55 This bearing mechanism supports a 270 kg locentered on the sample table~including a sample chamber o100 kg or less! and a 90 kg load from the output arm suppostructure that is offset by 685.8 mm from the center. The
l
ta
nd
FIG. 6. Top view of liquid surface spectrometer~refer to Table I!: mt,monochromator tank; yt, horizontal motion~transverse to the beam! for thespectrometer and monochromator tank together; 2u-tp, 2u tie plate connect-ing the 2u stage to the rest of the spectrometer; dth, detector theta~rotation!;atp, air bearing tie plate connecting the three air bearings; ia, input arm;oa, output arm.
4379Liquid surface spectrometer
le
inth
agaxin
tc2
ec
-
gsaten
,ethinn
r-io
ldenb
ria
-
ms
tio,
ht
0.
.allyo-
he
eryid
tteplts
onthe
y a
ple
s ason-andity.
rfen
sch
np
orstorly
h
or0
effertd
-
hich
bearing mechanism can rotate 37° in 2u on a radius of1238.25 mm~distance from the monochromator to sampcenter! ~see Fig. 6!.
The mechanism serves a dual purpose by also providthe bearing mechanism for the detector rotation. When2u tie plate is fixed at a specified angle and the dth strotates, the air bearing tie plate rotates about a verticalthrough the sample center. The dth rotation range is a mmum of 690° for 10°,2u,35°. Limitations on this rota-tion range are due to the position of the experimental huwall and interference between the output column and theutie plate.
The granite plate is flat to within 2.5mm and was leveledto better than 131024 rad when installed. For motion in thhorizontal plane, the vertical motion of a given referenpoint on the air bearing tie plate surface~with respect to thegranite plate! does not exceed 2.5mm over the entire excursion of the bearing mechanism.
E. Input and output arms
The input and output arms, shown schematically in Fi5 and 6, are centered 558.8 mm from the monochromand 685.8 mm from the sample center, respectively. Thhold Klinger rails~X-95!56 onto which the experimenter caattach slits~e.g., motorized Huber slit assemblies!, ion cham-bers, scintillator detectors~mounted vertically or horizon-tally!, Soller slits, a linear detector, evacuated beam pathsother optical elements as needed for a particular experimThe rails are easily replaced with others of different lengand the optical components can be placed at most poalong the beam path. The vertical position of the componeplaced on the rail is very reproducible~within a few mi-crometers!. The input arm is oriented and positioned corectly in the beam using an Anorad 7-6 linear translatstage mounted for vertical translation~‘‘ih’’ ! and a Huber414 double rotation stage~‘‘ir’’ ! rotating about a horizontaaxis. The other rotation axis of the Huber 414 can be userotate a crystal into the beam. This allows the incidentergy as a function of monochromator steering angle tomeasured as the incident angle is varied~by using a detectoron the end of the input arm!.
The output arm, which normally holds a detector, is oented and positioned in a similar fashion with a vertictranslation stage~Anorad 7-10! and a rotation about a horizontal axis~Franke PDM175M rotary table!. Because of thesignificant torque loads on both the input and output aradditional bearing surfaces were added for both the trantions and rotations.
The input and output arms and their associated mostages are supported on the input and output columnsspectively. The input column is mounted on the 2u tie plateconnecting the 2u stage and the detector rotation stage. Toutput column is mounted on the air bearing tie plate tharotated about the sample center by the dth stage.
F. Sample table and vibration isolation
The mounting surface for sample chambers is a30.75 m2 breadboard from Newport Research Corp.56 that is
4380 Rev. Sci. Instrum., Vol. 68, No. 12, December 1997
geeisi-
h
e
.orse
ornt.,tsts
n
to-e
-l
s,la-
nre-
eis
6
vibration isolated by a MOD-2 isolation system from JRS57
This system isolates the liquid surfaces from mechanicinduced vibrations. It provides active-feedback vibration islation, which maintains the absolute vertical position of tbreadboard to within 1mm ~and rotations to within 2mrad!,necessary for maintaining sample alignment for the vsmall grazing incident angles typically used to study liqusurfaces. The sample height~‘‘sh’’ ! stage is a custom builvertical translation stage with 290 mm of travel and a ssize of 1.3mm. Optical encoder feedback of this stage resuin a motion accuracy of;3 mm, primarily limited by themechanical creep of the stage~encoder from Heidenhain58!.For higher precision work, small samples can be mounteda small, accurate translation stage mounted on top ofsample breadboard.
The sample table can be rotated about its center bFranke rotary table~PDM400M, ‘‘sth’’!. Although thesample rotation may be limited by the use of large samchambers, the table is capable of rotating 360°.
G. Electronics and computer control
The motions of the spectrometer and beamline motorwell as the electronic signals from the detectors are ctrolled and read by a Sun Sparcstation 2 using hardwaresoftware that are standard in the x-ray scattering communThe software is a commercial package calledSPEC~CertifiedScientific Software!.59 The X19C spectrometer uses the Sumodule of theSPECsoftware whose macrolanguage has beused to customize the software for X19C. ACAMAC interfaceis used for motor control~E-500 stepper motor controllerfrom DSP60! and for counting single-channel detectors suas NaI scintillators~Bicron Corp.61! using counting and tim-ing electronics from Kinetic Systems~3610 Hex Counter and3655 Timing Generator62 and detector signal amplificatioelectronics from Ortec~556 Power Supply, 590A preamand SCA, and 449 ratemeter!.63 The electronics allows forcounting to absolute time intervals or for gating detectaccording to the total number of counts in another detec~typically used to monitor the beam intensity immediateprior to the sample!. Transistor–transistor logic signals fromtheCAMAC motor controllers are sent to motor drivers, whicamplify the signals as appropriate for different motors~driv-ers from ACS,64 4-phase stepping motors from SuperiElectric or Vexta!. The software controls approximately 4motors. An IEEE-488 interface board ~NationalInstruments65! allows other signals to be recorded by thcomputer. These include signals from a multichannel bu~Ortec 918 and 476-4 multiplexer63! that records the outpuof a linear detector~Ordela46! as well as any signals recordeby a scanner multimeter~Keithley Instruments model 19966!such as the resistance of thermistors~to measure sample temperatures!.
VII. MEASUREMENTS
In this section, a few measurements are discussed, willustrate the capabilities of the spectrometer.
Liquid surface spectrometer

inco
, t
inlo
teu
h
fnolu
ut
ulets
th
lytryla
a
th
assshey
-
as
e
The
lar-
redeeat-m-ifi-
n-akss
lsnte is
gle,
A. Liquid–liquid interfacial structure
Liquid–liquid interfaces are model systems to studyterfacial phenomena in a variety of technologically and sentifically important areas. Recent measurements at themonolayer–water interface by Leeet al. and McClainet al.used neutron reflectivity and x-ray scattering, respectivelyprobe the large interfacial roughness.67,68
At X19C, we are currently studying the oil–microemulsion interface in ternary liquid systems containa straight-chain oil, water, and a surfactant from the homogous series CiEj @n-alkyl polyglycol etherCH3~CH2!i 21(OCH2CH2) jOH#.69–72 We have made x-rayscattering measurements from the oil–microemulsion inface of several ternary mixtures that include one of the sfactants, C4E1, C6E2, or C10E4. The mixtures using C4E1 orC6E2 yield qualitatively similar results. The mixtures witC10E4 have much rougher interfaces (s>200 Å) and will bediscussed elsewhere. Here, we present studies oC4E1–water–decane~1:1:3! mixture at 35.00 °C prepared ia vapor-tight sample cell. Under these conditions, the stion is in a three-phase state with a middle-phase microemsion. The primary experimental challenge occurs becausex-ray beam fully traverses the diameter of one of the bphases. The concurrent absorption and bulk scattering dmines the need for a small sample that, in turn, requirevery small x-ray beam~10 mm vertically!. The high bril-liance of a synchrotron x-ray source is needed to meetexperimental challenge.
We used H2O from a Barnstead Nanopure UV systemdecane (991%) purchased from Sigma, and C4E1 ~.99.8%!purchased from Fluka. The solution is contained in a pocarbonate sample cell of approximate cylindrical symmeThe x rays pass in and out of the cell through two thin mywindows attached to the body of the cell with Kalrezo rings.The sample cell is surrounded by a two-stage thermostattemperature controlled to within 0.005 °C.
In this design, the x rays pass through 35 mm ofupper phase, necessitating the use of high energy x rays~seeFig. 7!. The absorption length of the upper decane-rich ph~at 35 °C! at 15 keV is 15 mm, resulting in an absorption loof 90%. By using a multilayer monochromator crystal at tX19C surface spectrometer, we have adequate intensitperform these experiments~631011 photons/s at 15 keV in a0.5 mm31 mm spot!.
The reflectivity data~from the oil–microemulsion inter-face! shown in Fig. 8 are very nearQc and cannot be analyzed with the Born approximation given in Eqs.~3! and~4!.Instead, these data were analyzed with the distorted wBorn approximation to determine the interfacial roughnes, using the result given by32,68,73
FIG. 7. Schematic of liquid–liquid scattering geometry.
Rev. Sci. Instrum., Vol. 68, No. 12, December 1997
-i-il–
o
g-
r-r-
a
-l-heker-a
is
,
-.r
nd
e
e
to
ves,
R~Qz!
I o>UQz2Qz
T
Qz1QzTU2
exp~2s2QzQzT!, ~21!
whereR(Qz) is the reflected intensity as a function of thwave-vectorQz normal to the interface,I o is the incidentintensity, andQz
T>AQz22Qc
2 is the z component of wave-vector transfer with respect to the microemulsion phase.solid line in Fig. 8 is a fit to Eq.~21! that yieldss566 Å63 Å. This value is much larger than the largest molecusize (;10 Å), and is indicative of a strongly fluctuating interface.
Figure 9 shows the surface diffuse scattering measuas a function ofb for fixed a. The larger peak occurs at thspecular condition (a5b); the smaller peak occurs at thcritical angle,ac , and is due to the enhanced surface sctering from surface fluctuations. The solid line results frofitting to the form given by Eq.~8! using the surface roughness determined by the specular reflectivity. The one signcant fitting parameter is the interfacial tension,g50.1860.01 dyn/cm. In addition to the interfacial tension, a liearly sloped background on the order of 10% of the peheights is fit. We have also fit our data to a slightly le
FIG. 8. Reflected intensity versusQz for x rays reflected from the oil–microemulsion interface of a C4E1–decane–water mixture. The two symbo~circles and triangles! represent two different data sets from two differesamples measured during two different experimental runs. The solid lina fit to Eq.~21!.
FIG. 9. Intensity of the surface diffuse scattering at fixed incident ana50.068°, plotted as a function of the scattering angle,b. The solid line isa fit to Eq.~8!.
4381Liquid surface spectrometer

ion-e.usdngmeusctene.
f
tiliellatr
vat
ththaahe
onre
reulesso
llretuteein
oi
(6o-
a
the
gbd
by
c-for-the
out
ingout
orentsor
den
hepar-
e-E-
an
ec-ntis-
or
r. Cir-ental
The.
approximate form for the distorted wave Born approximatas given by Sinhaet al.32 There are slight quantitative differences, however, the qualitative features remain the sam
The data in Figs. 8 and 9 are fit simultaneously becaof a small interplay between the roughness value needefit the reflectivity and that needed to fit the diffuse scatteriThis occurs because some diffusely scattered x rays aresured by the detector set for the specular condition. Totract the value for the roughness consistent simultaneowith both reflectivity and diffuse scattering requires subtraing the diffuse scattering from the specular measuremduring the fitting process. This will be discussed elsewher21
B. Thermal expansion coefficient of a perfluorinatedmonolayer at the air–water interface
Grazing incidence x-ray diffraction measurements omonolayer of perfluoro-n-eicosane@F~CF2!20F# at the watersurface were made at X19C. Although this molecule is nosurfactant in the traditional sense of having both hydrophand hydrophobic moieties, nevertheless, it forms wordered monolayers supported on water. It is plausible thdelicate balance between a strongly attractive latefluorocarbon–fluorocarbon interaction and the weakerder Waals forces between the fluorocarbon molecules andwater allows the fluorocarbon molecules to spread oversurface as a single layer. Due to the unusual nature ofmonolayer, it is sensible to ask if it shows some of the chacteristic features of bulk fluorocarbons. For example,earlier study of this monolayer had indicated that it migshow evidence for a structural transition similar to that sefor Teflon. However, our study of the thermal expansicoefficient over the temperature range from 2 to 35 °C pcludes this possibility.17
Monolayers of perfluoro-n-eicosane spread onto a puwater surface form a hexagonal phase with the molecoriented perpendicular to the surface. The studies discuhere were measured on monolayers where the macroscareal density varied from 0.45 to 0.50 nm2 per molecule. Themolecules form ordered monolayer patches whose unit ceconstant over the macroscopic density range studied he
The data shown in Fig. 10 demonstrate the temperadependence of the~0,1! diffraction peaks of three separamonolayers of perfluoro-n-eicosane in the hexagonal phasThe average thermal expansion coefficient of the chachain separation computed from this data is (7.160.8)31025 nm/°C. Although we have not found any studiesthe thermal expansion of bulk fluoroalkanes, this valuesimilar to thermal expansion coefficients of bulk alkanes31025 nm/°C) in the tightly packed low-temperature orthrhombic phase. However, the hexagonal~rotator! phase ofbulk alkanes is more loosely packed and has a much grethermal expansion, of the order of 531024 nm/°C.
The three sets of data shown in Fig. 10 illustraterepeatability of the spectrometer. Data sets B and C wtaken during a single trip to the synchrotron~NSLS!. Slightrealignment of the spectrometer between the spreadinthese two monolayers did not affect these indistinguishadata sets. However, data set A was measured during aferent trip to the synchrotron and is offset from B and C
4382 Rev. Sci. Instrum., Vol. 68, No. 12, December 1997
eto.
ea-x-ly-ts
a
ac-a
alnheeis
r-ntn
-
sedpic
is.re
.–
fs
ter
ere
ofleif-
0.015 nm21 in Qxy . The complete alignment of the spetrometer, including the beamline mirror, is responsiblethis systematic error inQxy . Note that the thermal expansion, indicated by the slope of the data, is essentiallysame for all three data sets.
ACKNOWLEDGMENTS
One of the authors~M.L.S.! acknowledges the follow-ing: Peter Pershan for many stimulating conversations abliquid surface scattering~including the calculation in the Ap-pendix!, John Blanz for conversations about the air bearsupport mechanism, Moshe Deutsch for good advice abspectrometer design, Wilfried Schildkamp for the mirrbender design, Peter Takacs for profilometer measuremof the mirror, and the University of Chicago’s Center fAdvanced Radiation Sources technical support group~in par-ticular, Harold Brewer, Kevin Van der Jack, and ClauPradervand!. This work was supported by the NSF Divisioof Chemistry~M.L.S. and S.A.R.!, CARS at the Universityof Chicago ~M.L.S.!, the University of Illinois at Chicago~M.L.S.!, and acknowledgment is made to the donors of TPetroleum Research Fund, administered by the ACS, fortial support of this research~M.L.S.!. Brookhaven NationalLaboratory is supported by the Division of Materials Rsearch, U.S. Department of Energy, under Contract No. DAC02-76CH00016.
APPENDIX: ENERGY ERROR DUE TO ALIGNMENT
Although most of the techniques we intend to use caccommodate the small energy changes that occur asx ischanged, the measurement of differential anomalous refltivity requires a very constant incident energy for all incideangles. It can be shown that if the incoming beam is maligned from thex axis by an anglee in the vertical and anangled in the horizontal~see Fig. 11!, then the change in theangleF required to reorient the monochromator crystal fBragg reflection at a particular energy isDF;ex2(1/2)dx2. To see this, writek in,m in ~j,h,z! space includ-ing the effect ofe andd ~see Fig. 12!,
FIG. 10. Diffraction peak centerQxy as a function of the substrate watetemperature. Data are shown for three separately prepared monolayerscular and square symbols represent data taken during the same experimrun; the triangles refer to data taken during a different experimental run.line is a least-squares linear fit to the data represented by the triangles
Liquid surface spectrometer

gm
sora
-
ar
ene-
ec-
a
ki-
of-
eris
ev.
.
v. A
.
g,
A.
-
l.
-
.
o,
L.
t-
n
k in,m5k„cos~e!cos~d!,sin~e!,cos~e!sin~d!…. ~A1!
For x50, the reciprocal lattice vector can be written as
t5t„2cos~p/22uB2d!,0,sin~p/22uB2d!…. ~A2!
Using the Bragg condition,22t•k5t2, it is easily foundthat t252kt cos(e)sin(uB) or t/2k5sin(uB) to first order ine.
By considering the projection oft into thej–z plane forxÞ0, it is seen that thej component oft is independent ofx~Fig. 12!. This allows us to write, forxÞ0,
t5t„2cos~p/22uB2d!,cos~uB1d!sin~x!,
3cos~uB1d!cos~x!…. ~A3!
Using the Bragg condition, Eq.~A3! leads to
t
2k>sin~uB!2ex1dx2/2, ~A4!
to first order ind and e. The first term is the usual Bragcondition. The remaining two terms yield the deviation frothe Bragg condition that we wanted to calculate.
Correct alignment of both the 3-circleQ axis ~to setdequal to zero! and the tilt of the monochromator tank~to sete equal to zero! can be used to maintain constant energy afunction of incident angle. This alignment proceeds as flows: Once the beam is adjusted to go through the centethe 3-circle, two adjustments must be made to align the behorizontally ~d! and vertically~e!. Both alignments are carried out by rotating the monochromator crystal, using theFstage, to be parallel to the beam for two values ofx that varyby 180°. To determine if the monochromator crystal is p
FIG. 11. Illustration of misalignment betweenk in,m and thex axis ~collinearwith thej axis!. The angular deviation in the horizontal isd; the deviation inthe vertical ise.
FIG. 12. Projection into thej–z plane of the monochromator reflectiokinematics when a misalignment exists betweenk in,m and thex axis ~col-linear with thej axis! as illustrated in Fig. 11.
Rev. Sci. Instrum., Vol. 68, No. 12, December 1997
al-ofm
-
allel to the beam, the crystal is placed into the beam andF isrocked. As long as the crystal is well within the beam, ththe peak in the intensity will have a maximum that corrsponds to the crystal being parallel to the beam. If the twoFvalues required for parallelism are different, then a corrtion of half the difference is made. To adjustd, the two xpositions used are1/290° and the correction is made byQ motion ~3-circleQ stage!. To adjuste, the twox positionsused are 0° and 180° and the correction is made by thenematic mount on the monochromator tank.
A typical alignment of the spectrometer is capablereducingDE/E to less than 5 eV over the full range of reflection angles without too much difficulty. Given the othlimitations in energy resolution at X19C, this resolutionadequate.
1D. Sluis and S. A. Rice, J. Chem. Phys.79, 5658~1983!.2L. Bosio and M. Oumezine, J. Chem. Phys.80, 959 ~1984!.3A. H. Weiss, M. Deutsch, A. Braslau, B. M. Ocko, and P. S. Pershan, RSci. Instrum.57, 2554~1986!.
4J. Als-Nielsen, F. Christensen, and P. S. Pershan, Phys. Rev. Lett48,1107 ~1982!.
5J. Als-Nielsen and P. S. Pershan, Nucl. Instrum. Methods Phys. Res.208,545 ~1983!.
6P. S. Pershan, A. Braslau, A. H. Weiss, and J. Als-Nielsen, Phys. Re35, 4800~1987!.
7P. S. Pershan, J. Phys.~Paris!, Colloq. 50, C7 ~1989!.8D. K. Schwartz, M. L. Schlossman, and P. S. Pershan, J. Chem. Phys96,2356 ~1992!.
9S. W. Barton, B. N. Thomas, E. B. Flom, S. A. Rice, B. Lin, J. B. PenJ. B. Ketterson, and P. Dutta, J. Chem. Phys.89, 2257~1988!.
10B. Lin, Ph.D. thesis~Northwestern University, 1990!.11K. M. Robinson and J. A. Mann, J. Phys. Chem.95, 2456~1991!.12B. R. McClain, Ph.D. thesis~M.I.T., 1994!.13L. Bosio, R. Cortes, G. Folcher, and M. Oumezine, Rev. Phys. Appl.20,
437 ~1985!.14J. Penfold and R. K. Thomas, J. Phys.: Condens. Matter2, 1369~1990!.15Y. R. Shen, Annu. Rev. Phys. Chem.40, 327 ~1989!.16K. B. Eisenthal, Annu. Rev. Phys. Chem.43, 627 ~1992!.17Z. Huang, M. L. Schlossman, A. A. Acero, Z. Zhang, N. Lei, and S.
Rice, Langmuir11, 2742~1995!.18Z. Huang, A. A. Acero, N. Lei, S. A. Rice, Z. Zhang, and M. L. Schlo
ssman, J. Chem. Soc. Faraday Trans.92, 545 ~1996!.19N. Lei, Z. Huang, and S. A. Rice, J. Chem. Phys.104, 4802~1996!.20S. M. Williams, Z. Zhang, D. Mitrinovic, and M. L. Schlossman, Bul
Am. Phys. Soc.41, 174 ~1996!.21S. M. Williams, Z. Zhang, D. Mitrinovic, Z. Huang, and M. L. Schloss
man ~unpublished!.22B. Lin, M. L. Schlossman, M. Meron, Z. Huang, P. J. Viccaro, S. M
Williams, T. Morkved, and H. Jaeger~unpublished!.23B. Lin, M. L. Schlossman, M. Meron, S. M. Williams, and P. J. Viccar
Rev. Sci. Instrum.67, 1 ~1996!.24P. S. Pershan, Faraday Discuss. Chem. Soc.89, 231 ~1990!.25J. Als-Nielsen, D. Jacquemain, K. Kjaer, F. Leveiller, M. Lahav, and
Leiserowitz, Phys. Rep.246, 251 ~1994!.26S. Dietrich and A. Haase, Phys. Rep.260, 1 ~1995!.27M. L. Schlossman and P. S. Pershan, inLight Scattering by Liquid Sur-
faces and Complementary Techniques, edited by D. Langevin~MarcelDekker, New York, 1992!, p. 365.
28J. Als-Nielsen and K. Kjaer, inPhase Transitions in Soft Condensed Mater, edited by T. Riste and D. Sherrington~Plenum, New York, 1989!, p.145.
29M. L. Schlossman, inEncyclopedia of Applied Physics, edited by G. L.Trigg ~VCH, New York, 1997!, Vol. 20, p. 311.
30M. Born and E. Wolf,Principles of Optics~Pergamon, Oxford, 1980!.31L. G. Parratt, Phys. Rev.95, 359 ~1954!.32S. K. Sinha, E. B. Sirota, S. Garoff, and H. B. Stanley, Phys. Rev. B38,
2297 ~1988!.33F. P. Buff, R. A. Lovett, and F. H. Stillinger, Phys. Rev. Lett.15, 621
~1965!.
4383Liquid surface spectrometer

ha
M
. S
en
-
ak
G
oro,
it-
etts
A
0–
n,
er,nn,J.
34O. M. Magnussen, B. M. Ocko, M. J. Regan, K. Penanen, P. S. Persand M. Deutsch, Phys. Rev. Lett.74, 4444~1995!.
35M. J. Regan, E. H. Kawamoto, S. Lee, P. S. Pershan, N. Maskil,Deutsch, O. M. Magnussen, and B. M. Ocko, Phys. Rev. Lett.75, 2498~1995!.
36S. Dietrich and H. Wagner, Z. Phys. B56, 207 ~1984!.37D. K. Schwartz, M. L. Schlossman, E. H. Kawamoto, G. J. Kellogg, P
Pershan, and B. M. Ocko, Phys. Rev. A41, 5687~1990!.38A. Braslau, P. S. Pershan, G. Swislow, B. M. Ocko, and J. Als-Niels
Phys. Rev. A38, 2457~1988!.39R. S. Becker, J. A. Golovchenko, and J. R. Patel, Phys. Rev. Lett.50, 153
~1983!.40S. Dietrich and H. Wagner, Z. Phys. B59, 35 ~1985!.41H. Dosch, Phys. Rev. B35, 2137~1987!.42H. Dosch, B. W. Batterman, and D. C. Wack, Phys. Rev. Lett.56, 1144
~1986!.43R. Feidenhans’l, Surf. Sci. Rep.10, 105 ~1989!.44W. C. Marra, P. Eisenberger, and A. Y. Cho, J. Appl. Phys.50, 6927
~1979!.45A. Zangwill, Physics at Surfaces~Cambridge University Press, Cam
bridge, 1988!.46Ordela, Oak Ridge Detector Laboratory, Inc., 139 Valley Court, O
Ridge, Tennessee 37830.47M. Stamm, G. Reiter, and S. Huttenbach, Physica B156&157, 564
~1989!.48J. Penfold, J. Phys.~Paris!, Colloq. 50, C7 ~1989!.49G. P. Felcher, R. O. Hilleke, R. K. Crawford, J. Haumann, R. Kleb, and
Ostrowski, Rev. Sci. Instrum.58, 609 ~1987!.50J. M. Bloch and P. Eisenberger, Nucl. Instrum. Methods Phys. Res. B31,
468 ~1988!.51Osmic, Inc., 1788 Northwood Drive, Troy, MI 48084.
4384 Rev. Sci. Instrum., Vol. 68, No. 12, December 1997
n,
.
.
,
.
52N. Lei, Z. Huang, and S. A. Rice~unpublished!.53Huber Diffraktionstechnik GmBH, D-8219 Rimsting, Germany.54Blake Industries, Inc., 660 Jerusalem Road, NJ 07076.55Dover Instrument Corp., 200 Flanders Road, P. O. Box 200, Westb
MA 01581.56Newport Research Corp., 1791 Deere Avenue, Irvine, CA 92714.57JRS, J. R. Sandercock, Zwillikerstrasse 8, CH-8910 Affoltern a.A., Sw
zerland.58Heidenhain Corp., 115 Commerce Dr., Schaumburg, IL 60173.59Certified Scientific Software, P. O. Box 640, Cambridge, Massachus
02139.60DSP Technology Inc., 48500 Kato Road, Fremont, CA 94538-7338.61Bicron Corp., 12345 Kinsman Road, Newbury, OH 44065-9677.62Kinetic Systems Corp., 11 Maryknoll Drive, Lockport, IL 60441.63EG&G Ortec, 100 Midland Road, Oak Ridge, TN 37831-0895.64Advanced Control Systems Corp., Old Mine Rock Road, Hingham, M
02043.65National Instruments, 6504 Bridge Point Parkway, Austin, TX 7873
5039.66Keithley Instruments, 28775 Aurora Road, Cleveland, Ohio 44139.67L. T. Lee, D. Langevin, and B. Farnoux, Phys. Rev. Lett.67, 2678~1991!.68B. R. McClain, D. D. Lee, B. L. Carvalho, S. G. J. Mochrie, S. H. Che
and J. D. Litster, Phys. Rev. Lett.72, 246 ~1994!.69M. Kahlweit and R. Strey, Angew. Chem. Int. Ed. Engl.24, 654 ~1985!.70M. Kahlweit and R. Strey, J. Phys. Chem.90, 5239~1986!.71M. Kahlweit and R. Strey, J. Phys. Chem.91, 1553~1987!.72M. Kahlweit, R. Strey, D. Haase, H. Kunieda, T. Schmeling, B. Faulhab
M. Borkovec, H.-F. Eicke, G. Busse, F. Eggers, T. Funck, H. RichmaL. Magid, O. Soderman, P. Stilbs, J. Winkler, A. Dittrich, and W. Jahn,Colloid Interface Sci.118, 436 ~1987!.
73L. Nevot and P. Croce, Rev. Phys. Appl.15, 761 ~1980!.
Liquid surface spectrometer