Virtis : an imaging spectrometer for the rosetta mission
31
VIRTIS: AN IMAGING SPECTROMETER FOR THE ROSETTA MISSION A. CORADINI 1 , F. CAPACCIONI 2,∗ , P. DROSSART 3 , G. ARNOLD 4 , E. AMMANNITO 1 , F. ANGRILLI 5 , A. BARUCCI 3 , G. BELLUCCI 1 , J. BENKHOFF 18 , G. BIANCHINI 5 , J. P. BIBRING 9 , M. BLECKA 14 , D. BOCKELEE-MORVAN 3 , M. T. CAPRIA 2 , R. CARLSON 15 , U. CARSENTY 4 , P. CERRONI 2 , L. COLANGELI 7 , M. COMBES 3 , M. COMBI 11 , J. CROVISIER 3 , M. C. DESANCTIS 2 , E. T. ENCRENAZ 3 , S. ERARD 3 , C. FEDERICO 16 , G. FILACCHIONE 2 , U. FINK 13 , S. FONTI 6 , V. FORMISANO 1 , W. H. IP 17 , R. JAUMANN 4 , E. KUEHRT 4 , Y. LANGEVIN 9 , G. MAGNI 2 , T. MCCORD 12 , V. MENNELLA 7 , S. MOTTOLA 4 , G. NEUKUM 4 , P. PALUMBO 7 , G. PICCIONI 2 , H. RAUER 4 , B. SAGGIN 5 , B. SCHMITT 10 , D. TIPHENE 3 and G. TOZZI 8 1 INAF, Istituto di Fisica Dello Spazio Interplanetario, Area di Ricerca di Tor Vergata, Via del Fosso del Cavaliere, 00133 Roma, Italy 2 INAF, Istituto di Astrofisica Spaziale e Fisica Cosmica, Roma, Italy 3 LESIA Observatoire de Paris Meudon, France 4 DLR, Berlin, Germany 5 Dipartimento di Ingegneria Meccanica, Universit` a di Padova 6 Dipartimento di Fisica, Universit` a di Lecce, Italy 7 Osservatorio di Capodimonte, Napoli, Italy 8 Osservatorio Astrofisico di Arcetri, Firenze, Italy 9 Institut d’Astrophysique Spatial CNRS, Orsay, France 10 Laboratoire de Glaciologie et Geophysique de l’Environment, Grenoble, France 11 Space Physics Research Laboratory, The University of Michigan, Ann Arbor, USA 12 Department of Earth and Space Science, University of Washington, Seattle, USA 13 Lunar Planetary Laboratory, University of Arizona, Tucson, USA 14 Polish Academy of Sciences, Warsaw, Poland 15 NASA JPL, Pasadena, USA 16 Universit` a di Perugia, Italy 17 MPI, Katlenburg, Germany 18 ESTEC, The Netherlands ( ∗ Author for correspondence: E-mail: [email protected]) (Received 24 October 2006; Accepted in final form 29 November 2006) Abstract. The VIRTIS (Visual IR Thermal Imaging Spectrometer) experiment has been one of the most successful experiments built in Europe for Planetary Exploration. VIRTIS, developed in cooperation among Italy, France and Germany, has been already selected as a key experiment for 3 planetary missions: the ESA-Rosetta and Venus Express and NASA-Dawn. VIRTIS on board Rosetta and Venus Express are already producing high quality data: as far as Rosetta is concerned, the Earth- Moon system has been successfully observed during the Earth Swing-By manouver (March 2005) and furthermore, VIRTIS will collect data when Rosetta flies by Mars in February 2007 at a distance of about 200 kilometres from the planet. Data from the Rosetta mission will result in a comparison – using the same combination of sophisticated experiments – of targets that are poorly differentiated and are representative of the composition of different environment of the primordial solar system. Comets and asteroids, in fact, Space Science Reviews (2007) 128: 529–559 DOI: 10.1007/s11214-006-9127-5 C Springer 2007
-
Upload
independent -
Category
Documents
-
view
3 -
download
0
Transcript of Virtis : an imaging spectrometer for the rosetta mission
VIRTIS: AN IMAGING SPECTROMETERFOR THE ROSETTA MISSION
A. CORADINI1, F. CAPACCIONI2,∗, P. DROSSART3, G. ARNOLD4,E. AMMANNITO1, F. ANGRILLI5, A. BARUCCI3, G. BELLUCCI1, J. BENKHOFF18,
G. BIANCHINI5, J. P. BIBRING9, M. BLECKA14, D. BOCKELEE-MORVAN3,M. T. CAPRIA2, R. CARLSON15, U. CARSENTY4, P. CERRONI2, L. COLANGELI7,
M. COMBES3, M. COMBI11, J. CROVISIER3, M. C. DESANCTIS2,E. T. ENCRENAZ3, S. ERARD3, C. FEDERICO16, G. FILACCHIONE2, U. FINK13,
S. FONTI6, V. FORMISANO1, W. H. IP17, R. JAUMANN4, E. KUEHRT4,Y. LANGEVIN9, G. MAGNI2, T. MCCORD12, V. MENNELLA7, S. MOTTOLA4,
G. NEUKUM4, P. PALUMBO7, G. PICCIONI2, H. RAUER4, B. SAGGIN5,B. SCHMITT10, D. TIPHENE3 and G. TOZZI8
1INAF, Istituto di Fisica Dello Spazio Interplanetario, Area di Ricerca di Tor Vergata,Via del Fosso del Cavaliere, 00133 Roma, Italy
2INAF, Istituto di Astrofisica Spaziale e Fisica Cosmica, Roma, Italy3LESIA Observatoire de Paris Meudon, France
4DLR, Berlin, Germany5Dipartimento di Ingegneria Meccanica, Universita di Padova
6Dipartimento di Fisica, Universita di Lecce, Italy7Osservatorio di Capodimonte, Napoli, Italy
8Osservatorio Astrofisico di Arcetri, Firenze, Italy9Institut d’Astrophysique Spatial CNRS, Orsay, France
10Laboratoire de Glaciologie et Geophysique de l’Environment, Grenoble, France11Space Physics Research Laboratory, The University of Michigan, Ann Arbor, USA12Department of Earth and Space Science, University of Washington, Seattle, USA
13Lunar Planetary Laboratory, University of Arizona, Tucson, USA14Polish Academy of Sciences, Warsaw, Poland
15 NASA JPL, Pasadena, USA16Universita di Perugia, Italy17MPI, Katlenburg, Germany
18ESTEC, The Netherlands(∗Author for correspondence: E-mail: [email protected])
(Received 24 October 2006; Accepted in final form 29 November 2006)
Abstract. The VIRTIS (Visual IR Thermal Imaging Spectrometer) experiment has been one ofthe most successful experiments built in Europe for Planetary Exploration. VIRTIS, developed incooperation among Italy, France and Germany, has been already selected as a key experiment for 3planetary missions: the ESA-Rosetta and Venus Express and NASA-Dawn. VIRTIS on board Rosettaand Venus Express are already producing high quality data: as far as Rosetta is concerned, the Earth-Moon system has been successfully observed during the Earth Swing-By manouver (March 2005)and furthermore, VIRTIS will collect data when Rosetta flies by Mars in February 2007 at a distanceof about 200 kilometres from the planet.
Data from the Rosetta mission will result in a comparison – using the same combination ofsophisticated experiments – of targets that are poorly differentiated and are representative of thecomposition of different environment of the primordial solar system. Comets and asteroids, in fact,
Space Science Reviews (2007) 128: 529–559DOI: 10.1007/s11214-006-9127-5 C© Springer 2007

530 A. CORADINI ET AL.
are in close relationship with the planetesimals, which formed from the solar nebula 4.6 billion yearsago. The Rosetta mission payload is designed to obtain this information combining in situ analysisof comet material, obtained by the small lander Philae, and by a long lasting and detailed remotesensing of the comet, obtained by instrument on board the orbiting Spacecraft. The combination ofremote sensing and in situ measurements will increase the scientific return of the mission. In fact,the “in situ” measurements will provide “ground-truth” for the remote sensing information, and, inturn, the locally collected data will be interpreted in the appropriate context provided by the remotesensing investigation. VIRTIS is part of the scientific payload of the Rosetta Orbiter and will detectand characterise the evolution of specific signatures – such as the typical spectral bands of mineralsand molecules – arising from surface components and from materials dispersed in the coma. Theidentification of spectral features is a primary goal of the Rosetta mission as it will allow identificationof the nature of the main constituent of the comets. Moreover, the surface thermal evolution duringcomet approach to sun will be also studied.
Keywords: comets, spectroscopy, space missions
Introduction
Comets are a heterogeneous class of objects as they accreted in the region spanningfrom Jupiter to Neptune or beyond, where the thermodynamical conditions weregreatly inhomogeneous at the time of the Solar System formation (Rickman andHuebner, 1990). Comets are believed to be the most primitive objects in the SolarSystem, because they spend their life in a cold environment and are unlikely to bedeeply thermally altered. When a comet enters the inner Solar System a coma isformed by the sublimation of ices, followed by dust ejection and differentiation ofthe subsurface layers.
Information about comets is derived by observations, experiments, modellingand space data.
The comets visited by space mission revealed large differences between themindicating that comets are very heterogeneous. However common characteristic canbe observed.
It is usually assumed, both in interpreting observations, spacecraft data and inmodelling the evolution of nuclei, that comet nuclei are porous, low-density objects.Recent results from Deep Impact mission indicate very low density (600 kg/m3orless) for comet Tempel 1 (A’Hearn et al., 2005). The high porosity helps in theinterpretation of the observed cometary activity, which otherwise would not beeasily explained if it were assumed that volatiles are present only on the cometsurface. The observations of Tempel 1 confirm the important role of subsurfaceemission. It is significant that the extent of water ice on Tempel 1’s surface is notsufficient to produce the observed abundance of water flux observed in the comet’scoma (A’Hearn et al., 2005; Sunshine et al., 2006) so the main source should be aquite uniform subsurface source.
At the opposite, the dust and gas production of comet P/Halley was foundto come from a limited number of discrete sources, with the rest of the surface

VIRTIS: AN IMAGING SPECTROMETER FOR THE ROSETTA MISSION 531
almost completely inactive (Keller et al., 1988). P/Halley is thus heterogeneous anddisplays two different unit: the first dominated by brighter materials, which could beinterpreted as ices; the second characterised by darker materials, probably alteredassemblies such as complex organic and secondary inorganic (Keller et al., 1988).
Photometrically corrected images of comet Borrelly emphasize that the nucleushas distinct, contiguous terrains covered with either bright or dark, smooth or mot-tled materials (Oberst et al., 2004).
The spatial and temporal irregularity of the nucleus activity leads to a non-uniform surface, with topographic features and roughness at different scales. There-fore the ability to combine imaging with spectroscopy is essential in order to localizeactive areas and to determine their composition and the composition of generatedgases.
The nature of the solid compounds of the comets (silicates, oxides, salts, or-ganics and ices) is still unknown. These chemical compounds can be identified byinfrared spectroscopy using high spatial resolution imaging to map the heteroge-neous parts of a nucleus and high spectral resolution spectroscopy to determine thecomposition unambiguously. The importance of the IR spectroscopy in identifyingthe characteristics of cometary nuclei has been recently shown by the investiga-tion performed by the Deep Impact team on comet 9P/Tempel 1. Sunshine et al.(2006) report detection of solid water ice deposits exposed on the surface of comet9P/Tempel 1. Three anomalously coloured areas have been shown to include wa-ter ice on the basis of their near-infrared spectra, which present diagnostic waterice absorptions at wavelengths of 1.5 and 2.0 μm. Moreover the infrared part ofVIRTIS can be used to infer the temperature of the nucleus as has been done byanalysing the thermal spectrum of 9P/Tempel 1 (1.05 to 4.8 μm).
The VIRTIS experiment will be extremely important also in the study ofcometary coma. The visual and infrared spectrum of the comet coma is charac-terised by a number of components comprising both gas emission bands and adust continuum (Bocklee-Morvan and Crovisier, 1992). Ground-based visual spec-troscopy has detected various atomic, radical and ionic species formed throughphoto-dissociation by solar ultraviolet radiation of the so-called “parent” moleculeswhich are sublimated from the nucleus and possibly from a halo of volatile grains.Previous IR comet observations have shown that various hydrocarbons show emis-sion bands between 3 and 4 μm (Brooke et al., 1996).
Scientific Objectives
An Hyperspectral Imager, like VIRTIS, covering a wide wavelength range from thenear UV (0.25 μm) to the near IR (5.0 μm) and having moderate to high spectralresolution and imaging capabilities – is an essential instrument for the determinationof the comet global (size, shape, albedo, etc.), and local (mineralogical features,topography, roughness, dust and gas production rates, etc.) properties. The mainscientific objectives of the ROSETTA-VIRTIS instrument will be achieved through

532 A. CORADINI ET AL.
a combination of the high spatial resolution channels (-M) and a high spectralresolution channel (-H). These objectives are: (1) to determine the nature of thesolids on the nucleus surface (composition of ices, dust and characterisation oforganic compounds); (2) to identify the gaseous species; (3) to monitor the gaseousactivity, and its spatial distribution; (4) to characterise the physical conditions ofthe coma, to measure the temperature of the nucleus; (5) to help the selection ofthe landing sites and to give support for other instruments.
In the original ROSETTA mission scenario, the target was comet P/Wirtanen.The delay in the launch of the Rosetta mission has obliged the Rosetta project to se-lect Comet 67P/CHURYUMOV-GERASIMENKO (hereafter C-G). as the missiontarget.
As the target of a key cometary mission, all the observations of C-G taken duringits sixth apparition were re-examined. C-G is unusually active for a short-periodcomet with the period of 6.6 yr. Comet activity is characterized by outbursts aroundthe perihelion passage. Unfortunately little is known about C-G but some prelim-inary evaluation of the comet physical parameters, such as surface temperature,percentage of active surface, intensity of gas and dust fluxes has been already doneon the basis of ground based observations (Cochran et al., 1992; A’Hearn et al.,1995; Schulz et al., 2004) as well as of theoretical modes (Coradini et al., 2004; DeSanctis et al., 2005). C-G is larger than 46P/Wirtanen, the initial target for whichthe ROSETTA mission was designed. Like P/Wirtanen, C-G is a Jupiter familycomet with a perihelion distance of 1.29 AU and a period of 6.57 yr.
Tancredi et al. (2000) estimated a radius of 2.5 km for 67P/Churyumov-Gerasimenko, one of the largest of the Jupiter family comets. Radar observations(Kamoun et al., 1998) seem to indicate an even larger radius (upper limit of 3.7 km).Similarly, the observations by Mueller (1992) give a radius of 3.2 km with an albedoof 0.03. Like P/Wirtanen, C-G underwent to a recent orbital change, as noted byBeliaev et al. (1986) and Carusi et al. (1985). Both papers agree about the fact thatC-G should have had close encounters with Jupiter in 1840 and 1959 that reducedthe perihelion distance significantly. Usually these events tend to rapidly increasethe comet’s activity, as shown by Coradini et al. (1997a,b) and De Sanctis et al.(2005) who developed thermal evolution models for this comet. The main char-acteristics of C-G is 67P/Churyumov-Gerasimenko to be a dusty comet (Kiselev,1998) and combining the estimated radius of the nucleus (Tancredi et al., 2000) withthe production rates (Osip et al., 1992) it seems that the active area of the nucleusof 67P/Churyumov-Gerasimenko should be about 6% (Kidger, 2003, 2004).
The comet lightcurves show outbursts at perihelion with strong similarities inthe 1982–1983, 1996–1997 and 2002–2003 apparitions, suggesting that the cometbehavior is similar over several returns or with a slight increase with successivepassages. A pre/post-perihelion asymmetry with a peak water production of is 1.0× 1028 mol/s has been reported (Schulz et al., 2004). With the available data itis difficult to say if minor species production rates are constant or peaked aroundperihelion.

VIRTIS: AN IMAGING SPECTROMETER FOR THE ROSETTA MISSION 533
Overall 67P/Churyumov-Gerasimenko has a dust production rate an or-der of magnitude greater at the same heliocentric distance post-perihelion as46P/Wirtanen, but 46P/Wirtanen has greater maximum dust production immedi-ately prior to perihelion (Kidger, 2004).
The observed coma morphology of this comet suggests the presence of areasof enhanced activity on the comet surface, but at the moment the exact locationand the percentage of active/non active regions is under debate and needs furtherdetailed investigation. Recent thermal evolution models indicate that if the wholenucleus, assumed with a radius of 2 km, is active than the production rate must belarger than the observed one. This result could indicate that the comet radius iseither smaller than 2 km or that the gas production is limited to some regions ofthe surface, or alternatively, that the gas source is located beneath the surface (DeSanctis et al., 2005).
COMET NUCLEUS AND THE ROLE OF VIRTIS
One of the main goals of the Rosetta mission is the determination of the globalcharacteristics of the nucleus. On the basis of the present knowledge and mod-els (Capria et al., 2003; Prialnik et al., 2004; De Sanctis et al., 2005), the upperlayer is expected to be partly or even completely depleted of the most volatile icesdue to ice sublimation: however the presence on the surface of localised ice-richareas cannot be excluded. The reflectance of the comet surface is expected to bevery low. in situ GIOTTO observations show an albedo of 0.04 of comet Hal-ley (Keller et al., 1988). Similarly low albedoes have been measured for cometBorelly, Wild 2 and comet Tempel 1 (Oberst et al., 2004; A’Hearn et al., 2005).Considerable reduction of reflectivity of pure ice is achieved even with very smallamounts of inclusions of dark and/or absorbing materials: the pure snow reflec-tivity which, in the visible, is approximately 0.9, can be reduced to less than0.3 with a dust to ice mass ratio of only 10−3 (Clark, 1981). The most abundantspecies are H2O (more than 80%), CO, CH3OH, and CO2, H2CO (NH3 being lessabundant).
If the observations and models are correct, we expect to find different kindof surfaces: dust covered regions characterized by subsurface emission, inactiveregions, and active regions, where outgassing is strongly localised. The inactiveareas are probably devolatilized areas covered with dust, the active area may becharacterised by the presence of ice processed during the earlier heating periods.These areas can evolve in time, and possibly their properties will change in timeduring the Rosetta mission. Radiation processes may have altered the primarymineral phases, as well as the ices (H2O, CH3OH, etc.). Simple hydrocarbonscould have been polymerised and gas-solid processes could have altered primarysilicates. Secondary phyllosilicates Fe-oxides (magnetite) and some salts may havebeen formed. All these elements should be searched for. Only the inner frozen

534 A. CORADINI ET AL.
nucleus should contain unaltered components, even if some degree of alterationhas happened (Haruyama et al., 1993; Choi et al., 2002; De Sanctis et al., 2005).The spectral characteristics of comet nuclei are likely to show features linked withthe mineralogical composition and presence of ices. The wavelength range from0.25 up to 5 μm is diagnostic for ices, minerals and organic compounds. Moreoverwithin a distance of 3 AU from the Sun the long wavelength part of the spectrum canbe used to study the comet surface temperatures. Global mapping of the nucleuswill provide important information about the distribution of minerals, inorganicand organic ices. The exact identification of organic material requires a spectralresolving power above 1000. For this objective observation of -M will be supportedby -H channel. Temperature distribution and temperature monitoring of active andinactive areas compared with the spectral albedo maps and gas production willallow study of the thermal properties and thermal balance of the nucleus and toinfer the comet subsurface composition. An inventory of the main topographicfeatures will help clarify the geological history and the evolution of the comet.In fact these bodies receive most of their energy from the outside, and geologicalhistory is strongly related to their thermal history and to their topography (Coradiniet al., 1997a,b). Secondary minerals, such as phyllosilicates, have water and OHabsorption features in the 2.9–3.3 μm range, and at 1.4 and 1.9 μm. The presence ofthe 1.4 and 1.9 μm bands is indicative of undissociated water in the mineral, whilethe presence of the 1.4 μm band alone suggests OH groups like hydroxyls. Theexact position of these bands should be diagnostic of the mineralogy of the comet.Several absorption bands of water ice fall in the near infrared. Other ices, like NH3,CO2 or H2S can also be identified by their typical spectral features. In laboratoryspectra of hydrocarbon ices (C2H2, C2H4, C2H6, C3H8, CH4) are reported. A globalmapping of the nucleus at these wavelengths will give important information onthe surface mineralogy, on the molecular compositions of organic compounds inthe mantle and on the presence of ices. These observations will provide an accuratemeasure of the dust and gas production rate from localised activity regions thusproviding some knowledge of the comet subsurface composition and a map ofactive regions (for typical expected spectra see Coradini et al., 1998).
COMA CHARACTERISATION
When the comet enters the inner Solar System, the volatiles are released to form atransient atmosphere around the nuclei. Ground based spectroscopy provided theidentification of various atomic and molecular species. The optical spectra of cometsare characterised by emissions from radicals and ions, while the infrared part of thespectra is more useful for the direct investigations of molecules (Bocklee-Morvanand Crovisier, 1992, see also the book Comets II and references therein). The in situanalysis of comet activity could give information on controversial topics concerningthe formation and the composition of a comet atmosphere. The VIRTIS instrument

VIRTIS: AN IMAGING SPECTROMETER FOR THE ROSETTA MISSION 535
can make an extremely valuable contribution to the coma science. Its extensivewavelength coverage over more than four spectral octaves from 0.25 to 5.0 μmmeans that many different types of molecules can be investigated, starting with thestrong 0.29 μm UV OH emission to the 4.7 μm fundamental CO band. Essentiallyall the fundamental bands of important molecules are covered. This large spectralrange coupled with good spectral resolution is combined with the excellent spatialresolution required for the investigation of many of the near nucleus phenomena.A considerable enhancement for the coma science is furthermore obtained by com-bining the spot measurements of the high spectral resolution channel -H with thespatial resolution and field of view of the lower spectral resolution channel -M.Thanks to ground-based and space-borne spectroscopic observations, quantitativedetection of various volatiles has been possible: H2O, CO2, H2CO, CH3OH, H2S,HCN, CO and CH4.
Observations of comets C/1996 B2 (Hyakutake) and C/1995 O1 (Hale-Bopp)have led to the identification of C2H6 (Mumma et al., 1996) and C2H2 (Brookeet al., 1996).
It has also been shown that atoms, radicals, and ions, not expected to be produceddirectly from the nucleus, are important constituents of comet coma (Festou et al.,1986). The formation of such species results from the photolysis of the parentmolecules initially incorporated in the ice and/or in the grains, and subsequent phasereactions. Past IR comet observations have shown that various hydrocarbons, notfully identified (possibly Polycyclic Aromatic Hydrocarbons, PAH) show emissionbands between 3 and 4 μm (Combes et al., 1988). Apart from contribution fromknown molecules such as CH3OH and possibly H2CO, other molecules rangingfrom small to large or even possibly grains, have to be present in the spectrum. Thespectral region 2.6–2.9 μm will be extremely useful to study the thermodynamicsof the coma. In fact, in this region a number of roto-vibrational bands of water(ν1, ν3 fundamental bands and several hot bands) are present. The inversion of thespectrum by means of numerical models of fluorescence excitation and radiativetransfer for the water bands in this spectral region will retrieveal of the waterrotational temperature, Trot, as well as the water ortho-to-para ratio, OPR (Crovisieret al., 1996; Crovisier et al., 1997). The knowledge of Trot coupled with the results ofhydrodynamical model of the cometary atmosphere expansion provides informationon the thermodynamical conditions inside the coma. On the other hand the relativeabundance of the ortho and para nuclear spin species of comet water, cannot bemodified neither by radiative processes nor by collisions but is believed to bedetermined mainly by the temperature at which water was last equilibrated. Thisshall provide indications on the primordial stages of cometary formation (Mummaet al., 1987). Observations comet C/1995 O1 (Hale-Bopp) with ISO/SWS at aspectral resolution of 1500, similar to the VIRTIS-H resolution, have indeed allowedto retrieve the rotational structure of the H2O band at 2.7 micron, with temperaturemeasurement Trot = 28.5 L, and an ortho/para ratio of 2.45, suggesting that cometH2O molecules where formed at low temperature (Crovisier et al., 1997).

536 A. CORADINI ET AL.
Another capability of the high spectral resolution channel is the detection ofisotopic species, such as 13CO, H2
17O, H218O or HDO with long integration times.
Thanks to the wide VIRTIS spectral coverage in the visible and UV it will be pos-sible to detect the important emissions of OH (0.28 and 0.31 μm), the main waterdissociation product and CN in addition to those of C3, NH, CH and CO+. In theoptical region the emission of the comet ions could be observed: CH+, CO+, H2O+,N+
2 . These ions are produced by several ionisation mechanisms, and the produc-tion rate is related to the Sun direction, the solar wind conditions, and solar fieldradiation. In the optical part of the comet spectrum various emission features of theneutral radicals CN, C2 and NH2 can be detected. The spectrum contains, possibly,the emissions of O(1D), a feature associated with the dissociation of water, and thewater ion H2O+. The 1 to 5 μm region is useful for investigations of molecules,because resonant fluorescent excitation is efficient there. The spectrum consists ofemission bands superimposed on a background continuum. The strongest featureis the band of H2O at 2.7 μm. The infrared portion of the spectrum is rich in funda-mental rotovibrational emissions of a number of important parent molecules: H2O,CO2, H2CO, CH3OH, CO etc.. In the 2.5–5 micron range ISO/Phot-S observationsof comet C/1995 O1 (Hale-Bopp) show early CO2 emission, when the comets wasstill at 4.6 AU from the Sun. CO2 could therefore be detected early in the coma,in addition to CO and H2O emissions (Crovisier et al., 1996, 1997). Condensedmolecules in the grains ejected in the coma can be studied in the solar reflectedspectrum and in emission.
The observations of absorption features due to light scattering by organic parti-cles will be difficult. Above 3 μm, where the strong bands of these particles arise,the spectrum is dominated by the emission near perihelion while at larger distancesthe number density of particles is strongly reduced. The main possibility for theobservation of grains is therefore the emission features of fundamental bands, i.e.,as for gaseous compounds, above 2.5 μm. Below 5 μm, at least one band of mostof the known or suspected comet molecules can be detected, except for the heaviestlike SO2 or S2. This will permit the identification of the type of bond (chemicalfamily), and possibly the individual molecules for the simpler ones.
ASTEROID SURFACE CHARACTERISATION
The new Rosetta mission baseline to the comet 67P/Churyumov-Gerasimenko in-cludes two asteroid fly-bys. Observations of the possible asteroids candidate forthe fly-by have been carried out at ESO-NTT (La Silla, Chile), TNG (Canaries),and NASA-IRTF (Hawaii) telescopes, in order to determine the taxonomy of allthe candidates. The asteroid targets were chosen after the spacecraft interplanetaryorbit insertion manoeuvre, when the available total amount of �v was known. Onthe basis of the analysis made by Barucci et al. (2005) and the available of �v theESA Science Working Group selected the asteroids 21 Lutetia and 2867 Steins as

VIRTIS: AN IMAGING SPECTROMETER FOR THE ROSETTA MISSION 537
targets for the Rosetta mission. The nature of Lutetia is still controversial. Lutetia’sspectral properties may be consistent with a composition similar to carbonaceouschondrite meteorites. The spectral properties of Steins suggest a more extensivethermal history. Steins may have a composition similar to relatively rare enstatitechondrite/achondrite meteorites. VIRTIS analysis will make possible to clarifythese open issues. In fact asteroids surface mineralogy and petrology can be stud-ied by means of visible and infrared spectroscopy. Furthermore, the analysis of thespectrophotometric phase curves will give information on surface structures, micro-roughness and porosity of the surface layers of the target asteroid. As discussed indetail above for comets, the infrared range contains a wealth of diagnostic spectralfeatures but it is basically unexplored in the study of asteroid surface composition.Several molecular species found in meteorites produce also important visible andnear infrared absorption features. Among them, water, OH bearing minerals, car-bonates and hydrocarbons are possibly found also on asteroid surfaces. Water iceitself could be present on some nearest asteroids, as recently suggested for Ceres(Vernazza et al., 2005). Instead of the relatively narrow band of ice, however, abroad absorption band has been seen in the spectra of some asteroids and it wasinterpreted as indicative of the presence of hydrated silicates (Jones et al., 1990).The high spectral resolution provided by the -H channel could contribute to asteroidstudies by delineating subtle absorption features and by refining the measurementof differences in spectral shape. Spectral images in the visible and infrared rangesby -M channel will give important information on the mineralogical composition ofthe target asteroid surface. Spectral resolution added to spatial resolution is neededto identify mineralogical provinces on the asteroid surface. VIRTIS can help alsoin the determination of the existence of possible asteroids satellites (in the NIR).
INSTRUMENT REQUIREMENTS AND REQUIRED ACTIVITY IN THE DIFFERENT
MISSION PHASES
A summary of the instrument requirements needed to accomplish the above men-tioned scientific requirements is given hereafter for the primary objectives of themission.
Nucleus science objectives:� Identification of different ices and ice mixtures and determination of theirspatial distribution. This must be done in spite of the very low albedo (<0.1),due to dark inclusions present in the ice and the resulting weak ice spectralfeatures, as well as at large distances from the Sun during some phases of themission.� Identification of the carbonaceous materials that probably are mixed withwater ice, even in low percentages (<20%). The associated spectral featureswill be very subdued and their identification, from their shape and centre,will require high S/N (>00). It will be important also to determine the overall

538 A. CORADINI ET AL.
continuum slopes of the spectra, as the presence of organic compounds willredden the spectra in diagnostic ways between 0.4 and 1.1 μm and into the IRas well.� Determination of the physical microstructure and nature of the surface grainsby measuring the spectrophotometric phase curve with a relative radiometricaccuracy of about 1%. Identification of the silicates, hydrates and other min-erals which are expected to be found. Strong but broad absorption features(λ/�λ < 20) should be observed from the visible (0.25–1.0 μm) to the nearIR (1.0–5.0 μm), so a spectral resolution of 100 is adequate.� Determination of the spatial distribution of the various mineralogical typesand their mixtures using both the spectral features and the overall brightness.Local fluctuations of the reflectivity and spectral features related to small scalecompositional differences are expected. For global mapping of the nucleus, aspatial resolution of a few tens of metres is needed.� Detection and monitoring of active areas on the comet surface (cryo-volcanism) to understand the physical processes operating and to identifythe material types associated. Determination of the composition of ices onthe nucleus surface. With the exception of H2O, condensed molecules displaydiagnostic narrow (as well as broad) absorption bands in the reflected com-ponent (1–3 μm). S/N higher than 100 and a minimum resolving power of1000 is needed to resolve the bands fully. The -H FOV must be within thefield of view of one -M frame (accuracy of few arcminutes) to allow combinedoperation at both high spatial and spectral resolution.
Coma science objectives:� Determination of the global distribution of gas and dust in the inner coma.Radiometric accuracy of 10% absolute and 1% relative with a resolving powerof 100 are required.� Identification and mapping of the strong molecular emissions in the nearultraviolet and visible portions of the spectrum. These include the main waterdissociation product OH (0.28 and 0.31 μm), CN, C3, NH, CH and CO+ ions,and the neutral radicals CN and C2. The combination of high spatial resolutionwith moderate spectral resolution (λ/�λ < 500) will allow correlation of theevolution of radicals with that of their parent molecules.� Mapping of the composition and evolution of gas and dust jets in the comaand comparison with the mineralogical composition and spatial morphologyof active regions on the surface of the nucleus.� Determination of the composition of the dust grains in the coma by observingemission features in the fundamental bands between 2.5–5 μm. These emis-sions will be observed mainly at the end of the mission, at distances from theSun of less than 2 AU.� Identification of the gas molecules. The 2–5 μm range corresponds to themaximum efficiency of molecular resonant fluorescence at fundamental

VIRTIS: AN IMAGING SPECTROMETER FOR THE ROSETTA MISSION 539
rotational/vibrational bands. A major objective is to identify the hydrocar-bon emission in the 3–4 μm range. Such identification requires a resolvingpower of the order of 2000 at 3.5 μm.� Assessment of the coma thermodynamics with the determination and mappingthe rotational temperatures for the individual lines of H2O with an accuracyof 1 K and a nominal S/N of 200.� Detection of early gaseous activity: Spectra will be obtained at long integrationtimes, starting before the mapping phase, to search for CO emission as anindicator of beginning activity. Determination of ortho/para ratio for H2O.Long integration should allow a determination of the OPR with a S/N ratio of50 to discriminate among different scenarios of comet formation.� Determination of isotopic ratios for selected molecules, such as 13CO, H2
17O,H2
18O or HDO.
Technical Description
In order to fully achieve the scientific objectives previously discussed, the VIRTISinstrument performances have to exceed the specifications of the baseline modelpayload instrument (Bar-Nun et al., 1993). In its final design the VIRTIS instrument,shown in Figure 1, Consist of three data channels. Two of the data channels are de-voted to spectral mapping and are housed in the Mapper (-M) optical subsystem. Thethird channel is devoted solely to spectroscopy and is housed in the High resolution
Figure 1. VIRTIS prior to its integration on the S/C. The VIRTIS-M imaging spectrometer is rec-ognizable by its square shaped baffle, while VIRTIS-H its cylindrical one. A MLI layer separatesthe cold part of the experiment, where the two optical heads are located, from its warm part, that isconnect to the Spacecraft body.

540 A. CORADINI ET AL.
TABLE I
VIRTIS characteristics and performances overview.
Virtis main characteristics and requirements
VIRTIS-M Visible VIRTIS-M InfraRed VIRTIS-H
Spectral Range 220.1–1046.0 952.8–5059.2 Order 0 4.05–5.03
(nm)
Order 1 3.47–4.32
Order 2 3.04–3.78
Order 3 2.70–3.37
Order 4 2.43–3.03
Order 5 2.21–2.76
Order 6 2.03–2.53
Order 7 1.88–2.33
Spectral Resolution 100–380 70–360 1300–3000
λ/�λλ
Spectral Sampling 1.89 9.44 0.6
(nm) (1)
Field of View 63.6 (slit) × 64.2 (scan) 63.6 (slit) × 64.2 (scan) 0.49 × 1.47
(mrad × mrad)
Max Spatial Resolution 248.6 (slit) × 250.8 (scan)
(μrad)
Pointing +Zsc and Boresighted with Osiris, NavCam
Telescope Shafer Shafer Off axis parabolic
Telescope Telescope mirror
Pupil Diameter (mm) 47.5 32
Imaging F# 5.6 3.2 2.04
Etendue (m2 sr) 4.6 × 10⁻¹¹ 7.5 × 10⁻¹¹ .8×10−9
Slit Dimension (mm) 0.038 × 9.53 0.029 × 0.089
Spectrometer Offner Relay Offner Relay Echelle
spectrometer
Detectors Thomson TH7896 CCD CdHgTe (2) CdHgTe (2)
Sensitivity Area Format 508 × 1024 270 × 436 270 × 436
Pixel Pitch (μm) 19 38 38
Operating temp. (K) 150 to 190 65 to 90 65 to 90
Spectral range (μm) 0.25 to 1.05 0.95 to 5.0 0.95 to 5.0
Mean Dark Current <1 e−1/s <10 fA @ 70K <10 fA @ 70K
Radiometric Resolution SNR >100 >100 >100 @ 3.3 μm
Radiometric Accuracy
Absolute <20% <20% <20%
Relative <1% <1% <1%

VIRTIS: AN IMAGING SPECTROMETER FOR THE ROSETTA MISSION 541
Figure 2. Functional block diagram of VIRTIS experiment.
(-H) optical subsystem. The addition of the -H subsystem makes VIRTIS increaseby more than 30% the scientific yield of the instrument proposed in the RosettaModel Payload (Bar-Nun et al., 1993), while maintaining the same mass allocation(Reininger et al., 1996). In Table I are summarised the main characteristics of theexperiment.
In Figure 2 is shown a block scheme, showing the various functional parts ofthe instrument. The instrument is made of 4 independent units (named Modules):the Optics Module, which contains the -M and -H optical heads, the ProximityElectronics Modules (one for -M and one for -H, devoted to the conditioning ofthe analog signals to and from the optical head, and to the low level control of theoptical heads), and the Main Electronics Module, which is the digital electronicsand has the task to control the overall experiment.
The VIRTIS design has been optimized to reduce its total mass without relying onsophisticated materials or electronics packaging and without degrading its scientificperformance. The total mass of VIRTIS is about 23 kg.
MECHANICAL DESIGN
The mechanical interface of the Optics Module with the spacecraft is the Palletbaseplate, placed at the bottom of the instrument (see Figure 3), via eight mountingfeet (two per side) on a 450 × 510 mm base plate. The Pallet is a hollow box 130 mm

542 A. CORADINI ET AL.
Figure 3. VIRTIS Optics Module design: (1) -M optical head; (2) -M entrance baffle and cover; (3)-M cryocooler; (4) -H optical head; (5) -H entrance baffle and cover; (6) -H cryocooler; (7) radiator;(8) titanium rods; (9) mechanical baseplate.
high with the coolers mounted inside. The Pallet must dissipate 15 W of which 13 Ware expected to be conducted to the spacecraft for radiative dissipation at 300 K.The remaining 2 W are radiated directly by the instrument at lower temperatures.
The Cold Box surface adjacent to the Pallet is covered by multilayer insulation(MLI) which also covers at least three of the remaining surfaces. A conservativeassumption is made that much of the thermal field of view of these surfaces is ofhigh emissivity parts of the spacecraft.
The low conductive heat load has been achieved by mounting the Cold Box on8 struts whose number and attachment positions were selected to avoid distortionupon cooling from room temperature.
The empty space in the Cold Box is intentional to allow enough radiating surfacearea without requiring a separate and complex radiator. The result is a low densitymodule with sufficient stiffness structures only where necessary. This reduces masswhile maintaining the surface area. Irregular shapes were eliminated to facilitateefficient MLI attachment.
VIRTIS-M
The -M optical concept is inherited from the visible channel of the Cassini VisibleInfrared Mapping Spectrometer (VIMS-V) developed at Officine Galileo (Brownet al., 2004).

VIRTIS: AN IMAGING SPECTROMETER FOR THE ROSETTA MISSION 543
Figure 4. VIRTIS-M optical design: Shafer telescope and Offner spectrometer.
VIRTIS-M uses a Shafer telescope consisting in the combination of an invertedBurch telescope with an Offner relay (Figure 4). The Offner relay takes the curved,anastigmatic virtual image of the inverted telescope and makes it flat and real with-out losing the anastigmatic quality. Coma is compensated by putting the aperturestop near the center of curvature of the primary mirror and thus making the tele-scope monocentric. The result is a telescope built only with spherical mirrors whichremains diffraction limited over an appreciable spectrum and field: at ±1.8 degreesthe spot diameters are less than 6 μm in diameter, which is 7 times smaller than theslit width.
Cassini-VIMS and OMEGA-VIMS both required separately housed co-alignedinstruments to cover the visible and infrared spectra. The Offner spectrometernot only does away with redundant optical systems, it eliminates the need forcollimators, camera objectives, and beam splitters and thereby simplifies fabricationand minimizes volume and mass. However, a grating spectrometer that does notrely on a collimator and camera objective requires perfect matching to its collectingtelescope.
The -M spectrometer does not need the beam splitter by realising two differentgroove densities on a single grating substrate. The grating profiles are holographi-cally recorded into a photoresist and then etched with an ion beam. Using variousmasks the grating surface can be separated into different zones with different groovedensities and different groove depths as shown in Figure 5.

544 A. CORADINI ET AL.
Figure 5. Design of the -M grating: the central zone (A1, A2) is used for the VIS channel while theexternal for the IR range. In the VIS region the laminar groove density is equal to 267.8 mm−1; thegrooves depth in the A1 zone is 230 nm while in the A2 340 nm. The IR corona has a blazed groovedensity equal to 53.8 mm−1.
The VIS regions, which make up the central 30% of the conjugate pupil area,correspond to the higher groove density for generating the higher spectral resolutionrequired in the “visible” channel extending from the ultra-violet to the near infrared.The smaller pupil area allows the visible channel to operate partially coherently andachieve a smaller point spread function. It should now be obvious that an on-axistelescope cannot be used with this grating concept because the visible portion ofthe conjugate grating surface would be obscured by the secondary mirror of thetelescope.
The reflected infrared solar irradiance is quite low and is not adequately com-pensated by the infrared emissions of the cold comet. The infrared channel thereforerequires a greater pupil area, about 70%.
Since the infrared channel does not require as high a resolution as the visiblechannel, the lower MTF caused by the visible zone’s obscuration of the infraredpupil is acceptable. In any case, the spot diagrams for all visible and infraredwavelengths at all field positions are within the dimension of a 40 μm pixel.
A laminar grating with a rectangular groove profile is used for the visible chan-nel’s pupil zone to enable two different groove depths to alter the grating efficiencyspectrum and compensate for the low solar energy and low CCD quantum efficiencyin the ultra-violet and near infrared regions. The resulting efficiency improves theinstrument’s dynamic range by increasing the S/N at the extreme wavelengths andpreventing saturation in the central wavelengths. For the infrared zones, a blazed

VIRTIS: AN IMAGING SPECTROMETER FOR THE ROSETTA MISSION 545
Figure 6. VIRTIS-H optical design.
groove profile is used that results in a peak efficiency at 5 μm to compensate forthe low signal levels expected at this wavelength.
VIRTIS-H
In -H the light is collected by an off-axis parabola and then collimated by another off-axis parabola before entering a cross-dispersing prism made of Lithium Fluoride.After exiting the prism the light is diffracted by a flat reflection grating whichdisperses in a direction perpendicular to the prism dispersion (See Figure 6). Theprism allows the low groove density grating, which is the echelle element of thespectrometer, to achieve very high spectral resolution by separating orders 7 through16 across a two-dimensional detector array. The spectral resolution varies in eachorder between 1200 and 3500.
Since the -H is not an imaging channel, it is only required to achieve good opticalperformance at the zero field position. The focal length of the objective is set by therequired IFOV and the number of pixels allowed for summing. While the telescopeis f/1.6, the objective is f/1.67 and requires five pixels to be summed in the spatialdirection to achieve a 1 mrad2 IFOV (5 × .45 × .45 mrad).
FOCAL PLANE ARRAYS
A summary of the characteristics of the VIRTIS detector is reported in Table I.The CCD in -M is a frame transfer device. Though the device will be so cold that

546 A. CORADINI ET AL.
dark current will be negligible, it can be made multi-pinned-phase (MPP) to reducethe dark current at room temperature; running the CCD inverted also limits thedamaging effects of radiation. The challenge for -M is to keep the CCD temperatureabove 155 K to prevent degradation of the charge transfer efficiency (CTE).
The 75 K IRFPA will be only 9 mm away form the CCD housing so both detectorarrays will have adjacent edges free of bond wires. A chrome-gold thin film on thefront surface of the CCD is used to improve the capture cross-section of the longwavelength photons, while lumogen coating is used to enhance the efficiency in theUV range.
Both the -M and -H IRFPAs are Mercury Cadmium Telluride on sapphire sub-strates. The -M and -H detectors have the same 5.1 μm cut-off wavelength require-ment and can therefore be manufactured from the same wafers. To reduce darkcurrent the -M IRFPA must be cooled to temperatures below 100 K. This has beenachieved by means of Stirling cycle cryocoolers, which guarantees operability formore than 10000 hours of operation in the cometary environment. Passive coolinghas been rejected because the low emissive power of passive radiators and the risk ofcomet contamination indicate a minimum radiator area larger than one square metre.
MAIN ELECTRONICS MODULE
The Main Electronics is physically separated from the Optics Module. The Elec-tronics Module houses the Power supply for all the experiment, the cooler elec-tronics, the Spacecraft interface electronics, for telemetry and telecommanding, theinterfaces with the Optics Module subsystems, and the DHSU (Data Handling andSupport Unit) which is the electronics for the data handling, processing and for theinstrument control.
The data processing and the data handling activities into the DHSU will beperformed using the on-line philosophy. The data will be processed and transferredto the spacecraft in real time. The mass memory (SSR) of the spacecraft will be usedto store or buffer a large data volume. The Main Electronics contains no additionalhardware component for data processing and compression. All data processing willbe performed by software.
CALIBRATION MEASUREMENTS
Before the integration of the VIRTIS experiment aboard Rosetta, a full calibra-tion of the instrument was performed to completely characterize the instrumentalperformances. The calibrations measurements and analysis are discussed in detailin Coradini et al. (2004), Ammannito et al. (2006) and Filacchione et al. (2006)and we refer the reader to those paper for an in depth discussion.
The fundamental calibrations necessary to correctly retrieve the scientific infor-mation from VIRTIS data are:

VIRTIS: AN IMAGING SPECTROMETER FOR THE ROSETTA MISSION 547� Geometric calibration: measurement of IFOV, FOV and in field distorsions;� Spectral calibration: correlation between spectral dispersion axis of the focalplanes with wavelength;� Spatial calibration: evaluation of the flat-field matrices necessary to homoge-nize the focal planes responses;� Radiometric calibration: determination of the Instrument Transfer Function(ITF), that allows to convert digital numbers (DN) in physical units of spectralradiance (W m−2 μm−1 sterad−1).
These quantities, continuously checked during the flight at each switch on of theexperiment, are used in the data pipeline before the scientific analysis.
In Flight Activities
In what follows we present some of the preliminary results of the VIRTIS activitiesduring the last 2 years cruise; the first activity consisted in the commissioning ofthe instrument devoted to the functional testing of the instrument.
The functional tests were carried out on 24–26 March 2004 and were aimed atthe verification of the functional capabilities of the instrument, in particular weredevoted to:� tests of all the mechanisms:
◦ opening/closing of protective covers◦ opening/closing of shutters◦ operability of the cryocoolers, in closed loop and open loop mode◦ operability of the scan mirror� verification of the calibration unit: operation with different lamp currents;� verification of all the operational modes� verification of the instrument performances, by means of the comparison of
ground and in-flight internal calibration.
The outcome of the functional tests are considered highly successful. All the VIRTISmechanisms and subsystems have performed nominally and no major anomalieshave been reported.
The functional tests have been started with VIRTIS operating at a temperatureabove the operational one for the optical heads (approximately 143 K for both op-tical heads). This anomalous temperature was due to a not nominal S/C orientationprior to the start of the VIRTIS functional tests. The sun was not on the X axis asexpected, but to avoid an anomalous heating of the antenna transmitter the S/C wasoriented with the sun on the +X panel but making an angle of 50 degrees with +Zaxis. Prior to the beginning of VIRTIS functional tests, the S/C has been reorientedin the nominal condition with the Sun perpendicular to the +X panel.

548 A. CORADINI ET AL.
ANALYSIS OF THE ON-BOARD CALIBRATION UNIT PERFORMANCES
The functional tests have also included several calibration runs using the VIRTIS-H and VIRTIS-M internal calibration units. The calibration have been performedboth with nominal (default) parameters settings as well as varying the detectortemperature and internal calibration lamp currents.
The analysis of H calibration data shows reasonable agreement between on-ground and in-flight calibration data. Calibration performances with the nominalcalibration sequence shows the following (see Figures 7 and 8):� nominal behaviour of both the spectral and radiance calibration lamps� spectral reconstruction according to the pre-launch pixel map table of the
VIRTIS-H spectrum shows only minor shift; the shift in the position of the 8orders of VIRTIS-H being of the order of 1 pixel only.� radiance calibration. No substantial disagreement is found with pre-launchcalibration, implying a good performance conditions for the detectors and forthe lamp itself.
The operations were performed at a detector temperature of 81.36 K (nominal) anda temperature of the optical box between 140 and 143 K; this temperature is higherthan the 135 K specified temperature, and allow us to detect a thermal backgroundof the optics in the detector area corresponding to the longer wavelength range.This behaviour is fully consistent with expectations. The focussing of the optics onthe detector, as retrieved from the radiance calibration observation is nominal.
Figure 7. Radiance calibration of March 25, 2004/Rosetta commissioning. The figure shows theVirtis H detector frame. The actual spectrum is represented by the titled lines each one being a portionof the spectral range covering from 1.88 μm, at the top of the image, to 5.02 μm at the bottom. Thewhite lines are the location of the profiles reported in Figure 8.

VIRTIS: AN IMAGING SPECTROMETER FOR THE ROSETTA MISSION 549
Figure 8. On the left is shown the vertical profile while on the right the horizontal one of Figure 7.
Also for VIRTIS-M the internal calibration analysis has pointed out a substantialagreement with the on-ground calibration runs. However, minimal differences existswhich have been interpreted in terms of the anomalously high temperature of theoptical heads, as mentioned above.
For instance, the internal calibration of VIRTIS-M uses, for both infrared andvisible channel, special coatings on the calibration lamp units which introduceabsorption features throughout the spectral range (Holmium-doped glass for Visand polystyrene for IR). In both cases the exact location of the absorption features istemperature dependent. Indeed, a spectral shift is present in the data when comparedto the on-ground calibration runs (see Figures 9 and 10).
For the visible channel (Figure 9) the signal for nominal current value is higherfor On-Ground calibration (named Orsay on the plot) respect to in flight data of
Figure 9. Calibration of VIRTIS-M Visible channel. The spectral curves for three different lampcurrents (MIN, MAX and NOM) are compared with the on-ground calibration (ORSAY).
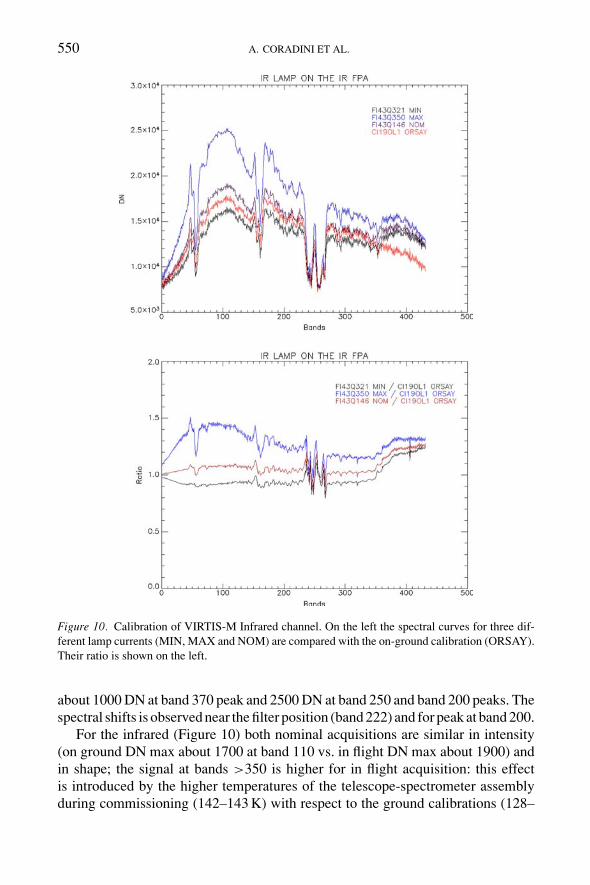
550 A. CORADINI ET AL.
Figure 10. Calibration of VIRTIS-M Infrared channel. On the left the spectral curves for three dif-ferent lamp currents (MIN, MAX and NOM) are compared with the on-ground calibration (ORSAY).Their ratio is shown on the left.
about 1000 DN at band 370 peak and 2500 DN at band 250 and band 200 peaks. Thespectral shifts is observed near the filter position (band 222) and for peak at band 200.
For the infrared (Figure 10) both nominal acquisitions are similar in intensity(on ground DN max about 1700 at band 110 vs. in flight DN max about 1900) andin shape; the signal at bands >350 is higher for in flight acquisition: this effectis introduced by the higher temperatures of the telescope-spectrometer assemblyduring commissioning (142–143 K) with respect to the ground calibrations (128–

VIRTIS: AN IMAGING SPECTROMETER FOR THE ROSETTA MISSION 551
129 K). Many lab-measurements made on the polystyrene filter confirm the shifts(of about one channel) observed in the main absorption features around bands230–260, varying the temperature of the calibration unit.
FIRST EARTH-MOON OBSERVATION
On the 24th of April the experiment MIRO planned to observe the Earth to verifythe boresight location. VIRTIS decided to run along to have the opportunity ofproviding a first light taken on an interesting celestial object. Indeed, the observationwas successful and in Figures 11 and 12 are reported the first scientific data acquiredby VIRTIS.
M data of the Earth-Moon observation. Pixel size is 4500 km, thus the Earthcovers a 3 × 3 spot while the Moon is about one pixel.
In the Earth spectrum are clearly visible (although this is still an un-calibratedspectrum) the absorption bands of water and CO2. On the contrary the Moon spec-trum lacks of absorption features being dominated by the thermal emission.
These observations are directly comparable with the Mars Express Omega ob-servations performed the 3 of July 2003 shown in Figure 13. A preliminary check
Figure 11. The image shows the first attempt of producing an RGB image from the uncalibratedVIRTIS.
Figure 12. Spectra showing the raw signal in DN is plotted for the Earth and Moon for the IR channel.

552 A. CORADINI ET AL.
Figure 13. Spectrum of the Earth obtained by the Omega experiment on board Mars Express.
has shown a substantial coincidence of the two observations, although in both casesonly raw DN were compared.
FIRST EARTH SWING-BY
On the 4th and 5th of March 2005, the ROSETTA probe performed the first of its 3fly-byes of the Earth; at its closest approach the probe passed at less than 2000 kmfrom ground. The original VIRTIS plan was to observe the Earth and Moon systemthroughout the closest approach; unfortunately, safety considerations (the S/C waspassing through the radiation belts), convinced us otherwise and we limited VIRTISactivities to two observations of the Moon for calibration purposes, one prior andone after the closest approach, and an observation of the Earth while the S/C wasin its outbound trajectory. A summary of the geometry of the encounter and of theobservation conditions as well as the operational parameters is given in Table IIand in Figure 14.
The Earth images were acquired during the outbound trajectory after about14 hours from the closest approach when the Earth was already at a distance of248.000 km. Therefore the pixel size was of the order of 62 km (see Table II). Twoimages were acquired one in the high resolution mode (pixel of 62 km), while theother in the nominal resolution mode which is obtained simply averaging 4 spatialpixels, thus degrading the ground resolution to 248 km. The integration time alsowas changed in order to verify the VIRTIS performances under different conditions.
Figure 15 shows the Earth as seen by the navigation camera of the S/C at left andby VIRTIS in the visible range at centre. The VIRTIS image is an RGB combination,at wavelengths 440, 550 and 700 nm. The characteristic shape of South America,partially hidden by white clouds covering the greater part of the Amazonian region

VIRTIS: AN IMAGING SPECTROMETER FOR THE ROSETTA MISSION 553
TABLE II
VIRTIS observations during March 2005 observation session.
Observation code VIRTIS#02 VIRTIS#05 VIRTIS#06
Date and time 04/03 19:30 05/03 08:00 05/03 12:30
Target Moon Moon Earth
Distance (km) 401633 211430 248000
Phase angle (degrees) 111.3 127.9 91.1
Illuminated portion (%) 32 19 49
Ground resolution (km) 100.5 52.9 62.0
Integration Times (s)
Channel M-VIS 1, 20, 30 1, 15 1
Channel M-IR 0.5, 2.0, 3.0, 3.5 1.5, 2.0, 3.0 0.5, 1
Channel H 5, 10 5, 10 5, 10
Spectral
Number of Pixels 432 432 432, 144
Sampling M-IR (nm) 9.4 9.4 9.4, 28.2
Sampling M-VIS (nm) 1.9 1.9 1.9, 5.7
Sampling H (nm) – – –
Figure 14. The trajectory of the S/C and the timing of the VIRTIS observations.

554 A. CORADINI ET AL.
Figure 15. The Earth as seen by the navigation camera (left) and by the VIS channel of VIRTIS-M.The RGB (centre) and the same picture stretched in false color (right) where it is possible to distinguishthe Brazilian forests (a), the track of the continent divider (b) and the Argentina’s pampas (c).
and of the northern part of south America is evident. At the very top of the centreimage a glimpse of Mexico is also visible.
Figure 15 shows the Earth as seen by the navigation camera of the S/C at left andby VIRTIS in the visible range at centre. The VIRTIS image is an RGB combination,at wavelengths 440, 550 and 700 nm. The characteristic shape of South America,partially hidden by white clouds covering the greater part of the Amazonian regionand of the northern part of south America is evident. At the very top of the centreimage a glimpse of Mexico is also visible.
An algorithm for the removal of the second order redundancy among differentareas in the three monochromatic images used in the RGB has been applied toenhance contrast among different areas in the image. The result is shown in theright panel of Figure 15. The effect is the reduction of part of the cloudiness andthe clearer appearance of different areas of the South American continent itself likethe Brazilian forests (a), the track of the continent divider (b) and the Argentina’spampas (c).
In the visible region the spectrum is very rich in features and very diagnosticof compositional differences. We identify three main different spectral typologies:clouds, land and sea. The left panel of Figure 16 shows the measured reflectance
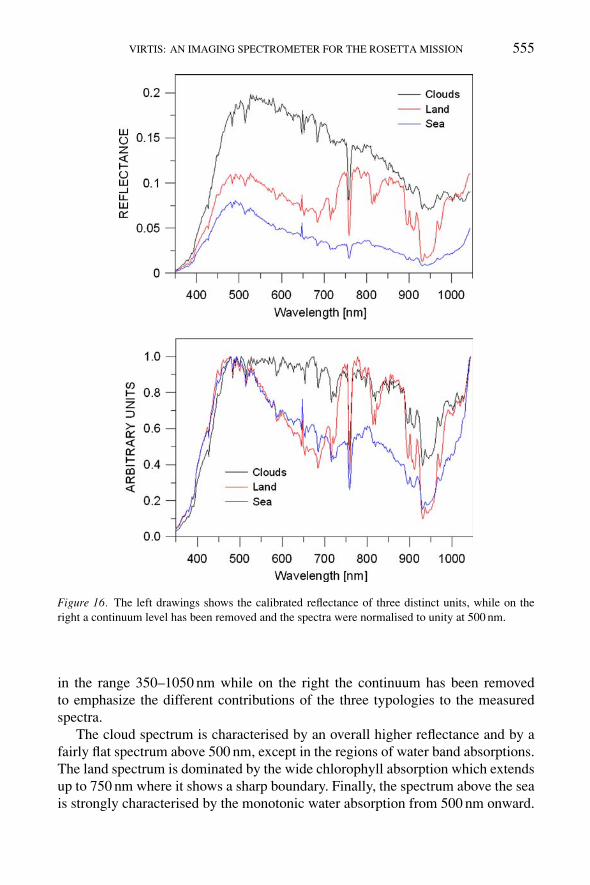
VIRTIS: AN IMAGING SPECTROMETER FOR THE ROSETTA MISSION 555
Figure 16. The left drawings shows the calibrated reflectance of three distinct units, while on theright a continuum level has been removed and the spectra were normalised to unity at 500 nm.
in the range 350–1050 nm while on the right the continuum has been removedto emphasize the different contributions of the three typologies to the measuredspectra.
The cloud spectrum is characterised by an overall higher reflectance and by afairly flat spectrum above 500 nm, except in the regions of water band absorptions.The land spectrum is dominated by the wide chlorophyll absorption which extendsup to 750 nm where it shows a sharp boundary. Finally, the spectrum above the seais strongly characterised by the monotonic water absorption from 500 nm onward.

556 A. CORADINI ET AL.
Superimposed on these general trends specific molecular absorption bands areidentified which can be mapped over the visible hemisphere. One of the main featureis the O2 A-band absorption at 760 nm, This is present everywhere with differentabundance levels.
In the infrared part of the spectrum we have the superposition of the reflected ofthe emitted components, the cross over region being at around 3 μm. A compositeof the two components is shown in Figure 17. The colours for the plot were selectedin order to show the continuum both in the NIR around 1.6 μm and in the IR around4 and 5 μm. The selected wavelengths are also shown in Figure 18 where the givenspectrum is taken near the terminator where the solar reflected light has about the
Figure 17. RGB image of the Earth in the infrared (B at 1613 nm, G at 4039 nm, and R at 4936 nm).
Figure 18. Spectrum of the Earth in the infrared. The coloured lines indicate the wavelength used toobtain the RGB image in Figure 15.

VIRTIS: AN IMAGING SPECTROMETER FOR THE ROSETTA MISSION 557
Figure 19. Radiance calibrated spectra of the Dayside (Blue), Nightside (Red) compared to the NIMSspectrum (black curve) as taken during the Earth fly-by.
same intensity of the emission beyond 3 μm. Dark blue area show cloud in theilluminated part and dark are the clouds in the night side that prevent the heat fromthe planet to escape to the space.
Many different molecular absorption are present in the IR spectrum. Two typicalspectra of the dayside and of the nightside are compared in Figure 19 to the averagespectrum of the Earth observed by NIMS onboard Galileo. All the most importantatmospheric molecules H2O, CO2, CH4, O3, N2O are visible in all the spectra.
Concluding Remarks
From the previous discussion it is apparent that the VIRTIS experiment will allow aconsiderable step forward in gaining new insight of the minor bodies’ physics andchemistry as well as of the complex relationships between comets and asteroids.The Cassini inheritance has been particularly valuable in designing the VIRTISinstrument. We expect to achieve with Rosetta mission not only new scientificresults but also to build up in Europe a planetology community more experiencedand efficient.
Acknowledgment
This work is supported by an ASI−Italian Space Agency−Grant No. I032050.

558 A. CORADINI ET AL.
References
A’Hearn, M. F., Belton, M. J. S., Delamere, W. A., Kissel, J., Klaasen, K. P., McFadden, L. A., et al.:2005, Science 310, 258.
A’Hearn, M. F., Millis, R. L., Schleicher, D. G., Osip D. J., and Birch, P. V.: 1995, Icarus 118, 223.Ammannito, E., Filacchione, G., Coradini, A., Capaccioni, F., Piccioni, G., De Sanctis, M. C., et al.:
Rev. Scientific Instrum. 77, 093109–1,10.Barucci, M. A., Fulchignoni, M., Fornasier, S., Dotto, E., Vernazza, P., Birlan, M., et al.: 2005, A&A
430, 313.Beliaev, N. A., Kresak, L., and Pittich, E. M.: 1986, Catalogue of Short-Period Comets. Bratislava:
Slovak Academy of Sciences, Astronomical Institute.Bockelee-Morvan, D., and Crovisier, J. (eds.): 1992, Proceedings of the 30th Liege International Astr.
Collaboration, p. 65.Brooke, T. Y., Tokunaga, A. T., Weaver, H. A., Crovisier, J., Bockelee-Morvan, D., and Crisp, D.:
1996, Nature 383, 606.Brown, R. H., Baines, K. H., Bellucci, G., Bibring, J. P., Buratti, B. J., Capaccioni, F., et al.: 2004,
Space Sci. Rev. 115, 111.Capria, M. T., Coradini, A., and de Sanctis, M. C.: 2003, Adv. Space Res. 31, 2543.Carusi, A., Kresak, L., Perozzi, E., and Valsecchi, G. B.: 1985, Long-Term Evolution of Short Period
Comets. Bristol: England and Accord, MA, Adam Hilger, Ltd.Choi, Y., Cohen, M., Merk, R., and Prialnik, D.: 2002, Icarus 160, 300.Clark R. N.: 1981, J. Geophys. Res. 86-B4, 3087.Combes, M., Crovisier, J., Encrenaz, T., Moroz, V. I., and Bibring, J.-P.: 1988, Icarus 76, 404.Cochran, A. L., Barker, E. S., Ramseyer, T. F., and Storrs, A. D.: 1992, Icarus 98, 151.Coradini, A., Capaccioni, F., Capria, M. T., De Sanctis, M. C., Espinasse, S., Orosei, R., et al.: 1997a,
Icarus 129, 317.Coradini, A., Capaccioni, F., Capria, M. T., De Sanctis, M. C., Espinasse, S., Orosei, R., et al.: 1997b,
Icarus 129, 337.Coradini, A., Capaccioni, F., Drossart P., Semery A., Arnold G., Schade U., et al., Planet. Space Sci.
46, 1291.Coradini, A., Capaccioni, F., Filacchione, G., Magni, G., Ammannito, E., Capria, M. T., et al.:
2004, L. Colangeli et al. (eds.), The New ROSETTA Targets, p. 223, Kluwer AcademicPublishers.
Crovisier, J., Brooke, T. Y., Hanner, M. S., Keller, H. U., Lamy, P. L., Altieri, B., et al.: 1996, Astron.Astrophys. 315, 385.
Crovisier, J., Leech, K., Bockelee-Morvan, D., Brooke, T. Y., Hanner, M. S., Altieri, B., et al.: 1997,Science 275, 1904.
De Sanctis, M. C., Capria, M. T., and Coradini, A.: 2005, Astron. Astrophys. 444, 605.Festou, M. C., Lecacheux, J., Kohl, J. L., Encrenaz, T., and Baudrand, J.: 1986, Astron. Astrophys.
169, 336.Filacchione, G., Ammannito, E., Coradini, A., Capaccioni, F., Piccioni, G., De Sanctis, M. C., et al.:
2006, Rev. Scientific Instrum. 77, 103106–1,09.Filacchione, G.: 2006, Calibrazioni a terra e prestazioni in volo di spettrometri ad immagine nel
visibile e nel vicino infrarosso per l’esplorazione planetaria. PhD Dissertation, Universita deglistudi di Napoli Federico II.
Jones, T. D., Lebofsky, L. A., Lewis, J. S., and Marley, M. S.: 1990, Icarus 88, 172.Haruyama, J., Yamamoto, T., Mizutani, H., and Greenberg, J. M.: 1992, J. Geophys. Res. 98(E8),
15,079.Kamoun, P., Campbell, D., Pettengill, G., and Shapiro, I.: 1998, Planet. Space Sci. 47, 23.Keller, H. U., Kramm, R., and Thomas, N.: 1988, Nature 331, 227.

VIRTIS: AN IMAGING SPECTROMETER FOR THE ROSETTA MISSION 559
Kiselev, N. N., and Velichko, F. P.: 1998, Icarus 133, 286.Kidger, M. R.: 2004, A&A 420, 389,Kidger, M. R.: 2003, A&A 408, 767.Mueller, B.: 1992, in Harris A. W., and Bowell E. (eds.), CCD-Photometry of Comets at Large
Heliocentric Distancesin Asteroids, Comets and Meteors 1991, p. 425.Mumma, M. J., Weaver H. A., and Larson, H. P.: 1987, Astron. Astrophys. 187, 419.Mumma, M. J., Di Santi, M. A., Russo, N. D., Fomenkova, M., Magee-Sauer, K., Kaminski, C. D.,
et al.: 1996, Science 272, 1310.Oberst, J., Giese, B., Howington-Kraus, E., Kirk, R., Soderblom, L., Buratti, B., et al.: 2004, Icarus
167, 70.Osip, D., Schleicher, D. G., and Millis, R. L.: 1992, Icarus 98, 115.Prialnik, D., Benkhoff, J., and Podolak, M.: 2004, in Festou, M. C., Keller, H. U., and Weaver, H. A.
(eds.), Comets II. University of Arizona Press, Tucson, p. 359.Reininger, F. M., Coradini, A., Capaccioni, F., Capria, M. T., Cerroni, P., de Sanctis, M. C., et al.:
1996, in Descour, M. R., Mooney, J. M. (eds.), Proceedings of the SPIE, Vol. 2819, p. 66, ImagingSpectrometry II.
Rickman, H.: 1990, in Huebner, W. F. (ed.), Comet Formation and Evolution. In Physics and Chemistryof Comets. Springer Verlag, p. 245.
Schulz, R., Stuwe, J. A., and Boehnhardt, H.: 2004, Astron. Astrophys. 422, L19.Sunshine, J. M., A’Hearn, M. F., Groussin, O., Li, J.-Y., Belton, M. J. S., Delamere, W. A., et al.:
2006, Science 311, 1453.Tancredi, G., Fernndez, J. A., Rickman, H., and Licandro, J.: 2000, Astron. Astrophys. Suppl. 146, 73.Vernazza, P., Mothe-Diniz, T., Barucci, M. A., Birlan, M, Carvano, J. M. Strazzulla, G., et al.: 2005,
Astron. Astrophys. 436, 1113.


![Mission Manager[1]](https://static.fdokumen.com/doc/165x107/6313fe215cba183dbf075a68/mission-manager1.jpg)