
Structural Mapping using PIMA Spectrometer
29
1 Structural Mapping using PIMA Spectrometer S. Mondlane [email protected] or [email protected] Presented @ GIRAF – Geosciences Information in Africa; 23 rd – 27 th September 2013; Accra, Ghana
-
Upload
eduardo-mondlane -
Category
Documents
-
view
2 -
download
0
Transcript of Structural Mapping using PIMA Spectrometer

1
Structural Mapping using PIMA Spectrometer
S. Mondlane
[email protected] or [email protected]
Presented @ GIRAF – Geosciences Information in Africa; 23rd – 27th September 2013;
Accra, Ghana

2
Presentation Layout • Introduction
• Mineral identification
• Mapping the degree of alteration in the mineralised shear zones
– Shear zones near the contact between the Bulawayan and Shamvaian Supergroups
– Shear zones on the contact between Bulawayan Supergroup and granites
– Shear zones near the Penhalonga granodiorite
• Results
• Discussion

INTRODUCTION
• East Zimbabwe Craton
• The MMO greenstone is an
important gold mining area
with combined historical
production and estimated
reserves of 128 t of gold
(Forster et al., 1996). There
are 241 old gold mines.
• The MMO area is dominated
by complex geological
history, characterized by
early accretionary structures
and later folding and
shearing. Various types of
brittle-ductile fractures
truncated this sequence
before the introduction of
gold mainly in the late
Archaean
3

4
Introduction

5
The relationships between the Bulawayan and the
overlying Mbeza and Mbeza Vengo sedimentary units is
controversial.
• The structure is a tightly folded synform made up of at
least three east-west striking en echelon synforms gently
plunging eastward at 25 – 30° and separated by tight
antiforms.
430000 440000 450000 460000 470000 480000 490000 500000
7900000
7910000
7920000
Shear zones
Trends
x
x x
x
x
y
y
y
y
y
y y
y
YUTM Coordinates Granites
Inner Granites
0 1000 2000 3000 4000
Zimbabwe
Harare
Mo
za
mb
iqu
e
m Bulawayan
Shamvaian
PENHALONGA
Chazuca
X

6
Gold Mineralization • Gold is controlled by secondary structures (e.g. fault
splays and duplexes), mainly related to dilational
quartz veins. Few Gold deposits are found in
metasedimentary rocks.
410000 420000 430000 440000 450000 460000 470000 480000 490000 500000
7890
000
7900
000
79
100
00
79
200
00
Boa Esperanca
Dot's Luck
Guy FawckesMunhene
ExcelsiorDias Perreira
Marondo
DampBraganca
MimosaShandon
Monarch
RezendeRedwing
TorontoReliance
Kenya Howat's Luck
Champion
Odzi
Quagga
Pilgrim
Chivuma
Gold Deposit
0 5000 10000 15000 20000
Shera zones
Zimbabwe
Harare
Mo
za
mb
iqu
e
UTM Coordinates m

7
Most of the gold in MMO belts is confined to the vicinity of re-activated ductile shear zones
022/52043/56
024/62062-39
??
?
? 021/66200/83
Faul t PlanLnx- 40E
S
0.5 cm
Chloritic-talc schist
Strike and dip
mineralised zones
Spacing of the 2nd
fo l ia tion exagerated
angle betw een the 2 foliation is less than 15.
100 m

8
How do we map structures using PIMA
• The most challenging problem in mineral exploration is finding method(s) that easily map mineralised structures in greenstone belts.
• Once the relationships between the mineralisation and structures (e.g. shear zones) are established, probably the most viable exercise is to devise methods and techniques that can map structures.

9
• The use SWIR spectrometry for mineral exploration has
increased dramatically in recent years. The reflectance
spectrum of a mineral in the SWIR is characteristic.
• Mineral spectrum is unique and depends on composition
and crystallinity.
UV Visible Near Infrared Short Wavelength Infrared Mid IR Far IFMicrowave Radiowave
OH
+ H
2O
H2
O
AlO
H
Fe
OH
Ca
CO
3
+M
gO
H
VIBRATIONAL SPECTRAL
ABSORPTION FEATURES

10
Minerals when irradiated by a source of light, selectively
absorb and reflect light in different amounts at specific
wavelengths due to the bending and stretching of
molecular bonds (Clark, 1999)
Mineral group/
composition
Wavelength in nm
OH (structurally bound)
1400 (also 1550 and 1750-1850 in some
minerals)
Water
1400 and 1900
Al-OH
2160-2220
Fe-OH
2230-2295
Mg-OH
2300-2360
CO3
2300-2350 (and also at 1870, 1990 and
2155)

11
PIMA SP principles, the PIMA spectrum, PIMA measurements and data processing, and feature extraction.

12
PIMA SP spectrum is characterised mathematically by
spectral parameters, which describe spectral features on
the basis of depth, width, asymmetry, size and wavelength
position of a particular absorption feature.
Spectrum S_06_SSP_Rw (1% SHQ)
85
87
89
91
93
95
97
99
101
1300 1400 1500 1600 1700 1800 1900 2000 2100 2200 2300 2400 2500
Wavelength (2nm sampling)
Re
fle
cta
nc
e i
n p
erc
en
tag
e
L Should
Depth
Central WL
Width
PIMA Spectra & feature extraction

13
Mineral identification • It is not unique method (Can be used in the field)
• The diagnostic characteristics of each mineral are ideal in pure (no mixing) minerals. Real life (Mixtures)
• Method 1- Comparison of the spectra with spectral library (spectra resulting from analyses and tests under different conditions such as differing grain sizes or mixtures of various materials). It is sensitive enough to map different regions of the spectrum such as a kaolinite versus a halloysite-like feature.
• The result can then be compared with results from other identification methods such as chemistry and petrography.

14
The spectra resemble the mixture of anhydrite,
montmorillonite and halloysite at proportions of
37:32:30 percent.
1300 1500 1700 1900 2100 2300 250032
38
44
50
56
62Spectra of sample 21_Sp_Rw
Nanometer
Refle
ctanc
e (%)
Spectrum of the sample
Reference spectrum

15
Mixed Spectrum
• Most minerals generally have major diagnostic absorption wavelengths between 2050 and 2450 nm due to Al-OH, Fe-OH, Mg-OH and CO3 absorption bonds and can be grouped spectrally according to the wavelength position of their deepest absorption feature.
• The spectral mixing can be considered in a simplistic way as a linear process where spectral signatures of different minerals are added together in one spectrum. For example;
• Mixed Spectrum = X% Mineral 1 + Y% Mineral 2 + Z% Mineral 3 +...+ % Mineral n

16
Water
Pyrophylite
F e rich Chlorite
Anhydrite
Diaspore
Hornblende
A lunite
Buddingtonite
Nontronite Jarosite
Tremolite
Tourmaline
Dolomite B io tite
Calcite Epidote
M g rich Chlorite
Gypsum
Actino lite M agnesite
Apatite
Aragonite
Antigorite Siderite Phlogopite
Talc
M ontmorillonite
Illite Phengite
M uscovite Kaolinite
Halloysite Dickitite
2000
2050
2100
2150
2200
2250
2300
2350
2400
0 5 10 15 20 25 30 35 40
Absorption (%)
Wav
ele
ngth
in n
m
2nd method: Plotting a scattergram of the deepest
absorption feature of the sample against the wavelength. This
method allows identification of mineral fields according to the
position of the sample in the scatter plot.

17
3rd method: similar to the previous method where the
asymmetry is used instead of deepest absorption feature. Method
proved to be powerful tool for discrimination of mineral field that
usually overlap in the scatter plot of deepest absorption feature.
0
0,5
1
1,5
2
2,5
3
3,5
4
4,5
1400 1450 1500 1550 1600 1650 1700 1750 1800 1850 1900 1950 2000 2050 2100 2150 2200 2250 2300 2350
Wavelength (nm)
Alunite
Kaolinite
Water
Nontronite
Talc
Actinolite
Asy
mme
try
Chlorite
Water
Kaolinite
Sericite

18
Mapping alteration in the mineralised shear zones

1300 1500 1700 1900 2100 2300 2500
31
36
41
46
52
57
Spectra os the samples Sp8_1 to Sp8_4
Nanometer
Refle
ctanc
e (%
)
Sp8_1
Sp8_2
Sp8_3
Sp8_4
19
Profile Sp/GF
0
10
20
30
40
1300 1500 1700 1900 2100 2300
Central w avelength (nm)
Depth
of absorp
tion
Profile Sp/GF
0
0.2
0.4
0.6
0.8
1
1.2
1300 1500 1700 1900 2100 2300
Central w avelength (nm)
Assym
etr
y
Water
Water
Talc Talc
Sericite Sericite

20
Shear zones near the contact between the Bulawayan and Shamvaian Supergroups
Profile Sp8
0
5
10
15
20
25
30
1800 1900 2000 2100 2200 2300 2400
Central w avelength (nm)
Depth
of absorption
Water
Kaolinite
Nontronite Talc
Profile Sp8
0
1
2
3
4
1800 1900 2000 2100 2200 2300 2400
Central w avelength (nm)
Assym
etr
y
Talc
Nontronite Kaolinite
Sericite
Water

21
Sheared contact between Bulawayan Sp-group and granites
Profile Sp1
0
20
40
60
1300 1500 1700 1900 2100 2300
Central w avelength (nm)
Depth
of A
bsorption
Profile Sp1
0
1
2
3
4
1300 1500 1700 1900 2100 2300
Central w avelength (nm)
Assym
etr
y
Water Water
Sericite
Sericite
Kaolinit
e
Kaolinit
e
Kaolinit
e
Kaolinite
22
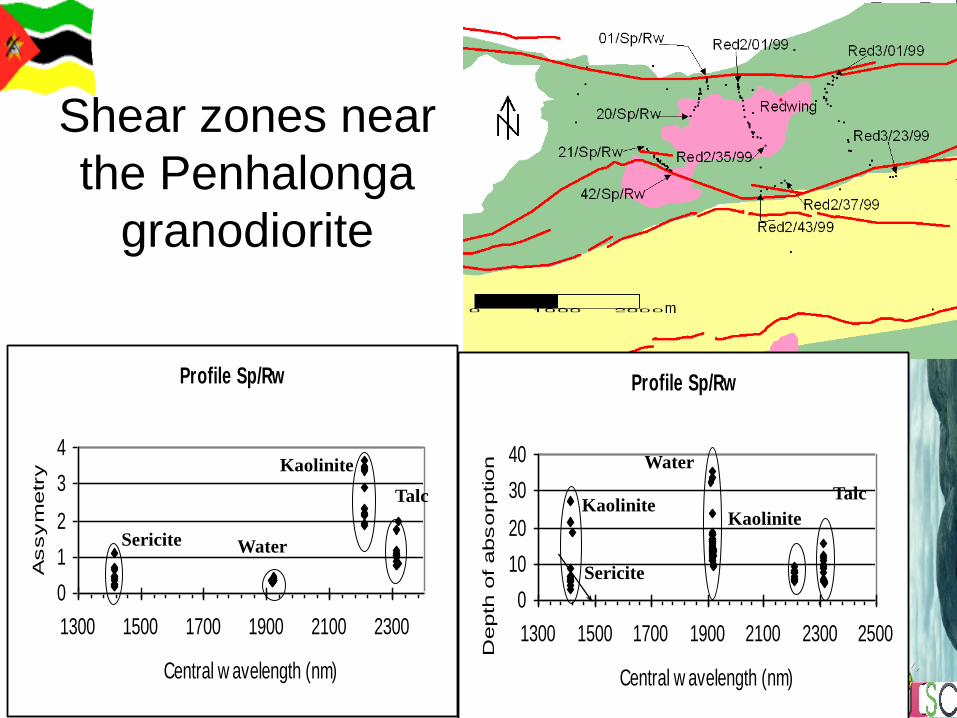
Shear zones near
the Penhalonga
granodiorite
Profile Sp/Rw
0
10
20
30
40
1300 1500 1700 1900 2100 2300 2500
Central w avelength (nm)
Depth
of absorption
Profile Sp/Rw
0
1
2
3
4
1300 1500 1700 1900 2100 2300
Central w avelength (nm)
Assym
etr
y
Talc
Kaolinite
Water
Sericite
Kaolinite Talc
Kaolinite
Water Sericite

23
1
10
100
Sp8
/01/
99
Sp8
/02/
99
Sp8
/03/
99
Sp8
/04/
99
Sp8
/05/
99
Sp8
/06/
99
Sp8
/07/
99
Sp8
/08/
99
Sp8
/09/
99
Sp8
/10/
99
Sp8
/11/
99
Sample number
Min
era
l M
ixtu
re %
Anhydrite
Talc
Kaolinite
Halloysite
Hornblende
Interpretation of the Results
Reflectance parameters (e.g. absorption feature) and the asymmetry index are important for the identification of the minerals in each sample but have proved to be of less significant when it comes to map shear zones and associated alteration, mainly due to mineralogical
mixture reflected
in the spectrum
and to the limited
amount of minerals
revealed by this
technique.

24
Approach that considers the % of each mineral in
the mixture in order to identify differences in
proportion and distribution of minerals resulting
from the presence of shear zones
1
10
100
Sp/G
F/01
Sp/G
F/02
Sp/G
F/03
Sp/G
F/04
Sp/G
F/05
Sp/G
F/06
Sp/G
F/07
Sample number
Min
era
l mix
ture
%
Anhydrite
Talc
Kaolinite
Halloysite

25
Profile on: ultramafic schists, granodiorite, a disturbed mine area
including old mine dumpsite and a contact between granodiorite
and ultramafic schists. The different minerals at varying
proportions, might be related to the lithologies underneath.
1
10
100
RE
D2
/01
/99
RE
D2
/04
/99
RE
D2
/06
/99
RE
D2
/08
/99
RE
D2
/10
/99
RE
D2
/12
/99
RE
D2
/15
/99
RE
D2
/17
/99
RE
D2
/19
/99
RE
D2
/21
/99
RE
D2
/23
/99
RE
D2
/26
/99
RE
D2
/28
/99
RE
D2
/30
/99
RE
D2
/32
/99
RE
D2
/37
/99
RE
D2
/40
/99
RE
D2
/42
/99
Sample number
Min
era
l m
ixtu
re %
Anhydrite
Talc
Halloysite
Kaolinite
Tremolite

26
Conclusion • PIMA spectrometer can be used in the field for
mapping shear zones during exploration programs in the MMO greenstone and similar environments.
• PIMA analysis can be important for validation of the existence or not of shear zones, which could have been defined on the basis of satellite imagery interpretation. This was observed in all profiles that crossed known shear zones which have shown mineralogical anomalies on top of the shear zones.
• PIMA data are only provisional for preliminary stages of exploration programs and this type of data bear the advantage of fast mineralogical results in the field.

27
Special thanks to: • de Beers SA • The Organizers and sponsors to this GIRAF 2013

28

29
0
5
10
15
20
25
30
S_06_
SSP_R
w_
S_07_
SSP_R
w
S_10_
SSP_R
w
S_11_
SSP_R
w
S_14_
SSP_R
w
S_17_
SSP_R
w
S_19_
SSP_R
w
S_23_
SSP_R
w
S_24_
SSP_R
w_
S_28_
SSP_R
w_
S_30_
SSP_R
w_
S_34_
SSP_R
w_
S_38_
SSP_R
w_
S_41_
SSP_R
w_
Salmpes
Absorp
tion (
%)
(1350 -
1700 n
m)
Iron Parameter