PARP mediates structural alterations in diabetic cardiomyopathy

In: Brain Research Journal ISSN 1935-2875 Volume 1, Issue 4 © 2008 Nova Science Publishers, Inc.
BRAIN MAPPING ALTERATIONS IN STRABISMUS Martín Gallegos-Duarte1, Héctor F. Rubio-Chevannier2 and
Jorge Mendiola-Santibañez3
1Instituto de Enfermedades Congénitas. Querétaro, México 2Unidad Neurológica Satélite, México, D.F.
3Universidad Autónoma de Querétaro, México
ABSTRACT
Congenital strabismus affects 3% of world population. Millions of persons suffer this condition, but still its origin or the reasons why not all patients respond to the traditional treatment are unknown.
Until very recently, it was believed that congenital strabismus had no relation to cortical alterations; therefore, neuroimaging studies were only required when strabismus was present in premature infants or when brain damage was suspected.
A preliminary study on strabismal patients in 1968 provided some insight into the incidence of the different presentations of strabismus in our institution, as well as the correlation among the various clinical signs. Based on this experience we decided to enlarge our sample. Using conventional EEG and digitized brain mapping (DBM) methods, we analyzed 195 young patients with clinical diagnosis of congenital strabismus –111 females (56.92%) and 84 males (43.08%); the age range was from 2 to 14 years.
The DBM approach was done in real time. Given its low cost, security and availability, DBM turned to be a useful tool to evince some alterations in cerebral cortex related to congenital strabismus, especially dissociated strabismus. We also employed complementary neuroimaging methods for research purposes.
From 195 DBM images, 56.4% exhibited various neuroelectric alterations, whereas 43.6% were considered normal. Abnormal DBM were more frequent in the dissociated strabismus group (64.95%) than in non-dissociated strabismus patients (42.6%); the rate of altered DBM images was higher in horizontal dissociated deviation cases (73.3%). Based on these findings, we recommend the use of DBM in patients with dissociated strabismus, and in some cases the treatment must go beyond surgery and glasses.
Some of our patients were subjected to different neuroimaging methods, such as single Photon emission tomography (SPECT), magnetic resonance imaging (MRI), granulometry, and proton nuclear magnetic resonance spectroscopy (1H NMRS) with the aim of correlating this data and gain further understanding on the origin of congenital strabismus, particularly dissociated strabismus cases.
This chapter addresses aspects of congenital strabismus, as well as some of its cortical implications –neuroelectric, neurometabolic and morphometric.
The illustrations are meant to make this interesting and scarcely-explored topic more accessible.

Martín Gallegos-Duarte, Héctor F. Rubio-Chevannier et al. 288
1. STRABISMUS Congenital strabismus affects 3% of world population [1]. This condition refers to the
pathological ocular deviation [Photo 1], [1], that is, while the dominant eye controls the visual sense and direction, the deviant eye exhibits a different alignment to the purpose and direction of the dominant eye [2].
Since no neurological damage is evident in this condition, the question that prompts is: What is congenital strabismus and where is its origin? [3] [Hoyt and Good]. To gain more insight into this problem, we employed clinical neurological studies and neuroimaging to get some answers.
There are always small differences in visual perception and in the movement of both eyes. In normal conditions, these variations are harmonized and integrated in the cerebral cortex, so that perceived images from each eye are fused into one. In strabismus these differences are large and anomalous relations are established between both eyes originating a functional competence between both visual fields. This in turn produces neurosensory variations such as amblyopia and suppression [4].
Congenital strabismus appears before infants are one year old and its clinical manifestations are varied [1,2,3,5]. From these manifestations the distinct sensory-motor descriptions of this condition have been integrated. However, more important than the time of appearance of this condition, is the fact that congenital strabismus is accompanied or not of dissociated movements [4].
Primary dissociated movements by nature are always congenital [4]; they can be detected when one of the eyes is fixed on a determined object, then the other manifests smooth and intermittent movements with variable angles that are regulated independently of the supranuclear control and Hering’s law [Photo 2a, 2b] [6,7,8].
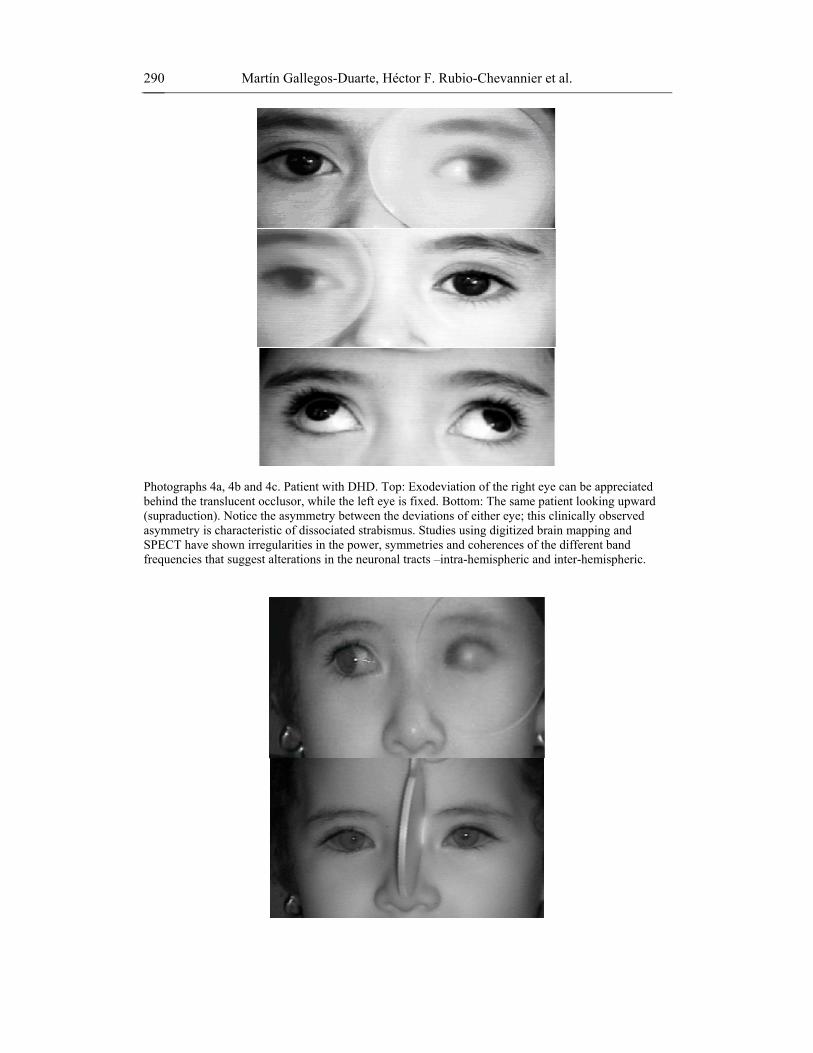
Dissociated movements are identified through their clinical manifestations as: dissociated vertical deviation (DVD) when the predominant dissociated movement is upward [Photos 2a,2b] and dissociated horizontal deviation (DHD) when the movement is variable, asymmetric and directed outward [Photos 3a, 3b, 3c, 3d, 4a, 4b, 4c] [6,7].
Photograph 1. Infant with congenital esotropia, variety Ciancia. The left eye fixes the gaze while the right eye deviates inward.

Brain Mapping Alterations in Strabismus 289
In addition, when the dissociated predominant movement is variable and inward and it is accompanied by DBM alterations, latent nystagmus, DVD, suppression, horizontal uncommittance, hyperopia astigmatysmus, amblyopia and lack of torticollis encompasses a syndrome known in Mexico as strabismic syndrome of angular variability (SSAV) [8] [Photo 5a, 5b, 5c, 5d]. DHD and SSAV will be discussed in more detail in this chapter, since these forms exhibit more cortical alterations than the rest and therefore have been studied more thoroughly.
Photographs 2a and 2 b. In the left Photograph the left eye presents a slight upward deviation due to a dissociated vertical deviation in low degree that can be enhanced by diminishing the entrance of light to the eye or the quality of the image with a translucent occlusor. These movements are independent or not associated with Hering’s Law.
Photographs 3a, 3b, 3c and 3d. Photographic sequence taken in partial darkness using the night shoot mode. 6-year old boy with DHD, exhibits an intermittent and variable exodeviation when the right eye is fixed (the pupil shows a light background reflection or Broker's reflex with a luminous spot at the center), the left eye is deviated outward and upward; the same thing happens when the left eye is fixed, the right eye then gets deviated. Notice that deviation measures are different for each eye. This asymmetry and variability in the presentation angle accompanied by other alterations such as suppression and amblyopia are not a good sign in accordance with the normativity of deviations reported in neurophysiological studies carried out in our patients.
Martín Gallegos-Duarte, Héctor F. Rubio-Chevannier et al. 290
Photographs 4a, 4b and 4c. Patient with DHD. Top: Exodeviation of the right eye can be appreciated behind the translucent occlusor, while the left eye is fixed. Bottom: The same patient looking upward (supraduction). Notice the asymmetry between the deviations of either eye; this clinically observed asymmetry is characteristic of dissociated strabismus. Studies using digitized brain mapping and SPECT have shown irregularities in the power, symmetries and coherences of the different band frequencies that suggest alterations in the neuronal tracts –intra-hemispheric and inter-hemispheric.

Brain Mapping Alterations in Strabismus 291
Photographs 5a, 5b, 5c and 5d. Six-year old, female patient with a variety of dissociated strabismus called “strabismic syndrome of angular variability” (SSAV). Upper Photos: Patient turns to her right, to the front and to her left during a stable phase (non-variable). Lower Photos: Patient tries to turn to her left during the variable phase. The left eye can not shift itself possibly due to the isometric contraction of the medial straight muscle that is not able to relax while the right eye gradually increases its deviation angle. This condition might be propitiated by the active cortical inhibition following Hering’s law possibly hindered by cortical disturbances evinced in Digitized Brain Mapping.
In cases of congenital strabismus, in which dissociated movements are rather evident, ophthalmologists usually call it “dissociated strabismus”. This condition entails a combination of movements in the horizontal, vertical and torsional directions, but the direction of the predominant movement is the one that gives name to the particular type. These dissociated movements can manifest themselves spontaneously, especially when the child in under physical or emotional stress: angry, tired, irritated, dehydrated or ill. There are some clinical manipulations that can induce this type of movements such as the cover test and cover-uncover test [9, 10] [Photos 2a, 2b]. Dissociated strabismus is usually related to neuroelectric, granulometric, sensory and perceptual alterations that will be addressed in this chapter.
With regard to the origin of congenital strabismus, its multifactor character with certain family predisposition is generally accepted [5]. Electro-occulography studies (EOG) in first degree relatives considered healthy show 63% alterations in eye pursuit movements when they have a strabismic relative [11].
Although congenital strabismus does not follow a Mendelian inheritance pattern, in some occasions it behaves as a dominant autosomic disease of incomplete penetration and in other occasions as a multifactor disease [12]. In our sample, 27% of our patients [10] admit having at least other relative with strabismus.
Among the many factors originating this disease, prematurity in newborns is an important risk factor to presenting strabismus, retinal alterations, refractive errors and neuronal immaturity [12]. In addition, newborns with low weight and respiratory distress [13,14,15]

Martín Gallegos-Duarte, Héctor F. Rubio-Chevannier et al. 292
are especially susceptible to presenting periventricular, intraventricular or parenchymal hemorrhages.
In premature newborns periventricular circulatory self-regulation is believed to be passive and dependent on perfusion pressure; meaning that fluctuations in arterial or central venous pressure, such as those occurring in traumatic births, due to respiratory alterations, the use of positive pressure and other maneuvers, can produce lesions in the vessels of the stem matrix [16,17]. Biochemical changes at this level [14] can also induce damage to neuronal interconnection pathways. This in turn produces various clinical manifestations, including strabismus.
When early onset of strabismus is accompanied by evident neuronal damage, for example, infant cerebral palsy or psychomotor retardation, neuroimaging exams such as intracranial ultrasound, EEG and magnetic resonance imaging (MRI) are carried out as soon as possible to determine the type and extension of the brain damage. It is infrequent that a physician requests a BDM study to gain further insight beyond that attained with an EEG, though the former method is useful in congenital strabismus for providing information on cortical activity. Thus, patients with congenital strabismus are regularly prescribed lenses, visual therapy, orthoptic eye patches and surgery, but they could be presenting cortical malfunctioning, not clinically detectable. [8]
Predisposition of patients to DBM alterations are those that are less than 7 years old and simultaneously present suppression, amblyopia, latent nystagmus and dissociated vertical deviation [Table 1].
Table 1. In a group of 68 patients with congenital strabismus the clinical signs
(Pearson’s correlations) were analyzed to establish correlations. Four signs with high correlations –latent nystagmus, dissociated vertical deviation, amblyopia and
suppression-- were identified in dissociated strabismus. These four elements were also correlated with altered brain mappings.
Pearson´s Correlations
1 .396** .442** .432 ** . .001 .000 .000
68 68 68 68
.396** 1 .194 .217
.001 . .112 .075
68 68 68 68
.442** .194 1 .803 ** .000 .112 . .000
68 68 68 68
.432** .217 .803** 1
.000 .075 .000 .
68 68 68 68
Suppression
Amblyopia
Latent Nystagmus
Dissociated Vertical Deviation
Suppression Amblyopia
Latent
Nystagmus
Dissociated Vertical
Deviation
**Correlation is significant at the 0.01 level (2-tailed). Analysis.

Brain Mapping Alterations in Strabismus 293
2. PERCEPTUAL ASSESSMENT AND STRABISMUS Although CS does not affect what Piaget and Vygotski [18,19] called “superior
functions”, there is evidence indicating that various association areas such as Broca’s, Wernicke’s, angular gyrus, and parieto-occipital regions, as well as motor areas might be involved; the results of perceptual assessments [20] and neuroelectric alterations in DBM [21] support this hypothesis.
The former can be understood when the cerebral cortex is visualized as a vast interconnection network. The visual cortex not only has feedback circuitry but also conveys information to other extra-striatum cortical zones. For example, the visual system is involved in the process of turning ideas into semantic and reading-writing messages [22], but impairments such as strabismus and amblyopia can deteriorate these abilities. It has been suggested that letter and word perception and reading comprehension are affected by visual, semantic, and environmental aspects where such reading occurs [22,23]. Moreover, lexicological and semantic levels affect the perceptual process in the phonological and logographical aspects, respectively.
It is also known that patients with CS exhibit difficulty in second and third degree stereopsis; this deficit indicates impairment in cortical integration.
A subjective manner to assess the performance of the visual system is through perceptual evaluations. These tests are designed to assess the capacity of the individual to give meaning to the information provided by the visual system, cerebral cortex and association areas [23]. Through these tests it is possible to establish whether the responses are adequate for certain visual stimuli.
Patients with strabismus present low spatial coordination, impairment in locomotor activity and a low profile in the results of perceptual tests. In a prospective study in which a screening perceptual assessment was carried out in a homogeneous group of 7-year old children with dissociated strabismus( n= 10), we found that all presented a low profile in visual perception, especially stereopsis, forms, sizes and spatial localization [21]. The mean values of these findings are given in Table 2.
Table 2. Perceptual assessment. An average of visual abilities was evaluated in 10
children (7 year-old) with dissociated strabismus. The outcome of each test was always deficient (less than 100%) especially in stereopsis, velocity of perception, perceptions of
forms and sizes, and peripheral vision.
Strabismus Dissociated and Perceptual Alterations n = 10 Perception of depth (estereopsia) 0% Visual memory 77.50% Speed of perception 64.25% Space perception 56.25% Saccadic movements 71.25% Peripheral vision 41.75% Perception of fundamental elements 87.75% Perception of forms and sizes 41.75% Movements of pursuit 81.25%

Martín Gallegos-Duarte, Héctor F. Rubio-Chevannier et al. 294
All patients had average school performance and adequate socialization within parameters considered as normal by parents, pediatricians and teachers. However, when some parents were interviewed they recognize that their sons tended to mix–up letters when reading or writing, were slow at reading and doing their homework, got easily distracted, placed their faces at a very short distance from their notebook or had a bad quality in handwriting.
Although these children presented oculomotor alterations without overt neurologic manifestations, they revealed visual perceptual deficits, possibly related to impairment in neuronal interconnection pathways between striatum cortex and cortico-cortical and inter-hemispheric areas participating in image processing –recognition, meaning, spatial localization, depth and visual memory, among others.
3. NEUROFUNCTIONAL STUDIES AND STRABISMUS In the study of strabismus and amblyopia different neurofunctional and morphometric
methods have been utilized. Thouvenin [25] in France uses brain electrical activity mapping (BEAM) as a screening method to verify visual reactivity at cortical level in small children with strabismic amblyopia. Horton [26, 27] in the USA analyzes brain cortex in primates with cytochemical techniques; he has concluded that amblyopia is a cortical malfunction with ophthalmologic manifestations. In the same country, Mendola [28] using Voxel analysis, reports diminution in gray matter in areas including the calcarine sulcus, parieto-temporal regions, and ventral temporal areas. Suk et al [29] in Hong Kong have used this same technique to analyze the redistribution of gray matter, which they think is due to brain plasticity, in adult Chinese patients with exotropia employing Voxel-based morphometry (VBM).
Morphometric findings reported by Mendola [28] and Chan [29] are in agreement with the neurofunctional results by Gallegos et al. [8,9,21,30] [Photo 6] showing that areas of the extra-striate cortex are affected in dissociated strabismus. Gallegos-Duarte et al. [31] and Moguel-Ancheita et al. [32] using SPECT [Photo 7, 8] and DBM [9a, 9b]demonstrate the existence of improved cortical metabolic changes after strabismus treatment [30,31,32].
Gastaut [30] in 1982 and Panayiotopoulos [33, 34] in 1989, using EEG, described the paroxysmal symptomatology in occipital lobes as a different form of idiopathic partial epilepsy. This condition refers to occipital lobe epilepsy in children with its vast symptomatology, but in which ocular deviation is exceptional [35]. On the other hand, Gallegos [36] reports two DHD patients with a paradoxical cortical response to light, to whom intermittent Photo stimulation induces regularization in paroxysmal brain activity. [Photos 10a, 10b and 10c]
Gallegos and Moguel [30,31,32] using SPECT, DBM and EOG demonstrate neuroadaptive changes taking place after the application of the botulism toxin to a girl with SSAV, which is attributable to an epileptogenic focus in ictal phase in the temporal lobe [Photo 7]. In addition, Gallegos et al. [21], using DBM [Photo 9a and 9b] and 1H-NMRS show the existence of active neuronal distress in cerebral cortex in patients with DHD [Photo 11a ] and SSAV [Photo 11b] manifested as the diminution in aspartate levels, lactate enhancement and loss of the relationship between creatine and choline in cases of dissociated strabismus.

Brain Mapping Alterations in Strabismus 295
Photograph 6. Photograph of an eight year-old boy with dissociated strabismus (DHD), attention deficit disorder, and low school performance. He exhibits irritative discharges during sleep in left fronto-temporal regions (electrical activity was interpolated to brain mapping). EEG traces during wakefulness (not represented here) are anomalous, consisting of the slowing-down of the left temporal region and parieto-temporal asymmetry.
Photograph 7. Scintillography from tomographic images taken with SPECT scan analyzed 45 minutes after the iv administration of tecnecium 99 ethyl cysteinate dimer to be detected under spectrometric observation in the red-violet scale performed in a 5 year-old girl with SSAV. In zones 3 and 4 corresponding to right temporal area (left side of the image) an epileptogenic area can be appreciated. Zones 7, 8, and 9 –corresponding to left fronto-temporal area (right side of the image)—exhibit low expenditure of a glucose analog; these areas presented the lowest voltages. EEG showed slow and paroxysmal activity with hyperactivity in right fronto-temporal regions and higher power in right temporal region.
Martín Gallegos-Duarte, Héctor F. Rubio-Chevannier et al. 296
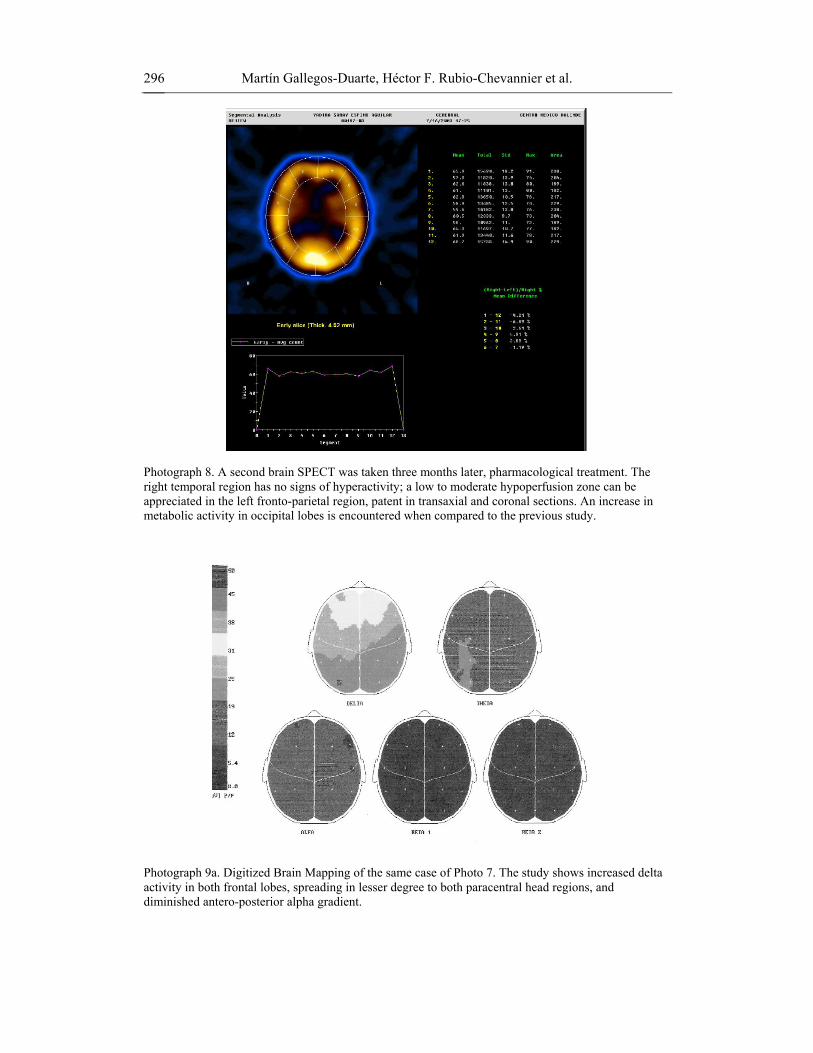
Photograph 8. A second brain SPECT was taken three months later, pharmacological treatment. The right temporal region has no signs of hyperactivity; a low to moderate hypoperfusion zone can be appreciated in the left fronto-parietal region, patent in transaxial and coronal sections. An increase in metabolic activity in occipital lobes is encountered when compared to the previous study.
Photograph 9a. Digitized Brain Mapping of the same case of Photo 7. The study shows increased delta activity in both frontal lobes, spreading in lesser degree to both paracentral head regions, and diminished antero-posterior alpha gradient.

Brain Mapping Alterations in Strabismus 297
Photograph 9b. Digitized Brain Mapping (DBM) of the same case of Photo 8. A second brain mapping was taken three months later pharmacological treatment. The study revealed a discreet improvement in the distribution of the power, a diminution of dysynchrony and a discreet delay in the cerebral electrogénesis. A year later another DBM was taken that was reported like normal.
Photograph 10a. EEG Six-year old, female with DHD diagnosis. The EEG shows unusually increased slow activity localized mostly both posterior head regions shortly after the hyperventilation began. Mixed with muscle and movement artifacts.
Martín Gallegos-Duarte, Héctor F. Rubio-Chevannier et al. 298
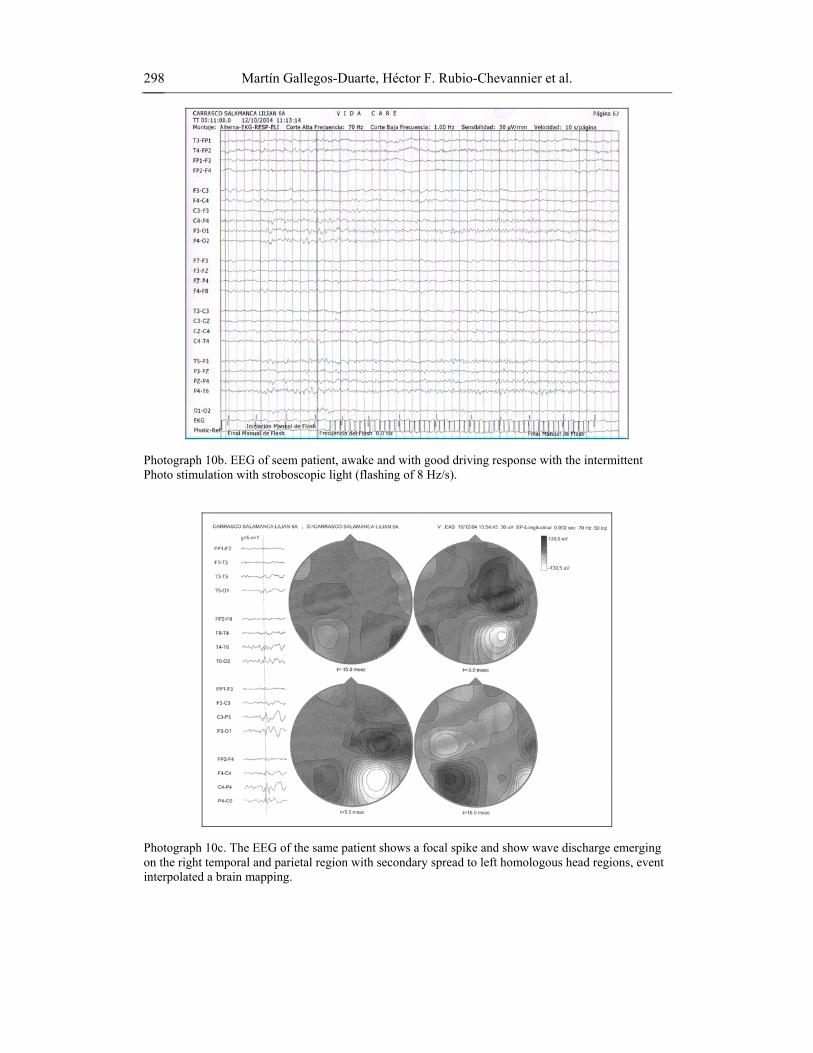
Photograph 10b. EEG of seem patient, awake and with good driving response with the intermittent Photo stimulation with stroboscopic light (flashing of 8 Hz/s).
Photograph 10c. The EEG of the same patient shows a focal spike and show wave discharge emerging on the right temporal and parietal region with secondary spread to left homologous head regions, event interpolated a brain mapping.

Brain Mapping Alterations in Strabismus 299
These authors suggest that the dissociated movements are the oculomotor manifestation of the epileptogenic disease [21, 30]. Besides, Gallegos et al [37] find, using granulometry, that DHD and SSAV have different degrees of neuronal maturity that were determined by this technique.
The above mentioned studies are completing the picture of cortical alterations underlying strabismus, and it has become clear that the striate cortex and the extra-striate cortex are involved in congenital dissociated strabismus. Moreover, neuroelectric studies of the cerebral cortex have shed a considerable amount of light on many aspects of this disease.
4. DIAGNOSTIC NEUROPHYSIOLOGICAL METHODS APPLIED IN STRABISMIC STUDIES
In 1950 Levinson and Stillerman made the first report showing that 30% of strabismic
patients presented electroencephalographic malfunctioning. Stillerman thought that ocular alterations including strabismus induced irritation in the occipital cortex, that is, for this author strabismus caused cortical changes, whereas Smith and Kellaway propounded that occipital alterations found in electrical recordings of some strabismic patients were projected from thalamic nuclei and that the physiopathology of strabismus should be different from epileptogenic lesions [38].
Given the difficulties researchers in strabismus had to confront at that time in trying to understand this condition by means of EEG studies, Soto de la Vega and Romero-Apis [38] publish in 1970 the first series of 116 cases in strabismus (including some neurogenic associated diseases) showing that 92% of patients presented electroencephalographic anomalies, especially the presence of slow waves. In this study there is a diagnosed case of “intermittent exotropia” along with an electroencephalographic recording exhibiting “clear spike paroxysmal activity from temporo-occipital (right and left) and occipito-occipital derivations”. In retrospect, this case highly probably corresponded to a patient with dissociated strabismus, similar to intermittent exotropia, now known as DHD.
Three fundamental facts originated from those early studies: a) a high incidence of cortical anomalies in the strabismic population, b) slow brain waves, and c) the presence of paroxysms. However, a long time had to elapse before many factors associated with dissociated strabismus could be correlated, namely clinical findings, neuroelectric recordings, neuroimaging studies and physiopathogeny.
Based on those studies, Gallegos and Moguel [8] prospectively study DBM information from 11 patients presenting congenital esotropia with variability and uncoordinated manifestations, but now related to anomalies in the brain cortex (Fisher test, p< 0.001). These authors conclude that this syndrome has own characteristics. It is characterized by the presence of congenital esotropia, variability, limited abduction, latent nystagmus, lateral nystagmus, dissociated vertical deviation (DVD) amblyopia, suppression, asymmetric horizontal movements and hyperopic astigmatism. [8,9,10].
Preliminary studies of the 11 patients mentioned previously showed lateralized cortico-subcortical dysfunction in 4 cases, diffuse dysfunction in 2 cases, asymmetry in frequency and power, electrooculogenesis delay in 2 cases, and non-lateralized irregular bursts of probable sub-cortical or centro-encephalic origin in 3 cases [8].

Martín Gallegos-Duarte, Héctor F. Rubio-Chevannier et al. 300
The combination of neuroimaging methods with electrophysiological studies allows a better localization of the origin of some alterations such as epilepsy, since the time-spatial resolution is enhanced [39]. A given example is the analysis of both, the neuroelectric behavior with DBM and the neurometabolic performance with SPECT, to study strabismus. [30, 31].
Using this combination of techniques, in one of our series of patients [30] the presence of low activity and high-voltage paroxysmal bursts and higher power in the right temporal region were evinced with EEG-DBM. Also, the presence of an epileptogenic focus in ictal phase was identified with SPECT imaging in the right temporal region originating a small symptomatogenic area (=194) with relative metabolic hyperactivity (64.7 U) [Photo 7]. This patient showed no neurological manifestations other than strabismus; this condition was characterized by: slow, variable and intermittent movements in the right eye, sometimes vertical and upward. These movements were present several times a week, particularly when she was tired or sleepy [Photo 4a].
The correlation between neurometabolic [Photos 7, 8] and neuroelectric alterations [Photos 6, 9a and 9b] could be related to the dissociated eye movements in a similar manner to some interictal EEG abnormalities observed in epileptic disorders.
After treatment with botulism toxin, visual therapy and neurological handling, the symptomatology improved remarkably. The motor aspect was stabilized; cortical, electric and metabolic responses also improved. A subsequent control study revealed a redistribution of glucose expenditure where higher quantities were present in posterior brain regions [Photo 8].
As DBM measures minute electrical pulses in brain activity, SPECT can quantify minor differences in the consumption of glucose analogs, by generating spectrometric images in two and three dimensions that can be computer analyzed in vivo [40, 41]. Given its spatial resolution, SPECT analysis is used to detect areas with functional deficits. [Photo 7] [31, 32, 40, 42]
The positive findings encountered in the above-mentioned studies have stimulated the use of neuroimaging methods such as SPECT (Photos 7 and 8) EEG [Photos 10a,10b], DBM [Photo 10c], 1H-NMRS and MRI [Photos 11a, 11b and 11c], granulometry [Photos 12a, 12b, 12c, 12d], EOG [Photos 13, 14a, 14b, 14c], and neurometry [Figure 1, Table 3 ], in studies on cerebral cortex behavior in strabismus. For example, with the aid of neuroimaging techniques it has been possible to differentiate in an ontogenic and functional manner that congenital esotropia has two varieties: the most common was described by Dr. Alberto Ciancia and known as “Ciancia syndrome” [Photo 1], the second dissociated condition has been recently dubbed in Mexico as SSAV [Photos 5a, 5b, 5c, and 5c]. Each form has its own distinctive features [10].
Combined neuroimaging studies such as DBM and 1H-NMRS have recently contributed to the better understanding of SSAV (of recent nosologic description) and DHD (thought to be a type of intermittent exotropia until a few years ago); these ailments might be considered the oculomotor expression of a cortical malfunction [21,30].
By means of DBM it is known that DHD exhibits various malfunctions in brain electrogenesis different from those found in intermittent exotropia. [36] From 1H-NMRS information [21] it is also known that there is neuronal distress in DHD, whereas granulometry [37] has shown that this type of patients presents less granulometric density than healthy children do. [Photos 12a, 12b, 12c, 12c]

Brain Mapping Alterations in Strabismus 301
Photo 11a. Spectroscopy (1H-NMRS) of the occipital lobes of the brain of a boy of 7 years of age, with DHD diagnosis. A loss of the choline - creatine relation is observed.
Photo 11b. Spectroscopy (1H-NMRS) performed in a 4 year-old girl with SSAV showing high lactate levels (4 units) and decreased N-acetyl-aspartate concentration (12 units). The white square in the axial and sagittal projections shows the exact location where the 1H-NMRS sample was taken from.

Martín Gallegos-Duarte, Héctor F. Rubio-Chevannier et al. 302
Photograph 11c. Normal RMI of a girl of 7 years of age with SEVA. The macroestructural morphometrics reports always are normal in these cases; nevertheless, the determined microstructural reports by means of the granulometric analysis are altered.
Photographs 12a and 12b. White substance of the occipital lobes in a healthy 7 year-old boy. 12a Abundant granulometric small forms are appraised that penetrate deeply in the gray substance and in addition are ordered in coraliform aspect. (12a).The healthy brains are gradually losing the elements of small size of the white substance during the granulometric technique (12b).
Photographs 12c and 12d. 12c. White substance of the occipital cortex in a 7 year-old boy with DHD. Notice the heavy absence of small granulometric sized elements (12c) as well as lobulated aspect (12d) that emerge from two great pieces. During the procedure of elimination of granulometric sized elements, first the small elements disappear, later the elements of greater size are disappearing progressively. In the brain with DHD it is possible to be observed that the small elements do not exist and this is a important morphologic difference.
Brain Mapping Alterations in Strabismus 303
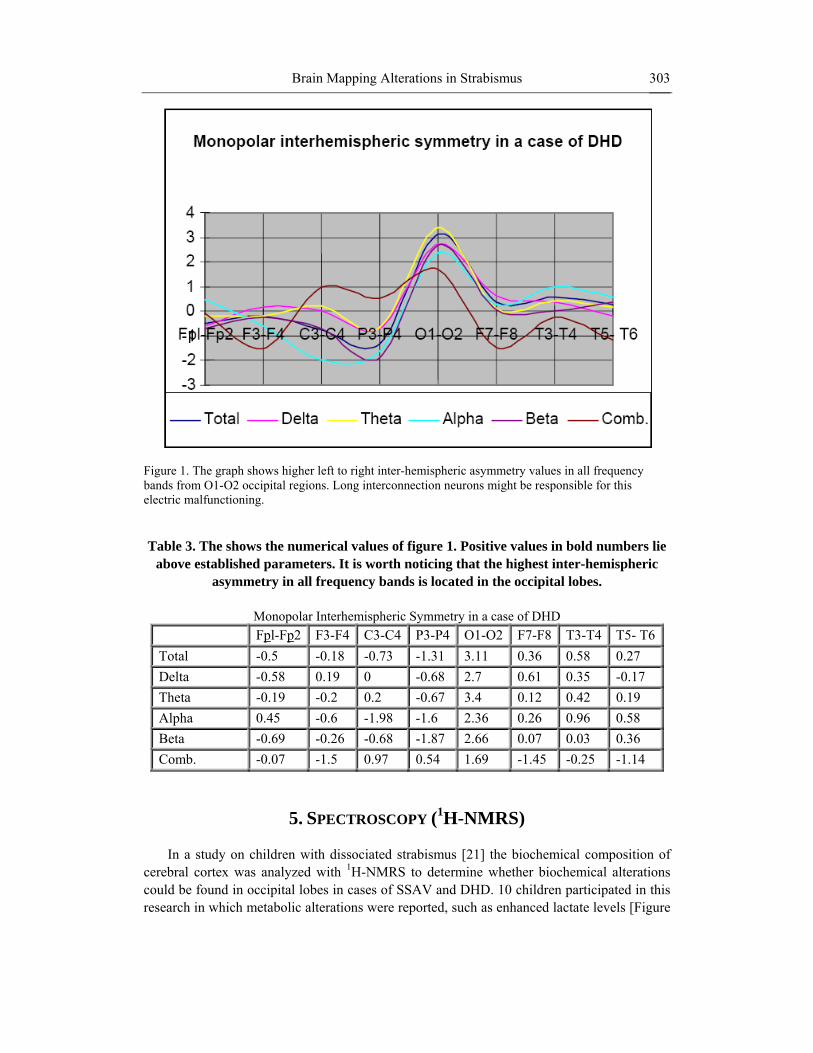
Figure 1. The graph shows higher left to right inter-hemispheric asymmetry values in all frequency bands from O1-O2 occipital regions. Long interconnection neurons might be responsible for this electric malfunctioning.
Table 3. The shows the numerical values of figure 1. Positive values in bold numbers lie
above established parameters. It is worth noticing that the highest inter-hemispheric asymmetry in all frequency bands is located in the occipital lobes.
Monopolar Interhemispheric Symmetry in a case of DHD
Fpl-Fp2 F3-F4 C3-C4 P3-P4 O1-O2 F7-F8 T3-T4 T5- T6 Total -0.5 -0.18 -0.73 -1.31 3.11 0.36 0.58 0.27 Delta -0.58 0.19 0 -0.68 2.7 0.61 0.35 -0.17 Theta -0.19 -0.2 0.2 -0.67 3.4 0.12 0.42 0.19 Alpha 0.45 -0.6 -1.98 -1.6 2.36 0.26 0.96 0.58 Beta -0.69 -0.26 -0.68 -1.87 2.66 0.07 0.03 0.36 Comb. -0.07 -1.5 0.97 0.54 1.69 -1.45 -0.25 -1.14
5. SPECTROSCOPY (1H-NMRS) In a study on children with dissociated strabismus [21] the biochemical composition of
cerebral cortex was analyzed with 1H-NMRS to determine whether biochemical alterations could be found in occipital lobes in cases of SSAV and DHD. 10 children participated in this research in which metabolic alterations were reported, such as enhanced lactate levels [Figure

Martín Gallegos-Duarte, Héctor F. Rubio-Chevannier et al. 304
2], decrease in N-acetyl-aspartate levels Figure 3] and lack of correlation between choline and creatine. [Figure 4].
Figure 2. Increase in lactate concentrations in 6 out of 10 patients with DHD. Presence of lactate reflects hypoxia and neuronal distress. Blue bars correspond with low lactate levels, whereas green bars indicate high concentrations of this metabolite.
Figure 3. Diminution in N-Acetil Aspartate concentrations in 7 out of 10 patients with DHD.
1H-NMRS gives information on the biochemical constitution of brain structures by measuring some metabolite concentrations. To achieve this electrons are excited in these substances by the incoming energy from magnetic resonance, this causes particles to change from a certain state α to a state β, when the electrons return to their initial state they release energy in the radiofrequency range that can be put into graphs. [43, 44] [Photo 11 a, 11 b]
Among the quantifiable elements in the brain by 1H-NMRS is creatine (Cr), a metabolite associated with energy production; N-acetyl-aspartate (NAA), found in axonal projections in white matter and whose diminution indicates neuronal damage, and lactate (Lac) whose enhancement implies neuronal distress, since it is a metabolite of anaerobic glycolisis [44,45]. There is evidence showing that epileptogenic activity induces neurolectric and

Brain Mapping Alterations in Strabismus 305
neurometabolic changes. Studies in rats [46] show that epileptic activity increases oxygen consumption in the affected area.
Figure 4. Creatine/ Choline relation. In normal conditions this relation must be 1:1, some patients presented changes in this proportion.
During the ictal phase [Photo 7] neurons receive an excitatory impulse that enhance oxygen consumption, which in turn reflects a subsequent depletion of energy in the affected area; this induces, on the one hand, electroencephalographic changes [Photo 9a] and, on the other hand, metabolic changes in the area surrounding the lesion, consisting basically in a raise in oxygen, lactate and pyruvate levels [Photo 11b, Figure 2].
It has been suggested that dissociated movements may be a form of expression of the epileptogenic condition and that the cerebral cortex actively participates in their origin [30]. In a study carried out in 7 year-old children (n=10) with dissociated strabismus and EEG paroxysms, 6 exhibited lactate enhancement [Figure 2]] and 7 showed a small diminution in N-acetyl-aspartate [18] [Figure 3].
N-acetyl-aspartate is present in high concentrations almost exclusively in brain neurons; therefore, it can be used to measure neuronal loss or diminution of gray matter [43]. A decrement in this neuronal marker has been reported in occipital cerebral cortex in children with dissociated strabismus [18]. This agrees with the findings reported by Suk [29] in the sense that a diminution in gray matter might exist in the occipital lobes of strabismic patients.
The presence of lactate in occipital lobes (site where samples were taken) point to the existence of acute neuronal distress that can be related to epileptogenic activity detected with EEG and DBM methods in distant areas of visual brain cortex, connected by intra-hemispheric or transcortical tracts, while N-acetyl-aspartate diminution may indicate a decrease in neuronal volume. In perspective, these findings suggest that the symptomatogenic zone is far from the visual brain cortex [21].
6. EOG AND STRABISMUS Since Dewar introduced the electrooculographic (EOG) study in humans in 1877, this
technique is the most widely used to understand vestibular functioning; currently this
Martín Gallegos-Duarte, Héctor F. Rubio-Chevannier et al. 306
methodology has been enriched with the use of video-oculography [47]. Initially this test was carried out by using a galvanometer and electrodes immersed in saline solution. This method has been improved not only in the technical aspects but also in its accuracy since nowadays it has incorporated EOG and video-recording to the electroencephalographic recording of children with strabismus.
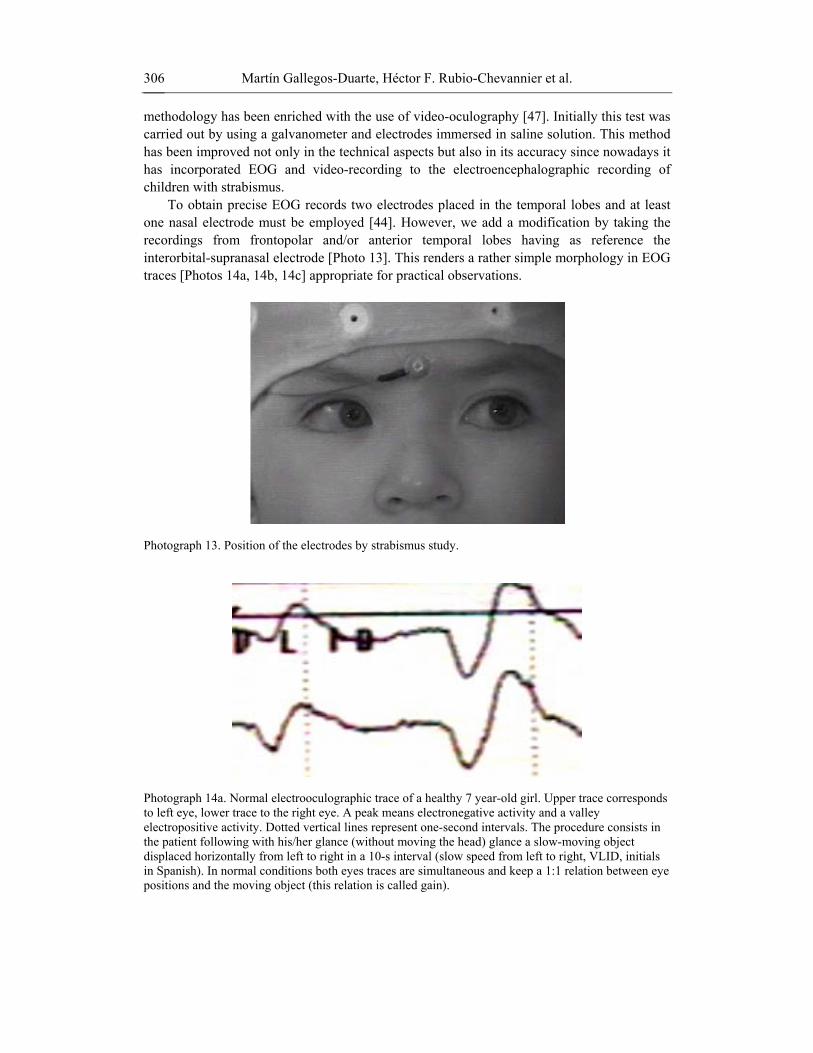
To obtain precise EOG records two electrodes placed in the temporal lobes and at least one nasal electrode must be employed [44]. However, we add a modification by taking the recordings from frontopolar and/or anterior temporal lobes having as reference the interorbital-supranasal electrode [Photo 13]. This renders a rather simple morphology in EOG traces [Photos 14a, 14b, 14c] appropriate for practical observations.
Photograph 13. Position of the electrodes by strabismus study.
Photograph 14a. Normal electrooculographic trace of a healthy 7 year-old girl. Upper trace corresponds to left eye, lower trace to the right eye. A peak means electronegative activity and a valley electropositive activity. Dotted vertical lines represent one-second intervals. The procedure consists in the patient following with his/her glance (without moving the head) glance a slow-moving object displaced horizontally from left to right in a 10-s interval (slow speed from left to right, VLID, initials in Spanish). In normal conditions both eyes traces are simultaneous and keep a 1:1 relation between eye positions and the moving object (this relation is called gain).

Brain Mapping Alterations in Strabismus 307
Photograph 14b. Electrooculographic trace of a 7 year-old girl with SSAV. In this case the patient must follow with her glance a slow moving object from right to left (VLDI, initials in Spanish). A decrease in the electric potential is viewed as a flattening of trace, simultaneous to a significant delay in the pursuit movement when compared to the normal trace. Gain is 25% higher (1:1.25), that is, the response is 200 ms delayed with respect to the normal one for an object moving horizontally in space.
Photograph 14c. The same patient as in previous 3 weeks after the application of the botulinic toxin into the medial straight muscles. The procedure is to follow a slow-moving object from right to left. Attenuation in the trace can be appreciated along with a larger gain indicating a decrease in the eclectic power; this is clinically called paresis, caused in this case by the chemical agent. This sequence carried out in different epochs shows electrooculographic variations in the VLDI (slow movement from right to left) sequence originated by the pharmacological handling of strabismus.
Although this technique is simple, it enables the recognition, on the one hand, of oculo-palpebral potentials during the EEG recording to identify some differences in amplitude and synchrony, as well as the polarity of slow pursuit and saccadic movements in treated and untreated patients with dissociated strabismus. To obtain DBM images, the recordings are not made in the EOG recording area, since eye movements produce artifacts that can be misleading.
EEG studies in primates in which strabismus has been provoked [48] indicate a difference in the velocity of each eye movement when they go from an out toward an inside position (temporal nasal direction). This movement is quicker when eyes go from the inside out; this difference in velocities can be appreciated during pursuit movements as a delay with respect to the object displaced through space. This difference is known as gain [Photo 15].
The EOG analysis in patients with CS indicates alterations in pursuit movements [49]. In addition, permanence of opto-kinetic nystagmus (OKN) has been described in this type of patients at older ages.

Martín Gallegos-Duarte, Héctor F. Rubio-Chevannier et al. 308
Photograph 15. An object (white shade) uniformly moves of left to right at a constant speed of 10º /s and a distance of 50 cm in scotopic conditions (in the dark). The patient follows the object with this left eye while we observed the position of the eye with respect to the object. A lag in the position of the eye with respect to the object is observed. This misalignment is the "gain". The presence of "gain" means that there is motor instability and angular variability, which increases the risk of which the patients show a dissociated strabismus and greater incidence of alterations in the Digitized Brain Mapping registries.
7. NEUROPHYSIOLOGICAL STUDIES ON STRABISMUS: ELECTROENCEPHALOGRAM AND DIGITIZED BRAIN MAPPING
In the study of strabismus, neurophysiological studies are ahead of other neurodiagnostic
methods since they are endowed with a high temporal resolution (quasi-real). Besides, the obtained values are completely objective; hindrances being lower spatial resolution and its limitation to a bi-axial plane [50]. For these reasons data must be analyzed under strict neurofunctional parameters.
The percentage of anomalous neurophysiological studies [Photo 16 and 17] in this series was considerably high [Figure 5]; therefore, we suggest that DBM must be performed in all patients with congenital and neurogenic strabismus, where there is evidence of dissociated movements, suspected hypoxia, low weight, neonatal trauma or some other gestational event. One must bear in mind that a single DBM considered as “normal” does not preclude previous or future abnormal mappings.

Brain Mapping Alterations in Strabismus 309
Photograph 16. EEG and Digitized Brain Mapping of a six year-old boy with SSAV (a form of dissociated strabismus). The study reveals bilateral irregularity; there is no antero-posterior gradient as should correspond to a patient of this age. Asymmetry due to lower voltage on right temporal lobe and bilateral slowing with irritative discharge in left frontal region interpolated to brain mapping.
Photograph 17. Digitized Brain Mapping bi-dimensional image of the electric activity of a 6 year-old girl with DHD (other form of dissociated strabismus). There is an asymmetry in posterior regions due to the decreased beta activity in both right parieto-occipital and temporal regions; this contrasts with the alpha- and theta- wave predominance in the same regions ipsilateral to the non-dominant eye. Conventional EEG exhibited asynchrony in the alpha rhythm.

Martín Gallegos-Duarte, Héctor F. Rubio-Chevannier et al. 310
Figure 5. We analyzed 195 files with essential strabismus (not neurogenic strabismus). Most of the patients showed neurologic alterations: 85 cases (56, 41%) were reported like normal whereas 110 patients (63, 59%) showed neuroelectrics alterations.
DBM studies are obtained of EEG data, which in turn represent the power and the spatio-temporal relation of the different frequency bands and the electrical conductivity of neural groups, especially of the apical dendrites of the pyramidal cells in cerebral cortex. These cells are influenced by the electrical activity of subcortical neurons [50].
DBM reveals the dynamic and functional character of the cortical function in real time. It can be readily applied to all strabismic children. It is employed regularly to determine the implications and the possible origin of some clinical manifestations of the disease. An example of the practicality of this technique is the verification of positive neuroadaptive changes posterior to medical treatment or surgery [30, 31, 32, and 51].
DBM data are useful to demonstrate an improvement in the gain parameter during horizontal version movements posterior to medical treatment or surgery [30]. This confirms the hypothesis of neuroelectric [30, 31] and neurometabolic [30,32] improvements in comparison to the values of these parameters previous to pharmacological handling with botulism toxin and/or surgery [Photos 7, 8, 9a and 9b].
The neuroadaptive capacity encountered in patients having undergone surgery for strabismus is certainly due to the plasticity of the human brain; this characteristic is defined as the capacity “to minimize the effects of lesions through structural and functional changes [51] [Pascual-Castroviejo]. The best way to assess this plasticity is by analyzing “the clinical situation with respect to the congenital anomaly or to the pre- and post-treatment stages in the acquired “processes” [51], in other words, to determine a “before” and “after” with the utmost objectivity [30, 31, 32] [Photos 7, 8 9a and 9b].
Among the benefits obtained from neurophysiological and neuroimaging studies one can mention the possibility of obtaining positive changes by medical and surgical handling of strabismus [30,31,32], such as improvement in electric [30,31] and metabolic [30,31] inter-hemispheric coherence, power redistribution [9,21,30], input improvement to occipital cortical regions [21], and a diminution of paroxysms [9,21]. It is important to emphasize that strabismus is not only a cosmetic matter; rather it has become a neurological question, which is the true issue.
Brain Mapping Alterations in Strabismus 311
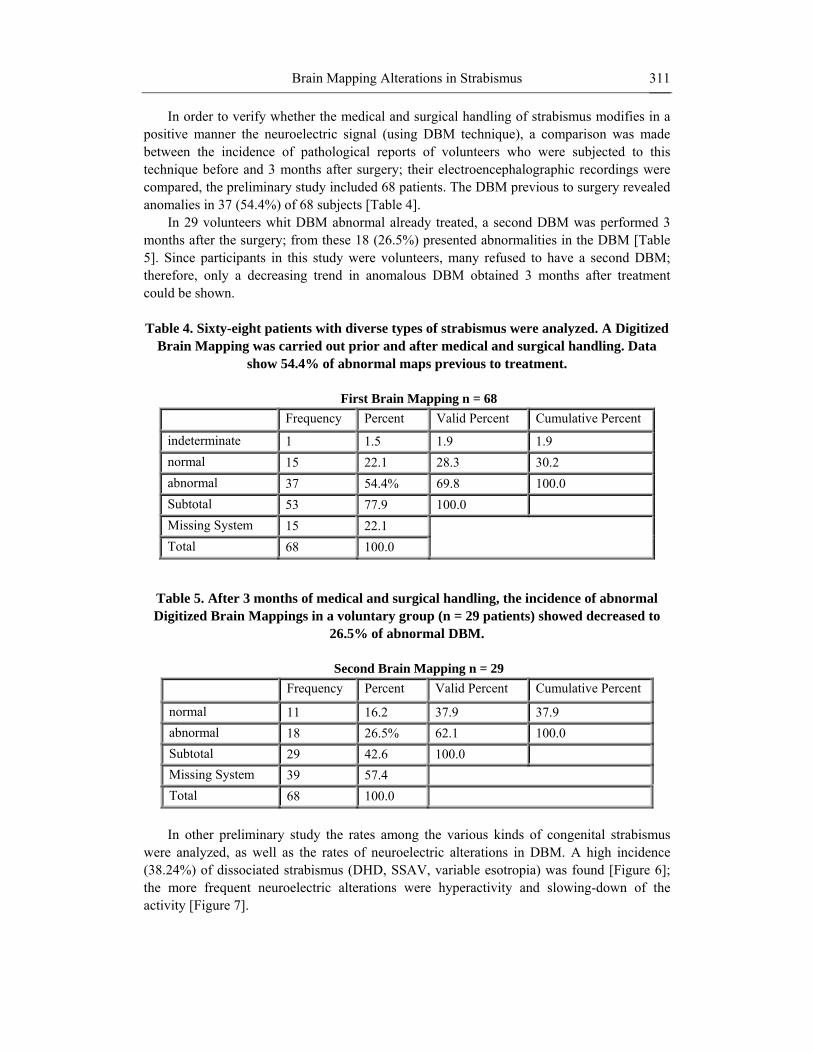
In order to verify whether the medical and surgical handling of strabismus modifies in a positive manner the neuroelectric signal (using DBM technique), a comparison was made between the incidence of pathological reports of volunteers who were subjected to this technique before and 3 months after surgery; their electroencephalographic recordings were compared, the preliminary study included 68 patients. The DBM previous to surgery revealed anomalies in 37 (54.4%) of 68 subjects [Table 4].
In 29 volunteers whit DBM abnormal already treated, a second DBM was performed 3 months after the surgery; from these 18 (26.5%) presented abnormalities in the DBM [Table 5]. Since participants in this study were volunteers, many refused to have a second DBM; therefore, only a decreasing trend in anomalous DBM obtained 3 months after treatment could be shown.
Table 4. Sixty-eight patients with diverse types of strabismus were analyzed. A Digitized
Brain Mapping was carried out prior and after medical and surgical handling. Data show 54.4% of abnormal maps previous to treatment.
First Brain Mapping n = 68
Frequency Percent Valid Percent Cumulative Percent
indeterminate 1 1.5 1.9 1.9 normal 15 22.1 28.3 30.2 abnormal 37 54.4% 69.8 100.0 Subtotal 53 77.9 100.0 Missing System 15 22.1 Total 68 100.0
Table 5. After 3 months of medical and surgical handling, the incidence of abnormal Digitized Brain Mappings in a voluntary group (n = 29 patients) showed decreased to
26.5% of abnormal DBM.
Second Brain Mapping n = 29 Frequency Percent Valid Percent Cumulative Percent
normal 11 16.2 37.9 37.9 abnormal 18 26.5% 62.1 100.0 Subtotal 29 42.6 100.0 Missing System 39 57.4 Total 68 100.0 In other preliminary study the rates among the various kinds of congenital strabismus
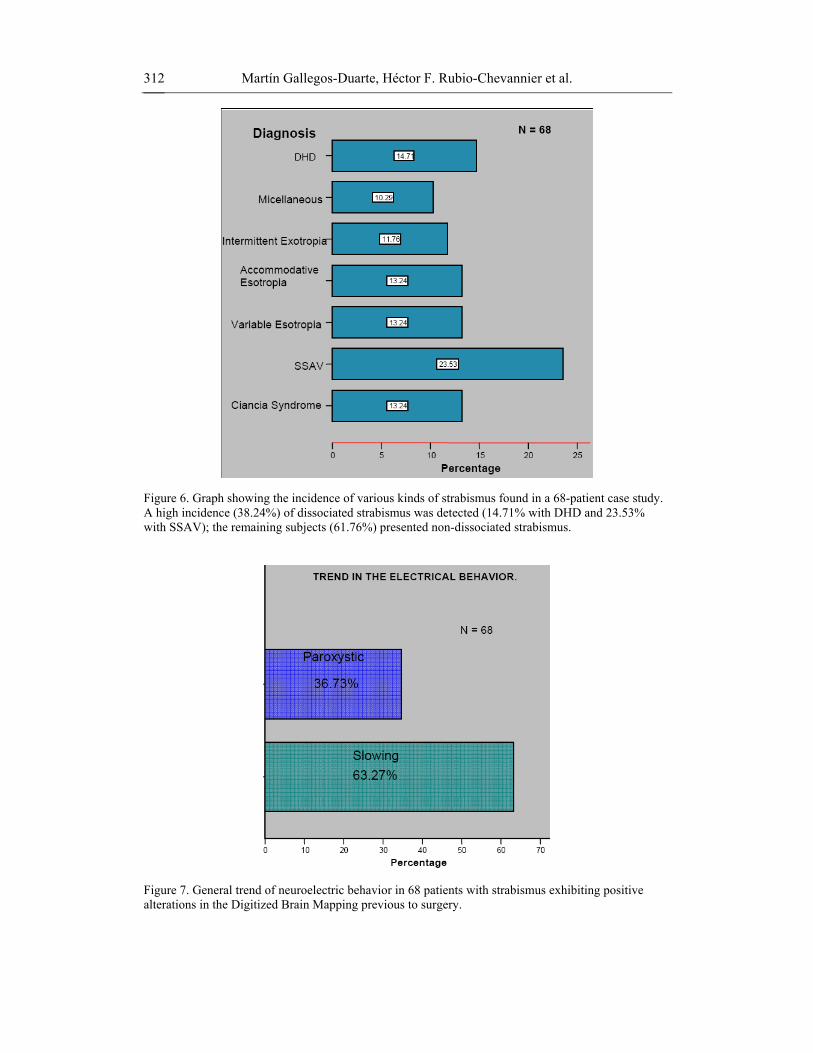
were analyzed, as well as the rates of neuroelectric alterations in DBM. A high incidence (38.24%) of dissociated strabismus (DHD, SSAV, variable esotropia) was found [Figure 6]; the more frequent neuroelectric alterations were hyperactivity and slowing-down of the activity [Figure 7].
Martín Gallegos-Duarte, Héctor F. Rubio-Chevannier et al. 312
Figure 6. Graph showing the incidence of various kinds of strabismus found in a 68-patient case study. A high incidence (38.24%) of dissociated strabismus was detected (14.71% with DHD and 23.53% with SSAV); the remaining subjects (61.76%) presented non-dissociated strabismus.
Figure 7. General trend of neuroelectric behavior in 68 patients with strabismus exhibiting positive alterations in the Digitized Brain Mapping previous to surgery.

Brain Mapping Alterations in Strabismus 313
In 49 patients (54.4%) of this preliminary series some alterations (slowing-down of the activity and paroxystic activity) were identified in the different areas of the cerebral cortex, though the majority of these alterations were predominant in occipital and frontal areas. [Table 6].
Table 6. In 49 out of 68 Digitized Brain Mappings it was possible to identify the
predominant location of electrical disturbances. The majority of alterations consisted of slowing of the activity in occipital and anterior regions of the brain.
Predominant location of the electrical alterations N = 49
Anterior Temporal Parietal Occipital Central Mixto Hemispheric Slowing 4 2 1 9 2 9 4 Paroxystic 4 2 1 4 2 3 2 Total 8 4 2 13 4 12 6
Based on these findings, we decided to analyze 195 cases to determine whether
alterations found in DBM rendered a significant difference between dissociated and non-dissociated strabismus. From the sample, 111 (56.92%) were females and 84 (43.08%) males, ages ranging from 1 to 12 years old. [Figure 8]
Male FemaleSex
0
10
20
30
40
50
60
Perc
ent
43.08
56.92
Figure 8. Digitized Brain Mapping analysis of 195 clinical cases; 111 (56.92%) were females and 84 (43.08%) males.
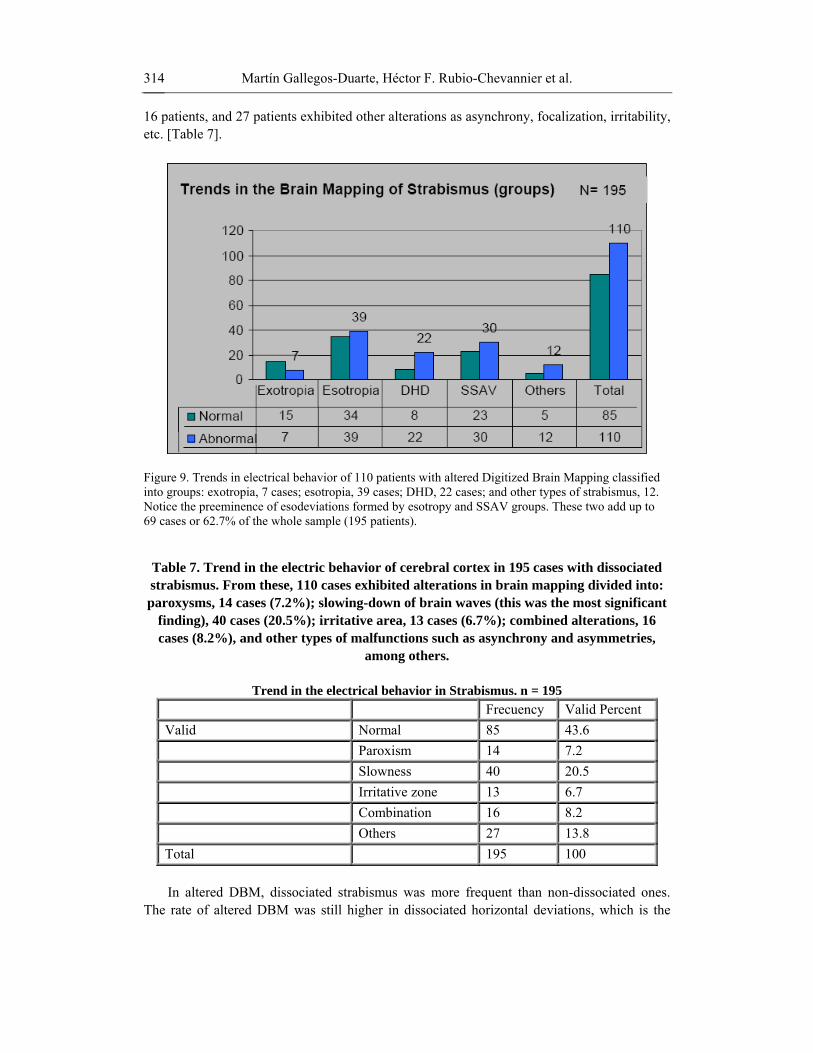
The majority of strabismic patients present neuroelectric alterations. From 195 patients, only 85 exhibited normal brain behavior, whereas 110 (56.4%) exhibited anomalies [Figure 9] Fourteen cases presented paroxysms, in 13 patients irritable zones were identified, slow waves were patent in 40 cases, a combination of slow waves and paroxysms was observed in
Martín Gallegos-Duarte, Héctor F. Rubio-Chevannier et al. 314
16 patients, and 27 patients exhibited other alterations as asynchrony, focalization, irritability, etc. [Table 7].
Figure 9. Trends in electrical behavior of 110 patients with altered Digitized Brain Mapping classified into groups: exotropia, 7 cases; esotropia, 39 cases; DHD, 22 cases; and other types of strabismus, 12. Notice the preeminence of esodeviations formed by esotropy and SSAV groups. These two add up to 69 cases or 62.7% of the whole sample (195 patients).
Table 7. Trend in the electric behavior of cerebral cortex in 195 cases with dissociated strabismus. From these, 110 cases exhibited alterations in brain mapping divided into: paroxysms, 14 cases (7.2%); slowing-down of brain waves (this was the most significant
finding), 40 cases (20.5%); irritative area, 13 cases (6.7%); combined alterations, 16 cases (8.2%), and other types of malfunctions such as asynchrony and asymmetries,
among others.
Trend in the electrical behavior in Strabismus. n = 195 Frecuency Valid Percent Valid Normal 85 43.6 Paroxism 14 7.2 Slowness 40 20.5 Irritative zone 13 6.7 Combination 16 8.2 Others 27 13.8 Total 195 100 In altered DBM, dissociated strabismus was more frequent than non-dissociated ones.
The rate of altered DBM was still higher in dissociated horizontal deviations, which is the

Brain Mapping Alterations in Strabismus 315
variety with more neuroelectrics alterations followed by the SSAV group. In conclusion this study shows that some neuroelectrics alterations in the cerebral cortex are related to strabismus, especially dissociated strabismus [Table 7].
A clear systematization of strabismus can be established by studying the clinical behavior of congenital strabismus. However, neuroelectrics findings in DBM do not reveal a characteristic pattern for identifying each type of this condition. In addition, a clear cause/effect correlation has not been established. Certainly, strabismus in most cases leaves its mark in the electroencephalographic recording, though it is not always revealed in the first attempt, given the existence of “false negatives”.
The former could be due to the multifactor origin of the disease [3,4,5,10,11] or to the ontogenic nature of the brain [52]. There are always irregularities in the neuroelectric oscillations, a changing background that can be modified by internal and external factors [50,53]. But this situation must not hinder the research of strabismus using DBM.
The finding of electric alterations in DBM not only has drawn some light into the origin of congenital strabismus and the participation of the cerebral cortex, but also this knowledge can guide us to find the best therapeutic alternatives for these patients. For example, in the case of dissociated cases with altered DBM, it is necessary to give the patient additional visual therapy, together with a visual perceptual assessment and, if necessary, refer them to visual therapy, language therapy, child psychology or neurology, as the case requires.
Though we can not assume a pathognomonic electric behavior in strabismus, we can correlate with caution every neurofunctional alteration with the clinical implications of the disease. For example, when strabismus is accompanied of dissociated movements, suppression, latent nystagmus and amblyopia, then cortical alterations are more evident [5,8,21]. The proportion of neuroelectric alterations that each of these eventualities contributes in itself is not known, because they are intricately intermingled. A correlation of these clinical signs is shown in Table 1. Besides, it is known that these signs underlie dissociated strabismus, and this condition in turn presents more than 70% of the alterations found in DBM.
The use of digitized brain mapping (DBM) as the chosen instrument to measure neurofunction in strabismus does not demerit the benefit that other methods with higher spatial resolution can offer and that may complement or be combined with the first technique, as the case requires, in a specific research problem within this field. In this sense, we have employed diverse complementary neuroimaging methods in vivo such as DBM, conventional EEG, neurometry, SPECT, 1H-NMRS, EOG, MRI, and granulometry. These techniques enable the analysis of brain electric behavior, energetic metabolism, biochemical composition, or morphometry. The information drawn from these approaches has provided insights into brain structure and function of children with strabismus.
The use of one or more of these tools has provided information on the cause-effect relationship [21,30], structural maturity concept [37], evinced neuro-adaptive changes [30,31,32] posterior to medical and surgical treatments, as well as shed some understanding into the origin of the disease [21].
The combination of DBM, SPECT and 1H-NMRS has rendered solid evidence supporting the correlation between dissociated movements and epileptogenic disease [21,30]. Indeed, it is possible that when intermittent and variable involuntary oculomotor movements appearing several times a week are accompanied by positive paraclinic studies such as altered DBM are,

Martín Gallegos-Duarte, Héctor F. Rubio-Chevannier et al. 316
in reality, and in agreement with the International League Against Epilepsy (ILAE) [54,55,56], a manifestation of epilepsy that has been evidently sub-diagnosed [21,30].
In other words, the presence of different irregularities of brain waves determined with EEG and DBM can be present in diverse neurological malfunctions such as it occurs in children with attention deficit disorder. In the specific case of children with dissociated strabismus, additional biochemical unbalances in cerebral cortex are detected with 1H-NMRS, as well as intermittent involuntary eye movements. By correlating these findings, there is evidence in dissociated CS not only for active neuronal distress, but also for the fact that these alterations in the cerebral cortex are more the cause than the effect of strabismus [21].
An example of the above is the marked presence of slow activity in brain electric activity. It is known that continuous slow activity may be associated with a diminution in cholinergic cortical afferences in anterior brain structures and that paroxysmal activity is linked to neurotransmission unbalances [50]. Both situations have been found in many of our patients [Figure 7 and Table 6], especially those with dissociated strabismus such as SSAV and DHD.
We analyzed 27 clinical files of patients with DHD to determine the ratio between “slowing-down” and activity enhancement (paroxysms and irritative discharges. Thirteen cases (48.1%) showed positive slowing-down, whereas 6 of the 27 patients exhibited irritative discharges and 10 paroxysms. [Table 8] Age range of these patients was from 2 to 14 years old; mean age= 6.7 years and mode = 6 years. We found that brain alterations were scattered in the following manner: 25.9% temporal, 25.9% frontal, 22.2% occipital and 22% parietal as such or in combination with other regions.
These findings bring to our minds those obtained with DBM approach in children suffering from attention deficit disorder (ADD). Similar to them, some patients with dissociated strabismus present a profile known as “maturity delay”, that is, enhancement of slow activity and deficit in fast activity.
Other point in common with ADD children is a higher epileptiform activity with respect to normal population of this age, as well as a decrease in inter-hemispheric coherence and an increase in the power of theta activity; this is interpreted by some authors as signs of immaturity and by others as developmental deviation [57].
Coherence alterations have been identified with the genesis of epilepsy; coherence studies are used to assess interconnections among different brain regions. [39, 57] In this sense, we have found that some cases of congenital strabismus, hipo-coherence of the wave delta in T5-T6. [Figure 10 and Table 10].
Table 8. Brain electric activity in 27 patients with DHD. The main finding is that
48.1% showed slowing-down of brain waves.
Trends in the electrical behavior in Dissociated Horizontal Deviation (DHD) n = 27 Irritative discharge Paroxistic Activity Lentification Count Count Count Indeterminate 21 17 14 Positive 6 10 13

Brain Mapping Alterations in Strabismus 317
Epilepsy is more evident than strabismus in the neuroelectric recording. This is explained by the fact that paroxysms and power changes are readily identified by the visual inspection of the electroencephalographic recording [54,55,56].
The electric behavior of the cerebral cortex comprised in the EEG recording not only shows power alterations and evident signs of focalized malfunctions, but also relevant information can be gained by analyzing intra- and inter-hemispheric functional relations. For example, in the 70’s research on the behavior of the electric coherence of frequency bands was initiated [39]. Among the reported findings were the differences between young brains and old ones [55], and between healthy ones and those suffering from Alzheimer’s [58].
Schizophrenia, Alzheimer’s, and ADD were among the diseases studied with new recording methods such as QEEG [58, 59]. The initial aim of improving the recording techniques was made by Adrian and Matthews, who in 1934, replicate the studies carried out by Berger and state that even though the EEG technique can be employed as a biological marker, it is not possible with this sole methodology to understand the functioning of the central control regulating eye movements and their complex cerebral interconnections to comprehend strabismus [60].
8. NEUROMETRY The advent of digital systems to enable the conversion of an analog signal into a digital
one --with more accuracy and minimization of sign deformation as time goes on--, as well as the extraordinary development of computational technology --that allows the instantaneous numerical analysis of the signal (QEEG) using algorithms-- are two breakthroughs that in combination with statistical procedures –univariate and multivariate— have provided more precise and sensitive recordings. This reliable information has enabled further insight into various diseases, since it is now possible the detection of discreet changes with respect to normal “Z” values [Table 9].
Once the signal is improved, a computerized analysis of significant elements in the bioelectric activity --absolute and relative power, inter- and intra-hemispheric symmetries and coherences in different frequency ranges— is performed and compared with normal “Z” values to determine whether in congenital strabismus the identified changes occurring in the cerebral cortex are significant and thus might implicate the participation of the cerebral cortex in the physiopathogeny of this disease. In this sense, neurometry or the neurometric method is a highly valuable instrument [Table 9].
As digital computer technology developed in the 60’s and 70’s, it became feasible to assess and quantify with precision more parameters than was possible through human visual inspection of raw EEG waveforms. With these developments the field of quantitative computerized analysis (QEEG) came into existence. Bickford and his colleagues were among the earliest to introduced the compressed spectral array (Bickford, Fleming and Billinger, 1971) [61], which increased visualization. However, they did not provide a quantified evaluation regarding deviation from normal.
Duffy and his associates [62] were among the first to exact meaningful information the volumes of data generated by the quantitative EEG (QEEG) techniques, by breaking
Martín Gallegos-Duarte, Héctor F. Rubio-Chevannier et al. 318
continuous background activity into its spectral components, numerical values for the various components were thus obtained.
By referencing these values to normal ones, a probability of normalcy can be established. Once a scaled value is established for a spectral component at each electrode site, a method for interpolating these values spatially between these sites is used to display a digitized brain map (DBM). These values are assigned hues of gray or colors within a scale which reflect changes over the scalp to illustrate the EEG findings.
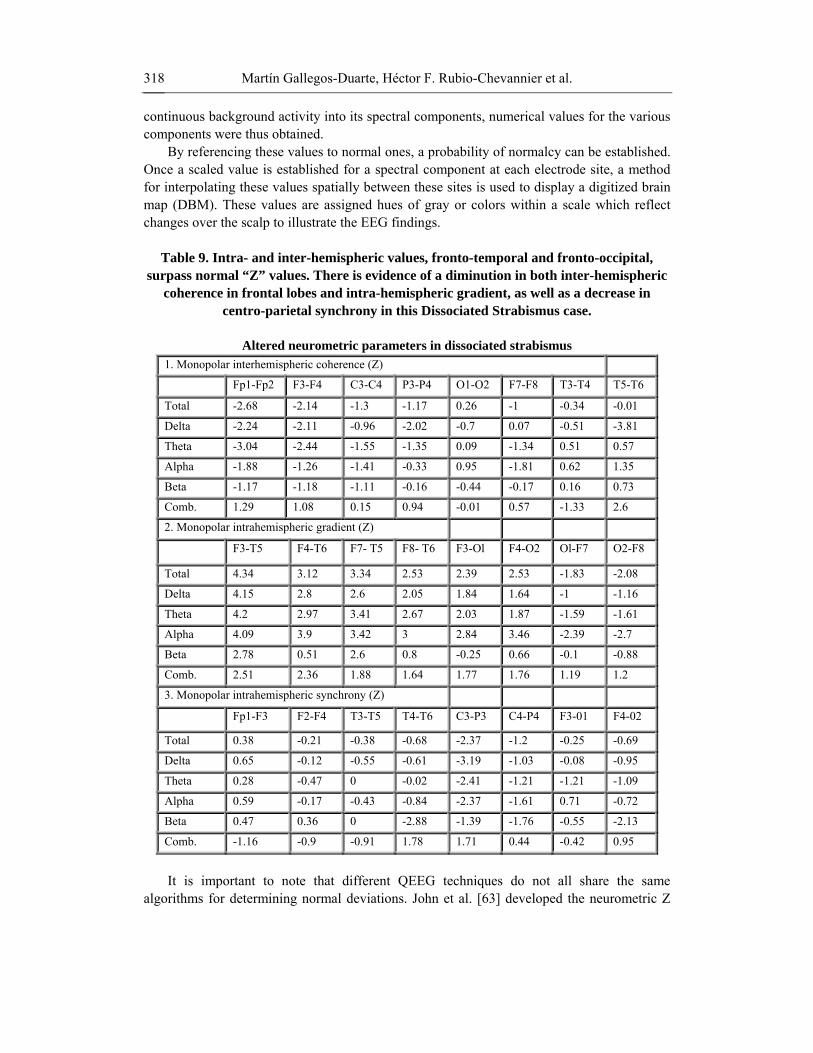
Table 9. Intra- and inter-hemispheric values, fronto-temporal and fronto-occipital,
surpass normal “Z” values. There is evidence of a diminution in both inter-hemispheric coherence in frontal lobes and intra-hemispheric gradient, as well as a decrease in
centro-parietal synchrony in this Dissociated Strabismus case.
Altered neurometric parameters in dissociated strabismus 1. Monopolar interhemispheric coherence (Z)
Fp1-Fp2 F3-F4 C3-C4 P3-P4 O1-O2 F7-F8 T3-T4 T5-T6
Total -2.68 -2.14 -1.3 -1.17 0.26 -1 -0.34 -0.01
Delta -2.24 -2.11 -0.96 -2.02 -0.7 0.07 -0.51 -3.81
Theta -3.04 -2.44 -1.55 -1.35 0.09 -1.34 0.51 0.57
Alpha -1.88 -1.26 -1.41 -0.33 0.95 -1.81 0.62 1.35
Beta -1.17 -1.18 -1.11 -0.16 -0.44 -0.17 0.16 0.73
Comb. 1.29 1.08 0.15 0.94 -0.01 0.57 -1.33 2.6
2. Monopolar intrahemispheric gradient (Z)
F3-T5 F4-T6 F7- T5 F8- T6 F3-Ol F4-O2 Ol-F7 O2-F8
Total 4.34 3.12 3.34 2.53 2.39 2.53 -1.83 -2.08
Delta 4.15 2.8 2.6 2.05 1.84 1.64 -1 -1.16
Theta 4.2 2.97 3.41 2.67 2.03 1.87 -1.59 -1.61
Alpha 4.09 3.9 3.42 3 2.84 3.46 -2.39 -2.7
Beta 2.78 0.51 2.6 0.8 -0.25 0.66 -0.1 -0.88
Comb. 2.51 2.36 1.88 1.64 1.77 1.76 1.19 1.2
3. Monopolar intrahemispheric synchrony (Z)
Fp1-F3 F2-F4 T3-T5 T4-T6 C3-P3 C4-P4 F3-01 F4-02
Total 0.38 -0.21 -0.38 -0.68 -2.37 -1.2 -0.25 -0.69
Delta 0.65 -0.12 -0.55 -0.61 -3.19 -1.03 -0.08 -0.95
Theta 0.28 -0.47 0 -0.02 -2.41 -1.21 -1.21 -1.09
Alpha 0.59 -0.17 -0.43 -0.84 -2.37 -1.61 0.71 -0.72
Beta 0.47 0.36 0 -2.88 -1.39 -1.76 -0.55 -2.13
Comb. -1.16 -0.9 -0.91 1.78 1.71 0.44 -0.42 0.95
It is important to note that different QEEG techniques do not all share the same
algorithms for determining normal deviations. John et al. [63] developed the neurometric Z

Brain Mapping Alterations in Strabismus 319
score maps using transformation functions such as the log transform. These authors adjusted values for the subtle effects of aging by fitting these values to age-dependent parameters, as well as mathematical correct regression equations to reflect the influence of the electrical activity in one area of the brain over another area. Neurometric values calculated with Mahalanobis distance multivariate equations can correct the deviation activity in one hemisphere from deviations in the other hemisphere. Similarly, activity in the anterior regions can be calculated from activity in the posterior regions [62].
These calculations are conducted for both monopolar and bipolar derivations. In addition, since age correction regression methods can be used, the ability to fit an individual’s data can be tested to fit the regression curves at earlier ages, thereby assessing maturational lag of cortical development. In 1998, the Neurometric Analysis System was released for used by qualified medical professionals to perform post-hoc statistical analysis of EEG recordings [61]. This technique was certified to be Year 2000 Compliant in accordance with the guidelines for use by the FDA. Moreover, the American Academy of Neurology approved the neurometric method as a research tool over other QEEG methods.
Prior to addressing the topic of neurometry it is important to remember that congenital strabismus is especially studied in children and that these patients exhibit some normal variations in brain electric behavior. It must also be considered that strabismus entails very subtle changes. Its specificity increases after the age of 6 given that the results can be compared with normal populations (normal “Z” values). Neuroelectric integration in 6-year olds is still unstable and has a larger variability range than in adults. These changes, together with the scarcity of parameters in healthy children to establish normal values, hinder the possibility of elaborating fine neurometric analyses in children younger than this age. For this reason, our neurometric analyses always refer to children older than 6 years [60, 63].
Normal values in our neurometric study have been validated in the asymptomatic population starting from 6 years of age. In the meantime, spectrographic analyses and their interpolation to brain mapping can be performed by means of various programs such as Persyst version 4.0. To carry out this type of studies, the American Clinical Neurophysiology Society (ACNS) has issued guidelines that recommend a minimum of 2-min conventional EEG recordings of representative epochs, free or artifacts, to produce a validated and certified neurophysiological interpretation.
Neurometry or neurometric analysis is derived from quantitative electroencephalogram (QEEG) studies. Since its certification in 2000 by the FDA, its acceptance has been progressive. The major benefit of using computerized discriminatory mathematical equations means that obtained values can almost be simultaneously compared with normal “Z” values obtained from the healthy population of the same age [Figures 10, 11, 12, Photos 18, 19].
The neurometric analysis is, given its nature, eminently objective and descriptive. These properties allow the assessment of the topographic behavior without compromising the high temporal resolution of the EGG technique.
Neurometry allows the correlation of the various EEG components and the delineation of its different characteristics along the various frequency ranges for each derivation. As a result very accurate information coming from multiple brain regions can be simultaneously obtained through the spectral analysis; thus our knowledge between structure and function is widened. A close relationship between electric activity and structure is established, as forming a unit. For example, coherence is thought to be mediated by the association of long and short cortico-cortical fibers, as well as by the association of cortico-subcortical fibers [58]. Thus, by
Martín Gallegos-Duarte, Héctor F. Rubio-Chevannier et al. 320
coherence studies it is possible to classify different types of pathologies, such as in brain dementias, and differentiate them from healthy subjects, given that dementia patients present, among other deficiencies, a difficulty for processing and associating information [58, 64].
The incorporation of discriminatory mathematical analysis enables the acquisition of accurate information regarding various QEEG parameters and compares them with data bases to quantify deviations from normal values.
Neurometry is not useful for identifying pathologies; rather it allows the perception of subtle changes that together with EEG data enable the statistical possibility of determining whether a certain value is out of the range of normal values and how this value is related to the rest of the electric activity in the brain at a certain moment [50].
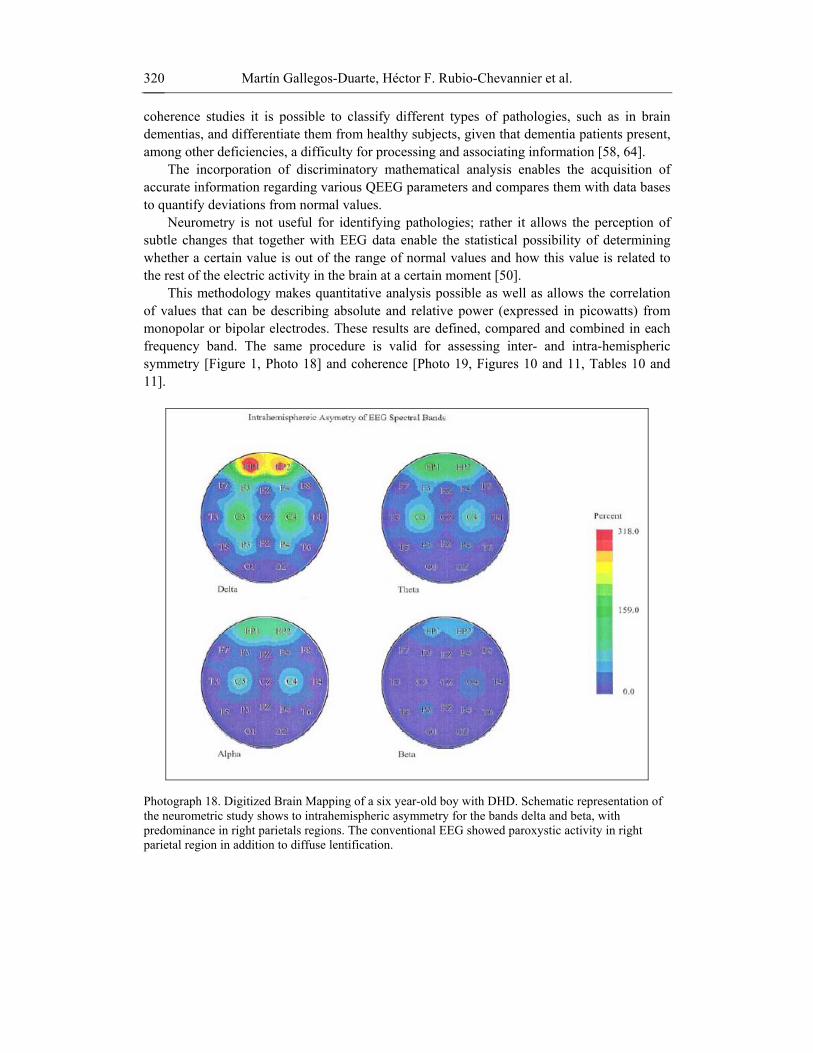
This methodology makes quantitative analysis possible as well as allows the correlation of values that can be describing absolute and relative power (expressed in picowatts) from monopolar or bipolar electrodes. These results are defined, compared and combined in each frequency band. The same procedure is valid for assessing inter- and intra-hemispheric symmetry [Figure 1, Photo 18] and coherence [Photo 19, Figures 10 and 11, Tables 10 and 11].
Photograph 18. Digitized Brain Mapping of a six year-old boy with DHD. Schematic representation of the neurometric study shows to intrahemispheric asymmetry for the bands delta and beta, with predominance in right parietals regions. The conventional EEG showed paroxystic activity in right parietal region in addition to diffuse lentification.

Brain Mapping Alterations in Strabismus 321
Photograph 19. Schematic representation showing coherence of EEG spectral bands. Color scale on the right side of the image marks the level of inter-hemispheric coherence (in percentage) from low (blue color) to high (red color) values. A diminution in coherence can be appreciated in temporal and parieto-occipital regions in a 6 year-old female patient with SSAV.
Figure 10. Distribution of inter-hemispheric coherence in a 6 year-old boy with SSAV. A decrease in delta waves (pink line) with value = -3.94 and an increment in alpha waves (green line) with value = 2.23 are present in left and right temporal regions.

Martín Gallegos-Duarte, Héctor F. Rubio-Chevannier et al. 322
Table 10. The Table 10 shows the numerical values of figure 10. Observe the great hipocoherence that is in the wave delta at level T5 and T6 (emphasized in yellow color).
Alterations in the coherence of the wave delta at temporal level are as a relatively frequent finding in cases of congenital strabismus. These alterations suggest it
extraestriated cortex participates in the origin of the congenital strabismus.
Monopolar interhemispheric coherence in a case of SSAV Fpl-Fp2 F3-F4 C3-C4 P3-P4 O1-O2 F7-F8 T3-T4 T5- T6 Total -1.22 -0.58 0.37 0.38 0.44 -0.5 2.14 -0.59 Delta -1.28 -0.64 0.4 0.27 -0.5 -1.34 -0.72 -3.94 Theta -1.7 -0.3 0.94 1.1 -0.52 -1.74 0.8 0.27 Alpha 0.13 -0.32 0.72 0.73 0.99 0.55 2.23 0.2 Beta -2.06 -0.41 0.19 0.47 -0.03 -2.11 1.54 0.39
Comb. 1.27 -1.78 -0.53 -0.39 -0.38 1.6 0.98 2.53
Figure 11. Neurometry study in a 6-year old boy with DHD. Alterations in coherence are evident especially occipital hypercoherence in theta and beta bands, as well as marked hypocoherence in the alpha rhythm in frontal brain regions.
Neurometric analysis of dissociated strabismus has shown, among other things, a negative increment in the intra-hemispheric monopolar gradient in the hemisphere corresponding to the non-dominant eye. As an example a case of a 6 year-old boy with SSAV is presented; his dominant eye is the right one and the left is suppressed [Photo 10, Table 10].
Brain Mapping Alterations in Strabismus 323
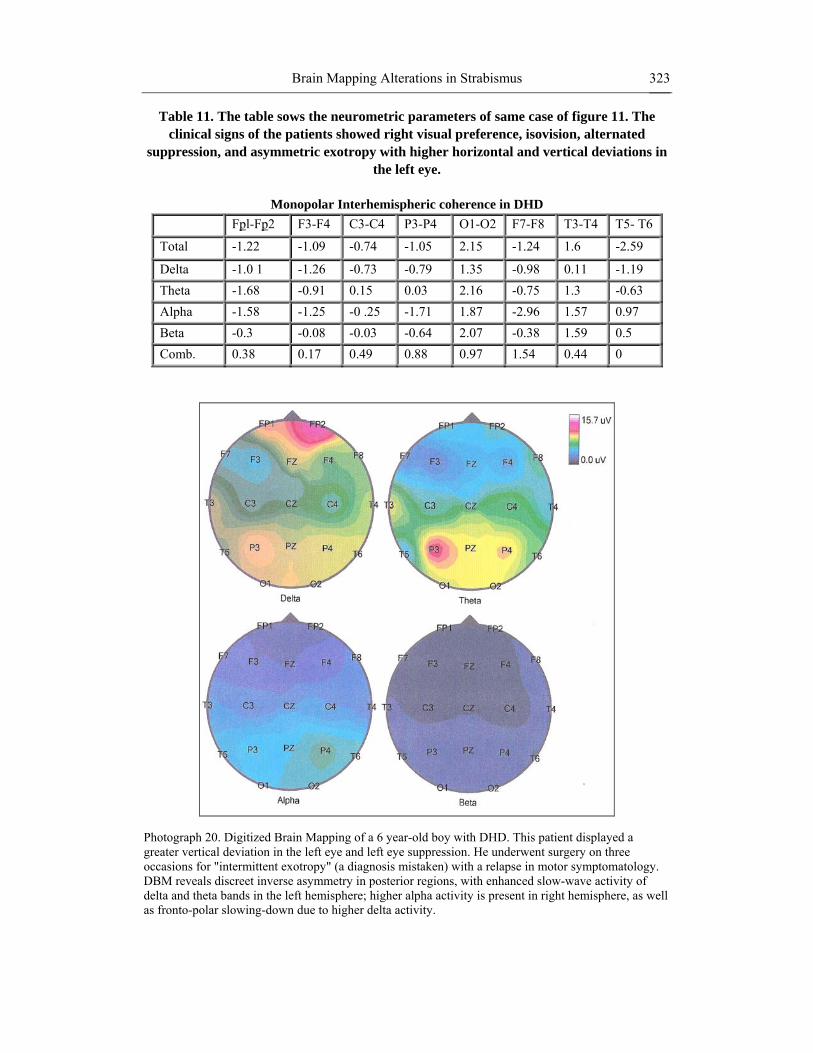
Table 11. The table sows the neurometric parameters of same case of figure 11. The clinical signs of the patients showed right visual preference, isovision, alternated
suppression, and asymmetric exotropy with higher horizontal and vertical deviations in the left eye.
Monopolar Interhemispheric coherence in DHD
Fpl-Fp2 F3-F4 C3-C4 P3-P4 O1-O2 F7-F8 T3-T4 T5- T6
Total -1.22 -1.09 -0.74 -1.05 2.15 -1.24 1.6 -2.59
Delta -1.0 1 -1.26 -0.73 -0.79 1.35 -0.98 0.11 -1.19 Theta -1.68 -0.91 0.15 0.03 2.16 -0.75 1.3 -0.63 Alpha -1.58 -1.25 -0 .25 -1.71 1.87 -2.96 1.57 0.97 Beta -0.3 -0.08 -0.03 -0.64 2.07 -0.38 1.59 0.5 Comb. 0.38 0.17 0.49 0.88 0.97 1.54 0.44 0
Photograph 20. Digitized Brain Mapping of a 6 year-old boy with DHD. This patient displayed a greater vertical deviation in the left eye and left eye suppression. He underwent surgery on three occasions for "intermittent exotropy" (a diagnosis mistaken) with a relapse in motor symptomatology. DBM reveals discreet inverse asymmetry in posterior regions, with enhanced slow-wave activity of delta and theta bands in the left hemisphere; higher alpha activity is present in right hemisphere, as well as fronto-polar slowing-down due to higher delta activity.
Martín Gallegos-Duarte, Héctor F. Rubio-Chevannier et al. 324
One year prior to surgery, the DBM showed generalized paroxysms of intermittent clustered spikes of slow waves during sleep phase II recordings. [Photo 16] One year after surgery the computerized traditional study showed no paroxysmal activity, though some variations were evident in inter-hemispheric synchrony in posterior parieto-temporal regions, as well as in occipital areas; data showed no persistent lateralization. In addition, changes in inter-hemispheric coherence were detected in parieto-occipital regions.
As follows an example of a DHD case in which coherence alteration is manifest, but this time on anterior brain regions [Figure 11, Table 11, Photo 6]
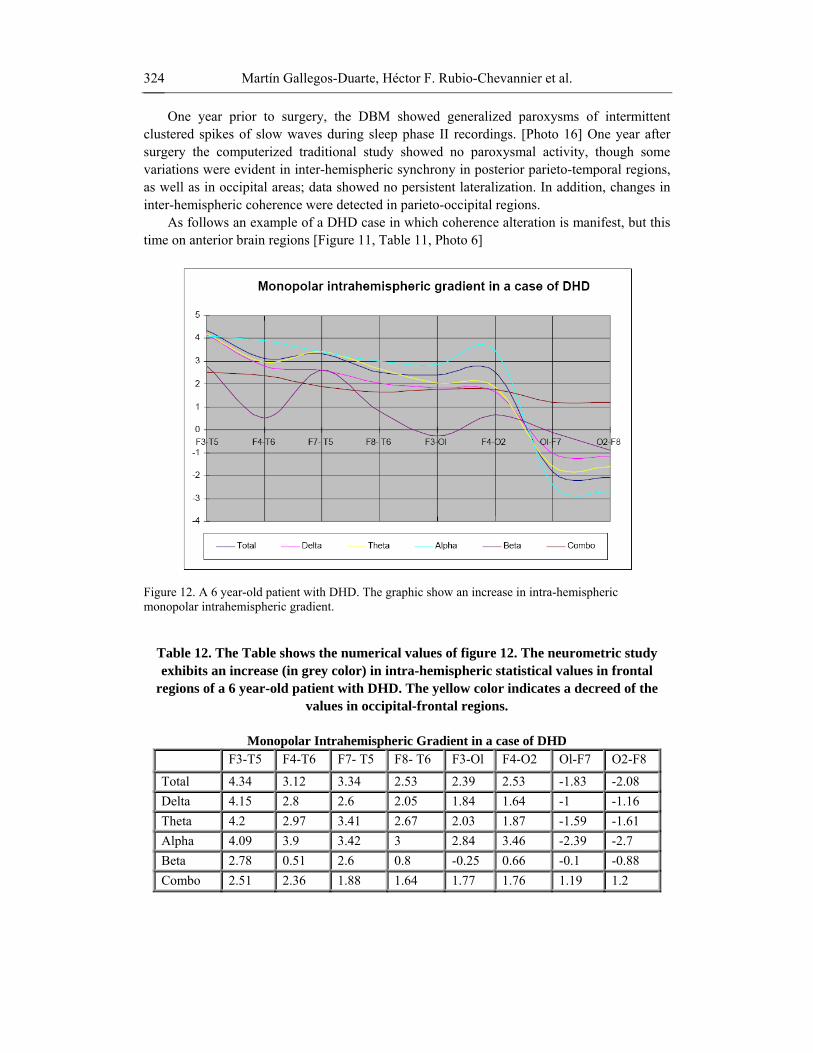
Figure 12. A 6 year-old patient with DHD. The graphic show an increase in intra-hemispheric monopolar intrahemispheric gradient.
Table 12. The Table shows the numerical values of figure 12. The neurometric study exhibits an increase (in grey color) in intra-hemispheric statistical values in frontal
regions of a 6 year-old patient with DHD. The yellow color indicates a decreed of the values in occipital-frontal regions.
Monopolar Intrahemispheric Gradient in a case of DHD
F3-T5 F4-T6 F7- T5 F8- T6 F3-Ol F4-O2 Ol-F7 O2-F8
Total 4.34 3.12 3.34 2.53 2.39 2.53 -1.83 -2.08 Delta 4.15 2.8 2.6 2.05 1.84 1.64 -1 -1.16 Theta 4.2 2.97 3.41 2.67 2.03 1.87 -1.59 -1.61 Alpha 4.09 3.9 3.42 3 2.84 3.46 -2.39 -2.7 Beta 2.78 0.51 2.6 0.8 -0.25 0.66 -0.1 -0.88 Combo 2.51 2.36 1.88 1.64 1.77 1.76 1.19 1.2

Brain Mapping Alterations in Strabismus 325
Most of patient with dissociated strabismus present cortical alterations. We have studied a group of 10 patients with DHD and have found a great amount of alterations in the DBM [Photo 10c and 20], the neurometry [Figure 11] the spectroscopy [Photo 11b ] and the granulometry [Photos 12c and 12d] in all of them.
From all image studies, neurofunctional ones are the most employed in the study of strabismus with regard to the cerebral cortex. However, in order to correlate structure with function, we have undertaken morphometric analyses in some patients, using magnetic resonance imaging to establish the absence of macro-structural alterations. However, when analyzing topographical sections obtained by resonance in a granulometry study, we found relevant differences between the brains of healthy children and those with dissociated strabismus.
9. GRANULOMETRY Since the discovery of X-rays by Roentgen in 1895, a great advancement has been made
to visualize the structures of the human body. Morphometric image studies, such as Computerized Axial Tomography scan or MRI, provide highly precise information of relatively large structures of the human body. However, given the complexity of the brain, there are structural aspects that are not liable to evaluation with conventional methods, for they can not be perceived at plain sight [64].
Granulometry is a concept used in image processing. This concept, originally introduced by Matheron [65-68] is useful and versatile for the morphological analysis of images. Its application includes a wide range of tasks, such as size estimation of the components in an image and image segmentation, just to mention a few.
Granulometry is the study of the distribution by sizes of the particles comprising an aggregate. This method is employed in diverse areas to describe the qualities of size and shape of the granules in a product. For example, in a soil study, granulometry provides information on whether the soil is sandy, clayey, etc.; when dealing with cement, granulometric studies may define its application and final performance.
Granulometric studies are based on a sieving process which is carried out with the help of a sieve, a measuring instrument that enables the classification of a material according to size. The main element in the sieve is the mesh. This technique entails the possibility of analyzing images in a numerical language, whereas MCD and neurometry provide objective neurofuctional information on the brain anatomical substrate. Both techniques are rather precise and a correlation is expected to give some insight into the origin of strabismus.
By using granulometry, a micro-structural study of the brain and cerebral cortex may be carried out in vivo using mathematical and granulometric analyses of Pixel (picture elements) and Voxel (volume elements) acquired from positive three dimensional magnetic resonance images (3-D RMI T1). By means of Voxel based analysis, Mendola [28] analyzed three major brain areas and found a diminution in total volume distribution of gray matter in visual cortex -–parieto-occipital and temporal-ventral regions—of patients with amblyopia. In other study, a redistribution of gray matter was reported by Suk-tak et al. [64], using Voxel morphometric analysis from MRI in adults with exotropia. These patients showed a redistribution of gray matter on the brain surface attributed to neuroadaptive changes [29].
Martín Gallegos-Duarte, Héctor F. Rubio-Chevannier et al. 326
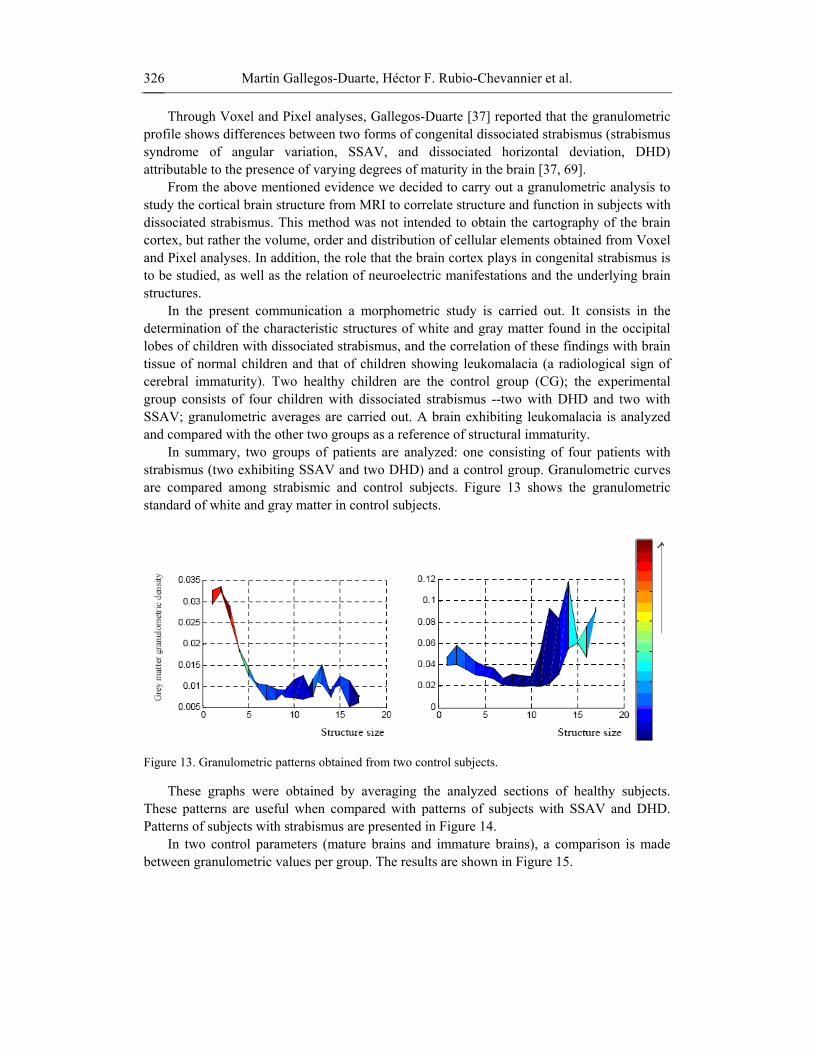
Through Voxel and Pixel analyses, Gallegos-Duarte [37] reported that the granulometric profile shows differences between two forms of congenital dissociated strabismus (strabismus syndrome of angular variation, SSAV, and dissociated horizontal deviation, DHD) attributable to the presence of varying degrees of maturity in the brain [37, 69].
From the above mentioned evidence we decided to carry out a granulometric analysis to study the cortical brain structure from MRI to correlate structure and function in subjects with dissociated strabismus. This method was not intended to obtain the cartography of the brain cortex, but rather the volume, order and distribution of cellular elements obtained from Voxel and Pixel analyses. In addition, the role that the brain cortex plays in congenital strabismus is to be studied, as well as the relation of neuroelectric manifestations and the underlying brain structures.
In the present communication a morphometric study is carried out. It consists in the determination of the characteristic structures of white and gray matter found in the occipital lobes of children with dissociated strabismus, and the correlation of these findings with brain tissue of normal children and that of children showing leukomalacia (a radiological sign of cerebral immaturity). Two healthy children are the control group (CG); the experimental group consists of four children with dissociated strabismus --two with DHD and two with SSAV; granulometric averages are carried out. A brain exhibiting leukomalacia is analyzed and compared with the other two groups as a reference of structural immaturity.
In summary, two groups of patients are analyzed: one consisting of four patients with strabismus (two exhibiting SSAV and two DHD) and a control group. Granulometric curves are compared among strabismic and control subjects. Figure 13 shows the granulometric standard of white and gray matter in control subjects.
Figure 13. Granulometric patterns obtained from two control subjects.
These graphs were obtained by averaging the analyzed sections of healthy subjects. These patterns are useful when compared with patterns of subjects with SSAV and DHD. Patterns of subjects with strabismus are presented in Figure 14.
In two control parameters (mature brains and immature brains), a comparison is made between granulometric values per group. The results are shown in Figure 15.

Brain Mapping Alterations in Strabismus 327
Figure 14. Granulometric patterns from four subjects with strabismus.

Martín Gallegos-Duarte, Héctor F. Rubio-Chevannier et al. 328
Figure 15. The control group (CG) shows a larger differential in the white matter (white columns) to gray matter (gray columns) ratio; the opposite occurs with the immature brain. Strabismus cases occupy an intermediate situation, in which the difference between these brain regions is smaller than in CG. Ratios of white to gray matter are the following: CG, 1.74; DHD (1) 2.15, DHD (2) 1.6, SSAV (1) 1.31, SSAV (2) 1.21, Leukomalacia 1.29.
In particular, three main groups of clear and dark structures are considered. These groups take into account the size of a square window, whose origin is in its center. The size of the window µ is computed as [2 µ+1] [2 µ+1], that is, the size µ=1 means a window [2(1)+1] [2(1)+1]=9 pixels, whereas µ=4, for example, means a square with [2(4)+1] [2(4)+1] =81 pixels. The groups are the following:
Group 1. All the small structures within the sizes 3 to 5 are comprised. Notice that structures with sizes 1 to 2 are not considered, since noisy components are
detected at these small sizes of the structuring element. Group 2. This group contains medium-sized structures located in the interval 6 to 9. Group 3. Finally, this group comprises large-sized structures, in the interval 10 to 15. In our case, MRI sections of occipital lobes of controls and patients with SSAV, DHD,
and leukomalacia are analyzed [Figure 15]. The granulometric analysis consists in sieving the brain image prior to the calculation of a graph similar to that of granulometric density. This process is illustrated in Figure 16.
Figure 16. Image illustrating the sieving process.

Brain Mapping Alterations in Strabismus 329
The granulometric profile of the four analyzed groups showed important differences. Specifically, differences in this profile were encountered between SSAV and DHD groups [Figure 15]. [69] This study allowed the correlation between structure and function in some cases of dissociated strabismus. In the occipital lobes, changes in granulometric density of brain cortex were found. These changes could be differentiated and compared to determine the maturity of certain structures. This in turn could be related to the presence of slow waves in MCD of dissociated strabismus.
Our results suggest that dissociated strabismus shows immaturity signs in neuronal granulometry: the immaturity level is more evident in children with DHD rather than in those with SSAV.
The classification of strabismus is currently controversial. Therefore, our interest is to determine, based upon physiopathogeny, whether clinical manifestations correspond to different conditions, or whether they are different expressions of the same disease with a common origin.
These structural differences [Photos 12a,12b, 12c and 12d] might be related to neuroelectrical behavior, for example. Patterns in neuronal distribution are capable of modifying the electric signal in EEG; in consequence, they are potentially quantifiable. This circumstance has been presumed in attention deficit subjects. In this respect, prevalence of atopic cellular groups is present in patients with Zinder dyslexia.
Although the size of the sample was not enough to establish a correlation between electroencephalographic findings and structure, our findings open a field in which the correlation of these parameters can be made with great accuracy.
Granulometric studies provided information concerning structural volumetric quantities detected in white and gray matter. In both cases, DHA and SSAV, changes were evident in white and gray matter when compared to volumetric quantities detected in control subjects. Furthermore, strabismic subjects with DHD exhibited less variation in GM than strabismic subjects with SSAV. With respect to WM, changes were encountered in large structures for both DHD and SSAV subjects, when compared to controls. These findings indicate that dissociated strabismus, specifically DHD and SSAV, may be originated mainly by alterations in gray matter and in large components of white matter.
10. METHODOLOGY
a) Clinical Study All patients had their strabological clinical record made; this included: cycloplegic
refraction with cyclopentolate, motoricity (ductions and versions, horizontal version trajectories, pursuit movements, monitored with night shoot video-recording in ectopic and mesopic conditions), sensory perception (visual acuteness, stereopsis tests, suppression diagnosis and amblyopia).
Martín Gallegos-Duarte, Héctor F. Rubio-Chevannier et al. 330
b) Electrooculography Ocular movements during the EOG recording were obtained with night shoot video-
recording. The patient was seated facing forward. Subsequently, a stimulus to assess slow movements followed a horizontal trajectory at 10º/s. To check saccadic movements, patient was asked to look at a dim light located to his right or left, and he was indicated in which direction he had to look at. Studies were carried out in a room with neutral background, free of noises and distractions. The same parameters were used each time and were taken by the same health professional as required by the International Convention of Geneva to perform anthropometric measures in living subjects.
For the simultaneous EOG and EEG recordings an additional nasal electrode was employed.
c) Perceptual Test A computerized perceptual screening was performed in an awake and cooperative patient,
with optical correction, in a neutral environment free of external stimuli. A high resolution flat LCD monitor was ergonomically placed at a 60-cm distance from the patient at eye level to determine the perception of speed, space, shapes, sizes and primordial elements. Visual memory was evaluated, as well as reading and writing speed, slow pursuit and saccadic movements, peripheral vision, visual preference and manual preference. These assessments were all performed by the same personnel und following the same exploratory routine.
d) Brain Mapping A DBM was performed to all patients using the 10-20 International System with 21
channels and a 32-channel recording option with established parameters for each epoch, in printed form as well as pulse monitored. The cortical response to various stimuli was recorded and evaluated, using digital electroencephalography. Stimuli were light, hyperventilation, opening and closing of eyelids, sleep, and wakefulness. Simultaneous electrooculography (EOG) using specific electrodes and channels were employed to assess horizontal version movements both slow and saccadic.
e) Neurometry Is a method of quantitative electroencephalographic analysis (QEEG) that uses objective
computer algorithms to extract a large number of quantitative from an EEG recording for comparison against a reference database. Each extracted feature is subjected to a statistical evaluation, and compared to the distribution of values of same features observed in a normative reference ("Z") database using multivariate statistical procedures

Brain Mapping Alterations in Strabismus 331
f) Magnetic Resonance Analysis of brain sections, 1 mm thick, was made using 3–D RMI T1 approach, without
contrast and medication free. Multiplanar brain images were acquired in simple phase, spine eco routine power sequences employing the FLAIR technique.
g) Spectroscopy (1H-NMRS) Proton nuclear magnetic resonance spectroscopy, 1H-NMRS, was performed in both
occipital lobes. A piece, 8 cm3, of brain cortex from each occipital lobe was selected and analyzed. The equipment and protocol were the following: Intera Pilips 1.0T, version 10.6, Fast Fell Echo sequence (FFE), T1 weighted in 3-D, field of vision (FOV) 230 mm, RFOV 80%, slice thickness 1 mm, without space between slices, eco time (ET) 6.9 ms, repetition time (RT) 25 ms, deviation angle (DA) 30 degrees, number of excitations (NAS) 1, number of slices 120.
h) Brain SPECT Brain SPECT was carried out using scintillography and analyzed every 45 minutes after
the intravenous administration of tecnecium 99 ethyl-cysteinate dimer to enable the spectrometric observation in the red-violet scale.
CONCLUSIONS The human brain cortex is unique. It consists of an ontogenic design with a wide
integration network at all levels. The visual system consumes a large part of these neurointegrative resources, so a motor sensory dysfunction such as strabismus not only leaves a frequent mark in DBM, but also the neurological findings available with neuroimaging techniques suggest cerebral cortex participation as the origin of dissociated movements underlying congenital strabismus.
It is difficult to establish whether strabismus is the cause of DBM alterations or, conversely, brain alterations in the cerebral cortex originate ocular deviations. There is evidence showing that observed neuroelectric alterations in extra-striate cortex could be directly related to the presence of dissociated movements.
It remains to be elucidated whether motor alterations or, more accurately, sensory alterations are the cause of the changes in the inter- and intra-hemispheric coherences encountered in neurometric reports.
One of the clinical characteristics of dissociated strabismus is the sensory-motor asymmetry. In addition to this finding, in this study, we have encountered alterations in coherence, frequency and power asymmetries possibly related to alterations in long-axon neurons of inter-hemispheric interconnection.
Martín Gallegos-Duarte, Héctor F. Rubio-Chevannier et al. 332
When going from a major degree of ontogenic complexity to a minor one in a descending direction --from cortex to nuclei, from nuclei to effector organ-- it can be appreciated that the cerebral cortex plays a preponderant role that must not be ignored.
Likewise, we can not disregard the evidence that the human being is especially prone to suffer from strabismus, an extremely rare disease in other species. Given that the human cerebral cortex is distinctively complex with respect to other species, we believe that in this structure lies the answer to some of our questions with regards to the cause of congenital strabismus and its origin.
Evidence from current studies suggests that some cortical alterations related to dissociated congenital strabismus may induce motor dysfunctions as it occurs in epilepsy. In fact, there is no evidence pointing to motor alterations as the cause of paroxysms, slowing down of brain activity, cortical hyperexcitability, nor something indicating a possibility in the inverse direction; hence, our interest in trying to understand the participation of electric disturbances in association with the manifestations in the oculomotor system.
The mechanisms underlying cortical disturbances in extra-striate areas apparently distant form each other may induce changes in ocular motility; though these mechanisms have not yet been elucidated. The presence of paroxysms possibly generates symptomatogenic zones capable of modifying the supranuclear control, as well as inhibiting Hering’s law. Once the latter happens, movements may become incoherent.
Invariably, the eye pertaining to the hemisphere where the main cortical alterations are present corresponds to the eye presenting higher variability with regard to movement, suppression, amblyopia, dissociated deviation, and a more evident latent nystagmus. In summary, the eye with more sensory and motor alterations corresponds in general to the hemisphere exhibiting major alterations.
We are aware that one study is not enough to establish accurately a cause-effect relationship between the activity of the cerebral cortex and strabismus, but by correlating various studies in this field we have been able to infer a physiopathologic basis for the origin of some alterations underlying congenital strabismus.
In gaining a better understanding into the origin of congenital strabismus and into the neurological differences among the various types of this disease, better medical and surgical treatments will be available. Moreover, the opportunity of having a multi-disciplinary handling of the strabismic patient –neurodiagnostics, neurology, therapy and psychology, among others-- will be possible.
Some of the bad outcomes frequently found after the surgical handling of strabismus can be associated with a bad pre-operative diagnosis [70], for example, to underestimate the cortical participation in the sensory and motor behaviors in this disease.
It is currently within our reach in reference to dissociated strabismus the possibility of more precise surgeries, the emphasis on visual pre-and post-operative rehabilitation, as well as a better counseling to the family with regard to the neurological implications. In summary, a better knowledge on the origin of the problem and its implications enables a better treatment for the patient.

Brain Mapping Alterations in Strabismus 333
ACKNOWLEDGMENTS The authors wish to thank to the foundation Mario Moreno Reyes for the financial
support and M. Sanchez Alvarez for proof-reading this manuscript.
BIBLIOGRAPHY
[1] Ciancia, AO.; La esotropia del lactante, En: Actualidades del estrabismo latinoamericano, Consejo Latinoamericano de estrabismo. Centro mexicano de estrabismo, México, D.F. 1998, 47-52.
[2] Ciancia, AO.; On Infantile Esotropia with Nystagmus in Abduction. J. Pediatr. Ophthalmol. Strabismus 32: 280-288. 1995.
[3] Hoyt CS, Good WV.: Infantile strabismus: What is it? Where is it? Br. J. Ophthalmol. 1994; 78:325-6.
[4] Gallegos-Duarte, M.; Estigma y origen de la endotropia congénita. Rev. Mex. Oftalmol. 79 (1): 10-16. 2005
[5] Helveston EM. The origins of congenital esotropia. J. Pediatr. Ophthalmol. Strabismus 1993; 30: 215-232.
[6] Romero-Apis, D. Castellanos-Bracamontes, A. Acosta-Silva, M.: Estrabismos disociados, En: Temas selectos de estrabismo segunda Edición. Centro Mexicano de Estrabismo 2005: 49-59 México, D.F.
[7] Shokida F.: “Desviación Horizontal Disociada: Diagnóstico y tratamiento” En: Curso Básico. Acta Estrabológica. 2001; en línea: http://www.oftalmo.com/estrabologia/rev-01/01-13.htm.
[8] Gallegos, M; Moguel, S.; Rubin de Celis, B.; Alteraciones en el mapeo cerebral en la endotropia congénita variable. Rev. Mex. Oftalmol; 2004; 78 (3): 122-126.
[9] Gallegos-Duarte, M.: Respuesta cortical paradójica durante la fotoestimulación intermitente. Cir. y Cir. 2005; 73 (3): 161-165.
[10] Gallegos-Duarte M: Maniobras exploratorias en la endotropia congénita En: Temas Selectos de Estrabismo. Centro Mexicano de Estrabismo SC. México, Composición Editorial Láser. México, D.F. 2005, 1-18.
[11] Sarubbi M.C., Letiz, M.A. Infantil esotropia: an inevitable legacy? Am. Orthopt. J. (55): 112-121. 2005.
[12] Maumenee IH, Alston A, Mets MB, Flynn JT, Mitchell TN, Beaty TH: Inheritance of congenital esotropia. Trans Am. Ophthalmol. Soc. (84): 85-93. 1986.
[13] Philippa M Pennefather Ph M, Clarke MP, Strong NP, David G Cottrell DG, Dutton J, Tin W Risk factors for strabismus in children born before 32 weeks gestation. Br. J. Ophthalmol. 83: 514-518. 1999.
[14] Stanley, F.J. survival and Cerebral Palsy in low birthweight infants: Implications for perinatal care. Pediatric Perinatal Epidemiology 1992, 6, 298-310.
[15] Tersidou V, Bennett P; Maternal risk factors for fetal and neonatal brain damage. Biol. Neonate 2001;79(3-4):157-62.

Martín Gallegos-Duarte, Héctor F. Rubio-Chevannier et al. 334
[16] Pulido-Rivas P., Martínez-Sarries J.F., Sola R.G. Tratamiento de la hidrocefalia secundaria a hemorragia intraventricular en el prematuro. Revisión bibliográfica. Rev. neurol. 44 (10): 616-624.
[17] Greisen G, Vannucci RC. Is periventricular leukomalacia of hipoxic-ischaemic inyury ? Hypocapnia and the patern brian. Biosl. Neonate. 2001; 79(3-4): 194:200.
[18] Hernández, R J. Entre Piaget y la pared del tubo neural. Gaceta Médica de Querétaro, 2003; 12 (3): 62-69.
[19] Vygotski, L. S., El desarrollo de los procesos psicológicos superiores, Grijalbo, Barcelona, 1988.
[20] Bravo-Cóppola, L. Las destrezas perceptuales y los retos en el aprendizaje de la lectura y la escritura. Una guía para la exploración y comprensión de dificultades específicas. En: Revista electrónica “Actualidades Investigativas en Educación”. Universidad de Costa Rica, Ed IMEC 2004; 4 (1): 1-24.
[21] Gallegos-Duarte M, Mendiola-Santibañez J, Ortiz-Retana JJ. Dissociated deviation. A strabismus of cortical origin. Cir y Cir 2007 (75); 4: 243-249.
[22] McClelland, J. L. Mirman, D., and Holt, L. L. (2006). Are there interactive processes in speech perception? Trends in Cognitive Sciences, 10(8), pp. 363-369.
[23] McClelland, J. L., McNaughton, B. L., and O'Reilly, R. C. Why there are complementary learning systems in the hippocampus and neocortex: Insights from the successes and failures of connectionist models of learning and memory. Psychological. Review, 102, 419-457. 1995.
[24] Thouvenin D, Tiberge M, Arne JL, Arbus L.Brain electrical activity mapping in the study of visual development and amblyopia in young children. J. Pediatr. Ophthalmol. Strabismus; 32(1):10-6. 1995.
[25] Horton, J.C. and Hocking, D.R: “Timing of the critical period for plasticity of ocular dominance columns in macaque striate cortex”. J. Neuroscience, 17:3684-3709,1997.
[26] Horton, J.C., Hocking, D.R., An adult-like pattern of ocular dominance columns in striate cortex of newborn monkeys prior to visual experience. J. Neuroscience 1996, 16:1789-1805.
[27] Mendola JD, Conner IP, Anjali R, Chan ST, Schwartz TL, Odom JV, Kwong KK. “Voxel-based analysis of MRI detects abnormal visual cortex in children and adults with amblyopia”. Human Brain Mapping 2005; 25(2) 222-236.
[28] Chan ST, Tang KW, Lam KC, Chan LK, Mendola JD; Kwong KK. Neuroanatomy and adult strabismus: a voxel-based morphometric analisys of magnetic resonance structural scans. Neuroimage (22) 986-994, 2004.
[29] Gallegos-Duarte M, Moguel-Anchita S. Participación y neuromodulación de la corteza extraestriada en el estrabismo. Arch. Chil. Oftal. Vol 63, (2): 199-209. 2006.
[30] Gallegos-Duarte, M, Moguel-Ancheita S: “Modifications neurologiques adaptatives après traitement médical et chirurgical du syndrome strabique avec variations des repères angulaires” Réunion de printemps, Association française de strabologie. 110 Congres de la société Française d´Ophtalmologie. Paris. mai, 2004. http://perso.wanadoo.fr/hoc.lods/demo150.html.
[31] Moguel-Ancheita S, Orozco-Gómez L, Gallegos-Duarte M, Alvarado I, Montes C. Cambios metabólicos en la corteza cerebral relacionados con el tratamiento de estrabismo. Resultados preliminares con SPECT”. Cir Ciruj 2004; 72:165-170.
Brain Mapping Alterations in Strabismus 335
[32] Caraballo RH, Cersósimo RO, Medina CS, Tenembaum S, Fejerman N. Idiopathic partial epilepsy with occipital paroxysms. Rev. Neurol. 25(143):1052-8. 1997.
[33] Panayiotpoulos CP, Inhibitory effect of central vision on occipital lobe seizures. Neurology 1981; 31:1330-3.
[34] Caraballo RH, Cersosimo RO, Medina CS, Tenembaum S, Fejerman N. Idiopathic partial epilepsy with occipital paroxysms. Rev. Neurol. 1997; 25: 1052-8.
[35] Gallego-Duarte, M.; “Respuesta cortical paradójica durante la fotoestimulación intermitente en el estrabismo disociado”. Cir Ciruj 2005; 73 (3): 163-167.
[36] Gallegos-Duarte M, Mendiola-Santivañez JD, Ortiz-Retama JJ.: Estrabismo disociado y maduración. Boletin del Consejo Latinoamericano de Estrabismo (CLADE) 2007, 21; 2. (In press).
[37] Soto-de la Vega M, Romero-Apis D. Alteraciones electroencefalográficas en el estrabismo. An. Soc. Mex. Oftal. 1970 (1): 9-18.
[38] Céspedes-Gacía Y, González-Hernández J.A.García-Fidalgo J., Beguería-Santos R.A., Figueredo-Rodríguez P. Coherencia cerebral interictal en pacientes con epilepsia del lóbulo temporal. Rev. Neurol. 27 (12): 1107-1111. 2003.
[39] Morales-Chacon L, Sánchez-Catasus C, Águila A, Bender J, García I, García ME, Lorigados. Contribución del SPECT cerebral en la evaluación de la epilepsia del lóbulo temporal farmacoresistente. Experiencia del CIREN. Rev. Mex. Neuroci. 2005; 6 (3) 250-256.
[40] Riikonen et al.: SPECT and MRI in foetal alcohol syndrome. Developmental medicine and child neurology 1999, 41: 652-659.
[41] Piovensan EJ, Cristiano Lange M, Kowacs PE, FemelliH,Werneck LC, Yamana A, et Al. Structural and functional analyses of the occipital cortex in visual impaired patients with visual loss before 14 years old. Arq Neuropsiquitr 2002; 60 (4): 949-953.
[42] Onofre-Castillo JJ, Martínez HR, Arteaga M, Gómez A, Olivas-Mauregui S.; Espectroscopia por resonancia magnética en enfermedades neurológicas. Rev. Mex. Neurol. 2002; 3 (4) 213-217.
[43] Warren K E.; NMR Spectroscopy and pediatric brain tumors. The oncologist 2004; (9): 312-318.
[44] Poca MA, Sauquillo J, Mena MP, Vilalta A, Rivero M.; Actualizaciones en los métodos de monitorización cerebral regional en los pacientes neurocríticos: presión tisular de oxigeno, microdiálisis y técnicas de espectroscopia por infrarrojos. Neurocirgía 2005; (16): 385-410.
[45] Darbina O, Rissob JJ, Carreb, Lonjonc EM, Naritoku DK. Metabolic changes in rat striatum following convulsive seizures. Brain Research 1050 (1): 124-129. 2005.
[46] Doménech-Campos E, Armengol-Caroeller M, Barona de Guzmán R. Electroculografía: aportación al diagnóstico del paciente con alteraciones del equilibrio. Act Otorrino Esp (56):12-16. 2005.
[47] Tychsen L; Wong AM; Burkhalter A.: Paucity of horizontal connections for binocular vision in V1 of naturally strabismic macaques: Cytochrome oxidase compartment specificity. J. Com. Neurol. 2004, 474 (2): 261-75.
[48] Melek NB, Garcìa H, Ciancia AO. La elecroculografía (EOG) de seguimiento de persecución en las esotropias con limitación bilateral de la abducción (LBA). Arch. Oftalmol B Aires (54): 271-276.
Martín Gallegos-Duarte, Héctor F. Rubio-Chevannier et al. 336
[49] Cabanyes-Truffino J, Cartografía cerebral: metodología y aplicaciones en la clínica neurológica. Rev. Neurol. 28 (11): 1090-1098. 1999.
[50] Pascual-Castroviejo. Plasticidad cerebral. Rev. Neurol. (Barc) 1996; 24 (135): 1361-1366.
[51] Hans-Rudolf Shc. Some findings concerning the relationship between ontogesesis and cytoarchitecture of the primate brain. J. Comp. Neurol. 2004; 133 (4): 411-427.
[52] Herrmann CS, Demiralp T. Human EEG gamma oscillations in neuropsychiatric disorders. Clinical Neurophysiolology 116: 2719-2733. 2005.
[53] Rubio D F. Epidemiología de la epilepsia, En: Manual clínico de la epilepsia, JGH Editores, México 1997: 15-20.
[54] Pozo-Lauzan D, Pozo-Alonso AJ.: Nuevo enfoque conceptual de la epilepsia. Rev. Cubana Pediatr. 2001; 73 (4): 224-9.
[55] Engel J Jr. ILAE commission report. A proposed diagnostic scheme for people with epileptic seizures and with epilepsy: report of the ILAE task force on classification and terminology. Epilepsia 2001; 42: 1-8.
[56] Mauritis N M, Scheeringa R, Van der Hoeven J H, de Jong R. EEG coherence obtained from an auditory oddball task increases with age. Journal of Clinical Neurophysiology. (23): 395-403. 2006.
[57] Calderón-González P.L, Parra-Rodriguez M.A., Libre-Rodríguez J.J., Gutiérrez J.V. Análisis espectral de la coherencia cerebral en la enfermedad de Alzheimer. Rev. Neurol. 2004; 38 (5): 422-427.
[58] Snyder S M., Hall J R. A Meta-analysis of Quantitative EEG power associated with attention-Deficit hyperactivity disorder. Journal of Clinical Neurophysiology 23 (5): 440-452. (2006).
[59] Adrian E.D., Matthews B.H.C. The interpretation of potential waves in the cortex. J. Physiol. (81): 440-471. 1934. on line http://jp.physoc.org/cgi/reprint/81/4/440.
[60] Fleming, N.L.and Ballinger, T.W. (1971).Compression of EEG data by isometric power spectral plots. EEG Clin.Neurophysiol., 1971 (31): 632.
[61] Duffy F.H. Bartels, P.H., Burtfiel, J.L. Significance probability mapping. An aid in the topographic analysis of brain electrical activity. EEG Cil. Neurophysiol. 1981 (51): 455-462.
[62] John, E.R., Prichep, L., Fridman, J., Easton, P. Neurometrics: computer-assisted differential diagnosis of brain dysfunctions. Science 1988; 293 (4836): 162-169.
[63] Snyder S M., Hall J R. A Meta-analysis of Quantitative EEG power associated with attention-Deficit hyperactivity disorder. Journal of Clinical Neurophysiology 23 (5): 440-452. (2006).
[64] Suk-tak Ch; Kwok-win T; Kwok-cheung L; Lap-kong Ch; Mendola JD; Kwong KK. Neuroanatomy and adult strabismus: a voxel-based morphometric analisys of magnetic resonance structural scans. Neuroimage (22) 986-994, 2004.
[65] Matheron G.: El´ements pour une th´eorie des milieux poreoux. Mason,Paris , 1967. [66] Vincent L.: Granulometries and Opening Trees. Fundamenta Informaticae, 41(12), 57–
90, 2000. [67] Vincent L., Dougherty E. R.:Morphological segmentation for textures and particles. In
Digital Image Processing Methods E.R. Dougherty, editor,. Marcel Dekker, New York, (1994) 43–102. L.

Brain Mapping Alterations in Strabismus 337
[68] Dougherty E. R.: Granulometric Size Density for Segmented Random-Disk Models. Mathematical Imaging and Vision, 17(3) (2002) 267–276.
[69] Gallegos-Duarte M, Mendiola-Santivañez JD, Granulometría de la corteza cerebral en el estrabismo. Free paper, Event ID: PP1106; 27 Congreso Panamericano de Oftalmología. Cancún México mayo 2007.
[70] Gallegos-Duarte M., Vidal-Pineda R, Enfermedad iatrogénica en estrabismo. Rev. Mex. Oftalmol.; 81 (2): 61-64. 2007.
Copyright © 2022 FDOKUMEN


![Mapping Functional Brain Activation Using [14C]-Iodoantipyrine in Male Serotonin Transporter Knockout Mice](https://static.fdokumen.com/doc/165x107/6323b5f703238a9ff60a8f0e/mapping-functional-brain-activation-using-14c-iodoantipyrine-in-male-serotonin.jpg)
![Mapping muscarinic receptors in human and baboon brain using [N-11C-methyl]-benztropine](https://static.fdokumen.com/doc/165x107/6344f35df474639c9b049d90/mapping-muscarinic-receptors-in-human-and-baboon-brain-using-n-11c-methyl-benztropine.jpg)