Ontology-Driven Decision Making in Transportation Transactions Management, Witold Abramowicz
Upload
khangminh22Category
view
1download
0

The Honorable Chair and Members, Pima County Board of Supervisors Re: Transportation Modeling to Guide Decision-Making September 29, 2021 Page 2
Sunset Road Connection Project The Sunset Road project provides a direct connection between Sunset and River Road, thereby eliminating the need to drive north to Orange Grove Road or south to Ruthrauff Road to cross Interstate 10 and the Rillito River. This project was modeled to evaluate traffic pattern differences between existing conditions and with the new Sunset Road link in place.
The analysis finds that adding the Sunset link reduces the annual regional vehicle miles travelled by 3.63 million; reduces annual vehicle hours travelled by 137 thousand and reduces annual delay by 125 thousand hours. Note that these gains are achieved using current origin and destination volumes and do not include future volumes associated with regional growth and the build-out of the Sunset Campus, which would show further gains.
The model also demonstrates the effect of the new link in terms of changes in traffic characteristics at all network locations. For example, the change in volume at the Orange

The Honorable Chair and Members, Pima County Board of Supervisors Re: Transportation Modeling to Guide Decision-Making September 29, 2021 Page 3
Grove link westbound to I-10 frontage is reduced from 27,035 vehicles to 16,765 as shown below with 7,725 vehicles routed through the new Sunset Road link. Note that the difference between the baseline scenario and the new Sunset link one does not add up equally as vehicles are traveling network-wide using multiple links and modes.
Differences can also be viewed as speed profiles through the various movements associated with any selected link. In the below example, the new Sunset Road link changes the I-10 northbound Frontage Road average speed at Orange Grove Road from 15mph to 35mph during the 5pm afternoon peak (17:00 hours) thereby demonstrating a large delay reduction.
While these metrics are useful in evaluating direct mobility effects, reductions in vehicle miles traveled and delay translate not only into productivity gains and direct monetary savings but also in carbon reduction, vehicle and fuel savings and other ancillary gains. The Board of Supervisors recently approved design funding for the Sunset Road project.

The Honorable Chair and Members, Pima County Board of Supervisors Re: Transportation Modeling to Guide Decision-Making September 29, 2021 Page 4
Snyder Bridge Project A Snyder Road bridge project has been proposed since at least the early 1960s to provide a roadway connection from the northeast across Sabino Creek to alleviate the need to drive south to East Tanque Verde Road.
At the subarea level, the existing condition or baseline illustrates a U-form travel pattern contributing to 26,940 hours of daily congestion (delay) to destinations via Sabino Canyon Road and Tanque Verde Road. Tanque Verde Road at this location is currently exceeding capacity volumes. A direct roadway connection reduces daily delay by 964 hours, daily vehicle-miles traveled by 10,917 and vehicle-hours traveled by 1,085.
The percent differences of directional travel on North Sabino Canyon and East Tanque Verde Road are shown below.

The Honorable Chair and Members, Pima County Board of Supervisors Re: Transportation Modeling to Guide Decision-Making September 29, 2021 Page 5
From a system perspective, a new bridge link results in an annual reduction of 875,750 vehicle-hours traveled, 2,889,500 vehicle-miles traveled, and 795,750 hours of delay reduced. The measures of effectiveness at the regional and subarea indicate that the project is of regional significance, though contingent on the cost of acquiring properties and construction as well as contrasting benefits against demand strategies alternatives.
School Carpool Program The third example of DTA modeling comprises a demand management strategy in lieu of an infrastructure project. Upon request of Pima County, Ms. Melrose Meiyu Pan, doctoral student at UArizona and Dr. Yi-Chang Chiu conducted an analysis to determine the amount of travel time that could theoretically be saved by a regional school carpool program. To this end, a case study was conducted for the 26 schools in the Marana Unified School District. A survey was distributed to these schools to understand the relationship between factors to include participation rates, demographics and marketing strategy in order to determine how level of engagement in a carpool program can be increased. The program was then simulated in DynusT to determine how much travel time savings would be generated based on survey result parameters. The analysis was then projected to estimate County-wide benefit.

The Honorable Chair and Members, Pima County Board of Supervisors Re: Transportation Modeling to Guide Decision-Making September 29, 2021 Page 6
The simulation found that with a 40 percent participation rate and an average of four children per vehicle, the annual travel time savings would be approximately 50,000 hours or 40 percent of the Sunset Road connection project, at a fraction of the cost. Aside from the time savings and associated traffic impact and environmental savings, this study highlights the potential of evaluating demand strategies to alleviate pressures on congested links as well as assist schools and neighborhoods with pickup and drop-off issues. The complete study is attached. Summary Transportation improvements have traditionally been proposed primarily based on location-specific capacity issues and without consideration of their overall effect on the entire network. DTA modeling of alternatives can demonstrate the effect of the proposed improvement on a subarea as well as on regional mobility in a manner that can be quantified in terms of travel savings, environmental impact savings and crash reductions associated with reduced volumes. In evaluating these savings against the cost of the improvement, a return on investment (ROI) can be calculated. ROI was not calculated for the above projects as the criteria and relative weights of factors such as delay, vehicle-miles travelled, carbon reduction, etc., have yet to be determined. Additionally, modeling is useful in evaluating the relative value of different mobility strategies in order to identify those generating the largest benefit within program budgets. This is where demand management strategies to include mode shifts, peak travel time shifts and distributed routing, to name a few, have large potential as they require a much smaller investment than typical roadway infrastructure projects and often provide benefit network-wide. Pima County plans to use DTA modeling to evaluate future proposed projects in order to maximize the value of limited available funding. Please let me know if you have any questions. CHH/anc Attachment c: Jan Lesher, Chief Deputy County Administrator Carmine DeBonis, Jr., Deputy County Administrator for Public Works Yves Khawam, PhD, Assistant County Administrator for Public Works Ana Olivares, Director Transportation Department

Abstract— Technology-driven traffic demand management has emerged as a promising concept for congestion mitigation in recent years, among which school carpooling could receive the particular benefit if applied to an entire region. To aid in the decision-making process for the funding of such a program, we provide a method to quantify the benefits using a simulation-based dynamic traffic assignment (DTA.) modeling approach. The research questions for this paper are a. How can we increase parents' engagement levels in a school carpooling program? b. How much travel time can we theoretically save using this type of demand strategy? To help answer these questions, surveys were designed and distributed through Amazon Mechanical Turk to understand the relationship between participation rates, occupancy, and factors such as parents' demographics, kids' age, and schools' marketing strategy. Using the information gathered on these relationships, the new demand for school carpooling implementation can be estimated. A case study in the Marana school district containing 26 schools in Pima County, Arizona, was studied. We conducted three types of analyses to evaluate the travel time savings by running the DTA simulation with the original and new demand. First, link-level travel time saving was analyzed. Second, we studied the sensitivity of regional travel time saved concerning a range of participation and occupancy rates to explore the potential of school carpooling programs. Third, we assessed the annual county-wide monetary savings if we expanded the school carpooling program to the whole Pima County to evaluate the overall performance of scenarios. We found that the distribution of travel time improvement among individual links in the Marana region would have a more consistent and significant improvement with increased participation rate and occupancy. We also found that promoting the program towards and targeting families that live farther away from schools would attract more participation.
I. INTRODUCTION
Urban traffic congestion declined significantly in 2020 after the outbreak of COVID-19 when many people started to work from home, and kids had to adapt to online classes. However, studies have indicated that car trips may now exceed pre-pandemic levels, as many drivers may start to depend on their vehicles more (D. Wang et al. 2021, 19; Johanson n.d.; "Post-Pandemic Traffic Jams: What They Might Mean for Tech, Media, and Telecom" n.d.). Not only do health risks hinder modality choices, but the growing home relocation during the pandemic has also made the use of public transportation even harder. As many companies work towards a permanent, flexible work arrangement and allow employees to shuffle between days in office and at home, big cities have seen an exodus of residents to the suburbs and to far-flung exurbs, where public transportation options are not available. The commute distance will increase dramatically, making traffic even worse as more people return to in-person work. Attention has been drawn to maximizing ridesharing ridership in the future, among which school carpooling has particular potential. Carpooling is a commonly promoted strategy but has not gotten significant attraction due to several practical challenges, such as safety concerns in carpooling with strangers, differences in individual working schedules, and difficulty changing driving habits. While schools in the US have widely used school buses, many safety and efficiency issues exist. Consequently, many parents continue to drive their kids to school. Private vehicles combined with low-occupied school buses cause severe traffic congestion around the school during peak hours. Similar concerns regarding safety and coordinating schedules also apply to this population. However, smartphone apps may be an efficient and effective way to navigate these concerns to facilitate school-based carpooling programs with parent/student groups. Such a program would utilize a non-trivial amount of resources and commitment from policymakers. Compared with public transit or ridesharing, school carpooling can be a helpful starting point for people to re-embrace multi-modal transportation, as people may feel more comfortable carpooling with their neighbors' or familiar families' children. While many pilot programs have been carried out before, such as GoKid Connect ("Carpool Software for Schools |The Best School Carpool Program That Works - GoKid ConnectGoKid" n.d.), the Denver region's school carpooling program Way To Go ("Home | Way to Go" n.d.), and the GoEzy social carpooling program ("Managed Carpooling" n.d.), they have not been quantitatively analyzed yet to evaluate how this type of demand strategy can mitigate the congestion at the regional level, and what methods may increase parents' engagement levels. To aid in the decision-making process for future funding of such a program, we provide a method to quantify the benefits using a proven engineering approach.
Melrose Pan is with the University of Arizona, 1209 E 2nd St, Tucson, AZ 85721. Yi-Chang Chiu, Ph.D. is a professor in the Department of Civil and Architectural Engineering and Mechanics, University of Arizona, 1209 E 2nd St,
Tucson, AZ 85721. (corresponding author to provide phone: 520-626-8462; e-mail: email: [email protected])
Evaluating the Congestion Improvement Benefit of a Regional School Carpooling Program using Dynamic Traffic Assignment
Melrose Meiyu Pan, Yi-Chang Chiu, Ph.D.

This paper addresses three significant deficiencies in existing research on the system-wide benefit of a school carpooling program. First, previous studies mainly used vehicle miles traveled (VMT) as a measure of demand reduction. However, few analyzed the travel time savings, which is a more intuitive measure for congestion mitigation from a traveler's perspective. Second, city or county-wide benefit analysis of carpooling needs to consider many factors such as participation rates (Richter et al. 2019), successful matching rate, and the efficiency of the matching algorithm. Our research considers various participation and vehicle occupancy rates. Third, policymakers need to know the relationships between participation rate, occupancy, and improvement level to determine the number of resources required to invest to achieve a target traffic improvement level. The research questions for this paper are: a) how can we increase parents' engagement levels in a school carpooling program? b) how much travel time-saving can we theoretically achieve using this type of demand strategy? We propose using the regional Dynamic Traffic Assignment (DTA.) for a proof-of-concept analysis. We obtained the Pima Association of Governments (PAG.) network model, and the origin-destination (OD) demand data from the StreetLight, also provided by the Pima County Department of Transportation (PCDOT), with proper calibration. Surveys were designed and distributed through Amazon Mechanical Turk to understand the relationship between participation rates, occupancy, and factors such as parents' demographics, kids' ages, and the schools' marketing strategies. According to passengers' socio-demographics provided by StreetLight, the new OD demand from each zone to the school zone was estimated based on the estimated participation rates and occupancy. We conducted three types of analyses using the DynusT mesoscopic simulation with the new OD demand input. First, link-level travel time savings were analyzed. Second, we studied the sensitivity of regional travel time savings concerning a range of participation and occupancy rates to explore the potential of school carpooling programs. Third, we assessed the annual county-wide monetary savings if we were to expand the school carpooling program to the entire Pima County to evaluate the overall performance of scenarios. The overall paper is structured as follows. First, we review the literature spanning the fields of ridesharing/carpooling and school pool studies/programs. Second, we lay out the methodological approach to demand reduction calculation and modeling. Third, we provide an in-depth discussion of the simulation results and the sensitivity of the regional carpooling program compared with the current self-driving mode. The conclusion focuses on the theoretical and practical implications for policy considerations and further research needed in the future.
II. LITERATURE REVIEW
Carpooling benefits have been studied widely, with economic models and simulations applied to predict the potential benefits, such as savings in energy consumption and vehicle miles traveled. Different carpooling strategies, such as matching schemes and route optimization algorithms, have been proposed and tested in simulation software. While most of them achieved a high amount of vehicle miles of travel (VMT) reduction, most of them assumed a high participation rate, making the proposed methods hard to reproduce in the real world. In reality, many programs start by targeting a specific group of users and reducing the size of the area of carpooling. Many regions in the US have initiated school carpooling programs. While schools successfully utilized some programs, many faced problems such as a lack of overall support from the schools, parents' complaints regarding privacy issues, or not enough matching pairs nearby. Because of a limited number of participants, most programs have failed to develop a system benefit analysis such as VMT or travel time savings.
Ride-Sharing Benefit Studies
In previous studies, the economic effects of energy conservation and environmental protection of carpooling have been examined (Minett and Pearce 2011). Travelers' behavior was also studied, and the results show that carpoolers are more likely to engage in a higher number of cold-start trip chains, which increase emission (Concas and Winters 2007). Drivers' responses to fuel price changes were also studied and used to analyze the potential of conversion to carpooling (Bento, Hughes, and Kaffine 2013). Recent research has also found that Transportation network companies (TNCs) are the most significant contributor to growing traffic congestion in the broader metropolitan areas of cities because they convert people who used to take public transit to use private vehicles, creating more deadheading trips with empty cars looking for a fare and added mileage between trips as drivers drive to a pickup locati on. While these studies did not consider the traffic flow models, they revealed that TNC based matching algorithms could not bring system benefits without considering these deadheading trips. The limitation lies in the strong assumption that all the drivers and passengers can be matched automatically and successfully, which is difficult to achieve in practice. In other studies, optimization and Simulation Models were utilized to test the effectiveness of different assumptions and carpooling strategies. The advantage of simulations is that many different parameters such as matching algorithms (Zhu, Liu, and Wang 2019; Dakroub et al. 2013), scheduling systems (Linares et al. 2016; Bilali et al. 2019), participation rate (Rodier, Alemi, and Smith 2016), the number of matches (Dubernet, Rieser-Schüssler, and Axhausen 2013), and drivers' willingness to change (Lees-Miller, Hammersley, and Davenport 2009) can be implemented and tested in the simulation software. Many traffic simulations have been conducted to study the effect of routing and ridesharing matching efficiency on system travel
time or congestion mitigation. A simulation study in Berlin found that vehicle kilometers traveled could be reduced by 15-20% based on the assumption that a fleet of vehicles has a capacity of between two to four ride requests (Bischoff, Maciejewsk, and Nagel 2018). However, the fact that more demand could be attracted is left unconsidered. More detailed integration of the scheduling system in the Stuttgart Region has been introduced as well (Richter et al., 2019). While a 100% participation rate and high occupancy rate can hardly be achieved in reality, the paper revealed the potential travel time saving that ridesharing can achieve. An optimization and simulation scheme was also carried out to optimize the factors from the driver's side, such as their waiting time (Y. Wang, Zheng, and Lim 2018; Engelhardt et al. 2019). Nonetheless, it is unknown if deadheading trips caused by unsuccessful matches will lead to more congestion, and more demand will be converted from public transit. Idle time of vehicles was also considered in a simulation to study the environmental impact (Kuntzky, Wittke, and Herrmann 2013). It pointed out that the number of vehicles and the integration of a bus system were the most critical factors to reduce the number of vehicles on the road. The representative literature is summarized in Table 1.
School Carpool Programs
The concept of school carpooling has been adopted in some regions in the US. Some programs are in partnership with local governments, while others with commercial and corporate groups. The common goal is to reduce the pickup and drop-off traffic surrounding schools, thus saving travel time for parents and reducing vehicle miles traveled. The Denver region's school carpooling program (Denver Region Schoolpool program 2017) operated a free online matching program, and each school had its matching network, making it possible for parents to connect with other families and arrange school carpools, or walking and biking groups (Hulstrom K-8, n.d.). After receiving a digital map, parents were able to search and form a school carpool. A VMT reduction of 9,672,270 of the school pool's 18,489 participating families was observed in 2017. While most parents were satisfied with the program, they suggested increasing the participant family pool so that parents could find a matching partner more easily near their location. Another carpooling program is run by 511 Contra Costa. 511 Contra Costa is a Transportation Demand Management Program in California that provides services for commuters and residents to explore various modes of personal travel. They ran the high school carpool program in San Ramon. Gift card incentives were used to attract more families to the school pool program. Carpool vehicles also enjoyed the privileged parking on campus (Amaral 2019). Several apps-based solutions included GPS mapping, in-app chatting features, and reminder functions, making carpooling easier for parents than web searching. GoKid Connect allowed parents to search on a map for parents who live close by. They can also manage their private carpooling network on this app by inviting other families they know and trust ("GoKid Connect Frequently Asked QuestionsGoKid" n.d.). Carpool to School is another school pool app that provided a secure matching service integrated with Google maps, scheduling, and a built-in text messaging to remind parents when it's their turn to drive ("Carpool to School – Success Academy South Bend" n.d.). The GoEzy app has a built-in social carpooling function allowing the individual or organization to form carpooling groups ("Managed Carpooling - A Smarter Approach to Carpool Adoption," n.d.). Another unique app is Zum. Unlike traditional school pool programs, Zum hires trained drivers to pick up and drop off children following parent-provided instructions for hand-off ("Zum Carpool Service - De La Salle High School" n.d.).
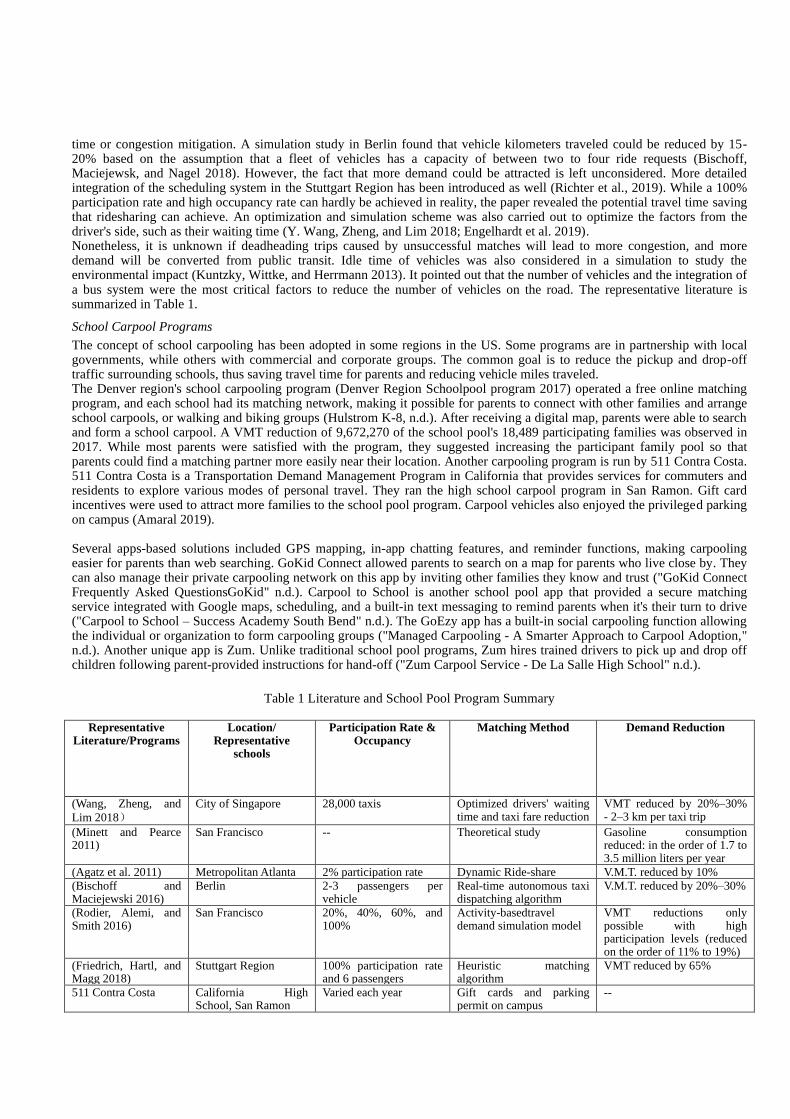
Table 1 Literature and School Pool Program Summary Representative
Literature/Programs Location/
Representative schools
Participation Rate & Occupancy
Matching Method Demand Reduction
(Wang, Zheng, and
Lim 2018)
City of Singapore 28,000 taxis Optimized drivers' waiting time and taxi fare reduction
VMT reduced by 20%–30% - 2–3 km per taxi trip
(Minett and Pearce 2011)
San Francisco -- Theoretical study Gasoline consumption reduced: in the order of 1.7 to 3.5 million liters per year
(Agatz et al. 2011) Metropolitan Atlanta 2% participation rate Dynamic Ride-share V.M.T. reduced by 10%
(Bischoff and Maciejewski 2016)
Berlin 2-3 passengers per vehicle
Real-time autonomous taxi dispatching algorithm
V.M.T. reduced by 20%–30%
(Rodier, Alemi, and Smith 2016)
San Francisco 20%, 40%, 60%, and 100%
Activity-basedtravel demand simulation model
VMT reductions only possible with high participation levels (reduced on the order of 11% to 19%)
(Friedrich, Hartl, and Magg 2018)
Stuttgart Region 100% participation rate and 6 passengers
Heuristic matching algorithm
VMT reduced by 65%
511 Contra Costa California High School, San Ramon
Varied each year Gift cards and parking permit on campus
--

Carpool to School Success Academy, South Bend
Not mentioned Secure matching, scheduling, and a built-in text messaging
--
GoKid Connect Crystal Springs Uplands School, Hillsborough
Not mentioned Inviting trusted families --
Zum De La Salle High School
Not mentioned Door-to-door service with trained drivers
--
Way to Go Schools in Denver Region
36% participation rate Using a digital map for parents to contact other families
VMT saved: 15,112,922

III. METHODOLOGY
The research questions for this paper are a. How can we increase parents' engagement levels in a school carpooling program? b. How much travel time can we theoretically save using this type of demand strategy? The workflow of the methodology is illustrated in Figure 1. To answer the first research question, surveys were sent out through Amazon Mechanical Turk to understand the relationship between carpooling intention and parents' demographics, kids' age, schools' marketing strategy, etc. Ordinal logistic regression was employed for modeling this relationship. This model was then used to estimate schools' participation rates and occupancy in the studied region using the socio-demographic and trip characteristics data. To answer the second research question, we used a DynusT ("DynusT," n.d.) Simulation to model various scenarios and quantitatively assess the relationship between traffic improvement and different levels of carpooling participation rates and occupancies. A school zone mainly serves as a destination zone in the morning where parents drop off their kids and leave for work. A school zone primarily serves as an origin zone in the afternoon when parents pick up their kids at school and leave for home. The school carpooling program seeks to reduce the number of vehicle trips from home to school in the morning and from school to home in the afternoon. Based on this knowledge, the demand reduction between each zone to a school zone in a particular time slot was estimated based on parents' participation rates of the school carpooling program and occupancy per vehicle. The new OD demand was then calculated by subtracting the estimated demand reduction from the original demand in a particular time slot. The original and new OD demand were used as the input for a DynusT mesoscopic simulation run with DUE convergence to obtain stable results. We conducted three types of analyses. First, link-level travel time saving was analyzed. Second, we studied the sensitivity of regional travel time saving concerning a range of participation and occupancy rates to explore the potential of school carpooling programs in the future. Third, we assessed the annual county-wide monetary savings if we expanded the school carpooling program to the entire Pima County to evaluate the overall performance of scenarios.
Figure 1. Work Flow
Notations
Set: J: school zone set. It contains all the school zone indexes in the area of interest. 𝐼: zone set. It contains all the zone indexes within 30 minutes' driving distance from the school zone j.
Index: t: Start time of the school peak hour. j: school zone index, 𝑗 ∈ 𝐽 i: zone index, 𝑖 ∈ 𝐼
Variables: N: Total number of zones

𝑇𝑗𝑡: The total demand (including non-school demand) to or from the school zone j at time t.
𝑇𝑖𝑗𝑡 : The demand between zone i and the school zone j.
𝑇𝑎𝑓𝑡𝑒𝑟 𝑖𝑗
𝑡 : The demand between zone i and the school zone j after the school carpooling program is implemented.
𝑇𝑆𝑗𝑡: The total school demand between zone i and the school zone j at time t.
𝑇𝑆𝑖𝑗𝑡 : The school demand between zone i and school zone j.
𝑇𝑆𝑎𝑓𝑡𝑒𝑟 𝑖𝑗
𝑡 : The demand between zone i and the school zone j after the school carpooling program is implemented.
𝑝𝑗%: Participation rate of the school carpooling program. 𝑝𝑗 is a random number between 0 and 100.
𝑜𝑗: The number of students in each vehicle. o is a random number between 2 and 4
Participation Rate and Occupancy Estimation
1) Carpool Intention People's carpool intention is related to multiple types of factors: demographic factors such as age and income, situational factors such as trip distance and purpose, intervention factors such as incentives and free parking, and finally, judgmental factors such as pro-auto attitudes, and social norms (Neoh, Chipulu, and Marshall 2017; Bachmann et al. 2018). Studies found that workers living in households with family incomes less than $20K are more willing to carpool (Ferguson 1995). In our case, the decision-makers are parents who need to send their kids to school. Likely, kids' demographics may also be important factors as parents have more safety concerns if they have younger kids. Different income levels or racial groups might also make different carpool decisions. Carpool intention is defined in this paper as a percentage metric describing parents' willingness to join a school carpooling program. To simplify this, we use three categories where 0% represents "not likely to join a school carpooling program," 50% represents "maybe," and 100% represents "very likely to join a school carpooling program." Ordinal Logistic regression was used in predicting the probability of parents' carpool intention in each category. We selected this model because it can predict ordered dependent variables, such as level of satisfaction (Eboli and Mazzulla 2009), crash injury severities (Sasidharan and Menéndez 2014), and Likert-type scales of willingness to pay (Erdem, Şentürk, and Şimşek 2010). While other machine learning models such as Neural Networks have been used to analyze rank-order responses, they are more likely to overfit, leading to poor predictability. To find out the coefficients of the model's parameters, we designed a survey and distributed it through Amazon Mechanical Turk. The responses were filtered by whether the respondents have kids under 18. We infer carpool intention by asking participants how likely they will carpool if they can find suitable matches in or near their communities. A Likert-type scale of 1 to 3 was used to represent carpool intention in the survey design. We also asked about their demographic characteristics, trip characteristics, and social norm. The necessary sample size is determined by the marginal error (the maximum allowed error), the standard deviation of the responses (carpool intention), and confidence level (how confident the actual mean falls within the margin of error). We set the marginal error as 6%, standard deviation as 0.5, and confidence level as 90%. Therefore, the sample size was determined to be 190 using the formula in (Israel 1992). The results of the survey are shown in Table 2. Only significant variables and their coefficients are shown. With 10-fold cross-validation, the average accuracy of the logistic model is 79.65%. Our results indicated that parents with higher education are more willing to join a school carpooling program. Those who have kids between 13-17 were found to be more inclined to carpool. While we also tested whether having kids under 13 affected carpool intention, this variable was not significant. Those who have longer travel times are also more willing to carpool. This shows that a substantial travel time saving can be a great attraction for parents. Social norms have the most significant effect on parents, indicating that those who have heard about successful school carpooling programs before are more likely to join as well.
Table 2 Survey Results (The number of participates that have at least one child=196)
Class Attribute Type Categories Mean Notation Coefficients p-value
Ordinal Carpool Intention Intention 1=Not Likely, 2=Maybe,
3=Very Likely 2.26 Y
beta_1: 1.4426 beta_2: 2.7966
beta_1: 0.0469 beta_2: 0.0227
Ordinal Education Demographic
0=Less Than High School Diploma, 1=High School
Diploma, 2=Some College, 3=Bachelor's Degree,
4=Graduate or Professional Degree
2.87 X1 0.2175 0.0753
Nominal Having Kids Age Between 13-17
Years Old Demographic 0=No, 1=Yes 0.58 X3 0.4904 0.0685

Continuous Travel Time Trip
Characteristics -- 18.44 min X2 0.0081 0.0164
Ordinal Friends/Neighbors
Joining School Carpool
Social Norms Linear scale, 1=Almost None,
5=A Lot 2.68 X4 0.7935 4.93E-08
The Ordinal Logistic model of carpool intention Y is shown in equation (1).
𝑙𝑜𝑔𝑖𝑡(𝑃(𝑌 ≤ 1)) = 𝛽1 − ∑ 𝑐𝑖𝑋𝑖
4
𝑖=1
, 𝑙𝑜𝑔𝑖𝑡(𝑃(𝑌 ≤ 2)) = 𝛽2 − ∑ 𝑐𝑖𝑋𝑖
4
𝑖=1
(1)
The probability of the carpool intention of the Likert scale of one to three is calculated using equations (2)-(4).
𝑃(𝑌 = 1) = 𝑃(𝑌 ≤ 1) =exp (𝛽1 − ∑ 𝑐𝑖𝑋𝑖
4𝑖=1 )
1 + exp (𝛽1 − ∑ 𝑐𝑖𝑋𝑖4𝑖=1 )
(2)
𝑃(𝑌 = 2) = 𝑃(𝑌 ≤ 2) − 𝑃(𝑌 ≤ 1) =exp(𝛽2 − ∑ 𝑐𝑖𝑋𝑖
4𝑖=1 )
1 + exp(𝛽2 − ∑ 𝑐𝑖𝑋𝑖4𝑖=1 )
−exp (𝛽1 − ∑ 𝑐𝑖𝑋𝑖
4𝑖=1 )
1 + exp (𝛽1 − ∑ 𝑐𝑖𝑋𝑖4𝑖=1 )
(3)
𝑃(𝑌 = 3) = 1 − 𝑃(𝑌 = 1) − 𝑃(𝑌 = 2) (4) For each school zone, we defined the aggregated carpool intention 𝜆𝑗 as an average of all parents' carpool intention who have
kids in this school, describing how willing parents are to join a carpool program. The aggregated carpool intention 𝜆𝑗 of school
zone j was calculated using equation (5) by averaging the carpool intention of parents living in zone i who have kids at school zone j for all i, i=1,2,..,N.
𝜆𝑗 =1
𝑁∑ 𝑃𝑖𝑗(𝑌 = 1) ∙ 0% + 𝑃𝑖𝑗(𝑌 = 2) ∙ 50% + 𝑃𝑖𝑗(𝑌 = 3) ×∙ 100%
𝑁
𝑖=1
(5)
2) Estimating Participation Rate and Occupancy Distribution Rather than a fixed value, we estimated school carpooling program participation rate and occupancy as random numbers that
follow s distribution varying with the carpool intention of the school zone.
We assumed that the participation rate of a school forms a Poisson distribution. Poisson distributions describe the probability
of a given number of events occurring in a fixed interval of time or space if these events occur with a known constant mean
rate and independently of the time since the last event. We used this long-tail distribution to model participation rate as the
probability of having larger participation rates decreases quickly. The participation rate 𝑝𝑗 of school, j is generated from the
probability distribution in (6) where the parameter 𝜆𝑗 represents the average participation rate of school j estimated using the
methodology in the previous section.
𝑃(𝑥, 𝜆𝑗) =𝑒−𝜆𝜆𝑗
𝑥
𝑥!, 𝑥 ∈ [0,1] (6)
We assumed that the probability of getting the number of kids between 2 and 4 in a carpool forms a shifted exponential distribution. We assumed that most families would get two kids per vehicle, and it is increasingly less likely to get more kids to carpool together. The average occupancy per vehicle is set as 𝛽𝑗 = 2.5 kids to get a conservative estimate. The occupancy
𝑜𝑗 of school, j is generated from the probability distribution in (7), where the parameter 𝛽𝑗 represents the average occupancy of
school j estimated using the methodology in the previous section.
𝑓(𝑦, 𝛽𝑗) =1
𝛽𝑗
𝑒𝑥𝑝 (−1
𝛽𝑗
(𝑦 − 2)) , 𝑦 ∈ [2,4] (7)
Simulation-Based Dynamic Traffic Assignment
We estimated the demand reduction between each zone to a school zone in a specific time slot based on parents' participation rates and occupancy per vehicle. The new OD demand was then calculated by subtracting the estimated demand reduction
from the original demand in a specific time slot. 𝑇𝑆𝑖𝑗𝑡 is denoted as the school demand from zone i to the school zone j when t
represents the morning peak hours and the demand from the school zone j to zone i if t represents the afternoon peak hours,
which is mainly contributed by parents' driving their kids to school or home. 𝑇𝑖𝑗𝑡 is denoted as the total demand from zone i to
the school zone j if t represents the morning peak hours, and the demand from the school zone j to zone i if t represents the afternoon peak hours. We assumed that the school demand accounts for a certain proportion 𝑐 of the total demand of an OD pair. The relationship is equation (8).

𝑇𝑆𝑖𝑗𝑡 = 𝑇𝑖𝑗
𝑡 ∙ 𝑐, 𝑐 ∈ [0,1] (8)
The new demand between zone i and school zone j is calculated by adding the non-school demand and the new school demand:
𝑇𝑎𝑓𝑡𝑒𝑟 𝑖𝑗
𝑡 = 𝑇𝑆𝑎𝑓𝑡𝑒𝑟 𝑖𝑗
𝑡 + 𝑇𝑖𝑗𝑡 ∙ (1 − 𝑐) (9)
The new school demand 𝑇𝑆𝑎𝑓𝑡𝑒𝑟 𝑖𝑗
𝑡 between zone i and school zone j during time slot t is calculated using equation (10):
𝑇𝑆𝑎𝑓𝑡𝑒𝑟 𝑖𝑗
𝑡 = 𝑇𝑆𝑖𝑗𝑡 ∙ (1 − 𝑝𝑗) + 𝑇𝑆𝑖𝑗
𝑡 ∙𝑝𝑗
𝑜𝑗
(10)
The original and new OD demand was used as the input of a DynusT mesoscopic simulation. The advantage of using a
simulation-based DTA model is the ability to capture complex and dynamic interactions between various entities that are
found in the real world. We employed a dynamic traffic simulation and assignment (DTA) model rather than a static method
to depict better the dynamic traffic changes that occur due to the scenarios of interest. Another reason for using the DTA
model is that it allows for a spill-back phenomenon where the outflow does not match the inflow, which works for our
scenario because the school region could have severe congestion. DynusT is a DTA capable of predicting the traffic before
and after the carpooling program is implemented. DynusT is based on the Anisotropic Mesoscopic Simulation (AMS) model.
While sharing the same characteristics of microscopic models where individual vehicles are represented, it can also describe a
corridor-regionwide traffic flow shift during an extended period, from peak hours to 24 hours (Dynamic Traffic Assignment: A
Primer 2011).
IV. CASE STUDY
The Marana school district in Pima County, Arizona, was employed as a case study. The road network was built based on the GIS shapefiles from Pima County. The school distribution and the school district map are shown in Figure 2. Twenty-six schools are in twenty-four traffic analysis zones (TAZ) in this region, so each TAZ. contains about 1.1 schools. The area per zone is approximately 8.3 square miles. There are 87 links in this area, and the average length is 0.5 miles.
Figure 2. GIS. Map of Marana School District
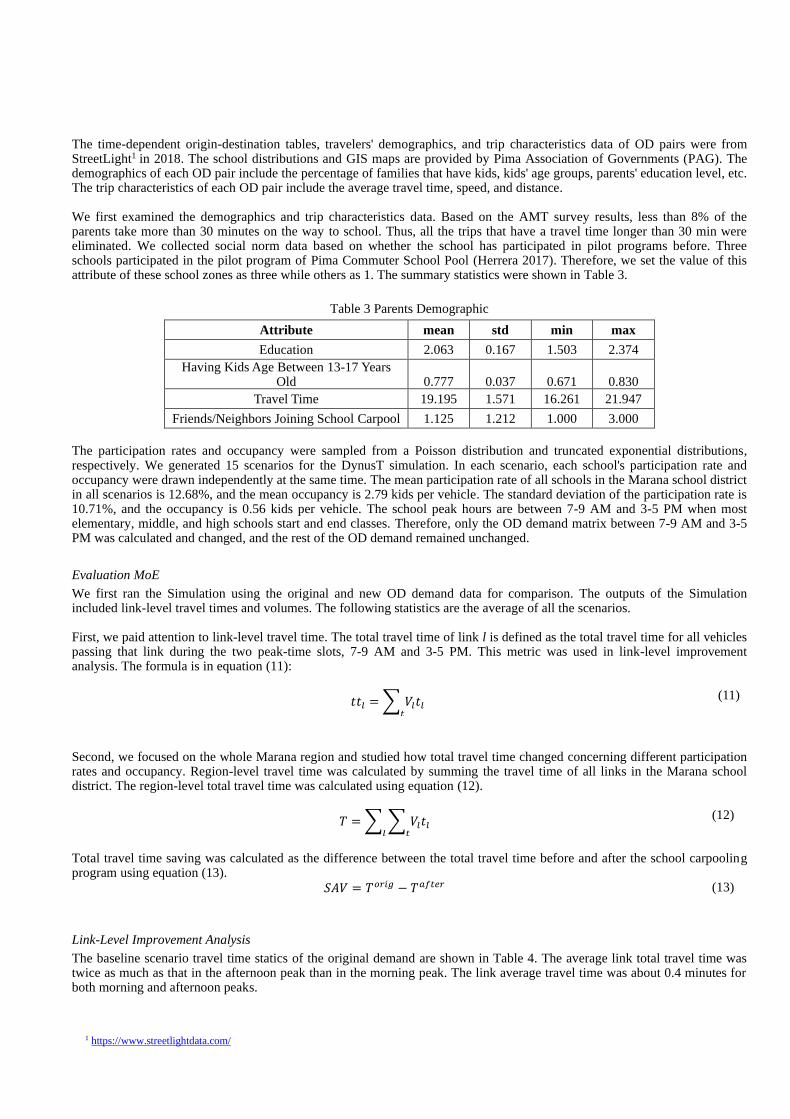
The time-dependent origin-destination tables, travelers' demographics, and trip characteristics data of OD pairs were from StreetLight1 in 2018. The school distributions and GIS maps are provided by Pima Association of Governments (PAG). The demographics of each OD pair include the percentage of families that have kids, kids' age groups, parents' education level, etc. The trip characteristics of each OD pair include the average travel time, speed, and distance. We first examined the demographics and trip characteristics data. Based on the AMT survey results, less than 8% of the parents take more than 30 minutes on the way to school. Thus, all the trips that have a travel time longer than 30 min were eliminated. We collected social norm data based on whether the school has participated in pilot programs before. Three schools participated in the pilot program of Pima Commuter School Pool (Herrera 2017). Therefore, we set the value of this attribute of these school zones as three while others as 1. The summary statistics were shown in Table 3.
Table 3 Parents Demographic
Attribute mean std min max
Education 2.063 0.167 1.503 2.374
Having Kids Age Between 13-17 Years Old 0.777 0.037 0.671 0.830
Travel Time 19.195 1.571 16.261 21.947
Friends/Neighbors Joining School Carpool 1.125 1.212 1.000 3.000
The participation rates and occupancy were sampled from a Poisson distribution and truncated exponential distributions, respectively. We generated 15 scenarios for the DynusT simulation. In each scenario, each school's participation rate and occupancy were drawn independently at the same time. The mean participation rate of all schools in the Marana school district in all scenarios is 12.68%, and the mean occupancy is 2.79 kids per vehicle. The standard deviation of the participation rate is 10.71%, and the occupancy is 0.56 kids per vehicle. The school peak hours are between 7-9 AM and 3-5 PM when most elementary, middle, and high schools start and end classes. Therefore, only the OD demand matrix between 7-9 AM and 3-5 PM was calculated and changed, and the rest of the OD demand remained unchanged.
Evaluation MoE
We first ran the Simulation using the original and new OD demand data for comparison. The outputs of the Simulation included link-level travel times and volumes. The following statistics are the average of all the scenarios. First, we paid attention to link-level travel time. The total travel time of link l is defined as the total travel time for all vehicles passing that link during the two peak-time slots, 7-9 AM and 3-5 PM. This metric was used in link-level improvement analysis. The formula is in equation (11):
𝑡𝑡𝑙 = ∑ 𝑉𝑙𝑡𝑙𝑡
(11)
Second, we focused on the whole Marana region and studied how total travel time changed concerning different participation rates and occupancy. Region-level travel time was calculated by summing the travel time of all links in the Marana school district. The region-level total travel time was calculated using equation (12).
𝑇 = ∑ ∑ 𝑉𝑙𝑡𝑙𝑡𝑙
(12)
Total travel time saving was calculated as the difference between the total travel time before and after the school carpooling program using equation (13).
𝑆𝐴𝑉 = 𝑇𝑜𝑟𝑖𝑔 − 𝑇𝑎𝑓𝑡𝑒𝑟
(13)
Link-Level Improvement Analysis
The baseline scenario travel time statics of the original demand are shown in Table 4. The average link total travel time was twice as much as that in the afternoon peak than in the morning peak. The link average travel time was about 0.4 minutes for both morning and afternoon peaks.
1 https://www.streetlightdata.com/

Table 4 Baseline Statistics
Mean Link
Volume 𝑡𝑡𝑙
𝑜𝑟𝑖𝑔
(min)
𝑇𝑜𝑟𝑖𝑔
(min)Tw
AM Peak 517 0.41 17717
PM Peak 636 0.40 32786
Figure 3 and Figure 4 show the link travel time distribution in the morning and afternoon before and after the school carpool program is implemented. The X-axis is the link travel time in minutes. The Y-axis is the cumulative distribution of the link travel time. Figure 3 shows that the overall link travel time is shorter after the school carpooling program is implemented in the morning peak hours. The blue line is on the left of the red line, indicating that a higher proportion of links have shorter travel times. We also checked if the mean travel time after the school carpool program is statistically different from before the program is implemented between 7-9 AM and 9-11 AM. And we observed a p-value of 0.0396 between 7-9 AM, meaning we can reject our null hypothesis of no change at a 95% confidence level. We found that the difference of mean travel time between 9-11 AM is not significant, with a p-value of 0.2017.
(a) (b)
Figure 3. The X-axis is the link travel time in minutes. The Y-axis is the cumulative distribution of the link travel time. (a)
Cumulative distribution of link travel time between 7-9 AM, p-value = 0.0396 (b) Cumulative distribution of link travel time
between 9-11 AM, p-value = 0.2017
Figure 4 shows that the overall link travel time is shorter after the school carpooling program is implemented in the afternoon. Both of our p-values meet the threshold for rejecting the null hypotheses that there's no difference between the travel time means between 3-5 PM and 5-7 PM at a 95% confidence level. This means that not only the link travel time is shorter during school peak hours (p-value=0.0325), but the link travel time saving is also significant during commute peak hours (p-value=0.0296). This shows that school carpooling can also help mitigate the congestion between 5-7 PM where most people on their way home, even though it does not directly reduce the demand in this time slot.
Figure 4. The X-axis is the link travel time in minutes. The Y-axis is the cumulative distribution of the link travel time. (a)
Cumulative distribution of link travel time between 3-5 PM, p-value= 0.0325 (b) Cumulative distribution of link travel time
between 5-7 PM, p-value =0.0296

Sensitivity Analysis
We further calculated the total daily travel time saving between 7-9 AM and 3-5 PM with different participation rates and occupancy. Figure 5 shows the total travel time saving as participation rate and occupancy increase. The results reveal that the distribution of travel time improvement among individual links in the Marana region would have a more consistent and more significant improvement with increased carpool participation rate and occupancy. Furthermore, the total travel time saving is in the morning peak hours is higher than that in the afternoon peak hours, as the school demand is higher in the morning than in the afternoon. This shows that the school carpooling program would have a more significant effect during morning rush hours.
Figure 5. Daily Travel Time saving Concerning Participation Rate and Occupancy
County-Wide Benefit Analysis
Next, we roughly approximated the annual county-wide savings if school carpooling programs were to be implemented by all the schools in the county. A more rigorous modeling approach is to input all the school information into the County DynusT D.T.A. model and collect the statistics directly without approximation. This paper focuses on demonstrating the modeling approach. The concept of Value-of-Time (VOT) was adopted to measure the benefits derived from the school carpooling project that reduced congestion and travel time. VOT usually varies from different income groups and distances (Athira et al., 2016). For generality, we used the value of time of $20 per hour, which TxDOT has used for passenger cars (Zhang, Jenelius, and Kottenhoff 2017). The parameters used for calculating annual county-wide savings from school carpooling programs were summarized below:
• 𝑆𝐴𝑉 = 𝑇𝑜𝑟𝑖𝑔 − 𝑇𝑎𝑓𝑡𝑒𝑟
• VOT: value of time = $20 per hour
• ND: the number of days in a school year = 160
• P: the proportion of schools of Marana to the Pima = 10%. The annual value of travel time savings for the county ASAV was calculated using equation (14):
ASAV = SAV × VOT × ND / P (14)
With 40% percent participation and an average of four children per vehicle, we have nearly $1M in annual travel time savings. With a more conservative 20% participation and an average occupancy of 2, we observed annual savings of $300k. The results also showed that if the program did not get a significant number of participants and attraction, the savings are relatively trivial. The policy implication is that an easy-to-use and trustworthy carpooling technology accepted by the parents and effective behavior-changing strategies (e.g., a sufficient amount of incentive for program jump-start and others) would be crucial for the success of this strategy to exhibit benefit.
Table 5 Annual Time Saving ($thousands)

p=10% p=20% p=30% p=40%
o=2 $12.80 $307.20 $460.80 $518.40
o=3 $275.20 $409.60 $633.60 $806.40
o=4 $172.80 $505.60 $678.40 $979.20
V. DISCUSSIONS
In this paper, we carried out the scenario-based analysis to understand the system benefit of school carpooling programs and participation and occupancy. According to the survey, we found that parents who have kids in middle schools and high schools are more willing to participate in the carpool program. Those living farther from the school are more likely to carpool. Successful pilot programs might also attract more participants. We can infer that the school carpooling program would be more successful if targeted at families with older kids and live farther away from school. The estimated average participation rate of the Marana school district is 12.68%, and occupancy is 2.79 kids per vehicle. We anticipate that with more promotions of the program and accurate targeting of users, the participation rate will be higher. According to the Simulation, we found that the link-level travel time is shorter during morning and afternoon peak hours in the Marana school district. The sensitivity analysis shows that travel time improvement among individual links had smaller variability as participation rate and occupancy increased, which indicated a more consistent amount of improvement in all the links. When the school demand was higher, increasing the participation rate could result in a much larger travel time saving. By estimating the system benefit of the school carpooling program, an annual saving of nearly $1M could be achieved if we applied the school carpooling program to the whole county with 40% percent participation and four kids per vehicle. With 20% percent participation and an average of 2 kids per vehicle occupancy, we had, on average, $300k annual saving. Previous studies suggest two significant factors influencing carpool intention, which are also in line with our findings. First, social norms increase the intention to carpool as a driver or passenger. More specifically, a study found that descriptive and personal norms help motivate people to carpool (Bachmann et al. 2018). As a result, employee or school carpool programs tend to be more successful than casual carpools as the organizations constitute an effective context for implementing carpool programs. Another study also showed that subjective norms and attitudes significantly impacted intentions toward carpooling (Abutaleb, El-Bassiouny, and Hamed 2020). Second, demographics can predict carpool intention to some extent. A study found that being between 26 and 45 years of age and being male could effectively increase the possibility of carpool usage (Chen, Jou, and Chiu 2021). While we included these demographics in our model, we only found that education level is significant. Another study showed that carpooling is very weakly related to socio-demographic variables and that psychological factors such as attitudes are more important (Olsson, Maier, and Friman 2019). These inconsistent findings imply that the relationship between demographics may vary by population, geographic locations, etc. The carpool programs need to be designed more effectively targeted to city characteristics (Chen, Jou, and Chiu 2021). Besides social norms and demographics, our study also identified the trip characteristics and marketing strategies that can influence carpooling intention. These findings provide three key insights into the school carpooling program's future arrangement to improve the participation rate. First, the program should target older kids, mainly middle and high school students. Younger kids may arouse parents' safety concerns thus less likely to participate in such a program. Second, those who live relatively far away from the school could be good targets. In this way, parents can save plenty of time on commute thus be more willing to find a carpool match. Third, successful pilot programs can lead to an increasingly higher participation rate in the future. Pilot participants' great experience can help reduce the barriers of other parents, such as privacy concerns or perceived difficulty in finding a carpool match. The limitation of this study is that the impact factors of carpool intention may not be applied to every school. State- or nationwide survey may uncover the differences among cities. Different types of schools may need slightly different targeting strategies as well. Therefore, our study offers perspectives such as demographics, social norms, trip characteristics, and marketing strategies that the school will need to consider before implementing the carpool program.
VI. CONCLUSIONS
Compared to investing in infrastructure, demand management, while potentially more cost-effective, is often less understood. This study provides DTA-based modeling to shed light on this using a case study in the Marana school district in the greater Tucson area. The proposed framework is rigorous and straightforward to compare with typical infrastructure strategies. Furthermore, our study also illustrated that designing demand strategies toward targeted groups could be effective. For example, our findings indicate that the carpooling strategy may be more effective if promoted in high schools rather than primary schools.

The findings provide insights into how much travel time value could be accomplished if the school carpooling program was operated throughout the city or county. This type of analysis could be used to plan for the program cost of the school pool program. It is noteworthy that the study focuses on demonstrating the overall methodology and approach with a real-world case study. The County-wide analysis was an approximation aiming for a ballpark estimate. To lead to County-wide policy decisions, a County-wide analysis including all the schools should be carried out in future studies.
VII. ACKNOWLEDGMENT
The authors are grateful for financial support from the Pima County Departure of Transportation for this study. The viewpoints expressed in this study are solely the authors’ and do not represent the opinions or viewpoints of Pima County.
REFERENCES
Abutaleb, Soha, Noha El-Bassiouny, and Sara Hamed. 2020. "Sharing Rides and Strides toward Sustainability: An
Investigation of Carpooling in an Emerging Market." Management of Environmental Quality: An International
Journal 32 (1): 4–19. https://doi.org/10.1108/MEQ-02-2020-0031.
Amaral, Darlene. 2019. "511 Contra Costa High School Carpool to School Program." San Ramon.
Athira, I. C., C. P. Muneera, K. Krishnamurthy, and M. VLR Anjaneyulu. 2016. "Estimation of Value of Travel Time for
Work Trips." In Transportation Research Procedia. https://doi.org/10.1016/j.trpro.2016.11.067.
Bachmann, Friedel, Anina Hanimann, Jürg Artho, and Klaus Jonas. 2018. "What Drives People to Carpool? Explaining
Carpooling Intention from the Perspectives of Carpooling Passengers and Drivers." Transportation Research Part F:
Traffic Psychology and Behaviour. https://doi.org/10.1016/j.trf.2018.08.022.
Bento, Antonio M., Jonathan E. Hughes, and Daniel Kaffine. 2013. "Carpooling and Driver Responses to Fuel Price Changes:
Evidence from Traffic Flows in Los Angeles." Journal of Urban Economics.
https://doi.org/10.1016/j.jue.2013.03.002.
Bilali, Aledia, Florian Dandl, Ulrich Fastenrath, and Klaus Bogenberger. 2019. "An Analytical Model for On-Demand Ride
Sharing to Evaluate the Impact of Reservation, Detour and Maximum Waiting Time." In 2019 IEEE Intelligent
Transportation Systems Conference, ITSC 2019. https://doi.org/10.1109/ITSC.2019.8917280.
Bischoff, Joschka, Michal Maciejewsk, and Kai Nagel. 2018. "City-Wide Shared Taxis: A Simulation Study in Berlin." In
IEEE Conference on Intelligent Transportation Systems, Proceedings, ITSC.
https://doi.org/10.1109/ITSC.2017.8317926.
"Carpool Software for Schools |The Best School Carpool Program That Works - GoKid ConnectGoKid." n.d. Accessed March
21, 2021. https://www.gokid.mobi/school-carpool-program/.
"Carpool to School – Success Academy South Bend." n.d. Accessed February 20, 2020.
https://successacademysb.com/parents/carpool-to-school/.
Chen, Tzu-Ying, Rong-Chang Jou, and Yi-Chang Chiu. 2021. "Using the Multilevel Random Effect Model to Analyze the
Behavior of Carpool Users in Different Cities." Sustainability 13 (2): 937. https://doi.org/10.3390/su13020937.
Concas, Sisinnio, and Philip L. Winters. 2007. "Impact of Carpooling on Trip-Chaining Behavior and Emission Reductions."
Transportation Research Record. https://doi.org/10.3141/2010-10.
Dakroub, Oussama, Carl Michael Boukhater, Fayez Lahoud, Mariette Awad, and Hassan Artail. 2013. "An Intelligent
Carpooling App for a Green Social Solution to Traffic and Parking Congestions." In IEEE Conference on Intelligent
Transportation Systems, Proceedings, ITSC. https://doi.org/10.1109/ITSC.2013.6728586.
Denver Region Schoolpool program. 2017. "Survey of WAY TO GO Schoolpool Families 2017." Denver Region.
Dubernet, Thibaut, Nadine Rieser-Schüssler, and Kay W. Axhausen. 2013. "Using a Multi-Agent Simulation Tool to Estimate
the Car-Pooling Potential." 92nd Annual Meeting of the Transportation Research Board.
Dynamic Traffic Assignment: A Primer. 2011. Dynamic Traffic Assignment: A Primer. https://doi.org/10.17226/22872.
“DynusT.” n.d. www.dynust.cm.
Eboli, Laura, and Gabriella Mazzulla. 2009. "An Ordinal Logistic Regression Model for Analysing Airport Passenger
Satisfaction." EuroMed Journal of Business. https://doi.org/10.1108/14502190910956684.
Engelhardt, Roman, Florian Dandl, Aledia Bilali, and Klaus Bogenberger. 2019. "Quantifying the Benefits of Autonomous
On-Demand Ride-Pooling: A Simulation Study for Munich, Germany." In 2019 IEEE Intelligent Transportation
Systems Conference, ITSC 2019. https://doi.org/10.1109/ITSC.2019.8916955.
Erdem, Cumhur, Ismail Şentürk, and Türker Şimşek. 2010. "Identifying the Factors Affecting the Willingness to Pay for Fuel-
Efficient Vehicles in Turkey: A Case of Hybrids." Energy Policy. https://doi.org/10.1016/j.enpol.2010.01.043.
Ferguson, Erik. 1995. "Demographics of Carpooling." Transportation Research Record.
"GoKid Connect Frequently Asked QuestionsGoKid." n.d. Accessed February 20, 2020. https://www.gokid.mobi/gokid-
connect-faqs/.
Herrera, Carlos. 2017. "‘School Pool’ Eases Marana School Traffic.” 2017.
“Home | Way to Go.” n.d. Accessed March 21, 2021. https://waytogo.org/.
Hulstrom K-8. n.d. “Hulstrom K-8 | Get To School.” Northglenn.
Israel, Gleen D. 1992. “Determining Sample Size Degree Of Variability.” The University of Florida.
Johanson, Mark. n.d. “Why Our Reliance on Cars Could Start Booming.” Accessed March 21, 2021.
https://www.bbc.com/worklife/article/20201202-why-our-reliance-on-cars-could-start-booming.
Kuntzky, K., S. Wittke, and C. Herrmann. 2013. “Car and Ride Sharing Concept as a Product Service System – Simulation as
a Tool to Reduce Environmental Impacts.” In The Philosopher’s Stone for Sustainability.
https://doi.org/10.1007/978-3-642-32847-3_64.
Lees-Miller, John, John Hammersley, and Nick Davenport. 2009. “Ride Sharing in Personal Rapid Transit Capacity
Planning.” In Proceedings of the International Conference on Automated People Movers.
https://doi.org/10.1061/41038(343)27.
Linares, M. Paz, Lídia Montero, Jaume Barceló, and Carlos Carmona. 2016. “A Simulation Framework for Real-Time
Assessment of Dynamic Ride Sharing Demand Responsive Transportation Models.” In Proceedings - Winter
Simulation Conference. https://doi.org/10.1109/WSC.2016.7822263.
“Managed Carpooling.” n.d. Metropia. Accessed March 21, 2021. https://www.metropia.com/managed-carpooling.
“Managed Carpooling - A Smarter Approach to Carpool Adoption.” n.d. https://www.metropia.com/managed-carpooling.
Minett, Paul, and John Pearce. 2011. “Estimating the Energy Consumption Impact of Casual Carpooling.” Energies.
https://doi.org/10.3390/en4010126.
Neoh, Jun Guan, Maxwell Chipulu, and Alasdair Marshall. 2017. “What Encourages People to Carpool? An Evaluation of
Factors with Meta-Analysis.” Transportation. https://doi.org/10.1007/s11116-015-9661-7.
Olsson, Lars E., Raphaela Maier, and Margareta Friman. 2019. “Why Do They Ride with Others? Meta-Analysis of Factors
Influencing Travelers to Carpool.” Sustainability 11 (8): 2414. https://doi.org/10.3390/su11082414.
“Post-Pandemic Traffic Jams: What They Might Mean for Tech, Media, and Telecom.” n.d. Deloitte Canada. Accessed March
21, 2021. https://www2.deloitte.com/ca/en/pages/technology-media-and-telecommunications/articles/post-pandemic-
traffic-jams.html.
Richter, Emely, Markus Friedrich, Alexander Migl, and Johann Hartleb. 2019. “Integrating Ridesharing Services with
Automated Vehicles into Macroscopic Travel Demand Models.” In MT-ITS 2019 - 6th International Conference on
Models and Technologies for Intelligent Transportation Systems. https://doi.org/10.1109/MTITS.2019.8883315.
Rodier, Caroline, Farzad Alemi, and Dylan Smith. 2016. “Dynamic Ridesharing: Exploration of Potential for Reduction in
Vehicle Miles Traveled.” Transportation Research Record. https://doi.org/10.3141/2542-15.
Sasidharan, Lekshmi, and Mónica Menéndez. 2014. “Partial Proportional Odds Model - An Alternate Choice for Analyzing
Pedestrian Crash Injury Severities.” Accident Analysis and Prevention. https://doi.org/10.1016/j.aap.2014.07.025.
Wang, Ding, Brian Yueshuai He, Jingqin Gao, Joseph Y. J. Chow, Kaan Ozbay, and Shri Iyer. 2021. “Impact of COVID-19
Behavioral Inertia on Reopening Strategies for New York City Transit.” ArXiv:2006.13368 [Physics, q-Fin],
February. http://arxiv.org/abs/2006.13368.
Wang, Yazhe, Baihua Zheng, and Ee Peng Lim. 2018. “Understanding the Effects of Taxi Ride-Sharing — A Case Study of
Singapore.” Computers, Environment and Urban Systems. https://doi.org/10.1016/j.compenvurbsys.2018.01.006.
Zhang, Yizhou, Erik Jenelius, and Karl Kottenhoff. 2017. “Impact of Real-Time Crowding Information: A Stockholm Metro
Pilot Study.” Public Transport 9 (3): 483–99. https://doi.org/10.1007/s12469-016-0150-y.
Zhu, Ming, Xiao Yang Liu, and Xiaodong Wang. 2019. “An Online Ride-Sharing Path-Planning Strategy for Public Vehicle
Systems.” IEEE Transactions on Intelligent Transportation Systems. https://doi.org/10.1109/TITS.2018.2821003.
“Zum Carpool Service - De La Salle High School.” n.d. Accessed February 20, 2020. https://www.dlshs.org/academic-
life/parents/zum-carpool-service.
Copyright © 2022 FDOKUMEN