Mapping Competitive Position
12
110 Harvard Business Review | November 2007 | hbr.org A simple chart shows how much a customer will pay for a perceived benefit. This is more than a marketing aid, it’s a powerful tool for competitive strategy. by Richard A. D’Aveni IGHT WEEKS. That’s all that separated the launch of Apple’s revolutionary iPhone, on June 29, 2007, and Motorola’s next- generation Razr 2 (pronounced Razr Squared) cellular telephone, on August 24. Before unveiling the successor to the Razr, which PC World magazine in 2005 ranked 12th on a list of the 50 greatest gadgets of the past 50 years, Motorola’s top management team was more worried than usual. With sales of the American communica- tion giant’s other cellular telephones tapering off, the company’s fate rested squarely on the Razr 2 . Moreover, senior executives like chair- man and CEO Edward J. Zander wondered if the iPhone had changed E Mapping Competitive Position YOUR Ian Whadcock
Transcript of Mapping Competitive Position

110 Harvard Business Review | November 2007 | hbr.org
A simple chart shows how much a customer will pay for a perceived benefi t. This is more than a marketing aid, it’s a powerful tool for competitive strategy. by Richard A. D’Aveni
IGHT WEEKS. That’s all that separated the launch of Apple’s
revolutionary iPhone, on June 29, 2007, and Motorola’s next-
generation Razr2 (pronounced Razr Squared) cellular telephone,
on August 24. Before unveiling the successor to the Razr, which
PC World magazine in 2005 ranked 12th on a list of the 50 greatest
gadgets of the past 50 years, Motorola’s top management team was
more worried than usual. With sales of the American communica-
tion giant’s other cellular telephones tapering off, the company’s fate
rested squarely on the Razr2. Moreover, senior executives like chair-
man and CEO Edward J. Zander wondered if the iPhone had changed
E
Mapping Competitive Position
YOU R Ia
n W
hadc
ock
1657 DAveni.indd 1101657 DAveni.indd 110 10/5/07 7:26:50 PM10/5/07 7:26:50 PM

hbr.org | November 2007 | Harvard Business Review 111
1657 DAveni.indd 1111657 DAveni.indd 111 10/5/07 7:27:06 PM10/5/07 7:27:06 PM

the competitive dynamics of the market in ways they hadn’t
foreseen. Had the iPhone created a new niche or would it
take the Razr2 head-on? How much extra could they charge
for the Razr2’s new features? Should Motorola play up the
Razr2’s noise-fi ltering technology, which it had patented?
The executives couldn’t wait for the results of focus group
sessions or sample surveys. They needed a fast, yet reliable
way of capturing changes that were emerging in the market
so they could fi nalize strategy quickly.
Like Motorola, most companies have to build fresh com-
petitive advantages and destroy others’ advantages faster
than they used to. As innovation pervades the value chain,
they must migrate quickly from one competitive position
to another, creating new ones, depreciating old ones, and
matching rivals’. The process is disorderly and unstable. Se-
nior executives desperately need new tools to help them sys-
tematically analyze their own and other players’ competitive
positions in hypercompetitive markets.
One way to do that is to track the relationship between
prices and a product’s key benefi t over time. However, it isn’t
easy to come to grips with either benefi ts or prices. Most
customers are unable to identify the features that determine
the prices they are willing to pay for products or services,
according to a 2004 survey by Strativity, a global research
and consulting fi rm. Worse, 50% of salespeople don’t know
what attributes justify the prices of the products and services
they sell.
If customers don’t know what they’re paying for, and man-
agers don’t know what they’re charging for, it’s almost impos-
sible for companies to identify their competitive positions.
Whenever I’ve asked senior executives to map the positions
of their company’s brands and those of key rivals, we end
up confused and dismayed. Different executives place their
fi rm’s offerings in different spots on a price-benefi t map; few
know the primary benefi t their product offers; and they all
overestimate the benefi ts of their own offerings while under-
estimating those of rivals. The lack of understanding about
competitive positions is palpable in industries such as con-
sumer electronics, where the number of features makes com-
parisons complicated; in markets like computer hardware,
where technologies and strategies change all the time; and
when products, such as insurance policies, are intangible.
Seven years ago, I came up with a way companies could
capture competitive positions graphically to serve as the ba-
sis for strategy discussions. Drawn by using simple statistical
analysis, a price-benefi t positioning map provides insights
into the relationship between prices and benefi ts, and tracks
how competitive positions change over time. Executives can
use the tool to benchmark themselves against rivals, dissect
competitors’ strategies, and forecast a market’s future, as
we shall see in the following pages. By creating an accurate
map of the competitive landscape, companies can also get
everyone in the organization on the same page. During my
consulting and research work, I have applied this tool in
more than 30 industries, including automobiles, advanced
materials, artifi cial sweeteners, cellular telephones, restau-
rants, retailing, turbines, tires, motorcycles, and ships. Let me
show you how to create and read a positioning map.
Drawing Positioning MapsIn its simplest form, a price-benefi t positioning map shows
the relationship between the primary benefi t that a product
provides to customers and the prices of all the products in a
given market. Creating such a map involves three steps.
Defi ne the market. To draw a meaningful map, you must
specify the boundaries of the market in which you’re inter-
ested. First, identify the consumer needs you wish to under-
stand. You should cast a wide net for products and services
that satisfy those needs, so you aren’t blindsided by fresh en-
trants, new technologies, or unusual offerings that take care
of those needs. Second, choose the country or region you
wish to study. It’s best to limit the geographic scope of the
analysis if customers, competitors, or the way products are
used differ widely across borders. Finally, decide if you want
to track the entire market for a product or only a specifi c seg-
ment, if you wish to explore the retail or wholesale market,
and if you’re going to track products or brands. You can cre-
ate different maps by changing these frames of analysis.
Choose the price and determine the primary benefi t. Once you’ve defi ned the market, you need to specify the
scope of your analysis of prices. You have implicitly decided
Richard A. D’Aveni ([email protected]) is the Pro-
fessor of Strategic Management at Dartmouth College’s Tuck School
of Business in Hanover, New Hampshire. He is the author of three
books, including Hypercompetition (Free Press, 1994).
Mapping Your Competitive Position
112 Harvard Business Review | November 2007 | hbr.org
Whenever I’ve asked senior executives to map the positions of their company’s brands and those of key rivals, we end up confused and dismayed.
1657 DAveni.indd 1121657 DAveni.indd 112 10/5/07 7:27:14 PM10/5/07 7:27:14 PM
whether to study retail or wholesale prices when you chose
which market to focus on, but you must also consider other
pricing parameters. You must choose whether to compare
initial prices or prices that include life cycle costs, prices
with transaction costs or without them, and the prices of
unbundled or bundled offers. These choices depend on the
yardstick that customers use in making purchasing decisions
in the market under study. Remember to be consistent about
the price defi nition you use while gathering data.
Identifying the primary benefi t – the benefi t that explains
the largest amount of variance in prices – can be complicated.
A product offers several benefi ts: basic functions, additional
features, durability, serviceability, aesthetics, ease of use, and
so on. Besides, companies usually differentiate products by
focusing on a different benefi t than competitors do.
However, the success of strategies depends on the
value that customers, not companies, place on fea-
tures. To determine that value, you must fi rst draw
up a list of the benefi ts offered by all the different
products or brands in the market and gather data
on how customers perceive those benefi ts.
You should use unbiased data, rather than rely
on gut instinct or top managers’ opinions, so that
you estimate the benefi ts’ value correctly. There are
more sources of hard data today than ever before.
You can draw on the product ratings of indepen-
dent organizations, such as Consumers Union, J.D.
Power, and Edmunds, as well as on government
agencies, like the U.S. Environmental Protection
Agency and the U.S. National Highway Traffi c Safety
Administration. Consumer guides, such as Zagat
and Michelin; websites, such as Trip Advisor and
the Tire Rack; and trade publications, like Ward’s
AutoWorld, also provide information on products
and services. Industrial catalogs publish detailed
product specifi cations, especially for high-tech and
industrial goods. Distributors often collect details
about product benefi ts. For example, vehicle deal-
ers gather warranty information to track how reli-
able automobiles are. Your own R&D department
probably tracks scientifi c data: Consumer electron-
ics manufacturers, for instance, collect information
on audio and video systems’ reproduction quality.
Once you’ve gathered data on products’ bene-
fi ts and prices, employ regression analysis to fi nd
out which benefi t explains most of the variance in
products’ prices. Using regression analysis is more
reliable than asking people how much they are
willing to pay for each feature because consumers
often can’t explain how they make their choices
and they often don’t do what they say.
Regression analysis examines the relationship
between a dependent variable (in this case, price)
and several independent variables (product benefi ts) and
creates a mathematical model of that relationship called the
regression equation (in this case, the price-benefi t equation).
Many software packages – Excel, SAS Analytics, and SPSS
15.0 for Windows, for instance – allow executives to perform
regression analyses. When the software fi nds the regression
equation, it will also yield an incremental r-square statistic
for each independent variable. That statistic shows the ex-
tent to which each benefi t contributes to the differences in
the prices of competing offerings while controlling for the
impact of all other benefi ts. The benefi t with the highest
incremental r-square accounts for more of the variation in
prices than the other benefi ts, so it’s the most important
driver of price. If several benefi ts correlate with one another,
hbr.org | November 2007 | Harvard Business Review 113
1657 DAveni.indd 1131657 DAveni.indd 113 10/5/07 7:27:21 PM10/5/07 7:27:21 PM

that suggests they jointly infl uence price differences. In such
cases, you can combine them into a single benefi t by creat-
ing an index or a scale – a common practice in marketing
research.
Plot positions and draw the expected-price line. When
you have identifi ed the primary benefi t, you are ready to
draw a positioning map by plotting the position of every
company’s product (or brand) in the marketplace according
to its price and its level of primary benefi t. Such positioning
maps may be an oversimplifi cation, but they show the rela-
tive positions of competitors on a common scale.
Finally, you must draw the expected-price line – that is,
the line that best fi ts the points on the map. The line shows
how much customers expect to pay on average to get dif-
ferent levels of the primary benefi t. In addition, the line’s
slope tells us how much more a customer is likely to pay for
a higher level of the primary benefi t. You can fi nd the line
that best fi ts the data by taking the slope associated with the
portion of the price-benefi t equation that links the primary
benefi t to prices. Or you can look at the map and draw a
line that runs roughly through the middle of the cloud of
points; in other words, half the points should lie above the
line and half should lie below. Research shows that in almost
all industries, a straight line that rises to the right fi ts the
data best. Curved lines and negatively sloped lines are pos-
sibilities in theory, but they describe short-lived phenomena.
Markets tend to converge on the same price for each benefi t,
and people tend to pay more for a higher level of benefi t, so
those trends create a straight line with a positive slope.
Products lie on either side of the line not by accident
but because of companies’ strategies. Enterprises position a
product or brand above the line to maximize profi ts, which
they can do by simply raising the price in the short run.
They can also do so by enticing customers to pay a higher
price for desirable secondary benefi ts. Companies can slot
their offerings below the line to maximize market share
by simply charging less than expected, or they may drop
some secondary benefi ts to attract price-sensitive customers.
Sometimes, a product’s secondary attributes may actually
reduce its price below what people would usually pay for
that level of benefi t. For example, if a calorie-free sweetener
leaves an aftertaste, people will pay less for the same level
of dieting benefi t the sweetener gives them.
Thus, deviations in price above or below
the line are caused by the added or reduced
value associated with secondary benefi ts or
pricing strategies designed to milk or build
market share.
Let me illustrate the process and pur-
poses of drawing a positioning map by
returning for a moment to the challenges
that Motorola faced in launching the Razr2.
In early June 2007, my research assistant
and I spent a week collecting data from
public sources on 40 “unlocked” cellular
telephones, which work with the calling
plans of many U.S. cellular service provid-
ers. We also gathered all the data we could
fi nd on the iPhone. We drew up a list of
the phones’ features, consumer ratings of
those features, and retail prices. A regres-
sion analysis showed that advanced func-
tionality accounted for most of the differ-
ence in the prices of cellular telephones. By
advanced functionality, I mean high-tech
features like the ability to play music in the
MP3 format and to snap high-resolution
photographs, the presence of sophisticated
e-mail software, and a QWERTY keyboard.
Advanced functionality accounted for 68%
of the variation in prices, and according to
my analysis customers paid on average $28
more for each advanced feature in a cellular
telephone.
Mapping Your Competitive Position
Expected-price line
Primary benefit: advanced functionality
Price
ULTRA-PREMIUM
PRICEYPREMIUM
MID-RANGE
BASIC
ULTRA-LOW
MOTOROLA V325
MOTOROLA V195 MOTOROLA V360
MOTOROLA SLVR L7
MOTOROLA Q
MOTOROLA RAZR V3c
LG CG300
PALM TREO 700p
SAMSUNG A800
SAMSUNG A990
NOKIA N80
iPHONE (June)
iPHONE (Sept.)
MOTOROLA L2
SUPER-PREMIUM
LG VX9800
Mapping the Cell Phone Market
Plotting prices against the primary benefi t products offer in a market makes it easy to see how that market looks to customers. This price-benefi t positioning map suggests there were fi ve segments in the U.S. cellular telephone market when Apple launched the iPhone in June 2007, carving out a new ultrapremium niche. That was short-lived though, as Apple quickly dropped the price by $200 in September. The move, which might have been anticipated in view of Apple’s iPod strategy, clearly puts pressure on many players in the superpremium segment.
114 Harvard Business Review | November 2007 | hbr.org
1657 DAveni.indd 1141657 DAveni.indd 114 10/5/07 7:27:27 PM10/5/07 7:27:27 PM
Two other benefi ts contributed to price differences, al-
beit to a lesser degree: display quality (color, high-resolution
screens, and touch screens) and advanced connectivity (Blue-
tooth, 3G, and Wi-Fi technologies). These three benefi ts to-
gether accounted for 80.5% of the difference in the prices of
handsets. Contrary to the popular perception that battery
life and the clarity of sound while making and receiving
calls matter to consumers, I found that competition had re-
duced those to hygiene factors (indicated by the fact that
their r-square values were extremely low). Although Mo-
torola has patented a technology that fi lters out background
noise from conversations, the results suggested the company
should think twice before emphasizing that as one of the
Razr2’s main benefi ts.
When I mapped the competitive positions that various
products occupied in the marketplace and drew the expected-
price line, I found fi ve clusters of mobile phones (see the
exhibit “Mapping the Cell Phone Market”). Motorola had
wisely spread its bets, positioning products in four of the fi ve
groups. Like all the other cellular telephone manufacturers,
it had no product in the ultrapremium segment that the
iPhone seems to be pioneering, but it had
positioned products on both sides of the
expected-price line. For example, in the mid-
range group, the Razr V3c was almost ex-
actly on the line, whereas the Razr SLVR L7
and Razr V360 were below it. Sony Erics-
son, Samsung, and LG had also positioned
devices below the line, which suggested
that the segment was becoming crowded
and prices would soon go into freefall. The
LG VX9800 had positioned itself above the
line, because of the added pricing power of
its superb color display.
Clearly, the iPhone will have a major im-
pact on the superpremium segment; Mo-
torola’s Q, for example, will be outclassed.
While some customers are likely to post-
pone purchases of cellular telephones until
they can afford the iPhone, it is unlikely
to have an impact on the rest of the mar-
ket – initially. However, Motorola will face
a stiff challenge because Apple is deploying
its iPod strategy in the cellular telephone
market.
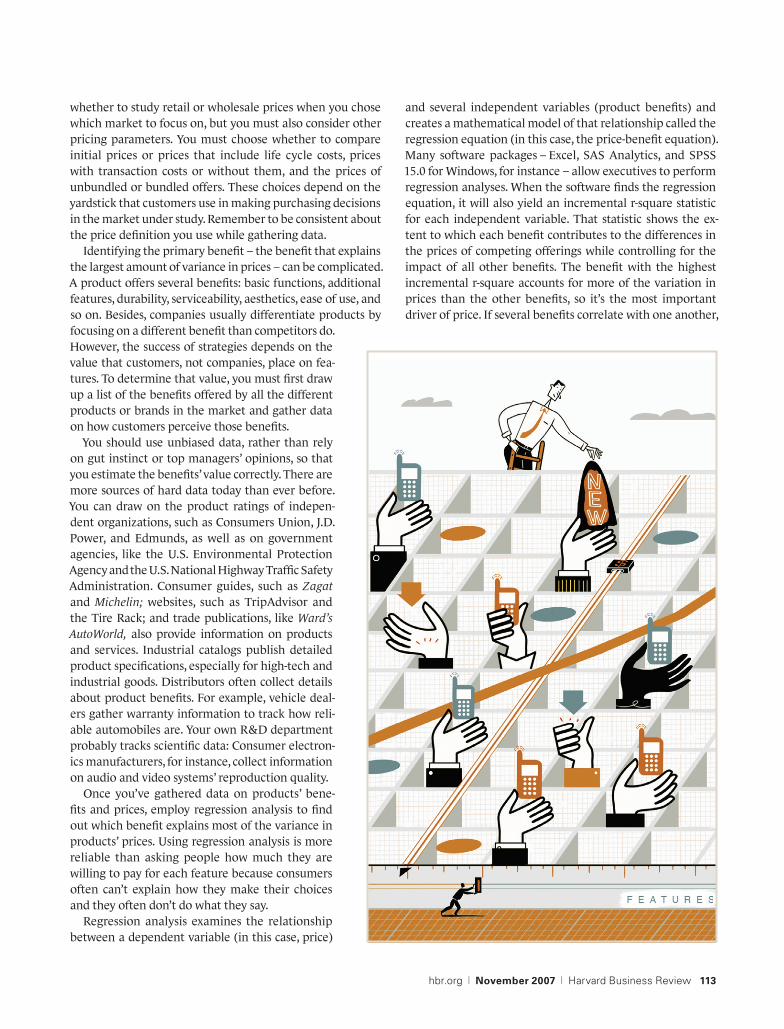
In the market for downloadable-music
players, Apple started in a high-price, high-
benefi ts position but rapidly moved down
and to the right by lowering the price for
the same primary benefi t (see the exhibit
“How Apple Set the Pace with the iPod”). In
like vein, the company slashed the price of
the iPhone by 33% in early September, two
months after its launch. If Apple continues to use the same
strategy, the iPhone will move quickly from the ultrapre-
mium to a midrange position. The Razr2 will then become a
basic phone because it doesn’t offer the iPhone’s advanced
functions.
Apple also created a full line of iPod products, making
it tough for rivals to fi nd uncontested spaces. If it does the
same with the iPhone, Motorola will soon have to contend
with a line of iPhones that will match Motorola’s full line of
Razrs. Motorola would do well, in that case, to push those
of the Razr2’s advanced functions that consumers value
most, rather than add more secondary features. For instance,
having a haptic touch screen on the Razr2 is a novel benefi t.
Do customers want it? Perhaps – but it comes second to the
advanced functionality they are more willing to pay for.
Interpreting Positioning MapsPositioning maps help companies penetrate the fog that
shrouds the competitive landscape. They can pinpoint the
benefi ts that customers value, locate unoccupied or less com-
petitive spaces, identify opportunities created by changes in
Primary benefit: functionality
Price
10/01iPodlaunch
7/02iPod becomes compatible with IBM PCs
4/03iTunes Storeopens online
10/03iTunes Store becomesPC compatible
1/04Apple respondsto entries by Sony, Dell, and Creative
10/04iPod Photointroduced
2/05
10GB 20GB
5GB 10GB
5GB
30GB
15GB
10GB
40GB
20GB
10GB
40GB PHOTO 40GBPHOTO 60GB
PHOTO 40GB20GB
15GB
MINI 4GB MINI 6GB
PHOTO 30GB
20GB
MINI 4GB
SHUFFLE 1GB
SHUFFLE 512MB
PHOTO 60GB
How Apple Set the Pace with the iPod
Plotting price against the primary benefi t over time for a product line can make shifts in market strategy clear. In this example, Apple has stayed ahead in the MP3-player market since October 2001 by giving customers more functionality and additional storage capacity at ever lower prices. That has made it tough for competitors like Sony, Dell, and Creative to gain toeholds.
hbr.org | November 2007 | Harvard Business Review 115
1657 DAveni.indd 1151657 DAveni.indd 115 10/5/07 7:27:34 PM10/5/07 7:27:34 PM

the relationship between the primary benefi t and prices, and
allow companies to anticipate rivals’ strategies. When inter-
preted within the context of industry and customer knowl-
edge, they help explain why some enterprises’ products and
brands perform better than others do.
Valuing intangible benefi ts. Many companies, especially
in industrial markets, seek to retain customers by offering
intangible benefi ts. To that end, they spend a great deal of
money to offer supplementary services without knowing if
customers want them enough to pay for them. This often
proves to be a drain on corporate resources. Companies can
avoid the problem by calculating the premiums they earn for
intangible secondary benefi ts.
That was driven home to me when my colleagues and I
conducted an analysis of the U.S. motorcycle market. Ac-
cording to a regression analysis, in the early 2000s, variations
in engine power, as measured by displacement, explained
much of the difference in motorcycle prices. Yet a position-
ing map showed that, in 2002, most of Harley-Davidson’s
models earned large premiums compared with rival prod-
ucts. Customers paid 38% more, on average, for Harleys than
they did for motorbikes from Honda, Yamaha, Kawasaki, and
Suzuki, even though the Japanese Big Four offered 8% to
12% more engine power. Because we had accounted for the
impact on prices of all physical features and attributes, we
concluded that the premium was most probably the result of
the intangible secondary benefi ts the company offered, such
as the image created by membership in the Harley Owners
Group (HOG) and apparel from Harley-Davidson’s Motor-
Clothes. These benefi ts had helped Harley-Davidson create
the impression that its customers were rebels, that they en-
joyed an adventurous lifestyle, and that they belonged to
a macho club. Harleys had attained cult status, especially
among the baby boomer generation.
However, the 2004 positioning map revealed a differ-
ent picture. The price of a Harley was still higher than that
of equivalent Japanese motorbikes, but it no longer com-
manded the highest premiums in the market. New Ameri-
can rivals, such as Victory and Big Dog, earned a 41% pre-
mium over Harley-Davidson for the same level of engine
capacity. The market leader was leaving money on the table,
possibly because its image no longer appealed to custom-
ers. We hypothesized that both Generation X and Genera-
tion Y consumers were seeing the Harley as their father’s
motorbike and that many women hated its bad-boy image.
Victory and Big Dog had capitalized on the desire for a
“New American Bike” as opposed to Harley-Davidson’s “Easy
Rider” image, which the Harley Owners Group and Harley’s
MotorClothes helped maintain. The newcomers’ highly cus-
tomized products were trumping Harleys because riding a
motorcycle had changed from being an act of rebellion to
one of self-expression.
The 2004 analysis was an early indicator that Harley-
Davidson was in trouble, despite the fact that industry ex-
perts insisted it would remain dominant owing to its his-
tory and market share. As it turned out, by 2006, Harley-
Davidson recognized the need to create a new image for its
products, saying in its annual report: “We’ve embarked on a
full range of marketing outreach activities, new events, and
new strategies to connect with emerging customer segments.
Through these efforts, we welcome more and more African-
Americans, Hispanics, women, and younger riders into the
family every year.” These initiatives included ladies-only “ga-
rage parties”; a line of women’s jackets in pink, blue, red, and
other bright colors; and motorbikes with lower seats to ac-
commodate customers with smaller builds. Harley-Davidson
is also using its new Buell line to reach out to younger riders
who want to have fun rather than portray a macho image.
Still, Harley-Davidson’s stock price fl oundered between 2005
and 2007, rising only recently on rumors that Honda is try-
ing to acquire it!
Anticipating shifts in the value of benefi ts. Companies
can employ the price-benefi t equation to get ahead of rivals
in markets where consumers keep demanding different
benefi ts. Once they have identifi ed what benefi ts appeal to
customers, executives can use the equation to decide which
features to develop, at what cost, and how soon they must
create the next differentiator.
Take the case of a major U.S. hotel chain that in 2000
wanted to know what new restaurants it should open in its
New York City hotels, which ones it should reformat, and
how it could earn more from them all. The food business is
notoriously fi ckle, so I decided to conduct a three-year his-
torical analysis of the 1,700 restaurants in the city on which
Zagat, the restaurant guide, had data. The eateries served ev-
ery possible cuisine, from pizza to French haute cuisine, and
Mapping Your Competitive Position
116 Harvard Business Review | November 2007 | hbr.org
“Customer experience” – a combination of decor, taste of food, and service – accounted for 73% of the price variation at NYC restaurants; cuisine accounted for 3.5%, location just 2.5%.
1657 DAveni.indd 1161657 DAveni.indd 116 10/5/07 7:27:39 PM10/5/07 7:27:39 PM

hbr.org | November 2007 | Harvard Business Review 117
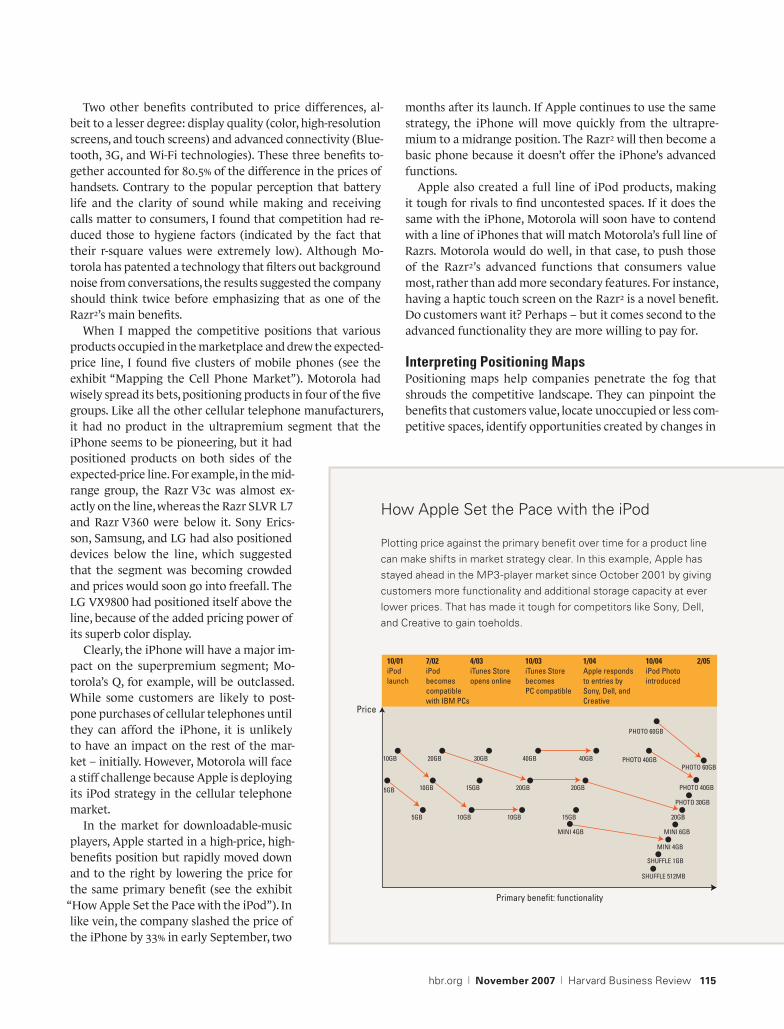
Finding Opportunity in the Crowded Midsize-Car Market
Adding more data to a price-benefi t map can make it easier to spot opportunities to reposition products. In this case, including indicators of sales growth and decline, best-sellers, and with-drawn models revealed subsegments of the midsize-car market in which competition was less intense and were therefore good opportunities to pursue.
Primary benefit: 1993 platform
1993 base price
Expected-price line
Audi A6 ++
Audi 90
BMW 3 +
Chrysler Imperial *
Infiniti J30 -Volvo 800 ++
Acura Legend - -Lexus ES 300 +
Mazda 929 - -Saab 9000 -Volvo 900 -
Buick Century -Buick Skylark -Ford Topaz ++
Honda Accord
Mazda 626 +
Mitsubishi Galant ++
Nissan AltimaOldsmobile Achieva -
Infiniti G20
Mercedes 190 *
Volvo 240 *
Chevrolet Corsica/Beretta +Dodge Colt +
Plymouth Acclaim - -
Pontiac Sunbird - -
PRICEY HIGH-END
Acura Vigor ++
Mercury Sable - -Saab 900 ++
Subaru Legacy +
MIDDLE
Buick Regal +
Ford Taurus ++Hyundai Sonata +
Mitsubishi Diamante -
Nissan Maxima ++
Olds Cutlass Ciera -Olds Cutlass Supreme
Toyota Camry ++
BARGAIN MIDRANGE
BASIC
PRICEY LOW-END
BARGAIN LOW-END
PREMIUM
In 1993, as the dotted ovals show, three subsegments of the U.S. midsize-car market – pricey low-end, bargain low-end, and premium – were relatively less competitive than the others.
Primary benefit: 1999 platform
1999 base price
Priceymidrange?
Bargainhigh-end?
Expected-price line
PRICEY LOW-ENDPRICEY HIGH-END
MIDDLEPREMIUM
BARGAIN MIDRANGE
BARGAIN LOW-END
BASIC
Acura CL ++
Audi A4 ++
BMW 3 ++
Chrysler Sebring - -
Infiniti G20
Mazda Millenia +
Mazda 626 +
Mercury Mystique -Nissan Altima +Plymouth Breeze - -
Chrysler Cirrus
Toyota Camry +VW Passat +
Saab 9-3 ++
Acura Vigor ++
Mitsubishi Diamante -Nissan Maxima +Volvo 70 ++
Buick Century ++Buick Regal ++
Ford TaurusMercury Sable -Olds Intrigue ++Olds Cutlass Supreme +
Chevy Malibu ++Daewoo Leganza
Dodge Stratus -
Ford Contour -Honda Accord +Hyundai Sonata ++
Subaru Legacy -
Audi A6 ++
Infiniti I30
Lexus ES 300 - -
Saab 9-5 ++
Automakers quickly slotted more products into those niches, and by 1999, all three had become crowded. Even the middle subsegment re-mained competitive owing to the overwhelming dominance of the Toyota Camry.
KEY+ = annual unit sales rose 3% to 10%
++ = annual unit sales rose more than 10%
- = annual unit sales fell 3% to 10%
- - = annual unit sales fell more than 10%
bold = more than 100,000 units sold in year
* = model withdrawn from market in year
= segments of lower competitive intensity
1657 DAveni.indd 1171657 DAveni.indd 117 10/5/07 7:27:44 PM10/5/07 7:27:44 PM

Mapping Your Competitive Position
118 Harvard Business Review | November 2007 | hbr.org
they were located in all the city’s boroughs. The restaurants
in the analysis ranged from Gray’s Papaya, which featured
a $2 two-dogs-and-a-tropical-drink special, to Le Bernardin’s
seafood, which set a customer back $75, on average, for din-
ner and a drink in 1998.
The analysis revealed that from the beginning of 1998
through the end of 2000, the primary driver of variations in
food prices wasn’t restaurants’ locations or the type of cui-
sine, as one might expect. It was a composite factor I called
“customer experience” – the extent to which the decor, the
taste of the food, and the service satisfi ed customers. That
explained 73% of the variation in prices, whereas cuisine
accounted for a mere 3.5% and location just 2.5%. Other fea-
tures, such as outdoor tables and dancing, were each respon-
sible for only 1% of the differences in price.
The longitudinal study helped identify several trends and
strategies. Initially, locating a restaurant in a hotel added
between $2 and $3.60 to the price that could be charged for
each meal, but that amount declined signifi cantly between
1998 and 2000. This suggested the hotel chain would do
better if it placed restaurants outside its properties, with
an entrance from the lobby. Restaurants with dance fl oors
charged $4.50 to $7.25 more for a meal and saw their pricing
power rise over the three years. That was a convincing argu-
ment for adding dancing to the menu – something the W
Hotels chain, which turns its lobbies into clubs, has success-
fully done. The premium on seafood and Russian food rose
during the period while it declined for French and Japanese
cuisines, indicating that the hotel chain could earn more by
repositioning its sushi bars as seafood restaurants and set-
ting up restaurants that served Russian food.
Interestingly, the expected-price line became steeper over
the three years of the study, an indication of a more intense
demand for the primary benefi t. So it wasn’t surprising
that high-end restaurants were enjoying a rising premium
for the customer experience they offered while the pricing
power of low-end restaurants was eroding. It seemed plau-
sible that as incomes rose in the city over the period, more
people frequented upscale restaurants. Declining demand at
the low end meant that such restaurants had to offer better
deals to hold market share or to grow: For instance, a meal’s
average price in restaurants with the lowest ratings in our
sample fell from $7.20 to $5.80. The tilt in the line was good
news for restaurants in the hotel chain’s high-end proper-
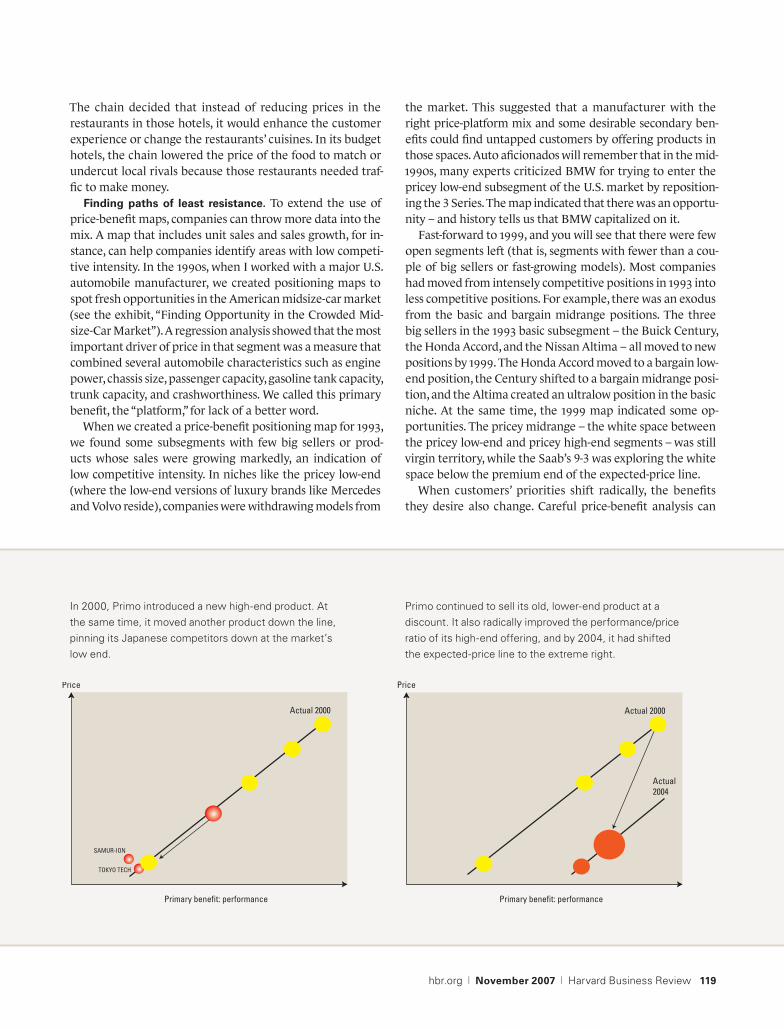
ties, but it created a dilemma for the middle-tier properties. Capturing an Evolving Strategy
Companies can use past trends to map projected future market moves. That’s what a company we’ll call Primo did to anticipate rivals in the price-sensitive market for advanced materials for electronic components.
The projection showed that archrivals “Neutryno,” “Tokyo Tech,” and “Samur-Ion” would dramatically gain market share as they boosted the performance/price ratio of their offerings. Primo’s executives were shocked.
Primary benefit: performance
Price
TOKYO TECH
NEUTRYNO
SAMUR-ION
PRIMO
Actual 1997
Projected 1999
Primary benefit: performance
Price
Actual 1997
Actual 1999
TOKYO TECH
NEUTRYNO
SAMUR-ION
PRIMO Projected 1999
In response, over the next two years, Primo moved both up and down the expected-price line, giving customers a range of options with even better performance for the price. As a result, Neutryno quit the industry.
1657 DAveni.indd 1181657 DAveni.indd 118 10/5/07 7:27:50 PM10/5/07 7:27:50 PM
hbr.org | November 2007 | Harvard Business Review 119
The chain decided that instead of reducing prices in the
restaurants in those hotels, it would enhance the customer
experience or change the restaurants’ cuisines. In its budget
hotels, the chain lowered the price of the food to match or
undercut local rivals because those restaurants needed traf-
fi c to make money.
Finding paths of least resistance. To extend the use of
price-benefi t maps, companies can throw more data into the
mix. A map that includes unit sales and sales growth, for in-
stance, can help companies identify areas with low competi-
tive intensity. In the 1990s, when I worked with a major U.S.
automobile manufacturer, we created positioning maps to
spot fresh opportunities in the American midsize-car market
(see the exhibit, “Finding Opportunity in the Crowded Mid-
size-Car Market”). A regression analysis showed that the most
important driver of price in that segment was a measure that
combined several automobile characteristics such as engine
power, chassis size, passenger capacity, gasoline tank capacity,
trunk capacity, and crashworthiness. We called this primary
benefi t, the “platform,” for lack of a better word.
When we created a price-benefi t positioning map for 1993,
we found some subsegments with few big sellers or prod-
ucts whose sales were growing markedly, an indication of
low competitive intensity. In niches like the pricey low-end
(where the low-end versions of luxury brands like Mercedes
and Volvo reside), companies were withdrawing models from
the market. This suggested that a manufacturer with the
right price-platform mix and some desirable secondary ben-
efi ts could fi nd untapped customers by offering products in
those spaces. Auto afi cionados will remember that in the mid-
1990s, many experts criticized BMW for trying to enter the
pricey low-end subsegment of the U.S. market by reposition-
ing the 3 Series. The map indicated that there was an opportu-
nity – and history tells us that BMW capitalized on it.
Fast-forward to 1999, and you will see that there were few
open segments left (that is, segments with fewer than a cou-
ple of big sellers or fast-growing models). Most companies
had moved from intensely competitive positions in 1993 into
less competitive positions. For example, there was an exodus
from the basic and bargain midrange positions. The three
big sellers in the 1993 basic subsegment – the Buick Century,
the Honda Accord, and the Nissan Altima – all moved to new
positions by 1999. The Honda Accord moved to a bargain low-
end position, the Century shifted to a bargain midrange posi-
tion, and the Altima created an ultralow position in the basic
niche. At the same time, the 1999 map indicated some op-
portunities. The pricey midrange – the white space between
the pricey low-end and pricey high-end segments – was still
virgin territory, while the Saab’s 9-3 was exploring the white
space below the premium end of the expected-price line.
When customers’ priorities shift radically, the benefi ts
they desire also change. Careful price-benefi t analysis can
In 2000, Primo introduced a new high-end product. At the same time, it moved another product down the line, pinning its Japanese competitors down at the market’s low end.
Primary benefit: performance
Price
Actual 2000
TOKYO TECH
SAMUR-ION
Primary benefit: performance
Price
Actual 2000
Actual 2004
Primo continued to sell its old, lower-end product at a discount. It also radically improved the performance/price ratio of its high-end offering, and by 2004, it had shifted the expected-price line to the extreme right.
1657 DAveni.indd 1191657 DAveni.indd 119 10/5/07 7:27:56 PM10/5/07 7:27:56 PM
Mapping Your Competitive Position
120 Harvard Business Review | November 2007 | hbr.org
provide an early warning of such a shift. For example, the
slope of the expected-price line in the midsize-car market de-
clined throughout the 1990s, implying that customers were
becoming less willing to pay for a larger platform. Instead,
our regression analyses showed, customers were starting to
pay more for safety. In 1993, customers weren’t willing to pay
very much for new safety features, but by 1999 they were
paying an extra $1,800 for each increment of improvement
in air bags and crash test performance, and an additional
$1,500 for antilock-braking systems. The rate of change in
the expected-price line’s slope suggested that the basis of
competition among midsize cars would shift by the 2000s.
Sure enough, by 2001, safety features overtook the platform
as the primary benefi t that customers looked for in midsize
cars. Due to the advance warning provided by this analysis,
the car manufacturer I worked with was able to anticipate
the shift, rather than play catch-up.
Preempting rivals. Companies can use price-benefi t maps
to predict the strategic intent of rivals and to fi nd ways of
preempting them. One method of doing that is to draw maps
based on projections of market trends. That’s what a divi-
sion of a U.S. Fortune 500 company did. The $1 billion unit,
which I’ll call Primo (the company requested anonymity),
manufactures advanced materials for high-tech component
makers in the electronics industry. When its senior managers
and I teased out the impact of each feature, we found that
the product’s primary customer benefi t was performance. At
that stage, Primo sold a high-priced product that delivered
better results than the offerings of its three major rivals,
an American company I’ll call Neutryno, and two Japanese
competitors I’ll label Tokyo Tech and Samur-Ion. In 1997,
Primo had the biggest market share, as indicated by the size
of its circle in the exhibit “Capturing an Evolving Strategy.”
But its rivals were improving quality and reducing prices. We
projected and mapped their possible trajectories, based on
the fi rms’ historic rate of improvement.
When Primo’s senior executives saw the map, they were
shocked. According to the scenario, Primo’s competitors in
this highly price-sensitive market would dominate the mar-
ket by 1999 because they would be able to offer more for
less. Primo’s executives decided to seize the initiative. They
increased R&D investment to come up with product im-
provements and process changes that would lower manufac-
turing costs. Primo fi rst moved at the high end, pushing the
expected-price line to a higher level of the primary benefi t
even as it lowered prices. It also split its high-end product
into three, so that customers interested in middle-level per-
formance would stop buying low-end products, while high-
end customers might stick with its premium product longer.
More and more people began to use the products, and to
use them in additional applications. Primo gained market
share, which more than made up for the loss in margins. The
strategy hurt Neutryno so much that it quit the market.
Having outpaced its competitors, Primo then decided to
outfl ank them. In 2000, Primo moved one of its products
down the new expected price line to a low-cost position in
the basic segment. The same year it also introduced a high-
end product for a new generation of electronic devices. Be-
tween 2001 and 2004, the company reduced this product’s
price as Primo gained experience and economies of scale,
moving it from a high-end niche to the mass market. Primo
also sold its old product at a discount to keep its Japanese
competitors pinned down at the market’s low end. This cut
deep into its rivals’ profi t margins, which left them without
the money to invest in new product development. Had it not
been for their parents’ deep pockets, the Japanese companies
would have left the market. Not only did Primo escape the
vicious cycle of declining market share and profi t margins
but it also turned the tables on rivals by shaping the emerg-
ing competitive landscape. By forecasting the movements
of prices and benefi ts, Primo stayed ahead of shifts in the
expected-price line – and its rivals.
• • •
A price-benefi t map sounds early warnings, suggests re-
sponses to competitive threats, and opens executives’ minds
to many possibilities. Like all strategy frameworks, it isn’t a
silver bullet. Every map suggests several hypotheses about
the reasons behind changes in competitive positions, and
executives must use their knowledge of the industry to in-
terpret them and arrive at the right strategies. Ultimately,
though, price-benefi t maps allow executives to make deci-
sions based on fact and to avoid the fatal allure of wishful
thinking.
Reprint R0711G
To order, see page 155.
Many experts criticized BMW for repositioning the 3 Series. The map indicated there was an opportunity at the pricey low end – and history tells us that BMW capitalized on it.
1657 DAveni.indd 1201657 DAveni.indd 120 10/5/07 7:28:08 PM10/5/07 7:28:08 PM