Introduction - Pima County
424
Introduction, Overview, Background and History A1.1 | Page Appendix A: Background & Current Conditions Chapter 1: Introduction, Overview, Background and History Key Subjects Purpose Brief History and Overview of Pima County Native Peoples Recent Pima County Planning Efforts Important Notes: 1. At the time of the preparation of the infrastructure study that served as the core of this background document, the Tohono O’odham Nation was treated as a planning area for statistical purposes only. The Tohono O’odham Nation is a sovereign nation, and though the County recognizes the importance of the Nation to the region, the County has no jurisdiction over the Nation. 2. All Exhibits referenced in this chapter are included at the end of the chapter. Introduction
-
Upload
khangminh22 -
Category
Documents
-
view
0 -
download
0
Transcript of Introduction - Pima County
I n t r o d u c t i o n , O v e r v i e w ,
B a c k g r o u n d a n d H i s t o r y
A1.1 | P a g e A p p e n d i x A : B a c k g r o u n d & C u r r e n t C o n d i t i o n s
Chapter 1: Introduction, Overview, Background and History
Key Subjects
Purpose
Brief History and Overview of Pima County
Native Peoples
Recent Pima County Planning Efforts
Important Notes:
1. At the time of the preparation of the infrastructure study that served as the core of this
background document, the Tohono O’odham Nation was treated as a planning area for
statistical purposes only. The Tohono O’odham Nation is a sovereign nation, and though
the County recognizes the importance of the Nation to the region, the County has no
jurisdiction over the Nation.
2. All Exhibits referenced in this chapter are included at the end of the chapter.
Introduction
I n t r o d u c t i o n , O v e r v i e w ,
B a c k g r o u n d a n d H i s t o r y
A1.2 | P a g e A p p e n d i x A : B a c k g r o u n d & C u r r e n t C o n d i t i o n s
1.1 Purpose
This background and current conditions document is a compendium of primarily local and regional
information that was used to inform the Pima County Comprehensive Plan, Pima Prospers. The plan
covers a diverse array of topics and most are intrinsically interlinked in terms of service delivery. No
individual or information source can provide all the background necessary on a single topic, let alone
discuss its interrelationships with other topics.
This document is one component of the plan making process and does not serve as the only source of
information. Public comment; stakeholder input; dialog with professional colleagues and subject matter
experts in the county, other agencies and the private sector; professional journals and trends in the
planning profession and in other professions covered in the plan content; the planning history of the
county; and the state statutory framework for county comprehensive planning are some of the other
source material critical to the genesis of this update to the Pima County Comprehensive Plan. Plan
making is very much an iterative process that builds on the past, recognizes present conditions and
looks to a future that may or may not resemble past and present.
Much of the document contains information compiled in the Pima County Infrastructure Study, a multi-
year, multidisciplinary effort meant to be a precursor to the Comprehensive Plan. This infrastructure
study was based on twelve of the thirteen “planning areas” used in the Comprehensive Plan (i.e. the
twelve in eastern Pima County). The thirteenth planning area is Ajo-Why, a critical part of Pima
Prospers. Some of the data refer to a fourteenth “planning area” but it is not, in fact, an actual planning
area. The fourteenth area includes Tohono O’odham lands and just like the incorporated jurisdictions,
Pima Prospers does not plan for the Tohono O’odham Nation lands. The fourteenth area is included for
the purpose of data calculations. Initially based solely on watershed boundaries, the planning areas
were altered to use major geographic or political boundaries such as a major road to create planning
areas with some commonality of interest. It is recognized that these planning areas work best for
certain types of physical infrastructure and less for human infrastructure. Economic development, a key
component of the Plan, is best addressed regionally although planning areas have differing potentials
due to the historic development pattern within each.
Exhibits 1.1.a Planning Areas (East) and 1.1.b Planning Areas (West), included at the end of this chapter,
show the location of these planning areas.
I n t r o d u c t i o n , O v e r v i e w ,
B a c k g r o u n d a n d H i s t o r y
A1.3 | P a g e A p p e n d i x A : B a c k g r o u n d & C u r r e n t C o n d i t i o n s
1.2 Brief History and Overview of Pima County
Pima County is named after the Pima Native Americans who are indigenous to this area. The land that is
now Pima County has a long history of human settlement but became part of the United States as part
of the Gadsden Purchase. On December 30, 1853, the United States purchased from Mexico a strip of
land lying south of the Gila River. The cost was $10 million in gold. Pima County, as originally formed,
actually included all of the Gadsden Purchase. In 1863, the Territory of Arizona was created, and Pima
was designated one of the original four counties of the Territory by the first Territorial Legislature the
following year. Over the years during Territorial days, all or portions of five newer counties were
created from Pima County, leaving the county in approximately its present configuration. Today, Pima
County encompasses an area of approximately 9188 square miles. Pima County by itself is larger than
the six smallest states and is larger than the three smallest states combined. The county is bounded on
the north by the counties of Maricopa and Pinal; on the east by Graham and Cochise Counties; on the
south by Santa Cruz County and the Mexican State of Sonora, and on the west by the County of Yuma.
The only municipality for most of the County’s existence and for years prior to that, the City of Tucson
was the capital of the Arizona Territory from 1867 to 1877, and today is the second largest city in the
state.
Pima County is one of the oldest continuously inhabited areas of the United States. Native Americans
have lived in this region from prehistoric times to the present. Pima County today is the home of the
bulk of the Tohono O’odham reservation, the third largest in the nation, and of the Pascua Yaqui Tribe.
In the middle of the 18th century, the discovery of silver and gold in the region drove development to
this region, and the County has been growing ever since. From a population of 395 in 1820, Pima
County has a population of slightly more than 980,000, per the 2010 Census population count. The bulk
of the population resides in eastern Pima County, in and around the City of Tucson and the suburban
municipalities surrounding the city. Approximately one third or more of the population lives in the
unincorporated area, mostly in the form of suburbs in Tucson and the Green Valley area south of
Tucson. The population is projected to reach 1.4 million by 2041.
Hohokam Indians lived and farmed the land for 4,000 years before Spanish missionaries and soldiers
arrived in the late 1600s. In the 1700s, the Spanish established the Presidio San Agustín del Tucson and
the Mission San Xavier del Bac -- the two most iconic and historic structures in the region. "The Old
Pueblo," as the adobe-walled Tucson Presidio became known, is Tucson's nickname to this day.
At the time of statehood for Arizona in 1912, Pima County had a population of 23,000, most of whom
were located in Tucson. Mining, farming, ranching, and the businesses necessary to support and sustain
these endeavors contributed significantly to the economy. People came to Tucson and Pima County for

I n t r o d u c t i o n , O v e r v i e w ,
B a c k g r o u n d a n d H i s t o r y
A1.4 | P a g e A p p e n d i x A : B a c k g r o u n d & C u r r e n t C o n d i t i o n s
health reasons, as tuberculosis patients arrived to take advantage of the arid climate as well as people
with other respiratory ailments like asthma. Tourism, especially dude ranches became popular as more
people owned automobiles and had the ability to travel greater distances. Davis-Monthan Air Force
base developed during World War II and remains an important part of the community.
Some of the area’s most popular attractions are on Pima County property. Residents and visitors can
catch a game or a concert at Kino Sports Complex, the area’s largest sports and entertainment venue, or
marvel at the technological wonders at the Pima Air & Space Museum, or take a closer look at some of
our unique wildlife at the Arizona-Sonora Desert Museum.
Today, a focal point for technology, life sciences, and innovation, Pima County benefits from major
observatories like Kitt Peak National Observatory, the University of Arizona, The University of Arizona
Science and Technology Park, The University of Arizona Solar Zone, the Biosphere II, Davis–Monthan Air
Force Base, and the Bioscience Center in Innovation Park.
Pima County consists of several jurisdictions, of which Tucson is the largest and county-seat. The vast
majority of the county population lies in and around the City of Tucson, filling much of the eastern part
of the county with urban development. Tucson, Arizona is a major commercial and academic center.
There are five jurisdictions in Pima County. These are the City of Tucson, the Town of Marana, the Town
of Oro Valley, the Town of Sahuarita, and South Tucson. The County also includes two sovereign
nations: The Tohono O’odham Nation and the Pascua Yaqui Tribe.
Over the years, a number of factors have contributed to how the development of Pima County has been
molded and shaped. The County’s topography; the nature of the economic eras in which we grew or
failed to grow; land ownership patterns, notably public and state trust land holdings; community and
political decisions on development, infrastructure and conservation matters; entrepreneurial private
sector initiatives notably in real estate shaping the region; the diverse population; the success or failure
of planning initiatives; zoning; incorporation and annexation; the climate; our dominate Sonoran desert
and sky islands; mining, farming and ranching; and tourism provide an incomplete but illustrative list.
Today, private land makes up approximately 13.6% of the county. As the county is 9188 square miles,
private land makes up approximately 1250 square miles (800,000 acres). Additionally, much of Arizona
state trust land, held in trust for supporting public institutions notably including the K-12 education
system, is potentially available for sale or lease for urban scale development. It comprises an additional
14.7% of the land mass of the county. The most highly valued trust land within and close to the county’s
municipalities is the most likely to be opened for eventual development.
An excellent history of the growth, development and form of Pima County through the year 2000 was
prepared by the Pima County Development Services Department (Frank P. Behlau, AICP, principal
author), can be found on line at www.pima.gov/cmo/sdcp/reports/d12/029HIS.PDF.
I n t r o d u c t i o n , O v e r v i e w ,
B a c k g r o u n d a n d H i s t o r y
A1.5 | P a g e A p p e n d i x A : B a c k g r o u n d & C u r r e n t C o n d i t i o n s
Native Peoples
The Tohono O’odham Nation and the Pascua Yaqui Tribe contribute significantly to the diversity of culture of the County’s population and to its economic prosperity. The Nation in particular makes up a major part of the land mass of the county, and together the Nation and Pascua Yaqui Tribe land ownership is over 42% of the county.
The Tohono O’odham Nation
"Tohono O'odham" means "Desert People." The Tohono O'odham people reside primarily in the
Sonoran Desert of southeastern Arizona and northwest Mexico. A United States reservation residing on
a portion of its people's original Sonoran desert lands, the Tohono O'odham Nation within the United
States is organized into twelve districts and include the new Hia-Ced District established recently. The
land lies in three counties in Arizona: Pima County, Pinal County, and Maricopa County. The main
reservation is located between Tucson and Ajo, Arizona, with its administrative center in the town of
Sells. A few of the districts are not contiguous with the main reservation: the San Xavier District
southwest of Tucson, the San Lucy District near the city of Gila Bend, and the Florence Village near the
city of Florence.
The reservation's land area is 11,534.012 square kilometers (4,453.307 sq. mi), the third-largest Indian
reservation area in the United States (after the Navajo and the Uintah and Ouray). The Tohono O’odham
Nation occupies most of the western portion of Pima County.
The 2010 census reported 10,201 people living on reservation land. The Nation's enrollment office tallies
a population of 25,000, with 20,000 living on its Arizona reservation lands.
The Pascua Yaqui Tribe
The Yoem People (now known as Yaqui) have lived in an area including what is now the southwestern
United States and northern Mexico for generations. The original boundaries of the Yaqui stretched from
north as far as Durango, Colorado; west as far as Yuma, Arizona and some parts of California; east
through New Mexico and Arizona and south as far as the southern tip of Sonora, Mexico.
From 1740 on, thousands of Yaquis moved into what is now Sonora, Mexico and southern Arizona to
work in the silver mines, where they excelled as both miners and craftsmen. In 1825, as the spanish
government moved to parcel out Yaqui land, a Yaqui rebellion was provoked that resulted in
intermittent war with the Spanish and Mexican Governments that lasted 100 years. This war caused
many Yaqui to travel to established settlements farther north, in order to work and buy ammunition,
food and needed supplies to further the cause of the Yaqui in the warring areas farther south. This

I n t r o d u c t i o n , O v e r v i e w ,
B a c k g r o u n d a n d H i s t o r y
A1.6 | P a g e A p p e n d i x A : B a c k g r o u n d & C u r r e n t C o n d i t i o n s
migration resulted in a substantial increase in the populations of the northern Yaqui settlements located
in what is now Arizona.
When the U.S. boundary line was fixed and located by agreement with Mexico through the Gadsden
Purchase in 1854, it divided the territory occupied by Yaquis between the United States and Mexico,
even though the continuing occupancy of the Yaquis and others was recognized by both countries. As a
result of the conflict between the Yaquis and the government of Mexico, between 1880 and 1910, the
United States granted asylum to these thousands of Yaquis from the south.
Although the Yaqui People are now settled together in several communities throughout their aboriginal
territory in the Southwest, including both sides of the international border, the largest concentrated
population of Yaquis on the U.S. side of the border live in Pascua Pueblo and in Pascua Yaqui Tribally
Recognized Communities in and around Greater Tucson/Pima County and the Maricopa/Pinal County
regions. In Pima County, the Pascua Yaqui Tribe includes Pascua Pueblo, the largest Tribal community,
growth center of the Tribe, located southwest of Tucson and the site of the Pascua Yaqui Reservation.
Pascua Pueblo and Pascua Yaqui Tribally Recognized Communities include lands held in fee by the Tribe.
Pascua Yaqui Tribally Recognized Communities include: Yoem Pueblo; Old Pascua and Barrio Libre/16th
& 44th. The Tribe’s Tortuga Ranch is also included in Pima County.
The Pascua Pueblo and the Pascua Yaqui Tribally Recognized Communities within Pima County
encompass a total of 8,844.89 acres. Of this total, 1,818.33 acres, or approximately 21 percent, are
reservation lands located in Pascua Pueblo and 7,026.56 acres, or approximately 79 percent, are lands
held in fee by the Tribe. Pascua Yaqui tribally recognized communities within Pima County encompass a
total of 305.47 acres. There are no reservation lands outside of Pima County.
According to 2010 Census counts and the Pascua Yaqui Tribe Enrollment Office, of the total 4,667
persons living in the Pima County region, 4002 persons, or 85.7 percent live in Pascua Pueblo and 665,
or 14.2 percent, live in Tribally Recognized Communities. Of the 4,667 total, 4,002, or 85.7 percent live
in Pascua Pueblo; 45, or 1 percent, live in Yoem Pueblo; 430, or 9.2 percent live in Old Pascua; and 190
or 4.1 percent live in Barrio Libre and 16th & 44th. There is no population living in the Tribe’s Tortuga
Ranch.
1.3 Recent County Planning Efforts
Since the last update of the Pima County Comprehensive Plan in 2001, a number of major initiatives
spearheaded or jointly led by the county have transpired. This section begins with the content and
focus of that Comprehensive Plan.
I n t r o d u c t i o n , O v e r v i e w ,
B a c k g r o u n d a n d H i s t o r y
A1.7 | P a g e A p p e n d i x A : B a c k g r o u n d & C u r r e n t C o n d i t i o n s
The Pima County Comprehensive Plan 2001
Pima County’s last comprehensive plan update charted a course for Sonoran Desert habitat protection
and brought the county’s plan into compliance with Arizona’s new Growing Smarter statutes. Adopted
by the Board of Supervisors in December 2001, the Pima County Comprehensive Plan 2001 includes
three working documents: the Regional Plan Policies; the Land Use Intensity Legend; and Rezoning and
Special Area Policies. The Plan focuses primarily on land use and conservation and incorporates the
Sonoran Desert Conservation Plan’s Conservation Lands System.
The 2001 plan update process took over from what was accomplished with the 1992 update process
which was to combine and standardize the many neighborhood and community plans and policies into
one document, to establish a common planned land use designation system, and to update many
outdated plans.
The Sonoran Desert Conservation Plan
The geographic scope of the award winning Sonoran Desert Conservation Plan (SDCP) is impressive; it
encompasses nearly 5.9 million acres located in Pima County, Arizona including the Tucson metropolitan
area. It sets a common regional vision for balancing the preservation of our natural resource and
cultural heritage while maintaining the community’s economic viability. This vision uniquely lends
continuity to other endeavors that plan for future growth, infrastructure services, economic
development, resources conservation, cultural heritage preservation and other efforts related to
improving the community’s health and well-being now and into the future. Initial emphasis tended to
focus on park expansion, ranch preservation, archaeological and cultural resources, wildlife habitat and
biological corridors, and riparian restoration. Land acquisition, funded by voter-approved bonds, was an
important tool in addressing many of these focal areas.
Today, however, as the County continues to be concerned about the conservation and preservation of
parks and natural and cultural resources, more attention is being devoted to addressing economic-
related concerns. Job growth and retention are at the forefront of the County’s Economic Plan. See
Pima County Economic Plan (page 1.13 of this chapter) for more details.
The SDCP is a visionary step forward for the citizens of Pima County and leaves the community better
prepared to protect the lifestyle and quality of life that make Pima County a unique and wonderful place
to live and visit.

I n t r o d u c t i o n , O v e r v i e w ,
B a c k g r o u n d a n d H i s t o r y
A1.8 | P a g e A p p e n d i x A : B a c k g r o u n d & C u r r e n t C o n d i t i o n s
Water & Wastewater Infrastructure, Supply and Planning Study (WISP)
In April 2008, the City of Tucson Mayor and Council and the Pima County Board of Supervisors initiated a
multi-year study of water and wastewater infrastructure, supply and planning issues. The ultimate goal
of this effort is to assure a sustainable community water source given continuing pressures on water
supply caused by population growth.
The first two phases of the study focused on collecting basic facts related to the condition and capacity
of water, wastewater and reclaimed water infrastructure, and of available water supplies. Information
on critical factors related to planning for a sustainable water future also was collected. Phase II of the
study culminated in a final report from the Oversight Committee and staff that sets forth a new
paradigm for planning for a sustainable water future and a set of common city/county goals and
recommendations. The County has been monitoring progress on the recommendations outlined in the
final document. Pima Prospers includes a number of those items by reference, in policy or in
implementation strategies.
Regional Wastewater Reclamation Plan
Pima County Regional Wastewater Reclamation Department (RWRD) has completed all the mandated
projects in the regulatory-driven Regional Optimization Master Plan (ROMP). This aggressive plan was
designed and constructed to expand and upgrade infrastructure to meet new and regulatory mandates
and potential future requirements. It also provides for the wastewater capacity needs of the community
for the next several decades. All of the regulatory-required infrastructure is now in operation, and work
on other ROMP-related projects is wrapping up. The completed ROMP projects met original scope goals
and objectives and were completed on or ahead of schedule. Almost all were completed significantly
under budget. To date, the overall ROMP Program has saved more than $114 million from the original
$720 million budget. These accomplishments will benefit all the customers of RWRD well into the future.
The ROMP Program was initially commissioned as a result of a new 2005 regulatory requirement to
improve the quality of the effluent discharged to the Santa Cruz River from Pima County’s Ina Road and
Roger Road Wastewater Reclamation Facilities (WRF). The Ina Road WRF was recently renamed the Tres
Rios Water Reclamation Facility WRF. In anticipation of the substantial expense to comply with this
regulatory requirement, RWRD engaged consultants and impacted stakeholders. The group evaluated
the community’s aging wastewater infrastructure along with best approaches to meet new
environmental standards. In-depth dialogue and consultation with this diverse group of experts and
community partners led to the development of the ROMP.
I n t r o d u c t i o n , O v e r v i e w ,
B a c k g r o u n d a n d H i s t o r y
A1.9 | P a g e A p p e n d i x A : B a c k g r o u n d & C u r r e n t C o n d i t i o n s
The following program goals were identified and developed:
• Improve the quality of effluent discharges to the Santa Cruz River from the Ina Road WRF by
January 30, 2014 and from the Roger Road WRF by January 30, 2015 in compliance with regulatory
requirements. The effluent quality improvement would be realized primarily through the reduction
of nutrients in the effluent resulting in improvements to the Santa Cruz River ecosystem and its
underlying groundwater aquifer.
• Provide wastewater treatment capacity to meet the needs of a majority of Pima County residents
for at least 25 years into the future.
• Upgrade or replace aging infrastructure of both major regional wastewater treatment facilities.
Initial components of the Roger Road WRF date back to the early 1950s. Components of the Ina
Road WRF date back to the 1970s.
• Incorporate features that can more cost effectively integrate projected future regulatory
requirements.
• Implement a good neighbor policy for the surrounding communities by incorporating odor control
technology in the ROMP facilities to prevent odors from affecting nearby homes and businesses.
• Incorporate architectural features and landscaping that are attractive and compatible with the
surrounding communities.
• Provide a safe workplace for employees of the regional systems.
• Develop a program budget and financial plan to fund the improvements while ensuring rate
increases do not become a hardship for the system’s ratepayers, who pay for the improvements.
As the ROMP was developed, these goals were incorporated into a plan which was finalized with a not-
to-exceed budget of $720 million. As a consequence of the goals and resulting plan, the ROMP became
the largest and most complex public works program ever undertaken in the history of Pima County.
Sustainability Action Plan for County Operations
Pima County strives to integrate sustainable decision making into all facets of its operations and to
achieve a triple bottom line of benefits, enhancing the environment, economy, and quality of life for its

I n t r o d u c t i o n , O v e r v i e w ,
B a c k g r o u n d a n d H i s t o r y
A1.10 | P a g e A p p e n d i x A : B a c k g r o u n d & C u r r e n t C o n d i t i o n s
citizens. On May 1, 2007, the Board of Supervisors adopted Resolution 2007-84, establishing a far-
reaching set of sustainability initiatives, paving the way for the development and adoption of the
Sustainable Action Plan for county operations in August 2008.
This plan represents a systematic approach to integrating the goals of sustainability into virtually all
facets of the way Pima County government operates—from the cars driven by County staff, to the
energy and water consumed at County facilities, to the construction of County buildings, to the products
the County purchases, to the way the County perceives and handles “used” materials.
Through the implementation of this plan and the programs it has generated, Pima County strives to set
an example for other communities desiring to achieve a high quality-of-life for their residents, protect
their natural and cultural heritage, and provide meaningful economic opportunities.
To date, the County has accomplished the following in its pursuit of creating a sustainable community:
Achieved a net savings of over $7,136,000 in energy costs.
Brought 7 megawatts of renewable energy online, more than tripling its renewable energy capacity.
44% of the County fleet vehicles are now flex fuel, alternative fuel, or hybrid vehicles.
Built all new County-occupied facilities and new additions greater than 5,000 square feet to LEED Silver standards.
Became the first public agency in the country to be awarded LEED for Homes provider status by the USGBC.
Acquired 98,286 acres of parklands and natural areas land for open space conservation.
Increased the number of County parks served by reclaimed water by 120% compared to the baseline.
Reduced the quantity of waste sent to landfills by 46%.
Southwest Infrastructure Plan
Pima County’s Southwest area has been identified by County planners as a potential and strategic
growth area. To accommodate population growth, the existing infrastructure must be improved and
expanded. The infrastructure plan provides a basis for infrastructure decision-making related to
development in the Southwest area. It quantifies the nature, phasing, financial impacts, and funding
possibilities for those flood control, parks and recreation, transportation, wastewater infrastructure and
other improvements that are necessary to serve future growth in the area. The plan includes phased
infrastructure plans, estimates of probable cost, funding analysis outputs, and provides a model for
deployment elsewhere in Pima County. The plan also summarizes readily available data regarding the
provision of other services provided by public, quasi-public, and private agencies such as fire districts,
Tucson Water, Tucson Unified School District, and utility providers. The planning process included
public input, identified stakeholders and subject experts, and numerous County departments.

I n t r o d u c t i o n , O v e r v i e w ,
B a c k g r o u n d a n d H i s t o r y
A1.11 | P a g e A p p e n d i x A : B a c k g r o u n d & C u r r e n t C o n d i t i o n s
Imagine Greater Tucson Process & Adopted Regional Vision
Imagine Greater Tucson has been a regional visioning process led by a local non-profit 501 (c) 3
corporation. The Vision, entitled “Looking Forward” was published and presented in September 2012. A
number of county staff participated in the public involvement process leading to the Vision and
development of the Vision itself.
The Vision for a Greater Tucson Region, resulting from the t Imagine Greater Tucson (IGT) process, is the
culmination of more than two years of input and participation by over 10,000 people countywide. The
Vision describes the future desired for the region based on shared values. This process resulted in 60
Shared Regional Values, categorized into nine (9) principles:
Accessibility
Educational Excellence
Environmental Integrity
Good Governance
Healthy Communities
Higher Education
Prosperity
Quality Neighborhoods
Regional Identity
The process and the published document outline a preferred future, noting that if the region were to
continue to develop without taking a change in path, the future would be inconsistent with the Shared
Regional Values. Quoting from the Looking Forward document, the Vision is “an expression of a region’s
core values and desired direction.” “The purpose…is to establish a strong cohesive identity for our
region and an agreed-upon basis for public decision making and collective action for the future.” The
Visioning process covered the metropolitan Tucson area. Among other components of implementation,
the Vision is meant to be input into jurisdictional comprehensive and general plans.
The Pima County Board of Supervisors accepted the Vision for a Greater Tucson Region, which focuses
primarily on development in urbanizing and suburbanizing eastern Pima County.
The Imagine Greater Tucson Looking Forward document discusses process, building blocks of the
preferred future, and the key components toward successful implementation which include:
Creating quality places and neighborhood choices
Developing a strong and diverse economy
Conserving resources and the natural environment
I n t r o d u c t i o n , O v e r v i e w ,
B a c k g r o u n d a n d H i s t o r y
A1.12 | P a g e A p p e n d i x A : B a c k g r o u n d & C u r r e n t C o n d i t i o n s
Creating an accessible region
Improving decision-making and regional collaboration
The document in full may be found on line at http://www.imaginegreatertucson.org/wp-
content/uploads/2013/08/Looking-Forward_Vision-for-a-Greater-Tucson-Region.pdf
Pima County Regional Master Trail System and The Loop
Changes in River Park and Greenway standards pointed at the need to update the Eastern Pima County
Trail System Master Plan last revised in 1996. In 2010, the Pima County Natural Resources, Parks and
Recreation Department lead this effort which included revisions to the Pima Regional Trail System
Master Plan Trails Map and the conforming modifications to the zoning code. The changes to the zoning
code updated the text to reflect the current trail system master plan.
The overall goal of this update was to expand the trail system in the urban core of the area’s
jurisdictions and to explore new opportunities in outlying areas. The plan builds on the efforts of the
previous master plan, taking a detailed look at both the areas surrounding the cities in the county and
the urban context of downtown and suburban Tucson, and the towns located in the periphery.
The updated system consists of approximately 853 miles of existing and proposed trails, paths,
greenways, river parks, bicycle boulevards, and enhance corridors that connect regional destinations,
workplaces, parks, schools, and preserve areas. In addition, there are 1,422 miles of single-track trails
that connect the urban core to the large and small natural preserves in Eastern Pima County. The trails
system includes parks, trailheads and boundary access points to increase user access to the system, as
well as detailed design standards—including River Park standards—to guide the future development of
the system.
Pima County is developing The Loop around metro Tucson with 55
miles of biking, walking and running paths connecting the Rillito,
Santa Cruz, and Pantano River Parks with the Julian Wash and
Harrison Road Greenways. Loop links will extend the network of
paths through Marana, Oro Valley, Tucson and South Tucson.
These connections are the result of Pima County’s cooperative
partnerships with these jurisdictions.
The Loop will connect parks, trailheads, bus and bike routes, workplaces, schools, restaurants, hotels
and motels, shopping areas, and entertainment venues. Visitors and Pima County residents can enjoy
The Loop on foot, bikes, skates and horses. If it doesn't have a motor, it's good to go on The Loop.

I n t r o d u c t i o n , O v e r v i e w ,
B a c k g r o u n d a n d H i s t o r y
A1.13 | P a g e A p p e n d i x A : B a c k g r o u n d & C u r r e n t C o n d i t i o n s
When completed, The Loop will total 131 miles and connect the Rillito River Park, Santa Cruz River Park,
and Pantano River Park with Julian Wash and the Harrison Greenway.
Pima County Economic Development Plan
In January 19, 2012, Chuck Huckleberry, the County Administrator, presented an Economic Development
report to the Board of Supervisors capturing the past and present actions to promote job growth and
retention. Pima County’s role in economic development has traditionally been focused on workforce
development managing the federal funds that are allocated through the State and funneled to
Workforce Investment Boards. Pima County pays an annual contribution to Tucson Regional Economic
Opportunities (TREO) to develop strategies for industry attraction and work with site selectors to match
their requirements with the region. The report outlined an aggressive shift to active recruitment and
infrastructure commitments to attract and retain large employers. The report proposes actions such as
Targeted Transportation Infrastructure Investments, proposed land acquisition, and promoting the
importance of solar energy.
Pursuant to the objectives, the following actions for example are currently underway:
Protect Raytheon from urban encroachment through land acquisition, airport planning, road
realignment and aerospace corridor planning
Protect the military functionality of DMAFB and the Air National Guard Fighter Wing through land
acquisitions and noise mitigation funding
Position the county for new jobs and new industry through maximizing on the current assets such as
airports for the Aerospace and Defense Research Corridor
Future challenges were identified that would require a regional approach to solve including, for
example, developing new investment strategies for transportation funding mechanisms and changing
public attitudes regarding infrastructure investment. It also recommends fostering a collaborative

I n t r o d u c t i o n , O v e r v i e w ,
B a c k g r o u n d a n d H i s t o r y
A1.14 | P a g e A p p e n d i x A : B a c k g r o u n d & C u r r e n t C o n d i t i o n s
environment in which the private sector, local governments, educational institutions and nonprofit
agencies work together to stabilize and expand the local economy.
Meant to be a short term strategic plan, a second phase of the Economic Development Plan for 2015-
2017 is awaited.
Pima County Multi-Species Conservation Plan and Habitat Conservation Plan
Pima County’s Multi-species Conservation Plan (MSCP) is the part of the Sonoran Desert Conservation
Plan (SDCP) that addresses endangered species compliance. Under the Endangered Species Act it is
illegal to take (harm, harass, pursue, hunt, shoot, wound, kill, trap, capture, or collect) threatened and
endangered species. The U.S. Fish and Wildlife Service (Service) may issue permits to take federally
listed species provided the taking is incidental to an otherwise lawful activity. Issuing such an incidental
take permit to a nonfederal entity, such as Pima County, requires the permit recipient to develop—and
commit to—a habitat conservation plan that minimizes and mitigates the effects of incidental take on
federally listed species. The MSCP is Pima County's habitat conservation plan, which covers 44 species.
Numerous investigations and research efforts were conducted as part of the SDCP to determine the
location, condition, and appropriate conservation measures for a number of key natural resources in
Pima County. This information provided the foundation for the MSCP. The MSCP:
Serves as the document of record for anticipated incidental take, habitat loss, mitigation,
management, and monitoring of covered species and their habitats that result from the activities
authorized under the permit (i.e., Covered Activities);
Establishes a phased approach to implementing the Pima County MSCP with appropriate interim
milestones for meeting requirements associated with projected impacts; and
Provides a means for tracking mitigation obligations and credit.
Once approved, the MSCP will be valid for up to 30 years or until impacts from the following activities
reach 36,000 acres:
• Ground disturbances on individual, single dwelling lots that occur subsequent to the County’s
issuance of a building permit that authorizes grading of 14,000 square feet or more provided that
the property owner elects to participate in the County’s Section 10 permit at the time the property
owner applies for the building permit;
• Ground disturbances that occur as part of—and subsequent to—the development of a residential
subdivision where such actions are subject to the County’s issuance of a site construction permit
provided the property owner elects to participate in the County’s Section 10 permit after submittal
I n t r o d u c t i o n , O v e r v i e w ,
B a c k g r o u n d a n d H i s t o r y
A1.15 | P a g e A p p e n d i x A : B a c k g r o u n d & C u r r e n t C o n d i t i o n s
of the site construction permit application but prior to the County’s issuance of the site construction
permit (see Section 3.4);
• Ground disturbances that occur as part of and subsequent to the development of a non-residential
facility where development is subject to the County’s issuance of a site construction permit provided
the property owner elects to participate in the County’s Section 10 permit after submittal of the site
construction permit application but prior to the County’s issuance of the site construction permit
(see Section 3.4);
• Activities of the County including construction, repair, maintenance, and operation of County
facilities and infrastructure;
• Construction, operation, and maintenance of renewable energy generation projects located on
County-owned lands leased to others specifically for that purpose;
• Relocation of utilities within County rights-of-way, where required by Pima County;
• Monitoring and land management activities including surveys, scientific studies, and other such
activities carried out by Pima County and its cooperators for the purposes of this MSCP;
• Restoration activities such as vegetation treatments (including wildland fire) that are intended to
improve the biological and ecological values;
• Recreation activities authorized by Pima County; and
• County ranch-management activities—exclusive of livestock herbivory and trampling—on land
owned by the County and lands managed by the County through grazing leases issued by the State
of Arizona.
I n t r o d u c t i o n , O v e r v i e w ,
B a c k g r o u n d a n d H i s t o r y
A1.16 | P a g e A p p e n d i x A : B a c k g r o u n d & C u r r e n t C o n d i t i o n s
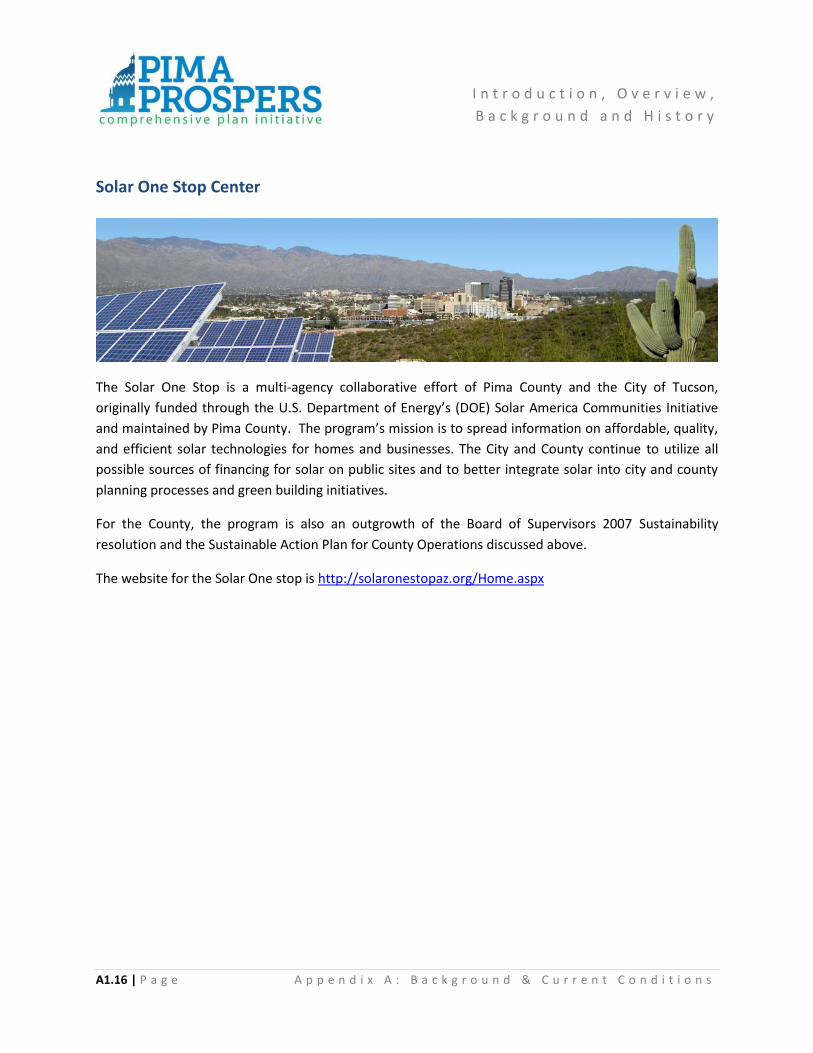
Solar One Stop Center
The Solar One Stop is a multi-agency collaborative effort of Pima County and the City of Tucson,
originally funded through the U.S. Department of Energy’s (DOE) Solar America Communities Initiative
and maintained by Pima County. The program’s mission is to spread information on affordable, quality,
and efficient solar technologies for homes and businesses. The City and County continue to utilize all
possible sources of financing for solar on public sites and to better integrate solar into city and county
planning processes and green building initiatives.
For the County, the program is also an outgrowth of the Board of Supervisors 2007 Sustainability
resolution and the Sustainable Action Plan for County Operations discussed above.
The website for the Solar One stop is http://solaronestopaz.org/Home.aspx
PLANNING AREAS
EXHIBIT 1.5.3
Pima County Jurisdictions, Planning Areas and Census Designated Places
October 2013

EXHIBIT 1.1Comprehensive Plan Study Area
September 2013
I n t r o d u c t i o n , O v e r v i e w , B a c k g r o u n d a n d H i s t o r y
A1.17 | P a g e A p p e n d i x A : B a c k g r o u n d a n d C u r r e n t C o n d i t i o n s

EXHIBIT 1.1.aPlanning Areas East
I n t r o d u c t i o n , O v e r v i e w , B a c k g r o u n d a n d H i s t o r y
A1.18 | P a g e A p p e n d i x A : B a c k g r o u n d a n d C u r r e n t C o n d i t i o n s

EXHIBIT 1.1.bPlanning Areas West
I n t r o d u c t i o n , O v e r v i e w , B a c k g r o u n d a n d H i s t o r y
A1.19 | P a g e A p p e n d i x A : B a c k g r o u n d a n d C u r r e n t C o n d i t i o n s

I n v e n t o r y , D e m o g r a p h i c s a n d
S o c i o - E c o n o m i c A n a l y s i s
A2.1 | P a g e A p p e n d i x A : B a c k g r o u n d a n d C u r r e n t C o n d i t i o n s
Chapter 2: Inventory, Demographics and Socio-Economic Analysis
Key Subjects
Location and Regional Context
Planning Areas and Settlements Description
Environmental Considerations (Topography, Hydrology and Biological Resources)
Demographics
Socio-economic Conditions
Important Notes:
1. At the time of the preparation of the infrastructure study that served as the core of this
background document, the Tohono O’odham Nation was treated as a planning area for
statistical purposes only. The Tohono O’odham Nation is a sovereign nation, and though
the County recognizes the importance of the Nation to the region, the County has no
jurisdiction over the Nation.
2. All Exhibits referenced in this chapter are included at the end of the chapter.
Inventory and Analysis
I n v e n t o r y , D e m o g r a p h i c s a n d
S o c i o - E c o n o m i c A n a l y s i s
A2.2 | P a g e A p p e n d i x A : B a c k g r o u n d a n d C u r r e n t C o n d i t i o n s
Base Mapping and Inventory
2.1 Location and Regional Context
Pima County is located in the south central region of Arizona and encompasses a total of 5,879,797.69
acres or 9,188.83 square miles (23,799.0 km2). The county is named after the Pima Native Americans
which are indigenous to this area. It borders between southwestern Arizona and northwestern Mexico's
Sonora state. Municipalities within Pima County include the City of Tucson (the largest and the county
seat), the City of South Tucson, the Town of Marana, the Town of Oro Valley, and the Town of Sahuarita.
The vast majority of the county population lies in and around the City of Tucson, filling much of the
eastern part of the county with urban development. Pima County includes two sovereign nations: The
Tohono O'odham Nation and the Pascua Yaqui Tribe.
Private land makes up approximately 13.6% (1250 square miles) of the county. Additionally, much of
Arizona state trust land, held in trust for supporting public institutions, is potentially available for sale or
lease for urban scale development. It comprises an additional 14.7% of the land mass of the county.
According to the 2000 census, of the total 9,188.83 square miles (23,799.0 km2) within Pima County,
approximately 9,186.27 square miles (23,792.3 km2) (or 99.97%) is land and 2.57 square miles (6.7 km2)
(or 0.03%) is water. The United States Office of Management and Budget designated Pima County as the
Tucson, AZ Metropolitan Statistical Area. The United States Census Bureau ranked the Tucson, AZ
Metropolitan Statistical Area as the 53rd most populous metropolitan statistical area of the United
States as of July 1, 2012.
The Office of Management and Budget further designated the Tucson, AZ Metropolitan Statistical Area
as a component of the more extensive Tucson-Nogales, AZ Combined Statistical Area, the 53rd most
populous combined statistical area and the 59th most populous primary statistical area of the United
States as of July 1, 2012.
Exhibit 2.1, included at the end of this chapter, shows Comprehensive Plan study area and regional
context and depicts municipalities, Tribal Lands, and major parks and protected areas.

I n v e n t o r y , D e m o g r a p h i c s a n d
S o c i o - E c o n o m i c A n a l y s i s
A2.3 | P a g e A p p e n d i x A : B a c k g r o u n d a n d C u r r e n t C o n d i t i o n s
2.2 Planning Areas
For planning purposes, Pima County is divided in thirteen distinct planning areas. The Pima County
Infrastructure Study serves as the core of this background document and includes 12 of the 13 Planning
Areas (Eastern Pima County). Western Pima County, the Ajo-Why planning area, was added for Pima
Prospers. A fourteenth “planning” area is included in some of the statistical data for this document but
is only for statistical purposes. Just as with the incorporated jurisdictions, Pima Prospers does not plan
for The Tohono O’odham Nation lands. While not part of the county land use plan, the Tohono
O’odham and the other jurisdictions are very important entities in the planning process. Each planning
area presents unique opportunities and challenges. In addition to addressing flood control,
transportation, wastewater, libraries, health and other countywide services provided by Pima County,
this comprehensive plan also assesses opportunities within each planning area. This layered approach
provides a more comprehensive picture of future needs.
See Exhibits 2.2.a and 2.2.b for Public and Private Land Ownership maps.
TABLE 2.2: Planning Area Acreages
Planning Area Total Acres
1. Avra Valley 316,549.11
2. Tucson Mountains 50,615.58
3. Southwest 150,723.67
4. Altar Valley 712,465.73
5. Upper Santa Cruz 176,765.50
6. Mountain View 183,813.05
7. Southeast 221,883.14
8. Central 79,887.01
9. Catalina Foothills 200,399.81
10. Rincon Valley 122,162.78
11. Tortolita 150,452.16
12. San Pedro 174,332.96
13. Ajo-Why 981,488.00
Total All Planning Areas: 3,521,538.50
Total County: 5,880,851.00
Source: Pima County Infrastructure Study, 2013

I n v e n t o r y , D e m o g r a p h i c s a n d
S o c i o - E c o n o m i c A n a l y s i s
A2.4 | P a g e A p p e n d i x A : B a c k g r o u n d a n d C u r r e n t C o n d i t i o n s
Avra Valley Planning Area (1)
The Avra Valley planning area encompasses 316,548 acres northwest of the Tucson metropolitan area
and west of Interstate 10 including a portion of the Town of Marana. The northwestern boundary of the
planning area is the Pinal/Pima County line until it reaches Interstate 10 in the area of the Rillito
community (approximately 1 ½ miles northwest of Avra Valley Road and Interstate 10) where the
eastern boundary drops south from Interstate10 roughly bisecting Saguaro National Park (west) until it
meets the southern boundary of the planning area. The southern boundary of the planning area begins
at the junction of Planning Areas 1, 2, and 3 at roughly the southern end of Saguaro National Park
(west), moving southwesterly until approximately the intersection of Sandario Road and two miles south
of Mile Wide Road where the boundary then extends westward along the border of the Ironwood Forest
National Monument and the Tohono O’odham Nation. The western boundary of the planning area is
the periphery of the Tohono O’odham Nation (the east boundaries of T11S, R5E and T12S, R5E near the
western edge of the Ironwood Forest National Monument). The planning area includes a portion of
Saguaro National Park (west), a small portion of Tucson Mountain Park, the Ironwood Forest National
Monument, and a portion of the Town of Marana (the portion on the west side of Interstate 10).
By jurisdiction, 52.6% (164,294 acres) of this planning area is the Ironwood Forest National Monument,
34.1% (106,566 acres) is unincorporated Pima County, 7.6% (23,852 acres) is the Town of Marana, 5.1%
(15,920 acres) is Saguaro National Park (west), .17% (521 acres) is Tucson Mountain Park, and .09% (274
acres) is the Tohono O’odham Nation.
Privately-owned lands (101,581 acres) constitute 32.1% of the planning area. The Bureau of Land
Management controls 36.3% (115,004 acres) of the planning area, the Arizona State Land Department
controls 24.9% (78,840 acres), the Saguaro National Park (west) controls 4.7% (15,015 acres) and the
remainder is owned by the Tohono O’odham Nation (.95%/2,998 acres), the Bureau of Reclamation
(.78%/2,466 acres), Parks and Recreation (.19%/592 acres), and there is a “GIS mapping alignment shift”
of 53 acres.
Tucson Mountains Planning Area (2)
The Tucson Mountains planning area encompasses approximately 50,615 acres in the central region of
eastern Pima County. The western boundary of the planning area runs south from Interstate 10, roughly
bisecting the Saguaro National Park (west) and abuts the eastern boundary of Planning Area 1, the
northeastern boundary is Interstate 10 from just south of Tangerine Road to just south of Starr Pass
Boulevard and abuts Planning Areas 8, 9, and 11, and the southern boundary is south of Starr Pass
Boulevard from Tucson Mountain Park to Interstate 10 and abuts the northern boundary of Planning
Area 3. The eastern edge of Planning Area 2 lies within the City of Tucson and the western edge lies
within Saguaro National Park (west) and Tucson Mountain Park. The unincorporated areas are mostly
within the central portion of the planning area, while a large southeastern portion lies within the City of
Tucson and a large northern portion lies within the Town of Marana.

I n v e n t o r y , D e m o g r a p h i c s a n d
S o c i o - E c o n o m i c A n a l y s i s
A2.5 | P a g e A p p e n d i x A : B a c k g r o u n d a n d C u r r e n t C o n d i t i o n s
By jurisdiction, 39.8% (20,141 acres) of the planning area is unincorporated Pima County, 21.2% (10,716
acres) is within the City of Tucson, 16.2% (8,217 acres) is within Saguaro National Park (west), 14.9%
(7,565 acres) is within the Town of Marana, and 7.9% (3,977 acres) is within Tucson Mountain Park.
Privately-owned lands constitute 75.9% (38,420 acres) of the planning area. With 6,240 acres, the
National Park Service controls 12.3% of the planning area, the Pima County Natural Resources, Parks and
Recreation Department controls 8.4% of the planning area, with the remaining acreage composed of
State Trust Lands (3.2%/1,608 acres), Game and Fish (.13%/66 acres) and Military Reserve (.08%/40
acres).
The Town of Marana meets the City of Tucson at approximately Sunset Road. South of Sweetwater
Drive, the City of Tucson incorporated area expands west of Silverbell Road to Painted Hills Road. The
City of Tucson abuts Tucson Mountain Park in the Starr Pass development area.
Southwest Planning Area (3)
The Southwest planning area consists of 70 square miles of land located within the roughly 7X12 mile
rectangular region generally bounded by Tucson Mountain Park to the north, Mission Road to the east,
the Tohono O’odham Nation San Xavier District and Pascua Yaqui Tribe lands to the south, and Sandario
Road to the west.
Land ownership of the area is widespread and diverse, including the federal government, the State of
Arizona, Pima County, the Arizona Board of Regents, and Tribal Nations. Some of those owners are
anticipated to release all or portions of their property to development.
Altar Valley Planning Area (4)
The Altar Valley planning area encompasses approximately 712,463 acres in the southwestern region of
eastern Pima County. The boundaries of the planning area are on the north where the Tohono O’odham
Nation meets the Ironwood Forest National Monument (the southern boundary of Planning Area 1), the
eastern boundary roughly follows the Brawley Wash south from Tucson Mountain Park to Ajo Highway
(Hwy 86) where the boundary moves eastward to the Tohono O’odham Nation (San Xavier District) and
follows the district’s boundary south and east to the Sierrita Mountains to the Pima/Santa Cruz County
border (abutting Planning Areas 3 and 5), the southern boundary is the Pima/Santa Cruz County
boundary, and the western boundary is the Baboquivari Mountains and the east perimeter of the
Tohono O’odham Nation.
Much of the planning area is unincorporated Pima County with the exceptions of the Buenos Aires
National Wildlife Refuge, the Coronado National Forest, Baboquivari Peak Wilderness Area, and portions
of the Tohono O’odham Nation.

I n v e n t o r y , D e m o g r a p h i c s a n d
S o c i o - E c o n o m i c A n a l y s i s
A2.6 | P a g e A p p e n d i x A : B a c k g r o u n d a n d C u r r e n t C o n d i t i o n s
By jurisdiction, 73.9% (485,377 acres) of this planning area is unincorporated Pima County, 15.5%
(101,595 acres) is the Buenos Aires National Wildlife Refuge, 7.6% (49,935 acres) is the Tohono O’odham
Nation, and the remainder is Coronado National Forest (2.2%/14,273 acres), the Baboquivari Peak
Wilderness Area (.31%/2,052 acres), Coyote Mountain Wilderness Area (in the Baboquivari Mountains)
and slivers of the Tohono O’odham Nation (San Xavier District) and Ironwood Forest National
Monument.
Privately-owned lands (119,767 acres) constitute 16.8% of the planning area. With 353,802 acres, the
Arizona State Land Department owns 49.7% of the planning area. The federal government owns 26.2%
of the planning area with 15.6% (111,407 acres) controlled by the Buenos Aires National Wildlife Refuge,
6.0% (43,059 acres) by the Coronado National Forest, and 4.6% (32,787 acres) by the Bureau of Land
Management. The remaining land area is owned by the Tohono O’odham Nation (including a sliver of
the San Xavier District) (7%), Game and Fish (.2%), and negligible acreage is attributed to “other” and to
a GIS alignment data shift.
Upper Santa Cruz Planning Area (5)
The Upper Santa Cruz planning area encompasses approximately 176,751 acres in the south-central
region of eastern Pima County. The western boundary of the planning area is the Sierrita Mountains,
the southern is the Pima-Santa Cruz county line, the eastern is generally the Santa Cruz River and the
Santa Rita Experimental Range (and the western boundary of Planning Area 7), and the northern is the
Tohono O’odham Nation – San Xavier District. The planning area is characterized by a history of copper
mining that continues today, as well as cattle ranching, agriculture and urban development along
Interstate Highway 19. I-19 is also a major highway providing connectivity to the US/Mexico border and
connecting the State of Sonora, Mexico and the State of Arizona.
Privately-owned lands (108,826 acres) constitute 61.5% of the planning area. With 61,665 acres, the
Arizona State Land Department controls 35% of the area within this planning area. Save an acre within
the Tohono O’odham Nation - San Xavier District, the balance of this planning area (6,258 acres; 3.5%) is
owned by the federal government, primarily the Bureau of Land Management and to a minor extent the
U.S. Forest Service. By jurisdiction, 8.5% (14,957 acres) is within the Town of Sahuarita and 91.5%
(161,794 acres) is within unincorporated Pima County.
Mountain View Planning Area (6)
The Mountain View planning area encompasses approximately 183,813 acres in the southeastern region
of Pima County. The northern boundary of the planning area is Interstate 10, the eastern boundary is
the Pima/Cochise County line, the southern boundary is the Pima/Santa Cruz County line, and the
western boundary is the eastern boundary of Planning Area 7 which is very roughly Highway 83 for
approximately six miles south from Interstate 10 to where the boundary veers southwest and bisects
the Coronado National Forest.

I n v e n t o r y , D e m o g r a p h i c s a n d
S o c i o - E c o n o m i c A n a l y s i s
A2.7 | P a g e A p p e n d i x A : B a c k g r o u n d a n d C u r r e n t C o n d i t i o n s
By jurisdiction, 60.8% (111,757 acres) is Pima County, 21.3% (39,132 acres) is Coronado National Forest,
17.5% (32,066 acres) is Las Cienegas National Conservation Area, and 0.5% (858 acres) is Cienega Creek
Natural Preserve. Privately-owned lands (26,737 acres) constitute 14.5% of the planning area. With
84,205 acres, the Arizona State Land Department owns 45.8%, the Bureau of Land Management owns
20.4% (37,540 acres), and the Coronado National Forest owns 14.5% (26,737 acres) of the planning area.
A residual amount of 0.14% or 251 acres is deemed “GIS data alignment shift”.
Southeast Planning Area (7)
The Southeast planning area encompasses approximately 221,882 acres in the south-central region of
eastern Pima County. The western boundary is made up of a portion of Interstate 19, of the eastern
boundary of the Tohono O’odham Nation (San Xavier District), of the western boundary of the Santa
Rita Experimental Range and Wildlife Area and a portion of the eastern boundary of Planning Area 5
which bisects the Town of Sahuarita. The southern boundary of the planning area is the Santa
Cruz/Pima County border. The southeastern boundary is the western boundary of Planning Area 6
which bisects the Coronado National Forest (Santa Rita Mountains) and roughly parallels a portion of
Highway 83. The northern boundary is Interstate 10 which is also the southern boundary of Planning
Area 8.
Including 121,164 acres, the Arizona State Land Department controls the majority (55%) of the area
within this planning area. Privately-owned lands (70,344 acres) constitute 32% of the planning area.
Save a few acres within the Tohono O’odham Nation (San Xavier District), the balance of this planning
area (30,332 acres; 13.7%) is owned by the federal government, specifically the U.S. Forest Service and
Bureau of Land Management.
By jurisdiction, 20% (43,304 acres) is within the City of Tucson, 2% (4,639 acres) is within the Town of
Sahuarita, and 42% (93,214 acres) is within unincorporated Pima County. A negligible amount of this
planning area (22 acres) is a small portion of the City of South Tucson (South Tucson).
Central Planning Area (8)
The Central planning area encompasses approximately 79,887 acres in the central region of eastern
Pima County. The western and southern boundaries of the planning area are Interstate 10 (where the
boundaries abut Planning Areas 2, 3, and 7), the northern boundary is the Rillito River and the
northeastern boundary is the Pantano Wash (both north and northeastern boundaries abutting Planning
Area 9), the eastern boundary is formed by the section line of the Wentworth Road alignment veering
away from the Pantano Wash and then south to Interstate 10 (where the boundary abuts Planning Area
10). Most of the planning area lies within the City of Tucson. The unincorporated areas of the planning
area are at the far northwest, a small area in the north, and several areas along the south boundary of
Interstate 10.

I n v e n t o r y , D e m o g r a p h i c s a n d
S o c i o - E c o n o m i c A n a l y s i s
A2.8 | P a g e A p p e n d i x A : B a c k g r o u n d a n d C u r r e n t C o n d i t i o n s
By jurisdiction, 88% (70,158 acres) is within the City of Tucson, 11% (9,100 acres) is within
unincorporated Pima County, .8% (615 acres) is within South Tucson, and a scant three acres is within
Marana.
Privately-owned lands (56,214 acres) constitute 70% of the planning area. With 12,935 acres, the
Arizona State Land Department controls 16% and with 10,737 acres, Davis-Monthan Air Force Base
controls 13% of the planning area.
Catalina Foothills Planning Area (9)
The Catalina Foothills planning area encompasses approximately 200,398 acres in the Catalina/Rincon
foothills region of eastern Pima County. The small western boundary of the planning area is Interstate
10 abutting the eastern boundary of Planning Area 2, the northwestern boundary abuts Planning Area
11 and is roughly from I-10 east along Orange Grove Road to Shannon Road then diagonally northeast to
slightly north of Magee Road and La Canada Drive and east to the Coronado National Forest to the
junction of Planning Areas 11 and 12 in the Catalina Mountains. The planning area’s northeastern
boundary follows along the Catalina Mountains ridgeline and is the southwestern boundary of Planning
Area 12. The southeastern boundary bisects Saguaro National Park (east) diagonally from southwest to
northeast from south of Irvington Road abutting Planning Area 10 and the southwestern boundary
roughly follows the Rillito River until Craycroft Road where it veers southeast and meets up with the
Pantano Wash south of Irvington Road, abutting the west boundary of Planning Area 10 and the
northern boundary of Planning Area 8.
With the notable exception of the City of Tucson-incorporated area south of Tanque Verde Road and
other minor exceptions, the area is predominantly unincorporated Pima County.
By jurisdiction, 48.6% (97,343 acres) of the planning area is Coronado National Forest, 30% (60,116
acres) is unincorporated Pima County, 13.3% (26,624 acres) is within Saguaro National Park (east), 7.7%
(15,475 acres) is within the City of Tucson, .31% (627 acres) is within the Town of Oro Valley and .11%
(213 acres) is within the Town of Marana.
Privately-owned lands constitute 39.1% (78,386 acres) of the planning area. With 97,133 acres, the
Coronado National Forest controls 48.5% of the planning area, the Saguaro National Park (east) controls
12.4% (24,758 acres) of the planning area, with the remaining acreage composed of Bureau of Land
Management property (.04%/78 acres) and State Trust Lands (.02%/44 acres). A small piece of the Town
of Oro Valley meets unincorporated Pima County near Magee Road and Oracle Road and the City of
Tucson incorporated area expands roughly south of Tanque Verde Road, west of Melpomene Way and
south to the southwestern boundary of the planning area.

I n v e n t o r y , D e m o g r a p h i c s a n d
S o c i o - E c o n o m i c A n a l y s i s
A2.9 | P a g e A p p e n d i x A : B a c k g r o u n d a n d C u r r e n t C o n d i t i o n s
Rincon Valley Planning Area (10)
The Rincon Valley planning area encompasses 122,162 acres at the eastern boundary of Pima County,
north of Interstate 10. The western boundary of the planning area (the eastern boundary of Planning
Area 8) is roughly the Pantano Wash to the section line of the Wentworth Road alignment south to
Interstate 10, the northern boundary (the southeastern boundary of Planning Area 9) starts south of the
Irvington Road alignment and bisects the Rincon Mountains diagonally to the northeast, the southern
boundary is Interstate 10, and the eastern boundary is the ridgeline of the Rincon Mountains (also a
portion of the Planning Area 12 boundary) south to the border of Cochise County and Pima County. The
planning area includes portions of Saguaro National Park (east), portions of the Rincon Mountains and
foothills, the Cienega Creek Natural Preserve, the unincorporated community of Vail and Colossal Cave
Mountain Park.
By jurisdiction, 54.6% (66,703 acres) of this planning area is unincorporated Pima County, 26.1% (31,916
acres) is within Saguaro National Park (east), 14.1% (17,204 acres) is within the Coronado National
Forest, 2.7% (3,292 acres) is Cienega Creek Natural Preserve, 1.7% (2,131 acres) is Colossal Cave
Mountain Park, .6% (757 acres) in within the City of Tucson and the remaining .13% (162 acres) is
Bureau of Reclamation Mitigation Lands.
Privately-owned lands (45,416 acres) constitute 37.2% of the planning area. The Arizona State Land
Department controls 25.8% (31,511 acres), the Saguaro National Park (east) controls 22.8% (27,873
acres), and the Coronado National Forest controls 14% (17,142 acres) of the planning area. The
remaining acreage is owned by the Bureau of Land Management (.18%/215 acres) and .005% entails a
“GIS mapping alignment shift” (6 acres).
Tortolita Planning Area (11)
The Tortolita planning area encompasses 150,451 acres in the northwestern region of eastern Pima
County. The western boundary of the planning area is Interstate 10 (abutting Planning Areas 1 and 2),
the northern boundary is the Pinal/Pima County line, the south/southeastern boundary is from I-10
roughly along Orange Grove Road to Shannon Road then diagonally northeast to slightly north of Magee
Road and La Canada Drive and east to the Coronado National Forest to the junction of Planning Areas 9
and 12 in the Catalina Mountains. The southeastern boundary joins the northwestern boundary of
Planning Area 9. The east boundary is within the Catalina Mountains abutting Planning Area 12. The
planning area includes the Towns of Marana and Oro Valley, Catalina State Park, Coronado National
Forest (Catalina Mountains), Tortolita Mountain Park and the remainder is unincorporated Pima County.
The unincorporated portions of the planning area are between the Towns of Marana and Oro Valley,
areas north and northeast of the Town of Oro Valley including the village of Catalina, and the western
portion of the Coronado National Forest.

I n v e n t o r y , D e m o g r a p h i c s a n d
S o c i o - E c o n o m i c A n a l y s i s
A2.10 | P a g e A p p e n d i x A : B a c k g r o u n d a n d C u r r e n t C o n d i t i o n s
By jurisdiction, 25% (37,600 acres) of this planning area is unincorporated Pima County, 30% (44,934
acres) is within the Town of Marana, 14.4% (21,738 acres) is within the Town of Oro Valley, 24.8%
(37,269 acres) is within the Coronado National Forest, 3.7% (5,495 acres) is Catalina State Park, and the
remaining 2.3% (3,415 acres) is within Tortolita Mountain Park.
Privately-owned lands (69,290 acres) constitute 46% of the planning area. With 42,708 acres, the
Coronado National Forest controls 28.4% and with 36,265 acres, the Arizona State Land Department
controls 24% of the planning area. The remaining acreage is owned by the Bureau of Reclamation (886
acres), Bureau of Land Management (638 acres), Catalina State Park (19 acres), and Pima County Parks
and Recreation (522 acres), and entails “GIS mapping alignment shift” (124 acres) accounting for a total
of 2,189 acres or approximately 1.5% of the total area.
San Pedro Planning Area (12)
The San Pedro planning area encompasses approximately 174,332 acres in the northeastern region of
Pima County. The northern boundary of the planning area is the Pima/Pinal County line, a small portion
of the eastern boundary is the Pima/Graham County line with the majority of the boundary being the
Pima/Cochise County line. The western/southwestern boundary is the ridgelines of the Coronado
National Forest and the Saguaro National Park (east) abutting Planning Areas 10, 9, and 11.
By jurisdiction, 51.7% (90,180 acres) is unincorporated Pima County, 43.1% (75,070 acres) is the
Coronado National Forest, 5.1% (8,867 acres) is the Saguaro National Park (east) and .12% (215 acres) is
the Bingham-Cienega Natural Preserve.
Privately-owned lands (25,352 acres) constitute 14.5% of the planning area. With 73,124 acres, the
Coronado National Forest controls 42%, with 66,899 acres, the Arizona State Land Department controls
38.4%, and with 8,819 acres, the Saguaro National Park (east) has 5.1% of the planning area.
Ajo-Why Planning Area (13)
The Ajo-Why planning area includes Ajo and Why. Ajo is located in the Sonoran Desert, tucked away in
Western Pima County, about 120 miles southwest of Phoenix and 130 miles west of Tucson. Why
(O'odham: Ban Hi:nk) is a small unincorporated rural community in Pima County, Arizona. It lies near the
western border of the Tohono O'Odham Indian Reservation and due north of Organ Pipe Cactus
National Monument in Southern Arizona. It is approximately thirty miles north of the Mexican border
where Lukeville, Arizona, and Sonoita, Sonora, Mexico meet, and ten miles south of Ajo, Arizona. Why is
located at the junction of state routes 85 & 86. The population in Why at the 2000 census was
approximately 116.
Ajo is landlocked with the Tohono O'odham Nation to the east, Organ Pipe Cactus National Monument
to the south, and the Cabeza Prieta National Wildlife Refuge and Goldwater Gunnery Range to the north

I n v e n t o r y , D e m o g r a p h i c s a n d
S o c i o - E c o n o m i c A n a l y s i s
A2.11 | P a g e A p p e n d i x A : B a c k g r o u n d a n d C u r r e n t C o n d i t i o n s
and west, and lands managed by the Bureau of Land Management (BLM) completely surround Ajo,
restricting expansion and agricultural production.
Within Ajo, Pima County owns several plots north of the town, run by the Pima County Natural
Resources Parks and Recreation (NRPR) department. The State of Arizona owns several scattered plots
around the Town of Why. Privately owned lands make up the rest.
2.3 Rural, Suburban, and Urban Areas
In addition to planning area uniqueness, Pima County is characterized by three distinct development
patterns, urban, suburban and rural. The vast majority of the county population lies in and around the
City of Tucson, filling much of the eastern part of the county with urban development. Tucson is a major
employment, commerce and academic center. Other jurisdictions in the County include Oro Valley,
Marana, Sahuarita, South Tucson, and the unincorporated community of Green Valley. The rest of the
county is sparsely populated and primarily rural in character. The largest towns are Sells, the capital of
the Tohono O'odham Nation, and Ajo in the far western region of the county.
The American Planning Association (APA) defines rural, suburban and urban areas. Rural is defined as
sparsely developed areas where the land is primarily used for farming, forestry, agriculture, resource
extraction, very low-density residential uses, or open space uses. The term rural is used to identify those
areas in the county with the lowest population density. Rural areas are typically characterized by larger
residential lots. They also include areas where livestock and agriculture are existing and/or permitted
uses. This development pattern is generally not served by water and sewer lines due to cost of
extending infrastructure to such areas. Instead, development in rural areas is generally served by water
wells and septic tanks.
Suburban areas include the low- to medium-density development patterns which surround the
downtown or other more intense urban areas. Suburban development is often residential in character
with single-family detached residential uses as the primary use of land. Increasingly, the suburbs include
employment and service centers as well as residential areas.
Urban areas are generally characterized of, or constituting a city. Urban development pattern is
characterized by moderate and higher density residential development (i.e., three or more dwelling
units per acre), commercial, industrial, institutional and government uses as well as the availability of
public services required for that development, specifically central water and sewer, road network, public
transit and other such services.

I n v e n t o r y , D e m o g r a p h i c s a n d
S o c i o - E c o n o m i c A n a l y s i s
A2.12 | P a g e A p p e n d i x A : B a c k g r o u n d a n d C u r r e n t C o n d i t i o n s
2.4 Planning Areas and Settlements
Table 2.4. shows all of the communities, including incorporated jurisdictions, within each planning area.
TABLE 2.4.a: Major Communities by Planning Area
Planning Area Communities Incorporated, Unincorporated, Other
1. Avra Valley Picture Rocks Unincorporated
Marana (town) Incorporated
2. Tucson Mountains Tucson Mountains Unincorporated
3. Southwest Tucson Estates Unincorporated
Ajo Way/Valencia Road corridors Unincorporated
Pascua Yaqui Tribe Sovereign Nation
4. Altar Valley Arivaca Unincorporated
Diamond Bell Unincorporated
Sasabe Unincorporated
Sierrita Mountain Unincorporated
Robles Junction/Three Points Unincorporated
5. Upper Santa Cruz Amado Unincorporated
Arivaca Junction Unincorporated
Continental Unincorporated
Elephant Head Unincorporated
Green Valley Unincorporated
Montana Vista Unincorporated
Sahuarita (town) Incorporated
6. Mountain View Mescal/J6 Unincorporated
7. Southeast Corona de Tucson Unincorporated
I-10 Airport Unincorporated
Vail/Mountain View / New Tucson
Unincorporated
8. Central Flowing Wells Unincorporated
Tucson (city) Incorporated
South Tucson (city) Incorporated
9. Catalina Foothills Catalina Foothills Unincorporated
Tanque Verde Unincorporated
Summerhaven Unincorporated
10. Rincon Valley Vail and West of Camino Loma Alta Unincorporated
11. Tortolita Catalina Unincorporated
Oro Valley (town) Incorporated
Casas Adobes Unincorporated
Marana (town) Incorporated
12. San Pedro Redington Unincorporated
13. Ajo-Why Ajo Unincorporated
Why Unincorporated
Lukeville Unincorporated

I n v e n t o r y , D e m o g r a p h i c s a n d
S o c i o - E c o n o m i c A n a l y s i s
A2.13 | P a g e A p p e n d i x A : B a c k g r o u n d a n d C u r r e n t C o n d i t i o n s
2.5 Environmental Considerations: Topography, Hydrology,
Biological Resources
Topography
According to Table 2.5.a, of the total 3,393,581 acres located within the non-tribal planning areas of the
County, approximately 254,072acres, or 7.5 percent, include 15-25 percent slopes, and approximately
442,027acres, or 13.03 percent, include 25 percent or greater slopes.
TABLE 2.5.a: Slopes 15-25 Percent and 25 percent and Greater by Planning Area (non-tribal lands)
Planning Area Total Acres
15-25 Percent Slopes
25 Percent and Greater
Slopes
1. Avra Valley 315,942 10,893 14,653
2. Tucson Mountains 50,616 4,478 6,297
3. Southwest 75,922 2,778 4,064
4. Altar Valley 661,888 43,607 67,759
5. Upper Santa Cruz 176,606 9,530 8,674
6. Mountain View 183,194 26,852 16,223
7. Southeast 221,727 8,455 18,942
8. Central 79,887 3 0
9. Catalina Foothills 200,400 26,701 72,851
10. Rincon Valley 122,141 15,244 29,258
11. Tortolita 150,337 11,402 33,753
12. San Pedro 174,268 34,589 58,573
13. Ajo-Why 980,653 59,540 110,980
Total All Planning Areas (Non-Tribal): 3,393,581 254,072 442,027
Total County (Non-Tribal): 3,393,994 254,126 442,161
Total County (including Tribal): 5,880,851 355,506 606,497
Source: Pima County Geographic Information Systems, 2013
Exhibits 2.5.a and 2.5.b, included at the end of this chapter, show topography.

I n v e n t o r y , D e m o g r a p h i c s a n d
S o c i o - E c o n o m i c A n a l y s i s
A2.14 | P a g e A p p e n d i x A : B a c k g r o u n d a n d C u r r e n t C o n d i t i o n s
Hydrology, Drainage and Washes
According to Table 2.5.b, of the total 3,521,131acres located within the County Planning Areas,
approximately 278,987acres, or 7.9 percent are located within Pima County designated flood plains.
TABLE 2.5.b: Acreage within the 100 Year Floodplain by Planning Area
Planning Area Total Acres
Pima County Designated Floodplain
Acreage
1. Avra Valley 316,532 84,065
2. Tucson Mountains 50,616 4,665
3. Southwest 150,724 33,603
4. Altar Valley 712,378 33,449
5. Upper Santa Cruz 176,779 6,132
6. Mountain View 183,452 5,921
7. Southeast 221,850 42,174
8. Central 79,887 6,808
9. Catalina Foothills 200,400 8,331
10. Rincon Valley 122,162 4,480
11. Tortolita 150,413 28,498
12. San Pedro 174,438 3,220
13. Ajo-Why 981,500 17,642
Total all Planning Areas: 3,521,131 278,987
Total County: 5,880,851 279,769
Source: Pima County Geographic Information Systems, 2013
Exhibits 2.5.c and 2.5.d, included at the end of this chapter, show hydrology.

I n v e n t o r y , D e m o g r a p h i c s a n d
S o c i o - E c o n o m i c A n a l y s i s
A2.15 | P a g e A p p e n d i x A : B a c k g r o u n d a n d C u r r e n t C o n d i t i o n s
Biological Resources
According to Table 2.5.c, of the total 3,521,131acres located within the County planning areas,
approximately 158,110 acres, or 4.5 percent, are located in Important Riparian Areas (IRA);
approximately 899,653 acres, or 25.6 percent, are located in Biological Core Management Areas;
approximately 1,389,261 acres, or 39.5 percent, are located Special Species Management Areas (SSMA);
and approximately 535,657acres, or 15.2 percent, are located in Designated Wildlife Linkages.
TABLE 2.5.c: Important Riparian Areas, Biological Core, Special Species Management Areas (SSMA)
and Designated Wildlife Linkages per Planning Area
Planning Area Important Riparian
Areas (IRA)
Biological Core
Management Areas
Special Species
Management Areas
(SSMA)
Designated Wildlife Linkages
1. Avra Valley 24,260 18,620 209,122 65,584
2. Tucson Mountains 4,976 1,720 23,174 6,340
3. Southwest 4,127 5,523 23,901 3,399
4. Altar Valley 53,742 253,637 433,130 164,535
5. Upper Santa Cruz 8,782 65,451 0 50,993
6. Mountain View 15,884 80,205 0 53,112
7. Southeast 9,868 107,361 0 18,249
8. Central 1,251 43 0 0
9. Catalina Foothills 8,864 51,370 17,412 21,113
10. Rincon Valley 6,927 73,005 22,170 22,976
11. Tortolita 10,795 23,510 47,637 29,927
12. San Pedro 8,634 102,762 15,957 99,428
13. Ajo-Why 0 116,447 596,758 0
Total All Planning Areas: 158,110 899,653 1,389,261 535,657
Total County: 158,178 899,915 1,390,968 695,829
Pima County Geographic Information Systems, 2013
Exhibits 2.5.e and 2.5.f, included at the end of this chapter, show Important Riparian Areas, Biological
Core, Special Species Management Areas (SSMA) and Designated Wildlife Linkages.

I n v e n t o r y , D e m o g r a p h i c s a n d
S o c i o - E c o n o m i c A n a l y s i s
A2.16 | P a g e A p p e n d i x A : B a c k g r o u n d a n d C u r r e n t C o n d i t i o n s
TABLE 2.5.d: Physical Constraints per Planning Area
Planning Area Total Acres within County Designated
Floodplains
Total Acres with 15 to 25 Percent
Slopes
Total Acres with 25 Percent or Greater
Slopes
Important Riparian Areas
(IRA)
Biological Core
Management Areas
Special Species Management
Areas (SSMA)
Designated Wildlife Linkages
1. Avra Valley 84,065 10,893 14,653 24,260 18,620 209,122 65,584
2. Tucson Mountains 4,665 4,478 6,297 4,976 1,720 23,174 6,340
3. Southwest 33,603 2,778 4,064 4,127 5,523 23,901 3,399
4. Altar Valley 33,449 43,607 67,759 53,742 253,637 433,130 164,535
5. Upper Santa Cruz 6,132 9,530 8,674 8,782 65,451 0 50,993
6. Mountain View 5,921 26,852 16,223 15,884 80,205 0 53,112
7. Southeast 42,174 8,455 18,942 9,868 107,361 0 18,249
8. Central 6,808 3 0 1,251 43 0 0
9. Catalina Foothills 8,331 26,701 72,851 8,864 51,370 17,412 21,113
10. Rincon Valley 4,480 15,244 29,258 6,927 73,005 22,170 22,976
11. Tortolita 28,498 11,402 33,753 10,795 23,510 47,637 29,927
12. San Pedro 3,220 34,589 58,573 8,634 102,762 15,957 99,428
13. Ajo-Why 17,642 59,540 110,980 0 116,447 596,758 0
Total All Planning Areas: 278,987 254,072 442,027 158,110 899,653 1,389,261 535,657
Total County: 279,769 254,126 442,161 158,178 899,915 1,390,968 695,829
Pima County Geographic Information Systems, 2013
According to Table 2.5.d, of the total 3,521,131acres located within the County planning areas, approximately 254,072 acres, or 7.21 percent, include 15-25 percent slopes, and approximately 442,027 acres, or
13.03 percent, include 25 percent or greater slopes; approximately 278,987 acres, or 7.9 percent are located within Pima County designated flood plains; approximately 158,110 acres, or 4.5 percent, are located in
Important Riparian Areas (IRA); approximately 899,653 acres, or 25.6 percent, are located in Biological Core Management Areas; approximately 1,389,261 acres, or 39.5 percent, are located Special Species
Management Areas (SSMA); and approximately 535,657 acres, or 15.2 percent, are located in Designated Wildlife Linkages.

I n v e n t o r y , D e m o g r a p h i c s a n d
S o c i o - E c o n o m i c A n a l y s i s
A2.17 | P a g e A p p e n d i x A : B a c k g r o u n d a n d C u r r e n t C o n d i t i o n s
Demographics
2.6 Existing and Projected Population
Population Growth
Throughout the decade of the 1990’s Pima County’s population grew by 40 percent, which is much faster
than Arizona as a whole at 13 percent. The unincorporated county also experienced rapid population
growth with a 28 percent increase over the 10 year time horizon. The decade of the 2000’s saw a
slowdown of this robust population growth for these three areas. However, the rate of growth for the
unincorporated county in the 2000’s outpaced Pima County as a whole (Figure 1).
Figure 1 – Arizona, Pima County and Unincorporated County Population Growth, 1990-2000 and 2000-2010

I n v e n t o r y , D e m o g r a p h i c s a n d
S o c i o - E c o n o m i c A n a l y s i s
A2.18 | P a g e A p p e n d i x A : B a c k g r o u n d a n d C u r r e n t C o n d i t i o n s
When considering the 14 defined “planning” areas in Pima County (of which Planning Area 14 (Tohono
O’odham Nation) is defined only for statistical purposes since Pima County has no jurisdiction over a
sovereign nation) (Figure 2), all of them grew in the 2000’s with the exception of Altar Valley, Ajo-Why and
the Tohono O’odham, which lost population. The planning areas that grew the fastest are the Upper
Santa Cruz and Rincon Valley at 90 percent and 313 percent respectively.
Figure 2 – Pima County Planning Areas Population Growth, 1990-2000 and 2000-2010
Of the four incorporated cities within Pima County, Sahuarita received the largest gains in population
growing from 3,242 people in the year 2000 to 25,259 by 2010, for a 679 percent population growth.
Marana’s population growth spurt cooled down in the decade of the 2000’s and grew at 158 percent,
significantly slower than 520 percent experienced from 1990-2000. Tucson and South Tucson are growing
at a much slower pace than all other areas.
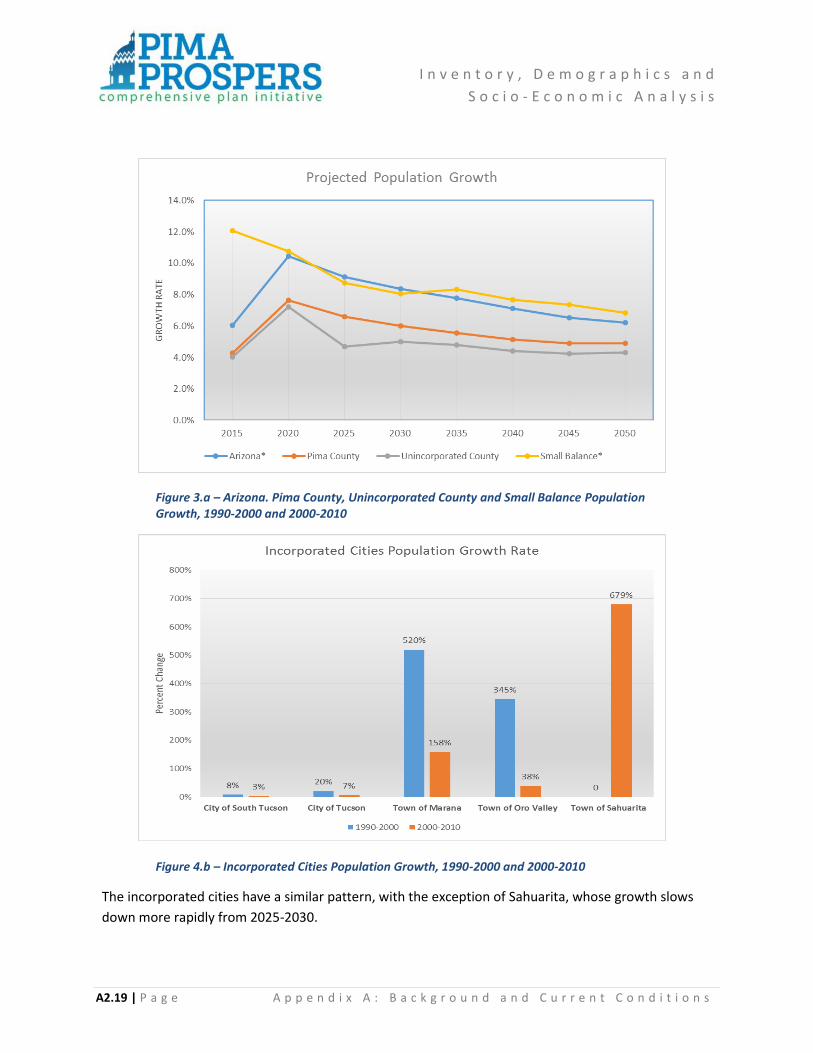
I n v e n t o r y , D e m o g r a p h i c s a n d
S o c i o - E c o n o m i c A n a l y s i s
A2.19 | P a g e A p p e n d i x A : B a c k g r o u n d a n d C u r r e n t C o n d i t i o n s
Figure 3.a – Arizona. Pima County, Unincorporated County and Small Balance Population Growth, 1990-2000 and 2000-2010
Figure 4.b – Incorporated Cities Population Growth, 1990-2000 and 2000-2010
The incorporated cities have a similar pattern, with the exception of Sahuarita, whose growth slows
down more rapidly from 2025-2030.

I n v e n t o r y , D e m o g r a p h i c s a n d
S o c i o - E c o n o m i c A n a l y s i s
A2.20 | P a g e A p p e n d i x A : B a c k g r o u n d a n d C u r r e n t C o n d i t i o n s
The following Table 2.6.a contains the 1990, 2000 and 2010 population counts by place and planning
area.
TABLE 2.6.a: 1990, 2000 and 2010 Population Counts
Place 1990 2000 2010
United States 248,709,873 281,421,906 308,745,538
Arizona 3,665,228 5,130,632 6,392,017
Pima County 666,880 843,731 980,263
Unincorporated Pima County 247,540 305,059 353,264
Planning Areas
1. Avra Valley 9,890 16,922 22,853
2. Tucson Mountains 30,724 46,211 63,422
3. Southwest 51,324 69,186 89,341
4. Altar Valley 3,759 6,923 7,062
5. Upper Santa Cruz 17,547 24,586 49,822
6. Mountain View 678 1,152 1,334
7. Southeast 72,361 92,940 116,512
8. Central 279,082 309,344 321,216
9. Catalina Foothills 140,837 171,595 176,907
10. Rincon Valley 1,549 3,808 12,861
11. Tortolita 47,906 89,597 108,154
12. San Pedro 54 126 103
13. Ajo-Why 3,401 3,903 3,524
14. Tohono O’odham 7,768 7,453 7,152
Incorporated Areas
City of South Tucson 5,093 5,490 5,652
City of Tucson 405,390 486,699 520,116
Town of Marana 2,187 13,556 34,961
Town of Oro Valley 6,670 29,700 41,011
Town of Sahuarita n/a 3,242 25,259
Source: US Bureau of the Census 1990, 2000 and 2010 counts.
Population Projections
Population projections from the U.S. Census Bureau were used to calculate the rate of change every five
years from 2015 to 2050. Growth continues on an upward trajectory through 2020 and has a sharp
decline between the years 2020 to 2025. After 2025 the rate of growth continues to gradually slow for all
areas.
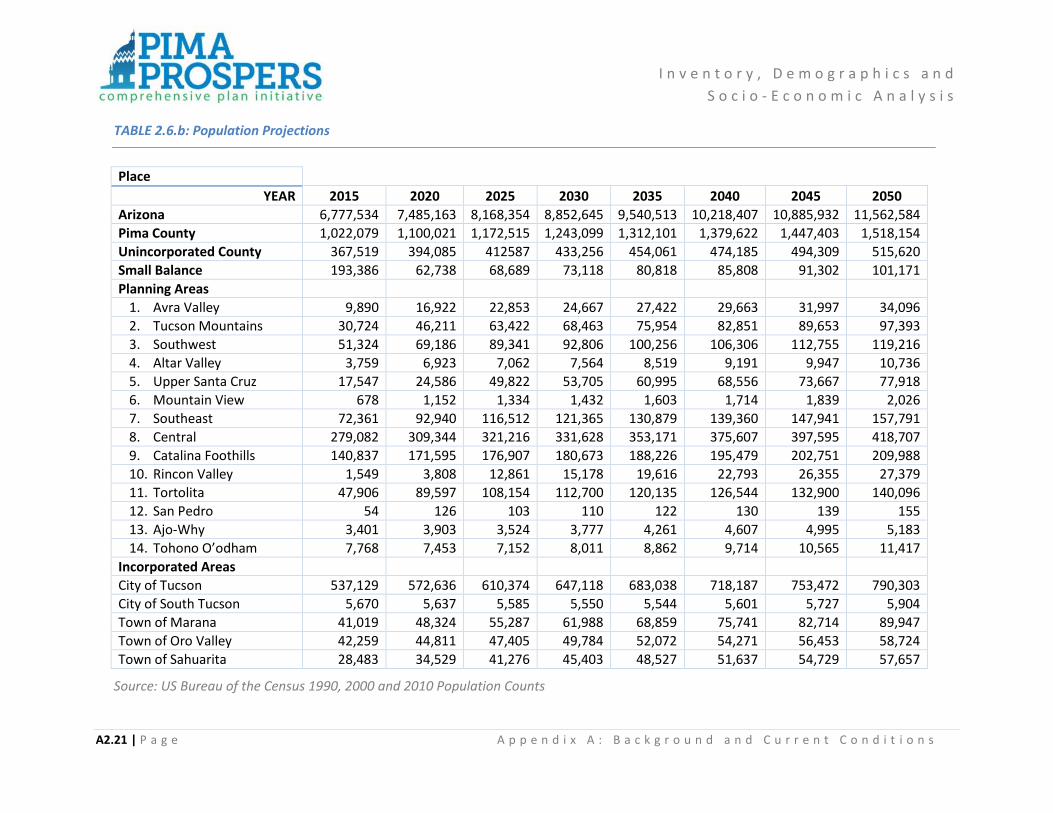
I n v e n t o r y , D e m o g r a p h i c s a n d
S o c i o - E c o n o m i c A n a l y s i s
A2.21 | P a g e A p p e n d i x A : B a c k g r o u n d a n d C u r r e n t C o n d i t i o n s
TABLE 2.6.b: Population Projections
Place
YEAR 2015 2020 2025 2030 2035 2040 2045 2050
Arizona 6,777,534 7,485,163 8,168,354 8,852,645 9,540,513 10,218,407 10,885,932 11,562,584
Pima County 1,022,079 1,100,021 1,172,515 1,243,099 1,312,101 1,379,622 1,447,403 1,518,154
Unincorporated County 367,519 394,085 412587 433,256 454,061 474,185 494,309 515,620
Small Balance 193,386 62,738 68,689 73,118 80,818 85,808 91,302 101,171
Planning Areas
1. Avra Valley 9,890 16,922 22,853 24,667 27,422 29,663 31,997 34,096
2. Tucson Mountains 30,724 46,211 63,422 68,463 75,954 82,851 89,653 97,393
3. Southwest 51,324 69,186 89,341 92,806 100,256 106,306 112,755 119,216
4. Altar Valley 3,759 6,923 7,062 7,564 8,519 9,191 9,947 10,736
5. Upper Santa Cruz 17,547 24,586 49,822 53,705 60,995 68,556 73,667 77,918
6. Mountain View 678 1,152 1,334 1,432 1,603 1,714 1,839 2,026
7. Southeast 72,361 92,940 116,512 121,365 130,879 139,360 147,941 157,791
8. Central 279,082 309,344 321,216 331,628 353,171 375,607 397,595 418,707
9. Catalina Foothills 140,837 171,595 176,907 180,673 188,226 195,479 202,751 209,988
10. Rincon Valley 1,549 3,808 12,861 15,178 19,616 22,793 26,355 27,379
11. Tortolita 47,906 89,597 108,154 112,700 120,135 126,544 132,900 140,096
12. San Pedro 54 126 103 110 122 130 139 155
13. Ajo-Why 3,401 3,903 3,524 3,777 4,261 4,607 4,995 5,183
14. Tohono O’odham 7,768 7,453 7,152 8,011 8,862 9,714 10,565 11,417
Incorporated Areas
City of Tucson 537,129 572,636 610,374 647,118 683,038 718,187 753,472 790,303
City of South Tucson 5,670 5,637 5,585 5,550 5,544 5,601 5,727 5,904
Town of Marana 41,019 48,324 55,287 61,988 68,859 75,741 82,714 89,947
Town of Oro Valley 42,259 44,811 47,405 49,784 52,072 54,271 56,453 58,724
Town of Sahuarita 28,483 34,529 41,276 45,403 48,527 51,637 54,729 57,657
Source: US Bureau of the Census 1990, 2000 and 2010 Population Counts

I n v e n t o r y , D e m o g r a p h i c s a n d
S o c i o - E c o n o m i c A n a l y s i s
A2.22 | P a g e A p p e n d i x A : B a c k g r o u n d a n d C u r r e n t C o n d i t i o n s
Population Counts 1990, 2000 and 2010 by Age and Gender by Planning Area
For all of the planning areas, the overall average ratio of males to females is 49.1 percent to 50.9 percent.
However, when you examine each of the planning areas separately (Figure 5), the Upper Santa Cruz has 6
percent more females than males with a ratio of 53.1 percent to 46.9 percent. This area embodies the
retirement communities of Green Valley and also contains the oldest population. The planning area that
has 3.3 percent more males than females is the Southeast, which also has one of the youngest
populations.
Figure 5 – 2010 Planning Area Ratio of Male to Female
When examining the age of the population within the planning areas for the year 2010, the Southeast
and Tohono O’odham have the youngest population with a little over one-third being 19 years of age and
younger. The planning areas with the largest percent of people over the age of 50 include Santa Cruz and
San Pedro.
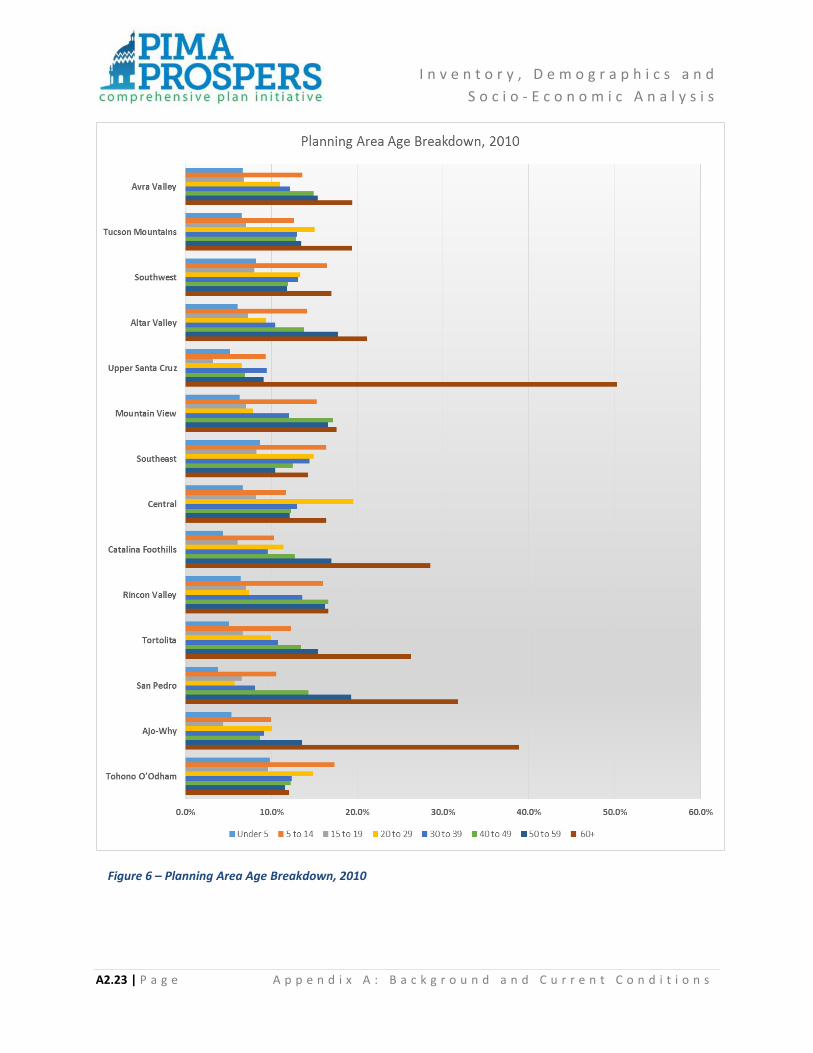
I n v e n t o r y , D e m o g r a p h i c s a n d
S o c i o - E c o n o m i c A n a l y s i s
A2.23 | P a g e A p p e n d i x A : B a c k g r o u n d a n d C u r r e n t C o n d i t i o n s
Figure 6 – Planning Area Age Breakdown, 2010
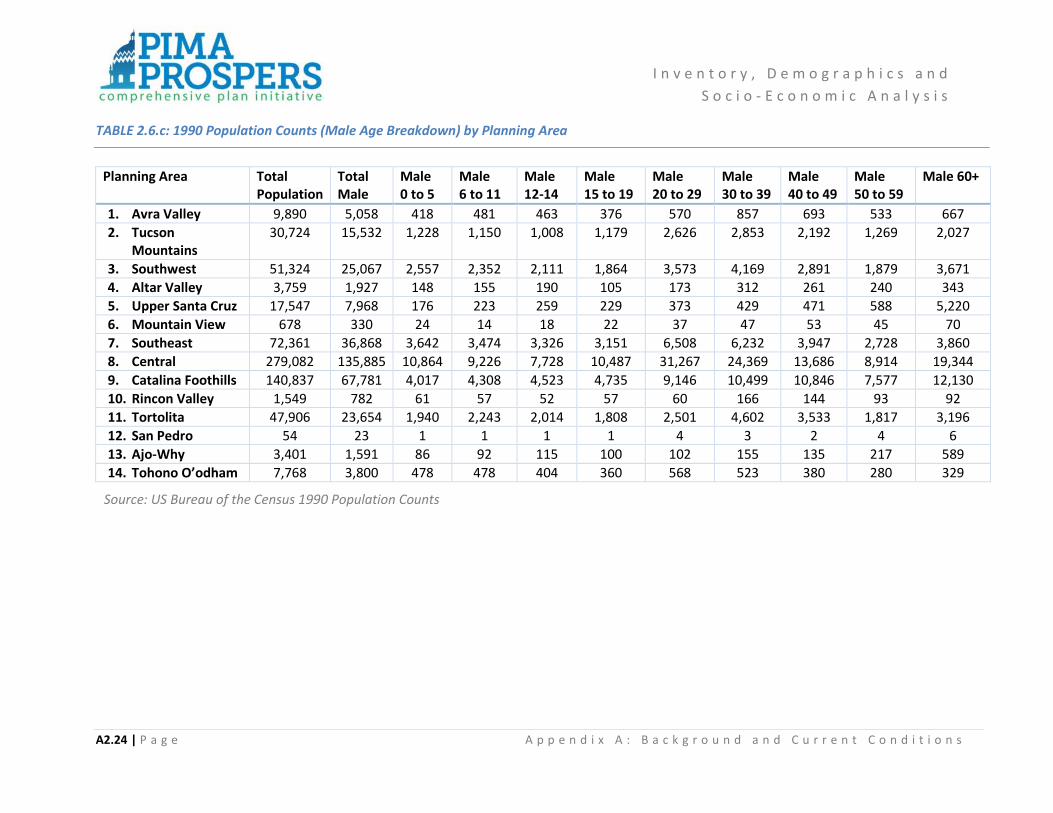
I n v e n t o r y , D e m o g r a p h i c s a n d
S o c i o - E c o n o m i c A n a l y s i s
A2.24 | P a g e A p p e n d i x A : B a c k g r o u n d a n d C u r r e n t C o n d i t i o n s
TABLE 2.6.c: 1990 Population Counts (Male Age Breakdown) by Planning Area
Planning Area Total Population
Total Male
Male 0 to 5
Male 6 to 11
Male 12-14
Male 15 to 19
Male 20 to 29
Male 30 to 39
Male 40 to 49
Male 50 to 59
Male 60+
1. Avra Valley 9,890 5,058 418 481 463 376 570 857 693 533 667
2. Tucson Mountains
30,724 15,532 1,228 1,150 1,008 1,179 2,626 2,853 2,192 1,269 2,027
3. Southwest 51,324 25,067 2,557 2,352 2,111 1,864 3,573 4,169 2,891 1,879 3,671
4. Altar Valley 3,759 1,927 148 155 190 105 173 312 261 240 343
5. Upper Santa Cruz 17,547 7,968 176 223 259 229 373 429 471 588 5,220
6. Mountain View 678 330 24 14 18 22 37 47 53 45 70
7. Southeast 72,361 36,868 3,642 3,474 3,326 3,151 6,508 6,232 3,947 2,728 3,860
8. Central 279,082 135,885 10,864 9,226 7,728 10,487 31,267 24,369 13,686 8,914 19,344
9. Catalina Foothills 140,837 67,781 4,017 4,308 4,523 4,735 9,146 10,499 10,846 7,577 12,130
10. Rincon Valley 1,549 782 61 57 52 57 60 166 144 93 92
11. Tortolita 47,906 23,654 1,940 2,243 2,014 1,808 2,501 4,602 3,533 1,817 3,196
12. San Pedro 54 23 1 1 1 1 4 3 2 4 6
13. Ajo-Why 3,401 1,591 86 92 115 100 102 155 135 217 589
14. Tohono O’odham 7,768 3,800 478 478 404 360 568 523 380 280 329
Source: US Bureau of the Census 1990 Population Counts

I n v e n t o r y , D e m o g r a p h i c s a n d
S o c i o - E c o n o m i c A n a l y s i s
A2.25 | P a g e A p p e n d i x A : B a c k g r o u n d a n d C u r r e n t C o n d i t i o n s
TABLE 2.6.d: 1990 Population Counts (Female Age Breakdown) by Planning Area
Planning Area Total Population
Total Female
Female 0 to 5
Female 6 to 11
Female 12-14
Female 15 to 19
Female 20 to 29
Female 30 to 39
Female 40 to 49
Female 50 to 59
Female 60+
1. Avra Valley 9,890 4,832 388 408 374 353 647 839 702 490 631
2. Tucson Mountains 30,724 15,192 1,101 1,102 1,015 1,035 2,307 2,677 2,026 1,370 2,559
3. Southwest 51,324 26,257 2,379 2,298 1,989 1,802 3,997 4,468 2,873 1,995 4,456
4. Altar Valley 3,759 1,832 130 157 165 108 206 306 245 213 302
5. Upper Santa Cruz 17,547 9,579 213 239 234 246 340 478 542 833 6,454
6. Mountain View 678 348 27 24 12 10 43 57 58 48 69
7. Southeast 72,361 35,493 3,467 3,294 3,157 3,074 5,784 5,522 3,777 2,863 4,555
8. Central 279,082 143,197 10,337 8,938 7,386 10,595 28,715 23,121 14,051 10,620 29,434
9. Catalina Foothills 140,837 73,056 3,874 4,302 4,464 4,526 9,146 11,836 11,630 8,155 15,123
10. Rincon Valley 1,549 767 53 59 68 46 71 170 127 81 92
11. Tortolita 47,906 24,252 1,770 1,996 1,918 1,542 2,909 5,120 3,417 1,861 3,719
12. San Pedro 54 31 5 4 1 3 7 4 2 3 2
13. Ajo-Why 3,401 1,810 81 101 122 95 113 191 178 245 684
14. Tohono O’odham 7,768 3,968 445 456 397 377 631 554 391 329 388
Source: US Bureau of the Census 1990 Population Counts

I n v e n t o r y , D e m o g r a p h i c s a n d
S o c i o - E c o n o m i c A n a l y s i s
A2.26 | P a g e A p p e n d i x A : B a c k g r o u n d a n d C u r r e n t C o n d i t i o n s
TABLE 2.6.e: 2000 Population Counts (Male Age Breakdown) by Planning Area
Source: US Bureau of the Census 2000 Population Counts
Planning Area Total Population
Total Male
Male Under 5
Male 5 to 14
Male 15 to 19
Male 20 to 29
Male 30 to 39
Male 40 to 49
Male 50 to 59
Male 60+
1. Avra Valley 16,922 8,685 607 726 814 693 927 1,374 1,448 974
2. Tucson Mountains 46,211 21,711 1,660 1,584 1,534 1,461 3,251 3,178 3,369 2,800
3. Southwest 69,186 33,662 2,961 3,204 3,155 2,654 4,433 4,526 4,479 3,275
4. Altar Valley 6,923 3,553 226 287 356 290 340 471 554 478
5. Upper Santa Cruz 24,586 11,244 277 309 343 324 487 567 694 1,020
6. Mountain View 1,152 579 22 43 50 33 30 69 107 106
7. Southeast 92,940 47,562 4,197 4,493 4,041 4,075 8,027 7,496 6,173 4,028
8. Central 309,344 152,008 11,125 10,549 9,728 12,120 30,629 24,321 20,951 13,443
9. Catalina Foothills 171,595 82,386 4,144 5,076 5,906 5,654 8,971 10,116 13,604 11,967
10. Rincon Valley 3,808 1,942 134 152 213 142 109 309 401 276
11. Tortolita 89,597 43,708 2,800 3,209 3,592 3,356 4,156 5,922 7,205 5,483
12. San Pedro 126 66 1 3 3 5 5 6 15 11
13. Ajo-Why 3,903 1,865 99 123 122 84 131 154 196 212
14. Tohono O’odham 7,453 3,590 392 423 406 367 510 461 409 290
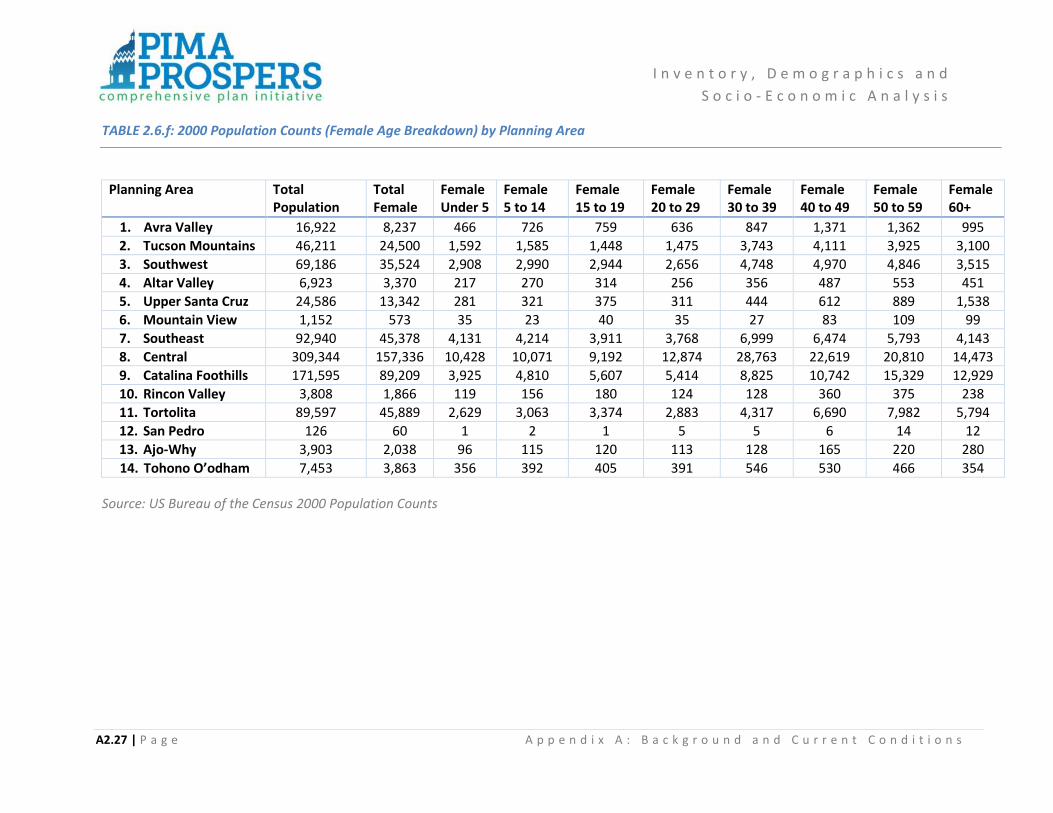
I n v e n t o r y , D e m o g r a p h i c s a n d
S o c i o - E c o n o m i c A n a l y s i s
A2.27 | P a g e A p p e n d i x A : B a c k g r o u n d a n d C u r r e n t C o n d i t i o n s
TABLE 2.6.f: 2000 Population Counts (Female Age Breakdown) by Planning Area
Source: US Bureau of the Census 2000 Population Counts
Planning Area Total Population
Total Female
Female Under 5
Female 5 to 14
Female 15 to 19
Female 20 to 29
Female 30 to 39
Female 40 to 49
Female 50 to 59
Female 60+
1. Avra Valley 16,922 8,237 466 726 759 636 847 1,371 1,362 995
2. Tucson Mountains 46,211 24,500 1,592 1,585 1,448 1,475 3,743 4,111 3,925 3,100
3. Southwest 69,186 35,524 2,908 2,990 2,944 2,656 4,748 4,970 4,846 3,515
4. Altar Valley 6,923 3,370 217 270 314 256 356 487 553 451
5. Upper Santa Cruz 24,586 13,342 281 321 375 311 444 612 889 1,538
6. Mountain View 1,152 573 35 23 40 35 27 83 109 99
7. Southeast 92,940 45,378 4,131 4,214 3,911 3,768 6,999 6,474 5,793 4,143
8. Central 309,344 157,336 10,428 10,071 9,192 12,874 28,763 22,619 20,810 14,473
9. Catalina Foothills 171,595 89,209 3,925 4,810 5,607 5,414 8,825 10,742 15,329 12,929
10. Rincon Valley 3,808 1,866 119 156 180 124 128 360 375 238
11. Tortolita 89,597 45,889 2,629 3,063 3,374 2,883 4,317 6,690 7,982 5,794
12. San Pedro 126 60 1 2 1 5 5 6 14 12
13. Ajo-Why 3,903 2,038 96 115 120 113 128 165 220 280
14. Tohono O’odham 7,453 3,863 356 392 405 391 546 530 466 354

I n v e n t o r y , D e m o g r a p h i c s a n d
S o c i o - E c o n o m i c A n a l y s i s
A2.28 | P a g e A p p e n d i x A : B a c k g r o u n d a n d C u r r e n t C o n d i t i o n s
TABLE 2.6.g: 2010 Population Counts (Male Age Breakdown) by Planning Area
Source: US Bureau of the Census 2010 Population Counts
Planning Area Total Population
Total Male
Male Under 5
Male 5 to 14
Male 15 to 19
Male 20 to 29
Male 30 to 39
Male 40 to 49
Male 50 to 59
Male 60+
1. Avra Valley 22,853 11,737 798 818 858 821 1,380 1,450 1,785 1,792
2. Tucson Mountains 63,422 31,333 1,938 1,939 1,936 2,230 5,091 4,191 4,071 4,151
3. Southwest 89,341 43,484 3,829 3,788 3,831 3,663 5,641 5,574 5,159 4,971
4. Altar Valley 7,062 3,608 198 225 241 240 342 336 462 667
5. Upper Santa Cruz 49,822 23,441 1,402 1,292 1,149 808 1,577 2,377 1,791 1,909
6. Mountain View 1,334 639 28 36 35 37 34 38 104 123
7. Southeast 116,512 60,093 5,262 5,042 4,827 5,207 9,124 8,931 8,047 6,418
8. Central 321,216 158,910 10,989 9,841 9,383 13,070 32,333 21,208 20,078 19,360
9. Catalina Foothills 176,907 84,408 3,963 4,359 4,936 5,449 10,073 8,241 10,569 13,866
10. Rincon Valley 12,861 6,444 461 506 571 516 464 884 1,050 956
11. Tortolita 108,154 52,050 2,745 3,125 3,701 3,708 5,329 5,578 6,761 7,766
12. San Pedro 103 53 1 4 3 4 3 5 6 7
13. Ajo-Why 3,524 1,763 93 91 95 85 174 176 161 223
14. Tohono O’odham 7,152 3,473 352 325 334 361 526 445 407 362

I n v e n t o r y , D e m o g r a p h i c s a n d
S o c i o - E c o n o m i c A n a l y s i s
A2.29 | P a g e A p p e n d i x A : B a c k g r o u n d a n d C u r r e n t C o n d i t i o n s
TABLE 2.6.h: 2010 Population Counts (Female Age Breakdown) by Planning Area
Source: US Bureau of the Census 2010 Population Counts
Planning Area Total Population
Total Female
Female Under 5
Female 5 to 14
Female 15 to 19
Female 20 to 29
Female 30 to 39
Female 40 to 49
Female 50 to 59
Female 60+
1. Avra Valley 22,853 11,116 781 719 764 741 1,193 1,412 1,677 1,661
2. Tucson Mountains 63,422 32,089 1,989 1,908 1,909 2,175 4,676 4,164 4,108 4,498
3. Southwest 89,341 45,857 3,630 3,638 3,683 3,521 6,046 6,088 5,551 5,634
4. Altar Valley 7,062 3,454 182 219 234 218 287 351 485 662
5. Upper Santa Cruz 49,822 26,381 1,278 1,300 1,120 865 1,793 2,478 1,789 2,771
6. Mountain View 1,334 695 23 40 52 36 38 49 132 128
7. Southeast 116,512 56,419 4,897 4,962 4,726 4,686 8,158 7,784 6,939 6,216
8. Central 321,216 162,306 10,390 9,523 8,726 13,280 30,453 20,528 19,361 19,743
9. Catalina Foothills 176,907 92,499 3,737 4,148 4,655 5,240 10,269 8,591 11,869 16,182
10. Rincon Valley 12,861 6,417 426 525 523 472 481 964 1,074 995
11. Tortolita 108,154 56,104 2,682 3,021 3,458 3,510 5,308 6,041 7,768 9,143
12. San Pedro 103 50 1 2 1 4 5 4 7 9
13. Ajo-Why 3,524 1,761 95 85 80 69 181 148 145 253
14. Tohono O’odham 7,152 3,679 351 292 298 329 542 441 468 465
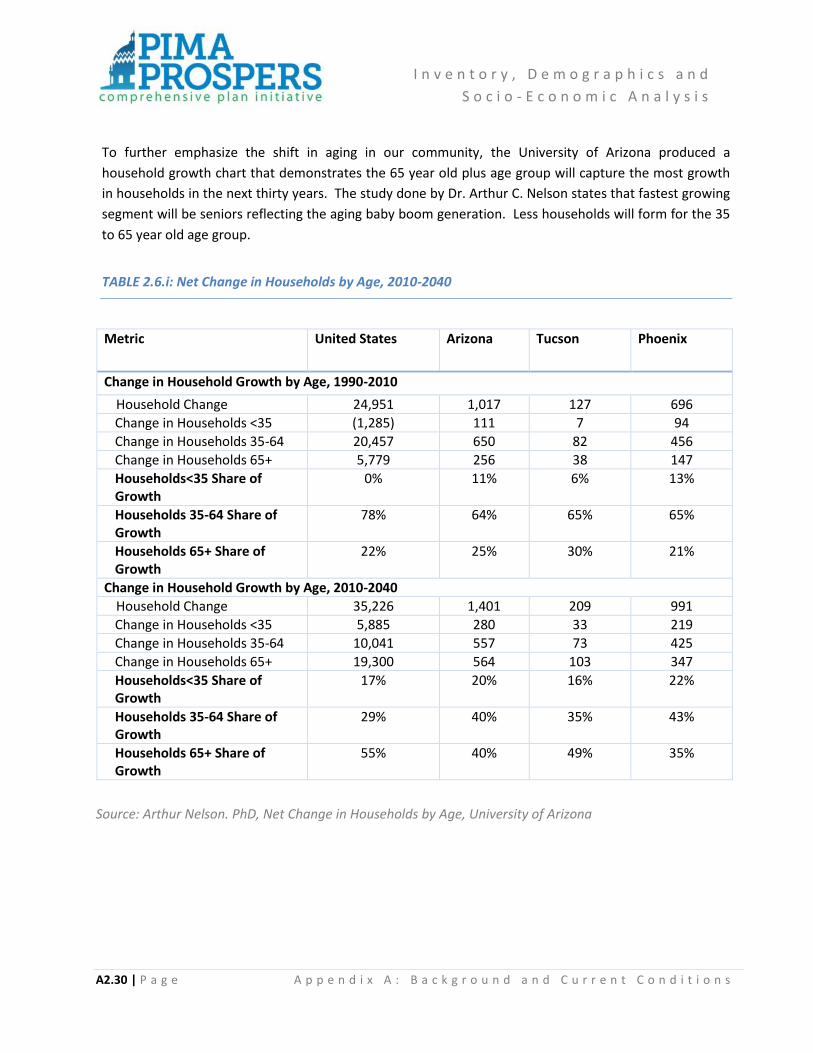
I n v e n t o r y , D e m o g r a p h i c s a n d
S o c i o - E c o n o m i c A n a l y s i s
A2.30 | P a g e A p p e n d i x A : B a c k g r o u n d a n d C u r r e n t C o n d i t i o n s
To further emphasize the shift in aging in our community, the University of Arizona produced a
household growth chart that demonstrates the 65 year old plus age group will capture the most growth
in households in the next thirty years. The study done by Dr. Arthur C. Nelson states that fastest growing
segment will be seniors reflecting the aging baby boom generation. Less households will form for the 35
to 65 year old age group.
TABLE 2.6.i: Net Change in Households by Age, 2010-2040
Source: Arthur Nelson. PhD, Net Change in Households by Age, University of Arizona
Metric United States Arizona Tucson Phoenix
Change in Household Growth by Age, 1990-2010
Household Change 24,951 1,017 127 696
Change in Households <35 (1,285) 111 7 94
Change in Households 35-64 20,457 650 82 456
Change in Households 65+ 5,779 256 38 147
Households<35 Share of Growth
0% 11% 6% 13%
Households 35-64 Share of Growth
78% 64% 65% 65%
Households 65+ Share of Growth
22% 25% 30% 21%
Change in Household Growth by Age, 2010-2040
Household Change 35,226 1,401 209 991
Change in Households <35 5,885 280 33 219
Change in Households 35-64 10,041 557 73 425
Change in Households 65+ 19,300 564 103 347
Households<35 Share of Growth
17% 20% 16% 22%
Households 35-64 Share of Growth
29% 40% 35% 43%
Households 65+ Share of Growth
55% 40% 49% 35%

I n v e n t o r y , D e m o g r a p h i c s a n d
S o c i o - E c o n o m i c A n a l y s i s
A2.31 | P a g e A p p e n d i x A : B a c k g r o u n d a n d C u r r e n t C o n d i t i o n s
2.7 Socioeconomic Conditions Assessment
The socioeconomic conditions in Pima County were assessed as part of the Pima Prospers Comprehensive
Plan initiative to determine planning area trends and needs. Unless specified otherwise, most of the
information in this section is based on block level US Bureau of Census decennial census for 1990, 2000
and 2010 by place and the planning area.
Race and Ethnicity 1990, 2000 and 2010
When comparing the race and ethnic mix of the population between the U.S., Arizona and
unincorporated Pima County, there are some key distinctions. The U.S. has a larger percentage of a White
Non-Hispanic and Black population than Arizona or the unincorporated county (Figure 7). Arizona and the
unincorporated county have a larger representation of Hispanic and American Indian than the U.S. as a
whole.
Figure 7 – 2010 Race and Ethnicity U.S., Arizona and the Unincorporated Pima County
Over time, Arizona and the unincorporated areas within Pima County have become more diverse. The
White population in 2010 represents 57 percent of the total population in the state, down from 72
percent 20 years earlier. The representation of the Hispanic population increased to 22 percent while
the Black and Asian population increased by 1 percent each (Figure 8). The unincorporated Pima County
also grew more diverse, but with a larger increase in the Hispanic population going from 24 percent to
36 percent over 20 years. Table 2.5.1 shows 1990, 2000 and 2010 race and ethnicity by place and
planning area.

I n v e n t o r y , D e m o g r a p h i c s a n d
S o c i o - E c o n o m i c A n a l y s i s
A2.32 | P a g e A p p e n d i x A : B a c k g r o u n d a n d C u r r e n t C o n d i t i o n s
Figure 8 – Arizona Race and Ethnicity, 1990-2010
Figure 9 – Unincorporated County Race and Ethnicity, 1990-2010

I n v e n t o r y , D e m o g r a p h i c s a n d
S o c i o - E c o n o m i c A n a l y s i s
A2.33 | P a g e A p p e n d i x A : B a c k g r o u n d a n d C u r r e n t C o n d i t i o n s
TABLE 2.7.a: Race and Ethnicity 1990, 2000 and 2010
Place White Non-Hispanic Hispanic Black American Indian Asian Other
YEAR 1990 2000 2010 1990 2000 2010 1990 2000 2010 1990 2000 2010 1990 2000 2010 1990 2000 2010 United States 188128296 194552774 196929412 22354059 33081736 50740089 29216293 33947837 37897524 1793773 2068883 2074523 6968359 10123169 14566264 249093 467770 558211
Arizona 2626185 3274258 4667121 688338 1225463 1,895,149 104809 149941 259008 190091 233370 296529 51530 89315 176695 4275 6120 761716
Unincorporated Pima County 454919 633,387 541700 163262 247,578 338802 19455 24047 31075 17005 21821 23558 11228 16595 24592 1011 1012 1461
Planning Area
(1) Avra Valley 79.0% 86.0% 86.7% 16.6% 19.6% 22.2% 1.9% 1% 1.7% 1.9% 2% 2.3% 0.6% 0.43% 0.8% 8.7% 9% 8.4%
(2) Tucson Mountains 47.8% 73% 75.0% 45.9% 40.6% 41.3% 3.4% 4% 3.9% 1.7% 3% 2.7% 1.1% 2.06% 3.6% 25.7% 19% 14.7%
(3) Southwest 46.0% 60% 60.3% 43.4% 52.8% 62.7% 3.0% 3% 2.7% 6.7% 9% 9.4% 0.8% 0.70% 1.0% 26.7% 27% 26.4%
(4) Altar Valley 77.0% 76% 78.6% 20.2% 36.2% 34.4% 0.7% 1% 0.9% 1.7% 3% 3.7% 0.4% 0.34% 0.5% 5.4% 19% 15.9%
(5) Upper Santa Cruz 92.2% 96% 90.0% 6.0% 10.6% 20.8% 0.7% 0.29% 1.7% 0.3% 1% 0.9% 0.7% 0.41% 1.4% 1.6% 3% 5.9%
(6) Mountain View 63.6% 95% 94.0% 30.1% 10.0% 11.0% 3.7% 0.40% 0.1% 2.1% 1% 2.2% 0.4% 0.28% 0.5% 13.2% 3% 3.5%
(7) Southeast 30.4% 56% 63.0% 64.1% 71.1% 70.2% 2.8% 3% 3.6% 1.8% 4% 3.7% 0.6% 0.58% 1.1% 43.4% 37% 28.5%
(8) Central 70.9% 77% 75.5% 21.0% 27.5% 33.3% 4.3% 5% 5.6% 1.3% 2% 2.6% 2.4% 3.03% 3.5% 10.7% 13% 12.5%
(9) Catalina Foothills 87.9% 91% 88.4% 8.2% 10.7% 15.1% 1.7% 2% 2.9% 0.3% 1% 0.9% 1.9% 2.69% 3.9% 2.6% 3% 3.8%
(10) Rincon Valley 81.6% 93% 89.5% 13.8% 13.6% 17.2% 2.8% 0.2% 3.0% 0.0% 1% 0.6% 1.8% 0.42% 2.5% 5.2% 5% 4.3%
(11) Tortolita 86.5% 92% 89.5% 10.6% 13.5% 17.6% 1.1% 1% 1.9% 0.3% 1% 0.8% 1.5% 1.77% 2.7% 4.2% 4% 5.0%
(12) San Pedro 88.5% 90% 90.4% 9.5% 15.7% 22.3% 0.8% 0% 0.0% 0.1% 7% 2.0% 0.9% 0.00% 0.0% 3.3% 3% 7.5%
(13) Ajo-Why 1404 2015 1723 1256 1285 1266 4 5 16 238 216 217 17 10 31 0 0 1
(14) Tohono O’odham 264 873 10,201 521 761 971 12 11 28 9,553 9,718 9,139 7 17 23 66 168 419
Incorporated Areas
City of South Tucson 359 496 578 4244 4316 4435 114 112 127 329 356 420 14 17 35 33 5 13
City of Tucson 256844 263748 245323 118595 164074 216308 16273 19795 23362 4613 7732 8776 8311 11537 14211 754 734 792
Town of Marana 1362 9718 24050 649 2473 7730 32 381 806 112 227 282 29 318 1280 3 5 76
Town of Oro Valley 6110 26182 33605 431 2058 4731 36 303 559 20 89 125 65 552 1263 8 20 51
Town of Sahuarita N/A 2357 15249 N/A 741 8077 N/A 13 661 N/A 32 188 N/A 31 463 N/A 0 43
Other Native Nations/Tribes
Pascua Yaqui Tribe 18 36 106 467 756 818 9 8 7 2,284 3,002 3,154 1 1 8 100 268 139
Source: US Bureau of the Census 1990. 2000 and 2010

I n v e n t o r y , D e m o g r a p h i c s a n d
S o c i o - E c o n o m i c A n a l y s i s
A2.34 | P a g e A p p e n d i x A : B a c k g r o u n d a n d C u r r e n t C o n d i t i o n s
Median Household Income 1990, 2000 and 2010
According to the US Bureau of the Census, median household income is the amount which divides the
income distribution into two equal groups, with half having income above that amount, and half having
income below that amount. Household income is often the combination of two income earners pooling
the resources and should therefore not be confused with an individual's earnings. The median household
income in Pima County lags both the U.S. and the state in 2010 as noted in Figure 10.
Figure 10 – U.S., Arizona, and Pima County Median Household Income
Table 2.7.b shows 1990, 2000 and 2010 median household income by planning area and incorporated
community. As can be seen, nine planning areas surpass the State in median household income, as does
Marana, Oro Valley and Sahuarita. The Rincon planning area has the highest median household income at
$99,897 followed by San Pedro at $94,050.

I n v e n t o r y , D e m o g r a p h i c s a n d
S o c i o - E c o n o m i c A n a l y s i s
A2.35 | P a g e A p p e n d i x A : B a c k g r o u n d a n d C u r r e n t C o n d i t i o n s
TABLE 2.7.b: 1990, 2000 and 2010 Median Household Income
Place 1990 2000 2010
United States $30,056 $41,998 $50,046
Arizona $27,822 $40,558 $50,448
Pima County $24,975 $36,758 $45,521
Planning Areas
14. Avra Valley $28,146 $47,096 $60,485
15. Tucson Mountains $34,876 $53,885 $68,841
16. Southwest $28,839 $41,567 $52,253
17. Altar Valley $28,302 $40,164 $51,834
18. Upper Santa Cruz $37,351 $52,387 $63,665
19. Mountain View $32,458 $53,704 $55,236
20. Southeast $22,856 $35,028 $49,550
21. Central $25,655 $36,800 $46,100
22. Catalina Foothills $46,955 $66,306 $78,669
23. Rincon Valley $41,715 $62,482 $99,897
24. Tortolita $41,285 $63,409 $78,035
25. San Pedro $46,010 $79,594 $94,050
26. Ajo-Why $18,531 $32,459 $38,608
27. Tohono O’odham $12,614 $24,050 $31,382
Incorporated Areas
City of South Tucson $9,869 $14,587 $18,830
City of Tucson $21,748 $30,981 $37,448
Town of Marana $22,245 $52,870 $70,705
Town of Oro Valley $40,539 $61,037 $71,561
Town of Sahuarita n/a $53,194 $72,781
Other Native Nations/Tribes
Pascua Yaqui Tribe $11,149 $22,235 $31,875
Source: US Bureau of the Census, 1990, 2000 and 2010
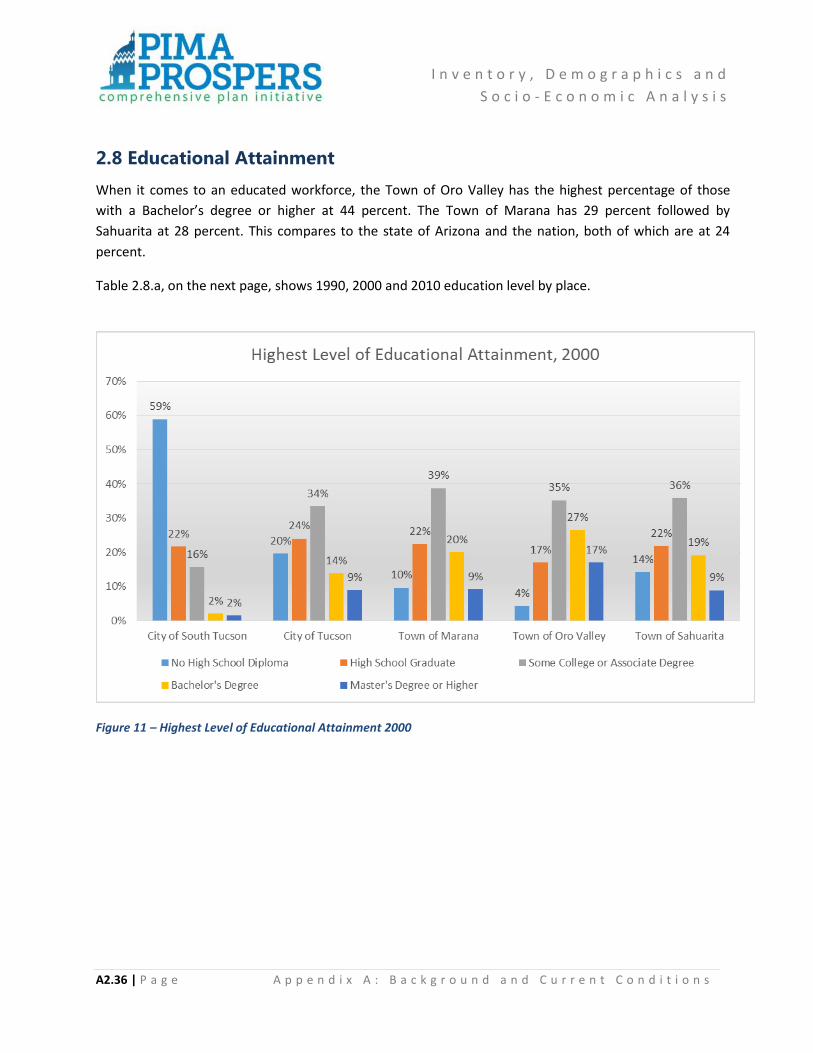
I n v e n t o r y , D e m o g r a p h i c s a n d
S o c i o - E c o n o m i c A n a l y s i s
A2.36 | P a g e A p p e n d i x A : B a c k g r o u n d a n d C u r r e n t C o n d i t i o n s
2.8 Educational Attainment
When it comes to an educated workforce, the Town of Oro Valley has the highest percentage of those
with a Bachelor’s degree or higher at 44 percent. The Town of Marana has 29 percent followed by
Sahuarita at 28 percent. This compares to the state of Arizona and the nation, both of which are at 24
percent.
Table 2.8.a, on the next page, shows 1990, 2000 and 2010 education level by place.
Figure 11 – Highest Level of Educational Attainment 2000

I n v e n t o r y , D e m o g r a p h i c s a n d
S o c i o - E c o n o m i c A n a l y s i s
A2.37 | P a g e A p p e n d i x A : B a c k g r o u n d a n d C u r r e n t C o n d i t i o n s
TABLE 2.8.a: 1990, 2000 and 2010 Education Level by Place
Place High School Graduates Some College or Associate Degree
Bachelor’s Degree
Master’s Degree or Higher
Population 25 Years and Over
YEAR 1990 2000 2010 1990 2000 2010 1990 2000 2010 1990 2000 2010 1990 2000 2010
United States 47,642,763 52,168,981 58,444,819 39,571,702 49,864,428 61,158,328 20,832,567 28,317,792 37,989,132 11,477,686 16,144,813 22,751,733 158,868,436 182,211,639 208,731,498
Arizona 601,440 791,904 1,040,152 741,784 1,078,520 1,459,638 306,554 493,419 736,240 160,319 272,793 436,607 2,301,177 3,256,184 4,280,464
Unincorporated Pima County 105,908 127,343 145,218 136,764 182,266 235,400 60,746 86,752 118,694 37,957 59,356 81,561 424,032 546,200 663,098
Incorporated Areas
City of South Tucson 445 710 1016 347 512 763 26 70 129 0 52 31 2,857 3,270 3,457
City of Tucson 62,085 72,295 80,667 81,840 100,855 109,072 31,639 41,719 49,322 19,817 27,144 32,093 248,500 301,036 323,802
Town of Marana n/a 2,037 4,538 n/a 3,516 7,728 n/a 1,816 5,123 n/a 829 2,808 n/a 9,075 21,693
Town of Oro Valley 1,054 3,767 4,859 1,756 7,816 9,630 1,155 5,884 8,339 689 3,775 5,934 4,928 22,189 29,724
Town of Sahuarita n/a 475 3,171 n/a 778 5,643 n/a 416 3,477 n/a 193 1,786 n/a 2,170 14,608
Other Native Nations/Tribes
Pascua Yaqui Tribe 167 379 171 57 184 129 5 19 47 15 8 56 857 1,427 1,810
Source: US Bureau of the Census 1990, 2000 and 2010
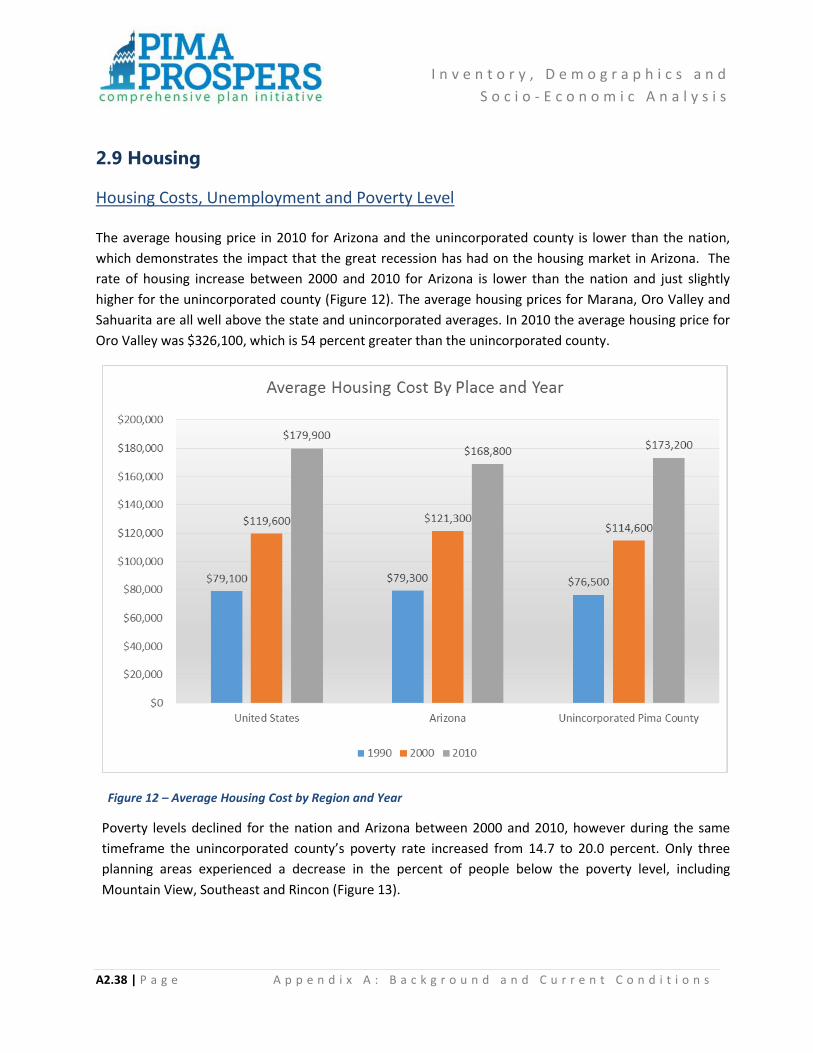
I n v e n t o r y , D e m o g r a p h i c s a n d
S o c i o - E c o n o m i c A n a l y s i s
A2.38 | P a g e A p p e n d i x A : B a c k g r o u n d a n d C u r r e n t C o n d i t i o n s
2.9 Housing
Housing Costs, Unemployment and Poverty Level
The average housing price in 2010 for Arizona and the unincorporated county is lower than the nation,
which demonstrates the impact that the great recession has had on the housing market in Arizona. The
rate of housing increase between 2000 and 2010 for Arizona is lower than the nation and just slightly
higher for the unincorporated county (Figure 12). The average housing prices for Marana, Oro Valley and
Sahuarita are all well above the state and unincorporated averages. In 2010 the average housing price for
Oro Valley was $326,100, which is 54 percent greater than the unincorporated county.
Figure 12 – Average Housing Cost by Region and Year
Poverty levels declined for the nation and Arizona between 2000 and 2010, however during the same
timeframe the unincorporated county’s poverty rate increased from 14.7 to 20.0 percent. Only three
planning areas experienced a decrease in the percent of people below the poverty level, including
Mountain View, Southeast and Rincon (Figure 13).
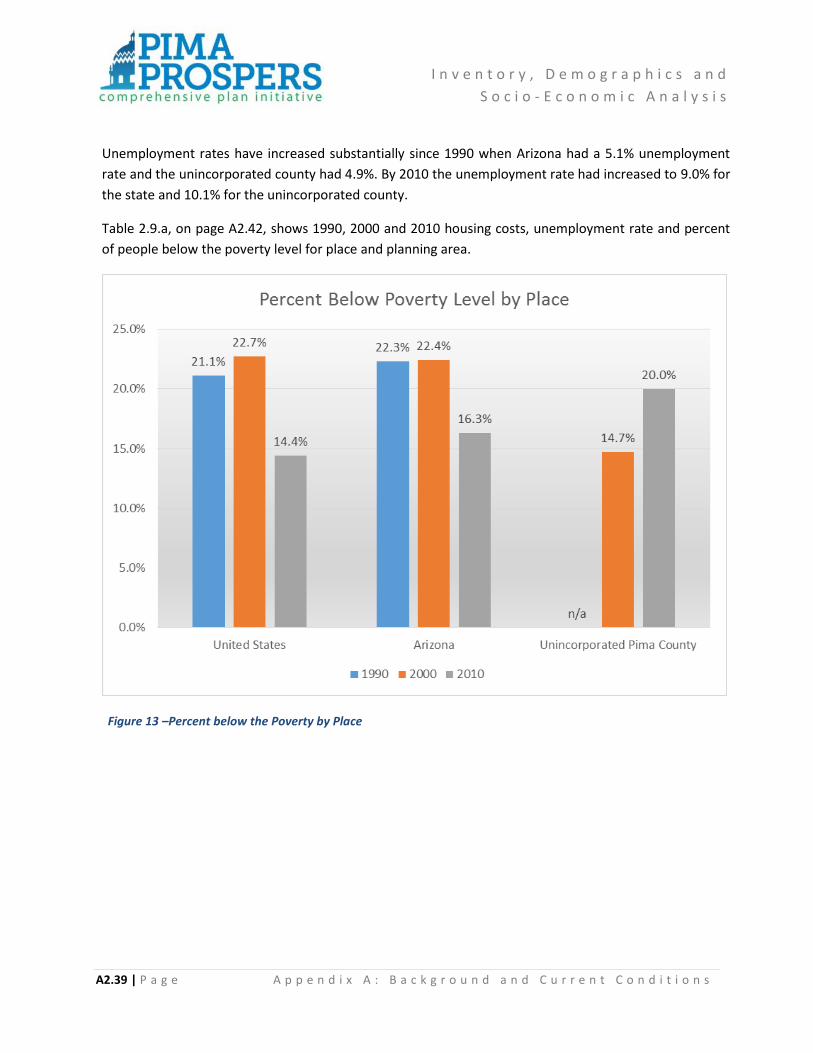
I n v e n t o r y , D e m o g r a p h i c s a n d
S o c i o - E c o n o m i c A n a l y s i s
A2.39 | P a g e A p p e n d i x A : B a c k g r o u n d a n d C u r r e n t C o n d i t i o n s
Unemployment rates have increased substantially since 1990 when Arizona had a 5.1% unemployment
rate and the unincorporated county had 4.9%. By 2010 the unemployment rate had increased to 9.0% for
the state and 10.1% for the unincorporated county.
Table 2.9.a, on page A2.42, shows 1990, 2000 and 2010 housing costs, unemployment rate and percent
of people below the poverty level for place and planning area.
Figure 13 –Percent below the Poverty by Place

I n v e n t o r y , D e m o g r a p h i c s a n d
S o c i o - E c o n o m i c A n a l y s i s
A2.40 | P a g e A p p e n d i x A : B a c k g r o u n d a n d C u r r e n t C o n d i t i o n s
Figure 14 – Percent below the Poverty by Planning Area, 2000 and 2010
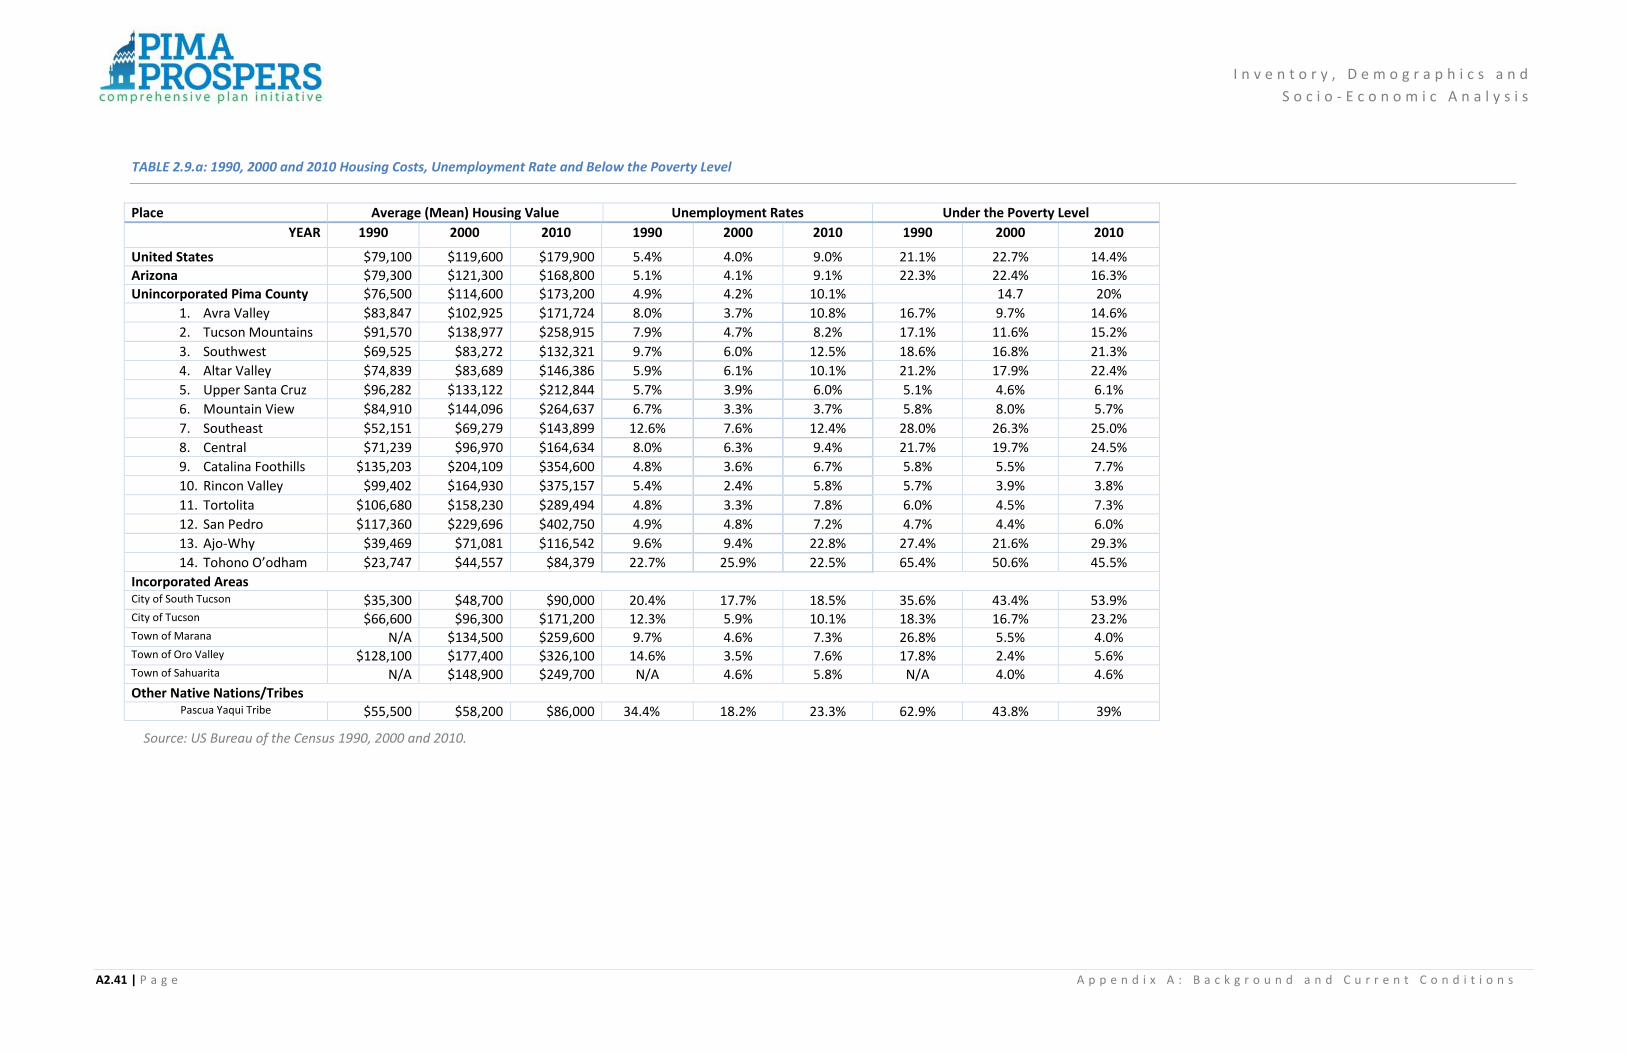
I n v e n t o r y , D e m o g r a p h i c s a n d
S o c i o - E c o n o m i c A n a l y s i s
A2.41 | P a g e A p p e n d i x A : B a c k g r o u n d a n d C u r r e n t C o n d i t i o n s
TABLE 2.9.a: 1990, 2000 and 2010 Housing Costs, Unemployment Rate and Below the Poverty Level
Place Average (Mean) Housing Value Unemployment Rates Under the Poverty Level
YEAR 1990 2000 2010 1990 2000 2010 1990 2000 2010
United States $79,100 $119,600 $179,900 5.4% 4.0% 9.0% 21.1% 22.7% 14.4%
Arizona $79,300 $121,300 $168,800 5.1% 4.1% 9.1% 22.3% 22.4% 16.3%
Unincorporated Pima County $76,500 $114,600 $173,200 4.9% 4.2% 10.1% 14.7 20%
1. Avra Valley $83,847 $102,925 $171,724 8.0% 3.7% 10.8% 16.7% 9.7% 14.6%
2. Tucson Mountains $91,570 $138,977 $258,915 7.9% 4.7% 8.2% 17.1% 11.6% 15.2%
3. Southwest $69,525 $83,272 $132,321 9.7% 6.0% 12.5% 18.6% 16.8% 21.3%
4. Altar Valley $74,839 $83,689 $146,386 5.9% 6.1% 10.1% 21.2% 17.9% 22.4%
5. Upper Santa Cruz $96,282 $133,122 $212,844 5.7% 3.9% 6.0% 5.1% 4.6% 6.1%
6. Mountain View $84,910 $144,096 $264,637 6.7% 3.3% 3.7% 5.8% 8.0% 5.7%
7. Southeast $52,151 $69,279 $143,899 12.6% 7.6% 12.4% 28.0% 26.3% 25.0%
8. Central $71,239 $96,970 $164,634 8.0% 6.3% 9.4% 21.7% 19.7% 24.5%
9. Catalina Foothills $135,203 $204,109 $354,600 4.8% 3.6% 6.7% 5.8% 5.5% 7.7%
10. Rincon Valley $99,402 $164,930 $375,157 5.4% 2.4% 5.8% 5.7% 3.9% 3.8%
11. Tortolita $106,680 $158,230 $289,494 4.8% 3.3% 7.8% 6.0% 4.5% 7.3%
12. San Pedro $117,360 $229,696 $402,750 4.9% 4.8% 7.2% 4.7% 4.4% 6.0%
13. Ajo-Why $39,469 $71,081 $116,542 9.6% 9.4% 22.8% 27.4% 21.6% 29.3%
14. Tohono O’odham $23,747 $44,557 $84,379 22.7% 25.9% 22.5% 65.4% 50.6% 45.5%
Incorporated Areas
City of South Tucson $35,300 $48,700 $90,000 20.4% 17.7% 18.5% 35.6% 43.4% 53.9% City of Tucson $66,600 $96,300 $171,200 12.3% 5.9% 10.1% 18.3% 16.7% 23.2% Town of Marana N/A $134,500 $259,600 9.7% 4.6% 7.3% 26.8% 5.5% 4.0% Town of Oro Valley $128,100 $177,400 $326,100 14.6% 3.5% 7.6% 17.8% 2.4% 5.6% Town of Sahuarita N/A $148,900 $249,700 N/A 4.6% 5.8% N/A 4.0% 4.6%
Other Native Nations/Tribes Pascua Yaqui Tribe $55,500 $58,200 $86,000 34.4% 18.2% 23.3% 62.9% 43.8% 39%
Source: US Bureau of the Census 1990, 2000 and 2010.
I n v e n t o r y , D e m o g r a p h i c s a n d
S o c i o - E c o n o m i c A n a l y s i s
A2.42 | P a g e A p p e n d i x A : B a c k g r o u n d a n d C u r r e n t C o n d i t i o n s
Household Characteristics 1990, 2000 and 2010 by Planning Area
The number of households between the years 2000 and 2010 increased 15.1 percent in the
unincorporated county. The average household size has been trending upward since 2000 from 2.47 to
2.49 persons per household in 2010.
When looking at the change in the number of households for the planning areas from 1990 to 2010, San
Pedro is the only area that lost nearly 39 percent of their households. The two planning areas that
experienced the greatest increase in the number of households was Rincon Valley with a 318 percent
increase and Upper Santa Cruz with 198 percent gain. The overall average rate of increase for all planning
areas was 81.6 percent. The household size for all of the planning areas has also increased, with an
overall average of 2.49 in 1990 growing to 2.63 persons per household in 2010.
Table 2.9.b shows 1990, 2000 and 2010 household characteristics by place and planning area.
Housing Units Tenure and Substandard Characteristics
When examining the change in total housing units in the unincorporated county there was a gain of 21.2
percent between 2000 and 2010, which compares to the state at 31.2 percent. The overall average gain
among the planning areas over the same timeframe was 42.3 percent, with the largest gain seen by
Rincon Valley at nearly 321 percent. Altar Valley lost 14.5 percent housing units, which may be attributed
to the removal of the housing stock.
The 2010 housing occupancy in the unincorporated county closely compares to the nation with 97.5
percent occupancy and 11.8 percent vacancy. The split between owner versus renter is 56 percent to
31.4 percent. Arizona has the highest vacancy at 16.1 percent (Figure 15). Within the planning areas the
Tohono O’odham and Ajo-Why have the lowest occupancy and highest vacancy. Catalina Foothills has
the highest occupied units at 89.4 percent and Mountain View posted the lowest vacancy at 3 percent.
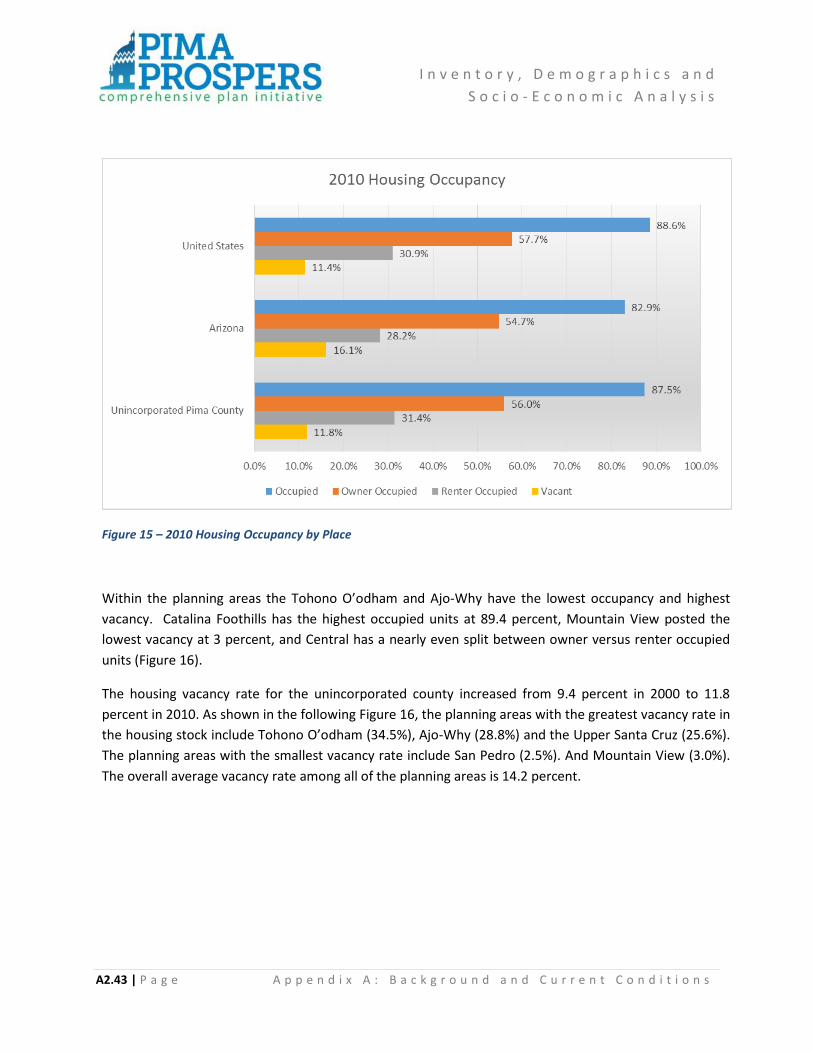
I n v e n t o r y , D e m o g r a p h i c s a n d
S o c i o - E c o n o m i c A n a l y s i s
A2.43 | P a g e A p p e n d i x A : B a c k g r o u n d a n d C u r r e n t C o n d i t i o n s
Figure 15 – 2010 Housing Occupancy by Place
Within the planning areas the Tohono O’odham and Ajo-Why have the lowest occupancy and highest
vacancy. Catalina Foothills has the highest occupied units at 89.4 percent, Mountain View posted the
lowest vacancy at 3 percent, and Central has a nearly even split between owner versus renter occupied
units (Figure 16).
The housing vacancy rate for the unincorporated county increased from 9.4 percent in 2000 to 11.8
percent in 2010. As shown in the following Figure 16, the planning areas with the greatest vacancy rate in
the housing stock include Tohono O’odham (34.5%), Ajo-Why (28.8%) and the Upper Santa Cruz (25.6%).
The planning areas with the smallest vacancy rate include San Pedro (2.5%). And Mountain View (3.0%).
The overall average vacancy rate among all of the planning areas is 14.2 percent.

I n v e n t o r y , D e m o g r a p h i c s a n d
S o c i o - E c o n o m i c A n a l y s i s
A2.44 | P a g e A p p e n d i x A : B a c k g r o u n d a n d C u r r e n t C o n d i t i o n s
Figure 16 – Planning Area Housing Occupancy, 2010

I n v e n t o r y , D e m o g r a p h i c s a n d
S o c i o - E c o n o m i c A n a l y s i s
A2.45 | P a g e A p p e n d i x A : B a c k g r o u n d a n d C u r r e n t C o n d i t i o n s
Substandard housing within the planning areas is primarily concentrated in Tohono O’Odham. The
percentage of units lacking complete plumbing fixtures rose from 28.2 percent in 1990 to 36.2 percent in
2010. Altar Valley also saw an increase in units lacking complete plumbing going from 1.2 percent to 9.7
percent. Similarly to plumbing, the planning areas that have incomplete kitchen facilities are Tohono
O’odham and Altar Valley.
Tables 2.9.c.a and 2.9.d shows 1990, 2000 and 2010 total housing units and substandard by place and
planning area.

I n v e n t o r y , D e m o g r a p h i c s a n d
S o c i o - E c o n o m i c A n a l y s i s
A2.46 | P a g e A p p e n d i x A : B a c k g r o u n d a n d C u r r e n t C o n d i t i o n s
TABLE 2.9.b: Household Characteristics 1990, 2000 and 2010 by Planning Area
Place Total Number of Households
Total Population in Households
Average Household Size
Population Living in Group Quarters
YEAR 1990 2000 2010 1990 2000 2010 1990 2000 2010 1990 2000 2010
United States 91,947,410 105,480,101 115,969,540 242,012,129 273,643,273 305,885,362 2.63 2.59 2.64 6,697,744 7,778,633 8,028,678
Arizona 1,388,843 1,901,327 2,380,990 3,584,545 5,020,782 6,403,988 2.62 2.64 2.68 80,683 109,850 149,267
Unincorporated Pima County 261,792 332,350 388,660 651,280 821,712 956,124 2.49 2.47 2.46 15,600 22,034 24,139
1. Avra Valley 3,458 5,783 8,193 9,890 16,500 22,348 2.86 2.85 2.73 0 422 505
2. Tucson Mountains 10,879 16,955 24,164 29,146 44,317 61,118 2.68 2.61 2.53 1,578 1,894 2,304
3. Southwest 17,990 23,451 29,813 51,277 68,951 89,177 2.85 2.94 2.99 47 235 164
4. Altar Valley 1,418 2,495 2,714 3,756 6,909 7,048 2.65 2.77 2.60 3 14 14
5. Upper Santa Cruz 8,858 12,544 22,918 17,402 24,343 49,636 1.96 1.94 2.17 145 243 186
6. Mountain View 260 456 547 663 1,139 1,324 2.55 2.50 2.42 15 13 10
7. Southeast 21,967 27,293 34,847 69,347 87,697 110,539 3.16 3.21 3.17 3,014 5,243 5,973
8. Central 117,639 130,150 133,717 269,256 297,920 308,562 2.29 2.29 2.31 9,826 11,424 12,654
9. Catalina Foothills 58,021 73,555 79,360 140,029 169,550 175,158 2.41 2.31 2.21 808 2,045 1,749
10. Rincon Valley 560 1,334 4,521 1,538 3,808 12,861 2.75 2.85 2.84 11 0 0
11. Tortolita 17,327 34,539 44,272 47,759 89,152 107,831 2.76 2.58 2.44 147 445 323
12. San Pedro 18 55 43 54 126 103 3.00 2.29 2.40 0 0 0
13. Ajo-Why 1,445 1,754 1,630 3,401 3,893 3,511 2.35 2.22 2.15 0 10 13
14. Tohono O’odham 1,952 1,986 1,921 7,762 7,407 6,908 3.98 3.73 3.60 6 46 244
Source: US Bureau of the Census 1990, 2000 and 2010

I n v e n t o r y , D e m o g r a p h i c s a n d
S o c i o - E c o n o m i c A n a l y s i s
A2.47 | P a g e A p p e n d i x A : B a c k g r o u n d a n d C u r r e n t C o n d i t i o n s
Housing Units and Housing Tenure 1990, 2000 and 2010
TABLE 2.9.c Housing Units and Housing Tenure 1990, 2000 and 2010
Place Total Housing Units
Total Occupied Housing Units
Housing Units Owner Occupied
Housing Units Renter Occupied
Housing Units Vacant
YEAR 1990 2000 2010 1990 2000 2010 1990 2000 2010 1990 2000 2010 1990 2000 2010
United States 102,263,678 115,904,641 131,704,730 91,947,410 105,480,101 116,716,292 59,024,811 69,815,753 75,986,074 32,922,599 35,664,348 40,730,218 10,316,268 10,424,540 14,988,438
Arizona 1,659,430 2,189,189 2,871,486 1,368,843 1,901,327 2,380,990 879,000 1,293,556 1,571,687 489,843 607,771 809,303 290,587 287,862 463,536
Unincorporated Pima County 298,207 366,737 440,909 261,792 332,350 388,660 159467 213,603 248,970 102325 118,747 139,690 36,415 34,387 52,249
Planning Areas
1. Avra Valley 3,913 6,318 9,327 3,458 5,784 8,194 2,883 4,895 6,712 575 889 1,482 455 534 1,133
2. Tucson Mountains 11,960 18,466 26,283 10,879 16,955 24,164 7,381 12,506 16,867 3,498 4,449 7,297 1,081 1,511 2,119
3. Southwest 20,967 26,238 34,021 17,990 23,451 29,813 13,842 18,094 22,230 4,148 5,357 7,583 2,977 2,787 4,208
4. Altar Valley 1,743 2,924 3,446 1,418 2,495 2,714 1,199 2,101 2,253 219 394 461 325 429 732
5. Upper Santa Cruz 11,654 16,031 29,279 8,858 12,544 22,919 7,656 10,947 19,406 1,202 1,597 3,513 2,796 3,487 6,360
6. Mountain View 320 523 630 260 455 547 214 407 456 46 48 91 60 68 83
7. Southeast 25,458 30,187 39,246 21,966 27,293 34,846 14,123 17,887 22,969 7,843 9,406 11,877 3,492 2,894 4,400
8. Central 132,053 141,506 150,614 117,639 130,150 133,717 56,325 64,062 63,633 61,314 66,088 70,084 14,414 11,356 16,897
9. Catalina Foothills 65,685 80,147 88,481 58,021 73,554 79,360 39,377 50,792 54,078 18,644 22,762 25,282 7,664 6,593 9,121
10. Rincon Valley 640 1,431 4,970 560 1,333 4,521 463 1,221 3,969 97 112 552 80 98 449
11. Tortolita 19,439 37,794 49,560 17,328 34,539 44,271 13,545 27,956 33,776 3,783 6,583 10,495 2,111 3,255 5,289
12. San Pedro 65 106 85 18 56 43 2 40 30 16 16 13 47 50 42
13. Ajo-Why 2,056 2,621 2,389 1,445 1,754 1,630 1,064 1,359 1,135 381 395 495 611 867 759
14. Tohono O’odham 2,254 2,445 2,578 1,952 1,987 1,921 1,393 1,336 1,456 559 651 465 302 458 657
Incorporated Areas
City of South Tucson 1861 2,059 2,191 1637 1810 1827 650 732 565 987 1078 1,310 224 249 316
City of Tucson 183338 209609 229762 162685 192891 205390 83687 103056 106651 78998 89835 98739 20653 16718 24372
Town of Marana 850 5702 14726 728 4944 13073 534 4090 10566 194 854 2507 122 758 1653
Town of Oro Valley 3576 13946 20340 2846 12249 17804 2049 10319 13786 797 1930 4018 730 1697 2536
Town of Sahuarita n/a 1247 10615 n/a 1155 9020 n/a 929 7615 n/a 226 1405 n/a 92 1595
Other Nations/Tribes
Pascua Yaqui Tribe 525 785 833 525 745 804 269 395 400 256 350 404 0 40 43
Source: US Bureau of the Census 1990, 2000 and 2010

I n v e n t o r y , D e m o g r a p h i c s a n d
S o c i o - E c o n o m i c A n a l y s i s
A2.48 | P a g e A p p e n d i x A : B a c k g r o u n d a n d C u r r e n t C o n d i t i o n s
Substandard Housing Units 1990, 2000 and 2010
TABLE 2.9.d: 1990, 2000 and 2010 Substandard Housing by Planning Area
Planning Area Total Housing Units
Complete Plumbing Facilities
Lacking Complete Plumbing Facilities
Complete Kitchen Facilities
Incomplete Kitchen Facilities
YEAR 1990 2000 2010 1990 2000 2010 1990 2000 2010 1990 2000 2010 1990 2000 2010
United States 102,263,678 115,904,641 132,452,249 101,161,982 114,569,474 131,799,802 1,101,696 1,335,167 652,447 101,154,052 114,388,787 131,350,283 1,109,626 1,515,854 1,101,966
Arizona 1,659,430 2,189,189 2,871,486 1,627,959 2,149,557 2,852,704 31,471 39,632 18,782 1,628,691 2,148,538 2,847,859 30,739 40,651 23,627
Unincorporated Pima County 298,207 366,737 444,349 296,319 364,050 443,092 6,875 2,687 1,257 296,003 294,727 441,401 2,204 3,480 2,948
Planning Areas
1. Avra Valley 4,576 7,307 9,297 4,519 7,253 8,896 58 53 401 4,543 7,232 9,017 34 74 279
2. Tucson Mountains 13,090 18,995 26,917 13,035 18,915 26,806 56 80 110 13,035 18,905 26,739 55 90 177
3. Southwest 20,978 25,719 34,645 20,852 25,573 34,404 126 146 241 20,851 25,544 34,233 127 175 412
4. Altar Valley 5,668 5,330 4,555 5,601 5,196 4,112 68 134 443 5,603 5,217 4,205 66 113 350
5. Upper Santa Cruz 8,817 15,151 24,862 8,800 15,101 24,573 17 50 289 8,792 15,099 24,479 25 52 383
6. Mountain View 1,879 1,959 2,515 1,852 1,948 2,396 27 11 119 1,868 1,950 2,441 12 10 74
7. Southeast 22,216 27,231 37,543 22,065 26,958 36,827 151 273 716 22,077 26,913 36,834 139 318 709
8. Central 129,738 141,233 150,989 129,158 140,374 149,200 580 860 1,790 128,920 140,117 148,419 818 1,117 2,571
9. Catalina Foothills 64,706 79,741 89,602 64,585 79,549 89,269 121 192 332 64,464 79,166 88,408 242 575 1,194
10. Rincon Valley 955 828 3,484 952 823 3,465 3 5 19 952 826 3,427 3 2 57
11. Tortolita 18,766 37,127 48,005 18,754 37,061 47,678 12 67 327 18,746 36,980 47,609 20 147 396
12. San Pedro 2,472 1,097 1,569 2,442 1,004 1,496 29 93 73 2,440 979 1,512 31 118 56
13. Ajo-Why 2,081 2,623 2,300 2,067 2,551 2,176 14 72 124 1,953 2,528 2,098 128 95 202
14. Tohono O’odham 2,216 2,390 2,599 1,590 1,739 1,658 626 651 941 1,712 1,795 1,739 505 595 861
Source: US Bureau of the Census 1990, 2000 and 2010

I n v e n t o r y , D e m o g r a p h i c s a n d
S o c i o - E c o n o m i c A n a l y s i s
A2.49 | P a g e A p p e n d i x A : B a c k g r o u n d a n d C u r r e n t C o n d i t i o n s
2.10 Employment
Employment by Industry Sector 2005-2010
Over the five years from 2005 to 2010, the industry sectors that experienced the greatest job losses were
Construction (42%), Information (40.3%) and Manufacturing (15.2%). The sector that generated the most
employment over the 5-year timeframe was Natural Resources and Mining, growing from 1,400 to 1,800
jobs. Educational and Health Services has steadily created jobs every year and overall increased by 15.6
percent.
Figure 17 – Pima County Employment Trend by Sector, 2005-2010
When looking at the percent of employment for each industry sector in 2010, Government employs 22
percent followed by Education and Health Services at 17 percent and Trade, Transportation and Utilities at
16 percent
Table 2.10.a shows 2005-2010 employment by industry sector for Pima County

I n v e n t o r y , D e m o g r a p h i c s a n d
S o c i o - E c o n o m i c A n a l y s i s
A2.50 | P a g e A p p e n d i x A : B a c k g r o u n d a n d C u r r e n t C o n d i t i o n s
Figure 18 – Pima County Employment by Industry, 2010

I n v e n t o r y , D e m o g r a p h i c s a n d
S o c i o - E c o n o m i c A n a l y s i s
A2.51 | P a g e A p p e n d i x A : B a c k g r o u n d a n d C u r r e n t C o n d i t i o n s
TABLE 2.10.a: Employment by Industry Sector 2005-2010
Industry Sector Number of Employees
YEAR 2005 2006 2007 2008 2009 2010
Construction 25,700 27,900 26,500 22,800 16,600 14,900
Manufacturing 28,300 28,100 27,500 27,200 25,100 24,000
Trade, Transportation and Utilities 59,600 62,700 64,300 62,700 58,200 56,600
Information 7,200 6,800 5,900 5,300 4,700 4,300
Financial Activities 16,500 17,600 18,200 17,200 17,500 17,600
Professional and Business Services 45,900 49,700 52,600 51,400 47,100 45,800
Educational and Health Services 50,500 52,600 54,700 57,100 58,500 58,400
Leisure and Hospitality 39,800 40,600 40,200 40,400 38,700 37,800
Natural Resources and Mining 1,400 1,600 1,800 1,900 1,700 1,800
Other Services 14,700 15,800 15,800 15,700 14,700 14,000
Government 77,100 76,300 77,900 79,800 79,100 78,300
Total Non-Farm Employment 366,700 379,600 385,300 381,500 361,800 353,400
Source: US Department of Labor, Bureau of Labor Statistics, State of Arizona Economic Security Research Administration, North American Industrial Classification System (NAICS)
Employment by Occupation 1990, 2000 and 2010
The mix of 2010 occupations in Pima County is reflective of the industry sectors. There is a high
concentration of Office and Administrative Support, Healthcare and Education positions (Figure 19). From
2000 to 2010, nine of the occupations experienced a decrease ranging from 0.2 percent to 3.7 percent. The
occupation that expanded the most was Healthcare Practitioners at 2.7 percent and the occupation that
shed the most jobs was Production at 3.7 percent.
Table 2.10.b shows 1990, 2000 and 2010 employment and occupation for Pima County.

I n v e n t o r y , D e m o g r a p h i c s a n d
S o c i o - E c o n o m i c A n a l y s i s
A2.52 | P a g e A p p e n d i x A : B a c k g r o u n d a n d C u r r e n t C o n d i t i o n s
Figure 19 – Pima County Employment by Occupation, 2010
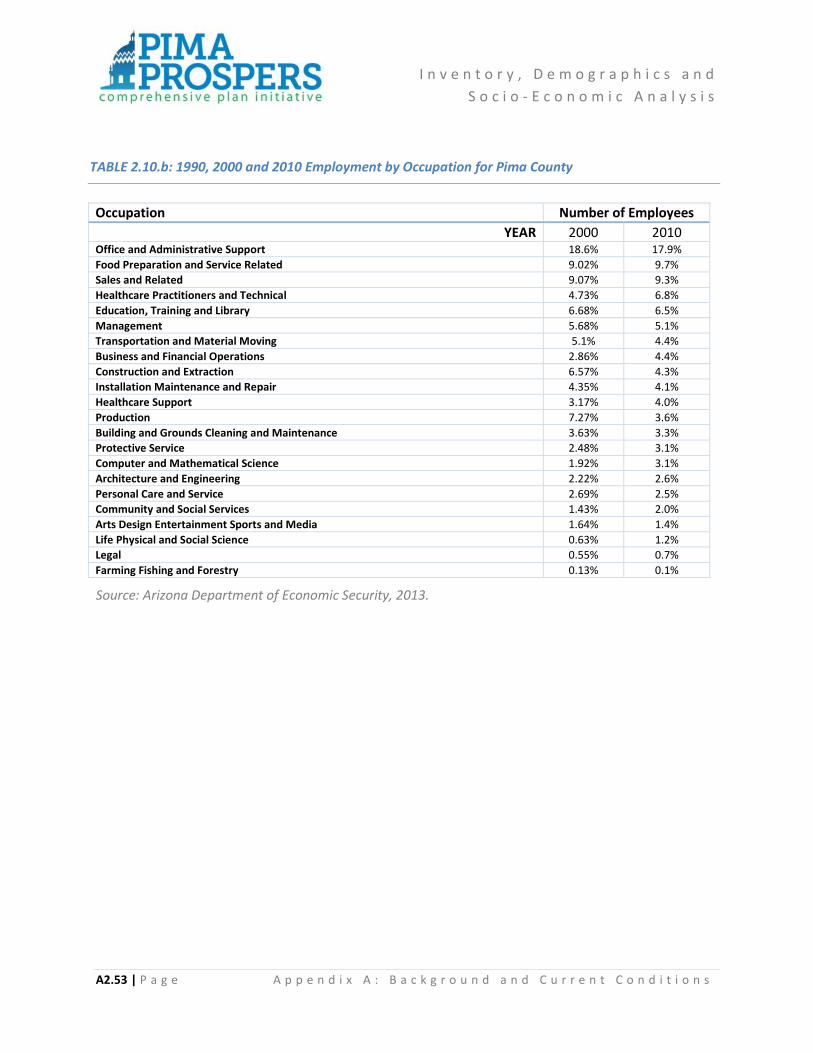
I n v e n t o r y , D e m o g r a p h i c s a n d
S o c i o - E c o n o m i c A n a l y s i s
A2.53 | P a g e A p p e n d i x A : B a c k g r o u n d a n d C u r r e n t C o n d i t i o n s
TABLE 2.10.b: 1990, 2000 and 2010 Employment by Occupation for Pima County
Occupation Number of Employees
YEAR 2000 2010 Office and Administrative Support 18.6% 17.9%
Food Preparation and Service Related 9.02% 9.7%
Sales and Related 9.07% 9.3%
Healthcare Practitioners and Technical 4.73% 6.8%
Education, Training and Library 6.68% 6.5%
Management 5.68% 5.1%
Transportation and Material Moving 5.1% 4.4%
Business and Financial Operations 2.86% 4.4%
Construction and Extraction 6.57% 4.3%
Installation Maintenance and Repair 4.35% 4.1%
Healthcare Support 3.17% 4.0%
Production 7.27% 3.6%
Building and Grounds Cleaning and Maintenance 3.63% 3.3%
Protective Service 2.48% 3.1%
Computer and Mathematical Science 1.92% 3.1%
Architecture and Engineering 2.22% 2.6%
Personal Care and Service 2.69% 2.5%
Community and Social Services 1.43% 2.0%
Arts Design Entertainment Sports and Media 1.64% 1.4%
Life Physical and Social Science 0.63% 1.2%
Legal 0.55% 0.7%
Farming Fishing and Forestry 0.13% 0.1%
Source: Arizona Department of Economic Security, 2013.

I n v e n t o r y , D e m o g r a p h i c s a n d
S o c i o - E c o n o m i c A n a l y s i s
A2.54 | P a g e A p p e n d i x A : B a c k g r o u n d a n d C u r r e n t C o n d i t i o n s
Major Employers in Pima County and Southern Arizona
The top 25 private sector employers in Pima County include a mix of aerospace, healthcare, mining, and
retail trade and collectively employ 65,366 workers. Based on the total number of jobs, retail trade
employs 27.4 percent, followed by healthcare at 22.7 percent and aerospace at 15.8 percent.
Figure 20 – Pima County Top 25 Private Sector Employers by Sector
The top 10 public sector employers include state and local government, military and homeland security,
education and tribal government. All combined, the public sector employs 64,534 workers with a near
even split between education (31.0%), military and homeland security (31.4%), and state and local
government (30.8%).
Figure 21 – Pima County Top 10 Public Sector Employers by Sector

I n v e n t o r y , D e m o g r a p h i c s a n d
S o c i o - E c o n o m i c A n a l y s i s
A2.55 | P a g e A p p e n d i x A : B a c k g r o u n d a n d C u r r e n t C o n d i t i o n s
TABLE 2.10.c: Top 25 Private Employers in Pima County and Southern Arizona 2013
Major Employer Employment Type
Raytheon Missile Systems 10,300
Wal-Mart Stores Incorporated 7,450
UA Healthcare 6,099
Freeport-McMoRan Copper & Gold 5,463
Carondelet Health Network 3,668
TMC Health Care 2.977
Fry’s Food Stores 2,700
Corrections Corp. of America 2,314
Asarco LLC 2,297
Afni Inc 2,199
Southern Arizona VA Health Center 2,182
Citi 2,000
Bashas’ Inc 1,800
APAC Customer Service 1,777
Safeway Inc 1,685
Target Stores Inc 1,640
Northwest Medical Center 1,757
Walgreens 1,420
IBM 1,375
TEP/UniSource Energy 1,232
Sol Casinos 1,300
Union Pacific Railroad 1,200
Circle K Stores 1,200
GEICO 1,155
Ventana Medical Systems, Inc 1,150
Source: Top 25 Largest Private Employers in Southern Arizona, TREO, 2013
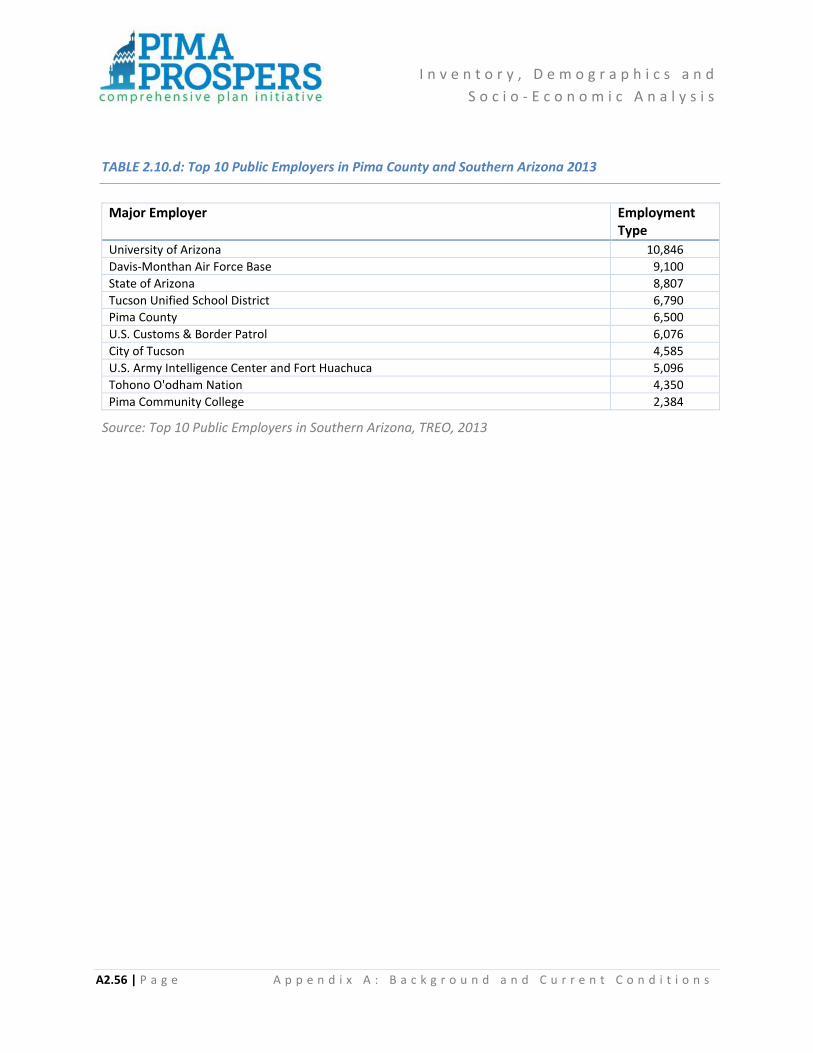
I n v e n t o r y , D e m o g r a p h i c s a n d
S o c i o - E c o n o m i c A n a l y s i s
A2.56 | P a g e A p p e n d i x A : B a c k g r o u n d a n d C u r r e n t C o n d i t i o n s
TABLE 2.10.d: Top 10 Public Employers in Pima County and Southern Arizona 2013
Major Employer Employment Type
University of Arizona 10,846
Davis-Monthan Air Force Base 9,100
State of Arizona 8,807
Tucson Unified School District 6,790
Pima County 6,500
U.S. Customs & Border Patrol 6,076
City of Tucson 4,585
U.S. Army Intelligence Center and Fort Huachuca 5,096
Tohono O'odham Nation 4,350
Pima Community College 2,384
Source: Top 10 Public Employers in Southern Arizona, TREO, 2013
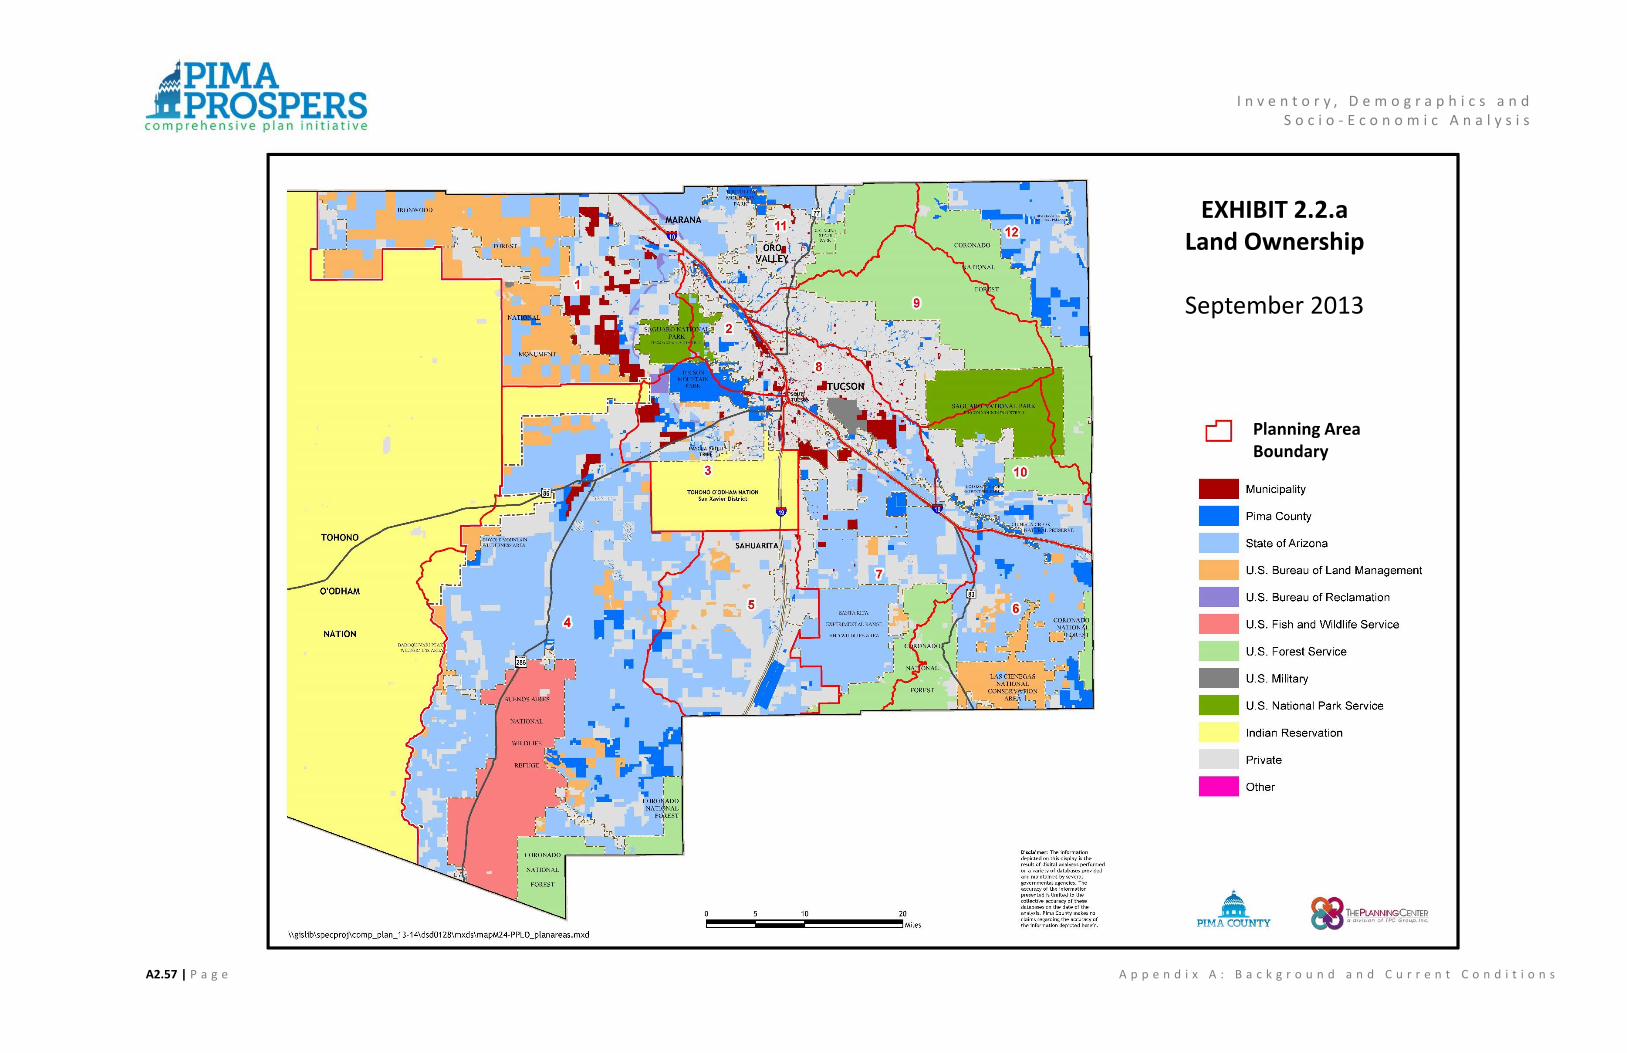
EXHIBIT 2.2.aLand Ownership
September 2013
Planning Area Boundary
I n v e n t o r y , D e m o g r a p h i c s a n d S o c i o - E c o n o m i c A n a l y s i s
A2.57 | P a g e A p p e n d i x A : B a c k g r o u n d a n d C u r r e n t C o n d i t i o n s

EXHIBIT 2.2.bLand Ownership
September 2013
I n v e n t o r y , D e m o g r a p h i c s a n d S o c i o - E c o n o m i c A n a l y s i s
A2.58 | P a g e A p p e n d i x A : B a c k g r o u n d a n d C u r r e n t C o n d i t i o n s

I n v e n t o r y , D e m o g r a p h i c s a n d S o c i o - E c o n o m i c A n a l y s i s
A2.59 | P a g e A p p e n d i x A : B a c k g r o u n d a n d C u r r e n t C o n d i t i o n s

I n v e n t o r y , D e m o g r a p h i c s a n d S o c i o - E c o n o m i c A n a l y s i s
A2.60 | P a g e A p p e n d i x A : B a c k g r o u n d a n d C u r r e n t C o n d i t i o n s

EXHIBIT 2.5.cEnvironmental Considerations:
Hydrology
September 2013
I n v e n t o r y , D e m o g r a p h i c s a n d S o c i o - E c o n o m i c A n a l y s i s
A2.61 | P a g e A p p e n d i x A : B a c k g r o u n d a n d C u r r e n t C o n d i t i o n s

EXHIBIT 2.5.dEnvironmental Considerations:
Hydrology
September 2013
I n v e n t o r y , D e m o g r a p h i c s a n d S o c i o - E c o n o m i c A n a l y s i s
A2.62 | P a g e A p p e n d i x A : B a c k g r o u n d a n d C u r r e n t C o n d i t i o n s

I n v e n t o r y , D e m o g r a p h i c s a n d S o c i o - E c o n o m i c A n a l y s i s
A2.63 | P a g e A p p e n d i x A : B a c k g r o u n d a n d C u r r e n t C o n d i t i o n s

I n v e n t o r y , D e m o g r a p h i c s a n d S o c i o - E c o n o m i c A n a l y s i s
A2.64 | P a g e A p p e n d i x A : B a c k g r o u n d a n d C u r r e n t C o n d i t i o n s

L a n d U s e D i s t r i b u t i o n , A n a l y s i s
a n d C u r r e n t C o n d i t i o n s
A3.1 | P a g e A p p e n d i x A : B a c k g r o u n d a n d C u r r e n t C o n d i t i o n s
Use of Land Chapter 3: Use of Land Distribution, Analysis, and Current Conditions
Key Subjects:
Land Use Distribution
Community Development and Neighborhood Capacity
Open Space
Environmental
Housing and Community Design
Cultural Resources
Important Notes:
1. At the time of the preparation of the infrastructure study that served as the core of this
background document, the Tohono O’odham Nation was treated as a planning area for
statistical purposes only. The Tohono O’odham Nation is a sovereign nation, and though
the County recognizes the importance of the Nation to the region, the County has no
jurisdiction over the Nation.
2. With the exception of Exhibits 3.1.a and 3.1.b depicting planning areas, all other Exhibits
referenced in this chapter are included at the end of this chapter.

L a n d U s e D i s t r i b u t i o n , A n a l y s i s
a n d C u r r e n t C o n d i t i o n s
A3.2 | P a g e A p p e n d i x A : B a c k g r o u n d a n d C u r r e n t C o n d i t i o n s
3.1 Land Use Distribution
Based on 2012 data, this section summarizes existing land use distribution by planning area. The County’s
13 planning areas are very diverse. For example, land use in the Avra Valley planning area is dominated
by agricultural land, while the Catalina Foothills planning area is made up primarily of single-family homes.
Exhibits 3.1.a and 3.1.b, included in the following pages, show the County planning areas.
Exhibits 3.1c and 3.1.d, included at the end of this chapter, show existing land uses.

L a n d U s e D i s t r i b u t i o n , A n a l y s i s
a n d C u r r e n t C o n d i t i o n s
A3.3 | P a g e A p p e n d i x A : B a c k g r o u n d a n d C u r r e n t C o n d i t i o n s
Exhibit 3.1.a: Pima County Planning Areas (East)

L a n d U s e D i s t r i b u t i o n , A n a l y s i s
a n d C u r r e n t C o n d i t i o n s
A3.4 | P a g e A p p e n d i x A : B a c k g r o u n d a n d C u r r e n t C o n d i t i o n s
Exhibit 3.1.b: Pima County Planning Areas (West)
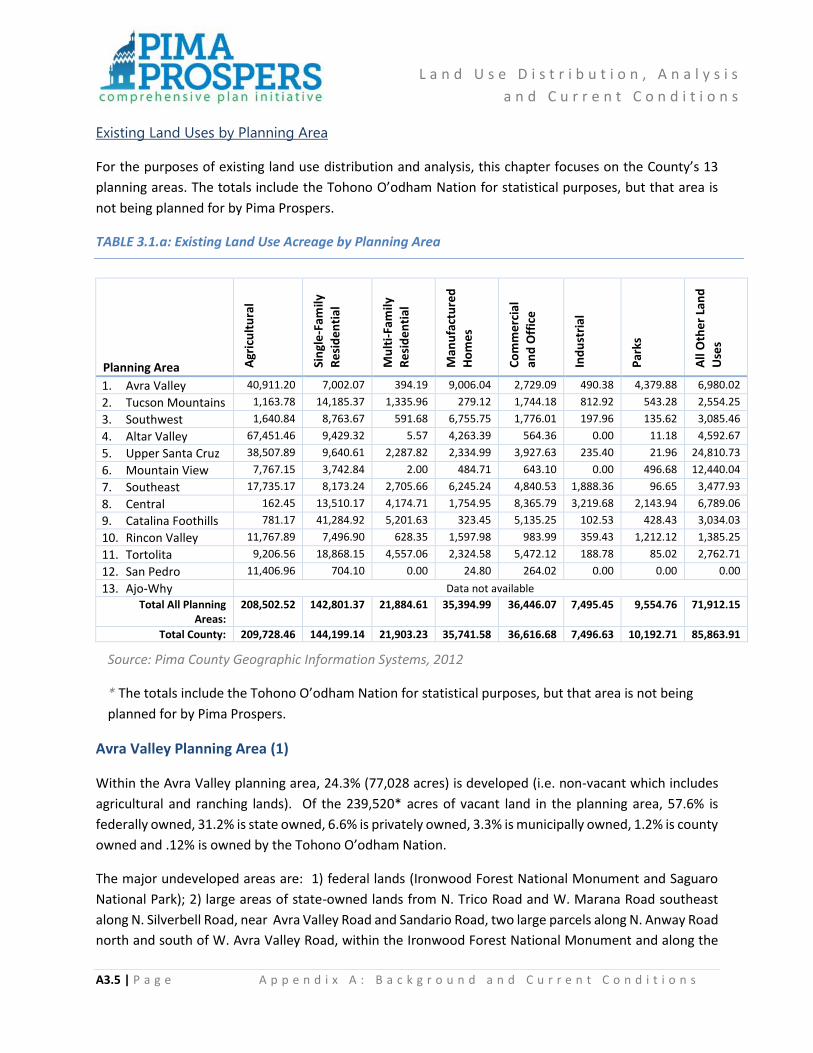
L a n d U s e D i s t r i b u t i o n , A n a l y s i s
a n d C u r r e n t C o n d i t i o n s
A3.5 | P a g e A p p e n d i x A : B a c k g r o u n d a n d C u r r e n t C o n d i t i o n s
Existing Land Uses by Planning Area
For the purposes of existing land use distribution and analysis, this chapter focuses on the County’s 13
planning areas. The totals include the Tohono O’odham Nation for statistical purposes, but that area is
not being planned for by Pima Prospers.
TABLE 3.1.a: Existing Land Use Acreage by Planning Area
Planning Area Agr
icu
ltu
ral
Sin
gle
-Fam
ily
Re
sid
en
tial
Mu
lti-
Fam
ily
Re
sid
en
tial
Man
ufa
ctu
red
Ho
me
s
Co
mm
erc
ial
and
Off
ice
Ind
ust
rial
Par
ks
All
Oth
er
Lan
d
Use
s
1. Avra Valley 40,911.20 7,002.07 394.19 9,006.04 2,729.09 490.38 4,379.88 6,980.02
2. Tucson Mountains 1,163.78 14,185.37 1,335.96 279.12 1,744.18 812.92 543.28 2,554.25
3. Southwest 1,640.84 8,763.67 591.68 6,755.75 1,776.01 197.96 135.62 3,085.46
4. Altar Valley 67,451.46 9,429.32 5.57 4,263.39 564.36 0.00 11.18 4,592.67
5. Upper Santa Cruz 38,507.89 9,640.61 2,287.82 2,334.99 3,927.63 235.40 21.96 24,810.73
6. Mountain View 7,767.15 3,742.84 2.00 484.71 643.10 0.00 496.68 12,440.04
7. Southeast 17,735.17 8,173.24 2,705.66 6,245.24 4,840.53 1,888.36 96.65 3,477.93
8. Central 162.45 13,510.17 4,174.71 1,754.95 8,365.79 3,219.68 2,143.94 6,789.06
9. Catalina Foothills 781.17 41,284.92 5,201.63 323.45 5,135.25 102.53 428.43 3,034.03
10. Rincon Valley 11,767.89 7,496.90 628.35 1,597.98 983.99 359.43 1,212.12 1,385.25
11. Tortolita 9,206.56 18,868.15 4,557.06 2,324.58 5,472.12 188.78 85.02 2,762.71
12. San Pedro 11,406.96 704.10 0.00 24.80 264.02 0.00 0.00 0.00
13. Ajo-Why Data not available
Total All Planning Areas:
208,502.52 142,801.37 21,884.61 35,394.99 36,446.07 7,495.45 9,554.76 71,912.15
Total County: 209,728.46 144,199.14 21,903.23 35,741.58 36,616.68 7,496.63 10,192.71 85,863.91
Source: Pima County Geographic Information Systems, 2012
* The totals include the Tohono O’odham Nation for statistical purposes, but that area is not being
planned for by Pima Prospers.
Avra Valley Planning Area (1)
Within the Avra Valley planning area, 24.3% (77,028 acres) is developed (i.e. non-vacant which includes
agricultural and ranching lands). Of the 239,520* acres of vacant land in the planning area, 57.6% is
federally owned, 31.2% is state owned, 6.6% is privately owned, 3.3% is municipally owned, 1.2% is county
owned and .12% is owned by the Tohono O’odham Nation.
The major undeveloped areas are: 1) federal lands (Ironwood Forest National Monument and Saguaro
National Park); 2) large areas of state-owned lands from N. Trico Road and W. Marana Road southeast
along N. Silverbell Road, near Avra Valley Road and Sandario Road, two large parcels along N. Anway Road
north and south of W. Avra Valley Road, within the Ironwood Forest National Monument and along the
L a n d U s e D i s t r i b u t i o n , A n a l y s i s
a n d C u r r e n t C o n d i t i o n s
A3.6 | P a g e A p p e n d i x A : B a c k g r o u n d a n d C u r r e n t C o n d i t i o n s
Central Arizona Project (CAP); and 3) large parcels owned by the City of Tucson primarily for well fields
and other privately owned parcels scattered between the state land parcels.
The unincorporated areas of more intense, existing residential development are surrounding the Picture
Rocks Road area, Anway Road and W. El Tiro Road south to W. Avra Valley Road is low-density residential.
The area near N. Anway Road and Manville Road is slightly more dense. The planning area also includes
the Central Arizona Project (CAP) and the Marana Regional Airport. There are also higher intensity areas
within the Town of Marana west of Interstate 10. Large agricultural areas exist north towards the
Pima/Pinal county line.
Tucson Mountains Planning Area (2)
Within the Tucson Mountains planning area, 26,183 acres (51.7%) are developed/non-vacant (includes
agricultural and ranching lands). Of the vacant land (24,432 acres or 48.2% of the total area) 13.6% is
County-owned, 11.8% is federally owned, 4.4% is municipally owned, 16.5% is privately owned, and 2% is
state owned. The major undeveloped areas are the Santa Cruz River floodplain, Saguaro National Park,
Tucson Mountain Park, Sweetwater Preserve, Greasewood Park, surrounding Pima College west, and
Sentinel Peak/Tumamoc Hill. The areas of more intense residential development are the Continental
Ranch development within the Town of Marana, the Rancho del Cerro and Agua Dulce Subdivisions within
unincorporated Pima County, and higher-density development within the City of Tucson, particularly east
of Greasewood Road and south of Goret Road, along Silverbell Road, in the Menlo Park area, and at the
major intersections of Silverbell Road at St. Marys Road, Speedway Boulevard, and Grant Road.
Southwest Planning Area (3)
The eastern portion of this planning area has been largely developed (typically accounting for 8% of
County permits) yet still has measurable infill potential. The northwestern portions are more prone to
flooding issues and difficult to serve with wastewater facilities. Areas along the Ajo Road and Valencia
Road corridors can sustain higher densities (flood control and drainage concerns permitting). Land
ownership is widespread and diverse, including federal government, the State of Arizona, Pima County,
the Arizona Board of Regents, and Tribal Nations. Private land ownership is not significant in terms of
large, undeveloped parcels. Some of the owners are anticipated to release all or portions of their property
to development. A total of 17,260 existing dwelling units were identified in this planning area.
The planning area includes or abuts several large, national and regional parks such as Saguaro National
Park West, Tucson Mountain Park, Saginaw Hill Regional Park and Robles Pass Trails Park. There are also
seven neighborhood, district and community parks within the Pima County park system.
Altar Valley Planning Area (4)
Within the Altar Valley planning area, 84,200 acres (11.8%) are developed/non-vacant (includes
agricultural and ranching lands). Most of the planning area is undeveloped including ranching/agricultural
uses or natural open space.

L a n d U s e D i s t r i b u t i o n , A n a l y s i s
a n d C u r r e n t C o n d i t i o n s
A3.7 | P a g e A p p e n d i x A : B a c k g r o u n d a n d C u r r e n t C o n d i t i o n s
Of the vacant land (628,263 acres) 56.1% is state-owned, 29.8% is federally owned, 8.6% is owned by the
Tohono O’odham Nation, 1.8% is county owned, and 0.5% is municipally owned. Most of the planning
area is undeveloped with the following exceptions, which are areas of more intense, primarily residential
development:
• Diamond Bell Ranch subdivisions
• Unplatted GR-1 zoned residential areas
• Three Points
• Arivaca
Commercial development is limited to Three Points and Arivaca.
Upper Santa Cruz Planning Area (5)
Within the Upper Santa Cruz planning area, 89,676 acres (51%) are developed/non-vacant (includes
agriculture and mining lands). Most of the built areas (12% of the total area) occur along Interstate 19 (I-
19) within the Canoa Land Grant boundary from the Town of Sahuarita extending south and including
Green Valley with additional development further east of I-19 in Quail Creek and Continental and at the
southern tip of I-19 within the planning area in Amado (a.k.a. Arivaca Junction). Outside of this I-19
corridor, is predominantly low-intensity rural land use, mining, and agriculture. Agriculture and mining
combined equal approximately 75% of the developed/non-vacant land and 38% of all land within the
planning area. The southern half of the Canoa Ranch land Grant on the east side of I-19 is primarily open
space.
The areas of more intense residential uses mixed with limited commercial and office uses are: (1) Green
Valley on the west side of I-19 within the Canoa Land Grant boundary north of the Escondido Wash, (2)
Green Valley and Continental on the east side of I-19 within the Canoa Land Grant boundary beginning at
the southern end of the Torres Blancas Golf Course extending north to the Town of Sahuarita, (3) the
Town of Sahuarita including the master planned communities of Rancho Sahuarita and Quail Creek, and
to a lesser degree, (4) Amado, Montana Vista, and Elephant Head.
Mountain View Planning Area (6)
Within the Mountain View planning area, 16.3% (29,884 acres) is developed/non-vacant (includes
agricultural and ranching lands). Of the vacant land (153,928 acres) 53.1% is state owned, 36.9% is
federally owned, 6.1% is County-owned, and 3.8% is privately owned.
This planning area is very sparsely developed and where developed is by large lot, single-family residential.
The areas of such development are along Old Sonoita Highway near E. Mesquite Mesa Trail and near
Hilltop Ranch Road. There is an area of SH zoning near I-10 and the Pima/Cochise County line and an area
zoned GR-1 near the I-10 and Sonoita Highway intersection. Otherwise the planning area is zoned IR
(Institution Reserve) for government owned parcels and RH (Rural Homestead) with a minimum lot size
L a n d U s e D i s t r i b u t i o n , A n a l y s i s
a n d C u r r e n t C o n d i t i o n s
A3.8 | P a g e A p p e n d i x A : B a c k g r o u n d a n d C u r r e n t C o n d i t i o n s
of 4.1 acres. The planning area includes the Las Cienegas National Conservation Area which includes the
Empire Ranch and the Coronado National Forest.
Southeast Planning Area (7)
Within the Southeast planning area, 52,940 acres (24%) are developed/non-vacant. Most of those
developed/non-vacant lands occur north of an east-west boundary established by the Old Vail Connection
alignment. North of this alignment, are industrial and urban intensity residential uses. South of the
alignment, rural, low intensity residential use is the predominant use. Within this rural area, however,
there are significant pockets where more intense residential uses, both built and planned, occur.
Privately-owned lands (70,344 acres) constitute 32% of the planning area. Save a few acres within the
Tohono O’odham Nation (San Xavier District), the balance of this planning area (30,332 acres; 13.7%) is
owned by the federal government, specifically the U.S. Forest Service and Bureau of Land Management.
By jurisdiction, 20% (43,304 acres) is within the City of Tucson, 2% (4,639 acres) is within the Town of
Sahuarita, and 42% (93,214 acres) is within unincorporated Pima County. A negligible amount of this
planning area (22 acres) is a small portion of the City of South Tucson.
The areas of more intense residential uses are: (1) Swan Road and Singing Cactus Lane (Swan Southlands
Specific Plan), and (2) S. Houghton Road and Camino del Toro (Corona de Tucson, Santa Rita Ranch,
Sycamore Canyon, New Tucson). Large, undeveloped tracts of land owned by Arizona State Land and
federal land management agencies have significantly influenced the existing development pattern of
privately owned property. This influence is not expected to change in the next 20 or more years.
Central Planning Area (8)
Within the Central planning area, 50,862 acres (64%) are developed/non-vacant (includes agricultural and
ranching lands). Most of the planning area is built with scattered exceptions throughout the planning
area. Of the vacant land (29,026 acres) 4% is County-owned, 13.4% is federally owned, 21% is municipally
owned, 23% is privately owned, and 38.3% is state owned. The major undeveloped area is located
southeast of roughly Camino Seco and Irvington Road, a large portion (10,800 acres) of which is the
Houghton Area Master Plan (HAMP) adopted by the City of Tucson on June 7, 2005. The largest portion
(76%) of HAMP is owned by the Arizona State Land Department.
The areas of more intense residential development are at main intersections and along major roads,
particularly north of Speedway Boulevard and south of 22nd Street including the Rita Ranch development,
but with the exception of the area around Davis Monthan Air Force Base (DMAFB) and in the southeastern
portion of the planning area. Commercial development is concentrated along Interstate-10, along major
roads particularly Oracle Road north of Grant Road, along Broadway Boulevard from Swan Road to Wilmot
Road, and all along Speedway Boulevard.

L a n d U s e D i s t r i b u t i o n , A n a l y s i s
a n d C u r r e n t C o n d i t i o n s
A3.9 | P a g e A p p e n d i x A : B a c k g r o u n d a n d C u r r e n t C o n d i t i o n s
Within unincorporated Pima County, a relatively intense commercial area exists west of DMAFB and south
of 36th Street near Palo Verde Road. Additionally, the University of Arizona Science and Technology Park,
the Target distribution center, and a canning facility are located near Interstate 10 and Rita Road.
Catalina Foothills Planning Area (9)
Within the Catalina Foothills planning area, 66,502 acres (33.3%) are developed/non-vacant (includes
agricultural and ranching lands). Of the vacant land (133,896 acres or 66.8% of the total area) 90.2% is
owned by the federal government (primarily Coronado National Forest), 8.0% is privately owned, 3.7% is
state owned, 1.2% is County owned and .5% is municipally owned.
The major undeveloped areas are the Coronado National Forest, the major washes (Rillito River, Tanque
Verde Wash and Pantano Wash) and their tributaries, Saguaro National Park, and a few isolated, privately-
owned parcels.
The Catalina Foothills are predominantly one residence per acre (RAC) development. North of Oracle
Jaynes Station and west of Shannon Road are higher 3-4 RAC developments with scattered spots of dense
residential development along Oracle Road and Ina Road. East of Oracle Road, the area is overwhelmingly
one residence per acre. Higher residential densities of approximately seven residences per acre are found
along majors and some cluster-type developments (e.g. Sunrise Ridge and Sunrise Presidio Townhouses,
Sabino Springs) are built along major routes. There are some scattered, isolated parcels that remain
undeveloped in the planning area, with the exception of some larger parcels of mostly .3 – 1 RAC density
located east of Catalina Highway. On the east side of the planning area and south of Tanque Verde Road
is mainly .3 – 1 RAC development. There are scattered nodes of commercial development at major
intersections throughout the planning area, with the exception of the far eastern portion where
commercial development is scarce. Industrial development is essentially non-existent.
Rincon Valley Planning Area (10)
Within the Rincon Valley planning area, 24.8% (30,304 acres) is developed (i.e. non-vacant which includes
agricultural and ranching lands). Of the 91,858 acres of vacant land in the planning area, 42% is federally
owned, 39% is state owned, 11% is privately owned, 8% is County owned, and less than 1% is municipally
owned. The major undeveloped areas are: 1) federal lands (Saguaro National Park and Coronado National
Forest (Rincon Mountains)); 2) state lands surrounding the area of Pistol Hill Road and Old Spanish Trail,
scattered around Marsh Station Road, and large parcels east of Marsh Station Road; 3) privately-owned
parcels including the mostly undeveloped Rocking K project and other lands scattered between state land
parcels. The unincorporated areas of more intense, existing residential development are the Garrigans
Gulch area, Rancho del Lago and Vail areas.
Tortolita Planning Area (11)
Within the Tortolita planning area, 31% (46,163 acres) is developed (i.e. non-vacant which includes
agricultural and ranching lands). Of the 104,288 acres of vacant land in the planning area, 43% is federally

L a n d U s e D i s t r i b u t i o n , A n a l y s i s
a n d C u r r e n t C o n d i t i o n s
A3.10 | P a g e A p p e n d i x A : B a c k g r o u n d a n d C u r r e n t C o n d i t i o n s
owned, 34% is state owned, 17% is privately owned, 4.5% is County owned, and 1% is municipally owned.
The major undeveloped areas are: 1) federal lands (Coronado National Forest – Catalina Mountains); 2)
state lands particularly north of the Rancho Vistoso development and east of the Lago del Oro Parkway,
and to a lesser extent 3) privately-owned parcels planned for low-density residential development located
north of Linda Vista Boulevard. The unincorporated areas of more intense, residential development are
south of Linda Vista Boulevard.
San Pedro Planning Area (12)
Within the San Pedro planning area, 28,538 acres (16.4%) are developed/non-vacant (includes agricultural
and ranching lands). Of the vacant land (67,838 acres) 46.5% is state-owned, 45.3% is federally owned,
4.8% is county owned, and 2.8% is privately-owned. Development of the planning area is limited to
several ranches along the San Pedro River.
San Pedro’s population is small compared to all other planning areas. The planning area had a population
of 137 and 107 in 2000 and 2010, respectively. This planning area experienced at 22% decrease in
population in the same time frame. This is the only planning area that experienced a decrease in
population from 2000 to 2010.
This planning area is characterized as very rural with mostly ranching, farming and rural-residential uses.
It is located on the east side of the Catalina Mountains and disconnected from the metropolitan area.
With an area of 272 square miles, this planning area had a population density of 1 person per square mile
in 2000, and in 2010. Accounting for the population decrease in that decade, the population density
decreased to 0 persons per square miles according to Bureau of the Census population counts.
Ajo-Why Planning Area (13)
According to the “Ajo Community Comprehensive Plan” prepared by the University of Arizona School of
Planning and Community Planning and Design Workshop (April 2001) prepared for the Western Pima
Community Council, “Ajo has a distinct land use pattern that is typical of a post-company owned town.
Twenty-five percent of private land in Ajo is vacant.”
Of the total 981,488 acre Ajo-Why planning area, 98 percent is under federal ownership. Other ownership
is as follows: privately-owned/non-mining lands are .6 percent, privately owned/mining lands are .8
percent, county owned are .3 percent, and state owned lands are .3 percent of the total area. Formerly
one of the largest copper mines in the world, the New Cornelia pit in Ajo is over a mile wide.
Existing land uses include agriculture, single-family residential, multi-family residential, manufactured
home, commercial and office, and some industrial uses. Ajo is surrounded by 12 million acres of public
and tribal land, which include Organ Pipe Cactus National Monument and Cabeza Prieta National Wildlife
Refuge, and tribal lands.
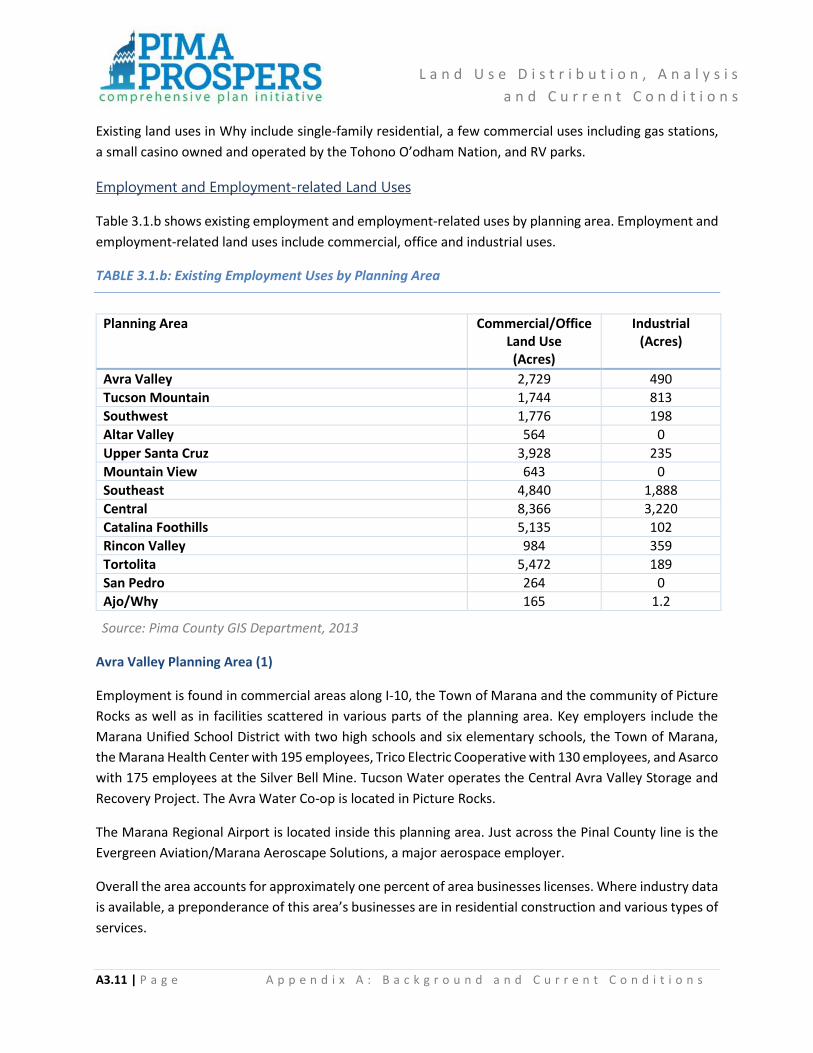
L a n d U s e D i s t r i b u t i o n , A n a l y s i s
a n d C u r r e n t C o n d i t i o n s
A3.11 | P a g e A p p e n d i x A : B a c k g r o u n d a n d C u r r e n t C o n d i t i o n s
Existing land uses in Why include single-family residential, a few commercial uses including gas stations,
a small casino owned and operated by the Tohono O’odham Nation, and RV parks.
Employment and Employment-related Land Uses
Table 3.1.b shows existing employment and employment-related uses by planning area. Employment and
employment-related land uses include commercial, office and industrial uses.
TABLE 3.1.b: Existing Employment Uses by Planning Area
Source: Pima County GIS Department, 2013
Avra Valley Planning Area (1)
Employment is found in commercial areas along I-10, the Town of Marana and the community of Picture
Rocks as well as in facilities scattered in various parts of the planning area. Key employers include the
Marana Unified School District with two high schools and six elementary schools, the Town of Marana,
the Marana Health Center with 195 employees, Trico Electric Cooperative with 130 employees, and Asarco
with 175 employees at the Silver Bell Mine. Tucson Water operates the Central Avra Valley Storage and
Recovery Project. The Avra Water Co-op is located in Picture Rocks.
The Marana Regional Airport is located inside this planning area. Just across the Pinal County line is the
Evergreen Aviation/Marana Aeroscape Solutions, a major aerospace employer.
Overall the area accounts for approximately one percent of area businesses licenses. Where industry data
is available, a preponderance of this area’s businesses are in residential construction and various types of
services.
Planning Area Commercial/Office Land Use (Acres)
Industrial (Acres)
Avra Valley 2,729 490
Tucson Mountain 1,744 813
Southwest 1,776 198
Altar Valley 564 0
Upper Santa Cruz 3,928 235
Mountain View 643 0
Southeast 4,840 1,888
Central 8,366 3,220
Catalina Foothills 5,135 102
Rincon Valley 984 359
Tortolita 5,472 189
San Pedro 264 0
Ajo/Why 165 1.2

L a n d U s e D i s t r i b u t i o n , A n a l y s i s
a n d C u r r e n t C o n d i t i o n s
A3.12 | P a g e A p p e n d i x A : B a c k g r o u n d a n d C u r r e n t C o n d i t i o n s
Tucson Mountains Planning Area (2)
Employment is clustered along I-10 and the higher-density neighborhoods south of Grant Road, with the
exception of Pima Community College West Campus and JW Marriott Resort located in the Tucson
Mountains.
The northern I-10 corridor contains significant manufacturing/aerospace/defense activity, including
Sargent Aerospace and Defense Corp. (275 employees), FLSmidth Krebs (267 employees), and Dover
Diversified. Also located along this corridor is Convergys Corporation, a call center (900 employees), Coca-
Cola Bottling Company of Tucson (180 employees) and Arizona Portland Cement/CalPortland cement
plant (127 employees).
Retail centers are found at the Arizona Pavilions Shopping Center just south of West Cortaro Road, and at
the major intersections of Silverbell Road at St. Marys Road, Speedway Boulevard, and Grant Road, with
many smaller retail businesses scattered along St. Marys Road, Grant Road and Grande Avenue.
Hospitality and tourism is an important industry for this area, with the JW Marriott Starr Pass Resort and
Spa employing 550 workers, as well as numerous motor inns along the I-10 frontage road from Grant Road
to 22nd Street.
The southern, inner-city neighborhoods between Grant Road and Congress Street contain significant
employment in the government, education, social services and health care sectors. Carondelet Health
Network accounts for approximately 2000 jobs, between administrative offices located on North Forbes
off of Grant Road and St. Mary’s Hospital located in Menlo Park Neighborhood. Education employers
include Marana Unified School District, Tucson Unified School District, Pima Community College West
Campus and Community Campus, and Arizona State Schools for the Deaf and the Blind. This area also
includes the western terminus of the Tucson Modern Street Car south of Congress Street and west of I-
10.
Overall the area accounts for approximately 5% of area business licenses. Where industry data is
available, a preponderance of businesses are in trade and various types of services.
Southwest Planning Area (3)
The SWIP area includes Ryan Airfield General Aviation Airport, owned and operated by the Tucson Airport
Authority. The airfield is currently planning for future expansion to serve the anticipated aviation business
needs of the region.
Altar Valley Planning Area (4)
Employment is found in small businesses along State Route 86, in the communities of Arivaca and Robles
Junction, as well as at scattered sites in various parts of the planning area. Key employers include Altar

L a n d U s e D i s t r i b u t i o n , A n a l y s i s
a n d C u r r e n t C o n d i t i o n s
A3.13 | P a g e A p p e n d i x A : B a c k g r o u n d a n d C u r r e n t C o n d i t i o n s
Valley Unified School District - with one elementary and one middle school – and the Three Points Fire
District.
Overall, the area accounts for approximately 0.3% of Tucson business licenses. Where industry data is
available, a preponderance of businesses are in residential construction, landscaping, retail trade, and
other services.
Upper Santa Cruz Planning Area (5)
Copper mining is a major economic activity in this planning area, with employment centers at Asarco on
the northern boundary of the area and Freeport-McMoRan west of Green Valley. These employers
reported 7,065 jobs, collectively, in April 2011, according to the Star 200. Senior residential and health
care services account for significant employment in the community of Green Valley with 530 jobs at La
Posada at Park Centre Inc., and others in smaller, assisted living facilities.
Business license records show 323 businesses listed for zip codes that fall (at least partially) in this
planning area. Although industry classification data is incomplete for this dataset, available information
indicates a preponderance of enterprises in the construction and service sectors, with approximately
30% in construction and 20% in retail trade. Census commute times for this planning area show that 37%
of residents may work within or near this planning area, with travel time to work of 15 minutes or less.
Mountain View Planning Area (6)
The sparsely-populated planning area contains very limited economic activity, with just five Tucson
business licenses. Rosemont Copper’s proposed mining operation in the planning area proposes to
employ 1,000 people during the construction phase, if implemented, and between 400 and 500 ongoing
workers during full operation.
Southeast Planning Area (7)
Employment centers are primarily located in the northern portion of this planning area. Raytheon,
Tucson International Airport and associated industries are significant employers. Other employment
areas include commercial and industrial uses in the area north of Irvington Road between Interstate 10
and Interstate 19 and correctional facilities along Wilmot Road and Old Vail Connection.
Pima County’s One Stop Program (Community Services, Employment and Training Department) has
identified significant opportunities for workforce development and training in this planning area. There
are 3,207 business licenses listed for zip codes that fall (at least partially) in this area. One Stop has
surveyed 49 companies in these zip codes and identified 960 jobs. Census commute times, which are
comparable to countywide data, indicate that 25% of residents may work within or near the planning
area, with travel time to work of 15 minutes or less.
L a n d U s e D i s t r i b u t i o n , A n a l y s i s
a n d C u r r e n t C o n d i t i o n s
A3.14 | P a g e A p p e n d i x A : B a c k g r o u n d a n d C u r r e n t C o n d i t i o n s
The aerospace and defense industries are leading contributors to our region’s economy. To protect the
existing employment base and support future expansion of these industries, an Aerospace-Defense
Corridor has been identified that encompasses the Tucson International Airport, Raytheon, and Arizona
Air National Guard facilities.
Central Planning Area (8)
Commercial development is concentrated along Interstate-10, along major roads particularly Oracle
Road north of Grant Road, along Broadway Boulevard from Swan Road to Wilmot Road, and all along
Speedway Boulevard. Within unincorporated Pima County, a relatively intense commercial area exists
west of DMAFB and south of 36th Street near Palo Verde Road. Additionally, the University of Arizona
Science and Technology Park, the Target distribution center, and a canning facility are located near
Interstate 10 and Rita Road. The Port of Tucson, and intermodal, logistics and distribution facility, is also
located within this planning area.
This planning area contains approximately 250,000 or 55% of the county’s jobs, with employment centers
at the University of Arizona, Downtown, along the commercial corridors described above, and scattered
throughout the planning area. Based on the 2010 American Community Survey estimated commute
times for the City of Tucson as many as 75% of residents may work within or near this planning area, with
travel time to work of 30 minutes or less.
Business license records show 14,090 businesses listed in this planning area for the fourth quarter of
2011, 51% of all current Tucson licenses. The 2009 Economic Census reported 20,547 business
establishments countywide. According to that dataset 98% of local businesses have fewer than 100
employees; 52% have fewer than five.
Although industry classification data is incomplete for the business license dataset, available information
indicates approximately 6% of local businesses are in construction, 2% in manufacturing, 3% in wholesale
trade and 14% in retail trade. Transportation and warehousing accounts for another 2% of businesses,
information and financial services each 1%, respectively, and real estate 9%. Of those licenses with an
industry classification code, 17% are in the professional, scientific and technical services area.
Countywide employment data also shows a preponderance of jobs in service sectors (89% of nonfarm
jobs) with the biggest concentration - 22% - of jobs is in government agencies, with business services,
health, trade and leisure/tourism each accounting for between 10% and 14% of local jobs.
Notwithstanding this, manufacturing employment - especially Aerospace Products and Parts - is critically
important to the regional economy in terms of its concentration of high-paying jobs, share of exports
and competitive advantage. In Pima County, the employment share of Aerospace and Defense is 12 times
higher than U.S. average.
L a n d U s e D i s t r i b u t i o n , A n a l y s i s
a n d C u r r e n t C o n d i t i o n s
A3.15 | P a g e A p p e n d i x A : B a c k g r o u n d a n d C u r r e n t C o n d i t i o n s
Catalina Foothills Planning Area (9)
Employment is clustered along the southern and western edges of the planning area, along arterials such
as Oracle Road, River Road, East Speedway Boulevard, East Broadway Boulevard and East 22nd Street.
Many of the area’s businesses are service-based, with retail centers found at Oracle Road and Ina Road,
Grant Road and Tanque Verde Road, La Encantada at Campbell Avenue and Skyline Drive and other major
intersections. Hospitality is a significant contributor, with scenic resort properties throughout the
Catalina foothills. Top employers are Catalina Foothills School District, Northwest Medical Center, Long
Realty Co., Tierra Antigua Realty, Canyon Ranch, and Loews Ventana Canyon Ranch.
Overall the area accounts for approximately 21% of Tucson business licenses; where industry data is
available, a preponderance of businesses are in trade and various types of services.
Rincon Valley Planning Area (10)
The planning area contains minimal employment, with isolated, service-based enterprises along Old
Spanish Trail and a small business district on Colossal Cave Road in Vail. The Vail School District is a major
employer, with Cienega High School and Old Vail Middle School and two elementary schools located in
the planning area. Overall, the area accounts for less than one percent of Tucson business licenses; where
industry data is available, a preponderance of businesses are in trade and various types of services.
Tortolita Planning Area (11)
Employment in this planning area is concentrated along Oracle Road. According to the 2007 Economic
Census, the Town of Oro Valley contains 568 businesses and accounts for approximately 8,000 of the
County’s jobs. Retail trade, hospitality, healthcare/bioscience, and manufacturing account for the
preponderance of jobs. Key employers include Roche Ventana Medical Systems, Honeywell, Northwest
Medical Center and Hilton El Conquistador Resort. The Census identified 100 establishments and
approximately 1,100 jobs (mostly retail and hospitality) in the unincorporated community of Catalina.
Business license records indicate another 1,285 businesses that are in Marana or in the unincorporated
area, concentrated in the construction, retail, professional services, administrative services, and
landscaping/environmental services industries.
San Pedro Planning Area (12)
Economic activity in this planning area is limited to several ranches along the San Pedro River. There are
no Tucson business licenses in this area.
Ajo/Why Planning Area (13)
Public sector employers in the area include the Ajo Unified School District, the US Border Patrol, Pima
County, US Postal Service, and National Park Service. Private sector employers in the area include

L a n d U s e D i s t r i b u t i o n , A n a l y s i s
a n d C u r r e n t C o n d i t i o n s
A3.16 | P a g e A p p e n d i x A : B a c k g r o u n d a n d C u r r e n t C o n d i t i o n s
Freeport McMoRan Copper and Global, Inc., International Sonoran Desert Alliance, Desert Senita
Community Health Center, the Tohono O’odham Nation, Olson’s Market, and Circle K.
Current Zoning by Planning Area
Table 3.1.c shows current zoning acreage by planning area.
Exhibits 3.1.e and 3.1.f, included at the end of this chapter, show current zoning.
Exhibits 3.1.g and 3.1.h, included at the end of this chapter, show the County’s Planned Land Use and
Exhibit 3.1.i and 3.1.j, included at the end of this chapter, show existing overlay zones.

L a n d U s e D i s t r i b u t i o n , A n a l y s i s
a n d C u r r e n t C o n d i t i o n s
A3.17 | P a g e A p p e n d i x A : B a c k g r o u n d a n d C u r r e n t C o n d i t i o n s
TABLE 3.1.c: Current Zoning Acreage by Planning Area
Planning Area
Inst
itu
tio
nal
Re
serv
e
Ru
ral R
esi
de
nti
al
Sub
urb
an R
anch
Sin
gle
Re
sid
en
ce/
Sub
urb
an H
om
est
ead
Mix
ed
Dw
elli
ng/
Mu
ltip
le R
esi
de
nce
Man
ufa
ctu
red
an
d
Mo
bile
Ho
me
Trai
ler
Ho
me
site
Tran
siti
on
al
Co
mm
erc
ial
Ind
ust
rial
Mu
ltip
le U
se
Mas
ter
Pla
nn
ed
Co
mm
un
ity
Go
lf C
ou
rse
Ove
rlay
Mo
un
t Le
mm
on
Maj
or
Re
sort
1. Avra Valley 133,562 151,923 857 4,268 0 0 0 36 133 1,220 0 0 0 0 0
2. Tucson Mountains 6,916 2,049 18,462 4,298 0 0 89 0 97 197 0 242 0 0 0
3. Southwest 16,749 108,149 5,297 5,450 2,027 867 613 346 680 646 0 2,965 0 0 0
4. Altar Valley 76,911 626,409 283 8,716 0 0 0 9 48 0 0 0 0 0 0
5. Upper Santa Cruz 0 152,783 944 2,860 1,469 170 113 1,539 682 139 0 545 622 0 0
6. Mountain View 66,981 115,755 0 681 0 0 0 0 0 0 0 0 0 0 0
7. Southeast 28,080 123,435 523 5,209 767 139 254 189 426 7,533 604 6,592 0 0 0
8. Central 0 1,196 136 529 249 59 35 16 326 3,974 1,708 536 0 0 0
9. Catalina Foothills 123,289 2 23,664 31,731 2,134 14 95 1,089 784 13 6 545 0 687 0
10. Rincon Valley 51,844 58,753 2,385 2,049 49 58 0 0 92 593 0 5,564 0 0 0
11. Tortolita 41,195 22,164 11,233 5,417 2,694 24 24 415 532 62 0 240 0 18 43
12. San Pedro 83,048 91,137 0 0 0 0 0 0 0 0 0 0 0 125 0
13. Ajo-Why 881,261 90,355 0 4,805 851 78 40 69 234 3,807 0 0 0 0 0
Total All Planning Areas: 1,509,836 1,544,108 63,785 76,013 10,239 1,409 1,262 3,707 4,035 18,185 2,318 17,229 622 830 43
Total Unincorporated
County:
1,513,083 3,900,076 63,786 76,017 10,239 1,409 1,423 3,707 4,035 18,185 2,318 17,231 622 830 43
Source: Pima County Geographic Information Systems, 2013
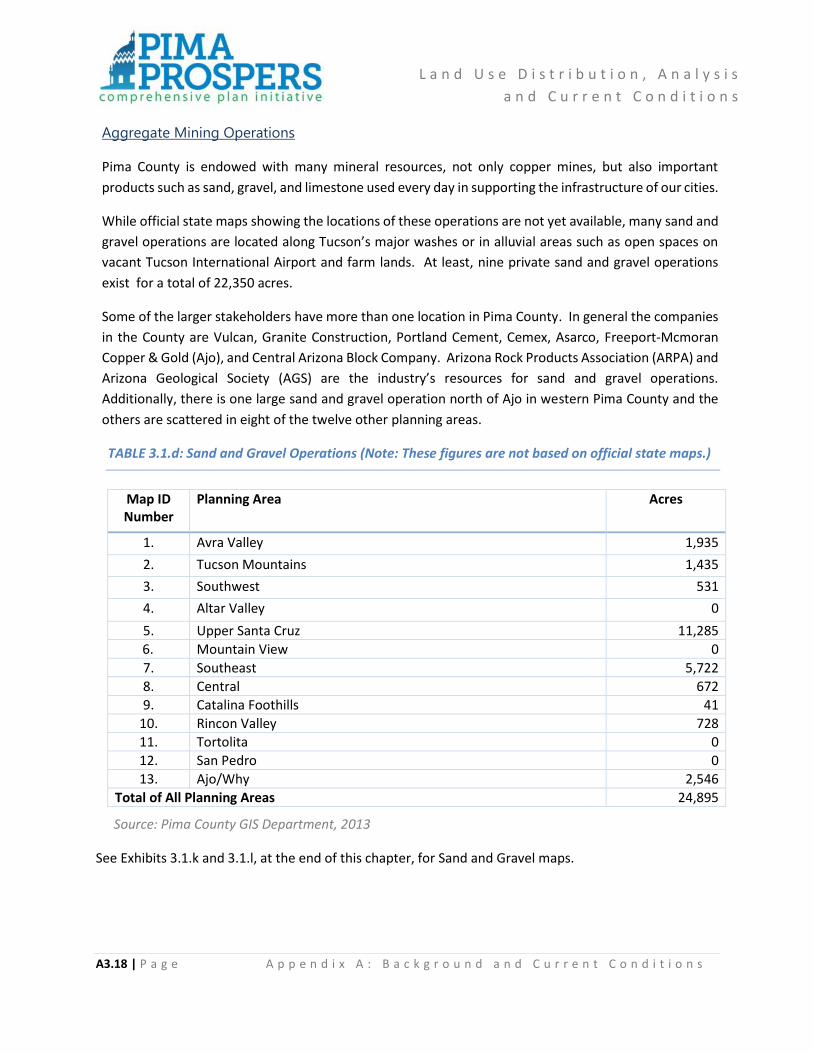
L a n d U s e D i s t r i b u t i o n , A n a l y s i s
a n d C u r r e n t C o n d i t i o n s
A3.18 | P a g e A p p e n d i x A : B a c k g r o u n d a n d C u r r e n t C o n d i t i o n s
Aggregate Mining Operations
Pima County is endowed with many mineral resources, not only copper mines, but also important
products such as sand, gravel, and limestone used every day in supporting the infrastructure of our cities.
While official state maps showing the locations of these operations are not yet available, many sand and
gravel operations are located along Tucson’s major washes or in alluvial areas such as open spaces on
vacant Tucson International Airport and farm lands. At least, nine private sand and gravel operations
exist for a total of 22,350 acres.
Some of the larger stakeholders have more than one location in Pima County. In general the companies
in the County are Vulcan, Granite Construction, Portland Cement, Cemex, Asarco, Freeport-Mcmoran
Copper & Gold (Ajo), and Central Arizona Block Company. Arizona Rock Products Association (ARPA) and
Arizona Geological Society (AGS) are the industry’s resources for sand and gravel operations.
Additionally, there is one large sand and gravel operation north of Ajo in western Pima County and the
others are scattered in eight of the twelve other planning areas.
TABLE 3.1.d: Sand and Gravel Operations (Note: These figures are not based on official state maps.)
Map ID Number
Planning Area Acres
1. Avra Valley 1,935
2. Tucson Mountains 1,435
3. Southwest 531
4. Altar Valley 0
5. Upper Santa Cruz 11,285
6. Mountain View 0
7. Southeast 5,722
8. Central 672
9. Catalina Foothills 41
10. Rincon Valley 728
11. Tortolita 0
12. San Pedro 0
13. Ajo/Why 2,546
Total of All Planning Areas 24,895
Source: Pima County GIS Department, 2013
See Exhibits 3.1.k and 3.1.l, at the end of this chapter, for Sand and Gravel maps.

L a n d U s e D i s t r i b u t i o n , A n a l y s i s
a n d C u r r e n t C o n d i t i o n s
A3.19 | P a g e A p p e n d i x A : B a c k g r o u n d a n d C u r r e n t C o n d i t i o n s
Military Airports
Davis-Monthan Air Force Base (DMAFB) and the 162nd Air National Guard Fighter Wing portion of Tucson International Airport (TIA) are military airports within Tucson city limits. There is a military installation located at the Barry M. Goldwater Air Force Range located north of Ajo, but it is located primarily within Maricopa County. Comprehensive planning and zoning for the environs of these airports includes unincorporated areas of Pima County. In addition to national security, these military airports provide economic benefits to the region. DMAFB is one of the region’s major employers with approximately 7,500 (2013) military positions and approximately 2,900 (2013) civilian jobs1. Including retiree data, the base circulated approximately $1.5 billion into the local economy and created approximately 4,400 jobs in 20131. DMAFB’s location within the city presents issues of potential encroachment of incompatible land uses and development patterns, and building construction types which could jeopardize public health, safety, and welfare. In turn, this could endanger the continued viability of DMAFB to carry out its current and future missions, which could result in its closure. The February 2004 Davis-Monthan Air Force Base/Tucson/Pima County Joint Land Use Study (JLUS) is intended to guide the decisions made by a variety of public and private entities in relation to compatible land use around DMAFB. In addition to the State of Arizona and its agencies, the Department of Defense, DMAFB, local jurisdictions, and private interests within the area can contribute to the implementation of the recommendations of the JLUS. The JLUS defines recommended compatible uses and performance standards that are used by Pima County and the City of Tucson to guide development in order to protect public health, safety, and welfare and Davis-Monthan’s mission and its economic benefits. Implementation of the JLUS Compatible Use Plan is fundamental to achieving these goals, and integration of land use recommendations into general and comprehensive plans and zoning ordinances is a key element in implementing the JLUS. Arizona Revised Statutes (ARS) §28-8481(J) requires compliance with requirements applicable to zoning and development in the defined “high noise or accident potential zone” of DMAFB in accordance with the Compatible Land Use Plan of the February 2004 JLUS. In 2004, the Military Airport (MA) comprehensive plan designation was adopted to restrict zoning options to ensure compatible zoning within the within high noise (Noise Control Zones) and accident potential (Approach-Departure Corridors) zones of DMAFB in line with the JLUS Implementation Program Strategies. In 2008, the Pima County Zoning Code and the International Building Code were amended to implement the JLUS Compatible Land Use Plan recommendations. The JLUS Implementation Program provides a number of implementation strategies. Some of the other strategies that have been utilized include land acquisition through bonds and use of the State Military Installation Fund to purchase existing incompatible land use development. See Exhibit 3.1.m for a map of Pima County Military Airports.
1 FY 13 Davis-Monthan AFB Economic Impact Analysis 2014.

L a n d U s e D i s t r i b u t i o n , A n a l y s i s
a n d C u r r e n t C o n d i t i o n s
A3.20 | P a g e A p p e n d i x A : B a c k g r o u n d a n d C u r r e n t C o n d i t i o n s
3.2 Existing Growth Areas
There are three designated growth areas according to the existing Comprehensive Plan. The areas are an
industrially-zoned (primarily) area near the airport, the Flowing Wells area, and the City of Tucson. The
existing growth area policies are: 1) The encouragement of mixed use planning, multimodal opportunities
and pedestrian and bicycle access; 2) Development should add architectural attractiveness and protect
the character and privacy of adjoining residential areas; 3) Residential proposals should increase densities
to not less than 8 RAC and include mixed uses and a variety of housing types; and, 4) The encouragement
of commercial development that supports area residents and creates multimodal transportation options.
Community Development and Neighborhood Capacity
The Community Development and Neighborhood Conservation Department utilizes various local, state
and federal resources to conduct community development and revitalization activities focusing efforts in
the most stressed neighborhoods and unincorporated areas in Pima County. Existing efforts are managed
within these specialized programs: Neighborhood Reinvestment; Neighborhood Stabilization Program;
Community and Rural Development; Homeless and Special Populations; and, Outside Agencies as detailed
below. The Community Development and Neighborhood Conservation Department also includes the
Affordable Housing program which is found later in this chapter under “Housing and Community Design”.
Home Repair and Weatherization
This program consists of both Pima County and agency administered efforts that directly provide various
grant assistance to qualified low-income homeowners in South Tucson, Marana, Sahuarita, Oro Valley and
unincorporated communities. The various granted funded services include: emergency home repair;
energy efficient and weatherization upgrades; handicap and accessibility retrofits; housing rehabilitation;
and, repair or replacement of major systems such as heating and cooling, roof, septic, electrical, gas and
water. Owner-occupied conventional, manufactured, or mobile homes are eligible. Elderly; persons with
disabilities; families with children; and, households with high energy burdens/uses are prioritized to
receive funding. Pima County's in house program utilizes specialized County staff and procured job order
contractors to execute coordinated home repair and weatherization scopes of work. Multiple funding
sources are utilized to provide services to unincorporated Pima County residents. In addition to the
County's managed program, HUD Community Development Block Grant (CDBG) funds are utilized to
contract and fund complementing emergency home repair, housing rehabilitation, and elderly/handicap
accessibility modification programs administered by local non-profits and sub-recipient government
agencies including the Town of Marana and the City of South Tucson. Pima County and its local
government and non-profit home repair and weatherization partners typically complete over 200 projects
per year as reported in Pima County's Consolidated Annual Performance Evaluation Report (CAPER) to
HUD.
L a n d U s e D i s t r i b u t i o n , A n a l y s i s
a n d C u r r e n t C o n d i t i o n s
A3.21 | P a g e A p p e n d i x A : B a c k g r o u n d a n d C u r r e n t C o n d i t i o n s
Neighborhood Reinvestment
The Neighborhood Reinvestment Program promotes stability and revitalizes stressed communities
through the funding of small capital improvement projects selected through a community consensus
process. The program is bond-funded and revitalizes neighborhoods with small community-based capital
improvement projects such as sidewalks, park improvements, and street lighting improvements.
In addition to providing organizing assistance to communities through its community-based project
application process, Neighborhood Reinvestment Program staff are also leveraging their community
contacts and organizing skills to assist communities at all different capacity levels. To date, 94 projects
have been completed as detailed in the Neighborhood Reinvestment Annual Report.
Neighborhood Stabilization Program (NSP)
Congress created the Neighborhood Stabilization Program (NSP) to assist with the community problems
that are the result of the mortgage foreclosure crisis. Pima County utilized NSP 1 and NSP2 resources to
revitalizes targeted areas through economic development activities and housing market stabilization. NSP
funds may be used for activities which include, but are not limited to:
Establish financing mechanisms for purchase and redevelopment of foreclosed homes and
residential properties;
Purchase and rehabilitate homes and residential properties abandoned or foreclosed;
Establish land banks for foreclosed homes;
Demolish blighted structures;
Redevelop demolished or vacant properties.
Neighborhood Stabilization Program 1 (NSP1)
The Department of Housing and Urban Development (HUD) began the Neighborhood Stabilization
Program (NSP1) to stabilize communities hardest hit by foreclosures, delinquencies, and the decline of
housing values. NSP provides emergency assistance to state and local governments to acquire and
redevelop foreclosed properties. Pima County received $3,086,867 in grant monies to purchase
foreclosed or abandoned homes and to rehabilitate, resell, or redevelop these homes in order to stabilize
neighborhoods and stem the decline of house values of neighboring homes. The program was authorized
under Title III of the Housing and Economic Recovery Act of 2008.
NSP1 Project Highlights
A total of 11 newly renovated homes transferred to the City’s El Portal Program and are actively
generating program income.
Non-profit partners have successfully developed new housing in the City of South Tucson

L a n d U s e D i s t r i b u t i o n , A n a l y s i s
a n d C u r r e n t C o n d i t i o n s
A3.22 | P a g e A p p e n d i x A : B a c k g r o u n d a n d C u r r e n t C o n d i t i o n s
Ajo Plaza Redevelopment project (the redevelopment of 29,320 SF of vacant commercial space in
the south building of the Ajo Plaza) is actively being revitalized by owner and developer,
International Sonoran Desert Alliance (ISDA). Other County supported planning revitalization
efforts for the Ajo Plaza include, Plan for the Revitalization of the Ajo (Arizona) Town Plaza,
conducted with the Conway School, Graduate Program in Sustainable Landscape Planning and
Design.
Neighborhood Stabilization Program 2 (NSP2)
The general stabilization goals of NSP2 are to expand opportunities for homeownership, halt declining
home values, and improve neighborhood conditions. Pima County and eight sub-grantees worked
together to apply for and implement the NSP2 Grant. The $22.1 million NSP2 grant is funded by the US
Department of Housing and Urban Development (HUD) through the American Recovery and
Reinvestment Act (ARRA). The grant is targeted to 30 census tracts covering neighborhoods in south and
central Tucson, as well as the City of South Tucson and an unincorporated area of Pima County. In order
to determine the effectiveness of NSP2 activities, Pima County contracted with University of Arizona,
College of Architecture, Planning and Landscape Architecture (CAPLA), Drachman Institute to complete
the following studies and area plans:
Provide a record of existing conditions in sample neighborhoods from within the NSP2 target area
(NSP2, Neighborhood Profile and Existing Conditions, Volumes I and II)
Develop survey instruments and train County interviewers in data collection skills to obtain
baseline data from individual residents in the selected neighborhoods and from families that have
moved into homes with NSP2 assistance (NSP2, Residential Data Collection Report, Volume III)
Provide a record of existing conditions in five commercial corridors in the NSP2 target area (NSP2,
Commercial Corridors, Profiles of Existing Conditions, Volume IV).

L a n d U s e D i s t r i b u t i o n , A n a l y s i s
a n d C u r r e n t C o n d i t i o n s
A3.23 | P a g e A p p e n d i x A : B a c k g r o u n d a n d C u r r e n t C o n d i t i o n s
Figure 1: NSP2 Target Area
Community and Rural Development
This program is primarily responsible for the administration of US Housing and Urban Development (HUD),
Community Development Block Grant (CDBG) funds. In addition to planning and administration, typical
activities include funding local programs and projects that promote development of: cultural, recreational
and public (social) services; community facilities; capital infrastructure; health and fire safety; housing;
and, economic development initiatives. Eligible activities must benefit low and moderate income
individuals, households or communities within South Tucson, Marana, Sahuarita, Oro Valley, and
unincorporated Pima County. Federally designated Pima County Community Development Target Areas;
Colonia’s; Neighborhood Revitalization Strategy Areas (NRSA's); and, other identified and highly stressed
neighborhoods/communities are prioritized to receive CDBG funding. Approximately 40 CDBG programs
and projects are recommended for funding per annum as approved by the Board of Supervisors and
identified in the Pima County HUD Annual Action Plan to HUD. Pima County’s required Fair Housing
compliance efforts are also funded via CDBG.

L a n d U s e D i s t r i b u t i o n , A n a l y s i s
a n d C u r r e n t C o n d i t i o n s
A3.24 | P a g e A p p e n d i x A : B a c k g r o u n d a n d C u r r e n t C o n d i t i o n s
Brownfields and Revitalization
In communities across the United States, both rural and urban, the legacy of the country's industrial past
now lays dormant in areas where once vibrant industrial and commercial districts existed. A brownfields
is a site that has actual or perceived contamination; nevertheless, these sites have potential for
redevelopment and reuse. Previous uses such as gas stations, manufacturing sites or industrial facilities
are now abandoned paved lots, derelict buildings, and home to rusting equipment.
These sites are often deemed a liability due to the "potential" of perceived contamination hindering their
reuse and redevelopment; however, the utilization of available federal and state brownfields initiatives
can provide local governments, private developers, non-profit agencies, financial institutions, insurance
companies, and community activists the tools and resources necessary to successfully redevelop these
denigrated areas.
The purpose of the Pima County Brownfields Program is to take advantage of available federal, state, and
local resources to promote brownfields revitalization activities. This is accomplished by analyzing the
distribution, quantity, and conditions of brownfields sites in Pima County. A fuller understanding of these
potential brownfields sites will encourage the reuse of these abandoned, deteriorated, and underutilized
properties into productive and viable land uses facilitating community and economic revitalization in
targeted areas. The program fosters a broad economic and community development strategy for Pima
County and is designed to complement existing and proposed revitalization initiatives. The Pima County
Brownfields Program places emphasis on addressing brownfields sites as a mechanism to:
• Establish, implement and expand upon a successful Pima County Brownfields Program.
• Utilize and pursue available brownfields resources to facilitate and expand economic development
opportunities specifically focusing in Pima County Community Development Target Areas and
proposed Infill Incentive Districts.
• Engage, educate and foster active and interested communities within Pima County to partner and
pursue available brownfields resources.
• Continue to work closely with other brownfields programs within Southern Arizona to develop a
more regional approach to brownfields redevelopment.
• Incorporate CDBG funds to create commercial facade, demolition and clearance to complement
brownfields efforts.
To date the Pima County Brownfields Program has completed 75 Phase I and Phase II Environmental site
assessments in Pima County creating new businesses and development.

L a n d U s e D i s t r i b u t i o n , A n a l y s i s
a n d C u r r e n t C o n d i t i o n s
A3.25 | P a g e A p p e n d i x A : B a c k g r o u n d a n d C u r r e n t C o n d i t i o n s
Homeless and Special Populations
This Program is responsible for the consolidated administration of multiple grants that provide various
housing and supportive services to the homeless and special populations. Federal grant and general funds
are coordinated and managed to fund an estimated 31 agency programs per year. However, HUD
Emergency Solutions (ESG), Supportive Housing Program (SHP), and Housing Opportunities for People
with AIDS (HOPWA) grants are the primary funding sources. In addition to administrative duties,
combined HUD funded eligible activities include, but are not limited to: homeless prevention and rapid
re-housing programs; homeless outreach; motel vouchers and emergency shelter; transitional and
permanent supportive housing; operations and maintenance; tenant based rental assistance; support
services; employment and training; and homeless management information system (HMIS).
In addition to HUD programs, the Homeless & Special Populations division also coordinates and manages
Pima County's Federal Emergency Management Agency (FEMA) Emergency Food and Shelter Program.
Outside Agencies
The Pima County Outside Agency (OA) program provides funding to non-profit organizations which serve
economically and socially disadvantaged populations through human service programs. The Pima County
Board of Supervisors establishes funding for the OA program and an appointed Committee holds a public
process to review requests and make recommendations to the Board. Specific Outside Agency program
objectives include the following:
• Direct funds to programs and agencies that have demonstrated a beneficial community impact.
• Identify gaps and community assets to determine an effective systematic approach for allocating
funding.
• Identify best practices implemented by agency programs and act as a resource for other agencies
to obtain best practice models and information.
• Provide technical to agencies for program enhancement & board/staff development.
The Outside Agency Advisory Committee, with members appointed by the Board of Supervisors and the
County Administrator, met throughout the year to review the progress programs have made and discuss
issues that the agencies may have including the contractual process, the contractual requirements, the
outcomes and outputs and the organizational capacity to deliver quality services.
Programs are organized into service categories and funded on a fiscal year basis. Service categories
typically including: Community Support; Emergency Food and Clothing; Senior Support; Support Services,
Shelter & Domestic Violence; Youth and Young Adults; and, General Services. The amount of funding for
each service category is based upon the Committee’s determination of community needs. Typically up to
80 local agencies are funded per two year funding cycle as detailed in Outside Agency Annual Impact
Reports submitted fiscally to the County Administrator and Board of Supervisors.

L a n d U s e D i s t r i b u t i o n , A n a l y s i s
a n d C u r r e n t C o n d i t i o n s
A3.26 | P a g e A p p e n d i x A : B a c k g r o u n d a n d C u r r e n t C o n d i t i o n s
Land Use Corridors
Certain existing and proposed major corridors in Pima County provide significant opportunities to focus
commercial, research, industrial employment and other types of development where these uses are the
most effective and mutually beneficial. Economic development corridors are defined in the Economic
Development Chapter.
3.3 Open Space
While the Open Space Element addresses only those lands that Pima County specifically owns in fee or
possesses a perpetual property right for conservation purposes, this Background discussion is more
expansive and reviews the full scope of the County’s land conservation efforts, which include property
rights that are more term limited like grazing leases. The County currently owns 98,286 acres of parklands
and natural areas, and manages over 130,000 thousand acres of grazing leases for conservation.
The reasons underlying the County’s land conservation are diverse and reflect the broad scope of
community priorities embedded in the Sonoran Desert Conservation Plan. Parklands and natural areas
have been acquired to prevent the encroachment of land uses incompatible with maintaining the integrity
and long-term viability of Davis-Monthan Air Force Base operations; to protect lands with important
archaeological artifacts and cultural resources; to promote public safety and watershed health by
removing floodprone lands from development; to enhance the public’s opportunities for outdoor
recreation; to preserve culturally important land uses and values; and to create a landscape that conserves
lands with high ecological value and promotes biological connectivity.
L a n d U s e D i s t r i b u t i o n , A n a l y s i s
a n d C u r r e n t C o n d i t i o n s
A3.27 | P a g e A p p e n d i x A : B a c k g r o u n d a n d C u r r e n t C o n d i t i o n s
Voter-approved County bonds in 1974, 1986, 1997, and 2004, have generated $230 million for the
acquisition and expansion of parklands and natural areas. These bond dollars have, in many cases, allowed
the County to leverage other funding sources, such as grants and federal funds, to effectively increase the
amount of funds available. In addition to purchasing properties, donations from private property owners
have contributed to the County’s portfolio of parklands and natural areas. Since 2004, nearly 1,600 acres
have been donated to the County including significant properties adjacent to Saguaro National Park and
the Catalina Mountains which would have been very costly to acquire otherwise. These properties are
noted in Table 3.3.a
The following are a few examples that illustrate how the County has capitalized on multiple funding
sources and made strategic acquisitions to secure parklands and natural areas that respond to the
community’s needs and priorities:
Davis-Monthan Air Force Base Urban Encroachment Prevention. Pima County spent $10 million
approved by voters in 2004 to purchase 461 acres in the vicinity of the base. Uses on these
properties are limited to prevent future development and inappropriate uses and to deter large
numbers of visitors. Compatible uses such as solar generating facilities are desirable.
Coyote Mountains Archaeological Complex: Old Hayhook Ranch. The acquisition of 839 acres was
funded using bonds (approx. $1.4 million) plus a Recovery Land Acquisition Grant from the U.S. Fish
and Wildlife Service. The property encompasses high value wildlife habitats and a complex of
Hohokam villages which the Tohono O’odham consider ancestral sites; it is also adjacent to the
Bureau of Land Management’s Coyote Wilderness Reserve. The property is managed to preserve
the exceptional natural and cultural resources as well as the biological connectivity with the Coyote
Mountains.
Canada del Oro (CDO) Floodprone Land Acquisition. The Pima County Regional Flood Control
District expended over $9 million from a variety of funding sources including bond funds, District
tax levy, and a $3 million federal grant to acquire approximately 193 acres that were subject to
repetitive flooding. Funds were also used to assist in the relocation of the home owners displaced
by the 2003 flooding exacerbated by the Aspen Fire in the upper watershed earlier that year. The
CDO is also a significant riparian area where biological diversity is similar to that found only at
Cienega Creek. Impacts to the riparian corridor due to groundwater withdrawals from private wells
in the area was alleviated with the acquisition as 23 active wells were retired. Stewardship of these
lands emphasizes maintenance of the riparian environment and controlling unauthorized uses such
as vandalism, trespass, wildcat dumping, and wood cutting.
Marley Ranch Conservation Area. Once completed the total acquisition will be 114,400 acres of
fee lands, conservation easements, plus state and federal grazing leases. The first phase of
acquisition occurred in 2009 and secured 6,337 acres of fee lands at a cost of just over $20 million
funded by the 2004 bond. The balance (17,663 acres in fee, 1,700-acre conservation easement,
85,900 acres state grazing lease, and 2,800 acres BLM grazing permit) is expected to come as future
bonds are approved by the voters. This ranch is one of the largest working ranches remaining in
L a n d U s e D i s t r i b u t i o n , A n a l y s i s
a n d C u r r e n t C o n d i t i o n s
A3.28 | P a g e A p p e n d i x A : B a c k g r o u n d a n d C u r r e n t C o n d i t i o n s
Southern Arizona. Historically, it was a principal focal point for Native American and Spanish
settlement. It is has had human occupation for the last 10,000 years and contains village sites and
other evidence of the Hohokam as well as Historic period ranches such as the Batamote Ranch.
Because the size and location of this Ranch Conservation Area allow for a physical connection
between the Buenos Aires National Wildlife Refuge and other County open space acquisitions,
native wildlife including far-ranging species like jaguar can move through and access the ecologically
important mountain systems of Southern Arizona. The size and scope of these lands also supports
numerous recreational opportunities including hiking, mountain biking, wildlife viewing, hunting,
recreational rock hounding, nature photography, and primitive camping. Drainages within this
Ranch Conservation Area also play an important role in aquifer recharge for Tucson and the Green
Valley/Sahuarita area.
Sweetwater Preserve. 2004 bond funds were used to acquire this 880-acre property in order to
protect a key segment of the Sweetwater Wash as well as high quality recreational opportunities
for hikers, mountain bikers, and equestrians. The recreational opportunities and high value natural
resources of this property had long-standing prominence in the area. Area residents’ response to
potential development of the property was decisive. Over 50 neighborhoods, environmental and
community organizations publicly supported acquisition and, in an unprecedented move, 180
individuals contributed $30,000 to defray outstanding property taxes in order for the County to
secure an option to buy this property. According to a recent national poll by Singletracks.com
released in June 2014, Sweetwater Preserve was voted Number 4 in the list of the 20 Most Scenic
Mountain Bike Trails in the Western US.
In total, these acquisitions are a significant accomplishment. They are testament to this community’s
desire to be multi-faceted in how it chooses to address future development, fiscal responsibility,
community health and safety, quality of life, and our heritage as residents of the Sonoran Desert. Our
open space acquisitions have contributed to directing urban growth and expansion to those areas having
greater infrastructure support, deterring traditional urban sprawl, and making urban infill more viable.
Facilitating a more compact urban form is also fiscally more responsible by maximizing revenues from
existing infrastructure and services and by limiting the increased operations and maintenance costs
associated with the expansion of sewers, roads, law enforcement, and other services provided by the
County. Additionally, protecting and conserving the long-term viability of natural and cultural assets is an
important investment in one of the region’s most important economic drivers, geo-tourism. Maintaining
our rural communities and ranching economy, as well as protecting the ecosystems of the Sonoran Desert
also enhances quality of life, creates life-style diversity, and improves environmental health for current
and future generations.
One area of concern going forward is how those land use projects that are authorized by Federal approvals
such as mining, electrical transmission corridor development, and natural gas pipeline construction will
affect the long-term integrity of County parklands and natural areas. These types of projects are subject
to few, if any, of Pima County’s regulatory authorities. This consequently leaves the County in a less than
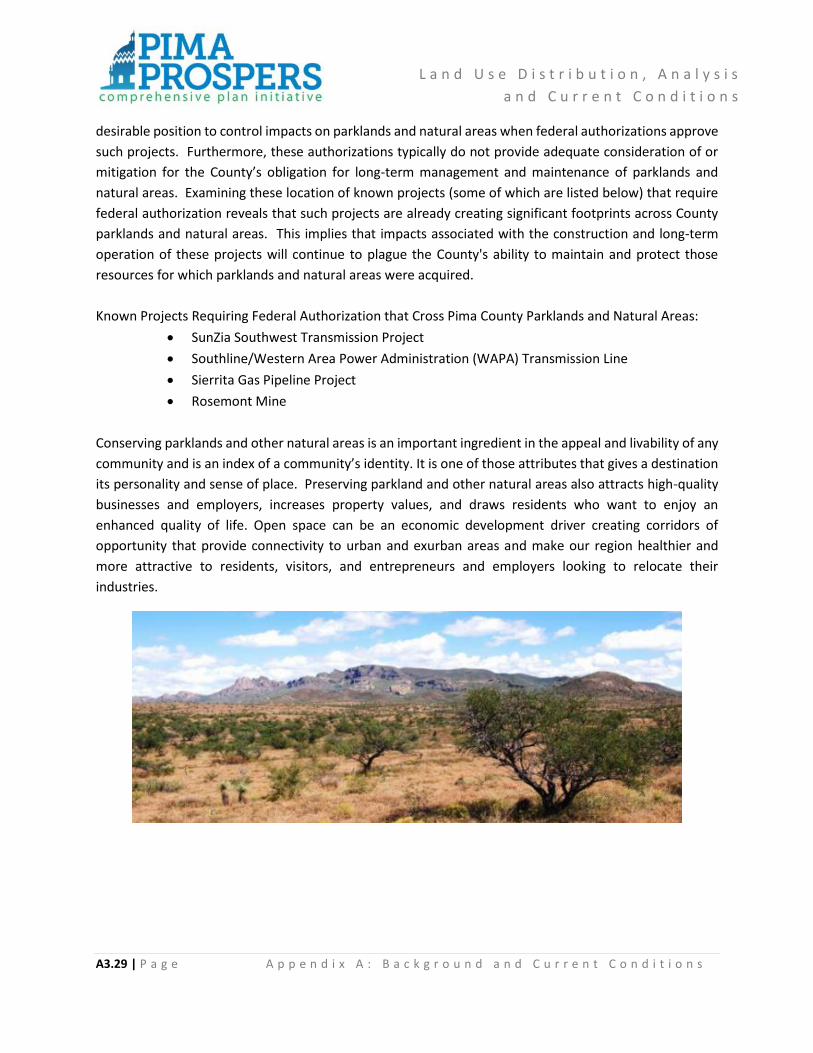
L a n d U s e D i s t r i b u t i o n , A n a l y s i s
a n d C u r r e n t C o n d i t i o n s
A3.29 | P a g e A p p e n d i x A : B a c k g r o u n d a n d C u r r e n t C o n d i t i o n s
desirable position to control impacts on parklands and natural areas when federal authorizations approve
such projects. Furthermore, these authorizations typically do not provide adequate consideration of or
mitigation for the County’s obligation for long-term management and maintenance of parklands and
natural areas. Examining these location of known projects (some of which are listed below) that require
federal authorization reveals that such projects are already creating significant footprints across County
parklands and natural areas. This implies that impacts associated with the construction and long-term
operation of these projects will continue to plague the County's ability to maintain and protect those
resources for which parklands and natural areas were acquired.
Known Projects Requiring Federal Authorization that Cross Pima County Parklands and Natural Areas:
SunZia Southwest Transmission Project
Southline/Western Area Power Administration (WAPA) Transmission Line
Sierrita Gas Pipeline Project
Rosemont Mine
Conserving parklands and other natural areas is an important ingredient in the appeal and livability of any
community and is an index of a community’s identity. It is one of those attributes that gives a destination
its personality and sense of place. Preserving parkland and other natural areas also attracts high-quality
businesses and employers, increases property values, and draws residents who want to enjoy an
enhanced quality of life. Open space can be an economic development driver creating corridors of
opportunity that provide connectivity to urban and exurban areas and make our region healthier and
more attractive to residents, visitors, and entrepreneurs and employers looking to relocate their
industries.

L a n d U s e D i s t r i b u t i o n , A n a l y s i s
a n d C u r r e n t C o n d i t i o n s
A3.30 | P a g e A p p e n d i x A : B a c k g r o u n d a n d C u r r e n t C o n d i t i o n s
Table 3.3.a: Pima County Parklands & Natural Area Acquisitions
Pima County Parklands & Natural Areas Acres A7 Ranch 41,252.0
Rancho Seco 37,113.2
Diamond Bell Ranch 30,757.7
Tucson Mountain Park 19,706.4
Sopori Ranch 15,485.2
Six Bar Ranch 13,602.4
Bar V Ranch 13,494.3
M Diamond Ranch 10,201.6
Marley Ranch 6,348.0
Sands Ranch 5,033.5
FLAP (multiple sites) 4,900.9 Canoa Ranch 4,853.9 King 98 Ranch 4,330.2
Cienega Creek Natural Preserve 4,267.8 Tortolita Mountain Park 3,924.8
Buckelew Properties 3,035.2
Empirita Ranch 2,713.6
Colossal Cave Mountain Park 2,219.0 Cienega Corridor 1,686.9 Oracle Ridge 1,173.4
Buehman Canyon 1,050.3
Sweetwater Reserve 890.8 Clyne Ranch 880.2
Old Hayhook Ranch 838.5
Honey Bee Biological Corridor 676.3 Lords Ranch 638.7
Arthur Pack Regional Park 513.1
Walden 447.3
Brawley Wash/Manville-Garcia 395.8
36th Street Corridor 373.5 Madera Highlands 373.3
Agua Verde Creek 353.9 Ajo 350.7
Drainageway 292.5
Cochie Canyon 286.0
Tumamoc 277.0
Bingham Cienega Natural Preserve 267.9
Tanque Verde Creek 216.6
Los Morteros 210.0
Rancho Del Cielo 162.4
Bee 160.2
Andrada 158.0
Segurson Donation 150.8
Southeast Corridor 141.4
Arivaca Open Space 122.1
Lower Santa Cruz Replenishment 104.6
Rocking K 103.6
Starr Pass Resorts Easements 103.1
Roy Drachman Agua Caliente Regional Park 100.6
Trico 96.6 Elephant Head Sec.15 Mit. Lands (Kreutz) 79.2

L a n d U s e D i s t r i b u t i o n , A n a l y s i s
a n d C u r r e n t C o n d i t i o n s
A3.31 | P a g e A p p e n d i x A : B a c k g r o u n d a n d C u r r e n t C o n d i t i o n s
Pima County Parklands & Natural Areas Acres Tanque Verde & Houghton Partners LLC 77.7
Malcolmson Donation 73.8
Marana Cottonwoods 72.5
Terra Rancho Grande 72.1
Valencia Site 68.2
PCDOT Mitigation Land 67.8
Avra Valley I-10 Wildlife Corridor 66.2
Dos Picos 55.8
Cultural Resource Parcel 54.1
Southeast Regional Park 52.8
Canoa Ranch Phase II 52.5
Cortaro-Hartman 49.0
Elephant Head Sec.15 Mit. Lands (Easely) 43.8
Manzanita Park Extension 40.4
Park? 40.2
Esther And David Tang 40.1
Elephant Head Sec.15 Mit. Lands 39.9
Picture Rocks District Park 37.9
South Wilmot LLC 35.5
Robson Quail Creek Parcel 28.7
Agua Caliente Creek 24.4
Dakota Wash 23.0
Doucette 22.0
DOT Section 7 19.6
Habitat 36Th/Kino 19.4
Holden Donation 18.4
Reay Rezoning - CLS Off Site Mitigation 18.0
Bear Creek Ranch 17.8
Steam Pump Ranch 15.3
Continental Ranch Development, LLCc 15.2
Sneed Parcel 14.0
San Domingo Flood Prone Area 14.0
Honey Bee Village Preserve 13.0
Treehouse 12.5
Robles Ranch 11.2
Tucson Mountain Park Biological Corridor 9.9
Linda Vista/Patrick Property 9.3
Mission & 36th Subdivision 7.6
Reid Parcel 7.3
Coronado National Forest 5.4
Mission Gardens 4.5
Lazy C Ranch Estates 3.3
CDO Hazard Mitigation 2.5
Dunbar School 2.5
San Pedro Chapel 2.2
Ina Overlook 1.1
Ajo Train Depot 0.9
Wal-Mart Conservation Easement 0.9
West Branch Santa Cruz 0.5
Source: Pima County Infrastructure Plan, 2013

L a n d U s e D i s t r i b u t i o n , A n a l y s i s
a n d C u r r e n t C o n d i t i o n s
A3.32 | P a g e A p p e n d i x A : B a c k g r o u n d a n d C u r r e n t C o n d i t i o n s
3.4 Environmental
The Maveen Marie Behan Conservation Lands System
The Maveen Marie Behan Conservation Lands System (CLS) was adopted as part of the Environmental
Element of the Pima County Comprehensive Plan 2001 Update in December 2001 and was updated June
21, 2005. In 2009, it was renamed as the Maeveen Marie Behan Conservation Lands System to
commemorate Dr. Behan’s extra-ordinary contribution in bringing the CLS to fruition.
The CLS identifies and maps those areas where priority biological resources occur within Pima County. It
also establishes policy guidelines for the conservation of these resources; guidelines are to be applied to
certain types of land use changes that require approval by the Board of Supervisors. Other elements
include definitions of seven priority biological resource categories, conservation guidelines,
implementation strategies, and a map.
The Board has applied the CLS to well over 80 requests for land use changes since 2002. The Board and
County Administrator’s Office also negotiate with mining corporations and others not regulated by the
County but doing business here to mitigate voluntarily for their project-related impacts to lands and
resources within the CLS. A tribute to the soundness of the CLS is that the policy has been in place for 13
years with only one update to allow for the incorporation of new scientific information. The CLS was
constructed according to the most current tenets of conservation biology and biological reserve design.
The CLS:
• perpetuates the comprehensive conservation of vulnerable species;
• retains those areas that contain large populations of focal vulnerable species;
• provides for the adjacency and proximity of habitat blocks;
• preserves the contiguity of habitat at the landscape level; and
• retains the connectivity of reserves with functional corridors.
The collective application of these individual tenets produces a CLS that retains the diverse representation
of physical and environmental conditions, preserves an intact functional ecosystem, minimizes the
expansion of exotic or invasive species, maximizes the extent of roadless areas, and minimizes
fragmentation. Implementation of the CLS not only conserves those biological resources that exist today
but, because of its landscape focus, preserves the future ebb and flow of resources essential to a healthy
functioning ecosystem. The seven CLS conservation land categories reflect relative values of biodiversity
for various lands across the landscape.

L a n d U s e D i s t r i b u t i o n , A n a l y s i s
a n d C u r r e n t C o n d i t i o n s
A3.33 | P a g e A p p e n d i x A : B a c k g r o u n d a n d C u r r e n t C o n d i t i o n s
Adherence to Conservation Lands System Guidelines will accomplish the following:
Protect against the loss of conservation values and landscape integrity through in-place
preservation and restoration or enhancement of degraded or otherwise compromised natural
resources.
Create development that retains conservation values at both the micro and macro landscape scale
by minimizing impacts to site-specific sensitive conservation values, maximizing landscape
continuity, facilitating the movement of native fauna and pollination of native flora across and
through the landscape, promoting the long-term diversity of native flora and fauna, and preserving
the viability of the CLS.
Based on the science of the SDCP with participation and oversight by the SDCP Science Technical Advisory
Team (STAT), seven CLS conservation land categories (CLS categories) were created, defined, and mapped.
Each category has an associated conservation guideline policy (conservation guidelines can be found in
Chapter 3 – Land Use Policies). The seven categories are: (See Glossary for definitions).
Important Riparian Areas are critical elements of the Sonoran Desert where biological diversity is at its
highest. These areas are valued for their higher water availability, vegetation density, and biological
productivity. They are also the backbone to preserving landscape connectivity.
Biological Core Management Areas have high biological values. They support large populations of
vulnerable species, connect large blocks of contiguous habitat and biological reserves, and support high
value potential habitat for five or more priority vulnerable species.
Special Species Management Areas are crucial to the conservation of three species of special concern to
Pima County: the cactus ferruginous pygmy-owl, Mexican spotted owl, and southwest willow flycatcher.
Multiple Use Management Areas support significant biological values, but these values do not attain the
level associated with Biological Core Management Areas. They support populations of vulnerable species,
connect large blocks of contiguous habitat and biological reserves, and support high value potential habitat
for three or more priority vulnerable species.
Scientific Research Areas are lands within the Tucson Basin that are managed for scientific research: the
Santa Rita Experimental Range and the University of Arizona’s Desert Laboratory at Tumamoc Hill.
Agricultural In-Holdings within the CLS are areas where active, or abandoned, agriculture lands exist within
the Conservation Lands System.
Critical Landscape Connections are six broadly-defined areas where biological connectivity is significantly
compromised, but where opportunity to preserve or otherwise improve the movement of wildlife between
major conservation areas and/or mountain ranges still persists. Roads, other infrastructure services, and
residential and commercial land uses within these areas, depending on configuration, can result in habitat
loss and fragmentation that inhibits the movement of native fauna and interrupt the pollination processes

L a n d U s e D i s t r i b u t i o n , A n a l y s i s
a n d C u r r e n t C o n d i t i o n s
A3.34 | P a g e A p p e n d i x A : B a c k g r o u n d a n d C u r r e n t C o n d i t i o n s
of native flora. These six areas generally focus attention on maintaining connectivity with the Santa Cruz
River in northwest Tucson and southern Pima County, between the Catalina and Tortolita Mountains,
between the Tohono O’odham Nation and Tucson Mountains, along the Cienega Creek corridor, and
through Avra Valley.
As the CLS created a new paradigm for development of privately-owned property in unincorporated Pima
County, a great deal of initial effort was devoted to developing and implementing procedures and
requirements that promote implementation of the CLS. Significant accomplishments include:
Modification of Site Analysis inventory requirements for rezoning applications to better identify the
presence of conservation values and identify areas most suitable for development;
Modification of for comprehensive plan amendment submittal requirements to include information
on conservation values;
Modification of Biological Impact Report requirements for rezoning and conditional use permit
applications to standardize information necessary to assess potential impacts to conservation
resources and the integrity of the CLS;
Standardized the review process for comprehensive plan amendment and rezoning applications to
determine the application’s conformance with CLS, consistency with existing or logical expansion of
infrastructure, and long-term conservation of highly valued natural resources; and
Promulgated a new zoning ordinance to allow for the transfer of development rights.
Exhibit 3.4 shows, provided at the end of this chapter, shows the County’s Transfer of Development Rights
(TDR) Sending and Receiving Areas.
Climate and Emerging Environmental Issues
Climate
Changes in the climate will continue to negatively affect the environment. The Assessment of Climate
Change in the Southwest United States observes that the regional climate is already becoming warmer,
with severe droughts becoming more common. This trend is expected to continue, and may be coupled
with greater precipitation extremes in winter, decreased summer precipitation, and more intense
flooding.
As a result of climate change, the western electric grid becomes vulnerable as demands for energy
increase. The reliability of transportation systems is expected to decrease; water supplies will become
increasingly stressed; the local economy may suffer as a result of decreased tourism and recreational

L a n d U s e D i s t r i b u t i o n , A n a l y s i s
a n d C u r r e n t C o n d i t i o n s
A3.35 | P a g e A p p e n d i x A : B a c k g r o u n d a n d C u r r e n t C o n d i t i o n s
opportunities; and the health of vulnerable populations will likely suffer.2 Wildfires are projected to
increase. Both natural and managed ecosystems in the southwest look to be affected by climate change3.
The extent to which communities are negatively impacted by climate change will depend heavily on their
adaptive capacity and proactive actions taken to prepare for its impacts.
Greenhouse gases are gases that trap heat in the atmosphere. Greenhouse gases include carbon dioxide
(CO2) which is produced through the burning of fossil fuels, solid waste, trees and wood products and
through certain chemical reactions; methane (CH4) which is released during the production and transport
of coal, natural gas and oil, as well as from livestock and other agricultural practices and from landfills
through the decay of organic waste; nitrous oxide (N2O) which is produced through agricultural and
industrial activities including fossil fuels and solid waste; and, fluorinated gases (hydrofluorocarbons,
perfluorocarbons, and sulfur hexafluoride) which are synthetic and are emitted from a variety of industrial
processes. Fluorinated gases are powerful greenhouse gases. Carbon dioxide is removed from the air
when it’s absorbed by plants (called sequestration). The effect of each type of gas on climate change
depends on how much gas is in the atmosphere, how long they remain in the atmosphere, and how
strongly the type of gas impacts global temperatures.4 Addressing climate change through the reduction
of greenhouse gases can occur on a local scale. Reducing vehicle miles traveled (VMT) is a key strategy
which can be done by making other modes of travel such as walking and biking viable. Greenhouse gases
can be reduced by investing in electric, hybrid, and natural gas transportation methods.
Pima County has taken a number of steps to plan for and mitigate the negative effects of climate change
and increase the resilience of the human and natural dimensions of the environment to climate-induced
changes including:
Increasing the production of renewable energy to replace fossil fuels. 5
The development and adoption of plans and strategies to improve water quality and insure the
availability of an adequate water supply678910
The development of drought response preparedness plans11
Efforts to reduce vehicle travel and increase the use of alternative modes of transportation12
2 EPA (2013). Southwest Impacts & Adaptation, http://www.epa.gov/climatechange/impacts-adaptation/southwest.html 3 Regional Climate Impacts: Southwest, Global Change Research Program 4 Climate Change – Overview of Greenhouse Gases, US Environmental Protection Agency 5 Pima County Sustainability Resolution: Resolution No. 2007-84, Renewable Energy Requirements 6 2011-2015 Action Plan for Water Sustainability, Water Supply: pg. 20 7 2007 RWRD, Regional Optimization Master Plan 8 Drought Response Plan and Water Wasting Code of Ordinances: Chapter 8.70 9 Pima County Local Drought Impact Group 10 2007 BOS Sustainability Resolution Requirements, Reduction requirements for water consumption by county operations 11 Drought Response Plan and Water Wasting Code of Ordinances: Chapter 8.70 12 Travel Reduction Ordinance: Chapter 17.40
L a n d U s e D i s t r i b u t i o n , A n a l y s i s
a n d C u r r e n t C o n d i t i o n s
A3.36 | P a g e A p p e n d i x A : B a c k g r o u n d a n d C u r r e n t C o n d i t i o n s
Increasing energy efficiency standards in both County owned and privately owned buildings1314
Reducing the risk of negative effects on public health resulting from climate change impacts1516
Improving stormwater management strategies to minimize runoff and flooding in urban areas1718
Adoption of diverse strategies to reduce loss of life and property from flooding and erosion;
Acquisition and long-term retention of natural open space. In their natural, vegetated state,
grassland and riparian areas can absorb excess carbon from the atmosphere relative to developed
areas and can mitigate some of the urban heat island effect;
Acquisition priorities for habitat protection are geographically diverse and biased toward
acquisition of riparian habitat to preserve watershed and ecological function;
Diversity in latitude and elevation of land acquisitions that expand existing reserves or assist in
retaining ecosystem connectivity;
Identification and protection for areas that have served as ecological refuge for species during
time of past climatic variability (riparian areas, talus, limestone);
Sponsorship of Natural Resources Conservation Services (NRCS) drought assistance to achieve
temporary reductions in stocking rates on ranches not owned or managed by Pima County;
Modifications of stock-watering systems to provide safer and more lasting access to water for
wildlife; and
Buffelgrass management in County preserves and along County roadways to reduce the threat of
wildfire and loss of native species.
Emerging Environmental Issues Buffelgrass and Other Invasive Species
Currently Pima County is involved in various programs to eradicate invasive species such as buffelgrass,
fountain grass, and giant reed along with many others from our natural slopes, washes, preserves, and
urban areas. Buffelgrass, in particular, is an aggressive species and a significant fire threat. The grass
spreads fast and burns hot, endangering native species including the iconic saguaro. The non-profit
organization, Southern Arizona Buffelgrass Coordination Center, http://www.buffelgrass.org is very active
in leading the “Beat Back Buffelgrass” campaign. Many volunteer groups go out into the natural and urban
areas to eradicate invasive species. It is a regionally important concern to the preservation and
conservation of the unique flora and fauna of the Sonoran Desert.
13 2007 BOS Sustainability Resolution Requirements: LEED Silver Building Standard for County facilities 14 International Energy Conservation Code: Ordinance 2012-34 15 Pima County Community Wildfire Protection Plan 16 Runoff Detention Systems: Ordinance 16.48 17 Runoff Detention Systems: Ordinance 16.48 18 Low Impact Development
L a n d U s e D i s t r i b u t i o n , A n a l y s i s
a n d C u r r e n t C o n d i t i o n s
A3.37 | P a g e A p p e n d i x A : B a c k g r o u n d a n d C u r r e n t C o n d i t i o n s
Wildfire
There are years when drought in Tucson causes high fire danger risks. Climate change and invasive species
such as buffelgrass are adding to the wildfire threat. Fire can change the natural composition of the desert
from the diversified, green, Sonoran Desert to grasslands. Wildfires are a major threat to the Sonoran
Desert and especially the native saguaros as well as outlying residential areas. The Pima County
Community Wildfire Protection Plan 2013 is a local planning effort to integrate state and federal level fire
planning, identify high risk lands, improve fire prevention and suppression activities, enhance firefighter
safety, identify funding needs and opportunities, and improve public education and outreach.
Air Quality
Another issue facing Pima County is the potential to exceed air quality standards for ozone. Ozone is a
colorless form of oxygen (O3) that occurs both naturally in the Earth's upper atmosphere and at ground-
level primarily as a result of human activities. Ground-level ozone is formed when two types of pollutants
react in the presence of sunlight and heat and is often called smog. These pollutants are known as volatile
organic compounds and oxides of nitrogen. They are found in emissions from fuel combustion sources
such as motor vehicles. Pima County is currently meeting the ozone standard set by the US Environmental
Protection Agency, but the standard may be revised to between 0.06 and 0.07 parts per million. If this
happens, Pima County is likely to be designated as a non-attainment area, which can require costly control
measures and affect federal funding for transportation projects. Even if the standard is not made more
stringent for the protection of human health, future choices for transportation and industry Pima County
needs to be aware of potential problematic levels of ozone.
Water Quality “Emerging contaminants” are present in a growing number of water sources that are used for human and
animal consumption. These contaminants include certain pharmaceutical compounds (hormones),
cosmetic, and personal care products that are released into the nation’s watercourses and aquifers
primarily through urban runoff, municipal sewage, and industrial discharges. Pima County’s ongoing
improvements to the wastewater treatment systems are the single most effective step that can be taken
here at the local level to minimize the impact of emerging contaminants on public health and the
environment. However, new compounds will continue to be created in the future and may change with
time. Public education, additional research, monitoring, and support of new programs by the Pima County
Board of Supervisors will be needed.
L a n d U s e D i s t r i b u t i o n , A n a l y s i s
a n d C u r r e n t C o n d i t i o n s
A3.38 | P a g e A p p e n d i x A : B a c k g r o u n d a n d C u r r e n t C o n d i t i o n s
3.5 Housing and Community Design
Housing Affordability
Housing affordability represents not just the cost of rent or mortgage. Affordability is the cost or benefit
of living in a community that’s accessible to good jobs, quality schools and healthcare; that’s safe,
adequately served by local utility companies, public infrastructure; that’s furnished with grocery stores,
and many other factors that meet the current and future needs of any household. As stated in the
County’s Five Year HUD Consolidated Plan, “effective local housing policies and priorities reflect the
needs and desires of households and families.”19
The average household size in Pima County is 2.54 people and ranges from a low of 2.41 in Oro Valley,
primarily a retirement-oriented community, to a high of 3.06 in South Tucson, a primarily family-oriented
community.20 Sixty percent of households include only one or two people; younger families reside in the
urban communities of Tucson and South Tucson, while older families reside in suburban and rural
communities, and more than half the workforce is employed in five primary industries including
healthcare/social assistance, retail trade, educational services, public administration and
accommodation/food service. Wages remain low despite a growing economy with the average Tucson
resident earning 88% of what the average U.S. worker earns.21
The following tables include average housing costs, gross rent as a percentage of household income, year
structure built, and average household income per planning area and provide an assessment of housing
affordability based on national affordability standards from HUD.
19 City of Tucson and Pima County Consortium 2010-2015 HUD Consolidated Plan, Pg. 14, (“ConPlan”),
http://cms3.tucsonaz.gov/files/hcd/Tucson%20Pima%20County%202010-2014%20Consolidated%20Plan.pdf 20 Ibid 21 The American Dream Lost: Foreclosures in Pima County, Arizona, Southwest Fair Housing Council (“Dream Lost”), prepared
by Richards Rhey and Ari Posner, September 20, 2004, Pg.13, http://www.docstoc.com/docs/38383492/The-American-Dream-Lost-Foreclosures-In-Pima-County-Arizona

L a n d U s e D i s t r i b u t i o n , A n a l y s i s
a n d C u r r e n t C o n d i t i o n s
A3.39 | P a g e A p p e n d i x A : B a c k g r o u n d a n d C u r r e n t C o n d i t i o n s
TABLE 3.5.a: Housing Affordability 1990
Place/ Planning Area
Average Household
Income
Arizona $27,540
Pima County $25,401
Planning Areas
Avra Valley $28,146
Tucson Mountains $34,876
Southwest $28,839
Altar Valley $28,302
Upper Santa Cruz $37,351
Mountain View $32,458
Southeast $22,856
Central $25,655
Catalina Foothills $46,955
Rincon Valley $41,715
Tortolita $41,285
San Pedro $46,010
Ajo/Why $18,531
Source: US Bureau of the Census, 1990
TABLE 3.5.b: Housing Affordability 2000
Place/ Planning Area
Average Household
Income
Arizona $40,558
Pima County $36,758
Planning Areas
Avra Valley $47,096
Tucson Mountains $53,885
Southwest $41,567
Altar Valley $40,164
Upper Santa Cruz $52,387
Mountain View $53,704
Southeast $35,028
Central $36,800
Catalina Foothills $66,306
Rincon Valley $62,482
Tortolita $63,409
San Pedro $79,594
Ajo/Why $32,459
Source: US Bureau of the Census, 2000

L a n d U s e D i s t r i b u t i o n , A n a l y s i s
a n d C u r r e n t C o n d i t i o n s
A3.40 | P a g e A p p e n d i x A : B a c k g r o u n d a n d C u r r e n t C o n d i t i o n s
TABLE 3.5.c: Housing Affordability 2010
Place/ Planning Area
Average Household Income
Arizona $50,448
Pima County $45,521
Planning Areas
Avra Valley $60,485
Tucson Mountains $68,841
Southwest $52,253
Altar Valley $51,834
Upper Santa Cruz $63,665
Mountain View $55,236
Southeast $49,550
Central $46,100
Catalina Foothills $78,669
Rincon Valley $99,897
Tortolita $78,035
San Pedro $94,050
Ajo/Why $38,608
Source: US Bureau of the Census, 2010
The Foreclosure Crisis in Pima County Foreclosures have affected all income levels and areas in Pima County. Since 2008, there have been
55,531 Notice of Sales (NOS), and 32,169 Trustee Deeds filed. Trustee Deeds indicate households went
all the way through foreclosure, short sale, or deed in lieu. Recovery continues to be a major priority for
affordable housing, as studies show Low-Moderate Income (LMI) households are the most affected.
Although housing values have increased and homes are gaining equity, housing values in the LMI areas
are slower to recover.
A 2005 study (The American Dream Lost: Predatory Lending and Foreclosures in Pima County) conducted
by the Southern Arizona Fair Housing Council identified a trend in predatory and sub-prime lending
targeting LMI and minority neighborhoods.22 These same neighborhoods were hardest hit with
foreclosures in 2008-2013. Another report titled “Wasted Wealth” (How the Wall Street Crash Continues
to Stall Economic Recovery and Deepen Racial Inequity in America May, 2013) examines the ongoing
impacts of the foreclosure crisis on the country and in particular on people of color.23 It found that wealth
22 Wasted Wealth, How the Wall Street Crash Continues to Stall Economic Recovery and Deepen Racial Inequity in America, by
Benn Henry, Jill Reese and Angel Torres, Alliance for a Just Society, May, 2013) Pg. 1, http://allianceforajustsociety.org/wpcontent/uploads/2013/05/Wasted.Wealth_NATIONAL.pdf
23 Wasted Wealth, How the Wall Street Crash Continues to Stall Economic Recovery and Deepen Racial Inequity in America, by Benn Henry, Jill Reese and Angel Torres, Alliance for a Just Society, May, 2013), Pg. 7, http://allianceforajustsociety.org/wpcontent/uploads/2013/05/Wasted.Wealth_NATIONAL.pdf

L a n d U s e D i s t r i b u t i o n , A n a l y s i s
a n d C u r r e n t C o n d i t i o n s
A3.41 | P a g e A p p e n d i x A : B a c k g r o u n d a n d C u r r e n t C o n d i t i o n s
was lost across the board from the Recession, but significantly more so for people of color. One reason
was directly linked to the foreclosure crisis. The Federal Reserve reported in March of 2013 that “Families
of color hold significantly higher percentages of wealth in home equity, with 52% of total assets for Latino
families and 49% for Black families, compared to just 28% for White families”.24 While households who
directly experienced foreclosure lost all their equity, the entire LMI community has seen their equity
wealth lost due to decline in property values of foreclosed homes.
In a report published by the Federal Reserve Bank of San Francisco – District 12 (including Arizona), the
demand for rental housing has increased during the foreclosure ‘crisis’. The fastest growing part of the
rental market is the share of single-family units – an increase of 7.6% between 2007 and 2012 (Choi*, pg
5). Related to this increased inventory is the rise in absentee ownership which “raises important
community development questions and issues around neighborhood stabilization, rental costs, property
maintenance, and lost asset building opportunities for potential first-time homeubyers.” (Choi*, pg. 2)
The only bright side to this trend is the impact on rents particularly for LMI households. Rents have
decreased somewhat in Pima County during the period of 2007 to 2012 from 45.0% to 44.5%, respectively
(Choi*, pg. 7).
*Community Development Research Brief: The Rise of Single Family Rentals in Arizona, California and
Nevada, Federal Reserve Bank of San Francisco, Laura Choi, Community Development Department,
September 2014.
Affordable housing through homeownership and safe decent affordable rental units continue to be a
priority. The Housing Program of the Community Development and Neighborhood Conservation
department offers a comprehensive one-stop housing center where Pima County residents can find
resources, information, and direct services for housing. As an example, The Pima County Housing Center
offers the public classes on financial education that include credit repair and debt management through
a small grant received from Freddie Mac to help residents recover from foreclosure. Though the market
has reduced the cost of housing, low wages, tighter credit restrictions and increased down payment
requirements make it difficult for LMI residents to buy a home. In the past, federal funding provided the
gap needed for homebuyers to purchase their first home. With federal funds shrinking by 48% over the
past 3 years, it makes it more difficult for affordable housing developers who used these funds to reduce
the price of housing for LMI households.
From 2000 to 2008 single family housing stock nearly doubled and 98% was single family.25 Renters and
lower income households often choose multi-family or manufactured housing which accounts for 65% of
unincorporated, rural Pima County housing stock. Housing stock that is 30 years or older represents 45%
24 City of Tucson and Pima County Consortium 2010-2015 HUD Consolidated Plan, (“ConPlan”), Pgs. 15 & 16,
http://cms3.tucsonaz.gov/files/hcd/Tucson%20Pima%20County%202010-2014%20Consolidated%20Plan.pdf 25 Ibid, Pg. 21

L a n d U s e D i s t r i b u t i o n , A n a l y s i s
a n d C u r r e n t C o n d i t i o n s
A3.42 | P a g e A p p e n d i x A : B a c k g r o u n d a n d C u r r e n t C o n d i t i o n s
of Pima County stock and over 75% of that in South Tucson. The need for rehabilitation, replacement,
historic preservation and energy-efficiency improvements is great.26 Ownership increases with household
income. While 79% of middle and high income households are owners, the rate declines to 54% for low
and moderate income households, 46% for very low income households, and 35% for extremely low
income households.27
Government programs define cost burden as paying more than 30% of gross household income for total housing cost (rent or mortgage and utilities). For lower-income households, the burden is magnified by having less income to afford essentials such as clothing, food, transportation and childcare. While 11% of owners and 26% of renters have some housing problem, the percentages are much greater among minority populations. Sixteen percent of Black or African American owners and 15% of Hispanic owners have greater housing problems and among renters, 31% of Black or African Americans and 29% of Hispanics have serious housing problems.28
Household Characteristics
Household Characteristics 1990, 2000, and 2010
The following tables show total population, total housing units, average household size, total occupied
units, renter occupied and owner occupied, vacant units and housing for seasonal, recreation or other use
for 1990, 2000 and 2010 by planning area. Planning Area 14 is included for statistical purposes only. Pima
County has no jurisdiction over the Tohono O’odham Nation.
26 Ibid, Pg. 22 27 Ibid, Pg. 23 28 City of Tucson and Pima County Consortium 2010-2015 HUD Consolidated Plan, (“ConPlan”), Pg. 24,
http://cms3.tucsonaz.gov/files/hcd/Tucson%20Pima%20County%202010-2014%20Consolidated%20Plan.pdf

L a n d U s e D i s t r i b u t i o n , A n a l y s i s
a n d C u r r e n t C o n d i t i o n s
A3.43 | P a g e A p p e n d i x A : B a c k g r o u n d a n d C u r r e n t C o n d i t i o n s
TABLE 3.5.d: Household Characteristics 1990
Place/Planning Area
Total Population
Total Households
Total Housing
Units
Average Household
Size
Occupied Housing
Units
Owner Occupied
Households
Renter Occupied
Households
Vacant Units
Arizona 3,665,228 1,437,551 1,368,843 2.62 1,368,843 878,561 490,282 290, 587
Pima County 666,880 298,207 261,792 2.49 261,792 159,467 102,325 36,415
Planning Areas
1) Avra Valley 9,890 3,913 3,458 2.86 3,458 2,883 575 455
2) Tucson Mountains 30,724 11,960 10,879 2.68 10,879 7,381 3,498 1,081
3) Southwest 51,324 20,967 17,990 2.85 17,990 13,842 4,148 2,977
4) Altar Valley 3,759 1,743 1,418 2.65 1,418 1,199 219 325
5) Upper Santa Cruz 17,547 11,654 8,858 1.96 8,858 7,656 1,202 2,796
6) Mountain View 678 320 260 2.55 260 214 46 60
7) Southeast 72,361 25,458 21,966 3.16 21,966 14,123 7,843 3,492
8) Central 279,082 132,053 117,639 2.29 117,639 56,325 61,314 14,414
9) Catalina Foothills 140,837 65,685 58,021 2.41 58,021 39,377 18,644 7,664
10) Rincon Valley 1,549 640 560 2.75 560 463 97 80
11) Tortolita 47,906 19,439 17,328 2.76 17,328 13,545 3,783 2,111
12) San Pedro 54 65 18 3.00 18 2 16 47
13) Ajo/Why 3,401 2,056 1,445 2.35 1,445 1,064 381 611
14) Tohono O’odham 7,768 2,254 1,952 3.98 1,952 1,393 559 302
Source: US Bureau of the Census, 2000 Population Counts Aggregates by Place and Planning Area
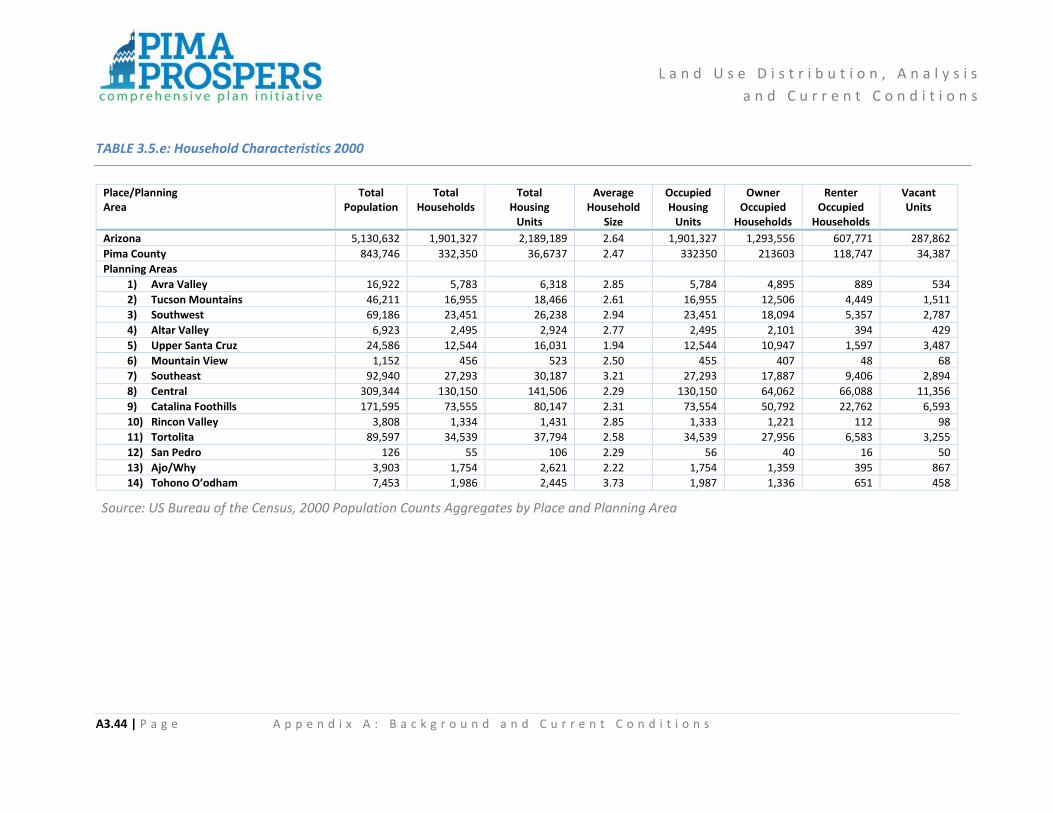
L a n d U s e D i s t r i b u t i o n , A n a l y s i s
a n d C u r r e n t C o n d i t i o n s
A3.44 | P a g e A p p e n d i x A : B a c k g r o u n d a n d C u r r e n t C o n d i t i o n s
TABLE 3.5.e: Household Characteristics 2000
Place/Planning Area
Total Population
Total Households
Total Housing
Units
Average Household
Size
Occupied Housing
Units
Owner Occupied
Households
Renter Occupied
Households
Vacant Units
Arizona 5,130,632 1,901,327 2,189,189 2.64 1,901,327 1,293,556 607,771 287,862
Pima County 843,746 332,350 36,6737 2.47 332350 213603 118,747 34,387
Planning Areas
1) Avra Valley 16,922 5,783 6,318 2.85 5,784 4,895 889 534
2) Tucson Mountains 46,211 16,955 18,466 2.61 16,955 12,506 4,449 1,511
3) Southwest 69,186 23,451 26,238 2.94 23,451 18,094 5,357 2,787
4) Altar Valley 6,923 2,495 2,924 2.77 2,495 2,101 394 429
5) Upper Santa Cruz 24,586 12,544 16,031 1.94 12,544 10,947 1,597 3,487
6) Mountain View 1,152 456 523 2.50 455 407 48 68
7) Southeast 92,940 27,293 30,187 3.21 27,293 17,887 9,406 2,894
8) Central 309,344 130,150 141,506 2.29 130,150 64,062 66,088 11,356
9) Catalina Foothills 171,595 73,555 80,147 2.31 73,554 50,792 22,762 6,593
10) Rincon Valley 3,808 1,334 1,431 2.85 1,333 1,221 112 98
11) Tortolita 89,597 34,539 37,794 2.58 34,539 27,956 6,583 3,255
12) San Pedro 126 55 106 2.29 56 40 16 50
13) Ajo/Why 3,903 1,754 2,621 2.22 1,754 1,359 395 867
14) Tohono O’odham 7,453 1,986 2,445 3.73 1,987 1,336 651 458
Source: US Bureau of the Census, 2000 Population Counts Aggregates by Place and Planning Area

L a n d U s e D i s t r i b u t i o n , A n a l y s i s
a n d C u r r e n t C o n d i t i o n s
A3.45 | P a g e A p p e n d i x A : B a c k g r o u n d a n d C u r r e n t C o n d i t i o n s
TABLE 3.5.f: Household Characteristics 2010
Place/Planning Area
Total Population
Total Households
Total Housing
Units
Average Household
Size
Occupied Housing
Units
Owner Occupied
Households
Renter Occupied
Households
Vacant Units
Arizona 6,392,017 2,380,990 2,844,526 2.68 2,380,990 1,571,687 809,303 463,536
Pima County 980,263 388,660 440,909 2.46 388,660 248,970 139,690 52,249
Planning Areas
1) Avra Valley 22,853 8,193 9,327 2.73 8,194 6,712 1,482 1,133
2) Tucson Mountains 63,422 24,164 26,283 2.53 24,164 16,867 7,297 2,119
3) Southwest 89,341 29,813 34,021 2.99 29,813 22,230 7,583 4,208
4) Altar Valley 7,062 2,714 3,446 2.60 2,714 2,253 461 732
5) Upper Santa Cruz 49,822 22,918 29,279 2.17 22,919 19,406 3,513 6,360
6) Mountain View 1,334 547 630 2.42 547 456 91 83
7) Southeast 116,512 34,847 39,246 3.17 34,846 22,969 11,877 4,400
8) Central 321,216 133,717 150,614 2.31 133,717 63,633 70,084 16,897
9) Catalina Foothills 176,907 79,360 88,481 2.21 79,360 54,078 25,282 9,121
10) Rincon Valley 12,861 4,521 4,970 2.84 4,521 3,969 552 449
11) Tortolita 108,154 44,272 49,560 2.44 44,271 33,776 10,495 5,289
12) San Pedro 103 43 85 2.40 43 30 13 42
13) Ajo/Why 3,524 1,630 2,389 2.15 1,630 1,135 495 759
14) Tohono O’odham Nation 7,152 1,921 2,578 3.60 1,921 1,456 465 657
Source: US Bureau of the Census, 2010 Population Counts Aggregates by Place and Planning Area

L a n d U s e D i s t r i b u t i o n , A n a l y s i s
a n d C u r r e n t C o n d i t i o n s
A3.46 | P a g e A p p e n d i x A : B a c k g r o u n d a n d C u r r e n t C o n d i t i o n s
Housing and Community Design
In 2012, Imagine Greater Tucson engaged the community in a discussion regarding community design and
growth pattern scenarios. The Preferred Future Scenario depicts a region that is more compact, efficient,
walkable, bikeable, greener and transit-oriented than it would be if we were to continue with a business-
as-usal approach to growth. This future emphasizes creating areas with increased density and greater mix
of land uses. The building blocks include centers, neighborhoods, transportation corridors, and
employment areas. Large regional centers (Downtown Tucson or Marana and Oro Valley) will anchor the
region with employment, higher density housing, shopping, and institutional uses. Town Centers will
anchor transit corridors, walkable commerce areas and feature low to midrise buildings. Neighborhood
centers will honor the adjacent residential neighbors with scaled form and use.
Compact and Mixed Use Development
Compact development means that buildings, parking areas, streets, driveways, and public spaces are
developed in ways that shorten trips, and lessen dependence on the automobile, thereby reducing levels
of land consumption, energy use, and air pollution. Compact development promotes full utilization of
urban services, such as water lines, sewers, streets, and emergency services, by taking advantage of
existing public facilities and minimizing the need for new facilities.
Mixed-use development is appropriate in neighborhood-oriented centers, regional activity centers, high
transit corridors, transit nodes, some community commercial centers, redevelopment and areas adjacent
to urban areas. Locating stores, offices, residences, public services, and recreation spaces within walking
distance of each other in these locations promotes:
• Healthy activities such as walking and biking;
• Independence of movement, especially for the young and the elderly who can conveniently walk,
cycle, or ride transit;
• Safety through around-the-clock presence of people;
• Reduction in auto use, especially for shorter trips;
• Support for those who work at home, through nearby services and amenities; and
• A variety of housing choices, so that the young and old, singles and families, and those of varying
economic ability may find places to live.
Examples of appropriate mixed-use include a corner store in a residential area, an apartment near or over
a shop, and a lunch counter in an industrial zone. For increased compatibility with surrounding areas,
mixed-use development can be horizontal or vertical. Horizontal forms consist of one story development
combining commercial at appropriate locations while vertical mixed-use provides retail or services at
ground level defining the public realm and feature office and residential on subsequent floors. Auto- or
truck-dependent uses, such as heavy industrial, distribution, automobile sales lots, and some drive-up or

L a n d U s e D i s t r i b u t i o n , A n a l y s i s
a n d C u r r e n t C o n d i t i o n s
A3.47 | P a g e A p p e n d i x A : B a c k g r o u n d a n d C u r r e n t C o n d i t i o n s
drive-through facilities should not be located in centers, nodes, or other compact, mixed-use areas
because of their negative impact on nearby residences and the pedestrian environment.
Commercial and mixed-use design standards, in tandem with mixed-use zoning, overcomes
incompatibility. Additionally, limitations on commercial functions, such as hours of operation and delivery
truck access, may be necessary. More fundamentally, to gain the full benefits of a mix of uses, buildings
must have convenient access to a connected system of streets and paths. Otherwise, people will still be
encouraged or required to use cars, even for the shortest trips.
In Pima County, community centers are becoming multi-use places providing a variety of services. It is
anticipated that this trend will continue, taking advantage of horizontal and vertical mixed-use land
patterns allowing for the provision of a variety of services in community centers. Pima County has
commercial and mixed use design standards for certain types of development but lacks urban design
expertise to fully promote this type of development. It also has landscape design manuals that need
updating to provide the best practices in creating walkable areas.
Green Building Materials
Green buildings seek to reduce energy use, water use, material use and create a healthier indoor
environment. The principles of affordability and green building coincide since the subsequent reduction
in operating costs and the potential for reduced health costs make building more affordable. Green
building seeks to promote efficiencies and sustainability in six areas: Location and Linkages, Site
Development, Water Use, Energy Use, Material Resources and Indoor Air Quality.
Location and Linkages: Seeks to reduce automobile dependence, achieve housing and jobs
proximity, compact development and diversity of uses. Based on a study by the Center for
Neighborhood Technology, when considering transportation costs, the number of affordable homes
in the greater Tucson area is reduced from 73% to 21%.29 Historic land use patterns and current
development do not achieve most green building measures in this area.
Site Development: Seeks to decrease the heat island effect and reduce water run-off.
Water Use: Seeks to reduce irrigation water use and indoor water use. Xeriscape landscaping and
the use of drip irrigation are locally acceptable and common green building principles. In contrast,
a Pima County-adopted requirement for waterless urinals in all new construction, which continues
to receive resistance. There remains a general reluctance even with projects seeking green building
certification to use ultra-low flow water fixtures.
Energy Use: Energy Star for Homes is a popular element of sustainability. All but one of the national
builders as well as several local builders in the Pima County market build to the Energy Star for
29 See for example the Seattle area: http://greenworksrealty.com/e-cert_report/Jan-2012-ECert-Graphic.pdf

L a n d U s e D i s t r i b u t i o n , A n a l y s i s
a n d C u r r e n t C o n d i t i o n s
A3.48 | P a g e A p p e n d i x A : B a c k g r o u n d a n d C u r r e n t C o n d i t i o n s
Home standard.30 There is no current estimate of market penetration for energy star homes
however in the past, research by TEP has indicated a participation rate as high as 60%.31
Comparatively, one of the largest single sources of energy savings is to “right size” air conditioners
in both new construction and replacements, but the industry remains reluctant to adopt this
practice.
Material Resources: Local material for building is limited to adobe and concrete. Pima County was
instrumental in developing and later adopting a building code to facilitate adobe construction
however, adobe remains a specialty material. Concrete block is used in some commercial projects
and very seldom in residential work.
Indoor air quality: Seeks to reduce indoor air pollution by use of materials that have reduced
volatile organic compound (VOC) emissions. Low VOC materials have become common place in the
market since the creation of green building rating systems brought the issue to the forefront. Use
of these materials in mainstream building, however, is still limited.
Many of the green building measures noted above have a slight, first-cost increase over the similar
“brown” building measures. Even though there is demonstrated overall positive return on investment for
green building,32 the building industry acceptance of green building is low. This is due to the split
incentive: the benefits of the energy efficient, water efficient, healthier building do not accrue to the
developer.33 The Energy Efficient Mortgage was designed to help offset the split incentive but has very
limited if any use in Pima County.34 Energy Efficient Mortgage was designed to help offset the split
incentive but has very limited if any use in Pima County.35
Certified green homes that achieve efficiencies and sustainability in all six areas noted above have had
limited success in the Pima County market place. Fifty-two homes were certified by Pima County in the
Regional Green Building program between 2008 and 2013. As of January 2015, 349 homes in Pima County
have been certified by the County in the national LEED for Homes program. Local market recognition of
the value of certification does not yet exist when compared to more mature, sustainable building markets
in other areas of the country. For example, research in King County Washington reports a 23% increase in
the resale value of certified green homes.36
30 Richmond American does not participate in Energy Star for Homes see http://www.energystar.gov/index.cfm?fuseaction=new_homes_partners.showAreaResults&s_code=AZ&msa_id=33 for list of energy star builders. 31 Verbal communication with Dan Hogan, TEP Residential Account Manager. 32 Center for Neighborhood Technology Affordability Index accessed 9/3/2013 http://htaindex.cnt.org/map/ 33 See for example: http://www.usgbc.org/Docs/Archive/General/Docs1992.pdf and
http://www.lexology.com/library/detail.aspx?g=6d193295-389d-48b8-881e-f393aa9a5d74 34 Personal communication with Eric Painter, Nova Home Loans; Jan Anderson, Long Realty and others 35 Personal Communication with Eric Painter, Nova Home Loans; Jan Anderson, Long Realty and others. 36 http://greenworksrealty.com/e-cert_report/Jan-2012-ECert-Graphics.pdf
L a n d U s e D i s t r i b u t i o n , A n a l y s i s
a n d C u r r e n t C o n d i t i o n s
A3.49 | P a g e A p p e n d i x A : B a c k g r o u n d a n d C u r r e n t C o n d i t i o n s
Housing Rehabilitation and Redevelopment
While assisting first-time homebuyers to enter the homeownership market is one important community
sustainability strategy, assisting existing homeowners to maintain their housing is equally important. Cost
burdened owners are often challenged to maintain their properties and deferred maintenance may lead
to deterioration of major housing systems, neighborhoods, and communities.
Existing homeowners may experience cost burden (paying more than 30% of household income for
housing) or severe cost burden (paying more than 50% of household income for housing). While owners
at all income levels experience cost burden, it is more prevalent among lower-income owners. Sixty-nine
percent of extremely low income owners are either cost burdened or severely cost burdened. Fifty-seven
percent of very low income, 39% of low and moderate income, 37% of middle income, and 13% of higher
income households are also cost burdened.37
Housing affordability extends beyond the relationship of housing costs to income. Just as transportation
costs impact housing affordability based on location, utilities directly impact housing affordability. The
standard measure for affordable rental housing and monthly rent subsidies includes an allowance for
utilities derived from average utility costs by unit size. Low and moderate income households and large
families occupying older structures are especially impacted by high utility costs. Improving housing
affordability and reducing operating costs through improved energy efficiency and sustainable design is
an important strategy.38
Housing Condition The more poorly a structure is built, the more costly it is to operate in the long run. The overall goal of
energy efficient and sustainable building practices is to provide for long-term affordability and
sustainability. Some of the objectives are to recognize transit and transportation accessibility, improve
indoor air quality, and positively impact the health and well-being of residents. Energy efficiency has many
household and community benefits. The movement is towards long-term cost savings, decreased
emissions, increased health, and ultimately increased productivity. Incorporating appropriate materials
and techniques into public and nonprofit facilities can also reduce organizational operating expenses,
providing for lower overhead and increasing opportunities to serve the community.39
37 City of Tucson and Pima County Consortium 2010-2015 HUD Consolidated Plan, (“ConPlan”), Pg. 31,
http://cms3.tucsonaz.gov/files/hcd/Tucson%20Pima%20County%202010-2014%20Consolidated%20Plan.pdf 38 Ibid, Pg. 24 39 Ibid, Pg. 24

L a n d U s e D i s t r i b u t i o n , A n a l y s i s
a n d C u r r e n t C o n d i t i o n s
A3.50 | P a g e A p p e n d i x A : B a c k g r o u n d a n d C u r r e n t C o n d i t i o n s
Age of Housing Older housing units may be less energy efficient, resulting in higher utility costs for occupants. In addition,
some materials such as lead paint (in units built prior to 1978) and asbestos may represent health hazards
to occupants. The age of the housing stock is one indicator of housing quality. While many older housing
units have been well-maintained and lovingly restored, other older housing units may have been built to
outdated building codes using materials and construction techniques that are no longer considered safe
or sustainable. Older units are the most likely to require rehabilitation or replacement, historic
preservation, and energy-efficiency improvements.
Almost half (45% or 199,606 units) of the housing stock in Pima County is 30 years old or older. The
majority of older units are located in Tucson, where 49% of the stock is more than 30 years old, and in
South Tucson where 75% of the stock is more than 30 years old. One third of older housing stock was built
prior to 1960 when local building codes were not yet adopted or enforced in many areas. Much of the
oldest housing stock is in Tucson and South Tucson:
In Tucson, 53,666 units or 23% of the stock was built before 1960 and another 83,345 or 36% of the
housing stock was built between 1960 and 1980.
In South Tucson 1,002 units or 47% of the stock was built before 1960, and another 807 or 38% of
the housing stock was built between 1960 and 1980.40
Material and Labor Costs One argument against energy efficiency improvements and sustainable building has been that material
and labor costs are high. However as demand has increased, costs have decreased putting many
improvements within the reach of households and builders alike. In fact, many energy efficiency
improvements have zero or very low cost. According to Pima County Community Development staff, LEED
silver certification costs approximately 2% more than standard construction and can result in significantly
lower utility bills and community impacts.
Both the University of Arizona Drachman Institute and the Arizona State University Stardust Center for
Homes and the Family have been working towards building models of energy conservation and
sustainable design. The Drachman Institute has developed design guidelines and model units that are
readily available to nonprofit builders.
The Stardust Center has developed standards (AZ5 ReGreen) that provide energy efficiency retrofit
guidelines. Both the AZ5 ReGreen and LEED guidelines provide a menu of techniques and materials that
40 Ibid, Pg. 22

L a n d U s e D i s t r i b u t i o n , A n a l y s i s
a n d C u r r e n t C o n d i t i o n s
A3.51 | P a g e A p p e n d i x A : B a c k g r o u n d a n d C u r r e n t C o n d i t i o n s
range from zero -cost to high-cost, making it possible for those who are not well-versed in all of the
techniques and materials to choose the most efficient and sustainable improvements and building
techniques.
Local government has also played an important role in energy efficiency and sustainable building. Pima
County is the only recognized local government to provide LEED certification. This certification places
energy efficiency and sustainable development expertise within local government, where partnerships
and relationships with the affordable housing and community development industry are readily sustained.
One success that demonstrates the effectiveness of in-house expertise is the adoption of Green
rehabilitation standards by jurisdictions throughout the County. The standards are coordinated with a
Certification program for rehabilitation contractors.41
TABLE 3.5.g: Pima County Owner Housing Activities, 5-Year Goals And Performance Measures 42
Activity 5-year Goal & Performance Measure
Funding Source(s)
Owner-occupied Housing Rehab, including Lead Abatement and Historic Preservation
450 units CDBG, HOME
Acquisition, Rehabilitation, Resale 200 units HOME
Handicap Accessibility Improvements 150 units CDBG
Demolition/Reconstruction 30 units CDBG, HOME
Source: Pima County Development Services Department, 2013
Substandard Housing
This section provides an inventory of substandard housing in need of rehabilitation or demolition by
planning area based on census indicators and on best available data. Indicators include:
Year Structure was built: A distinction is made between units built before 1940 and units built
thereafter. Research has demonstrated that units built before 1940 are much more likely to be in
substandard condition. This factor is probably the most dominant factor in estimating the condition
of the housing stock.
Persons per Room: 1.01 or more persons per room is an index of overcrowding.
Plumbing Facilities: Inadequate plumbing facilities are indicated by either a lack of exclusive use of
plumbing facilities or incomplete plumbing facilities.
Kitchen Facilities: Inadequate kitchen facilities are indicated by shared use of a kitchen or the lack
of a sink with piped water, a stove or a refrigerator.
41 Ibid, Pg. 25 42 Ibid, Pg. 76

L a n d U s e D i s t r i b u t i o n , A n a l y s i s
a n d C u r r e n t C o n d i t i o n s
A3.52 | P a g e A p p e n d i x A : B a c k g r o u n d a n d C u r r e n t C o n d i t i o n s
Heating or Cooling: Inadequate or no heating or cooling.
Structure: Structural repairs needed
TABLE 3.5.h: Substandard Housing by Planning Area 2010
Planning Area Lacking Plumbing
LackingKitchen
Total Housing Units
Pima County 1,257 2,948 444,349
Avra Valley 401 279 9,297
Tucson Mountains 110 177 26,917
Southwest 241 412 34,645
Altar Valley 443 350 4,555
Upper Santa Cruz 289 383 24,862
Mountain View 119 74 2,515
Southeast 716 709 37,543
Central 1,790 2,571 150,989
Catalina Foothills 332 1,194 89,602
Rincon Valley 19 57 3,484
Tortolita 327 396 48,005
San Pedro 73 56 1,569
Ajo/Why 124 202 2,300
Totals 1,257 2,948 444,349
Source: US Bureau of the Census 2010
County Designated Colonias Section 916 of the Cranston-Gonzalez National Affordable Housing Act of 1990 requires the State of
Arizona, to set aside up to 10 percent of their annual Community Development Block Grant (CDBG)
allocations. Pima County has eight colonias that are eligible contenders for Arizona’s 10% CDBG set-aside
funds.
A “colonia” as defined by Section 916 of the Cranston-Gonzalesz Act is any identifiable community that
meets the following criteria:
Is located within 150 miles of the United States and Mexico border, except within any standard
metropolitan statistical area that has a population exceeding 1,000,000;
Is designated by Pima County as a colonia for eligibility of Arizona CDBG funds;
Is a colonia based on the objective criteria such as a lack of potable water supply, lack of adequate
sewage systems, and lack of decent, safe, and sanitary housing;
In existence and generally recognized as a colonia before the enactment of the National Affordable
Housing Act of 1990.

L a n d U s e D i s t r i b u t i o n , A n a l y s i s
a n d C u r r e n t C o n d i t i o n s
A3.53 | P a g e A p p e n d i x A : B a c k g r o u n d a n d C u r r e n t C o n d i t i o n s
Additionally, the State of Arizona Department of Housing (ADOH) has developed their own colonia
certification list and developed a process to certify Arizona colonias to ensure that they comply with
Section 916 of the Cranston-Gonzalez Act of 1990 and Federal Housing and Urban Development’s (HUD)
Office of Community Planning and Development (CPD) notice 11- 001 to set-aside funds in meeting the
colonia residents’ needs regarding health and safety in terms of water, sewage, and housing.
A community, county, or tribe wishing to obtain ADOH colonia certification must meet all four of the
criteria and must demonstrate eligibility thru extensive historic documentation. In order to be considered
an eligible colonia it is important to recognize and document evidence that water, sewer, and/or housing
issues were in existence in the community in question, prior to November 1990.
Communities, counties, or tribes wishing to obtain state CDBG funding for colonia projects must first
complete the certification process prior to being eligible to participate in a colonia set-aside competitive
funding round.
Pima County will continue to work with the federally-designated USDA colonias to certify them under the
ADOH guidelines, thereby making such communities eligible for State of Arizona CDGB ‘set-aside’ funding.
See Exhibit 3.5.a and 3.5.b for maps of Pima County Designated Colonias.

L a n d U s e D i s t r i b u t i o n , A n a l y s i s
a n d C u r r e n t C o n d i t i o n s
A3.54 | P a g e A p p e n d i x A : B a c k g r o u n d a n d C u r r e n t C o n d i t i o n s
TABLE 3.5.i: Designated Colonias in Pima County
Sub-region Colonias
Avra Valley Avra Valley Water Co.
Marana Town
Marana Water District
Rancho del Conejo
Red Hill Water Coop
Tucson Mtns Town of Marana
Rillito
Altar Valley Sierrita Mountain
Arivaca
Three Points
Upper Santa Cruz Sierrita Mountain
Sahuarita Town
Elephant Head
Mountain View None
Southeast Littletown
Old Nogales Highway
Sahuarita Town
South Tucson
Central Littletown
Marana Town
South Tucson
Catalina Foothills None
Rincon Valley None
Tortolita Marana Town
San Pedro None
Ajo/Why Ajo
Source: Arizona Department of Housing, 2013
L a n d U s e D i s t r i b u t i o n , A n a l y s i s
a n d C u r r e n t C o n d i t i o n s
A3.55 | P a g e A p p e n d i x A : B a c k g r o u n d a n d C u r r e n t C o n d i t i o n s
3.6 Cultural Resources
This section identifies priority site complexes, priority archaeological sites, and cultural resources on
County Conservation Land, existing deficiencies and potential remedies by planning area based on data
provided in the Pima County Infrastructure Study, 2013.
Pima County has a long-term commitment to protect its cultural resources, beginning with Board of
Supervisors Resolution 1983-104, which provides protection for archaeological and historic sites on
County projects. Various existing County ordinances and policies also require the consideration and
protection of cultural resources on projects permitted by the County. The County also ensures that
appropriate State and Federal cultural resources requirements are met, as required on a project-specific
basis; for example, if a Clean Water Act, Section 404 Permit is required, then the County will implement
compliance to the federal standard as well as meeting the County standard.
The following County, State, and Federal legal authorities can apply in different situations and give
guidance to compliance actions:
Federal Antiquities Act 1906
Arizona State Antiquities Act 1927
Historic Stes Act [NHL, HABS, HAER] 1935
National Historic Preservation Act 1966
National Environmental Policy Act 1969
American Indian Religious Freedom Act 1978
Archeological Resources Protection Act 1979
Native American Graves Protection: Repatriatian Act 1990
Arizona Historic Preservation Act 1982
Pima County Board of Supervisors Resolution 1983-104 (and other BOS resolutions, see below)
Pima County Board of Supervisors Policy C3.17, 2008
Arizona State Burial Act 1990
Pima County Comprehensive Plan 2002
Pima County Zoning Code, Title 18
The National Register of Historic Places and the Arizona Register of Historic Places provide historic
properties and districts cultural significance and guidance for preservation planning and the appropriate
treatments and mitigation.
Following a goal set forth in the regional policies of the current comprehensive plan, as amended June
2012, Pima County has adopted a list of Priority Cultural Resources (PCR) as part of the 2001 Sonoran
Desert Conservation Plan. Identification of cultural resources for inclusion on this List was conducted
under the oversight and direction of the Sonoran Conservation Plan Cultural and Historic Resources
Technical Advisory Team and 20 experts in historic preservation and archaeology. The List is divided into

L a n d U s e D i s t r i b u t i o n , A n a l y s i s
a n d C u r r e n t C o n d i t i o n s
A3.56 | P a g e A p p e n d i x A : B a c k g r o u n d a n d C u r r e n t C o n d i t i o n s
two general categories of cultural resource types, one consisting of 91 archaeological sites and site
complexes, and the other consisting of 138 historic sites and structures.
The List includes, and will continue to include, a balanced collection of cultural resources of exceptional
value that are representative of the County’s diverse cultural history regardless of current jurisdiction.
The List primarily serves as a planning tool for development, and designation as a PCR will help ensure
that these significant places are provided the highest consideration prior to any county public works
project, as well as in select cases, private development. A secondary function of the List, and arguably
equally as important, is to encourage through education the stewardship of these exceptional resources
by providing for their immediate conservation, and long term preservation, so as to illustrate and
commemorate the history and prehistory of Pima County.
In 2004, Pima County voters approved bond funding for projects to preserve cultural resources. Public-
approved historic preservation bonds have been used to acquire conservation easements for the repair,
rehabilitation, and preservation of significant cultural resources and historic properties listed in the
National Register of Historic Places. Many of these bond projects include an education component and
serve to educate the public on Pima County’s cultures and history, which benefit the public and local
communities. Examples of Bond projects include the Anza National Historic Trail. The Anza Trail runs for
60 miles through Pima County and is part of the greater 1200-mile trail that was used in 1775 by Spanish
explorers looking for a land route from Sonora to San Francisco.
Other bond projects that have made a substantial difference in the rehabilitation of historic buildings
include the Canoa Ranch Buildings Rehabilitation, Steam Pump Ranch, Ajo Train Depot, and Dunbar
School. Bond projects focusing on preserving archaeological sites include Dakota Wash Site, Coyote
Mountains, Honey Bee Village, and Pantano Townsite. Preservation of archaeological sites and
rehabilitation of historic buildings in Pima County provides economic benefits to local businesses due to
tourism and helps maintain and reinforce a local community’s sense of place. Pima County shall continue
to support the public’s interest in cultural resources and historic preservation projects through the County
Bond program. See Pima County’s website for information on bond projects: http://webcms.pima.gov/government/bonds/
Cultural Resources Background Evaluation
Research and predictive modeling has enabled the characterization of Pima County lands into three basic
categories (low-medium-high) of archaeological sensitivity. Based on these categories, priority Cultural
Resources (archaeological and historic sites) are places of such extraordinary importance to the history
and culture of the people of Pima County that their conservation is of utmost concern. These documented
resources are significant places on the landscape and known to contain material remnants of ancient
and/or historic cultures. The assessment that follows addresses the specific cultural resources needs
identified by the Pima County Infrastructure Study by planning area.

L a n d U s e D i s t r i b u t i o n , A n a l y s i s
a n d C u r r e n t C o n d i t i o n s
A3.57 | P a g e A p p e n d i x A : B a c k g r o u n d a n d C u r r e n t C o n d i t i o n s
Identified significant cultural resources on County conservation lands require management. Without care,
these resources are subject to erosion processes, inadvertent impacts, and benign neglect. However,
maintain the long-term value of the community’s investment to acquire these resources, the County
currently employs a volunteer program through Arizona State Parks, called the Arizona Site Stewards
Program where volunteers monitor significant cultural resources on lands owned by Pima County. Site
stewards are currently monitoring previously recorded sites on a regular basis and record and
subsequently report to the County and State Parks. Such monitoring information is fundamental to
informing County management strategies.
Current deficiencies in terms of cultural resources in the planning areas could include any of the following
depending upon the specific planning area:
• The inadequacy of the level of current inventory status.
• The quality of our current inventory status.
• The lack of knowledge of significant cultural resources on a large proportion of County conservation
lands or lands proposed for County conservation in the future.
• The lack of resources to manage known, significant cultural resources on County conservation lands
• The lack of preservation of significant cultural resources through development which cannot avoid
impacts to sites.
• Only a portion a planning area has been inventoried for cultural resources and most surveys were
conducted in the 1980s. In many cases, these surveys would be considered outdated by current
regulatory standards due to changes in geological processes over time and field techniques. The
majority of these surveyed lands were those planned for potential development in the 1980s.
Although archaeologists can estimate the probability of finding cultural resources in areas not
previously investigated. However, at present, little is known about the cultural resources status on
unsurveyed land, or lands proposed for County conservation in the future.
An example of potential remedies are those listed for the Altar Valley planning area:
Supporting conservation and designating conservation areas are efforts that would make a
substantial difference in cultural resources preservation.
One example includes County efforts in nominating historic buildings for listing in the National
Register for Historic Places (NRHP) and rehabilitating the historic ranches., such as Robles Ranch.
The Pima County conservation area includes a portion of the Coyote Mountains Site Complex but
the nomination as the Coyote Mountains National Register Archaeological District has not yet been
submitted to the Keeper of the Register.
Listing significant standing historic structures and archaeological and historic districts is an
important step in the preservation and management of historic properties.

L a n d U s e D i s t r i b u t i o n , A n a l y s i s
a n d C u r r e n t C o n d i t i o n s
A3.58 | P a g e A p p e n d i x A : B a c k g r o u n d a n d C u r r e n t C o n d i t i o n s
Potential Remedies and Projects Per Planning Area
Of most urgency is the need to conserve, restore, document, and rehabilitate known historic sites and
buildings and known archaeological sites located within the Tucson Downtown Priority Archaeological Site
Complex. The County is actively rehabilitating buildings it has acquired and has conservation easements
through at least portions of important archaeological and historic sites associated with the history of
Tucson. Greater funding is required to preserve, restore, and rehabilitate buildings. Funding from future
bonds and collaborating with nonprofit and private owners and the City of Tucson will continue to be a
necessary part in successful conservation of Downtown Tucson.
Sometimes development cannot avoid impacts to significant archaeological sites. In order to remedy this
situation, a greater understanding of the cultural resources within a region is helpful in being able to make
development decisions that can avoid or lessen the impacts early in the planning process of a
development project. Promoting greater use of restoration and rehabilitation in standing structures and
conservation easements in sites in the Central planning area (downtown Tucson) is important. One
excellent approach that begins to address the needs for programmatic ways of recognizing and treating
the significant historic and archaeological sites in the downtown Tucson area is the City of Tucson Historic
Preservation Office’s identification of “Sensitivity Zones”. The City of Tucson sensitivity zones are defined
with specific programmatic requirements designed to mitigate effects of construction in those zones. In
general, additional systematic surveys conducted to modern standards would be the optimal approach to
improve our understanding of the spatial distribution, quantity, and type of cultural resources.
Avra Valley Planning Area (1)
This planning area includes Ironwood Forest National Monument, Brawley Wash, and Saguaro National
Park. Small portions of the planning area have been surveyed for cultural resources. The largest of the
surveys were carried out over 20 years ago, some of which are associated with the ASARCO mine and
others were conducted in the southeastern most corner of the planning area.
In general, cultural resources survey in this planning area is limited. However, several small, systematically
placed block survey areas conducted by the University of Arizona in the past 15 years resulted in the
identification of numerous archaeological sites in the Ironwood Forest National Monument.
With the exception of the southeastern most portion of the planning area, areas where cultural resources
surveys were conducted have resulted in the identification of cultural resources.

L a n d U s e D i s t r i b u t i o n , A n a l y s i s
a n d C u r r e n t C o n d i t i o n s
A3.59 | P a g e A p p e n d i x A : B a c k g r o u n d a n d C u r r e n t C o n d i t i o n s
Priority Archaeological Site Complexes
Tucson Mountains B Priority Archaeological Site Complex
Los Robles Priority Archaeological Site Complex
Archaeological Districts Listed in the National Register of Historic Places
• Cocoraque Butte Archaeological District
• Los Robles Archaeological District
Priority Archaeological and Historic Sites
• Pig Farm Site (Hog Farm Ballcourt Site)
• Saguaro Springs
• Santa Anna del Chiquiburitac Mission
• Camp Pima (CCC)
• Cocoraque Butte
• Producer Cotton Gin
• Tucson Mountain Park
County Conservation Lands
At present, no significant cultural resources are known to be located on County conservation lands.
However, portions of several sites (Camp Pima CCC, Cocoraque Butte, Pig Farm Site, Saguaro Springs, and
Santa Anna del Chiquiburitac) are located in Federal land preserves.
Existing Deficiencies
Current deficiencies in terms of cultural resources in this planning area primarily concern conservation
and cultural resources surveys.
• The lack of resources to conserve and protect known archaeological sites.
• The lack of current survey data.
• The lack of preservation of significant cultural resources through development which
cannot avoid impacts to sites.
Potential Remedies and Projects
This planning area encompasses significant historic and prehistoric cultural resources. Potential remedies
that would make a substantial difference in cultural resources preservation would include the County
acquisition of conservation lands, supporting conservation efforts and designating conservation areas.

L a n d U s e D i s t r i b u t i o n , A n a l y s i s
a n d C u r r e n t C o n d i t i o n s
A3.60 | P a g e A p p e n d i x A : B a c k g r o u n d a n d C u r r e n t C o n d i t i o n s
Tucson Mountains Planning Area (2)
This planning area includes land owned by Pima County, Town of Marana, City of Tucson, Tucson
Mountain Park, other local parks, Saguaro National Park West, and State Trust Land. The northern half of
the area and much of the area along the Santa Cruz River have been surveyed. The surveyed portions also
have been characterized as a zone of high archaeological sensitivity (SDCP). The Northern Tucson Basin
Survey (Arizona State Museum) 1981-174.ASM, was the largest block survey conducted in this planning
area. Fewer surveys have been conducted west of the Santa Cruz River floodplain and in Saguaro National
Park West and Tucson Mountain Park. Less is known of the area in the southwestern portion of the area,
characterized by low archaeological sensitivity.
Over one hundred archaeological sites are known to exist in the Tucson Mountain planning area. The large
majority of the previously identified sites are part of Priority Archaeological Site Complexes (SDCP). Four
Priority Archaeological Site Complexes.
Priority Archaeological Site Complexes
• Tucson Mountains A Complex
• Los Morteros Complex
• River Confluence Complex
• Middle Santa Cruz Complex
Priority Archaeological Sites
• Los Morteros
• Cortaro Fan Site
• Dairy Site
• Saguaro Springs
• Linda Vista
• Bojorquez-Aguirre Ranch
• Yuma Wash
• Roland
• Picture Rocks
• Costello-King
• Hodges Ruin
• Sunset Lime Kiln
• Rabid Ruin
• Los Pozos
• Sweetwater Lime Kiln
• Santa Cruz Bend
• Stone Pipe
L a n d U s e D i s t r i b u t i o n , A n a l y s i s
a n d C u r r e n t C o n d i t i o n s
A3.61 | P a g e A p p e n d i x A : B a c k g r o u n d a n d C u r r e n t C o n d i t i o n s
• San Augustin/Clearwater
• Solomon Warner/Mill
• Black Sheep Cave
County Conservation Lands
Cultural resources on County conservation lands include Black Sheep Cave, Linda Vista, Los Morteros, San
Augustin/Clearwater, and Tumamoc Hill.
Existing Deficiencies
Current deficiencies in terms of cultural resources in this planning area primarily concern conservation
and management.
• The lack of resources to conserve known archaeological sites.
• The lack of resources to manage known, significant cultural resources on County
conservation lands.
• The lack of preservation of significant cultural resources through development which
cannot avoid impacts to sites.
• Need to conserve National Register-listed sites which are chosen for utility corridors.
Potential Remedies and Projects
This planning area encompasses significant historic and prehistoric cultural resources. The area is
characterized by diverse cultural resource types. Supporting conservation efforts and designating
conservation areas are efforts that would make a substantial difference in cultural resources preservation.
As large portions of the planning area are already known to contain significant cultural resources, projects
and programs supporting the management of the resources and the lands are necessary projects. One
good example of how many significant archaeological sites are currently being managed by Pima County,
is through the Arizona Site Stewards Program.
L a n d U s e D i s t r i b u t i o n , A n a l y s i s
a n d C u r r e n t C o n d i t i o n s
A3.62 | P a g e A p p e n d i x A : B a c k g r o u n d a n d C u r r e n t C o n d i t i o n s
Southwest Planning Area (3)
The Southwest planning area has been identified as a major growth area by the Pima County Southwest
Infrastructure Plan (SWIP). As part of the development review process, it is anticipated that cultural
resources will be assessed on a project by project basis as development occurs within this area.
The planning area includes the San Xavier District of the Tohono O’odham Nation and the Pascua Yaqui
Tribe Reservation. Cultural resources records are unavailable for these areas, however, important cultural
and historic resources are present. For instance, the San Xavier del Bac Mission is the oldest intact
European structure in Arizona and is a National Historic Landmark and a UNESCO World Heritage Site. The
remaining portions of this planning area range between high and low archaeological sensitivity zones,
with high sensitivity zones associated with the Santa Cruz River and Black Wash systems. Very little of the
planning area has been inventoried for cultural resources, and correspondingly little is known about the
cultural resources status in unsurveyed areas. Even so, several large prehistoric sites are known, including
National Register-eligible sites, like the prehistoric Hohokam villages of the Valencia Site and Dakota
Wash. The Valencia Site is the only prehistoric priority cultural resources site in the area and three Priority
Archaeological Site Complexes are associated with the West Branch of the Santa Cruz River. Much of
Tucson Mountain Park is incorporated within this planning area; it is designated a Priority Historic Site in
the Sonoran Desert Conservation Plan. There are no sites listed on the National Register of Historic Places.
Priority Archaeological Site Complexes
West Branch Complex
Valencia Complex
Middle Santa Cruz Complex
Priority Archaeological Sites
Valencia Site
Tucson Mountain Park Priority Historic Site
Altar Valley Planning Area (4)
At least half of the land in this planning area is State Trust Land. Significant portions of land are also within
the Buenos Aires National Wildlife Refuge and the Tohono O’odham Nation. Coronado National Forest,
private land, Bureau of Land Management, and Pima County lands are also included in the planning area.
Very little of the land (less than 10 percent) in the area has been surveyed for cultural resources, and, a
similarly low percentage has been developed. The landscape includes a portion of the Baboquivari
Wilderness Area, Brawley Wash, and the Altar valley containing braided and dissected wash systems
which create diverse natural habitats. The valleys at the bases of canyon mouths of the steep Coyote
Mountains provided protected settings suitable for prehistoric human occupation.

L a n d U s e D i s t r i b u t i o n , A n a l y s i s
a n d C u r r e n t C o n d i t i o n s
A3.63 | P a g e A p p e n d i x A : B a c k g r o u n d a n d C u r r e n t C o n d i t i o n s
Although only a major few surveys (e.g. Dart et al. 1980, Brack 2011) have been conducted, it is expected
that cultural resources exist in this planning area that have yet to be recorded. Previously recorded
cultural resources and sites are clustered within identified Priority Archaeological Site Complexes (SDCP).
Priority Archaeological Site Complexes
• Brawley Batamote Complex
• Coyote Mountain Complex
• Gunsight Mountain Complex
Priority Archaeological Sites
• Cocoraque Butte
• Blackstone Ruin
• Robles Ranch
Historic Properties Listed on the National Register of Historic Places
• Cocoraque Butte
• Robles Ranch House
Traditional Cultural Property
The Altar Valley planning area also encompasses a portion of the Baboquivari Mountains and Kitt Peak,
which is located on Tohono O’odham Nation Indian Reservation lands. Kitt Peak is a Traditional Cultural
Property and known to the Tohono O’odham as I’toi’s Garden. As I’toi is the creator of the Universe and
the Tohono O’odham, Kitt Peak is a sacred place to the Tohono O’odham Nation.
County Conservation Lands
A portion of the Coyote Mountain Priority Archaeological Site Complex exists within County conservation
lands located in T17S, R8E, Sections 3, 9, and 10. Pima County owns approximately 804 acres that contain
four archaeological sites located in South Mendoza Canyon and White Rincon Canyon, and a portion of
the historic Hay Hook Ranch.
Existing Deficiencies
Current deficiencies in terms of cultural resources in this planning area primarily concern conservation
and management.
• The lack of resources to acquire conservation lands.
• The lack of current survey data.
• The need for managing and monitoring significant cultural resources so that
archaeological sites are not destroyed through pot-hunting and historic buildings are not

L a n d U s e D i s t r i b u t i o n , A n a l y s i s
a n d C u r r e n t C o n d i t i o n s
A3.64 | P a g e A p p e n d i x A : B a c k g r o u n d a n d C u r r e n t C o n d i t i o n s
neglected and destroyed. Survey assessments conclude that a large majority of the
archaeological sites have been impacted by looting, particularly from the ground surface.
Potential Remedies and Projects
This area is characterized by diverse cultural resource types. Supporting conservation and designating
conservation areas are efforts that would make a substantial difference in cultural resources preservation.
One example includes County efforts in nominating historic buildings for listing in the National Register
for Historic Places (NRHP) and rehabilitating the historic ranches, such as Robles Ranch. The Pima County
conservation area includes a portion of the Coyote Mountains Site Complex but the nomination as the
Coyote Mountains National Register Archaeological District has not yet been submitted to the Keeper of
the Register.
Listing significant standing historic structures and archaeological and historic districts is an important step
in the preservation and management of historic properties.
Upper Santa Cruz Planning Area (5)
Although cultural resources (archaeological and historic sites) have been identified throughout this
planning area, survey has shown that cultural resources tend to be concentrated in certain areas. The high
archaeological sensitivity zone occurs mostly in areas associated with the Santa Cruz River. Other locations
that have been previously surveyed just west of the Sierrita Mountains have been designated with
moderate sensitivity. The remaining portions of land within this planning area represent low
archaeological sensitivity.
Previous research offers a picture on the lifeways of populations that inhabited the land. Surveys have
also generated reports on site type and in some cases additional research (e.g. excavation and intensive
inventory projects) on significant archaeological and historic sites. Survey in this planning area has
resulted in the identification of approximately 200 archaeological and historic sites.
Priority Archaeological Site Complexes
• Eastern Sierrita Complex
• Canoa Ranch Complex
National Register of Historic Places Sites
• Canoa Ranch
• Missile Site 8 - Air Force Facility Missile Site 8 (571-7) Military Reservation in Green Valley,
Arizona, is the only remaining on alert Titan II Intercontinental Ballistic Missile (ICBM)
complex during the Cold War between 1963 and 1987 (National Park Service). The
missiles were built to survive and retaliate on a nuclear attack from the Soviet Union.

L a n d U s e D i s t r i b u t i o n , A n a l y s i s
a n d C u r r e n t C o n d i t i o n s
A3.65 | P a g e A p p e n d i x A : B a c k g r o u n d a n d C u r r e n t C o n d i t i o n s
Titan II carried the largest single warhead used in the ICBM program and was constructed
in response to the "missile gap" panic of the late 1950s and early 1960s.
Potential Remedies and Projects
• Additional systematic surveys conducted to modern standards would be the optimal
approach to improve our understanding of the spatial distribution, quantity, and type of
cultural resources in this area.
• One critical element for management is having an inventory of cultural resources on
County conservation lands. The County’s cultural resources staff is currently preparing a
cultural resources long-term management plan. This plan will include differing levels of
proposed survey and inventory on County lands.
• For future planning purposes and management, it may be beneficial to have an
understanding of where the significant cultural resources are located with respect to the
Conservation Lands System categories. It is important to have at least an initial
assessment or a sample survey of proposed County conservation areas to determine the
importance of conservation of cultural resources in parallel with other County
conservation goals (e.g. natural resources). This enables planning for future Bond projects
and would benefit the public to a greater extent.
• There are some cases in which development cannot avoid impacts to significant
archaeological sites. In order to remedy this situation, a greater understanding of the
cultural resources within a region is helpful in being able to make development decisions
that can avoid or lessen the impacts early in the planning process of a development
project.

L a n d U s e D i s t r i b u t i o n , A n a l y s i s
a n d C u r r e n t C o n d i t i o n s
A3.66 | P a g e A p p e n d i x A : B a c k g r o u n d a n d C u r r e n t C o n d i t i o n s
Mountain View Planning Area (6)
Pima County, Cienega Creek Natural Preserve, Coronado National Forest, and Las Cienegas National
Conservation Area lands comprise the majority of this planning area. Very little of the land in this planning
area has been formally surveyed for cultural resources, and, a similarly low percentage has been
developed. The larger block surveys have been completed in the Santa Ritas west of SR 83 as part of the
cultural resources compliance process for the continuing development and expansion of the Anamax and
Rosemont mines over the past 40 years.
One north-south linear survey (SWCA 1999) running from the northern planning area boundary to the
southern boundary resulted in the identification of archaeological sites. Cultural resources likely exist in
the canyons along tributaries between mountain ridges, such as in Apache Canyon. These restricted areas
of possible prehistoric land use between high ridges are defined as areas of high and moderate
archaeological sensitivity (SDCP). Previously recorded cultural resources are clustered within identified
Priority Archaeological Site Complexes (SDCP), also defined as areas of high archaeological sensitivity
(SDCP). These areas with habitation sites and larger clusters of sites are found in the valleys.
The SDCP predicts a strong positive correlation between Important Riparian Areas (CLS) and
archaeological sites in this planning area.
Priority Archaeological Site Complexes
• Davidson Canyon Complex
• Upper and Lower Cienega Creek Complexes
Priority Archaeological Sites
• Greaterville
• Rosemont Townsite
• Donaldson Site
• Total Wreck Mine
• Marsh Station Road
Priority Historic Sites
• Kentucky Camp
• Empire Ranch
Historic Properties Listed on the National Register of Historic Places
• Kentucky Camp
• Empire Ranch
• Empirita Cattle Ranch Rural Historic District
L a n d U s e D i s t r i b u t i o n , A n a l y s i s
a n d C u r r e n t C o n d i t i o n s
A3.67 | P a g e A p p e n d i x A : B a c k g r o u n d a n d C u r r e n t C o n d i t i o n s
Traditional Cultural Property
This planning area also encompasses a portion of the Santa Rita Mountains, located in the Coronado
National Forest that is known to the Tohono O’odham Nation as Ce:wi Duag, “Long Mountain”. Ce:Wi
Duag is considered a Traditional Cultural Property to the Tohono O’odham Nation. The State Historic
Preservation Office has determined Ce:wi Duag eligible for listing on the National Register of Historic
Places as a Traditional Cultural Property. County Conservation Lands
At present a portion of Marsh Station Road, approximately four acres, is within Pima County preserve
lands in T17S, R17E, Section 1.
Existing Deficiencies
Current deficiencies in terms of cultural resources in this planning area primarily concern conservation
and management
• The lack of resources to acquire conservation lands.
• The lack of current survey data.
• The need for managing and monitoring significant cultural resources so that
archaeological sites are not destroyed through pot-hunting and historic buildings are not
neglected and destroyed.
• The need to conserve significant cultural resources (traditional cultural properties,
historic sites, and archaeological sites) and protect these resources from being destroyed.
Potential Remedies and Projects
This area is characterized by diverse cultural resource types. Supporting conservation and designating
conservation areas are efforts that would make a substantial difference in cultural resources preservation.
Submitting the research and documentation needed to list significant standing historic structures,
archaeological and historic districts, and Traditional Cultural Properties in the National Register of Historic
Places is an important step in the preservation and management of cultural resources.

L a n d U s e D i s t r i b u t i o n , A n a l y s i s
a n d C u r r e n t C o n d i t i o n s
A3.68 | P a g e A p p e n d i x A : B a c k g r o u n d a n d C u r r e n t C o n d i t i o n s
Southeast Planning Area (7)
The Southeast planning area has been populated for many thousands of years. Prehistorically, populations
peaked during the period between A.D. 200 and A.D. 1300. Certain parts of the landscape appear to have
been more heavily utilized than others. The degree of archaeological sensitivity within this planning area
varies across the landscape. Archaeological sensitivity is based on a variety of factors including the
presence of documented archaeological and historic sites and Priority Cultural Resources. Based on what
is known from cultural resources surveys, the area with the greatest archaeological sensitivity and
prehistoric occupation is associated with the Santa Cruz River, where surface water was historically
available.
Only about a third of the planning area has been surveyed or inventoried for cultural resources. Previously
surveyed areas were conducted on non-contiguous portions of land and little is known about the cultural
resources status in un-surveyed areas. For those areas that have been surveyed, most were inventoried
over 20 years ago and, on the whole, were motivated by the need to inventory cultural resources in
advance of development. Within the area, 643 archaeological or historic sites have been identified.
Priority Cultural Resources (archaeological and historic sites) have also been identified within the area.
Priority Archaeological Complexes
• Zanardelli Priority Archaeological Site Complex.
• Middle Santa Cruz Priority Archaeological Site Complex.
• Continental Madera Priority Archaeological Site Complex.
• Santa Rita Priority Archaeological Site Complex.
Priority Historic Sites
• The Historic Community of Sahuarita (1911).
• The Ghost Town of Helvetia (1899).
• Old Nogales Highway. This historic road was significant during the late Historic (A.D. 1900
– 1950) time period.
Central Planning Area (8)
Within this planning area, the high archaeological sensitivity zone occurs in association with prehistoric
and historic settlement near the Rillito River, Santa Cruz River, and in the immediate vicinity of downtown
Tucson where settlement has been continuous for 4,000 years. The settlement pattern throughout history
shows that these localized areas were intensively occupied. To the east and south of these major rivers,
the majority of the land included in this area, is within a moderate or low archaeological sensitivity zone.
The planning area includes the origins of the modern city of Tucson, first identified by Spanish missionary,
Fr. Eusebio Francisco Kino in the 1690s as San Cosme del Tucson, named after the Piman village of

L a n d U s e D i s t r i b u t i o n , A n a l y s i s
a n d C u r r e n t C o n d i t i o n s
A3.69 | P a g e A p p e n d i x A : B a c k g r o u n d a n d C u r r e n t C o n d i t i o n s
“stjukshon” that he encountered at the base of Sentinel Peak. With the establishment of a mission at
stjukshon and a military presidio east of the Santa Cruz River, Tucson became the northernmost outpost
of New Spain and what has become the core of downtown Tucson today. This planning area evidences
both archaeologically and through its historic neighborhoods, the initial settlement, sequential
development, and expansion of the City as it spread northward and southward along the Santa Cruz River
and eastward encompassing virtually the entire Tucson valley. Today, there are 30 City historic districts
listed in the National Register of Historic Places that reflect the development of Tucson as shown in the
attached table and map.
There has been a great deal of research over the past 20 years on the archaeological and historical
settlements characterizing the areas associated with the Rillito River, Santa Cruz River and downtown
Tucson. Many of these significant sites evident in the built environment or with substantial surface
indicators had been previously identified and recorded even prior to the extensive use of systematic
survey in contract archaeology. As modern downtown Tucson development increased, however, more
surveys, archaeological investigations, and historic property inventories were conducted. The majority of
the significant cultural resources are found within localized areas. At least half of the area, between
downtown Tucson and the Rillito River, is within a zone of low archaeological sensitivity. Fewer surveys
have been conducted and few significant sites have been recorded in this low sensitivity region. The
southernmost portion, which accounts for approximately 1/3 of the total area of this planning area, is
within a zone of moderate archaeological sensitivity. Priority Cultural Resources (archaeological and
historic sites) within the area are places of such extraordinary importance to the history and culture of
the people of Pima County and that their conservation is of utmost concern. These previously documented
resources are significant places on the landscape and known to contain material remnants of ancient
and/or historic cultures.
Priority Archaeological Site Complexes
River Confluence Complex
Middle Santa Cruz Complex
Downtown Tucson Complex
Priority Historic Sites and Priority Archeological Sites
A total of 115 priority priority historic sites and six priority archeological sites have been identified in this planning area. These sites are listed in the Pima County Infrastructure Study. County Conservation Lands
County conservation lands in the planning area primarily consist of relatively small areas of land areas
focused on historic buildings and conservation easements within historic and archaeological sites. Some
of these conservation areas include Hodges Ruin, Dunbar School, Roy Place building, 1927 County

L a n d U s e D i s t r i b u t i o n , A n a l y s i s
a n d C u r r e n t C o n d i t i o n s
A3.70 | P a g e A p p e n d i x A : B a c k g r o u n d a n d C u r r e n t C o n d i t i o n s
Courthouse, Wilmot Library, School for Performing Arts, San Pedro Chapel, and future acquisition of the
Chicanos por la Causa building.
National Register of Historic Places- Historic Districts
• Feldmans (Speedway-Drachman)
• Sam Hughes Residential
• West University
• John Spring Neighborhood
• University of Arizona Campus
• Indian House Residential
• El Montevideo Residential
• El Encanto Estates Residential
• Pie Allen Residential
• El Encanto Apartments
• Iron Horse Expansion
• Colonia Solana Residential
• Fort Lowell Multiple Resource Area
• El Presidio
• Armory Park Residential
• Barrio Libre
• Aldea Linda Residential
• Barrio El Hoyo
• Barrio El Membrillo
• Blenman-Elm
• Catalina Vista
• Barrio Santa Rosa
• Harold Bell Wright Estates
• Jefferson Park
• Rincon Heights
• San Clemente
• Winterhaven
• Tucson Warehouse
• El Presidio
• Barrio Anita
Existing Deficiencies
Current deficiencies in terms of cultural resources in the planning area primarily concern conservation.
L a n d U s e D i s t r i b u t i o n , A n a l y s i s
a n d C u r r e n t C o n d i t i o n s
A3.71 | P a g e A p p e n d i x A : B a c k g r o u n d a n d C u r r e n t C o n d i t i o n s
• The lack of resources to conserve, restore, document, and rehabilitate known historic
sites, buildings, and archaeological sites on both County-owned and non-County-owned
lands in Downtown Tucson.
• The lack of resources to manage known, significant cultural resources on County
conservation lands
• The lack of preservation of significant cultural resources through development which
cannot avoid impacts to sites
• The inadequacy of the level of our current inventory status in the low and moderate
sensitivity areas and a need for continued documentation or research in high sensitivity
areas.
Potential Remedies and Projects
• Of most urgency is the need to conserve, restore, document, and rehabilitate known
historic sites and buildings and known archaeological sites located within the Tucson
Downtown Priority Archaeological Site Complex. The County is actively rehabilitating
buildings it has acquired and has conservation easements through at least portions of
important archaeological and historic sites associated with the history of Tucson. Greater
funding is required to preserve, restore, and rehabilitate buildings. Funding from future
bonds and collaborating with nonprofit and private owners and the City of Tucson will
continue to be a necessary part in successful conservation of Downtown Tucson.
• There are some cases in which development cannot avoid impacts to significant
archaeological sites. In order to remedy this situation, a greater understanding of the
cultural resources within a region is helpful in being able to make development decisions
that can avoid or lessen the impacts early in the planning process of a development
project. Promoting greater use of restoration and rehabilitation in standing structures
and conservation easements in sites in this area is important. One excellent approach that
begins to address that we need programmatic ways of recognizing and treating the
significant historic and archaeological sites in the downtown Tucson area has been
developed by the City of Tucson Historic Preservation Office. This approach includes the
identification of “Sensitivity Zones” that include both archaeological and historic sites:
some of the earliest settlements in Tucson and major historic sites dating to the founding
of Tucson as a Spanish settlement. The Sensitivity Zones within Area 8 include the Court
Street Cemetery Zone, the Downtown Tucson City Center Zone, the Hardy-Fort Lowell
Zone, and a portion of the Stone Pipe Zone.
• In general, additional systematic surveys conducted to modern standards would be the
optimal approach to improve our understanding of the spatial distribution, quantity, and
type of cultural resources.

L a n d U s e D i s t r i b u t i o n , A n a l y s i s
a n d C u r r e n t C o n d i t i o n s
A3.72 | P a g e A p p e n d i x A : B a c k g r o u n d a n d C u r r e n t C o n d i t i o n s
Catalina Foothills Planning Area (9)
Approximately half of the planning area includes land in the Coronado National Forest. The area also
includes Pima County, Saguaro National Park (Rincon Mountain District), and private land. Much of the
area has not been surveyed for cultural resources. Out of the surveys that have been conducted, the
largest of the block surveys were conducted over 30 years ago. The area is characterized by the rugged
terrain in the Coronado National Forest and two major watersheds—Tanque Verde Wash and Sabino
Creek. Geological processes have likely altered the land surface over the past 30 years enough to change
the nature of the archaeological sites that can be seen on the surface. The existing survey data may now
be considered somewhat outdated, but many priority historic and archaeological sites that were identified
as a result of surveys have been part of comprehensive investigative projects.
Over one hundred archaeological sites are known to exist in the planning area. The large majority of the
previously identified sites are part of Priority Archaeological Site Complexes (SDCP) and in areas which
have been previously surveyed.
Priority Archaeological Site Complexes
• Tanque Verde Creek Complex
• Rincon Mountains Complex
• Rincon Creek Complex.
Priority Archaeological and Historic Sites
• Sabino Canyon Ruin
• Whiptail Ruin
• Agua Caliente Ranch
• University Indian Ruin
• 49er’s Site
• Houghton Road Site
• Bosque Site
• Tanque Verde Wash Site
• Emkay Site
• A7 Ranch
• Tohono Chul Park
• Catalina Foothills Estates
• St. Phillips in the Hills
• Agua Caliente Ranch
• Binghamption Rural Historic Landscape
• Campbell Avenue Farm
• Gallery in the Sun

L a n d U s e D i s t r i b u t i o n , A n a l y s i s
a n d C u r r e n t C o n d i t i o n s
A3.73 | P a g e A p p e n d i x A : B a c k g r o u n d a n d C u r r e n t C o n d i t i o n s
Historic Properties Listed on the National Register of Historic Places
• Lemmon Rock Lookout House
• Lowell Ranger Station
• Rillito Racetrack
• Charles Todd House
• Deep Well Ranch
• Fort Lowel Park/Hardy Site
• Ramada House
• Saint Phillip’s in the Hills Episcopal Church
Existing Deficiencies
Current deficiencies in terms of cultural resources in the planning area primarily concern conservation
and management.
• The lack of resources to conserve known archaeological sites and acquire conservation
lands.
• The lack of current survey data.
• The lack of preservation of significant cultural resources through development which
cannot avoid impacts to sites.
• The need for managing and monitoring significant cultural resources so that
archaeological sites are not destroyed through pot-hunting and historic buildings are not
neglected and destroyed.
Potential Remedies and Projects
The area encompasses significant historic and prehistoric cultural resources. The area is characterized by
diverse cultural resource types. Supporting conservation and designating conservation areas are efforts
that would make a substantial difference in cultural resources preservation.
One example includes County efforts in nominating historic buildings for listing in the National Register
for Historic Places (NRHP). For instance, multiple properties (The Architecture and Planning of Josias
Joesler and John Murphey in Tucson, Arizona, 1927-1956) have been listed on the NRHP.
Historic property types include single and multifamily residences, commercial projects, institutional
buildings, and districts. One example is the Catalina Foothills Estates, a project which began in 1928 with
the purchase of 7,000 acres of land to be developed into hacienda style homes with open patios and
stylistic features that used the topography, view, and vegetation to best advantage. Additional buildings
designed by Joesler are currently being nominated for listing in the NRHP. Listing such significant standing
structures is an important step in the preservation and management of historic properties.

L a n d U s e D i s t r i b u t i o n , A n a l y s i s
a n d C u r r e n t C o n d i t i o n s
A3.74 | P a g e A p p e n d i x A : B a c k g r o u n d a n d C u r r e n t C o n d i t i o n s
Rincon Valley Planning Area (10)
This planning area includes land owned by Saguaro National Park, State Trust Land, National Forest,
private lands, and Pima County lands. Archaeological research has defined the areas of high archaeological
sensitivity (SDCP) along the Pantano Wash, Cienega Creek, and Rincon Wash.
Portions of the planning area have been surveyed for cultural resources. The largest of the surveys in the
area were carried out over 20 years ago. These include the Saguaro National Monument, Rocking K Ranch,
Coyote Creek, Vail, and Colossal Cave surveys. Several hundred archaeological sites are known to exist in
this area. The large majority of the previously identified sites are in Priority Archaeological Site Complexes
(SDCP). Three Priority Archaeological Site Complexes (Rincon Mountains, Rincon Creek, and Lower
Cienega Creek) are within this planning area. Two districts listed on the National Register of Historic
Places, the southern portion of the Rincon Mountain Foothills Archaeological District and the Colossal
Cave Preservation Park Historic District are found in the planning area.
Priority Archaeological Site Complexes
• Rincon Mountains Priority Archaeological Site Complex
• Rincon Creek Priority Archaeological Site Complex
• Lower Cienega Creek Complex
Priority Archaeological and Historic Sites
• Loma Alta Site
• Pantano Townsite
• Cienega Stage Station
• Marsh Station Road
• Manning Camp
• Colossal Cave
• Cienega Bridge
County Conservation Lands
At present, the Cienega Stage Stop, Marsh Station Road, and Pantano Townsite are on County
Conservation lands.
Existing Deficiencies
Current deficiencies in terms of cultural resources in this planning area primarily concern conservation
and management, as well as heritage education and public interpretation.
• The lack of resources to conserve and protect known archaeological sites.

L a n d U s e D i s t r i b u t i o n , A n a l y s i s
a n d C u r r e n t C o n d i t i o n s
A3.75 | P a g e A p p e n d i x A : B a c k g r o u n d a n d C u r r e n t C o n d i t i o n s
• The lack of resources to manage known, significant cultural resources on County
conservation lands.
• The lack of preservation of significant cultural resources through development which
cannot avoid impacts to sites.
Potential Remedies and Projects
The planning area encompasses significant historic and prehistoric cultural resources. The sites have
information that can reveal large-scale and long-term patterns of economic, social, and cultural processes.
Potential remedies that would make a substantial difference in cultural resources preservation would
include the acquisition of conservation lands, supporting conservation efforts and designating
conservation areas.
As large portions of the area are already known to contain significant cultural resources, projects and
programs supporting the management of the resources and the lands are necessary projects. At present,
site steward volunteers with the Arizona Site Stewards Program monitor significant archaeological sites
in the Lower Cienega Creek Priority Archaeological Site Complex on a weekly basis (between four and six
sites in one day). They report their results in a database managed by Arizona State Parks and send written
reports to the Regional Coordinator and the Pima County cultural resources coordinator for the sites
stewards program. Site stewards also volunteer their time in outreach programs and education to the
public to enhance awareness for the importance of site preservation.
Tortolita Planning Area (11)
This planning area includes land owned by Pima County, Town of Marana, Coronado National Forest, Oro
Valley, Catalina State Park, and Tortolita Mountain Park. Diverse landscapes including the Santa Cruz River
floodplain, the Cañada del Oro Wash, piedmont or bajada, and the more rugged uplands of the Northern
Tucson Basin characterizes an area that has also been intensively occupied for thousands of years.
Archaeological research has defined a large portion of Planning This planning area is a zone of “high
archaeological sensitivity” (SDCP), especially areas associated with prehistoric settlement along Santa
Cruz River and in the uplands. At least 30 years of research conducted through both cultural resources
surveys and more focused investigations on archaeological settlements have been carried out in the area.
In contrast to other areas in Pima County, the great majority of land in the area has been covered by
cultural resources survey—particularly by extensive and large block surveys conducted over 20 years ago.
Topographic restraints and focused research interests may have resulted in slightly less than 100%
coverage; however, surveys have contributed greatly to our understanding of the settlement patterns and
history in the planning area. More recently, a block survey covered 1,422 acres of ASLD state trust land in
the rugged terrain of the Tortolita Mountains, likely to be auctioned in the near future and potentially
acquired for conservation purposes. As expected in the outcrops and hills of this portion of the planning
L a n d U s e D i s t r i b u t i o n , A n a l y s i s
a n d C u r r e n t C o n d i t i o n s
A3.76 | P a g e A p p e n d i x A : B a c k g r o u n d a n d C u r r e n t C o n d i t i o n s
area, a variety of sites spanning prehistoric through the historic period were identified during this survey
(O’Mack, et. al. June 2012) conducted by William Self Associates, Inc.
Several hundred archaeological sites are known to exist in the planning area. The large majority of the
previously identified sites are in Priority Archaeological Site Complexes (SDCP).
Priority Archaeological Site Complexes
• River Confluence Complex
• Middle Santa Cruz Complex
• Marana Mound Complex
• Los Morteros Complex
• Wild Burro Canyon Complex
• Honey Bee Complex
• Upper Sutherland Wash Complex
Priority Archaeological Sites
• Sutherland Wash Site
• Marana Mound
• Honeybee Village
• Romero Ruin
• Steam Pump Ranch
• Cortaro Fan Site
• Dairy Site
• Las Capas
County Conservation Lands
• Steam Pump Ranch Site – Conservation Easement on site owned by Oro Valley
• Sutherland Wash Site – Coronado National Forest
• Honey Bee Village – Fee Simple – owned by Pima County
• Romero Ruin– Catalina State Park – owned by Coronado National Forest
Existing Deficiencies
Current deficiencies in terms of cultural resources in the planning area primarily concern conservation
and management, as well as heritage education and public interpretation.
• The lack of resources to conserve known archaeological sites, such as the Marana
Mound site.
• The lack of resources to manage known, significant cultural resources on County
conservation lands.

L a n d U s e D i s t r i b u t i o n , A n a l y s i s
a n d C u r r e n t C o n d i t i o n s
A3.77 | P a g e A p p e n d i x A : B a c k g r o u n d a n d C u r r e n t C o n d i t i o n s
• The lack of preservation of significant cultural resources through development which
cannot avoid impacts to sites.
• Need to conserve prehistoric settlement systems, such as Marana Mound complex,
which also exists along a popular utility corridor.
• The lack of resources for completing rehabilitation of Steam Pump Ranch for use as a
public facility.
• The lack of resources for walking trails and interpretation of Honey Bee Village and Los
Morteros as heritage education sites.
Potential Remedies and Projects
The planning area encompasses significant historic and prehistoric cultural resources. This area is unique,
however, in that entire prehistoric settlements on a regional level still exist. The sites have information
that can reveal large-scale and long-term patterns of economic, social, and cultural processes in the
Northern Tucson Basin. Potential remedies include purchasing of vast open space lands for preservation
purposes. If acquiring large blocks of land is not possible, supporting conservation efforts and designating
conservation areas are efforts that would make a substantial difference in cultural resources preservation.
As large portions of the area are already known to contain significant cultural resources. Projects and
programs supporting the management of the resources and the lands such as the the Arizona Site
Stewards Program are necessary. At present, site steward volunteers monitor significant archaeological
sites such as Sutherland Wash, Honey Bee Village, and Los Morteros on a bi-weekly basis. They report
their results in a data base managed by Arizona State Parks and send written reports to the Regional
Coordinator and the Pima County cultural resources coordinator for the sites stewards program. Site
stewards also volunteer their time in outreach programs and education to the public to enhance
awareness for the importance of site preservation.
San Pedro Planning Area (12)
This planning area is bounded on the north and east by the Cochise, Graham, and Pinal County lines and
on the west by the Coronado National Forest ridge line. Much of the land is controlled by the Coronado
National Forest, Arizona State Land Department, and Saguaro National Park. Very little of the area has
been surveyed. Most of the surveys in the area have focused on the Redington area and Oracle Ridge
Mine.
Low archaeological sensitivity areas are associated with the western portion of the area in the Coronado
National Forest. Previously identified archaeological sites also cluster along the banks of the San Pedro
River.

L a n d U s e D i s t r i b u t i o n , A n a l y s i s
a n d C u r r e n t C o n d i t i o n s
A3.78 | P a g e A p p e n d i x A : B a c k g r o u n d a n d C u r r e n t C o n d i t i o n s
Priority Archaeological Site Complex
• Redington Complex
Priority Archaeological Sites
• Greaterville
• Rosemont Townsite
• Donaldson Site
• Total Wreck Mine
• Marsh Station Road
Priority Historic Sites
• Kentucky Camp
• Empire Ranch
Historic Properties Listed on the National Register of Historic Places
• Kentucky Camp
• Empire Ranch
• Empirita Cattle Ranch Rural Historic District
Traditional Cultural Property
This planning area also encompasses a portion of the Santa Rita Mountains, located in the Coronado
National Forest that is known to the Tohono O’odham Nation as Ce:wi Duag, “Long Mountain”. Ce:Wi
Duag is considered a Traditional Cultural Property to the Tohono O’odham Nation. Documentation on
Ce:wi Duag for listing on the National Register of Historic Places as a Traditional Cultural Property, have
been submitted to the State Historic Preservation Office and are currently under review.
County Conservation Lands
At present a portion of Marsh Station Road, approximately four acres, is within Pima County preserve
lands in T17S, R17E, Section 1.

L a n d U s e D i s t r i b u t i o n , A n a l y s i s
a n d C u r r e n t C o n d i t i o n s
A3.79 | P a g e A p p e n d i x A : B a c k g r o u n d a n d C u r r e n t C o n d i t i o n s
Existing Deficiencies
Current deficiencies in terms of cultural resources in the planning area primarily concern conservation of
Traditional Cultural Properties and archaeological sites and management of historic ranches.
• The lack of resources to acquire conservation lands.
• The lack of current survey data.
• The need for managing and monitoring significant cultural resources.
• The need to conserve significant cultural resources (traditional cultural properties,
historic sites, and archaeological sites) and protect these resources from being destroyed.
Potential Remedies and Projects
The area is characterized by diverse cultural resource types. Supporting conservation and designating
conservation areas are efforts that would make a substantial difference in cultural resources preservation.
Submitting the research and documentation needed to list significant standing historic structures,
archaeological and historic districts, and Traditional Cultural Properties in the National Register of Historic
Places is an important step in the preservation and management of cultural resources.
Ajo-Why Planning Area (13)
Ajo, Arizona is the main gateway to Organ Pipe Cactus National Monument. The historic architecture of
its the central plaza is one example of its many historic buildings. In 2012, the Ajo site stewards became
active in the area. Much of the 2012-2013 seasons’ focused were be border-related. Of the Organ Pipe
and Cabeza Prieta land holdings less than 10% have been surveyed for archaeological sites and none of
the most heavily impacted areas were examined at all. Over the last four years the Ajo Site Stewards have
helped conduct surveys in those areas and numerous sites have been discovered and extensive evidence
of shell jewelry production has been located and recorded. Many of these sites have been cut by new
two-tracks and roads, and some of them quite severely. The Ajo Site Stewards have also been asked to
intensify site monitoring in some areas on the Barry M. Goldwater Range. Detailed analysis of some of
these sites under the supervision of range archaeologist Adrianne Rankin will likely occur.

L a n d U s e D i s t r i b u t i o n , A n a l y s i s
a n d C u r r e n t C o n d i t i o n s
A3.80 | P a g e A p p e n d i x A : B a c k g r o u n d a n d C u r r e n t C o n d i t i o n s
Cultural Resources Heritage Education and Outreach
Outreach is one facet in the implementation of long-term preservation. Pima County has been committed
to providing outreach, which include opportunities in education, community and professional
involvement, partnerships with outside agencies and organizations, activities, presentations, and reports.
Public education is an important aspect of contributing to facilitating local communities to become
actively involved in preservation of cultural resources. Pima County has been involved in areas of public
education of cultural resources and shall continue to provide leadership in bringing the goals of cultural
resources preservation to the public in a way that encourages active participation. Participation includes
different levels of interest and involvement, including for the general public, for avocational and trained
volunteers, and for the professional cultural preservationists, including partnerships with non-profit
organizations https://www.oldpueblo.org/ that provide both formal technical archaeological training and tours
on County-owned lands, providing positions and relevant work experience for college interns from the
University of Arizona participation in the annual state-wide Archaeology Expo http://azstateparks.com/archy/
and the Arizona Historic Preservation Conference https://azpreservation.com/ . Pima County is continuing to
update the website and the web page for Cultural Resources & Historic Preservation Division is a starting
point for the public to find avenues for education through County projects and partnerships,
http://webcms.pima.gov/cms/One.aspx?portalId=169&pageId=51010.
Cultural Resources and Historic Preservation Outreach and Volunteers
Pima County has developed an important management role in the Arizona Site Stewards Program. Site
stewards are trained and certified by the State Historic Preservation Office and the Governor’s
Archaeology Advisory Commission http://www.azsitestewardprogram.com/. Site stewards for the Tucson area
monitor cultural resources on Pima County lands and report to an Arizona State Parks database and the
land manager on the physical condition of cultural resources, assisting with land management on the
Valencia site, Dakota Wash, Los Morteros, Honey Bee Village, and the cultural resources located in the
Cienega Creek Natural Preserve.
Cultural Resources and Historic Preservation for New Development
Actions under Chapter 18.81 (grading standards) require that private development projects subject to
cultural resources requirements include mitigation. Preservation and avoidance is the preferred
mitigation strategy. Current DSD process assists in this goal because cultural resources review has been
occurring as early as possible in the development review process making more options possible for
construction projects. There is a need to develop incentives to assist developers in preserving cultural
resources whenever possible.

L a n d U s e D i s t r i b u t i o n , A n a l y s i s
a n d C u r r e n t C o n d i t i o n s
A3.81 | P a g e A p p e n d i x A : B a c k g r o u n d a n d C u r r e n t C o n d i t i o n s
Preservation and Maintenance of Community Traditions
Pima County provides the setting for today’s culturally and ethnically diverse population in a dynamic and
rapidly growing mix of urban, rural, municipal, and tribal relationships that today continue the traditions
that reach back through layers of shared history into the deep prehistoric past. Each layer preserves its
unique character while connecting with the common threads of life and community in the desert, linking
our shared traditions and collective sense of identity. The County is composed of a mix of cultural and
historic landscapes, featuring the open vistas of rural landscapes juxtaposed with expanding urban
landscapes supporting diverse communities and micro-communities. Open spaces preserve the wide
range of natural and cultural environments, which include thousands of prehistoric and historic
archaeological sites marking past human life ways. Ranch lands and rural communities define historic
working landscapes and combine a firmly rooted sense of place and continuity of traditions. The built
environments of urban landscapes also provide a strong sense of place and community with tangible links
to the past defined by historic buildings and structures that define the unique character of private and
public places and link them to the contemporary urban environment.
Effective long-range development requires important planning tools like the County’s regional
infrastructure planning program and other tools to consider effects of development and strategies to
preserve and protect the County’s cultural resources through:
a. the identification of significant cultural resources in both rural and urban landscapes; and
b. the development of incentives to encourage the conservation and in-place preservation of
cultural resources within the County.
Registers can provide local historic properties and districts with appropriate levels of recognition for their
archaeological and historic significance for planning and conservation prestige. The criteria for nomination
to the Registers are based on the National Register Criteria of Significance, as adapted under Policy 1b.
Pima County Register of Historic Places. Pima County has more than 100 properties currently listed on the
National Register. They include a diverse range of resources, including archaeological sites, historic sites
and structures, religious shrines and churches, military installations, historic neighborhoods, and historic
structures representing the County’s unique architectural heritage. The County will ensure the
preservation of those properties listed on the Registers and will nominate additional sites when
appropriate. Providing public access to the listed properties can be accomplished by posting the County
Register on the County Office of Sustainability and Conservation website and providing links to the State
and National Registers’ websites. OSC will manage the County Register to ensure timely updates to the
list.
Development of incentives to encourage the conservation and in-place preservation and protection of the
County’s cultural resources is an on-going priority. Cultural resources tax incentive programs are available
at the state and federal levels and County staff should facilitate private participation; development of
opportunities at the local level will continue to be on-going priority. Public projects such as the Agua

L a n d U s e D i s t r i b u t i o n , A n a l y s i s
a n d C u r r e n t C o n d i t i o n s
A3.82 | P a g e A p p e n d i x A : B a c k g r o u n d a n d C u r r e n t C o n d i t i o n s
Caliente Ranch and the Colossal Cave rehabilitations are examples of Pima County voters supporting
preservation with community funding. In addition to historic preservation expertise, critical architectural,
engineering and other technical expertise, contribute to the preservation of these irreplaceable
properties. Additional incentives to owners of local historic properties should be explored, such as tax
benefits or technical assistance to achieve preservation goals.
Cultural Resources Protection Ordinance
Past County efforts have attempted to revise and adopt a revised comprehensive Cultural Resources
Historic Zone overlay. However, the political realities under Proposition 207 hinder such efforts today.
The preservation goal of establishing this zone remains valid, as outlined in the 2002 Comprehensive Plan,
Addendum, to provide a voluntary protection mechanism for properties not covered by other zoning
designations. Special landscapes in the County such as rural working Ranch landscapes and Open Space
could be protected without hindering property owners’ abilities to manage and use their properties. Other
examples of properties that would benefit include individual buildings, corridors or linkages between
communities, traditional cultural properties and sacred sites, and rural communities.
Adaptive Use of Cultural Resources
The County prefers adaptive use, or re-use, of historic resources, buildings, and structures over demolition
or significant alteration of the resource, whenever possible. This can be accomplished by preservation and
rehabilitation of historic resources for compatible uses. Pima County will apply this policy to appropriate
County-owned buildings.

Planning Area Boundary
EXHIBIT 3.1.cExisting Land Use
September 2013
L a n d U s e D i s t r i b u t i o n , A n a l y s i sa n d C u r r e n t C o n d i t i o n s
A3.83 | P a g e A p p e n d i x A : B a c k g r o u n d a n d C u r r e n t C o n d i t i o n s

EXHIBIT 3.1.dExisting Land Use
September 2013
L a n d U s e D i s t r i b u t i o n , A n a l y s i sa n d C u r r e n t C o n d i t i o n s
A3.84 | P a g e A p p e n d i x A : B a c k g r o u n d a n d C u r r e n t C o n d i t i o n s

Planning Area Boundary
EXHIBIT 3.1.eCurrent Zoning
September 2013
L a n d U s e D i s t r i b u t i o n , A n a l y s i sa n d C u r r e n t C o n d i t i o n s
A3.85 | P a g e A p p e n d i x A : B a c k g r o u n d a n d C u r r e n t C o n d i t i o n s

EXHIBIT 3.1.fCurrent Zoning
September 2013
L a n d U s e D i s t r i b u t i o n , A n a l y s i sa n d C u r r e n t C o n d i t i o n s
A3.86 | P a g e A p p e n d i x A : B a c k g r o u n d a n d C u r r e n t C o n d i t i o n s

A d d i t i o n a l R e f e r e n c e M a p s
EXHIBIT 3.1.gPlanned Land Use-2001
Comprehensive Plan (as amended)
April 2013
Planning Area Boundary
A3.87 | P a g e A p p e n d i x A : B a c k g r o u n d a n d C u r r e n t C o n d i t i o n s

A d d i t i o n a l R e f e r e n c e M a p s
EXHIBIT 3.1.hPlanned Land Use
April 2013
A3.88 | P a g e A p p e n d i x A : B a c k g r o u n d a n d C u r r e n t C o n d i t i o n s

Planning Area Boundary
EXHIBIT 3.1.iDistrict Overlays
April 2013
L a n d U s e D i s t r i b u t i o n , A n a l y s i sa n d C u r r e n t C o n d i t i o n s
A3.89 | P a g e A p p e n d i x A : B a c k g r o u n d a n d C u r r e n t C o n d i t i o n s

EXHIBIT 3.1.jDistrict Overlays
April 2013
L a n d U s e D i s t r i b u t i o n , A n a l y s i sa n d C u r r e n t C o n d i t i o n s
A3.90 | P a g e A p p e n d i x A : B a c k g r o u n d a n d C u r r e n t C o n d i t i o n s
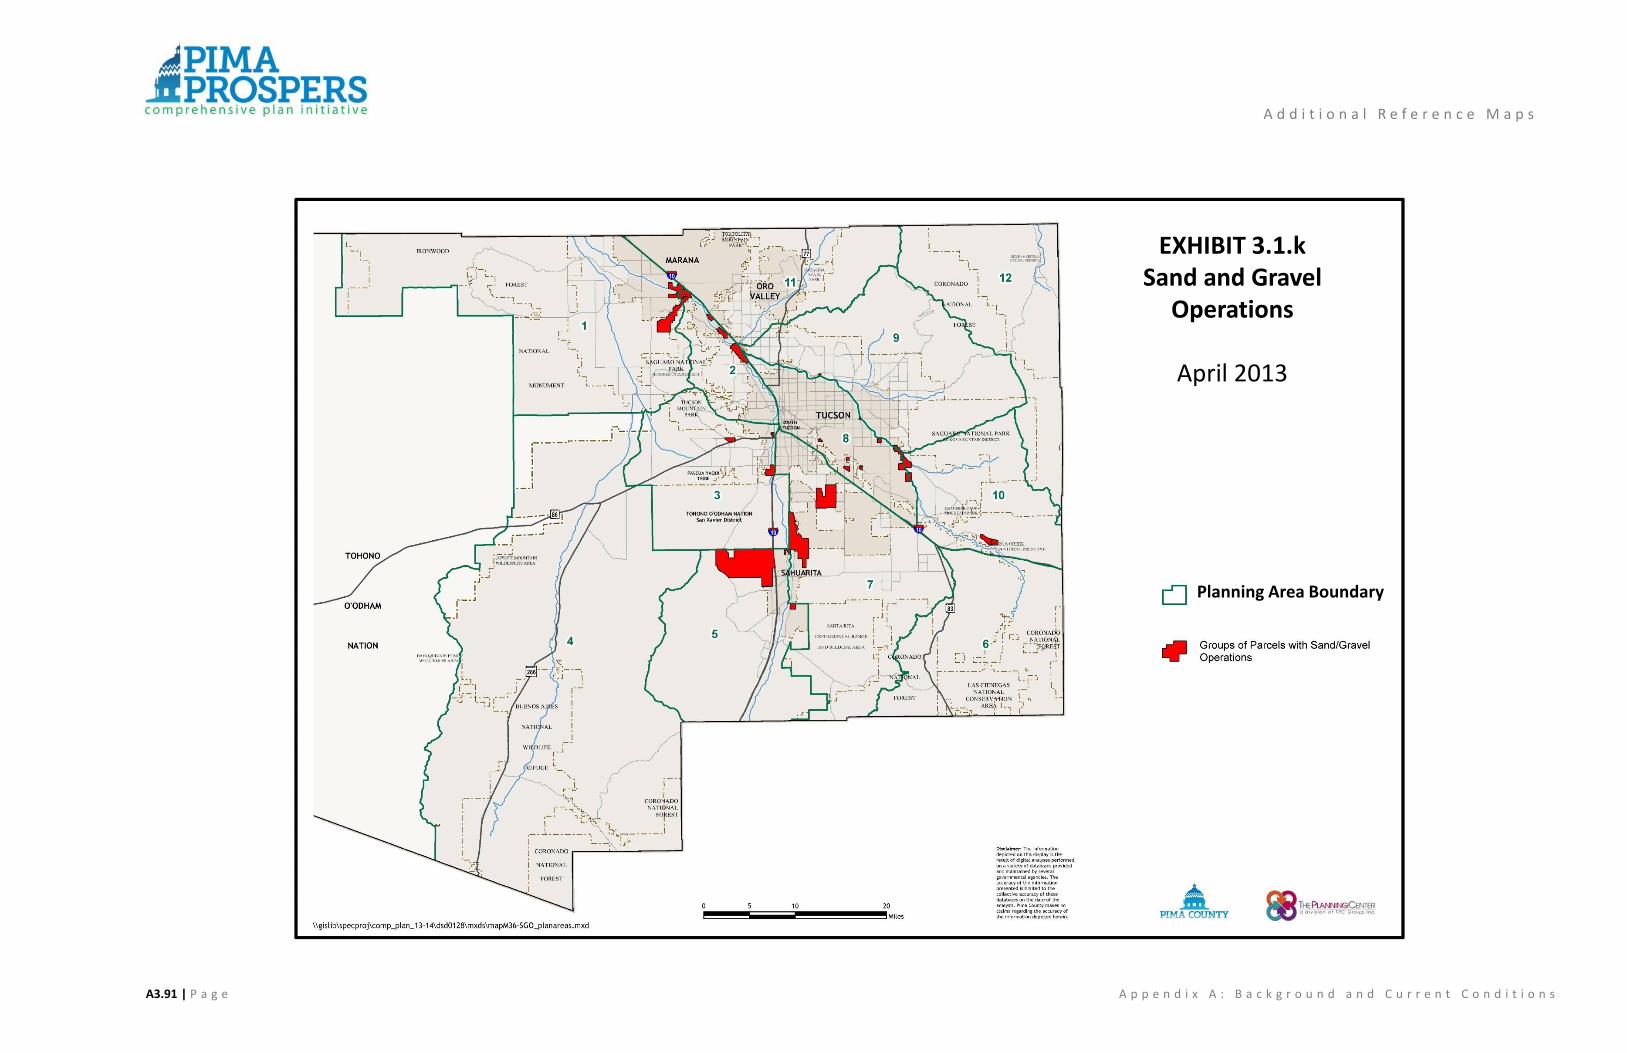
A d d i t i o n a l R e f e r e n c e M a p s
Planning Area Boundary
EXHIBIT 3.1.kSand and Gravel
Operations
April 2013
A3.91 | P a g e A p p e n d i x A : B a c k g r o u n d a n d C u r r e n t C o n d i t i o n s

A d d i t i o n a l R e f e r e n c e M a p s
EXHIBIT 3.1.lSand and Gravel
Operations
April 2013
A3.92 | P a g e A p p e n d i x A : B a c k g r o u n d a n d C u r r e n t C o n d i t i o n s

EXHIBIT 3.1.mMilitary Airports
April 2013
L a n d U s e D i s t r i b u t i o n , A n a l y s i sa n d C u r r e n t C o n d i t i o n s
A3.93 | P a g e A p p e n d i x A : B a c k g r o u n d a n d C u r r e n t C o n d i t i o n s

A d d i t i o n a l R e f e r e n c e M a p s
Planning Area Boundary
EXHIBIT 3.4Transfer of Development Rights (TDR) Sending and
Receiving Areas
April 2013
A3.94 | P a g e A p p e n d i x A : B a c k g r o u n d a n d C u r r e n t C o n d i t i o n s
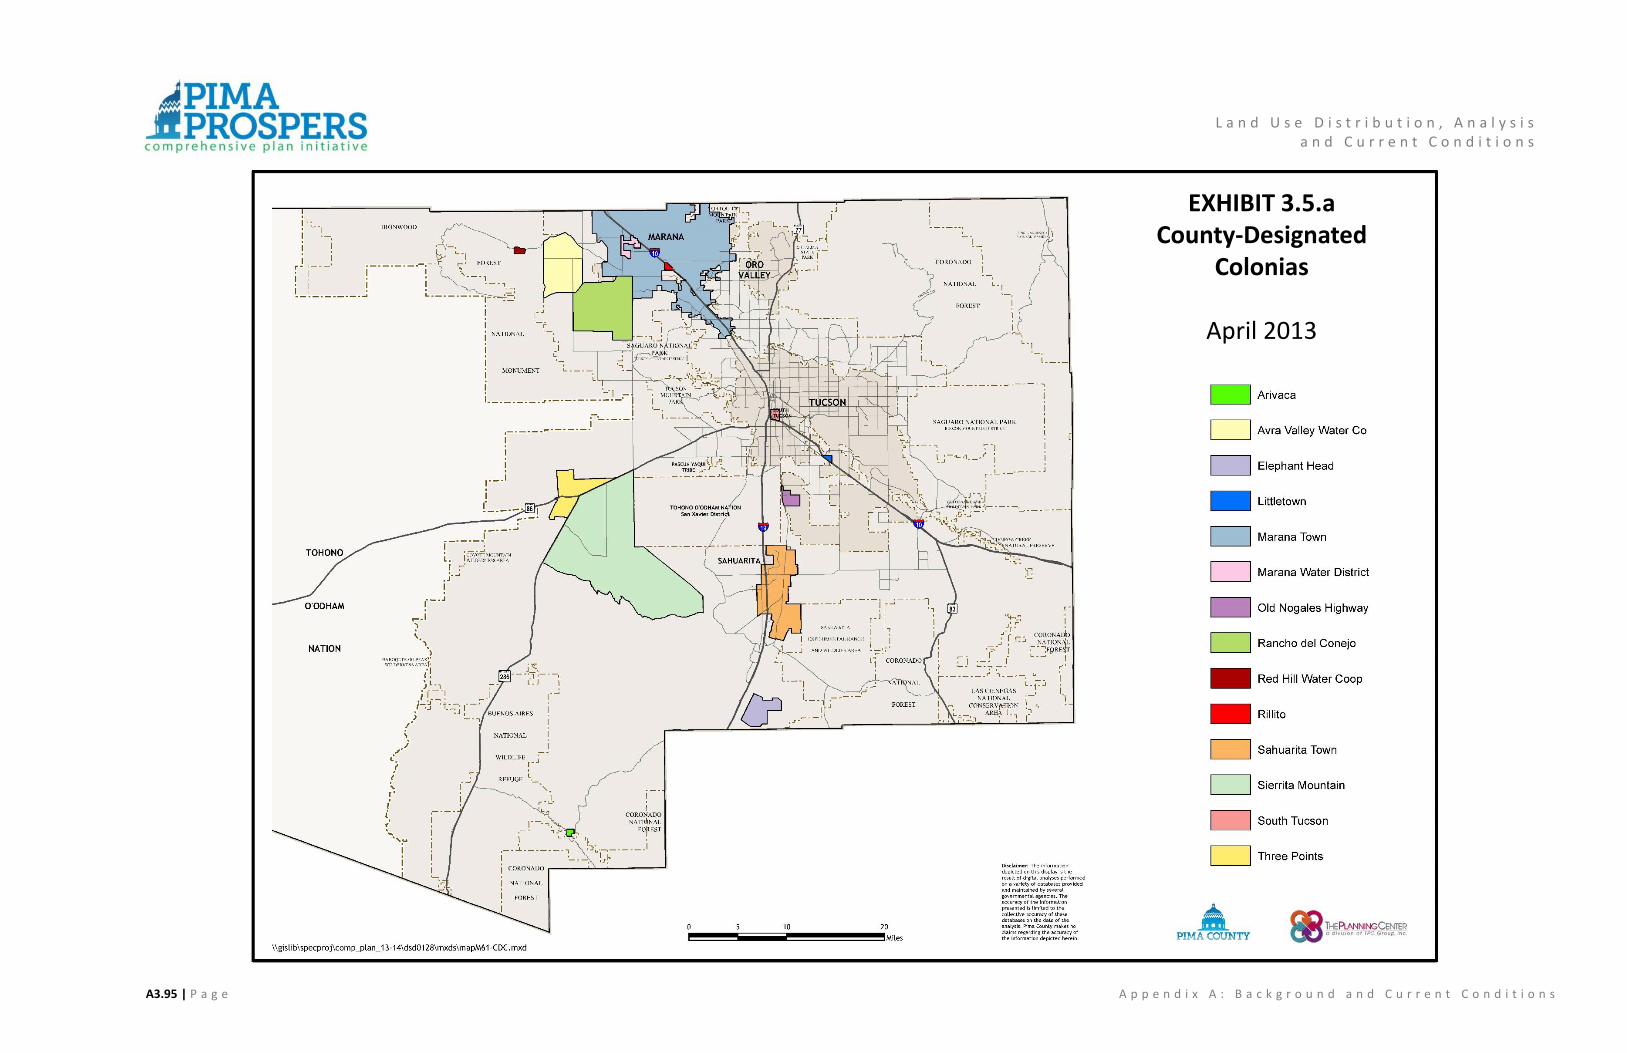
EXHIBIT 3.5.aCounty-Designated
Colonias
April 2013
L a n d U s e D i s t r i b u t i o n , A n a l y s i sa n d C u r r e n t C o n d i t i o n s
A3.95 | P a g e A p p e n d i x A : B a c k g r o u n d a n d C u r r e n t C o n d i t i o n s

EXHIBIT 3.5.bCounty-Designated
Colonias
April 2013
L a n d U s e D i s t r i b u t i o n , A n a l y s i sa n d C u r r e n t C o n d i t i o n s
A3.96 | P a g e A p p e n d i x A : B a c k g r o u n d a n d C u r r e n t C o n d i t i o n s

P h y s i c a l I n f r a s t r u c t u r e
C o n n e c t i v i t y B a c k g r o u n d
A4.1 | P a g e A p p e n d i x A : B a c k g r o u n d a n d C u r r e n t C o n d i t i o n s
Chapter 4: Physical Infrastructure Connectivity Background
Key Subjects
Transportation
Water Resources
Energy
Wastewater
Environmental: Air Quality and Solid Waste
Communications
Public Buildings and Facilities
Trails
Flood Control/Drainage
Infrastructure Concurrency
Important Notes:
1. At the time of the preparation of the infrastructure study that served as the core of this
background document, the Tohono O’odham Nation was treated as a planning area for
statistical purposes only. The Tohono O’odham Nation is a sovereign nation, and though
the County recognizes the importance of the Nation to the region, the County has no
jurisdiction over the Nation.
2. All Exhibits referenced in this chapter are included at the end of the chapter.
Physical Infrastructure
Connectivity
P h y s i c a l I n f r a s t r u c t u r e
C o n n e c t i v i t y B a c k g r o u n d
A4.2 | P a g e A p p e n d i x A : B a c k g r o u n d a n d C u r r e n t C o n d i t i o n s
4.1 Transportation
The County transportation system includes roadways and bridges, railways, bus transit systems, airports, bikeways and pedestrian facilities. The following sections describe each type of facility or system followed by a section describing transportation-related issues. This background assessment leads to the development of goals and policies included in the Policy Volume.
Facilities and Systems
Roadways The public roadway system includes Interstates 10 and 19, state highways, arterial and collector streets, local roadways and bridges, but the county is responsible for building and maintaining only those public roadways in the unincorporated areas that are not controlled by the state. This includes approximately 1,800 miles of roadways from unpaved rural roads to 6-lane urban arterials.
Bus and Public Transit Bus and public transit options for county residents are very limited outside the City of Tucson limits. Sun Shuttle operates nine routes that extend to various locations outside of Tucson including Green Valley and Sahuarita to the south and Marana and Oro Valley to the north. Dial-a-ride service is provided for individuals with disabilities and who live within eligible areas. Several SunTran routes - mostly the express routes - extend beyond the city limits to serve county residents. The lack of public transit makes mobility and access more difficult especially for those with lower incomes, the elderly and disabled. Public transit facilities also include bus stops, sidewalks, and bus pull-outs along the county roadway system.
Bicycle Facilities Bicycle facilities include both the existing roadway network as well as separate shared-use paths. Drivers are required by State law to “share the road” and safely pass cyclists on any street, but many major roadways have 5-6 foot paved shoulders for bicycles. Local streets are also part of the bicycle network, whether signed as bike routes or not. Approximately 3% of all commuting trips are by bicycle, which ranks Tucson 7th in the nation1. Cyclists and other non-motorized users can use paved shared-use paths if they want to avoid riding on streets. The best example is The Loop which surrounds metro Tucson via the Rillito River Park, Santa Cruz River Park, Pantano River Park, Julian Wash Greenway, and Harrison Greenway. The county also provides education and encouragement programs including the Safe Routes to Schools Program to encourage more school children to bike and walk to school.
1 The League of American Bicyclists, 2011

P h y s i c a l I n f r a s t r u c t u r e
C o n n e c t i v i t y B a c k g r o u n d
A4.3 | P a g e A p p e n d i x A : B a c k g r o u n d a n d C u r r e n t C o n d i t i o n s
Pedestrian Facilities Pedestrian facilities generally include sidewalks, crosswalks, traffic signals, paths and benches, bus stops, parking lots and the areas between vehicle parking areas and adjacent buildings. Crosswalk facilities include signalized intersections and specialized pedestrian-only traffic signals that stop traffic in one or both directions at a time to allow pedestrians to cross roadways in between intersections. Shared-use pathways such The Loop and the riverparks as well as walking and hiking trails are also a part of the county pedestrian system.
Aviation and Airports Public airports in Pima County include Tucson International Airport (TIA), Ryan Airfield, the Marana airport and La Cholla Airpark in Oro Valley. Pima County owns and operates the Ajo Municipal Airport in Ajo, Arizona. While Pima County is not directly involved in airport planning and operations, the TIA as well as the Davis-Monthan Air Force Base strongly impact the regional economy and impact county airspace and adjacent land development by restricting building heights in airport zones.
Rail, Freight and Shipping The Union Pacific Rail Road runs parallel to Interstate 10 and Interstate 19 to Mexico. Smaller rail spurs are associated with the Asarco Mine operations near Green Valley (along Pima Mine Road) and other locations. The intermodal Port of Tucson is located north of I-10 near Kolb Road along the main Union Pacific rail line. Planned expansion of the Port of Tucson will increase capacity for shipping more goods via rail. Increased trade with Mexico is anticipated which would increase trucking and potentially rail.
Transportation Issues
Several transportation related issues including roadway maintenance, safety and congestion have been raised at public meetings and expressed through public outreach efforts. These issues are discussed in this section and led to the development of transporation goals and policies which are part of the Policy Volume of the comprehensive plan.
Deteriorating Roadway Conditions County and city roads as a whole are not in great condition despite an aggressive capital improvement program which has widened and improved many arterial roadways since 1997. Approximately two-thirds of all roadways in the county are in poor or failing condition. Fixing these roads is a financial challenge, because many federal and regional (RTA) roadway funds can only be used to build new roads and cannot be spent on maintenance. State roadway funds have also declined. The county is currently spending approximately $23 million per year to fix the worst roadways, but total needs exceed $270 million. Alternative funding is needed to repair our roadways.
Improving Traffic Safety Roadway and traffic safety is one of the highest priorities for Pima County, which collects and tabulates crash statistics for all roadways and intersections so that deficiencies can be identified and addressed. Roadways with the highest crash rates are prioritized for improvements which can include widening

P h y s i c a l I n f r a s t r u c t u r e
C o n n e c t i v i t y B a c k g r o u n d
A4.4 | P a g e A p p e n d i x A : B a c k g r o u n d a n d C u r r e n t C o n d i t i o n s
shoulders, reducing hills and curves, installing pedestrian-activitated crossing signals and other techniques. Many older roadways are not designed to accommodate flooding, so access and safety are problems during summer monsoon and winter rains. Driver education is an ongoing effort to encourage drivers to stay out of washes and avoid texting while driving for example. Pima County has also been significantly involved in region wide efforts to reduce wildlife/vehicle collisions. Either through the County’s own project activities or in cooperation with other regional partners, startegies such as re-sizing culvert drainage features to facilitate passage of wildlife are being implemented on key roadways such as Silverbell and Tangerine Roads where wildlife mortality due to vehicle collisions is known to be a frequent occurrence. Pima County has also made financial contributions, as well as significant staff support, to the implementation of the first overpass crossing structure in southeast Arizona. This structure (along with other necessary amenities), has been made possible due primarily to funding allocations provided by the Regional Transportation Authority’s Wildlife Linkage funds and this structure, as well as the other key wildlife features, have been incorporated into the Arizona Department of Transportation’s SR 77 widening project. Incorporating the wildlife elements into the roadway project provided not only a great opportunity to maximize construction efficiencies, but also encompassed a critical wildlife connection between the Santa Catalina and Tortolita Mountains where wildlife mortality due to vehicle collision is significant, and would be expected to worsen due to the widened roadway.
Congestion and Capacity Traffic congestion in Tucson is ranked 15th in the United States but this includes all the roadways within the city limits as well as those within the unincorporated areas2. The city, county and PAG all monitor traffic congestion in part by collecting traffic counts on all major and minor roadways. Traffic counts that exceed roadway capacities provide an indicator of congestion problems and suggest where limited funding may be spent. Following an aggressive capital improvement program funded by the 1997 bond issue and the 2006 RTA, many regional roadways and intersections have been widened to mitigate congestion problems. A review of 178 major roadways segments in the county indicates that only twelve, or about 7%, have volumes that exceed capacity. Some of these segments, such as Houghton Road, are being widened. People are driving less now than in 2007. Similar state and national trends since 2006 have been explained by a number of factors, including the economic recession, increased gas prices, increased fuel efficiency, and fewer younger drivers. Whether or not this trend continues will determine in part where and when future transportation investments should be made. The rate, location, and density of land use development will continue to determine transportation needs and limitations on roadway capacity will increasingly influence land use decisions.
Providing Transportation Choices The County’s built environment is characterized by low-density residential areas with commercial development located along major arterial roadways. Commercial development is often more
2 Tom Tom Traffic Index, 2014

P h y s i c a l I n f r a s t r u c t u r e
C o n n e c t i v i t y B a c k g r o u n d
A4.5 | P a g e A p p e n d i x A : B a c k g r o u n d a n d C u r r e n t C o n d i t i o n s
concentrated at major intersections. As with many suburban and rural communities, many residential areas are not located close enough to commercial areas, employment, and other destinations to encourage walking versus driving. However, there is more interest in walking and bicycling as a means of healthy transport. Unfortunately, traditional zoning and street design discourages walking and instead promotes driving, even for relatively short trips. This is because zoning traditionally separates residential areas from non-residential areas and because subdivisions often do not connect to adjacent areas except via arterial streets. Subdivisions may have only one or two points of entry and exit and cul-de-sacs block off street connections to adjacent neighborhoods, shopping, and parks. A more open and connected street network supports walking and bicycling as convenient, safe, and healthy forms of transportation. Similarly, more flexible zoning allows residential areas to be located closer to shopping, work, and other destinations which make walking and bicycling a more viable means of personal transportation. (ref. Subdivision and Development Street Standards, p. 3.23-24).
Improving Public Health The linkage between transportation and public health has received an increasing amount of attention, as the nation searches to find more ways to address obesity and chronic disease. Americans spend more time in their vehicles, and school age children are walking and bicycling less than they did generations ago. This is a result of many factors such as suburbanization, cheaper housing located further away from city centers, longer driving distances, and safety concerns among others. Zoning laws historically separated housing areas from employment and commercial areas, resulting in people living further away from work, school, and shopping destinations. Transportation policies and investments historically focused on expanding roadway networks and traffic capacity with less focus on alternatives to driving. There is increasing demand for communities to provide more opportunities for walking and biking by making it easier and safer to walk and ride a bicycle instead of or in addition to driving. Roadways that integrate bicycle and pedestrian facilities can provide alternatives to driving, and communinities themselves can be located and designed to provide more opportunities to walk and bike. Changing settlement patterns and the way we develop our communities to make them more integrated will require changes to zoning and development standards so that people can live closer to work, school and shopping.
Promoting Economic Development and Equity Transportation investment and economic development go hand in hand. Investing in new roadways and improving existing facilities can stimulate economic development by providing the necessary infrastructure to support existing and growing businesses and attract new employers to the region. Regional access and mobility are important economic factors. Investments in public transit systems can also spur economic development along major transit routes as seen along the City’s Streetcar Line. A balanced transportation system that serves all segments of the community can:
• Strengthen neighborhoods • Engage historically under-represented communities • Support distinctive places to live, work and play • Provide people of all backgrounds with better access to opportunities
P h y s i c a l I n f r a s t r u c t u r e
C o n n e c t i v i t y B a c k g r o u n d
A4.6 | P a g e A p p e n d i x A : B a c k g r o u n d a n d C u r r e n t C o n d i t i o n s
Identify those areas that could benefit from Transit Oriented Development (TOD) and mixed use zoning and development
Transportation Planning and Design
Regional Transportation Planning Transportation planning for the region begins with the long-range Regional Transportation Plan (RTP), administered by the Pima Association of Governments (PAG), which provides a vision for the region’s transportation network over the next 30 years. The RTP includes all jurisdictions and all modes of travel, including auto, transit, bike and pedestrian. The PAG Transportation Improvement Plan (TIP) is a five-year schedule and budget of proposed transportation projects within eastern Pima County. Other plans contributing to transportation plans include the Short-Range Transit Plan, the Regional Plan for Bicycling, and other studies such as the Regionally Significant Corridors study.
Major Streets and Scenic Routes
The Pima County Major Streets and Scenic Routes Plan (MSSRP) is a map and an ordinance that 1) establishes adequate future street widths and setbacks along major streets, and 2) designates certain roads as “scenic” which places additional constraints on adjacent building development. Properties located adjacent to major and scenic routes are required to comply with specific setback and height requirements (scenic only). The current setback for major routes is 30 feet plus one-half the future right of way shown on the MSSRP, often 150 feet. The MSSRP is being updated to classify major routes according to size and function, modify right of way widths, and remove the 30 foot additional setback requirement for all major routes. This will provide additional land for private development while preserving an appropriate amount of right of way for future roadway conditions. Exhibits 4.1.a and 4.1.b, included at the end of the chapter, show existing Major Streets and Scenic Routes.
Complete Streets While roadways have historically been designed to move as much traffic as possible, current transportation trends are focusing more on building roadways that better accommodate all users of the roadway system, including transit vehicles, pedestrians and bicyclists. Smart Growth America defines complete streets as streets for everyone. They are designed and operated to enable safe access for all users, including pedestrians, bicyclists, motorists and transit riders of all ages and abilities. Complete streets are easier to cross, walk to shops, and bicycle to work. They allow buses or other forms of public transit such as streetcars to run on time and make it safe for people to walk to and from transit stops. Pima County designs roadways to accommodate current and anticpated users of the roadway including buses, bicycles and pedestrians and even equestrians in specific locations. All new roadways include shoulders for bicycle use, and sidewalks are provided where walking is observed or planned.

P h y s i c a l I n f r a s t r u c t u r e
C o n n e c t i v i t y B a c k g r o u n d
A4.7 | P a g e A p p e n d i x A : B a c k g r o u n d a n d C u r r e n t C o n d i t i o n s
Green Streets Another new trend in roadway design and sustainability is the integration of stormwater management within the roadway right of way. Roadways that are designed to accommodate stormwater typically drain water off the roadway through channels and culverts. Rather than seeking to collect and remove all stormwater, berms and swales can be incorporated into the non-paved areas alongside roadways. This allows rainwater to be directed into basins to water trees and into landscaped areas that allow water to infiltrate rather than be carried away. These systems can reduce irrigiation needs for landscaping, encourage walking by providing shade trees alongside roadways, and reduce the amount of water that is directed away from communities.

P h y s i c a l I n f r a s t r u c t u r e C o n n e c t i v i t y B a c k g r o u n d
A4.8 | P a g e A p p e n d i x A : B a c k g r o u n d a n d C u r r e n t C o n d i t i o n s
TABLE 4.1.a: Roadways with Highest Volume to Capacity Ratios
Roadway Limits # of Lanes
Traffic Volume
Traffic Capacity
Over/ Under
Capacity
Speed Limit
Transit Bike FHWA Classification MS&SRP Classification
Vol/Cap Ratio
Cortaro Farms Rd Stargrass Dr to Thornydale Rd 2 18,800 14,900 over 40 N N Urban Minor Arterial Scenic Major 1.26
Houghton Rd Escalante Rd to Corte Madera 2 24,500 14,900 over 45 N Y/N Rural Minor Arterial Major Scenic 1.64
Old Vail Connection Rd to Old Vail Rd 2 15,000 13,600 under 55 No Yes Rural Principal Arterial Major Scenic Route 1.10
Ina Road CDO Wash to La Cholla Blvd 4 35,400 33,000 over 45 Y Y Urban Principal Arterial Scenic Major 1.07
La Cholla Blvd to Skyline Dr 4 35,000 33,000 under 45 Y Y Urban Principal Arterial Major Scenic 1.06
Orange Grove Rd Orange Blossom Ln to Shannon Rd 2 24,100 14,900 over 45 Y Y Urban Principal Arterial Major 1.62
La Cholla Blvd to Oracle Rd 2 22,000 14,900 over 45 N Y/N Urban Principal Arterial Major 1.47
Oracle Rd to Skyline Dr 2 16,000 14,900 over 45 N Y Urban Principal Arterial Major 1.07
River Road Shannon Rd to Alvernon Way 4 36,000 33,000 under 45 Y Y Urban Principal Arterial Major Scenic 1.09
Skyline Dr Ina Rd to Sunrise Dr 4 34,000 33,000 under 45 N Y Urban Principal Arterial Major Scenic 1.03
Sunrise Dr Skyline Dr to Craycroft Rd 4 36,500 33,000 under 45 Y Y Urban Principal Arterial Major Scenic 1.11
Thornydale Road Cortaro Farms Rd to Camino del Norte 2 19,500 14,900 over 45 Y N Urban Minor Arterial Scenic Major 1.31
Source: Pima County Department of Transportation, 2014.

P h y s i c a l I n f r a s t r u c t u r e
C o n n e c t i v i t y B a c k g r o u n d
A4.9 | P a g e A p p e n d i x A : B a c k g r o u n d a n d C u r r e n t C o n d i t i o n s
4.2 Water Resources
Water, the most limiting factor in the Sonoran Desert, is a subject of focus throughout the Southwest,
specifically in Arizona as increasing water demands are placed. When addressing growth and development
in Pima County, the impacts for this natural resource must be considered.
Water Availability
Water supply sources available in Pima County include imported Colorado River water through the
Central Arizona Project (CAP) canal, groundwater and reclaimed water produced at Tucson Water’s
reclaimed water facilities adjacent to the Agua Nueva Water Reclamation Facility (WRF). Underground
Storage Facilities, of which there are six, store renewable water, either CAP water or reclaimed water, in
an underground aquifer.3 4
Arizona Department of Water Resources (ADWR) manages the State’s Assured Water Supply Program
which covers subdivisions within the Tucson Active Management Area (AMA). This program was created
as part of the 1980 Groundwater Management Act to conserve groundwater. The assured water supply
regulations require all new subdivisions to be served by a water provider with a designated assured
water supply or to be certified as having an assured water supply.
Groundwater Replenishment District: The Central Arizona Groundwater Replenishment District (GRD)
was created to allow subdivisions with no access to renewable water to continue to grow while meeting
assured water supply rules. The GRD agrees to replenish the groundwater that will be pumped to serve
the subdivision and the subdivision agrees to pay GRD’s costs to acquire renewable water and replenish
it on behalf of the subdivision.
Water Supply and Demand Management
The Bureau of Reclamation completed a study of the Colorado River Basin that supplies seven states,
and the Central Arizona Project (CAP) with its share of 1.5 million acre feet delivered annually to Pima
County as well as Pinal and Maricopa counties. Basin-wide, shortfall between projected water supply
and demand is likely; an estimated 3.2 million acre feet or more a year by 2060.
The Arizona Department of Water Resources (ADWR) reached a similar conclusion in the report,
Arizona’s Next Century: A Strategic Vision for Water Supply Sustainability. Some areas of the state are
expected to experience constrained growth due to water shortage and new water supply acquisition or
importation will be required.
3 http://www.azwater.gov/azdwr/WaterManagement/Recharge/TypesofRechargePermits.htm 4 Knowledge Portals: Energy Management: Energy Efficiency and Pumping: FAQ’s, Water Research Foundation,
www.waterrf.org, 2013

P h y s i c a l I n f r a s t r u c t u r e
C o n n e c t i v i t y B a c k g r o u n d
A4.10 | P a g e A p p e n d i x A : B a c k g r o u n d a n d C u r r e n t C o n d i t i o n s
Lake Mead, supply source for CAP water, is forecast to continually decline due to the recurring structural
deficit of more water required by the Basin states than is naturally supplied to the reservoir. This deficit,
although exasperated by drought, exists despite it. Water level at Mead serves as a trigger for
mandatory reductions of CAP water. The increasing probability of lower water levels corresponds to the
likelihood of less CAP water delivered to Pima County- although at first only impacting the agricultural
sector.
The Bureau of Reclamations and the Arizona Department of Water Resources (ADWR) studies
recommend using all water supplies as efficiently as possible and the expansion of reclaimed water use
for non-potable purposes to ease potable demand. Effluent has and will continue to be a key water
supply in the state’s management plans and goal of safe yield, or hydrological balance. Yet both reports
agree that no one strategy will solve future imbalance; augmentation will be required despite
conservation and reuse efforts.
Exhibits 4.2, included at the end of the chapter, shows Water Service Areas servicing Pima County by
planning area.
TABLE 4.2.a: Water Service Areas Total Acreage by Planning Area
Planning Area Water Service Areas
(Acres)
1) Avra Valley 15,849
2) Tucson Mountains 28,045
3) Southwest 27,701
4) Altar Valley 5,465
5) Upper Santa Cruz 16,697
6) Mountain View 0
7) Southeast 61,077
8) Central 69,591
9) Catalina Foothills 68,282
10) Rincon Valley 9,105
11) Tortolita 47,074
12) San Pedro 0
13) Ajo-Why 0
Total All Planning Areas: 348,885
Total County: 348,885
Source: Pima County Geographic Information Systems, 2013

P h y s i c a l I n f r a s t r u c t u r e
C o n n e c t i v i t y B a c k g r o u n d
A4.11 | P a g e A p p e n d i x A : B a c k g r o u n d a n d C u r r e n t C o n d i t i o n s
Avra Valley Planning Area (1) This planning area is one of the few areas that has experienced rising groundwater levels along the Santa Cruz River corridor primarily due to the presence of CAP recharge facilities and reclaimed water discharged, however, ground water levels in the vicinity of Brawley Wash and west of the Tucson Mountains have declined.5 No reclaimed water is delivered in this planning area; the reclaimed water infrastructure does not extend to this area. Much of the residential water service is provided by exempt wells that provide water to unregulated subdivisions. The water providers are:
1) Marana Water (a municipal water utility) provides water service primarily within its limits.6
Marana Water is taking its full CAP allocation; 2) Avra Valley Water Co-op provides water service to the Picture Rocks area. Avra Valley Water Co-
op has a CAP allocation but does not take it; 3) Tucson Water is the largest municipal water provider in Pima County and has a CAP allocation.
In the Avra Valley planning area, Tucson Water only provides water service to three isolated service areas (i.e. eastern boundary of the Ironwood Forest, southwest of El Tiro Road and Anway Road, and near Silverbell Road at the western boundary of the Town of Marana). 7 There are four Groundwater Replenishing District (GRD) subdivisions within the planning area. Marana Water and Tucson Water are both member service areas of the GRD. There are a number of recharge facilities in the planning area, so replenishment conducted by the GRD occurs relatively close to where the water is being withdrawn. Tucson Water has not used the GRD to replenish on its behalf, but could do so if the need arises. Marana has used the GRD to replenish. Tucson Mountains Planning Area (2) Tucson Water, Marana Water and Avra Valley Water Cooperative are all providers in this area and have CAP allocations. The smaller water providers are Avra Valley Water Cooperative, Lazy C Water Service and Logan Hills Water Company. Only Avra Valley Water Co-op has a CAP entitlement and none have a reclaimed water entitlement. There are no member GRD subdivisions in this planning area. Depth to groundwater varies widely in this planning area. Reclaimed water in the Tucson metropolitan area is produced at the Tucson Water’s reclaimed water facilities adjacent to the Agua Nueva WRF.
5 ADWR Water Atlas, Volume 8, Section 8.5 Tucson Active Management Area, page 380. 6 Town of Marana 2010 Potable Water Master Plan, Final Draft, Westland Resources, September 2010. 7 City of Tucson Water Service Area Policy, City of Tucson Resolution 21602, adopted August 4, 2010.

P h y s i c a l I n f r a s t r u c t u r e
C o n n e c t i v i t y B a c k g r o u n d
A4.12 | P a g e A p p e n d i x A : B a c k g r o u n d a n d C u r r e n t C o n d i t i o n s
Southwest Planning Area (3) Tucson Water and Metro Water are the major water providers in this area. Both water providers have CAP allocations. In 2012, Tucson Water began taking delivery of its entire 144,172 acre-feet entitlement of CAP water at its Clearwater Renewable Resource Facility located at the western portion of Planning Area 3. CAP water is recharged in two recharge facilities, Central Avra Valley Storage and Recovery Project (CAVSARP) and South Avra Valley Storage and Recovery Project (SAVSARP) where it is blended with groundwater. The CAP/groundwater blend is recovered in water wells located around the recharge basins and delivered to Tucson Water customers throughout their service area. CAVSARP is permitted by ADWR to recharge up to 100,000 acre-feet of CAP water, while SAVSARP is permitted to recharge up to 60,000 acre-feet of CAP water. Metro Water plans to enter into a CAP wheeling agreement in the future that will deliver CAP water from the Tucson Water recharge facilities to areas to be served by Metro Water. Some parcels in Planning Area 3 are within the City of Tucson non-expansion area, meaning no water service provider is designated to serve these parcels. Reclaimed water could be made available from the Avra Valley WRF, but no reclaimed water delivery system is in place. Altar Valley Planning Area (4) The major source of water is groundwater. No major water providers are located in this planning area. Residential water service is provided by non-exempt wells. No reclaimed water is available to this area. Upper Santa Cruz Planning area (5) The major source of water is groundwater. Other water supply sources are CAP water, reclaimed water and mountain front recharge. The planning area is served by six major municipal water providers, several smaller providers and a number of privately-owned groundwater wells. The major municipal water providers are Farmers Water Company, Green Valley Domestic Water Improvement District, Community Water Company of Green Valley, Sahuarita Water Company, Las Quintas Water Company, and Quail Creek Water Company. The two water providers with CAP allocations are Community Water Company of Green Valley and the Green Valley Domestic Water Improvement District. Replenishment facilities in the planning area include Pima Mine Road Recharge Project, Robson/Quail Creek, Town of Sahuarita Recharge Facility, and the FICO Groundwater Savings Facility (it has not stored water because of the lack of physical infrastructure to deliver either CAP or effluent). Reclaimed water from the Green Valley WRF is fully committed to golf course irrigation. Effluent from the Arivaca Junction WRF is delivered to a local ranch and is restricted to agricultural use. Mountain View Planning Area (6) The major source of water is groundwater. No major water providers are located in this planning area. Residential water service is provided by non-exempt wells. No reclaimed water is available to this area.

P h y s i c a l I n f r a s t r u c t u r e
C o n n e c t i v i t y B a c k g r o u n d
A4.13 | P a g e A p p e n d i x A : B a c k g r o u n d a n d C u r r e n t C o n d i t i o n s
Southeast Planning Area (7) Tucson Water is the primary water company providing potable service. This planning area receives a
blend of CAP water and groundwater. For the City, groundwater will remain an important supply source
to meet peak demand and provide a backup supply. Other water providers include the Vail Water
Company and, to the south in the Sahuarita/Green Valley Area, the water providers include Farmers
Water, Sahuarita Water, Community Water and Green Valley Water Company. There are also small
individual water providers including Voyager RV which serves an RV campground and the Arizona State
Prison as well as numerous exempt private wells.
Reclaimed water is available to an urbanized portion of this planning area and effluent is recharged through percolation ponds at the Green Valley and Corona de Tucson Water Reclamation Facilities. Central Planning Area (8) A majority of the planning area is within the incorporated area of the City of Tucson and receives most of its water supply from Tucson Water. Other water providers include Flowing Wells Irrigation District and the Vail Water Company. Davis-Monthan Air Force Base provides its water within the base boundaries and the University of Arizona provides about half of its water supply through groundwater wells and the remainder is provided by the city’s water utility. Reclaimed water treated by Pima County and delivered through Tucson Water’s reclaimed water system serves municipal parks and golf courses. There are two major stormwater harvesting projects located in this planning area. Catalina Foothills Planning Area (9) This planning area has few GRD subdivisions. The major water providers are Metro Water and the Mt Lemmon Water District, serving Summerhaven, which provides water service derived from mountain springs. Tucson Water provides municipal water service. Groundwater is an important source and beginning in 2000, groundwater levels in the central area have increased due to Tucson Water’s delivery of the CAP/groundwater blend. Tucson Water delivers reclaimed water within its service area. A comparatively smaller source of water, rainfall and snowmelt, replenish the aquifer as mountain front recharge8 and a number of springs are located in this planning area (e.g. Agua Caliente, Bear Wallow and La Cebadilla). Metro Water was created to serve a specific portion of unincorporated northwest Tucson but has added three service areas in unincorporated Pima County including the Hub located in the Catalina Planning Area. Metro Water has a CAP allocation which is primarily recharged. Metro Water has a reclaimed
8 http://www.azwater.gov/azdwr/WaterManagement/AMAs/documents/ch2-tuc.pdf
P h y s i c a l I n f r a s t r u c t u r e
C o n n e c t i v i t y B a c k g r o u n d
A4.14 | P a g e A p p e n d i x A : B a c k g r o u n d a n d C u r r e n t C o n d i t i o n s
water entitlement through an agreement with Tucson Water but currently has no plans to deliver reclaimed water directly to areas within this planning area. Rincon Valley Planning Area (10) Municipal water providers that serve this area include Vail Water Company, Spanish Trail Water Company and Saguaro Water Company. Tucson Water serves a small portion of the area. Vail has a CAP allocation and had taken its full allocation and recharged it at facilities in the Marana area9. Vail Water Company has no share of reclaimed water. Spanish Trail has a CAP allocation and recharges at facilities in the Marana area. 10 Spanish Trail has a share of reclaimed water which is recharged. Although both Vail and Spanish Trail water companies have CAP allocations, their delivery systems do not access CAP water directly due to the lack of infrastructure. In 2013, Vail entered into a wheeling agreement with Tucson Water for the recharge and subsequent direct delivery of the utility’s CAP allotment, a maximum of 1,857 acre-feet a year, thereby eliminating that volume of groundwater pumping in the Vail service area and the hydrological disconnection between recharge and recovery sources. Saguaro Water Company service area has a number of GRD subdivisions. Saguaro Water Company has no CAP allocation or reclaimed water. Tucson Water only provides water service to two small areas. Rural areas without service from these providers rely on private wells. A comparatively smaller source of water, rainfall and snowmelt, replenish the aquifer as mountain front recharge.11 Tortolita Planning Area (11) Major municipal water providers that serve this area include the Town of Oro Valley, Town of Marana, Metro Water and Tucson Water. The service areas of Oro Valley and Metro Water are entirely within this planning area. Tucson Water serves isolated areas and the Town of Marana’s water utility serves limited portions of the planning area. The Town of Oro Valley’s water utility generally serves its incorporated area. Oro Valley has a CAP allocation. Oro Valley has an effluent entitlement through an agreement with Tucson Water. Several smaller water providers also provide residential water service. Rural areas that do not receive municipal water from these water providers rely on private wells for water service. The County and City of Tucson have an intergovernmental agreement regarding effluent entitlements and the City also has separate agreements with Oro Valley, Marana and Metro Water for effluent entitlements. In this planning area, the Marana water utility serves three specific areas. Marana currently relies exclusively on groundwater.12 All of their entitlement is recharged to offset groundwater pumping. Tucson Water provides reclaimed water to several golf courses. Several smaller water providers provide municipal water to this planning area. None of these providers has a CAP or reclaimed
9 ADWR Annual Status Report found at:
http://www.azwater.gov/azdwr/WaterManagement/Recharge/PermittedFacilities.htm 10 ADWR Annual Status Report found at:
http://www.azwater.gov/azdwr/WaterManagement/Recharge/PermittedFacilities.htm 11 http://www.azwater.gov/azdwr/WaterManagement/AMAs/documents/ch2-tuc.pdf 12 Town of Marana 2010 Potable Water System Master Plan, August 31, 2012
P h y s i c a l I n f r a s t r u c t u r e
C o n n e c t i v i t y B a c k g r o u n d
A4.15 | P a g e A p p e n d i x A : B a c k g r o u n d a n d C u r r e n t C o n d i t i o n s
water entitlement. There are several GRD member subdivisions. This planning area is highly dependent on groundwater because it is up gradient from the renewable sources of water, CAP water and reclaimed water, and because of the distance to these water sources. San Pedro Planning Area (12) The major source of water is groundwater. No major water providers are located in this planning area. Residential water service is provided by non-exempt wells. No reclaimed water is available to this area. Ajo Planning Area (13): Municipal water service is provided by the Ajo Improvement Company, a private water company regulated by the Arizona Corporation Commission. Groundwater is the major source of water for this area. The Ajo Improvement Company has approximately 1,100 customers and sold 0.5 acre-feet in 2012, according to an annual report filed with the Corporation Commission.13
Water Demand Assessment
Pima County is not a water provider and is not responsible for assuring water supply for residential or commercial users therefore the County does not have actual demand data. Yet Pima County does ask for 100 year assured water supply from the developer while approving a residential subdivision. There is no requirement for 100 year assured supply for commercial development. On per capita basis, residential demand has not increased due to various conservation approaches adopted by municipalities.
Current Water Demand This section summarizes current water demand by planning area where data is available. Avra Valley Planning Area (1) This planning area is generally characterized as rural residential. Based on a population of 22,856 and an average per capita water consumption of 120 gallons per person per day, the estimated water demand in is 384 acre-feet per year. The planning area is sparsely populated with pockets that have developed through unregulated lot splits. Many areas are not served by a municipal water provider and obtain their water from exempt wells. Exempt wells are primarily used for residential, non-irrigation purposes and have a maximum pump capacity of 35 gallons per minute. These wells are less regulated by the Arizona Department of Water Resources (ADWR) and are exempt from reporting well pumping volumes to ADWR. The proliferation of exempt wells can decrease groundwater levels. Because of its rural nature and number of unregulated subdivisions, many areas in the planning area are not connected to the public sewerage system and rely on individual septic tank systems for residential sewage. The northeast portion of the
13 http://www.azcc.gov/Divisions/Utilities/Annual%20Reports/Wastewater.asp
P h y s i c a l I n f r a s t r u c t u r e
C o n n e c t i v i t y B a c k g r o u n d
A4.16 | P a g e A p p e n d i x A : B a c k g r o u n d a n d C u r r e n t C o n d i t i o n s
planning area is connected to a public sewerage system as detailed by the Regional Wastewater Reclamation Department (RWRD). For the less dense, rural areas, lack of connection to a public sewerage system means this wastewater cannot be captured as reclaimed water and used for irrigation and landscape. The major demand for water in the area includes:
Schools and parks with turf facilities utilize potable supplies since no reclaimed water
infrastructure is available in this planning area. There are no golf courses in this planning area.
Agricultural Water - The eastern portion of the planning area has 38,045 acres of agricultural
lands. Groundwater pumping for agricultural use is regulated by ADWR. Only land with an
Irrigation Grandfathered Right can be irrigated with groundwater within an AMA. The
landowner must participate in one of two ADWR water conservation programs.
Mining – The ASARCO Silverbell Mine is located in this planning area. Mines have rights to pump
groundwater pursuant to Type 1 and Type 2 non-irrigation grandfathered water rights and
groundwater withdrawal permits. The amount of groundwater used can fluctuate widely
depending on the copper market conditions.
Tucson Mountains Planning Area (2)
This planning area is generally characterized as residential. Based on a population of 63,422 and an
average water usage of 120 gallons per person per day, the estimated potable water demand in this
planning area is 7.7 million gallons per day or 8,600 acre-feet per year. The largest commercial/industrial
user is Carondelet St. Mary’s Hospital which uses approximately 234,226 gallons per day and receives
water service from Tucson Water.
Other water use sectors in this planning area include turf and sand/gravel operations. The predominant
turf water demand is from parks and golf courses. Four golf courses are located in this area and all but
one receives reclaimed water from the City reclaimed water system. A list of the area’s golf courses,
water source and water provider is listed in Table 4.2.b.
TABLE 4.2.b: Water Source and Water Provider for Golf Courses
Golf Course
Water Provider
Water Source
Starr Pass Tucson Water Reclaimed
Silverbell Tucson Water Reclaimed
El Rio Tucson Water Reclaimed
Quarry Pines CMID Groundwater
Source: Pima County Infrastructure Plan, 2013.
P h y s i c a l I n f r a s t r u c t u r e
C o n n e c t i v i t y B a c k g r o u n d
A4.17 | P a g e A p p e n d i x A : B a c k g r o u n d a n d C u r r e n t C o n d i t i o n s
Schools and parks typically have playground and sports fields irrigated with water. The City of Tucson’s
parks are irrigated with reclaimed water and include Menlo Park, Joaquin Murrieta Park and Santa Cruz
River Park from Mission Lane to Grant Road. Christopher Columbus Park is irrigated with low quality
non-potable groundwater. Opportunities exist to bring reclaimed water to Sportspark as the Tres Rios
(Ina Road) WRF is close by. The Town of Marana operates a number of parks in this planning area that
are irrigated with groundwater. These include Continental Ranch Community Park, Continental Reserve
Park, Wade McLean Neighborhood Park and Crossroads at Silverbell District Park.
Southwest Planning Area (3)
Pima County’s Southwest area has been identified by County planners as a potential and strategic
growth area. To accommodate population growth, the existing infrastructure must be improved and
expanded. The Pima County Southwest Infrastructure Plan (SWIP) provides a basis for infrastructure
decision-making related to development in the Southwest area. It quantifies the nature, phasing,
financial impacts, and funding possibilities for those flood control, parks and recreation, transportation,
water, wastewater infrastructure and other improvements that are necessary to service future
saturation growth within the study limits. The SWIP includes a framework for sustainable infrastructure
planning for water conservation and reuse.
Altar Valley Planning Area (4) Encompassing a total of 1,027 square miles Altar Valley is the largest planning area in Pima County. With
a total population of 7,044 in 2010 and a population density of 7 persons per square mile, Altar Valley is
one of the least populated areas in Pima County. Only approximately 73.9 percent of this planning area,
or 485,377 acres, is located within Pima County unincorporated area as large portions are included in
the Buenos Aires National Wildlife Refuge, the Coronado National Forest, Baboquivari Peak Wilderness
Area, and sections of the Tohono O’odham Nation.
Currently, approximately 84,200 acres, or 11.8 percent of this planning area is developed/non-vacant
land including ranching/agricultural uses or open space. Of the vacant land, 56.1 percent is State owned;
29.8 percent is federally owned; 8.6 percent is owned by the Tohono O’odham Nation, 1.8 percent is
County owned; and 0.5 percent is municipally owned. Most of the planning area is undeveloped with
the following exceptions: Diamond Bell Ranch subdivisions; unplatted GR-1 zoned residential areas;
Three Points and Arivaca.
The area’s limited residential development is low density and dispersed in nature. The major water
users include agriculture, mining, golf courses and schools, Tucson Water, and municipal, County, State
and Federal parks. There is a total of 21 water providers in this planning area.

P h y s i c a l I n f r a s t r u c t u r e
C o n n e c t i v i t y B a c k g r o u n d
A4.18 | P a g e A p p e n d i x A : B a c k g r o u n d a n d C u r r e n t C o n d i t i o n s
Green Valley Planning Area (5)
This planning area is generally characterized as a retirement community with a population of 49,820.
The primary water users in this planning area are metal mining and agriculture. Other water uses include
municipal, golf courses and sand and gravel operations. The following table shows current and projected
water use data based on 2006 water use for each user sector.
TABLE 4.2.c: Green Valley Planning Area Water Use (acre-feet per year)
Major Water Users Actual Water Use14 Projected Water Use15
Year 2006 2015 2025
Metal Mining16 34,600 54,000 54,000
Agriculture 29,800 28,100 18,700
Municipal 7,575 14,100 16,300
Golf Courses 4,375 5,600 5,600
Sand & Gravel 475 700 700
Total 76,825 102,502 95,300
Source: Pima County Infrastructure Plan, 2013.
Metal Mining
Metal mining is the single largest groundwater user in the planning area. Two mines, Freeport
McMoRan and ASARCO, use approximately 34,600 acre-feet of water annually and account for 45
percent of the water demand in the area. These mines have rights to pump groundwater pursuant to
Type 1 and Type 2 non-irrigation grandfathered rights
Reclaimed water from the Green Valley Water Reclamation Facility is fully committed to golf course
irrigation. Effluent from the Arivaca Junction Water Reclamation Facility is delivered to a local ranch and
is restricted to agricultural use.
Two water providers have CAP allocations; Community Water Company of Green Valley (CWCGV) has an
allocation of 2,858 acre-feet per year while Green Valley Domestic Water Improvement District
(GVDWID) has an allocation of 1,900 acre-feet per year. CWCGV and GVDWID recharge their CAP water
14 Estimated Water Usage for Upper Santa Cruz Providers and Users Group Years: 2006-2030, USC/PUG, January 10, 2009. 15 Tables ES-10and ES-11 CAP Water Use Feasibility Analysis and Delivery System Optimization Study, prepared by Malcolm
Pirnie for the Arizona Department of Water Resources (1998). 16 Includes ASARCO and Freeport McMoRan.
P h y s i c a l I n f r a s t r u c t u r e
C o n n e c t i v i t y B a c k g r o u n d
A4.19 | P a g e A p p e n d i x A : B a c k g r o u n d a n d C u r r e n t C o n d i t i o n s
at recharge facilities located outside of Area 5. The remaining water providers pump groundwater
pursuant to Type 1 and Type 2 non-irrigation grandfathered rights.
Golf Courses
Golf courses use groundwater to irrigate turf grass and landscaping. ADWR regulates the amount of
groundwater used by golf courses. There are eight golf courses in this planning area. Six courses use
groundwater provided by either the local municipal water providers or they pump groundwater
pursuant to a Type 1 or Type 2 non-irrigation grandfathered right. One golf course, Canoa Ranch is
required to offset groundwater pumped by purchasing an equivalent amount of CAP water. The CAP
water is recharged outside of the planning area. Another golf course, Quail Creek, purchases reclaimed
water from Pima County’s Green Valley Water Reclamation Facility and recharges it at an adjacent
underground storage facility. The stored reclaimed water is recovered at the golf course site and used to
irrigate turf. Golf courses account for 6 percent of the water demand in the planning area.
Sand and Gravel
Sand and gravel operations use water to remove fine-grained particles. Water is also used to produce
ready-mix concrete, to control dust and other operations. In addition to recycling wash water, ADWR
requires additional conservation measures relating to dust control and related clean-up activities. Sand
and gravel operations use only one percent of the water demand in the planning area.
Mountain View Planning Area (6)
The Mountain View planning area encompasses 183,813 acres in the southeastern region of Pima
County. Of this total, 60.8 percent is within Pima County jurisdiction, 21.3 percent is Coronado National
Forest, 17.5 percent is Las Cienegas National Conservation Area, and 0.5 percent is Cienega Creek
Natural Preserve. Privately owned lands constitute 14.5 percent of the planning area. The State Land
Department owns 45.8 percent; the Bureau of Land Management owns 20.4 percent and the Coronado
National Forest owns 14.5 percent of the planning area.
In 2010, the population was 1,331 with a population density of 5 persons per square mile. This sparsely-
populated planning area contains very little development activity. Developed areas are primarily large
lot single-family residential. There is no water data available for this area.
Potential remedies and projects within this area will depend upon agreements with federal and state
landowners as well as the for-profit businesses operated in the area, which the County has limited
ability to regulate.
P h y s i c a l I n f r a s t r u c t u r e
C o n n e c t i v i t y B a c k g r o u n d
A4.20 | P a g e A p p e n d i x A : B a c k g r o u n d a n d C u r r e n t C o n d i t i o n s
Southeast Planning Area (7)
This planning area encompasses approximately 221,882 acres in the south-central region of eastern
Pima County. Of this total, approximately 121,164 acres or 55 percent of the planning area is owned by
the Arizona State Land department. Privately owned lands include 70,344 acres or 32 percent of the
planning area. The balance of the planning area include lands owned by the Tohono O’odham Nation
and the federal government, specifically the U.S. Forest Service and the Bureau of Land Management. By
jurisdiction, 20 percent is within the City of Tucson, 2 percent is within the Town of Sahuarita and 42
percent is within unincorporated Pima County.
Water providers include the Vail Water Company serving the New Tucson Area; to the south in the
Sahuarita/Green Valley Area water providers include Farmers Water, Sahuarita Water, Community
Water and Green Valley Water Company. There are also small individual water providers including
Voyager RV which serves an RV campground and the Arizona State Prison as well as numerous exempt
private wells.
Reclaimed water is available to the urbanized portion of this planning area, generally along Drexel Road
east of 6th Avenue, and north along 6th Avenue. Effluent is recharged through percolation ponds at the
Green Valley and Corona de Tucson Wastewater Treatment Facilities.
Central Planning Area (8)
This planning area is generally characterized as residential, commercial and industrial. Based on a
population of 321,216 and a per capita water use of 120 gallons per person per day, the estimated
residential water use of this planning area is 43,200 acre-feet per year. Major commercial and industrial
users and their average daily water consumption are shown in the following table.
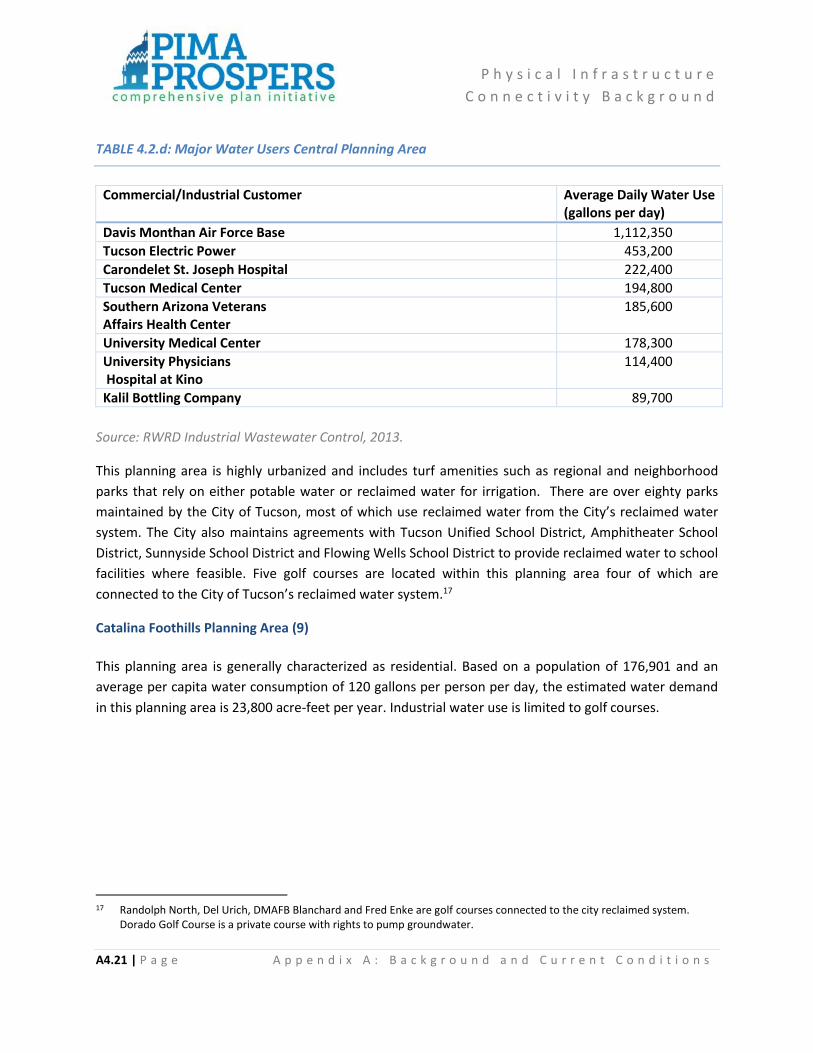
P h y s i c a l I n f r a s t r u c t u r e
C o n n e c t i v i t y B a c k g r o u n d
A4.21 | P a g e A p p e n d i x A : B a c k g r o u n d a n d C u r r e n t C o n d i t i o n s
TABLE 4.2.d: Major Water Users Central Planning Area
Commercial/Industrial Customer Average Daily Water Use (gallons per day)
Davis Monthan Air Force Base 1,112,350
Tucson Electric Power 453,200
Carondelet St. Joseph Hospital 222,400
Tucson Medical Center 194,800
Southern Arizona Veterans Affairs Health Center
185,600
University Medical Center 178,300
University Physicians Hospital at Kino
114,400
Kalil Bottling Company 89,700
Source: RWRD Industrial Wastewater Control, 2013.
This planning area is highly urbanized and includes turf amenities such as regional and neighborhood
parks that rely on either potable water or reclaimed water for irrigation. There are over eighty parks
maintained by the City of Tucson, most of which use reclaimed water from the City’s reclaimed water
system. The City also maintains agreements with Tucson Unified School District, Amphitheater School
District, Sunnyside School District and Flowing Wells School District to provide reclaimed water to school
facilities where feasible. Five golf courses are located within this planning area four of which are
connected to the City of Tucson’s reclaimed water system.17
Catalina Foothills Planning Area (9)
This planning area is generally characterized as residential. Based on a population of 176,901 and an
average per capita water consumption of 120 gallons per person per day, the estimated water demand
in this planning area is 23,800 acre-feet per year. Industrial water use is limited to golf courses.
17 Randolph North, Del Urich, DMAFB Blanchard and Fred Enke are golf courses connected to the city reclaimed system.
Dorado Golf Course is a private course with rights to pump groundwater.
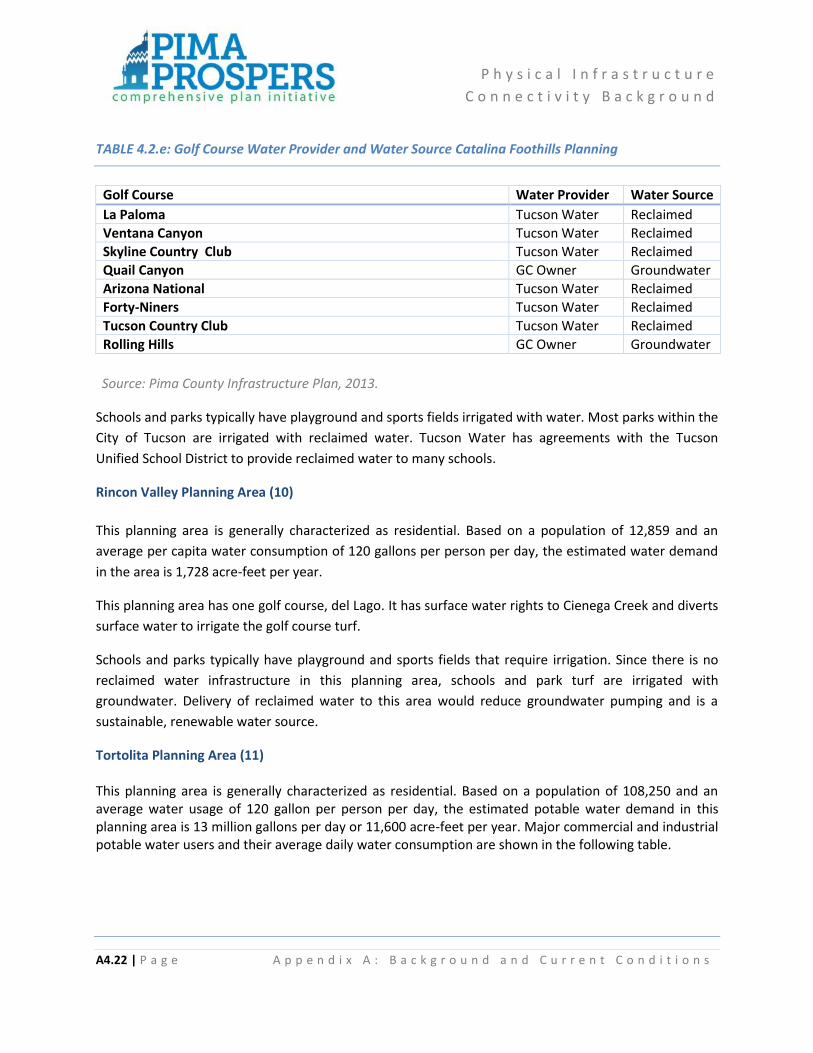
P h y s i c a l I n f r a s t r u c t u r e
C o n n e c t i v i t y B a c k g r o u n d
A4.22 | P a g e A p p e n d i x A : B a c k g r o u n d a n d C u r r e n t C o n d i t i o n s
TABLE 4.2.e: Golf Course Water Provider and Water Source Catalina Foothills Planning
Golf Course Water Provider Water Source
La Paloma Tucson Water Reclaimed
Ventana Canyon Tucson Water Reclaimed
Skyline Country Club Tucson Water Reclaimed
Quail Canyon GC Owner Groundwater
Arizona National Tucson Water Reclaimed
Forty-Niners Tucson Water Reclaimed
Tucson Country Club Tucson Water Reclaimed
Rolling Hills GC Owner Groundwater
Source: Pima County Infrastructure Plan, 2013.
Schools and parks typically have playground and sports fields irrigated with water. Most parks within the
City of Tucson are irrigated with reclaimed water. Tucson Water has agreements with the Tucson
Unified School District to provide reclaimed water to many schools.
Rincon Valley Planning Area (10)
This planning area is generally characterized as residential. Based on a population of 12,859 and an
average per capita water consumption of 120 gallons per person per day, the estimated water demand
in the area is 1,728 acre-feet per year.
This planning area has one golf course, del Lago. It has surface water rights to Cienega Creek and diverts
surface water to irrigate the golf course turf.
Schools and parks typically have playground and sports fields that require irrigation. Since there is no
reclaimed water infrastructure in this planning area, schools and park turf are irrigated with
groundwater. Delivery of reclaimed water to this area would reduce groundwater pumping and is a
sustainable, renewable water source.
Tortolita Planning Area (11) This planning area is generally characterized as residential. Based on a population of 108,250 and an average water usage of 120 gallon per person per day, the estimated potable water demand in this planning area is 13 million gallons per day or 11,600 acre-feet per year. Major commercial and industrial potable water users and their average daily water consumption are shown in the following table.

P h y s i c a l I n f r a s t r u c t u r e
C o n n e c t i v i t y B a c k g r o u n d
A4.23 | P a g e A p p e n d i x A : B a c k g r o u n d a n d C u r r e n t C o n d i t i o n s
TABLE 4.2.f: Major Water Users Tortolita Planning Area
Source: Pima County Infrastructure Plan, 2013.
Other major water users in this planning area include schools, parks and golf courses. Many of Pima
County’s golf courses are located in this planning area and most receive reclaimed water from various
entities that have reclaimed water entitlements. A list of the area’s golf courses, water source and water
provider is included in the following table.
TABLE 4.2.g: Golf Course Water Source Tortolita Planning Area
Golf Course Water Provider Water Source
Crooked Tree Pima County Reclaimed
El Conquistador Oro Valley Reclaimed
The Gallery Tucson Water Reclaimed
Heritage Highlands Tucson Water Reclaimed
Oro Valley Country Club Oro Valley Country Club Groundwater
Omni Tucson National Metro Water18 Groundwater & Reclaimed
The Club at Vistoso Oro Valley Reclaimed
Ritz-Carlton Tucson Water Reclaimed
Stone Canyon Oro Valley Reclaimed
Pusch Ridge Oro Valley Potable
Sun City Vistoso Oro Valley Reclaimed
Source: Pima County Infrastructure Plan, 2013.
18 Omni Tucson National will receive reclaimed water when Metro Water delivery system is complete.
Water User Water Provider Average Daily Water Use (gallons per day)
Northwest Hospital Metro Water 116,000
Hilton Resort Oro Valley 113,300
Sunrise of La Cholla Metro Water 72,500
La Cholla Airpark Oro Valley 71,600
Catalina Canyon Apts Metro Water 67,300
PM Enclave Apts Metro Water 65,000
Foothills Mall Metro Water 64,300
Rockridge Apts Oro Valley 57,900
Oro Valley Hospital Oro Valley 50,800
HLS La Reserve Properties Oro Valley 46,300

P h y s i c a l I n f r a s t r u c t u r e
C o n n e c t i v i t y B a c k g r o u n d
A4.24 | P a g e A p p e n d i x A : B a c k g r o u n d a n d C u r r e n t C o n d i t i o n s
Schools and parks typically have playground and sports fields irrigated with water. Many schools and
parks located in this planning area are not irrigated with reclaimed water. Opportunities to extend the
reclaimed system where other turf users may exist could be explore.
San Pedro Planning Area (12)
This planning area encompasses approximately 174,332 acres in the northeastern region of Pima
County. By jurisdiction, 90,180 acres or 51.7 percent is unincorporated Pima County, 75,070 acres, or
43.1 percent, is the Coronado National Forest, 8,867 acres or 5.1 percent is the Saguaro National Park
(east) and 215 acres, or .12 percent is the Bingham-Cienega Natural Preserve. Located within this area is
Mt. Lemmon which has a small year round population. According to the U.S. Bureau of the Census
counts, the total population of this planning area decreased from a total of 137 persons in 2000 to a
total of 107 persons in 2010. With an area of 272 square miles, this planning area has a population
density of 1 person per square mile in 2000 and 2010 respectively.
Mt. Lemmon Water district is the water provider for the area. With fewer trees to catch rainfall more
water replenishes supplies. Additionally, the Mt. Lemmon Water district has added more than a million
gallons of storage capacity. However, if the monsoons do not provide a consistent source of water, a
system of water rationing goes into effect.
The first step is voluntary rationing following notices about the amount of water they use. The second
step is mandatory. The third step is to shut down parts of the system and tell people they can bring
water up from Tucson if necessary. 19
Ajo-Why Planning Area (13)
The communities of Ajo and Why are located in this planning area. The Basin and range aquifer system
supplying Ajo extends underground over 200,000 square miles, and is composed of contained pockets of
water within a network of saturated and highly permeable sand and gravel called basin and fill. Though
seemingly vast, water levels in portions of this aquifer have been significantly depleted. 20
A subsidiary of Freeport-McMoran, Ajo Improvement Company (AIC), owns two wells that supply 1,100
Ajo households with water. Water in Ajo is pumped from the wells north of town and held in two
storage towers near the Mine Pit. AIC also sells water to two other utility companies, Five Acres Water
Company, which then resells the water in different geographic territories within Ajo. There are also
private wells throughout the Ajo area that draw on the aquifer. It is unknown to what extent these wells
are functioning. The site specific availability of water for new wells cannot always be predicted. An
19 https://www.azpm.org/p/top-news/2010/8/12/169-mt-lemmon-faces-drought-challenge/ 20 Ahron Lerman, Susannah Spock, and Sean Walsh (2011) A Sonoran Oasis: Developing a Local Food System for Ajo, Arizona,
Conway School of Landscape Design, Ajo, Arizona.

P h y s i c a l I n f r a s t r u c t u r e
C o n n e c t i v i t y B a c k g r o u n d
A4.25 | P a g e A p p e n d i x A : B a c k g r o u n d a n d C u r r e n t C o n d i t i o n s
observation well must first be drilled to determine the suitability of a well. The testing can add more
cost to an already expensive drilling process. 21
Water in the Ajo area is of poor quality due to high levels of naturally occurring arsenic and fluoride,
which the utility companies filter out to state regulated levels. Owners of residential wells may or may
not filter their water. The naturally occurring arsenic and fluoride and presence of up to seventy
potential brownfield sites in Ajo suggest that testing water before use on edible crops would be
prudent. 22
There is no available current water demand data for this planning area.
Projected Water Demand
In accordance with Arizona Administrative Code (AAC) R18-5-502 through -509, Pima County
Department of Environmental Quality (PDEQ) is authorized to review and approve plans for water line
extensions, modifications, or relocations, as well as new water sources, tanks, or other infrastructure for
a Public Water System (PWS), in order to ensure that it is constructed in accordance to State standards
and engineering guidelines published by the Arizona Department of Environmental Quality (ADEQ)
under Engineering Bulletin Number 8 and Number 10. PDEQ is responsible for identifying new water
systems that meet the definition of a PWS, and working with operators and responsible parties to
ensure production and distribution of safe drinking water.
A Public Water System (PWS) is defined as a water system which serves 15 or more connections, or 25
or more people, for more than 60 days a year. There are approximately 200 currently identified PWS in
Pima County. Without a centralized public water supply facilities monitoring system, the number of PWS
makes it difficult to obtain consistent PWS data such as facility design capacity, estimated demand per
capita in gallons, estimated current demand, and estimated facility surplus capacity and number of
potable water connections for residential and non-residential uses.
The projected water demand is based on population projections, land use data, facility design capacity,
estimated demand per capita in gallons, estimated current demand, and estimated facility surplus
capacity and number of potable water connections for residential and non-residential uses. Without
such baseline data, it is impossible to estimate projected water demand. The compilation of such data is
beyond the scope of this Comprehensive Plan.
21 Ahron Lerman, Susannah Spock, and Sean Walsh (2011) A Sonoran Oasis: Developing a Local Food System for Ajo, Arizona,
Conway School of Landscape Design, Ajo, Arizona. 22 Ibid.

P h y s i c a l I n f r a s t r u c t u r e
C o n n e c t i v i t y B a c k g r o u n d
A4.26 | P a g e A p p e n d i x A : B a c k g r o u n d a n d C u r r e n t C o n d i t i o n s
City/County Wastewater Study
The Water and Wastewater Infrastructure, Supply and Planning Study (WISP) was completed in
November 2011 with the adoption of the Action Plan for Water Sustainability (Action Plan).
Implementation of the WISP Action Plan began in March 2011. Year-End Progress Reports on WISP
Action Plan implementation describes the action items that have already been completed and the
progress of shared Pima County and the City of Tucson water sustainability goals.
Progress has been made and is continuing in realization of WISP goals. Pima Prospers serves as the
fundamental planning document that accomplishes a majority of the action items within WISP’s
Comprehensive Integrated Planning component, linking land use and water resources planning. Recent
data are better informing design guidelines for neighborhood stormwater harvesting and regional
assessment of residential development’s water use, furthering goals associated with WISP’s Demand
Management component. Pima County has adopted a Net-Zero Energy Building Code, began
administration of the Conservation Effluent Pool (CEP), revised riparian mitigation guidelines and
drought management plans, accepted a strategic plan for utilization of the County’s reclaimed water
and partnered in the EPA-funded study of the Lower Santa Cruz River. Meanwhile, work continues on a
joint recharge project with the City and issuance of the County’s Section 10 permit and implementation
of the Multi Species Conservation Plan is pending following federal approval.
Pima County and the City of Tucson have made great strides in completing action items identified in
WISP.One item that remains unresolved for some in unincorporated Pima County is Tucson Water’s
Water Service Area Policy (CIP 21). In 2013, Mayor and Council adopted refinements to the 2010 City
policy that resulted in the refusal of water service in designated growth areas. The refinements provide
service to properties abutting current Tucson Water connections within certain limitations and allow for
an appeals process upon denial of service and exceptions for economic development. While an
improvement from the previous policy, some properties may remain in a non-expansion area with
limited options for service.
Staff will continue to implement the WISP Action Plan and will report on progress made on continuing
action items in annual Year End Progress Reports.
Water Conservation and Protection
The City/County Water and Wastewater Infrastructure, Supply and Planning Study listed
accomplishments of phase 2 goals and recommendations for demand management. Tucson Water’s
Community Conservation Task Force (CCTF) recommended a plan based on cost benefit analysis for
enhanced water use efficiency programs with a focus on technology. The CCTF recommendations to
Mayor and Council resulted in the development of a conservation fee to fund Tucson Water’s
conservation programs.

P h y s i c a l I n f r a s t r u c t u r e
C o n n e c t i v i t y B a c k g r o u n d
A4.27 | P a g e A p p e n d i x A : B a c k g r o u n d a n d C u r r e n t C o n d i t i o n s
Adopted in 2008, the City of Tucson Water Harvesting and Graywater ordinances mandate that new
commercial development utilize water-harvesting practices to meet 50% of the site landscape water
requirement and dual plumbing to allow for graywater system installation in new homes.
Pima County 2006 and 2007 Water Conservation Code Amendments include requirements now in place
for waterless urinals and automatic faucets in commercial buildings, sub-water meters in multifamily
construction, pool covers for new pools and use of reclaimed water for new golf courses. In new
construction, separate reclaimed-ready irrigation plumbing and irrigation with seasonal adjustments and
rain sensors are required and restrictions on large water fountains and water features and turf areas are
in place.
Pima County Green Building and LEED Certification programs were established in 2008 promoting the
construction of sustainable homes.
Southern Arizona Water Rights Settlement Act
In 1982, the Southern Arizona Water Rights Settlement Act (SAWRSA) was enacted by Congress to
address the water right claims of the San Xavier and Shuck Toak Districts of the Tohono O’odham
Nation. SAWRSA awarded the districts an annual entitlement to 37,800 AF of CAP water and 28,200 AF
of settlement water to be delivered by the Secretary of the Interior to the two districts. The districts may
also pump annually up to 13,200 AF of groundwater from non-exempt wells. In addition to state and
local financial contributions, the City of Tucson contributed 28,200 AF annually of effluent to be used by
the Secretary to facilitate deliveries to the districts (through sale or exchange).
In December 2004 the President signed into law P.L. 108-451, the Arizona Water Settlements Act. Title
III of the Act amended the 1982 SAWRSA and provided a mechanism to implement the settlement. The
amendment identified the source of the settlement water as CAP Non-Indian Agricultural priority water.
The Nation may lease its CAP water within the CAP service area. State law was amended to provide
additional protection to groundwater resources on the San Xavier Reservation, and allow the Nation to
store its CAP water in an in lieu fashion. The settlement was implemented in December 2007 and
includes dismissal of claims against non-Indian parties in U.S. and State courts, and approval of the
settlement by the Gila Adjudication Court for incorporation into the final decree in that case.
Although Pima County does not have jurisdiction over sovereign nations, the County works
cooperatively with both the Tohono O’odham Nation and the Pascua Yaqui Tribe under existing
intergovernmental agreements.
Tradeoffs for Human Populations, Energy Production and Economic Development
The development and implementation of renewable energy opportunities, efforts, and projects can
present significant challenges in ecosystem and water management and ecosystem tradeoffs. For
example, the solar power facility in Gila Bend may require as much as 60,000 acre-feet per annum (AFA)

P h y s i c a l I n f r a s t r u c t u r e
C o n n e c t i v i t y B a c k g r o u n d
A4.28 | P a g e A p p e n d i x A : B a c k g r o u n d a n d C u r r e n t C o n d i t i o n s
of groundwater for cooling according to hydrologist Larry Onyskow. This estimate exceeds the estimated
groundwater recharge rate of more than 9,000 to 88,000 AFA not including withdrawals from other
water uses in the area. Although 100 – 246 million acre-feet of groundwater may be stored in the Lower
Gila Basin, data and distribution of ground water throughout the entire area is not readily available,
particularly for the 1220-square-mile Ten Mile Wash sub-basin in which the community of Ajo is located. 23
Even with general data on the Lower Gila Basin, determining groundwater availability for a specific
location in the sub-basin will require further scientific research, possibly including the drilling of test
wells. 24
Large-scale generation of solar power requires enormous areas of land to hold the multiple arrays of PV
cells. Heating just a typical house may require a "collector area" of 200 square feet. Therefore, a large
tract of land and habitat may be lost to produce solar energy which in turn impacts water recharge. The
water required to cool such arrays may result in less sustainable practice than the solar energy
production yield.
A way to minimize tradeoffs for human populations, energy production, habitat and economic
development, partnerships with the local university in the study of the impacts of clean energy
production on other natural resources such as water must be conducted. The current practices are
policy and legislator driven with very little integrated studies looking into the interdependence on
numerous impacts and tradeoffs.
Emerging Issues
This section identifies emerging issues such as groundwater shortages, climate, and CAP Colorado River
Supply.
Arizona Department of Water Resources (ADWR) Tucson Active Management Area
The Arizona Department of Water Resources (ADWR) manages the state’s Assured Water Supply
Program which covers subdivisions within Active Management Areas such as the Tucson Active
Management Areas (Tucson AMA). This program was created as part of the 1980 Groundwater
Management Act to conserve groundwater. The assured water supply regulations require all new
subdivisions to be served by a water provider with a designated assured water supply or for an
individual subdivision to be certified as having an assured water supply. In Planning the Upper Santa
23 Arizona Department of Water Resources 2011 24 United States Geological Survey (USGS) 2010.
P h y s i c a l I n f r a s t r u c t u r e
C o n n e c t i v i t y B a c k g r o u n d
A4.29 | P a g e A p p e n d i x A : B a c k g r o u n d a n d C u r r e n t C o n d i t i o n s
Cruz area, Sahuarita Water Company has been designated as having an Assured Water Supply by the
ADWR through membership with the Central Arizona Groundwater Replenishment District. 25
Subdivisions within the water service area of the other water providers must obtain a certificate of
assured water supply from ADWR. Commonly, the subdivision joins the Central Arizona Groundwater
Replenishment District which replenished groundwater pumped on their behalf.
Safe Yield Task Force was convened by the Arizona Department of Water Resources’ Groundwater Users
Advisory Committee (GUAC) to evaluate strategies for achieving safe yield in the Tucson Active
Management Area by 2025. The Task Force explores priority issues that include CAP Utilization, recovery
of long term storage credits, sub-area management and agricultural and industrial groundwater rights.
Alternatives will be developed and submitted to the GUAC for further implementation and could form
the basis of the Tucson Active Management Area’s Fourth Management Plan.
Groundwater Shortage and Drought Impacts
According to the Arizona Department of Water Resources (ADWR), Local Drought Impact Groups (LDIG)
consists of water providers and local, state and federal agencies. Pima County’s LDIG meets bimonthly
to monitor drought conditions, discuss drought impacts and coordinate drought declarations and
responses. LDIG meetings include presentations on the winter and summer seasons from the National
Weather Service, overview of the U.S. Drought Monitor from the Climate Assessment for the Southwest,
Tucson Water’s annual drought assessment and a status report on the Colorado River and reservoir
levels at Lake Mead and Lake Powell from the Central Arizona Water Conservation District.
Pima County has had in place a Drought Response Plan and Water Wasting Ordinance since 2006. The
year following its adoption, Pima County issued a Drought Stage One declaration in conjunction with the
City of Tucson. This declaration has remained in place since then and its response measure is voluntary
reduction in water use. During this time, Pima County's LDIG, functioning as the drought monitoring
committee established in the ordinance, has met regularly to monitor the status of drought in Pima
County and to assess the drought impacts. When Pima County adopted the Drought Response Plan, an
emphasis was placed on water use impacts. However, drought has impacts to many sectors and
therefore, an assessment of Pima County's vulnerability to drought was conducted.
That assessment reached a number of conclusions; County owned and maintained open space and
riparian habitat is the most vulnerable county asset. The County’s long term planning programs
associated with these lands are also a significant asset. A drought management plan for the county
should protect these investments by prioritizing adaptive management strategies and resources for
these sectors. Agriculture and ranching are not dominant economic drivers in Pima County however are
25 http://www.azwater.gov/azdwr/WaterManagement/AAWS/documents/documents/List_of_Designated_Providers_5-25-
11.pdf
P h y s i c a l I n f r a s t r u c t u r e
C o n n e c t i v i t y B a c k g r o u n d
A4.30 | P a g e A p p e n d i x A : B a c k g r o u n d a n d C u r r e n t C o n d i t i o n s
valued as a distinct regional cultural heritage. Ranching is most beneficial to the county as a land
management and habitat maintenance tool. Birding and wildlife watching, combined with other outdoor
recreation and tourism, are dominant economic drivers for the county. Birding offers economic benefits
comparable to the region’s largest copper mine. The county’s habitat programs are of benefit to these
economic sectors. Tourism is multi-faceted and duplicative in other sectors and sub-sectors. Of the
drought sensitive industries considered in this narrative, it is the most dominant economic driver.
Outdoor activities associated with the natural environment are the most popular county attractions.
Socio-economic impacts are second and third order impacts easily obscured. Collecting reports on all
order of impact is an important function of Pima County’s LDIG.
Drought Impacts
The impacts of sustained drought were observed in several sectors throughout Pima County:
At Cienega Creek, groundwater levels in three wells have dropped as much in the last year as they
have in the last 15 years. Stream reaches are also shorter and the surface water volume is lower.
Despite the warm, wetter summer weather patterns in eastern Pima County, water utilities
continue to see a change in the peak high demand day. Usually occurring in mid- to late-June, the
peak high water use day occurred in August and the peak was lower than in previous years.
For ranchers, impacts to stock ponds and grasses continue to indicate drought conditions.
Drought Indicators
In 2010, ADWR began using the U.S Drought Monitor instead of the monthly ADWR Drought Monitor
Report (DMR). The U.S Drought Monitor is a web-based reporting system and is now used because:
It provides more timely information
In some cases, drought conditions can change rapidly
The ADWR DMR was reporting conditions that were at least one month old
The US Drought Monitor has better and more timely input
The US Drought Monitor is a more sustainable process in light of the ADWR budget cuts
LDIG is now using the US Drought Monitor to monitor drought conditions in Pima County.
Drought-Related Actions
During the year, the City of Tucson and Pima County completed Phase 2 of a water/wastewater
infrastructure study. Phase 2 establishes a framework for sustainable water resources planning through
the implementation of 19 goals and 56 recommendations. Phase 1 was completed in 2009 and consisted
of an infrastructure inventory. With respect to drought, the Phase 2 report recommends the City and
P h y s i c a l I n f r a s t r u c t u r e
C o n n e c t i v i t y B a c k g r o u n d
A4.31 | P a g e A p p e n d i x A : B a c k g r o u n d a n d C u r r e n t C o n d i t i o n s
County pursue adaptive, flexible, multi-pronged preparedness strategies, including diversification of
water supplies and improved demand management, such as increased reliance on water harvesting. To
track and measure the plan’s progress, an action plan implementing the goals and recommendation of
Phase 2 is being completed.
On June 1, 2010, the City of Tucson began implementing a rainwater-harvesting ordinance that requires
new commercial properties to provide a minimum 50 percent of their landscaping water budget from
harvested rainwater.
Also on June 1, the City of Tucson began requiring all new one- and two-family dwellings to have gray
water stub-outs for laundry drains. New single-family dwellings will be required to have separate drain
lines for lavatories, showers and bathtubs to allow for future installation of distributed gray water
systems.
Should drought conditions persist and curtailments of CAP water be declared, water providers have
several response strategies in place. The first and second CAP curtailment levels will not affect deliveries
to municipal water providers. However, drought response plans are in place and more restrictive
drought response measures can be taken if a shortage is declared. The Arizona Water Bank Authority
has stored unused CAP allocations at recharge facilities in the Tucson Active Management Area on
behalf of Tucson Water and other CAP subcontractors in the region. This water can be recovered during
shortage periods. Potential climate change impacts on water resources are also being assessed in a 26-
member climate change committee being led by the City of Tucson.
Central Arizona Project (CAP) Colorado River Supply
The Central Arizona Project (CAP) is a 336-mile canal that delivers water from the Colorado River near
Lake Havasu to Phoenix and on to Tucson.26 Completed in 1993, it can deliver an average of 1.5 million
acre-feet of water annually to municipal and agricultural users, as well as Indian communities. The CAP
canal delivers water to regional recharge facilities, major water providers and Indian communities that
have CAP entitlements.
Underground Storage Facilities store renewable water, either CAP water or reclaimed water, in an
underground aquifer.27 ADWR permits two types of underground storage facilities; constructed and
managed. A constructed underground storage facilities uses a constructed device such as an injection
well or percolation basin to recharge water underground. In a managed underground storage facility
water is recharged in a natural water-transmissive area such as a streambed that allows the water to
percolate, or recharge into the aquifer. The entity storing water can either recovery its water the same
26 http://www.cap-az.com/AboutUs/FAQ.aspx 27 http://www.azwater.gov/azdwr/WaterManagement/Recharge/TypesofRechargePermits.htm
P h y s i c a l I n f r a s t r u c t u r e
C o n n e c t i v i t y B a c k g r o u n d
A4.32 | P a g e A p p e n d i x A : B a c k g r o u n d a n d C u r r e n t C o n d i t i o n s
year it was stored (annual recovery) or can accrue long term storage credits and recover its stored water
at a later date. Recovery of the long term storage credits must be consistent with a recovery well permit
issued by ADWR and must not damage other land and water users.
The regulation of land and water rights is especially important in Arizona, where access to water is
essential for land development due to the desert climate. Arizona policy makers have established a
statutory scheme that protects individual rights and governs access to these resources so that one group
is not unfairly advantaged over another in accessing these vital resources.
Arizona water law is established in Title 45 of the Arizona state law. The law places the Arizona
Department of Water Resources (ADWR) in charge of regulating state water issues and establishes a
system that regulates water usage differently depending on if the water is drawn from the surface or
brought up from the ground.
Arizona water supply is categorized into four different sources, which are managed separately. These
sources are the Colorado River, groundwater, surface water not related to the Colorado River and
effluent outflows.
In order to gain the right to use surface water, potential water rights holders must apply to the
department of water resources. The application process involves a public input mechanism where those
opposed to the proposed use of the water can have their voices heard. Applicants can apply for rights to
draw from surface water in order to create a municipal water supply, irrigate crops, create power,
refresh groundwater resources and use for mining purposes.
Effluent, Water Harvesting and Recycling
In April 2008 the City of Tucson and Pima County initiated a joint effort for sustainable water resource
planning known as the “City/County Water and Wastewater Infrastructure, Supply and Planning Study”
(Water Study). The City/County Water Study is a multi-year effort to identify ways the City and County,
which respectively own and operate the region’s primary water and wastewater utilities, can work
together to advance more cooperative and sustainable water planning.
After two years of intensive study under the guidance of a joint City/County Citizens Advisory
Committee, City and County staff prepared the Phase 2 Water Study Report. The Phase 2 Report built
upon the Phase 1 Report that preceded it and establishes a framework for sustainable water resources
planning including 19 goals and 56 recommendations within four interconnected elements: Water
Supply; Demand Management; Comprehensive Integrated Planning; and Respect for Environment. The
City of Tucson Mayor and Council and the Pima County Board of Supervisors adopted the Phase 2 Report
through City and County resolutions (No. 21478 and 2010-16 respectively), and directed staff to work
together to create an Action Plan for implementing the Phase 2 goals and recommendations.

P h y s i c a l I n f r a s t r u c t u r e
C o n n e c t i v i t y B a c k g r o u n d
A4.33 | P a g e A p p e n d i x A : B a c k g r o u n d a n d C u r r e n t C o n d i t i o n s
The following Action Plan represents a dramatic shift in business as usual for the City and County. It
advances a set of 87 specific actions grouped within 14 City/County programs to implement the Phase 2
goals and recommendations and to achieve the following outcomes within the five-year planning
horizon:
• Water, wastewater and stormwater resources are planned in an integrated fashion.
• More renewable water resources including effluent, reclaimed, stormwater and rainwater and
graywater are put to use in an efficient manner.
• Water resource policies help further economic goals.
• Collaborative efforts are undertaken to acquire new water, to achieve greater flexibility in use of
existing supplies, and to align and enhance standards for water use efficiency.
• Improved water quality resulting from regional wastewater treatment facility upgrades (i.e. the
Regional Optimization Master Plan or ROMP) is matched to needs for recharge, environmental
restoration and public amenities such as parks, golf courses and ball fields.
• Land use, infrastructure and water resources planning are linked and foster optimum use of
renewable water resources in future growth areas and increased water and energy efficiency
outcomes in new development.
• Water is dedicated and allocated to environmental needs, sensitive riparian ecosystems are
preserved and maintained, and cost-effective and collaborative environmental restoration
projects are advanced.
• Public values are considered in water resources planning and public awareness of the human,
environmental and economic benefits of improving water use efficiency is increased.
Prior to the delivery of renewable Central Arizona Project (CAP) water, the Tucson region was the largest
metropolitan area solely dependent on non-renewable groundwater resources. Beginning in the 1940s,
groundwater withdrawals began to exceed replenishment and, like other growing areas of the state, the
Tucson area began to experience groundwater overdraft leading to the lowering of groundwater tables
and subsequent loss of riparian habitat, subsidence and declines in water quality.
The 1980 Arizona Groundwater Management Act (GMA) gave the state control of groundwater pumping
and established a statewide goal known as “Safe Yield” within the Phoenix, Tucson and Prescott Active
Management Areas (AMAs). Safe yield means that by 2025 the AMAs must pump groundwater at a rate
no greater than the rate of natural and artificial replenishment. To reach safe yield by 2025, water users
in the AMAs must offset all the groundwater uses that total more than the net natural recharge with
renewable resources, like CAP water and effluent, or with artificial recharge.
The Arizona Department of Water Resources (ADWR) administers the safe yield goal through a series of
ten-year management plans for each AMA. The Tucson AMA is currently operating under the Third
Management Plan and the Fourth Management Plan is under development. Despite positive progress
P h y s i c a l I n f r a s t r u c t u r e
C o n n e c t i v i t y B a c k g r o u n d
A4.34 | P a g e A p p e n d i x A : B a c k g r o u n d a n d C u r r e n t C o n d i t i o n s
toward attaining the safe yield goal, ADWR notes in its Third Management Plan: “given current
projections, the AMA will not reach safe-yield by 2025.”
Although of critical importance, even if the safe yield goal were met, it would not solve all the issues
related to groundwater overdraft. Under the 1980 GMA, development may continue to mine
groundwater through purchase of paper water recharge credits from the Central Arizona Project. State
law allows for withdrawals in one part of the AMA to be offset by recharge in another hydrological
disconnected location. As such, safe yield applies strictly on an AMA-wide basis and can result in
continued problems related to localized overdraft within sub basins. A Safe Yield Task Force deliberates
on the topic of how to address the challenges of meeting safe yield in the Tucson AMA and the Fourth
Management Plan, when completed, will provide specific steps to reach safe yield.
Additionally, the City/County Water and Wastewater Study recognized the need to go beyond safe yield
when establishing a framework for sustainable water planning. In the Phase I Report the Oversight
Committee concluded: “A definition of sustainable water management must consider the regional
impacts of water use at the watershed scale and the localized impacts to aquifers and groundwater-
dependent ecosystems. It must establish a link between sustainable groundwater use and the provision
of renewable water sources to areas impacted by groundwater overdraft.”
The primary sources of water addressed in the Action Plan are managed by three utilities: (1) The City of
Tucson, Tucson Water Department operates and maintains the potable and reclaimed water systems;
(2) Pima County Regional Wastewater Reclamation Department (RWRD) operates and maintains a
regional wastewater conveyance and treatment system that generates the effluent used in the City of
Tucson’s reclaimed system; and (3) The Pima County Regional Flood Control District (RFCD) manages
stormwater resources.
This Action Plan focuses on activities that will advance integrated water resource planning for all these
sources of water within the combined service areas of Tucson Water and Pima County Regional
Wastewater Reclamation Department.
Many of the activities are well suited to being implemented in partnership with other jurisdictions,
water and wastewater providers and stakeholders and, where feasible and appropriate, the City and
County will include outreach to potential partners as they implement these activities.
Tucson Water serves approximately 800,000 customers and accounts for 72% of municipal demand in
Pima County. The City’s obligated service area extends outside of its incorporated boundaries. Pima
County is the Designated Management Agency for all of Pima County except the Tohono O’odham
Nation, the Town of Marana and the Town of Sahuarita. The Pima County RWRD provides 97% of the
total treatment capacity for Pima County28. Additionally, the Phases 1 and 2 Water Study reports
28 City/County Water & Wastewater Study Phase 1 Report, Executive Summary, page 11, 2008.
P h y s i c a l I n f r a s t r u c t u r e
C o n n e c t i v i t y B a c k g r o u n d
A4.35 | P a g e A p p e n d i x A : B a c k g r o u n d a n d C u r r e n t C o n d i t i o n s
highlighted the importance of rainwater and stormwater as a supplemental source of locally renewable
water. Historically, stormwater has been treated as a safety hazard and managed for disposal not for
beneficial use. The Phase 2 goals include a heightened emphasis on integrating land use and water
resources planning which includes incorporating beneficial use of stormwater as feasible in new
development and capital improvement projects.
On June 1, 2010, the City of Tucson began implementing a rainwater-harvesting ordinance that requires
new commercial properties to provide a minimum 50 percent of their landscaping water budget from
harvested rainwater. Also on June 1, the City of Tucson began requiring all new one- and two-family
dwellings to have gray water stub-outs for laundry drains. New single-family dwellings will be required
to have separate drain lines for lavatories, showers and bathtubs to allow for future installation of
distributed gray water systems. The County currently does not have a rainwater-harvesting ordinance
and it will benefit to adopt one. The Town of Oro Valley water harvesting ordinance is a good regional
model.
Water Resource Management and Reclamation
The Pima County Regional Wastewater Reclamation Department (RWRD) provides design, management
and maintenance of the sanitary sewer system, including the conveyance and treatments systems
(3,400+ miles of sewer, two metropolitan wastewater treatment plants and seven sub-regional
facilities).
The Pima County Regional Flood Control District is responsible for regional flood control needs in Pima
County including constructing major flood control facilities, purchasing flood and erosion-prone land,
operating the community’s flood warning system, and providing floodplain management activities for all
unincorporated county areas. This includes activities aimed at enhancing wildlife, recreation and riparian
habitats along watercourses and floodplains and constructing and operating groundwater recharge
facilities that also have flood control benefits, among other services.
As provided in the Water Action Plan, to achieve water sustainability goals, changes to the existing
infrastructure must begin by improving the efficiency and flexibility of the existing built environment,
including roads, parks, public services water, wastewater and stormwater systems. In addition to
considering the location and form of growth, integrated planning cross-departmental planning also
needs to consider the efficient allocation, distribution and use of all available water resources including
stormwater, effluent, reclaimed and potable water.
Such integrated planning efforts include updating the County Comprehensive plan in a manner that
increases opportunities to influence future growth patterns in the region. Tools that may be used
include:
Analysis of infrastructure and public facilities’ needs.

P h y s i c a l I n f r a s t r u c t u r e
C o n n e c t i v i t y B a c k g r o u n d
A4.36 | P a g e A p p e n d i x A : B a c k g r o u n d a n d C u r r e n t C o n d i t i o n s
Designation of suitable growth areas and job centers.
Exploration of pre-zoning to encourage growth in line with the Plans.
Identification of opportunities to promote mixed-uses, well-designed densities and infill;
Establishment of improvement districts to direct growth, infrastructure phasing plan and an
implementation component.
Evaluation of improvement districts as tools to fund open space acquisition;
Exploration of legislative changes to allow transfer of development rights from the unincorporated
area to the City.
Development of a fiscal sustainability model that understands true costs and funding mechanisms
to provide public services and infrastructure based on various land use patterns.
Comprehensive Plan Water Policies for Rezoning Requests
The existing comprehensive plan has policies that propose water conservation measures as conditions of
rezoning. Whether a rezoning proposal increases the water demand projections in areas that are less
than five miles from a groundwater dependent ecosystem and if the development will have an adverse
impact on a groundwater dependent ecosystem are evaluated during review.
Rezoning proposals that increase the water demand above existing zoning are evaluated as to whether
they are fully offset in areas of shallow groundwater (less than 50 feet below the land surface). Increases
in water demand can be offset by recharge, legal and verifiable water rights, or retirement or purchase
of water rights from within the same or up-gradient shallow groundwater area. Per policy, rezoning
proposals are not to increase the water demand above existing zoning in areas of Isolated Basins.
The existing plan states that rezoning proposals that rely on use of groundwater withdrawn from a five-
mile radius of mapped groundwater-dependent ecosystems are to include a hydrologic impact analysis
to show how groundwater withdrawn for the development may impact ecological assets. Policy states
that rezoning proposals that may adversely impact groundwater-dependent ecosystems are to employ
pump tests and monitoring, and use avoidance strategies, including well site selection and screening of
wells. Policies state that rezoning proposals located in areas that will not be served by a water provider
with physical access to a renewable and potable water supply and are located in subsidence areas shall
employ mitigation measures to minimize subsidence in the area. Certain mitigation measures are
proposed to minimize subsidence in groundwater-dependent areas and areas located in high subsidence
potential areas.
Per policy, a Final Integrated Water Management Plan (FIWMP) is submitted at the tentative plat or
development plan stage of a proposed project for which a rezoning has been approved. The FIWMP
should include proposed uses of all legally available water resources and pertinent details of reuse,
replenishment, conservation and use of renewable supplies of water, all designed to minimize impacts
to the aquifer.

P h y s i c a l I n f r a s t r u c t u r e
C o n n e c t i v i t y B a c k g r o u n d
A4.37 | P a g e A p p e n d i x A : B a c k g r o u n d a n d C u r r e n t C o n d i t i o n s
Other Existing Water Conservation Measures/Management Tools
Per comprehensive plan policy, all rezoning applications that require a site analysis in the County
currently entail a Water Resource Impacts Assessment. Most proposed comprehensive plan amendments
currently entail a Water Supply Impact Review.
4.3 Energy
With more than 100 significant solar energy businesses already established in Arizona, building a robust industry that ranges from rooftop panel makers to major power generators, the state has become a preeminent location for the renewable energy industry. Along with a climate featuring more than 300 days of sunshine annually, a pro-business package, including the Renewable Energy Tax Incentive Program, have made Arizona especially advantageous. But there is more that can and needs to be done to promote this renewable energy source.
In 2014 the Solar Energy Industries Association (SEIA) ranked Arizona #7 nationwide (after CA, MA, NM, NJ, NC, and MO, in that order) in solar employment per capita, with an estimated 316 solar companies and 9,800 jobs. In fact, Arizona accounts for approximately 8.2% of the nation’s total employment in the solar industry and consistently ranks as a top state for photovoltaic energy generation.29
SEIA also reports that Arizona has the most installed solar electrical watts per capita and the second-highest solar energy capacity in the United States, with enough solar energy installed in the state to power 158,800 homes. The Tucson area enjoys a percent of possible sunshine value of 85 percent annually, second in the state only to Yuma.30 As of July 2009, 844 solar PV customers were connected to the electrical grid, an increase from 237 customers three years prior, for a total of 2,493 kW of solar photo voltaic distributed generation capacity. For current solar production in the form of residential, non-residential, and utility scale operations, the “Arizona Solar Map” found on the arizonagoessolar.org website shows the increasing use of solar energy. Power generation requires significant water consumption;31 water consumption varies greatly by the type of energy, for instance, solar (consumes far less) versus coal. For each kilowatt-hour of electricity not generated, 2/3 of a gallon of water can be saved.32 Conserving energy through the use of water efficient solar energy systems conserves water that would have been lost during power generation in other forms of fuel such as coal; and, conserving water helps reduce energy demands from pumping, moving and treating water. See Exhibit 4.3.a and 4.3.b for Pima County Electrical Utility Service Area maps.
29 Arizona Commerce Authority 30 Tucson Sustainable Design Assessment Team Report, June 11-13 2007, AIA Communities by Design 31 Ibid 32 Alternative Energy Options Accepted by Pima Association of Governments Regional Council, November 2006

P h y s i c a l I n f r a s t r u c t u r e
C o n n e c t i v i t y B a c k g r o u n d
A4.38 | P a g e A p p e n d i x A : B a c k g r o u n d a n d C u r r e n t C o n d i t i o n s
Overall Energy Supply and Demand Summary
Quick facts about Arizona’s energy system33:
Arizona’s Palo Verde, rated at 3,937 net megawatts, is the largest nuclear power plant in the
Nation.
Arizona ranked second in the nation in solar photovoltaic installations as of 2014.
Arizona, the 16th most populous state in 2010, ranked 45th in per capita energy consumption, partly
due to the State’s small industrial sector.
Arizona’s only operating coal mine, Kayenta, on the Navajo and Hopi reservations, supplies the 7 to
8 million short tons burned annually by the Navajo Generating Station’s three 750-megawatt units.
Arizona’s Renewable Environmental Standard requires 15 percent of the State’s electricity
consumed in 2025 to come from renewable energy resources; in 2013 , approximately 8 percent of
Arizona’s net electricity generation came from renewable resources, primarily from the Glen
Canyon and Hoover Dams.
Twenty-five percent of the energy consumed in Arizona homes is for air conditioning, which is
more than four times the national average of 6 percent according to the U.S. Energy Information
Administration’s Residential Energy Consumption Survey
Energy Supply
Approximately 73 percent of Arizona’s energy production is from coal, natural gas, and petroleum.
TABLE 4.3.a: Arizona Energy Production by Type
Energy Production Type BTU’s (trillion) Percentage of Total
Coal 459.9 27
Natural Gas 293.7 17
Petroleum 500.9 29
Nuclear Energy 327.3 19
Renewable Energy (includes conventional hydroelectric power, biomass, geothermal, solar thermal and photovoltaic and wind)34
136.6 8
Total 1,718.4 100
Source: U.S. Energy Information Administration, Energy Conservation Overview, U.S. Department of Energy, 2011.
33 U.S. Energy Information Administration, State Energy Data System, U.S. Department of Energy, July 2012 34 U.S. Energy Information Administration, Energy Consumption Overview, U.S. Department of Energy, 2011

P h y s i c a l I n f r a s t r u c t u r e
C o n n e c t i v i t y B a c k g r o u n d
A4.39 | P a g e A p p e n d i x A : B a c k g r o u n d a n d C u r r e n t C o n d i t i o n s
As shown in the previous table, Arizona produces 1,718.4 trillion BTUs of energy. 35 The ten largest
Arizona plants by generation capacity in 2010 were: 36
The Palo Verde (nuclear) run by Arizona Public Service Company
Navajo (coal) run by the Salt River Project
Gila River Power Station (gas) by the Gila River Power Station Lp
Springerville (coal) by Tucson Electric Power Company
Glen Canyon dam (hydroelectric) by the US Bureau of Reclamation
Santan (gas)
Mesquite Generating Station (gas) by Mesquite Power LLC
Harquahala Generating Project (gas) by New Harquahala Generating Co., LLC
Hoover Dam (hydroelectrical) by the US Bureau of Reclamation
Cholla (coal) by the Arizona Public Service Company.
Arizona’s electrical power currently comes primarily from coal, natural gas, and nuclear generation.37
Electricity used in Pima County comes mainly from coal deposits in the northeast part of the state and
western New Mexico.38 Coal-fired plants provide almost 2/5 of the State’s demand for electricity. The
remainder is supplied mostly by natural gas fired plants and nuclear power. More than 1/3 of the coal
produced goes to Nevada.39
Power Utilities in Pima County include:
Tucson Electric Power Co. (TEP)
Trico Cooperative (Trico)
Arizona Public Service (APS)
Western Area Power Administration (WAPA)
Tohono O’odham Utility Authority (TOUA)
Sulphur Springs Valley Electric Cooperative (SSVEC)
Ajo Improvement Company
Southwest Natural Gas
Arizona Electric Power Cooperative40
35 Ibid 36 U.S. Energy Information Administration, U.S. Department of Energy, 2010. 37 Power Arizona, ArizonaExperience.org, 2013 38 Ties that Bind: Plans for New Energy Infrastructure in Pima County, Arizona, Julia Fonseca and Neva Connolly, Pima County
Office of Sustainability and Conservation, February 2012 39 U.S. Energy Information Administration, Arizona State Energy Profile Analysis, U.S. Department of Energy, October 2009 40 Ties that Bind: Plans for New Energy Infrastructure in Pima County, Arizona, Julia Fonseca and Neva Connolly, Pima County
Office of Sustainability and Conservation, February 2012

P h y s i c a l I n f r a s t r u c t u r e
C o n n e c t i v i t y B a c k g r o u n d
A4.40 | P a g e A p p e n d i x A : B a c k g r o u n d a n d C u r r e n t C o n d i t i o n s
Tucson Electric Power (TEP) is the largest electricity provider in Pima County.41 TEP relies primarily on
coal, supplied from outside the region, representing approximately 93 percent of power production fuel
sources.42 The three TEP generating stations within Tucson providing much of the Tucson area’s energy
(over 650 MW) needs are:
Sundt facility which is the largest in Pima County and uses coal, oil, natural and/or landfill gas
DeMoss-Petrie generator can use gas or oil
North Loop units fired by natural gas.
All three plants are necessary to meet peak power demands during the summer. TEP also uses landfill
gases and solar to produce additional power from smaller facilities. The largest electricity provider in
the State is Arizona Public Service (APS) which provides electricity services for Ajo, the Organ Pipe
National Monument, and a small portion of the San Pedro River Valley in northeast Pima County. 43
The Central Arizona Project (CAP) generates power at the Navajo plant to operate pumps that lift CAP
water to Tucson, the San Xavier District, and the Mission mine. Tucson is nearly the highest elevation
of the CAP canal therefore incurring the greatest accumulated pumping costs, but the City is not charged
more than other CAP water customers.44
Arizona imports virtually all of its natural gas and petroleum products.45 Arizona receives its petroleum
supply from southern California and from El Paso mainly through the Kinder-Morgan pipeline.46 In
addition, the All-America Crude Oil Pipeline passes through the San Pedro Valley but does not go
through Tucson. The petroleum products that move through Pima County include diesel, jet fuel, crude
oil, ethanol and gasoline.47
El Paso Natural Gas (EPNG) provides wholesale natural gas to Southwest Gas, TEP and other major
consumers in Pima County. EPNG has two distribution stations in Pima County, one in Vail and the other
in north Tucson. Natural Gas has long been available to Ajo due to the mines where elsewhere
41 Ibid 42 Tucson Sustainable Design Assessment Team Report, June 11-13 2007, AIA Communities by Design 43 Ties that Bind: Plans for New Energy Infrastructure in Pima County, Arizona, Julia Fonseca and Neva Connolly, Pima County
Office of Sustainability and Conservation, February 2012 44 Ibid 45 Power Arizona, ArizonaExperience.org, 2013 46 Ties that Bind: Plans for New Energy Infrastructure in Pima County, Arizona, Julia Fonseca and Neva Connolly, Pima County
Office of Sustainability and Conservation, February 2012 47 Ties that Bind: Plans for New Energy Infrastructure in Pima County, Arizona, Julia Fonseca and Neva Connolly, Pima County
Office of Sustainability and Conservation, February 2012 (pg. 7)
P h y s i c a l I n f r a s t r u c t u r e
C o n n e c t i v i t y B a c k g r o u n d
A4.41 | P a g e A p p e n d i x A : B a c k g r o u n d a n d C u r r e n t C o n d i t i o n s
connections can be a limiting factor. The main body of the Tohono O’odham Nation, Altar Valley and
much of Pima County and a portion of San Pedro Valley lack access to natural gas.48
Arizona has one nuclear power plant – Palo Verde which is the largest nuclear plant in the nation.49 Palo
Verde provides about ¼ of the State’s total electricity generation.
The major renewable energy source remains hydroelectrical power derived from the Colorado River. In
2010, 11.9 percent of the electricity capacity derived from renewable supplies, including 10.1 percent
from hydroelectrical power and 1.8 percent from wood/wood waste.50 In 2007, the U.S. Department of
Energy designated Tucson as a “Solar America City”. Arizona’s large desert areas offer some of the
highest solar power potential in the country.51
A number of fueling stations in the Tucson area offer alternative fuels, including biodiesel, compressed
natural gas (CNG), electric power, ethanol (E85) and propane and the number of distribution and retail
sites is expanding rapidly. CNG, propane and electric were among the first alternative fuel sources to be
used. Tucson was one of the first five official launch markets for the Nissan LEAF (an all-electric
passenger vehicle).52 All-electric and plug-in hybrid vehicles are now prevalent. Wind energy in Arizona
is largely limited to the consistent winds on the Colorado Plateau.53
Energy Demand
Arizona uses energy primarily in the forms of electricity and petroleum (for transportation).54 While
Arizona ranks near the middle of states in total energy consumption per capita, energy consumption is
low and the State economy is not energy intensive. More than ½ of Arizona households rely on
electricity for home heating mainly from coal-fired plants, hydroelectric power, and nuclear power.55
Residential consumers account for 394.7 trillion BTUs or 41% of the total energy use in the State,
commercial for 345.5 BTUs or 36%, and 221 BTUs at 22% for industrial development.56 Arizona
households use 26% less energy than the U.S. average. Arizona consumers use 17% of their overall
consumption for air conditioning whereas the national average is 6% with a greater percentage going
48 Ibid 49 U.S. Energy Information Administration, State Energy Data System, U.S. Department of Energy, July 2012 50 U.S. Energy Information Administration, Arizona State Energy Profile Analysis, U.S. Department of Energy, October 2009 51 Ibid 52 Ibid 53 Power Arizona, ArizonaExperience.org, 2013 54 Ibid 55 U.S. Energy Information Administration, Arizona State Energy Profile Analysis, U.S. Department of Energy, October 2009 56 U.S. Energy Information Administration, Energy Consumption Overview 2011

P h y s i c a l I n f r a s t r u c t u r e
C o n n e c t i v i t y B a c k g r o u n d
A4.42 | P a g e A p p e n d i x A : B a c k g r o u n d a n d C u r r e n t C o n d i t i o n s
toward space heating nationally (41%) than on a state level (15%).57 Three fourths of the natural gas
consumption in Arizona is for electricity. Two-fifths of Arizona households rely on natural gas for home
heating. The middle range energy consumption by the state also means that the 8 percent of renewable
energy sources accounts for an even smaller impact on the use and type of energy.
Source: U.S. Energy Information Administration, Arizona State Energy Profile Analysis, October 2009 Figure 1: Arizona State Energy Profile Analysis, 2009
57 U.S. Energy Information Administration, Arizona State Energy Profile Analysis, October 2009

P h y s i c a l I n f r a s t r u c t u r e
C o n n e c t i v i t y B a c k g r o u n d
A4.43 | P a g e A p p e n d i x A : B a c k g r o u n d a n d C u r r e n t C o n d i t i o n s
Source: U.S. Energy Information Administration, Arizona State Energy Profile Analysis, October 2009
Figure 2: Arizona State Energy Profile Analysis, 2009

P h y s i c a l I n f r a s t r u c t u r e
C o n n e c t i v i t y B a c k g r o u n d
A4.44 | P a g e A p p e n d i x A : B a c k g r o u n d a n d C u r r e n t C o n d i t i o n s
Source: Arizona Solar Power Map, National Renewable Energy Laboratory, July 2007
Figure 3: Arizona Solar Power map
P h y s i c a l I n f r a s t r u c t u r e
C o n n e c t i v i t y B a c k g r o u n d
A4.45 | P a g e A p p e n d i x A : B a c k g r o u n d a n d C u r r e n t C o n d i t i o n s
Renewable Energy Incentive District (REID)
The Renewable Energy Incentive District (REID) ordinance was adopted by the Pima County Board of
Supervisors to entice large-scale renewable energy facilities to develop on specifically selected sites.
Given Pima County’s abundant solar energy resources, the County wants to encourage its use to off-set
the need for fossil fuels if the photovoltaic solar facilities, particularly on REID sites which are lands that do
not compromise other County interests such as protecting unique desert resources. Establishing the REID
sites minimizes potential adverse impacts and provides the development community more certainty in
where to locate. REID solar facilities are limited to photovoltaic systems or “other technology that does
not use any more water than would be used by a photo-voltaic system” as photovoltaic systems use little
to no water. Incentives to develop on REID sites are offered by the various county development review
departments and offices such as waived or reduced regulations and fees and expedited review processes.
Promoting renewable energy sources also provides clean jobs and adds to the variety of industries upon
which southern Arizona’s economy is based. And, as solar development increases, it is likely that solar
energy costs will decrease and photovoltaic production will become more and more cost-effective.
Other Forms of Clean Energy
In addition to solar and wind, the Arizona Corporation Commission’s Renewable Energy Standards also
encourage utility companies to use biomass, biogas, geothermal and other similar technologies to
generate “clean” energy to power Arizona’s future. Pima County’s Regional Wastewater Reclamation
Department (RWRD) is embarking on using biogas byproduct of wastewater treatment from its Tres Rios
Wastewater Reclamation Facility. The Tres Rios WRF produces digester gas mostly of methane and
carbon dioxide, a byproduct of the anaerobic digestion process.
Net Zero Energy
Local government energy policy commonly focuses on the supply of the necessary energy for the
community. Energy efficiency is rarely considered a “source” of energy. However energy efficiency is the
largest untapped “source” of cost effective energy. The baseline for building energy efficiency is the
International Energy Conservation Code (IECC). Pima County adopted the 2012 IECC which is 30% more
efficient compared with the 2006 IECC. A study by the U.S. Department of Energy found that the cost of
the energy efficiency improvements in a typical 2012 code home are approximately $3,256 more than a
2006 code home with home owner savings per year of $293 for a return on investment of 7%.
In addition to solar and wind, the Arizona Corporation Commission’s Renewable Energy Standards also
encourage utility companies to use biomass, biogas, geothermal and other similar technologies to
generate “clean” energy to power Arizona’s future. Pima County’s Regional Wastewater Reclamation
Department (RWRD) is embarking on using biogas byproduct of wastewater treatment from its Tres Rios
Wastewater Reclamation Facility. The Tres Rios WRF produces digester gas mostly of methane and
carbon dioxide, a byproduct of the anaerobic digestion process.

P h y s i c a l I n f r a s t r u c t u r e
C o n n e c t i v i t y B a c k g r o u n d
A4.46 | P a g e A p p e n d i x A : B a c k g r o u n d a n d C u r r e n t C o n d i t i o n s
With its proximity to major markets coupled with large expanses of flat rooftops and relatively flat, open
landscape, Pima County is well positioned for developing a thriving renewable energy industry that is
prepared to satisfy the demands of the low carbon economy of the future. Per dollar invested, renewable
energy and efficiency generate more jobs than any other energy-related industry sector and they rely
primarily on the local workforce, insuring the jobs stay local. With the potential to host more than
8,000 gigawatts of solar statewide, wide scale deployment over the next 10-15 years would generate tens
of thousands of construction-phase jobs, $10 billion in earnings and economic activity, and more than
4000 permanent jobs and $750 million annually in earnings and additional economic activity. Robust
investment in a the development of a clean, renewable energy supply, will build a foundation for
economic stability and growth, generating thousands of new high-paying jobs, boosting economic activity,
conserving scarce water supplies, improving public health and enhancing energy security.
4.4 Wastewater Treatment
The Pima County Regional Wastewater Reclamation Department (RWRD) provides design, management
and maintenance of the sanitary sewer system, including the conveyance and treatments systems (3,400+
miles of sewer, two metropolitan wastewater treatment plants and seven sub-regional facilities).
Exhibits 4.4.a and 4.4.b, Sewer Service Areas, included at the end of this chapter, show Designated
Management Area Wastewater Treatment Facilities, Non-Designated Management Area Treatment
Facilities, Marana Wastewater Reclamation Facility Service Area, and Pima County Regional Wastewater
Reclamation Department Service Area by planning area.
Table 4.4.a shows Sewer Service Areas total acreage.

P h y s i c a l I n f r a s t r u c t u r e
C o n n e c t i v i t y B a c k g r o u n d
A4.47 | P a g e A p p e n d i x A : B a c k g r o u n d a n d C u r r e n t C o n d i t i o n s
TABLE 4.4.a: Sewer Service Areas Total Acreage by Planning Area
Planning Area Pima County Regional Wastewater Reclamation Department Service Area
(Acres)
Marana Wastewater Reclamation Facility
Service Area (Acres)
1) Avra Valley 195 52,829
2) Tucson Mountains 11,519 2,147
3) Southwest 11,980 0
4) Altar Valley 0 0
5) Upper Santa Cruz 8,752 0
6) Mountain View 0 0
7) Southeast 13,162 0
8) Central 70,596 0
9) Catalina Foothills 50,233 0
10) Rincon Valley 6,141 0
11) Tortolita 26,026 20,140
12) San Pedro 7 0
13) Ajo-Why 0 0
Total All Planning Areas: 198,610 75,116
Total County: 198,610 75,116
Source: Pima County Geographic Information Systems, 2013
Wastewater Assessment
Avra Valley Planning Area (1)
Inventory and Service Baseline
This planning area is served by one wastewater treatment facility, the Marana Wastewater Reclamation
Facility (WRF). Only the Marana facility is physically located in the planning area serving the residents in
the northwestern portion of the town.
The Marana WRF, located in the northern portion of the town, is currently operated by the Town of
Marana and has a Designated Management Agency (DMA) status. The DMA status gives the town the
authority to construct and operate new reclamation facilities in Marana. The Marana facility serves
several master planned communities, including the Gladden Farms, Rancho Marana, and San Lucas, as
well as the Marana Main Street and the Town’s Municipal Complex. The facility is permitted to treat a

P h y s i c a l I n f r a s t r u c t u r e
C o n n e c t i v i t y B a c k g r o u n d
A4.48 | P a g e A p p e n d i x A : B a c k g r o u n d a n d C u r r e n t C o n d i t i o n s
design flow of 0.70 million gallons per day (mgd). The town currently operates and maintains the
sanitary sewer conveyance system tributary to the facility.
Two privately owned package plants are also located in this planning area, one serving the Marana High
School and the other one serving the Marana Community Correctional Facility. The plants have capacity
of 0.07 mgd and 0.13 mgd and are permitted to treat onsite sewage only.
Existing Deficiencies
Expansion of the treatment and conveyance systems is predicated upon growth; its expansion primarily
driven by the development community. Current development and growth patterns suggest that the Tres
Rios facility service area is being adequately served by RWRD. Due to topographic constraints, the
service connection to the Tres Rios facility for future developments downstream the facility may not be
feasible without the addition of substantial infrastructure such as lift stations and lengthy conveyance
lines. Future capacity allotments would require assessment by RWRD on a project-by-project basis. The
Department has not identified and is not aware of any major service deficiencies within this area.
Potential Remedies and Projects
Necessary system augmentation is anticipated as new and infill developments occur in the planning
area. The Department currently requires that any expansion of sanitary system resulting from new
development shall be paid for by the developer or development.
Tucson Mountains Planning Area (2)
Inventory and Service Baseline
RWRD and the Town of Marana are the wastewater service providers in this planning area. There are
three wastewater reclamation facilities in this planning area: the Tres Rios Water Reclamation Facility
(TRWRF), the Agua Nueva (WRF), and the Rillito Vista WRF.
The service area includes a mixture of sewer service users, including residential, commercial and
industrial, of which the dense residential developments of portion of the Town of Marana (e.g.
Continental Ranch) and the City of Tucson comprise the majority. A well-served widespread sewer
system exists for the Tres Rios and Agua Nueva wastewater facilities. Unincorporated areas of less dense
suburban population are served by private individual septic systems. Such are the medium and large
sized residential lots and single-family subdivisions located in the central portion of the planning area.
The Tres Rios WRF, located on N. Casa Grande Highway, collects and treats wastewater from the City of
Tucson and surrounding areas. The facility is permitted to treat a design flow of 50 million gallons per
day (mgd) of wastewater. The majority of the effluent produced is discharged into the Santa Cruz River.
The Roger Road WRF, located on W. Sweetwater Drive, along the east side of the Santa Cruz River,
began operating in the 1950’s is no longer in service and has been replaced by the Agua Nueva WRF. The
P h y s i c a l I n f r a s t r u c t u r e
C o n n e c t i v i t y B a c k g r o u n d
A4.49 | P a g e A p p e n d i x A : B a c k g r o u n d a n d C u r r e n t C o n d i t i o n s
plant had a maximum capacity of 41.0 mgd and collected and treated wastewater from within the City
of Tucson and surrounding areas to the south as far as the state prison on Wilmot Rd., and east as far as
the unincorporated community of Vail. The plant’s effluent was discharged into the Santa Cruz River, or
reused for turf irrigation and other purposes, primarily through the City of Tucson’s reclaimed water
system. Sludge produced at the facility was transferred to the Regional Biosolids Facility for further
treatment.
The Roger Road WRF was replaced by a new 32 mgd water reclamation facility, Agua Nueva WRF. The
Roger Road plant was decommissioned after the new water reclamation facility was built.
Lastly, the Rillito Vista WRF is operated by the Town of Marana and comprised of a pond percolation
wastewater treatment system, currently serves the Rillito Vista subdivision of approximately 67 lots.
One private septic facility in this planning area is owned and operated by the Milagro Subdivision and
Homeowner’s Association. Disposal is via wetlands and subsurface drip irrigation. The system serves 28
homes.
Existing Deficiencies
The Department has not identified and is not aware of any existing service deficiencies within this
planning area. The Department implemented the Regional Optimization Master Plan (ROMP) to ensure
adequate treatment and conveyance capacity is available within this planning area and the greater
metropolitan area.
Potential Remedies and Projects
Expansion of the treatment and conveyance systems is predicted upon growth; its expansion primarily
driven by the development community. Currently, RWRD adequately serves existing development in the
planning area. The ways in which this area develops will dictate the type of infrastructure expansion
needed for RWRD to continue to effectively serve the area. Developer driven expansion of conveyance
system will be required as infill development occurs. The Department currently requires that any
necessary expansion of sanitary systems resulting from new development shall be paid for by the
developer or development.
Increased treatment capacity at the Tres Rios WRF, will meet the long-term treatment capacity needs
for the area and the majority of tributary metropolitan area.
Growth and development, and particularly in the western portion of this area, is limited due to
topographical and environmental constraints, therefore the system infrastructure expansion in this
direction is unlikely.
Phase two of the previously mentioned ROMP included an upgrade and capacity expansion of the Tres
Rios WRF from 37.5 mgd to 50 mgd. The majority of flows from the Roger Road WRF service area is now
being treated at the Tres Rios WRF after the facility expansion was completed in 2014.

P h y s i c a l I n f r a s t r u c t u r e
C o n n e c t i v i t y B a c k g r o u n d
A4.50 | P a g e A p p e n d i x A : B a c k g r o u n d a n d C u r r e n t C o n d i t i o n s
Concurrently phase three of the ROMP implementation was completed, including the construction of
the Water Campus just north of the existing Roger Road WRF. The Water Campus replaced the old Roger
Road plant and followed by the decommissioning of the Roger Road facility.
The new 32 million gallon-a-day Water Campus reduced the levels of ammonia and nitrogen in the
effluent discharged into the Santa Cruz River, and was equipped with state-of-the art odor control
features. The facility is highly automated and uses an innovative treatment technology that saves
significant electrical power. No solids are handled at Water Campus; instead solids are conveyed to and
treated at the upgraded Tres Rios WRF.
Southwest Planning Area (3)
The purpose of the wastewater management portion of the Southwest Infrastructure Plan (SWIP) is to
quantify the impending consequences of proposed land uses in this planning area by developing a
proposed interceptor sewer sizing and conceptual alignment plan. This servicing strategy considered
serviceability and conversion issues for areas currently using septic systems. The infrastructure sizes,
alignments, and locations provided in the SWIP are for planning purposes. Final details must be
determined in follow-on preliminary and detailed design stages.
In addition, the study has included Pima County’s ongoing and future planned upgrades at the Avra
Valley WWTF and quantified the existing and committed capacity at the plant in light of the demand
forecasts posed by the envisioned land uses in its upstream tributary area. Key wastewater treatment
issues addressed by this study include effluent discharge issues posed by the receiving water bodies,
regulatory constraints and treatment processes, biosolids handling, and opportunities for effluent water
re-use. Probable capital and operations and maintenance (O&M) costs are included in the SWIP.
Analysis and Assumptions
Standard Pima County assumptions were used to estimate the sewer flows, including the following
conservative assumptions. The average wastewater generation for residential development is 85 gallons
per capita per day. The average wastewater generation for commercial and industrial developments is
1,000 gallons per acre per day. The average persons per dwelling unit is 2.7. Wastewater generation at
existing school sites was calculated as Number of students x 20 gallons per student per day. Additional
assumptions and design criteria are provided in the SWIP.
For planning purposes, those areas with densities below an assumed cost-effective threshold of 1.33
residences per acre (RAC) were not serviced via traditional gravity sewers. It was assumed that these
areas would be served by septic systems should they be developed. Triggering flows for any proposed
treatment plant expansion were set at 85% of the plant design inflow.

P h y s i c a l I n f r a s t r u c t u r e
C o n n e c t i v i t y B a c k g r o u n d
A4.51 | P a g e A p p e n d i x A : B a c k g r o u n d a n d C u r r e n t C o n d i t i o n s
Basis of Existing and Future Sewage Generation Estimates
The volume of wastewater generated by existing developments was roughly estimated using
Transportation Analysis Zone (TAZ) data from the Pima Association of Government (PAG). This TAZ data
provided population data for both the year 2000 and projected populations at 2030. Current year (2007)
population estimates were extrapolated from this 2000/2030 dataset assuming a constant linear growth
rate.
Because TAZ data only extends out to the year 2030, the anticipated SWIP build-out will occur beyond
the range of the current TAZ time frame. Future build-out flows were estimated based on the projected
land use and population data provided by Pima County Planning Department.
Delineation of Sewer Sub-basins and Sub-areas
The study area within the Avra Valley sewer basin was divided into eight sub-basins numbered 1 through
8. These sub-basins were defined based on their natural drainage patterns and existing infrastructure.
Given topographic conditions at the SWIP boundary, it may be possible to service additional adjacent
areas in the future. One potential servicing expansion to the southwest towards Three Points was
considered, however land uses in this area would quickly become constrained by the Conservation Land
System (CLS), which forms the backbone of the Sonoran Desert Conservation Plan (SDCP).
Within the study area (but outside the delineated Avra Valley sewer service sub-basins) are three
distinct sub-areas that are notable based upon their drainage condition. The 6,801 acre area located in
the northwest corner of the study area cannot naturally drain to the Avra Valley WWTF via gravity flow.
Given that the proposed growth density in this area is relatively low, on-site septic systems may prove to
be the most feasible means of disposing of wastewater generated within this area.
The 5,219 acre area located in the eastern portions of the study area is part of the Agua Nueva WWTP
sewer basin. In addition, on the ridge line between this area and the delineated Avra Valley WWTF
sewer basin there is an indeterminate treatment destination area where future wastewater could
potentially be directed to either the Avra Valley WWTF or the Agua Nueva WWTP. As directed by Pima
County, areas outside the specifically delineated Avra Valley WWTF sewer basin were not examined in
this Infrastructure Plan. Optimal means of servicing these subareas may be studied in subsequent
planning projects.
Projected Population and Flow Statistics
The projected populations provided by Pima County planners at the time the SWIP was prepared were
used to generate future wastewater flow estimates. Three growth scenarios were developed in Phase 1,
describing higher density, medium density, and lower density scenarios. The Phase 2 population was
closest to the Phase 1 medium density scenario.
In general, it does not make economic sense to provide public sewer service to subdivisions in locations
where houses are located far away from each other. For the purposes of this planning level effort, only

P h y s i c a l I n f r a s t r u c t u r e
C o n n e c t i v i t y B a c k g r o u n d
A4.52 | P a g e A p p e n d i x A : B a c k g r o u n d a n d C u r r e n t C o n d i t i o n s
areas where the proposed RAC is higher than 1.33 (e.g. one unit on a lot equal to or larger than 0.75
acres) was considered for public sewer servicing. Based on this assumption, low density areas with a
proposed RAC less than 1.33 will be on septic systems and will not contribute wastewater to the public
sewer facilities.
TABLE 4.4.b: Acreage of Sub-basins and Sub-areas
Sub-basins and Sub-areas Total Acreage
1 5,500
2 4,851
3 2,691
4 2,241
5 1,895
6 4,264
7 3,853
8 2,771
Non-Serviceable Area (by Gravity to Avra Valley WWTF) 6,801
Area in Roger Road WWTP Sewer Service Basin 5,219
Indeterminate Treatment Destination Area 3,519
Source: Pima County Southwest Infrastructure Study, 2007.
TABLE 4.4.c: Projected Total and Effective Population
Sub-basins and Sub-areas Total Acreage
1 5,500 2 4,851 3 2,691 4 2,241 5 1,895 6 4,264 7 3,853 8 2,771 Non-Serviceable Area (by Gravity to Avra Valley WWTF) 6,801 Area in Roger Road WWTP Sewer Service Basin 5,219 Indeterminate Treatment Destination Area 3,519
Source: Pima County Southwest Infrastructure Study, 2007.

P h y s i c a l I n f r a s t r u c t u r e
C o n n e c t i v i t y B a c k g r o u n d
A4.53 | P a g e A p p e n d i x A : B a c k g r o u n d a n d C u r r e n t C o n d i t i o n s
TABLE 4.2.d: Projected Total and Effective Population (Phase II Density Scenario)
Sub-basins and Sub-areas Total Population
Effective Population
Percent of Public Sewer
1 36,904 29,654 80.4 2 23,512 21,244 90.4 3 20,623 19,688 95.5 4 5,743 3,424 59.6 5 8,073 6,288 77.9 6 17,240 13,338 77.4 7 6,229 1,231 19.8 8 5,500 4,010 72.9 Sub-Totals 123,822 98,877 79.9 Non-Serviceable Area (by Gravity to Avra Valley WWTF) 4,126 0 0.0 Area in Roger Road WWTP Sewer Service Basin 20,785 16,926 81.4 Indeterminate Treatment Destination Area 5,584 2,079 37.2
Source: Pima County Southwest Infrastructure Study, 2007.
As expected, denser developments lead to higher percentages of the population being serviced by
public sewers. The total predicted Phase 1 influent ADWF flows at the Avra Valley WWTF ranged from
6.3 MGD for the lower density scenario up to 11.7 MGD for the higher density scenario. Inflows under
the medium density scenario and the higher density scenario are higher than previously anticipated
inflows to this facility. The addition of industrial and commercial lands to the development concept in
Phase 2 resulted in a total predicted influent ADWF flow at the Avra Valley WWTF of 11.3 MGD.
Residual Capacity of Existing Sewers
For current conditions the great majority of the wastewater collection and conveyance system has
sufficient capacity to convey the existing flow during peak wet weather flow periods. However, the
residual capacity in the existing system is not sufficient to accommodate the proposed future flows at all
locations.
Proposed Expansion of Conveyance Systems
Proposed expansion of conveyance systems is discussed in detailed and mapped in the SWIP study for
this planning area.
Sub-basin/Sub-area Phase II Density Scenario
A revised wastewater servicing plan was developed during Phase II to accommodate the residential,
industrial, and commercial lands in the altered development concept. The service areas include Ryan

P h y s i c a l I n f r a s t r u c t u r e
C o n n e c t i v i t y B a c k g r o u n d
A4.54 | P a g e A p p e n d i x A : B a c k g r o u n d a n d C u r r e n t C o n d i t i o n s
Airfield to support industrial employment possibilities. During both Phase 1 and Phase 2 it was
determined that the existing system is not sufficient to accommodate the entirety of the anticipated
future flows. It was assumed that in many cases the conveyance capacity of existing sewers would be
augmented by the addition of sewers installed in parallel with existing sewers. The existing pipes
requiring augmentation are highlighted in red.
For Phase 1, in order to service the proposed development in the southwest corner of the SWIP area, a
new trunk sewer will be necessary. The proposed trunk, which extends along the West Ajo Highway, is
schematically shown on the maps for the purposes of this study. The eventual constructed alignment
must be determined through a formal route study. This trunk has been sized to handle wastewater
generated in the adjacent yellow-colored areas within the SWIP boundary.
For Phase 2, the concepts evolved. In Basin 6 the flow from the northeast was split. One segment flows
to the south in an 8-inch line and then west in a 12-inch line. The other segment flows west and then
south in a 12-inch line. It was assumed that the flow split could be accomplished so that the two
segments would not exceed capacity. If this assumption is incorrect and the flow cannot be split to avoid
exceeding capacity in either segment, portions of these sewers would have to be augmented. In order to
service the proposed development in the southwest corner of the SWIP area, new trunk sewers will be
necessary.
The proposed trunk sewers, which extend along West Ajo Highway and skirt the west edge of Ryan
Airfield are schematically shown in the SWIP study. The eventual constructed alignment should be
determined through a formal route study. The route study should consider at least the following factors:
the routing of the sewer or sewers to serve this area, the size of the sewers, and how much of the area,
if any, could be served by a sewer west of Ryan Airfield.
Wastewater Treatment Capacity and Currently Proposed Expansion
Existing Treatment Capacity
The Avra Valley WWTF is a biological nutrient removal oxidation ditch with an ADWF design capacity of 4
MGD.
Expansion Acheived in CIP
Due to the ongoing and rapid growth in the Avra Valley WWTF service area, Pima County authorized a
plant expansion of 4.0 MGD additional capacity. The new expansion constructed two new parallel 2.0
MGD process trains. The original oxidation ditch was designed and built as a temporary facility. After the
4.0 MGD expansion, the original oxidation ditch was taken out of service. The County then replaced the
existing system with the new 4.0 MGD ditch system to the Modified Ludzak-Ettinger (MLE) process to
create additional capacity.
The improvements provided an additional 4.0 MGD capacity include a new inlet gravity sewer and
influent lift station, modifications to the headworks, two biological nutrient removal oxidation ditches,

P h y s i c a l I n f r a s t r u c t u r e
C o n n e c t i v i t y B a c k g r o u n d
A4.55 | P a g e A p p e n d i x A : B a c k g r o u n d a n d C u r r e n t C o n d i t i o n s
clarifiers, continuous backwashing deep bed filters, ultraviolet (UV) disinfection, sludge holding basins,
sludge thickening equipment, dewatering equipment, means of additional effluent discharge to
percolation basins and/or the Black Wash spray fields, and upgrades to the process water, odor control,
and electrical systems. Initially, solids were stored on-site, dewatered to 5% to 6% solids content, and
trucked to the Ina Road WPCF for further digestion. Future on-site aerobic digestion may be considered
at some point.
The influent lift station and headworks were designed for an ultimate ADWF flow of 6.2 MGD and a peak
flow of 12.0 MGD. Solids handling from both new treatment trains and the existing system are
combined and thickened in an aerated and mixed holding tank prior to aerobic digestion. The sludge is
dewatered and trucked to land application sites. A tertiary filtration area was planned and basin
capacity constructed for ultimate 6.2 MGD. The filtration and ultraviolet disinfection equipment was
sized to treat 4.0 MGD.
This 4.0 MGD expansion was programmed within the CIP and is completed. The total combined cost for
the Avra Valley WWTF 4.0 MGD Biological Nutrient Removal Oxidation Ditch (BNROD) Expansion project
delivery is $44,900,000. Included in these costs is the purchase of heavy equipment to operate and
maintain the effluent disposal ponds in a proactive manner to maximize their disposal capacity. This
amount is being financed through a combination of 2004 Bonds under an amended bond authorization
and System Development Funds.
Additional Required Treatment Capacity Expansion
In Phase 1 Pima County planners developed three SWIP scenarios with varying levels of development
intensity. From a wastewater treatment design point of view, the total required treatment capacity at
the Avra Valley WWTF for the higher, medium, and lower density scenarios were considered.
Lower Density Scenario
An expansion adding 4.0 MGD capacity has been programmed into the CIP and is in the process of being
delivered. With this 4.0 MGD addition, the Avra Valley WWTF could theoretically treat an ADWF of up to
6.2 MGD, however the original oxidation ditch was designed and constructed as a temporary facility and
has already been in operation for an extended period of time. Once the 4.0 MGD addition is finished, it
is recommended that this temporary facility be taken out of service. A new facility expansion would then
be pursued to provide sufficient treatment capacity to support the lower density scenario ADWF of 6.5
MGD.
Avra Valley WWTF requirements related to this scenario will include maintaining the proposed 4.0 MGD
and replacing the existing 2.2 MGD capacity oxidation ditch with an equivalent means of treating 2.5
MGD capacity. Through these additions the Avra Valley WWTF would continue to be capable of
producing Class A+ effluent.

P h y s i c a l I n f r a s t r u c t u r e
C o n n e c t i v i t y B a c k g r o u n d
A4.56 | P a g e A p p e n d i x A : B a c k g r o u n d a n d C u r r e n t C o n d i t i o n s
Medium Density Scenario
An ADWF capacity of 9.5 MGD will be required to support the population represented by the medium
density scenario. Avra Valley WWTF requirements related to this scenario will include the maintenance
of a total capacity of 4.0 MGD from the ongoing expansion, and the construction of an additional 5.5
MGD of ADWF treatment processes capable of producing Class A+ effluent.
Higher Density Scenario
An ADWF capacity of 12.0 MGD will be required should the higher density development scenario
transpire. Avra Valley WWTF requirements related to this scenario will include the maintenance of a
total capacity of 4.0 MGD from the ongoing expansion, and the construction of an additional 8.0 MGD of
ADWF treatment processes capable of producing Class A+ effluent.
In Phase 2, Pima County planners transitioned to a single most probable SWIP development scenario
with projected levels of development intensity. An ADWF capacity of 12.0 MGD will be required for the
Phase 2 development scenario. Avra Valley WWTF requirements related to this scenario include the
maintenance of a total capacity of 4.0 MGD from the ongoing expansion, and the construction of an
additional 8.0 MGD of ADWF treatment processes capable of producing Class A+ effluent.
Probable Costs for Effluent Disposal
As part of the SWIP, the probable costs for effluent utilization were developed based on three options.
The first option assumed 100% of the treated effluent is recharged using on-site percolation ponds. The
second option used a combination of percolation ponds and riparian restoration. The third option
maximized urban re-use in combination with either percolation or both percolation and habitat
restoration. Under option three, three major regional parks were included.
Summary of Wastewater Capital Costs
SWIP-related wastewater capital projects to be funded by Pima County (developer-borne conveyance
costs have been omitted) depended upon the density scenario during Phase 1 but was simplified in
Phase 2 to represent total approximate cost ranging from $127,652,000 to $165,067,000 in 2007.
Altar Valley Planning Area (4)
According to the 2000 and 2010 US Bureau of the Census, Altar Valley planning area as one of the lowest
population densities in Pima County with 7 persons per square mile. The area includes portion of the
Tohono O’odham Nation, the Buenos Aires National Wildlife refuge, the Baboquivari Peak Wilderness
Area, the Coyote Mountain Wilderness Area, the Ironwood Forest National Monument and slivers of the
Tohono O’odham Nation San Xavier District. Privately owned lands constitute approximately 16.8
percent of the planning area.

P h y s i c a l I n f r a s t r u c t u r e
C o n n e c t i v i t y B a c k g r o u n d
A4.57 | P a g e A p p e n d i x A : B a c k g r o u n d a n d C u r r e n t C o n d i t i o n s
Most of the land in this planning area are under the Conservation Land System. Most of the planning
area is undeveloped. Therefore, most of the wastewater systems is serviced by septic tanks. Commercial
development is limited to Three Points and Arivaca. Given the low population density, the low 2 percent
increase in population between 2000 and 2010, the presence of a variety of wilderness areas and the
current land use trends, it is anticipated that this area will remain serviced by private septic tanks or
small treatment plants.
Upper Santa Cruz Planning Area (5)
Inventory and Service Baseline
There are two wastewater service providers in this planning area; the Town of Sahuarita and Pima
County Regional Wastewater Reclamation Department (RWRD). There are two facilities physically
located in this area, the Green Valley Wastewater Reclamation Facility (WRF), being the primary
wastewater service provider for the Area, and the Arivaca Junction WRF, serving two residential
subdivisions. Both facilities are managed and operated by RWRD.
The Green Valley WRF, located at 19600 S. Old Nogales Highway, along the east side of the Santa Cruz
River, is comprised of two independent treatment trains that are permitted to treat a design flow of 4.1
million gallons per day (mgd). Additional service areas for the Green Valley WRF will be determined by
growth in the PAG Plan Joint Management Areas.
The Arivaca Junction WRF, located at 28601 S. Nogales Highway at the Pima/Santa Cruz County line,
consists of a 3.2 acre pond and is permitted to treat 100,000 gallons per day (gpd). The plant is
scheduled to close upon the completion of developer driven connection between the service area and
Green Valley WRF.
Subsequent to the plant closure, the conveyance flows from the Arivaca Junction WRF service area will
be diverted to the Green Valley WRF. The timing of the sewer extension is mainly driven by the Canoa
Ranch Development, as the two most downstream phases of the sewer extension are to be built by the
developer. The final phase, which consists of the construction of approximately one mile of gravity
sewer tying into the existing line at Elephant Head Road, will be completed by the County.
Along with the future sewer extension, a scalping plant that would treat the combined effluent from the
Arivaca Junction facility is being evaluated for the Old Canoa Ranch. This reclaimed water will be used
for the park irrigation and habitat restoration at the Old Canoa Ranch.
Existing Deficiencies
The Department does not have any existing service deficiencies within area five. Expansion of the
treatment and conveyance systems is driven by growth; its expansion is primarily driven by the
development community. The facility is permitted to treat 4.1 million gallons a day (MGD), and
currently sees flows that average 1.8 MGD to 2.2 MGD depending on the time of year.
P h y s i c a l I n f r a s t r u c t u r e
C o n n e c t i v i t y B a c k g r o u n d
A4.58 | P a g e A p p e n d i x A : B a c k g r o u n d a n d C u r r e n t C o n d i t i o n s
The Green Valley WRF serves a population that is unique when compared the service areas of other
treatment facilities within Pima County. The population served by the Green Valley WRF is
predominately made up of retired, senior citizens, with a portion of them listing residences outside of
southern Arizona as their primary residence. The make up of this population accounts for the
fluctuation of flows over the course of the year.
Potential Remedies and Projects
The Department also desires to provide additional wastewater service to the areas surrounding the
Green Valley WRF service area, as these areas develop and additional conveyance capacity is required.
Conveyance of the Arivaca Junction wastewater flows to the Green Valley WRF for treatment is a long
range goal for this planning area. A couple of milestones must be reached before this takes place. First,
the Canoa Ranch Development, on the west side of I-10, must construct two phases of sewer to serve
the additional 3,917 dwelling units. Then, the County must build a new sewer to complete the
connection.
Mountain View Planning Area (6)
Inventory and Service Baseline
Pima County Regional Wastewater Reclamation Department (RWRD) is the designated sewer service
provider for this area. However, currently there is no public sewer infrastructure to serve this area. The
nearest public sewer is several miles away in the adjacent Planning Areas 7 and 10.
The sparsely populated areas of this planning area are all served by private septic systems. RWRD
currently does not have plans for sewer system extension in this area. Densities requiring public sanitary
sewer service in this region are unexpected.
Most of the land within this planning area is owned by the Arizona State Land Department, the Bureau
of Land Management and the Coronado National Forest. Only 14 percent of the area are privately
owned lands. The sparsely populated are contains very little economic activity with just five Tucson
business licenses. The area is sparsely develop and where developed is by large lot single-family.
According to the US Bureau of the Census, the area had a population density of 4 people per square mile
in 2000 and 5 people per square mile in 2010 respectively.
Southwest Planning Area (7)
Inventory and Service Baseline
There are two wastewater service providers in this planning area, the Town of Sahuarita and Pima
County Regional Wastewater Reclamation Department. There are two facilities physically located in this
planning area: the Corona de Tucson Wastewater Reclamation Facility (WRF); and the Pima County

P h y s i c a l I n f r a s t r u c t u r e
C o n n e c t i v i t y B a c k g r o u n d
A4.59 | P a g e A p p e n d i x A : B a c k g r o u n d a n d C u r r e n t C o n d i t i o n s
Fairgrounds WRF. Unincorporated areas of less dense rural population are served by septic systems.
The Corona de Tucson WRF, located at 1100 W. Sahuarita Road, is permitted to treat 1.3 million gallons
per day (MGD) of wastewater. The facility is topographically constrained to areas south of West
Sahuarita Road. Land ownership surrounding the facility is primarily large lot private residential, Bureau
of Land Management, and State Trust Lands. The Pima County Fairgrounds WRF, located at 11300 S.
Houghton Road, is permitted to treat an annual average of 20,000 gallons per day (GPD) of wastewater.
Existing Deficiencies
The RWRD does not have any existing service deficiencies. Expansion of the treatment and conveyance
systems is driven by growth; its expansion is primarily driven by the development community.
There are landownership patterns that will markedly affect the current and future distribution of land
uses in this planning area. On balance, there is a comparatively small percentage of land that is held in
private ownership. The Arizona State Land Department, the U.S. Forest Service, and to a lesser degree,
the Bureau of Land Management owns the majority of land in this planning area. With the location and
speed of growth largely driven by the actions of the Arizona State Land Department, it is important that
the growth occur in a radial manner, growing out from the existing system instead of leapfrogging. The
RWRD continuously evaluates the capital costs associated with potential service deficiencies; however,
current development and growth patterns suggest that this planning area is being adequately served.
While RWRD adequately serves existing development in the planning area, the possibility of an
additional 350,000 people would require the expansion of services within this area. How this area
develops will dictate the type of infrastructure expansion needed for RWRD to continue to effectively
serve the area. RWRD does not foresee the need, nor are there plans, to rehabilitate or augment any of
their treatment or conveyance systems within the Southlands Service Area within the next six years.
Both the treatment and conveyance systems within this area are relatively new, and in compliance with
all permits that apply to the respective system.
The Town of Sahuarita Southeast Conceptual Area Plan
The Town of Sahuarita is currently working with the Arizona State land Department in the preparation of
the Town of Sahuarita Southeast Conceptual Area Plan (SECAP) within this planning area. The SECAP
encompasses approximately 38,170 acres or 59.6 square miles. It is anticipated that these area will be
annexed to the Town’s corporate boundary.
Potential Remedies and Projects
RWRD does recognize that future growth in this area will necessitate the expansion of these systems,
but at a cost of the developer. It is RWRD’s current requirement that any expansion needs that arise
from new development shall be paid for by the developer or development.

P h y s i c a l I n f r a s t r u c t u r e
C o n n e c t i v i t y B a c k g r o u n d
A4.60 | P a g e A p p e n d i x A : B a c k g r o u n d a n d C u r r e n t C o n d i t i o n s
Specific service considerations related to the potential for growth are:
• Verano - Projected 1.72 million gallons per day. If developed according to existing planned
residential and non-residential uses, this 3,200-acre development, at build-out, would generate
approximately 1.72 million gallons per day (mgd) which would be treated at the proposed
Southlands WRF. The timing for construction of this facility will be determined by growth in the
area. The RWRD is sufficiently able to handle the current level of service required of the system’s
users. The RWRD is continuously evaluating the needs for future treatment and conveyance
capacities relative to future growth to ensure continued level of service demands are met.
• Southlands WRF. This WRF is to be designed to accommodate the 1.72 mgd to be generated from
Verano as well as the additional 9.7 mgd projected to be generated by the balance of the
Southlands Service Area. However, the Southlands WRF would likely be designed initially to
accommodate flows yielded by the first phases of development in Verano with allowances for
additional expansion capacity to treat flows generated from the rest of the Southlands Service
Area. When and where flows from future development in the Southlands Service Area exceed the
availability of treatment capacity at the Southlands WRF, some developments may be required to
convey wastewater flows to other adjoining service areas. The proposed Hook M development
near Kolb and Sahuarita Roads also falls within the Southlands Service Area, but flows could be
conveyed via force main to the Corona de Tucson WRF if the Southlands WRF is not constructed.
• Fairgrounds WRF. This facility has operational capacity for approximately 20,000 gpd, however,
this has been allocated for development within the Southlands Service Area that are coming
online currently and in the immediate future. Once sufficient base flows have been established,
the flows may be conveyed to either the Agua Nueva basin, via the Southeast Interceptor, or the
proposed Southlands WRF.
• Corona de Tucson WRF. This WRF and its associated service basin is constrained due to
surrounding topography and little land available for future development within the service basin.
Any additional development, beyond what is entitled and platted, will likely require expansion of
the treatment facility. Unless the potential for future development increases due to the release of
tracts of State Trust land, the need to consider providing increased treatment capacity would
likely come from developments located in the Southlands Service basin that must convey flows to
the Corona de Tucson WRF.
Central Planning Area (8)
While RWRD adequately serves existing development in the planning area, how this area develops will
dictate the type of infrastructure expansion needed for RWRD to continue to effectively serve the area.
RWRD does not foresee the need, nor are there plans, to rehabilitate or augment any of their treatment
or conveyance systems in this planning area within the next six years. Both the treatment and

P h y s i c a l I n f r a s t r u c t u r e
C o n n e c t i v i t y B a c k g r o u n d
A4.61 | P a g e A p p e n d i x A : B a c k g r o u n d a n d C u r r e n t C o n d i t i o n s
conveyance systems within this area are relatively new and in compliance with all permits that apply to
the respective system.
RWRD does recognize that future growth in this area will necessitate the expansion of these systems,
but at a cost of the developer. It is RWRD’s current requirement that any expansion needs that arise
from new development, shall be paid for by the developer or development.
Inventory and Service Baseline
Pima County Regional Wastewater Reclamation Department (RWRD) is the wastewater service provider
for this area. Three facilities serve this planning area, the Agua Nueva Wastewater Reclamation Facility
(WRF), the Tres Rios Water Reclamation Facility TRWRF, and the Randolph Road WRF. Only the
Randolph Road WRF is physically located in this planning area.
The Randolph Park WRF is a scalping plant located at 3805 E. 22nd Street. The facility treats wastewater
en route to the Agua Nueva WRF and has a maximum average monthly flow of 3.5 MGD diverted from
an interceptor two miles to the west. The treatment process consists of anoxic tanks, aeration tanks,
membrane bioreactors and ultraviolet (UV) disinfection. Class A quality reclaimed water is pumped into
the City of Tucson’s Reclaimed Water System. A limited amount of water is used for onsite landscape
irrigation. Generated sludge is further processed at the Tres Rios Water Reclamation Facility TRWRF.
There are no current plans to expand the capacity of the Randolph Park WRF.
Conveyance of wastewater flow from this planning area tributary areas to the Agua Nueva WRF is
accomplished by multiple interceptors: the Southeast Interceptor (SEI), Aviation Corridor to Santa Cruz
(ACSC), Aviation Corridor to Southeast (ACSE), Santa Cruz Interceptor (SCI), South Rillito (SRI), and
Pantano Interceptor (PTI). Conveyance of flow to the Tres Rios Water Reclamation Facility TRWRF is by
the North Rillito Interceptor (NRI).
Existing Deficiencies, Future Concerns, and Potential Remedies
The Department has not identified and is not aware of any existing service deficiencies within this
planning area. The Department has completed the Regional Optimization Master Plan (ROMP) to ensure
adequate treatment and conveyance capacity is available within the metropolitan area.
Expansion of the treatment and conveyance systems is predicated upon growth; its expansion primarily
driven by the development community. The majority of land in this planning area is privately owned and
developed as this area includes the densely populated central region of Tucson. However, significant
growth has occurred in the last several years in the southeast section of this planning area where the
majority of private land is still available for development.

P h y s i c a l I n f r a s t r u c t u r e
C o n n e c t i v i t y B a c k g r o u n d
A4.62 | P a g e A p p e n d i x A : B a c k g r o u n d a n d C u r r e n t C o n d i t i o n s
Augmentation of the SEI segment along Euclid Avenue between 36th Street and 18th Street, primarily
conveying flow from the southeast area, has been identified by the Department as a short term priority
to mitigate this concern. The Department is currently calibrating the hydraulic model it uses to
determine the potential impacts of various proposed hydraulic planning scenarios. These scenarios can
be further developed to determine if additional expansion of the SEI is necessary. Further augmentation
of other segments of the conveyance system is also anticipated as new development and infill occurs in
this area.
Currently, the relatively slow pace of development does not create immediate demand for additional
treatment capacity. Increased treatment capacity at the Ina Road WRF, which is currently undergoing
upgrade and expansion, will meet the long-term treatment capacity needs for this area and the majority
of metropolitan area.
The need for a new sub-regional facility and/or a new scalping plant to serve the far southeast area has
been identified in the 2006 Metropolitan Area Facility Plan Update. Three potential locations in Area 8
have been evaluated by the Department. A major factor in assessing the timeframe (year 2010 or 2015)
for facility construction was the rate of development of the Houghton Area Master Plan (HAMP), which
to date remains largely undeveloped. ROMP implementation process, of which the first phase of the
plant interconnect was completed in 2010, and the two subsequent phases were completed in 2014.
The plant interconnect consists of the construction of the Santa Cruz Interceptor that allows a portion of
the wastewater tributary to the Agua Nueva WRF to now be conveyed to the Tres Rios WRF for
treatment. The new interceptor was primarily constructed to increase flow and capacity management
opportunities between the two plants. It consists of five mile pipes varying in size from 60 to 72 inches
in diameter, and is designed to handle an average flow of 36 MGD with 81 MGD peak flow.
Phase two included an upgrade and capacity expansion of the Tres Rios Water Reclamation Facility WRF
from 37.5 MGD to 50 MGD. The majority of flows from the Agua Nueva WRF service area are treated at
the Tres Rios Water Reclamation Facility WRF. The third phase of the ROMP implementation process
was the construction of a new water reclamation campus north of the Roger Road WRF. The new facility
is designed to reduce the levels of ammonia and nitrogen in the effluent discharged into the Santa Cruz
River. The facility does not handle solids, which will be conveyed to and treated at the Tres Rios Water
Reclamation Facility WRF. Class A+ quality effluent will be produced.
Functional Area-specific Considerations
Wastewater Reclamation
Currently, RWRD adequately serves existing development in the planning area. The ways in which this
area develops will dictate the type of infrastructure expansion needed for RWRD to continue to
effectively serve the area. Developer driven expansion of conveyance system will be required as infill
development occurs, particularly in the southeast area. The RWRD has identified two primary goals for
this area; (1) augmentation of the SEI, a short-term priority aimed at mitigating flow concerns associated
P h y s i c a l I n f r a s t r u c t u r e
C o n n e c t i v i t y B a c k g r o u n d
A4.63 | P a g e A p p e n d i x A : B a c k g r o u n d a n d C u r r e n t C o n d i t i o n s
with growth in the southeastern section, and (2) construction of a new regional reclamation facility
and/or a scalping plant, a long-term planning goal for this planning area.
RWRD recognizes future growth in this area will necessitate the expansion of treatment and conveyance
systems. The Department currently requires that any necessary expansion of sanitation systems
resulting from new development shall be paid for by the developer or development.
Catalina Foothills Planning Area (9)
Inventory and Service Baseline
Pima County Regional Wastewater Reclamation Department (RWRD) is the wastewater service provider
for this planning area. The area is served by three wastewater treatment facilities, of which only the sub-
regional Mt. Lemmon Wastewater Reclamation Facility (WRF) is located in this planning area. The other
two facilities are the Agua Nueva WRF and the Tres Rios Water Reclamation Facility WRF , located in
Planning Area 2.
The Mt. Lemmon WRF service area is comprised of the Catalina Mountains of unincorporated Pima
County, including the community of Summerhaven in Mt. Lemmon, as well as the far-east side of the
Tucson metropolitan area. These are at the same time the northernmost and easternmost points of the
RWRD service area. All population in the service area is well served by existing facilities. Low-density
suburban and rural populations in this planning area are served by private septic systems.
Two gravity interceptors are responsible for collecting wastewater flow from the south-central portion
of this area to the receiving treatment plants on the west side of the Tucson metropolitan area. They
are: the North Rillito Interceptor (NRI) and the Tanque Verde Interceptor (TVI). In addition, the
Summerhaven community in the Mt. Lemmon is served by isolated conveyance system that covers a
small service area of less than a square mile in size.
The Mt. Lemmon WRF, located on N. Sabino Canyon Park Road, in the town of Summerhaven, is
permitted to treat domestic sewage from a maximum of 77 properties. Currently the system has only 49
connections of which only forty-five percent is active. The maximum treatment capacity requirement is
established by an agreement between Pima County and the United States Forest Services (USFS). The
Mt. Lemmon WRF service area is primarily residential with a few commercial establishments, including
restaurants and gift shops.
The current treatment capacity of the Mt. Lemmon WRF is 20,000 gallons per day (gpd). The facility uses
an oxidation ditch with chlorination and dechlorination providing secondary treatment of domestic
sewage. Produced sludge is hauled of the mountain to the nearest sewer line, from where it is further
conveyed to the Tres Rios WRF and the Regional Biosolids Facility for processing and conditioning.
Since the Mt. Lemmon sewer system is entirely within the boundaries of the Coronado National Forest,
the USFS has significant input into future plans for growth, water use, and effluent disposal for the

P h y s i c a l I n f r a s t r u c t u r e
C o n n e c t i v i t y B a c k g r o u n d
A4.64 | P a g e A p p e n d i x A : B a c k g r o u n d a n d C u r r e n t C o n d i t i o n s
sewer system. This requires continuous collaborative efforts between the RWRD and USFC in preparing
long-range plans for the future of the Mt. Lemmon sewer system.
Also, in this planning area, specifically in the Santa Catalina Mountains, USFC operates a small treatment
system, an anaerobic lagoon type of system that treats sewage from a local ranger station. Treated
effluent is seasonally reused for irrigation.
Existing Deficiencies
Expansion of the treatment and conveyance systems in predicted upon growth; its expansion primarily
driven by the development community. Currently, RWRD adequately serves existing development in the
planning area. The ways in which this area develops will dictate the type of infrastructure expansion
needed for RWRD to continue to effectively serve the area.
The department is constructing an augmentation project to increase capacity of the NRI.
The Department has not identified and is not aware of any other major service deficiencies within this
planning area. Augmentation of other segments of the conveyance system is anticipated as new
development and infill occur in the planning area. The Department currently requires that any necessary
expansion of sanitation systems resulting from new development shall be paid for by the developer or
development.
Due to current economic trends that have greatly slowed growth taking place on the mountain, the sub-
regional wastewater treatment facility of the Mt. Lemmon is anticipated to remain the same in regards
to current treatment capacity, serving limited service area with steady service demand. In addition,
development in Summerhaven is rather limited due to topographical and environmental constraints.
Future connections to the collection system are currently allowed at the expense of developers and new
home construction. RWRD remains the service provider retaining the sole system ownership.
Potential Remedies and Projects
Increased treatment capacity at the Tres Rios WRF will meet the long-term treatment capacity needs for
this area.
Rincon Valley Planning Area (10)
Inventory and Service Baseline
Pima County Regional Wastewater Reclamation Department (RWRD) is the wastewater service provider
for this planning area. There are currently no RWRD wastewater facilities in this planning area. The
sewer infrastructure is limited to serving residential subdivisions in the western portion of the planning
area.

P h y s i c a l I n f r a s t r u c t u r e
C o n n e c t i v i t y B a c k g r o u n d
A4.65 | P a g e A p p e n d i x A : B a c k g r o u n d a n d C u r r e n t C o n d i t i o n s
This area is situated within the group of sewer basins tributary to the Agua Nueva Wastewater
Reclamation Facility (WRF). Wastewater is collected via gravity sewer and conveyed to the Agua Nueva
WRF for treatment. Two major interceptors serve this area, the Pantano Interceptor (PTI) and the
Southeast Interceptor (SEI). The PTI collects sewage from the northern portion while the SEI generally
collects sewage from the southern portion of the planning area. The interceptors are located outside
this area.
The service area is comprised of mostly single family residential subdivisions in the Vail Valley Ranch
Specific Plan area. The service area boundary extends to the edge of the existing subdivisions. A number
of low to medium density subdivisions, including individual lots of less dense population are served by
private septic systems.
Existing Deficiencies
Expansion of the treatment and conveyance systems is predicted upon growth; its expansion primarily
driven by the development community. Current development and growth patterns suggest that this
area is being adequately served by RWRD. Future capacity allotments would require assessment by
RWRD on a project-by-project basis. The Department has not identified and is not aware of any major
service deficiencies within this area.
Potential Remedies and Projects
Necessary system augmentation is anticipated as new and infill developments occur in the planning
area. The Department currently requires that any expansion of sanitation system resulting from new
development shall be paid for by the developer or development.
Service expansion is anticipated as new growth materializes particularly in the proposed master-planned
communities of Rocking K. Augmentation of the PTI would be necessary in order for this development
and other planned developments in the northern portion of this area to be adequately served by public
sewer. Similarly, planned expansion of the SEI capacity would benefit the southern portion of the
planning area, as well as the adjacent Planning Areas 7 and 8.
Tortolita Planning Area (11)
Inventory and Service Baseline
Pima County Regional Wastewater Reclamation Department (RWRD) is the primary wastewater service
provider for this planning area. The service area includes the Towns of Marana (east of I-10) and Oro
Valley, unincorporated areas between the Towns of Marana and Oro Valley, including the village of
Catalina, as well as several subdivisions in Pinal County. A small portion of Area 11 on the east side of I-
10 is served by the Marana Wastewater Reclamation Facility (WRF), currently maintained and operated
by the Town of Marana.
P h y s i c a l I n f r a s t r u c t u r e
C o n n e c t i v i t y B a c k g r o u n d
A4.66 | P a g e A p p e n d i x A : B a c k g r o u n d a n d C u r r e n t C o n d i t i o n s
The developed parts of the service area consist primarily of low to medium density residential and rural
residential transitioning to suburban/urban land uses. Additional land uses in the area include
commercial and industrial. A potential for extensive development and additional sewer service demand
in this area exists.
Currently there are no existing RWRD wastewater facilities in this planning area. The primary
wastewater service facility is the Tres Rios WRF, located in Planning Area 2. Combined flows from this
planning area tributary areas are conveyed via the Canada del Oro Interceptor (CDO). Unincorporated
areas of less dense population are served by septic systems.
Two small privately-owned wastewater facilities are located in this planning area, the Adonis Sanitary
Sewerage Facility and the Saguaro Ranch Guest Ranch package plant. Both are limited by permits to only
treat flow from the Homeowner’s Association (approximately 150 mobile homes) and the Guest Ranch.
Existing Deficiencies
The Department has not identified and is not aware of any existing service deficiencies within this area.
The Department has implemented the Regional Optimization Master Plan (ROMP) to ensure adequate
treatment and conveyance capacity is available within this area.
Potential Remedies and Projects
Expansion of the treatment and conveyance systems is predicted upon growth; its expansion primary
driven by the development community. Currently, RWRD adequately serves existing development in the
planning area. The ways in which this area develops will dictate the type of infrastructure expansion
needed for RWRD to continue to effectively serve the area. Developer driven expansion of conveyance
system will be required as infill development occurs. The Department currently requires that any
necessary expansion of sanitation systems from new development shall be paid for by the developer or
development.
The relatively slow pace of development currently does not create immediate demand for additional
conveyance capacity. Increased treatment capacity at the Tres Rios Water Reclamation Facility WRF,
which has undergone an upgrade and expansion, will meet the long-term treatment capacity needs for
this area and the majority of metropolitan area. Future development in Area 11 will be served to either
the Tres Rios WRF or Marana WRF. A new public wastewater facility is planned by the Town of Marana
to serve the town’s projected planning area. One of alternative locations for the new WRF is in this area.
Phase two of the previously mentioned ROMP implementation included an upgrade and capacity
expansion of the Tres Rios WRF from 37.5 million gallons per day (MGD) to 50 MGD. The majority of
flows from the Agua Nueva WRF service area are treated at the Tres Rios WRF since the expansion
completion in 2014.

P h y s i c a l I n f r a s t r u c t u r e
C o n n e c t i v i t y B a c k g r o u n d
A4.67 | P a g e A p p e n d i x A : B a c k g r o u n d a n d C u r r e n t C o n d i t i o n s
San Pedro Planning Area (12)
Inventory and Service Baseline
Pima County Regional Wastewater Reclamation Department (RWRD) is the designated sewer service
provider for this planning area. The planning area is outside the reach of public conveyance system. No
RWRD facilities exist in this area. The primarily rural population is served by private septic systems. The
nearest public sewer is in the adjacent Planning Area 9, serving the Mt. Lemmon area.
Current development and growth patterns suggest that this planning area will continue to be served by
on-site septic systems. RWRD currently does not have plans for sewer extension in this area. Densities
requiring public sanitary sewer service in this region are unexpected.
Ajo-Why Planning Area (13)
Inventory and Service Baseline
Pima County Regional Wastewater Reclamation Department (RWRD) does not provide wastewater
services to this planning area.
The Ajo Improvement Company owns the sewer treatment facility which treats over 46 million gallons of
wastewater per year, however, there is interest in finding a new methods of processing th wastewater,
especial its disposal which is currently pumped to the top of the New Cornelia mine trailings dam.

P h y s i c a l I n f r a s t r u c t u r e
C o n n e c t i v i t y B a c k g r o u n d
A4.68 | P a g e A p p e n d i x A : B a c k g r o u n d a n d C u r r e n t C o n d i t i o n s
TABLE 4.4.e: Existing Capacity for Wastewater Facilities with a Design Capacity of 100,000 Gallons or
More per Day by Sub-region
Facility Name Facility Location Design Capacity (Gallons)
Estimated Current Demand
(Gallons)
Agua Nueva WRF Agua Nueva WRF: 32.0 mgd
N/A
Arivaca Junction WRF 28601 Old Nogales Highway, Amado, AZ
100,000 gpd 48000 gpd
Avra Valley WRF 4.0 mgd 1.3 mgd
Corona de Tucson WRF 1100 W Sahuarita Road 1.3 mgd 0.27 mgd
Green Valley WRF
19600 S. Old Nogales Hwy, Green Valley
4.1 mgd 1.77 mgd
Tres Rios WRF
7101 N. Casa Grande Hwy 50 mgd 22.45 mgd
Randolph Park WRF
3805 E. 22nd Street 3.5 mgd 2.2 mgd
Roger Road WRF
2600 W. Sweetwater Drive decommissioned N/A
Source: Pima County Infrastructure Study 2013
Notes:
1. Regulatory Agency – Arizona Department of Environmental Quality (ADEQ)
2. Operational Responsibility – Pima County Regional Wastewater Reclamation Department
3. Type of Facility - The department operates numerous types of treatment processes including:
evaporation ponds, aerated lagoons, oxidation ditches, closes loop reactors, biological nutrient
removal, and bardenpho among others.
4. Estimated population served – data non provided
5. Estimated surplus capacity in gallons – Dynamic. It changes every day.
6. The estimated demand per capita (gallons per person per day - 80 gallons per capita per day (gpcd),
2.7 people per home, 216 gallons per dwelling unit
7. Percent of residential connections – unknown.

P h y s i c a l I n f r a s t r u c t u r e
C o n n e c t i v i t y B a c k g r o u n d
A4.69 | P a g e A p p e n d i x A : B a c k g r o u n d a n d C u r r e n t C o n d i t i o n s
4.5 Environmental: Air Quality and Solid Waste
Air Quality Trends and Projections
Pima County Department of Environmental Quality (PDEQ) monitors ambient (outdoor) air pollutants
throughout eastern Pima County. There are six criteria pollutants that are monitored in accordance with
the National Ambient Air Quality Standards (NAAQS) set by the Environmental Protection Agency (EPA)
to comply with the Federal Clean Air Act. The NAAQS were established to protect public health and the
environment. The six criteria pollutants are: carbon monoxide (CO), ozone (O3), particulate matter
(PM10 and PM2.5), nitrogen dioxide (NO2), sulfur dioxide (SO2) and lead (Pb).
Carbon monoxide concentrations have declined in the past three decades mostly due to the use of
cleaner burning fuels and cleaner cars. The levels of CO remain around 20% of the standard.
Pima County’s ground level ozone concentrations have remained relatively steady at 95% of the
standard. Ground level ozone concentrations are highest in the summer months due to the intense
sunlight and heat. Oxides of nitrogen and volatile organic compounds react in the presence of sunlight
to form ozone.
PM10 is particulate matter with an aerodynamic diameter of 10 microns or less and PM2.5 is particulate
matter with an aerodynamic diameter of 2.5 microns or less. Pima County violated the PM10 standard
in 1999 with four recorded exceedances of the standard. The County developed a plan that included
measures to minimize contributing controllable sources, increased enforcement and education. The
County is in attainment of the current standards.
PDEQ also measures nitrogen dioxide and sulfur dioxide. No significant changes in the levels of these
two pollutants have been seen in the past 20 years. Concentrations of nitrogen dioxide average about
30% of the standard. Sulfur levels continue to be extremely low with averages around 7% of the
standard.
The other criteria pollutant measured by PDEQ is lead. Most urban areas have seen a dramatic decrease
in ambient lead levels since the phase out and ban of lead in gasoline. On October 15, 2008, EPA
strengthened the lead standard which required Pima County to perform area monitoring at one
location. The EPA has initiated an evaluation of the current ozone standard to determine if it sufficiently
protective of public health and the environment. If the standard is lowered in the future, Pima County
may be in nonattainment of the revised standard. Were that to happen, the County would need to
develop an air quality control plan to reduce emissions to return the area to compliance. The chart
below shows the data for ozone.
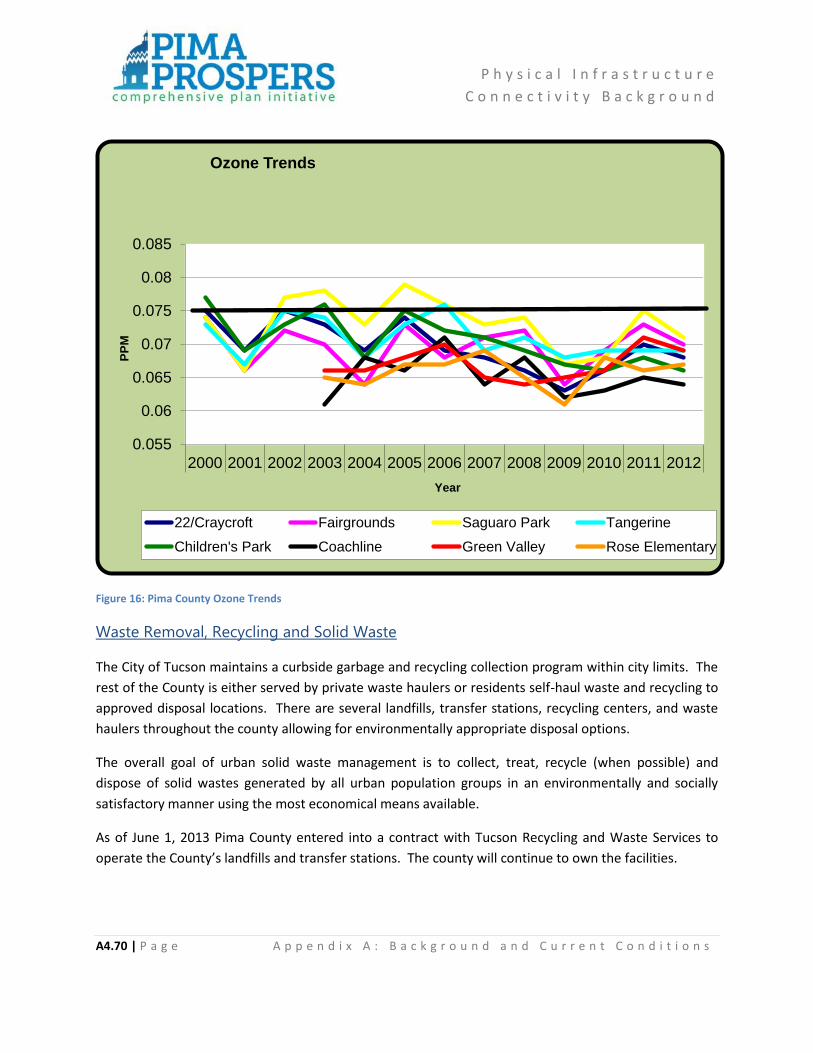
P h y s i c a l I n f r a s t r u c t u r e
C o n n e c t i v i t y B a c k g r o u n d
A4.70 | P a g e A p p e n d i x A : B a c k g r o u n d a n d C u r r e n t C o n d i t i o n s
Figure 16: Pima County Ozone Trends
Waste Removal, Recycling and Solid Waste
The City of Tucson maintains a curbside garbage and recycling collection program within city limits. The
rest of the County is either served by private waste haulers or residents self-haul waste and recycling to
approved disposal locations. There are several landfills, transfer stations, recycling centers, and waste
haulers throughout the county allowing for environmentally appropriate disposal options.
The overall goal of urban solid waste management is to collect, treat, recycle (when possible) and
dispose of solid wastes generated by all urban population groups in an environmentally and socially
satisfactory manner using the most economical means available.
As of June 1, 2013 Pima County entered into a contract with Tucson Recycling and Waste Services to
operate the County’s landfills and transfer stations. The county will continue to own the facilities.
0.055
0.06
0.065
0.07
0.075
0.08
0.085
2000 2001 2002 2003 2004 2005 2006 2007 2008 2009 2010 2011 2012
PP
M
Year
Ozone Trends
22/Craycroft Fairgrounds Saguaro Park Tangerine
Children's Park Coachline Green Valley Rose Elementary
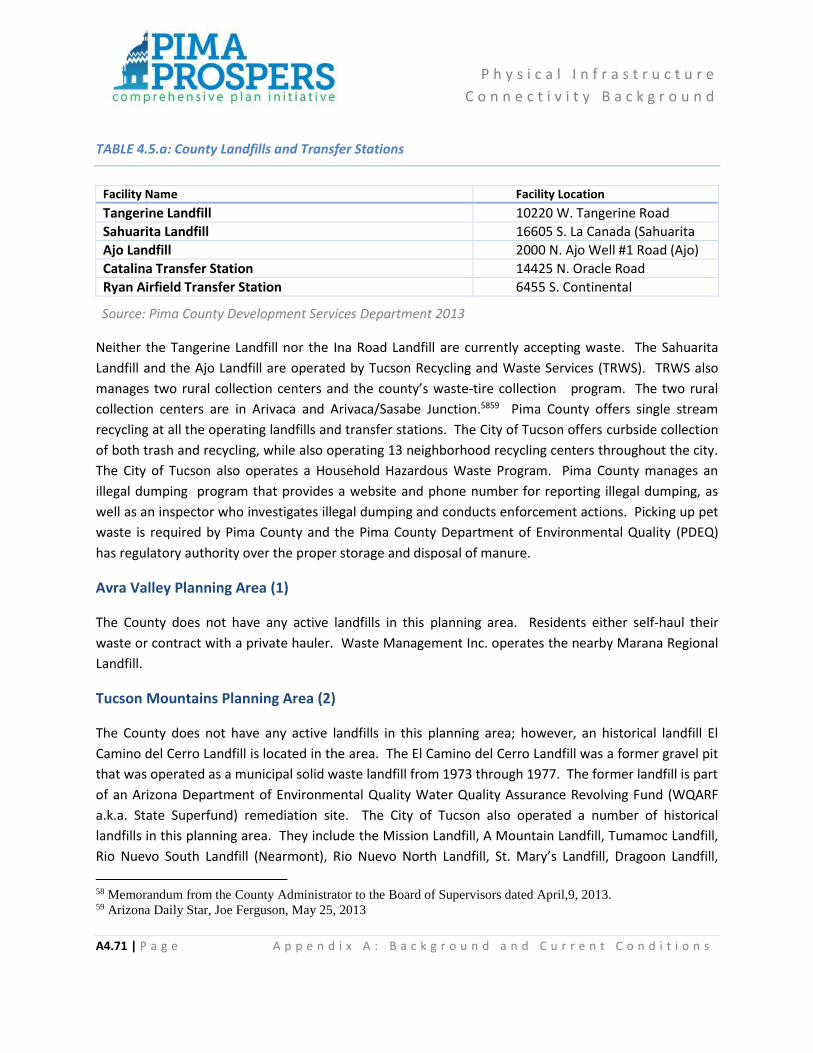
P h y s i c a l I n f r a s t r u c t u r e
C o n n e c t i v i t y B a c k g r o u n d
A4.71 | P a g e A p p e n d i x A : B a c k g r o u n d a n d C u r r e n t C o n d i t i o n s
TABLE 4.5.a: County Landfills and Transfer Stations
Facility Name Facility Location
Tangerine Landfill 10220 W. Tangerine Road
Sahuarita Landfill 16605 S. La Canada (Sahuarita
Ajo Landfill 2000 N. Ajo Well #1 Road (Ajo)
Catalina Transfer Station 14425 N. Oracle Road
Ryan Airfield Transfer Station 6455 S. Continental
Source: Pima County Development Services Department 2013
Neither the Tangerine Landfill nor the Ina Road Landfill are currently accepting waste. The Sahuarita
Landfill and the Ajo Landfill are operated by Tucson Recycling and Waste Services (TRWS). TRWS also
manages two rural collection centers and the county’s waste-tire collection program. The two rural
collection centers are in Arivaca and Arivaca/Sasabe Junction.5859 Pima County offers single stream
recycling at all the operating landfills and transfer stations. The City of Tucson offers curbside collection
of both trash and recycling, while also operating 13 neighborhood recycling centers throughout the city.
The City of Tucson also operates a Household Hazardous Waste Program. Pima County manages an
illegal dumping program that provides a website and phone number for reporting illegal dumping, as
well as an inspector who investigates illegal dumping and conducts enforcement actions. Picking up pet
waste is required by Pima County and the Pima County Department of Environmental Quality (PDEQ)
has regulatory authority over the proper storage and disposal of manure.
Avra Valley Planning Area (1)
The County does not have any active landfills in this planning area. Residents either self-haul their
waste or contract with a private hauler. Waste Management Inc. operates the nearby Marana Regional
Landfill.
Tucson Mountains Planning Area (2)
The County does not have any active landfills in this planning area; however, an historical landfill El
Camino del Cerro Landfill is located in the area. The El Camino del Cerro Landfill was a former gravel pit
that was operated as a municipal solid waste landfill from 1973 through 1977. The former landfill is part
of an Arizona Department of Environmental Quality Water Quality Assurance Revolving Fund (WQARF
a.k.a. State Superfund) remediation site. The City of Tucson also operated a number of historical
landfills in this planning area. They include the Mission Landfill, A Mountain Landfill, Tumamoc Landfill,
Rio Nuevo South Landfill (Nearmont), Rio Nuevo North Landfill, St. Mary’s Landfill, Dragoon Landfill,
58 Memorandum from the County Administrator to the Board of Supervisors dated April,9, 2013. 59 Arizona Daily Star, Joe Ferguson, May 25, 2013

P h y s i c a l I n f r a s t r u c t u r e
C o n n e c t i v i t y B a c k g r o u n d
A4.72 | P a g e A p p e n d i x A : B a c k g r o u n d a n d C u r r e n t C o n d i t i o n s
State Pit Landfill, and the Silverbell Landfill. The City of Tucson’s Silverbell Landfill is also a WQARF site.
There is a small area of groundwater contamination associated with the City of Tucson’s Tumamoc
Landfill.
Southwest Planning Area (3)
The County does not have any active landfills in this planning area, however, the county does operate
the Ryan Field Transfer Station through a contractor, Tucson Recycling and Waste Services. Residents
can either dispose of their waste at the transfer station or contract with a private waste collection
company for disposal.
Altar Valley Planning Area (4)
The County does not have any active landfills in this planning area, however, the county does operate
two rural collection centers, one in Arivaca and another at the Arivaca-Sasabe Junction. These two sites
are now operated by a contractor, Tucson Recycling and Waste Services.
Upper Santa Cruz Planning Area (5)
The County’s Sahuarita Landfill is the only municipal landfill located in this planning area and is operated
through Tucson Recycling and Waste Services. The landfill has only about one year of capacity
remaining and will then be closed to the public. Tucson Recycling and Waste Services will construct and
operate a transfer station at the site.
In June 2006, the Arizona Department of Environmental Quality (ADEQ) issued a Mitigation Order on
Consent to Freeport McMoran (at the time Phelps Dodge Sierrita, Inc.) for the sulfate plume
contamination. Freeport submitted a Mitigation Plan including completing purchase of 9,000 acres of
state lands and obtaining the permits needed for the construction of a new tailings impoundment in this
area. Currently, Freeport continues to implement their deferred Mitigation Plan in the interim through
continued well monitoring, obtaining easements and right-of-ways, and submittal of purchase
application to State land.
Mountain View Planning Area (6)
The County does not have any active landfills in this planning area. Residents in the area can dispose of
their household garbage at a nearby landfill or contract with a private waste hauler for disposal.

P h y s i c a l I n f r a s t r u c t u r e
C o n n e c t i v i t y B a c k g r o u n d
A4.73 | P a g e A p p e n d i x A : B a c k g r o u n d a n d C u r r e n t C o n d i t i o n s
Southeast Planning Area (7)
The City of Tucson’s Los Reales Landfill is the only municipal landfill located in this planning area. The
landfill has a minimum of 60 years of remaining capacity. For residents within its jurisdictional limit, the
City of Tucson provides weekly trash collection services for municipal waste and recycling materials.
Residents in unincorporated areas must make their own arrangements for the disposal of household
waste and recycling either through a commercial hauler or by hauling their own trash and recycling to an
approved facility (including the Los Reales Landfill).
Within this planning area, there is one WQARF site and one federal Superfund (Comprehensive
Environmental Response, Compensation, and Liability Act (CERCLA)) site. The WQARF site is the Los
Reales landfill. It is located at 5300 E. Los Reales Road, south of Interstate-10 and in the vicinity of the
intersection of Swan Road and East Los Reales Road. The City of Tucson is the owner and operator of
this active municipal sanitary landfill and is monitoring and performing cleanup of groundwater
impacted with tetrachloroethene (PCE) and trichloroethene (TCE) from the unlined portion of the
landfill. The Superfund Site is at the Tucson International Airport Area (TIAA) located south of Ajo Way,
north of Hughes Access Road, west of Alvernon Way, and east of Interstate-19. Groundwater and soil
contamination are under investigation and remediation.
Central Planning Area (8)
Land in the Central Planning area within the City of Tucson is served by City Environmental Services
which provides weekly pickup of waste and recycling. Areas outside of City limits are responsible for
hiring a private municipal waste collection service or self-hauling to an approved waste disposal site.
Catalina Foothills Planning Area (9)
Residents in the area who live within the City of Tucson have garbage collection provided by the City.
Residents who live outside of the City contract for private haulers or dispose of their household waste at
an approved area disposal location. There are two landfills in this planning area, the closed Vincent
Mullins operated by the City of Tucson and right next to it is the private Speedway Recycling and Landfill
Facility owned by The Fairfax Companies.
Rincon Valley Planning Area (10)
Residents who live in this planning area contract for waste disposal with private haulers or dispose of
their household waste at an approved area disposal location. There are no landfills in the planning area;
the nearest landfill is the Tucson City Los Reales landfill located at 5300 E. Los Reales Road.

P h y s i c a l I n f r a s t r u c t u r e
C o n n e c t i v i t y B a c k g r o u n d
A4.74 | P a g e A p p e n d i x A : B a c k g r o u n d a n d C u r r e n t C o n d i t i o n s
Tortolita Planning Area (11)
The County does not have any active landfills in this planning area but does have the Catalina Transfer
Station. The Catalina Transfer Station is also the location of the closed Catalina Landfill. The landfill was
operated by Pima County but was closed when the transfer station was opened. Residents currently
make their own arrangements for the disposal of household waste and recycling either through a
commercial hauler or by hauling their own trash and recycling to an approved facility (including the
Catalina Transfer Station).
San Pedro Planning Area (12)
The County does not have any active landfills in this planning area. Residents in the area can dispose of
their household garbage at a nearby landfill or contract with a private waste hauler for disposal.
Ajo/Why Planning Area (13)
The landfill is currently operating under the direction of Tucson Recycling and Waste Services.

P h y s i c a l I n f r a s t r u c t u r e
C o n n e c t i v i t y B a c k g r o u n d
A4.75 | P a g e A p p e n d i x A : B a c k g r o u n d a n d C u r r e n t C o n d i t i o n s
4.6 Communications
Communication Networks
In 2008, a 25-year-old man led police and sheriff’s deputies on a zig-zag car chase that began on the
northwest side of Tucson and ended near the base of Mount Lemmon, with one Tucson Police officer
fatally wounded and two Pima County Sheriff’s deputies injured. Throughout that deadly chase, police
and deputies weren’t able to talk to each other on the same radio frequency. The incident highlighted a
serious flaw in emergency communications that has been corrected. The radio communications systems
throughout much of Pima County were on different radio frequency bands and use different proprietary
technologies. They didn’t provide for live, simultaneous communication among law enforcement, fire
agencies and medical first responders.
In April,2014, the county’s new public safety voice radio network, funded by bonds approved by voters
in 2004 began operation. The new Pima County Wireless Integrated Network (PCWIN) system includes
over 7,000 radios, serving over 50 fire, law enforcement, and emergency management and public
service agencies from Tucson to Ajo, from Sahuarita to Mount Lemmon, and from the Rincon Valley to
Avra Valley, enabling all of these agencies to talk to each other by radio in real time on a single system,
regardless of their jurisdictional boundaries.
The County completed the construction and implementation of the PCWIN project with the guidance of
a cross jurisdictional Executive Management Committee chaired by the Pima County Sheriff. Now that
the system is fully functional, operations are governed by a cross jurisdictional Board of Directors. The
PCWIN Board of Directors is the overarching governing body responsible for setting strategic direction,
policy formation, financial oversight, and the ongoing viability of the PCWIN Cooperative. Each Member
organization of the PCWIN Cooperative will have a voting Representative on the Board of Directors. The
tactical operations and direction are handled by the PCWIN Executive Director with guidance from a
seven member Executive Committee that is appointed by the Board of Directors and serves in advisory
capacity to the Board and the Executive Director. Members of the Executive Committee are executive
level members of police, fire, information technology, maintenance organizations, and an Indian
Community or at-large member.
Another critical component of public safety communication and coordination is the Pima County Office
of Emergency Management and Homeland Security (PCOEMHS). When major incidents occur, whether
they involve public safety organizations or infrastructure and emergency management personnel, it is
important that everyone work together to address the issue at hand in a coordinated manner. The Pima
County Office of Emergency Management and Homeland Security has the lead role in coordination of all
assets needed to address regional emergency situations, whether they are weather-related or pose a

P h y s i c a l I n f r a s t r u c t u r e
C o n n e c t i v i t y B a c k g r o u n d
A4.76 | P a g e A p p e n d i x A : B a c k g r o u n d a n d C u r r e n t C o n d i t i o n s
risk to the community in other ways. PCOEMHS utilizes a standardized suite of web accessible
communications systems and follows a nationally defined structure and process for incident
management. These standardized systems and processes are critical to timely and effective support to
an incident commander. The Pima County Office of Emergency Management and Homeland Security
also coordinates regular classroom and operational training exercises to insure procedures and
communication systems work in times of major emergencies. The new Emergency Operations Center is
an integral part of the Pima County Emergency Communications and Operations Center (PECOC) that
was constructed as a part of the Bond project approved in 2004. This state of the art facility is the
communications hub, not only for regional radio communications but also is capable of capturing and
analyzing input from a wide range of resources to insure decision makers and first responders have the
maximum amount of useful and coordinated information available to them to address the issue at hand.
Data Communication
To address the growing demand for cross-jurisdictional information across Pima County, the
infrastructure for data communication among various government agencies becomes a key factor in
overall regional coordination. While each of the various agencies, and utilities have developed their
own information highway infrastructure, a collaborative process to interconnect the various
jurisdictional networks has been under way for several years. Not only do these agreements allow for
data sharing, but they also minimize capital and operating costs where current technology allows
various jurisdictions to utilize the same infrastructure in a secure, segregated manner. If an agency
needs a network presence at a site that is nearby a network managed by another agency,
intergovernmental agreements allow for the extension of the closest network as opposed to expensive
extensions of other agency networks with appropriate cost allocation, but at significant cost savings.
Site selection priorities by potential employers looking to locate in the region include the availability of
robust data communication networks. Regional collaboration to maximize the value of every
jurisdiction’s communications infrastructure not only benefits the jurisdictions, but also sends a clear
message to employment prospects that there is a collaborative solution that raises the data
communications level for all in the region. This kind of collaboration is also critical to attracting regional
infrastructure grants and commercial networks such as Google Fiber. The Google Fiber Community
Checklist is one that Pima County, City of Tucson and other jurisdictions, the University of Arizona, and
some of the utilities are following to insure maximum opportunity to attract such a commercial network
presence. All of these infrastructure planning efforts are aimed at creating more jobs in the community
while lowering operating costs of the cooperating agencies.

P h y s i c a l I n f r a s t r u c t u r e
C o n n e c t i v i t y B a c k g r o u n d
A4.77 | P a g e A p p e n d i x A : B a c k g r o u n d a n d C u r r e n t C o n d i t i o n s
Pima County Office of Emergency Management & Homeland Security
The Office of Emergency Management & Homeland Security is a project participant. The County
Emergency Operations Center and support staff offices will be a tenant in the planned Pima County
Regional Emergency Communications and Operations Center. OEM staff is expected to participate in
planning and implementation of the communications and emergency operations center(s).
Pima County Real Property
Pima County Real Property is responsible for acquiring any new property required by the project. The
Office may also be involved in preparing and negotiating tenant leases as requested by the Sheriff’s
Department.
Voice & Data Radio Project Participants
Multiple jurisdictions will benefit from the PCWIN project. The degree of participation expected during
implementation is directly related to the degree of benefit, risk, contribution and stake that each
jurisdiction has in the project. All jurisdictions will have an interest in planning future systems that will
meet their end-user communications requirements and will therefore be expected to participate in User
Committee activities.
Some jurisdictions will have a more significant role; some will be direct participants in the
communications facility aspects of the project and/or may provide other assets that contribute to the
success of the projects. Each jurisdiction will have some degree of responsibility for assisting with
planning, training, cutover activities, and intergovernmental agreements.
The following jurisdictions will have additional specific responsibilities:
City of Tucson
Pima County and the City of Tucson are the two largest jurisdictions participating in the project. City of
Tucson communications assets and facilities figure prominently in the PCWIN Conceptual Architecture
Plan. These assets are expected to be important to the project. The city is the largest single participant
in the communications facility component of the project. As a result, the City of Tucson has a larger
stake in the project and it is expected that their level of participation will be significant. The City will be
responsible for approving agreements with the County to make use of the City assets, reviewing and
approving design plans for City facilities, assisting with configuration of City communications assets to
support PCWIN systems, assisting with organization of a radio maintenance shop, assisting with
development and implementation of cut-over plans, and contribution of technical advice. The City will
retain control and ownership of their facilities and will be responsible for maintaining and operating
their facilities.

P h y s i c a l I n f r a s t r u c t u r e
C o n n e c t i v i t y B a c k g r o u n d
A4.78 | P a g e A p p e n d i x A : B a c k g r o u n d a n d C u r r e n t C o n d i t i o n s
Town of Marana
The Town of Marana has deployed a Motorola Astro25 voice radio system. This system and its
associated communications equipment assets also figure prominently in the PCWIN Conceptual
Architecture Plan. The Town will be responsible for approving agreements with the County to make use
of Town assets if proposed by the selected radio vendor, assisting with configuration of Town
communications assets to support PCWIN systems, assisting with organization of a radio maintenance
shop, and contribution of technical advice.
Tohono O’odham Nation
The Tohono O’odham Nation has jurisdiction over two communications sites required to provide
countywide radio coverage that will primarily benefit the Nation’s end-users. The Nation has also
utilized grant funds to purchase microwave equipment and an equipment shelter that are intended to
contribute to the PCWIN project. The Nation will be responsible for approving agreements with the
County to permit use of the Nation’s land, facilities and equipment to support the PCWIN systems.
Communications & Emergency Operations Center(s) Project Participants
Tucson Police Department Communications Section
The Tucson Police Department Communications Section call-taker and dispatch operations will be
located in the Pima County Regional Emergency Communications and Operations Center. TPD
representatives will participate in the design planning effort and coordinate integration of agency
specific technology into the new facility.
Tucson General Services Department – 9-1-1 PSAP & Fire Dispatch
The Tucson General Services Department - 9-1-1 PSAP & Fire Dispatch functions will be located in
renovated facilities at the City of Tucson Thomas Price Service Center. Department representatives will
participate in the design planning effort and coordinate integration of agency specific technology into
the new facility.
County Fire District Dispatch Organization
The Northwest and Drexel Heights Fire Districts are leading an organizing effort to develop a dispatch
organization that will provide services to the various County Fire Districts. The fire districts are
responsible for their organizational development activities outside of the PCWIN project. Because the
new organization will operate from facilities to be renovated by the PCWIN project, representatives of
this organization will need to participate in the design planning effort for the dispatch facilities, and
coordinate integration of agency specific technology into the new facilities.
P h y s i c a l I n f r a s t r u c t u r e
C o n n e c t i v i t y B a c k g r o u n d
A4.79 | P a g e A p p e n d i x A : B a c k g r o u n d a n d C u r r e n t C o n d i t i o n s
Pima County Sheriff’s Department Communications Section
The Pima County Sheriff’s Department Communications Section will be located in the Pima County
Regional Emergency Communications and Operations Center. PCSD representatives will participate in
the design planning effort and coordinate integration of agency specific technology into the new facility.
Pima County Office of Emergency Management & Homeland Security
The County Emergency Operations Center and support staff offices will be a tenant in the planned Pima
County Regional Emergency Communications and Operations Center. OEM staff is expected to
participate in planning and implementation of the communications and emergency operations center(s).

P h y s i c a l I n f r a s t r u c t u r e
C o n n e c t i v i t y B a c k g r o u n d
A4.80 | P a g e A p p e n d i x A : B a c k g r o u n d a n d C u r r e n t C o n d i t i o n s
4.7 Public Buildings and Facilities
Like all local governments, Pima County owns or in some instances, leases, a vast inventory of both
special use public facilities and general office buildings, as well as physical plant, surface and subsurface
infrastructure all of which must be maintained and periodically improved. County facilities include:
libraries, food banks, health clinics, service centers, race track, schools, fuel stations, sports stadium,
performing arts center, fairgrounds, rodeo grounds, parking garages, community centers, landfills,
wastewater treement facilities, animal care center, wastewater lift stations, pump stations, jail, parks,
vocational school, archery range, campgrounds, shooting range and a multitude of administration
buildings.
The Board of Supervisors adopted the Sustainable Action Plan for County Operations (SAPCO) in August
2008 to implement the Sustainability Initiatives and in April 2012, the Board expanded the SAPCO by
adopting the Health and Wellness Chapter. Many initiatives to increase energy efficiency, reduce waste,
promote green building have been applied to County facilities.
A variety of strategies can incorporate the mission of public facilities with healthy community principles.
These may include incorporation of arts and culture, grouping of public facilities that provide compatible
functions, the integration of government facilities into mixed use projects, and the provision of services
to rural areas through existing or new multipurpose community centers. Public facilities and buildings
can serve as canvases for portraying the local history and celebrating the County identity, character,
heritage and sense of place. Murals, fountains, gathering plazas, promenades articulate the unique
meaning, value, and character of the physical and social form of the community creating space for social
intimacy, enhancing the community's character or sense of place and promoting health and enhancing
well-being.
See Exhibit 4.7.a and 4.7.b for maps of Pima County Public Buildings and Facilities.
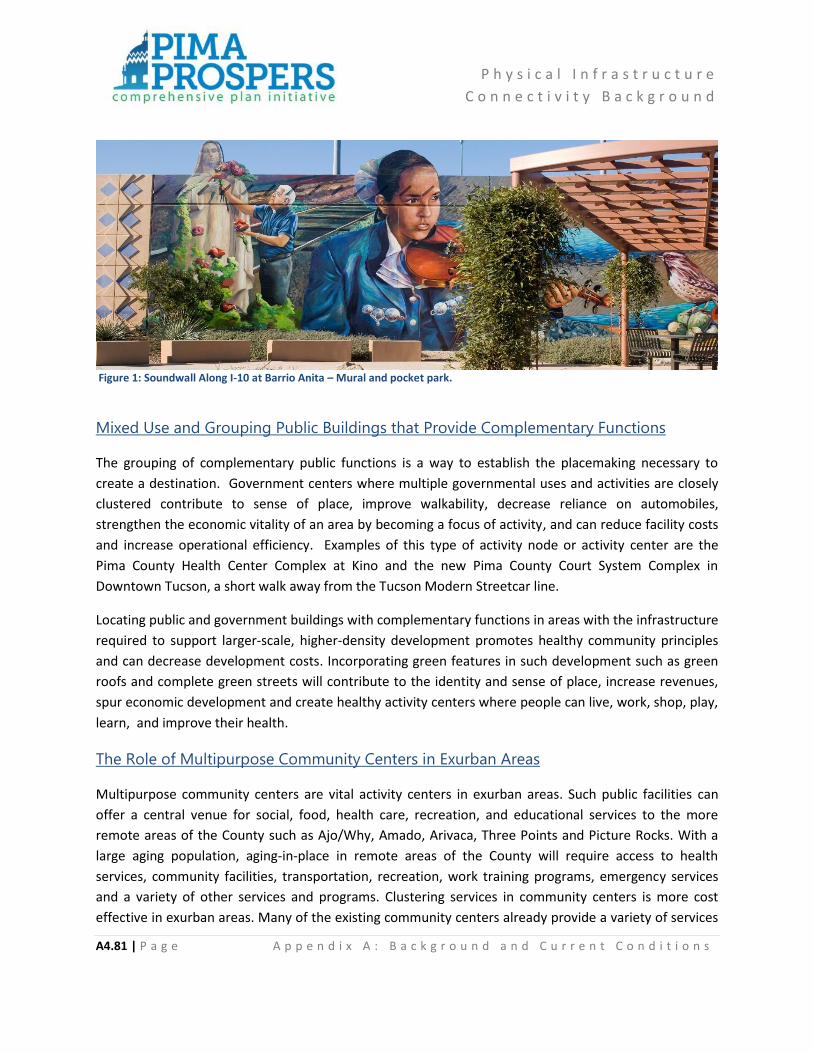
P h y s i c a l I n f r a s t r u c t u r e
C o n n e c t i v i t y B a c k g r o u n d
A4.81 | P a g e A p p e n d i x A : B a c k g r o u n d a n d C u r r e n t C o n d i t i o n s
Figure 1: Soundwall Along I-10 at Barrio Anita – Mural and pocket park.
Mixed Use and Grouping Public Buildings that Provide Complementary Functions
The grouping of complementary public functions is a way to establish the placemaking necessary to
create a destination. Government centers where multiple governmental uses and activities are closely
clustered contribute to sense of place, improve walkability, decrease reliance on automobiles,
strengthen the economic vitality of an area by becoming a focus of activity, and can reduce facility costs
and increase operational efficiency. Examples of this type of activity node or activity center are the
Pima County Health Center Complex at Kino and the new Pima County Court System Complex in
Downtown Tucson, a short walk away from the Tucson Modern Streetcar line.
Locating public and government buildings with complementary functions in areas with the infrastructure
required to support larger-scale, higher-density development promotes healthy community principles
and can decrease development costs. Incorporating green features in such development such as green
roofs and complete green streets will contribute to the identity and sense of place, increase revenues,
spur economic development and create healthy activity centers where people can live, work, shop, play,
learn, and improve their health.
The Role of Multipurpose Community Centers in Exurban Areas
Multipurpose community centers are vital activity centers in exurban areas. Such public facilities can
offer a central venue for social, food, health care, recreation, and educational services to the more
remote areas of the County such as Ajo/Why, Amado, Arivaca, Three Points and Picture Rocks. With a
large aging population, aging-in-place in remote areas of the County will require access to health
services, community facilities, transportation, recreation, work training programs, emergency services
and a variety of other services and programs. Clustering services in community centers is more cost
effective in exurban areas. Many of the existing community centers already provide a variety of services

P h y s i c a l I n f r a s t r u c t u r e
C o n n e c t i v i t y B a c k g r o u n d
A4.82 | P a g e A p p e n d i x A : B a c k g r o u n d a n d C u r r e n t C o n d i t i o n s
such as library, youth and senior programs, meal services, exercise classes, and other community
functions.
Figure 2: Flowing Wells Community Center.

P h y s i c a l I n f r a s t r u c t u r e
C o n n e c t i v i t y B a c k g r o u n d
A4.83 | P a g e A p p e n d i x A : B a c k g r o u n d a n d C u r r e n t C o n d i t i o n s
4.8 Trails
Pima County Regional Trail System Master Plan
Recent changes in river park and greenway standards convinced staff of the need to update the Eastern
Pima County Trail System Master Plan, which was last updated in 1996. The overall goal of the 2011
Pima Regional Trail System Master Plan was to expand the trail system both internally to the urban
zone of the area’s jurisdictions and to explore new opportunities in outlying areas.
The plan builds on the efforts of the previous Master Plan, taking another careful look at both the areas
surrounding the cities in the county, and the urban context of downtown and suburban Tucson and the
towns that are located on its periphery. The updated system consists of 853 miles of existing and
proposed trails, paths, greenways, river parks, bicycle boulevards and enhanced corridors that connect
regional destinations, parks, schools, and preserve areas. In addition, there are 1,422 miles of single
track trails that connect the urban core to the large natural preserves in Eastern Pima County, for a
total of 2,275 miles of trail. The trails system includes trails, parks, trailheads and boundary access
points to increase user access to the system, as well as detailed design standards for the first time—
including the Divided Urban Pathway (DUP) standard for river parks and greenways--to guide the future
development of the system.
The goals of the plan are to:
1) provide a regional trails network;
2) improve/expand the trail system within the urban core;
3) update the trails plan to reflect regional growth;
4) integrate the trails plan with regional land-use plans;
5) provide improved access to natural resource areas; and
6) integrate trails across jurisdictional boundaries.
Collaborating jurisdictions include the City of Tucson, Pima County, City of South Tucson, Town of
Marana, Town of Sahuarita and Town of Oro Valley. The Master Plan includes background data, system
features, a trail system element, standards, an inventory of facilities, implementation and funding. The
trail system encompasses trails, single-track trails, paths, river parks, greenways, enhanced
bicycle/pedestrian corridors, bicycle boulevards, trailheads and entry nodes, boundary access points,
crossings, interpretive and regulatory signs, pedestrian districts, and pedestrian activity areas.
It is anticipated that Pima Prospers policy will support the implementation of the existing plan rather
than duplicating this effort. For a complete inventory of trails facilities, the Pima Regional Trail System
Master Plan is available under a separate cover from Pima County Natural Resources Parks and
Recreation Department.
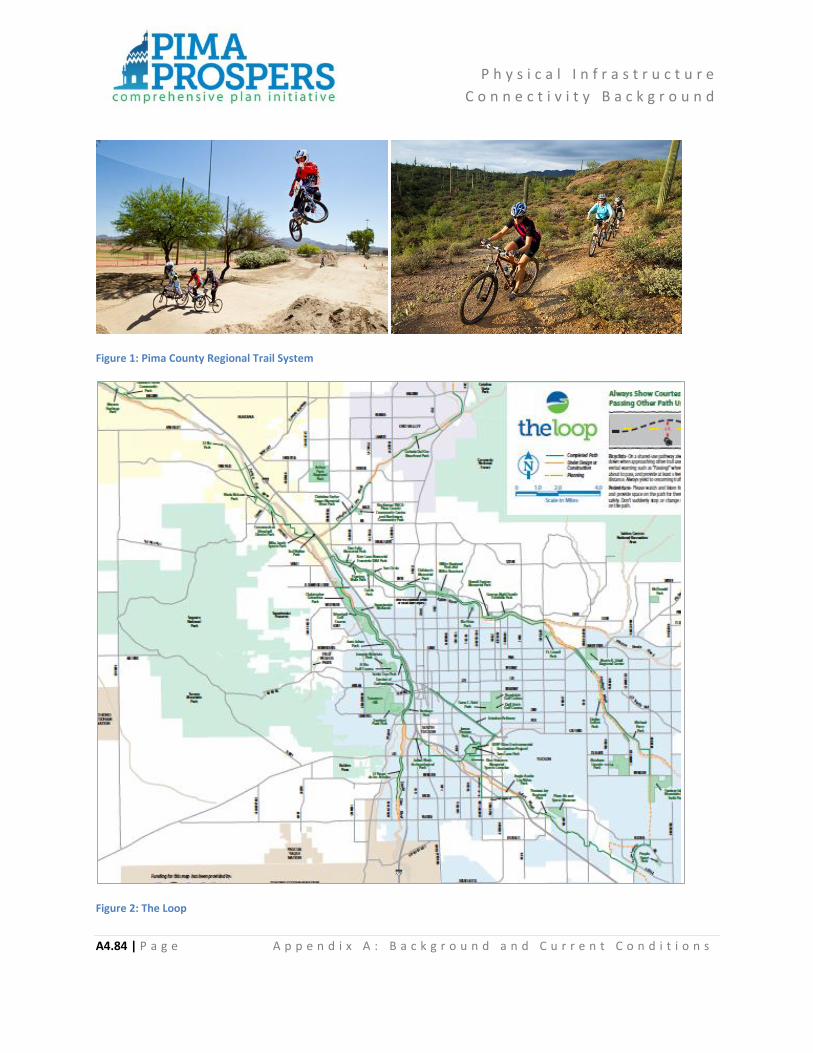
P h y s i c a l I n f r a s t r u c t u r e
C o n n e c t i v i t y B a c k g r o u n d
A4.84 | P a g e A p p e n d i x A : B a c k g r o u n d a n d C u r r e n t C o n d i t i o n s
Figure 1: Pima County Regional Trail System
Figure 2: The Loop

P h y s i c a l I n f r a s t r u c t u r e
C o n n e c t i v i t y B a c k g r o u n d
A4.85 | P a g e A p p e n d i x A : B a c k g r o u n d a n d C u r r e n t C o n d i t i o n s
Trail System, Transportation Modes, Healthy Communities & Economic Development
Pima Prospers recognizes the connection between physical activity and healthy bodies and minds.
Trails contribute to healthy lifestyles, provide access and serve as alternate transportation modes, and
provide connectivity from neighborhoods to diverse land uses, recreation areas and open space. They
also provide an opportunity to exercise, breathe clean air, reduce mental stress andoffer opportunities
for residents and visitors to learn about the lush Sonoran desert. When appropriately branded, such
trails attract visitors to the area.
The Loop
When completed, The Loop will include 131 miles of paths connecting the Rillito, Santa Cruz, and
Pantano River Parks with the Julian Wash and Harrison Road Greenways. Loop links will extend the
network of multi-use paths to Marana, Oro Valley, Tucson, and South Tucson. These exciting
connections are the result of Pima County’s cooperative partnerships with these jurisdictions.
The Loop will connect parks, trailheads, bus and bike routes, works places, schools, restaurants, hotels
and motels, shopping areas, and entertainment venues. Visitors and Pima County residents will enjoy
The Loop on foot, bikes, skates, and horses. If it does not have a motor, it’s good to go on The Loop.
This type of effort ties the trails system, transportation mode, healthy communities and economic
development. Pima Prospers policies should continue to support and maintain a trail system that
integrates the four spheres of healthy community, healthy people, healthy environment and healthy
economy.
Figure 3: The Loop provides alternate transportation modes.

P h y s i c a l I n f r a s t r u c t u r e
C o n n e c t i v i t y B a c k g r o u n d
A4.86 | P a g e A p p e n d i x A : B a c k g r o u n d a n d C u r r e n t C o n d i t i o n s
4.9 Flood Control/Drainage
The Pima County Regional Flood Control District strives to use forward-looking floodplain management
practices to minimize flood and erosion damage to property and infrastructure, both public and private.
Regionally, the District is involved in a variety of flood monitoring, flood control and natural resource
management activities. It also performs floodplain management activities within unincorporated
portions of Pima County. While the District is a regional authority, undertaking flood mitigation efforts
throughout Pima County, it does not regulate floodplains within incorporated areas or on Tribal Nations.
Regional Flood Control District (RFCD)
Current and Proposed RFCD Efforts The Regional Flood Control District impacts land use in three basic ways: providing flood hazard mapping
information, building flood control infrastructure and protecting the natural functions of floodplains.
The District updates Federal Emergency Management Agency (FEMA) Special Flood Hazard Maps and
makes these and studies of flood prone areas not mapped by FEMA available to the public. Capital
Improvements Programs continue to reduce flood damage risk and provide amenity in developed areas
while the protection of natural floodplains as a successful non-structural floodplain management tool
has also received increasing attention.
The most significant flood hazard in this region is flash flooding and erosion including channel migration.
Development within these hazard areas is prevalent due to historical development patterns, lack of
floodplain mapping and understanding risks associated with flooding in an arid region. Following the
floods of the latter part of 1983 and 1993, efforts focused on bank stabilization for major watercourses
including the Santa Cruz River, Rillito and Pantano. In addition to these capital improvements, sediment
management, floodplain map updates, and land acquisitions have also been extensive.

P h y s i c a l I n f r a s t r u c t u r e
C o n n e c t i v i t y B a c k g r o u n d
A4.87 | P a g e A p p e n d i x A : B a c k g r o u n d a n d C u r r e n t C o n d i t i o n s
The hidden costs of not conducting these activities include increased risk of flood damages including loss
of property and life, ongoing excessive maintenance costs, increased liability and development of the
perception of overly burdensome and unnecessary public expenditures. Furthermore, failure to pursue
these activities results in increased flood insurance rates and reduced availability of post-disaster federal
assistance.
Looking ahead, regional detention facilities will be considered due to downstream flow constraints
including transportation infrastructure. Protection of natural flow corridors and habitat in the overbanks
will also help attenuate flood flows and reduce the need for increasing downstream channel, bridge and
culvert sizes. The District’s encroachment criteria, detention and habitat protection requirements all
contribute to this approach.
As a result of these capital improvements and land acquisitions, the District is responsible for
maintenance of 23,818 acres of land. Of this, 14,812 acres are owned in fee title, with 9006 acres via
easements, IGA and Special Conditions. The District also owns the flood control improvements placed
thereon including levees, bank protection, detention basins, channels, and multi-use facilities.
Traditional floodplain activities such as agriculture, aggregate mining, and waste disposal have been on
the decline. This trend has been bolstered by adoption of the Important Riparian Area component of the
Maeveen Marie Behan Conservation Lands System and incorporation of this component into the
Floodplain Management Ordinance. Not only has this resulted in the identification and protection of
major flow corridors, it has forged the basis for The Loop, an urban, non-vehicular circulation route.
The Pima County Emergency Planning The Pima County Multi-Hazard Mitigation Plan was prepared according to The Disaster Mitigation Act of
2000 (DMA2K). The DMA2K requires all local, county, tribal and state governments to have a FEMA
approved hazard mitigation plan in order to be eligible for certain federal disaster mitigation funds and
is considered in the National Flood Insurance Program Community Rating System which determine
insurance rates within the County. This plan focuses on the area's most threatening hazards and
provides a strategy to reduce or eliminate the risk from those hazards to the people and property of
Pima County. These include dam failure, disease, drought, earthquake, extreme heat, flood, hail,
Hazardous Material Events, lightning, severe winds, subsidence, thunderstorm, tornado, tropical cyclone
and wildfire. While vulnerability is assessed for each of these hazards specifically, the plan also provides
a basis for responding to any declared emergency event.
Planning makes it possible to manage the entire life cycle of a potential crisis. Strategic and operational
planning establishes priorities, identifies expected levels of performance and capability requirements,

P h y s i c a l I n f r a s t r u c t u r e
C o n n e c t i v i t y B a c k g r o u n d
A4.88 | P a g e A p p e n d i x A : B a c k g r o u n d a n d C u r r e n t C o n d i t i o n s
provides the standard for assessing capabilities, and helps stakeholders learn their roles. The planning
elements identify what an organization's Standard Operating Procedures (SOP) or Emergency
Operations Plans (EOP) should include for ensuring that contingencies are in place for delivering the
appability during a large-scale disaster.
All-hazards planning is built upon scalable, flexible, and adaptable coordinating structures that allow for
planning documents to be useful for both the expected and unexpected incidents, as they arise, no
matter the size, scope or complexity. Encouraged from within Federal doctrine, such as the National
Response Framework, all-hazards planning has become the preferred method and is in use across all
Pima County planning documents.
The hazards and vulnerability assessments contained in the Multi-Hazard Plan are incorporated by
reference in this Background and Current Conditions volume. The Multi-Hazard Plan assesses the
vulnerability of Critical Facilities as defined by FEMA and the PCC and is intended to coordinate their
integration into responses both as a providers and potential victims.
Critical facilities include hospitals, police and fire stations, public works machinery yards, libraries and
schools which are involved in emergency response as well as electrical, water and sewer facilities which
must remain functional during emergencies. Hazardous waste storage facilities are considered critical as
they may exacerbate an event if unprotected or damaged, as in the case of nuclear power plants and
fuel storage. Lastly facilities such as nursing homes and jails which house people who may not be
sufficiently mobile to evacuate on their own are considered critical. Critical facilities are regulated under
the Floodplain Management Ordinance per FEMA guidelines however these provisions were adopted in
2013. And therefore many grandfathered facilities exist in vulnerable areas. Secondly, the 2005 plan
used assumptions rather than inventories so the value of this information is limited.
Storm Water Runoff
Pima County manages storm water to ensure public safety through three regulatory mechanisms. First,
the Pima County Regional Flood Control District, through the Floodplain Management Ordinance,
addresses the impact of development on flooding, erosion and riparian habitat. The purpose of the
Ordinance is to protect lives and property from flood risk and ensure no adverse impact to adjacent or
downstream properties. These are accomplished by establishing encroachment thresholds, flood peak
and flood volume reduction requirements, and incentives for avoiding the disturbance of riparian
habitat. Flood Control policy recognizes beneficial functions of floodplains and riparian areas including
flood attenuation, recharge, pollution control, and habitat. In recent years, as part of drought response
and resiliency the County has been cooperating with other local and regional entities to develop
guidelines for the benficial use of stormwater including green infrastructure ad low impact development
techniques such as water harvesting.
P h y s i c a l I n f r a s t r u c t u r e
C o n n e c t i v i t y B a c k g r o u n d
A4.89 | P a g e A p p e n d i x A : B a c k g r o u n d a n d C u r r e n t C o n d i t i o n s
Second, the Department of Environmental Quality administers programs to address storm water
quality. In 1972, the U.S. Congress passed the Clean Water Act (CWA) to protect and improve the
quality of the water of the United States. The State of Arizona gained the primacy, or authority, to
implement this federal program at the state level in 2002. The Arizona Pollutant Discharge Elimination
System (AZPDES) is the state program that protects surface water quality.
Pima County holds a Municipal Separate Storm Sewer System (MS4) Permit which authorizes the county
to discharge storm water from its MS4 to receiving waters. The county’s MS4 consists of 2,087 miles of
roadways, 39 miles of storm drains, and infrastructure collecting runoff into stream channels. The
program includes control measures to minimize the discharge of pollutants carried by runoff. In order to
control the pollutants that enter and exit the MS4, the County performs inspections of construction and
industrial sites that are permitted via the AZPDES Construction General Permit and Multi-Sector General
Permit, respectively.
Lastly, the building code and zoning codes contain provisions establishing minimum standards for site
grading, site drainage and design. The largest area for improvement is in coordination and integration as
already reflected in the infrastructure and land management programs.
Drainage Integration
While landowners and investors desire coordinated regulation, integration also offers opportunity to
achieve community quality of life goals including safety, accessibility, amenity and habitat
preservation. While the building code and Floodplain Management Ordinance provide design guidance
to minimize flood risk and off-site impacts, the riparian habitat, water quality, comprehensive plan
water policy, Native Plant Preservation Ordinances and zoning code all contain integrative provisions
which have been underutilized.
For example, while the Floodplain Management Ordinance encourages avoidance of riparian habitat it
does not require it and design and performance criteria are provided. On the other hand, the Native
Plant Preservation Ordinance requires mapped riparian habitat to be set-aside as open space.
Application of this NPPO provision strengthens the protection of riparian habitat as intended by the
Floodplain Management Ordinance.
The District has developed criteria which would apply at rezoning that define when floodplains and
mapped riparian habitat are to be set-aside as open space. In addition, the zoning code provides for
modification of development standards in riparian areas. The existing comprehensive plan land use
designation, Resource Transition (RT) was meant to ensure low density development within floodplains
and habitat. Plan policies regarding the definition, treatment and distribution of RT have been re-

P h y s i c a l I n f r a s t r u c t u r e
C o n n e c t i v i t y B a c k g r o u n d
A4.90 | P a g e A p p e n d i x A : B a c k g r o u n d a n d C u r r e n t C o n d i t i o n s
evaluated. Pima Prospers proposes updating these maps to reflect updated floodplain and habitat
distribution and to strengthen avoidance provisions.
By weaving together watercourses, riparian and upland habitat, and recreation better urban
development can be achieved. This includes increases in property value and services availability. New
guidelines under development address water harvesting and habitat mitigation and offer further
opportunity for integration, particularly for drought response. Both regulation and infrastructure
programs offer these opportunities and will continue to be utilized.
4.10 Infrastructure Concurrency
Land use actions heard by the Board of Supervisors, particularly rezoning requests, undergo staff review
for concurrency for transportation, flood control, wastewater/environmental quality, parks and
recreation, water, and school services. Staff verify whether the request has adequate infrastructure
capacity to serve the proposed development.
It is the policy of the current comprehensive plan to “Establish a formal Concurrency Management
System” and water, and school services to “Establish a formal permit review procedure to allow the
County to determine and coordinate the individual and cumulative impacts each proposed development
request will have on each of the minimum level-of-service standards identified for the urban
service/expansion area where the development request is located.”
And finally, the plan suggests to “Establish a scale of development assessment fees to finance necessary
public infrastructure and facilities. Once the built-out projection of a given Urban Service Area or Urban
Expansion Area has been used to calculate its total public infrastructure requirement, a total cost
estimate for the area’s public infrastructure can be completed. This total infrastructure cost estimate
can then be used to establish equitable developer-assessment fees for each area.

P h y s i c a l I n f r a s t r u c t u r e C o n n e c t i v i t y B a c k g r o u n d
A4.91 | P a g e A p p e n d i x A : B a c k g r o u n d a n d C u r r e n t C o n d i t i o n s

EXHIBIT 4.1.bMajor Streets & Scenic Routes
September 2013
P h y s i c a l I n f r a s t r u c t u r e C o n n e c t i v i t y B a c k g r o u n d
A4.92 | P a g e A p p e n d i x A : B a c k g r o u n d a n d C u r r e n t C o n d i t i o n s

EXHIBIT 4.2Water Service Areas
September 2013
P h y s i c a l I n f r a s t r u c t u r e C o n n e c t i v i t y B a c k g r o u n d
A4.93 | P a g e A p p e n d i x A : B a c k g r o u n d a n d C u r r e n t C o n d i t i o n s
Note: There are no Water Service Areas in West Pima County

EXHIBIT 4.3.aElectrical Utility Service
Areas
September 2013
P h y s i c a l I n f r a s t r u c t u r e C o n n e c t i v i t y B a c k g r o u n d
A4.94 | P a g e A p p e n d i x A : B a c k g r o u n d a n d C u r r e n t C o n d i t i o n s
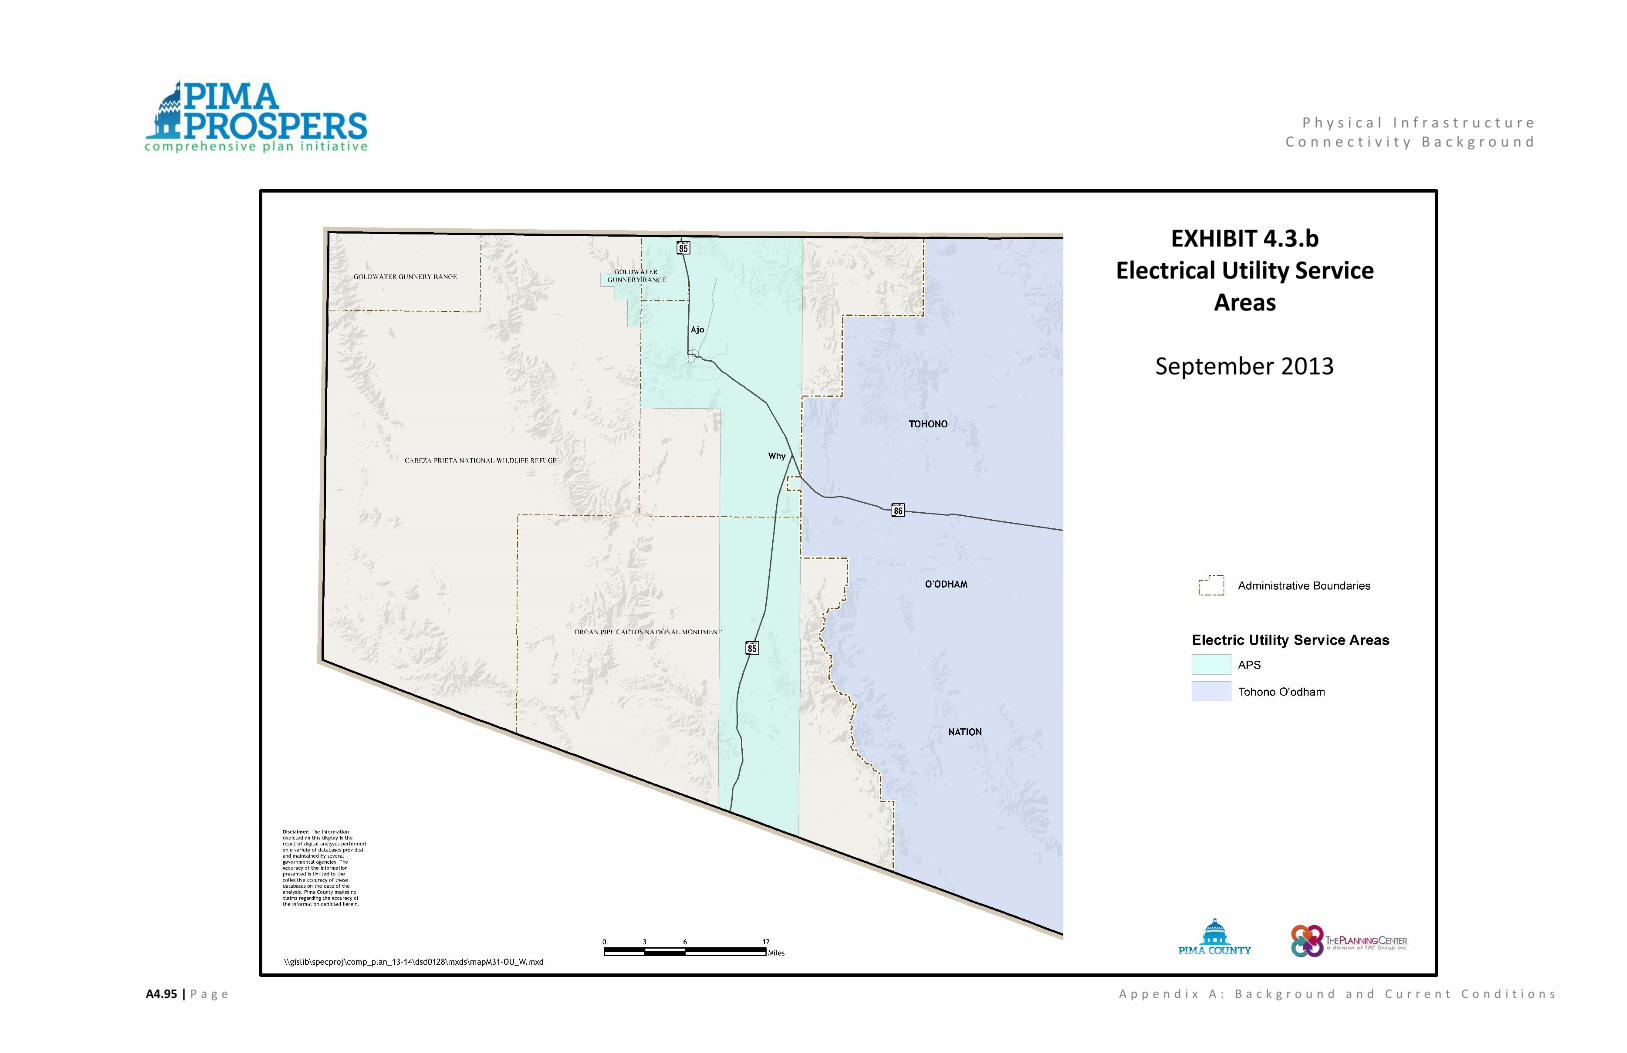
EXHIBIT 4.3.bElectrical Utility Service
Areas
September 2013
P h y s i c a l I n f r a s t r u c t u r e C o n n e c t i v i t y B a c k g r o u n d
A4.95 | P a g e A p p e n d i x A : B a c k g r o u n d a n d C u r r e n t C o n d i t i o n s
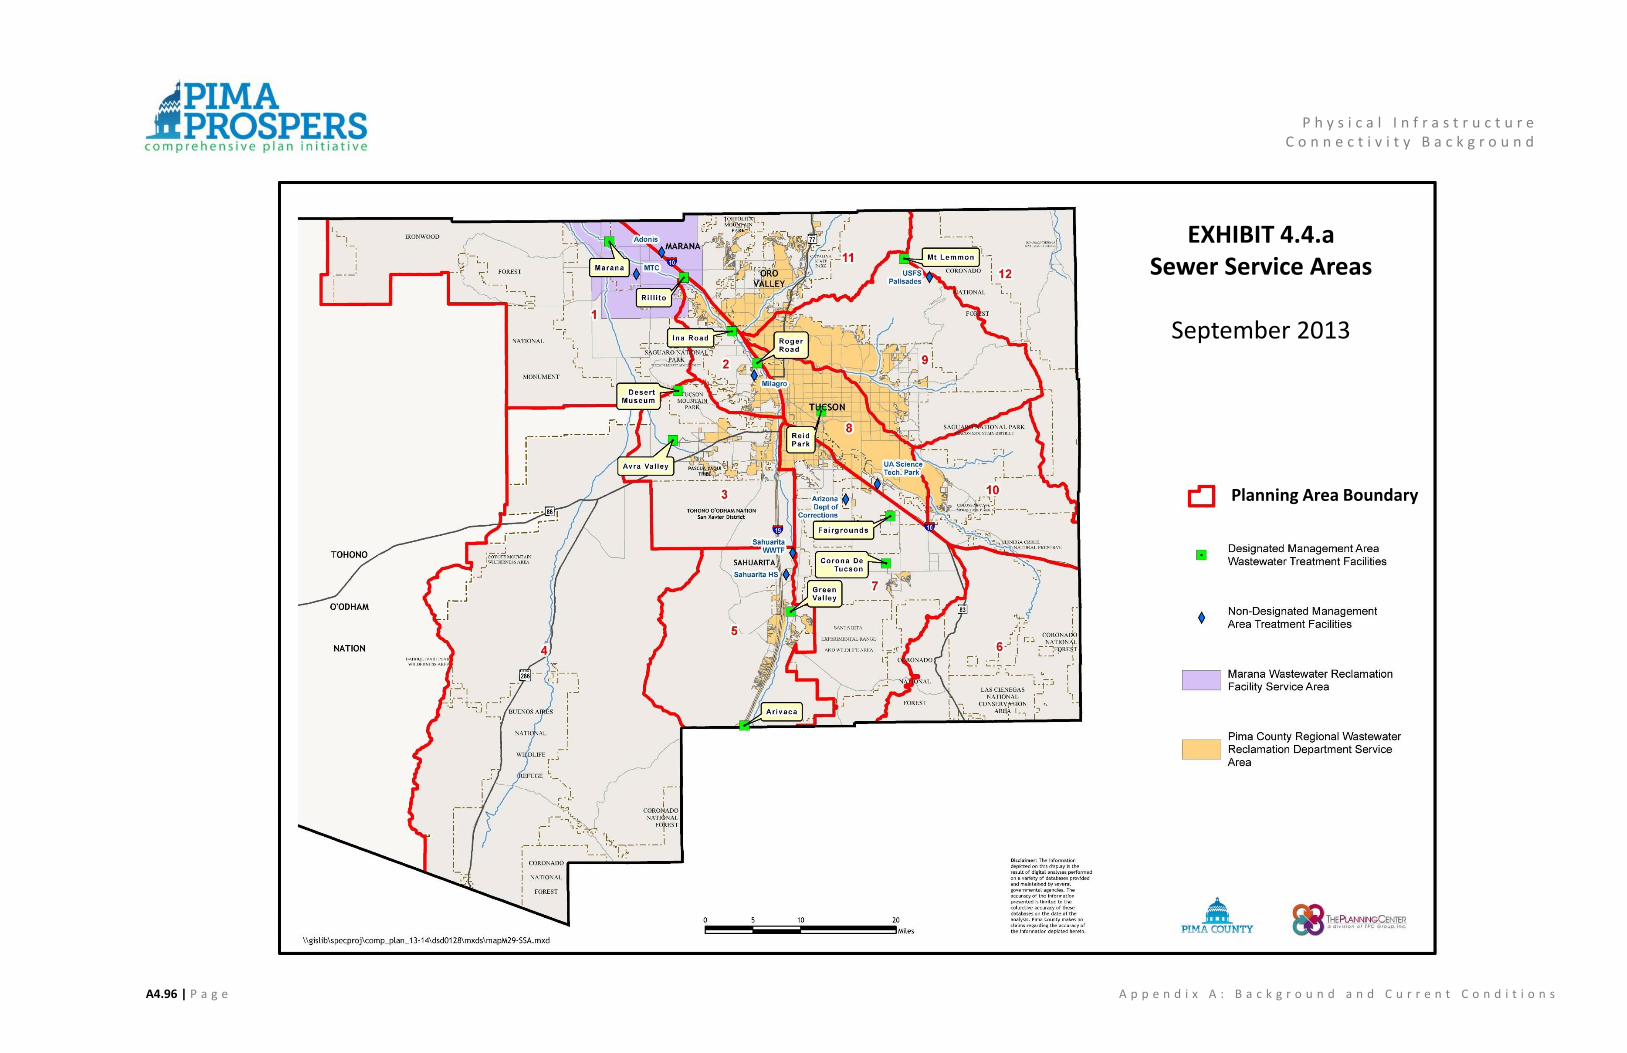
EXHIBIT 4.4.aSewer Service Areas
September 2013
Planning Area Boundary
P h y s i c a l I n f r a s t r u c t u r e C o n n e c t i v i t y B a c k g r o u n d
A4.96 | P a g e A p p e n d i x A : B a c k g r o u n d a n d C u r r e n t C o n d i t i o n s
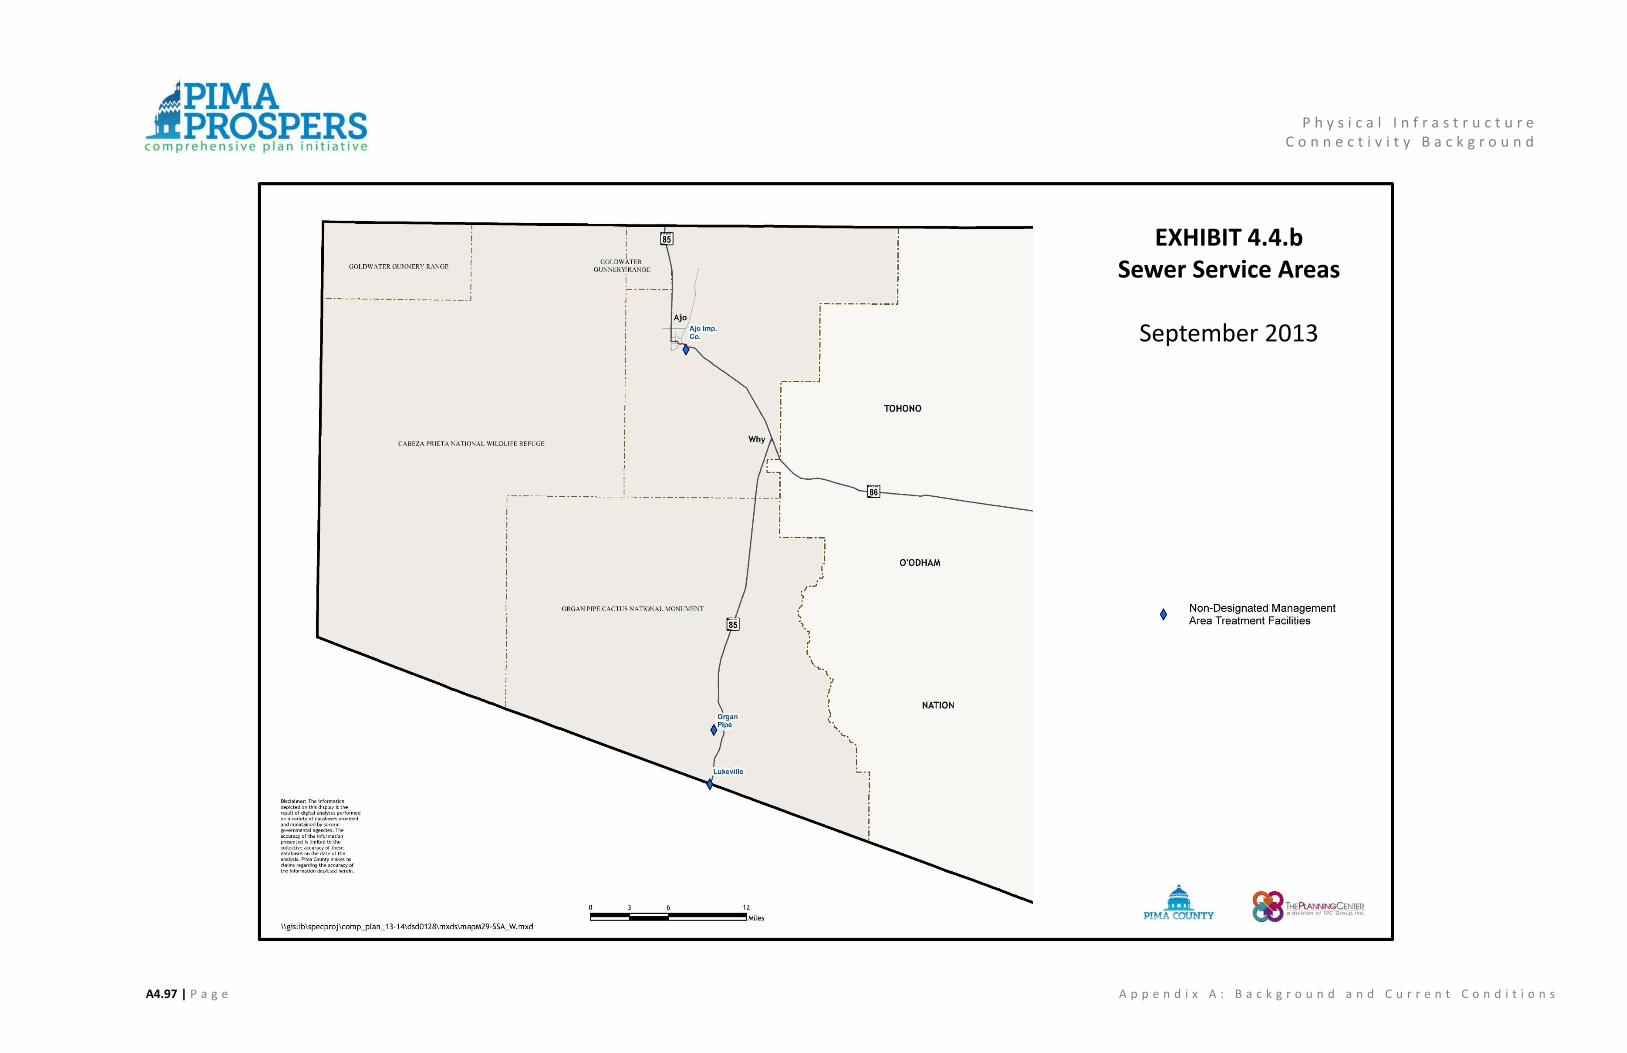
EXHIBIT 4.4.bSewer Service Areas
September 2013
P h y s i c a l I n f r a s t r u c t u r e C o n n e c t i v i t y B a c k g r o u n d
A4.97 | P a g e A p p e n d i x A : B a c k g r o u n d a n d C u r r e n t C o n d i t i o n s

EXHIBIT 4.7.aPublic Buildings and
Facilities
September 2013
P h y s i c a l I n f r a s t r u c t u r e C o n n e c t i v i t y B a c k g r o u n d
A4.98 | P a g e A p p e n d i x A : B a c k g r o u n d a n d C u r r e n t C o n d i t i o n s

EXHIBIT 4.7.bPublic Buildings and
Facilities
September 2013
P h y s i c a l I n f r a s t r u c t u r e C o n n e c t i v i t y B a c k g r o u n d
A4.99 | P a g e A p p e n d i x A : B a c k g r o u n d a n d C u r r e n t C o n d i t i o n s

H u m a n I n f r a s t r u c t u r e
C o n n e c t i v i t y B a c k g r o u n d
A5.1 | P a g e A p p e n d i x A : B a c k g r o u n d a n d C u r r e n t C o n d i t i o n s
Chapter 5: Human Infrastructure Connectivity Background
Key Subjects
Health Care Services Delivery
Public Safety and Emergency Services
Parks and Recreation
Workforce Training/Education
Arts and Entertainment
Library Services
Animal Care
Food Access
Important Notes:
1. At the time of the preparation of the infrastructure study that served as the core of this
background document, the Tohono O’odham Nation was treated as a planning area for
statistical purposes only. The Tohono O’odham Nation is a sovereign nation, and though
the County recognizes the importance of the Nation to the region, the County has no
jurisdiction over the Nation.
2. All Exhibits referenced in this chapter are included at the end of the chapter.
Human Infrastructure
Connectivity
H u m a n I n f r a s t r u c t u r e
C o n n e c t i v i t y B a c k g r o u n d
A5.2 | P a g e A p p e n d i x A : B a c k g r o u n d a n d C u r r e n t C o n d i t i o n s
5.1 Health Care Services Delivery
Pima County is a key player in making the community healthy and safe. The County has the ability to
influence many of the social, cultural and environmental factors that affect people’s health and lifestyle
choices. Infrastructure and policy development, community collaboration, and service delivery by the
County all have the potential to impact health outcomes. This section defines a healthy community, and
summarizes the state of heath and challenges currently facing Pima County.
Health Services and Healthy Communities
Pima County has taken the stance that a healthy community is more than the absence of disease. A
holistic healthy community approach involves housing, the environment, the economy, transportation
and much more.
Historically, the County operated certain programs to
ensure efficient health service delivery to Pima County
residents. Over the past decade, the County’s focus has
shifted from direct service delivery to its support of a
healthy and safe community through leadership,
collaboration with community stakeholders, education
and prevention efforts, and community design. The
County continues to provide some health services,
primarily through the Pima County Health Department
(PCHD). PCHD provides public health services mandated by Arizona Revised Statutes, Arizona
Administrative Code or Pima County Ordinance; delegated from the State; as well as other services to
strategically address critical community health issues. PCHD also ensures health care services are
delivered to adults and youth detained in the custody of the Pima County Sheriff’s Department or
Juvenile Court.
Healthy Communities Defined
A Healthy Community promotes healthy individuals, a healthy economy and a healthy environment. In
other words, it benefits all and it contributes significantly to livability and long term economic resiliency
of the community.
One of the most critical issues confronting communities in Arizona today is the impact that the physical
environment has on public health. Research studies have consistently shown that the design of the
physical environment contributes to chronic diseases such as obesity, type II diabetes and heart related

H u m a n I n f r a s t r u c t u r e
C o n n e c t i v i t y B a c k g r o u n d
A5.3 | P a g e A p p e n d i x A : B a c k g r o u n d a n d C u r r e n t C o n d i t i o n s
disease. Designing healthy communities that facilitate an active lifestyle and that support air and water
quality is critical to the long term health of Arizona communities as well as to Pima County.
In 2012, the American Planning Association Arizona Chapter, the Arizona Department of Health Services,
the Livable Communities Coalition, Maricopa County Department of Public Health, St. Luke’s Health
Initiative, and the Sonoran Institute combined their efforts to create a Healthy Community Design
Coalition for Arizona. This collaboration resulted in the preparation of the Healthy Community Design
Toolkit 2012. The toolkit is a guide for residents, planners and urban designers in the preparation of
comprehensive and general plans. Rather than being a step-by-step guide, it provides an overview of the
process, explains how to assess existing conditions and provides examples of policies that may be
considered for incorporation.
The Toolkit provides that a comprehensive plan should serve as community vision for the future. That
vision must address the issues of community health – healthy eating/active living – and put in place
goals and policies – that respond to the need of residents to have opportunities for a healthy lifestyle.
Pima Prospers expands the vision of healthy community to also include healthy workforce, healthy
economy, and healthy environment. These need to be weaved in the policy framework to produce an
implementable plan that carries our region into a prosperous future.
The Healthy Communities approach involves four major interdependent spheres: health care access,
environment, community design, and lifestyle choice.

H u m a n I n f r a s t r u c t u r e
C o n n e c t i v i t y B a c k g r o u n d
A5.4 | P a g e A p p e n d i x A : B a c k g r o u n d a n d C u r r e n t C o n d i t i o n s
Figure 1: Healthy Community Approach
Healthy Community Framework
ENVIRONMENT Parks, Trails, Open Space, Air, Water Quality, Wildlife
HEALTH CARE ACCESS Health Services, Access, Active Lifestyles and Affordability
LIFESTYLE CHOICES Education, Jobs, Workforce Training, Housing, Public Safety, Healthy Eating, Active Living
COMMUNITY DESIGN Land Use, Physical Infrastructure, Human Infrastructure, Economic Development

H u m a n I n f r a s t r u c t u r e
C o n n e c t i v i t y B a c k g r o u n d
A5.5 | P a g e A p p e n d i x A : B a c k g r o u n d a n d C u r r e n t C o n d i t i o n s
Existing Population-based Health Services
The Pima County Health Department serves as the community’s voice for public health, and assures
that high quality services are available and accessible to all persons.
The Pima County Health Department works to uphold public health and safety by assuring it provides
the Ten Essential Public Health Services as defined by the Centers for Disease Control and Prevention
(CDC).
Ten Essential Public Health Services
1. Monitor health status to identify and solve community health problems; 2. Diagnose and investigate health problems and health hazards in the community; 3. Inform, educate, empower people about health issues; 4. Mobilize community partnerships and action to identify and solve health problems; 5. Develop policies and plans that support individual and community health efforts; 6. Enforce laws and regulations that protect health and ensure safety; 7. Link to/provide care of needed personal health services and assure the provision of health care
when otherwise unavailable; 8. Assure competent workforce for public and personal healthcare workforce; 9. Evaluate effectiveness, accessibility, and quality of personal and population-based health
services; and 10. Research for new insights and innovative solutions to health problems.
Figure 2: Public Health Services

H u m a n I n f r a s t r u c t u r e
C o n n e c t i v i t y B a c k g r o u n d
A5.6 | P a g e A p p e n d i x A : B a c k g r o u n d a n d C u r r e n t C o n d i t i o n s
PCHD responds to these services by providing the following functions to the public at PCHD locations
and various community sites:
Administration of immunizations to children and adults;
Screening and treatment for tuberculosis (latent and active) and community education;
Screening, diagnosis and treatment for sexually transmitted diseases (STDs), HIV and STD
education and counseling, and referral to care for those infected with HIV;
Communicable disease investigation and surveillance for diseases such as tuberculosis, syphilis,
gonorrhea, West Nile virus, rabies and many others as directed by the state;
Certification of births and deaths and provider education on proper vital record procedures;
Assurance of community compliance with food service, swimming pool, and housing, and smoke-
free statutes and code;
Chronic disease education, particularly related to tobacco use prevention and cardiovascular
health, for all ages;
Screening and preventive dental services to young school-age children;
Breast and cervical cancer screening to low-income women, and referrals to diagnostic and
treatment services when appropriate;
Family planning and contraceptive services, particularly to low-income women and youth;
Nutritional vouchers, health education, and support to low-income women and children;
Public health nursing for individuals, families and groups to include services related to fall
prevention, child safety seats, prevention of low-birth weight or premature infants, and
complications related to pregnancy;
Nurse consulting services to child care providers and schools; and
Coordination of community preparedness for public health emergencies.
State of Health in Pima County
Identifying the primary health issues facing Pima County allows for a comprehensive approach to
planning that illuminates how the environment we live in is shaping the health of our communities. This
section examines the health status and outcomes of people living in Pima County and their ability to
access infrastructure, resources and services that improve health and prevent premature deaths.
Health Indicators and Risk Factors
Mortality rates are an important factor in evaluating the County’s health services and in determining
how to move forward in the future.
From 2005 to 2010, Pima County saw the death rate decline for cardiovascular disease (though it ranks
10th out of 15 counties in Arizona). Overall death rates also declined in the same time period for

H u m a n I n f r a s t r u c t u r e
C o n n e c t i v i t y B a c k g r o u n d
A5.7 | P a g e A p p e n d i x A : B a c k g r o u n d a n d C u r r e n t C o n d i t i o n s
malignant neoplasms, accidental injury, cerebrovascular disease, Alzheimer's disease, influenza and
pneumonia.
During that same period, Pima County saw an overall increase in death rates for injury by firearms,
suicide, diabetes and drug-induced deaths. In fact, Pima County has one of the state’s highest rates of
drug-induced deaths, ranking 3rd among all Arizona counties.
Leading Causes of Death1
Another indicator for a population's health is the leading cause of death. In 2011, the leading cause of
death in Pima County was cardiovascular disease, followed by cancer. More Pima County residents died
from lung cancer than any other type of cancer at a rate of 38.8/100,000 population. The following
table shows Pima County age-adjusted mortality rate (deaths per 100,000 residents) compared to the
State rate.
Table 5.1.a: Leading Cause of Death - 2011
Cause of Death Pima County Arizona % Compared to AZ
1 Cardiovascular Disease (includes heart disease) 208.0 201.0 3.5%
2 Cancer 156.8 151.3 3.6%
3 Accident (unintentional injury) 43.2 45.5 -5.1%
4 Chronic lower respiratory disease 40.7 45.9 -11.3%
5 Cerebrovascular disease (stroke) 34.4 30.6 12.4%
6 Diabetes 21.6 24.8 -12.9%
7 Drug-induced death 20.3 16.8 20.8%
8 Injury by fire arms 17.5 14.7 19.0%
9 Alzheimer's disease 17.4 35.2 -50.6%
Source: Arizona Department of Health Services, 2011
When comparing males and females in Pima County, females were more likely to die from Alzheimer’s,
influenza and pneumonia, and chronic liver disease and cirrhosis, than males. Males were more likely to
die from fire-arm injury, alcohol use, and suicide, than females.
1 Bishop, Torres & Gupta, S. (May 2013). Arizona Health Status and Vital Statistics. Arizona Department of Health
Services, Public Health Services, Bureau of Public Health Statistics.

H u m a n I n f r a s t r u c t u r e
C o n n e c t i v i t y B a c k g r o u n d
A5.8 | P a g e A p p e n d i x A : B a c k g r o u n d a n d C u r r e n t C o n d i t i o n s
Table 5.1.b: Leading Cause of Death for Males and Females- 2011
Source: Arizona Department of Health Services, 2011
Health Risk
The behaviors and risk factors of Pima County residents illustrate opportunities for community planning
that influence the social and built environments contributing to premature and preventable deaths. Of
particular note is that over twenty percent of adults in Pima County report that they did not participate
in physical activity of any kind in the past month. The following table provides a comparison of the
performance of Pima County and Arizona on key health risk indicators.
Table 5.1.c.: Health Risk Factors
Indicators Cause of Death
Risk Factor
Pima
County
Arizona Compared to
Arizona
Physical Activity Adults reporting they did not participate in physical
activity of any kind in the past month2
20.3% 20.8%
Obesity/ Overweight adults 31.8% 39.7%
2 Behavioral Risk Factor Surveillance System Data for Pima County and Arizona. (2010).

H u m a n I n f r a s t r u c t u r e
C o n n e c t i v i t y B a c k g r o u n d
A5.9 | P a g e A p p e n d i x A : B a c k g r o u n d a n d C u r r e n t C o n d i t i o n s
Indicators Cause of Death
Risk Factor
Pima
County
Arizona Compared to
Arizona
Overweight Obese adults 26.6% 25.2%
Substance Abuse Report binge drinking in the last 30 days 16.8% 14.0%
Heavy drinker 8.0% 5.5%
Tobacco Use Current smoker 15.5% 15%
Preventative
Health
Women with Pap Test in Past 3 years3 70.1% 67.5%
Sexual Behavior Rate of Gonorrhea Infection in females 15-444 10.5% 16.7%
Rate of Syphilis Incidence (primary and secondary) 4.6% 4.3%
Rate of new HIV cases 6.3 8.7
Source: Arizona Department of Health Services, 2011
Hospitalizations
Pima County hospitals are seeing the impact of people’s choices on their health outcomes as well as
clear trends in the health care needs of Pima County’s populations. An inpatient discharge occurs when
a person who was admitted to a hospital leaves that hospital. In 2011, heart disease was the leading
hospital inpatient discharge diagnosis in Pima County (94.1/10,000 population).5 Psychoses including
alcoholic psychoses, drug psychoses, schizophrenic disorders and manic-depressive disorders had the
second highest rate for hospital discharge diagnosis at 71.0/10,000 population. Fractures and
osteoarthrosis, issues prevalent within Pima County’s older populations, are near the top of the list of
diagnosis hospitals treat. This information indicates that healthy behaviors, behavioral health and elder
care are top health concerns in Pima County.
3 Arizona Department of Health Services Cancer Registry Data (2010). 4 Mrela, Ck.K & Torres, C. (2011). Arizona Health Status and Vital Statistics. Arizona Department of Health Services. 5 Mrela, Ck.K & Torres, C. (2011). Arizona Health Status and Vital Statistics. Arizona Department of Health Services.
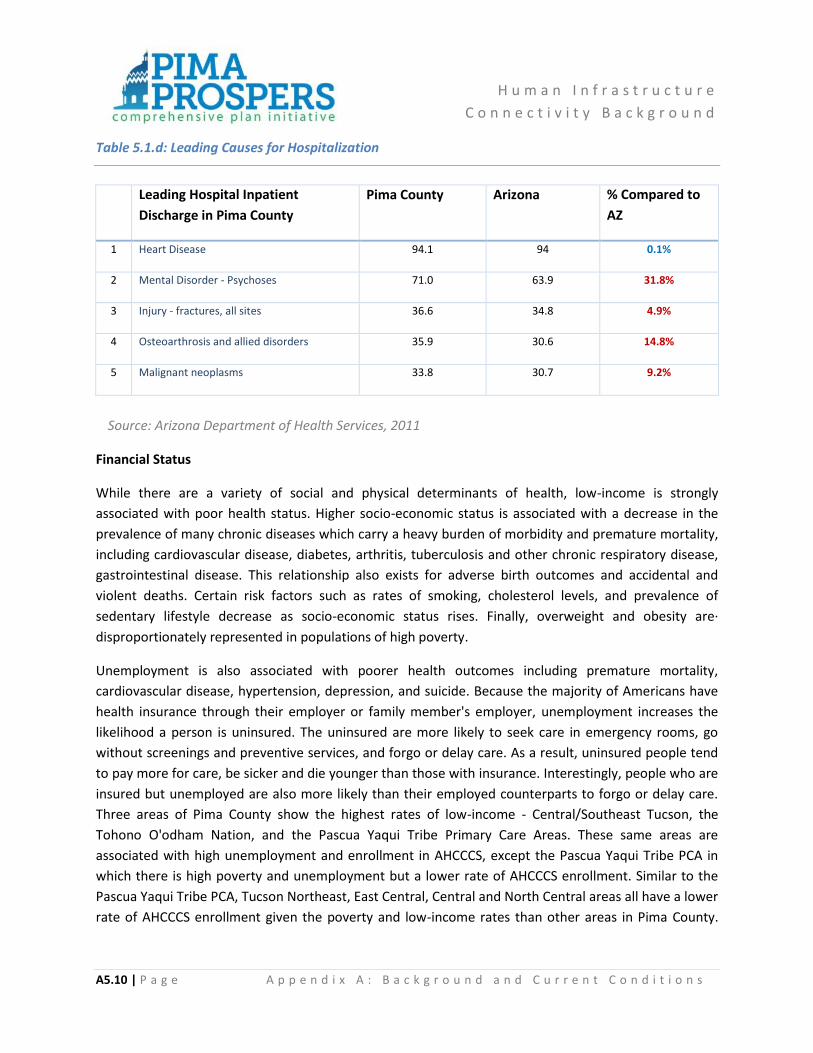
H u m a n I n f r a s t r u c t u r e
C o n n e c t i v i t y B a c k g r o u n d
A5.10 | P a g e A p p e n d i x A : B a c k g r o u n d a n d C u r r e n t C o n d i t i o n s
Table 5.1.d: Leading Causes for Hospitalization
Leading Hospital Inpatient
Discharge in Pima County
Pima County Arizona % Compared to
AZ
1 Heart Disease 94.1 94 0.1%
2 Mental Disorder - Psychoses 71.0 63.9 31.8%
3 Injury - fractures, all sites 36.6 34.8 4.9%
4 Osteoarthrosis and allied disorders 35.9 30.6 14.8%
5 Malignant neoplasms 33.8 30.7 9.2%
Source: Arizona Department of Health Services, 2011
Financial Status
While there are a variety of social and physical determinants of health, low-income is strongly
associated with poor health status. Higher socio-economic status is associated with a decrease in the
prevalence of many chronic diseases which carry a heavy burden of morbidity and premature mortality,
including cardiovascular disease, diabetes, arthritis, tuberculosis and other chronic respiratory disease,
gastrointestinal disease. This relationship also exists for adverse birth outcomes and accidental and
violent deaths. Certain risk factors such as rates of smoking, cholesterol levels, and prevalence of
sedentary lifestyle decrease as socio-economic status rises. Finally, overweight and obesity are·
disproportionately represented in populations of high poverty.
Unemployment is also associated with poorer health outcomes including premature mortality,
cardiovascular disease, hypertension, depression, and suicide. Because the majority of Americans have
health insurance through their employer or family member's employer, unemployment increases the
likelihood a person is uninsured. The uninsured are more likely to seek care in emergency rooms, go
without screenings and preventive services, and forgo or delay care. As a result, uninsured people tend
to pay more for care, be sicker and die younger than those with insurance. Interestingly, people who are
insured but unemployed are also more likely than their employed counterparts to forgo or delay care.
Three areas of Pima County show the highest rates of low-income - Central/Southeast Tucson, the
Tohono O'odham Nation, and the Pascua Yaqui Tribe Primary Care Areas. These same areas are
associated with high unemployment and enrollment in AHCCCS, except the Pascua Yaqui Tribe PCA in
which there is high poverty and unemployment but a lower rate of AHCCCS enrollment. Similar to the
Pascua Yaqui Tribe PCA, Tucson Northeast, East Central, Central and North Central areas all have a lower
rate of AHCCCS enrollment given the poverty and low-income rates than other areas in Pima County.

H u m a n I n f r a s t r u c t u r e
C o n n e c t i v i t y B a c k g r o u n d
A5.11 | P a g e A p p e n d i x A : B a c k g r o u n d a n d C u r r e n t C o n d i t i o n s
This indicates that low-income people in these areas may be particularly at risk for not having sufficient
access to health services, particularly those individuals who do not qualify for assistance programs.
Finally, Ajo stands out as an area with high poverty and unemployment rates.
County’s Health Gap Analysis and Workforce Issues
A considerable portion of the population residing in Pima County does not have adequate access to
primary medical, behavioral and dental services. Approximately 23% of Pima County residents live in a
medically underserved area (MUAs), indicating that residents lack adequate access to care and are likely
to have unmet health needs. Furthermore, it is estimated that nearly a quarter of Pima County’s
population lives in areas with inadequate access to primary care practitioners and 31% lives in areas
with inadequate access to dental professionals.
Health and Human Services designated the entire County as a low-income mental health HPSA (Health
Professional Service Area), meaning individuals and families earning less than 200% of the Federal
Poverty Level do not have adequate access to mental health professionals. A shortage of practicing
professionals and geographic barriers such as a lack of transportation options and distance necessary to
reach the professional contribute to this lack of access.
Table 5.1.e: Population Residing in Primary Medical Care and Dental Health Professional Shortage
Areas (HPSAs) by Planning Area, 2009
Planning Area Total
Population
Residing in
Planning
Area
Population
Residing in
a Primary
Care HPSA
Population
Residing in a
Dental HPSA
%
Population
Residing in
Planning
Area
% of
Population
Residing in
a Primary
Care HPSA
% of
Population
Residing in
a Dental
HPSA
Avra Valley 19,191 17,190 17,162 2% 90% 89%
Tucson Mountains 45,993 358 358 6% 1% 1%
Southwest 69,730 3,397 5,564 8% 5% 8%
Altar Valley 13,229 8,314 8,096 2% 63% 61%
Upper Santa Cruz 22,178 11,206 11,207 3% 51% 51%
Mountain View 4,128 4,121 4,122 0% 100% 100%
Southeast 85,342 78,298 19,320 10% 92% 23%
Central 309,259 65,513 117,191 37% 21% 38%

H u m a n I n f r a s t r u c t u r e
C o n n e c t i v i t y B a c k g r o u n d
A5.12 | P a g e A p p e n d i x A : B a c k g r o u n d a n d C u r r e n t C o n d i t i o n s
Planning Area Total
Population
Residing in
Planning
Area
Population
Residing in
a Primary
Care HPSA
Population
Residing in a
Dental HPSA
%
Population
Residing in
Planning
Area
% of
Population
Residing in
a Primary
Care HPSA
% of
Population
Residing in
a Dental
HPSA
Catalina Foothills 171,352 0 72,626 21% 0% 42%
Rincon Valley 2,215 0 2,215 0% 0% 100%
Tortolita 88,044 0 0 11% 0% 0%
San Pedro 1,955 0 521 0% 0% 27%
This partial gap analysis identifies some potential health service deficiencies in Pima County.
Coordination among multiple community stakeholders is required to identify and remedy the service
deficiencies that exist in the community. There are several aspects of County operations that directly
impact residents’ access to public health services and infrastructure that supports healthy lifestyles.
These aspects include environmental quality, transportation, parks and recreation, libraries,
developmental services, and community services.
To achieve a reduction in health disparities, improve access to care and encourage healthy lifestyles,
Pima County can positively influence the choices its residents make by enacting ordinances and policies
that support health, such as those that provide improved access to a healthy environment, recreation,
nutritious foods, and health care services. Optimally, this should be done in collaboration with the highly
motivated community stakeholders and local governments while carefully tracking and assessing federal
and state policy initiatives.
Community Health Improvement
Pima County plays a key role in disease prevention, education, and provision of health services to
County residents. The sections below outline the challenges of providing health services to its citizens.
County Role & Challenge in Disease Prevention and Provision of Services
Data also highlight significant health issues in the American Indian populations. Any collaboration with
tribal communities and Indian Health Services should recognize the independent status of this
population as well as their utilization of the County wide health infrastructure for significant services as
evidenced in the hospital admission rates.
Sources: Estimates based on data from the Arizona Department of Health Services (ADHS) 2009
Primary Care Profiles and 2005 TAZ population estimates from Pima Association of Governments
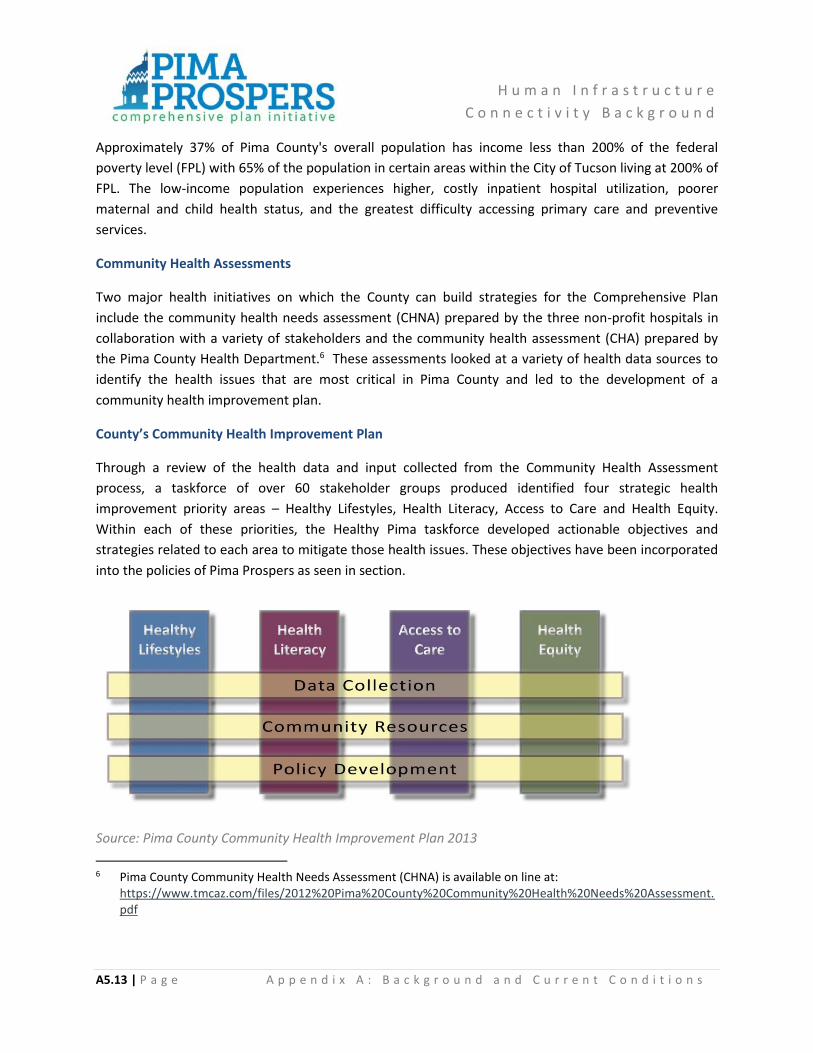
H u m a n I n f r a s t r u c t u r e
C o n n e c t i v i t y B a c k g r o u n d
A5.13 | P a g e A p p e n d i x A : B a c k g r o u n d a n d C u r r e n t C o n d i t i o n s
Approximately 37% of Pima County's overall population has income less than 200% of the federal
poverty level (FPL) with 65% of the population in certain areas within the City of Tucson living at 200% of
FPL. The low-income population experiences higher, costly inpatient hospital utilization, poorer
maternal and child health status, and the greatest difficulty accessing primary care and preventive
services.
Community Health Assessments
Two major health initiatives on which the County can build strategies for the Comprehensive Plan
include the community health needs assessment (CHNA) prepared by the three non-profit hospitals in
collaboration with a variety of stakeholders and the community health assessment (CHA) prepared by
the Pima County Health Department.6 These assessments looked at a variety of health data sources to
identify the health issues that are most critical in Pima County and led to the development of a
community health improvement plan.
County’s Community Health Improvement Plan
Through a review of the health data and input collected from the Community Health Assessment
process, a taskforce of over 60 stakeholder groups produced identified four strategic health
improvement priority areas – Healthy Lifestyles, Health Literacy, Access to Care and Health Equity.
Within each of these priorities, the Healthy Pima taskforce developed actionable objectives and
strategies related to each area to mitigate those health issues. These objectives have been incorporated
into the policies of Pima Prospers as seen in section.
Source: Pima County Community Health Improvement Plan 2013
6 Pima County Community Health Needs Assessment (CHNA) is available on line at:
https://www.tmcaz.com/files/2012%20Pima%20County%20Community%20Health%20Needs%20Assessment.pdf

H u m a n I n f r a s t r u c t u r e
C o n n e c t i v i t y B a c k g r o u n d
A5.14 | P a g e A p p e n d i x A : B a c k g r o u n d a n d C u r r e n t C o n d i t i o n s
Aging in Pima County
Consideration of the health and well-being of older adults is a clear
area of focus as Pima County is home to more adults 65 and older
per capita than the state as a whole. Just over 21% of Pima County’s
population is over 60 years of age and this population will continue
to grow as estimates indicate that by 2020, one in four Arizona
residents will be over 60 years of age. Within Pima County, the
highest concentrations of older adults are found in Green Valley,
Ajo and Arivaca.
It is well-established that older adults are higher utilizers of health services due to the prevalence of
chronic health conditions7. This population has a high demand for home and community-based services
that support them in their homes rather than more costly institutional settings such as assisted living or
skilled nursing facilities.
To meet this demand there must be a trained workforce, including home care paraprofessionals, and a
transportation system that meets the needs of the caregivers as well as elderly.
Communities frequently lack accessible and affordable housing options that allow older adults to safely
remain in their communities as housing needs change. Community design that supports mixed use
principles works to bring services closer to places of residence. This community design principle further
improves the accessibility of services, and increases opportunities for active transportation and social
interaction.
Existing Aging in Place Programs
Pima County has partnered with the Pima Council on Aging (PCOA) as the designated Area Agency on
Aging serving older adults and their families living in Pima County. PCOA services include:
Education on the Arizona Long Term Care System which is part of Arizona’s version of Medicaid
are offered monthly for free.
Caregiver services such as resource assistance, classes, and some at home services are offered.
Elder Rights and Benefits: The Elder Rights and Benefits Department advocates for and assists
older adults with a wide range of issues.
Information on healthy living, staying fit, and quality of life.
Help with minor repairs or adaptations may be available to home owners age 60 and over.
7 Bernstein AB, Hing E, Moss AJ, Allen KF, Siller AB, Tiggle RB. 2003. Health care in America: Trends in utilization. Hyattsville, MD: National Center for Health Statistics.
H u m a n I n f r a s t r u c t u r e
C o n n e c t i v i t y B a c k g r o u n d
A5.15 | P a g e A p p e n d i x A : B a c k g r o u n d a n d C u r r e n t C o n d i t i o n s
The Community Services System (CSS) provides case management and in-home help to individuals
who have difficulty performing basic activities of daily living, such as dressing, bathing, toileting,
etc.
A senior resource and services helpline.
Long-Term Care Ombudsmen: PCOA’s Long-Term Care Ombudsmen visit assisted living and
nursing home residents in Pima County to advocate for resident rights.
Meals and Nutrition: PCOA has two meal programs – Pima County Meals on Wheels for home
bound clients and our senior meal program offered at multiple locations.
Medicare: PCOA is the local Arizona SHIP (State Health Insurance Assistance Program) and a
partner of the Centers for Medicare and Medicaid Services (CMS).
Neighbors Care Alliance: Neighbors Care Alliance (NCA) assists neighborhoods and faith-based
communities in helping seniors remain independent and in their homes as long as possible
through the support of neighbors helping neighbors.
Partners in Planning: Partners in Planning assists with difficult end of life planning matters.
Personal Budgeting Assistance: Trained volunteers assist low income individuals to balance their
bank accounts, prepare a budget and organize bills.
Opportunities to do volunteer work.
Pima County Health Department offers additional services to seniors. Public Health Nurses provide
health and wellness education to seniors in nutrition programs. They receive one-on-one education and
handouts on a variety of health topics with an emphasis on blood pressure management. Additionally
adult vaccination services provided by PCHD are highly sought after by the elderly community.

H u m a n I n f r a s t r u c t u r e
C o n n e c t i v i t y B a c k g r o u n d
A5.16 | P a g e A p p e n d i x A : B a c k g r o u n d a n d C u r r e n t C o n d i t i o n s
Land Use, Community Design and Public Health
Community design affects the activity level of area
residents. Mindful zoning and development can lead to
communities that better support improved health
outcomes for residents. Communities that are spread out
have limited connectivity to other communities and
services and require motor vehicle transit. Auto-oriented
communities are directly linked to a low ratio of physical
activity and poorer air quality. Furthermore, the proximity
of public open spaces to residences and work places
promotes physical activity. The decision of where to utilize
park and recreational resources is integral to establishing infrastructure that supports healthy lifestyles
and it is even more important in low-income neighborhoods and areas where resident mobility is
diminished.
Environmental quality and built environments directly affect community health. The Centers for Disease
Control, recognizing that the way communities are designed and built can affect people's physical and
mental health, launched the Healthy Community Design Initiative. This initiative supports a greater
influence of public health surveillance and research on community design decisions. The initiative
highlights that healthy community design can improve people's health by:
Increasing physical activity;
Reducing injury;
Increasing access to healthy food;
Improving air and water quality;
Minimizing the effects of climate change;
Decreasing mental health stresses;
Strengthening the social fabric of a community; and
Providing fair access to livelihood, education, and resources.
The community health assessments recently completed and the demographic and statistical data
highlighted in this report identify four major themes – healthy lifestyles, health literacy, access to care
and health equity, and two critical areas of focus – obesity and behavioral health. These health issues
require attention, not only due to their impact, but also because they are tied to the leading causes of
death among Pima County residents i.e., cardiovascular disease, accidents, strokes, drug-induced
deaths, diabetes and suicide.

H u m a n I n f r a s t r u c t u r e
C o n n e c t i v i t y B a c k g r o u n d
A5.17 | P a g e A p p e n d i x A : B a c k g r o u n d a n d C u r r e n t C o n d i t i o n s
While health is in part a personal responsibility, the County can positively influence the choices its
residents make by enacting ordinances and policies that support a healthy community, such as those
that provide improved access to healthy and safe environments, recreation, nutritious foods, and health
care. Pima County can serve as a critical catalyst for change and collaboration aimed at protecting health
and promoting wellness in Southern Arizona.

H u m a n I n f r a s t r u c t u r e
C o n n e c t i v i t y B a c k g r o u n d
A5.18 | P a g e A p p e n d i x A : B a c k g r o u n d a n d C u r r e n t C o n d i t i o n s
5.2 Public Safety and Emergency Services
Public Safety and Emergency Services
The Pima County Office of Emergency Management (PCOEM) recognizes the need for coordinated
emergency response to any emergency or disaster by public safety, emergency services, emergency
management, private sector, and community and volunteer agencies. PCOEM continues to develop and
maintain a close working relationship with its partners and stakeholders in the emergency community.
Events, meetings, training and exercises are held continuously to develop relationships and networking.
The Pima County Multi-Year Training and Exercise Program (MYTEP) calendars these events for three
years increasing participation through awareness. PCOEM maintains an open and inclusive approach to
those organizations and agencies who wish to participate in regional emergency preparedness.
The Pima County Office of Emergency Management (PCOEM) manages emergency/disaster planning
and emergency operations and resource coordination during disasters or emergencies. A major part of
that role involves coordinating, planning and exercising with local public health, public safety and
emergency services providers and agencies. PCOEM operates the Pima County Emergency Operations
Center (PCEOC) which is the regional coordination center for county departments, first responders, local
jurisdictions/agencies, utilities, private sector, community organizations, faith-based organizations, and
non-profits. The PCEOC supports local emergency response efforts by coordinating mutual aid requests,
logistics/resource support, emergency communications, and is the regional point of contact to request
state resources and support. The PCEOC also coordinates with local, state and federal agencies to
provide support to local jurisdictions and on-scene incident command objectives.
Emergency preparedness planning is a crucial emergency services element of the PCOEM function.
PCOEM has developed and maintained many all-hazards emergency plans for disasters and emergencies
which may occur. The following is a partial list:
Pima County Emergency Operations Plan 2012
This plan is the comprehensive emergency operations plan for Pima County and includes federal
emergency management doctrine and guidelines that keep Pima County well integrated and consistent
with all tiers of government nationally. Compliance with standardized FEMA plan design, procedures
and documentation during emergencies ensures a more streamlined emergency management process
and expedites reimbursement of disaster expenses from the federal government should that become
necessary.
Pima County Building Evacuation Plans (PCOEM)
PCOEM has developed building evacuation plans and has conducted drills to practice and refine the
plans.

H u m a n I n f r a s t r u c t u r e
C o n n e c t i v i t y B a c k g r o u n d
A5.19 | P a g e A p p e n d i x A : B a c k g r o u n d a n d C u r r e n t C o n d i t i o n s
Local Emergency Planning Committee (LEPC)
LEPC is a function of PCOEM and is statutorily mandated to support emergency planning for those who
use, store, and/or manufacture hazardous materials in Pima County. Pima County boasts one of the
most highly regarded LEPCs in the state and region.
Pima County Fatalities Management Plan
This is a joint venture with the Pima County Health Department and the Medical Examiner’s Office to
effectively deal with a mass fatalities event such as an airline crash, pandemic, weapon of mass
destructions (WMD), or any event resulting in a large number of deaths. This plan provides guidance and
direction in the collection, documentation, transport, storage, identification, decontamination, and
interment of human remains.
Pima County Multi-Jurisdictional Hazard Mitigation Plan (MJHMP) 2012
The Pima County Office of Emergency Management coordinated with the Arizona Division of Emergency
Management (ADEM) Mitigation Office to facilitate and develop this plan. This plan is required by FEMA
in order to qualify Pima County for federal mitigation grants.
Pima County Community Wildfire Protection Plan
The Pima County Health Department’s Office of Public Health Preparedness is engaged in collaborative,
community focused emergency public health planning to address biological, chemical, radiological, or
natural disaster events that result in public health threats or emergencies. Also see Wildfire on page
5.21.
Below is a summarized version of the plans the Pima County Health Department has developed and
maintains in order to keep Pima County prepared for any public health emergency:
PCHD All Hazards Plan
PCHD Continuity of Operations Plan
PCHD SNS and Mass Clinic Plan
PCHD Public Health Surge Plan
PCHD Pandemic Flu Plan
PCHD Preparedness Exercise and Training Plan
PCHD Environmental Health Response Plan
PCHD Agency Communications Plan

H u m a n I n f r a s t r u c t u r e
C o n n e c t i v i t y B a c k g r o u n d
A5.20 | P a g e A p p e n d i x A : B a c k g r o u n d a n d C u r r e n t C o n d i t i o n s
Community Threats and Hazard Areas
The Pima County Office of Emergency Management (PCOEM) has completed a collaborative regional
threat assessment and has identified a list of possible hazards facing the county and its local
jurisdictions. This hazard information is included in the Pima County Multi-Jurisdictional Hazard
Mitigation Plan (MJHMP) 2012. This assessment is based on historical occurrences and documented
events. The State of Arizona Multi-Hazard Mitigation Plan supports the Pima County MJHMP. The most
frequent and recurring hazards are floods/flashfloods and wildfires.
Flood/Flash Flood
Flooding is clearly a major hazard in the County. Pima County has been part of 13 disaster declarations
for flooding, with three of those declarations occurring in the past five years.
As demonstrated by Pima County’s past flood events, the impact to the general public is typically
property damage and loss, injury, and in some cases, death. Floods having an impact on Pima County
residents and infrastructure as a whole are low, though some parts of Pima County may be more
affected, such as, some rural areas adjacent to riparian waterways, and therefore may become isolated
because of transportation routes being washed out, or closed.
Much effort has been expended on developing flood response protocols among the various
departments and jurisdictions having responsibilities to monitor, alert, and respond to flood events.
During actual or potential flooding events, flood response departments and agencies are called to
respond to the Pima County Emergency Operations Center to coordinate resources and communicate
with other EOCs.
Pima County Flood Control District has worked diligently to increase the county’s score with the
Community Rating Service and this has resulted in a reduction in National Flood Insurance Program
(NFIP) rates for affected Pima County residents.
Pima County is also recognized by the National Weather Service as a Storm Ready County because of its
preparedness, alert and warning capabilities.
Wildfire
Pima County has a high vulnerability to wildfires. Due to climate (heat and wind), geographical terrain,
and man-made incidents, Pima County has had 26 wildfires in excess of 100 acres for the period of 2002
to 2009. Wildfires and the resulting effects harm wildlife, soil, water and appearance of the land for
many years. The pattern of less than normal annual precipitation will continue to exacerbate the wildfire
threat. The consistent pattern of seasonal rainfall producing vegetation which later becomes potential
fuel for fires will always be present. The Pima County Office of Emergency Management continues to

H u m a n I n f r a s t r u c t u r e
C o n n e c t i v i t y B a c k g r o u n d
A5.21 | P a g e A p p e n d i x A : B a c k g r o u n d a n d C u r r e n t C o n d i t i o n s
address the fire threat through mitigation planning and community planning. The PCOEM, in
partnership with the University Of Arizona School of Agriculture, applied for federal grant funds for a
buffelgrass eradication program. This program works in the community to remove buffelgrass which is a
non-native, invasive plant which is highly flammable and fast burning. PCOEM has also facilitated and
coordinated the development of the comprehensive Pima County Community Wildfire Protection Plan
(CWPP) which promotes fire prevention and suppression strategies, improve firefighter and public
safety, reduce fuels, protect property and promote community involvement.
Extreme Temperature
Growth in Pima County over the past five years has significantly increased the amount population and
infrastructure is exposed to extreme temperatures. There is also an increased demand on resources
such as power in summers and natural gas in the winter. The primary intersects of extreme temperature
hazards and future development of the county is in the general increase in population and infrastructure
that would be exposed. Advanced building codes requiring adequate burial depth of water lines are
generally being used and enforced.
Over the past two decades, as the metropolitan area has dramatically grown in size the "urban heat
island" effect has developed, which cause temperatures in the center of metropolitan areas to become
much warmer than those in rural areas. The concrete and asphalt of urban areas retains the heat of the
day, and releases it slowly as compared to the surrounding desert terrain, which cools much quicker at
night. As development continues to occur within Tucson and its environs, heat conditions will continue
to increase.
In Pima County, PCOEM works closely with Tucson Electric Power, the American Red Cross, and the Pima
County Health Department to monitor hazardous heat conditions and possible power interruptions
during the summer monsoon. Plans include cooling centers and shelters to provide a refuge for people
to escape the heat. Inversely, during times of very cold weather, plans include maintaining contact with
Southwest Gas, Kinder-Morgan, Tucson Electric Power, Trico Electric, and the American Red Cross to set
up warming centers as was done in the past during an interruption of natural gas leaving many without
heat during frigid cold conditions.
Disease
Pandemic and infectious diseases create a serious threat to public health as they may affect a large
percentage of the population, regardless of health condition, age or location. These potentially
hazardous conditions affect humans, domestic animals, and livestock (food supply).
The Pima County Health Department seeks to prevent infectious diseases from entering the county and
control those that are endemic or have already entered. Of particular concern to the County Health
Department are Ebola, new pandemic diseases, such as SARS, new strains of HIV, new influenza strains

H u m a n I n f r a s t r u c t u r e
C o n n e c t i v i t y B a c k g r o u n d
A5.22 | P a g e A p p e n d i x A : B a c k g r o u n d a n d C u r r e n t C o n d i t i o n s
such as the most recent H1N1 threat, botulism, and bio-terrorism pathogens such as anthrax, smallpox,
or chemical attacks of sarin or VX gas. As a component of the Pima County Health Department, the
Disease Control division seeks to reduce the incidence of disease morbidity and mortality in Pima County
through the identification of community health problems, compilation of health statistics, and
development of appropriate intervention programs. Special attention is paid to epidemiology, HIV/AIDS,
sexually transmitted diseases, in addition to preventive programs such as immunizations and well
women services.
Pima County recently developed a comprehensive Pima County Ebola Preparation and Response
Framework which was the product of collaboration between many county departments, state agencies
and local hospitals. This will coordinate the response and planning by medical and public safety
departments and agencies to manage an Ebola outbreak should one occur.
Community Emergency Readiness and Hazard Mitigation Planning
The Pima County Office of Emergency Management (PCOEM) supports community preparedness and
readiness through outreach programs.
PCOEM coordinates the Southern Arizona School Safety and Preparedness Consortium which
builds communications with and between schools, offers training in incident management, and
strengthens school resilience through plan development.
PCOEM conducts Community Emergency Response Team (CERT) training, which is a FEMA Citizen
Corps program that teaches basic emergency response skills to the average person and equips
them with basic equipment.
The Pima County Multi-Jurisdictional Hazard Mitigation Plan contains the mitigation priorities and
projects identified by each of the local jurisdictions in the county – Marana, Oro Valley, Sahuarita,
Tucson, Pascua Yaqui Tribe, Tohono O’odham Tribe, South Tucson, and unincorporated Pima County.
Priorities are focused on the highest ranked hazards as identified by each jurisdiction. This collaborative
planning process is revised every five years and is coordinated between the state and PCOEM.
The Pima County Health Department Office of Public Health Preparedness is engaged in collaborative,
community focused emergency health planning to address biological, chemical, radiological, or natural
disaster events that result in public health threats or emergencies. The Pima County Health Department
is working to:
Develop effective plans and resources during emergencies to protect the community.
Develop and maintain public health emergency capacity.
Coordinate with community, county, state, tribal, and federal partners to develop a plan to
provide mass prophylaxis and treatment to all people in the county.

H u m a n I n f r a s t r u c t u r e
C o n n e c t i v i t y B a c k g r o u n d
A5.23 | P a g e A p p e n d i x A : B a c k g r o u n d a n d C u r r e n t C o n d i t i o n s
Develop the capacity to rapidly identify diseases and initiate prevention and control activities.
Develop effective, secure communication infrastructure for rapid communication among public
health and its partners.
Develop the capacity to effectively communicate health/risk information to the public and key
partners.
Develop a public health workforce (including volunteers).
Better prepare the community for an emergency.
Fire Service
Fire service throughout Pima County is handled within departments or districts based on the governing
body of the population area. Service in the population areas vary. The City of Tucson has several fire
stations and can provide service within five minutes. South Tucson, which is a one square mile city,
provides fire service to its residents within five to seven minutes. Service within the County is available
and is ready when needed. Areas that are incorporated have more established service than the
unincorporated areas of the County.
See Exhibits 5.2.a and 5.3.b for a map of Pima County Fire Districts.
Fire Service Availability by Planning Area
Table 5.2.a: Existing Fire Service Inventory by Planning Area
Planning Area Fire Service
1. Avra Valley Avra Valley Fire District
Northwest Fire District
Picture Rocks Fire District
Rural - Metro Fire Department
Silverbell Army Heliport Fire Department
Three Points Fire District
Tohono O'odham Nation Fire Department
2. Tucson Mountains Drexel Heights Fire District
Northwest Fire District
Picture Rocks Fire District
Rural - Metro Fire Department
Three Points Fire District
Tucson Fire Department

H u m a n I n f r a s t r u c t u r e
C o n n e c t i v i t y B a c k g r o u n d
A5.24 | P a g e A p p e n d i x A : B a c k g r o u n d a n d C u r r e n t C o n d i t i o n s
Planning Area Fire Service
3. Southwest Drexel Heights Fire District
Northwest Fire District
Pascua (Yaqui) Pueblo Fire Department
Picture Rocks Fire District
Rural - Metro Fire Department
South Tucson Fire District
Three Points Fire District
Tucson Airport Authority Fire Department
Tohono O'odham Nation Fire Department
Tucson Fire Department
4. Alter Valley Arivaca Fire District
Helmet Peak Volunteer Fire Department
Rural - Metro Fire Department
Three Points Fire District
Tohono O'odham Nation Fire Department
5. Upper Santa Cruz Arivaca Fire District
Elephant Head Volunteer Fire Department
Green Valley Fire District
Helmet Peak Volunteer Fire Department
Rural - Metro Fire Department
Three Points Fire District
6. Mountain View Corona de Tucson Fire District
Mescal - J6 Fire District
Rincon Valley Fire District
Rural - Metro Fire Department
Sonoita - Elgin Fire District
7. Southeast Corona de Tucson Fire District
Elephant Head Volunteer Fire Department
Green Valley Fire District
Rincon Valley Fire District
Rural - Metro Fire Department
South Tucson Fire District
Tucson Airport Authority Fire Department
Tucson Fire Department
8. Central Corona de Tucson Fire District
Davis-Monthan Air Force Base Fire Department
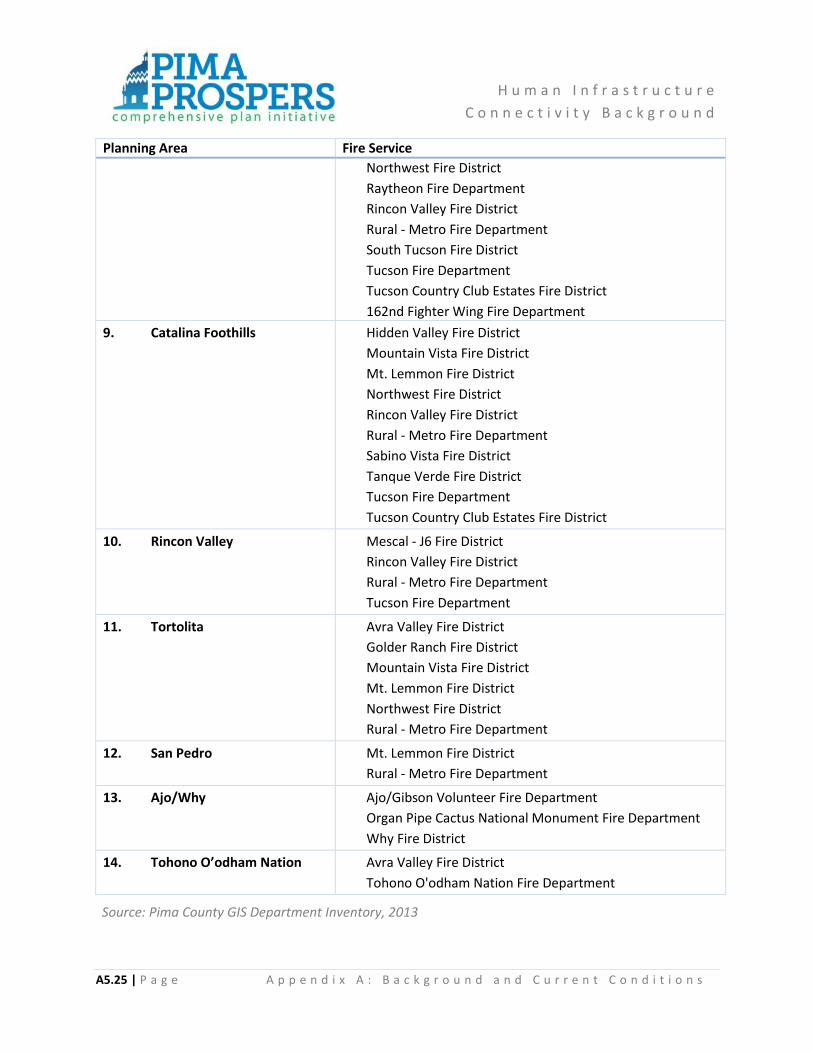
H u m a n I n f r a s t r u c t u r e
C o n n e c t i v i t y B a c k g r o u n d
A5.25 | P a g e A p p e n d i x A : B a c k g r o u n d a n d C u r r e n t C o n d i t i o n s
Planning Area Fire Service
Northwest Fire District
Raytheon Fire Department
Rincon Valley Fire District
Rural - Metro Fire Department
South Tucson Fire District
Tucson Fire Department
Tucson Country Club Estates Fire District
162nd Fighter Wing Fire Department
9. Catalina Foothills Hidden Valley Fire District
Mountain Vista Fire District
Mt. Lemmon Fire District
Northwest Fire District
Rincon Valley Fire District
Rural - Metro Fire Department
Sabino Vista Fire District
Tanque Verde Fire District
Tucson Fire Department
Tucson Country Club Estates Fire District
10. Rincon Valley Mescal - J6 Fire District
Rincon Valley Fire District
Rural - Metro Fire Department
Tucson Fire Department
11. Tortolita Avra Valley Fire District
Golder Ranch Fire District
Mountain Vista Fire District
Mt. Lemmon Fire District
Northwest Fire District
Rural - Metro Fire Department
12. San Pedro Mt. Lemmon Fire District
Rural - Metro Fire Department
13. Ajo/Why Ajo/Gibson Volunteer Fire Department
Organ Pipe Cactus National Monument Fire Department
Why Fire District
14. Tohono O’odham Nation Avra Valley Fire District
Tohono O'odham Nation Fire Department
Source: Pima County GIS Department Inventory, 2013

H u m a n I n f r a s t r u c t u r e
C o n n e c t i v i t y B a c k g r o u n d
A5.26 | P a g e A p p e n d i x A : B a c k g r o u n d a n d C u r r e n t C o n d i t i o n s
Public Safety
The Pima County Sheriff’s Department is committed to safety and well-being by utilizing advanced
strategies of community policing and the direct supervision management of its detention facilities.
Community policing involves the establishment of dynamic partnerships with citizens, communities, and
other civic and criminal justice agencies working together toward common goals. The Pima County
Sheriff’s Department provides a wealth of information on its website at www.pimasheriff.org about
crime prevention, detention center services and online services which include filing a police report and
obtaining crimes statistics to name a few. The Department strives to provide accurate and timely
information by way of its Facebook and Twitter accounts. It encourages citizens to follow various
websites to receive information on crime trends, road closures, and community events such as Dispose-
A-Meds and Shred-A-Thons. In addition, its award winning Sheriff’s Auxiliary Volunteers program
provides home inspections, vacation checks and neighborhood watch patrols to assist the Department
with its public safety mission.

H u m a n I n f r a s t r u c t u r e
C o n n e c t i v i t y B a c k g r o u n d
A5.27 | P a g e A p p e n d i x A : B a c k g r o u n d a n d C u r r e n t C o n d i t i o n s
5.3 Parks and Recreation
Pima County established its Parks and Recreation Department in 1947 to serve urban and rural residents
and guests by providing leisure-time destinations and services. Today the Parks Department does
everything from care for stately saguaros in Tucson Mountain Park to overseeing after-school recreation
programs. Additionally, many other classes and services are offered at the parks and community
centers. These facilities serve as an integral part of the community and are often the major service
provider for the area. The following park facilities are currently in place in Pima County:
Community Centers (13)
Pools and Splash Pads (10)
Parks (49)
Dog Parks
BMX and Skate Parks
River Parks and Greenways
Natural Resources
Trailheads (21)
Shooting Sports (5)
Camping
Mike Jacob Sports Park
Pima County has over 10,000 acres of public developed and undeveloped parkland within its planning
area. This section summarizes the funding and economic use of the parkland and recreation facilities
currently serving Pima County residents.
See Exhibit 5.3.a and 5.3.b for Existing Parks and Recreation maps.
See Exhibit 5.3.c and 5.3.d for Existing Open Space and Parks maps.

H u m a n I n f r a s t r u c t u r e
C o n n e c t i v i t y B a c k g r o u n d
A5.28 | P a g e A p p e n d i x A : B a c k g r o u n d a n d C u r r e n t C o n d i t i o n s
Pima County Sports Facilities Assessment
A countywide inventory of sports facilities was conducted by Pima County Sports and Tourism authority
in 2013. The Pima County Sports Facilities Assessment lays the foundation for a comprehensive plan for
the development of sport and recreation facilities including the ability to host sports and other events. It
aggregates the findings into a long range development scenario, and assesses the existing sport and
recreation infrastructure for a wide range of activities using two measures: (1) Providing recreational
value to the citizens of Pima County; and (2) Enhancing regional, national, and international tourism.
Various jurisdictions maintain an inventory of their facilities in one of many formats. This study
assimilated such information and developed a single database in a Geographic Information Systems
(GIS) format that includes both table data (database) as well as graphic representation of the data
(maps). The regional audit includes indoor and outdoor facilities from all jurisdictions and (to the extent
of available information) all schools, private sports facilities meeting minimum auditing requirements.
Minimum auditing requirements were defined as any existing facility comprised of at least two major
sports fields (outdoor), and any significant number of indoor courts or facilities. Fields or courts could
be aggregated by adding two separate facilities in close proximity to one another. The facilities may
have been added to the audit where they otherwise would not have met the threshold on their own.
The following regionally established sports have been recognized and these sports have been measured
against several filters:
• Aquatics (Diving, Swimming, Synchronized Swimming)
• Archery • Athletics (Track and Field) • Cycling (Road Cycling, Mountain
Biking, BMX) • Baseball (Professional, Youth) • Basketball (professional, Youth) • Football (Youth) • Golf • Indoor Ice Sheet Sports
• Lacrosse • Rodeo • Rugby • Running • Shooting (Trap & Skeet) • Soccer • Softball • Tennis • Triathlon • Volleyball (indoor)
While it is recommended that these sports continue to be developed and promoted both locally and in
terms of hosting regular organized competitions at the highest level of participation, programming for
this study included a much wider range of activities for the purposes of arriving at a more
comprehensive proposal for the long term development of sport facilities and activities.

H u m a n I n f r a s t r u c t u r e
C o n n e c t i v i t y B a c k g r o u n d
A5.29 | P a g e A p p e n d i x A : B a c k g r o u n d a n d C u r r e n t C o n d i t i o n s
Funding and Return Investment Mechanisms
Pima County Natural Resources, Parks and Recreation (NRPR) does not have a financial plan for return
on investments, as a public entity, this is not its mission. The department does acquire land for open
space and recreational purposes, which is a capital investment. This is accomplished through bonds and
an in-lieu fee that is collected from the subdivision platting process. The in-lieu fee is also used for
recreational equipment that needs replacing when it is vandalized or aged over the years. There are
potential funding possibilities for NRPR that could include reorganization of the department. These
opportunities would be to have the Stadium District - Kino Sports Complex and the Economic and
Tourism Department under the NRPR umbrella. Keeping the revenue that is generated by the other
departments under NRPR would enable NRPR to reposition itself to allow for a proactive parks
department versus a department that is mostly reactive.
Existing Funding and Return Investment Mechanisms
Existing funding for the Natural Resources and Parks and Recreation Department come from various
sources including:
General Fund
Supplemental Requests
Bonds
Grants
Earned Revenue
Joint Use and Economical Use of Parks
Pima County has had bond programs in the past that have funded sports fields for various school
districts with the requirement that the fields be open to the public when school is not in session. This
joint use arrangement has worked well as the county provides the money for the construction of the
fields and the school district maintains the fields.
The residential recreation areas section in the zoning code has standards for the amount of square
footage and recreational facilities that is required in a residential subdivision, which is maintained by a
homeowners association. These neighborhood parks provide areas for the residents to walk to a park
versus driving to a community or district park. The neighborhood parks are geared to the people in the
subdivision who can provide important recreational needs that are requested by the residents.

H u m a n I n f r a s t r u c t u r e
C o n n e c t i v i t y B a c k g r o u n d
A5.30 | P a g e A p p e n d i x A : B a c k g r o u n d a n d C u r r e n t C o n d i t i o n s
It is more cost effective for the county to provide regional parks of 40 acres and larger with recreational
facilities, such as baseball, soccer and softball fields, swimming pools, shade structures with picnic areas,
and have the homeowners maintain the smaller parks in their neighborhood that are used by local
residents. This division of parks makes economic sense in that the residents are paying for the park they
use and the large public parks provide facilities beyond those provided for in the smaller parks.
NRPR and Kino Sports Complex have sport fields for rent to public, youth and adult groups. These fields
are rented out at a nominal rate to lessen the financial burden to the sports leagues in the county, so
an increase to these fees is not feasible.
Earned revenue is however obtained for the Kino Sports Complex by renting facilities for various sports
or entertainment events. These earned revenues have varied widely over the years. They have been as
high as $1.8 million per year when two-team MLB Spring Training was conducted at the complex to as
low as $700,000 in the year after MLB abandoned the Kino facilities. Currently, the amount of revenues
budgeted is beginning to approach those that were received when two teams utilized the facilities for
MLB Spring Training. At this level, additional General Funds will eventually not be necessary to support
the complex.

H u m a n I n f r a s t r u c t u r e
C o n n e c t i v i t y B a c k g r o u n d
A5.31 | P a g e A p p e n d i x A : B a c k g r o u n d a n d C u r r e n t C o n d i t i o n s
5.4 Workforce Training/Education
The Pima County Workforce Investment Board is authorized by the Department of Labor and appointed
by the Pima County Board of Supervisors guide local workforce policy and oversee the local One-Stop
system that connects eligible job ready youth, adult, and dislocated workers with employment
opportunities, with a focus on high-demand industry occupations. The Pima County One-Stop Career
Center administers funding and programs under the Workforce Investment Act and is part of the
Arizona Workforce Connection, a statewide network of career centers. The Pima County Workforce
Investment Board pursues its vision of "Quality Jobs, Qualified Workers" through the following goals:
Assisting people to obtain jobs in strategic industry sectors.
Supporting employers in finding and hiring qualified employees.
Engaging underrepresented labor pools by removing barriers to employment.
This section summarizes the workforce training and education programs currently serving Pima County
residents.
Workforce Training Role in Improving Services and Economy
Workforce development is a key component in the economic development of our region. At the macro
level, the availability of skilled workers is a central factor in economic competitiveness which in turn
drives prosperity. Tucson’s ability to attract quality jobs depends to increasing extent on the availability
of a labor pool of qualified workers. Simultaneously, opportunities to increase skills mean increased
earning power for current workers and individuals entering the workforce.
Pima County One-Stop offers a continuum of career development services for both youth and adults and
conducts special outreach to low-income, dislocated worker and high-school dropout populations.
Services are coordinated centrally, but delivered through a network of more than 50 organizations
ranging from community-based non-profits, governmental agencies, and proprietary trainers. Services
such as vocational rehabilitation, adult education, Unemployment Insurance, basic social services and
labor exchange/Employment Service are co-located in the main One-Stop Center at the Rio Nuevo
Community Resource Campus.
Three tiers of service are offered:
Core services – include self‐service options, such as labor market info, job banks and on‐line job
matching, and staff assisted options, such as workshops, resumes, job leads, career counseling,
and referrals. There is no eligibility requirement for core services.
Intensive Services – include vocational assessment, case management, individual employment
plan services, pre‐vocational adult education, job search and placement. Services are provided
H u m a n I n f r a s t r u c t u r e
C o n n e c t i v i t y B a c k g r o u n d
A5.32 | P a g e A p p e n d i x A : B a c k g r o u n d a n d C u r r e n t C o n d i t i o n s
based on eligibility for a variety of formula and discretionary grants targeting low‐income,
dislocated worker, disadvantaged youth and high‐school dropout populations, as well as veterans.
Training – for those who meet eligibility requirements and who lack specialized skills necessary to
obtain employment, training is provided from a menu of more than 300 qualified occupational
training programs and through on‐the‐job training contracts directly with employers. An
assessment is used to determine whether occupational training is appropriate, and the job seeker
is assisted in preparing a training plan.
The One-Stop Center provides support to employers in recruiting, staffing and training a viable
workforce. Job order registration, applicant screening and job matching is conducted in person and
online. Customized training may be implemented to upgrade the skills of existing workers, and on-the-
job training is provided where appropriate for new employees. The One-Stop has also worked with
industry clusters and other employer groups to design new training needed to address workforce
shortages in fields such as information technology, engineering technology, machining and healthcare.
Existing Workforce Programs
Pima County connects job seekers – youth, adults, veterans and dislocated workers – to a network of
employment, training, and educational programs. Some of these programs include:
Adults:
One-Stop Center
Sullivan Jackson Employment Center (SJEC)
Kino Veterans’ Workforce Center
Youth:
Summer Youth Program
Las Artes, Arts & Education
Pima Vocational High School
Pledge-A-Job program
Role of Workforce Training in Economic Development
Workforce investment priorities have to balance the goal of providing access to quality employment
opportunities where they are found today with that of developing a skilled workforce for the quality
jobs of the future. Whereas 50 years ago most of our jobs were unskilled and semi-skilled, future job
growth will be concentrated at high skill levels, as global competitiveness gravitates toward innovation.
Our sector strategies reflect this balance by offering career advancement pathways from lower-skilled
H u m a n I n f r a s t r u c t u r e
C o n n e c t i v i t y B a c k g r o u n d
A5.33 | P a g e A p p e n d i x A : B a c k g r o u n d a n d C u r r e n t C o n d i t i o n s
positions to high-skilled occupations that command high wages and increase the innovation capacity of
our economy.
The foundation of the One-Stop is a shared vision articulated by the Workforce Investment Board as
“Quality Jobs, Qualified Workers.” The One-Stop coordinates a continuum of services on both sides of
that coin – increasing qualifications of workers and widening the talent pipeline for industry to create
more and better jobs.
Pima County One-Stop has a Business Services Team which collaborates with Tucson Regional Economic
Opportunities on business attractions efforts, as well as with local Chambers of Commerce and other
major trade groups. The team also conducts outreach to local companies, and ongoing industrial
workforce needs surveys. These efforts help to connect businesses that are relocating, starting,
expanding or maintaining operations in Pima County with services to recruit, retain and train a qualified
workforce.
Workforce investment needs to be focused on industry sectors that provide the preponderance of the
region’s high-paying jobs and/or that offer our region the greatest competitive advantage in the global
economy. Key sectors may be grouped in a variety of ways; Pima County One-Stop has identified the
following strategic sectors:
Emerging Technologies/Renewable Resources
Aerospace/Defense/Manufacturing
Transportation/Logistics
Health Science/Bioscience
Infrastructure
Workforce Training, Education, GED Education Gap
Pima County’s efforts to develop a home-grown talent pool to fuel economic growth are challenged by
low educational levels among adult workers. A significant proportion of One-Stop customers do not
have adequate reading, language and math scores on standardized assessment tests to enroll in
occupational training or attain employment at sustainable wages.
Southern Arizona faces a dilemma in that its regional economy needs to attract and grow high-wage
jobs, but there is a shortage of skilled workers to fuel this growth. Meanwhile, many local workers – as
well as unemployed job seekers – are unable to move forward in their careers because they lack
sufficient skills and education to get a job or a promotion. Pima County One-Stop is focused on training
the existing workforce for higher-skill jobs in strategic industry sectors. Since most workers can ill afford

H u m a n I n f r a s t r u c t u r e
C o n n e c t i v i t y B a c k g r o u n d
A5.34 | P a g e A p p e n d i x A : B a c k g r o u n d a n d C u r r e n t C o n d i t i o n s
to stop working to go to school, specialized approaches are needed for both employed and unemployed
populations.
Employed worker training programs are being customized to business needs by such means as online
format, onsite or proximate location, special scheduling. Unemployed worker training or retraining
offers compressed as well as intensive instruction that is aligned to the requirements of unemployment
benefits.
Both types of programs:
Engage businesses as co-sponsors based on their immediate workforce needs and long-term
interests.
Provide competencies that directly match jobs for which employers have current or projected
demand;
Align where possible with credit-bearing coursework and seamless transfer to professional degree
programs;
Where possible, provide portable credentials or industrial certifications that will enhance trainees’
employability and earning power;
Offer supportive services to help training participants juggle work or job search, basic family needs
and school.
The One-Stop and its partners have developed some strategies for providing remedial education so that
job seekers can increase their earning power through training. For example Las Artes is a GED program
for young adults and Pima Vocational High School is an alternative, work-focused pathway to high-
school diploma – both sponsored by the Pima County Board of Supervisors. The “Lindsey Center”
collaboration was developed in partnership with Literacy Connects and Pima College Adult Education
through a series of special grants. In addition Pima County One-Stop funds adult education services
through SER Jobs for Progress, Portable Practical Educational Preparation (PPEP), Inc., and Tucson Youth
Development, and coordinates referrals with the Ready to Earn program offered by Goodwill Industries.
Features of these programs have included:
Content contextualized around a specific career focus and/or specific occupational competencies;
Intensive, full-time scheduling;
Use of assessment tools and computer-assisted education to customize instruction to specific
areas of weakness;
Cohort-based instruction, enhanced with supportive services, job club activities, and motivational
team building.

H u m a n I n f r a s t r u c t u r e
C o n n e c t i v i t y B a c k g r o u n d
A5.35 | P a g e A p p e n d i x A : B a c k g r o u n d a n d C u r r e n t C o n d i t i o n s
While small in scale and often dependent on special grants, the community/one-stop based adult
education programs leverage diverse resources and produce skill gains and diploma attainment at high
rates.
Youth and Juvenile Preparation for Future Workforce
In 2012-13, 1,270 youth were employed in summer jobs, and 300 former high-school dropouts earned a
GED through Las Artes, or earned a high-school diploma through Pima Vocational High School.
Youth who need additional assistance or skill training may be eligible for the following services provided
by the One-Stop Career Center:
Individualized Career Development
Summer Youth Opportunities
After-School Opportunities
Las Artes GED Program
Pima Vocational High School
La Casita Homeless Youth Employment
Occupational Training
Job Search Assistance
Pledge-A-Job Placement Program
Support Services
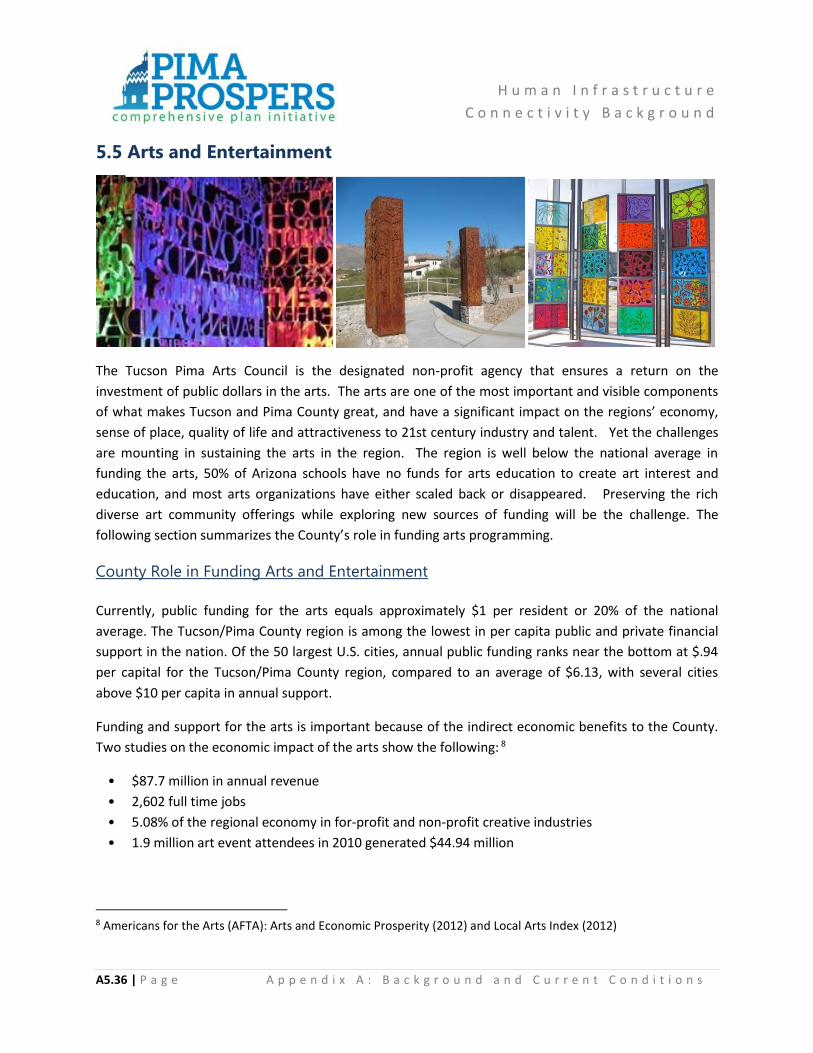
H u m a n I n f r a s t r u c t u r e
C o n n e c t i v i t y B a c k g r o u n d
A5.36 | P a g e A p p e n d i x A : B a c k g r o u n d a n d C u r r e n t C o n d i t i o n s
5.5 Arts and Entertainment
The Tucson Pima Arts Council is the designated non-profit agency that ensures a return on the
investment of public dollars in the arts. The arts are one of the most important and visible components
of what makes Tucson and Pima County great, and have a significant impact on the regions’ economy,
sense of place, quality of life and attractiveness to 21st century industry and talent. Yet the challenges
are mounting in sustaining the arts in the region. The region is well below the national average in
funding the arts, 50% of Arizona schools have no funds for arts education to create art interest and
education, and most arts organizations have either scaled back or disappeared. Preserving the rich
diverse art community offerings while exploring new sources of funding will be the challenge. The
following section summarizes the County’s role in funding arts programming.
County Role in Funding Arts and Entertainment
Currently, public funding for the arts equals approximately $1 per resident or 20% of the national
average. The Tucson/Pima County region is among the lowest in per capita public and private financial
support in the nation. Of the 50 largest U.S. cities, annual public funding ranks near the bottom at $.94
per capital for the Tucson/Pima County region, compared to an average of $6.13, with several cities
above $10 per capita in annual support.
Funding and support for the arts is important because of the indirect economic benefits to the County.
Two studies on the economic impact of the arts show the following: 8
• $87.7 million in annual revenue
• 2,602 full time jobs
• 5.08% of the regional economy in for-profit and non-profit creative industries
• 1.9 million art event attendees in 2010 generated $44.94 million
8 Americans for the Arts (AFTA): Arts and Economic Prosperity (2012) and Local Arts Index (2012)
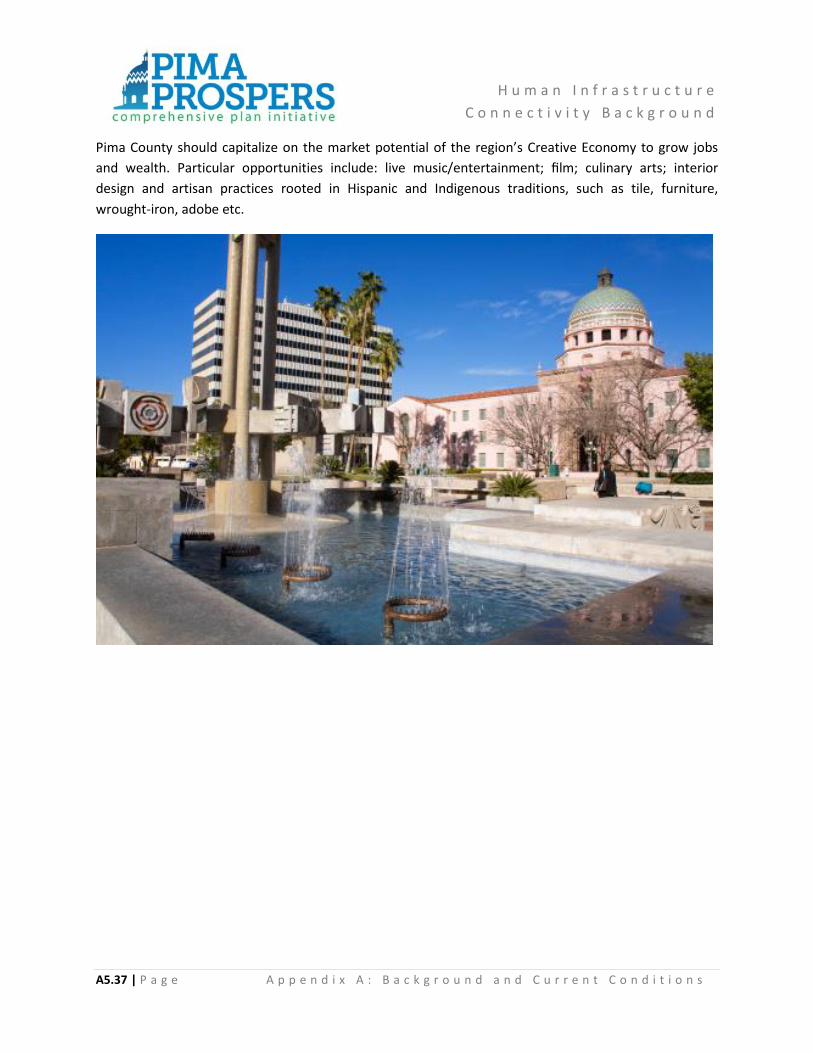
H u m a n I n f r a s t r u c t u r e
C o n n e c t i v i t y B a c k g r o u n d
A5.37 | P a g e A p p e n d i x A : B a c k g r o u n d a n d C u r r e n t C o n d i t i o n s
Pima County should capitalize on the market potential of the region’s Creative Economy to grow jobs
and wealth. Particular opportunities include: live music/entertainment; film; culinary arts; interior
design and artisan practices rooted in Hispanic and Indigenous traditions, such as tile, furniture,
wrought-iron, adobe etc.

H u m a n I n f r a s t r u c t u r e
C o n n e c t i v i t y B a c k g r o u n d
A5.38 | P a g e A p p e n d i x A : B a c k g r o u n d a n d C u r r e n t C o n d i t i o n s
5.6 Library Services
The Pima County Public Library enriches lives and builds community through opportunities to learn,
know, interact, and grow. The Library is recognized and valued by all community members as:
A significant resource and advocate for youth as they develop from birth to thoughtful inheritors
of our community.
A destination and place of discovery that provides abundant print materials, digital options and
functions as a welcoming place for the exchange of ideas among all residents to satisfy their life-
long curiosity.
A community asset and an active partner in community building recognized for creating and
motivating a skilled workforce, nurturing and celebrating our diverse cultural heritage, supporting
the arts in all forms, and building 100% literacy for the residents of Pima County.
An organization that cultivates staff that are knowledgeable, passionate and positive about the
central role libraries play in individual lives and community growth.
A forward-thinking institution that recognizes, supports and provides technological breakthroughs
advancing the convenient, effective use of information, knowledge and communication.
An organization that incorporates and integrates the goals of sustainability into all aspects of its
operations.
A free democratic institution devoted to providing community members with the information
needed to participate in our democratic community.
Pima County currently has 27 library branches that serve the County’s planning area. The County’s
library system is the first regional system of its kind in the state and provides significant, positive
beneficial services to the public, including economic development, employment and job training, and
other skills development. This section summarizes the services and the changing role of the libraries
currently available to Pima County residents.
See Exhibits 5.6.a and 5.6.b for Pima County Library maps.

H u m a n I n f r a s t r u c t u r e
C o n n e c t i v i t y B a c k g r o u n d
A5.39 | P a g e A p p e n d i x A : B a c k g r o u n d a n d C u r r e n t C o n d i t i o n s
Literate Community, Economic and Workforce Development
The Pima County Public Library reaches thousands of adults, caregivers, parents and children with family
literacy activities and in conjunction with Make Way for Books, the Arizona Humanities County, Pima
County Adult Education, the University of Arizona and the Arizona State Library.
Children’s services staff provide Storytimes, intergenerational programming that promote early
literacy and student success to parents.
Librarians provide training that offer hands-on activities and supervised practice sessions that
guide caregivers and parents through a range of developmentally appropriate activities that
promote reading readiness.
Collaborations with community partners allow the Library to provide homework and research assistance
and information literacy for students of all ages.
The Library collaborates with the Metropolitan Education Commission (MEC) to provide
opportunities for Pima County residents to access online information about study skills, financial
aid, career exploration and college selection.
Literacy Connects provides professional development for the Library’s ReadStrong Program,
offering opportunities for the tutors to learn new strategies for teaching literacy. During drop-in
times, ReadStrong tutors work with patrons, practicing reading comprehension strategies that
help develop confidence and enjoyment in reading.

H u m a n I n f r a s t r u c t u r e
C o n n e c t i v i t y B a c k g r o u n d
A5.40 | P a g e A p p e n d i x A : B a c k g r o u n d a n d C u r r e n t C o n d i t i o n s
The Library’s economic and workforce development services include
dedicated computers for job seekers and career builders, increased
assistance and community resource referrals, and online resources to
support the development of 21st century skills. In connection with Pima
County One Stop, Literacy Connects, the Arizona State Library Archives
and Public Records, and the Arizona Department of Economic Security,
the Pima County Public Library has taken an integrated approach to
workforce development and entrepreneurship. In addition to assistance
for job seekers, the Library offers GED preparation and tutoring services,
English Language learning, and reading comprehension activities to help
residents sharpen their skills, land that job and meet their goals.
Library programs assisted 9,700 job seekers, an increase of almost 15 percent over the previous
year. The library received hundreds of positive comments regarding expanded job help related
services.9
Six laptop computer labs gave rural and smaller branches with minimal meeting room space, the
ability to add programs to help hundreds more patrons a month with their job search.
The addition of 25 dedicated job help stations and dedicated job help zones helped hundreds more job seekers to be self-directed in their job search activities. 33,642 patrons took advantage of extended access.10
The Library provides work experience opportunities to Graduate Assistants, Interns, Youth Workers, and
Mature Workers in partnership with Pima County One-Stop and the University of Arizona’s School of
Information Resources and Library Science. Additionally, the University of Arizona’s College of Nursing,
College of Public Health, and Arizona State University’s School of Social work are working with the
Library and the Health Department to offer unique educational opportunities for their students.
9 Pima County Public Library Community Impact Plan 2012/2013 First Year Report, 2013 10 Ibid

H u m a n I n f r a s t r u c t u r e
C o n n e c t i v i t y B a c k g r o u n d
A5.41 | P a g e A p p e n d i x A : B a c k g r o u n d a n d C u r r e n t C o n d i t i o n s
Digital Literacy
The Pima County Public Library serves as an access point for readers and for a range of community
access services including public access computers, internet and wireless services, e-book, audio content,
and online information services. The Library offers computer classes at local branches independently
and in partnership with the OASIS Institute. These classes encourage the development of 21st century
skills including digital literacy, critical thinking, and collaborative work activities. Computer classes are
available in English and Spanish. The Library provides access to electronic content (e-books, audio
content, e-magazines and online information services) while providing for equal access via a robust
internet/Wi-Fi connection.
Connected Learning
Pima County Public Library is providing opportunities for patrons to create content in multiple formats
through classes with career professionals. CreateIT provides youth with media and technology classes,
as well as mentoring opportunities with local experts to increase 21st century learning skills in the areas
of information, media and technology literacy. All classes are taught by career professionals and are
open to middle school and high school students.
The Catalyst Café program is a monthly convening of nonprofits, small business, and smart ideas to talk
technology and innovation in the service of people, neighborhoods, nonprofits and small business.
The Library is also a founding partner in the new Tucson Downtown Innovation District (DID), and joins
the DID in their mission to nurture local talent and build a robust tech/innovation economy and to
educate and encourage youth in STEAM concepts and disciplines.

H u m a n I n f r a s t r u c t u r e
C o n n e c t i v i t y B a c k g r o u n d
A5.42 | P a g e A p p e n d i x A : B a c k g r o u n d a n d C u r r e n t C o n d i t i o n s
Community Connections
The Library connects to the community outside of
library facilities. Mobile outreach efforts include the
Bookmobile, the Bookbike, and the Books on Wheels
Program. The Bookbike has proven to be an
exceptional way to connect the public with library
services and promote an environmentally savvy and
instantly recognizable face of the public library. This
year Pima County Bicycle & Pedestrian Program has
helped the Library to expand the Books-On-Wheels
services by pedaling books to homebound residents.
The Library engages in sustainability projects with the community. The Seed Library's mission is to help
nurture a thriving community of gardeners and seed savers in Pima County. In addition to providing
access to free seeds at 8 library locations, the library supports gardeners and seed savers, from beginner
to expert, through the process of growing, harvesting, and seed saving.
The Library continues an award-winning partnership with the Pima County Health Department to
provide on-site intervention services and a focus on public health. The goals of the Library Nurses
Program are to provide a safe and welcoming environment for all patrons and staff and minimize the
number of 911 calls for non-medical emergencies at library branches.
The program has grown from one nurse, to five nurses rotating among library branches, to all Public Health nurses in Pima County assigned to connect and engage with residents at public library sites.
During the first year of the program, library nurses interacted with more than 2,800 patrons and 911 medical calls from libraries were reduced by 20 percent.11
11 Pima County Health Department Library Nurse Project Annual Report, 2013

H u m a n I n f r a s t r u c t u r e
C o n n e c t i v i t y B a c k g r o u n d
A5.43 | P a g e A p p e n d i x A : B a c k g r o u n d a n d C u r r e n t C o n d i t i o n s
In addition to providing needed services, the Library Nurses Program has built a strong foundation of partnership with the County Health Department and raised the profile of public health nurses as neighborhood resources.
The Library’s Programs & Partnerships Office engages with other departments, organizations and agencies in the community to build resources, offer programs that focus on Pima County’s diverse populations, and make connections to enhance the quality of life for residents in Pima County.
Opportunities and Challenges In FY 2012-2013, 5,792,641 people visited the Pima County Public Library, and at the end of August 2013, we had over 416,000 library cardholders.12 Despite these statistics that demonstrate our importance and relevance to the community, the Library continues to face several challenges: staffing, underbuilt facilities, bandwidth capacity, increasing content costs, and providing content in new formats. The Pima County Public Library’s greatest constraints involve funding. The community’s demand for more learning opportunities has outgrown the Library’s resources. Nevertheless, the Library continues to successfully serve the informational, cultural, educational, and recreational needs of the community.
12 Pima County Public Library Community Impact Plan 2012/2013 First Year Report, 2013
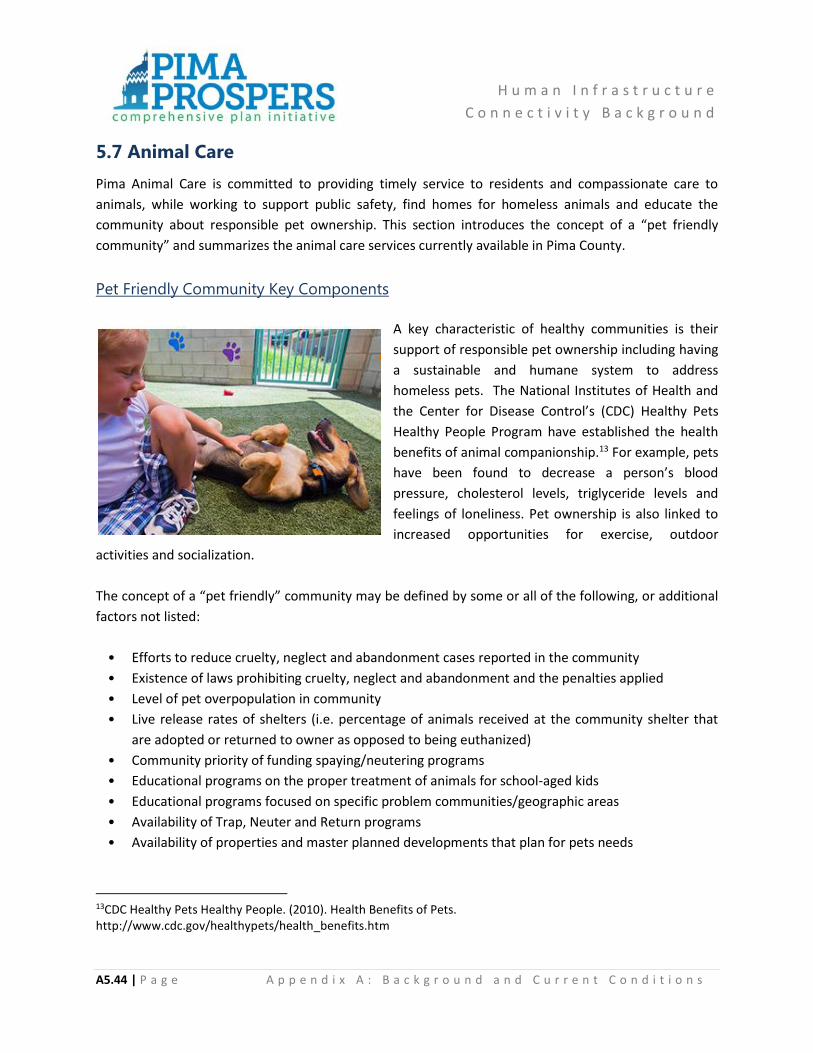
H u m a n I n f r a s t r u c t u r e
C o n n e c t i v i t y B a c k g r o u n d
A5.44 | P a g e A p p e n d i x A : B a c k g r o u n d a n d C u r r e n t C o n d i t i o n s
5.7 Animal Care
Pima Animal Care is committed to providing timely service to residents and compassionate care to
animals, while working to support public safety, find homes for homeless animals and educate the
community about responsible pet ownership. This section introduces the concept of a “pet friendly
community” and summarizes the animal care services currently available in Pima County.
Pet Friendly Community Key Components
A key characteristic of healthy communities is their
support of responsible pet ownership including having
a sustainable and humane system to address
homeless pets. The National Institutes of Health and
the Center for Disease Control’s (CDC) Healthy Pets
Healthy People Program have established the health
benefits of animal companionship.13 For example, pets
have been found to decrease a person’s blood
pressure, cholesterol levels, triglyceride levels and
feelings of loneliness. Pet ownership is also linked to
increased opportunities for exercise, outdoor
activities and socialization.
The concept of a “pet friendly” community may be defined by some or all of the following, or additional
factors not listed:
• Efforts to reduce cruelty, neglect and abandonment cases reported in the community
• Existence of laws prohibiting cruelty, neglect and abandonment and the penalties applied
• Level of pet overpopulation in community
• Live release rates of shelters (i.e. percentage of animals received at the community shelter that
are adopted or returned to owner as opposed to being euthanized)
• Community priority of funding spaying/neutering programs
• Educational programs on the proper treatment of animals for school-aged kids
• Educational programs focused on specific problem communities/geographic areas
• Availability of Trap, Neuter and Return programs
• Availability of properties and master planned developments that plan for pets needs
13CDC Healthy Pets Healthy People. (2010). Health Benefits of Pets. http://www.cdc.gov/healthypets/health_benefits.htm

H u m a n I n f r a s t r u c t u r e
C o n n e c t i v i t y B a c k g r o u n d
A5.45 | P a g e A p p e n d i x A : B a c k g r o u n d a n d C u r r e n t C o n d i t i o n s
• Availability of veterinarians willing to perform low-cost spay/neuters and/or offer lower cost
medical treatment
• Overall community support for shelters and rescue organizations (e.g. financially, volunteers)
• Frequency of adoption of homeless animals from shelters and rescue groups versus purchasing
pets
• Efforts to discourage puppy/kitten mills and online sales of pets
• Availability of pet behavioral problem treatment education and programs (e.g. advice hotline)
• Community’s overall animal care awareness (e.g. ranging from proper shelter, food, water to
making a lifetime commitment, to ensuring the protection of pets on the 4th of July)
• Availability of rental/senior/condominium properties that allow pets14
• Availability of emergency shelters, transportation, and other assistance to people with pets
• Availability of shelters for homeless persons with pets (not only emergency but in the heat, rain,
and cold)
• Accessible pet supply and service businesses
• Community presence of businesses which support rescue groups (e.g. donations, services)
• Community presence of businesses that allow pets
• Animal-centered community events
• Community events that allow/encourage pets
• Acceptance of entertainment events with questionable animal treatment (e.g. greyhound racing,
rodeo calf roping, circuses)
• Robust owner compliance with licensing dogs
• A major portion of pets microchipped
• A major portion of pet owners with established veterinarians
• Mass transit system allows pets
If Pima County aspires to be deemed “pet friendly”, the community can decide for itself what that
designation entails. Pima County may choose a different or more rigorous set of criteria than other
communities.
14 Inability to find pet friendly housing is one of the leading causes of cat and dog abandonment (AAPAW Alamo Area Partners for Animal Welfare - http://aapaw.org/)
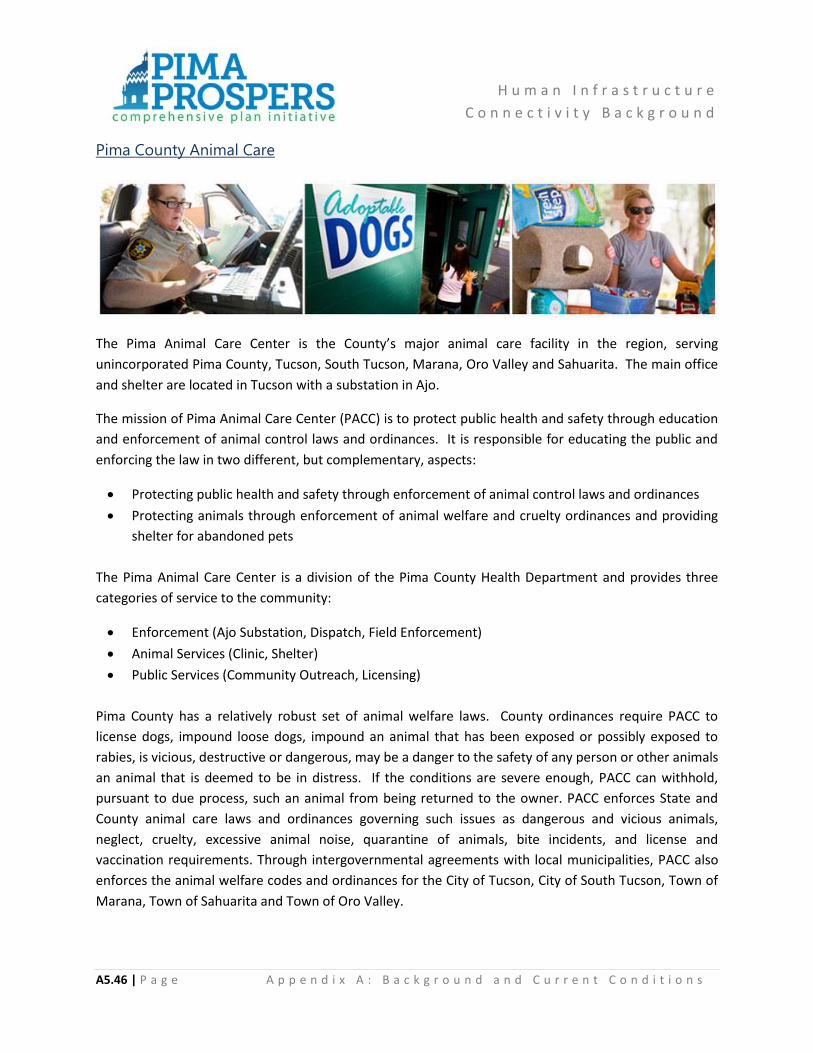
H u m a n I n f r a s t r u c t u r e
C o n n e c t i v i t y B a c k g r o u n d
A5.46 | P a g e A p p e n d i x A : B a c k g r o u n d a n d C u r r e n t C o n d i t i o n s
Pima County Animal Care
The Pima Animal Care Center is the County’s major animal care facility in the region, serving
unincorporated Pima County, Tucson, South Tucson, Marana, Oro Valley and Sahuarita. The main office
and shelter are located in Tucson with a substation in Ajo.
The mission of Pima Animal Care Center (PACC) is to protect public health and safety through education
and enforcement of animal control laws and ordinances. It is responsible for educating the public and
enforcing the law in two different, but complementary, aspects:
Protecting public health and safety through enforcement of animal control laws and ordinances
Protecting animals through enforcement of animal welfare and cruelty ordinances and providing
shelter for abandoned pets
The Pima Animal Care Center is a division of the Pima County Health Department and provides three
categories of service to the community:
Enforcement (Ajo Substation, Dispatch, Field Enforcement)
Animal Services (Clinic, Shelter)
Public Services (Community Outreach, Licensing)
Pima County has a relatively robust set of animal welfare laws. County ordinances require PACC to
license dogs, impound loose dogs, impound an animal that has been exposed or possibly exposed to
rabies, is vicious, destructive or dangerous, may be a danger to the safety of any person or other animals
an animal that is deemed to be in distress. If the conditions are severe enough, PACC can withhold,
pursuant to due process, such an animal from being returned to the owner. PACC enforces State and
County animal care laws and ordinances governing such issues as dangerous and vicious animals,
neglect, cruelty, excessive animal noise, quarantine of animals, bite incidents, and license and
vaccination requirements. Through intergovernmental agreements with local municipalities, PACC also
enforces the animal welfare codes and ordinances for the City of Tucson, City of South Tucson, Town of
Marana, Town of Sahuarita and Town of Oro Valley.
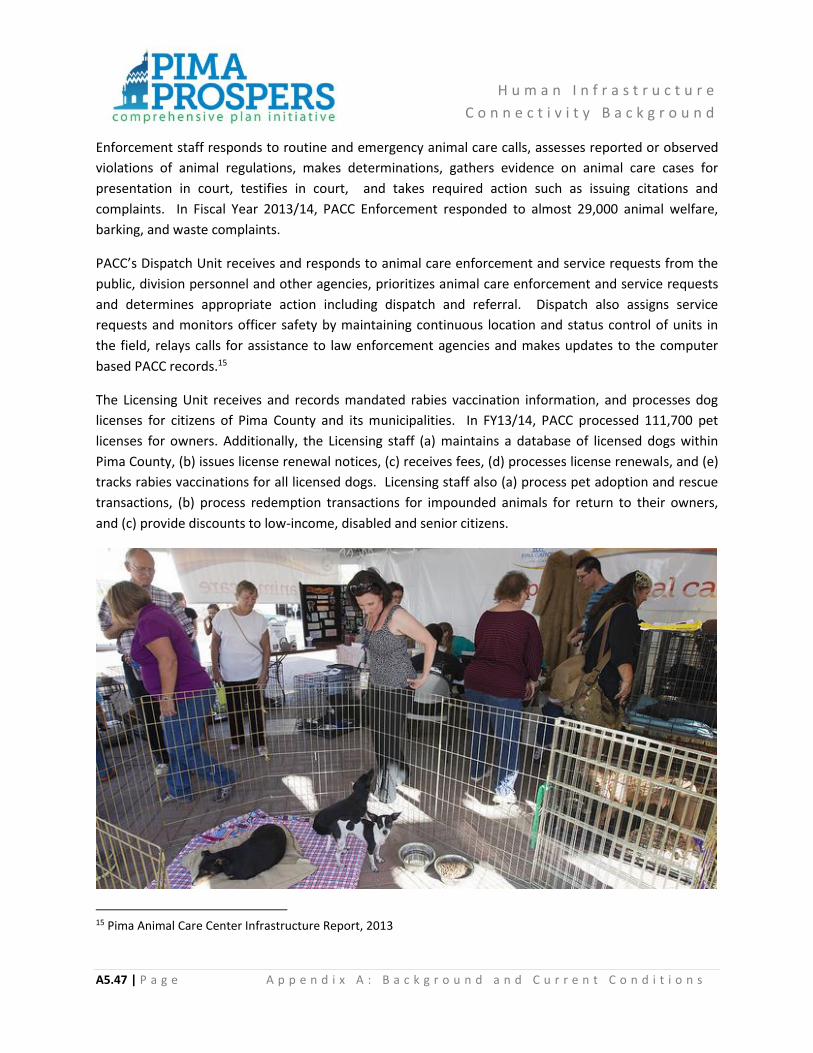
H u m a n I n f r a s t r u c t u r e
C o n n e c t i v i t y B a c k g r o u n d
A5.47 | P a g e A p p e n d i x A : B a c k g r o u n d a n d C u r r e n t C o n d i t i o n s
Enforcement staff responds to routine and emergency animal care calls, assesses reported or observed
violations of animal regulations, makes determinations, gathers evidence on animal care cases for
presentation in court, testifies in court, and takes required action such as issuing citations and
complaints. In Fiscal Year 2013/14, PACC Enforcement responded to almost 29,000 animal welfare,
barking, and waste complaints.
PACC’s Dispatch Unit receives and responds to animal care enforcement and service requests from the
public, division personnel and other agencies, prioritizes animal care enforcement and service requests
and determines appropriate action including dispatch and referral. Dispatch also assigns service
requests and monitors officer safety by maintaining continuous location and status control of units in
the field, relays calls for assistance to law enforcement agencies and makes updates to the computer
based PACC records.15
The Licensing Unit receives and records mandated rabies vaccination information, and processes dog
licenses for citizens of Pima County and its municipalities. In FY13/14, PACC processed 111,700 pet
licenses for owners. Additionally, the Licensing staff (a) maintains a database of licensed dogs within
Pima County, (b) issues license renewal notices, (c) receives fees, (d) processes license renewals, and (e)
tracks rabies vaccinations for all licensed dogs. Licensing staff also (a) process pet adoption and rescue
transactions, (b) process redemption transactions for impounded animals for return to their owners,
and (c) provide discounts to low-income, disabled and senior citizens.
15 Pima Animal Care Center Infrastructure Report, 2013
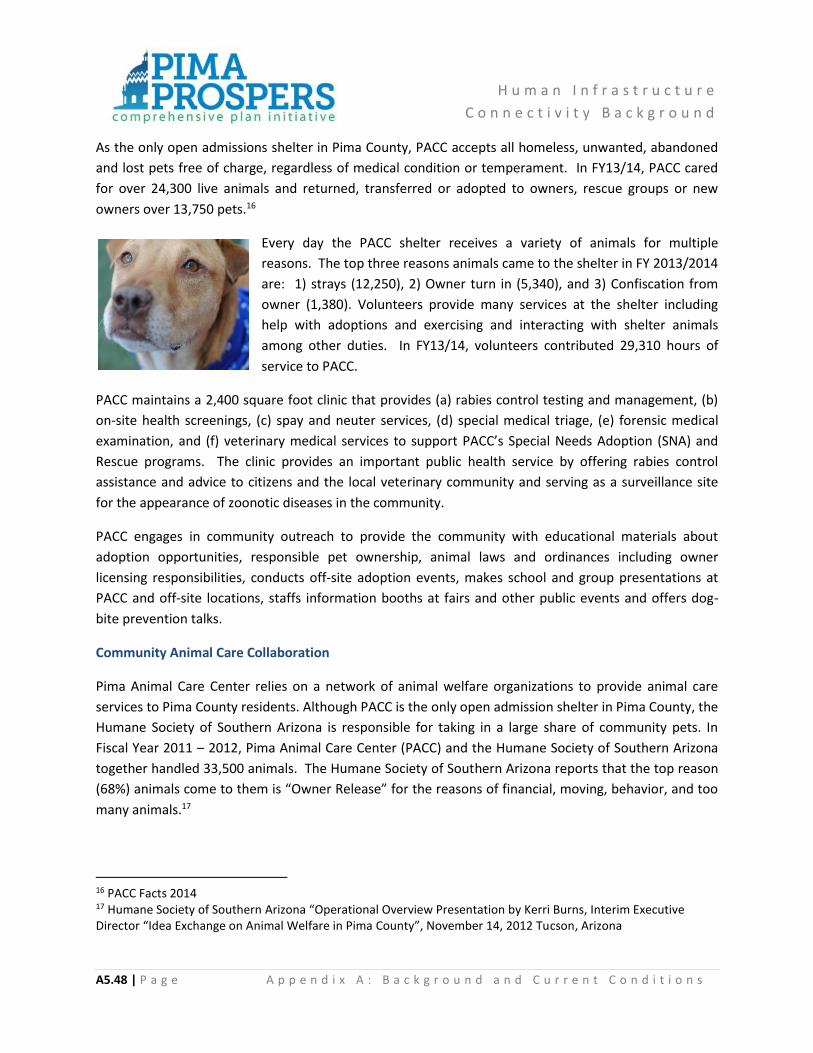
H u m a n I n f r a s t r u c t u r e
C o n n e c t i v i t y B a c k g r o u n d
A5.48 | P a g e A p p e n d i x A : B a c k g r o u n d a n d C u r r e n t C o n d i t i o n s
As the only open admissions shelter in Pima County, PACC accepts all homeless, unwanted, abandoned
and lost pets free of charge, regardless of medical condition or temperament. In FY13/14, PACC cared
for over 24,300 live animals and returned, transferred or adopted to owners, rescue groups or new
owners over 13,750 pets.16
Every day the PACC shelter receives a variety of animals for multiple
reasons. The top three reasons animals came to the shelter in FY 2013/2014
are: 1) strays (12,250), 2) Owner turn in (5,340), and 3) Confiscation from
owner (1,380). Volunteers provide many services at the shelter including
help with adoptions and exercising and interacting with shelter animals
among other duties. In FY13/14, volunteers contributed 29,310 hours of
service to PACC.
PACC maintains a 2,400 square foot clinic that provides (a) rabies control testing and management, (b)
on-site health screenings, (c) spay and neuter services, (d) special medical triage, (e) forensic medical
examination, and (f) veterinary medical services to support PACC’s Special Needs Adoption (SNA) and
Rescue programs. The clinic provides an important public health service by offering rabies control
assistance and advice to citizens and the local veterinary community and serving as a surveillance site
for the appearance of zoonotic diseases in the community.
PACC engages in community outreach to provide the community with educational materials about
adoption opportunities, responsible pet ownership, animal laws and ordinances including owner
licensing responsibilities, conducts off-site adoption events, makes school and group presentations at
PACC and off-site locations, staffs information booths at fairs and other public events and offers dog-
bite prevention talks.
Community Animal Care Collaboration
Pima Animal Care Center relies on a network of animal welfare organizations to provide animal care
services to Pima County residents. Although PACC is the only open admission shelter in Pima County, the
Humane Society of Southern Arizona is responsible for taking in a large share of community pets. In
Fiscal Year 2011 – 2012, Pima Animal Care Center (PACC) and the Humane Society of Southern Arizona
together handled 33,500 animals. The Humane Society of Southern Arizona reports that the top reason
(68%) animals come to them is “Owner Release” for the reasons of financial, moving, behavior, and too
many animals.17
16 PACC Facts 2014 17 Humane Society of Southern Arizona “Operational Overview Presentation by Kerri Burns, Interim Executive Director “Idea Exchange on Animal Welfare in Pima County”, November 14, 2012 Tucson, Arizona
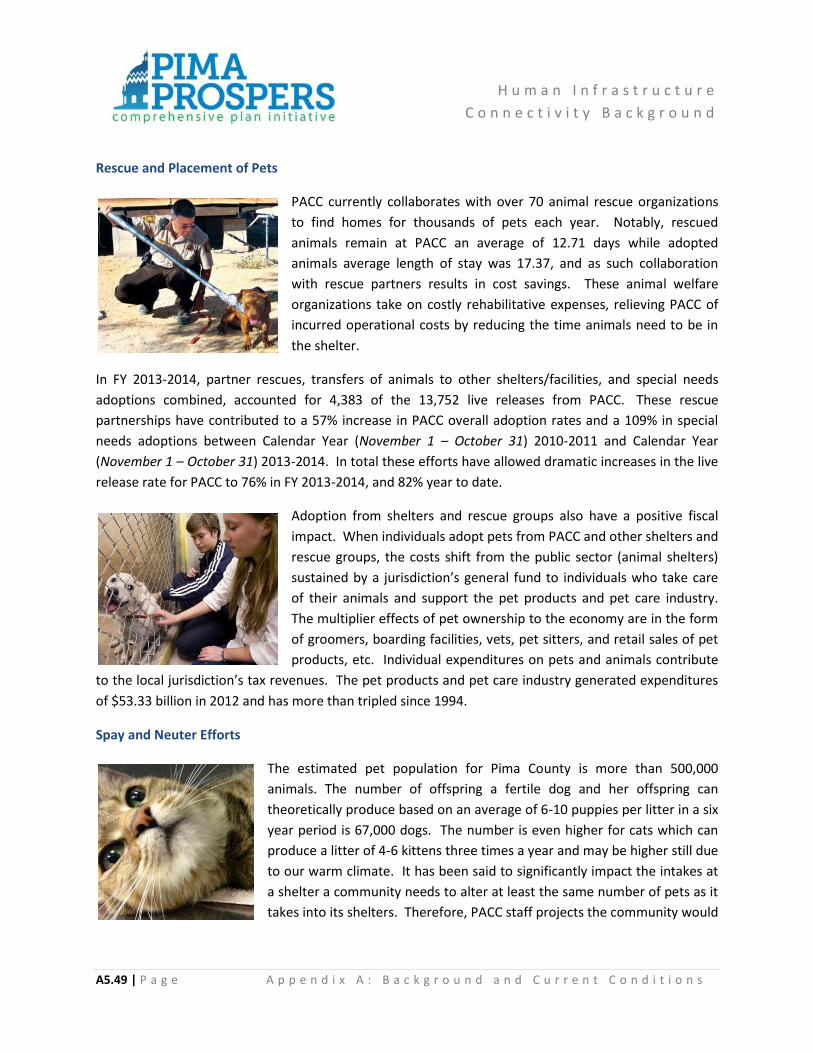
H u m a n I n f r a s t r u c t u r e
C o n n e c t i v i t y B a c k g r o u n d
A5.49 | P a g e A p p e n d i x A : B a c k g r o u n d a n d C u r r e n t C o n d i t i o n s
Rescue and Placement of Pets
PACC currently collaborates with over 70 animal rescue organizations
to find homes for thousands of pets each year. Notably, rescued
animals remain at PACC an average of 12.71 days while adopted
animals average length of stay was 17.37, and as such collaboration
with rescue partners results in cost savings. These animal welfare
organizations take on costly rehabilitative expenses, relieving PACC of
incurred operational costs by reducing the time animals need to be in
the shelter.
In FY 2013-2014, partner rescues, transfers of animals to other shelters/facilities, and special needs
adoptions combined, accounted for 4,383 of the 13,752 live releases from PACC. These rescue
partnerships have contributed to a 57% increase in PACC overall adoption rates and a 109% in special
needs adoptions between Calendar Year (November 1 – October 31) 2010-2011 and Calendar Year
(November 1 – October 31) 2013-2014. In total these efforts have allowed dramatic increases in the live
release rate for PACC to 76% in FY 2013-2014, and 82% year to date.
Adoption from shelters and rescue groups also have a positive fiscal
impact. When individuals adopt pets from PACC and other shelters and
rescue groups, the costs shift from the public sector (animal shelters)
sustained by a jurisdiction’s general fund to individuals who take care
of their animals and support the pet products and pet care industry.
The multiplier effects of pet ownership to the economy are in the form
of groomers, boarding facilities, vets, pet sitters, and retail sales of pet
products, etc. Individual expenditures on pets and animals contribute
to the local jurisdiction’s tax revenues. The pet products and pet care industry generated expenditures
of $53.33 billion in 2012 and has more than tripled since 1994.
Spay and Neuter Efforts
The estimated pet population for Pima County is more than 500,000
animals. The number of offspring a fertile dog and her offspring can
theoretically produce based on an average of 6-10 puppies per litter in a six
year period is 67,000 dogs. The number is even higher for cats which can
produce a litter of 4-6 kittens three times a year and may be higher still due
to our warm climate. It has been said to significantly impact the intakes at
a shelter a community needs to alter at least the same number of pets as it
takes into its shelters. Therefore, PACC staff projects the community would
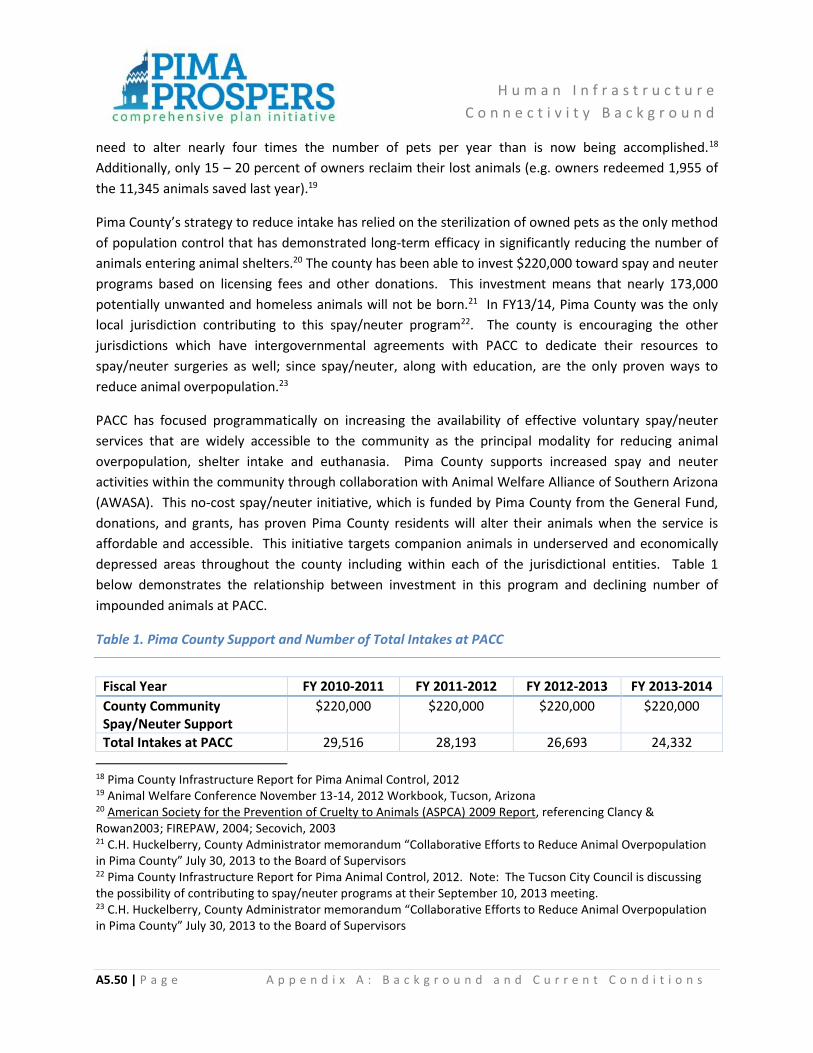
H u m a n I n f r a s t r u c t u r e
C o n n e c t i v i t y B a c k g r o u n d
A5.50 | P a g e A p p e n d i x A : B a c k g r o u n d a n d C u r r e n t C o n d i t i o n s
need to alter nearly four times the number of pets per year than is now being accomplished.18
Additionally, only 15 – 20 percent of owners reclaim their lost animals (e.g. owners redeemed 1,955 of
the 11,345 animals saved last year).19
Pima County’s strategy to reduce intake has relied on the sterilization of owned pets as the only method
of population control that has demonstrated long-term efficacy in significantly reducing the number of
animals entering animal shelters.20 The county has been able to invest $220,000 toward spay and neuter
programs based on licensing fees and other donations. This investment means that nearly 173,000
potentially unwanted and homeless animals will not be born.21 In FY13/14, Pima County was the only
local jurisdiction contributing to this spay/neuter program22. The county is encouraging the other
jurisdictions which have intergovernmental agreements with PACC to dedicate their resources to
spay/neuter surgeries as well; since spay/neuter, along with education, are the only proven ways to
reduce animal overpopulation.23
PACC has focused programmatically on increasing the availability of effective voluntary spay/neuter
services that are widely accessible to the community as the principal modality for reducing animal
overpopulation, shelter intake and euthanasia. Pima County supports increased spay and neuter
activities within the community through collaboration with Animal Welfare Alliance of Southern Arizona
(AWASA). This no-cost spay/neuter initiative, which is funded by Pima County from the General Fund,
donations, and grants, has proven Pima County residents will alter their animals when the service is
affordable and accessible. This initiative targets companion animals in underserved and economically
depressed areas throughout the county including within each of the jurisdictional entities. Table 1
below demonstrates the relationship between investment in this program and declining number of
impounded animals at PACC.
Table 1. Pima County Support and Number of Total Intakes at PACC
Fiscal Year FY 2010-2011 FY 2011-2012 FY 2012-2013 FY 2013-2014
County Community Spay/Neuter Support
$220,000 $220,000 $220,000 $220,000
Total Intakes at PACC 29,516 28,193 26,693 24,332
18 Pima County Infrastructure Report for Pima Animal Control, 2012 19 Animal Welfare Conference November 13-14, 2012 Workbook, Tucson, Arizona 20 American Society for the Prevention of Cruelty to Animals (ASPCA) 2009 Report, referencing Clancy & Rowan2003; FIREPAW, 2004; Secovich, 2003 21 C.H. Huckelberry, County Administrator memorandum “Collaborative Efforts to Reduce Animal Overpopulation in Pima County” July 30, 2013 to the Board of Supervisors 22 Pima County Infrastructure Report for Pima Animal Control, 2012. Note: The Tucson City Council is discussing the possibility of contributing to spay/neuter programs at their September 10, 2013 meeting. 23 C.H. Huckelberry, County Administrator memorandum “Collaborative Efforts to Reduce Animal Overpopulation in Pima County” July 30, 2013 to the Board of Supervisors
H u m a n I n f r a s t r u c t u r e
C o n n e c t i v i t y B a c k g r o u n d
A5.51 | P a g e A p p e n d i x A : B a c k g r o u n d a n d C u r r e n t C o n d i t i o n s
As part of its long term commitment to spay and neuter initiatives, Pima County initiated a partnership
with Best Friends Animal Society to address the feral cat challenge through an effective Trap, Neuter
and Return program targeted in nine high stress zip codes historically demonstrating the largest number
of feral cats.
Fiscal benefit to the County and jurisdictions due to spay and neuter initiatives can be estimated from FY
2013 – 2014 cost analyses. In FY 2013-2014, PACC had a live outcome for 23,976 shelter pets, costing
the County $2.8 million for care and evaluation of these pets, or $118.41 per companion animal. By
comparison, the contracted spay and neuter cost averages to $70 per animal. The decrease in shelter
volume associated with our spay/neuter policy has a cost benefit and reflects the County’s long-term
investment in this strategy. Continuance of support for aggressive spay and neuter initiatives is
essential to reducing the number of pets cared for by PACC and the costs associated with this service.
Pima Alliance for Animal Welfare (PAAW) It will take a community effort to address the homeless pet situation.24 PACC cannot do it alone. Pima
Alliance for Animal Welfare (PAAW) was formed in November 2012, bringing together representatives
from rescue groups (dogs, cats, horses and pigs), breeders, funders, veterinarians, shelters (Hermitage,
Pima Animal Care Center, and Humane Society of Southern Arizona among many others), and national
organizations like the Humane Society of US and Best Friends Animal Sanctuary. From that meeting
came a consensus that the community had to do something immediately. The alliance agreed to discuss
ways to work cooperatively to reduce the number of animals coming into the shelters, to help those
already in the shelter find a second chance at having a loving home, and to provide support to current
pet owners.25 A Steering Committee was appointed to meet regularly and move the issue forward
checking in with the bigger group every six months. PAAW is a staff supported fund of the Community
Foundation for Southern Arizona.
The mission of PAAW is to engage all Pima County residents, agencies, and organizations in aggressive
adoption and spay/neuter efforts, responsible breeding, and conscientious pet ownership to ensure all
companion animals have a loving home and humane care.26
PAAW has adopted three priorities related to improving animal welfare in Pima County:
Crowd Control: How do we stop animals from coming in to our shelters?
Quality of Life: How do we improve their lives while in a shelter or with a rescue organization?
24 C.H. Huckelberry, County Administrator memorandum “, Collaborative Efforts to Reduce Animal Overpopulation in Pima County” July 30, 2013 to the Board of Supervisors 25 Ibid 26 Ibid
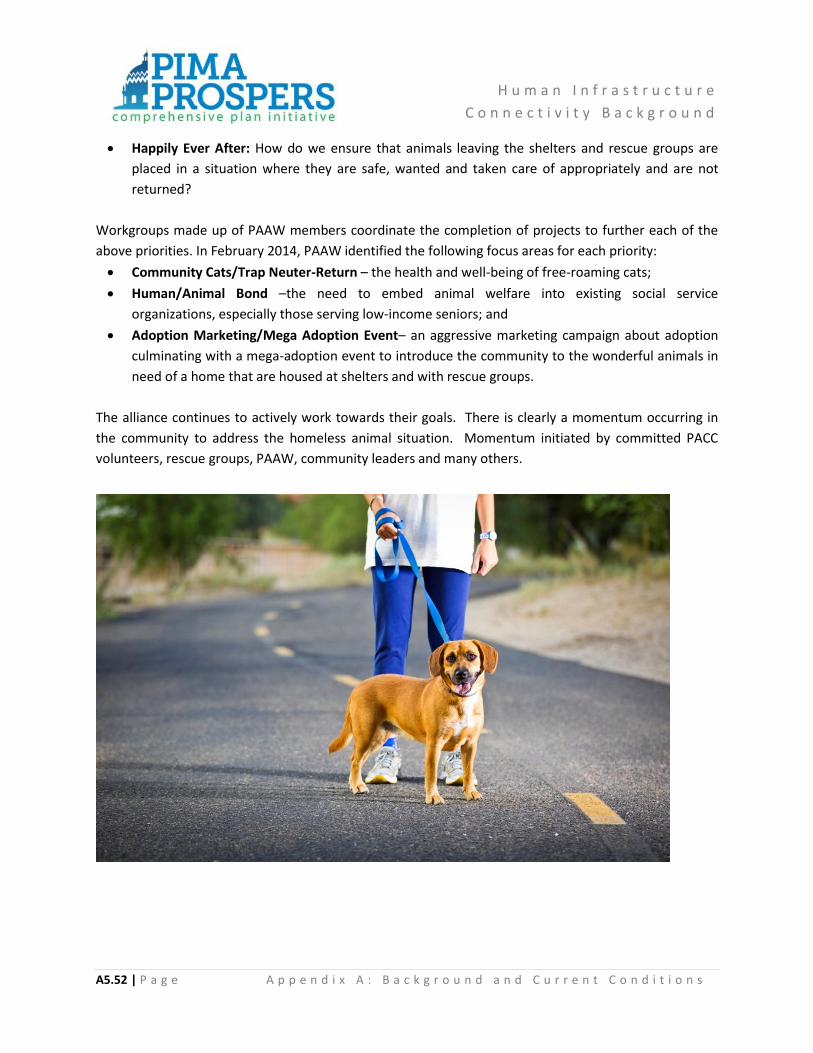
H u m a n I n f r a s t r u c t u r e
C o n n e c t i v i t y B a c k g r o u n d
A5.52 | P a g e A p p e n d i x A : B a c k g r o u n d a n d C u r r e n t C o n d i t i o n s
Happily Ever After: How do we ensure that animals leaving the shelters and rescue groups are
placed in a situation where they are safe, wanted and taken care of appropriately and are not
returned?
Workgroups made up of PAAW members coordinate the completion of projects to further each of the
above priorities. In February 2014, PAAW identified the following focus areas for each priority:
Community Cats/Trap Neuter-Return – the health and well-being of free-roaming cats;
Human/Animal Bond –the need to embed animal welfare into existing social service
organizations, especially those serving low-income seniors; and
Adoption Marketing/Mega Adoption Event– an aggressive marketing campaign about adoption
culminating with a mega-adoption event to introduce the community to the wonderful animals in
need of a home that are housed at shelters and with rescue groups.
The alliance continues to actively work towards their goals. There is clearly a momentum occurring in
the community to address the homeless animal situation. Momentum initiated by committed PACC
volunteers, rescue groups, PAAW, community leaders and many others.
H u m a n I n f r a s t r u c t u r e
C o n n e c t i v i t y B a c k g r o u n d
A5.53 | P a g e A p p e n d i x A : B a c k g r o u n d a n d C u r r e n t C o n d i t i o n s
Animal Care Services High Stress Areas
A team of students from the University of Arizona Eller College of Management was recruited to assist
with analyzing data from the primary animal shelters serving Pima County - Humane Society of Southern
Arizona (HSSA) and PACC - to help identify strategic solutions to save more lives. Specifically their goal
was to “identify areas where appropriate interventions could lead to measurable improvements and
meaningful education to the public”.
The Eller team found the following zip codes to be the top five sources (in order of number of animals)
for:
Feline Intake
HSSA - 85711, 85719, 85705, 85716, 85745
PACC – 85705, 85706, 85713, 85719, 85710
Canine Intake
HSSA – 85716, 85745, 85710, 85705, 85730
Feline Adoptions
PACC – 85711, 85705, 85712, 85719, 85710

H u m a n I n f r a s t r u c t u r e
C o n n e c t i v i t y B a c k g r o u n d
A5.54 | P a g e A p p e n d i x A : B a c k g r o u n d a n d C u r r e n t C o n d i t i o n s
These zip codes are located as follows:
85705 Downtown, Miracle Mile, Stone Avenue, Flowing Wells areas - River Road to 1st Avenue to
Aviation Hwy to Santa Cruz River/I-10
85706 South-central - Irvington Road to I-10/west edge of Davis Monthan AFB to Valencia Road to the Santa Cruz River
85710 East - Wilmot Road to Speedway Blvd to Harrison Road to Golf Links Road
85711 Near east - Alvernon Way to Speedway Blvd to Wilmot Road to Golf Links Road
85712 Near northeast - Alvernon Way to River Road to Wilmot Road to Speedway Blvd
85713 South - 22nd St. to Alvernon Way to Ajo Way to Kinney Road
85716 Central - Tucson Blvd to River Road to Alvernon Way to 22nd St.
85719 Central - 1st Street to the Rillito River to Tucson Blvd to 22nd St.
85730 East of Davis Monthan Air Force Base (DMAFB) – Golf Links Road to Old Spanish Trail to Irvington Road alignment to DMAFB
85745 West - I-10 to 22nd St. to Tucson Mtn./Saguaro National Parks to Sunset Road
The students found that the breeds with the highest numbers taken in by both agencies are: pit bull,
Chihuahua, shepherd, and Labrador Retriever. They also provided data on the geographic sources of
volunteers, the live release rate for PACC, and the relationship of income to the geographic sources by
zip codes of intake and adoptions.
A separate, rough evaluation to determine if any particular geographic areas request more PACC
services than others was done by Development Services staff based on the number of enforcement
responses Pima Animal Control Center (PACC) received during Fiscal Year 2012-13. This evaluation did
not include data from the Humane Society of Southern Arizona. The populations of each zip code were
accounted for in the calculations. The results of the evaluation are: 1) a high number of overall
enforcement responses come from zip codes 85705, 85706, 85713; 2) a high number of enforcement
calls regarding neglect come from 85705, 85706, 85711, 85712, 85713; 3) a high number of
enforcement calls regarding cruelty come from 85705, 85710, 85713; and, 4) a high number of
enforcement calls regarding loose animals come from 85705, 85706, 85713.
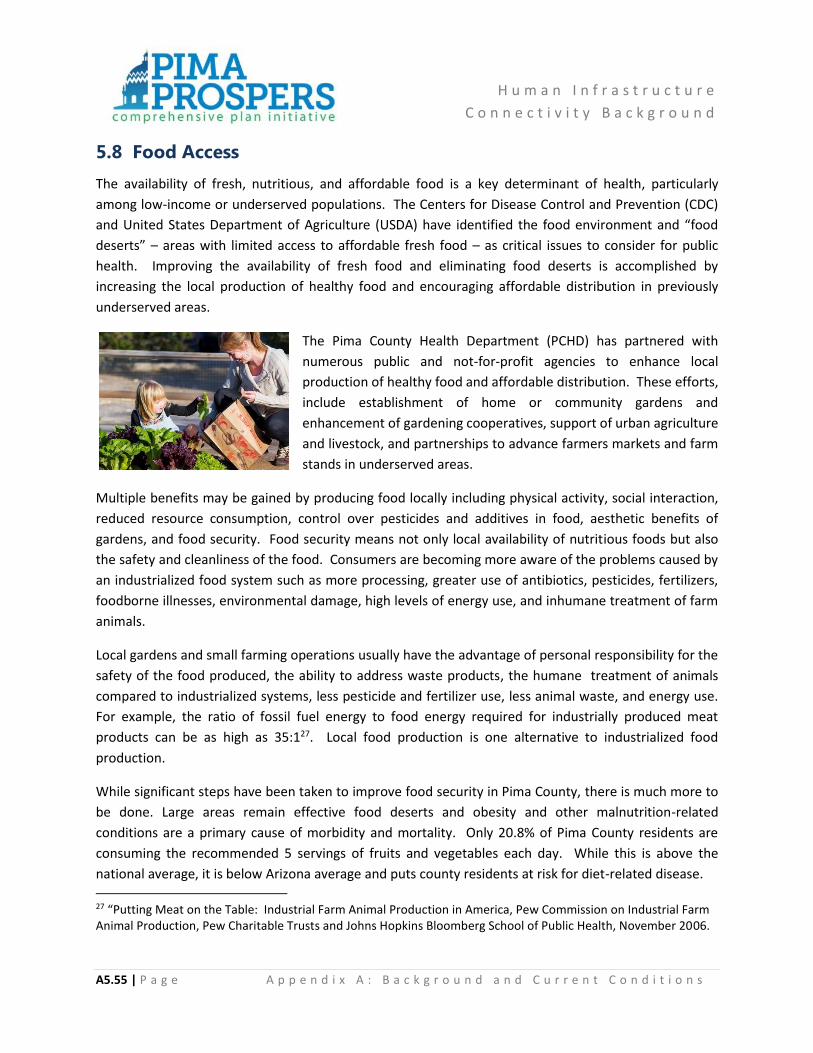
H u m a n I n f r a s t r u c t u r e
C o n n e c t i v i t y B a c k g r o u n d
A5.55 | P a g e A p p e n d i x A : B a c k g r o u n d a n d C u r r e n t C o n d i t i o n s
5.8 Food Access
The availability of fresh, nutritious, and affordable food is a key determinant of health, particularly
among low-income or underserved populations. The Centers for Disease Control and Prevention (CDC)
and United States Department of Agriculture (USDA) have identified the food environment and “food
deserts” – areas with limited access to affordable fresh food – as critical issues to consider for public
health. Improving the availability of fresh food and eliminating food deserts is accomplished by
increasing the local production of healthy food and encouraging affordable distribution in previously
underserved areas.
The Pima County Health Department (PCHD) has partnered with
numerous public and not-for-profit agencies to enhance local
production of healthy food and affordable distribution. These efforts,
include establishment of home or community gardens and
enhancement of gardening cooperatives, support of urban agriculture
and livestock, and partnerships to advance farmers markets and farm
stands in underserved areas.
Multiple benefits may be gained by producing food locally including physical activity, social interaction,
reduced resource consumption, control over pesticides and additives in food, aesthetic benefits of
gardens, and food security. Food security means not only local availability of nutritious foods but also
the safety and cleanliness of the food. Consumers are becoming more aware of the problems caused by
an industrialized food system such as more processing, greater use of antibiotics, pesticides, fertilizers,
foodborne illnesses, environmental damage, high levels of energy use, and inhumane treatment of farm
animals.
Local gardens and small farming operations usually have the advantage of personal responsibility for the
safety of the food produced, the ability to address waste products, the humane treatment of animals
compared to industrialized systems, less pesticide and fertilizer use, less animal waste, and energy use.
For example, the ratio of fossil fuel energy to food energy required for industrially produced meat
products can be as high as 35:127. Local food production is one alternative to industrialized food
production.
While significant steps have been taken to improve food security in Pima County, there is much more to
be done. Large areas remain effective food deserts and obesity and other malnutrition-related
conditions are a primary cause of morbidity and mortality. Only 20.8% of Pima County residents are
consuming the recommended 5 servings of fruits and vegetables each day. While this is above the
national average, it is below Arizona average and puts county residents at risk for diet-related disease.
27 “Putting Meat on the Table: Industrial Farm Animal Production in America, Pew Commission on Industrial Farm Animal Production, Pew Charitable Trusts and Johns Hopkins Bloomberg School of Public Health, November 2006.

H u m a n I n f r a s t r u c t u r e
C o n n e c t i v i t y B a c k g r o u n d
A5.56 | P a g e A p p e n d i x A : B a c k g r o u n d a n d C u r r e n t C o n d i t i o n s
Zoning barriers continue to exist limiting the ability of county residents to fairly and safely sell their
surplus home-grown produce while at the same time allowing frequent yard and garage sales, despite
Arizona Revised Statute specifically protecting the rights of residents to sell such produce (A.R.S. §3-561
et seq.) without undue restriction. The perception of safety, disease risk and neighborhood noise
(related especially to urban livestock) continue to be concerns that should be addressed to further
encourage local food production and distribution. A comprehensive understanding by the public that
garden-grown produce is acceptable and allowable for service in restaurants will continue to improve
options available at local eateries, enhancing both physical and economic health in Pima County.
Innovative and cost-effective methods to continue to expand local food production, urban farming and
livestock, and affordable food distribution must be identified and implemented to sustain the work
started by PCHD and community partners.28
Community Gardens
Under the Communities Putting Prevention to Work
program, PCHD collaborated with the Community
Food Bank of Southern Arizona and Community
Gardens of Tucson to significantly expand support for
private and community gardens in neighborhoods at
greater risk for obesity and related conditions. The
expansion of the Food Bank’s Gardening Cooperative
and active partnership with several school, church and
neighborhood groups resulted in the addition of
hundreds of home-based gardens. For those residents
interested in gardening but lacking land for their use (such as those living in apartments or other multi-
unit dwellings), training and supplies for container gardening was provided, allowing the growth of fresh
vegetables, fruits and herbs in small containers on a porch or patio.
Alongside the Community Food Bank, Community Gardens of Tucson was contracted to install and
manage nearly 20 community gardening sites in parks, church or school yards or on private property
with granted access rights (such as apartment complexes), allowing hundreds of families to participate
in planting, growing and harvesting their own fresh fruits and vegetables.
Between the home and community garden efforts, it is estimated that nearly 500,000 servings of fresh
fruits and vegetables will be grown in Pima County each year that would not otherwise have been
available. 29
28 Pima County Health Department (Don Gates)
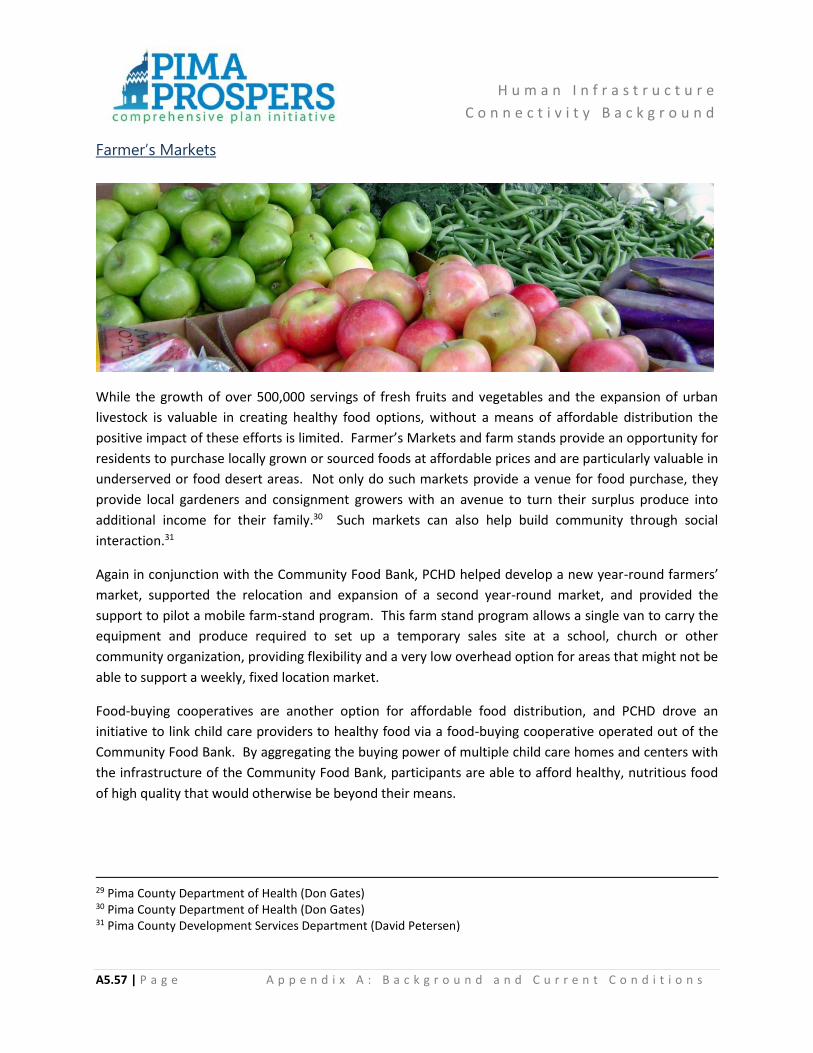
H u m a n I n f r a s t r u c t u r e
C o n n e c t i v i t y B a c k g r o u n d
A5.57 | P a g e A p p e n d i x A : B a c k g r o u n d a n d C u r r e n t C o n d i t i o n s
Farmer’s Markets
While the growth of over 500,000 servings of fresh fruits and vegetables and the expansion of urban
livestock is valuable in creating healthy food options, without a means of affordable distribution the
positive impact of these efforts is limited. Farmer’s Markets and farm stands provide an opportunity for
residents to purchase locally grown or sourced foods at affordable prices and are particularly valuable in
underserved or food desert areas. Not only do such markets provide a venue for food purchase, they
provide local gardeners and consignment growers with an avenue to turn their surplus produce into
additional income for their family.30 Such markets can also help build community through social
interaction.31
Again in conjunction with the Community Food Bank, PCHD helped develop a new year-round farmers’
market, supported the relocation and expansion of a second year-round market, and provided the
support to pilot a mobile farm-stand program. This farm stand program allows a single van to carry the
equipment and produce required to set up a temporary sales site at a school, church or other
community organization, providing flexibility and a very low overhead option for areas that might not be
able to support a weekly, fixed location market.
Food-buying cooperatives are another option for affordable food distribution, and PCHD drove an
initiative to link child care providers to healthy food via a food-buying cooperative operated out of the
Community Food Bank. By aggregating the buying power of multiple child care homes and centers with
the infrastructure of the Community Food Bank, participants are able to afford healthy, nutritious food
of high quality that would otherwise be beyond their means.
29 Pima County Department of Health (Don Gates) 30 Pima County Department of Health (Don Gates) 31 Pima County Development Services Department (David Petersen)

H u m a n I n f r a s t r u c t u r e
C o n n e c t i v i t y B a c k g r o u n d
A5.58 | P a g e A p p e n d i x A : B a c k g r o u n d a n d C u r r e n t C o n d i t i o n s
Additionally, as the local government agency responsible for enforcement of food code, PCHD has
verified that use of food grown in private or community gardens is allowable to serve in cafeterias and
restaurants provided all other food code parameters for storage, preparation and service are followed.32
There appear to be at least five farmer’s markets located in what may be considered underserved areas.
The farmer’s markets are33:
• El Pueblo Farmers’ Market located in El Rio Clinic parking lot on the SW corner of Irvington Road
and S. 6th Ave.
• Community Food Bank Farmers’ Market located at 3003 S. Country Club (Between 36th St & Ajo)
• Marana Farmers’ Market located at Marana Health Center 13395 Marana Main Street
• Santa Cruz River Farmers’ Market located at 100 S. Avenida del Convento (near Congress and
Grande)
• Farmers’ Market at 77north Marketplace, 16733 N. Oracle Road in Catalina
According to the Pima County library and individual farmer’s market websites, there appears to be at least 16 additional farmer’s markets. Ajo’s Collaborative Food Access Efforts
According to “A Sonoran Oasis – Developing a Local Food System for Ajo, Arizona” (2011) Ajo “has seen
the emergence of a local food system through a farmer’s market, community gardens, pomegranate
orchard, and more”. Additional efforts include capturing rainwater, farm stands, educational programs
on food production and making healthy food choices, and a number of small enterprise programs. New
organizations have sprung up in the last few years adding to the many organizations working together to
create a local, decentralized food production system that helps the economy and provides more food
choices. Ajo and surrounding area residents work with organizations ranging from health centers,
school districts, garden groups, the Tohono O’odham Nation, cooperative extension agencies, and
government offices.
Just announced in December 2014, Ajo was selected as one of 26 communities by the Obama
Administration to participate in Local Foods, Local Places, a federal initiative providing technical support
to integrate local food systems into community economic action plans. Ajo will receive technical
assistance to develop and implement an action plan promoting local foods and entrepreneurship in
order to create an economically vibrant community.
32 Pima County Department of Health (Don Gates) 33 Farmers’ Markets Listed by Community Food Bank

H u m a n I n f r a s t r u c t u r e
C o n n e c t i v i t y B a c k g r o u n d
A5.59 | P a g e A p p e n d i x A : B a c k g r o u n d a n d C u r r e n t C o n d i t i o n s
Small-scale Community Agriculture
The Pima County Health Department (PCHD) has also
supported expanded urban agriculture through support
of the Community Food Bank urban farm programs.
Under the same initiative, PCHD helped develop and
launch Las Milpitas de Cottonwood urban farm. Located
in south central Tucson, Las Milpitas features a large
community garden, instructional settings, several
resources for small producers, composting, and youth
farm education programs. This working farm provides
opportunities for the community to learn and participate in food security while helping established small
producers manage and expand their crops.
Advocacy for sustainable food sources and regional food security continues to be a primary goal of the
Community Food Bank, and PCHD is supportive of this mission. The Health Department has provided for
regulatory reviews and guidance regarding urban livestock such as chickens and goats, providing
information to community residents on allowances under existing city, county or state codes and
ordinance. Additionally, PCHD continues to provide guidance on the handling of animal food products
such as eggs and honey.34
The Pima County Zoning Code appears to be fairly liberal in provisions for keeping of livestock, poultry
and small animals, and beekeeping. Beekeeping is permitted in all zones subject to development
standards. The raising of ratites (emus and ostriches) is permitted in the IR, RH, GR-1, SR, SR-2, and SH
zones and are conditional uses in the CR-1 and CR-2 zones. Raising of hogs is permitted in the IR, RH,
GR-1, SR, and SH zones. Birds (chicken and poultry) are permitted in the IR, RH, GR-1, SR, SR-2, SH, TR
(no roosters), CR-1, CR-2, and CR-3 (no roosters) zones with few limitations. Raising of livestock (cattle,
horses, goats, and sheep) is permitted in the IR, RH, GR-1, SR, SR-2, SH, CR-1, and CR-2 zones. 35
34 Pima County Department of Health (Don Gates) 35 Pima County Development Services Department (David Petersen)

Planning Areas
EXHIBIT 5.2.aFire Districts
September 2013
P h y s i c a l I n f r a s t r u c t u r e C o n n e c t i v i t y B a c k g r o u n d
A5.60 | P a g e A p p e n d i x A : B a c k g r o u n d a n d C u r r e n t C o n d i t i o n s

Planning Areas
EXHIBIT 5.2.aFire Districts
September 2013
P h y s i c a l I n f r a s t r u c t u r e C o n n e c t i v i t y B a c k g r o u n d
A5.61 | P a g e A p p e n d i x A : B a c k g r o u n d a n d C u r r e n t C o n d i t i o n s

A d d i t i o n a l R e f e r e n c e M a p s
Planning Area Boundary
EXHIBIT 5.3.aExisting Parks and Recreation Areas
October 2013
A5.62 | P a g e A p p e n d i x A : B a c k g r o u n d a n d C u r r e n t C o n d i t i o n s

A d d i t i o n a l R e f e r e n c e M a p s
EXHIBIT 5.3.bExisting Parks and Recreation Areas
October 2013
A5.63 | P a g e A p p e n d i x A : B a c k g r o u n d a n d C u r r e n t C o n d i t i o n s

A d d i t i o n a l R e f e r e n c e M a p s
Planning Area Boundary
EXHIBIT 5.3.c Open Space
October 2013
A5.64 | P a g e A p p e n d i x A : B a c k g r o u n d a n d C u r r e n t C o n d i t i o n s

A d d i t i o n a l R e f e r e n c e M a p s
EXHIBIT 5.3.d Open Space
October 2013
A5.65 | P a g e A p p e n d i x A : B a c k g r o u n d a n d C u r r e n t C o n d i t i o n s

Planning Areas
EXHIBIT 5.6.aExisting Libraries
September 2013
P h y s i c a l I n f r a s t r u c t u r e C o n n e c t i v i t y B a c k g r o u n d
A5.66 | P a g e A p p e n d i x A : B a c k g r o u n d a n d C u r r e n t C o n d i t i o n s

EXHIBIT 5.6.bExisting Libraries
September 2013
P h y s i c a l I n f r a s t r u c t u r e C o n n e c t i v i t y B a c k g r o u n d
A5.67 | P a g e A p p e n d i x A : B a c k g r o u n d a n d C u r r e n t C o n d i t i o n s

E c o n o m i c D e v e l o p m e n t
B a c k g r o u n d
A6.1 | P a g e A p p e n d i x A : B a c k g r o u n d a n d C u r r e n t C o n d i t i o n s
Chapter 6: Economic Development Background
Key Points
Identification of Key Economic Development Corridors
Current strategies in place to develop or strengthen industry clusters
Exploration of tourism, revenues, and other opportunities
6.1 Economic Development
Every community has a goal to build prosperity. Economic Development is the set of programs and
strategies that aid the development of these different aspects of prosperity and seek to strengthen
them. Pima County, Tucson Regional Economic Opportunities Inc. (TREO) and the state all play key
roles. The differing types of a community’s capital include:
Intellectual capital Incubation facilities for business startups, angel funds, new ideas or labs for
researching should be readily available.
Financial capital “Rainy day funds” are an example of public stewardship of financial capital,
designed to help society weather risks and uncertainties.
Social capital is the stock of trust, relationships, and networks that support civil society. These
connections are facilitated through broadband Access, access to recreation and gathering spaces,
and organized community events.
Individual capital is the stock of skills and physical and mental healthiness of people in a region.
Economic Development

E c o n o m i c D e v e l o p m e n t
B a c k g r o u n d
A6.2 | P a g e A p p e n d i x A : B a c k g r o u n d a n d C u r r e n t C o n d i t i o n s
Natural capital is the stock of unimpaired environmental assets such as the Arizona Sonoran
Desert, its non-renewable resources and renewable resources, as well as climate.
Political capital, is evidenced by the ability of an individual or a group to influence the distribution
of resources, including helping set the agenda of what resources are available1.
TREO Economic Blueprint for the Region
Tucson Regional Economic Opportunities, Inc. was formed in 2005 to be the lead economic
development agency for the region. In early 2007, TREO released Securing Our Future Now: An
Economic Blueprint for the Tucson Region. The Blueprint, as it’s known, combined quantitative analysis
of metro Tucson with focus group conversations, interviews, and surveys. The report highlighted the
region’s strengths and weaknesses in the various areas of wealth, mentioned above, and suggested
concentrating on five areas to develop a more competitive economy: TREO’ s “Power of Five”
1 Wealth Creation in Rural Communities, Funded by the Ford Foundation Revised 9/11
E c o n o m i c D e v e l o p m e n t
B a c k g r o u n d
A6.3 | P a g e A p p e n d i x A : B a c k g r o u n d a n d C u r r e n t C o n d i t i o n s
This blueprint was updated and released by TREO Board of Directors on April 30, 2014. Pima County
funds TREO and has representation on the Board of Directors. That update recommended the following:
Establish one goal for job growth that the region will work towards, 40,000 new jobs over the next
5 years
Concentrate on creating export based jobs
Focus on the military assets such as extending the industries for aerospace and defense
Align education to meet the industry demand for talent and skills
Focus on education to build a talent pipeline
Achieve seamless connectivity to Mexico, Canada and other Southwest Business markets through
infrastructure investment and funding
Focus on entrepreneurship to grow our own industry
Build a Healthy Community with a focus on healthcare industry
Pima County’s Economic Plan
In alignment with the TREO Blueprints, Pima County expanded its role in regional economic
development efforts beyond the existing programs geared to managing workforce training, managing
tourism attractions, and contributing to the funding of TREO. Faced with a regional economic slump as
the impacts of the Great Recession lingered, the Pima County Board of Supervisors adopted a plan from
the County Administrator in January 2012 to address a series of initiatives to spark economic recovery
through the retention and recruitment of industry to the region. The adopted plan forms the
foundation of the policy plan in the comprehensive plan. Most of the initiatives centered on
infrastructure projects to support existing industry, changing the business climate, and a continued
focus on workforce development efforts. The Economic Plan was supplemented with an action plan.
The 2015-2017 action plan will include the following 13 central initiatives:
1. PRIMARY JOB CENTER DEVELOPMENT including: A. Raytheon Buffer; B. Aerospace, Defense and Technology Business and Research Park; C. Sunset Road and Interstate10/River Road development; D. Tech Launch Arizona; E. Biosciences and Biotechnology; F. Redevelopment of Downtown Primary Employment – 97 E. Congress Street and Lot at
Broadway/Scott; and G. Assist Expansion of existing, local Manufacturing Companies.

E c o n o m i c D e v e l o p m e n t
B a c k g r o u n d
A6.4 | P a g e A p p e n d i x A : B a c k g r o u n d a n d C u r r e n t C o n d i t i o n s
2. REGIONAL INFRASTRUCTURE INVESTMENT FOR JOB CREATION including: A. Planning an Interstate 11, Auxiliary Interstate Highway; B. Interstate 10 to Interstate 19; C. State Route 189 - Mariposa to Interstate 19; D. Assisting with Second Parallel Runway at Tucson International Airport; E. Direct Connection to Auxiliary Interstate Highway; F. A Rail/Truck Interface at the Port of Tucson and Aerospace/Defense Park; and G. Regional Collaboration with Other Southern Arizona Employment Centers (Fort Huachuca,
Yuma Air Center, Santa Cruz Produce).
3. PROTECTING OUR EXISTING MAJOR EMPLOYMENT BASE A. Raytheon – Roadway Relocation and Buffer B. Davis-Monthan Air Force Base – P4 Process and Mission C. Arizona Air National Guard – New Entrance and Munitions Handling and Storage Facility D. The University of Arizona – State Funding E. Health Services Industry F. Logistics Industry G. Expand Local Manufacturing, especially advanced technology manufacturing by:
1. Providing Workforce Training Assistance Programs 2. Supporting Business Development Programs 3. Helping to Advertise Local Businesses (or Business Sectors) to Outside Markets 4. Listening to and Constantly Improving Business-Government Interface
4. LOGISTICS CENTER AT TUCSON INTERNATIONAL AIRPORT ENVIRONS
A. Pima County as the Logistics Hub of the Southwest B. Distribution Center Redevelopment – Target Fulfilment Center and Others C. Port of Tucson – Rail/Truck interface D. Air Cargo Capacity at TIA – Increased by New Second Runway E. High Speed Surface Transportation Interstate 10 and Interstate 19 and Connecting New
Interstate Auxiliary Highway F. Mexico Trade Interface - Rail and Trucking, Taking Advantage of Growing Port Capacity in
Guaymas, Mexico
5. LEVERAGING THE INTELLECTUAL CAPACITY OF THE UNIVERSITY OF ARIZONA A. Tech Launch Arizona
1. Wheelhouse Arizona 2. Tech Transfer Arizona 3. Tech Parks Arizona 4. Corporate Relations Arizona
B. Biosciences, Health and Agriculture C. Defense D. Optics, Materials Science, Manufacturing

E c o n o m i c D e v e l o p m e n t
B a c k g r o u n d
A6.5 | P a g e A p p e n d i x A : B a c k g r o u n d a n d C u r r e n t C o n d i t i o n s
6. PROMOTING TOURISM A. Diversify Sports Attractions by
1. Encouraging Professional Soccer as an Emerging Attraction Sport 2. Building Infrastructure to Attract Amateur and Youth Tournaments 3. Updating Kino Stadium and Amateur Baseball Infrastructure
B. Making Cycling a Tourism Destination Event C. Creating New and Expanding Existing Tourism through Public Investment in
1. Regional Visitor and EcoVisitor Center 2. Maintaining and Improving Leased Property Infrastructure 3. Assisting to Improve Other Community Attractions 4. Increased advertising of local community attractions
D. Inbound Medical Tourism
7. MINING – MODERNIZING A TRADITIONAL INDUSTRY A. Support advanced mining technology and resource extraction with minimum impact
footprints B. Reclamation support activities to reclaim mining sites and tailings disposal sites C. Collaborate with mining interests to maximize natural resources conservation D. Maximize renewable water resources for meeting the water supply needs of mining
8. ENHANCING OUR RELATIONSHIP WITH MEXICO
A. Impacting the Cost of Doing Business for Import/Export: Taxation Impact of Maquiladora and Sales Tax, Technical and Engineering Expertise to Support Maquiladora Operations
B. Support Expanded Relationship of Port of Tucson and Other Logistics Sites with Mexico especially Hermosillo, Guaymas and Queretaro
C. Strengthen Rail Service and Customs Capacity at the Border D. Educate Southern Arizona Businesses and Citizens About Cross-border Opportunities and
Making it Easier for Mexico-based Businesses to do Business in Pima County E. Work with Visit Tucson to Increase Tourism to and from Mexico
9. CANADA
A. Expanded Foreign Direct Investment B. Encourage local expansion and addition of subsidiaries from Canadian Owned Companies –
Bombardier, Stantec, Oracle Mining, Hudbay and Fortis Energy. C. Utilize existing Canadian contacts to seek new Canadian Investment in Pima County D. Promote Canadian and other foreign investment in Pima County-Mexico cross border
manufacturing projects E. Work with Visit Tucson to Increase Tourism to and from Canada

E c o n o m i c D e v e l o p m e n t
B a c k g r o u n d
A6.6 | P a g e A p p e n d i x A : B a c k g r o u n d a n d C u r r e n t C o n d i t i o n s
10. SOUTH KOREA A. Renewable energy development
1. Small business development in Pima County 2. Baseball training at Kino Stadium 3. Tourism
11. JOB TRAINING AND WORKFORCE SKILLSET ENHANCEMENT
A. Higher Skills Equal Increased Competitiveness, More Jobs and Increased Earning Power: Provide Matching Fund grants for Internships, Apprenticeships and Incumbent Worker Advanced Education
B. Continue to operate a Workforce Investment Board and One Stop Regional Workforce Development Center to provide Centralized Information, Recruitment and Training Resources to Employers and to be an Access Hub for Federal and State Training Funds
C. Increase Library System Resources for Business and Entrepreneurial Development
12. DOWNTOWN REDEVELOPMENT A. Creating a Regional Art and Cultural Center B. Enhancing the Opportunity for Corporate Headquarters Location C. Expanding the Administrative and Legal Center of the Region
13. INVESTING FOR AN ECONOMICALLY COMPETITIVE FUTURE
A. County General Obligation Bonds B. Solving the Transportation Funding Dilemma

E c o n o m i c D e v e l o p m e n t
B a c k g r o u n d
A6.7 | P a g e A p p e n d i x A : B a c k g r o u n d a n d C u r r e n t C o n d i t i o n s
6.2 Existing Economic Development “Corridors of Opportunity”
Traditionally, the I-10 corridor has also served as an economic development corridor with much of the
industrial base of the region located adjacent to that corridor. This co-location with the interstate has
also lead to congestion and further widening to accommodate not only regionally trade and commerce
but office commuting. Other corridors should be considered to join major employment centers and
satellite supply chain providers. Such corridors could join health care centers and hospitals to
bioscience industry, the ports and warehouses with airports and rail, aerospace and defense industry
with protected corridors for airports, Davis Monthan, and supporting facilities. The Sonoran Corridor
proposes just that to connect aerospace and defense uses and industry along with logistics and trade
facilities. Economic development corridors integrate:
Development Principles;
Transportation Principles;
Land Use Principles;
Economic Principles;
Environmental Principles; and
Social Principles.
The intent of these corridors is to ultimately promote such principles to:
Reduce travel times;
Increase mobility, accessibility and affordability;
Integrate multiple modes of transportation, compact and mixed land uses and job creation;
Strengthen the development of prominent economic activity nodes;
Increase recruitment and retention of major employers within the region;
Enhance community integration, health and walkability through connectivity; and
Protect natural and cultural resources.

E c o n o m i c D e v e l o p m e n t
B a c k g r o u n d
A6.8 | P a g e A p p e n d i x A : B a c k g r o u n d a n d C u r r e n t C o n d i t i o n s
Sun Belt Corridor and What Arizona Wants
The Sun Corridor (roughly the size of Indiana) is the
label for the emerging southwest megapolitan area.
Megapolitan areas are defined as compact, with 2 or
more metropolitan areas 50 or 200 miles apart,
connected by commuting patterns, complex and
bounded by key corridors. Anchored by Phoenix and
Tucson, The Sun Corridor includes approximately
1/5th of Arizona’s land mass but 80% of the
population. Of the approximately 11.2 million acres
within the Sun Corridor, private ownership accounts
for more than a third of the land, roughly twice the
percentage of the entire state.2
Figure 1: The Sun Corridor
The Arizona We Want
The Center for the Future of Arizona (CFA) is leading a long-term project to define a vision of statewide goals and the strategies needed to achieve those goals. A survey showed that Arizonans are highly attached to their community. The Arizona We Want report notes that GDP growth is correlated with high levels of citizen attachment to community. The poll also shows that Arizonans rate their communities’ natural environment highly, but are pessimistic about the availability of job opportunities. As a statewide effort, the Arizona We Want project may be useful for defining a vision that can unify communities throughout the Sun Corridor (Figure 1). Used in combination with the results of Imagine Greater Tucson, this may provide a useful vision for the megapolitan region. 3
2 Megapolitan Arizona’s Sun Corridor, Morrison Institute for Public Policy, May 2008 3 Tucson’s New Prosperity, Capitalizing on the Sun Corridor, Sonoran Institute, July 2010

E c o n o m i c D e v e l o p m e n t
B a c k g r o u n d
A6.9 | P a g e A p p e n d i x A : B a c k g r o u n d a n d C u r r e n t C o n d i t i o n s
Canada, Arizona, Mexico (CANAMEX) Trade Corridor
The Canamex Trade Corridor was established by the
North American Free Trade Agreement (NAFTA) as a
high priority series of highways that will link Mexico
with Canada. The corridor was proposed for use by
railroads, pipelines and fiber optic communications.
The route is depicted below, but a second proposal is
being studied for Interstate 11 following a similar
route, that will replace the non-highway portions of
U.S. 93 and offer an alternate bypass around Phoenix
and Tucson.
Figure 2: CANAMEX Corridor
The alternate route of I-11 is currently the subject of Southern Arizona Stakeholder partners meetings
hosted by the Arizona Department of Transportation (ADOT). Pima County is in support of the proposed
I-11 and has suggested route alternatives.
The US/Mexico Border and Our Binational Economy
Ever since the enactment of NAFTA, bilateral trade has grown exponentially, reaching a record high of
nearly $535 billion in 2012. Mexico is now the third-ranked commercial partner of the U.S. and the
second largest market for U.S. exports. Mexico spent $163 billion on U.S. goods in 2010, and trade with
Mexico sustains six million jobs in the U.S. U.S. sales to Mexico are larger than all U.S. exports to the
BRIC countries (Brazil, Russia, India and China) combined, as well as all combined sales to Great Britain,
France, Belgium and the Netherlands. Twenty-two states count Mexico as their No. 1 or No. 2 export
market, and it is a top-five market for 14 other states. In 2010, Mexico exported more than $4.3 billion

E c o n o m i c D e v e l o p m e n t
B a c k g r o u n d
A6.10 | P a g e A p p e n d i x A : B a c k g r o u n d a n d C u r r e n t C o n d i t i o n s
in vegetables; the U.S. accounted for 90% of this total, becoming Mexico’s largest vegetable export
market.4
In 2010, Mexico invested an unprecedented five percent of its GDP in infrastructure. With 76 seaports
along its 11,000 kilometers of seashore on the Pacific and Atlantic Oceans, 85 airports, 26,700
kilometers of railroad and 366,000 kilometers of road, Mexico is one of the most “interconnected”
countries in the entire hemisphere.
Goldman Sachs research on the Next 11 Emerging Markets estimates that the Mexican economy will
become the world’s fifth largest economy by 2050, putting Mexico ahead of Brazil, Russia and China.
And given its rapidly advancing infrastructure, increasing middle class and rapidly declining poverty
rates, it is expected to have a higher GDP per capita than all but three European countries by 2050.
The resolution in July of a long dispute has allowed Mexican trucks to make deliveries in America. Once
in place, the U.S. – Mexico cross-border trucking program is projected to produce savings of up to $675
million annually for binational trading costs, according to the Mexican federal government. The
automotive, electronics and aeronautic industries, among others, are examples of the highly integrated
supply chains between U.S. and Mexican industries that have successfully faced global competition.
Supply chains are critical to businesses’ underlying value, growth potential, and economic
competitiveness.
A major challenge to supply chain economics is border delays, security concerns, and infrastructure
constraints. These issues create an environment of uncertainty in the business community, which deters
investment, job creation and economic prosperity.
In May of 2010 the U.S. and Mexico signed the 21st Century Border Management Joint Declaration.
Recognizing the importance of fostering the commercial relationship, both countries have agreed to
coordinate efforts to enhance the economic competitiveness by expediting lawful trade. Today more
than 75,000 trucks (carrying close to 80 % of our two-way trade) cross the border on a daily basis. 5
4 Realizing the Strategic National Value of our Trade, Tourism and Ports of Entry with Mexico, New Policy
Institute, May 2013 5 Realizing the Strategic National Value of our Trade, Tourism and Ports of Entry with Mexico, New Policy
Institute, May 2013

E c o n o m i c D e v e l o p m e n t
B a c k g r o u n d
A6.11 | P a g e A p p e n d i x A : B a c k g r o u n d a n d C u r r e n t C o n d i t i o n s
The Tucson Tech Corridor
The Tucson Tech Corridor is cluster of industrial zoned or commercial properties (many shovel ready)
located along Interstate 10 and is anchored by landowners and developments that are among the
region’s leaders in economic development and real estate development (Figure 4). Partners involved in
this project include Diamond Ventures, University of Arizona Science & Tech Park, Ashland Group, and
Port of Tucson located at Kolb and Valencia adjacent to I-10 and the Union Pacific Railroad.6
Figure 4: Tucson Tech Corridor from TTC Website
6 Information and map from http://tucsontechnologycorridor.com/vision.html
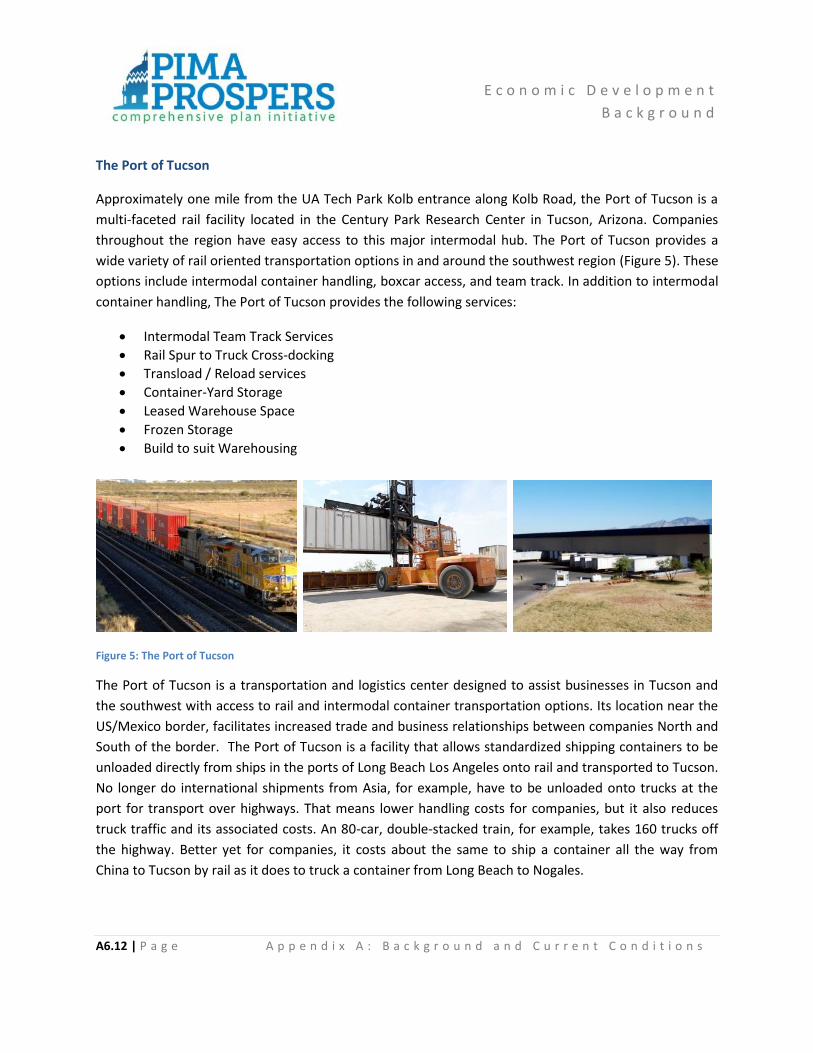
E c o n o m i c D e v e l o p m e n t
B a c k g r o u n d
A6.12 | P a g e A p p e n d i x A : B a c k g r o u n d a n d C u r r e n t C o n d i t i o n s
The Port of Tucson
Approximately one mile from the UA Tech Park Kolb entrance along Kolb Road, the Port of Tucson is a
multi-faceted rail facility located in the Century Park Research Center in Tucson, Arizona. Companies
throughout the region have easy access to this major intermodal hub. The Port of Tucson provides a
wide variety of rail oriented transportation options in and around the southwest region (Figure 5). These
options include intermodal container handling, boxcar access, and team track. In addition to intermodal
container handling, The Port of Tucson provides the following services:
Intermodal Team Track Services
Rail Spur to Truck Cross-docking
Transload / Reload services
Container-Yard Storage
Leased Warehouse Space
Frozen Storage
Build to suit Warehousing
Figure 5: The Port of Tucson
The Port of Tucson is a transportation and logistics center designed to assist businesses in Tucson and
the southwest with access to rail and intermodal container transportation options. Its location near the
US/Mexico border, facilitates increased trade and business relationships between companies North and
South of the border. The Port of Tucson is a facility that allows standardized shipping containers to be
unloaded directly from ships in the ports of Long Beach Los Angeles onto rail and transported to Tucson.
No longer do international shipments from Asia, for example, have to be unloaded onto trucks at the
port for transport over highways. That means lower handling costs for companies, but it also reduces
truck traffic and its associated costs. An 80-car, double-stacked train, for example, takes 160 trucks off
the highway. Better yet for companies, it costs about the same to ship a container all the way from
China to Tucson by rail as it does to truck a container from Long Beach to Nogales.

E c o n o m i c D e v e l o p m e n t
B a c k g r o u n d
A6.13 | P a g e A p p e n d i x A : B a c k g r o u n d a n d C u r r e n t C o n d i t i o n s
The Port of Tucson's rail access consists of a two mile siding complimented by an additional 3,000 foot
siding. The 3,000 foot siding branches to grade level access, dock level access, intermodal container
access, and team track facilities. The rail service has been designed with expansion in mind. Rail access
to additional properties and warehouse space can be facilitated with ease. Recently, the Port of Tucson
has received a $5 million federal grant to build an intermodal ramp that will allow the facility to handle
increased international cargo.
The Century Park Research Center is also registered as a Foreign Trade Zone (FTZ 174, site 2), which
allows the facility to ship and receive product in bond. Foreign Trade Zone transportation and storage
can equate to savings on products or materials being imported.
The Port of Tucson and Pima County
The federal government awarded Pima County and The Port of Tucson a $5 million grant that will
enhance businesses’ direct rail access to West and Gulf Coast ports and help position this region as a
major transportation hub. Of nearly 600 applications, fewer than 10 percent were selected for funding
through the TIGER 2013 grant program.
Pima County has 140 miles of opportunity in the Sun Corridor, which stretches from Pima County to
Maricopa County and will have 85 percent of the state’s population and 90 percent of the jobs. The Port,
which already receives boxcars of Mexican beer and trainloads of pipelines, military equipment and
other commercial shipments, opens global markets for manufacturers and exporters and is one more
way for the region’s businesses to ship to customers efficiently and at competitive rates.
The grant will speed up train transfers. Currently, trains entering the Port have to practically slow to a
stop, causing delays for other trains and for motorists who have to wait for the cars to pass. The grant
will allow for the equivalent of an “off-ramp” that will eliminate the need to slow and stop arriving
trains.
Pima County has invested more than $168 million in transportation improvements in the southern
corridor of the community, as part of Pima County’s vision to link the major employment centers on the
south side. The development of the Port facility will require 40 heavy construction workers and the
completed project should provide jobs for 100 logistic workers when the facility is fully operational.
More importantly, the facility will serve as a catalyst for the development of additional jobs throughout
the region, including in local warehouses and distribution centers.
E c o n o m i c D e v e l o p m e n t
B a c k g r o u n d
A6.14 | P a g e A p p e n d i x A : B a c k g r o u n d a n d C u r r e n t C o n d i t i o n s
The Bio Industry Corridor
Tucson and Southern Arizona are home to an emerging biotechnology industry sector particularly
focused on medical devices, diagnostics and pharmaceutical development. The Tucson region is home to
two of the world’s largest pharmaceutical companies: Roche and Sanofi-Aventis. There are also several
leading institutes and organizations including the Critical Paths Institute (C-PATh) – a joint collaboration
between the University of Arizona and the Food and Drug Administration and several emerging biotech
companies. Pima County helped foster this industry by putting forth an innovative package to attract a
budding bioscience firm to the region. Pima County lacks vacant wet lab space, so the county utilized
vacant medical space to construct then lease wet lab space at the Abrams Health Building August 2012.
The wet lab space is the temporary home for Accelerate while Accelerate builds a permanent location
and launches its bio- diagnostic product. After they move out, the wet lab space will be available for
another company to locate to the region. The region’s lack of wet lab space puts it at a disadvantage in
competing with other areas in the county. The addition of Accelerate Diagnostics opening a lab at the
Abrams Building, created a corridor in alignment with the U of A Bioscience Park.
The Arizona Bioscience Park
The Arizona Bioscience Park encompasses 65-acres of land in central Tucson. It is located adjacent to
some of Tucson’s most historic and multi-cultural neighborhoods. The eastern boundary of the Bio Park
is situated along Kino Parkway, one of the major north/south transportation corridors in Tucson. The
northern boundary of the Park is located along 36th Street across from the Quincey Douglas Library
Neighborhood Center and Silverlake Park.
Regionally, the Bio Park is strategically located 2.5 miles from the University of Arizona Main Campus, 4
miles from Tucson International Airport and 3 miles from downtown Tucson. The UA Bio Park is located
within a five mile radius of 40 biotech companies and organizations, including three major research
hospitals: University of Arizona Medical Center, University of Arizona Medical Center South Campus and
Southern Arizona VA Health Care System.

E c o n o m i c D e v e l o p m e n t
B a c k g r o u n d
A6.15 | P a g e A p p e n d i x A : B a c k g r o u n d a n d C u r r e n t C o n d i t i o n s
The Aerospace Defense Corridor
2013 study by the International Trade Administration, WorldTradeStatistics.com revealed that Arizona's
aerospace & defense total exports rose by more than 18% from 2011 to 2012, reaching a $2.87 billion
total. The increase was primarily due to a near $400 million increase in aircraft, engines and parts
exports. According to a 2012 Deloitte study, Arizona ranks fourth nationwide in aerospace industry
payroll and fourth in aerospace revenue at $14.99 billion. More than 1,200 Arizona-based companies
make this state America's third largest supply chain contributor for aerospace & defense.7
TTechAmerica's 2013 Cyberstates Report ranks Arizona fourth nationwide for jobs in the space
and defense systems manufacturing industry, employing more than 8,700 people. A 2012 report
by Brooking Metropolitan Policy noted that Tucson ranks fourth in the nation for the total
percentage of manufacturing workforce dedicated to high-tech work, with more than 51% of it
related to aerospace & defense. Four major research institutions in Arizona have been provided
the NASA Space Grant: Arizona State University, Embry Riddle University (home of the nation's
highest ranked aerospace engineering program among non-doctoral program schools, according
to U.S. News & World Report), Northern Arizona University and the University of Arizona. 8Among the companies taking advantage of Arizona's favorable aerospace & defense climate
are:
Raytheon
Honeywell
General Dynamics C4 Systems
The Boeing Company
Northrop Grumman
Orbital Sciences
United Technologies – includes Goodrich, Hamilton Sundstrand
L3 Communications
Standard Aero (MRO)
Bombardier
Nammo Talley
7 Arizona Commerce Authority Aerospace Industry http://www.azcommerce.com/industries/aerospace-defense 8 Ibid.
E c o n o m i c D e v e l o p m e n t
B a c k g r o u n d
A6.16 | P a g e A p p e n d i x A : B a c k g r o u n d a n d C u r r e n t C o n d i t i o n s
Arizona's A&D supply chain includes more than 1,200 small, medium and large-scale, world-renowned
companies that contribute almost $15 billion annually to the economy and are responsible for more
than 150,000 jobs. Numbers reflecting Arizona's long-standing history and success in aerospace and
defense.9
The Pima County Board of Supervisors authorized in June 2013 a contract to begin the design for a new
road realignment near Raytheon Missile Systems that will help protect jobs at our region’s largest
private employer, while allowing for possible future expansion. The contract is a $1.7 million planning
and design contract to start the process of realigning Hughes Access Road. Ultimately, the $8 million
project will relocate Hughes Access Road from Nogales Highway to Alvernon Way. (Figure 6)
Relocating a roughly four-mile segment of the existing road approximately 2,500 feet to the south has
several benefits that will help address two ongoing concerns: a lack of buffer space for Raytheon
operations and an inability to expand. It will also accommodate the addition of a second runway for
Tucson Airport Authority expansion further north. (Figure 6)
Pima County in 2012 purchased nearly 400 acres south of the Raytheon facility to help address urban
encroachment. Moving the road alignment helps address the issue of high volume of public traffic close
to Raytheon’s operation, while providing Raytheon additional flexibility to preserve or expand their
programs in the future. (Figure 6)
The project will improve access throughout the general area and serve as the backbone for a new, 10-
mile aerospace and defense parkway, while allowing for compatible development in a new potential
aerospace and defense research and business park. Although a final route is not designed, it is proposed
to link to I-19 to the West in possible alignment with a I-11 route and to I-10 to the east to further
connect the interstate system and provide commerce and trucking routes.
9 http://www.azcommerce.com/industries/aerospace-defense/industry-impact

E c o n o m i c D e v e l o p m e n t
B a c k g r o u n d
A6.17 | P a g e A p p e n d i x A : B a c k g r o u n d a n d C u r r e n t C o n d i t i o n s
Aerospace and Defense Corridor Economic Development Initiative Planning and Implementation Action Plan
The Tucson International Airport (TIA) environs have been the major aerospace, defense and manufacturing job center in our region for decades. Presently, in the TIA environs and The University of Arizona Science and Technology Park, which is 10 miles east of TIA, there are 40,000 high technology/high wage jobs in aerospace, defense, manufacturing, scientific research and logistics.
Public infrastructure investment to support these job centers is nothing new. In 1980, transportation improvements known as the Kino/Campbell Corridor, Kolb Corridor and Palo Verde Corridor were initiated and completed, totaling over $168.1 million of investment. These infrastructure investments substantially improved mobility between and among these job centers and the urban population of greater Tucson.
In 2010, the vulnerability of growing and sustaining these job centers was demonstrated when Raytheon chose to locate a component of their production and assembly facilities in Huntsville, Alabama in a new facility being constructed at Redstone Arsenal. Tucson could not compete for this line of business due to critical constraints on the Tucson manufacturing and production facilities of Raytheon.
From this lost opportunity for future jobs came the realization that our region needs to do a much better job of protecting the existing employment base and fostering an environment where existing private employers can grow and expand without constraint or restriction. After over a year of public review, a cornerstone of the newly adopted economic strategy of Pima County is to take steps necessary to provide a coordinated master planned approach that will allow for expansion of that base in place or within our region.
The primary objective of the Aerospace and Defense Corridor Economic Development Initiative is to retain and grow new high-technology aerospace and defense jobs in the vicinity of TIA and to encourage significant science and technology-based job growth in the Tucson Technology Corridor, including The University of Arizona Science and Technology Park.
Concentrating economic development planning on this corridor takes advantage of significant amounts of open space to avoid traditional conflicts between industrial and residential uses, incorporates existing assets such as The University of Arizona Science and Technology Park, Port of Tucson and TIA, and offers maximum benefit from a master planned approach. Also, there are complementary employers with diverse labor and material demands to attract supply chain growth and related or complementary industrial users. The Aerospace and Defense Corridor is a strategic investment that can be made at this time to retain the existing employment base, as well as provide the greatest opportunity for employment base expansion. Today, these regional job centers are not efficiently interconnected by surface transportation or the technology necessary for complementary growth.
Likewise, concentrating significant public infrastructure investments within this existing and future job corridor would appear to be a sound economic development strategy. Focusing our economic development efforts on the Aerospace and Defense Corridor will allow this region to achieve multiple economic development objectives, job protection and creation, and other community objectives.

E c o n o m i c D e v e l o p m e n t
B a c k g r o u n d
A6.18 | P a g e A p p e n d i x A : B a c k g r o u n d a n d C u r r e n t C o n d i t i o n s
Figure 6: Proposed Aerospace and Defense Corridor Road Alignments

E c o n o m i c D e v e l o p m e n t
B a c k g r o u n d
A6.19 | P a g e A p p e n d i x A : B a c k g r o u n d a n d C u r r e n t C o n d i t i o n s
Figure 7: Aerospace Defense Parkway Plan and Research and Business Park

E c o n o m i c D e v e l o p m e n t
B a c k g r o u n d
A6.20 | P a g e A p p e n d i x A : B a c k g r o u n d a n d C u r r e n t C o n d i t i o n s
The Tucson Modern Streetcar It is not often that one major infrastructure improvement can have a dramatic impact on major retail
and housing activity and job centers, but the Tucson Modern Streetcar will do just that leaving
opportunity for housing and development along its path.
The 3.9-mile streetcar route will connect major activity centers in the City of Tucson: The University of
Arizona, Arizona Health Sciences Center, University Main Gate Business District, 4th Avenue Business
District, Congress Avenue Shopping and Entertainment District, and the Mercado District. By connecting
these neighborhoods and key employers, it has revitalized the downtown. This key public investment
has led to further private investment critical to downtown renaissance and attracting the younger
creative class workforce. Although located in the City, Pima County owns substantial amounts of real
estate along the route and aid in the development and connectivity of the streetcar through
redevelopment of its properties. A vital downtown was
The Sun Link project has already triggered transit oriented development - new retail, office and
residential development and redevelopment along the streetcar corridor. To date, more than $800
million has been invested by the private sector. Fifty new restaurants, bars and cafes, some 1500 new
student housing apartments plus 58 new retail businesses have popped up along the route over the past
two years, and there are mixed-use housing developments in the works. Additionally, there has been
significant corporate business expansion within the Sun Link route: a new headquarters for UniSource
Energy, with 400+ plus employees, and Providence Service Corporation, both publicly traded companies.
More development is planned for the downtown area connecting to the university.
Figure 8: Tucson Modern Street Car Route and Character Areas

E c o n o m i c D e v e l o p m e n t
B a c k g r o u n d
A6.21 | P a g e A p p e n d i x A : B a c k g r o u n d a n d C u r r e n t C o n d i t i o n s
6.3 Existing Major Employment Centers
Davis-Monthan Air Force Base
Davis-Monthan Air Force Base (D-M AFB) is a key component of the Air Combat Command installation
system of the United States Air Force. The base is staffed by 7,700 military and civilian personnel and is
home to approximately 5,000 aircraft. The 355th Fighter Wing is the host unit at Davis-Monthan Air
Force Base, however, other units also call D-M home. Twelfth Air Force, the 563rd Rescue Group and
The Aerospace Maintenance and Regeneration Group (AMARG) are all based out of D-M. The 162nd
Fighter Wing Operation Snowbird detachment's mission, is to provide support for U.S. military flying
units and allied partners deployed for training. It is housed at the base.
It is a major contributor to the economic well-being of Southern Arizona. The Air National Guard is the
region’s 37th largest employer, generating more than $280 million in annual economic benefit. Davis-
Monthan, meanwhile, is the third largest public employer in the region, contributing $1.1 billion a year
to the local economy. According to D-M's Fiscal Year 2012 Economic Impact Analysis, released in April
26, 2013 D-M and military retirees circulated approximately $1.6 billion and helped create more than
4,600 jobs in the local area.10
D-M lies to the northwest of the UA Tech Park. The base
operates and maintains 519 buildings, encompassing
4,409,801 square feet of space. D-M's footprint includes 6,011
acres of government-owned land and 4,578 acres of
easement, rights-of-way and leased land, totaling 10,589
acres.
Figure 9: Davis Monthan Air Force Base
Residential neighborhoods lie northwest of D-M. Recognizing that encroachment around the air base
may endanger future missions, Pima County has authorized and spent $10 million to purchase
properties in the Davis-Monthan Air Force Base Departure Corridor, to ensure the long-term viability of
the region’s third-largest employer. The County placed a priority on lands under the primary flight paths
to help prevent encroachment of inappropriate land uses upon the base.
10 FY12 Davis-Monthan Air Force Base Economic Impact on Tucson

E c o n o m i c D e v e l o p m e n t
B a c k g r o u n d
A6.22 | P a g e A p p e n d i x A : B a c k g r o u n d a n d C u r r e n t C o n d i t i o n s
The University of Arizona
Leveraging the intellectual capacity of the University of Arizona (UA) as a major economic development
strategy is a large part of Pima County’s Economic Development Plan. With a total of 10,846 employs in
2013, The University is ranked among the top 20 public research universities nationwide. The UA
generates more than $625 million in research. Together, the University of Arizona, the UA Tech Park and
UA Health Network infuse billions of dollars into the state economy each year. The University system
reaches every Arizona county and five tribal reservations, supporting one out of every 93 jobs in the
state.11 The Main campus encompasses 387 acres in central Tucson.
UA not only serves as a learning and research institution but also as an economic development catalyst
for new technologies, science and business startups. The UA has three Communities of Innovation -- the
Arizona Center for Innovation, the UA Tech Park, and the UA Bio Park – that contribute significantly to
the economic expansion of the community with the following goals:
Attract new businesses
Grow established businesses
Launch new companies
Commercialize new technologies
Create high-paying, clean jobs
11 University of Arizona website, About the University

E c o n o m i c D e v e l o p m e n t
B a c k g r o u n d
A6.23 | P a g e A p p e n d i x A : B a c k g r o u n d a n d C u r r e n t C o n d i t i o n s
The UA Tech Park
Annually, the UA Tech Park generates an economic impact of over $3 billion in Pima County. The UA
Tech Park is home to 40 tenant companies that employed 7,570 people in 2013. In total, the UA Tech
Park created 14,803 jobs in the regional economy. The average annual salary for UA Tech Park
employees was $85,515, compared to the Pima County average of $39,973. In total, an estimated $77.9
million in tax revenues distributed to state, county and city governments. The UA Tech Park generated a
total impact of $3.02 billion in Pima County.12
Raytheon Missile Systems
Raytheon is a unique technology company and a world leader in defense electronics, with a broad range
of products, service and capabilities. The proud legacies of Raytheon, E-Systems, Texas Instruments
Defense, Hughes Aircraft and others have come together to form one company with one vision: to be
the most admired defense and aerospace systems company through our world-class people, innovation
and technology. The largest private employer in Southeastern Arizona, Raytheon employed 10,300
people in 2013.
12 UA Tech Park website: Economic Impact
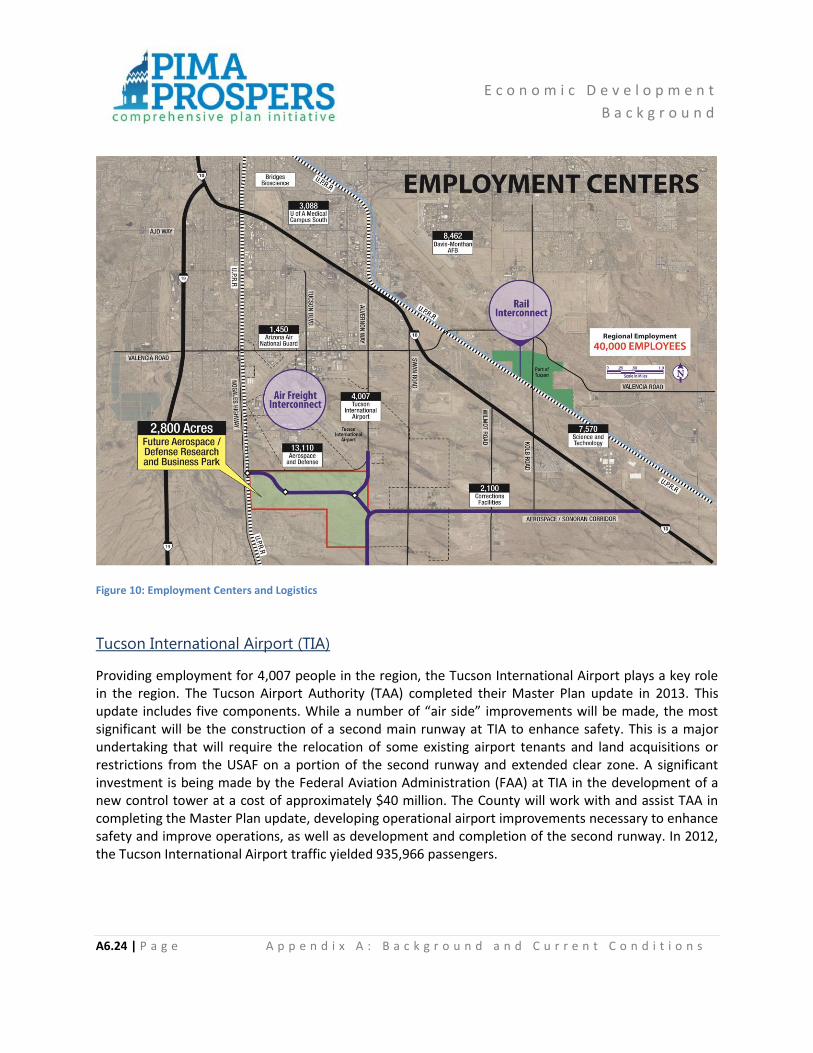
E c o n o m i c D e v e l o p m e n t
B a c k g r o u n d
A6.24 | P a g e A p p e n d i x A : B a c k g r o u n d a n d C u r r e n t C o n d i t i o n s
Figure 10: Employment Centers and Logistics
Tucson International Airport (TIA)
Providing employment for 4,007 people in the region, the Tucson International Airport plays a key role in the region. The Tucson Airport Authority (TAA) completed their Master Plan update in 2013. This update includes five components. While a number of “air side” improvements will be made, the most significant will be the construction of a second main runway at TIA to enhance safety. This is a major undertaking that will require the relocation of some existing airport tenants and land acquisitions or restrictions from the USAF on a portion of the second runway and extended clear zone. A significant investment is being made by the Federal Aviation Administration (FAA) at TIA in the development of a new control tower at a cost of approximately $40 million. The County will work with and assist TAA in completing the Master Plan update, developing operational airport improvements necessary to enhance safety and improve operations, as well as development and completion of the second runway. In 2012, the Tucson International Airport traffic yielded 935,966 passengers.

E c o n o m i c D e v e l o p m e n t
B a c k g r o u n d
A6.25 | P a g e A p p e n d i x A : B a c k g r o u n d a n d C u r r e n t C o n d i t i o n s
6.4 Strengthening Economic Development Corridors and
Employment Centers
The major emerging economic development corridors from multistate to regional include:
The Canamex Corridor connecting trade from Mexico to Canada, this also includes discussion of
a new interstate highway connecting Las Vegas to the border. ADOT is leading the study of
routes with Mexican officials and the other states. A study group has formed here in southern
Arizona and Pima County has proposed a suggested route to mitigate environmental and
residential disruption. Residents in Avra Valley, one of the potential routes, have voiced strong
opinions.
The Sun Corridor connecting inter related routes and communities within Arizona stretching
from Sierra Vista to Prescott. This consists of series of the transportation networks and
solutions to transport goods. The market and job centers overlap in this corridor so united it
can share resources, build capacity and transport its people.
The Aerospace and Defense Corridor that connects defense related industries and land around
the airports and will help connect I-19 and I-10 for trade and buffer from DMAFB, Raytheon, and
TIA. This corridor will serve to attract additional industry as well as provide critical infrastructure
to connect I-19 in the south and provide traffic alternatives to access to the east. It will buffer
TIA and Raytheon from domestic traffic.
The Tucson Tech corridor that connects the U of A tech park with interrelated commercial and
industrial lands and routes along I-10 includes rail access at the Port of Tucson. This corridor
connects to Texas on the east and ports on the shores of California for Asian trade
opportunities.
Many districts exist in the form of Educational Districts (University of Arizona), Medical Districts
(emerging Southern BioScience and medical campuses), Solar Districts, and Corrections District
(at the end of Wilmot south.) These districts become major employment centers with
associated offices, housing (senior) or workforce housing, or research or distribution facilities.
E c o n o m i c D e v e l o p m e n t
B a c k g r o u n d
A6.26 | P a g e A p p e n d i x A : B a c k g r o u n d a n d C u r r e n t C o n d i t i o n s
Economic Development Programs in the Region
Economic development programs in the region include:
State of Arizona
The State of Arizona is primarily responsible through legislative adopted initiatives to give tax credits, tax
waivers, grants, and loans funded by the state. Almost all financial incentives flow through the recently
formed new Arizona Commerce Authority (ACA). The ACA is an economic development organization
committed to attracting and retaining industry and to creating quality jobs for Arizona and its citizens.
The authority is a partnership of public and private-sector individuals. In early 2011, the governor
signed into law the Arizona Competitiveness Package, making Arizona more competitive on the global
business landscape with loans, tax incentives and closing funds.
City of Tucson
As the largest city within Pima County, Tucson plays a vital role in the region’s economic development.
Under its Economic Development department the city offers a package of 21 incentives that are
categorized by the city as Development Services Programs, Financial Incentives, Loan Programs,
Business Assistance and Incentive Districts. Most of the incentives are broadly available to businesses
based on the type of business operation or its geographic location. Tucson provides critical
infrastructure for the region’s economic development including being the largest water provider.
Tucson, like Pima County, actively supports tourism, international trade and other key areas of
economic development.
Town of Oro Valley
The town has no specific incentive programs but does offer an Economic Development Zone at Oro
Valley’s Innovation Park. Essentially an overlay district that was created in October 2012, the EEZ offers
streamlined development review to companies developing or expanding in Innovation Park. The process
consists of exemption from the town’s conceptual design, architecture and conceptual public art plan
approval processes. The town’s planning and zoning administrator assures compliance with the town
code in order to speed the development approval process. Oro Valley’s innovation Park is a critical bio-
medical hub and the town is actively attempting to develop more high-tech industry.
E c o n o m i c D e v e l o p m e n t
B a c k g r o u n d
A6.27 | P a g e A p p e n d i x A : B a c k g r o u n d a n d C u r r e n t C o n d i t i o n s
Town of Marana
Marana’s incentives are part of its larger economic development strategic plan known as the “Economic
Development Roadmap.” The town offers internal incentives which include the Marana Job Creation
Incentive Program (MJCIP) and the Expedited Development Review Incentive (EDRIP). The MJCIP
incentive reallocates construction sales for new construction, expansion or renovation by non-retail
companies who locate or expand within the town boundaries. The Expedited Development Review
Incentive Program provides qualifying companies expedited review of development plans through the
town’s development services department. Marana’s location along Interstate 10 and the Union Pacific
rail lines has made logistics and manufacturing priorities in the town’s economic development strategy.
Town of Sahuarita
The Town of Sahuarita’s economic development department works closely with the Green Valley-
Sahuarita Chamber of Commerce on issues of business expansion and retention. Sahuarita does not
offer any incentives of its own. The town is geographically positioned near Interstate 19 and Pima
County’s planned Sonoran Corridor, and views Mexico trade, logistics and the manufacturing established
in southern Tucson as economic development drivers.
City of South Tucson
The City of South Tucson does not have an economic development department and does not offer any
incentives. A 2009 Economic Development plan for the city notes that South Tucson is within the Pima
County Foreign Trade Zone administered by TREO. The city has begun looking at developing a business
park in order to diversify its primarily retail economy.
Other Economic Development Programs and/or Incentives in the Region
Besides the package of assistance programs that the ACA offers from the state, Pima County has
experience with the following:
Foreign Trade Zones
Foreign Trade Zone designation is considered if requested by an industry. However this is usually in consultation with the school district so that no revenue is lost to that district. The Port of Tucson is registered as a Foreign Trade Zone (FTZ 174, site 2), which allows the facility to ship and receive product in bond. Foreign Trade Zone transportation and storage can equate to savings on products or materials being imported.

E c o n o m i c D e v e l o p m e n t
B a c k g r o u n d
A6.28 | P a g e A p p e n d i x A : B a c k g r o u n d a n d C u r r e n t C o n d i t i o n s
Shovel Ready and Infrastructure Programs
Designed to build roads or critical infrastructure to facilitate the expansion or attraction of industry. Open Space Programs
Programs designed to buffer from uses that would conflict with the industry. Mitigation Programs
Such as noise mitigation meant to mitigate sound issues and help the community adjust to changes in
industry focus.
Workforce Training Programs
Tax credits are offered to assist training and the hiring of employees. Matching of job skills with job
training to prepare the workforce for emerging new industry and skills.
Business Climate Assistance Programs:
Business One Stop program that will assist employers with business startup, grants, permits, approvals,
and guidance on community resources.

E c o n o m i c D e v e l o p m e n t
B a c k g r o u n d
A6.29 | P a g e A p p e n d i x A : B a c k g r o u n d a n d C u r r e n t C o n d i t i o n s
TABLE 6.4.a: Economic Development Programs, Mechanisms and Strategies Currently Available at the County to Secure its Long Range Vision
for Major Economic Development Corridors
Major Corridor Existing Economic Development Programs, Mechanisms and Strategies
Aerospace and Defense Corridor
Infrastructure: Relocate Hughes Access Road. Initiate planning for the relocation of Hughes Access Road, Anticipated construction costs of $8 million are to be shared equally by the City of Tucson and Pima County.
Buffer and Protect Raytheon and provide for TIA expansion. This relocation will provide maximum protection for Raytheon Missile Systems and allow for possible Raytheon expansion, as well as facilitate long-term development of the Tucson Airport Authority’s plans for job expansion and economic development.
Provide Open Space to Support Davis-Monthan Air Force Base and the 162nd Fighter Wing of the Arizona Air National Guard. Take those actions necessary to support the military functionality of Davis-Monthan Air Force Base and the 162nd Fighter Wing of the Arizona Air National Guard by supporting their growth and expansion, as well as new military missions that may be assigned, including continued voter-authorized bond investments of $10 million to protect the Davis-Monthan Departure Corridor.
Mitigate Impacts: .Help Abate Aircraft Noise. Implement a new aircraft noise abatement program for Davis-Monthan Air Force Base and Tucson International Airport with an investment of $20 million in voter-approved bond funding.
Plan the Aerospace/Defense Research and Business Park. Allocate $100,000 from the Board Contingency Fund to advance planning for an approximately 2,800-acre Aerospace/Defense Research and Business Park in partnership with the Tucson Airport Authority, Pima County and the City of Tucson.
The Tucson Tech Corridor Infrastructure: Support the UA Tech Park. Support the Tucson Tech Corridor and the UA Science and Technology Park by allocating as much as $10 million for public infrastructure to help make the UA Science and Technology Park “shovel ready” for new technology employers.
Fund the Aerospace Parkway and Alvernon Way Improvements. Allocate up to $90 million in general obligation bonds to be approved by the voters for completion of the aerospace parkway linking the job centers at Tucson International Airport with the Tucson Tech Corridor and the UA Science and Technology Park.
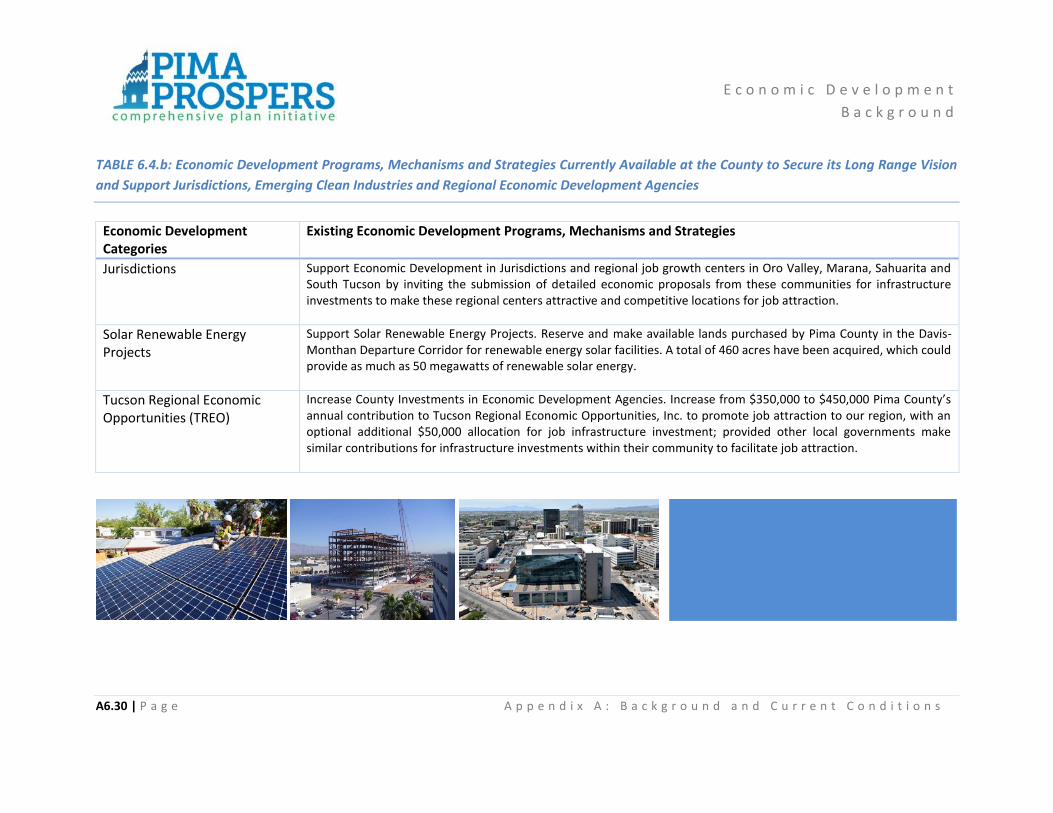
E c o n o m i c D e v e l o p m e n t
B a c k g r o u n d
A6.30 | P a g e A p p e n d i x A : B a c k g r o u n d a n d C u r r e n t C o n d i t i o n s
TABLE 6.4.b: Economic Development Programs, Mechanisms and Strategies Currently Available at the County to Secure its Long Range Vision
and Support Jurisdictions, Emerging Clean Industries and Regional Economic Development Agencies
Economic Development Categories
Existing Economic Development Programs, Mechanisms and Strategies
Jurisdictions Support Economic Development in Jurisdictions and regional job growth centers in Oro Valley, Marana, Sahuarita and South Tucson by inviting the submission of detailed economic proposals from these communities for infrastructure investments to make these regional centers attractive and competitive locations for job attraction.
Solar Renewable Energy Projects
Support Solar Renewable Energy Projects. Reserve and make available lands purchased by Pima County in the Davis-Monthan Departure Corridor for renewable energy solar facilities. A total of 460 acres have been acquired, which could provide as much as 50 megawatts of renewable solar energy.
Tucson Regional Economic Opportunities (TREO)
Increase County Investments in Economic Development Agencies. Increase from $350,000 to $450,000 Pima County’s annual contribution to Tucson Regional Economic Opportunities, Inc. to promote job attraction to our region, with an optional additional $50,000 allocation for job infrastructure investment; provided other local governments make similar contributions for infrastructure investments within their community to facilitate job attraction.

E c o n o m i c D e v e l o p m e n t
B a c k g r o u n d
A6.31 | P a g e A p p e n d i x A : B a c k g r o u n d a n d C u r r e n t C o n d i t i o n s
County Economic Development Partnerships with Major Industry/Employers
Aerospace and Defense
There are currently between 20,000 and 30,000 people employed in the Aerospace industry in southern
Arizona. Tucson is ranked one of the top 5 areas in the U.S for this industry. Tucson is 8.35 more
concentrated in the aerospace product and parts manufacturing industry than the average of all
metropolitan statistical areas across the country.
Pima County provides assistance to Raytheon, one of the largest employers in Pima County and
surrounding areas, in order to bring further economic growth, foster expansion, and protect jobs.
Through open space purchases and road relocation, Pima County will not only partner with business to
facilitate infrastructure but also help meet their training needs and workforce development.
University of Arizona
Ranked among the top 20 public research facilities in the nation, the University of Arizona is one of the
largest public sector employers in the region. Employing Nobel and Pulitzer Prize winners, the UA
generates more than $600 million in research and partners with businesses to help ensure innovative
ideas come to fruition. Leveraging the intellectual assets of this community is key to fostering the clean,
high-quality jobs Pima County wants to attract and build. Capitalizing on the Intellectual Assets of The
University of Arizona is a central component of the current County economic development strategy.
1. Physician training: The University of Arizona Medical Center - South Campus University of
Arizona not only provides lifesaving treatment in a medically-underserved area of the
community, but also serves as a teaching medical campus, creating a qualified physician pool in
the region.
2. Community medicine: County bond dollars are helping fund the development of a Family and
Community Medicine facility and laboratories at the South Campus.
E c o n o m i c D e v e l o p m e n t
B a c k g r o u n d
A6.32 | P a g e A p p e n d i x A : B a c k g r o u n d a n d C u r r e n t C o n d i t i o n s
3. Behavioral Health: A unique partnership between several public and private organizations,
including Pima County and the University of Arizona, led to the development of two new
University of Arizona behavioral health facilities integrated into the South Campus. The Crisis
Response Center provides triage for people in crisis and directs them to appropriate care, while
the Behavioral Health Pavillion provides inpatient, outpatient, and emergency medical and
behavioral health services.
Public/Private Partnerships
Pima County taps into a diverse pool of talent, perspectives and financial resources to foster strong
programs and initiatives that will weather tough economic times and provide quality service for the local
community.
1. Tucson Medical Center: With 3,000 employees, the nonprofit TMC is Southern Arizona’s largest
community hospital and an important economic leader. The County partnered with TMC to
bring back more than $10 million in federal matching dollars to help bolster physician training
efforts and to help the hospital recoup skyrocketing costs of charity care.
2. Pima Community College: The County, through its One-Stop Career Centers, partners with the
college on medical job training efforts.
3. YMCA of Southern Arizona: The County has entered into a novel program with this provider of
recreational and wellness services. By providing the land, equipment and facilities, it allows the
YMCA to do what it does best: The direct delivery of services.
4. Indoor Sports Center: Pima County teamed up with Southern Arizona Community Sports to
construct a 40,000 square foot facility that will provide young adults more opportunities to
experience team sports, with the capacity for five basketball and eight volleyball courts.

E c o n o m i c D e v e l o p m e n t
B a c k g r o u n d
A6.33 | P a g e A p p e n d i x A : B a c k g r o u n d a n d C u r r e n t C o n d i t i o n s
TABLE 6.4.b: Other Employers by Industry Type
Other Employers Industry Type Location
Innovation Park Start-ups, incubators, medical and Research and Development (R&D)
Town of Oro Valley
Tucson International Airport Tucson International Airport and Ryan Airfield. TIA is a full commercial service airport serving the Tucson metropolitan area, southern Arizona, and northern Sonora, Mexico. Ryan Airfield serves as a general aviation reliever airport for TIA and is a popular recreation field for transient pilots
City of Tucson
Catalina Foothills Resort District
Includes holistic healing destinations such as Miraval and Canyon Ranch and tourism destinations such as La Paloma and Ventana Canyon
Pima County
Corrections District Department of Corrections Pima County
St. Mary’s Medical District Medical and Health Care City of Tucson
St. Joseph Medical District Medical and Health Care City of Tucson
UMC Medical District Medical and Health Care City of Tucson
TMC Medical District Medical and Health Care City of Tucson
Northwest Hospital Medical District
Medical and Health Care Pima County
Oro Valley Hospital Medical and Health Care Town of Oro Valley
Downtown Government District
Government City of Tucson
Veterans Affairs Medical District
Medical, Health Care/Veterans Affairs City of Tucson
Pima Community College District
Education City of Tucson
Tohono O’odham Gaming/Tourism Tohono O’odham Nation
Pascua Yaqui Tribe Gaming/Tourism Pascua Yaqui Tribe
Source: Pima County Development Services Department, 2013

E c o n o m i c D e v e l o p m e n t
B a c k g r o u n d
A6.34 | P a g e A p p e n d i x A : B a c k g r o u n d a n d C u r r e n t C o n d i t i o n s
Major Private and Public Employers in Southern Arizona
Table 8.44a lists major the top 25 private employers in southern Arizona in 2013. Table 8.44b lists the
top 10 public employers in southern Arizona in 2013.
TABLE 6.4.c: Top 25 Private Employers in Southern Arizona in 2013
Employer Number of Employees
Industry Type
Raytheon Missile Systems 10,300 Aerospace and Defense
Wal-Mart Stores inc. 7,450 Retail
UA Healthcare 6,099 Medical/Healthcare
Freport-McMoRan Copper & Gold 5,463 Gold and Copper Production
Carondolet Health Network 3,668 Medical/Healthcare
TMC HealthCare 2,977 Medical/Healthcare
Fry’s Food Stores 2,700 Retail Food
Corrections Corp. of America 2,314 Corrections
Asarco LLC 2,297 Minerals/Copper Mining
Afni Inc. 2,199 Customer Care
Southern Arizona VA Health Care 2,182 Medical/Healthcare
Citi 2,000 Financial Services
Bashas’ Inc. 1,800 Retail Food
APAC Customer Service 1,777 Customer Care Outsourcing
Northwest Medical Center 1,757 Medical/Healthcare
Safeway Inc. 1,685 Retail Food
Target Stores Inc. 1,640 Retail
Walgreens 1,420 Retail Pharmaceutical
IBM 1,375 Applications Innovation/IT Services
Sol Casinos 1,300 Casinos/Resort
TEP/UniSource Energy 1,232 Electric Utilities
Union Pacific Railroad 1,200 Transportation and Logistics
Circle K Stores 1,200 Convenience
GEICO 1,155 Insurance Services
Ventana Medical Systems, Inc. 1,150 Pathology Testing Laboratories (Medical Support)
Source: Arizona Daily Star, 2013

E c o n o m i c D e v e l o p m e n t
B a c k g r o u n d
A6.35 | P a g e A p p e n d i x A : B a c k g r o u n d a n d C u r r e n t C o n d i t i o n s
TABLE 6.4.d: Top 10 Public Employers in Southern Arizona in 2013
Employer Number of Employees
Industry Type
University of Arizona 10,846 Education
Davis-Monthan Air Force Base 9,100 Aerospace and Defense
State of Arizona 8,807 State Government
Tucson Unified School District 6,790 Education
Pima County 6,500 County Government
U.S. Customs and Border Patrol 6,076 Federal Government
City of Tucson 4,585 Municipal Government
U.S. Army Intelligence Center and Fort Huachuca 5,096 Federal Government
Tohono O’odham Nation 4,350 Native Nation Government
Pima Community College 2,384 Education
Source: Arizona Daily Star, 2013
Fiscally Appropriate Land Use Strategy
A fiscally appropriate land use strategy takes competitive advantage of and supports:
• Major economic development corridors
• Major employment centers
• Binational economy
• Governor’s industry clusters initiative
• Innovation and new technology development
• Clean and energy efficient industry
• Mixed-use 24-hour neighborhoods
• Public/private partnerships

E c o n o m i c D e v e l o p m e n t
B a c k g r o u n d
A6.36 | P a g e A p p e n d i x A : B a c k g r o u n d a n d C u r r e n t C o n d i t i o n s
6.5 Tourism
Travel and tourism is one of the most important “export-oriented” industries in Arizona. Arizona is one
of 6 of the top tourism states in the nation along with Florida, New York, Hawaii, Las Vegas, and
California, but spends the least of most states to promote tourism. Florida spends $60 million a year on
tourism promotion, California $50 million, Hawaii $75 million, New York $160 million and Nevada and
Las Vegas $310 million. Arizona is at about $20 million, and maybe $15 million goes into advertising.
Defining Arizona’s natural attractions to the traveling public is important.
Spending by visitors generates sales in lodging, food services, recreation, transportation and retail
businesses – the “travel industry.” These sales support jobs for Arizona residents and contribute tax
revenue to local and state governments. Travel is especially important in the non-metropolitan areas of
the state, where manufacturing and traded services are less prevalent. 13
The Arizona travel industry continued its moderate expansion in 2012. Although real spending (adjusted
for inflation) and travel-generated employment remain below their pre-recession levels, both spending
and employment levels improved – spending for the third consecutive year and employment for the
second year. Continuing improvement in the broader economy should foster continued growth in the
travel industry. 14 In Arizona Travel Impacts 1998-2012, the Arizona Office of Tourism summarizes
Arizona travel:
Direct Travel Spending: Total direct travel spending in Arizona was $19.3 billion in 2012. Travel
spending increased by 4.6 percent in current dollars compared to 2011.
Lodging sales: A primary component in total visitor spending, lodging sales increased by 4.4
percent from 2011 to 2012 following a 3.9 percent increase the preceding year and a 4.6
increase from 2009 to 2010.
Travel Activity: Visitor air travel arrivals on domestic flights increased by 0.5 percent in 2012,
following similar increases the preceding two years. Air travel to Arizona declined by 8 percent
per year in 2008 and 2009. Other indicators of room demand and visitor volume also showed
modest increases.
Employment: Direct travel-generated employment was 161,300 in 2012. This represents as
addition of 4,200 jobs, an increase of 2.7 percent. This is the second consecutive year of
employment growth in the travel industry since the decline in employment associated with the
2008-2009 recession.
13 Arizona Travel Impacts 1998-2012, Arizona Office of Tourism, Dean Runyan Associates, June 2013. 14 Ibid.

E c o n o m i c D e v e l o p m e n t
B a c k g r o u n d
A6.37 | P a g e A p p e n d i x A : B a c k g r o u n d a n d C u r r e n t C o n d i t i o n s
Re-spending of Travel Related Revenues: The re-spending of travel-related revenues by
businesses and employees supported 139,000 additional jobs outside of the travel industry with
earnings of $5.6 billion.
The Gross Domestic Product (GDP): The GDP of the travel industry was $7.6 billion in 2012. The
travel industry and the microelectronics industry have been the top two export-oriented
industries in the state in recent years.

E c o n o m i c D e v e l o p m e n t
B a c k g r o u n d
A6.38 | P a g e A p p e n d i x A : B a c k g r o u n d a n d C u r r e n t C o n d i t i o n s
Travel $5.3
Microelectronics $4.6
Aerospace $3.0
Agriculture $1.5
Mining $1.2
$0 $1 $2 $3 $4 $5 $6
Earnings in Billions
Source: Preliminary 2012 estimates by Dean Runyan Associates. Agriculture includes food and beverage
processing industries.
Figure 12: Selected Arizona Export-Oriented Industries, 2012.
Apache Cochise
Coconino Gila
Graham/Greenlee La Paz
Maricopa Mohave
Navajo Pima Pinal
Santa Cruz Yavapai
Yuma 0% 10% 20% 30% 40%
Percent Travel-Generated
Source: Dean Runyan Associates and Arizona Department of Revenue. These estimates represent the total state
transaction privilege tax receipts generated by travel spending. Counties and municipalities generally are allocated a
portion of these receipts based on resident population. Other county and municipal excise taxes are also imposed on
visitors.
Figure 13: State Transaction Privilege Taxes Generated by Direct Travel Spending, 2012.

E c o n o m i c D e v e l o p m e n t
B a c k g r o u n d
A6.39 | P a g e A p p e n d i x A : B a c k g r o u n d a n d C u r r e n t C o n d i t i o n s
Travel Generated Employment and Earnings
The following table provides estimates for individual counties. Total employment includes all full-time
and part-time wage and salary employment and self-employment. Because total employment includes
all jobs, regardless of the hours worked, the average annual earnings of the job or the number of
individuals employed, this indicator is in some respects less useful than earnings estimates. Nonetheless,
the distribution of counties is similar for earnings and employment. 15 As shown in this table, Pima
County was second to Maricopa County in total travel generated employment and earnings in 2012.
TABLE 6.5.a: Travel-Generated Employment and Earnings as Percent of Total 2012
Employment Earnings (Million)
County
Total
Travel Percent Travel
Total
Travel
Percent Travel
Apache 30,510 1,590 5.2% $1,144 $32 2.8%
Cochise 55,540 3,660 6.6% $2,843 $75 2.6%
Coconino 83,020 10,870 13.1% $3,213 $282 8.8%
Gila 21,580 2,990 13.9% $793 $64 8.1%
Graham/Greenlee 17,050 980 5.7% $750 $14 1.8%
La Paz 7,590 1,230 16.2% $345 $30 8.8%
Maricopa 2,241,050 86,000 3.8% $114,167 $3,558 3.1%
Mohave 61,020 5,950 9.8% $2,277 $129 5.7%
Navajo 39,660 3,440 8.7% $1,466 $80 5.4%
Pima 487,740 22,340 4.6% $21,424 $577 2.7%
Pinal 80,710 5,590 6.9% $3,423 $135 4.0%
Santa Cruz 17,770 1,960 11.0% $790 $49 6.1%
Yavapai 82,060 8,090 9.9% $2,773 $179 6.5%
Yuma 82,530 6,660 8.1% $3,765 $153 4.1%
Arizona Total 3,307,840 161,340 4.9% $159,173 $5,357 3.4%
Source: Dean Runyan Associates, U.S. Bureau of Labor Statistics, and U.S. Buerau of Economic Analysis.
Total and Travel-Generated Employment Estimates by Dean Runyan Associates, 2013.
Note: Details may not add to totals due to rounding. Percentages calculated on unrounded numbers.
15 Arizona Travel Impacts1998-2012, Arizona Office of Tourism, Phoenix, Arizona, June 2013

E c o n o m i c D e v e l o p m e n t
B a c k g r o u n d
A6.40 | P a g e A p p e n d i x A : B a c k g r o u n d a n d C u r r e n t C o n d i t i o n s
TABLE 6.5.b: Arizona County Travel Impacts 2012
Travel Spending Related Travel-Generated Impacts
County
Total
($Million)
Visitor
($Million)
Earnings
($Million)
Employment
(jobs)
Local Taxes
($Million)
State Taxes
($Million)
Total Taxes
($Million) Apache 127 110 32 1,590 3.6 5.6 9.1 Cochise 348 316 75 3,660 10.7 14.3 25.0 Coconino 1,045 1,000 282 10,870 29.7 43.3 73.0 Gila 282 270 64 2,990 5.0 11.5 16.5 Graham/Greenlee 77 66 14 980 1.8 3.4 5.1 La Paz 146 142 30 1,230 2.9 5.8 8.7 Maricopa 11,533 8,758 3,558 86,000 338.5 395.5 733.9 Mohave 536 471 129 5,950 10.6 21.4 32.0 Navajo 304 279 80 3,440 7.9 13.2 21.1 Pima 2,665 2,129 577 22,340 50.1 100.4 150.5 Pinal 628 537 135 5,590 11.7 26.7 38.4 Santa Cruz 271 260 49 1,960 5.0 10.0 15.0 Yavapai 699 638 179 8,090 15.6 28.5 44.1 Yuma 657 595 153 6,660 14.3 26.2 40.5 Arizona 19,318 ** 5,357 161,340 507.2 705.7 1,212.9
Source: Dean Runyan Associates, U.S. Bureau of Labor Statistics, and U.S. Bureau of Economic Analysis, 2013.
Notes: Details may not add to totals due to rounding. Property taxes and sales taxes paid by travel industry employees not included in the county estimates due to data limitations. The local and state tax estimates for the state of Arizona (Sections II and III of this report) include property taxes and the sales taxes paid by travel industry employees. **The sum of county visitor spending is less than statewide visitor spending because a portion of county ground transportation is allocated to “other travel” at the county level.

E c o n o m i c D e v e l o p m e n t
B a c k g r o u n d
A6.41 | P a g e A p p e n d i x A : B a c k g r o u n d a n d C u r r e n t C o n d i t i o n s
TABLE 6.5.c: Arizona County Total Travel Spending 1198-2012p ($ Millions)
Annual
Percent Change
County 1998 2000 2002 2003 2004 2005 2006 2007 2008 2009 2010 2011 2012p 11-12p 98-12p Apache 83 104 99 97 101 115 122 123 147 119 120 126 127 0.9 3.1 Cochise 226 269 271 281 311 331 340 367 375 352 365 361 348 3.4 3.1 Coconino 639 704 667 713 758 812 845 885 939 879 938 998 1,045 4.7 3.6 Gila 195 218 213 221 228 248 260 269 260 245 256 269 282 5.1 2.7 Graham/Greenlee
36 44 40 41 42 49 62 65 67 52 61 69 77 10.9 5.9
La Paz 105 114 117 121 122 134 127 130 133 130 128 138 146 6.3 2.4 Maricopa 6997 8114 7570 8235 8960 9993 10659 10851 10584 9480 10292 10912 11533 5.7 3.6 Mohave 310 351 377 408 422 459 516 504 515 478 511 528 536 1.4 4.0 Navajo 195 249 231 229 232 256 280 281 308 262 272 291 304 4.6 3.2 Pima 1,832 2,110 2,098 2,170 2,362 2,618 2,697 2,649 2,550 2,380 2,481 2,588 2,665 3.0 2.7 Pinal 222 252 272 285 320 362 417 480 526 497 580 636 628 1.4 7.7 Santa Cruz
242 280 289 280 299 302 281 284 282 294 261 239 271 13.2 0.8
Yavapai 372 469 477 497 510 573 613 640 651 584 613 661 699 5.8 4.6 Yuma 377 439 458 478 518 556 585 590 624 611 603 650 657 1.0 4.1 Arizona 11832 13716 13180 14055 15188 16809 17802 18118 17960 16364 17479 18467 19318 4.6 3.8
Source: Dean Runyan Associates, U.S. Bureau of Labor Statistics, and U.S. Bureau of Economic Analysis, 2013.
Notes: Details may not add to totals due to rounding. Percentages calculated on unrounded numbers.

E c o n o m i c D e v e l o p m e n t
B a c k g r o u n d
A6.42 | P a g e A p p e n d i x A : B a c k g r o u n d a n d C u r r e n t C o n d i t i o n s
TABLE 6.5.d: Arizona County Travel-Generated Earnings 1998-2012p ($Millions)
Annual
Percent Change
County 1998 2000 2002 2003 2004 2005 2006 2007 2008 2009 2010 2011 2012p 11-12p 98-12p Apache 20 24 24 23 23 25 27 29 32 31 30 30 32 5.8 3.4 Cochise 50 57 59 61 67 70 73 82 84 81 81 76 75 -1.6 3.0 Coconino 189 204 195 206 221 228 240 265 283 267 262 271 282 3.9 2.9 Gila 50 54 54 55 56 61 65 68 66 63 60 61 64 5.5 1.8 Graham/Greenlee
8 10 9 9 9 11 14 15 15 12 12 13 14 6.3 3.9
La Paz 23 25 26 26 26 28 27 28 29 29 29 30 30 2.7 2.0 Maricopa 2,200 2,551 2,431 2,592 2,814 3,014 3,281 3,425 3,298 3,158 3,247 3,418 3,558 4.1 3.5 Mohave 85 94 104 110 110 116 133 133 136 133 127 124 129 4.1 3.0 Navajo 48 60 57 55 56 59 66 68 76 69 71 73 80 9.1 3.7 Pima 401 460 479 480 517 563 580 582 556 538 538 548 577 5.3 2.6 Pinal 54 58 65 66 73 81 94 112 122 121 126 132 135 2.5 6.8 Santa Cruz
44 49 52 50 54 54 52 54 54 54 50 44 49 9.3 0.8
Yavapai 105 129 133 137 139 152 165 177 180 164 162 168 179 7.0 3.9 Yuma 86 97 103 108 118 120 131 135 144 145 143 153 153 0.4 4.2 Arizona 3,363 3,874 3,792 3,978 4,283 4,583 4,947 5,173 5,075 4,865 4,939 5,142 5,357 4.2 3.6
Source: Dean Runyan Associates, U.S. Bureau of Labor Statistics, and U.S. Bureau of Economic Analysis, 2013.
Notes: Details may not add to totals due to rounding. Percentages calculated on unrounded numbers.
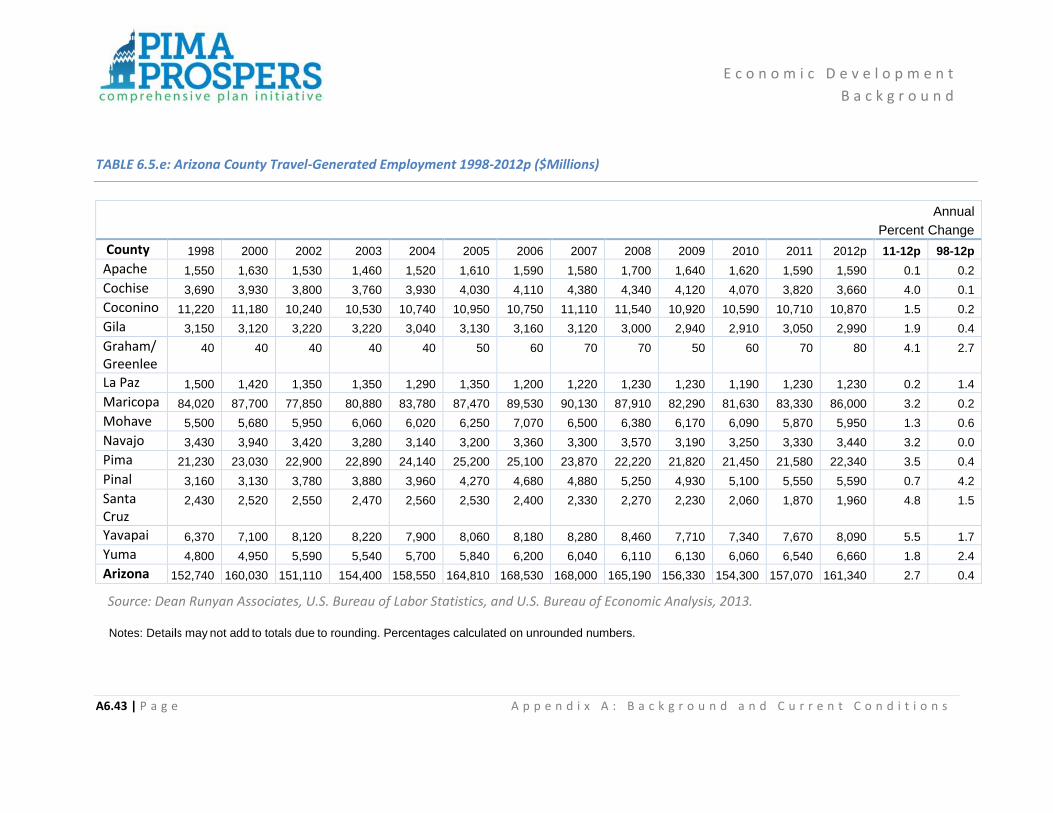
E c o n o m i c D e v e l o p m e n t
B a c k g r o u n d
A6.43 | P a g e A p p e n d i x A : B a c k g r o u n d a n d C u r r e n t C o n d i t i o n s
TABLE 6.5.e: Arizona County Travel-Generated Employment 1998-2012p ($Millions)
Annual
Percent Change
County 1998 2000 2002 2003 2004 2005 2006 2007 2008 2009 2010 2011 2012p 11-12p 98-12p
Apache 1,550 1,630 1,530 1,460 1,520 1,610 1,590 1,580 1,700 1,640 1,620 1,590 1,590 0.1 0.2
Cochise 3,690 3,930 3,800 3,760 3,930 4,030 4,110 4,380 4,340 4,120 4,070 3,820 3,660 4.0 0.1
Coconino 11,220 11,180 10,240 10,530 10,740 10,950 10,750 11,110 11,540 10,920 10,590 10,710 10,870 1.5 0.2
Gila 3,150 3,120 3,220 3,220 3,040 3,130 3,160 3,120 3,000 2,940 2,910 3,050 2,990 1.9 0.4
Graham/Greenlee
40 40 40 40 40 50 60 70 70 50 60 70 80 4.1 2.7
La Paz 1,500 1,420 1,350 1,350 1,290 1,350 1,200 1,220 1,230 1,230 1,190 1,230 1,230 0.2 1.4
Maricopa 84,020 87,700 77,850 80,880 83,780 87,470 89,530 90,130 87,910 82,290 81,630 83,330 86,000 3.2 0.2
Mohave 5,500 5,680 5,950 6,060 6,020 6,250 7,070 6,500 6,380 6,170 6,090 5,870 5,950 1.3 0.6
Navajo 3,430 3,940 3,420 3,280 3,140 3,200 3,360 3,300 3,570 3,190 3,250 3,330 3,440 3.2 0.0
Pima 21,230 23,030 22,900 22,890 24,140 25,200 25,100 23,870 22,220 21,820 21,450 21,580 22,340 3.5 0.4
Pinal 3,160 3,130 3,780 3,880 3,960 4,270 4,680 4,880 5,250 4,930 5,100 5,550 5,590 0.7 4.2
Santa Cruz
2,430 2,520 2,550 2,470 2,560 2,530 2,400 2,330 2,270 2,230 2,060 1,870 1,960 4.8 1.5
Yavapai 6,370 7,100 8,120 8,220 7,900 8,060 8,180 8,280 8,460 7,710 7,340 7,670 8,090 5.5 1.7
Yuma 4,800 4,950 5,590 5,540 5,700 5,840 6,200 6,040 6,110 6,130 6,060 6,540 6,660 1.8 2.4
Arizona 152,740 160,030 151,110 154,400 158,550 164,810 168,530 168,000 165,190 156,330 154,300 157,070 161,340 2.7 0.4
Source: Dean Runyan Associates, U.S. Bureau of Labor Statistics, and U.S. Bureau of Economic Analysis, 2013.
Notes: Details may not add to totals due to rounding. Percentages calculated on unrounded numbers.
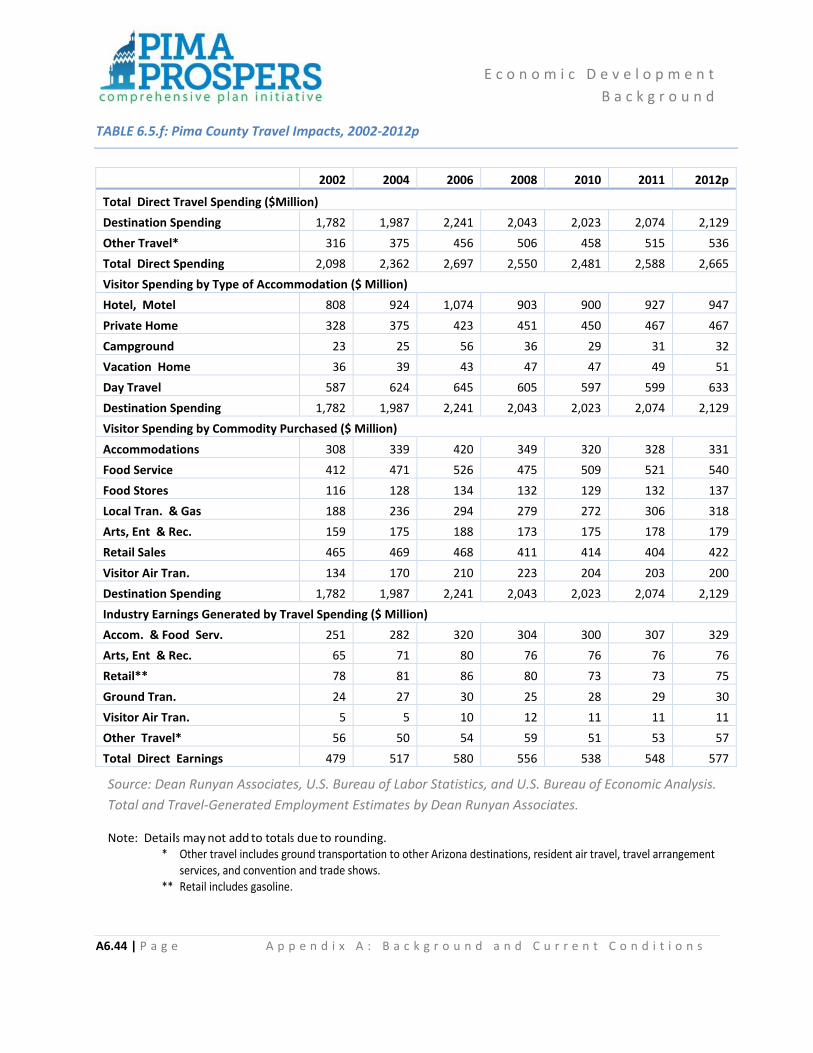
E c o n o m i c D e v e l o p m e n t
B a c k g r o u n d
A6.44 | P a g e A p p e n d i x A : B a c k g r o u n d a n d C u r r e n t C o n d i t i o n s
TABLE 6.5.f: Pima County Travel Impacts, 2002-2012p
2002 2004 2006 2008 2010 2011 2012p
Total Direct Travel Spending ($Million)
Destination Spending 1,782 1,987 2,241 2,043 2,023 2,074 2,129
Other Travel* 316 375 456 506 458 515 536
Total Direct Spending 2,098 2,362 2,697 2,550 2,481 2,588 2,665
Visitor Spending by Type of Accommodation ($ Million)
Hotel, Motel 808 924 1,074 903 900 927 947
Private Home 328 375 423 451 450 467 467
Campground 23 25 56 36 29 31 32
Vacation Home 36 39 43 47 47 49 51
Day Travel 587 624 645 605 597 599 633
Destination Spending 1,782 1,987 2,241 2,043 2,023 2,074 2,129
Visitor Spending by Commodity Purchased ($ Million)
Accommodations 308 339 420 349 320 328 331
Food Service 412 471 526 475 509 521 540
Food Stores 116 128 134 132 129 132 137
Local Tran. & Gas 188 236 294 279 272 306 318
Arts, Ent & Rec. 159 175 188 173 175 178 179
Retail Sales 465 469 468 411 414 404 422
Visitor Air Tran. 134 170 210 223 204 203 200
Destination Spending 1,782 1,987 2,241 2,043 2,023 2,074 2,129
Industry Earnings Generated by Travel Spending ($ Million)
Accom. & Food Serv. 251 282 320 304 300 307 329
Arts, Ent & Rec. 65 71 80 76 76 76 76
Retail** 78 81 86 80 73 73 75
Ground Tran. 24 27 30 25 28 29 30
Visitor Air Tran. 5 5 10 12 11 11 11
Other Travel* 56 50 54 59 51 53 57
Total Direct Earnings 479 517 580 556 538 548 577
Source: Dean Runyan Associates, U.S. Bureau of Labor Statistics, and U.S. Bureau of Economic Analysis.
Total and Travel-Generated Employment Estimates by Dean Runyan Associates.
Note: Details may not add to totals due to rounding. * Other travel includes ground transportation to other Arizona destinations, resident air travel, travel arrangement
services, and convention and trade shows. ** Retail includes gasoline.

E c o n o m i c D e v e l o p m e n t
B a c k g r o u n d
A6.45 | P a g e A p p e n d i x A : B a c k g r o u n d a n d C u r r e n t C o n d i t i o n s
TABLE 6.5.f: Pima County Travel Impacts, 2002-2012p (Continued)
2002 2004 2006 2008 2010 2011 2012p
Industry Employment Generated by Travel Spending (Jobs)
Accom.&Food Serv. 12,900 13,790 14,630 12,740 12,510 12,650 13,250
Arts, Ent & Rec. 3,960 4,550 4,550 3,860 4,040 4,070 4,180
Retail** 3,050 3,050 3,120 2,880 2,590 2,580 2,580
Ground Tran. 800 820 830 680 710 730 750
Visitor Air Tran. 140 130 220 250 210 200 200
Other Travel' 2,040 1,800 1,750 1,800 1,390 1,340 1,380
Total Direct Employment 22,900 24,140 25,100 22,220 21,450 21,580 22,340
Government Revenue Generated by Travel Spending ($Million)
Local Tax Receipts 41.1 45.0 53.9 47.3 47.0 49.3 50.1
State Tax Receipts 78.2 86.1 95.0 85.5 90.3 97.2 100.4
Total Direct Gov't Revenue 119.4 1 31 . 1 148.9 132.8 137.4 146.4 150.5
Source: Dean Runyan Associates, U.S. Bureau of Labor Statistics, and U.S. Bureau of Economic Analysis.
Total and Travel-Generated Employment Estimates by Dean Runyan Associates.
Note: Details may not add to totals due to rounding. * Other travel includes ground transportation to other Arizona destinations, resident air travel, travel arrangement
services, and convention and trade shows. ** Retail includes gasoline.
E c o n o m i c D e v e l o p m e n t
B a c k g r o u n d
A6.46 | P a g e A p p e n d i x A : B a c k g r o u n d a n d C u r r e n t C o n d i t i o n s
The Pima County Department of Economic Development and Tourism
As shown in the previous tables, travel and tourism continues to be among the most important export
industries driving Arizona’s and Pima County’s economy. To enhance the economic welfare of the Pima
County citizens and businesses, the Pima County Department of Economic Development and Tourism
act as primary liaison with the business, academic and tourism community. It provides business
development, marketing, training, and revenue enhancement programs to Pima County’s leased asset
partners, the Arizona-Sonora Desert Museum, Old Tucson Studios, Colossal Cave Mountain Park, Pima
Air and Space Museum, Pima County Fairgrounds, and more.
Program Goals and Objectives
Coordinate Pima County’s economic development resources to concentrate on collaborative
community efforts in business and job creation, business retention and expansion, increased
tourism and enhancing the community’s quality of life.
Effectively coordinate all public resources to produce a sustaining positive business
development climate.
Create a unique awareness of Pima County through branding to increase business and leisure
travel.
Develop a more comprehensive marketing plan in partnership with Visit Tucson with the
following initiatives: increase Mexican tourism to the attractions, create a destination special
event department in Tucson, develop a marketing assistance grant program for the area
attractions, assist in the development of new air routes to Tucson, and increase the number of
film and video production utilizing Pima County as their base shooting and production
headquarters.
Increase cultural and heritage awareness of Pima County.
Develop optional use concepts for County land for Pima County Fairgrounds, Leased Property
Attractions and environmental friendly businesses.
Develop a partnership approach to County Involvement in all public and private organizations
involved in economic and tourism development.
Increase the number of special events and revenue producing activities at Kino Sports Complex.
The department and its programs are funded by both public and private funds in partnership with its
community outside agencies, the City of Tucson, Southern Arizona Attractions Alliance, Arizona Office of
Tourism, Arizona Commerce Authority and the Metropolitan Tucson Convention and Visitors Bureau.

E c o n o m i c D e v e l o p m e n t
B a c k g r o u n d
A6.47 | P a g e A p p e n d i x A : B a c k g r o u n d a n d C u r r e n t C o n d i t i o n s
Tourism Impacts and Drivers on the Region
Tourism is one of the region’s positive and pure industries. The outside visitor contributes to an increase
in the bed tax, which bolsters the revenue to the region without the associated burden of population
growth. It is important to understand key drivers to the region as a foundational source for generating
tourism such as hotels and resorts, parks and attractions, and festivals and events.
Annual Visitors Statistics
Mexico Visitation and Spending in Pima County
Visitors from Mexico are a valued market segment for the tourism industry in the region. A 2007-08
study by the University of Arizona, The Mexican Visitors to Arizona, states that Mexican visitors'
expenditures in Pima County increased 237% from $289 million to $976 million from 2001 to 2007-08.
Pima County receives 36.3% of the total expenditures by Mexican visitors in Arizona. The number of
border crossings from Mexico to Arizona increased from 22.91 million in 2001 to 24.02 million in 2007-
08, an increase of 4.92%.
According to the study, 13.37 million Mexican visitor parties visit Arizona while 1,008,176 parties' final
destination was Tucson. Average party size is 2.68 people. Therefore, Tucson received 2,701,912
Mexican visitors. The percentage of Mexican visitors who stayed overnight in Arizona rose from less
than 4% to 16%. This increase is due largely to the increased percentage of visitors to Metro Tucson on
overnight visits.
According to the same study, 98.9% of Arizona's Mexican visitors are from the state of Sonora. Shopping
is still the primary reason for Mexican visitors to the US. Other reasons include visiting friends and family
and work. The report attributes $976.4 million in expenditures to Mexican visitors to Pima County (5.2%
of Pima County's taxable sales) and 2.3 million overnight visitors.
The Mexican Visitors to Arizona study was conducted by the University of Arizona Economic and
Business Research Center, reported by the Eller College of Management and sponsored by the Arizona
Office of Tourism, Phoenix Sky Harbor International Airport, Maricopa County DMOs, and the
Metropolitan Tucson Convention and Visitors Bureau.
Convention and Visitors Bureau Statistics Performance Indicators and Measures
Table 6.5.g lists performance indicators and measures gathered by the Metropolitan Tucson Convention
and Visitors Bureau (MTCVB) for 2011 and 2012. While occupancy, average daily rate, and revenue per
room increase during this period, bookings and room nights, and number of participants slightly
decreased. Although the economic impact slightly decreased, it is a strong indicator of the importance of
visitors to the region with a total impact of $132.6 million in 2012.

E c o n o m i c D e v e l o p m e n t
B a c k g r o u n d
A6.48 | P a g e A p p e n d i x A : B a c k g r o u n d a n d C u r r e n t C o n d i t i o n s
TABLE 6.5.g: Performance Indicators and Measures
Performance Indicators 2011 2012
Occupancy 55.8% 57%
Average Daily Rate $89.32 $90.00
Revenue Per Available Room $49.88 $51.29
Pima County Bed Tax Collections $6,386,614 Not Available
Performance Measures
Bookings (Meetings & Sports) 362 327
Room Nights (Sports & meetings) 331,805 312,167
Delegates/Participants 176,297 171,702
Economic Impact $145 million $132.6 million
Source: MTCVB) Performance Indicators and Measures Data, 2013
Tourism Economics Table 6.5.h provides direct and indirect impact of tourism in the region and relevant economic,
demographic and socioeconomic data based on data available at the Arizona Office of Tourism. Table
6.5.i provides the same data for Pima County.
TABLE 6.5.h Tourism Economics Tucson and Southern Arizona 2012 (Pima, Cochise, Santa Cruz)
Categories 2012
Domestic Overnight Visitors per Year - Pima, Cochise, Santa Cruz counties 7.0 Million
Direct Travel Spending $3.3 Billion
Tourism Jobs - Direct Employment 28,000
Direct Tax Receipts $190 Million
Median Age of Visitors 46.5 years
Median Income of Visitors $71,350
Average Length of Stay 4.6 Nights
Average Party Size 2.6 Persons
Source: Arizona Office of Tourism (AOT), Tourism Economics, Longwoods, VisaVue, Smith Travel
Research and Dean Runyan Associates, 2012
According to AOT, top states of visitor origin include: Arizona, California and Washington and the top
cities of visitor origin include: Phoenix, Los Angeles, Seattle, San Diego, and San Francisco and Bay
area.16
16 AOT/Dean Runyan Associates 2012

E c o n o m i c D e v e l o p m e n t
B a c k g r o u n d
A6.49 | P a g e A p p e n d i x A : B a c k g r o u n d a n d C u r r e n t C o n d i t i o n s
TABLE 6.5.i: Tourism Economics Pima County 2012 (Includes Tucson)
Categories 2012
Direct Travel Spending $2.665 Billion
Tourism Jobs - Direct Employment 22,340
Direct Tax Receipts $150.5 Million
Source: Arizona Office of Tourism (AOT), Tourism Economics, Longwoods, VisaVue, Smith Travel
Research and Dean Runyan Associates, 2012
According to Table 6.5.i, Pima County captured a substantial amount of the direct travel spending, direct
employment and direct tax receipts.
TABLE 6.5.j: Hospitality Facts 2013
Category 2013
Lodging Properties within the Tucson City Limit 101 properties/10,112 rooms
Lodging properties within Pima County 169 properties/16,851 rooms
City Bed Tax 12.05% plus a $2 per room/ per night surcharge
County Bed Tax 12.05%
Oro Valley Bed Tax 14.05%
Source: MTCVB and AOT, 2013
TABLE 6.5.k: Average Visitor Travel Party Spending Per Night 2013
Category 2013
Lodging $167.78
Food & Beverage $125.59
Entertainment $74.09
Local Transportation $26.25
Retail shopping $130.68
Other $8.09
Total Spending $532.48
Source: Strongpoint Research, MTCVB Visitor Survey (page 26) November 2012.

E c o n o m i c D e v e l o p m e n t
B a c k g r o u n d
A6.50 | P a g e A p p e n d i x A : B a c k g r o u n d a n d C u r r e n t C o n d i t i o n s
Convention and Visitors Bureau Statistics by Type of Event Table 6.5.l shows number of visitors attracted to the region via major annual conferences, conventions
and other events by source.
TABLE 6.5.1: Convention and Visitors Bureau Statistics by Type of Event 2013
Conference Name Total Visitors
Source
Tucson Rodeo Parade 200,000 Tucson Rodeo
Fourth Avenue Street Fair 200,000 Fourth Avenue Merchant Association
Tucson Meet Yourself 100,000 Tucson Meet Yourself
Tucson Festival of Books 100,000 University of Arizona
Tucson Gem and Mineral Show 55,000 Visit Tucson 17
Tucson Rodeo/ La Fiesta de los Vaqueros 55,000 Tucson Rodeo
Jehovah’s Witness Convention 46,900 Visit Tucson
El Tour de Tucson 39,000 El Tour de Tucson
TAR Soccer Shootout 18,000 TAR Soccer Shootout
Tucson Invitational Games 11,500 Tucson Invitational Games
Mariachi Conference 9-10,000 La Frontera
Source: Various sources as indicated in table.
17 Most recent estimate based on 2007 Economic Impact Study. More current data is not available.
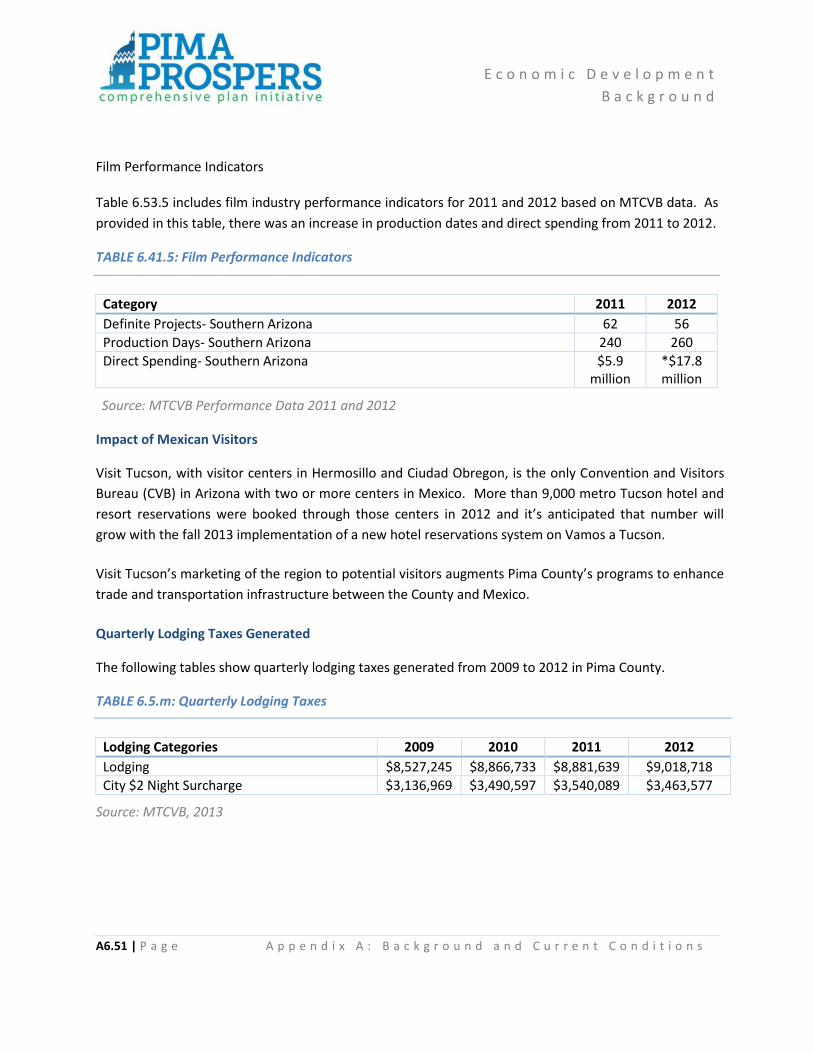
E c o n o m i c D e v e l o p m e n t
B a c k g r o u n d
A6.51 | P a g e A p p e n d i x A : B a c k g r o u n d a n d C u r r e n t C o n d i t i o n s
Film Performance Indicators Table 6.53.5 includes film industry performance indicators for 2011 and 2012 based on MTCVB data. As
provided in this table, there was an increase in production dates and direct spending from 2011 to 2012.
TABLE 6.41.5: Film Performance Indicators
Category 2011 2012
Definite Projects- Southern Arizona 62 56
Production Days- Southern Arizona 240 260
Direct Spending- Southern Arizona $5.9 million
*$17.8 million
Source: MTCVB Performance Data 2011 and 2012
Impact of Mexican Visitors
Visit Tucson, with visitor centers in Hermosillo and Ciudad Obregon, is the only Convention and Visitors
Bureau (CVB) in Arizona with two or more centers in Mexico. More than 9,000 metro Tucson hotel and
resort reservations were booked through those centers in 2012 and it’s anticipated that number will
grow with the fall 2013 implementation of a new hotel reservations system on Vamos a Tucson.
Visit Tucson’s marketing of the region to potential visitors augments Pima County’s programs to enhance
trade and transportation infrastructure between the County and Mexico.
Quarterly Lodging Taxes Generated
The following tables show quarterly lodging taxes generated from 2009 to 2012 in Pima County.
TABLE 6.5.m: Quarterly Lodging Taxes
Lodging Categories 2009 2010 2011 2012
Lodging $8,527,245 $8,866,733 $8,881,639 $9,018,718
City $2 Night Surcharge $3,136,969 $3,490,597 $3,540,089 $3,463,577
Source: MTCVB, 2013

E c o n o m i c D e v e l o p m e n t
B a c k g r o u n d
A6.52 | P a g e A p p e n d i x A : B a c k g r o u n d a n d C u r r e n t C o n d i t i o n s
TABLE 6.5.n: Quarterly Lodging Taxes
Fiscal Year Hotel Excise Tax (1)
Rental Vehicle Surcharges (2)
Recreational Vehicle Tax (3)
2002-03 $ 2,536 $ 1,436 $ 195
2003-04 2,717 1,277 209
2004-05 2,885 1,595 200
2005-06 5,212 1,589 214
2006-07 7,796 1,357 210
2007-08 6,901 1,732 222
2008-09 5,628 1,389 159
2009-10 5,637 1,521 181
2010-11 5,887 1,538 165
2011-12 6,626 1,464 146
Source: Pima County Finance and Risk Management Department, 2013
Notes: (1) Tax increased from 1% to 2% January 1, 1997; the additional 1% can only be used for County sports facilities. In
January of 2006, the tax increased from 2% to 6%, of which only 34% can be used for sports facilities. (2) Car rental surcharges increased from $2.50 to $3.50 per rental contract July 1, 1996. Usage is restricted to
County sports facilities. (3) Recreational vehicle taxes apply at the rate of $0.50 per vehicle per night and became effective July 1, 1997.
Usage of this tax is limited to athletic activities.
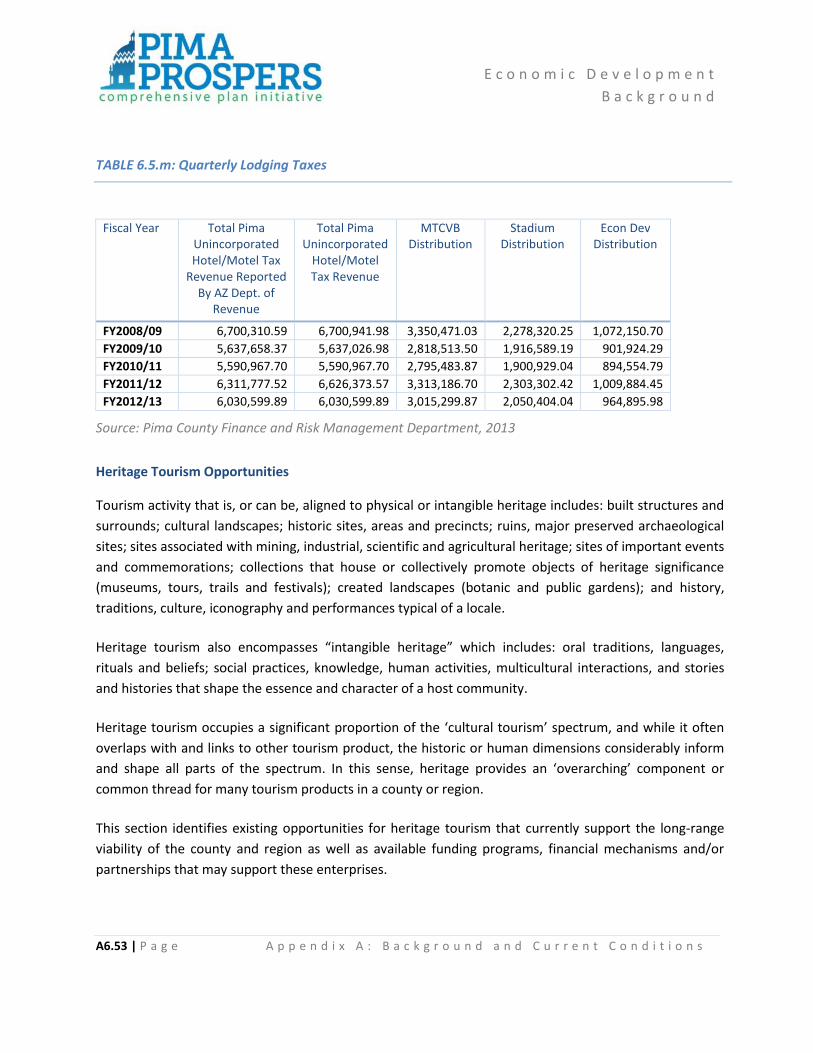
E c o n o m i c D e v e l o p m e n t
B a c k g r o u n d
A6.53 | P a g e A p p e n d i x A : B a c k g r o u n d a n d C u r r e n t C o n d i t i o n s
TABLE 6.5.m: Quarterly Lodging Taxes
Fiscal Year Total Pima
Unincorporated Hotel/Motel Tax
Revenue Reported By AZ Dept. of
Revenue
Total Pima Unincorporated
Hotel/Motel Tax Revenue
MTCVB Distribution
Stadium Distribution
Econ Dev Distribution
FY2008/09 6,700,310.59 6,700,941.98 3,350,471.03 2,278,320.25 1,072,150.70
FY2009/10 5,637,658.37 5,637,026.98 2,818,513.50 1,916,589.19 901,924.29
FY2010/11 5,590,967.70 5,590,967.70 2,795,483.87 1,900,929.04 894,554.79
FY2011/12 6,311,777.52 6,626,373.57 3,313,186.70 2,303,302.42 1,009,884.45
FY2012/13 6,030,599.89 6,030,599.89 3,015,299.87 2,050,404.04 964,895.98
Source: Pima County Finance and Risk Management Department, 2013
Heritage Tourism Opportunities
Tourism activity that is, or can be, aligned to physical or intangible heritage includes: built structures and
surrounds; cultural landscapes; historic sites, areas and precincts; ruins, major preserved archaeological
sites; sites associated with mining, industrial, scientific and agricultural heritage; sites of important events
and commemorations; collections that house or collectively promote objects of heritage significance
(museums, tours, trails and festivals); created landscapes (botanic and public gardens); and history,
traditions, culture, iconography and performances typical of a locale.
Heritage tourism also encompasses “intangible heritage” which includes: oral traditions, languages,
rituals and beliefs; social practices, knowledge, human activities, multicultural interactions, and stories
and histories that shape the essence and character of a host community.
Heritage tourism occupies a significant proportion of the ‘cultural tourism’ spectrum, and while it often
overlaps with and links to other tourism product, the historic or human dimensions considerably inform
and shape all parts of the spectrum. In this sense, heritage provides an ‘overarching’ component or
common thread for many tourism products in a county or region.
This section identifies existing opportunities for heritage tourism that currently support the long-range
viability of the county and region as well as available funding programs, financial mechanisms and/or
partnerships that may support these enterprises.

E c o n o m i c D e v e l o p m e n t
B a c k g r o u n d
A6.54 | P a g e A p p e n d i x A : B a c k g r o u n d a n d C u r r e n t C o n d i t i o n s
Major heritage sites in the area include:
San Xavier del Bac Mission
Mission San Xavier del Bac was founded in 1692 by a Jesuit missionary, Father Eusebio Francisco Kino. It
was then that he became the first non-Indian to visit the village of Wa:k, or “Bac,” as he wrote it. A part
of the Tohono O’odham Reservation, San Xavier offers a window into the regions past.
Juan Bautista de Anza National Historic Trail
The Juan Bautista de Anza National Historic Trails encapsulates the Spanish and Mexican history and
culture of the American Southwest. The Anza Trail is a 1,200-mile marked route, beginning in Southern
Arizona. It memorializes the route established over two centuries ago by Juan Bautista de Anza II,
Captain of the Presidio of Tubac in Sonora (now Southern Arizona). This intrepid explorer led an
expedition to scout a new overland route to northern California and established the Presidio at San
Francisco.
Arizona History Museum/Arizona Historical Society
Established by an Act of the First Territorial Legislature on November 7, 1864, the Arizona Historical
Society (AHS) is Arizona’s oldest historical agency. Architects of the Territory’s code of laws realized they
were making history and that it was important to preserve a record of their activities. One of their
earliest actions was to create the means for documenting the past and recording contemporary events
as they unfolded. This became the Arizona Historical Society, formed to collect and preserve “all facts
relating to the history of this Territory.”
Today, AHS serves as the steward of state history, fulfilling its mission to collect, preserve, interpret, and
disseminate the history of Arizona and the West. Collections, housed in AHS museum facilities
throughout the state, number in excess of three million objects. The Society’s artifact and manuscript
holdings offer unrivaled opportunities for public programming, educational outreach, and exhibitions, as
well as academic and community-based research.
AHS collections not only provide premier resources for recounting Arizona’s past, but are invaluable
tools for promoting public understanding of contemporary issues such as water availability, immigration,
free trade, mining, ranching and agribusiness, the defense industry, cultural diversity, and urban
development and revitalization.
The Arizona Historical Society — through its exhibits, programs, publications, and outreach — informs
and inspires people of all ages by reminding them of the boldness and daring spirit that characterized
countless individuals, past and present, who have made Arizona their home.

E c o n o m i c D e v e l o p m e n t
B a c k g r o u n d
A6.55 | P a g e A p p e n d i x A : B a c k g r o u n d a n d C u r r e n t C o n d i t i o n s
Arizona State Museum (Tucson)
The Arizona State Museum is the oldest and largest anthropology museum in the Southwest, established
in 1893 by the Arizona Territorial Legislature. Arizona State Museum’s collections and experts are
among the world’s most significant resources for the study of southwestern cultures. Located in the
University of Arizona campus, The Arizona State Museum attracted 20,000 visitors in 2012. The
Museum:
Is the state's official permitting agency for archaeological and paleontological projects across the
state.
Serves as the state’s official archaeological repository and is the largest/busiest non-federal
intake facility in the country.
Administers the Arizona Antiquities Act and assists state and federal agencies in enforcing
related legislation.
Is the University of Arizona’s anthropology museum and is one of the oldest research units on
the campus.
Hosts researchers from around the world who use the collections to expand the frontiers of
knowledge in archaeology, ethnology, and ethno-history.
Is an affiliate of the Smithsonian.
Holds a comprehensive collection of American Indian basketry, totaling 25,000+ woven pieces of
rare and outstanding baskets, sandals, cradle boards, mats, cordage, and preserved fibers
representing every indigenous basket-making culture in North America.
Holds the world’s largest whole-vessel collection of Southwest Indian pottery (20,000+
specimens).
Cares for more than 3 million objects, including more than 300,000 catalogued archaeological
artifacts, 40,000 ethnographic artifacts, 500,000 photographic negatives and original prints,
90,000 volumes of rare and hard-to-find titles, 6,000 maps, 1,500 linear feet of archival
documents, and more than 1,000 sound recordings.
Curates the artifacts used by pioneering archaeologists to define the Mogollon and Hohokam
cultures, as well as the Salado phenomenon.
Holds one of the nation’s top Navajo textile collections that includes some of the earliest and
most rare examples of this type of weaving, including one of the largest Navajo rugs ever woven.
Holds one of the largest collections of Casas Grandes pottery in any museum outside of Mexico.
Holds one of the largest collections of Seri material in the U.S.
Has more than 500 outstanding examples of Mexican folk masks from the renowned Cordry
Collection.
Holds the archives, papers and original field notes and drawings of SW anthropology giants such
as Emil Haury, Grenville Goodwin, Edward Spicer, Clara Lee Tanner, and others.

E c o n o m i c D e v e l o p m e n t
B a c k g r o u n d
A6.56 | P a g e A p p e n d i x A : B a c k g r o u n d a n d C u r r e n t C o n d i t i o n s
Has more than 4,000 comparative vertebrate skeletons in the Stanley J. Olsen Laboratory of
Zoo-archaeology.
Tohono O’Odham National Cultural Center and Museum
The Cultural Center & Museum is working to instill pride by creating a permanent tribal institution to
protect and preserve O'odham "jewe c himdag". Working with elders, the Cultural Center & Museum
promotes understanding and respect of O'odham "himdag" through educational programs and public
outreach. It also includes an extensive collection of Tohono O’odham art.
Marana Heritage River Park
Marana Heritage River Park is west of the Interstate 10 on Tangerine Farms Loop Road and south of
Gladden Farms. Last year, the Town of Marana council adopted a budget authorization for the 2014
fiscal year, which will allow for the Parks and Recreation department to begin on the first modules. One
of the focus areas is Heritage Farm, which will be built to celebrate the culture of farming in Marana.
The farm currently has a community garden and a demonstration garden. The gardens are an area for
residents to learn about Marana’s farm heritage through planting, working and eating the locally grown
food. Looking to the future, the department would want commercial farming, retail and a farmer’s
market in the area. The second focus area is Heritage Park where a heritage themed splash pad, Ramada
and access area would be built.
The last focus area is Heritage Ranch, which is meant to bring different regional areas to the community.
The ranch will have two arenas, each 150 by 300 feet that will hold different sporting events celebrating
the regions heritage. The area will include lights, speakers, concessions stands, restrooms, a
maintenance facility, stalls for the horse, parking, landscaping and the use of a utility line. The estimated
cost is $7.9 million and if approved would open in summer 2015.
La Fiesta de los Vaqueros (Tucson Rodeo)
The first La Fiesta de los Vaqueros (Celebration of the Cowboys) in 1925 touted three days of events and
competition. Today, the event has grown to a nine-day celebration centered on the Tucson Rodeo, one
of the top 25 professional rodeos in North America and takes place in mid Febraury every year. Current
and former Professional Rodeo Cowboys Association (PRCA) world champions are featured in each
Tucson Rodeo. The entry list for Tucson could be the Who’s Who’ of pro rodeo. Approximately 11,000
fans gather for this event each year.

E c o n o m i c D e v e l o p m e n t
B a c k g r o u n d
A6.57 | P a g e A p p e n d i x A : B a c k g r o u n d a n d C u r r e n t C o n d i t i o n s
Santa Cruz Valley Heritage Alliance
Heritage tourism focuses on promoting the people, cultures, and unique sites and attractions that make
up Pima County. Millions of tourists travel throughout the world seeking to learn about the history of
specific regions. The Santa Cruz Valley Heritage Alliance is in place to advocate for Tucson and southern
Arizona to be designated as a national heritage area. Earning such a designation would make this region
more attractive to travelers seeking this type of experience. The Santa Cruz Valley Heritage Alliance and
Visit Tucson promote the following heritage experiences identified by the Alliance:
1. Sky Islands and Desert Seas: Sky islands are forested mountain ranges separated from each
other by basins and valleys (seas) of desert and grasslands. The Sky Island region of
southeastern Arizona, southwestern New Mexico, northeastern Sonora and northwestern
Chihuahua has a globally unprecedented array of northern and southern plant and animal
species.
2. Streams in the desert: The Santa Cruz River and its tributaries have supported humans and
wildlife in the desert for thousands of years.
3. Bird habitats and migration routes: Pima County is one of the major bird migration routes in the
western U.S.
4. Native American lifeways: Southern Arizona is one of the longest-inhabited places in North
America and is home to two Native American tribes.
5. Desert farming: People have farmed in Pima County for four millennia and constructed canals to
irrigate fields in the same locations for the past 3,500 years.
6. Ranching traditions: The high desert grasslands of southern Arizona facilitates ranching, which
has profoundly shaped the region’s cultural and natural landscape.
7. Spanish & Mexican frontier: Beginning in the 1680s, the Santa Cruz Valley was part of the
northern frontier of New Spain, where Spanish colonists, soldiers and missionaries interacted
with local Native Americans
8. Mining booms: Ghost towns and old mines throughout the region are visible reminders of
mining booms and busts over several centuries.
9. U.S. Military Posts on the Mexico border: The operations and posts of the U.S. military are an
important part of the history of southern Arizona.
10. U.S.-Mexico Border Culture: The Santa Cruz Valley spans the border between the United States
and Mexico, where residents of this region find their lives are entwined with people on both
sides of the border via family ties, economic interaction, or common history.
Increasing the emphasis on heritage tourism would bring additional visitors and their economic impact
to Pima County. Visit Tucson and the Santa Cruz Valley Heritage Alliance will continue their
collaboration to market the region’s unique heritage to potential visitors.
E c o n o m i c D e v e l o p m e n t
B a c k g r o u n d
A6.58 | P a g e A p p e n d i x A : B a c k g r o u n d a n d C u r r e n t C o n d i t i o n s
Medical/Holistic Healing Destination Tourism Opportunities
Historically, the healing power of the sun had made our region a Mecca for holistic healing. Miraval,
Canyon Ranch, the University of Arizona Center for Integrative Medicine attract people from all over the
world. Medical/holistic health tourism opportunities in the county and region are identified in this
section.
Destination Spas
Pima County has two of the world’s top destination spas in Canyon Ranch and Miraval. Affluent customers travel to Tucson from throughout the world to partake in programs ranging on average between four and 10 days. Typically, the further the distance traveled, the longer the stay. Both spas offer consultants who help customers package the experiences they want. High-end resort accommodations are combined with spa, fitness, health and wellness, nutrition education and food tailored to a healthy lifestyle. Destination spas differentiate Tucson. Many cities have stellar resorts with upscale resort spas. Destination spas, however, attract extremely affluent visitors who patronize them multiple times per year including celebrities like Oprah Winfrey. These visits provide rejuvenation and a rededication to a healthy lifestyle. On average, destination spa customers spend considerably more than do typical resort customers. Developing nonstop flights to Tucson from New York, Boston, Atlanta and other East coast cities would help attract additional customers to Canyon Ranch and Miraval. Canyon Ranch has established resorts in Lenox, Mass., and in Miami to make it more convenient for its customers to engage in their programs.
Canyon Ranch
Canyon Ranch is more than a place. It's a state of mind and a way of life. For more than 30 years, Canyon
Ranch has been empowering people to live healthier, longer, more joyful lives through fitness, nutrition,
stress management and integrative wellness. Located on more than 150 acres in the iconic Sonoran
Desert of Southern Arizona, Canyon Ranch was once the heart of a large, working cattle ranch, and, then
from the ‘30s through the ‘70s, a rustic guest ranch. Today, the ranch is a world-class destination health
spa resort featuring healthy gourmet cuisine & wellness programs.
Miraval
Miraval is a top-rated destination retreat - a resort, an award-winning spa, and a great getaway. Situated
in the warm shade of Santa Catalina Mountains in northern Tucson, Arizona on 400 acres of idyllic land,
Miraval is a place dedicated to opening eyes, minds, and hearts. For nearly two decades, Miraval has
built its programming around the concept of Life in Balance™.

E c o n o m i c D e v e l o p m e n t
B a c k g r o u n d
A6.59 | P a g e A p p e n d i x A : B a c k g r o u n d a n d C u r r e n t C o n d i t i o n s
Mental and Behavioral Health
Sierra Tucson is recognized internationally for its customized treatments for addictions, pain
management, and mental and behavioral health disorders.
Sierra Tucson
Sierra Tucson is an internationally renowned treatment facility that has helped thousands of people
rebuild their lives over the past 30 years. Sierra Tucson is multi-licensed by the state of Arizona, and
dually accredited by The Joint Commission as both a hospital and behavioral health care facility that is
known and respected as a leader in the treatment of addictions and behavioral disorders. With a clinical
staff-to-patient ratio of 2.5:1, the professional, experienced, and caring staff develop individualized
treatment plans for each patient. Progressive, effective therapies help every individual discover,
confront, and learn to manage the issues at the very heart of human behavior and disease.
Cottonwood de Tucson
Cottonwood de Tucson was founded in 1987 by a group of recovering individuals. Their vision was to
create a world-class treatment center in Tucson, and then use that model in building other centers in
key areas around the country. The treatment model they developed was welcomed and needed in the
late 1980’s and Cottonwood de Tucson experienced rapid growth and success. Cottonwood de Tucson
was followed by Cottonwood de Albuquerque and Cottonwood de Austin in short order.
In April 1993 the Welch family purchased the controlling interest in Cottonwood de Tucson. By early
1993 Cottonwood began to emerge with an innovative dual-diagnosis treatment model that to this day
continues to set them apart from other treatment facilities. Key behavioral health staff began arriving, a
multi-disciplinary team was assembled, and slowly Cottonwood de Tucson began to be recognized as an
addiction rehab treatment facility that married the best-of-the-best treatment modalities.
Medical Services
Pima County has a plethora of outstanding health-care systems and facilities led by the University of
Arizona Medical Center. The University of Arizona Health System delivers world-class care in nearly
every conceivable area of medicine. The quality of their care and facilities attracts customers from
throughout Arizona, the southwestern United States and Mexico.
A trend that has emerged recently, however, is that U.S. citizens in need of surgery and other expensive
care and procedures are traveling to Mexico for these services because medical charges are so much
less there. These trends will need to be followed to determine how much growth can be expected in
Pima County related to medical tourism.
E c o n o m i c D e v e l o p m e n t
B a c k g r o u n d
A6.60 | P a g e A p p e n d i x A : B a c k g r o u n d a n d C u r r e n t C o n d i t i o n s
University of Arizona Medical Center
The University of Arizona Medical Center-University Campus was ranked among the nation’s best
hospitals for the care of older adults and as high performing in 11 other medical specialties in U.S. News
& World Report’s Best Hospitals list of 2012-13. With an aging U.S. population, the University’s medical
center will attract people and their friends and family to Tucson.
University of Arizona Cancer Center
Founded in 1976 as a Division of The University of Arizona's College of Medicine, the University of
Arizona Cancer Center is a Center of Excellence in the Arizona Health Sciences Center. In 1990, The
University of Arizona Cancer Center was designated as one of the first comprehensive cancer centers by
the National Cancer Institute (NCI). The University of Arizona Cancer Center is the only comprehensive
cancer center headquartered in Arizona.
The primary responsibility of an NCI comprehensive cancer center is to conduct research that will lead to
the reduction of cancer morbidity and mortality. A framework for this research consists of focusing upon
the molecular and cellular mechanisms of oncogenesis.
Molecular mechanisms emphasize genetic, epigenetic, and signaling mechanisms, while cellular
mechanisms emphasize the biology of invasion and metastasis, as well as stromal-cellular interactions.
With the primacy of this research mission in mind, the research programs and core services constitute a
bedrock of The University of Arizona Cancer Center.
The translational research performed by University of Arizona Cancer Center investigators has resulted
in the development of at least 17 bio-technology and pharmaceutical companies, mostly in Arizona.
Biotechnology companies include: Ventana Medical Systems, Cancer Technologies, DeMetrix, and
ImaRx. Pharmaceutical companies focused on cancer treatment include: AmpliMed, Arizona Cancer
Therapeutics, Cylene, Montigen Pharmaceuticals, ProLx, Sanofi Aventis, and Targeted Cancer
Therapeutics, LLC. Pharmaceutical companies focused on cancer prevention include: Cancer Prevention
Pharmaceuticals, Clinuvel, Niadyne, Surface Safe, Topical Technologies, Inc., and PHusis Therapeutics.
A study performed by the Eller College of Management at the University of Arizona in 2008 suggests
that the impact of a sustained $70 million in annual research funding through The University of Arizona
Cancer Center includes: 5,180 jobs, $237 million in wages, $795 million in gross sales, $7 million in city
and county revenues, and $10.5 million in state revenues.
University of Arizona Server Heart Center
The Sarver Heart Center, established in 1986, is dedicated to the prevention and treatment of
cardiovascular disease via the academic pillars of research (discovering knowledge), education (sharing
knowledge) and patient care (applying knowledge).
E c o n o m i c D e v e l o p m e n t
B a c k g r o u n d
A6.61 | P a g e A p p e n d i x A : B a c k g r o u n d a n d C u r r e n t C o n d i t i o n s
The Arizona Center for Integrative Medicine
The Arizona Center for Integrative Medicine at the University of Arizona College of Medicine is leading
the transformation of health care by creating, educating, and actively supporting a community that
embodies the philosophy and practice of healing-oriented medicine, addressing mind, body and spirit.
The Center was founded in 1994 by Dr. Andrew Weil, and has focused its efforts in three domains:
education, clinical care and research. The Center was built upon the premise that the best way to
change a field is to educate the most gifted professionals and place them in settings where they can, in
turn, teach others.
Older Adults Communities & Aging in Place
The climate of the region as played a key role in attracting retirees to the region. In addition, the existing
County population is aging. According the the Arizona Department of Health Services Pima County age
cohorts, in 2008, approximately 32 percent of the total County population consisted of persons 50 years
or older. New innovative ways of building communities.
According to the Pima Association of Governments (PAG) the median age in Pima County was 32.8 in
1990 (slightly below the national average), 35.7 in 2000 and was estimated as 36.7 in 2007. The slow rise
of the median age is due to the aging of the Baby Boomers, not to any massive influx of seniors.
Although most of metropolitan Tucson's growth over the next 20 years will be driven by working age
people moving here for employment opportunities, the current aging population and those moving here
to retire seeking a better climate provide an opportunity to reevaluate the need create older adult
communities that are based on healthy communities principles.
Geo-Tourism and Visitors
The US definition of geo-tourism was heavily influenced by the National Geographic Society, which defines
geo-tourism as tourism that sustains or enhances the geographical character of a place – its environment,
culture, aesthetics, heritage, and the well-being of its residents. The concept of Geographical sustainable
tourism with coining the word Geo-tourism, was introduced publicly in a 2002 report by the Travel
Industry Association of America (as of 2009 this organization adapted name to U.S. Travel Association) and
National Geographic Traveler magazine.
The National Geographic's Geo-tourism (NGG-tourism program) is "best practice" tourism that sustains, or
even enhances, the geographical character of a place, such as its culture, environment, heritage, and the
well-being of its residents.
National Geographic's Geo-tourism program incorporates sustainability principles, but in addition to its
do-no-harm ethic, focuses on the place as a whole. The idea of enhancement allows for development
E c o n o m i c D e v e l o p m e n t
B a c k g r o u n d
A6.62 | P a g e A p p e n d i x A : B a c k g r o u n d a n d C u r r e n t C o n d i t i o n s
based on character of place, rather than standardized international branding, and generic architecture,
food, and so on. Best practices of Geotourism include:
Integrity of place: Enhance geographical character by developing and improving it in ways
distinctive to the local, reflective of its natural and cultural heritage, so as to encourage market
differentiation and cultural pride.
International codes: Adhere to the principles embodied in the World Tourism Organization’s Global
Code of Ethics for Tourism and the Principles of the Cultural Tourism Charter established by the
International Council on Monuments and Sites (ICOMOS).
Market selectivity: Encourage growth in tourism market segments most likely to appreciate,
respect, and disseminate information about the distinctive assets of the locale.
Market diversity: Encourage a full range of appropriate food and lodging facilities, so as to appeal to
the entire demographic spectrum of the geo-tourism market and so maximize economic resiliency
over both the short and long term.
Tourist satisfaction: Ensure that satisfied, excited geo-tourists bring new vacation stories home and
encourage friends to experience the same thing, thus providing continuing demand for the
destination.
Community involvement: Base tourism on community resources to the extent possible,
encouraging local small businesses and civic groups to build partnerships to promote and provide a
distinctive, honest visitor experience and market their locales effectively. Help businesses develop
approaches to tourism that build on the area’s nature, history and culture, including food and drink,
artisanry, performance arts, etc.
Community benefit: Encourage micro- to medium-size enterprises and tourism business strategies
that emphasize economic and social benefits to involved communities, especially poverty
alleviation, with clear communication of the destination stewardship policies required to maintain
those benefits.
Protection and enhancement of destination appeal: Encourage businesses to sustain natural
habitats, heritage sites, aesthetic appeal, and local culture. Prevent degradation by keeping volumes
of tourists within maximum acceptable limits. Seek business models that can operate profitably
within those limits. Use persuasion, incentives, and legal enforcement as needed.
Land use: Anticipate development pressures and apply techniques to prevent undesired
overdevelopment and degradation. Contain resort and vacation-home sprawl, so as to retain a

E c o n o m i c D e v e l o p m e n t
B a c k g r o u n d
A6.63 | P a g e A p p e n d i x A : B a c k g r o u n d a n d C u r r e n t C o n d i t i o n s
diversity of natural and scenic environments and ensure continued resident access to scenic
features and environments. Encourage major self-contained tourism attractions, such as large-scale
theme parks and convention centers unrelated to character of place, to be sited in needier locations
with no significant ecological, scenic, or cultural assets.
Conservation of resources: Encourage businesses to minimize water pollution, solid waste, energy
consumption, water usage, landscaping chemicals, and overly bright nighttime lighting. Advertise
these measures in a way that attracts the large, environmentally sympathetic tourist market.
Planning: Recognize and respect immediate economic needs without sacrificing long-term character
and the geo-tourism potential of the destination. Where tourism attracts in-migration of workers,
develop new communities that themselves constitute a destination enhancement. Strive to diversify
the economy. Adopt public strategies for mitigating practices that are incompatible with geo-
tourism and damaging to the image of the destination.
Interactive interpretation: Engage both visitors and hosts in learning about the place. Encourage
residents to promote the natural and cultural heritage of their communities so tourists gain a richer
experience and residents develop pride in their locales.
Geotourism Opportunities in the Pima County Region
Many people choose to live in and visit Pima County due to its climate, natural Sonoran Desert beauty
and opportunities to explore the region in a variety of active and passive ways. Pima County’s Loop
Trail, which traverses the periphery of Tucson is mostly complete and offers cyclists a scenic recreational
experience that they can handle at their own pace. Sabino and Madera canyons, Catalina State Park,
Mount Lemmon, Organ Pipe National Monument and many other areas throughout Pima County, allow
residents and visitors to hike, cycle, mountain bike, rock climb, engage in birding and photography, and
more.
Pima County’s past emphasis on acquiring and preserving land in its natural state is paying off now, and
will in the future, by providing lands for residents and visitors to explore. One such preserve is Saguaro
National Park, which contains the world’s largest and most dense forests of saguaro cacti. Such
acquisition and preservation policies are also an economic strategy for a region largely dependent on its
natural beauty and uniqueness attracting travelers the world over. This section identifies regional geo-
tourism jewels within the region.
Visit Tucson’s fall 2012 visitor inquiry study found that 60% of metro Tucson visitors engage in outdoor
desert activities, while more than half took in western culture and attractions (55%) and caves and
desert attractions (54%).

E c o n o m i c D e v e l o p m e n t
B a c k g r o u n d
A6.64 | P a g e A p p e n d i x A : B a c k g r o u n d a n d C u r r e n t C o n d i t i o n s
The region’s weather, unique Sonoran Desert beauty and wide-open spaces differentiate Pima County
from many areas of the world. Preserving scenic lands and enhancing geo-tourism-related attractions
and activities will enhance residents’ quality of life, while helping to attract more visitors and their
expenditures to Pima County.
Summerhaven/Mount Lemmon/Ski Valley
With 150,00 visitors in 2011, a trip up to Summerhaven/Mount Lemmon/Ski Valley offers an incredible
educational experience for those interested in its numerous climatic zones. “During World War II, a
group of skiers made up of Lowell Thomas, a noted journalist and adventurer, a local forest ranger, and
many Davis Monthan serviceman which included Thomas’ son, later a Governor of Alaska, and Art
Devlin, a future Olympic ski jumper and Television commentator, formed the Saguaro Ski Club. The well-
known cartoonist, Paul Webb, created a patch and membership certificates for the club showing a skier
wrapped around a saguaro cactus.
Thomas sent honorary memberships to dozens of friends, famous personalities around the world,
making membership a tongue in cheek must. A ski gala was held that first year at the Arizona Inn with
many of Thomas’ friends in attendance. A Forest Service lease was obtained, an old model “A” with its
tires removed propelled a rope tow and Mt. Lemmon Ski Valley had its beginning.”18
18 http://www.skithelemmon.com - The official Web Site of Mt. Lemmon Ski Valley

E c o n o m i c D e v e l o p m e n t
B a c k g r o u n d
A6.65 | P a g e A p p e n d i x A : B a c k g r o u n d a n d C u r r e n t C o n d i t i o n s
Biosphere 2
Attracting 100,000 visitors annually, Biosphere 2 is nestled in the Sonoran Desert in Pima County. The
University of Arizona assumed ownership of Biosphere 2 in July 2011. A generous gift from the
Philecology Foundation helps fund Biosphere 2 operations and some research projects. Other grants and
awards, primarily from the National Science Foundation, also support research activities. In the 1800s,
the Biosphere 2 property was part of the Samaniego CDO Ranch. After several changes of ownership, it
became a conference center in the 1960s and 1970s, first for Motorola, then for The University of
Arizona. Space Biospheres Ventures bought the property in 1984 and began construction of the current
facility in 1986 to research and develop self-sustaining space-colonization technology.
Two missions, between 1991 and 1994, sealed Biospherians inside the glass enclosure to measure
survivability. Behind this highly public exercise was useful research that helped further ecological
understanding. Several first-person accounts have been published by former crew members that
provide different perspectives on the experiment.
In 1994, Decisions Investments Corporation assumed control of the property and Columbia University
managed it from 1996-2003 and reconfigured the structure for a different mode of scientific research,
including a study on the effects of carbon dioxide on plants. Columbia also built classrooms and housing
for college students of earth systems science. The property was sold June 4, 2007, to CDO Ranching and
its development partners who then leased the property to UA from 2007-2011.

E c o n o m i c D e v e l o p m e n t
B a c k g r o u n d
A6.66 | P a g e A p p e n d i x A : B a c k g r o u n d a n d C u r r e n t C o n d i t i o n s
The enclosure now serves as a tool to support research already underway by UA scientists. As a
laboratory for large-scale projects, such as the Landscape Evolution Observatory (LEO), the university's
stewardship of Biosphere 2 will allow the UA to perform key experiments aimed at quantifying some of
the consequences of global climate change. 19
Sabino Canyon
Of all the natural attractions in and around Tucson, Sabino Canyon is certainly the most popular. This
large chasm in the Santa Catalina Mountains is one of the most unique Southwestern desert canyons.
Sabino Canyon is a natural desert oasis located in the Coronado National Forest and is home to
spectacular desert landscapes and abundant wildlife.
19 University of Arizona Science Biosphere 2 http://b2science.org/who/history

E c o n o m i c D e v e l o p m e n t
B a c k g r o u n d
A6.67 | P a g e A p p e n d i x A : B a c k g r o u n d a n d C u r r e n t C o n d i t i o n s
Saguaro National Park (East and West)
Tucson, Arizona is home to the nation's largest cacti. The giant saguaro is the universal symbol of the
American west. These majestic plants, found only in a small portion of the United States, are protected
by Saguaro National Park, to the east and west of the modern city of Tucson. Here you have a chance to
see these enormous cacti, silhouetted by the beauty of a magnificent desert sunset.
Catalina State Park
Located about 12 miles north of the city on Arizona Highway 77 (Oracle Road), this park affords the best
views of the canyons and domes of the Catalina Mountains in the area that was formerly known as
Romero Ranch. The park attracts visitors interested in hiking, bird watching and wild habitat in its lush
Sonoran desert setting.

E c o n o m i c D e v e l o p m e n t
B a c k g r o u n d
A6.68 | P a g e A p p e n d i x A : B a c k g r o u n d a n d C u r r e n t C o n d i t i o n s
Colossal Cave Mountain Park
Attracting 38,000 visitors in 2012, the Colossal Cave Mountain Park invites visitors to explore the
different sections of this site, experience the area's history, learn about the area’s abundant wildlife,
enjoy tours of the caves and learn about its bat population.
Tohono Chul
The Tohono Chul Park enriches people's lives by connecting them with the wonders of nature, art and
culture in the Sonoran Desert and inspiring wise stewardship of the natural world. The Hummingbird
garden is planted with salvia, desert honeysuckle, desert willow and many other hummingbird-friendly
plants. Hummingbirds are drawn to sweet, flute-shaped flowers, which are perfect for the birds’ long,
narrow beaks. You’re sure to see a “hummer” flitting from flower to flower.
E c o n o m i c D e v e l o p m e n t
B a c k g r o u n d
A6.69 | P a g e A p p e n d i x A : B a c k g r o u n d a n d C u r r e n t C o n d i t i o n s
The hummingbirds most frequently seen in this garden are the black-chinned, a summer visitor, and the
Costa’s and Anna’s, which have taken up permanent residence in the park. Migrants you may see
include broad-billed, rufous, and occasionally calliopes and Allen’s. These hummingbirds, which migrate
from colder climates, may be seen drinking their fill from the salvia, which blooms through the winter
season.
Technology and Innovation Impacting Tourism Opportunities
Travel is one of the areas that has been most affected by consumer technology in recent years.
Travelers research potential vacation destinations online and typically consult multiple websites in doing
so. The percentage of travel booked online continues to grow steadily as more Americans become
outfitted and familiar with technology.
Technological advances allow cities and regions to dispel misperceptions, such as through the use of
video to educate consumers that there is much more to Pima County than saguaros and 100-degree
days. Tucson’s rapidly-developing downtown, unique events like the All Souls Procession, Tucson
Festival of Books and the Tucson Gem, Mineral & Fossil Showcase can be shown and described in detail
to show visitors what they can experience.
Visit Tucson implemented a new “app” in 2012-13 to allow consumers to download the Tucson
Attractions Passport, which features offers to numerous Pima County attractions. While this passport is
still printed and sold, offering it online allows tech-savvy consumers to research the attractions,
purchase the passport online and redeem the coupons electronically at attractions.
Visit Tucson introduced a new website in fall 2012 and is “re-skinning” the website in fall 2013 to reflect
its new “Free Yourself” brand. Video and new content are added almost daily to make it a living,
breathing reflection of Pima County’s tourism attributes, which evolves continually. Visit Tucson is also
unveiled its new mobile website in 2013 to better promote metro Tucson.
With the advent of social media, it’s vital that Visit Tucson continually update and communicate with
potential travelers via Facebook, Twitter, Instagram and other emerging channels. Having a stagnant
presence on these mediums drives customers away. Social media is a way to engage customers and let
them know about deals, upcoming events and new attractions and offerings.

E c o n o m i c D e v e l o p m e n t
B a c k g r o u n d
A6.70 | P a g e A p p e n d i x A : B a c k g r o u n d a n d C u r r e n t C o n d i t i o n s
Travelers are also visiting consumer-review websites for “credible” reviews about places to visit, along
with the hotels, restaurants, attractions and other vacation elements that are important to them. Visit
Tucson advertises on sites, such as Trip Advisor, and monitors many others to get a feel for potential
visitors’ reactions to Tucson. Visit Tucson also engages in search engine optimization to ensure
consumers entering Tucson travel keywords into Google and other search engines can easily find
www.visittucson.org.
Another way technology is impacting tourism is through online travel agencies (OTAs), such as
Travelocity, Expedia, Kayak and more. These sites allow individual consumers to compare prices for
airline travel, hotel stays and rental cars and then book the offer that best suits them. Some OTAs are
delving into attraction and event ticket packaging, as well. Visit Tucson and the Southern Arizona
Attractions Alliance currently use aRes to market and sell attractions tickets and Visit Tucson uses aRes
as its hotel booking engine on www.visittucson.org. Visit Tucson is working with attractions and hotels
to get them to work together on additional packaging opportunities. Vamos a Tucson moved forward
with Regatta, a new online booking platform, which will be used in the Vamos a Tucson visitor centers in
Mexico to book hotel stays and, eventually, attractions tickets, as well.
Due to the speed of change related to technology, Pima County and Visit Tucson will need to stay on top
of new travel-related technology trends to ensure the best possible customer experience related to
researching and booking all aspects of travel within Pima County.
Aerospace Tourism Opportunities
Pima County has taken a leadership role in southern Arizona related to the aerospace industry by
creating an aerospace and defense corridor initiative. This initiative will bring substantial transportation
and infrastructure investment to the area containing Tucson International Airport, Davis-Monthan Air
Force Base, Raytheon Missile Systems and Bombardier Aerospace. The County’s intention is to retain
and grow new high-technology aerospace and defense jobs in that region.
There is considerable travel associated with these industries, which could create the demand needed to
support additional flights in and out of Tucson International Airport, along with business travel and
meetings to support area hotels and resorts. Pima County also has top aerospace-related tourism
attractions in the Pima Air & Space Museum, the Boneyard and Titan Missile Museum.
The Pima Air & Space Museum and the Boneyard
Located adjacent to Tucson International Airport, the Pima Air & Space Museum is one of the largest air
and space museums in the world. It features more than 300 aircraft and spacecraft, including many of
the most historically significant and technically-advanced craft ever produced.
E c o n o m i c D e v e l o p m e n t
B a c k g r o u n d
A6.71 | P a g e A p p e n d i x A : B a c k g r o u n d a n d C u r r e n t C o n d i t i o n s
The Boneyard
Pima Air & Space Museum offers bus tours of the 309th Aerospace Maintenance and Regeneration
Group facility, also known as the “Boneyard.” The Boneyard is an aerospace storage and maintenance
facility housing hundreds of retired aircraft.
The Titan Missile Museum
The Titan Missile Museum, which is a preserved Titan II missile site, is a treasure for Pima County and
southern Arizona. The museum educates visitors about the Cold War conflicts between the United
States and the former Soviet Union and how technology was used by the United States to avoid nuclear
war.
From a tourism perspective, it’s imperative that these attractions be maintained and promoted to aid
with attracting visitors to Pima County. A total of 37 percent of Tucson travelers visited an aircraft,
astronomy or missile attraction, per Visit Tucson’s fall 2012 visitor inquiry study. That same study found
that “aircraft/missile” was the primary reason for recommending Tucson to other travelers for 7% of
local visitors.
Sports Tourism Opportunities
Pima County has been the site of numerous national and international youth and amateur sports events
through the years, and has been home also to professional baseball and, now, Major League Soccer
spring training activities. Based on existing facilities throughout Pima County, Visit Tucson focuses on
attracting youth and amateur soccer, baseball and swimming/diving events to the region. Visit Tucson
has also worked with United States national governing bodies to bring in USA Swimming, Diving,
Shooting, Volleyball and Wrestling activities.
Through the work of the Pima County Sports & Tourism Authority a study has been conducted to
examine the types of venues needed to serve the local community, and that would also attract regional,
national and international events in targeted sports. The results of that study can help guide land use as
it relates to sports tourism for many years to come.
Kino Sports Complex
Pima County is in the midst of transforming the northern fields at Kino Sports Complex from baseball to
soccer fields. This work includes transforming one field into a “pocket” stadium with grandstand seating
to accommodate 3,000 spectators. This stadium and the surrounding facilities are being used by the FC
Tucson, Arizona’s Premier Development League franchise, and by Major League Soccer for its spring
training matches. Youth and amateur lacrosse, field hockey, rugby and other field sports can be played

E c o n o m i c D e v e l o p m e n t
B a c k g r o u n d
A6.72 | P a g e A p p e n d i x A : B a c k g r o u n d a n d C u r r e n t C o n d i t i o n s
on these fields by local clubs and by national and international teams brought in for tournament
competition.
The southern portion of Kino Sports Complex primarily hosts baseball events, including Tucson
Invitational Games, which features more than 50 college baseball teams annually in January and
February, and, occasionally by Korean professional baseball teams.
Kino Stadium, with a capacity of 11,500, was used through August 2013 by the Tucson Padres Triple-A
baseball team and is used for other baseball and soccer activities, as well as concerts and other major
events.
Cycling
Pima County’s Loop Trail, with 100 miles of shared-use paths for visitors on foot, bikes, skates and
horses, and the region’s bike lanes, mountains, elevation and sunny year-round weather make it a haven
for cyclists. Cycling is an amenity that is promoted heavily to potential visitors. Pima County is also
involved with cycling events, such as El Tour de Tucson and the Old Pueblo Grand Prix, which attract
competitive cyclists from throughout the world.
Tucson Trap and Skeet Club
Tucson Trap and Skeet Club is set to host several major shooting events each year: the Old Pueblo Skeet
Open; the Winter Chain Trap Shoot; and the Satellite Spring Grand American.
New Tourism Opportunities
International Visitors
The biggest tourism opportunity for Pima County and the nation is increasing international travel from
developing nations. Visit Tucson, the entity that serves as Pima County’s tourism marketing
organization, doesn’t have the budget to market extensively in Brazil, China and India. However, the
massive number of inhabitants in those nations, combined with increasing wealth, will lead to large
influxes of visitors from those nations in coming decades.
It will be vital for Tucson to work with the Arizona Office of Tourism and other convention and visitors
bureaus (CVBs) throughout Arizona to market collectively the state and its many experiences to these
potential travelers to ensure Arizona receives its market share of them.
Visit Tucson invests a considerable amount in marketing metro Tucson to potential visitors in Mexico.
Visit Tucson has visitor centers in Hermosillo and Ciudad Obregon, Mexico, and engages in a substantial

E c o n o m i c D e v e l o p m e n t
B a c k g r o u n d
A6.73 | P a g e A p p e n d i x A : B a c k g r o u n d a n d C u r r e n t C o n d i t i o n s
amount of consumer advertising and promotions to drive visitors to Tucson to shop, for sports events
and to enjoy the region’s attractions. The most recent study on the travel-related impacts of Mexico on
Arizona, found that Mexico visitors spend $976 million annually in Pima County. There is much more
than can be done to facilitate travel and trade between Mexico and Pima County.
Growing Tourism
Cities and regions that are top tourism destinations are strategic in their approach to growing the
industry. They invest in tourism marketing and meetings recruitment through their CVBs. They invest in
tourism-related capital projects and infrastructure that provide recreational, entertainment and culture
venues and opportunities for residents and visitors alike. They also invest in sports events and festivals
that attract visitors regionally, nationally and internationally to their areas. When done properly, a
strong public vision and limited public investment, can spur millions of investment in capital projects and
events that add to residents’ quality of life, while attracting targeted visitors.
Meetings
In 2008, hotels and resorts throughout Pima County had a year-round occupancy of approximately 68
percent. In 2013, year-round occupancy is at 56 percent. The majority of the decrease is attributed to a
drop in meetings activity throughout the United States. Decreases were recorded in the number of
meetings, number of people attending meetings, length of stay and per-day spending. Pima County’s
resorts rely heavily on meetings for their survival.
The meetings industry is recovering slowly, but Arizona, including Pima County, is behind pace. Tucson
is hampered by a lack of nonstop flights, along with low resort rates and other concessions offered to
meeting planners to get them to book meetings. Visit Tucson is increasing its investment in attracting
meetings to Tucson and will continue to focus heavily on this aspect of tourism.
Strategies that May Help Grow Tourism
Discount Kino Sports Complex Use Fees. Discount facility use or rental fees for the Kino Sports Complex by 25 percent if an event or activity guarantees at least $25,000 in hotel room rentals or meals and discount the use fee by 50 percent if the guaranteed amount is $50,000 or greater.
Facilitate Amateur and Professional Soccer. Allocate $2 million from the Chicago White Sox settlement fund to make permanent soccer stadium improvements at the Kino Sports Complex.
Finish and Enhance The Loop. Place priority capital funding on completing The Loop and enhancing the river park system to facilitate destination tourism.
Expand Tourism Venues. Recommend bond fund public investments in tourism venues as shows in Table 6.5.o:

E c o n o m i c D e v e l o p m e n t
B a c k g r o u n d
A6.74 | P a g e A p p e n d i x A : B a c k g r o u n d a n d C u r r e n t C o n d i t i o n s
TABLE 6.5.o: Expand Tourism Venues Recommendation
Venue Recommended Bond Fund
Arizona-Sonora Desert Museum Water Exhibit $4,000,000
Pima Air and Space Museum Cold War Exhibit $4,000,000 Pima Air and Space Museum Space Exploration Exhibit $8,000,000 Tumamoc Hill Regional Visitors Center $10,000,000 Tucson Children’s Museum $6,000,000 Tucson Museum of Art $5,000,000 Total: $37,000,000
Source: Visit Tucson, 2013
Metropolitan Tucson Convention Visitors Bureau (MTCVB)
The Metropolitan Tucson Convention & Visitors Bureau adopted a “doing business as (dba)” designation of Visit Tucson in June 2013. It’s a 501(c)(6) nonprofit company with nearly 90 percent of its funding coming from bed tax invested by Pima County, City of Tucson and Town of Oro Valley. Visit Tucson’s mission is to drive economic development by connecting visitors with their ideal travel and meetings experiences in Tucson and southern Arizona. It accomplishes this through a variety of strategies and tactics employed by its many divisions, including: marketing; public relations; convention sales & services; travel industry sales; Mexico marketing; sports; film; partnership development; and visitor services. Top opportunities for Visit Tucson to enhance economic development in Pima County include: Branding: Visit Tucson conducted considerable research with local stakeholders and with Tucson visitors in top feeder markets to determine what sets Tucson apart from other potential vacation destinations. Those results, combined with other research about visitors’ perceptions about the region were used to develop the “Free Yourself” travel branding campaign that was launched in June 2013. Visit Tucson will promote Pima County’s geo-tourism, attractions, resorts, golf, dining and more as part of its new advertising campaign, which is launching in fall 2013. Top performing zip codes within Tucson’s top feeder markets will be targeted. Meetings: Visit Tucson is partnering with resorts and hotels throughout Pima County to attract more meetings activity. Meetings mean additional spending on group food and beverage, and meeting services, including audio visual and transportation for group excursions. Mexico Marketing: Visit Tucson, with visitor centers in Hermosillo and Ciudad Obregon, is the only CVB in Arizona with two or more centers in Mexico. More than 9,000 metro Tucson hotel and resort reservations were booked through those centers in 2012 and it’s anticipated that the number will grow with the fall 2013 implementation of a new hotel reservations system on Vamos a Tucson. Visit

E c o n o m i c D e v e l o p m e n t
B a c k g r o u n d
A6.75 | P a g e A p p e n d i x A : B a c k g r o u n d a n d C u r r e n t C o n d i t i o n s
Tucson’s marketing of the region to potential visitors augments Pima County’s programs to enhance trade and transportation infrastructure between the County and Mexico. Sports: Visit Tucson is partnering with Pima County to bring in Major League Soccer teams for spring training activities at Kino Sports Complex in 2014 and beyond. Visit Tucson will also work with the County to evaluate future sports facilities that could serve residents while attracting regional, national and international events. Film: After failing to pass statewide film incentive legislation, Visit Tucson is partnering with Pima County, City of Tucson, Old Tucson and other entities to explore the potential creation of regional incentives geared toward attracting television series. Television series typically spend several million dollars in the areas where they shoot during multiple-month timeframes. Visit Tucson will continue to seek input from Pima County to ensure Visit Tucson’s programs align with the County’s economic development objectives.

E c o n o m i c D e v e l o p m e n t
B a c k g r o u n d
A6.76 | P a g e A p p e n d i x A : B a c k g r o u n d a n d C u r r e n t C o n d i t i o n s
6.6 Place-base Planning in the Economic Context
Figure 7 Place-based planning: cultural, heritage and environmental character as major economic development assets in the County and region.
In the past century, most plans determined where buildings could go based chiefly on what they were
used for. A “Place-Base Planning” approach can better help shape a vibrant exurban, suburban, and
urban areas of the county while meeting the challenges of and capitalizing on 21st century trends. Place-
based planning is a way to shape the future by concentrating on the look and feel of places, their form
and their character, their connectivity, instead of focusing only on conventional categories of land use.
Most places are made of neighborhoods, districts and corridors – and they will continue to be.
Neighborhoods are places with a mix of homes and businesses that share a similar development
pattern. Districts are single use areas like shopping centers or campuses where development patterns
were created specifically for that use. Corridors are linear connections between neighborhoods created
by road, rail, amenities and greenway connections. When examining the long range viability of this
region and its economy it is worth examining the health of Pima County’s economy with the following
factors to measure its wealth: individual, financial, natural etc.
Place-based Cultural Tourism is based on the assumption that cultural travelers want to explore what
makes a destination distinctive, authentic, and memorable. They want to experience the essence of the
destination – its “place”. Through experiencing “place”, they are enriched – intellectually and
emotionally. Of course, attractions are more than essential; they are critical. That said, attractions
are expressions of a destination’s culture; they are not its embodiment.20
In creating places, neighborhoods, districts or major activity nodes, and corridors, whether for cultural
tourism or economic development, can have a better sense of place. Keeping this concept in mind, Pima
20 Place-based cultural tourism: a new planning paradigm Steven Thorne, October 23, 2012
E c o n o m i c D e v e l o p m e n t
B a c k g r o u n d
A6.77 | P a g e A p p e n d i x A : B a c k g r o u n d a n d C u r r e n t C o n d i t i o n s
Prospers will identify county wide and area specific policy that will help strengthen the sense of place of
each planning or character area.
Art Creating Place in the Region
Art is a major shaper of sense of place. A rich tri-cultural heritage, stemming from ancient Native
American, Hispanic, and Old West traditions, has helped shape the Pima County region into a vibrant
Southwest community. The deepest-running of these roots are those of the desert-dwelling Pima
people, the first to inhabit the land that eventually became Pima County. The region is blessed with a
long tradition of famous Southwestern artists depicting western and Native American interpretations of
the area’s heritage inspired by the history, lore and scenic quality and of our region.
Western Art
Ettore "Ted" DeGrazia (June 14, 1909 – September 17, 1982) was an American impressionist, painter,
sculptor, composer, actor, director, designer, architect, jeweler, and lithographer. Described as "the
world's most reproduced artist", DeGrazia is known for his colorful images of Native American children
of the American Southwest and other Western scenes. DeGrazia also painted several series of
exhibitions like the Papago Legends, Padre Kino, and Cabeza de Vaca. He was a graduate of the
University of Arizona.
Artist Diana Madaras who says painting "fills me with joy" is equally well known for her bold, colorful
artwork as for her generous charitable giving. Madaras owns two Southwest art galleries in Tucson,
Arizona that feature her work exclusively, and is president of the nonprofit Art for Animals Foundation, a
charity she founded in 1999 to help abused, injured and orphaned animals. Madaras is very active in
community service and her Southwest art has benefited more than 100 charities.

E c o n o m i c D e v e l o p m e n t
B a c k g r o u n d
A6.78 | P a g e A p p e n d i x A : B a c k g r o u n d a n d C u r r e n t C o n d i t i o n s
Native American Art
Thousands of years ago, the Pima people planted the Santa Cruz River floodplains with crops like beans,
squash and corn. Today, their Tucson-area descendants (the Tohono O'odham or "Desert People" and
Akimel O'odham or "River People") are expert desert-dwellers who continue to grow native crops and
harvest local bear grass, yucca, and devil's claw to create beautiful hand-woven basketry.
Arizona State Museum (ASM) is affiliated with the Smithsonian Institution and is the oldest, largest
anthropology museum in the American Southwest, established in 1893. ASM introduces visitors to the
native cultures of the American Southwest and is renowned for excellence in preserving, interpreting,
and presenting the material culture of this region. The museum holds one of the nation's top Navajo
textile collections, including one of the largest Navajo rugs ever woven, as well as the world's largest
whole-vessel collection of Southwest Indian pottery (20,000 specimens), and more than 150,000
catalogued archaeological and ethnographic artifacts.
Mission San Xavier del Bac
Known as "The White Dove of the Desert," Mission San Xavier del Bac is located nine miles south of
downtown Tucson in the Santa Cruz Valley on the Tohono O'odham Reservation. Acclaimed as the finest
example of mission architecture in the United States, the San Xavier Mission was sited by the famed
Jesuit missionary and explorer Father Eusebio Francisco Kino, who first visited Bac - "place where the
water appears" - in 1692. The foundation for the first Bac church, located two miles north of the present
Mission, was laid in 1700. The present church - an active parish - was built from 1783-1797.

E c o n o m i c D e v e l o p m e n t
B a c k g r o u n d
A6.79 | P a g e A p p e n d i x A : B a c k g r o u n d a n d C u r r e n t C o n d i t i o n s
Depiction of the Region in Books
The Pima County region has produced numerous famous authors. Some are included in the following
list:
Edward Abbey – author
Jon Anderson - poet
Michael Blake – author
Charles Bowden – author
Ray Bradbury – author
Erskine Caldwell – playwright
Max Cannon – author and creator of the comic strip Red Meat (comic)
Mitch Cullin – author
Charles G. Finney – author
Barbara Kingsolver – novelist
Joseph Wood Krutch – author
Larry Mc. Murtry – author
Tom Miller – travel writer
Stacey Richter - author
Richard Shelton - poet, author
Leslie Marmon Silko – author
Susan Sontag - author
Luci Tapahonso - poet laureate of the Navajo Nation
David Foster Wallace – author
Peter Wild – poet, author, and Professor of English at the University of Arizona
Ofelia Zepeda - poet laureate of Tucson, author
6.7 Fiscal Viability
The Fiscal Viability appendix is provided as Appendix D.