Validation of an analytical method for analysis of cannabinoids in hair by headspace solid-phase...
9
Analytica Chimica Acta 670 (2010) 63–71 Contents lists available at ScienceDirect Analytica Chimica Acta journal homepage: www.elsevier.com/locate/aca Validation of an analytical method for analysis of cannabinoids in hair by headspace solid-phase microextraction and gas chromatography–ion trap tandem mass spectrometry Elissandro Soares Emídio, Vanessa de Menezes Prata, Haroldo Silveira Dórea ∗ Laboratório de Análise de Compostos Orgânicos Poluentes, Departamento de Química, Universidade Federal de Sergipe, 49100-000, Av. Marechal Rondon, s/n. Jardim Rosa Elze, São Cristóvão, SE, Brazil article info Article history: Received 1 February 2010 Received in revised form 11 April 2010 Accepted 12 April 2010 Available online 18 April 2010 Keywords: Cannabinoids Hair analysis Headspace solid-phase microextraction Gas chromatography–ion trap tandem mass spectrometry abstract The development of an analytical method for the determination of 9 -tetrahydrocannabinol (THC), cannabidiol (CBD) and cannabinol (CBN) in samples of human hair is described. Samples were subjected to a procedure based on the combination of headspace solid-phase microextraction (HS-SPME) with gas chromatography linked with mass spectrometry operating in tandem mode (GC–MS/MS). A 10 mg aliquot of sample was firstly decontaminated using petroleum ether, deionized water and dichloromethane (2 mL of each solvent), for 10 min under sonication, and then digested in alkaline solution (1 mol L −1 NaOH). The method variables evaluated were pH, mass of hair, fiber type, extraction temperature, desorption time, ionic strength, pre-equilibrium time and extraction time. Parameters concerning operation of the tandem mode MS/MS were also assessed and optimized. Validation of the method demonstrated excel- lent linearity in the range 0.1–8.0 ng mg −1 , with regression coefficients better than 0.994. Precision was determined using two different concentrations (upper and lower limits of the linear range), and RSD val- ues were between 6.6 and 16.4%. Absolute recoveries (measured in triplicate) were in the range 1.1–8.7%, and limits of detection and quantification were 0.007–0.031 ng mg −1 and 0.012–0.062 ng mg −1 , respec- tively. The LOQ for THC (0.062 ng mg −1 ) was below the cut-off value (LOQ ≤ 0.1 ng mg −1 ) established by the Society of Hair Testing (SOHT), the Society of Toxicological and Forensic Chemistry (STFCh) and the Société Franc ¸ aise de Toxicologie Analytique (SFTA). The optimized SPME method was applied in anal- ysis of hair samples from Cannabis drug users, showing that CBN and CBD were present in all samples analyzed. © 2010 Elsevier B.V. All rights reserved. 1. Introduction The content of active substances present in the Cannabis sativa plant is highly complex and still remains to be fully character- ized. Of over 500 chemical compounds identified, more than 60 belong to the cannabinoid class, the most important being cannabi- nol (CBN), cannabidiol (CBD) and 9 -tetrahydrocannabinol (THC) (Fig. 1) [1]. The main psychoactive cannabinoid is THC, which is used as a reference substance in evaluation of the consumption of the drug in the forms of the various preparations derived from Cannabis (hashish, marijuana, sinsemilla) [2]. Derivatives of Cannabis sativa are widely used illegal drugs worldwide, as also are (often legal) ethyl alcohol and products derived from Nicotiana tabacum [3]. In Brazil, 6.9% of the 47 million inhabitants of the 107 largest Brazil- ∗ Corresponding author. Tel.: +55 79 2105 6654; fax: +55 79 2105 6651. E-mail address: [email protected] (H.S. Dórea). ian cities, corresponding to 3.2 million persons, have consumed the plant at least once in their lives [4]. Evidence for previous use of Cannabis is normally obtained from urine samples, as well as from blood [5]. Alternative matrices are also now being employed, including saliva, sweat, fingernails, breath, breast milk and hair [6–11]. These are less invasive than the collection of blood or urine. Hair is currently recognized as the third main biological material for use in drug analyses, besides urine and blood [12], and differs from the latter in that it offers a wider detection window (months to years), hence enabling investigation of its chronic consumption. Since it is a long lasting solid, analy- sis of hair can be performed even centuries following its growth [13]. Collection of hair samples is a simple, non-invasive process, and adulteration is difficult. Where necessary, it is possible to col- lect an additional sample, whose characteristics will be the same as those of the previously collected sample, a feature impossible to achieve with samples of blood or urine [14]. Furthermore, no special conditions are needed for transport or storage, since hair samples are stable for prolonged periods of time [15]. 0003-2670/$ – see front matter © 2010 Elsevier B.V. All rights reserved. doi:10.1016/j.aca.2010.04.023
Transcript of Validation of an analytical method for analysis of cannabinoids in hair by headspace solid-phase...
Vht
ELA
a
ARRAA
KCHHGm
1
pibn(
ri(aeB
0d
Analytica Chimica Acta 670 (2010) 63–71
Contents lists available at ScienceDirect
Analytica Chimica Acta
journa l homepage: www.e lsev ier .com/ locate /aca
alidation of an analytical method for analysis of cannabinoids in hair byeadspace solid-phase microextraction and gas chromatography–ion trapandem mass spectrometry
lissandro Soares Emídio, Vanessa de Menezes Prata, Haroldo Silveira Dórea ∗
aboratório de Análise de Compostos Orgânicos Poluentes, Departamento de Química, Universidade Federal de Sergipe, 49100-000,v. Marechal Rondon, s/n. Jardim Rosa Elze, São Cristóvão, SE, Brazil
r t i c l e i n f o
rticle history:eceived 1 February 2010eceived in revised form 11 April 2010ccepted 12 April 2010vailable online 18 April 2010
eywords:annabinoidsair analysiseadspace solid-phase microextractionas chromatography–ion trap tandemass spectrometry
a b s t r a c t
The development of an analytical method for the determination of �9-tetrahydrocannabinol (THC),cannabidiol (CBD) and cannabinol (CBN) in samples of human hair is described. Samples were subjectedto a procedure based on the combination of headspace solid-phase microextraction (HS-SPME) with gaschromatography linked with mass spectrometry operating in tandem mode (GC–MS/MS). A 10 mg aliquotof sample was firstly decontaminated using petroleum ether, deionized water and dichloromethane (2 mLof each solvent), for 10 min under sonication, and then digested in alkaline solution (1 mol L−1 NaOH).The method variables evaluated were pH, mass of hair, fiber type, extraction temperature, desorptiontime, ionic strength, pre-equilibrium time and extraction time. Parameters concerning operation of thetandem mode MS/MS were also assessed and optimized. Validation of the method demonstrated excel-lent linearity in the range 0.1–8.0 ng mg−1, with regression coefficients better than 0.994. Precision wasdetermined using two different concentrations (upper and lower limits of the linear range), and RSD val-
ues were between 6.6 and 16.4%. Absolute recoveries (measured in triplicate) were in the range 1.1–8.7%,and limits of detection and quantification were 0.007–0.031 ng mg−1 and 0.012–0.062 ng mg−1, respec-tively. The LOQ for THC (0.062 ng mg−1) was below the cut-off value (LOQ ≤ 0.1 ng mg−1) established bythe Society of Hair Testing (SOHT), the Society of Toxicological and Forensic Chemistry (STFCh) and theSociété Francaise de Toxicologie Analytique (SFTA). The optimized SPME method was applied in anal-ysis of hair samples from Cannabis drug users, showing that CBN and CBD were present in all samples analyzed.. Introduction
The content of active substances present in the Cannabis sativalant is highly complex and still remains to be fully character-
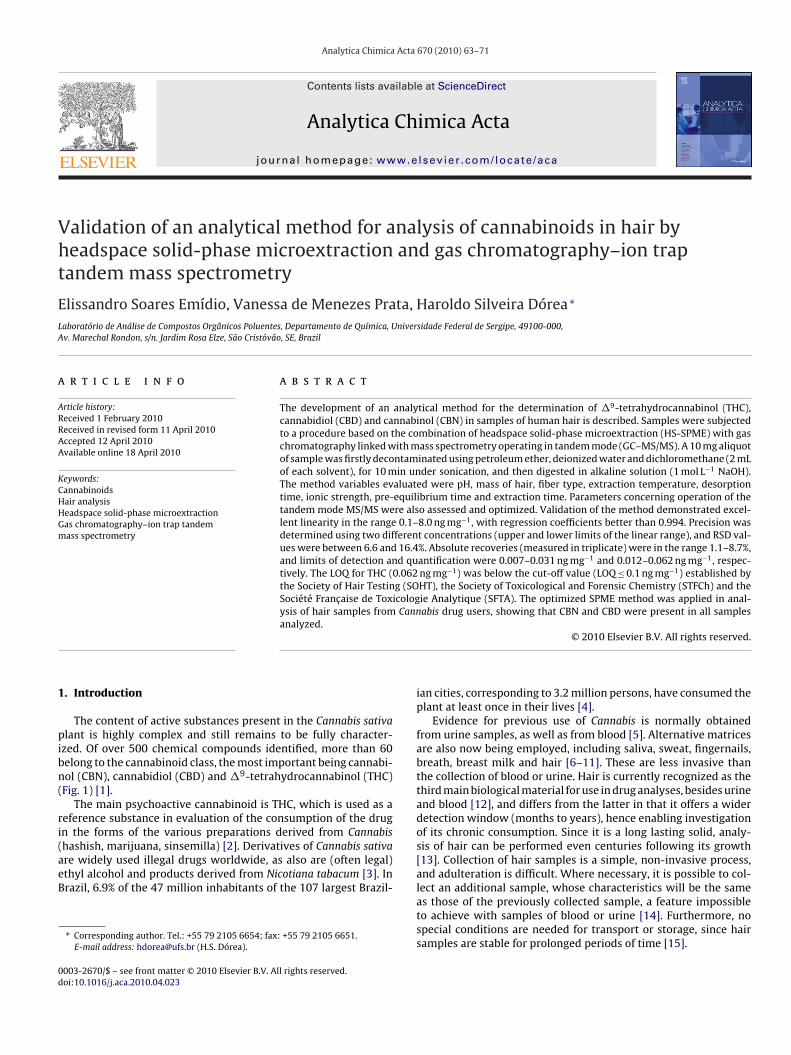
zed. Of over 500 chemical compounds identified, more than 60elong to the cannabinoid class, the most important being cannabi-ol (CBN), cannabidiol (CBD) and �9-tetrahydrocannabinol (THC)Fig. 1) [1].
The main psychoactive cannabinoid is THC, which is used as aeference substance in evaluation of the consumption of the drugn the forms of the various preparations derived from Cannabis
hashish, marijuana, sinsemilla) [2]. Derivatives of Cannabis sativare widely used illegal drugs worldwide, as also are (often legal)thyl alcohol and products derived from Nicotiana tabacum [3]. Inrazil, 6.9% of the 47 million inhabitants of the 107 largest Brazil-∗ Corresponding author. Tel.: +55 79 2105 6654; fax: +55 79 2105 6651.E-mail address: [email protected] (H.S. Dórea).
003-2670/$ – see front matter © 2010 Elsevier B.V. All rights reserved.oi:10.1016/j.aca.2010.04.023
© 2010 Elsevier B.V. All rights reserved.
ian cities, corresponding to 3.2 million persons, have consumed theplant at least once in their lives [4].
Evidence for previous use of Cannabis is normally obtainedfrom urine samples, as well as from blood [5]. Alternative matricesare also now being employed, including saliva, sweat, fingernails,breath, breast milk and hair [6–11]. These are less invasive thanthe collection of blood or urine. Hair is currently recognized as thethird main biological material for use in drug analyses, besides urineand blood [12], and differs from the latter in that it offers a widerdetection window (months to years), hence enabling investigationof its chronic consumption. Since it is a long lasting solid, analy-sis of hair can be performed even centuries following its growth[13]. Collection of hair samples is a simple, non-invasive process,and adulteration is difficult. Where necessary, it is possible to col-
lect an additional sample, whose characteristics will be the sameas those of the previously collected sample, a feature impossibleto achieve with samples of blood or urine [14]. Furthermore, nospecial conditions are needed for transport or storage, since hairsamples are stable for prolonged periods of time [15].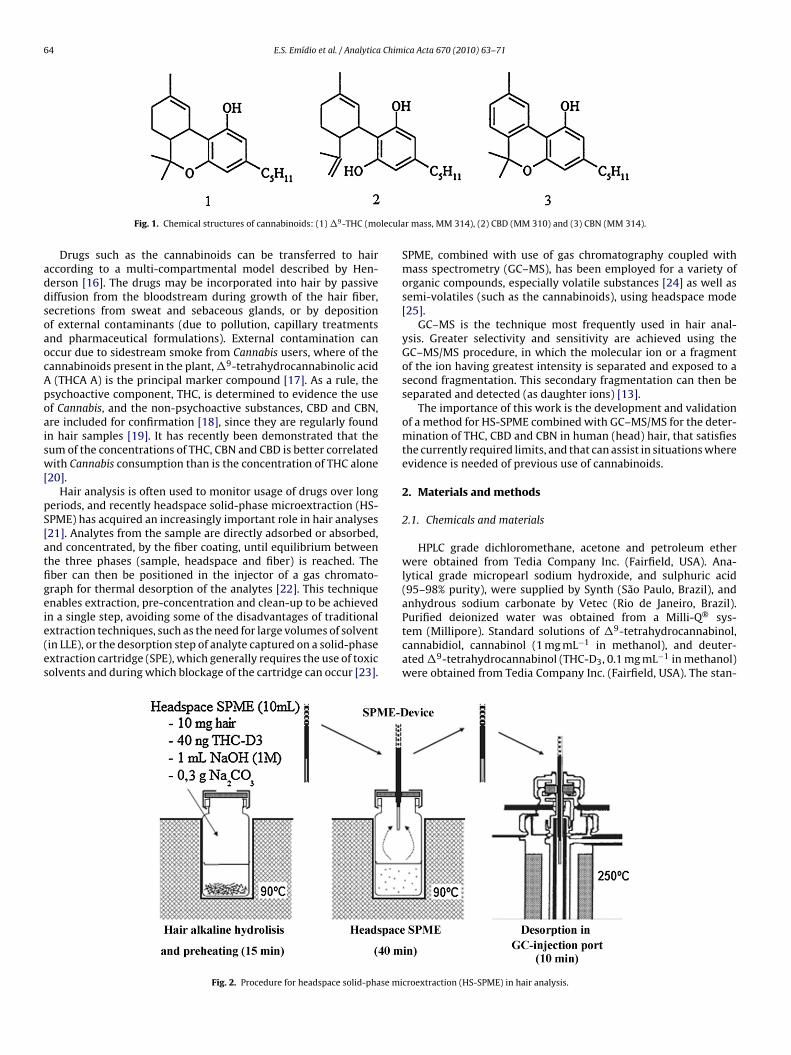
64 E.S. Emídio et al. / Analytica Chimica Acta 670 (2010) 63–71
lecula
addsoaocApoaisw[
pS[atfigeie(es
Fig. 1. Chemical structures of cannabinoids: (1) �9-THC (mo
Drugs such as the cannabinoids can be transferred to hairccording to a multi-compartmental model described by Hen-erson [16]. The drugs may be incorporated into hair by passiveiffusion from the bloodstream during growth of the hair fiber,ecretions from sweat and sebaceous glands, or by depositionf external contaminants (due to pollution, capillary treatmentsnd pharmaceutical formulations). External contamination canccur due to sidestream smoke from Cannabis users, where of theannabinoids present in the plant, �9-tetrahydrocannabinolic acid(THCA A) is the principal marker compound [17]. As a rule, the
sychoactive component, THC, is determined to evidence the usef Cannabis, and the non-psychoactive substances, CBD and CBN,re included for confirmation [18], since they are regularly foundn hair samples [19]. It has recently been demonstrated that theum of the concentrations of THC, CBN and CBD is better correlatedith Cannabis consumption than is the concentration of THC alone
20].Hair analysis is often used to monitor usage of drugs over long
eriods, and recently headspace solid-phase microextraction (HS-PME) has acquired an increasingly important role in hair analyses21]. Analytes from the sample are directly adsorbed or absorbed,nd concentrated, by the fiber coating, until equilibrium betweenhe three phases (sample, headspace and fiber) is reached. Theber can then be positioned in the injector of a gas chromato-raph for thermal desorption of the analytes [22]. This techniquenables extraction, pre-concentration and clean-up to be achieved
n a single step, avoiding some of the disadvantages of traditionalxtraction techniques, such as the need for large volumes of solventin LLE), or the desorption step of analyte captured on a solid-phasextraction cartridge (SPE), which generally requires the use of toxicolvents and during which blockage of the cartridge can occur [23].Fig. 2. Procedure for headspace solid-phase mi
r mass, MM 314), (2) CBD (MM 310) and (3) CBN (MM 314).
SPME, combined with use of gas chromatography coupled withmass spectrometry (GC–MS), has been employed for a variety oforganic compounds, especially volatile substances [24] as well assemi-volatiles (such as the cannabinoids), using headspace mode[25].
GC–MS is the technique most frequently used in hair anal-ysis. Greater selectivity and sensitivity are achieved using theGC–MS/MS procedure, in which the molecular ion or a fragmentof the ion having greatest intensity is separated and exposed to asecond fragmentation. This secondary fragmentation can then beseparated and detected (as daughter ions) [13].
The importance of this work is the development and validationof a method for HS-SPME combined with GC–MS/MS for the deter-mination of THC, CBD and CBN in human (head) hair, that satisfiesthe currently required limits, and that can assist in situations whereevidence is needed of previous use of cannabinoids.
2. Materials and methods
2.1. Chemicals and materials
HPLC grade dichloromethane, acetone and petroleum etherwere obtained from Tedia Company Inc. (Fairfield, USA). Ana-lytical grade micropearl sodium hydroxide, and sulphuric acid(95–98% purity), were supplied by Synth (São Paulo, Brazil), andanhydrous sodium carbonate by Vetec (Rio de Janeiro, Brazil).
Purified deionized water was obtained from a Milli-Q® sys-tem (Millipore). Standard solutions of �9-tetrahydrocannabinol,cannabidiol, cannabinol (1 mg mL−1 in methanol), and deuter-ated �9-tetrahydrocannabinol (THC-D3, 0.1 mg mL−1 in methanol)were obtained from Tedia Company Inc. (Fairfield, USA). The stan-croextraction (HS-SPME) in hair analysis.
E.S. Emídio et al. / Analytica Chimica Acta 670 (2010) 63–71 65
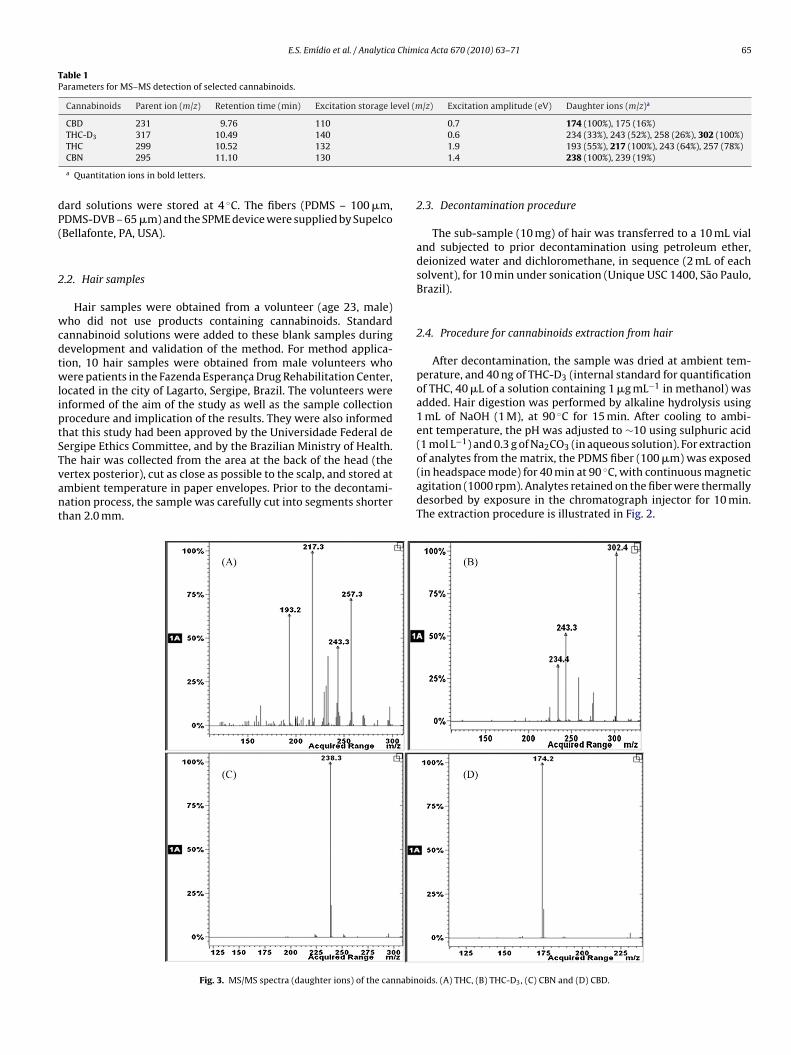
Table 1Parameters for MS–MS detection of selected cannabinoids.
Cannabinoids Parent ion (m/z) Retention time (min) Excitation storage level (m/z) Excitation amplitude (eV) Daughter ions (m/z)a
CBD 231 9.76 110 0.7 174 (100%), 175 (16%)THC-D 317 10.49 140 0.6 234 (33%), 243 (52%), 258 (26%), 302 (100%)
dP(
2
wcdtwliptSTvant
3
THC 299 10.52 132CBN 295 11.10 130
a Quantitation ions in bold letters.
ard solutions were stored at 4 ◦C. The fibers (PDMS – 100 �m,DMS-DVB – 65 �m) and the SPME device were supplied by SupelcoBellafonte, PA, USA).
.2. Hair samples
Hair samples were obtained from a volunteer (age 23, male)ho did not use products containing cannabinoids. Standard
annabinoid solutions were added to these blank samples duringevelopment and validation of the method. For method applica-ion, 10 hair samples were obtained from male volunteers whoere patients in the Fazenda Esperanca Drug Rehabilitation Center,
ocated in the city of Lagarto, Sergipe, Brazil. The volunteers werenformed of the aim of the study as well as the sample collectionrocedure and implication of the results. They were also informedhat this study had been approved by the Universidade Federal deergipe Ethics Committee, and by the Brazilian Ministry of Health.
he hair was collected from the area at the back of the head (theertex posterior), cut as close as possible to the scalp, and stored atmbient temperature in paper envelopes. Prior to the decontami-ation process, the sample was carefully cut into segments shorterhan 2.0 mm.Fig. 3. MS/MS spectra (daughter ions) of the cannabin
1.9 193 (55%), 217 (100%), 243 (64%), 257 (78%)1.4 238 (100%), 239 (19%)
2.3. Decontamination procedure
The sub-sample (10 mg) of hair was transferred to a 10 mL vialand subjected to prior decontamination using petroleum ether,deionized water and dichloromethane, in sequence (2 mL of eachsolvent), for 10 min under sonication (Unique USC 1400, São Paulo,Brazil).
2.4. Procedure for cannabinoids extraction from hair
After decontamination, the sample was dried at ambient tem-perature, and 40 ng of THC-D3 (internal standard for quantificationof THC, 40 �L of a solution containing 1 �g mL−1 in methanol) wasadded. Hair digestion was performed by alkaline hydrolysis using1 mL of NaOH (1 M), at 90 ◦C for 15 min. After cooling to ambi-ent temperature, the pH was adjusted to ∼10 using sulphuric acid(1 mol L−1) and 0.3 g of Na2CO3 (in aqueous solution). For extraction
of analytes from the matrix, the PDMS fiber (100 �m) was exposed(in headspace mode) for 40 min at 90 ◦C, with continuous magneticagitation (1000 rpm). Analytes retained on the fiber were thermallydesorbed by exposure in the chromatograph injector for 10 min.The extraction procedure is illustrated in Fig. 2.oids. (A) THC, (B) THC-D3, (C) CBN and (D) CBD.
6 Chimica Acta 670 (2010) 63–71
2
fiW8
iWcpalTwc(
ri
2
sscr2t(odtttac
3
3
twedresii2faea
mtdooa
THC–7.2) [27]. A substance is considered to be hydrophobic whenlog Kow ≥ 3.0 [28], when the molecules are highly lipophilic, andmore efficiently extracted by the non-polar PDMS fiber.
The conditions and parameter values used in this and subse-quent tests are provided in the captions to Figs. 4–12.
6 E.S. Emídio et al. / Analytica
.5. GC–MS analysis
Analyses were performed using a CP-3800 gas chromatograph,tted with a Saturn 4000 MS/MS ion trap mass detector (Varian,alnut Creek, CA, USA), split/splitless 1079 PTV injector and CP-
400 auto-sampler (Varian, Middelburg, Netherlands).Chromatographic separation was achieved using a VF-5ms cap-
llary column (30 m × 0.25 mm i.d., 0.25 �m film thickness, Varian,alnut Creek, CA, USA). Ultra-pure helium (99.999%) was used as
arrier gas, at a flow rate of 1.0 mL min−1. The furnace temperaturerogram was a ramp from 100 to 280 ◦C at 15 ◦C min−1, followed byhold at 280 ◦C for 6 min. The injector, manifold, source and transfer
ine temperatures were set to 250, 50, 190 and 250 ◦C, respectively.he solvent delay was 6.0 min. Splitless injection was employed,ith a split-valve off-time of 2.0 min. Data acquisition and pro-
essing were performed using Varian Star Workstation softwareversion 6.9). The total run time was 18 min.
The MS was first operated in full scan mode at 70 eV. The massange was 50–400 m/z, with 0.79 s/scan and zero thresholds. Theonization filament emission current was 10 �A.
.6. MS in MS/MS mode
The MS was used in tandem MS/MS mode to improve theensitivity and selectivity of the method. Mass spectrum analy-is employed electron impact (EI) mode, and target TIC, emissionurrent and scans averaged 1000 counts, 10 �A and 1 microscan,espectively. The selected quantification ions were m/z 174, 238,17 and 302 for CBD, CBN, THC and THC-D3, respectively. Excita-ion storage levels (storage RF) were m/z 110 (CBD), 132 (THC), 130CBN) and 140 (THC-D3), and the isolation window for the spectraf the components analyzed was 3 m/z. A study of collision-inducedissociation (CID) was performed to confirm adequate breakage ofhe most intense cannabinoid fragment (parent ion), and improvehe detectability of the technique. This was achieved by varyinghe excitation energy from 0 to 90 eV in the non-resonant mode,nd from 0 to 2 eV in the resonant mode, for direct injection ofannabinoid solution (1 �L) at a concentration of 5 �g mL−1.
. Results and discussion
.1. Optimization of GC–MS/MS conditions
Initially, the parent ions were selected from the mass spec-rum in full scan mode, then fragmentation of the parent ionas achieved by collision-induced dissociation (CID) in resonant
xcitation mode (intramolecular) for all of the analytes, which pro-uced better detectability (up to three times greater signal/noiseatio), compared to the non-resonant mode (intermolecular). Thexcitation energy was determined by means of various analy-es employing different voltage values, with an excitation energyncrease of 0.1 V per step. The mass spectra of the daughterons were obtained from the base ion (m/z 174–CBD; 217–THC;38–CBN; 302–THC-D3). Table 1 shows the analytical parametersor the cannabinoids in tandem mode MS/MS. Confirmation of thenalytes was obtained using their retention times and the pres-nce of the most intense daughter ions for each analyte (Table 1nd Fig. 3).
Greater selectivity is achieved in MS/MS mode than in full scanode, since only the fragment (parent ion) selected for refragmen-
ation remains in the trap, with the daughter ions proceeding to theetector. Hence the MS/MS mode is a very useful tool for analysisf complex matrices [13], including hair samples, that may possessther molecules (interferents) eluting at the same retention times the target analyte, which in full scan mode arrive at the detec-
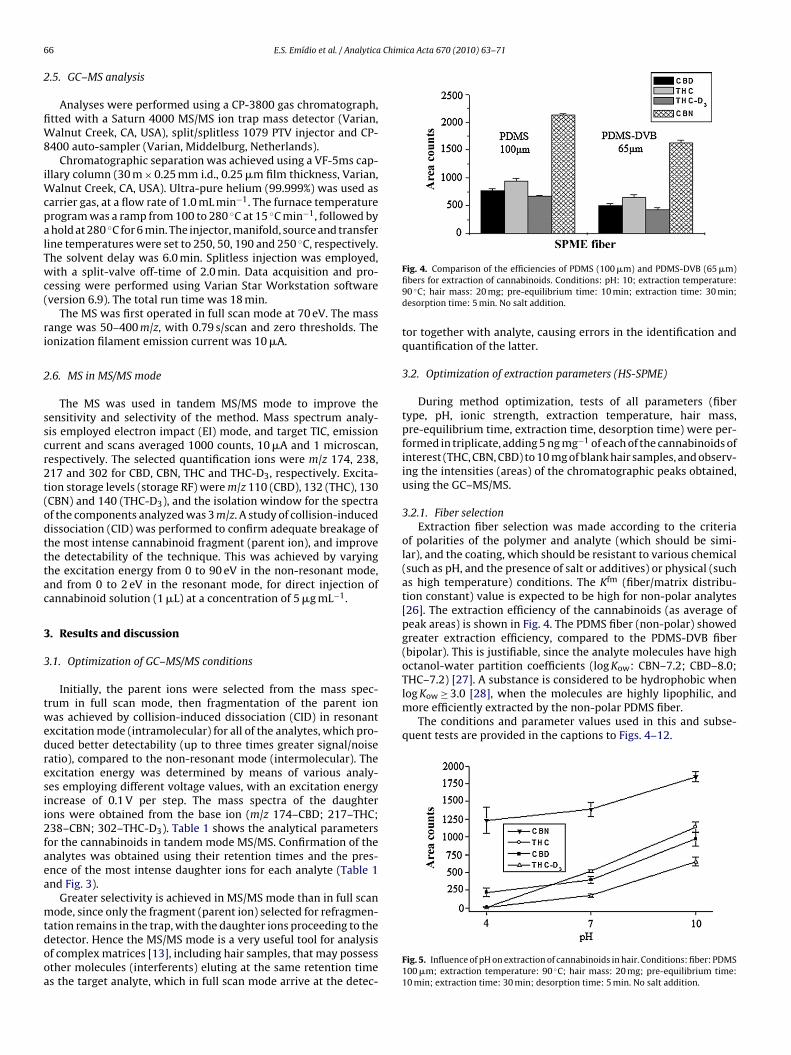
Fig. 4. Comparison of the efficiencies of PDMS (100 �m) and PDMS-DVB (65 �m)fibers for extraction of cannabinoids. Conditions: pH: 10; extraction temperature:90 ◦C; hair mass: 20 mg; pre-equilibrium time: 10 min; extraction time: 30 min;desorption time: 5 min. No salt addition.
tor together with analyte, causing errors in the identification andquantification of the latter.
3.2. Optimization of extraction parameters (HS-SPME)
During method optimization, tests of all parameters (fibertype, pH, ionic strength, extraction temperature, hair mass,pre-equilibrium time, extraction time, desorption time) were per-formed in triplicate, adding 5 ng mg−1 of each of the cannabinoids ofinterest (THC, CBN, CBD) to 10 mg of blank hair samples, and observ-ing the intensities (areas) of the chromatographic peaks obtained,using the GC–MS/MS.
3.2.1. Fiber selectionExtraction fiber selection was made according to the criteria
of polarities of the polymer and analyte (which should be simi-lar), and the coating, which should be resistant to various chemical(such as pH, and the presence of salt or additives) or physical (suchas high temperature) conditions. The Kfm (fiber/matrix distribu-tion constant) value is expected to be high for non-polar analytes[26]. The extraction efficiency of the cannabinoids (as average ofpeak areas) is shown in Fig. 4. The PDMS fiber (non-polar) showedgreater extraction efficiency, compared to the PDMS-DVB fiber(bipolar). This is justifiable, since the analyte molecules have highoctanol-water partition coefficients (log Kow: CBN–7.2; CBD–8.0;
Fig. 5. Influence of pH on extraction of cannabinoids in hair. Conditions: fiber: PDMS100 �m; extraction temperature: 90 ◦C; hair mass: 20 mg; pre-equilibrium time:10 min; extraction time: 30 min; desorption time: 5 min. No salt addition.
E.S. Emídio et al. / Analytica Chimica Acta 670 (2010) 63–71 67
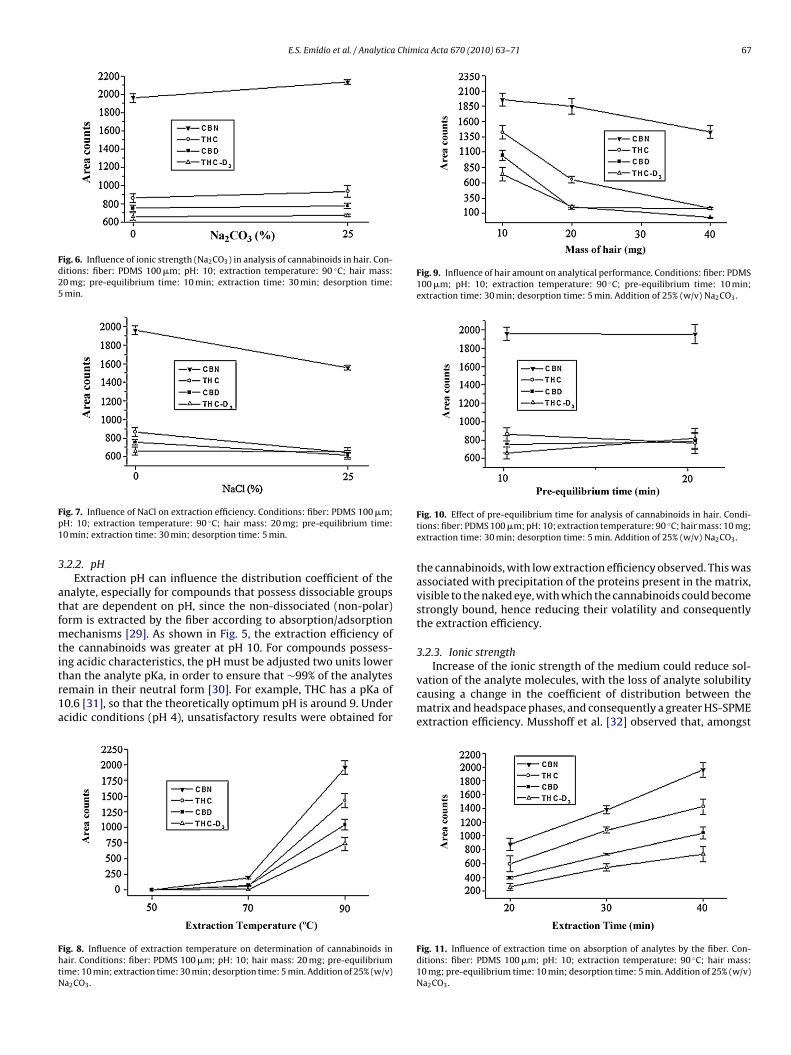
Fig. 6. Influence of ionic strength (Na2CO3) in analysis of cannabinoids in hair. Con-ditions: fiber: PDMS 100 �m; pH: 10; extraction temperature: 90 ◦C; hair mass:20 mg; pre-equilibrium time: 10 min; extraction time: 30 min; desorption time:5 min.
Fp1
3
atfmtitr1a
FhtN
Fig. 9. Influence of hair amount on analytical performance. Conditions: fiber: PDMS100 �m; pH: 10; extraction temperature: 90 ◦C; pre-equilibrium time: 10 min;extraction time: 30 min; desorption time: 5 min. Addition of 25% (w/v) Na2CO3.
ig. 7. Influence of NaCl on extraction efficiency. Conditions: fiber: PDMS 100 �m;H: 10; extraction temperature: 90 ◦C; hair mass: 20 mg; pre-equilibrium time:0 min; extraction time: 30 min; desorption time: 5 min.
.2.2. pHExtraction pH can influence the distribution coefficient of the
nalyte, especially for compounds that possess dissociable groupshat are dependent on pH, since the non-dissociated (non-polar)orm is extracted by the fiber according to absorption/adsorption
echanisms [29]. As shown in Fig. 5, the extraction efficiency ofhe cannabinoids was greater at pH 10. For compounds possess-
ng acidic characteristics, the pH must be adjusted two units lowerhan the analyte pKa, in order to ensure that ∼99% of the analytesemain in their neutral form [30]. For example, THC has a pKa of0.6 [31], so that the theoretically optimum pH is around 9. Undercidic conditions (pH 4), unsatisfactory results were obtained forig. 8. Influence of extraction temperature on determination of cannabinoids inair. Conditions: fiber: PDMS 100 �m; pH: 10; hair mass: 20 mg; pre-equilibriumime: 10 min; extraction time: 30 min; desorption time: 5 min. Addition of 25% (w/v)a2CO3.
Fig. 10. Effect of pre-equilibrium time for analysis of cannabinoids in hair. Condi-tions: fiber: PDMS 100 �m; pH: 10; extraction temperature: 90 ◦C; hair mass: 10 mg;extraction time: 30 min; desorption time: 5 min. Addition of 25% (w/v) Na2CO3.
the cannabinoids, with low extraction efficiency observed. This wasassociated with precipitation of the proteins present in the matrix,visible to the naked eye, with which the cannabinoids could becomestrongly bound, hence reducing their volatility and consequentlythe extraction efficiency.
3.2.3. Ionic strength
Increase of the ionic strength of the medium could reduce sol-vation of the analyte molecules, with the loss of analyte solubilitycausing a change in the coefficient of distribution between thematrix and headspace phases, and consequently a greater HS-SPMEextraction efficiency. Musshoff et al. [32] observed that, amongst
Fig. 11. Influence of extraction time on absorption of analytes by the fiber. Con-ditions: fiber: PDMS 100 �m; pH: 10; extraction temperature: 90 ◦C; hair mass:10 mg; pre-equilibrium time: 10 min; desorption time: 5 min. Addition of 25% (w/v)Na2CO3.
68 E.S. Emídio et al. / Analytica Chimica Acta 670 (2010) 63–71
Fn9A
vet(at
3
itmcieett
3
t(gao[ga
3
taKreiith
tdeit2
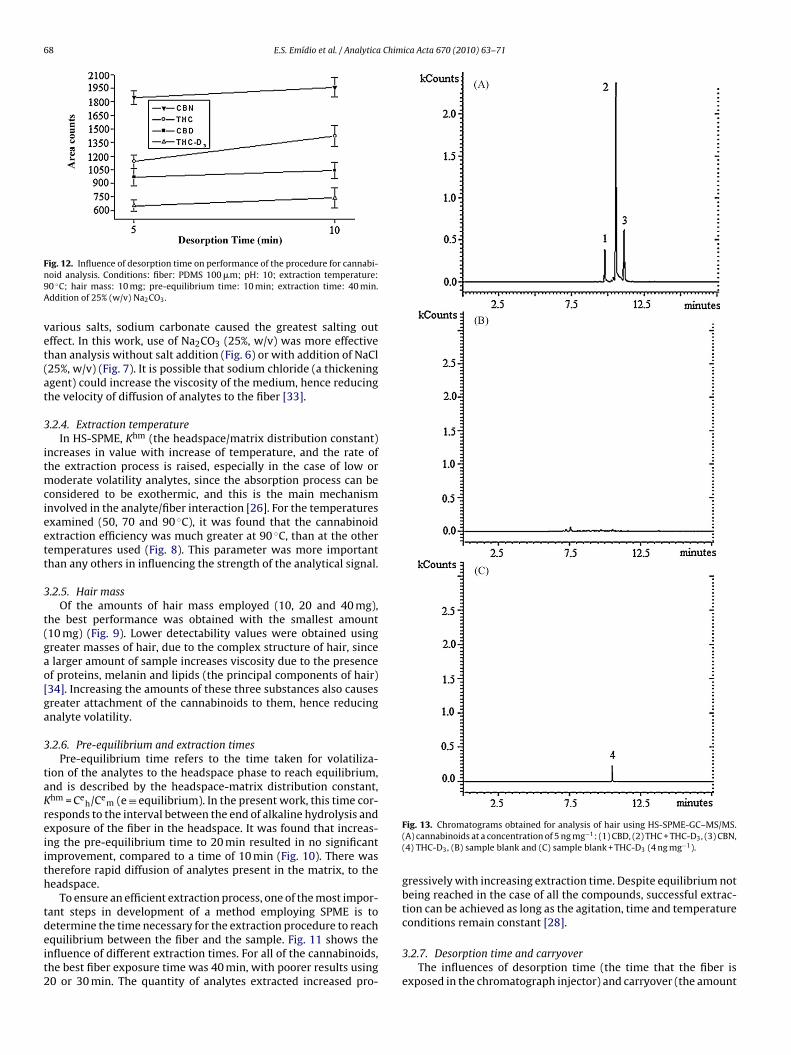
ig. 12. Influence of desorption time on performance of the procedure for cannabi-oid analysis. Conditions: fiber: PDMS 100 �m; pH: 10; extraction temperature:0 ◦C; hair mass: 10 mg; pre-equilibrium time: 10 min; extraction time: 40 min.ddition of 25% (w/v) Na2CO3.
arious salts, sodium carbonate caused the greatest salting outffect. In this work, use of Na2CO3 (25%, w/v) was more effectivehan analysis without salt addition (Fig. 6) or with addition of NaCl25%, w/v) (Fig. 7). It is possible that sodium chloride (a thickeninggent) could increase the viscosity of the medium, hence reducinghe velocity of diffusion of analytes to the fiber [33].
.2.4. Extraction temperatureIn HS-SPME, Khm (the headspace/matrix distribution constant)
ncreases in value with increase of temperature, and the rate ofhe extraction process is raised, especially in the case of low or
oderate volatility analytes, since the absorption process can beonsidered to be exothermic, and this is the main mechanismnvolved in the analyte/fiber interaction [26]. For the temperaturesxamined (50, 70 and 90 ◦C), it was found that the cannabinoidxtraction efficiency was much greater at 90 ◦C, than at the otheremperatures used (Fig. 8). This parameter was more importanthan any others in influencing the strength of the analytical signal.
.2.5. Hair massOf the amounts of hair mass employed (10, 20 and 40 mg),
he best performance was obtained with the smallest amount10 mg) (Fig. 9). Lower detectability values were obtained usingreater masses of hair, due to the complex structure of hair, sincelarger amount of sample increases viscosity due to the presencef proteins, melanin and lipids (the principal components of hair)34]. Increasing the amounts of these three substances also causesreater attachment of the cannabinoids to them, hence reducingnalyte volatility.
.2.6. Pre-equilibrium and extraction timesPre-equilibrium time refers to the time taken for volatiliza-
ion of the analytes to the headspace phase to reach equilibrium,nd is described by the headspace-matrix distribution constant,hm = Ce
h/Cem (e ≡ equilibrium). In the present work, this time cor-
esponds to the interval between the end of alkaline hydrolysis andxposure of the fiber in the headspace. It was found that increas-ng the pre-equilibrium time to 20 min resulted in no significantmprovement, compared to a time of 10 min (Fig. 10). There washerefore rapid diffusion of analytes present in the matrix, to theeadspace.
To ensure an efficient extraction process, one of the most impor-ant steps in development of a method employing SPME is to
etermine the time necessary for the extraction procedure to reachquilibrium between the fiber and the sample. Fig. 11 shows thenfluence of different extraction times. For all of the cannabinoids,he best fiber exposure time was 40 min, with poorer results using0 or 30 min. The quantity of analytes extracted increased pro-Fig. 13. Chromatograms obtained for analysis of hair using HS-SPME-GC–MS/MS.(A) cannabinoids at a concentration of 5 ng mg−1: (1) CBD, (2) THC + THC-D3, (3) CBN,(4) THC-D3, (B) sample blank and (C) sample blank + THC-D3 (4 ng mg−1).
gressively with increasing extraction time. Despite equilibrium notbeing reached in the case of all the compounds, successful extrac-tion can be achieved as long as the agitation, time and temperatureconditions remain constant [28].
3.2.7. Desorption time and carryoverThe influences of desorption time (the time that the fiber is
exposed in the chromatograph injector) and carryover (the amount
E.S. Emídio et al. / Analytica Chimica Acta 670 (2010) 63–71 69
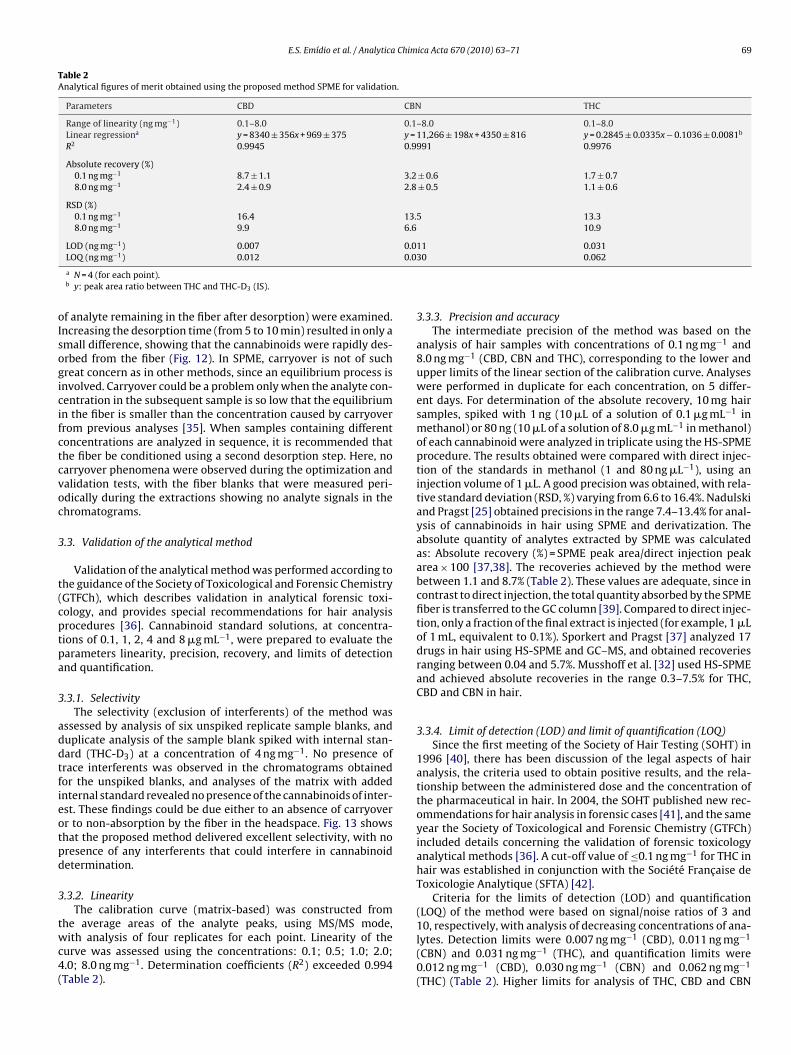
Table 2Analytical figures of merit obtained using the proposed method SPME for validation.
Parameters CBD CBN THC
Range of linearity (ng mg−1) 0.1–8.0 0.1–8.0 0.1–8.0Linear regressiona y = 8340 ± 356x + 969 ± 375 y = 11,266 ± 198x + 4350 ± 816 y = 0.2845 ± 0.0335x − 0.1036 ± 0.0081b
R2 0.9945 0.9991 0.9976
Absolute recovery (%)0.1 ng mg−1 8.7 ± 1.1 3.2 ± 0.6 1.7 ± 0.78.0 ng mg−1 2.4 ± 0.9 2.8 ± 0.5 1.1 ± 0.6
RSD (%)0.1 ng mg−1 16.4 13.5 13.38.0 ng mg−1 9.9 6.6 10.9
LOD (ng mg−1) 0.007 0.011 0.0310.0
oIsogicifctcvoc
3
t(cptpa
3
addtfieotpd
3
twc4(
LOQ (ng mg−1) 0.012
a N = 4 (for each point).b y: peak area ratio between THC and THC-D3 (IS).
f analyte remaining in the fiber after desorption) were examined.ncreasing the desorption time (from 5 to 10 min) resulted in only amall difference, showing that the cannabinoids were rapidly des-rbed from the fiber (Fig. 12). In SPME, carryover is not of suchreat concern as in other methods, since an equilibrium process isnvolved. Carryover could be a problem only when the analyte con-entration in the subsequent sample is so low that the equilibriumn the fiber is smaller than the concentration caused by carryoverrom previous analyses [35]. When samples containing differentoncentrations are analyzed in sequence, it is recommended thathe fiber be conditioned using a second desorption step. Here, noarryover phenomena were observed during the optimization andalidation tests, with the fiber blanks that were measured peri-dically during the extractions showing no analyte signals in thehromatograms.
.3. Validation of the analytical method
Validation of the analytical method was performed according tohe guidance of the Society of Toxicological and Forensic ChemistryGTFCh), which describes validation in analytical forensic toxi-ology, and provides special recommendations for hair analysisrocedures [36]. Cannabinoid standard solutions, at concentra-ions of 0.1, 1, 2, 4 and 8 �g mL−1, were prepared to evaluate thearameters linearity, precision, recovery, and limits of detectionnd quantification.
.3.1. SelectivityThe selectivity (exclusion of interferents) of the method was
ssessed by analysis of six unspiked replicate sample blanks, anduplicate analysis of the sample blank spiked with internal stan-ard (THC-D3) at a concentration of 4 ng mg−1. No presence ofrace interferents was observed in the chromatograms obtainedor the unspiked blanks, and analyses of the matrix with addednternal standard revealed no presence of the cannabinoids of inter-st. These findings could be due either to an absence of carryoverr to non-absorption by the fiber in the headspace. Fig. 13 showshat the proposed method delivered excellent selectivity, with noresence of any interferents that could interfere in cannabinoidetermination.
.3.2. LinearityThe calibration curve (matrix-based) was constructed from
he average areas of the analyte peaks, using MS/MS mode,ith analysis of four replicates for each point. Linearity of the
urve was assessed using the concentrations: 0.1; 0.5; 1.0; 2.0;.0; 8.0 ng mg−1. Determination coefficients (R2) exceeded 0.994Table 2).
30 0.062
3.3.3. Precision and accuracyThe intermediate precision of the method was based on the
analysis of hair samples with concentrations of 0.1 ng mg−1 and8.0 ng mg−1 (CBD, CBN and THC), corresponding to the lower andupper limits of the linear section of the calibration curve. Analyseswere performed in duplicate for each concentration, on 5 differ-ent days. For determination of the absolute recovery, 10 mg hairsamples, spiked with 1 ng (10 �L of a solution of 0.1 �g mL−1 inmethanol) or 80 ng (10 �L of a solution of 8.0 �g mL−1 in methanol)of each cannabinoid were analyzed in triplicate using the HS-SPMEprocedure. The results obtained were compared with direct injec-tion of the standards in methanol (1 and 80 ng �L−1), using aninjection volume of 1 �L. A good precision was obtained, with rela-tive standard deviation (RSD, %) varying from 6.6 to 16.4%. Nadulskiand Pragst [25] obtained precisions in the range 7.4–13.4% for anal-ysis of cannabinoids in hair using SPME and derivatization. Theabsolute quantity of analytes extracted by SPME was calculatedas: Absolute recovery (%) = SPME peak area/direct injection peakarea × 100 [37,38]. The recoveries achieved by the method werebetween 1.1 and 8.7% (Table 2). These values are adequate, since incontrast to direct injection, the total quantity absorbed by the SPMEfiber is transferred to the GC column [39]. Compared to direct injec-tion, only a fraction of the final extract is injected (for example, 1 �Lof 1 mL, equivalent to 0.1%). Sporkert and Pragst [37] analyzed 17drugs in hair using HS-SPME and GC–MS, and obtained recoveriesranging between 0.04 and 5.7%. Musshoff et al. [32] used HS-SPMEand achieved absolute recoveries in the range 0.3–7.5% for THC,CBD and CBN in hair.
3.3.4. Limit of detection (LOD) and limit of quantification (LOQ)Since the first meeting of the Society of Hair Testing (SOHT) in
1996 [40], there has been discussion of the legal aspects of hairanalysis, the criteria used to obtain positive results, and the rela-tionship between the administered dose and the concentration ofthe pharmaceutical in hair. In 2004, the SOHT published new rec-ommendations for hair analysis in forensic cases [41], and the sameyear the Society of Toxicological and Forensic Chemistry (GTFCh)included details concerning the validation of forensic toxicologyanalytical methods [36]. A cut-off value of ≤0.1 ng mg−1 for THC inhair was established in conjunction with the Société Francaise deToxicologie Analytique (SFTA) [42].
Criteria for the limits of detection (LOD) and quantification(LOQ) of the method were based on signal/noise ratios of 3 and
10, respectively, with analysis of decreasing concentrations of ana-lytes. Detection limits were 0.007 ng mg−1 (CBD), 0.011 ng mg−1(CBN) and 0.031 ng mg−1 (THC), and quantification limits were0.012 ng mg−1 (CBD), 0.030 ng mg−1 (CBN) and 0.062 ng mg−1
(THC) (Table 2). Higher limits for analysis of THC, CBD and CBN
70 E.S. Emídio et al. / Analytica Chimica Acta 670 (2010) 63–71
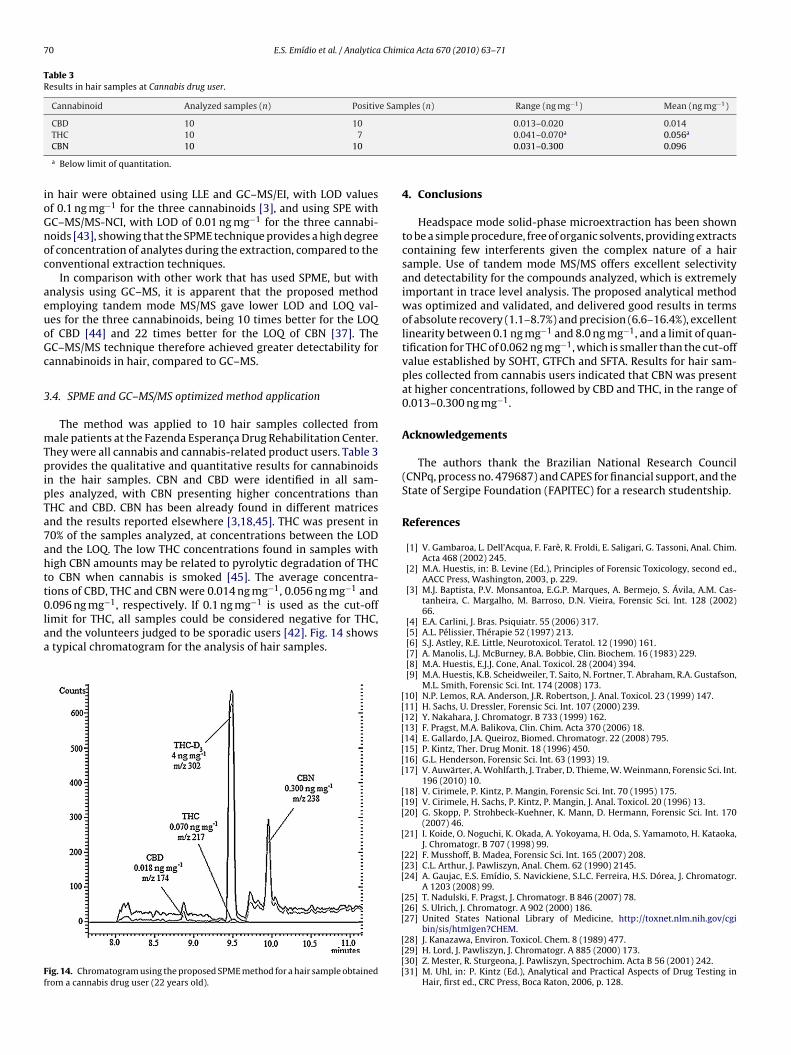
Table 3Results in hair samples at Cannabis drug user.
Cannabinoid Analyzed samples (n) Positive Samples (n) Range (ng mg−1) Mean (ng mg−1)
CBD 10 10 0.013–0.020 0.014
ioGnoc
aeuoGc
3
mTpipTa7ahtt0laa
Ff
THC 10 7CBN 10 10
a Below limit of quantitation.
n hair were obtained using LLE and GC–MS/EI, with LOD valuesf 0.1 ng mg−1 for the three cannabinoids [3], and using SPE withC–MS/MS-NCI, with LOD of 0.01 ng mg−1 for the three cannabi-oids [43], showing that the SPME technique provides a high degreef concentration of analytes during the extraction, compared to theonventional extraction techniques.
In comparison with other work that has used SPME, but withnalysis using GC–MS, it is apparent that the proposed methodmploying tandem mode MS/MS gave lower LOD and LOQ val-es for the three cannabinoids, being 10 times better for the LOQf CBD [44] and 22 times better for the LOQ of CBN [37]. TheC–MS/MS technique therefore achieved greater detectability forannabinoids in hair, compared to GC–MS.
.4. SPME and GC–MS/MS optimized method application
The method was applied to 10 hair samples collected fromale patients at the Fazenda Esperanca Drug Rehabilitation Center.
hey were all cannabis and cannabis-related product users. Table 3rovides the qualitative and quantitative results for cannabinoids
n the hair samples. CBN and CBD were identified in all sam-les analyzed, with CBN presenting higher concentrations thanHC and CBD. CBN has been already found in different matricesnd the results reported elsewhere [3,18,45]. THC was present in0% of the samples analyzed, at concentrations between the LODnd the LOQ. The low THC concentrations found in samples withigh CBN amounts may be related to pyrolytic degradation of THCo CBN when cannabis is smoked [45]. The average concentra-ions of CBD, THC and CBN were 0.014 ng mg−1, 0.056 ng mg−1 and
.096 ng mg−1, respectively. If 0.1 ng mg−1 is used as the cut-offimit for THC, all samples could be considered negative for THC,nd the volunteers judged to be sporadic users [42]. Fig. 14 showstypical chromatogram for the analysis of hair samples.
ig. 14. Chromatogram using the proposed SPME method for a hair sample obtainedrom a cannabis drug user (22 years old).
[[[[[[[[
[[[
[
[[[
[[[
[[[[
0.041–0.070a 0.056a
0.031–0.300 0.096
4. Conclusions
Headspace mode solid-phase microextraction has been shownto be a simple procedure, free of organic solvents, providing extractscontaining few interferents given the complex nature of a hairsample. Use of tandem mode MS/MS offers excellent selectivityand detectability for the compounds analyzed, which is extremelyimportant in trace level analysis. The proposed analytical methodwas optimized and validated, and delivered good results in termsof absolute recovery (1.1–8.7%) and precision (6.6–16.4%), excellentlinearity between 0.1 ng mg−1 and 8.0 ng mg−1, and a limit of quan-tification for THC of 0.062 ng mg−1, which is smaller than the cut-offvalue established by SOHT, GTFCh and SFTA. Results for hair sam-ples collected from cannabis users indicated that CBN was presentat higher concentrations, followed by CBD and THC, in the range of0.013–0.300 ng mg−1.
Acknowledgements
The authors thank the Brazilian National Research Council(CNPq, process no. 479687) and CAPES for financial support, and theState of Sergipe Foundation (FAPITEC) for a research studentship.
References
[1] V. Gambaroa, L. Dell’Acqua, F. Farè, R. Froldi, E. Saligari, G. Tassoni, Anal. Chim.Acta 468 (2002) 245.
[2] M.A. Huestis, in: B. Levine (Ed.), Principles of Forensic Toxicology, second ed.,AACC Press, Washington, 2003, p. 229.
[3] M.J. Baptista, P.V. Monsantoa, E.G.P. Marques, A. Bermejo, S. Ávila, A.M. Cas-tanheira, C. Margalho, M. Barroso, D.N. Vieira, Forensic Sci. Int. 128 (2002)66.
[4] E.A. Carlini, J. Bras. Psiquiatr. 55 (2006) 317.[5] A.L. Pélissier, Thérapie 52 (1997) 213.[6] S.J. Astley, R.E. Little, Neurotoxicol. Teratol. 12 (1990) 161.[7] A. Manolis, L.J. McBurney, B.A. Bobbie, Clin. Biochem. 16 (1983) 229.[8] M.A. Huestis, E.J.J. Cone, Anal. Toxicol. 28 (2004) 394.[9] M.A. Huestis, K.B. Scheidweiler, T. Saito, N. Fortner, T. Abraham, R.A. Gustafson,
M.L. Smith, Forensic Sci. Int. 174 (2008) 173.10] N.P. Lemos, R.A. Anderson, J.R. Robertson, J. Anal. Toxicol. 23 (1999) 147.11] H. Sachs, U. Dressler, Forensic Sci. Int. 107 (2000) 239.12] Y. Nakahara, J. Chromatogr. B 733 (1999) 162.13] F. Pragst, M.A. Balikova, Clin. Chim. Acta 370 (2006) 18.14] E. Gallardo, J.A. Queiroz, Biomed. Chromatogr. 22 (2008) 795.15] P. Kintz, Ther. Drug Monit. 18 (1996) 450.16] G.L. Henderson, Forensic Sci. Int. 63 (1993) 19.17] V. Auwärter, A. Wohlfarth, J. Traber, D. Thieme, W. Weinmann, Forensic Sci. Int.
196 (2010) 10.18] V. Cirimele, P. Kintz, P. Mangin, Forensic Sci. Int. 70 (1995) 175.19] V. Cirimele, H. Sachs, P. Kintz, P. Mangin, J. Anal. Toxicol. 20 (1996) 13.20] G. Skopp, P. Strohbeck-Kuehner, K. Mann, D. Hermann, Forensic Sci. Int. 170
(2007) 46.21] I. Koide, O. Noguchi, K. Okada, A. Yokoyama, H. Oda, S. Yamamoto, H. Kataoka,
J. Chromatogr. B 707 (1998) 99.22] F. Musshoff, B. Madea, Forensic Sci. Int. 165 (2007) 208.23] C.L. Arthur, J. Pawliszyn, Anal. Chem. 62 (1990) 2145.24] A. Gaujac, E.S. Emídio, S. Navickiene, S.L.C. Ferreira, H.S. Dórea, J. Chromatogr.
A 1203 (2008) 99.25] T. Nadulski, F. Pragst, J. Chromatogr. B 846 (2007) 78.26] S. Ulrich, J. Chromatogr. A 902 (2000) 186.27] United States National Library of Medicine, http://toxnet.nlm.nih.gov/cgi
bin/sis/htmlgen?CHEM.28] J. Kanazawa, Environ. Toxicol. Chem. 8 (1989) 477.29] H. Lord, J. Pawliszyn, J. Chromatogr. A 885 (2000) 173.30] Z. Mester, R. Sturgeona, J. Pawliszyn, Spectrochim. Acta B 56 (2001) 242.31] M. Uhl, in: P. Kintz (Ed.), Analytical and Practical Aspects of Drug Testing in
Hair, first ed., CRC Press, Boca Raton, 2006, p. 128.

Chim
[
[[[[
[[
[
[40] Society of hair testing, Forensic Sci. Int. 84 (1997) 3.[41] Society of hair testing, Forensic Sci. Int. 145 (2004) 83.
E.S. Emídio et al. / Analytica
32] F. Musshoff, H.P. Junker, D.W. Lachenmeier, L. Kroener, B. Madea, J. Anal. Toxicol.26 (2002) 554.
33] M.R. Lee, Y.C. Yeh, W.S. Hsiang, C.C. Chen, J. Chromatogr. B 707 (1997) 91.34] M.R. Harkey, Forensic Sci. Int. 63 (1993) 9.
35] T. Gorecki, J. Pawliszyn, Anal. Chem. 67 (1995) 3265.36] F.T. Peters, M. Hartung, M. Herbold, G. Schmitt, T. Daldrup, F. Musshoff, Toxi-chem. Krimtech. 71 (2004) 146.37] F. Sporkert, F. Pragst, Forensic Sci. Int. 107 (2000) 129.38] F. Musshoff, D.W. Lachenmeier, L. Kroener, B. Madea, Forensic Sci. Int. 133
(2003) 32.
[[[[
ica Acta 670 (2010) 63–71 71
39] M. Nishida, M. Yashiki, A. Namera, K. Kimura, J. Chromatogr. B 842 (2006)110.
42] F. Pragst, T. Nadulski, Ann. Toxicol. Anal. 17 (2005) 237.43] J. Wicks, L.M.T. Tsanaclis, Ann. Toxicol. Anal. 17 (2005) 120.44] C.D.R. de Oliveira, M. Yonamine, R.L.M. Moreau, J. Sep. Sci. 30 (2007) 133.45] S. Strano-Rossi, M. Chiarotti, J. Anal. Toxicol. 23 (1999) 7.