Water analysis of the sixteen environmental protection agency—polycyclic aromatic hydrocarbons via...
8
Journal of Chromatography A, 1345 (2014) 1–8 Contents lists available at ScienceDirect Journal of Chromatography A j o ur na l ho me page: www.elsevier.com/locate/chroma Water analysis of the sixteen environmental protection agency—polycyclic aromatic hydrocarbons via solid-phase nanoextraction-gas chromatography/mass spectrometry Walter B. Wilson, Udienza Hewitt, Mattheu Miller, Andres D. Campiglia ∗ Department of Chemistry, 4000 Central Florida Blvd, Physical Sciences Room 255, University of Central Florida, Orlando, FL 32816-2366, USA a r t i c l e i n f o Article history: Received 20 December 2013 Received in revised form 19 March 2014 Accepted 30 March 2014 Available online 4 April 2014 Keywords: Polycyclic aromatic hydrocarbons Solid-phase nanoextraction Gas chromatography-mass spectrometry Gold nanoparticles Water analysis a b s t r a c t The growing concern with a sustainable environment poses a new challenge to analytical chemists facing the routine monitoring of polycyclic aromatic hydrocarbons (PAHs) in water samples. The new method presented here meets several features of green analytical chemistry. PAHs are extracted from 500 L of water sample with 1 mL of a gold nanoparticles aqueous solution and released with 100 L of organic solvents for subsequent analysis via gas chromatography/mass spectrometry. The relative standard devi- ations of the overall procedure ranged from 2.4 (acenaphthene) to 7.8% (dibenz[a,h]anthracene). The limits of detection were excellent as well and varied from 4.94 (fluoranthene) to 65.5 ng L −1 (fluorene). The excellent analytical figures of merit, the simplicity of the experimental procedure, the short analysis time and the reduced solvent consumption demonstrate the potential of this approach for the routine monitoring of the sixteen priority pollutants via and environmentally friendly methodology. © 2014 Elsevier B.V. All rights reserved. 1. Introduction The fact that polycyclic aromatic hydrocarbons (PAHs), which originate from many natural and anthropogenic sources, can induce cancer has been documented in numerous epi- demiological studies [1–6]. The US Environmental Protection Agency (EPA) includes sixteen PAHs in its priority pollutants list, namely benz[a]anthracene (B[a]A), benzo[b]fluoranthene (B[b]F), benzo[k]fluoranthene (B[k]F), benzo[a]pyrene (B[a]P), dibenz[a,h]anthracene (DB[a,h]A), indeno[1,2,3-cd]pyrene (I[1,2,3- cd]P), naphthalene (Nap), acenaphthylene (Aceny), acenaph- thene (Acen), fluorene (Flu), phenanthrene (Phen), anthracene (Ant), fluoranthene (Fluo), pyrene (Pyr), chrysene (Chr), and benzo[ghi]perylene (B[ghi]P) [7]. Since a primary route of human exposure to PAHs is contaminated water, the routine monitoring of the sixteen EPA-PAHs is recommended in water samples taken from municipal wells and agricultural irrigation sources such as ponds, lakes and rivers [8–21]. Maximum contaminant levels (MCL) of regulated PAHs range from 10 to 200 ng L −1 [7,22]. The EPA recommends MCL not to exceed 200 ng L −1 . The European Union and the World Health Orga- nization (WHO) have set a 10 ng L −1 MCL value for the highly ∗ Corresponding author. Tel.: +1 4078234162. E-mail address: [email protected] (A.D. Campiglia). toxic B[a]P and 200 ng L −1 MCL values for Fluo, B[b]F, B[k]F, B[ghi]P, and I[1,2,3-cd]P. These rather low concentration levels make water analysis a particularly challenging task. The clas- sic approach follows the sequence of sample preparation and chromatographic analysis. By removing PAHs from the water sample into an organic solvent suitable for chromatographic anal- ysis, sample preparation pre-concentrates PAHs, simplifies matrix composition and facilitates analytical resolution in the chromato- graphic column. Solid-phase extraction (SPE) is nowadays the recommended method for water samples [23]. When compared to liquid–liquid extraction, SPE reduces solvent consumption, pre- vents emulsions and provides better extraction efficiency. The main disadvantage of SPE is its long processing time. The extrac- tion of 1 L of water – which is the recommended volume to reach detectable PAHs concentrations by classic chromatographic approaches [23] – adds approximately 1 h to the total analysis time. High-performance liquid chromatography (HPLC) and gas chro- matography/mass spectrometry (GC/MS) are the basis of EPA methodology. Ultraviolet absorption (254 nm) and room temper- ature fluorescence detection are widely used in HPLC, but the selectivity of these detectors is modest. Since PAHs identification is solely based on retention times, unambiguous PAH identification requires complete chromatographic resolution in the separation column. When HPLC is applied to “unfamiliar” samples, a suppor- ting analytical technique such as GC/MS is recommended to verify http://dx.doi.org/10.1016/j.chroma.2014.03.082 0021-9673/© 2014 Elsevier B.V. All rights reserved.
-
Upload
independent -
Category
Documents
-
view
3 -
download
0
Transcript of Water analysis of the sixteen environmental protection agency—polycyclic aromatic hydrocarbons via...

Wan
WD
a
ARRAA
KPSGGW
1
wcdAl(dct(beofp
fen
h0
Journal of Chromatography A, 1345 (2014) 1–8
Contents lists available at ScienceDirect
Journal of Chromatography A
j o ur na l ho me page: www.elsev ier .com/ locate /chroma
ater analysis of the sixteen environmental protectiongency—polycyclic aromatic hydrocarbons via solid-phaseanoextraction-gas chromatography/mass spectrometry
alter B. Wilson, Udienza Hewitt, Mattheu Miller, Andres D. Campiglia ∗
epartment of Chemistry, 4000 Central Florida Blvd, Physical Sciences Room 255, University of Central Florida, Orlando, FL 32816-2366, USA
r t i c l e i n f o
rticle history:eceived 20 December 2013eceived in revised form 19 March 2014ccepted 30 March 2014vailable online 4 April 2014
a b s t r a c t
The growing concern with a sustainable environment poses a new challenge to analytical chemists facingthe routine monitoring of polycyclic aromatic hydrocarbons (PAHs) in water samples. The new methodpresented here meets several features of green analytical chemistry. PAHs are extracted from 500 �L ofwater sample with 1 mL of a gold nanoparticles aqueous solution and released with 100 �L of organicsolvents for subsequent analysis via gas chromatography/mass spectrometry. The relative standard devi-
eywords:olycyclic aromatic hydrocarbonsolid-phase nanoextractionas chromatography-mass spectrometryold nanoparticlesater analysis
ations of the overall procedure ranged from 2.4 (acenaphthene) to 7.8% (dibenz[a,h]anthracene). Thelimits of detection were excellent as well and varied from 4.94 (fluoranthene) to 65.5 ng L−1 (fluorene).The excellent analytical figures of merit, the simplicity of the experimental procedure, the short analysistime and the reduced solvent consumption demonstrate the potential of this approach for the routinemonitoring of the sixteen priority pollutants via and environmentally friendly methodology.
© 2014 Elsevier B.V. All rights reserved.
. Introduction
The fact that polycyclic aromatic hydrocarbons (PAHs),hich originate from many natural and anthropogenic sources,
an induce cancer has been documented in numerous epi-emiological studies [1–6]. The US Environmental Protectiongency (EPA) includes sixteen PAHs in its priority pollutants
ist, namely benz[a]anthracene (B[a]A), benzo[b]fluorantheneB[b]F), benzo[k]fluoranthene (B[k]F), benzo[a]pyrene (B[a]P),ibenz[a,h]anthracene (DB[a,h]A), indeno[1,2,3-cd]pyrene (I[1,2,3-d]P), naphthalene (Nap), acenaphthylene (Aceny), acenaph-hene (Acen), fluorene (Flu), phenanthrene (Phen), anthraceneAnt), fluoranthene (Fluo), pyrene (Pyr), chrysene (Chr), andenzo[ghi]perylene (B[ghi]P) [7]. Since a primary route of humanxposure to PAHs is contaminated water, the routine monitoringf the sixteen EPA-PAHs is recommended in water samples takenrom municipal wells and agricultural irrigation sources such asonds, lakes and rivers [8–21].
Maximum contaminant levels (MCL) of regulated PAHs range
rom 10 to 200 ng L−1 [7,22]. The EPA recommends MCL not toxceed 200 ng L−1. The European Union and the World Health Orga-ization (WHO) have set a 10 ng L−1 MCL value for the highly∗ Corresponding author. Tel.: +1 4078234162.E-mail address: [email protected] (A.D. Campiglia).
ttp://dx.doi.org/10.1016/j.chroma.2014.03.082021-9673/© 2014 Elsevier B.V. All rights reserved.
toxic B[a]P and 200 ng L−1 MCL values for Fluo, B[b]F, B[k]F,B[ghi]P, and I[1,2,3-cd]P. These rather low concentration levelsmake water analysis a particularly challenging task. The clas-sic approach follows the sequence of sample preparation andchromatographic analysis. By removing PAHs from the watersample into an organic solvent suitable for chromatographic anal-ysis, sample preparation pre-concentrates PAHs, simplifies matrixcomposition and facilitates analytical resolution in the chromato-graphic column. Solid-phase extraction (SPE) is nowadays therecommended method for water samples [23]. When comparedto liquid–liquid extraction, SPE reduces solvent consumption, pre-vents emulsions and provides better extraction efficiency. Themain disadvantage of SPE is its long processing time. The extrac-tion of 1 L of water – which is the recommended volume toreach detectable PAHs concentrations by classic chromatographicapproaches [23] – adds approximately 1 h to the total analysistime.
High-performance liquid chromatography (HPLC) and gas chro-matography/mass spectrometry (GC/MS) are the basis of EPAmethodology. Ultraviolet absorption (254 nm) and room temper-ature fluorescence detection are widely used in HPLC, but theselectivity of these detectors is modest. Since PAHs identification is
solely based on retention times, unambiguous PAH identificationrequires complete chromatographic resolution in the separationcolumn. When HPLC is applied to “unfamiliar” samples, a suppor-ting analytical technique such as GC/MS is recommended to verify
2 romat
c[
oWpoocpgop–s
osdT(tmaGiapv
2
2
taTc1GAS(
t
2
mdsdciv
2
oaspt
W.B. Wilson et al. / J. Ch
ompound identification and to check peak-purity of HPLC fractions23].
Research efforts in our lab have focused on the developmentf analytical methodology for a sustainable environment [24–26].ithin the concept of green analytical chemistry [27–29], HPLC
resents a distinct disadvantage over GC/MS, which is the need ofrganic solvents for PAHs separation. Under classic EPA method-logy [23], the HPLC analysis of the sixteen priority pollutantsonsumes approximately 75 mL of mobile phase (methanol-water)er sample. Considering the gradient elution of the chromato-raphic separation, this mobile phase volume is equivalent to 66 mLf methanol. Adding the volumes of eluting solvents from the SPErocedure – i.e., 5 mL of ethyl acetate and 5 mL of methyl chloride
the total volume of organic solvents is approximately 76 mL perample.
The new method we present here requires only 100 �L ofrganic solvent per sample. EPA-PAHs are extracted from wateramples with the aid of an experimental procedure previouslyeveloped for the analysis of high-molecular weight PAHs [30,31].his procedure – which we have named solid-phase nanoextractionSPNE) – takes advantage of the strong affinity that PAHs have forhe surface of gold nanoparticles (Au NPs). Separation and deter-
ination of the sixteen EPA-PAHs is accomplished in 22 min vian optimized GC/MS method. The entire analysis – i.e., SPNE andC/MS – takes less than 25 min per sample. The excellent analyt-
cal figures of merit (AFOM) – associated to the simplicity, shortnalysis time and reduced solvent consumption – demonstrate theotential of SPNE-GC/MS for the routine monitoring of EPA-PAHsia environmentally friendly methodology.
. Experimental
.1. Chemicals
Nanopure water from a Barnstead Nanopure Infinity water sys-em was used throughout. 20 nm average diameter Au NPs inqueous solutions (7 × 10¹¹ particles mL−1) were purchased fromed Pella, Inc. (Redding, CA). HPLC grade methanol was pur-hased from Fischer Scientific (Pittsburg, PA). Analytical grade-pentanethiol and n-octane were from Acros Organics (Atlanta,A). B[a]A, B[b]F, B[k]F, B[a]P, DB[a,h]A, I[1,2,3-cd]P, Nap, Aceny,cen, Flu, Phen, Ant, Fluo, Pyr, Chr and B[ghi]P were purchased formigma-Aldrich (Milwaukee, WI) at their highest available purity≥98%).
Note: use extreme caution when handling PAHs that are knowno be extremely toxic.
.2. Solution preparation
Stock PAH solutions were prepared in either HPLC gradeethanol or n-octane and kept in the dark at 4 ◦C. Possible PAH
egradation was monitored via room-temperature fluorescencepectroscopy. Working solutions of PAHs were prepared by serialilution of stock solutions with the appropriate solvent. Commer-ial solutions of Au NPs were kept in the dark at 4 ◦C. The physicalntegrity of Au NPs was monitored periodically via ultraviolet-isible absorption spectroscopy.
.3. Extraction of EPA-PAH with Au NPs
A 500 �L aliquot of the water sample was mixed with 1 mLf 20 nm Au NPs. The mixture was shaken for 5 min at 1400 rpm
nd centrifuged for 10 min at 13,400 rpm. The supernatant waseparated from the precipitate with a micro-pipette. 2 �L of 1-entanethiol, 48 �L of methanol, and 50 �L of n-octane were addedo the precipitate. The new mixture was shaken for 5 min atogr. A 1345 (2014) 1–8
1400 rpm. All mixing and shaking times were previously optimizedfor best PAH recovery.
2.4. Absorption spectroscopy
Absorbance measurements were carried out with a single-beamspectrophotometer (model Cary 50, Varian) equipped with a 75-Wpulsed xenon lamp, 20-nm fixed band-pass, and 24,000 nm min−1
maximum scan rate.
2.5. Sample mixing and centrifugation for PAHs extraction withgold colloids
Sample mixing and centrifugation were performed in 2-mLMicroplain glass tubes. Sample mixing was done with a Maxi MixIII Rotary Shaker (Type M65800, Barnstead-Thermolyne) equippedwith a PT500X6A Vortex Mixer accessory. Centrifugation was per-formed with a MiniSpin centrifuge (Eppendorf) at the maximumrotational speed (13,400 rotations per minute) of the centrifuge.
2.6. Gas chromatography/mass spectrometry
GC/MS was carried out with the aid of a gas chromatograph(6850 GC, Agilent, Avondale PA) coupled to a quadruple massspectrometer with electron impact (EI) ionization at 70 eV (5975VL, Agilent). The gas chromatograph was equipped with an autosampler using 5 �L syringes. Pulsed, 2 �L splitless injections wereperformed at 275 ◦C and purged for 100 mL min−1 at 0.25 min. Sep-arations were carried out on a 5% phenyl methyl siloxane (DB-5ms)column (30 m × 0.25 mm i.d. × 0.25 �m film thickness). The tem-peratures of transfer line, manifold and source of ionization wereset at 280 ◦C, 280 ◦C and 230 ◦C, respectively.
The oven temperature program for “slow” separation condi-tions were 50 ◦C for 0.8 min followed by temperature increases to200 ◦C at 10 ◦C min−1, 225 ◦C at 2.0 ◦C min−1, 266 ◦C at 2.0 ◦C min−1,and 285 ◦C at 2.0 ◦C min−1. The solvent delay time was 6.0 min andthe total run time was 60 min. The oven temperature program for“fast” separation conditions were 80 ◦C for 1.0 min, temperatureincrease to 250 ◦C at 25 ◦C min−1 and held constant for 6.0 min,and an additional temperature increase to 300 ◦C at 10.0 ◦C min−1
and held constant for 2.0 min. The solvent delay time was 3.5 minand the total run time was 22 min. In all cases, the carrier gas wasultrapure helium at constant flow rates of 0.8 mL min−1 (slow) and1.8 mL min−1 (fast).
PAH peak identification was based on the retention times andfull scan spectra of the standards. A mass range of m/z 50–300was recorded in the full-scan mode. AFOM in the selective ionmonitoring (SIM) mode were obtained at the main molecularion peaks of individual PAHs, namely m/z = 128 (Nap), m/z = 152(Aceny), m/z = 154 (acen), m/z = 166 (Flu), m/z = 178 (Phen andAnt), m/z = 202 (Fluo and Pyr), m/z = 228 (B[a]A and Chr), m/z = 252(B[b]F, B[k]F and B[a]P), m/z = 276 (I[1,2,3-cd]P and B[ghi]P) andm/z = 278 (DB[a,h]A).
3. Results and discussion
3.1. GC separation of the sixteen EPA-PAHs
One of the challenges facing GC/MS for the analysis EPA-PAHsis the separation of priority pollutants with the same molecularweight and virtually identical fragmentation patterns [32,33]. Themost popular GC column for the separation of EPA-PAHs utilizes a
stationary phase composed of 5% phenyl and 95% methylpolysilox-ane (DB-5ms) [32–44]. Depending on the complexity of the samplematrix, the length of the column may vary between 15 and 60 m. Inhighly complex environmental matrixes, the individual resolution
W.B. Wilson et al. / J. Chromatogr. A 1345 (2014) 1–8 3
Table 1Comparison of chromatographic parameters for the GC/MS separation of the sixteen EPA-PAHs under slow and fast separation conditions.
PAHa Slow-GC/MS Fast-GC/MS
Retention time (min) Signal Intensity (×103 r.u.) FWHMb (min) Retention time (min) Signal intensity (×103 r.u.) FWHMb (min)
Nap 9.67 ± 0.002 4.39 ± 0.09 0.028 ± 0.001 4.306 ± 0.007 35.9 ± 1.34 0.013 ± 0.001Aceny 13.31 ± 0.004 2.81 ± 0.05 0.032 ± 0.001 5.798 ± 0.003 23.3 ± 2.17 0.017 ± 0.001Acen 13.74 ± 0.001 3.16 ± 0.05 0.032 ± 0.001 5.981 ± 0.001 27.3 ± 1.40 0.019 ± 0.002Flu 14.94 ± 0.001 2.25 ± 0.04 0.041 ± 0.002 6.476 ± 0.001 14.9 ± 0.84 0.025 ± 0.001Phen 17.33 ± 0.002 2.25 ± 0.10 0.041 ± 0.001 7.410 ± 0.003 15.3 ± 0.74 0.032 ± 0.003Ant 17.45 ± 0.003 2.96 ± 0.01 0.052 ± 0.001 7.455 ± 0.000 16.2 ± 0.90 0.032 ± 0.001Fluo 21.92 ± 0.001 2.17 ± 0.05 0.060 ± 0.002 8.681 ± 0.002 15.8 ± 0.68 0.037 ± 0.003Pyr 23.03 ± 0.006 1.80 ± 0.02 0.061 ± 0.003 8.985 ± 0.003 14.3 ± 0.94 0.042 ± 0.002B[a]A 31.24 ± 0.001 1.79 ± 0.01 0.086 ± 0.003 11.43 ± 0.003 6.99 ± 0.62 0.053 ± 0.002Chr 31.52 ± 0.006 1.89 ± 0.02 0.091 ± 0.003 11.54 ± 0.002 8.61 ± 0.77 0.052 ± 0.001B[b]F 40.40 ± 0.010 1.39 ± 0.01 0.109 ± 0.001 15.46 ± 0.006 5.03 ± 0.61 0.066 ± 0.001B[k]F 40.60 ± 0.008 1.55 ± 0.02 0.119 ± 0.003 15.54 ± 0.003 5.60 ± 0.57 0.066 ± 0.003B[a]P 42.96 ± 0.009 1.54 ± 0.01 0.112 ± 0.003 16.50 ± 0.005 5.32 ± 0.52 0.049 ± 0.001I[1,2,3-cd]P 52.47 ± 0.012 1.82 ± 0.02 0.132 ± 0.003 19.53 ± 0.003 7.38 ± 0.78 0.054 ± 0.003DB[a,h]A 52.88 ± 0.005 1.63 ± 0.02 0.148 ± 0.003 19.59 ± 0.001 7.75 ± 0.69 0.063 ± 0.003
± 0.00
red in
oD
–gEnacif
mfsmcEstoh
rSpbTpAtb
3
oTbpmdul
n-octane. After a second centrifugation, the supernatant was readyfor PAHs analysis via instrumental methods [24,46,47].
The original procedure was later modified for the extrac-tion of high-molecular weight PAHs [30,31]. The main difference
Table 2Comparison of chromatographic resolutions and number of theoretical plates underslow and fast GC/MS conditions.
PAHa Slow-GC/MS Fast-GC/MS
Rsb N (×105)c Rs
b N (×105)c
B[a]A 1.212 7.31 0.926 2.58Chr 6.65 2.73B[b]F 0.971 7.61 0.607 3.04B[k]F 6.45 3.07I[1,2,3-cd]P 1.167 8.75 0.717 7.25DB[a,h]A 7.07 5.36
a All working solutions were prepared in n-octane. 2 �L injection volume.b Resolution (Rs) between peaks was calculated with the equation
B[g,h,i]P 54.50 ± 0.007 1.64 ± 0.01 0.142
a Individual PAH concentrations = 1.0 × 10⁴ ng L−1. Working solutions were prepab FWHM, full-width at half-maximum.
f the sixteen EPA-PAHs has been accomplish mainly with 60 mB-5ms columns [32–34].
The length of the DB-5ms column chosen for the present studies 30 m – provides a reasonable compromise between chromato-raphic resolution and analysis time [35–44]. Within the sixteenPA-PAHs, three groups present the main resolution challenge,amely (i) Chr and B[a]A; (ii) B[b]F and B[k]F; and (iii) DB[a,h]And I[1,2,3-cd]P. Their complete separation in the chromatographicolumn is particularly relevant to distinguish between the MWsomers chr/B[a]A and B[b]F/B[k]F, which have very similar massragmentation patterns.
Fig. 1 compares the GC/MS chromatograms of a syntheticixture with the sixteen EPA-PAHs recorded under slow and
ast separation conditions. Table 1 summarizes the averages ofeparation parameters calculated from three independent chro-atographic runs under “slow” and “fast” conditions. Within a
onfidence interval of 95% [45], the retention times of the sixteenPA-PAHs were statistical different from each other under the twoets of experimental conditions. For all the studied PAHs, reducinghe total analysis time from 60 to 22 minutes increased the intensityf their analyte signals (peak height) and reduced the full-width atalf maximum (FWHM) of their chromatographic peaks.
The extent to which the faster separation conditions affect theesolution of the most challenging EPA-PAHs is illustrated in Fig. 2.imilar degrees of peak overlapping as those in Fig. 2 have beenreviously reported with the same length of DB-5ms column (30 m)ut at the expenses of longer analysis times (30–40 min) [40–42].able 2 compares the resolution (Rs) and number of theoreticallates (N) obtained under the two sets of separation conditions.lthough baseline resolution (Rs = 1.5) was not achieved in any of
he studied cases, quantitative separation was still possible underoth slow and fast GC/MS conditions.
.2. Analytical figures of merit (AFOM) under slow and fast GC/MS
Table 3 summarizes the AFOM of the sixteen priority pollutantsbtained via GC/MS under the two set of separation conditions.he linear dynamic ranges (LDRs) of the calibration curves wereuilt with a minimum of six PAH concentrations. The averageeak heights plotted in the calibration graphs correspond to a
inimum of three measurements recorded from three indepen-ent chromatographic runs. No efforts were made to reach thepper concentration limits of the calibration curves. The excel-
ent correlation coefficients (R) demonstrate the existence of linear
5 20.19 ± 0.005 6.39 ± 0.65 0.055 ± 0.002
n-octane. 2 �L injection volume.
relationships in all cases. The lowest linear concentration corre-sponds to the limit of quantitation (LOQ). The limits of detection(LODs) and the LOQs were calculated for a signal-to-noise (S/Np-p)ratio of 3 and 10, respectively. The Np-p was measured at the basepeak of each PAH over a sufficiently wide region of the chro-matogram. The increase in peak intensity observed under fastseparation conditions led to LOD improvements ranging from 3×(B[a]A, B[b]F, B[k]F, B[a]P and B[ghi]P) to 8× (Nap, Aceny andAcen). The rather low relative standard deviations (RSDs) reflectthe outstanding precision of the measurements under both sets ofseparation conditions.
3.3. SPNE
SPNE was originally devised for the analysis of EPA-PAHs in tap(drinking) water samples [24,46,47]. PAHs extraction was accom-plished by mixing micro-liters (�L) of water sample with �L ofAu NPs suspended in aqueous solution. After mixing, centrifuga-tion and decantation of the supernatant, the precipitate was treatedwith 2 �L of 1-pentanethiol and 48 �L of n-octane. Upon binding tothe gold surface, 1-pentanethiol released PAHs to the surroundingmedium in a process that was favored by the non-polar nature of
Rs = 2(t2 − t1)/w2 − w1; where t1 and t2 are retention times of peaks 1 and 2,respectively (Table 1), and w1 and w2 are the widths at the base of each peak.
c Number of theoretical plates (N) of each PAH was determined with the equationN = 5.54(tm/w0.5)2; where tm is the retention time and w0.5 is the width at half heightof the peak.

4 W.B. Wilson et al. / J. Chromatogr. A 1345 (2014) 1–8
Fig. 1. GC/MS chromatogram of a standard mixture of the sixteen EPA-PAHs at the 1.0 × 10⁴ ng L−1 concentration level recorded under slow (A) and fast (B) separationconditions. Peak identities are (1) Nap, (2) Aceny, (3) Acen, (4) Flu, (5) Phen, (6) Ant, (7) Fluo, (8) Pyr, (9) B[a]A, (10) Chr, (11) B[b]F, (12) B[k]F, (13) B[a]P, (14) I[1,2,3-cd]P,(15) DB[a,h]A and (16) B[ghi]P.
Fig. 2. Separation of the critical EPA-PAH pairs at the 1.0 × 10⁴ ng L−1 concentration level under slow (A) and fast (B) GC/MS conditions. Peak identities are (9) B[a]A, (10)Chr, (11) B[b]F, (12) B[k]F, (14) I[1,2,3-cd]P, (15) DB[a,h]A.

W.B. Wilson et al. / J. Chromatogr. A 1345 (2014) 1–8 5
Table 3Analytical figures of merit via slow and fast GC/MS methods.
PAHa Slow-GC/MS Fast-GC/MS
LDRb (103 ng L−1) R2c LODd (ng L−1) RSDe (%) LDRb (103 ng L−1) R2c LODd (ng L−1) RSDe (%)
Nap 1.70–100 0.9992 514 3.1 0.21–500 0.9987 62.9 4.8Aceny 5.32–100 0.9996 1610 5.9 0.74–500 0.9984 195 4.9Acen 4.65–100 0.9988 1408 5.4 0.54–500 0.9981 163 5.6Flu 2.07–100 0.9991 628 0.8 0.31–500 0.9980 94.8 4.7Phen 2.63–100 0.9992 796 4.2 0.39–500 0.9980 117 5.9Ant 2.06–100 0.9980 624 4.2 0.37–500 0.9997 114 5.8Fluo 1.35–10.0 0.9993 408 2.2 0.19–500 0.9981 56.0 8.5Pyr 1.26–10.0 0.9991 382 1.1 0.17–500 0.9986 52.5 8.8B[a]A 1.91–10.0 0.9987 442 4.7 0.37–500 0.9993 113 8.8Chr 0.86–10.0 0.9988 261 2.6 0.19–500 0.9998 57.2 3.3B[b]F 3.22–10.0 0.9989 977 1.5 0.89–500 0.9993 270 1.4B[k]F 3.46–10.0 0.9992 1047 2.6 0.96–500 0.9992 290 4.4B[a]P 3.05–10.0 0.9985 925 3.7 0.85–500 0.9995 268 5.1I[1,2,3-cd]P 3.03–10.0 0.9927 919 1.3 0.75–500 0.9991 227 8.9DB[a,h]A 3.34–10.0 0.9947 1012 1.0 0.70–500 0.9979 213 5.3B[g,h,i]P 2.43–10.0 0.9935 737 2.4 0.62–500 0.9995 189 2.8
a All working solutions were prepared in n-octane. Injection volume = 2 �L.b Linear dynamic range (LDR); lower concentration limit = limit of quantitation (LOQ) estimated as S/N = 10.
ear d
wtamtavhme
se
c R = correlation coefficient.d Limit of detection (LOD) estimated as S/N = 3.e Relative standard deviation (RSD) calculated from medium concentrations of lin
as the addition of 48 �L of methanol to the releasing mix-ure of 1-penthanethiol and n-octane. By providing a well-definednd visually distinguishable two-phase system (octane andethanol/Au NPs precipitate), the addition of methanol avoided
he need of the second centrifugation step prior to instrumentalnalysis. In addition, the presence of methanol in the releasing sol-ent mixture improved considerably the extraction efficiency ofigh-molecular weight PAHs. As shown in Fig. 3, the addition ofethanol to the releasing PAHs mixture reduces 10 min of the total
xtraction time.The plot in Fig. 4 compares the overall recoveries (OR) of the
ixteen EPA-PAHs obtained with the two SPNE procedures. Allxtractions were made from Nanopure water samples previously
Fig. 3. Schematic diagram of both the original (30 min) and new (20 min) SPNE
ynamic ranges.
spiked with the sixteen priority pollutants at the final concentra-tion of 1.0 × 10³ ng L−1 (1% methanol-water, v/v). The OR valueswere calculated according to equation 1:
OR (%) = 100
([PAH]O × VO
[PAH]H2O × VH2O
)(1)
where VO and VH2O correspond to the volumes of supernatant(n-octane) and water sample, respectively; [PAH]H2O = 1.0 ×
103 ng L−1 and [PAH]O is the PAH concentration in the super-natant (n-octane). [PAH]O values were obtained via the fast GC/MSmethod. All concentrations in the supernatants were within thelinear dynamic ranges of individual PAHs in n-octane (see Table 3).procedure for the analysis of EPA-PAHs in water samples via fast GC/MS.

6 W.B. Wilson et al. / J. Chromatogr. A 1345 (2014) 1–8
Table 4SPNE-GC/MS analytical figures of merit for the sixteen EPA-PAHs.
PAHa LDRb (ng L−1) R2c LODd (ng L−1) RSDe (%) Recoveries (%)
Nap 28–5000 0.9965 8.40 3.5 102.4 ± 4.3Aceny 46–5000 0.9978 14.0 5.0 95.9 ± 5.5Acen 60–5000 0.9955 18.3 2.4 95.9 ± 3.3Flu 216–5000 0.9966 65.5 3.3 42.7 ± 2.2Phen 41–5000 0.9998 12.4 3.7 101.6 ± 5.9Ant 38–5000 0.9997 11.4 4.3 97.3 ± 4.0Fluo 16–5000 1.0000 4.94 4.5 101.8 ± 6.8Pyr 21–5000 0.9999 6.40 4.2 100.2 ± 5.3B[a]A 26–5000 0.9950 7.88 6.8 99.8 ± 1.8Chr 27–5000 0.9984 8.12 5.9 96.6 ± 2.1B[b]F 60–5000 0.9980 18.2 7.1 95.4 ± 4.7B[k]F 61–5000 0.9969 18.5 3.5 103.5 ± 1.2B[a]P 55–5000 0.9945 16.5 5.5 92.8 ± 2.4I[1,2,3-cd]P 43–5000 0.9942 13.0 6.1 95.9 ± 3.5DB[a,h]A 45–5000 0.9958 13.5 7.8 98.7 ± 2.8B[g,h,i]P 51–5000 0.9969 15.4 6.2 99.9 ± 4.0
a All working solutions were prepared in 1% methanol.b Linear dynamic range (LDR); lower concentration limit = limit of quantitation (LOQ) estimated as S/N = 10.c R = correlation coefficient.
near d
WtedtSmivnrn
3
vup
Fpsad
values to those reported in Table 3 (fast GC/MS) show an overall LODimprovement of approximately one order of magnitude. ORs were
d Limit of detection (LOD) estimated as S/N = 3.e Relative standard deviation (RSD) calculated from medium concentrations of li
ithin a confidence interval of 95% (N1 = N2 = 3), [45] the ORs ofhe new procedure were better for all the studied PAHs with thexception of Aceny, Acen, Flu, Phen, Ant and B[a]A. The observedifferences among the ORs of EPA-PAHs reflect differences in rela-ive affinity towards the surface of Au NPs and the supernatants.imilar to high-molecular weight PAHs [30,31], the presence ofethanol appears to facilitate the partitioning of most EPA-PAHs
nto the layer of n-octane. Larger (75 and 98 �L) or smaller (25 �L)olumes of methanol deteriorated the partitioning of PAHs into the-octane layer. All further studies were then carried out using aeleasing mixture composed of 2 �L of 1-penthanethiol, 50 �L of-octane and 48 �L of methanol.
.4. AFOM of SPNE-GC/MS
Table 4 summarizes the AFOM of the sixteen EPA-PAHs obtainedia SPNE-GC/MS. All extractions were made from 500 �L of Nanop-re water previously spiked with standard mixtures of the sixteenriority pollutants in 1% methanol-water (v/v). A volume of 1 mL
ig. 4. Comparison of overall recoveries obtained via the original and the new SPNErocedure. All extractions were carried out with 1 mL of 20 nm Au NPs in aqueousolution. Extractions were made from 500 �L of Nanopure water spiked with PAHst a final concentration of 1.0 × 10³ ng L−1. All overall recoveries were quantitativelyetermined via fast GC-MS.
ynamic ranges.
of Au NPs solution was used in all cases, which should be able toextract the sixteen EPA-PAHs at the 6.4 × 10⁴ ng L−1 individual con-centration [46]. Each LDR was estimated with a minimum of sixPAH concentrations. The peak intensities plotted in the calibrationgraphs corresponded to the averages of nine GC/MS measurementsmade from triplicate aliquots (2 �L each) of three complete SPNEtrials. No efforts were made to reach the upper concentration lim-its of the LDRs. The lowest linear concentrations correspond to theLOQ values, which were calculated as those described in Table 3.The existence of linear relationships was confirmed with excellent Rvalues in all cases. The RSDs reflect the outstanding reproducibilityof SPNE-GC/MS measurements at the parts-per-trillion concentra-tion level. All LODs were at the parts-per-trillion level and wellbelow the MCL of regulated EPA-PAHs. Comparison of SPNE-GC/MS
calculated according to Equation 1.
Table 5Overall recoveries of sixteen EPA-PAHs in St. John’s river water samples via SPNE-GC/MS.
PAH a Recoveryb (%) RSDc (%) texpd
Nap 85.1 ± 2.5 2.89 6.06Aceny 85.5 ± 5.9 6.89 2.25Acen 91.5 ± 1.9 2.11 2.01Flu 37.1 ± 0.4 1.16 1.75Phen 102.3 ± 9.6 9.37 0.11Ant 93.4 ± 2.2 2.35 1.49Fluo 94.5 ± 1.6 1.68 2.07Pyr 96.0 ± 2.4 2.45 1.26B[a]A 101.5 ± 1.3 1.30 1.33Chr 93.3 ± 0.8 0.85 2.56B[b]F 100.7 ± 2.1 2.09 1.79B[k]F 98.7 ± 2.1 2.15 3.46B[a]P 96.7 ± 2.2 2.25 2.09I[1,2,3-cd]P 93.4 ± 2.9 3.13 0.96DB[a,h]A 99.6 ± 2.7 2.71 0.40B[g,h,i]P 95.8 ± 2.9 2.98 1.45
a All working solutions were prepared in 1% methanol/water (v/v). All EPA-PAHswere spiked at the 1.0 × 10³ ng L−1 concentration levels. Injection volume = 2 �L.
b All extractions were made with 1 mL of Au NPs in aqueous solution (7.0 × 10¹¹
particles mL−1). Tabulated values represent the averages of triplicate measurementstaken from three aliquot samples.
c Relative Standard Deviation.d t-test of recovery for EPA-PAHs in nanopure water (Table 4). tcritical = 2.78.
W.B. Wilson et al. / J. Chromatogr. A 1345 (2014) 1–8 7
Table 6Comparison of different adsorbent material combined with GC/MS for the analysis of 16 EPA-PAH in water samples.
Reference Extraction material Sample size(mL)
Organicg solvent(mL)
Extractiong time(min)
Analysisg time(min)
Recovery (%) RSDh (%) LODi (ng L−1)
Current AuNPsa 0.5 0.1 20 22 37–102.3 1–8 4–66[36] MWCNTsb 500 36 60 40 70–127 1–12 2–8[37] MWCNTsb 50 2 50 65 72–93 4–14 1–150[38] MWCNTsb 20 0.1 35 28 72–98 4–12 4–47[39] PDMSc 30 0 45 70 – 1–20 1–29[40] PDMSc 10 0 90 60 69–105 2–24 30–270[41] Fe3O4
d 20 4.5 10 20 35–99 2–10 800–36000[42] OPA/MMNPse 10 0.5 2 30 54–119 1–12 14–70[43] SCX-2f 500 15 60 45 67–136 1–18 18.4–238[44] Fe3O4
d 20 0.1 46 28 – 4–10 15–335
a Gold Nanoparticles.b Multi-walled Carbon Nanotubes.c Polydimethylsiloxane fibres.d Silica with strong cation-exchange groups.e Fe3O4 microspheres.f n-Octadecylphosphonic acid modified mesoporous magnetic nanoparticle.
3u
utI7aptPwdstTio[BpE
4
w6[(4[(ctt[v
coat
[[[[
[
[[[[[[[
[
[
[[[[
g Based on 12 water samples.h Relative Standard Deviation.i Limit of detection (LOD) estimated as S/N = 3.
.5. SPNE-GC/MS analysis of EPA-PAHs in water samples ofnknown composition
The feasibility to monitor the sixteen EPA-PAHs in samples ofnknown composition was investigated with water samples fromhe St. John’s River collected at different locations of the Hontoonsland State Park (Deland, FL, USA). All samples were collected in
mL dark amber vials and kept in the dark at 4 ◦C until furthernalysis. Since no EPA-PAHs were detected in the collected sam-les, potential matrix interference was then investigated by spikinghe collected samples with microliter volumes of standard EPA-AHs mixtures at the parts-per-billion concentration level. SPNEas carried out with 500 �L aliquots according to the new proce-ure depicted in Fig. 3. GC/MS analysis was performed under fasteparation conditions. Table 5 summarizes the ORs and the RSDs ofhe analyzed samples. In all cases, the RSDs were lower than 25%.his feature meets the criterion for the analysis of regulated PAHsn water samples [22]. With the exception of Nap and B[k]F, all thether recoveries were statistically equivalent ( = 0.05, N1 = N2 = 3)45] to those reported obtained with Nanopure water (see Table 4).ased on these results, it is possible to state that the matrix com-osition of the St. John’s River had minimal effect on the ORs ofPA-PAHs.
. Conclusion
A wide range of analytical recoveries have been reported for theater analysis of EPA-PAHs via SPE-GC/MS [48–52]. These include
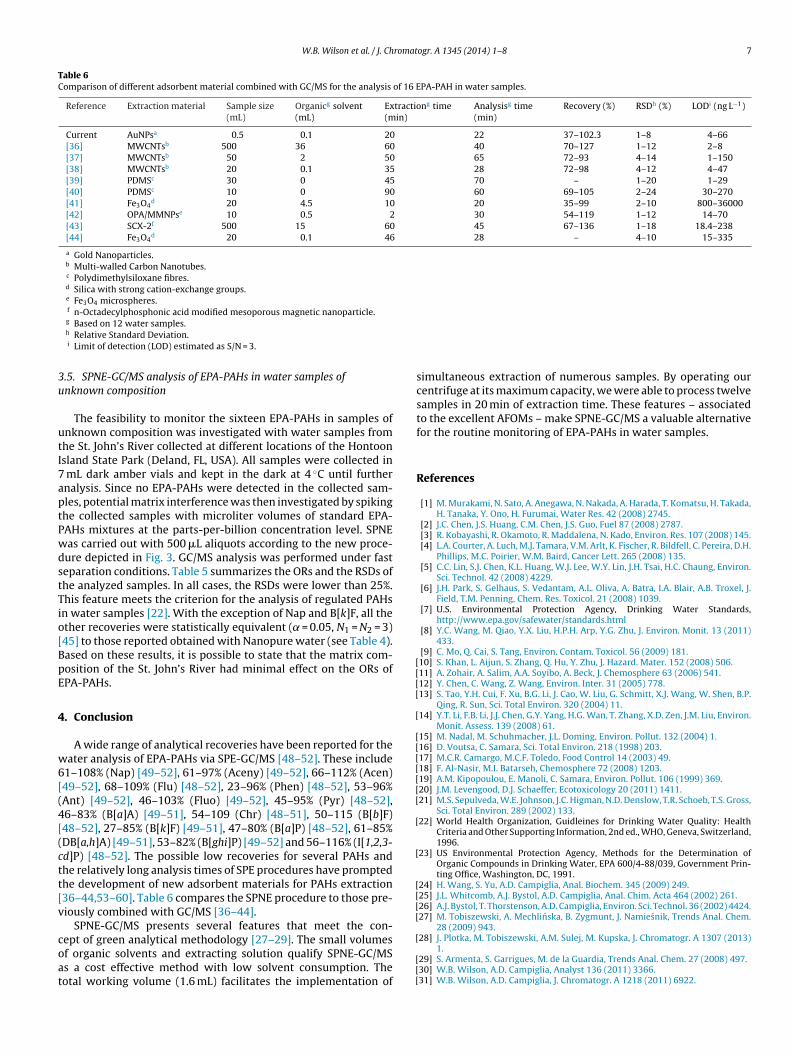
1–108% (Nap) [49–52], 61–97% (Aceny) [49–52], 66–112% (Acen)49–52], 68–109% (Flu) [48–52], 23–96% (Phen) [48–52], 53–96%Ant) [49–52], 46–103% (Fluo) [49–52], 45–95% (Pyr) [48–52],6–83% (B[a]A) [49–51], 54–109 (Chr) [48–51], 50–115 (B[b]F)48–52], 27–85% (B[k]F) [49–51], 47–80% (B[a]P) [48–52], 61–85%DB[a,h]A) [49–51], 53–82% (B[ghi]P) [49–52] and 56–116% (I[1,2,3-d]P) [48–52]. The possible low recoveries for several PAHs andhe relatively long analysis times of SPE procedures have promptedhe development of new adsorbent materials for PAHs extraction36–44,53–60]. Table 6 compares the SPNE procedure to those pre-iously combined with GC/MS [36–44].
SPNE-GC/MS presents several features that meet the con-
ept of green analytical methodology [27–29]. The small volumesf organic solvents and extracting solution qualify SPNE-GC/MSs a cost effective method with low solvent consumption. Theotal working volume (1.6 mL) facilitates the implementation of[
[[[
simultaneous extraction of numerous samples. By operating ourcentrifuge at its maximum capacity, we were able to process twelvesamples in 20 min of extraction time. These features – associatedto the excellent AFOMs – make SPNE-GC/MS a valuable alternativefor the routine monitoring of EPA-PAHs in water samples.
References
[1] M. Murakami, N. Sato, A. Anegawa, N. Nakada, A. Harada, T. Komatsu, H. Takada,H. Tanaka, Y. Ono, H. Furumai, Water Res. 42 (2008) 2745.
[2] J.C. Chen, J.S. Huang, C.M. Chen, J.S. Guo, Fuel 87 (2008) 2787.[3] R. Kobayashi, R. Okamoto, R. Maddalena, N. Kado, Environ. Res. 107 (2008) 145.[4] L.A. Courter, A. Luch, M.J. Tamara, V.M. Arlt, K. Fischer, R. Bildfell, C. Pereira, D.H.
Phillips, M.C. Poirier, W.M. Baird, Cancer Lett. 265 (2008) 135.[5] C.C. Lin, S.J. Chen, K.L. Huang, W.J. Lee, W.Y. Lin, J.H. Tsai, H.C. Chaung, Environ.
Sci. Technol. 42 (2008) 4229.[6] J.H. Park, S. Gelhaus, S. Vedantam, A.L. Oliva, A. Batra, I.A. Blair, A.B. Troxel, J.
Field, T.M. Penning, Chem. Res. Toxicol. 21 (2008) 1039.[7] U.S. Environmental Protection Agency, Drinking Water Standards,
http://www.epa.gov/safewater/standards.html[8] Y.C. Wang, M. Qiao, Y.X. Liu, H.P.H. Arp, Y.G. Zhu, J. Environ. Monit. 13 (2011)
433.[9] C. Mo, Q. Cai, S. Tang, Environ. Contam. Toxicol. 56 (2009) 181.10] S. Khan, L. Aijun, S. Zhang, Q. Hu, Y. Zhu, J. Hazard. Mater. 152 (2008) 506.11] A. Zohair, A. Salim, A.A. Soyibo, A. Beck, J. Chemosphere 63 (2006) 541.12] Y. Chen, C. Wang, Z. Wang, Environ. Inter. 31 (2005) 778.13] S. Tao, Y.H. Cui, F. Xu, B.G. Li, J. Cao, W. Liu, G. Schmitt, X.J. Wang, W. Shen, B.P.
Qing, R. Sun, Sci. Total Environ. 320 (2004) 11.14] Y.T. Li, F.B. Li, J.J. Chen, G.Y. Yang, H.G. Wan, T. Zhang, X.D. Zen, J.M. Liu, Environ.
Monit. Assess. 139 (2008) 61.15] M. Nadal, M. Schuhmacher, J.L. Doming, Environ. Pollut. 132 (2004) 1.16] D. Voutsa, C. Samara, Sci. Total Environ. 218 (1998) 203.17] M.C.R. Camargo, M.C.F. Toledo, Food Control 14 (2003) 49.18] F. Al-Nasir, M.I. Batarseh, Chemosphere 72 (2008) 1203.19] A.M. Kipopoulou, E. Manoli, C. Samara, Environ. Pollut. 106 (1999) 369.20] J.M. Levengood, D.J. Schaeffer, Ecotoxicology 20 (2011) 1411.21] M.S. Sepulveda, W.E. Johnson, J.C. Higman, N.D. Denslow, T.R. Schoeb, T.S. Gross,
Sci. Total Environ. 289 (2002) 133.22] World Health Organization, Guidleines for Drinking Water Quality: Health
Criteria and Other Supporting Information, 2nd ed., WHO, Geneva, Switzerland,1996.
23] US Environmental Protection Agency, Methods for the Determination ofOrganic Compounds in Drinking Water, EPA 600/4-88/039, Government Prin-ting Office, Washington, DC, 1991.
24] H. Wang, S. Yu, A.D. Campiglia, Anal. Biochem. 345 (2009) 249.25] J.L. Whitcomb, A.J. Bystol, A.D. Campiglia, Anal. Chim. Acta 464 (2002) 261.26] A.J. Bystol, T. Thorstenson, A.D. Campiglia, Environ. Sci. Technol. 36 (2002) 4424.27] M. Tobiszewski, A. Mechlinska, B. Zygmunt, J. Namiesnik, Trends Anal. Chem.
28 (2009) 943.
28] J. Plotka, M. Tobiszewski, A.M. Sulej, M. Kupska, J. Chromatogr. A 1307 (2013)1.29] S. Armenta, S. Garrigues, M. de la Guardia, Trends Anal. Chem. 27 (2008) 497.30] W.B. Wilson, A.D. Campiglia, Analyst 136 (2011) 3366.31] W.B. Wilson, A.D. Campiglia, J. Chromatogr. A 1218 (2011) 6922.

8 romat
[
[[
[
[[
[[[[[[[[
[
[[
[[[[[
[[[[
[
W.B. Wilson et al. / J. Ch
32] D.L. Poster, M.M. Schantz, L.C. Sander, S.A. Wise, Anal. Bioanal. Chem. 386 (2006)859.
33] J.A. Gómez-Ruiz, T. Wenzl, Anal. Bioanal. Chem. 393 (2009) 1697.34] S.A. Wise, D.L. Poster, S.D. Leigh, C.A. Rimmer, S. Mössner, P. Schubert, L.C.
Sander, M.M. Schantz, Anal. Bioanal. Chem. 398 (2010) 717.35] F. Galan-Cano, M. del, C. Alcudia-León, R. Lucena, S. Cardenas, M. Valcarcel, J.
Chromatogr. A 1300 (2013) 134.36] J. Ma, R. Xiao, J. Li, J. Yu, Y. Zhang, L. Chen, J. Chromatogr. A 1217 (2010) 5462.37] H. Wu, X. Wang, B. Liu, J. Lu, B. Du, L. Zhang, J. Ji, J. Chromatogr. A 1217 (2010)
2911.38] L. Guo, H.K. Lee, J. Chromatogr. A 1218 (2011) 9321.39] A.J. King, J.W. Readman, J.L. Zhou, Anal. Chim. Acta 523 (2004) 259.40] R. Doong, S. Chang, Y. Sun, J. Chromatogr. A 879 (2000) 177.41] Y. Liu, H. Li, J. Lin, Talanta 77 (2009) 1037.42] J. Ding, Q. Gao, D. Luo, Z. Shi, Y. Feng, J. Chromatogr. A 1217 (2010) 7351.
43] Q. Zhao, J. Simmons, E.D. Conte, J. Chromatogr. A 1132 (2006) 1.44] L. Bai, B. Mei, Q. Guo, Z. Shi, Y. Feng, J. Chromatogr. A 1217 (2010) 7331.45] M.J. Miller, J.C. Miller, Statistics and Chemometrics for Analytical Chemistry,4th Ed., Prentice-Hall, Inc., New York, 2000.46] H. Wang, A.D. Campiglia, Anal. Chem. 80 (2008) 8202.
[
[
ogr. A 1345 (2014) 1–8
47] H. Wang, A.D. Campiglia, Talanta 83 (2010) 233.48] G. Carrera, P. Fernandez, R. Vilanova, J.O. Grimalt, J. Chromatogr. A 823 (1998)
189.49] K. Li, H.F. Li, L.B. Liu, Y. Hashi, J.M. Lin, J. Chromatogr. A 1154 (2007) 74.50] N.Q. Li, H.K. Lee, J. Chromatogr. A 921 (2001) 255.51] S.R. Sargenti, H.M. McNair, J. Microcolumn Sep. 10 (1998) 125.52] W. Kanchanamayoon, N. Tatrahum, World J. Chem. 3 (2008) 51.53] L. Oliferova, M. Statkus, G. Tsysin, O. Shpigun, Y. Zolotov, Anal. Chim. Acta 538
(2005) 35.54] L. Xu, H.K. Lee, J. Chromatgr. A 1192 (2008) 203.55] K. Yang, B.S. Xing, Environ. Pollut. 145 (2007) 529.56] W. Wang, Y. Huang, W. Shu, J. Cao, J. Chromatogr. A 1173 (2007) 27.57] P. Kueseng, C. Thammakhet, P. Thavarungkul, P. Kanatharana, Microchem. J. 96
(2010) 317.58] A.A. Costa, W.B. Wilson, H. Wang, A.D. Campiglia, S.C. Dias, J.A. Dias, Micro-
porous Mesoporous Mater. 149 (2011) 186.59] W.B. Wilson, A.A. Costa, H. Wang, J.A. Dias, S.C. Dias, A.D. Campiglia, Anal. Chim.
Acta 733 (2012) 103.60] W.B. Wilson, A.A. Costa, H. Wang, A.D. Campiglia, J.A. Dias, S.C. Dias, Microchem.
J. 110 (2013) 246.