A Comparative Study of the Interaction of Different Polycyclic Aromatic Hydrocarbons on Different...
36
NanoLab Articles Dublin Institute of Technology Year A Comparative Study of the Interaction of Different Polycyclic Aromatic Hydrocarbons on Different Types of Single Walled Carbon Nanotubes Sourabhi Debnath * Qiaohun Cheng † Teresa Jedderman ‡ Hugh J. Byrne ** * Dublin Institute of Technology, [email protected] † Dublin Institute of Technology, [email protected] ‡ Dublin Institute of Technology, [email protected] ** Dublin Institute of Technology, [email protected] This paper is posted at ARROW@DIT. http://arrow.dit.ie/nanolart/33
-
Upload
independent -
Category
Documents
-
view
0 -
download
0
Transcript of A Comparative Study of the Interaction of Different Polycyclic Aromatic Hydrocarbons on Different...

NanoLab
Articles
Dublin Institute of Technology Year
A Comparative Study of the Interaction
of Different Polycyclic Aromatic
Hydrocarbons on Different Types of
Single Walled Carbon Nanotubes
Sourabhi Debnath∗ Qiaohun Cheng†
Teresa Jedderman‡ Hugh J. Byrne∗∗
∗Dublin Institute of Technology, [email protected]†Dublin Institute of Technology, [email protected]‡Dublin Institute of Technology, [email protected]∗∗Dublin Institute of Technology, [email protected]
This paper is posted at ARROW@DIT.
http://arrow.dit.ie/nanolart/33

— Use Licence —
Attribution-NonCommercial-ShareAlike 1.0
You are free:
• to copy, distribute, display, and perform the work
• to make derivative works
Under the following conditions:
• Attribution.You must give the original author credit.
• Non-Commercial.You may not use this work for commercial purposes.
• Share Alike.If you alter, transform, or build upon this work, you may distribute theresulting work only under a license identical to this one.
For any reuse or distribution, you must make clear to others the license termsof this work. Any of these conditions can be waived if you get permission fromthe author.
Your fair use and other rights are in no way affected by the above.
This work is licensed under the Creative Commons Attribution-NonCommercial-ShareAlike License. To view a copy of this license, visit:
• URL (human-readable summary):http://creativecommons.org/licenses/by-nc-sa/1.0/
• URL (legal code):http://creativecommons.org/worldwide/uk/translated-license
1
A comparative study of the interaction of different
polycyclic aromatic hydrocarbons on different types of
single walled carbon nanotubes.
Sourabhi Debnath*, Qiaohuan Cheng, Theresa G. Hedderman, and Hugh J. Byrne
FOCAS Research Institute, Dublin Institute of Technology, Kevin Street, Dublin 8, Ireland
* Corresponding author. Tel: +353 1 402 7932. Fax: +353 1 402 7901.
E-mail: [email protected].
ABSTRACT
A comparative study of the solubilising effect of polycyclic aromatic hydrocarbon (PAHs) on single
walled carbon nanotubes (SWCNTs) produced by high pressure decomposition of carbon monoxide
(HiPco) and the arc discharge (AD) method has been carried out with the aid of fluorescence and Raman
spectroscopy. For this study, polyphenyl and polyacene PAHs of different lengths are used. From the
study it has been found that the binding energy of PAHs with AD SWCNTs is the same as that with
HiPco SWCNTs. Shorter PAHs molecules better solubilise SWCNTs and in general smaller diameter
SWCNTs. Thus, given their smaller diameter profile, significantly larger amounts of HiPco SWCNTs
are solubilised than AD SWCNTs.

2
KEYWORDS: Single walled carbon nanotubes, polycyclic aromatic hydrocarbon, fluorescence
quenching, binding energy, dispersion limit.
INTRODUCTION
Single walled carbon nanotubes (SWCNTs) are one of the most studied nano-materials due to their
high strength [1], electrical[2] and thermal conductivity [3]. These SWCNTs can be produced by arc
discharge (AD) [4, 5], laser ablation (LA) [2, 6, 7], high pressure decomposition of carbon monoxide
(HiPco) [8], and catalytic decomposition of hydrocarbons [9]. In bulk production, SWCNTs produced
by different processes contain bundles and ropes of SWCNTs with significant quantities of impurities.
For many application purposes it is important to disperse SWCNTs from their bundles and remove
impurities. But due to their relative insolubility in solvents, non reactive surfaces, in combination with
their high surface area and high aspect ratio which leads to significant agglomeration via intrinsic
intertubule van der Waals attractions, it is difficult to process and handle them [10]. Various methods
have been reported for the solubilisation and dispersion of SWCNTs in water and organic solvents [11-
12]. It has been found that SWCNTs can be solubilised in water with linear polymers; polyvinyl
pyrrolidone (PVP) and polystyrene sulfonate (PSS) [19]. It is also reported that in water SWCNTs have
been dispersed with the aid of surfactant [20]. Functionalization also increases the solubility of
SWCNTs [16, 21] in water and organic solvents.
It has been also found that organic polymers such as poly PmPV-co-DOctOPV and polycyclic
aromatic hydrocarbons (PAHs) can solubilise and aid in the purification of the SWCNTs in organic
solvents [12-15, 18]. The interaction can cause the SWCNTs to disperse from their bundled form [12-
15, 18] and there is a strong suggestion that the organic species interact preferentially with SWCNTs of
certain diameters or diameter range and even electronic structure [12,13,22]. In other studies it was
found that adsorption of specifically designed and geometrically constrained pentacenic and
quaterrylene based amphiphiles was found to be selective of the nanotube helicity angle [23].

3
To optimise the solubilisation and dispersion of SWCNTs in solvents using PAHs, it is important to
understand the interaction of SWCNTs with PAHs. In a previous study, the interaction of PAHs with
SWCNTs produced by the HiPco process was studied in a systematic way using PAHs of different
lengths from the polyacene and polyphenyl series [14, 15]. From this study, clear structure property
relationships governing the binding energies of the molecules to the HiPco SWCNTs and the dispersion
limit of HiPco SWCNTs in the composite solutions [14, 15] were obtained. From a Raman spectroscopy
study, a limited degree of structural specificity was evident, although PAHs were seen to solubilise both
chiral and achiral HiPco SWCNTs [24].
The objective of the study presented here is to explore the interaction of these PAHs of systematically
varied chain length with SWCNTs produced by the HiPco and AD methods, exploring the significance
of the diameter and length of SWCNTs on the interaction of PAHs with SWCNTs. For this study,
fluorescence and Raman spectroscopy were used. For the fluorescence study, a model based on the
adsorption/desorption equilibrium of SWCNTs and PAHs has been used [11]. The details of this method
are described elsewhere [11, 14, 15, 17, 22]. It probes the interaction of the PAH molecules with the
SWCNTs bundles and their resultant dispersion into isolated nanotubes by monitoring fluorescence
quenching as a function of concentration. It yields a characteristic concentration (C0) at which the rate of
adsorption of PAH molecules onto the SWCNT surfaces is equal to the desorption rate, which is in turn
dependent on the molecular binding energy, EB. The effect of systematic variation of PAH length and
structure on C0 and E
B can lay the foundation for structure activity relationships.
The diameter dependent selective interaction of both types of SWCNTs with the PAH molecules is
studied by Raman spectroscopy. Raman spectroscopy is a powerful tool to investigate the vibrational
properties and thus characterize SWCNTs. The radial breathing modes (RBMs) of SWCNTs which lie
in the region of ~ 200 cm-1 give information about the diameter and chirality of SWCNTs. In this region,

4
carbon atoms undergo uniform radial displacement [25-27]. As the RBM frequency is related to the
SWCNT diameter and the structural indices (n, m), a Raman spectrum of a SWCNT sample can be
employed to establish the range of diameters present in a sample [28]. It was recognised at an early stage
that, for a given sample of SWCNTs containing a range of diameters, the Raman spectrum is dominated
by the SWCNT which are resonant at the frequency of the source laser [28]. Thus, for the complete
characterisation of a sample of SWCNT, a broad range of laser excitation energies should be used [26].
To investigate the interaction of different PAHs with HiPco and AD SWCNTs, the Raman spectra were
recorded with four different laser excitation energies. Employing these four different laser excitation
energies, the range of SWCNT diameters within the pristine SWCNTs and composite samples were
obtained. Comparing the diameter distribution of composite samples to those of pristine samples the
information about selective interaction of different PAHs with HiPco and AD SWCNTs were obtained.
Combining the fluorescence and Raman studies, a quantitative assessment of the relative efficacy of
PAHs in solubilising SWCNTs made by the two production methods is made.
EXPERIMENTAL SECTION
As received HiPco SWCNTs obtained from Carbon Nanotechnologies, Inc. (16200 Park Row,
Houston, TX 77087), AD SWCNTs (Sigma-Aldrich, Ireland) and PAHs (Sigma-Aldrich, Ireland), were
used to prepare different composite solutions with chloroform as solvent. HiPco SWCNTs typically
contain up to 10% metal catalyst (Fe) impurities, encapsulated in the tips [8, 29], and AD SWCNTs up
to 30% amorphous carbon or turbostratic graphite and catalyst impurities [5, 30]. Chloroform was used
because of its poor affinity for SWCNTs [11, 31]. Although, a small degree of solubilisation is affected
at low concentration[32], precipitation is observed within hours of sonication. In the presence of PAHs,
however, the solutions are stable for more than 24 months.
Two sets of solutions (the ranges are provided below) were prepared. To one of the two sets,
HiPco SWCNTs were added in a 1:1 ratio by weight (w/w); HiPco SWCNTs: PAHs.

5
~ 1.25 x 10⁻³ mol/L to ~ 1.22 x 10
-6 mol/L for naphthalene,
~ 7.81 x 10⁻⁵ mol/L to ~ 3.72 x 10
-11 mol/L for tetracene,
~ 1.56 x 10⁻⁴ mol/L to ~ 1.19 x 10
-9 mol/L for biphenyl and
~ 7.81 x 10⁻⁵ mol/L to ~ 3.63 x 10
-14 mol/L for p-quaterphenyl
At the highest concentration, both PAHs and composite solutions were sonicated using a sonic tip
(Ultrasonic processor VCX 750 W) for 3 x 10 s at 38% of the power output. Then these samples were
serially diluted by a factor of two with pure chloroform down to the lowest concentration. Each diluted
sample was further tip sonicated as above and was then allowed to settle for 72 hours, after which the
supernatant liquid from the composite samples was carefully withdrawn. The suspensions were allowed
to settle for a further 24 hours before being characterized by fluorescence spectroscopy (Perkin Elmer
LS55). The same procedures and concentration ranges as above were used to prepare composites of AD
SWCNTs with the corresponding PAHs.
It was noted that for both HiPco SWCNTs and AD SWCNTs composites, in suspensions above
the dispersion limit, described below, a considerable amount of precipitation of SWCNTs was observed
and so the solubilisation is only partial. The dispersion limit is the concentration where SWCNTs are
maximally dispersed [20, 23]. At concentrations where the SWCNTs are well dispersed, no precipitate
was found. As composite solutions were prepared by using SWCNTs/PAHs in 1:1 ratio by weight
(w/w), it can be stated that below the dispersion limit the concentration of PAHs and SWCNTs are the
same. Concentrations quoted are thus those of the as prepared solutions in terms of PAH concentration.
From fluorescence studies, the regions where SWCNTs were dispersed to a maximum in the
presence of PAHs of different lengths were obtained. At these concentrations, the SWCNTs bundles
were fully dispersed. The concentration range was chosen such that it spanned the region of dispersion

6
observed in these fluorescence based studies [14, 15]. The sample below the dispersion limit [14, 15, 20,
33] (Table 4) for each PAH composite was chosen for Raman characterization and was drop cast onto
clean quartz substrates. AFM confirmed that at concentration below the dispersion limit, the bundles
remained isolated on the substrate (supplemental information Figure S1).
The Raman instrument used in this study was a LabRAM HR 800 Raman Microscope (Horiba
Jobin Yvon) with a confocal imaging microscope system. Four laser lines, 785 nm (~ 1.58 eV) at 240
mW, 660 nm (~ 1.88 eV) at 80 mW, 532 nm (~ 2.33 eV) at 40 mW and 473 nm (~ 2.62 eV) at 40 mW
were employed as sources. To study the effect of PAH length on solubility and selectivity of SWCNTs,
the four laser lines were used to extensively probe the range of diameters present in the composite
samples. Spectra were acquired by mapping the 25 µmm x 25 µmm field of view of a x50 long focal length
objective with a step size of 5 µm.m. By scanning two different areas within the samples, on average fifty
spectra for each sample were obtained. Raman spectra were corrected for the quartz substrate
background. The RBM features obtained were fitted with a combination Lorentzian/Gaussian line shape
using the instrument LabSpec software version 4.02.
RESULTS AND DISCUSSION
Before studying the interaction of different PAHs with HiPco and AD SWCNTs using the
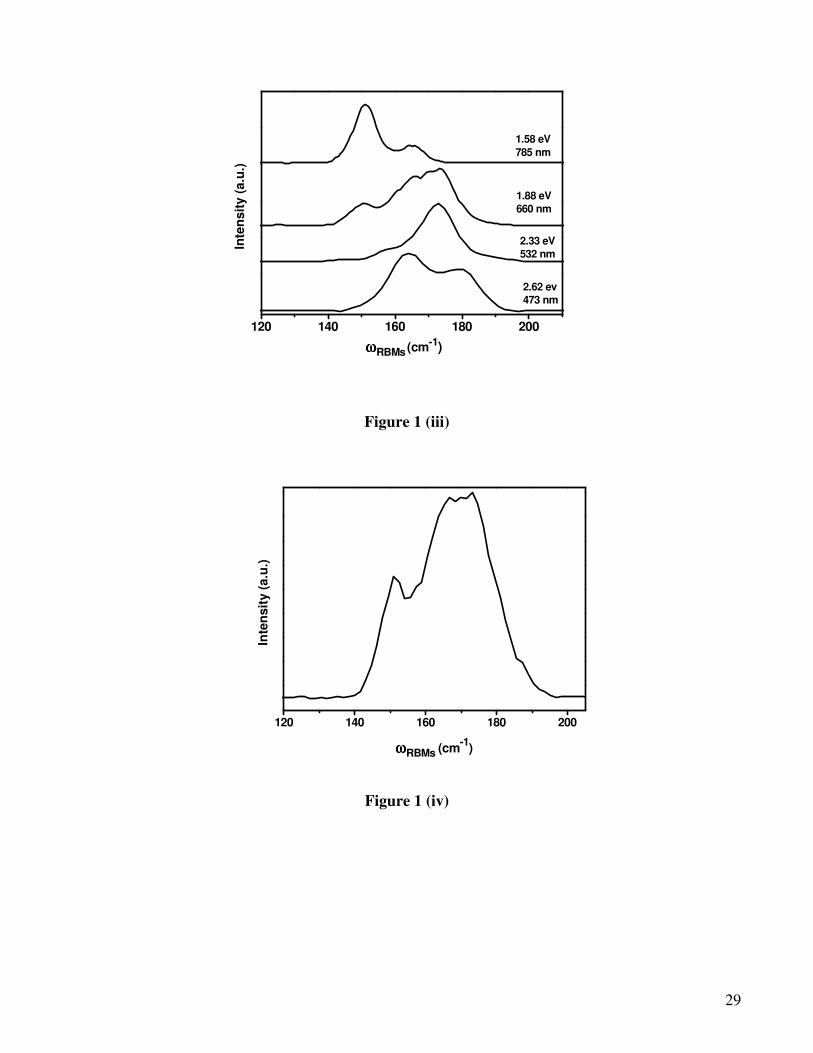
fluorescence model, pristine SWCNTs were characterised using Raman spectroscopy. Figure 1 shows
the Raman spectra in the RBM region of a pristine HiPco and AD SWCNTs sample for the four
different laser sources; 785 nm (1.58 eV), 660 nm (1.88 eV), 532 nm (2.33 eV) and 473 nm (2.62 eV).
Due to the different resonance conditions [34], each different source wavelength gives rise to a markedly
different profile and these profiles are also very different for HiPco and AD SWCNTs. Figure 1 (ii) and
7
(iv) show the combined profiles of RBMs with the four different laser energies of HiPco and AD
SWCNTs respectively by a simple addition of the respective spectra which have been normalized
according to the intensities of the RBMs of each laser line for pristine HiPco and AD SWCNTs
respectively.
Using a previously reported method [24], the diameter distribution of pristine HiPco and AD
SWCNTs were obtained (Table 1 and 2). From Table 1 and 2 and Figure 1, it is found that the SWCNTs
used for the interaction study were of diameter ranges from ~ 0.7 nm to ~ 1.4 nm and from ~ 1.3 nm to ~
1.7 nm for HiPco and AD SWCNTs respectively. These diameter ranges are consistent with reported
values of HiPco ( 0.7 nm to 1.4 nm [8]) and AD SWCNTs (1.1 nm to 1.74 nm [35]) obtained by TEM
and Raman studies respectively.
To study the interaction of PAHs with HiPco and AD SWCNTs, containing markedly different
structural profiles, a fluorescence based model was employed. In SWCNTs/PAHs composite solutions,
free PAHs molecules and those that are bound to the SWCNTs are present simultaneously [11]. In the
composite solution, quenching of the fluorescence in the presence of SWCNTs relative to the
fluorescence of PAH solutions in the absence of SWCNTs, indicates the interaction of PAHs with
SWCNTs [11, 17, 18, 22, 36]. In the case of composite solutions, the observed fluorescence is due to the
free molecules only. Adapting the fluorescence model of Coleman et al. [11], a plot of the fraction of
free PAHs molecules as a function of concentration was achieved (Figure 2). This model is based on the
adsorption and desorption of molecules in solution by the SWCNT surface at low concentration and
when the system is in equilibrium, the adsorption rate equals the desorption rate [11]. According to this
model, as the concentration is varied, the variation of the fraction of free molecules can be described in
terms of a characteristic concentration [11] and the concentration of SCWNTs.
NF/ (N
F+N
B) = 1/ (1+C
NT/C
0) = Fl
comp/Fl
polymer Equation 1
where C0= π
2υ ρ
bunA
bune
-E
B
/ kT/ (48Df) Equation 2

8
In Equation 1, C0 is the characteristic concentration as defined in reference [11] and C
NT is the
concentration of SWCNTs. It represents the concentration at which the number of free molecules, NF, is
equal to the number of bound molecules, NB, and thus the concentration at which the rate of molecular
adsorption on the SWCNT surfaces is equal to the rate of desorption. As SWCNTs and PAHs are used
in a 1:1 ratio by weight, CNT
can also represent the concentration of the molecules. NF is the number of
free molecules, NB is the number of bound molecules, Fl
comp is the fluorescence of the composite and
Flpolymer
is the fluorescence of the polymer which gives the fraction of free molecules in solution. In
Equation 2, υ is a pre-exponential frequency factor, ρbun
is the SWCNT bundle mass density , Abun
is the
bundle surface area, EB is the binding energy, k is the Boltzmann constant, T is the absolute temperature,
f is the spatial integral, D is the diffusion coefficient and D = kT/ (6 π η aa), where η is the solvent viscosity
and a is the molecular hydrodynamic radius [11]. From Equation 2 the binding energy EB between the
molecules and the SWCNTs can be obtained [11].
In Figure 2, the curves show the same general trend regardless of the type of SWCNTs, in agreement
with the behavior seen by Coleman et al. [11] and Hedderman et al. [22]. At the highest concentrations,
shown in Figure 2 for the example of p-quaterphenyl only, the molecularly dispersed PAHs interact with
SWCNT bundles. With decreasing concentration, the PAHs act to disperse the SWCNTs, decreasing the
bundle size (as confirmed by AFM [11, 20, 22]), increasing the effective surface area per SWCNT
available to the molecules for adsorption, resulting in a concentration dependent decrease in the fraction
of free PAH molecules, as represented by the ratio of Equation 1. This decrease reaches a minimum at
the point when the SWCNTs are maximally dispersed. Similar concentration dependent debundling has
been observed and verified using AFM in organic solvents [33] and water/surfactant dispersions [20] of
HiPco SWCNTs and the concentration of maximum dispersion has been termed the dispersion limit [20,
33]. In the plots of fluorescence quenching, the dispersion limit is determined by the concentration of
maximum quenching. From this point, further decreasing the concentration, the surface area per
SWCNT is constant and the fluorescence quenching behavior can be fitted by Equation 1 using C0 (the

9
characteristic concentration) as a fitting parameter. For the range of PAHs, it has been observed that the
dispersion limit, or concentration of maximal fluorescence quenching, and the characteristic
concentration C0, are linearly correlated (supplemental information Figure S2).
Figure 3 shows the relationship between the estimated dispersion limit of HiPco and AD SWCNTs,
and the molecular weight of PAHs. With increasing length of the PAH molecules the concentration at
which SWCNTs bundles are maximally dispersed is reduced for both HiPco and AD SWCNTs. This is
an indication that the shorter molecules are more effective at dispersing the SWCNTs bundles. The
polyacene PAHs are more effective than their polyphenyl counterparts and this may be an indication
that the more planar and rigid polyacenes are more effective at debundling than the polyphenyl
oligomers in which the phenyl units are free to rotate relative to each other. From Figure 3 it can be seen
that, except for the tetracene composite, the dispersion limits of AD SWCNTs estimated for the three
different PAHs are almost identical to those estimated for HiPco SWCNTs with the corresponding
PAHs.
It is worth noting that for the case of the interaction of tetracene with both types of SWCNTs, the
observed minimum of the fluorescence curve is considerably less that for the other PAHs and occurs at a
concentration which is lower than the fitted characteristic concentration. This implies that less than 50%
of the molecules are bound at the minimum and may indicate that tetracene is not very efficient at
debundling SWCNTs in general, albeit slightly better for AD SWCNTs. The dispersion limit of AD
SWCNTs by tetracene is higher than that for HiPco SWCNTs by tetracene.
The observed quenching of the fluorescence of the PAHs is a result of π-π stacking interactions [18,
22] between SWCNTs and the PAH molecules. Figure 4 shows the relationship between the maximum
quenching of PAHs with HiPco (squares) and AD (triangles) SWCNTs, and molecular weight of PAHs.
Starting from high concentrations, the degree of quenching increases as the composite solutions are
10
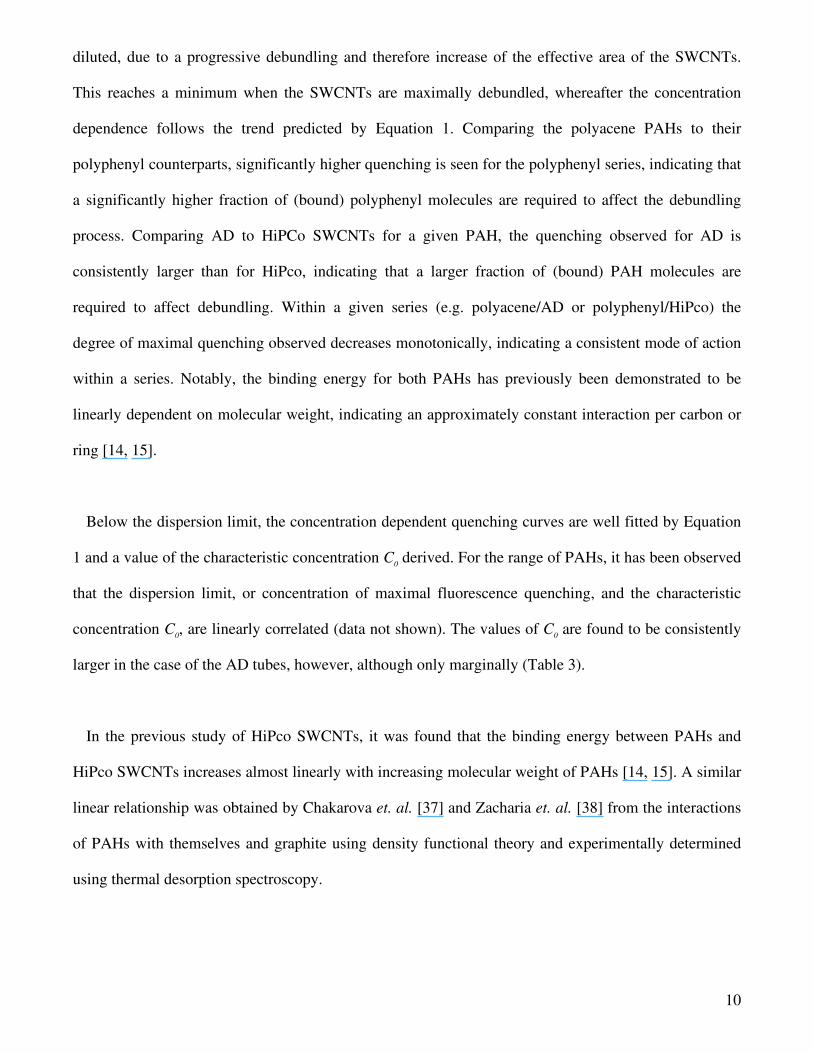
diluted, due to a progressive debundling and therefore increase of the effective area of the SWCNTs.
This reaches a minimum when the SWCNTs are maximally debundled, whereafter the concentration
dependence follows the trend predicted by Equation 1. Comparing the polyacene PAHs to their
polyphenyl counterparts, significantly higher quenching is seen for the polyphenyl series, indicating that
a significantly higher fraction of (bound) polyphenyl molecules are required to affect the debundling
process. Comparing AD to HiPCo SWCNTs for a given PAH, the quenching observed for AD is
consistently larger than for HiPco, indicating that a larger fraction of (bound) PAH molecules are
required to affect debundling. Within a given series (e.g. polyacene/AD or polyphenyl/HiPco) the
degree of maximal quenching observed decreases monotonically, indicating a consistent mode of action
within a series. Notably, the binding energy for both PAHs has previously been demonstrated to be
linearly dependent on molecular weight, indicating an approximately constant interaction per carbon or
ring [14, 15].
Below the dispersion limit, the concentration dependent quenching curves are well fitted by Equation
1 and a value of the characteristic concentration C0 derived. For the range of PAHs, it has been observed
that the dispersion limit, or concentration of maximal fluorescence quenching, and the characteristic
concentration C0, are linearly correlated (data not shown). The values of C
0 are found to be consistently
larger in the case of the AD tubes, however, although only marginally (Table 3).
In the previous study of HiPco SWCNTs, it was found that the binding energy between PAHs and
HiPco SWCNTs increases almost linearly with increasing molecular weight of PAHs [14, 15]. A similar
linear relationship was obtained by Chakarova et. al. [37] and Zacharia et. al. [38] from the interactions
of PAHs with themselves and graphite using density functional theory and experimentally determined
using thermal desorption spectroscopy.
11
To establish the binding energy between PAHs and AD SWCNTs, the same fluorescence model is
used [11, 14]. The value of ρbun
for HiPco and AD SWCNTs is taken as 1.6 x 10⁻³ Kg/m
-3 and 1.33 x10
-3
Kg/m-3 respectively [39], the value of A
bun is taken as 1.5 x 10
-15 m
2 for HiPco and for AD it is 2.2 x 10
-15
m2 [39]. The value of other parameters is taken from literatures [11, 14, 39].
From Table 3 it can be found that regardless of SWCNT type, the binding energy between SWCNTs
and corresponding PAH is the same. It can be thus be stated that the binding energy between SWCNTs
(HiPco and AD) and PAHs is constant but due to the different dimensions of the respective SWCNTs,
the Co value is slightly different (HiPco and AD SWCNTs) for the corresponding composite.
To probe the selective interaction of different PAHs with HiPco and AD SWCNTs, Raman
spectroscopy was used. The concentrations of the composite samples selected for the Raman study are
listed in Table 4.
In Figure 5 (i) and (ii), which are the examples of single point Raman spectra of HiPco /naphthalene
composite samples at two different concentrations, it can be seen that above the dispersion limit at ~
1.17 x 10⁻⁴ mol/L, HiPco SWCNTs remain bundled but below the dispersion limit ~ 1.46 x10
-5 mol/L
predominantly isolated SWCNTs are observed. The insets of these figures show the RBM region of the
corresponding sample and are corrected for the quartz substrate background. As for pristine HiPco and
AD SWCNTs, maps of the composite sample of HiPco and AD SWCNTs with different PAHs at
concentrations below the dispersion limit were performed using the four laser sources. Although in all
cases the RBM spectrum was predominantly singly featured, the spectral positioning varied significantly
from point to point. Therefore, a histogram of occurrence of single RBM features at specific frequencies
was constructed for each source wavelength. To understand the overall effect of these PAHs on the
diameter distribution of both SWCNTs, histograms of overall diameter distribution of solubilised,
dispersed and isolated HiPco and AD SWCNTs are plotted on the same plot (Figure 6). As the RBM

12
frequency is inversely proportional to the diameter, in these plots the histograms represent the
percentage of occurrences of SWCNTs of different diameters, for each composite, at each of the four
different laser excitation energies.
It is well established that the diameter of SWCNT (d) can be related to the RBM frequency RBMω and
structural indices (n, m) by the following equation [40]
222
12
1
)(3C
mnmna
CC
d
C
cc
RBM +++
=+=
−
πω …………… Equation 3,
where,
ac-c
is the distance between the C-C bonds, 0.144 nm, [40]
C1 is a constant of proportionality [41],
C2 is essentially a damping factor which accounts for a frequency shift dependent on the damping
caused by the local environment of the SWCNT [34].
In literature, different values of C1 and C
2 can be found, ranging from 216 cm
-1 nm to 248 cm
-1 nm and
10 to 19 cm-1 for C
1 and C
2 respectively [25-27, 40, 42-45]. Therefore there is considerable uncertainty
in the selection of the value of these parameters. For the purpose of this work, two sets of C1
( 216 cm-1
nm and 234 cm-1 nm) and C
2 (17 nm and 10 nm) values were used to initially obtain a potential diameter
range for pristine SWCNTs. from the RBM frequencies and Equation 3. An estimate of the most
probable diameters contributing to the Raman spectrum at each source wavelength was made, assuming
that resonant SWCNTs dominate the Raman spectrum, by reference to the so-called Kataura plot [46]
which graphically relates the optical transition energies of metallic and semiconducting SWCNTs with
their diameters. For SWCNTs of diameter in the range of ~ 0.7 nm to ~ 1.4 nm (which is the typical
diameter range for HiPco SWCNTs [8], only semiconducting SWCNTs should be resonant at a laser
energy of ~ 1.58 eV (785 nm). Therefore, for this laser energy only the diameters of semiconducting
SWCNTs in the selected diameter range were chosen. However, in many cases there exists more than

13
one candidate corresponding to the particular ωRBM
. To assign a single diameter to a corresponding ωRBM
,
the inverse of these chosen diameters were plotted against the corresponding value of ωRBM.
. As there is a
linear dependence between ωRBM
and the inverse diameter (1/d) [26], the plot should be a straight line.
For a particular ωRBM
, a particular diameter was selected from the best fit to the straight line. Also from
this best fit, the value of C1 and C
2 were found to be 221.5 cm
-1 nm and 14.4 cm
-1 respectively for 785 nm
(1.58 eV). Similarly, the diameters and the value of C1 and C
2 for the different laser energies were found.
The values of C1 and C
2 thus obtained were 207.5 cm
-1 nm and 29.1 nm for 660 nm (1.88 eV), 233.0 cm
-1
nm and 8.5 nm for 532 nm (2.33 eV) and 213.7 cm-1 nm and 22.7 nm for 473 nm (2.62 eV) laser
frequency respectively.
Given the systematic structural dependence of the binding energy of PAHs to mixed SWCNT
samples, it is reasonable to expect that the binding interaction should be optimal for a direct mapping of
the PAH structure onto the linear backbone of matched SWCNT structures. However, a recent detailed
study of their interaction with HiPco SWCNTs suggests a binding which is not specific to structure or
chirality [24]. The results from this study are presented in Figure 6, and show that the PAHs interact
with a range of HiPco SWCNT diameters. In terms of structural selectivity, it has been observed that for
HiPco SWCNTs, only the polyacene moieties solubilise the armchair SWCNTs, although biphenyl also
solubilises the (11, 0) and (12, 0) zig-zag SWCNTs [24]. The polyphenyl moieties do not solubilise the
armchair SWCNTs. However, in none of the four composite samples is the solubilisation of nonchiral
SWCNTs dominant [24]. In general a preference for smaller diameter SWCNTs is evident, although the
longer PAHs have the capacity to solubilise larger diameter SWCNTs, due to their increased binding
energy. This general trend is also seen in the interaction of PAHs of varying length with AD SWCNTs.
It must therefore be postulated that the smaller PAHs can relatively efficiently bind normal to the tube
axis of nonchiral nanotubes and along the direction of the chiral vector of chiral nanotubes. Given the
curvature of the SWCNTs, this is more efficient for the smaller PAHs on small diameter SWCNTs, the
14
longer PAHs interacting more efficiently with larger diameter SWCNTs. Additionally, the polyphenyl
PAHs have a degree of rotational freedom about the inter-phenyl bond which may inhibit structurally
specific binding. PAHs are also known to stack orthogonal to the surface of graphite, although this is
energetically favourable only at high coverage [38]. A correlation of such steric and energetic
considerations may reduce any structural selectivity. The curvature of SWCNTs compared to the width
of PAHs [47] and the solvent, chloroform [48] might also affect the interaction process. Gotovac et al.
reported that in liquid-phase adsorption of tetracene and phenanthrene on SWCNTs, tetracene was
adsorbed more than six times more than phenanthrene which attributed to the effect of the nanoscale
curvature of the tube surface [47]. From the report of Liu et al.[48], it has been found that in liquid-
phase, the solvent also plays an important role for the selective solubilisation of SWCNTs. It was found
that the pentacene derivative is more effective for extraction of metallic SWCNTs when
dimethylfomamide (DMF) is used as a solvent rather than N-methyl-2-pyrrolidone (NMP) and
chloroform [48].
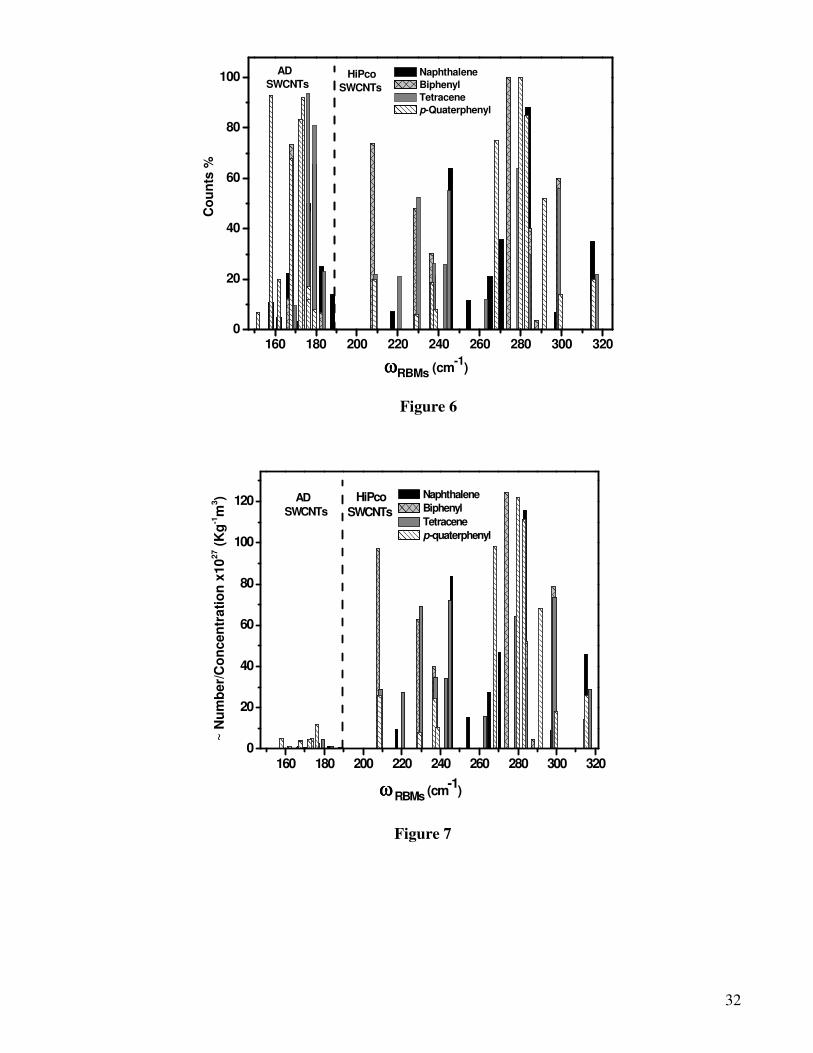
From Figure 6, it is difficult to obtain quantitative information about the degree of solubilisation by
the different PAHs. In this sense it would be more informative to estimate the number of SWCNTs
solubilised at the characteristic concentration. From a previous study using AFM [39], the average
diameter and length of HiPco and AD SWCNTs were found to be 0.9 nm; 750 nm and 1.3 nm; 1000 nm
respectively. Using these values, the approximate volumes ( TubeV = 2 π r r2l, where r and l are the radius
and the length of a SWCNT respectively) of corresponding SWCNTs were calculated. Using Equation
4, the approximate number of corresponding SWCNTs per concentration, at the characteristic
concentration C0 was calculated.
31%mKg
V
CountV
ionConcentrat
Number
Tube
Solution −
×
×=
ρ Equation 4
15
Here, Number = Number of SWCNTs,
SolutionV = Volume of the solution
ρ = mass density of corresponding SWCNTs (HiPco: 1.6x10⁻³ Kg/m
3 and
AD: 1.33x10⁻³ Kg/m
3)
Concentration = Characteristic concentration for the respective PAH.
Count% is the occurrence obtained from the Raman spectroscopy study.
A plot of Number/Concentration as a function of ωRBMs
representing the diameter distribution of HiPco
and AD composite solutions was plotted (Figure 7). It can be seen that the approximate number of
selected HiPco SWCNTs per concentration is significantly higher than that of AD SWCNTs and again it
is found that the shorter chain PAHs more efficiently solubilise and disperse the SWCNTs. The
approximate number of SWCNTs selected by different PAHs was obtained by multiplying the
Number/Concentration of different PAHs/SWCNTs composite samples of corresponding SWCNTs
(Table 3) with value of C0. A plot representing the approximate number of selected SWCNTs (HiPco
and AD) by different PAHs is shown in Figure 8.
In Figure 8, it can be seen that with increasing molecular weight or size of PAHs, the number of
solubilised SWCNTs decreases. The decrease is approximately exponential, and correlates well with the
approximately exponential decrease of the dispersion limit, as shown in Figure 3 (and characteristic
concentration) with molecular weight of PAH. It can be stated that although longer PAHs bind more
strongly with SWCNTs they solubilise the SWCNTs less efficiently. Therefore, the shorter the PAHs
molecules (here naphthalene) the better the solubilisation of SWCNTs. From Figure 7 and 8, it is also
evident that the number of AD SWCNTs selected by PAHs is less than that of HiPco SWCNTs. The
reason might be because of the larger diameter and length of AD SWCNTs as well as the larger bundle
surface area than that of HiPco SWCNTs more PAHs are interacting with AD SWCNTs to make it
soluble than that of HiPco SWCNTs which is also evident from the quenching study (Figure 4).

16
The quality and nature of impurities present in SWCNTs might also affect the interaction process
[49]. However, it has previously been indicated that the interaction of PAHs and organic polymers with
SWCNT samples effectively purifies them as amorphous and graphitic residuals are not solubilised [12,
18]. However, as indicated in the experimental section, at concentrations where the SWNTs are well
dispersed, no precipitate was visually observable, indicating that some degree of impurities may be
present in the sample. It is not clear how their presence may effect the interaction process, but in a
quantitative comparison they should be considered. The presence of 30% and 10% impurities in AD and
HiPCo samples respectively should result in a reduction of C0 by a corresponding factor. A re-evaluation
of the PAH binding energies results in values for the AD composites which are consistently ~5% than
those for the HiPco composites, a difference which is with in the experimental errors of the
measurement. In terms of number of nanotubes solubilised, a similar correction would result in a further
reduction of the estimate of the number of AD nanotubes solubilised, relative to HiPco.
CONCLUSIONS
The concentration dependence fluorescence study shows that, in a 1:1 composite ratio by weight,
HiPco and AD SWCNTs are debundled at similar concentrations by PAHs. Polyacene PAHs are more
efficient than their polyphenyl counterparts and debundling is affected more readily in HiPco
composites than in AD. The total amount of solubilised SWCNTs decreases with the increasing
molecular weight of PAHs. Observed differences in characteristic concentration for the two types of
nanotube are largely due to differing dimensions, and once the tubes are maximally debundled, the
binding energy of PAHs is independent of nanotube type. For both tubes types, little or no structural
selectivity is observed, although in general smaller diameter nanotubes are more effectively solubilised.
17
Thus, once debundled, the smaller diameter HiPCo SWCNTs are solubilised to a significantly higher
degree than the AD SWCNT samples.
ACKNOWLEDGMENT
This project is funded under the Science Foundation Ireland Research Frontiers Program PHY037
2006. The Raman Instrument was purchased under the framework of the INSPIRE programme, funded
by the Irish Government's Programme for Research in Third Level Institutions, Cycle 4, National
Development Plan 2007-2013, supported by the European Union Structural Fund.
Supporting Information Available
Figure S1 shows an AFM image of HiPco SWCNTs deposited on quartz from a ~ 9.536 x10⁻⁹ mol/L
HiPco/tetracene suspension in chloroform. This concentration is below the concentration of maximum
fluorescence quenching of the HiPco/tetracene composite sample. From this figure it is evident that
below this concentration, the samples contain dispersed and isolated SWCNTs of diameters in the range
of ~ 0.8 to ~ 1.0 nm. This AFM result indicates that the probability of obtaining isolated SWCNTs
below this concentration is high for the corresponding composite, and that this concentration may be
considered to be the dispersion limit of the composite dispersions. This AFM result also confirms that
after drop-casting and drying the dispersed samples, SWCNTs remain debundled.
As shown in Figure S2, the dispersion limit is well correlated with the characteristic concentration
C0.
These materials are available free of charge via the Internet at http://pubs.acs.org.

18
Figure S1: AFM image of HiPco SWCNTs of HiPco/tetracene sample at concentration ~ 9.536 x10⁻⁹
mol/L (i). Diameters of HiPco SWCNTs in this sample are shown in (ii).
1E-7 1E-5 1E-3 0.1 10 1000
1E-9
1E-8
1E-7
1E-6
1E-5
1E-4
1E-3
0.01
0.1
1
10
100
1000
p-Quaterphenyl
Tetracene
Biphenyl
Naphthalene
p-Quinquephenyl
p-Quaterphenyl
p-Terphenyl
Tetracene
AnthraceneBiphenyl
C0 x
10
-7 (
mo
l/L
)
Dispersion limit x10-7 (mol/L)
HiPco SWCNTs
AD SWCNTsNaphthalene
Figure S2: Characteristic concentration as a function of dispersion limit.
19
REFERENCES
1. Yu, M.F.; Files, B.S.; Arepalli, S.; Ruoff, R.S. Tensile loading of ropes of single wall carbon
nanotubes and their mechanical properties. Phys. Rev. Lett. 2000, 84, 5552-5555.
2. Thess, A.; Lee, R.; Nikolaev, P.; Dai, H.J.; Petit, P.; Robert, J.; Xu, C.H.; Lee, Y.H.; Kim, S.G.;
Rinzler, A.G.; Colbert, D.T.; Scuseria, G.E.; Tomanek, D.; Fischer, J.E.; Smalley, R.E.
Crystalline ropes of metallic carbon nanotubes. Science 1996, 273, 483-487.
3. Hone, J.; Whitney, M.; Piskoti, C.; Zettl, A. Thermal conductivity of single-walled carbon
nanotubes. Phys. Rev. B 1999, 59, R2514-R2516.
4. Iijima, S.; Ichihashi, T. Single-Shell Carbon Nanotubes of 1-Nm Diameter. Nature 1993, 363,
603-605.
5. Journet, C.; Maser, W.K.; Bernier, P.; Loiseau, A.; delaChapelle, M.L.; Lefrant, S.; Deniard, P.;
Lee, R.; Fischer, J.E. Large-scale production of single-walled carbon nanotubes by the electric-
arc technique. Nature 1997, 388, 756-758.
6. Puretzky, A.A.; Geohegan, D.B.; Fan, X.; Pennycook, S.J. Dynamics of single-wall carbon
nanotube synthesis by laser vaporization. Appl. Phys. Mater. Sci. Process. 2000, 70, 153-160.
7. Scott, C.D.; Arepalli, S.; Nikolaev, P.; Smalley, R.E. Growth mechanisms for single-wall carbon
nanotubes a laser ablation process. Appl. Phys. Mater. Sci. Process. 2002. 74, 11-11.
8. Nikolaev, P.; Bronikowski, M.J.; Bradley, R.K.; Rohmund, F.; Colbert, D.T.; Smith, K.A.;
Smalley, R.E. Gas-phase catalytic growth of single-walled carbon nanotubes from carbon
monoxide. Chem. Phys. Lett. 1999, 313, 91-97.
9. Colomer, J.F.; Bister, G.; Willems, I.; Konya, Z.; Fonseca, A.; Van Tendeloo, G.; Nagy, J.B.
Synthesis of single-wall carbon nanotubes by catalytic decomposition of hydrocarbons. Chem.
Commun. 1999, 1343-1344.

20
10. Park, C.; Ounaies, Z.; Watson, K.A.; Crooks, R.E.; Smith, J.; Lowther, S.E.; Connell, J.W.;
Siochi, E.J.; Harrison, J.S.; Clair, T.L.S. Dispersion of single wall carbon nanotubes by in situ
polymerization under sonication. Chem. Phys. Lett. 2002, 364, 303-308.
11. Coleman, J.N.; Fleming, A.; Maier, S.; O'Flaherty, S.; Minett, A.I.; Ferreira, M.S.; Hutzler, S.;
Blau, W.J. Binding kinetics and SWNT bundle dissociation in low concentration polymer-
nanotube dispersions. J. Phys. Chem. B 2004, 108, 3446-3450.
12. Dalton, A.B.; Blau, W.J.; Chambers, G.; Coleman, J.N.; Henderson, K.; Lefrant, S.; McCarthy,
B.; Stephan, C.; Byrne, H.J. A functional conjugated polymer to process, purify and selectively
interact with single wall carbon nanotubes. Syn. Meta. 2001, 121, 1217-1218.
13. Dalton, A.B.; Stephan, C.; Coleman, J.N.; McCarthy, B.; Ajayan, P.M.; Lefrant, S.; Bernier, P.;
Blau, W.J.; Byrne, H.J. Selective interaction of a semiconjugated organic polymer with single-
wall nanotubes. J. Phys. Chem. B 2000, 104, 10012-10016.
14. Debnath, S.; Cheng, Q.; Hedderman, T.G.; Byrne, H.J. A study of the interaction between
single-walled carbon nanotubes and polycyclic aromatic hydrocarbons: Toward structure-
property relationships. J. Phys. Chem. C 2008, 112, 10418-10422.
15. Debnath, S.; Cheng, Q.; Hedderman, T.G.; Byrne, H.J. An experimental study of the interaction
between single walled carbon nanotubes and polycyclic aromatic hydrocarbons. Phys. Status
Solidi B 2008, 245, 1961-1963.
16. Dyke, C.A.; Tour, J.M. Covalent functionalization of single-walled carbon nanotubes for
materials applications. J. Phys. Chem. A 2004, 108, 11151-11159.
17. Giordani, S.; Bergin, S.D.; Drury, A.; Mhuircheartaigh, E.N.; Ruther, M.; Coleman, J.N.; Blau,
W.J. Effect of solvent and dispersant on the bundle dissociation of single- walled carbon
nanotube. Proc. SPIE 2005, 5824, 42-49.
18. Hedderman, T.G.; Keogh, S.M.; Chambers, G.; Byrne, H.J. Solubilization of SWNTs with
organic dye molecules. J. Phys. Chem. B 2004, 108, 18860-18865.

21
19. O'Connell, M.J.; Boul, P.; Ericson, L.M.; Huffman, C.; Wang, Y.H.; Haroz, E.; Kuper, C.; Tour,
J.; Ausman, K.D.; Smalley, R.E. Reversible water-solubilization of single-walled carbon
nanotubes by polymer wrapping. Chem. Phys. Lett. 2001, 342, 265-271.
20. Priya, B.R.; Byrne, H.J. Investigation of sodium dodecyl benzene sulfonate assisted dispersion
and debundling of single-wall carbon nanotubes. J. Phys. Chem. C 2008, 112, 332-337.
21. Ren, D.M.; Guo, Z.; Du, F.; Liu, Z.F.; Zhou, Z.C.; Shi, X.Y.; Chen, Y.S.; Zheng, J.Y. A novel
soluble Tin(IV) porphyrin modified single-walled carbon nanotube nanohybrid with light
harvesting properties. Int. J. Mol. Sci. 2008, 9, 45-55.
22. Hedderman, T.G.; Keogh, S.M.; Chambers, G.; Byrne, H.J. In-depth study into the interaction of
single walled carbon nanotubes with anthracene and p-terphenyl. J. Phys. Chem. B 2006, 110,
3895-3901.
23. Marquis, R.; Greco, C.; Sadokierska, I.; Lebedkin, S.; Kappes, M.M.; Michel, T.; Alvarez, L.;
Sauvajol, J.L.; Meunier, S.; Mioskowski, C. Supramolecular discrimination of carbon nanotubes
according to their helicity. Nano Lett. 2008, 8, 1830-1835.
24. Debnath, S.; Cheng, Q.; Hedderman, T.G.; Byrne, H.J. A Raman spectroscopy study of the
solubilisation of SWCNTs by polycyclic aromatic hydrocarbons. Carbon December 2009,
Accepted.
25. Bachilo, S.M.; Strano, M.S.; Kittrell, C.; Hauge, R.H.; Smalley, R.E.; Weisman, R.B. Structure-
assigned optical spectra of single-walled carbon nanotubes. Science 2002, 298, 2361-2366.
26. Dresselhaus, M.S.; Dresselhaus, G.; Jorio, A. Raman spectroscopy of carbon nanotubes in 1997
and 2007. J. Phys. Chem. C 2007, 111, 17887–17893.
27. Yu, Z.H.; Brus, L. Rayleigh and Raman scattering from individual carbon nanotube bundles. J.
Phys. Chem. B 2001, 105, 1123-1134.
28. Rao, A.M.; Richter, E.; Bandow, S.; Chase, B.; Eklund, P.C.; Williams, K.A.; Fang, S.;
Subbaswamy, K.R.; Menon, M.; Thess, A.; Smalley, R.E.; Dresselhaus, G.; Dresselhaus, M.S.
22
Diameter-selective Raman scattering from vibrational modes in carbon nanotubes. Science 1997,
275, 187-191.
29. Carbon Nanotechnology Inc., 16200 Park Row, Houston, TX 77084-5195, United States.
30. http://www.sigmaaldrich.com.
31. Cheng, Q.; Debnath, S.; Gregan, E.; Byrne H.J. Effects of chlorinated aromatic solvents on the
dispersion of HiPco SWNTs. Phys. Status Solidi B 2008, 245, 1947-1950.
32. Bahr, J.L.; Mickelson, E.T.; Bronikowski, M.J.; Smalley, R.E.; Tour, J.M. Dissolution of small
diameter single-wall carbon nanotubes in organic solvents? Chem. Commun. 2001, 193-194.
33. Giordani, S.; Bergin, S.D.; Nicolosi, V.; Lebedkin, S.; Kappes, M.M.; Blau, W.J.; Coleman, J.N.
Debundling of single-walled nanotubes by dilution: Observation of large populations of
individual nanotubes in amide solvent dispersions. J. Phys. Chem. B 2006, 110, 15708-15718.
34. Kuzmany, H.; Plank, W.; Hulman, M.; Kramberger, C.; Gruneis, A.; Pichler, T.; Peterlik, H.;
Kataura, H.; Achiba, Y. Determination of SWCNT diameters from the Raman response of the
radial breathing mode. Euro. Phys. J. B 2001, 22, 307-320.
35. Keogh, S. Spectroscopic Characterisation of SWNT Polymer Composites. PhD thesis, Dublin
Institute of Technology 2006.
36. Curran, S.A.; Ajayan, P.M.; Blau, W.J.; Carroll, D.L.; Coleman, J.N.; Dalton, A.B.; Davey,
A.P.; Drury, A.; McCarthy, B.; Maier, S.; Strevens, A.; A composite from poly(m-
phenylenevinylene-co-2,5-dioctoxy-p-phenylenevinylene) and carbon nanotubes: A novel
material for molecular optoelectronics. Adv. Mater. 1998, 10, 1091-1093.
37. Chakarova, S.D.; Schroder, E. van der Waals interactions of polycyclic aromatic hydrocarbon
dimers. J. Chem. Phys. 2005, 122, 054102 (1)- 054102 (5).
38. Zacharia, R.; Ulbricht, H.; Hertel, T. Interlayer cohesive energy of graphite from thermal
desorption of polyaromatic hydrocarbons. Phys. Rev. B 2004, 69, 155406-1-155406-7.
39. Hedderman, T.G. Solubilisation, purification and processing of SWNT using organic molecules.
PhD Thesis. Dublin Institute of Technology 2006.
23
40. Strano, M.S.; Doorn, S.K.; Haroz, E.H.; Kittrell, C.; Hauge, R.H.; Smalley, R.E. Assignment of
(n, m) Raman and optical features of metallic single-walled carbon nanotubes. Nano Lett. 2003,
3, 1091-1096.
41. Hahm, M.G.; Kwon, Y.K.; Lee, E.; Ahn, C.W.; Jung, Y.J. Diameter Selective Growth of
Vertically Aligned Single Walled Carbon Nanotubes and Study on Their Growth Mechanism. J.
Phys. Chem. C 2008, 112, 17143-17147.
42. Fantini, C.; Jorio, A.; Souza, M.; Strano, M.S.; Dresselhaus, M.S.; Pimenta, M.A. Optical
transition energies for carbon nanotubes from resonant Raman spectroscopy: Environment and
temperature effects. Phys. Rev. Lett. 2004, 93, 147406(1)-147406(4).
43. Jorio, A.; Saito, R.; Hafner, J.H.; Lieber, C.M.; Hunter, M.; McClure, T.; Dresselhaus, G.;
Dresselhaus, M.S. Structural (n, m) determination of isolated single-wall carbon nanotubes by
resonant Raman scattering. Phys. Rev. Lett. 2001, 86, 1118-1121.
44. Rao, A.M.; Chen, J.; Richter, E.; Schlecht, U.; Eklund, P.C.; Haddon, R.C.; Venkateswaran,
U.D.; Kwon, Y.K.; Tomanek, D. Effect of van der Waals interactions on the Raman modes in
single walled carbon nanotubes. Phys. Rev. Lett. 2001, 86, 3895-3898.
45. Telg, H.; Maultzsch, J.; Reich, S.; Hennrich, F.; Thomsen, C. Chirality distribution and
transition energies of carbon nanotubes. Phys. Rev. Lett. 2004, 93, 177401(1)-177401(4).
46. Kataura, H.; Kumazawa, Y.; Maniwa, Y.; Umezu, I.; Suzuki, S.; Ohtsuka, Y.; Achiba, Y.;
Optical properties of single-wall carbon nanotubes. Syn. Meta. 1999, 103, 2555-2558.
47. Gotovac, S.; Honda, H.; Hattori, Y.; Takahashi, K.; Kanoh, H.; Kaneko, K. Effect of nanoscale
curvature of single-walled carbon nanotubes on adsorption of polycyclic aromatic hydrocarbons.
Nano Lett. 2007, 7, 583-587.
48. Liu, C.H.; Liu, Y.Y.; Zhang, Y.H.; Wei, R.R.; Li, B.R.; Zhang, H.L.; Chen, Y. Selective
interaction of a soluble pentacene derivative with metallic single-walled carbon nanotubes.
Chem. Phys. Lett. 2009, 471, 97-102.
24
49. Gotovac, S.; Hattori, Y.; Noguchi, D.; Miyamoto, J.; Kanamaru, M.; Utsumi, S.; Kanoh, H.;
Kaneko, K. Phenanthrene adsorption from solution on single wall carbon nanotubes. J. Phys.
Chem. B 2006, 110, 16219-16224.
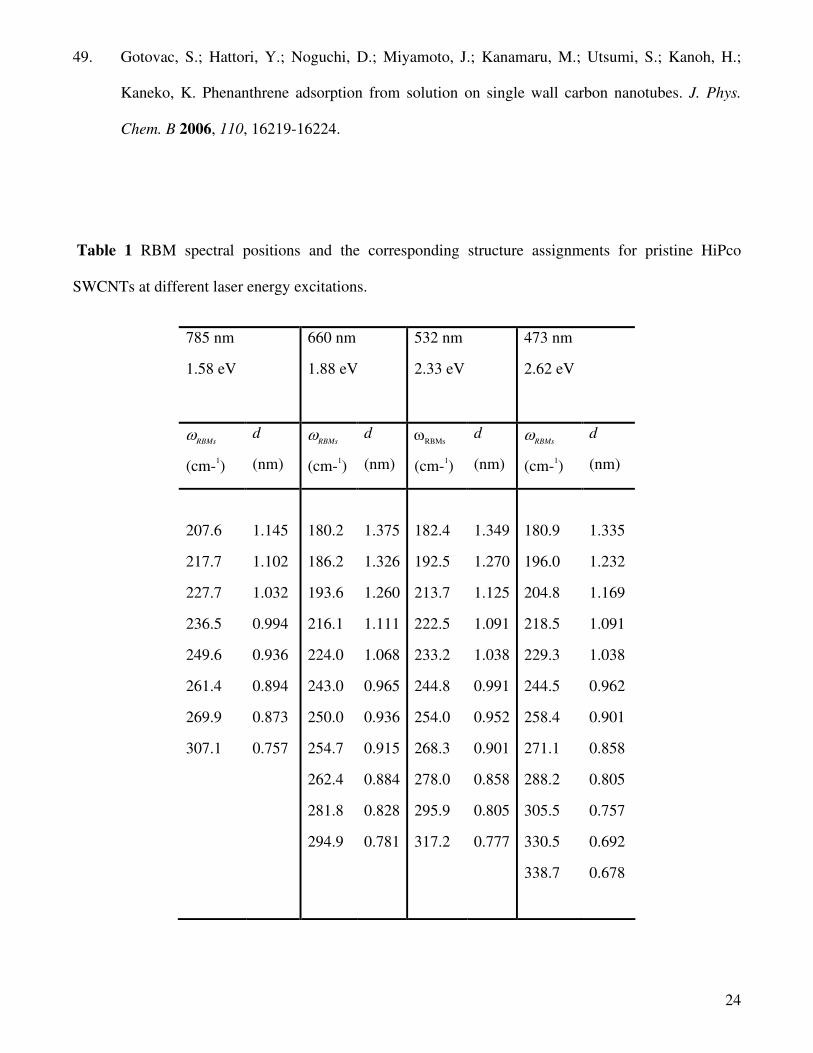
Table 1 RBM spectral positions and the corresponding structure assignments for pristine HiPco
SWCNTs at different laser energy excitations.
785 nm
1.58 eV
660 nm
1.88 eV
532 nm
2.33 eV
473 nm
2.62 eV
ωRBMs
(cm-1)
d
(nm)
ωRBMs
(cm-1)
d
(nm)
ωRBMs
(cm-1)
d
(nm)
ωRBMs
(cm-1)
d
(nm)
207.6
217.7
227.7
236.5
249.6
261.4
269.9
307.1
1.145
1.102
1.032
0.994
0.936
0.894
0.873
0.757
180.2
186.2
193.6
216.1
224.0
243.0
250.0
254.7
262.4
281.8
294.9
1.375
1.326
1.260
1.111
1.068
0.965
0.936
0.915
0.884
0.828
0.781
182.4
192.5
213.7
222.5
233.2
244.8
254.0
268.3
278.0
295.9
317.2
1.349
1.270
1.125
1.091
1.038
0.991
0.952
0.901
0.858
0.805
0.777
180.9
196.0
204.8
218.5
229.3
244.5
258.4
271.1
288.2
305.5
330.5
338.7
1.335
1.232
1.169
1.091
1.038
0.962
0.901
0.858
0.805
0.757
0.692
0.678
25
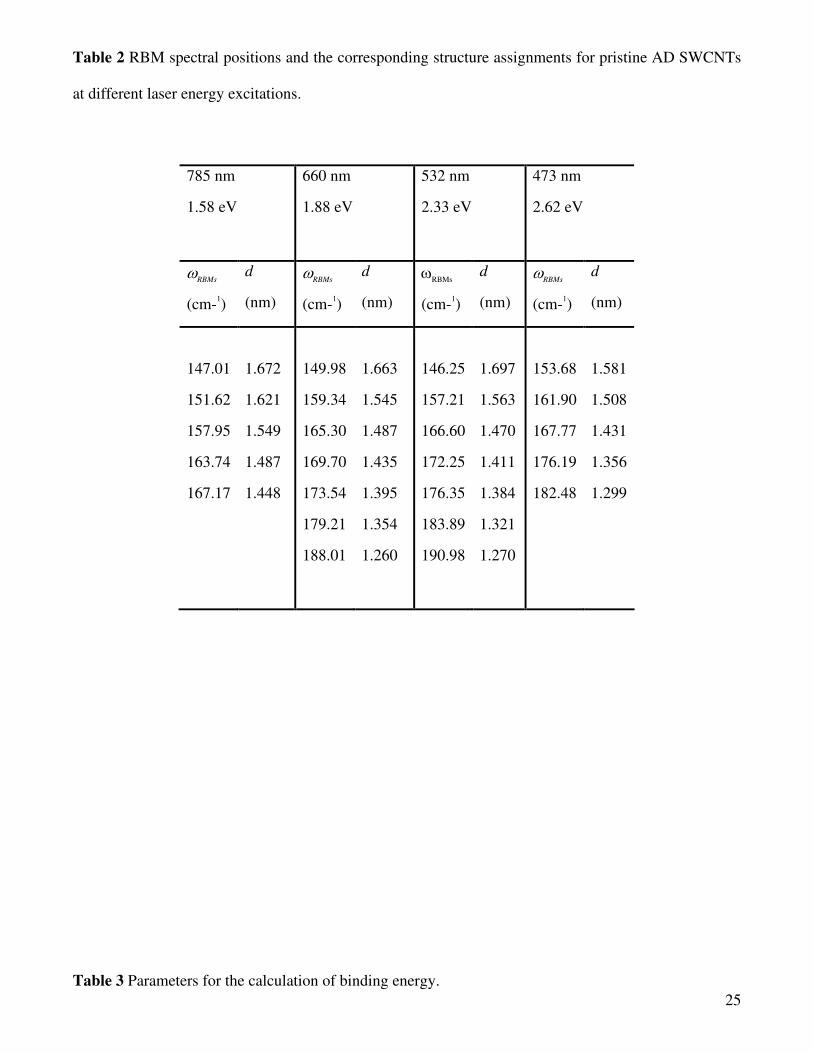
Table 2 RBM spectral positions and the corresponding structure assignments for pristine AD SWCNTs
at different laser energy excitations.
785 nm
1.58 eV
660 nm
1.88 eV
532 nm
2.33 eV
473 nm
2.62 eV
ωRBMs
(cm-1)
d
(nm)
ωRBMs
(cm-1)
d
(nm)
ωRBMs
(cm-1)
d
(nm)
ωRBMs
(cm-1)
d
(nm)
147.01
151.62
157.95
163.74
167.17
1.672
1.621
1.549
1.487
1.448
149.98
159.34
165.30
169.70
173.54
179.21
188.01
1.663
1.545
1.487
1.435
1.395
1.354
1.260
146.25
157.21
166.60
172.25
176.35
183.89
190.98
1.697
1.563
1.470
1.411
1.384
1.321
1.270
153.68
161.90
167.77
176.19
182.48
1.581
1.508
1.431
1.356
1.299
Table 3 Parameters for the calculation of binding energy.
26
PAHs For HiPco composite
C0 (Kg/m3)
For AD composite
C0 (Kg/m3)
For HiPco composite
EB(eV)
For AD composite
EB(eV)
Naphthalene 7.68 x 10⁻³ 8.96x10
-3 0.46 0.46
Anthracene 3.11x10⁻³ -------------- 0.49 --------
Tetracene 9.13 x 10⁻⁵ 1.36x10
-4 0.58 0.58
Biphenyl 2.31 x 10⁻³ 2.92x10
-3 0.50 0.50
p-terphenyl 5.75 x 10⁻⁷ -------------- 0.72 -------
p-quaterphenyl 2.14 x 10⁻⁸ 2.69x10
-8 0.81 0.81
p-quinquephenyl 4 x 10-16
-------------- 1.12 --------
Table 4 Concentration of each PAH composite used for Raman study.
Sample concentration (mol/L) PAH
HiPco AD
Naphthalene ~ 1.17x10
-4
~ 1.46 x10⁻⁵
~ 2.92 x10⁻⁵
Tetracene ~ 4.76 x10⁻⁹ ~ 1.90 x10
-8
Biphenyl ~ 3.05 x10⁻⁷ ~ 1.95 x10
-5
p-Quaterphenyl ~ 3.72 x10⁻¹¹
~ 3.72 x10⁻¹¹
FIGURE CAPTIONS

27
Figure 1: RBMs of pristine HiPco (i) and AD (iii) SWCNTs with 785 nm (1.58eV), 660 nm (1.88 eV),
532 nm (2.33 eV) and 473 (2.62 eV) as source (ii) combined Raman spectra of HiPco (ii) and AD (iv)
SWCNTs for the different lasers.
Figure 2: A plot of the fraction of free PAHs as a function of concentration for HiPco SWCNTs and
AD SWCNTs composite. The solid and dashed curves are the best fits to Equation 1 for HiPco and AD
SWCNTs respectively. Solid and dashed vertical lines indicate C0 and the dispersion limit of SWCNTs
for the case of p-quaterphenyl respectively.
Figure 3: A plot of estimated dispersion limit of HiPco (squares) and AD (triangles) SWCNTs as a
function of molecular weight of PAHs. Straight line is a guide to the eye.
Figure 4: A plot of maximum quenching of PAHs with HiPco (squares) and AD (triangles) SWCNTs as
a function of molecular weight of PAHs. Straight lines are guide to the eye.
Figure 5: Raman spectra of HiPco/naphthalene composite samples of concentrations (i) ~ 1.17 x 10⁻⁴
mol/Land (ii) ~ 1.46 x10⁻⁵ mol/L respectively at 532nm (2.33 eV)
Figure 6: A plot of overall diameter distribution of HiPco and AD SWCNTs selected by PAHs.
Figure 7: A plot of Number/Concentration as a function of ωRBMs
.
Figure 8: Total number of solubilised AD and HiPco SWCNTs as function of molecular weight of
PAHs.

28
150 200 250 300 350
2.62 eV
473 nm
2.33 eV
532 nm
1.88 eV
660 nm
ωωωωRBMs (cm-1
)
Inte
nsit
y (
a.u
.)
1.58 eV
785 nm
Figure 1 (i)
150 200 250 300 350
Inte
ns
ity
(a
.u.)
ωωωωRBMs (cm-1
)
Figure 1 (ii)
29
120 140 160 180 200
2.62 ev
473 nm
2.33 eV
532 nm
1.88 eV
660 nm
Inte
nsit
y (
a.u
.)
ωωωωRBMs (cm-1)
1.58 eV
785 nm
Figure 1 (iii)
120 140 160 180 200
Inte
nsit
y (
a.u
.)
ωωωωRBMs (cm-1
)
Figure 1 (iv)

30
1E-131E-121E-111E-10 1E-9 1E-8 1E-7 1E-6 1E-5 1E-4 1E-3 0.01
0.0
0.2
0.4
0.6
0.8
1.0
p-Quaterphenyl
Tetracene
Fl
Co
m/F
l P
AH
s
Concentration (mol/L)
AD & Naphthalene
HiPco & Naphthalene
AD & Biphenyl
HiPco & Biphenyl
AD & Tetracene
HiPco & Tetracene
AD & p-Quaterphenyl
HiPco & p-Quaterphenyl
Naphthalene
Biphenyl
Dispersion limit
C0
Figure 2
150 200 250 300 350 4001E-15
1E-14
1E-13
1E-12
1E-11
1E-10
1E-9
1E-8
1E-7
1E-6
1E-5
1E-4
1E-3
0.01
p-quinquephenyl
Tetracene
Anthracene
p-quaterphenyl
p-terphenyl
Biphenyl
Dis
pe
rsio
n lim
it (
mo
l/L
)
Molecular weight (gm/mol)
Naphthalene
Figure 3

31
150 200 250 300 350 4000.3
0.4
0.5
0.6
0.7
0.8
0.9
1.0
p-quaterphenyl
AD
Biphenyl
AD
Tetracene
AD
Naphthalene
AD
p-quinquephenyl
HiPco
p-quaterphenyl
HiPco
p-terphenyl
HiPco
Biphenyl
HiPco
Tetracene
HiPco
Anthracene
HiPco
Ma
xim
um
qu
en
ch
ing
Molecular weight (gm/mol)
Naphthalene
HiPco
Figure 4
(i) (ii)
Figure 5
32
160 180 200 220 240 260 280 300 3200
20
40
60
80
100 HiPco
SWCNTs
Co
un
ts %
ωωωωRBMs (cm-1
)
Naphthalene
Biphenyl
Tetracene
p-Quaterphenyl
AD
SWCNTs
Figure 6
160 180 200 220 240 260 280 300 3200
20
40
60
80
100
120
ωωωω RBMs (cm-1
)
~ N
um
be
r/C
on
ce
ntr
ati
on
x10
27 (
Kg
-1m
3) Naphthalene
Biphenyl
Tetracene
p-quaterphenyl
HiPco
SWCNTs
AD
SWCNTs
Figure 7

33
Molecular weight (gm/mol)
100 120 140 160 180 200 220 240 260 280 300 320
To
tal
nu
mb
er
x 1
0-2
2
1e-1
1e+0
1e+1
1e+2
1e+3
1e+4
1e+5
1e+6
Naphthalene Ad
Naphthalene HiPco
Biphenyl Ad
Biphenyl HiPco
Tetracene HiPco
Tetracene AD
p-Quaterpheny HiPco
p-Quaterpheny AD
Figure 8

34
TABLE OF CONTENTS IMAGE: