Nitro 525RS Parts Manual Rev.2-0.pdf - Tubeline Manufacturing
Upload
khangminh22Category
view
1download
0
fu K //• ^^V
Commission of the European Communities Community Bureau of Reference
(#1 Illf0fl113iiiifi REFERENCE MATERIALS
The certification of the purity of seven nitro-polycyclic aromatic compounds
CRM Nos 305, 306, 307, 308, 310, 311, 312


Commission of the European Communities Community Bureau of Reference
bcr information REFERENCE MATERIALS
The certification of the purity of seven nitro-polycyclic aromatic compounds
CRM Nos 305, 306, 307, 308, 310, 311, 312
J.J. Belliardo Community Bureau of References, CEC, Brussels, Belgium
J. Jacob Biochemisches Institut für Umweltcarcinogene, Ahrensburg, Federal Republic of Germany
A.S. Lindsey Leatherhead, United Kingdom
Directorate-General Science, Research and Development
1988 L-_ EUR 11254 EN
PARI r " ~ \ n!ioth.

Published by the COMMISSION OF THE EUROPEAN COMMUNITIES
Directorate-General Telecommunications, Information Industries and Innovation
Batiment Jean Monnet LUXEMBOURG
LEGAL NOTICE Neither the Commission of the European Communities nor any person acting on behalf of the Commission is responsible for the use which
might be made of the following information
DISCLAIMER Whenever, in this report, a commercial product is identified by the manufacturer's name or label, such identification should in no instance be taken
as an endorsement by the Commission or as an indication that the particular product or equipment is necessarily the best available for the
particular purpose
Cataloguing data can be found at the end of this publication
Luxembourg: Office for Official Publications of the European Communities, 1988
ISBN 92-825-7956-5 Catalogue number: CD-NA-11254-EN-C
© ECSC-EEC-EAEC, Brussels • Luxembourg, 1988
Printed in Belgium
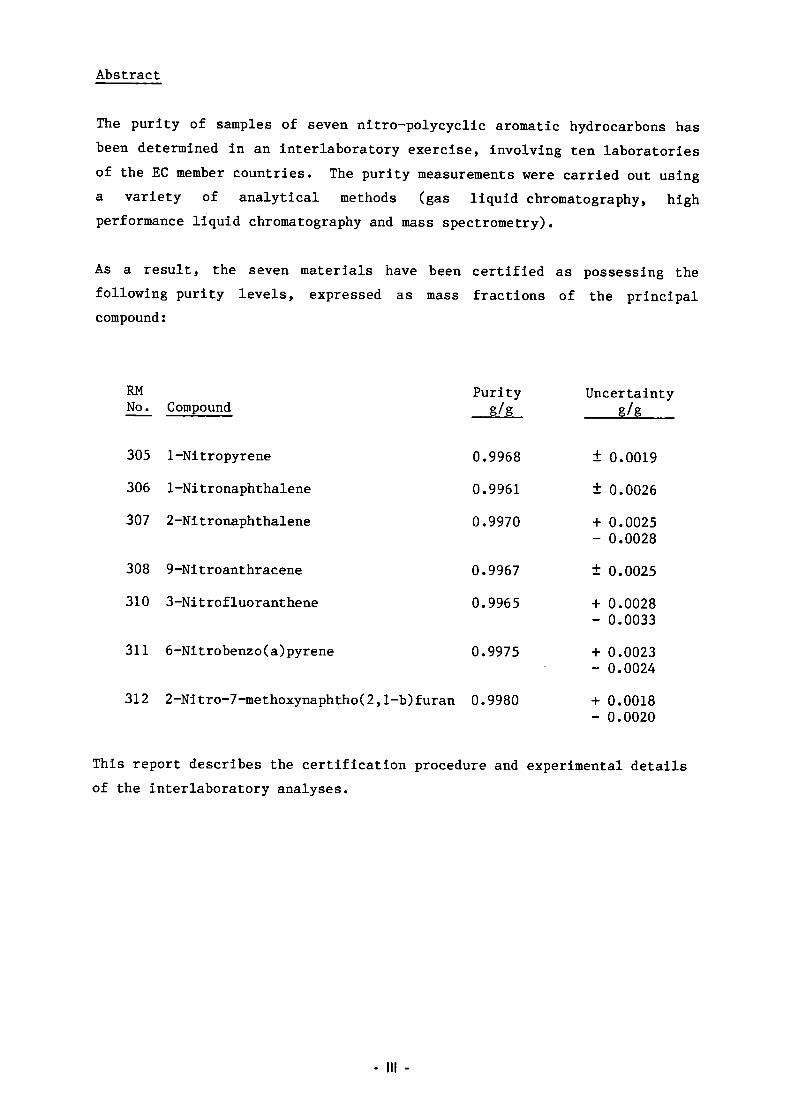
Abstract
The purity of samples of seven nitro-polycyclic aromatic hydrocarbons has been determined in an interlaboratory exercise, involving ten laboratories of the EC member countries. The purity measurements were carried out using a variety of analytical methods (gas liquid chromatography, high performance liquid chromatography and mass spectrometry).
As a result, the seven materials have been certified as possessing the following purity levels, expressed as mass fractions of the principal compound:
RM No. Compound
305 1-Nitropyrene
306 1-Nitronaphthalene
307 2-Nitronaphthalene
308 9-Nitroanthracene
310 3-Nitrofluoranthene
311 6-Nitrobenzo(a)pyrene
312 2-Nitro-7-methoxynaphtho(2,l-b)furan 0.9980
This report describes the certification procedure and experimental details of the interlaboratory analyses.
Purity g/g
0.9968
0.9961
0.9970
0.9967
0.9965
0.9975
0.9980
Uncertainty g/g
+ +
+
+
+
+
+
0.0019
0.0026
0.0025 0.0028
0.0025
0.0028 0.0033
0.0023 0.0024
0.0018 0.0020
III
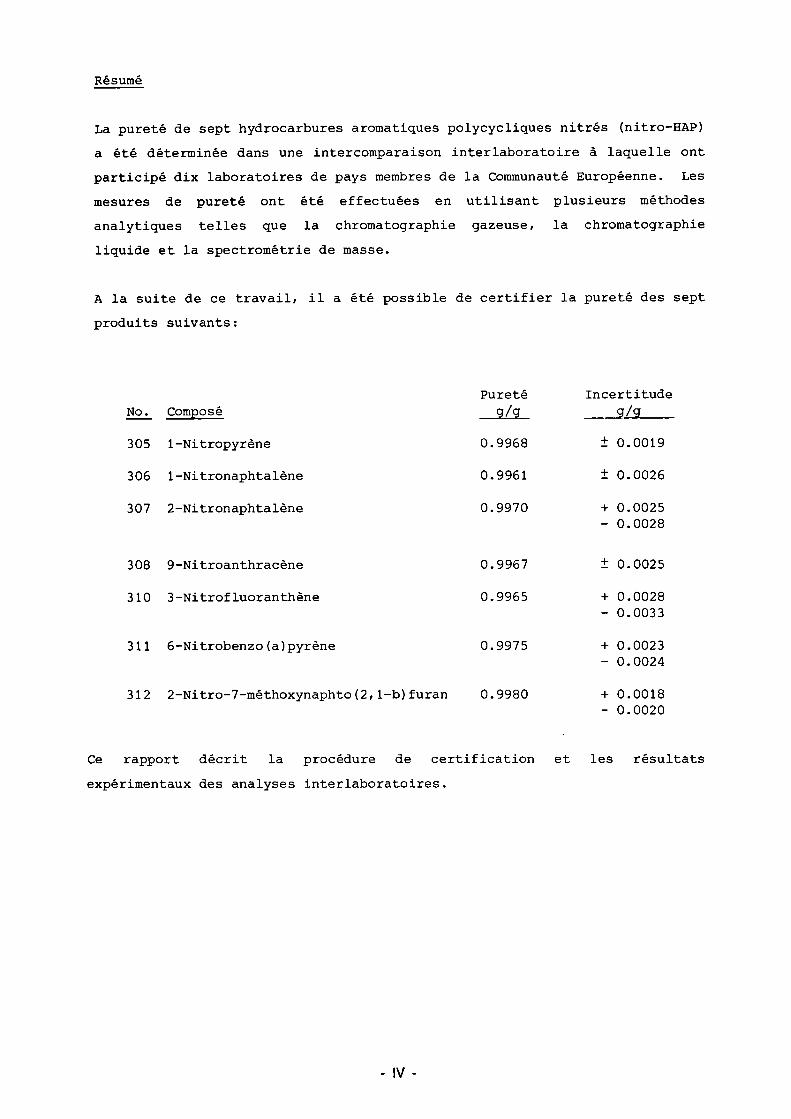
Resume
La purete de sept hydrocarbures aromatiques polycycliques nitres (nitro-HAP) a ete determinee dans une intercomparaison interlaboratoire a laquelle ont participe dix laboratoires de pays membres de la Communaute Europeenne. Les mesures de purete ont ete effectuees en utilisant plusieurs methodes analytiques telles que la chromatographie gazeuse, la chromatographie liquide et la spectrometrie de masse.
A la suite de ce travail, il a ete possible de certifier la purete des sept produits suivants:
No. Compose
305 1-Nitropyrene
306 1-Nitronaphtalene
307 2-Nitronaphtalene
308 9-Nitroanthracene
310 3-Nitrofluoranthene
311 6-Nitrobenzo(a)pyrene
312 2-Nitro-7-methoxynaphto(2,1-b)furan 0.9980
Purete g/g
0.9968
0.9961
0.9970
0.9967
0.9965
0.9975
0.9980
Incertitude
+
+
+ —
+
+ -
+ -
+ -
g/g
0.0019
0.0026
0.0025 0.0028
0.0025
0.0028 0.0033
0.0023 0.0024
0.0018 0.0020
Ce rapport decrit la procedure de certification et les resultats experimentaux des analyses interlaboratoires.
IV

CONTENTS
Page
1. Introduction 1
2. Certification Procedure 3
3. Participants 4 3.1 Synthesis 3.2 Purification, Identity and Homogeneity Control 3.3 Stability Checks 3.4 Certification Analyses 3.5 Statistical Evaluation
4. Materials 5 4.1 Preparation of Materials 4.2 Confirmation of Identity 4.3 Homogeneity Testing of Candidate Reference Materials 10 4.4 Stability of Reference Materials 12 4.4.1 Experimental Design 4.4.2 Experimental Details 4.4.3 Results 4.4.4 Other Factors Affecting Stability 13
5. Analytical Methods 14 5.1 Experimental Procedures 5.2 Comparison of Analytical Methods 15 5.2.1 Gas Liquid Chromatography (GLC) 5.2.2 High Performance Liquid Chromatography (HPLC) 16 5.2.3 Mass Spectrometry (MS) 17 5.3 Collection and Evaluation of Results 5.4 Sources of Error 18 5.4.1 GLC 5.4.2 HPLC 19 5.4.3 Mass Spectrometry 20 5.4.4 Conclusions
- V

Page 6. Certification Exercise: Results and Evaluation 20
6.1 Results and their Evaluation 6.2 Statistical Treatment of the Results for Organic Impurities 22 6.3 Inorganic Impurities 24 6.4 Estimation of Total Purity 26 6.5 Nature of Organic Impurities 27 6.6 Certified Values
7. Recommendations for Use 29 7.1 Warning 7.2 Instructions for Use 7.3 Biological Activity of Nitro-PAHs 30
8. Appendix 32 8.1 Tabulated Results Tables 3-9 Table 10 Tables 11A-C Figures 1-7
Mean Results for each RM 33-39 Summary of Analytical Results 40 Organic Impurities Detected by Mass Spectrometry 41-43 Range Bar Graphs of Accepted Results 44-50
8.2 Melting Points 51
9. References 52
VI -

Glossary
Abbreviations
BCR Community Bureau of Reference
CRM Certified Reference Material
EC European Communities
FID Flame Ionisation Detector
GC/MS Gas Chromatography/Mass Spectrometry
GC-Cap Capillary Column Gas Liquid Chromatography
GC-Pk Packed Column Gas Liquid Chromatography
GLC Gas Liquid Chromatography
HPLC High Performance Liquid Chromatography
HPLC-Ad Adsorption HPLC
HPLC-RP Reversed Phase HPLC
IARC International Agency for Research on Cancer
JRC Joint Research Centre
MS Mass Spectrometry
PAH Polycyclic Aromatic Hydrocarbon
PAC Polycyclic Aromatic Compound
RRI Relative Retention Index
RM Reference Material
THF Tetrahydrofuran
TMS Tetramethylsilane
UV Ultraviolet Spectrophotometry
WHO World Health Organisation
6ppm Chemical shift in parts per million relative to TMS
signal (0.00)
- VII

List of Symbols
X1 = mean value of purity within a laboratory
s, = standard deviation of X.
X = mean value of purity for a given method m s = standard deviation of X m m Y1 = individual set mean result for organic impurities
from one method in one laboratory
Y- = mean of p values of log Y, log r 1 s, = standard deviation of Yn log log Y' = mean of p values of either Y. or antilog Y. ,
as appropriate
CL' = 95% confidence limits for Y'
X = best estimate of purity from organic analysis based on
the mean of all set means accepted for certification
s = standard deviation of X
p = number of set mean results used to calculate X and s,
and Y'
CL = upper 95% confidence limit for X
CL = lower 95% confidence limit for X
VIII

1. Introduction
Interest in nitro-polycyclic aromatic hydrocarbons (nitro-PAHs) increased rapidly in 1978 when Pitts et al (1) demonstrated that polycyclic aromatic hydrocarbons (PAHs) react with oxides of nitrogen to form nitro-compounds. These compounds are known to be formed during petrol and diesel fuel combustion.
A particular difficulty arises in the determination of nitro-PAHs in exhaust particulates because of the tendency for additional nitration of PAHs to occur during collection on the filters (2). In addition nitro-PAHs have been detected in carbon black, photocopier toners, coal derived synthetic fluids, and in cigarette smoke (3 and 4).
The quantification of nitro-PAHs has been hampered by the small amount of individual compound present (pg to ng per mg of extract) and by the extreme complexity of the extracts which contain hundreds of potentially interfering aromatic species including PAHs, nitrogen- and sulphur-containing heterocyclic compounds, as well as oxygenated PAHs (5 and 6). The subject has been thoroughly discussed recently by White (7). Because there is such a large number of PAH derivatives, pure reference materials are needed to ensure reliable identification and quantification of the compounds measured by the analytical techniques used.
It is now appreciated that the carcinogenicity of urban air can only partially be attributed to benzopyrene and other carcinogenic PAHs. Some of the nitro compounds, such as 1-nitropyrene, have been shown to be potent, direct acting mutagens in the Ames' test on bacteria, and in mutagenic assay on mammalian cells (4, 10 and 11). They also stimulate DNA repair in cultivated human cells and are carcinogenic to animals (8 and 14). However
- 1

there is no information concerning their direct hazard to man. Numerous other nitro-PAHs, whose presence has been noted in diesel exhaust gases, have not been tested for mutagenicity or carcinogenicity because of the unavailability of pure reference materials. In view of the high interest in testing the mutagenicity of this class of compounds, it was decided to include an additional nitro compound which was known to possess a particularly strong direct-acting mutagenic activity (15). Although not identified as an environmental pollutant, the 2-nitro-7-methoxynaphthofuran was selected as being suitable for this purpose.
This report describes the preparation and certification of batches of six nitro-PAHs and one 2-nitronaphthofuran which possessed purities between 0.996 and 0.998 g/g. The choice of this series of compounds was based on the following considerations: - Needs of environmental pollution monitoring. - Nonavailability of nitro-PAHs at the desired purity from commercial suppliers.
- Possible mutagenic and carcinogenic hazards.
In the experimental work associated with the production of the present series of nitro-PAC reference materials the following quality criteria were adopted: - the materials should possess a purity of at least 0.990 g/g - the purity analysis should be carried out by at least three different analytical methods in each participating laboratory
- impurities detected at mass fractions of 0.001 g/g or higher should be identified, if possible, and determined quantitatively.
- 2

The general aim and method was to certify the purity of the reference material with a total uncertainty of less than 0.01 g/g, by subtracting impurities from unity. The certified nitro-PAC reference materials are intended mainly for the qualitative and quantitative calibration of analytical apparatus and methods (determination of retention times, response factors and reference spectra in chromatographic and spectroscopic analyses) and for the study of biological activity.
2. Certification Procedure
The certification procedure adopted for the nitro-PACs was similar to that utilised for the PAC series (12) which involved dividing the reference materials and the participating laboratories into two groups. Each group consisted of 5 or 6 laboratories of which two were common to both, each laboratory in each group analysing at least four of the materials. All laboratories reported triplicate results obtained by three or more different methods. This procedure permitted the number of results available for technical and statistical evaluation to be of adequate size and comparable with similar PAC certification rounds. The analytical procedures applied are discussed in section 5.
3 -
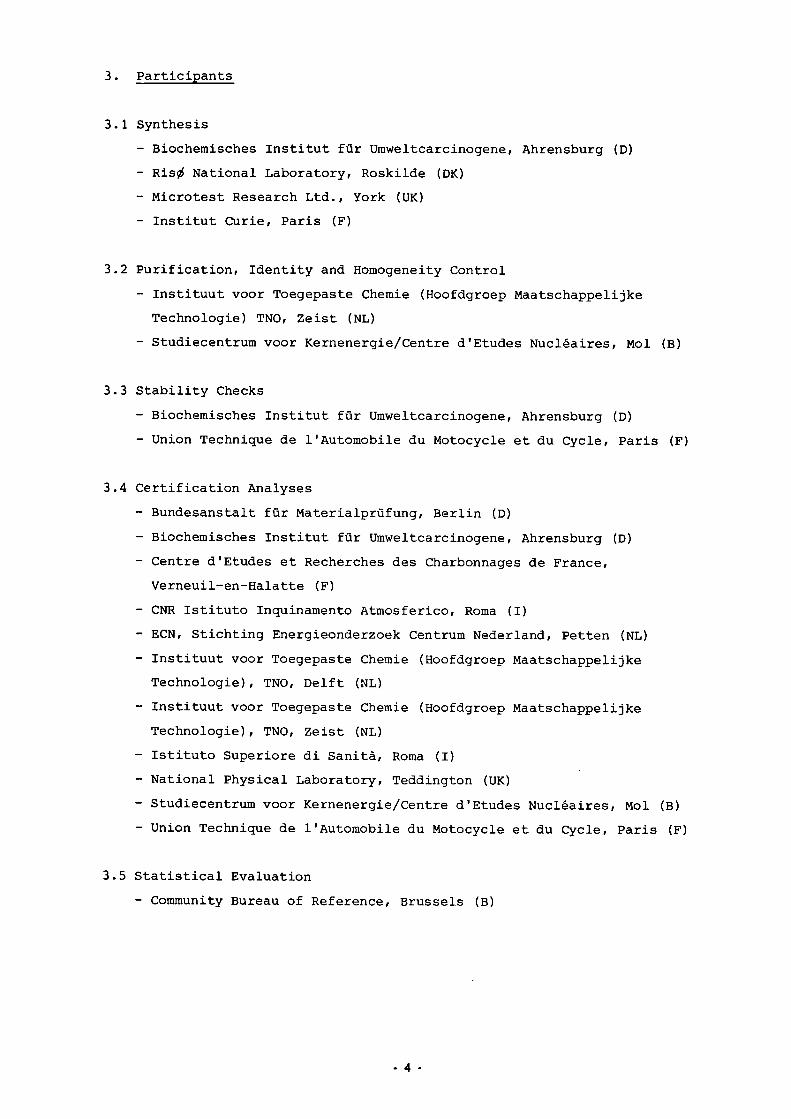
3. Participants
3.1 Synthesis - Biochemisches Institut fur Umweltcarcinogene, Ahrensburg (D) - Ris^ National Laboratory, Roskilde (DK) - Microtest Research Ltd., York (UK) - Institut Curie, Paris (F)
3.2 Purification, Identity and Homogeneity Control - Instituut voor Toegepaste Chemie (Hoofdgroep Maatschappelijke Technologie) TNO, Zeist (NL)
- Studiecentrum voor Kernenergie/Centre d1Etudes Nucleaires, Mol (B)
3.3 Stability Checks - Biochemisches Institut fur Umweltcarcinogene, Ahrensburg (D) - Union Technique de 1'Automobile du Motocycle et du Cycle, Paris (F)
3.4 Certification Analyses - Bundesanstalt fur Materialprufung, Berlin (D) - Biochemisches Institut fur Umweltcarcinogene, Ahrensburg (D) - Centre d'Etudes et Recherches des Charbonnages de France, Verneuil-en-Halatte (F)
- CNR Istituto Inquinamento Atmosferico, Roma (I) - ECN, Stichting Energieonderzoek Centrum Nederland, Petten (NL) - Instituut voor Toegepaste Chemie (Hoofdgroep Maatschappelijke Technologie), TNO, Delft (NL)
- Instituut voor Toegepaste Chemie (Hoofdgroep Maatschappelijke Technologie), TNO, Zeist (NL)
- Istituto Superiore di Sanita, Roma (I) - National Physical Laboratory, Teddington (UK) - Studiecentrum voor Kernenergie/Centre d'Etudes Nucleaires, Mol (B) - Union Technique de 1'Automobile du Motocycle et du Cycle, Paris (F)
3.5 Statistical Evaluation - Community Bureau of Reference, Brussels (B)

4. Materials
4.1 Preparation of Materials
The seven nitrogen-containing reference compounds were prepared under contract to BCR to provide batches of purified material varying between 2 g and 5 g. The compounds were synthesised by following published procedures. In most cases this involved direct nitration of the parent hydrocarbon. In the synthesis of 2-nitronaphthalene, the naphthalene-2-diazonium cobaltinitrite complex was utilised as intermediate. 2-Nitro-7-methoxy-naphtho(2,l-b)furan was synthesized by a condensation reaction. Purification of the compounds was achieved by recrystallisation from solution and in some cases by sublimation and column chromatography.
4.2 Confirmation of Identity
The products obtained by direct nitration of polycyclic aromatic hydrocarbons have been widely studied, and the structures of the mono nitro-derivatives in the cases of naphthalene, anthracene, pyrene, fluoranthene and benzo(a)pyrene have been well established in the literature. 2-Nitro-naphthalene was synthesized by an unambiguous route from 2-aminonaphthalene, via the diazonium cobaltinitrite complex. In the case of 2-nitro-7-methoxynaphtho(2,l-b)furan, prepared by a condensation reaction, the structure has been well founded in earlier work. Consequently there is little reason to doubt the identity of the isolated compounds.
Additional confirmatory evidence of the structures of the compounds has been provided by the infrared spectrum, nuclear magnetic resonance spectrum and mass spectrum recorded for each compound. The melting points and chromatographic relative retention indices were also measured. All the data obtained were consistent with the data previously reported for each compound.
- 5 -

13 The C NMR chemical shifts of the compounds in CDClq (dioxane-d8 for RM 311) were measured using the solvent signal as reference (CDCl, 77.0 ppm; dioxane-d8 67.8 ppm).
RM No.
305
306
307
308
310
311
312
121.44 126.87 131.21
123.00 129.33
119.14 129.87
121.15 130.54
117.94 127.11 137.29
122.18 124.94 129.49
55.51 122.56 158.19
13c 122.42 126.95 134.77
123.86 134.26
124.48 131.84
122.46 144.07
121.19 128.26 140.62
122.43 125.98 129.88
106.31 124.66
NMR Chemical
123.32 127.46 142.49
124.02 134.53
127.82 135.72
125.98
121.78 129.53 143.78
123.58 128.33 130.62
108.66 130.88
Shifts
123.87 129.82
125.03 146.52
127.89 145.42
128.24
122.59 131.45 144.15
123.79 128.36 131.06
112.57 132.22
(ppm)
124.48 130.51
127.24
129.41
128.70
122.96 133.07
123.85 128.47 132.11
119.91 150.88
126.59 130.61
128.51
129.63
130.22
124.57 137.07
123.89 128.93
122.36 152.58
These data provide further confirmation of the accepted structures. All signals are present in the expected chemical shift area and with the
13 expected intensity. The C NMR spectra of the compounds are discussed in (16). The synthetic routes employed to synthesise the compounds are summarised diagrammatically on the following pages.
- 6 -

RM No.305 1-NITROPYRENE (17)
HNO 3 -> dioxan/70 C
RM No.306 1-NITR0NAPHTHALENE (18, 19)
HN03/H2S04
95 °C - >
RM No.307 2-NITRONAPHTHALENE (20)
1. HNO,
2. Na Co(N02)6
N=N
aq. NaN02
CuSO /Cu20 X = 1/3 I Co(N02)J 3-

RM No.308 9-NITROANTHRACENE (16)
70% HNO 3
■ >
dioxan
RM No.310 3-NITR0FLU0RANTHENE (19, 21)
HNO 3
glac. acetic acid * o
- 8 -

RM No.311 6-NITR0BENZ0(a)PYRENE (23)
65% HNO 3 4 benzene/acetic acid
RM No.312 2-NITRO-7-METHOXYNAPHTHO(2,l-b)FURAN (24)
CHO + BrCH2N02
(reflux)

4.3 Homogeneity Testing of Candidate Reference Materials
Before distribution of the seven candidate reference materials to the laboratories participating in the certification exercise, the homogeneity of the bulk batches was confirmed by examining at least six samples, taken randomly from the bulk, by HPLC. All the materials, including those purified by chromatography or sublimation, were subjected to prior homogenisation by solution and single batch recrystallisation to promote uniform distribution of possible impurities.
The materials were dispensed as 10 mg units in glass vials, and the between-bottle homogeneity of each series was then investigated in two laboratories by means of capillary gas chromatography and by adsorption HPLC (measurement wavelength 254 nm), which methods had been shown, in preliminary studies, to give reliable results.
The between-bottle homogeneity was evaluated using nine vials, taken at uniform intervals from each series. Typically 0.1 mg test portions were dissolved in a suitable solvent and sub-samples from each of the vials were analysed by the methods indicated above. The purity of each test portion was obtained by quantifying the impurities. In each case the standard deviation of the results obtained for nine different vials was not significantly different from that of analyses of sub-samples taken from a single vial. The results are given in Table A (page 11). There is no detectable inhomogeneity and no significant difference between the between-bottle results and the within-bottle results.
It is concluded that all the series of materials are homogeneous.
10 -

TABLE A Summary of Within-Bottle and Between-Bottle Homogeneity Tests
RM No.
305
306
307
308
310
311
312
Mean Results for Between-Bottle Homogeneity
Purity Mass
Fraction g/g
0.9986g
0.9978Q
0.99709
0.9992Q
0.9954g
0.9994Q
0.9999?
s
o.oooo6
o.oooi4
o.oooo5
0.0002Q
o.oooi0
o.oooi0
0
No. Detmns.
n
9
9
9
9
9
9
9
Mean Results for Within-Bottle Subsamples
Purity Mass
Fraction g/g
0.99862
0.99786
0.99709
0.9991Q
0.9955Q
0.9993Q
0.9999?
s
o.oooo4
o.oooi3
o.oooo7
0.0002Q
0.0001,-6
0.0002Q
0
No. Detains.
n
10
12
5
4
9
4
9
Method
GC-Cap/FID
GC-Cap/FID
GC-Cap/FID
HPLC-Ad
GC-Cap/FID
HPLC-Ad
GC-Cap/FID
11 -

4.4 Stability of Reference Materials
4.4.1 Experimental Design
Experiments were designed to investigate possible degradation due to the temperature. Samples of the compounds were stored at -80 °C, 4 °C, 20 °C and 40 °C for a time period of 6 months.
Samples of each compound were stored in brown glass vials wrapped in aluminium foil to minimise exposure to light. The samples stored at +4 °C and +40 °C were analysed at the beginning, and after 1, 3 and 6 months. In addition, the samples stored at -80 °C were analysed after 6 months. Analyses of the samples stored at +20 °C were only to be carried out if decomposition was detected at +40 °C.
4.4.2 Experimental Details
After storage, the samples were dissolved in toluene or dichloromethane and analysed immediately in order to minimise possible decomposition in solution. On-column injection about 110 °C was employed using either an all-glass solid injection system or a direct on-column device. Flame ionisation detection was used after separation on silicone coated quartz capillary columns.
4.4.3 Results
In the case of 9-nitroanthracene and 3-nitrofluoranthene, there was a small change (0.2% of measured purity) at +40 °C after one month. However this may be attributed to methodological variations since there was no further change even after 6 months at +40 °C.
All seven compounds were found to be stable at +4 °C and (except as mentioned above) at +40 °C after a storage of 6 months.
12

4.4.4 Other Factors Affecting Stability
Impurities in nitro-PAHs have occasionally been reported when using capillary GC. It seems probable, however, that in some cases these result from decomposition during injection at high temperatures (above 200 °C).
It was established in this stability study that the decomposition of nitro-PAHs depends on the area of the hot surface in the injection port; the decomposition was higher when glass wool and glass beads were used in the injection insert.
Decomposition of nitro-PAHs on heating has been described by Sweetman et al (9), nitro-PAHs being partly converted into amino-PAHs. This reduction takes place on the column and both compounds are eluted at the same time.
Impurities may also arise as a consequence of photodecomposition in solution. Earlier investigations had demonstrated that cyclohexane solutions of 9-nitroanthracene decompose rapidly when irradiated with UV light. To demonstrate this, a tetrahydrofuran/hexane solution of 9-nitroanthracene was placed in front of a 700 watt daylight lamp for ten minutes. The most abundant decomposition products were identified by GC/MS as anthraquinone and fluorenone.
In addition, the laboratories participating in the certification exercise were requested to repeat the analyses of their own solutions of reference materials after 24 and 48 hours storage in the dark at +4 °C (refrigerator). No significant change was observed.
It can be concluded that although some nitro-PAHs are sensitive to high temperature and to light irradiation, they remain stable when stored in the dark at +4 °C.
- 13 -

5. Analytical Methods
5.1 Experimental Procedures
Each laboratory was supplied with three vials, selected at random, each containing 10 mg of the material to be analysed. The laboratories were requested to analyse these samples by means of at least three different analytical methods chosen from the following: - GLC (capillary and/or packed column) - HPLC (adsorption and/or reversed phase) - MS (GC-capillary column/MS, GC-packed column/MS). At least three replicates by each method were required.
Laboratories were asked to guard against the possibility of cross-contamination of samples by using a new syringe for each nitro-PAH and to obviate errors due to "memory effects" of the chromatographic column by running solvent blanks between samples. In the case of HPLC the UV wavelength used for determining the absorbance of the solution was standardised at 254 nm since the majority of impurities were expected to absorb in this region (see section 5.2.2.). In addition one laboratory performed the HPLC determination for each compound at the maximum absorbance of the sample. Laboratories were also asked to run each compound at least once on each analytical system for an extended period of time, to ensure that errors did not arise through non-detection of late-eluting peaks.
It should be emphasised that the strategy of purity measurement used for the certification was an indirect one. The methods indicated above determine the mass fractions of the observed impurities and the purity of the material is then established by the subtraction from unity of the total mass fraction of all detected impurities. The implications of this strategy on the accuracy of the determination is discussed further in section 5.4.
- 14 -
5.2 Comparison of Analytical Methods
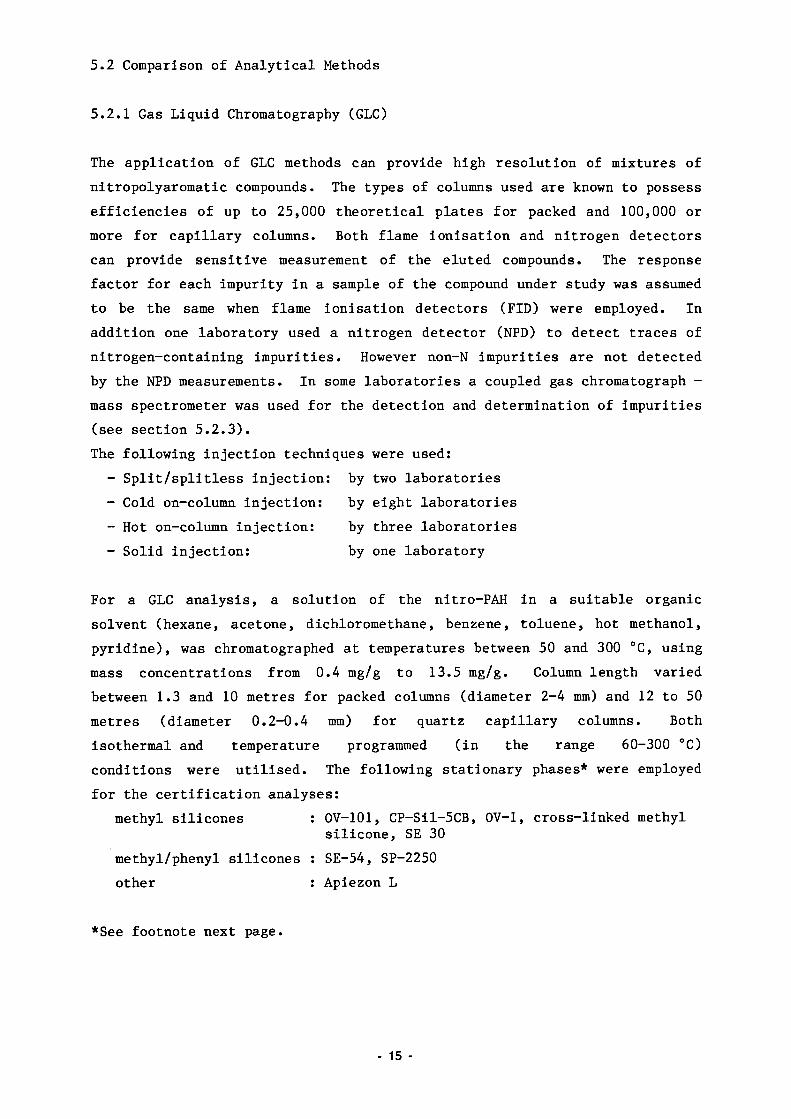
5.2.1 Gas Liquid Chromatography (GLC)
The application of GLC methods can provide high resolution of mixtures of nitropolyaromatic compounds. The types of columns used are known to possess efficiencies of up to 25,000 theoretical plates for packed and 100,000 or more for capillary columns. Both flame ionisation and nitrogen detectors can provide sensitive measurement of the eluted compounds. The response factor for each impurity in a sample of the compound under study was assumed to be the same when flame ionisation detectors (FID) were employed. In addition one laboratory used a nitrogen detector (NPD) to detect traces of nitrogen-containing impurities. However non-N impurities are not detected by the NPD measurements. In some laboratories a coupled gas chromatograph -mass spectrometer was used for the detection and determination of impurities (see section 5.2.3). The following injection techniques were used: - Split/splitless injection: by two laboratories - Cold on-column injection: by eight laboratories - Hot on-column injection: by three laboratories - Solid injection: by one laboratory
For a GLC analysis, a solution of the nitro-PAH in a suitable organic solvent (hexane, acetone, dichloromethane, benzene, toluene, hot methanol, pyridine), was chromatographed at temperatures between 50 and 300 °C, using mass concentrations from 0.4 mg/g to 13.5 mg/g. Column length varied between 1.3 and 10 metres for packed columns (diameter 2-4 mm) and 12 to 50 metres (diameter 0.2-0.4 mm) for quartz capillary columns. Both isothermal and temperature programmed (in the range 60-300 °C) conditions were utilised. The following stationary phases* were employed for the certification analyses:
methyl silicones : OV-101, CP-SH-5CB, OV-1, cross-linked methyl silicone, SE 30
methyl/phenyl silicones : SE-54, SP-2250 other : Apiezon L
*See footnote next page.
- 15 -

5.2.2 High Performance Liquid Chromatography (HPLC)
The HPLC methods, carried out at room temperature using both adsorption phase and reversed phase column packings, also permit the determination of nitro-PAHs with high relative molar masses and can avoid the possibility of their decomposition at elevated temperatures. Another advantage is the ease of separation and isolation of impurities for further analysis. In the absence of pure samples of each impurity it was assumed that the response factors of the impurities at the given wavelength were the same, and that all the impurities absorbed in the region of 254 nm which was the wavelength chosen for measurement of the absorbance.
The column length used for the HPLC analysis was 25 cm with internal diameters in the range of 1-5 mm. The mass concentrations of the nitro-PAH compounds used were 10 ug to 5 mg per gram and the injected sample volume was between 10 pi and 75 pi. The UV wavelength used for individual measurements of the absorbance was 254 nm, except in one laboratory where the maximum absorbance of the main compound was utilised. Another laboratory also reported results obtained by HPLC coupled with chemiluminescence detection. This technique involves an on-line reduction after the HPLC separation, the nitro-compounds being reduced to the corresponding amino-compounds, which are then detected by peroxyoxalate chemiluminescence.
The following packings were used*:
(Adsorption) Lichrosorb Si-60 (5 pm), Chromspher Si (5 pm) + Alox T (5 (jm), CP Spher Si (8 |jm) with (variously) hexane containing dichloromethane, hexane containing tetrahydrofuran, heptane containing dichloromethane.
(Reversed Lichrosorb RP 18 (5 um), Microspher C18 (3 pm), Supelcosil Phase) LC-PAH (5 pm), Zorbax ODS (5 pm), Chromspher C18 (5 pm),
Spherirsorb ODS (5 pm). Various solvent systems were used including methanol, methanol-water, acetonitrile, acetonitrile-water.
*A11 stationary phases and column packings are available through the usual laboratory suppliers, and the order in which they are listed implies no recommendation as to their suitability or performance.
16 -
5.2.3 Mass Spectrometry
The coupling of a suitable GC capillary column to a mass spectrometer permitted ready quantification of the eluted components of a nitro-PAH mixture based on the total ion current chromatogram. In addition valuable information on the m/z values of the molecular and fragment ions could be recorded and provided evidence of the chemical composition of the impurities present.
An electron ionisation potential of 70 eV was used for recording the mass spectra and the capillary columns utilised and GC conditions applied were similar to those indicated above (section 5.2.1).
In some cases qualitative identification of impurities present was made by high resolution mass spectrometry using the direct inlet method.
5.3 Collection and Evaluation of Results
All the results for the certification analyses were collected from the participating laboratories by the Community Bureau of Reference, Brussels and were collated for statistical analysis.
The statistical evaluation of the results of the certification analyses was carried out according to procedures similar to those used for the PAC compounds described in a recent report (12) and is discussed in section 6.2.
17 -

5.4 Sources of Error
Although a systematic examination of the analytical errors which can occur in the purity analysis of nitro-PAH materials is not feasible because of the differences in equipment (instruments, chromatogaphic columns) and experimental conditions used by the participating laboratories, it is of interest to highlight some potential errors.
A fundamental source of error arises from the method of purity estimation by the subtraction of mass fractions of impurities from unity. Impurities that remain undetected because they are not separated from the main component or are not detected in its presence, or are retained on the column, will lead directly to an over-estimation of the purity. The certification exercise is therefore designed to minimise the risk of non-detection of impurities by the use of a wide range of separation systems and detection devices.
A second general source of error in the evaluation of analytical results obtained by chromatographic techniques is linked with the various methods of peak area quantification and to the difficulty of assigning correct response factors to minute impurity components.
5.4.1 GLC
The principal sources of error in this technique are - retention of impurities on the column, - insufficient resolution between impurities and main component, - partial decomposition of the main component during analysis or during sample preparation.
Whereas errors arising through the first two causes would lead to an over-estimation of the purity, the third cause would result in purity values which were too low.
- 18

In view of the variety of capillary and packed columns with different column packings, different solvents and injection techniques, which were used by the participating laboratories, it is considered unlikely that organic impurities with sufficient volatility could systematically escape detection and quantification.
5.4.2 HPLC
As in the case of GLC, analytical errors in HPLC may be caused by retention of impurities on the columns, by their insufficient separation from the main component peak or by artefacts generated by chemical reaction of the injected compounds with the solvents during elution. Another major source of error is the method of quantification. In contrast to GLC, a generally applicable universal mass detector is not available in HPLC and the most widely used detector (UV) requires determination of the response factors of the individual compounds.
To a first approximation, identical response factors for the main component and the impurities can often be assumed. For accurate quantitative determination of impurities the UV spectra of individual impurities should be available, or alternatively samples of the impurities themselves. The UV spectra of the pure nitro-PAH compounds were recorded prior- to the certification measurements to establish that all the compounds possessed sufficient absorption at 254 nm, which could be utilised for measuring the absorbance of the eluate.
Insufficient separation or retention of organic trace impurities will result in purity values which are too optimistic. The use of adsorption and reversed phase HPLC, however, makes failure to detect organic impurities in a systematic fashion unlikely.
- 19

5.4.3 Mass Spectrometry
When a mass spectrometer coupled with a gas-liquid chromatograph is used, sources of error similar to those discussed in section 5.4.1 may be expected. In addition errors may arise through thermal decomposition (less likely with glass or glass-lined interfaces) or over-fragmentation of the main component, especially if electron impact ionisation is being used. Similar over-fragmentation might occur in the same proportions with impurities of similar structure to the main component. Both effects would result in an underestimation of the purity of the reference material.
Mass spectrometer memory effects can result in erroneous measurements and can generally be minimized by runs of blank solvent between sample runs.
5.4.4 Conclusions
As several methods were used, and as their respective systematic uncertainties are of different origins, the likelihood of a common systematic error is small and provides confidence that there is no sizeable systematic error in the final result.
6. Certification Exercise: Results and Evaluation
6.1 Results and Their Evaluation
A summary of all the results received is presented in tabular form for each of the seven reference materials, showing in each box the mean value of the individual measurements supplied by each laboratory for each analytical method, hereafter referred to as the set mean (see Tables 3-9). In addition, with the exclusion of those results underlined in Tables 3-9 (see below), the means of all submitted individual set means, grouped both by method ( X ) or by laboratory (X,) are given together with the corresponding standard deviation (s and s-, respectively).
- 20 -
Three results (identified by a * and underlined in Tables 3-9) were rejected during the evaluation of results according to the following criterion: - A substantial divergence from the means of results by similar methods applied in other laboratories. These results were judged to be incorrect values, and this conclusion was also supported by the preliminary statistical evaluation showing these results to be outliers.
There were two outlying values detected in the sets of results obtained by reversed phase HPLC, for RM 306 (Lab. 5) and for RM 310 (Lab. 3), and one outlying value in the results obtained by packed column chromatography for RM 311, for which an impurity of high relative molar mass (possibly due to decomposition in the injection port (290 °C)) was found (Lab. 2).
Results obtained by the GC-capillary column method involving a nitrogen detector, and by HPLC using chemiluminescence detection (identified by § and underlined in Tables 3-9), were also excluded from the final statistical evaluation since these methods will only detect the presence of nitrogen-containing compounds. They are, however, indicative of the levels of such compounds.
Results marked with a + represent those results where no impurities were detected by the method and the value given is the laboratory's lower estimate of purity based on the detection limits for impurities of their methods and equipment. The limit of detection for a given impurity may vary from one laboratory to another, typically from 0.01 mg/g to 0.1 mg/g. It is dependent mainly on the concentration and volume of the solution injected, the mass of an individual impurity reaching the detector and the signal-to-noise ratio of the analysing system.
Since the participating laboratories, when applying the same analytical technique, were encouraged to use different columns, solvents and temperature programming to reduce the risk of systematic errors, the sensitivity of the analytical technique may differ and consequently the number of significant figures of the reported results is not the same for every laboratory.
21 -
6.2 Statistical Treatment of the Results for Organic Impurities.
The statistical evaluation of the accepted results of the purity measurements of the current series of nitro-PAH reference materials has essentially followed the procedure adopted in the PAC (sixth) series (12). The results were expressed as follows: a. The certified organic impurity is derived from the mean of the individual set means, each set mean representing a given method in a given laboratory. b. The uncertainty is expressed in terms of the 95% confidence limits of the mean organic purity. c. In addition to the overall purity, the organic and inorganic impurities are stated separately (see sections 6.3 and 6.4, Table B and Table 1).
In the initial phase of the statistical evaluation, the distribution of the accepted set means of impurities was tested for normality for each of the materials. Inspection of the data suggested that, especially for those compounds of very high purity, the skewed distribution would be more consistent with a logarithmic-normal distribution (i.e. one in which the logarithms of the mass fractions of the impurities are distributed normally).
For this purpose the set means, expressed as mass fractions of the impurities, and, in a separate calculation, their logarithms, were tested for conformity to a normal distribution using the Kolmogorov-Lilliefors test. The results for four of the compounds (RM Nos. 307, 310, 311 and 312) were found to conform more satisfactorily to a log-normal distribution.
Where a normal distribution of the mass fractions of impurities was indicated, the confidence limits of the overall mean of purity were calculated by using the relationship:
X ± t.s /p"
- 22
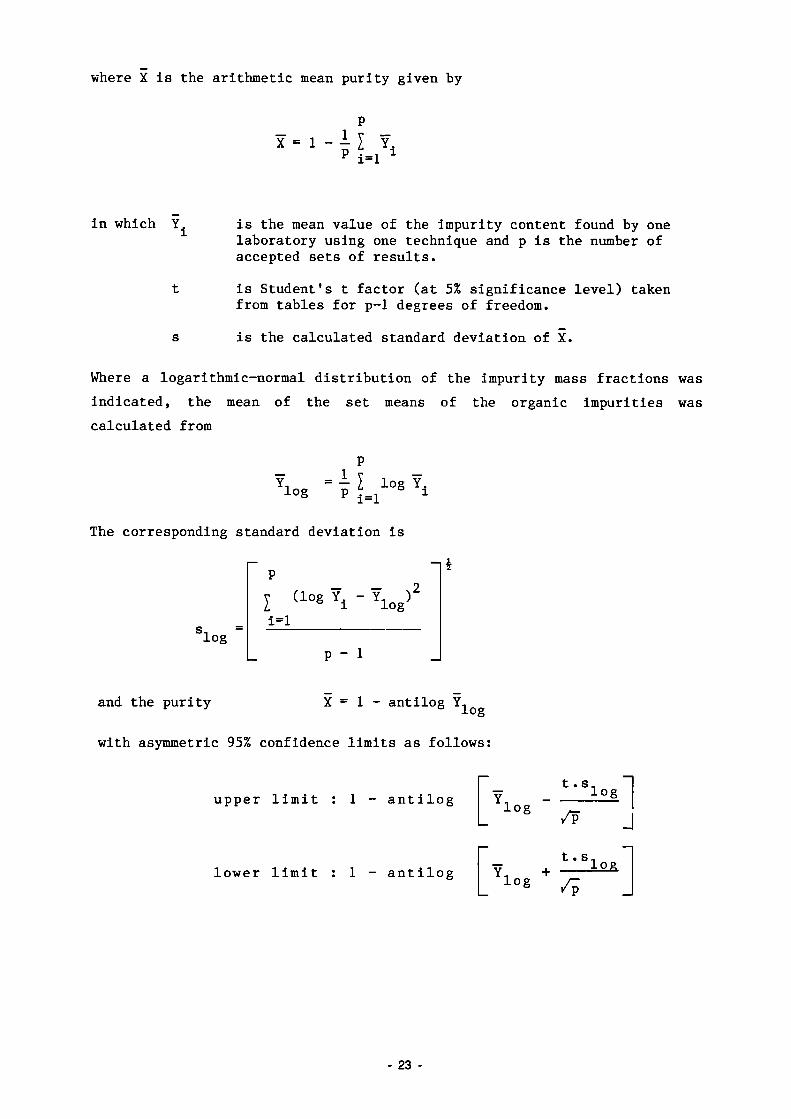
where X is the arithmetic mean purity given by
X = 1 - M Y M-l
1
in which Y. 1
is the mean value of the impurity content found by one laboratory using one technique and p is the number of accepted sets of results.
is Student's t factor (at 5% significance level) taken from tables for p-1 degrees of freedom.
is the calculated standard deviation of X.
Where a logarithmic-normal distribution of the impurity mass fractions was indicated, the mean of the set means of the organic impurities was calculated from
■ 7 L 1 0 8 Ti
The corresponding standard deviation is
log P .=1
log
ni I (1
°S Yi " Y l o /
3=1
P " 1
and the purity X = 1 - ant i log Y. log
with asymmetric 95% confidence l imi t s as follows:
upper l i m i t : 1 - a n t i l o g
lower l i m i t : 1 - a n t i l o g
l o g t . s
/ P
t . s
l o g
l o g • 1
T
1Qg /I
- 23 -
Table 1 (p.28) gives a summary of these final values together with results of the analyses for inorganic impurities. The accepted results shown in Tables 3 - 9 are also depicted graphically in the form of bar graphs in Figures 1 - 7 (Appendix)
6.3 Inorganic Impurities.
The determination of inorganic impurities in the nitro-PAH compounds, due to the fact that the quantities of materials were too low to allow replicate determination of inorganic impurities in several laboratories, has been made in one specialised laboratory on two replicates of 50 mg of each compound, and has been limited to those impurities most likely to be found present when samples are subjected to ashing at moderate temperatures. For RM 305 the amount of ash was below the detection limit of 0.0002 g/g, but for the other six compounds it varied from 0.0005 to 0.0009 g/g. Examination of the volatile impurities was confined to silica, CI, S and P, which in the majority of cases were found to be below the detection limits. The results
of the determinations are given in Table B (p.25).
The methods used were as follows:
Ash + SiO- : 50 mg sample was burnt in a Pt crucible, heated to 750 °C for 1 hour. The ash was then treated with HF to determine SiO~.
3-PO, : Oxygen bomb combustion, then light spectrometric determination.
2-Cl , SO, : Oxygen bomb combustion, then ion chromatography.
The results of the determination of inorganic impurities are summarised in Table 10. In each case, the inorganic impurity is assumed to have an associated uncertainty of numerically equivalent value.
- 24

TABLE B Results of Inorganic Determinations *
RM No. Ash Si02 CI
305 <0.02 <0.02 <0.05 <0.02 <0.05 <0.02 <0.02 <0.05 <0.02 <0.05
306 0.07 <0.02 0.07 <0.02 <0.05 0.08 <0.02 0.06 <0.02 <0.05
307 0.07 <0.02 <0.05 0.04 0.05 0.07 <0.02 <0.05 0.07 0.05
308 0.07 <0.02 <0.05 <0.02 <0.05 0.07 <0.02 <0.05 <0.02 <0.05
310 0.08 <0.02 <0.05 <0.02 <0.05 0.09 <0.02 <0.05 <0.02 0.10
311 0.06 <0.02 <0.05 <0.02 <0.05 0.05 <0.02 <0.05 <0.02 0.10
312 0.05 0.02 <0.05 <0.02 0.05 0.05 0.02 <0.05 <0.02 <0.05
* Results given as mg per gram. Determinations made on 50 mg samples.
Note: Determination of trace amounts of inorganic nitrogen in the presence of organic nitrogen was not practical. If present, in line with other series, the amount is likely to be close to the normal detection limit.
25 -

6.4 Estimation of Total Purity
Estimation of total purity can in principle be made after combining the means and uncertainties of the individual estimates for the organic and inorganic impurities.
However, whereas the values for the organic impurities are derived from actual determinations, those for the inorganic impurities are obtained from a method employed close to its detection limit or are based on the estimated detection limit of the method.
The total purity is estimated by subtracting the sum of the (measured) mass fractions of the organic and the (estimated) inorganic impurities from unity. The uncertainty associated with this total purity is estimated by the linear addition of uncertainties of the corresponding organic and inorganic components. It follows that the result is not a formal statistical 95% confidence interval.
Example: RM 307
Organic impurity = 0.0008 - 0.0003 g/g + 0.0006
and Inorganic impurity = 0.0022 + 0.0022 g/g lead to Total impurity = 0.0030 - 0.0025 g/g
+ 0.0028 from which is derived Total purity = 0.9970 + 0.0025 g/g (1 - total impurity)
- 0.0028
As with the PAC series (sixth series) in order to give the analyst a more immediate indication of organic purity, the organic and inorganic impurities are quoted separately on the certificate together with the estimate of total purity as described above.
26
6.5 Nature of Organic Impurities
Many of the organic impurities quantified during the certification exercise were also analysed by mass spectrometry, and were mainly impurities already present in the precursors used for the synthesis. However in some cases, such as 9-nitroanthracene, artefacts can occur due to thermal or photochemical reactions of the main compound. Although complete identification of the impurities was not possible in the majority of cases, tentative identification was made on the basis of the m/z values of the ion peaks, and where possible by spectra matching.
The impurities observed by means of coupled gas chromatography - mass spectrometry together with the m/z values are given in Tables 11A - 11C. Since different chromatographic columns were used by the participating laboratories, the relative retention indices for isomeric impurities may differ, and consequently population mean values and standard deviation values for the individual isomeric impurities cannot reliably be established. For this reason the measurements made by each participating laboratory are shown in the Tables.
6.6 Certified Values
The values of the certified purities of the seven reference materials are given in Table 1 (see p.27).
The certified organic impurities are based on results from 4-5 different methods.
- 27 -

TABLE 1 Certified Purity Values
RM No
305
306
307
308
310
311
312
Compound
1-Nitropyrene
1-Nitronaphthalene
2-Nitronaphthalene
9-Nitroanthracene
3-Nitrofluoranthene
6-Nitrobenzo(a)-pyrene
2-Nitro-7-methoxy-naphtho(2,1-b)furan
Organic Impurities g/g
0.0018 -0.0005
0.0018 -0.0005
0.0008 -0.0003 +0.0006
0.0014 -0.0006
0.0012 -0.0005 +0.0010
0.0005 -0.0003 +0.0004
0.0003 -0.0001 +0.0003
P
18
17
20
21
17
19
18
Inorganic Impurities g/g
0.0014 -0.0014
0.0021 -0.0021
0.0022 -0.0022
0.0019 -0.0019
0.0023 -0.0023
0.0020 -0.0020
0.0017 -0.0017
Certified Purity g/g
0.9968 +0.0019
0.9961 +0.0026
0.9970 +0.0025 -0.0028
0.9967 +0.0025
0.9965 +0.0028 0.0033
0.9975 +0.0023 -0.0024
0.9980 +0.0018 -0.0020
Note: See section 6.3 for discuission of inorganic purity values.
28 -

7. Recommendations for Use
7.1 Warning
Several studies have reported on the carcinogenic/mutagenic potential of these materials, and a selected summary of the reported activities is given in section 7.3 below.
It is essential that these compounds are only handled by persons properly qualified and trained in the handling and use of potentially toxic hazardous chemicals.
It is the responsibility of laboratory management and personnel to ensure that good laboratory practice is followed in handling these compounds so that contamination of the laboratory does not occur, and the health of the laboratory staff is protected.
- Avoid skin contact when handling the compounds, by wearing protective gloves - Avoid inhalation or ingestion of nitro-PAH arising from aerosol formation or vaporisation.
The samples should be carefully opened in a restricted area and preferably in a protective hood or glove box set aside for this purpose.
Before handling these materials, users should study the recommended procedure for dealing with contaminations resulting from an accident in the laboratory.
7.2 Instructions for Use and Disposal of Waste Solutions
The certified reference materials are available as samples of 10 mg in thick-walled amber glass vials. To ensure safety during distribution these vials are supplied in aluminium containers with a screw cap.
29 -

All nitro-PAH reference materials should be stored in darkness under cool conditions to prevent any photosensitised reactions. Solutions of nitro-PAH reference materials intended for calibration purposes should be freshly prepared and should not be exposed to light before use.
Calibration solutions should be discarded after use, preferably into special waste containers to avoid contamination of ground or waste waters by nitro-PAH materials. Alternatively the recommendations of the International Agency for Research on Cancer for the destruction of PAC materials in laboratory wastes should be followed (24).
Users should ensure that the disposal of waste nitro-PAHs conforms to national regulations.
7.3 Biological Activity of Nitro-PAHs
Many nitro-PAHs are known to be biologically active compounds in microbiological mutagenicity assays. Several are potent direct mutagens in Ames' Salmonella bioassay, a short-term test designed to detect chemicals which may be potential carcinogens.
Some nitro-PAHs also exhibit carcinogenic effects in mice and rats, inducing benign and malignant liver cell tumors in various tissues (14).
Relevant information on the toxic and biological effects of nitro-PAHs is given in Table 2 (p.31).
30

TABLE 2 Summary of Biological Activities*
RM No.
305
306
307
308
310
311
312
Compound
1-Nitropyrene
1-Nitronaphthalene
2-Nitronaphthalene
9-Nitroanthracene
3-Nitrofluoranthene
6-Nitrobenzo(a)pyrene
2-Nitro-7-methoxy-naphtho(2,1-b)furan
Mutagenic Activity
++
-/+
-/+
+++
++
+++
Carcinogenic Activity
-/+
-/+
S*
+
++
Key: - inactive -/+ uncertain
+ weak ++ moderate
+++ strong
* see (14) 0 no information available
31

8. Appendix
8.1 Tabulated Results
Page
Tables 3-9: Mean Results of Organic Purity Determinations
for each RM 33-39
Table 10: Summary of Analytical Results 40
Tables 11A-C: Organic Impurities Detected by Mass Spectrometry 41-43
Figures 1-7: Range Bar Graphs of Accepted Results 44-50
8.2 Melting Points of the Reference Materials 51
- 32 -
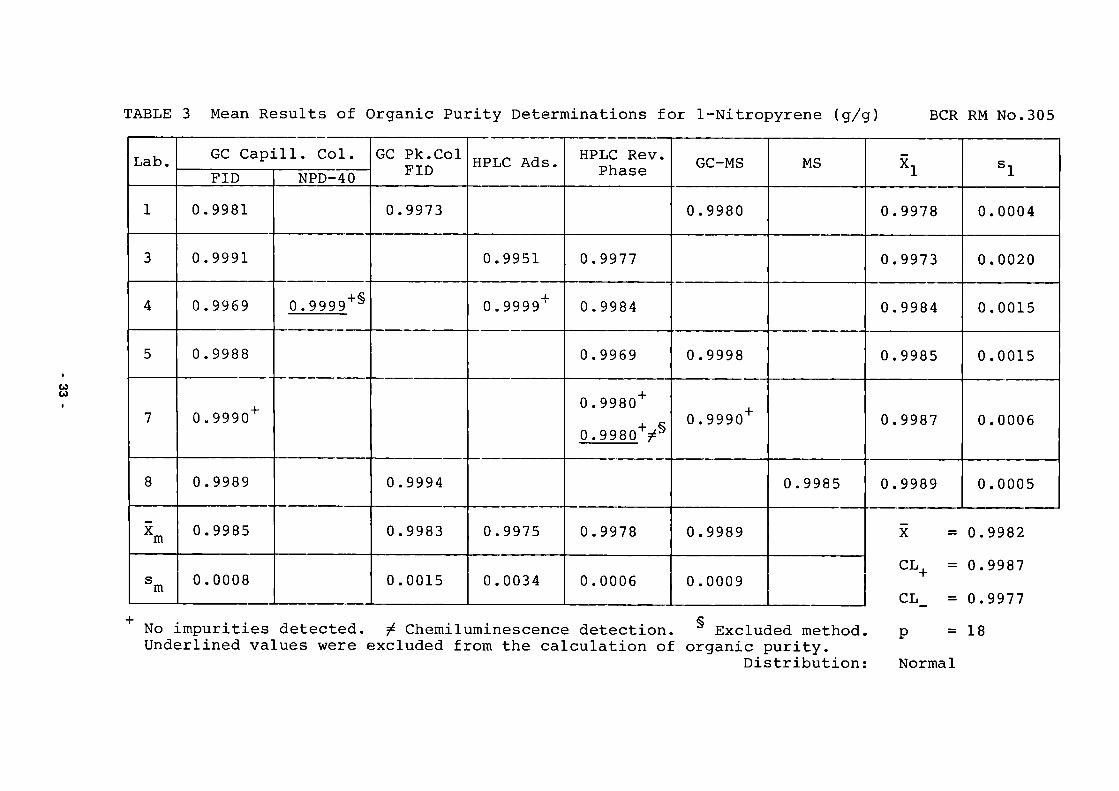
TABLE 3 Mean Results of Organic Purity Determinations for 1-Nitropyrene (g/g) BCR RM No.305
G3 CO
Lab.
1
3
4
5
7
8
X m s m
GC Capill. Col. FID
0.9981
0.9991
0.9969
0.9988
0.9990+
0.9989
0.9985
0.0008
NPD-40
0.9999+§
GC Pk.Col FID
0.9973
0.9994
0.9983
0.0015
HPLC Ads.
0.9951
0.9999+
0.9975
0.0034
HPLC Rev. Phase
0.9977
0.9984
0.9969
0.9980+
0.9980+^§
0.9978
0.0006
GC-MS
0.9980
0.9998
0.9990+
0.9989
0.0009
MS
0.9985
*1
0.9978
0.9973
0.9984
0.9985
0.9987
0.9989
sl
0.0004
0.0020
0.0015
0.0015
0.0006
0.0005
X = 0.9982 CL+ = 0.9987
CL = 0.9977 _l_ r?
No impurities detected. ^ Chemiluminescence detection. Excluded method. Underlined values were excluded from the calculation of organic purity.
p =18 Distribution: Normal

TABLE 4 Mean Results of Organic Purity Determination for 1-Nitronaphthalene (g/g) BCR RM No.306
Lab.
1
3
4
5
7
8
X m s m
GC Capill. Col. FID
0.9987
0.9976
0.9982
0.9976
0.9990+
0.9969
0.9980
0.0008
NPD-40
0.9986 §
GC Pk.Col FID
0.9980
0.9970
0.9975
0.0007
HPLC Ads.
0.9973
0.9997
0.9985
0.0017
HPLC Rev. Phase
0.9964
0.9997
0.9908*
0.9980+
0.9980+^§
0.9980
0.0017
GC-MS
0.9990
0.9985
0.9990+
0.9988
0.0003'
MS
0.9993
*1
0.9986
0.9971
0.9992
0.9980
0.9987
0.9977
X CL+ = CL
Sl
0.0005
0.0006
0.0009
0.0006
0.0006
0.0014
0.9982
0.9987 0.9977
No impurities detected. * Outlier. ^ Chemiluminescence detection. § Excluded method. Underlined values were excluded from calculation of organic purity.
Distribution;
= 17
Normal

TABLE 5 Mean Results of Organic Purity Determination for 2-Nitronaphthalene (g/g) BCR RM No.307
CO
Lab.
1
2
4
6
9
10
X m
s m
GC Capill. Col. FID
0.9963
0.9998 0.9978 a
0.9992
0.9983
0.9960
0.9996
0.9981
0.0015
NPD-40
0.9995 §
GC Pk.Col FID
0.9995
0.9996
0.9999+
0.9997
0.0002
HPLC Ads.
0.9990
0.9999+
0.9994
0.0006
HPLC Rev. Phase
0.9983
0.9979 0.9976 b
0.9994
0.9998
0.9986
0.0010
GC-MS
0.9990
0.9990+
0.9990
0.0
MS
0.9968
*1
0.9983
0.9990
0.9991
0.9984
0.9981
0.9987
Sl
0.0017
0.0009
0.0008
0.0010
0.0019
0.0017
X = 0.9992 CL+ = 0.9995 CL = 0.9986
+ a b No impurities detected. Hot injector. X = 209 nm.
§ Excluded method. Underlined values were excluded from calculation of organic purity.
Distribution;
= 20
Log-Normal

TABLE 6 Mean Results of Organic Purity Determinations for 9-Nitroanthracene (g/g) BCR RM No.308
CO O)
Lab.
1
2
4
6
9
10
X m
s m
GC Capill. Col. FID
0.9999+
0.9996 0.9994 a
0.9983
0.9981
0.9980
0.9993
0.9989
0.0008
NPD-40
0.9982 §
GC Pk.Col FID
0.9999+
0.9998
0.9999+
0.9999
<0.0001
HPLC Ads.
0.9950
0.9992
0.9999
0.9971
0.0030
HPLC Rev. Phase
0.9983
0.9989 0.9996 b
0.9960
0.9997
0.9985
0.0015
GC-MS
0.9999+
0.9990+
0.9995
0.0006
MS
0.9975
*1
0.9999
0.9984
0.9986
0.9991
0.9977
0.9988
sl
0.0
0.0023
0.0005
0.0008
0.0015
0.0012
X = 0.9986 CL+ = 0.9992 CL = 0.9980
No impurities detected. Hot injector. X = 240 nm. § Excluded method. Underlined values were excluded from calculation of organic purity.
Distribution:
= 21
Normal

TABLE 7 Mean Results of Organic Purity Determinations for 3-Nitrofluoranthene (g/g) BCR RM No.310
to
Lab.
1
3
4
5
7
8
X m s m
GC Capill. Col. FID
0.9990
0.9977
0.9961
0.9955
0.9990+
0.9975
0.9975
0.0014
NPD-40
0.9954 §
GC Pk.Col FID
0.9991
0.9999+
0.9995
0.0006
HPLC Ads.
0.9995+
0.9995
0.9995
0.0
HPLC Rev. Phase
0.9897*
0.9955
0.9956
0.9960 0.9980 ^ §
0.9957
0.0003
GC-MS
0.9990
0.9997
0.9980+
0.9989
0.0009
MS
0.9999
*1
0.9990
0.9986
0.9970
0.9969
0.9977
0.9991
sl
<0.0001
0.0013
0.0022
0.0024
0.0015
0.0014
X = 0.9988 CL+ = 0.9993 CL = 0.9978
No impurities detected. * Outlier. ^ Chemiluminescence detection. § Excluded method. Underlined values were excluded from calculation of organic purity.
Distribution:
= 17
Log-Normal

TABLE 8 Mean Results of Organic Purity Determinations for 6-Nitrobenzo(a)pyrene (g/g) BCR RM No.311
00
Lab.
1
2
4
6
9
10
X m s m
GC Capill. Col. FID
0.9990
0.9999 0.9977 a
0.9977
0.9971
0.9990+
0.9994
0.9985
0.0010
NPD-40
0.9986 §
GC Pk.Col FID
0.9999+
0.9936*
0.9983
0.9991
0.0011
HPLC Ads.
0.9990+
0.9999+
0.9999
0.9996
0.0005
HPLC Rev. Phase
0.9999+
0.9990
0.9999+
0.9999
0.9997
0.0004
GC-MS
0.9999+
0.9990+
0.9994
0.0006
MS
0.9990
0.9990
0.0
*1
0.9996
0.9989
0.9992
0.9981
0.9993
0.9995
Sl
0.0005
0.0011
0.0013
0.0010
0.0005
0.0004
X = 0.9995 CL+ = 0.9998 CL = 0.9991
+ a § No impurities detected. *Outlier. Hot injector. Excluded method. Underlined values were excluded from calculation of organic purity.
Distribution:
p =19 Log-Normal

CO
TABLE 9 Mean Results of Organic Purity Determinations for 2-Nitro-7-methoxynaphtho(2,1-b)furan (g/g) BCR RM No.312
Lab.
1
3
4
5
7
8
X m s m
GC Capill. Col. FID
0.9999+
0.9995+
0.9988
0.9999
0.9990+
0.9999
0.9995
0.0005
NPD-40
0.9982 §
GC Pk.Col FID
0.9999+
0.9999
0.9999
0.0
HPLC Ads.
0.9995+
0.9999+
0.9997
0.0003
HPLC Rev. Phase
0.9995+
0.9989
0.9993
0.9980+
0.9933 ^ §
0.9989
0.0007
GC-MS
0.9999+
0.9994
0.9990+
0.9994
0.0005
MS
0.9999
*1
0.9999
0.9995
0.9992
0.9995
0.9987
0.9999
Sl
0.0
0.0
0.0006
0.0003
0.0006
0.0
X =0.9997 CL+ = 0.9998 CL = 0.9994
I x?
No impurities detected. ^ Chemiluminescence detection. Excluded method, Underlined values were excluded from calculation of organic purity.
Distribution: p =18 Log-Normal

TABLE 10 Summary of Analytical Results (g/g)
■I* o
RM No.
305
306
307
308
310
311
312
Compound
1-Nitropyrene
1-Nitronaphthalene
2-Nitronaphthalene
9-Nitroanthracene
3-Nitrofluoranthene
6-Nitrobenzo(a)pyrene
2-Nitro-7-methoxy-
naphtho(2,1-b)furan
D*
N
N
L
N
L
L
L
Organic Analysis Y'
0.0018
0.0018
0.0008
0.0014
0.0012
0.0005
0.0003
X + CL
0.9982 ± 0.0005
0.9982 ± 0.0005
0.9992 + 0.0003 - 0.0006
0.9986 ± 0.0006
0.9988 + 0.0005 - 0.0010
0.9995 + 0.0003 - 0.0004
0.9997 + 0.0001 - 0.0003
P
18
17
20
21
17
19
18
Inorganic Analysis Ash
<0.0002
0.00075
0.0007
0.0007
0.00085
0.00055
0.0005
Volatiles*2*
<0.0012
<0.00135
<0.00155
<0.0012
<0.0014c
<0.0014c
<0.0012
Certified Total Purity
0.9968 ± 0.0019
0.9961 ± 0.0026
0.9970 + 0.0025 - 0.0028
0.9967 ± 0.0025
0.9965 + 0.0028 - 0.0033
0.9975 + 0.0023 - 0.0024
0.9980 + 0.0018 - 0.0020
D* = Distribution character of impurity values; N = normal (gaussian); L = logarithmic-normal. 0 = Volatile elements analysed: Cl, S and P.

TABLE 11A Organic Impurities Detected by Mass Spectrometry
RM
305
306
Compound and Relative
Molecular Mass
1-Nitropyrene C,,HnNCL=247.24 16 y z.
1-Nitronaphthalene C1QH7N02=173.17
Impurity Peaks m/z
247
255
247 252 291
168
179
179 252 298
Identification (Provisional)
C,fiH„NOp (isomer) 7
C,gHgN02 (isomer) 7 ?
hydrog. prod. ii ii
? 7
Impurity
Mean Value mg/g
1.6
0.4 1.27
0.10
1.3
0.66
0.81
0.56
0.28
Content
Lab. Code
1
1
1 8 8
1
5
5 8 8
RRI
0.94
0.94
1.01
d.i.
d.i.
0.83
1.017
1.019
d.i.
d.i.
d.i. = direct inlet mass spectrometry. RRI = Relative Retention Index.
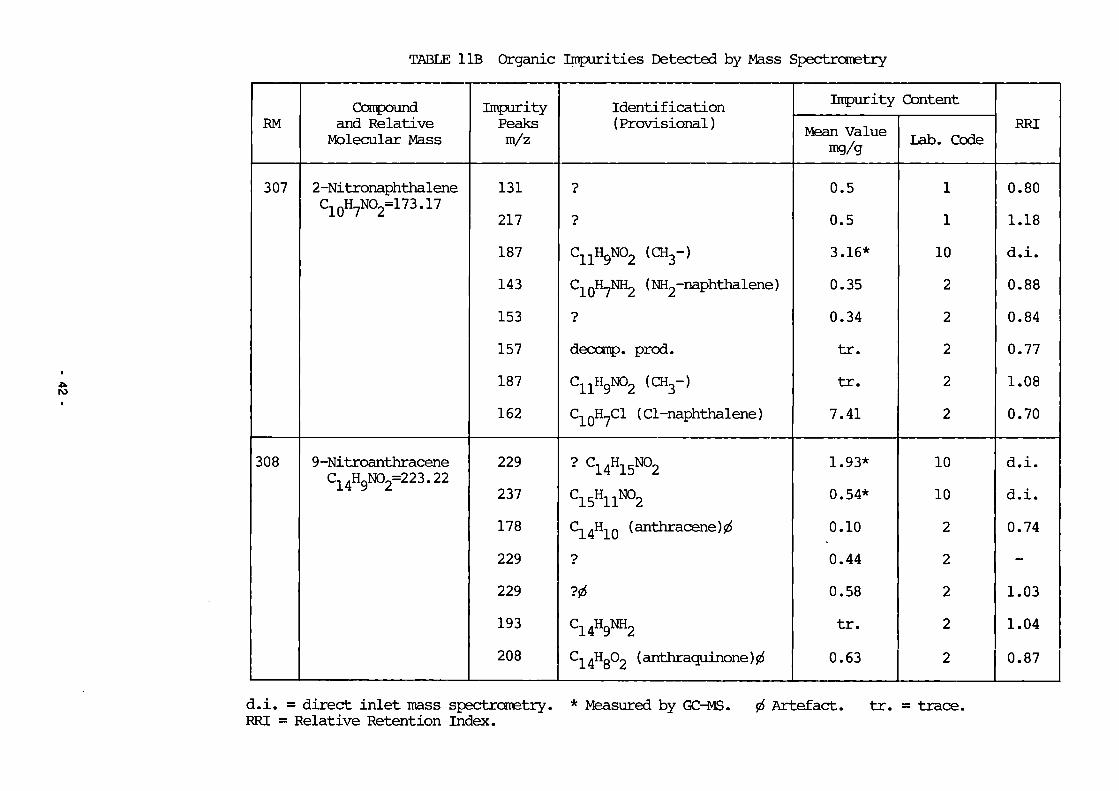
TABLE 11B Organic Impurities Detected by Mass Spectrometry
N)
RM
307
308
Compound and Relative
Molecular Mass
2-Nitronaphthalene ^^^2=173.17
9-Nitroanthracene C14H9N02=223.22
Impurity Peaks m/z
131
217
187 143 153 157 187 162
229
237
178 229 229 193 208
Identi fication (Provisional)
?
C nH 9N0 2 (CH3-)
C,0H7NH2 (MU-naphthalene) ?
decornp. prod.
C I ; LH 9NO 2 (CH3-)
C10H7C1 (Cl-naphthalene)
? C14H15N02
C 1 5H nN0 2
C14H10 (antnr'acene)^ 7
It C14H9NH2
C, .HgO- (anthraquinone)szJ
Inpiority
Mean Value mg/g
0.5
0.5
3.16*
0.35
0.34
tr. tr. 7.41
1.93*
0.54*
0.10
0.44
0.58
tr.
0.63
Content
Lab. Code
1
1
10 2 2 2 2 2
10
10
2 2 2 2
2
RRI
0.80
1.18
d.i.
0.88
0.84
0.77
1.08
0.70
d.i.
d.i.
0.74
-
1.03
1.04
0.87
d.i. = direct inlet mass spectrometry. * Measured by GC-MS. 0 Artefact. tr. = trace. RRI = Relative Retention Index.

TABLE 11C Organic Impurities Detected by Mass Spectrometry
RM
310
311
312
Compound and Relative
Molecular Mass
3-Nitrofluoranthene ClgH9N02=247.24
6-Nitrobenzo(a)pyrene C20HnNO2=297.30
2-Nitro-7-niethoxy-naphtho(2,1-b)furan C13H6NO4=240.18
Impurity Peaks m/z
247
202
217
243
292
355
231
252
267
280
Identification (Provisional)
C,fiHgN02 (isomer) C16H10 (fluorantnene) C16H9NH2
C,6H8(N02)2 (dinitrofluor-anthene)
C21H13N02 C20H12 C 2 0H n NH 2
?
Impurity Content
Mean Value mg/g
1.0
tr.
5.1
tr.
0.24
tr.
1.01*
tr.
tr.
0.06
Lab. Code
1
2
2
2
5
8
10
2
2
8
RRI
0.995
0.70
0.99
0.93
1.352
d.i.
d.i.
0.80
1.07
d.i.
d.i. = direct inlet mass spectrometry. * Measured by GC-MS. tr. = trace. RRI = Relative Retention Index

RM 305 1-NITR0PYRENE
BAR GRAPHS OF ACCEPTED RESULTS (TABLE 3)
0.9930 0.9980 1.0030 g/g lAAAAAAAAAAAAAAAAAAAAAAAAAAAAAAAAAAAAAAAxAAAAAAAAAAAAAAAAAAAAAAAAAAAAAAAAAAAAAAAj,
Lab Cod 1 3 4 5 7 8
1 8 3 4 3 4 5 7 1 S 7 8
. Method e Code GC-CapF 6C-CapF 6C-CapF GC-CapF GC-CapF GC-CapF
6C-PkCol GC-PkCol
HPLC-Ads HPLC-Ads
HPLC-RP HPLC-RP HPLC-RP HPLC-RP
6C/HS 6C/HS 6C/HS US
<-+->
<+>
<-+-> <+>
<+>
<+> <♦>
— + >
-> <-♦->
<+>
--> +>
<+> <+>
<+>
Mean Value 0.9981 0.9991 0.9969 0.9988 0.9990 0.9989
0.9973 0.9994
0.9951 0.9999
0.9977 0.9984 0.9969 0.9980
0.9980 0.9998 0.9990 0.9985
44 -
RM 306 1-NITR0NAPHTHALENE
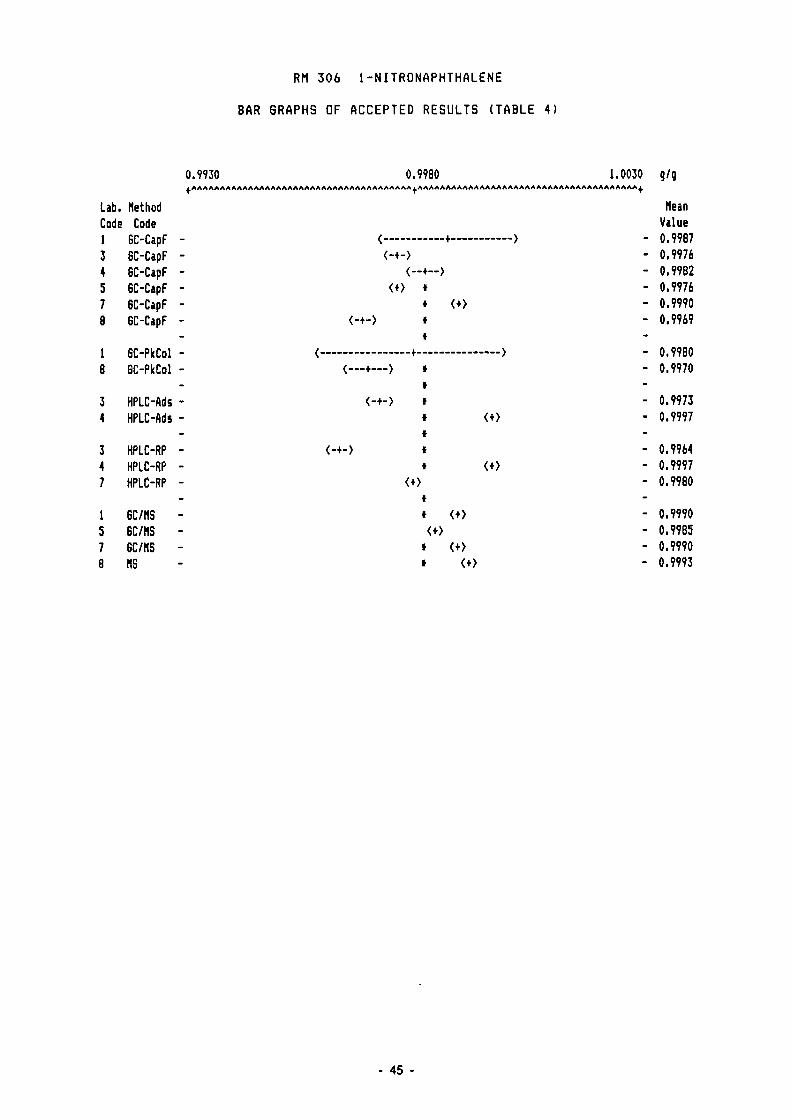
BAR GRAPHS OF ACCEPTED RESULTS (TABLE 4)
0.9930 0.9980
8
1.0030 g/g . A A A A A A A A A A A A A A A A A A A A A A A A A A A A A A A A A A A A A A A i A A A A A A A A A A A A A A A A A A A A A A A A A A A A A A A A A A A A A A A ^
ab. Method ode Code
GC-CapF -6C-CapF -GC-CapF -BC-CapF -BC-CapF -BC-CapF -
1 SC-PkCol -8 GC-PkCol -
3 HPLC-Ads -4 HPLC-Ads -
3 HPLC-RP -4 HPLC-RP -7 HPLC-RP -
1 GC/HS -5 GC/HS -7 GC/HS -8 US
<-<-+->
<-<+>
<-+->
<--
<-+->
<-+->
<+>
-->
<+>
<+>
<+>
<+>
<+>
<+> <+>
(lean Value
- 0.9987 - 0.9976 - 0.9982 - 0.9976 - 0.9990 - 0.9969
- 0.9980 - 0.9970
- 0.9973 - 0.9997
- 0.9964 - 0.9997 - 0.9980
- 0.9990 - 0.99B5 - 0.9990 - 0.9993
45

RM 307 2-NITRONAPHTHALENE
BAR GRAPHS OF ACCEPTED RESULTS (TABLE 5)
Lab Method Code Code
2a
10
6b 10
10
SC-CapF 6C-CapF GC-CapF 6C-CapF 6C-CapF 6C-CapF GC-CapF
6C-PkCol GC-PkCol GC-PkCol
HPLC-Ads HPLC-Ads
HPLC-RP HPLC-RP HPLC-RP HPLC-RP HPLC-RP
6C/HS 6C/HS ns
-
-
-
-
-
-
-
-
-
-
-
-
-
-
-
-
-
-
-
-
< — + — >
<+>
0.9930 0.9980 1.0030 g/g iAAAAAAAAAAAAAAAAAAAAAAAAAAAAAAAAAAAAAAAxAAAAAAAAAAAAAAAAAAAAAAAAAAAAAAAAAAAAAAAi
Mean Value
- 0.9963 <-+-> - 0.9998
- 0.9978 -> - 0.9992
- 0.9983 - 0.9960
<+> - 0.9996
> - 0.9995 - 0.9996 - 0.9999
- 0.9990 - 0.9999
- 0.9983 - 0.9979 - 0.9976
+ — > - 0.9994 <+> - 0.9998
<+> - 0.9990 <+> - 0.9990
* - 0.9968
<+>
<--♦--> <----♦ >
— - + > <--
■+ <+>
<+>
<+>
- 46

Lab . Method Code Code
2a
10
10
6b 10
10
GC-CapF -GC-CapF -GC-CapF -GC-CapF -GC-CapF -GC-CapF -GC-CapF -
GC-PkCol -6C-PkCol -BC-PkCol -
HPLC-Ads -HPLC-Ads -HPLC-Ads -
HPLC-RP -HPLC-RP -HPLC-RP -HPLC-RP -HPLC-RP -
GC/HS -
GC/HS -
HS
RM 308 9-NITROANTHRACENE
BAR GRAPHS OF ACCEPTED RESULTS (TABLE 6)
0.9930 0.9980 1.0030 g/g ^ A A A A A A A A A A A A A A A A A A A A A A A A A A A A A A A A A A A A A A A ^ A A A A A A A A A A A A A A A A A A A A A A A A A A A A A A A A A A A A A A A I
Mean Value
* <+> - 0.9999 * <+> - 0.9996 « <+> - 0.9994
<-+-> - 0.99B3 < 1 ) _ 0 1 9 9 B 1
< + > . 0 9 9 8 0 - 0.9993
- 0.9999 - 0.9998 - 0.9999
<-
>
t <--+--> « « <+> t <+> * <+> * *
< — + — > * <+> «
- - + — > <-+-> « <+>
* <+) t « <+> «<♦> «
- 0.9950 - 0.9992 - 0.9999
- 0.9983 - 0.9989 - 0.9996 - 0.9960 - 0.9997
- 0.9999 - 0.9990
<-+-> * - 0.9975
47

RM 310 3-NITR0FLU0RANTHENE
BAR GRAPHS OF ACCEPTED RESULTS (TABLE 7)
0.9930 0.9980 1.0030 g/g . A A A A A A A A A A A A A A A A A A A A A A A A A A A A A A A A A A A A A A A A A A A A A A A A A A A A A A A A A A A A A A A A A A A A A A A A A A A A A A A ^
Lab Cod 1 3 4 5 7 8
1 8 3 4 4 5 7 1 5 7 8
Method > Code GC-CapF 6C-CapF 6C-CapF GC-CapF 6C-CapF 6C-CapF
6C-PkCol 6C-PkCol
HPLC-Ads HPLC-Ads
HPLC-RP HPLC-RP HPLC-RP
GC/flS 6C/KS 6C/NS MS
-
--
--
---
----
<+> ... >
<+>
<+>
< — + — >
+
<+>
<+>
<+>
<+>
<+> < — + — >
->
<+> <+>
<+>
Mean Value
- 0.9990 - 0.9977 - 0.9961 - 0.9955 - 0.9990 - 0.9975
- 0.9991 - 0.9999
- 0.9995 - 0.9995
- 0.9955 - 0.9956 - 0.9960
- 0.9990 - 0.9997 - 0.9980 - 0.9999
- 48
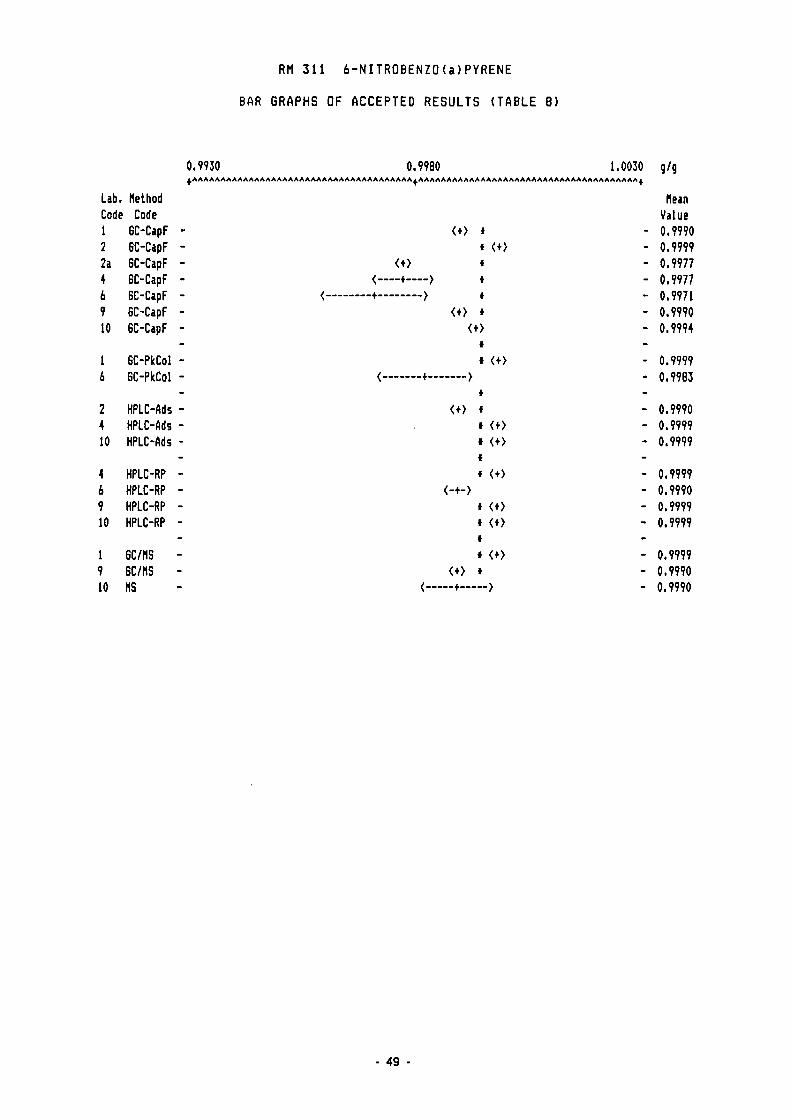
RM 311 6-NITR0BENZ0(a)PYRENE
BAR GRAPHS OF ACCEPTED RESULTS (TABLE 8)
0.9930 0.9980 1.0030 g/g xAAAAAAAAAAAAAAAAAAAAAAAAAAAAAAAAAAAAAAAiAAAAAAAAAAAAAAAAAAAAAAAAAAAAAAAAAAAAAAAi.
Lab . Method Code Code
2a
10
10
10
10
GC-CapF GC-CapF GC-CapF GC-CapF GC-CapF 6C-CapF GC-CapF
GC-PkCol 6C-PkCol
HPLC-Ads HPLC-Ads HPLC-Ads
HPLC-RP HPLC-RP HPLC-RP HPLC-RP
GC/HS GC/NS MS
<--
<-
<+> __+_. -->
-+--
<--
<+>
<+>
t ♦ <+> i t # *
<+>
_ ,
<+>
<-+->
<+> — + - -
# * <♦>
t i t <+> * <+> t * <+>
* <+> * <+> t * <+> » ... >
Mean Value 0.9990 0.9999 0.9977 0.9977 0.9971 0.9990 0.9994
0.9999 0.9983
0.9990 0.9999 0.9999
0.9999 0.9990 0.9999 0.9999
0.9999 0.9990 0.9990
- 49 -

Lab Codi 1 3 4 S 7 8
1 8 3 4 3 4 5 7 1 5 7 8
. Method i Code BC-CapF 6C-CapF SC-CapF GC-CapF GC-CapF 6C-CapF
GC-PkCol GC-PkCol
HPLC-Ads HPLC-Ads
HPLC-RP HPLC-RP HPLC-RP HPLC-RP
GC/HS 6C/MS GC/HS ns
RM 312 2-NITR0-7-METHOXYNAPHTHO ( 2 , l - b ) FURAN
BAR GRAPHS OF ACCEPTED RESULTS (TABLE 9)
0.9930 0.9980 1.0030 g/g ^AAAAAAAAAAAAAAAAAAAAAAAAAAAAAAAAAAAAAAAxAAAAAAAAAAAAAAAAAAAAAAAAAAAAAAAAAAAAAAAx
Mean Value
<+> - 0.9999 <+> - 0.9995
<+> * - 0.9988 <+> - 0.9999
<+> * - 0.9990 <+> - 0.9999 * <+> - 0.9999 <+> - 0.9999 t
<+> - 0.9995 <+> - 0.9999 i
<+> - 0.9995 <-+-> t - 0.9989
<+> * - 0.9993 <+> * - 0.9980
# <+> - 0.9999
<+> - 0.9994 <+> » - 0.9990
<+> - 0.9999
50

8.2 Melting Points of the Reference Materials
The melting point temperatures of the reference materials were determined by two methods: differential scanning calorimetry (DSC) and the Zeichert melting point microscope.
The DSC method has been described in a previous report (II), and the instrument was calibrated directly against pure indium (m.p. 156.6 °C). This method gave melting points correct to ± 0.5 °C.
The Zeichert apparatus was calibrated at two melting points, that of pure azobenzene (m.p. 68.0 °C) and that of dicyanodiamide (m.p. 210.0 °C) and provided melting points correct to ± 1.0 °C. The results of the measur-
ments are shown below.
RM No. Compound 305 1-Nitropyrene 306 I-Nitronaphthalene 307 2-Nitronaphthalene 308 9-Nitroanthracene 310 3-Nitrofluoranthene 311 6-Nitrobenzo(a)pyrene 312 2-Nitro-7-methoxy-naphtho(2,l-b)furan
m.p. C 153.0 56.5 76.0 146.0 166.0 260.0 188.0
Method Use DSC DSC
Zeichert Zeichert Zeichert Zeichert DSC
- 51

9. References
1. J. N. Pitts, K. A. van Cauwenberghe, D. Grosjean, J. P. Schmid, D. R. Fitz, W. L. Belser, G. B. Knudson and P. M. Hynds. Science, 202, 515-519 (1978).
2. A. Hartung, J. Kraft, J. Schulze, H. Kiess, K. H. Lies. Chromatographia, \9_, 269 (1984).
3. M G. Nishioka, B. A. Petersen and J. Lewtas. "Comparison of Nitro Aromatic Content and Direct-acting Mutagenicity of Diesel Emissions". In: Polynuclear Aromatic Hydrocarbons: Physical and Biological Chemistry. (Editors: M. Cooke, A. J. Dennis and G. L. Fisher) Battelle Press and Springer Verlag, p.603-613 (1982).
4. H. S. Rosenkranz, R. C. McCoy, D.R. Sanders, M. Butler, D. K. Kiriazides and R. Mermelstein. Science, 209, 1039-1043 (1980).
5. G. Grimmer, J. Jacob, K-W. Naujack and G. Dettbarn. Anal. Chem., 55, 892 (1983).
6. Torben Nielsen. Anal. Chem., 55, 286-290 (1983).
7. C. M. White (Ed.), Nitrated Polycyclic Aromatic Hydrocarbons, p.376. A. Huethig Verlag. Heidelberg, Basel, New York (1985).
8. J. Campbell, G. C. Crumplin, J. V. Garner, R. C. Garner, C. N. Martin and A. Rutter. Carcinogenesis, 2̂ , 559 (1981).
9. J. A. Sweetman, F. W. Karasek and 0. Schuetzle. J. Chromatog., 247, 245, 254 (1982).
10. E. C. McCoy, E. J. Rosenkranz, L. A. Petrullo, H. S. Rosenkranz and R. Mermelstein. Environm. Mutag., 3^, 499-511 (1981).
11. R. Mermelstein, D. K. Kiriazides, M. Butler, E. C. McCoy and H. S. Rosenkranz. Mutat. Res., 89_, 187-196 (1982).
12. W. Karcher, R. J. Fordham, J. Jacob and E. Colinet. The certification of polycyclic aromatic compounds. Part V. CRM Nos. 153-161, 177. EUR 9209 En-1984.
13. J. Jacob, J. J. Belliardo and P. J. Wagstaffe. The certification of polycyclic aromatic compounds. Part VI. CRM Nos. 152,265-272. EUR 10295 En-1985.
52 -

14. J. Jacob, J. J. Belliardo, P. J. Wagstaffe and W. Karcher. (in preparation.)
15. C. Lasne, Z. W. Ju, W. Venegas and I. Chouroulinkov. Mutat. Res. 130, 273-282 (1984).
16. J. Venekamp. (In preparation.)
17. R. S. Bodine, P. H. Ruehle, R. W-Roth, G. Bosch, L. Bosch, G. Opperman and J. H. Saugier. Proc. of Seventh Internat. Sympos. on Polynuclear Aromatic Hydrocarbons, Battelle Press, Columbus, Ohio, p. 135-145, (19 ).
[RM 305 & RM 308]
18. M. Duvalma, I. V. Pirvulescu and T. D. Bota. (Rumanian Ministry of Petroleum and Chemical Industry), French Patent No. 1352613/1963; Chem. Abstracts, 61_, 626e, (1964).
[RM 306]
19. W. Seidenfaden and D. Pawellek. Stickstoff Verbindungen: in Houben-Weyl, Methoden der Organ. Chemie, Bd.X/1, p.492.
20. H. H. Hodgson and E. R. Ward. J. Chem. S o c , 127-129, (1947).
21. A. Streitwieser Jr. and R. C. Fahey. J. Org. Chem., 27, 2352, (1962).
22. L. F. Fieser and E. B. Hershberg. J. Amer. Chem. Soc, 61, 1565-1574, (1939),
23. M. J. S. Dewar, T. Mole, D. S. Urch and E. W. T. Warford. J. Chem. S o c , 3572-3575 (1956).
24. R. Royer and J. P. Buisson. Eur. J. Med. Chem., 15, 275 (1980).
[RM 306 & RM 310]
[RM 307]
[RM310]
[RM 311]
[RM 311]
[RM 312]
25. Laboratory Decontamination and Destruction of Carcinogens in Laboratory Wastes: Some Polycyclic Aromatic Hydrocarbons. Edited by M. Castegnaro, G. Grimmer, 0. Hutzinger, W. Karcher, H. Kunte, M. Lafontaine, E. B. Sansone, G. Telling and S. P. Tucker, IARC Scientific Publication No. 49, Lyon (1983),
- 53


European Communities — Commission
EUR 11254 — The certification of the purity of seven nitro-polycyclic aromatic compounds CRM Nos 305, 306, 307, 308, 310, 311, 312
J.J. Belliardo, J. Jacob, A.S. Lindsey
Luxembourg: Office for Official Publications of the European Communities
1988 — VIII, 53 pp., 22 tab. — 21.0 x 29.7 cm
BCR information series
EN
ISBN 92-825-7956-5
Catalogue number: CD-NA-11254-EN-C
Price (excluding VAT) in Luxembourg ECU 6 BFR 250 IRL 4.50 UKL 4 USD 7
The purity of samples of seven nitro-polycyclic aromatic hydrocarbons has been determined in an interlaboratory exercise, involving 10 laboratories in EC countries. The purity measurements were carried out using a variety of analytical methods (gas liquid chromatography, high performance liquid chromatography and mass spectrometry). This report describes the certification procedure and experimental details of the interlaboratory analyses.

Venta y suscripciones • Salg og abonnement • Verkauf und Abonnement • lluAnoxiq KCU ouv5poueq Sales and subscriptions • Vente et abonnements • Vendita e abbonamenti
Verkoop en abonnementen • Venda e assinaturas
BELGIQUE / BELGIE IRELAND PORTUGAL
Moni teur beige / Belgisch Staatsblad Rue de Louvain 4 0 4 2 / Leuvensestraat 4042 1000 Bruxelles / 1000 Brussel Tel. 512 00 26 CCP / Postrekening 000-2005502-27
Sous-depots / Agentschappen:
Librairie europeenne / Europese Boekhandel Rue de la Loi 244 / Wetstraat 244 1040 Bruxelles / 1040 Brussel
CREDOC Rue de la Montagne 34 / Bergstraat 34 Bte 11 / Bus 11 1000 Bruxelles / 1000 Brussel
DANMARK
Schultz EF-publikationer Montergade 19 1116 Kobenhavn K Tlf: (01) 14 11 95 Telecopier: (01) 32 75 11
BR DEUTSCHLAND
Bundesanzeiger Verlag Breite StraBe Postfach 10 80 06 5 0 0 0 Kbln 1 Tel. (02 21) 20 29-0 Fernschreiber: ANZEIGER BONN 8 882 595 Telecopierer: 20 29 278
GREECE
G.C. Eleftheroudakis SA International Bookstore 4 Nikis Street 105 63 Athens Tel. 322 22 55 Telex 219410 ELEF
Sub-agent for Northern Greece:
Molho's Bookstore The Business Bookshop 10 Tsimiski Street Thessaloniki Tel. 275 271 Telex 412885 LIMO
ESPANA
Boletin Oficial del Estado Trafalgar 27 2 8 0 1 0 Madr id Tel. (91) 446 60 00
Mundi-Prensa Libros, S.A. Castello 37 2 8 0 0 1 Madr id Tel. (91) 431 33 99 (Libros)
431 32 22 (Suscripciones) 435 36 37 (Direccion)
Telex 49370-MPLI-E
FRANCE
Journal officiel Service des publications des Communautes europeennes 26, rue Desaix 75727 Paris Cedex 15 Tel. (1) 45 78 61 39
Government Publications Sales Office Sun Alliance House Molesworth Street Dublin 2 Tel. 71 03 09
or by post
Government Stationery Office EEC Section 6th floor Bishop Street Dublin 8 Tel. 78 16 66
ITALIA
Licosa Spa Via Lamarmora, 45 Casella postale 552 50 121 Firenze Tel. 57 97 51 Telex 570466 LICOSA I CCP 343 509
Subagenti: Libreria scterrtrfica Luck) de Biasb AEKXJ Via Meravigl i . 16 20 123 Milano Tel. 80 76 79
Herder Editrice e Libreria Piazza Monteci tor io, 117-120 00 186 Roma Tel. 67 94 628 /67 95 304
Libreria giuridica Via 12 Ottobre. 172/R 16 121 Genova Tel. 59 56 93
GRAND-DUCHE DE LUXEMBOURG et autres pays / and other countries
Office des publications officielles des Communautes europeennes 2, rue Mercier L-2985 Luxembourg Tel. 49 92 81 Telex PUBOF LU 1324 b CCP 19190-81 CC bancaire BIL 8 -109 /6003 /200 Sogenal 61-490226-96-26
Abonnements / Subscriptions Messageries Paul Kraus 11, rue Christophe Plantin L-2339 Luxembourg Tel. 49 98 881 Telex 2515 CCP 49242-63
NEDERLAND
Staatsdrukkerij- en uitgeverijbedrijf Christoffel Plantijnstraat Postbus 20014 2500 EA 's-Gravenhage Tel. (070) 78 98 80 (bestellingen)
Imprensa Nacional Casa da Moeda , E. P. Rua D. Francisco Manuel de Melo, 5 1092 Lisboa Codex Tel. 69 34 14 Telex 15328 INCM
Distribuidora Livros Bertrand Lda. Grupo Bertrand. SARL Rua das Terras dos Vales, 4-A Apart. 37 2700 Amadora CODEX Tel. 493 90 50 - 494 87 88 Telex 15798 BERDIS
UNITED KINGDOM
H M S O Books (PC 16) HMSO Publications Centre 51 Nine Elms Lane London SW8 5DR Tel. (01) 211 77 02
Sub-agent:
Alan Armstrong Er Associates Ltd Arkwright Road Reading, Berks RG2 OSQ Tel. (0734) 75 17 69 Telex 849937 AAALTD G
TURKIYE
Diinya super veb ofset A.S. Narlibahce Sokak No. 15 Cagaloglu Istanbul Tel: 512 01 90 Telex: 23822 dsvo-tr.
UNITED STATES OF AMERICA
European Communitv Information Service 2100 M Street. NW Suite 707 Washington, DC 20037 Tel. (202) 862 9500
CANADA
Renouf Publishing Co., Ltd 61 Sparks Street Ottawa Ontario K1P 5R1 Tel. Toll Free 1 (800) 267 4164 Ottawa Region (613) 238 8985-6 Telex 053-4936
JAPAN
Kinokuniya Company Ltd 17-7 Shinjuku 3-Chome Shiniuku-ku Tokyo 160-91 Tel. (03) 354 0131
Journal Department PO Box 55 Chitose Tokyo 156 Tel. ( 03 )439 0124
01/88

NOTICE TO THE READER
All scientific and technical reports published by the Commission of the European Communities are announced in the monthly periodical 'euro abstracts'. For subscription (1 year: BFR 3 300) please write to the address below.
Price (excluding VAT) in Luxembourg ECU 6 BFR 250 IRL 4.50 UKL 4 USD 7
* * * OFFICE FOR OFFICIAL PUBLICATIONS *_E2_* 0 F T H E EURoPEAN COMMUNITIES * Of> *
* * * L - 2985 Luxembourg
ISBN ^2- f lSS-7TSb-S
Copyright © 2022 FDOKUMEN