Simultaneous identification of different classes of hydrocarbons and determination of...
11
ELSEVIER Journal of Chromatography A, 728 (1996) 359-369 JOURNALOF CHROMATOGRAPHY A Simultaneous identification of different classes of hydrocarbons and determination of nitro-polycyclic aromatic hydrocarbons by means of particle beam liquid chromatography-mass spectrometry L. Bonfanti a, M. Careri b'*, A. Mangia b, P. Manini b, M. Maspero ~ ~ENEL-CRT, Via A. Pisano 120, 56100 Pisa, Italy b Dipartimento di Chimica Generale ed lnorganica, Chimica Analitica, Chimica Fisica, Universitdt degli Studi di Parma, Viale delle Scienze, 43100 Parma, Italy ~CISE, Centro Informazioni Studied Esperienze, P.O. 12081, 20134 Milan, Italy Abstract LC-MS with a particle beam interface was used to separate and identify aliphatic hydrocarbons, polycyclic aromatic hydrocarbons (PAHs) and their nitrated derivatives (nitro-PAHs). In particular, the behaviour of nitro-PAHs and of two nitrated biphenyls was checked in terms of instrumental response. A normal-phase chromatographic system was used, with a silica column and heptane-tetrahydrofuran as mobile phase. Electron impact and positive- and negative-ion chemical ionization (NICI) modes were used; for nitro-PAHs, the best results were obtained under NICI conditions. In the flow-injection mode, detection limits as low as pg levels were obtained for 9-nitroanthracene, 3-nitro-9-fluorenone, 1-nitropyrene, 1,8-dinitronaphthalene, 2,7-dinitrofluorene and 2,7- dinitro-9-fluorenone, whereas the low-molecular-mass 1- and 2-nitronaphthalene were not detected even at tzg levels; using the analytical column, a detection limit five times higher was determined for 1-nitropyrene. For most of the nitro-PAHs considered, the dependences of the intensities on the amounts injected were found to be linear in a range of more than two orders of magnitude. Keywords: Liquid chromatography-mass spectrometry: Particle beam interface; Interfaces, LC-MS; Hydrocarbons; Polynuclear aromatic hydrocarbons 1. Introduction The combination of HPLC and MS is un- doubtedly an attractive technique for the identifi- cation of non-volatile or thermally labile sub- stances; the reliability of mass spectrometry in identification is added to the separating capa- * Corresponding author. bility of chromatography. In this way, it is pos- sible to overcome the lack of specificity of the conventional HPLC detectors: the need for such specificity is particularly crucial in the case of complex matrices. Various technical solutions exist to the prob- lem of compatibility between the conditions of liquid chromatography and the requirements of mass spectrometry. In the first coupled systems, 0021-9673/96/$15.00 © 1996 Elsevier Science B.V. All rights reserved SSDI 0021-9673(95)01040-8
-
Upload
independent -
Category
Documents
-
view
10 -
download
0
Transcript of Simultaneous identification of different classes of hydrocarbons and determination of...

E L S E V I E R Journal of Chromatography A, 728 (1996) 359-369
JOURNAL OF CHROMATOGRAPHY A
Simultaneous identification of different classes of hydrocarbons and determination of nitro-polycyclic aromatic hydrocarbons
by means of particle beam liquid chromatography-mass spectrometry
L. Bonfanti a, M. Careri b'*, A. Mangia b, P. Manini b, M. Maspero ~ ~ENEL-CRT, Via A. Pisano 120, 56100 Pisa, Italy
b Dipartimento di Chimica Generale ed lnorganica, Chimica Analitica, Chimica Fisica, Universitdt degli Studi di Parma, Viale delle Scienze, 43100 Parma, Italy
~CISE, Centro Informazioni Studied Esperienze, P.O. 12081, 20134 Milan, Italy
Abstract
LC-MS with a particle beam interface was used to separate and identify aliphatic hydrocarbons, polycyclic aromatic hydrocarbons (PAHs) and their nitrated derivatives (nitro-PAHs). In particular, the behaviour of nitro-PAHs and of two nitrated biphenyls was checked in terms of instrumental response. A normal-phase chromatographic system was used, with a silica column and heptane-tetrahydrofuran as mobile phase. Electron impact and positive- and negative-ion chemical ionization (NICI) modes were used; for nitro-PAHs, the best results were obtained under NICI conditions. In the flow-injection mode, detection limits as low as pg levels were obtained for 9-nitroanthracene, 3-nitro-9-fluorenone, 1-nitropyrene, 1,8-dinitronaphthalene, 2,7-dinitrofluorene and 2,7- dinitro-9-fluorenone, whereas the low-molecular-mass 1- and 2-nitronaphthalene were not detected even at tzg levels; using the analytical column, a detection limit five times higher was determined for 1-nitropyrene. For most of the nitro-PAHs considered, the dependences of the intensities on the amounts injected were found to be linear in a range of more than two orders of magnitude.
Keywords: Liquid chromatography-mass spectrometry: Particle beam interface; Interfaces, LC-MS; Hydrocarbons; Polynuclear aromatic hydrocarbons
1. Introduction
The combinat ion of H P L C and MS is un- doubtedly an attractive technique for the identifi- cation of non-volatile or thermally labile sub- stances; the reliability of mass spect rometry in identification is added to the separating capa-
* Corresponding author.
bility of chromatography. In this way, it is pos- sible to overcome the lack of specificity of the conventional H P L C detectors: the need for such specificity is particularly crucial in the case of complex matrices.
Various technical solutions exist to the prob- lem of compatibil i ty between the conditions of liquid chromatography and the requirements of mass spectrometry. In the first coupled systems,
0021-9673/96/$15.00 © 1996 Elsevier Science B.V. All rights reserved S S D I 0021-9673(95)01040-8
360 L. Bonfanti et aL / J. Chrornatogr. A 728 (1996) 359-369
such as moving belt (MB) [1], and in the still- used particle beam (PB) interface [2], ionization is obtained by means of the conventional elec- tron impact (El) and chemical ionization (CI) techniques. More recently, new interfacing/ioni- zation systems have been proposed. These sys- tems, basically thermospray (TS) [3] and electro- spray/ionspray (ES/IS) [4,5], perform the ioniza- tion of the substance directly from the mobile phase through the mechanism of ion evaporation [6,7]. The atmospheric pressure chemical ioniza- tion (APCI) system [8] is based on the formation of gas-phase ions from a corona discharge or from a 63Ni source. In the heated nebulizer (HN) interface, a sprayer is coupled to a heated vapor- ization chamber [9]; in this way, aqueous mobile phases and high flow-rates can be used. These interface/ionization systems are now the most widely used. In particular, ES/IS nowadays ap- pears to be the most effective system, thanks to its wide range of usable molecular mass and sensitivity; this interface will certainly be the subject of further technological developments.
As for the particle beam interface, this system undoubtedly has limitations, e.g., a limited range of operative molecular mass, since a certain volatility is required, the necessity to use mobile phases with a low water content and volatile salts or buffers and, above all, in many cases lower sensitivity than that obtained with ES/IS. On the other hand, in its application field this interface has some positive practical features: it has full compatibility with conventional EI/CI sources and consequently there is the possibility of hav- ing a flexible G C - M S / L C - M S system, which can cover the field of substances of different volatility up to about 1000 u; mass spectra recorded in the El mode are suitable for automatic retrieval search procedures; the fragmentation patterns provide structural information, without the necessity for using more complex MS-MS instru- mentation. Recently, technical modifications to the PB nebulizer device have been proposed, in order to operate with/zl/min flow-rates, with an improvement in the signal-to-noise ratio, even with water-rich mobile phases [10,11]. The prob- lems deriving from the high water content in the eluent can also be reduced by mixing "post-
column" solvents, such as tetrahydrofuran (THF), or suitable carriers, which improve the efficiency of nebulization and transfer through the interface [12].
Regarding the application of HPLC-MS in the environmental field, most of the examples deal with the separation and identification of pes- ticides or their metabolites, using different inter- faces; other examples concern surfactants, dyes and polycyclic aromatic hydrocarbons, as re- ported in some recent reviews [13-19].
As regards PAHs, the PB interface has been applied to study the behaviour of hydroxy-, nitro-, hydroxynitro- and amino-PAHs for their determination in atmospheric particulates [20]. For nitro-PAHs, detection limits of about 1 ng injected have been reported, using negative-ion chemical ionization (NICI); hydroxy-PAHs gave a poor response, probably owing to surface adsorption in the interface. The same LC-MS interfacing system has been used for the de- termination of PAHs in soils and sediments [21]; detection limits in the 10-100 ng/g range have been obtained for compounds of molecular mass greater than 220. PAHs and their oxygenated derivatives have been determined in marine sediment and water samples, using the LC-PB- MS technique [22]; the detection limits for PAHs containing four or more rings were in the ng range. A modified PB interface having a con- centric ultrasonic nebulizer has been used for the determination of PAHs [23]; detection limits of 200 pg, 500 pg and 1 ng for chrysene, ben- zo[ghi]perylene and dibenz[a,h]anthracene, re- spectively, have been obtained.
Polar substituted polycyclic aromatic com- pounds have been characterized in a standard reference material (diesel exhaust particulates) using both GC-MS and LC-MS [24]. For LC- MS, a reversed-phase chromatographic system and a thermospray interface were used; twenty compounds, including nitro-, hydroxy- and amine derivatives, were identified.
PAHs, being neutral, low-polarity compounds, are not suitable for detection in ES-MS, which requires ionic or ionizable analytes; charge-trans- fer complexation, in which PAHs behave as electron donors and chloro derivatives as accep-

L. Bonfanti et al. / J. Chromatogr. A 728 (1996) 359-369 361
tors, has been used to obtain charged species, suitable for an ES interface [25,26].
Recently, HPLC and pneumatically assisted ES have been used to study six hydroxy-PAH standards, on a reversed-phase column, using both positive- and negative-ion acquisition modes. The incomplete separation of some of them was overcome using the single-ion moni- toring acquisition procedure; in this way, de- tection at ng levels was achieved [27].
In this work, LC-MS with a particle beam interface was used to verify the capability of this technique to identify different classes of hydro- carbons, i.e. aliphatic hydrocarbons, PAHs and nitro-PAHs, including two nitrobiphenyls, in a single chromatographic separation; for this pur- pose, standard compounds were used at this stage of the work. The aim was to develop an analytical method which could perform rapid screening for the identification of the different classes of hydrocarbons, with minimum treat- ment of the samples, overcoming the problem of the volatility required for GC-MS. In addition, the detection limits and the dependences of the instrumental responses on the amounts injected were determined for nitro-PAHs of different
molecular mass and for the two biphenyl deriva- tives.
2. Experimental
2.1. Reagents
The LC-MS behaviour of the different classes of hydrocarbons was studied using linear ali- phatic hydrocarbons from n-C 7 to n-C36 and the PAHs and nitro-PAHs listed in Table 1. Toluene and dichloromethane solutions having concen- trations of about 10 /zg/ml of each compound were used.
All compounds were purchased from Supel- chem (Milan, Italy). The mobile phases were prepared using HPLC-grade heptane and THF; toluene and dichloromethane were of analytical- reagent grade. All solvents were obtained from Lab-Scan (Dublin, Ireland).
Amberlite XAD-2 resin (20-60 mesh) was purchased from Carlo Erba (Milan, Italy) and purified according to the Level I EPA Proce- dures Manual [28].
Table 1 List of the PAH and nitro-PAH compounds examined and molecular masses
Compound M Compound M
Naphthalene 128 1-Nitronaphthalene 173 2-Methylnaphthalene 142 2-Nitronaphthalene 17 :~ Fluorene 166 2-Methyl-l-nitronaphthalene 188 Phenanthrene 178 2-Nitrobiphenyl 199 Anthracene 178 2-Nitrofluorene 211 Fluoranthene 202 1,5-Dinitronaphthalene 218 Pyrene 202 1,8-Dinitronaphthalene 218 Benz[a]anthracene 228 9-Nitroanthracene 223 Benz[b]anthracene 228 3-Nitro-9-fluorenone 225 Triphenylenc 228 2,2'-Dinitrobiphenyl 244 Chrysene 228 1-Nitropyrene 247 Benzo[a]pyrene 252 2,7-Dinitrofluorene 256 Benzo[e ]pyrene 252 2,7-Dinitro-9- fluorenone 270 lndeno[l.2,3-cd]pyrene 276 Benzo[ ghi]perylene 276 Dibenz[a,c]anthracene 278 Dibenz[a,h ]anthracene 278 Coronene 300 1,3,5-Triphenylbenzene 306
362 L. Bonfanti et al. / J. Chromatogr. A 728 (1996) 359-369
2.2. Liquid chromatography with UV detection
The chromatographic apparatus consisted of a Hewlett-Packard (Palo Alto, CA, USA) HP 1050 chromatograph equipped with a Model 7125 injection valve with a 20-/zl loop (Rheodyne, Cotati, CA, USA). For detection, a Hewlett- Packard HP 1050 variable-wavelength detector was used, monitoring the eluates at 254 nm; the detector signals were monitored using Maxima Data Acquisition software (Waters-Millipore, Milford, MA, USA).
The separations were performed on a 250 × 4.6 mm I.D. LiChrosorb Si-60 column (Merck, Darmstadt, Germany) packed with 10-#m par- ticles. The mobile phase was heptane-THF at a flow-rate of 0.8 ml/min; the following gradient programme was applied: 100% heptane, 5 min; 0-50% THF in 30 rain, with a linear gradient; heptane-THF (50:50), held for 5 min.
2.3. Liquid chromatography with MS detection
carried out by extracting ion profiles from the total ion current (TIC) signal; in the case of nitro-PAHs, most experiments were performed in the single-ion and in the selected-ion moni- toring (SIM) modes; ions used for monitoring were the molecular ions of nitro compounds listed in Table 1 (dwell time between 100 and 200 ms for each ion). When single-ion monitoring was carried out, a dwell time of 900 ms was pro- grammed.
Chromatographic separations were carried out under the same conditions as for LC-UV.
3. Results and discussion
The reversed-phase mode is the most widely used LC mechanism for the separation of PAHs and nitro-PAHs [29,30]; in this work, the normal- phase system was preferred, since the aim was to verify the capability of LC-PB-MS to separate and simultaneously to identify classes of hydro-
A Hewlett-Packard system was used: an HP 1090 chromatograph, equipped with an HP 1050 autosampler, was connected to a quadrupole mass spectrometer (HP 5989A) through a par- ticle beam interface (HP 59980A). The mass spectrometer was equipped with dual EI /CI source, negative-ion detection and a 1000-u mass range. Data were collected using an HP MS 59940A ChemStation.
The operating conditions of the interface were as follows: the nebulizing gas was high-purity helium (inlet pressure 241 kPa), the temperature of the desolvation chamber was 70°C and the nebulizer was set in such a way that the capillary extended about 1 ram.
Both EI and CI techniques were used: posi- tive- and negative-ion CI mass spectra were obtained, with methane as a reagent gas (ion source manifold pressure 0.187 kPa). The ion source and quadrupole temperatures were 250 and 100°C respectively; the electron energy was 30 or 70 eV in the EI mode and 230 eV in the CI mode. For both EI and CI analyses, in general the mass range m/z 105-350 was scanned at a rate of 1.16 s per scan. Analyses were also
IO.4AU VIII
v X l l
\ • ,.4/ LJL
I i I i i I i I i i I I I I i I I I i I I i i
0 5 10 15 20 T i m e ( r a i n )
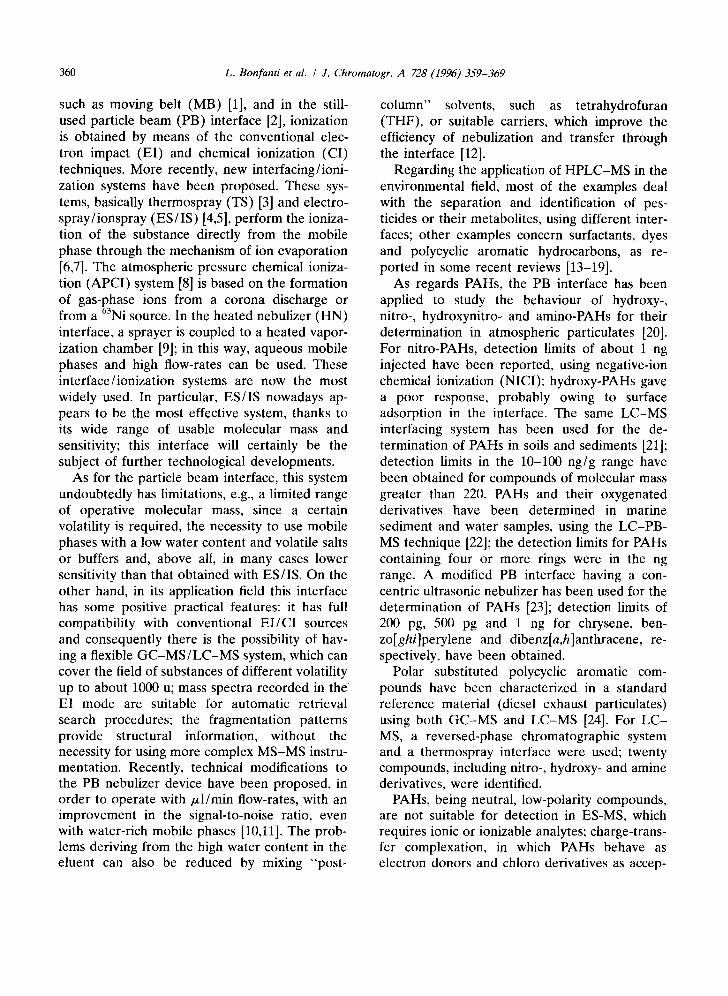
Fig. 1. L C - U V trace for a 10 /zg/ml mixture of the PAHs and ni t ro-PAHs listed in Table 1. Column, LiChrosorb Si-60 (10/~m); mobile phase, h e p t a n e - T H F ; injection volume, 20 /~1. For o ther conditions, see Experimental . Peaks: I = 2-methyl- l -n i t ronaphthalene; II = 9-nitroanthracene; I I I = 1-nitronaphthalene; I V = 2-ni tronaphthalene; V = 2-nitro- biphenyl; VI = 2-nitrofluorene; VII = 1-nitropyrene; VIII = 3-nitro-9-fluorenone; IX = 1,8-dinitronaphthalene; X = 2,7-di- nitrofluorene; XI = 1,5-dinitronaphthalene; XII = 2,2'-di- nitrobiphenyl; XIII = 2,7-dinitro-9-fluorenone.

L. Bonfanti et al. / J. Chrornatogr, A 728 (1996) 359-369 363
carbons, rather than to separate single compo- nents.
In a preliminary step, the separation between a mixture of PAHs having molecular masses rang- ing from 128 and 306 and a mixture of thirteen nitro-PAHs was achieved, using UV detection. By injecting 20 #1 of solutions having concen- trations around 10/zg/ml of each compound, the separation shown in Fig. 1 was obtained. For neutral PAHs seven major peaks were observed between 5.7 and 8.4 min: as for nitro-PAHs, under these chromatographic conditions a good separation was obtained for the compounds examined, except for 1,5-dinitronaphthalene, which was hardly resolved from 2,2'-dinitro- biphenyl,
The difference between the retention times of the heaviest PAHs and the least retained of the nitro-PAHs was sufficient to obtain an effective separation also with mass detection. Therefore,
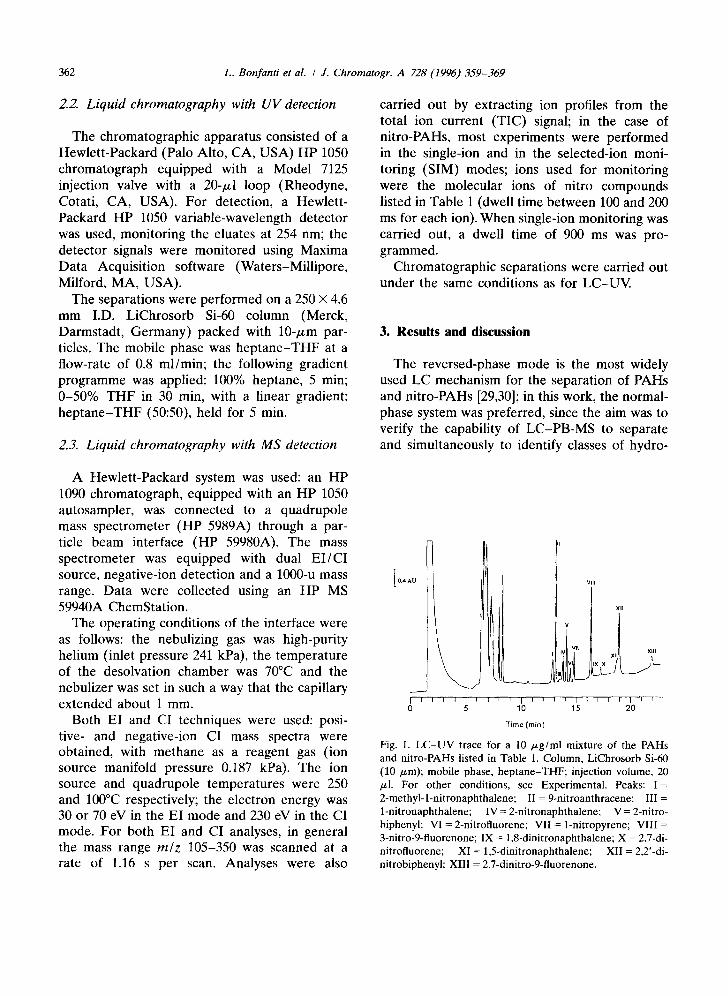
the same mobile phase with gradient elution was used to separate aliphatic hydrocarbons, PAHs and nitro-PAHs with a PB-MS system; different ionization modes were exploited. Fig. 2 shows this separation obtained in the E1 mode, moni- toring the total ion current signals; about 100 ng of each compounds were injected. For detection. El ionization at 70 eV was used; in this way, it was possible to detect the hydrocarbons of all three classes, although with low sensitivity. As expected, the aliphatic hydrocarbons co-eluted and were virtually unretained; Fig. 3a shows the mass spectrum averaged between 3.12 and 3.24 min, having the typical pattern of long-chain saturated hydrocarbons: acquisition in the 105- 350 u mass range only gave evidence of peaks up to m/z 309, corresponding to the fragment ion [C22H45] +. In order to obtain structural infor- mation on the heaviest hydrocarbons, it was operated in the 350-550 u scan range (Fig. 3b):
~mllll,ll~t
m
Fig. 2. LC-PB-MS full-scan trace for a 10/zg/ml mixture of linear aliphatic hydrocarbons (from C 7 to C3,) and of the PAHs and nitro-PAHs listed in Table 1. Injection volume, 10/zl. For other conditions, see Experimental. MS, E! mode (mass range 105--350 u).
364 L. Bonfanti et al. / J. Chromatogr. A 728 (1996) 359-369
l ong o II/111
O / ~.1
127
jJ I "' ..... ,mta...,dnt ..... ~11,
8
169
t ls7 / , :~o S l
. . . . . . . . ~t , a J" ~ : a I i ~ D • i • i i n
~ssICh~e
• 407
. ..I.h.tll IIJ ] ,,t"~. I i' . . ~ . . . ~ . . . , ~ . , .
tw- • 351 • 365
' I , h . . . . J , i . . . u, , . .
Fig. 3. L C - P B - E I mass spectra of the unresolved mixture of linear aliphatic hydrocarbons ranging from C 7 to C36. (a) Scan range 105-350 u; (b) scan range 350-550 u. Ionization energy. 70 eV; positive-ion signal.
in this way, ions up to m/z 449, which corre- sponds t o [C32H65] +, were visible; the latter fragment accounts for the elimination of C2H 5 from C 3 4 H 7 0 .
The aromatic hydrocarbons are eluted about 5 min after the aliphatic hydrocarbons, hence the two classes are well separated. The separation within the class of PAHs is evidently incomplete, as observed above in the case of UV detection. Nevertheless, by extracting from the total ion current profile the signals corresponding to the molecular ions, it was possible to obtain a partial deconvolution of the PAHs examined; Fig. 4 shows the mass chromatograms of the parent ions at m/z 228, 252, 276, 278, 300 and 306 corresponding to the compounds listed in Table 1 from benz[a]anthracene to 1,3,5-triphenylben- zene. The low-molecular-mass PAHs were not detected because they were presumably skimmed away by the vacuum pumps of the interface.
The EI ionization mode is not the most suit- able for the detection of nitro-PAHs; in fact, poor quality mass spectra were generated, as
already observed by other workers [20], and low responses were obtained, even at a low voltage (30 V). The best results were achieved using CI and monitoring the negative ions; when electron- capture negative ionization was used, signals corresponding to nitro-PAHs were enhanced, whereas the saturated hydrocarbons, as non-elec- tron-capturing compounds, were predictably not detected (Fig. 5a). Operating in the full-scan mode, eight peaks out of thirteen were observed, since only the heaviest mono- or the dinitro derivatives were detected; the most volatile mononitronaphthalenes and nitrobiphenyl were probably lost in the momentum separator of the interface, as discussed above and as already reported by other workers [22] for the most volatile PAHs. In order to achieve selectivity and much higher sensitivity for the nitro compounds, the SIM mode was performed by monitoring the molecular ions: the results are shown in Fig. 5b.
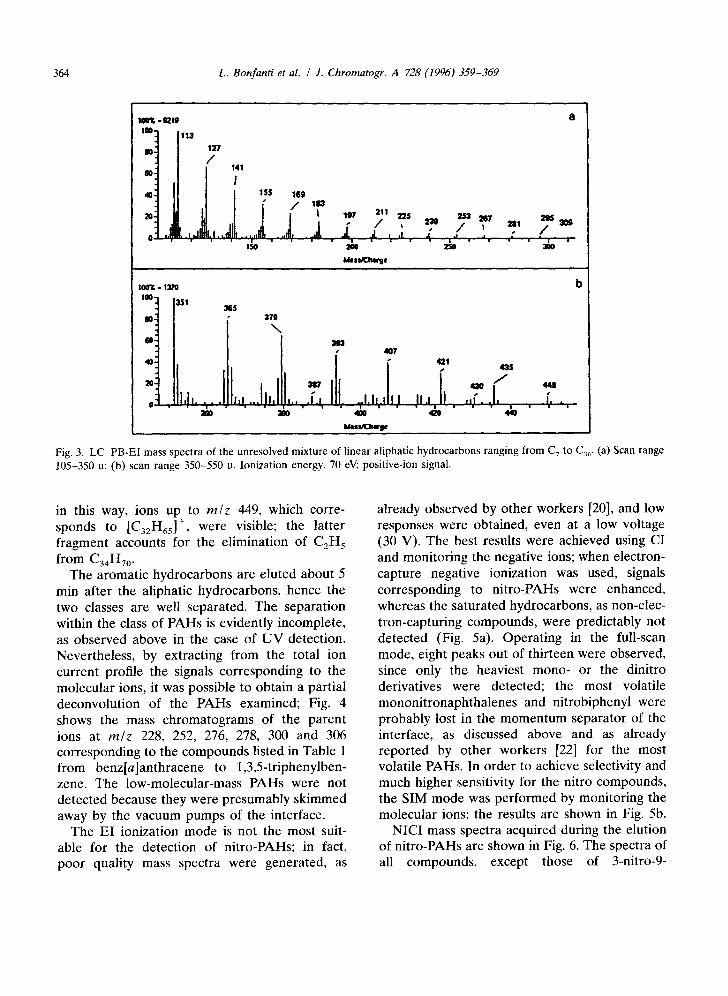
NICI mass spectra acquired during the elution of nitro-PAHs are shown in Fig. 6. The spectra of all compounds, except those of 3-nitro-9-

L. Bonfanti et al. / ]. Chromatogr. A 728 (1996) 359-369 365
Abundance 100~
50
0
100%
50
mJz 228 100%=8000
0
. . . . - o . . . . . . . . 0 2 4 6 8
mlz 252 / i
nuz 276
lo ia
,%
1 " I ] J
I I
0
mlz 278
. . . . . . . . . . . . . . . j l I . . . . . .
mlz 300
mlz 306
/
. . . A o . 2 4 6 8 10 12
Time (m~] Fig. 4. Mass chromatograms of [M] + ions in the synthetic PAH mixture. Ion profiles for benz[a]anthracene, benz[b]anthracene, triphenylene and chrysene (m/z 228), benzo[a]pyrene and benzo[e]pyrene (m/z 252), indeno[1,2,3-cd]pyrene and benzo- [ghi]perylene (rn/z 276), dibenz[a,c]anthracene and dibenz[a,h]anthracene (m/z 278), coronene (m/z 300) and 1,3,5-triphenylben- zene (m/z 306).
fluorenone and 2,2'-dinitrobiphenyl, displayed [M] ions as the base peak. In a second step, elimination of an oxygen atom was observed for 9-nitroanthracene, 2-nitrofluorene, 1-nitropyrene, 3-nitro-9-fluorenone, 1,8-dinitronaphthalene, 2,7- dinitrofluorene and 2,7-dinitro-9-fluorenone, generating peaks at m/z 207 (3%), 195 (3%), 231 (3%), 209 (3%), 202 (4%), 240 (6%) and 254 (18%), respectively. In addition, in the spectra of most of the compounds (9-nitroanth- racene, 3-nitro-9-fluorenone, 1.8-dinitronaphthal- ene, 2,7-dinitrofluorene, 2,2'-dinitrobiphenyl and 2,7-dinitro-9-fluorenone) a signal corresponding to [M--30]- was detected; this fragment can be explained by a reduction to amino derivatives of the nitro compounds occurring prior to ioniza- tion, as has been observed by Whiton [20] under the same experimental conditions, or by the release of an NO group [31]. As for the occur- rence of a reduction reaction, Whiton observed
that it is isomer specific; in fact, a peak for the reduced amine species dominates the methane NICI spectrum of 3-nitrofluoranthene, whereas in the mass spectrum of 1-nitropyrene the reduc- tion product is not present, as also observed in this work (Fig. 4). Small fragment ion signals [M - NO2]- are also present in the NICI spectra of 1,8-dinitronaphthalene (m/z 172, 1%), 2,7- dinitrofluorene (m/z 210, 1%) and 2,7-dinitro-9- fluorenone (m/z 224, 10%). Conversely, the spectrum of 2,2'-dinitrobiphenyl is characterized by a prominent peak at m/z 198 corresponding to the loss of a n N O 2 group and by the molecular ion at m/z 244 (49%); in addition, the signal at m/z 180 (17%) attributable to the [ M - 4 0 ] - anion is detected; it can be assumed that the loss of four oxygen atoms leads to the formation of an azo linkage between the nitrogens, as previ- ously reported by Stemmler and Hites [32].
Since little information is available on the use

366 L. Bonfanti et al. / J. Chromatogr. A 728 (1996) 359-369
100- 1 0 0 ~ = 64770
8O
60
xu
v,,v,,, t I
i | l l l l l l l l l l l l l l l l l l l l l l l l 5 10 15 ~
1 0 0 - 100'% = E¢166S
so-"
sos VIII Xll b
xnl
20' ' ' '25~
• Vlll [IX 4o-
• L 0 ~ 1 1 I I I I I I I I I I I I I I I I I
0 S 10 15
Time (mln.]
Fig. 5. L C - P B - M S separation of (a) PAH and nitro-PAH mixture, full-scan acquisition ( 1 0 5 - 3 5 0 u), N I C I mode, and (b) nitro-PAH mixture, SIM acquisition, NICI mode• Ions monitored: II, m / z 223; VI, m / z 211; VII , m / z 247: VI I I , m / z 225; IX, m / z 218; X, m / z 256; XII , m / z 244; XI I I , rn/z 270.
For conditions, see Experimental.
of LC-MS in the determination of nitro-PAHs, the instrumental responses in terms of detection limits, linearity and reproducibility were studied. As it is known that the signal intensity obtained
using HPLC-PB-MS is influenced by the com- position of the mobile phase, the concentration of THF was varied from 0% to 50% and the molecular ion signals were monitored in the flow- injection analysis (FIA) mode. The intensities increased when the THF content was increased, with a maximum at 30% of THF in the eluent; as an example, Fig. 7 shows replicate injections of 10 ng of 1-nitropyrene with different ratios of heptane and THF in the mobile phase; satisfac- tory reproducibility can be observed, with rela- tive standard deviations ranging from 1.5% to 8.0%.
The linearity ranges of the responses were checked for nine of the nitro-PAHs in the FIA mode, with triplicate injections at each concen- tration level; in Table 2 the detection limits, the ranges of amounts injected, the corresponding equations and the standard deviations of slopes and intercepts are reported. As can be noted, the dependences of the intensities on the injected amounts are linear in a range greater than two orders of magnitude. Table 2 also gives the detection limits (LODs) determined in the FIA mode using heptane-THF (70:30) and acquiring the molecular ion signals under NICI conditions, For some of the nitro-PAHs considered, detec- tion limits corresponding to S/N = 3, below 10 pg
Table 2
Limits of detection (LODs) and linearity between amount of nitro-PAH injected and chromatographic peak area in F I A - M S
mode"
Compound LOD Range a x 10 s b :x: 10 -2 n r
(ng) (ng)
2-Methyl-l-nitronaphthalene 0.5 1 -100 - 8.91 _+ 0.20 18
2-Nitrobiphenyl 0.7 10-100 - 15.21 _+ 0.74 15
2-Nitrofluorene 0.07 0 .1 -5 - 2 0 3 . 4 ___ 63.14 803.6 + 33.0 15
1,5 - D i n i t r o n a p h t h a l e n e 0.03 0. l - 10 1245.27 _+ 6.43 18
1,8-Dinitronaphthalene 0.003 0 .01 -5 - 9 4 3 . 4 + 306.20 4836.67 _+ 80.0 24 9-Nitroanthracene 0.005 0 .05 -10 -258•21 --- 80.64 0.76 -+ 0.02 21
3 -Ni t ro -9- f luorenone 0.007 0•05-10 - 0.93 -+ 0.01 18 2,2'-Dinitrobiphenyl 0.01 0 .05-10 -375•07 ___ 107.96 1459.0 _+ 33.5 21 1-Nitropyrene 0.001 0 .01 -10 - 9.55 _+ 0.15 21
1-Nitropyrene ~' 0.005 0 .05 -10 - 5•64 -+ 0.07 18
2,7-Dinitrofluorene 0.001 0 .01 -10 264•27 + 70.66 3.01 _+ 0.02 21 2 ,7 -Din i t ro -9- f luorenone 0.007 0 .05-10 - 253.41 + 74.85 0.15 -+ 0.03 18
0.997
0.995
0.991
0.983
0.997 0.995
0.998 0.996
0.997 1.000 1.000 0.996
" N I C I de tec t ion , S IM conditions. For ions monitored, see Experimental. Calibration fitting: y = a + bx ( p = 0.95)• b H P L C - M S mode.

L. Bonfanti et al. / J. Chromatogr. A 728 (1996) 359-369 367
100% =6377
137 207
i l I ' ' i i " I ! i i I ' ' I
100% = 1287
148 179 195 /
o , ~ t . I "1 I I I S • I I I I ' I I" " I
100% = 59475
179 21S 231 I
' , , , , , , " , I , " , ,' , , , , i 100% = 24997
181 I 209 o , , , , , , ,;,1, ;~ . k , , , . . . . ,
150 200 250 300
100% = 62650
100% = 64356
226
188 ,0~',[ 240
0 , I I i I | t t l I I I i ' l I I •' I I l I
100% = 46923
o , , . - , - , , - , , , . . . . , 150 200 250 300
Mass/Charge
Fig. 6. LC-PB-CI mass spectra (negative-ion mode) for 10/zg/ml nitro-PAH standard: (a) 9-nitroanthracene; (b) 2-nitrofluorene; (c) l-nitropyrene; (d) 3-nitro-9-fluorenone: (e) 1,8-dinitronaphthalene: (f) 2,7-dinitrofluorene; (g) 2,2'-dinitrobiphenyl- (h) 2,7- dinitro-9-fluorenone.
injected, were obtained. These results are similar to those obtained by Doerge et al. [22] and Singh et al. [23] for PAHs having four or more rings. Much higher values (0.5 and 0.7 ng, respectively) were obtained for 2-methyl-l-nitronaphthalene and 2-nitrobiphenyl. As expected, the lightest, 1-nitronaphthalene and 2-nitronaphthalene, were not detected, even on injecting /zg amounts. In the case of 1-nitropyrene, for which one of the lowest detection limits was obtained in the FIA mode, the minimum detectable amount was also determined by using the analytical column; a fivefold decrease in response was observed (Table 2).
Finally, to check for possible interferences
from the solid adsorbent usually employed for sampling emissions of fossil fuel combustion, a 30-g portion of an XAD-2-type sorbent resin was Soxhlet extracted for 24 h with toluene. XAD-2 resin is the most widely used adsorption trap for compounds unretained from filters in sampling devices, such as the US-EPA Modified Method No. 5 sampling train [33]. The extract of the XAD-2 resin was spiked with a toluene solution of nitro-PAHs at two levels (0.1 and 1 ng) and analysed under the same experimental conditions as chosen for the chromatographic separation and for PB-MS detection. As an example, Fig. 8 shows the chromatograms obtained in the single- ion acquisition mode by monitoring the molecu-
368 L. Bonfanti et al. / J. Chromatogr. A 728 (1996) 359-369
100% = 1.3e+06
100-
6O" b
O " i i , i 1- 1o 20
i ajill, [llll I I I I "/ I I I I
3O 4O
~ ( , , ~ n . )
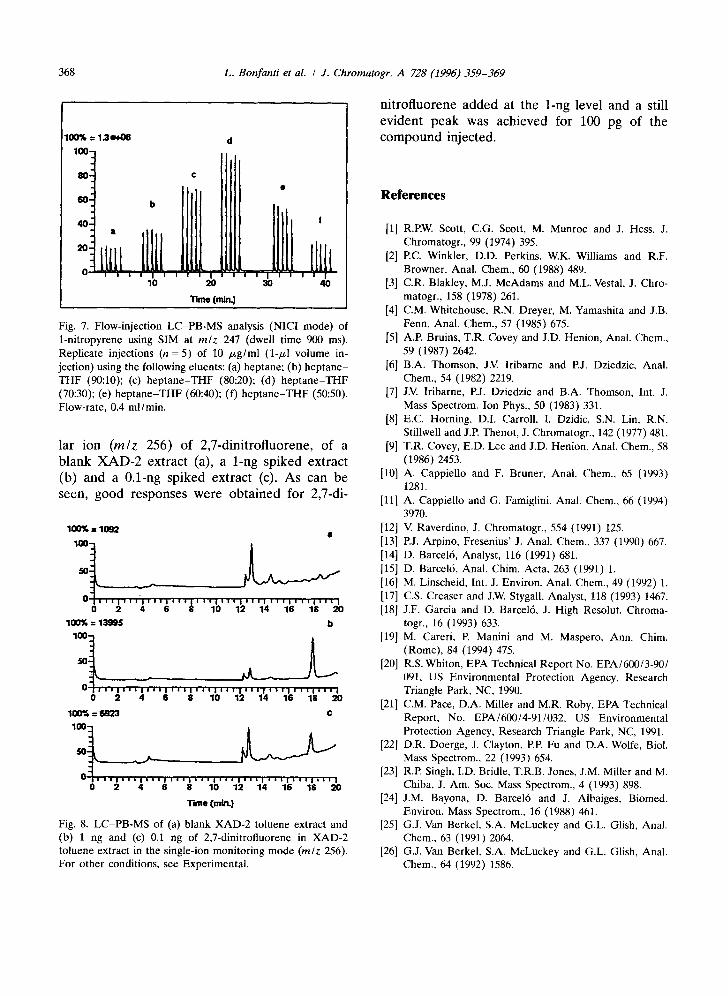
Fig. 7. Flow-injection LC-PB-MS analysis (N1CI mode) of 1-nitropyrene using SIM at m / z 247 (dwell time 900 ms). Replicate injections (n = 5) of 10 p,g/ml (1-/zl volume in- jection) using the following eluents: (a) heptane; (b) heptane- THF (90:10); (c) heptane-THF (80:20); (d) heptane-THF (70:30); (e) heptane-THF (60:40); (f) heptane-THF (50:50). Flow-rate, 0.4 ml/min.
lar ion (m/z 256) of 2,7-dinitrofluorene, of a blank XAD-2 extract (a), a 1-ng spiked extract (b) and a 0.1-ng spiked extract (c). As can be seen, good responses were obtained for 2,7-di-
100"/* = 1 0 9 2 a
- j ~ ,
0 I I I I I I l * l i l l l I I 1 | 1 a l i * l l I I I l l I I I I I I I I I 1 | I 0 2 4 6 $ 10 12 14 16 1$ 20
100% = 1 3 ~ $ b
0 I i i l i l l l l l l * | i i i i i i i i i i i i l l l l i i i i i i i l l l l i 0 2 4 6 8 10 12 14 16 18 20
1 0 ~ = lf623 C
0 | 1 a i i i i i i 1 " 1 1 1 i i i l i i i i i i i i i i i i i l l l l i i i t l l i 0 2 4 6 $ 10 12 14 16 18 2 0
Time (mira)
Fig. 8. LC-PB-MS of (a) blank XAD-2 toluene extract and (b) l ng and (c) 0.1 ng of 2,7-dinitrofluorene in XAD-2 toluene extract in the single-ion monitoring mode (m/z 256). For other conditions, see Experimental.
nitrofluorene added at the 1-ng level and a still evident peak was achieved for 100 pg of the compound injected.
References
[1] R.P.W. Scott, C.G, Scott, M. Munroe and J. Hess, J. Chromatogr., 99 (1974) 395.
[2] P.C. Winkler, D.D. Perkins, W.K. Williams and R.F. Browner, Anal. Chem., 60 (1988) 489.
[3] C.R, Blakley, M.J. McAdams and M.L. Vestal, J. Chro- matogr., 158 (1978) 261.
[4] C.M. Whitehouse, R.N. Dreyer, M. Yamashita and J,B. Fenn, Anal. Chem., 57 (1985) 675.
[5] A.P. Bruins, T.R. Covey and J.D. Henion, Anal. Chem., 59 (1987) 2642.
[6] B.A, Thomson, J.V. Iribarne and PJ. Dziedzic, Anal. Chem., 54 (1982) 2219.
[7] J.V. Iribarne, P.J. Dziedzic and B.A. Thomson, Int. J. Mass Spectrom. Ion Phys., 50 (1983) 331.
[8] E.C. Homing, D.I, Carroll, I. Dzidic, S.N. Lin, R.N. Stillwell and J.P. Thenot, J. Chromatogr., 142 (1977) 481.
[9] T.R. Covey, E.D. Lee and J.D. Henion, Anal. Chem., 58 (1986) 2453.
[10] A. Cappiello and F. Bruner, Anal. Chem., 65 (1993) 1281,
[11] A. Cappiello and G. Famiglini, Anal. Chem., 66 (1994) 3970.
[12] V. Raverdino, J. Chromatogr., 554 (1991) 125. [13] P.J. Arpino, Fresenius' J. Anal. Chem., 337 (1990) 667. [14] D. Barcel6, Analyst, 116 (1991) 681. [15] D. Barcel6, Anal. Chim. Acta, 263 (1991) 1. [16} M. Linscheid, Int. J, Environ. Anal. Chem., 49 (1992) 1. [17] C.S. Creaser and J.W. Stygall, Analyst, 118 (1993) 1467. [18] J.F. Garcia and D. Barcel6, J. High Resolut. Chroma-
togr., 16 (1993) 633. [19] M. Careri, P. Manini and M. Maspero, Ann. Chim.
(Rome), 84 (1994) 475. [20] R.S. Whiton, EPA Technical Report No. EPA/600/3-90/
091, US Environmental Protection Agency, Research Triangle Park, NC, 1990.
[21] C.M. Pace, D.A. Miller and M.R. Roby, EPA Technical Report, No. EPA/600/4-91/032, US Environmental Protection Agency, Research Triangle Park, NC, 1991.
[22] D.R. Doerge, J. Clayton, P.P. Fu and D.A. Wolfe, Biol. Mass Spectrom., 22 (1993) 654.
[23] R.P. Singh, I.D. Bridle, T.R.B. Jones, J.M. Miller and M. Chiba, J. Am. Soc. Mass Spectrom., 4 (1993) 898.
[24] J.M. Bayona, D. Barcel6 and J. Albaiges, Biomed. Environ. Mass Spectrom., 16 (1988) 461.
[25] GJ. Van Berkel, S.A. McLuckey and G.L. Glish, Anal. Chem., 63 (1991) 2064.
[26} G.J. Van Berkel, S.A. McLuckey and G.L. Glish, Anal. Chem., 64 (1992) 1586.

L. Bonfanti et al. / J. Chromatogr. A 728 (1996) 359-369 369
[27] M.T. Galceran and E. Moyano, J. Chromatogr. A, 683 (1994) 9.
[28] J.C. Harris, Z.A. Grosser, P.L. Levins, D.J. Sorlin and C.H. Summers, EPA Technical Report No. EPA/600/7- 82/048, US Environmental Protection Agency, Research Triangle Park, NC, 1982.
[29] K.G. Furton, E. Jolly and G. Pentzke, J. Chromatogr., 642 (1993) 33.
[30] S.A. Wise, L.C. Sander and W.E. May, J. Chromatogr., 642 (1993) 329.
[31] J. Arey, B. Zielinska, R. Atkinson and A.M. Winer, Atmos. Environ., 21 (1987) 1437.
[32] E.A. Stemmler and R.A. Hites, Biomed. Environ. Mass Spectrom., 17 (1988) 311.
[33] Test Method for Evaluating Solid Waste, EPA SW 846- Method 0010. US Environmental Protection Agency, Research Triangle Park, NC, 1986.