Particulate polycyclic aromatic hydrocarbons and n-alkanes in recycled paper processing operations
29
ACPD 7, 15693–15721, 2007 Particulate PAH spatial variability and aging in Mexico City D. A. Thornhill et al. Title Page Abstract Introduction Conclusions References Tables Figures Back Close Full Screen / Esc Printer-friendly Version Interactive Discussion EGU Atmos. Chem. Phys. Discuss., 7, 15693–15721, 2007 www.atmos-chem-phys-discuss.net/7/15693/2007/ © Author(s) 2007. This work is licensed under a Creative Commons License. Atmospheric Chemistry and Physics Discussions Particulate polycyclic aromatic hydrocarbon spatial variability and aging in Mexico City D. A. Thornhill 1 , S. C. Herndon 2 , T. B. Onasch 2 , E. C. Wood 2 , M. Zavala 3 , L. T. Molina 3 , J. S. Gaffney 4 , N. A. Marley 4 , and L. C. Marr 1 1 Department of Civil and Environmental Engineering, Virginia Polytechnic Institute and State University, Blacksburg, Virginia, USA 2 Aerodyne Research Inc., Billerica, Massachusetts, USA 3 Molina Center for Energy and the Environment, La Jolla, California and Massachusetts Institute of Technology, Cambridge, Massachusetts, USA 4 Department of Chemistry, University of Arkansas, Little Rock, Arkansas, USA Received: 17 October 2007 – Accepted: 24 October 2007 – Published: 9 November 2007 Correspondence to: L. C. Marr ([email protected]) 15693
-
Upload
independent -
Category
Documents
-
view
6 -
download
0
Transcript of Particulate polycyclic aromatic hydrocarbons and n-alkanes in recycled paper processing operations

ACPD7, 15693–15721, 2007
Particulate PAHspatial variability andaging in Mexico City
D. A. Thornhill et al.
Title Page
Abstract Introduction
Conclusions References
Tables Figures
J I
J I
Back Close
Full Screen / Esc
Printer-friendly Version
Interactive Discussion
EGU
Atmos. Chem. Phys. Discuss., 7, 15693–15721, 2007www.atmos-chem-phys-discuss.net/7/15693/2007/© Author(s) 2007. This work is licensedunder a Creative Commons License.
AtmosphericChemistry
and PhysicsDiscussions
Particulate polycyclic aromatichydrocarbon spatial variability and agingin Mexico CityD. A. Thornhill1, S. C. Herndon2, T. B. Onasch2, E. C. Wood2, M. Zavala3,L. T. Molina3, J. S. Gaffney4, N. A. Marley4, and L. C. Marr1
1Department of Civil and Environmental Engineering, Virginia Polytechnic Institute and StateUniversity, Blacksburg, Virginia, USA2Aerodyne Research Inc., Billerica, Massachusetts, USA3Molina Center for Energy and the Environment, La Jolla, California and MassachusettsInstitute of Technology, Cambridge, Massachusetts, USA4Department of Chemistry, University of Arkansas, Little Rock, Arkansas, USA
Received: 17 October 2007 – Accepted: 24 October 2007 – Published: 9 November 2007
Correspondence to: L. C. Marr ([email protected])
15693

ACPD7, 15693–15721, 2007
Particulate PAHspatial variability andaging in Mexico City
D. A. Thornhill et al.
Title Page
Abstract Introduction
Conclusions References
Tables Figures
J I
J I
Back Close
Full Screen / Esc
Printer-friendly Version
Interactive Discussion
EGU
Abstract
As part of the Megacities Initiative: Local and Global Research Observations (MILA-GRO) study in the Mexico City Metropolitan Area in March 2006, we measured particu-late polycyclic aromatic hydrocarbons (PAHs) and other gaseous species and particu-late properties at six locations throughout the city. The measurements were intended to5
support the following objectives: to describe spatial and temporal patterns in PAH con-centrations, to gain insight into sources and transformations of PAHs, and to quantifythe relationships between PAHs and other pollutants. Total particulate PAHs at the Insti-tuto Mexicano del Petroleo (T0 supersite) located near downtown averaged 50 ng m−3,and aerosol active surface area averaged 80 mm2 m−3. PAHs were also measured on10
board the Aerodyne Mobile Laboratory, which visited six sites encompassing a mixtureof different land uses and a range of ages of air parcels transported from the city core.Weak intersite correlations suggest that local sources are important and variable andthat exposure to PAHs cannot be represented by a single regional-scale value. Therelationships between PAHs and other pollutants suggest that a variety of sources and15
ages of particles are present. Among carbon monoxide, nitrogen oxides (NOx), andcarbon dioxide, particulate PAHs are most strongly correlated with NOx. Mexico City’sPAH-to-black carbon mass ratio of 0.01 is similar to that found on a freeway loop in theLos Angeles area and approximately 8–30 times higher than that found in other cities.Ratios also indicate that primary combustion particles are rapidly coated by secondary20
aerosol in Mexico City. If so, the lifetime of PAHs may be prolonged if the coatingprotects them against photodegradation or heterogeneous reactions.
1 Introduction
The Mexico City Metropolitan Area (MCMA) is home to some of the highest measuredconcentrations of particulate polycyclic aromatic hydrocarbons (PAHs) in the world25
(Marr et al., 2004; Velasco et al., 2004). PAHs are a class of semi-volatile compounds
15694
ACPD7, 15693–15721, 2007
Particulate PAHspatial variability andaging in Mexico City
D. A. Thornhill et al.
Title Page
Abstract Introduction
Conclusions References
Tables Figures
J I
J I
Back Close
Full Screen / Esc
Printer-friendly Version
Interactive Discussion
EGU
that are formed during combustion. Many are known or suspected carcinogens. In theircondensed form, they are associated mainly with fine particles (Eiguren-Fernandez etal., 2004; Miguel et al., 1998). PAH exposure has been associated with low birthweights (Choi et al., 2006; Tang et al., 2006) and respiratory symptoms in infants(Jedrychowski et al., 2005). Thus, the extremely high concentrations of PAHs in Mexico5
City may pose a serious health hazard and demand more complete information abouttheir spatial and temporal patterns, sources, and transformations in the atmosphere.
Aerosol surface area has also been implicated as an indicator of the health impactsof particulate pollution. Toxicology studies suggest that the dose-response relationshipis more closely tied to surface area than to mass, number, or size (Brown et al., 2001;10
Oberdorster, 2000; Stoeger et al., 2006; Tran et al., 2005). Especially for low-solubilityparticles, surface area may be a more appropriate measure of exposure (Maynard,2003). Tandem measurements of both PAHs and surface area in laboratory and fieldexperiments have been shown to discriminate between different types of combustionsources and to indicate the degree of particle aging (Bukowiecki et al., 2002; Burtscher15
et al., 1993; Marr et al., 2004; Ott and Siegmann, 2006; Siegmann et al., 1999).In April 2003, a multi-national team of scientists conducted an intensive five-week
field campaign in the Mexico City Metropolitan Area (MCMA-2003) to contribute to theunderstanding of air quality problems in megacities (Molina et al., 2007). Measure-ments of PAHs by three different techniques suggested that aerosol surface PAH con-20
centrations diminish rapidly during the mid-morning hours due to coating by secondaryaerosol in the highly photochemically active environment of Mexico City (Dzepina et al.,2007; Marr et al., 2006). However, detailed PAH measurements in 2003 were limited toa single site, so the spatial and temporal variations in their concentrations, which areimportant from a standpoint of exposure and control, are not known.25
In March 2006, an even larger field campaign in Mexico City took place to study airpollution in megacities not only at the local scale, but also at the regional and globalscales. The Megacity Initiative: Local and Global Research Observations (MILAGRO)campaign consisted of four components whose goals ranged from providing the sci-
15695
ACPD7, 15693–15721, 2007
Particulate PAHspatial variability andaging in Mexico City
D. A. Thornhill et al.
Title Page
Abstract Introduction
Conclusions References
Tables Figures
J I
J I
Back Close
Full Screen / Esc
Printer-friendly Version
Interactive Discussion
EGU
entific basis for policies that would reduce pollutant levels in Mexico City itself to de-scribing the long-range transport of pollution emitted by a megacity. As part of theMCMA-2006 ground-based component focusing on local impacts, we measured par-ticulate PAHs, aerosol active surface area (AS), and other gaseous, particulate, andmeteorological parameters at six locations throughout Mexico City. Measurements5
were situated at the Instituto Mexicano del Petroleo supersite near the city center andon board the Aerodyne Mobile Laboratory (AML). In addition to visiting the supersite,the AML also traveled to five other suburban, exurban, and rural sites (Fig. 1) thatencompassed residential, industrial, commercial, undeveloped, and mixed settings.
The objective of this study is to describe the temporal and spatial variations in PAH10
and AS concentrations in Mexico City. Furthermore, we investigate the relationshipsof ambient PAH and AS concentrations with other pollutants to gain new knowledgeabout their sources and evolution as they are transported throughout the megacityatmosphere. Transformations are important because they could affect the particles’toxicity and long-range transport impacts. We compare and contrast concentrations in15
fresh, mixed, and aged emissions by considering a busy downtown location, suburbanareas, the city outskirts, and a mountaintop location at the edge of the city. The knowl-edge gained from the study will provide the scientific basis for the development of riskassessments for exposure to these pollutants in Mexico City and the crafting of controlstrategies to reduce their emissions and health impacts.20
2 Experimental
2.1 Particle surface characterization
PAHs were measured using real-time sensors (EcoChem PAS 2000 CE) that photoion-ize particle-bound PAHs by exposing the aerosol to ultraviolet light at a wavelength of254 nm, which is specific to condensed-phase PAHs. The current generated by the25
flow of charged particles is then measured. The analyzer produces a semi-quantitative
15696

ACPD7, 15693–15721, 2007
Particulate PAHspatial variability andaging in Mexico City
D. A. Thornhill et al.
Title Page
Abstract Introduction
Conclusions References
Tables Figures
J I
J I
Back Close
Full Screen / Esc
Printer-friendly Version
Interactive Discussion
EGU
estimate of total PAHs adsorbed on particles’ surfaces at 10-s resolution with a detec-tion limit of 1 ng m−3. Although the technique does not provide speciation information,its strengths are its sensitivity and high time resolution, both of which are limitations oftraditional filter-based methods.
Aerosol active surface area, or Fuchs surface, is defined as that which is accessible5
to a molecule that might diffuse to a particle’s surface. It was measured by diffusioncharging (EcoChem DC 2000 CE). The DC analyzer generates a corona dischargewhich produces a cascade of electrons and ions that can attach to particles. As withthe photoemission aerosol sensor for PAHs, a sensitive electrometer is then used tomeasure the current generated by the flow of charged particles. The analyzer reports10
active surface area of particles smaller than ∼100 nm at 10-s resolution with a detectionlimit of 1 mm2 m−3. The simultaneous measurement of particle surface properties withthe PAS and DC sensors has been described as a technique for fingerprinting differenttypes of combustion particles (Bukowiecki et al., 2002).
All the PAH and AS analyzers were factory calibrated three months prior to the field15
campaign. At the beginning of the field campaign, we co-located and cross-calibratedthe instruments against each other while measuring ambient air in Mexico City and thenapplied the resulting correction factors to all data. To facilitate analysis using diagnosticratios and multivariate statistics, we averaged all data over a common 2- or 10-mininterval. Black carbon (BC), operationally defined as the light-absorbing component20
of particles, was measured at 2-min intervals using an aethalometer (Magee ScientificAE-3) at a wavelength of 880 nm.
2.2 Measurement sites
During the month-long MCMA field campaign in March 2006, we conducted measure-ments at the Instituto Mexicano del Petroleo (T0 supersite) and on board the Aerodyne25
Mobile Laboratory (AML), which visited six sites including the T0 supersite (Fig. 1). Thesupersite is located 10 km north of downtown Mexico City in the midst of a residential,commercial, and services area. It is surrounded by streets that are heavily traveled by
15697

ACPD7, 15693–15721, 2007
Particulate PAHspatial variability andaging in Mexico City
D. A. Thornhill et al.
Title Page
Abstract Introduction
Conclusions References
Tables Figures
J I
J I
Back Close
Full Screen / Esc
Printer-friendly Version
Interactive Discussion
EGU
light-duty vehicles and modern heavy-duty diesel buses. The PAH and AS analyzerswere situated on a building rooftop, approximately 15 m above ground level. The near-est major roads were 40 m away. To fulfill the objective of observing aged plumes, weselected the location and timing of the AML visits (Table 1) on the basis of meteorolog-ical analyses that identified sites that were generally downwind of the urban plume on5
certain days (de Foy et al., 2007).The AML was designed and built by Aerodyne Research Inc. (Kolb et al., 2004). It
was equipped with a comprehensive suite of gas and particle analyzers that measurecarbon monoxide (CO), carbon dioxide (CO2), nitric oxide (NO), nitrogen dioxide (NO2),total nitrogen oxides (NOy), speciated volatile organic compounds (VOCs), PAHs, and10
AS, among others. The AML’s PAH analyzer was identical to that used at T0. Duringthe field campaign, the AML drove to six sites and remained parked for 2–12 days ateach location (Table 1). These sites encompassed varying environments, includingresidential, commercial, industrial, undeveloped, and mixed land use areas.
The AML visited the T0 and T1 supersites, Pedregal, Pico Tres Padres, Santa Ana,15
and PEMEX (Fig. 1). Intended to represent the partially aged Mexico City plume asit drifts downwind under certain meteorological conditions, the T1 supersite is locatedat the Universidad Technologica de Tecamac ∼30 km northeast of T0. Tecamac is asuburb in the State of Mexico and has a mixture of commercial and residential areas.The supersite is within 2 km of the town center, and the nearest road is several hun-20
dred meters away. Pedregal is located ∼25 km southwest of downtown Mexico City in asuburban residential area whose roads are lightly traveled. The sampling site was theJFK Elementary School, which is also one of the routine air quality monitoring sites forthe environmental agency of the Mexico City Federal District Government. Pico TresPadres, the site of the main television transmitters for the MCMA, is an isolated moun-25
tain ∼15 km north-northeast of T0 and 3000 m above sea-level, or ∼800 m above thevalley floor. A single, mostly unused road runs up the mountain, and the surroundingarea is not well traveled. Santa Ana is located in a residential area at the southern tipof the city, ∼40 km southeast of T0. Its roads are lightly traveled. Under certain meteo-
15698

ACPD7, 15693–15721, 2007
Particulate PAHspatial variability andaging in Mexico City
D. A. Thornhill et al.
Title Page
Abstract Introduction
Conclusions References
Tables Figures
J I
J I
Back Close
Full Screen / Esc
Printer-friendly Version
Interactive Discussion
EGU
rological conditions, Santa Ana represents an outflow receptor for air pollution comingfrom the city center. Located in the extreme north of the city, the PEMEX site is in ahighly industrialized area closely situated to a major oil refinery (5 km away), cementplants, chemical factories, agricultural activities, and a power plant.
During the MCMA-2006 field campaign, air flow trajectories within the Mexico City5
basin and the fate of the urban plume were simulated, and five types of wind circulationpatterns were identified (de Foy et al., 2005; de Foy et al., 2007): Cold Surge, SouthVenting, O3-North, O3-South, and Convection (North and South). During the 31 daysof the MCMA-2006 field campaign, three were Cold Surge (14, 21, 23 March), eightwere South Venting (1–7, 13 March), five were O3-South (8, 12, 15–17 March), seven10
were O3-North (9–11, 18-20, 22 March), and eight were Convection (24–31 March).The prevailing meteorological conditions can strongly influence ambient pollutant con-centrations for given emission levels and also determine the regional impacts of theurban plume (de Foy et al., 2006).
3 Results15
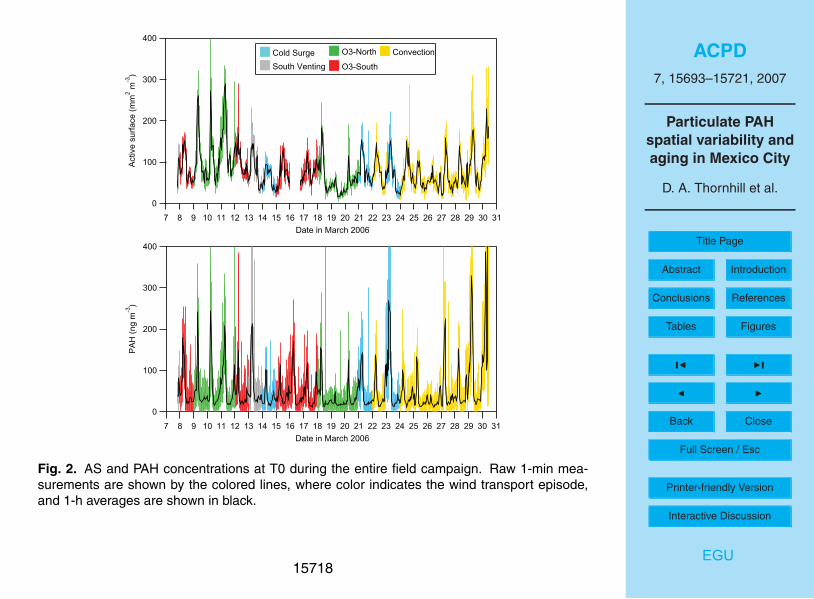
Figure 2 displays time series of AS and total particulate PAH concentrations at theT0 supersite. The raw 1-min measurements are shown by colored lines, whose colorindicates the wind transport episode defined for each day. The black lines represent1-h averages and are intended to highlight diurnal patterns in the measurements. Thehighest AS concentrations occurred on O3-North and Convection days, while the high-20
est average PAH concentrations occurred on Convection days, which are defined byweak winds aloft (de Foy et al., 2007).
Strong diurnal patterns are evident in both AS and PAHs. AS concentrations at T0 av-eraged 80 mm2 m−3 during the campaign, with a maximum 10-s value of 760 mm2 m−3
on 30 March at 09:58. Typically, concentrations rose above 100 mm2 m−3between25
06:30–08:30 and then decreased throughout the remainder of the morning and af-ternoon to ∼50 mm2 m−3. PAH concentrations averaged 50 ng m3 throughout the cam-
15699

ACPD7, 15693–15721, 2007
Particulate PAHspatial variability andaging in Mexico City
D. A. Thornhill et al.
Title Page
Abstract Introduction
Conclusions References
Tables Figures
J I
J I
Back Close
Full Screen / Esc
Printer-friendly Version
Interactive Discussion
EGU
paign with a maximum value of 3660 ng m3on 30 March at 10:02, within minutes of themaximum AS observation. During the morning rush hour, PAH concentrations gen-erally rose to a maximum of ∼250 ng m−3 between 06:30–08:30 and then decreasedthroughout the remainder of the morning and afternoon to ∼20 ng m−3. The daily min-ima in AS were more variable than in PAHs. Overnight concentrations rose as high as5
75 ng m3. The daily maxima were nearly twice as high as observed at a site 17 km tothe southeast in 2003 (Marr et al., 2006) and 1.5 times as high as observed at a site13 km to the southwest in 2003 and 2005 (Baumgardner et al., 2007). In all three stud-ies, the PAH concentration measured by aerosol photoionization falls off more rapidlybetween 08:00–10:00 than do concentrations of other primary pollutants.10
Table 1 summarizes PAH concentrations at each site visited by the AML in chronolog-ical order. The highest average PAH concentration was observed at T0 and the lowestat Pico Tres Padres and Santa Ana, the mountaintop and southern outflow sites, re-spectively. The maximum PAH concentration occurred at T0. Figure 3 shows PAH timeseries at each site. At Pedregal, PAH concentrations were highest between 06:00–15
08:00 on Monday 6 March. They were slightly elevated in the hours before midnighton the evening of Saturday 4 March. These periods probably correspond to the timesof heaviest traffic and lowest boundary layer height. At Pico Tres Padres, PAH concen-trations remained below 10 ng m−3, even though fine particulate mass concentrations(PM2.5), not shown, routinely rose at approximately 10:00 each day, as the boundary20
layer lifted up past the site. At T1, PAH concentrations increased to 100–200 ng m−3 inthe morning hours, well before 06:00.
Santa Ana lies at the southern edge of the basin, and here PAH concentrations werealways less than 30 ng m−3. Cold Surge conditions, in which the wind flushes from thecenter of the basin toward the south and past the site late into the evening (de Foy25
et al., 2007), prevailed on 23 March and may have contributed to the increase in PAHconcentrations centered around midnight of the 24th. At PEMEX, concentrations didnot exceed 80 ng m−3 and the temporal patterns were irregular. The AML’s observationperiod at T0 coincided with the highest observed concentrations of the field campaign.
15700

ACPD7, 15693–15721, 2007
Particulate PAHspatial variability andaging in Mexico City
D. A. Thornhill et al.
Title Page
Abstract Introduction
Conclusions References
Tables Figures
J I
J I
Back Close
Full Screen / Esc
Printer-friendly Version
Interactive Discussion
EGU
Table 2 displays the relationships between PAHs and carbon monoxide (CO), carbondioxide (CO2), and total nitrogen oxides (NOy) measured by the AML. The slope and
standard error of the least-squares linear regression and correlation coefficient (R2)are shown in the table. For CO, the correlations are weak everywhere except Pedregaland T1. PAHs are strongly correlated with NOy at T1, PEMEX, and T0, and weakly5
correlated with NOy at the other sites. The regressions between PAHs and true NOxare not significantly different from those with NOy, so henceforth, we will refer to therelationship as with NOx. This notation will facilitate comparison with other studies, themajority of which use chemiluminescence and report results as NOx. The slopes arehighest and similar at T1 and T0, which are also the most urbanized sites. For CO2,10
the correlations are strongest at T0 and weak elsewhere. All correlation factors arerelatively weak at Pico Tres Padres (R2≤0.26) and Santa Ana (R2≤0.44).
The simultaneous measurement of PAHs at T0 and other sites allows examinationof their spatial variability in the MCMA. Figure 1 presents the Pearson correlation coef-ficients of 10-min PAH concentrations at various sites visited by the AML against those15
measured continuously at the T0 supersite during periods of simultaneous measure-ments. A correlation factor could not be calculated for Pedregal because monitoringat T0 had not yet begun. Of course, the correlation was strongest when the AML wasparked at T0. It was moderate at T1 and poor at all other sites.
The relationship between PAHs and AS has been shown to be related to the source20
type and aging of the particles (Bukowiecki et al., 2002; Marr et al., 2004; Siegmann etal., 1999). Figure 4 illustrates the relationship between PAH and AS (10-min averages)at T0. The color indicates the time of day of each measurement. There is consider-able scatter in the data; the correlation is fair, with R2=0.45. For the subset of databetween 05:00–07:00, just before sunrise, the equation of the line is PAH=1.17×AS–25
3.20 with R2=0.58. For the subset of data between 12:00–14:00, the equation of theline is PAH=0.03×AS+16.33 with R2=0.01. Figure 4 shows that higher PAH/AS ratios,i.e. those points falling above the regression line, and those with high absolute PAH andAS values, tend to occur during the early morning hours. The slope of the regression
15701
ACPD7, 15693–15721, 2007
Particulate PAHspatial variability andaging in Mexico City
D. A. Thornhill et al.
Title Page
Abstract Introduction
Conclusions References
Tables Figures
J I
J I
Back Close
Full Screen / Esc
Printer-friendly Version
Interactive Discussion
EGU
line is 39 times higher in the morning compared to the afternoon. There is no clearrelationship between the ratio and wind transport episode.
Figure 4 also shows PAHs versus BC, classified the time of day. PAHs and BC areexpected to be correlated since both originate from combustion sources. For all times,the correlation between PAHs and BC is stronger (R2=0.77) than between PAHs and5
AS, and the slope of the line, 11.7±0.1 ngµg−1, indicates that PAHs are 1% of BC bymass. As with PAH/AS, higher PAH/BC ratios tend to occur during the morning rushhour period. As the day progresses, PAH/BC ratios tend to decrease and are lowestbetween 12:00–18:00. The equation of the regression line between 05:00–07:00 isPAH=14.4×BC–13.8 with R2=0.82. Later in the afternoon, between 12:00–14:00, the10
relationship is PAH=0.76×BC+16.2 with R2=0.02. The slope is 19 times higher in themorning. Table 3 contrasts PAH/BC ratios in Mexico City with those measured in threeother cities, where the same aerosol photoionization method was used to measurePAHs. The mass ratio of PAHs to BC in Mexico City is similar to that measured alonga freeway loop in the Los Angeles area and approximately 8–30 times higher than15
in diluted vehicle exhaust in Ogden, Utah and ambient air in Fresno, California. Thecorrelation factors between PAHs and BC are similar in all cities.
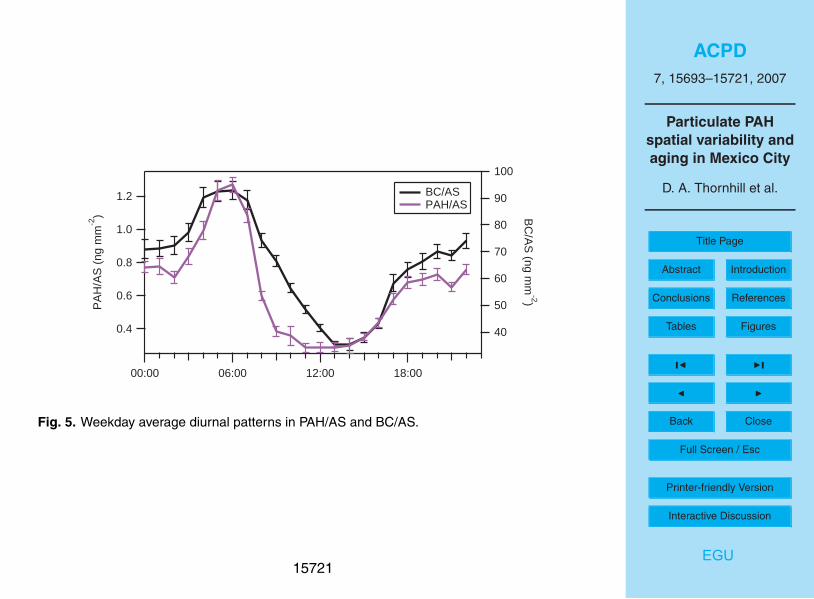
Figure 5 shows average weekday diurnal patterns of the ratios PAH/AS and BC/AS.The latter is an indicator of the fraction of particles that are of combustion origin at anytime (Burtscher et al., 1993), as BC is expected to be minimally reactive. The BC/AS20
ratio peaks around the morning rush hour and then falls off steadily throughout thelate morning and early afternoon. During this period, growth of secondary aerosol inMexico City is considerable (Molina et al., 2007; Salcedo et al., 2006; Volkamer et al.,2006) and contributes to AS but not BC. Even though both PAHs and BC are of com-bustion origin, their ratios to AS diverge between 07:00–12:00, with PAH/AS falling off25
more rapidly than BC/AS. Whether this observation is due to chemical transformations,physical coating of the particles, or other mechanisms is discussed below.
15702

ACPD7, 15693–15721, 2007
Particulate PAHspatial variability andaging in Mexico City
D. A. Thornhill et al.
Title Page
Abstract Introduction
Conclusions References
Tables Figures
J I
J I
Back Close
Full Screen / Esc
Printer-friendly Version
Interactive Discussion
EGU
4 Discussion
4.1 PAH and AS concentrations, sources, and aging
PAH concentrations may vary considerably between cities due to differences in emis-sion sources and meteorological conditions. Mexico City’s PAH concentrations aresubstantially higher than those measured in other large cities. Eiguren-Fernandez et5
al. (2004) measured total particulate PAH concentrations of 0.5 ng m−3 and 2 ng m−3
in rural and urban areas of Los Angeles, respectively. In contrast, concentrations inrural and urban areas of Mexico City are nearly 25 times higher. In Hong Kong, par-ticulate PAH concentrations ranged from 0.41 ng m−3 to 48 ng m−3 in rural to urbanareas (Zheng and Fang, 2000). These values compare more closely with Mexico City;10
however, PAH concentrations in Mexico City are still higher. PAHs have also been mea-sured in different environments of Greece (Mantis et al., 2005), where total particulateconcentrations ranged from 2 ng m−3 to 52 ng m−3 in rural to urban areas. Again, thesevalues compare more closely with the results seen in Mexico City, but the values forMexico City are higher yet.15
The database of measurements of ambient AS in other cities is considerably smaller.Mexico City’s mean AS concentration of 80 mm2 m−3 at T0 is comparable to that foundin Los Angeles, where mean concentrations of 69 and 53 mm2 m−3 were recorded attwo ambient locations (Ntziachristos et al., 2007). AS in a residential area of RedwoodCity ranged between 40–300 mm2 m−3, with the higher concentrations attributed to20
wood burning and fireplaces in the neighborhood (Ott and Siegmann, 2006). It appearsthat while particulate PAH loading in Mexico City is higher than in many other cities, itsaerosol surface area loading is not comparatively extraordinary.
Vehicular traffic has been recognized as the major contributor to PAH emissions inurban areas (Kittleson et al., 2004; Lee et al., 1995), and therefore it is not surprising25
that the highest average PAH and AS concentrations are found at T0, where traffic isheaviest. The timing of PAH and AS peaks at the more urban locations corresponds toperiods of rush hour traffic. Burtscher et al. (1993) also found the highest PAH and AS
15703
ACPD7, 15693–15721, 2007
Particulate PAHspatial variability andaging in Mexico City
D. A. Thornhill et al.
Title Page
Abstract Introduction
Conclusions References
Tables Figures
J I
J I
Back Close
Full Screen / Esc
Printer-friendly Version
Interactive Discussion
EGU
values in Zurich to occur during rush hour and ascribed them to motor vehicles.At some locations, including Pedregal, T1, and PEMEX, increases in PAH concentra-
tions occur at nighttime between 23:00 and 04:00 (Fig. 3). The increase in PAHs maybe due to transport of particles emitted earlier in the evening during times of high trafficdensity, or it may indicate the presence of other nighttime sources. Speciation mea-5
surements in 2003 suggest that wood and trash burning contribute to PAHs observedat night (Marr et al., 2006). The impact of emissions at nighttime can be magnified be-cause of stable atmospheric conditions. Some industries are thought to switch to usingdirtier fuels and processes at night, when enforcement of regulations is less likely. Fur-thermore, at T1 during the first two weeks of the field campaign, Doran et al. (2007)10
observed increased organic and elemental carbon during nighttime hours with peakvalues attained in the morning hours near sunrise. A similar pattern occurred at T1 on21 March. The temporal variations imply that at night a buildup of pollution from nearbyurban sources is occurring, followed by a subsequent dilution during the next morningas the boundary layer expands.15
Spatial and temporal patterns in concentrations indicate not only potential sources ofPAHs but also the degree of atmospheric processing the particles undergo. As emis-sions are transported, there are subject to dilution and other transformations. Thisbehavior is supported by Fig. 3, which shows that in general, higher PAH concentra-tions occur at T0 and PEMEX, which are dominated by fresh emissions. Lower con-20
centrations occur at Pico Tres Padres and Santa Ana, which are receptor sites whereemissions have undergone dilution and aging by the time they arrive. Intermediateconcentrations occur at T1 and Pedregal, which lie between the two extremes.
PAHs as detected by the surface-specific photoemission method may diminish dueto coating by secondary aerosol, and Figs. 4 and 5 support this hypothesis. PAH loss25
by photodegradation, heterogeneous reactions, or volatilization is less likely becausemeasurements in 2003 showed that even when surface-bound PAHs diminish, PAHsare still detected by aerosol mass spectrometry, a method that is able to detect themanywhere in the particles, not just on the surface (Marr et al., 2006). An increase
15704

ACPD7, 15693–15721, 2007
Particulate PAHspatial variability andaging in Mexico City
D. A. Thornhill et al.
Title Page
Abstract Introduction
Conclusions References
Tables Figures
J I
J I
Back Close
Full Screen / Esc
Printer-friendly Version
Interactive Discussion
EGU
in secondary aerosol in the mid-morning hours contributes to aerosol surface areaand is expected to cause a reduction in both PAH/AS and BC/AS ratios, but it doesnot explain the decrease in PAH/BC ratio (Fig. 4) or the divergence between the two(Fig. 5). Studies using a variety of techniques have shown that primary combustionparticles are rapidly coated by secondary aerosol within a few hours in Mexico City5
(Baumgardner et al., 2007; Dzepina et al., 2007; Johnson et al., 2005; Marr et al., 2006;Salcedo et al., 2006). This finding could explain the temporal patterns observed inPAH/AS and PAH/BC ratios because secondary aerosol formation would not increasethe total mass of PAHs but could contribute to it being coated. After condensationof secondary aerosol on primary combustion particles, the PAHs on the surfaces of10
primary particles would no longer be detectable by the photoionization method, butBC would remain detectable by the light absorption method. In contrast, the ratios ofPAH/AS and PAH/BC were found to be much more constant throughout the day at aport south of Los Angeles (Polidori et al., 2007). The difference may be due to theupwind location of this site, which experiences relatively clean inflow from the Pacific15
Ocean and thus less secondary aerosol formation.Pico Tres Padres is of special interest because it sits 800 m above the valley floor,
and during the morning hours, it is above the mixing (boundary) layer that containsfreshly emitted pollutants. Its diurnal patterns of particulate mass loading differ fromthose at sites on the valley floor. PM2.5 concentrations increase around 10:00 each20
day, coinciding with the rising of the boundary layer, verified visually, up to the AML’slocation on the mountain. Particle surface PAH concentrations, however, do not riseconcomitantly, further supporting the proposition that initially fresh combustion emis-sions from the valley below have undergone transformations that inhibit the detectionof surface-bound PAHs.25
The rapid coating of primary combustion particles in the megacity environment couldhave important implications for PAH longevity in the atmosphere. Experiments haveshown that particulate PAHs can decay in the presence of sunlight (Kamens et al.,1988) and can undergo heterogeneous reactions with the hydroxyl radical, ozone, and
15705
ACPD7, 15693–15721, 2007
Particulate PAHspatial variability andaging in Mexico City
D. A. Thornhill et al.
Title Page
Abstract Introduction
Conclusions References
Tables Figures
J I
J I
Back Close
Full Screen / Esc
Printer-friendly Version
Interactive Discussion
EGU
NOx (Esteve et al., 2006; Kwamena et al., 2007; Molina et al., 2004). However, if thePAHs are coated by secondary aerosol, they may be less susceptible to degradationand may persist long enough to be transported to remote areas.
4.2 Intersite correlations of PAH and AS concentrations
Figure 1 shows that intersite correlation coefficients calculated for other sites versus5
T0 are quite weak, except for T1. While strong intersite correlations would indicatespatially uniform emission patterns and sources and regional-scale mixing of pollu-tants, the results for Mexico City suggest that PAHs vary considerably in space. Con-centrations at individual sites are largely independent of one another and are insteaddominated by local sources, and/or fresh combustion particles have been sufficiently10
transformed that surface-bound PAHs are no longer present by the time the particlesreach other sites. This conclusion is further supported by the lack of a consistent re-lationship between PAH and AS concentrations and wind transport episodes (Fig. 2);regional-scale meteorological patterns do not have a strong effect on concentrations.
Mantis et al. (2005) and Siegmann et al. (1999) report generally higher correla-15
tion coefficients for their intersite comparisons during studies of PAHs in Greece andSwitzerland, respectively. The study in the Greater Athens area of Greece found anintersite correlation of r=0.61 between two urban locations, r=0.76 between an ur-ban location and a background location, and r=0.57 between an urban location and amixed-urban industrial location. An important implication for risk assessment studies20
is that a single monitoring site in Mexico City will not adequately represent the popula-tion’s exposure.
4.3 Correlation of PAHs with AS, NOx, CO2, CO, and BC
The ratio of PAH to AS concentrations has been described as a fingerprint for differenttypes of combustion particles (Bukowiecki et al., 2002; Matter et al., 1999; Siegmann et25
al., 1999). The relationship between these parameters provides a qualitative means of
15706
ACPD7, 15693–15721, 2007
Particulate PAHspatial variability andaging in Mexico City
D. A. Thornhill et al.
Title Page
Abstract Introduction
Conclusions References
Tables Figures
J I
J I
Back Close
Full Screen / Esc
Printer-friendly Version
Interactive Discussion
EGU
identifying different sources and describing the physical and chemical properties of par-ticles. In contrast to previous studies which have shown tighter relationships betweenPAHs and AS for specific sources such as diesel exhaust, roadway vehicle emissions,candles, fires, and cigarettes (Bukowiecki et al., 2002; Marr et al., 2004; Siegmann etal., 1999), the relationship shown in Fig. 4 contains significantly more scatter. For a5
single source, the relationship between PAHs and AS is expected to be linear with acharacteristic slope. The spread of the data indicates that the aerosol represents amixture of different sources and particles of different ages. Ambient measurements incomplex environments are expected to produce such results.
The stronger correlation of PAHs with NOx, rather than with CO and CO2 (Table 2),10
likely reflects the importance of diesel engines as sources of both PAH and NOx emis-sions (Harley et al., 2005; Marr et al., 1999). CO is emitted mainly by gasoline-poweredvehicles, which emit far lower particulate PAHs than do diesel engines (Marr et al.,2002). Weak positive correlations between PAHs and NOx have also been reported inBrisbane, Australia (Muller et al., 1998).15
Pollutant ratios can be useful for estimating emissions and for describing the evolu-tion of source strengths over decadal time scales (Marr et al., 2002). The mass ratioof particulate PAH/NOx measured along roads during the MCMA-2003 field campaignwas 4.7±5.9×10⁻⁴ (Jiang et al., 2005). During the MCMA-2006 field campaign, thisratio was 1.09±0.05 ng m−3 ppb−1, or 7.7±0.4×10⁻⁴ in mass terms, at T0 (and simi-20
lar at the other urbanized sites T1 and PEMEX). The ratio in 2006 has not changedsignificantly from that measured in 2003, within the precision of the methods used.
While the mass ratio of PAH/BC at T0 is similar to that observed along a freeway loopin the Los Angeles area (Westerdahl et al., 2005), lower ratios were found in ambientair in Fresno, California and diluted vehicle exhaust in Ogden, Utah (Arnott et al., 2005).25
The similarity in PAH/BC between T0 and the Los Angeles freeway may indicate thatvehicular sources are similar in the two locations and dominate measurements at T0or alternatively, if particles have aged slightly by the time they reach the elevated T0measurement site, may indicate that the PAH/BC ratio in fresh emissions in Mexico City
15707
ACPD7, 15693–15721, 2007
Particulate PAHspatial variability andaging in Mexico City
D. A. Thornhill et al.
Title Page
Abstract Introduction
Conclusions References
Tables Figures
J I
J I
Back Close
Full Screen / Esc
Printer-friendly Version
Interactive Discussion
EGU
is actually higher than in Los Angeles. The ambient ratio in Mexico City is nearly 10times higher than in Fresno. Direct measurements of exhaust are needed to determinewhether particulate emissions from Mexico City’s vehicles contain higher amounts ofPAHs than in the U.S. If so, PAH emissions could be minimized by reducing the PAHcontent of fuels (Marr et al., 1999).5
5 Conclusions
It is apparent that PAH pollution is a major problem in the more heavily trafficked areasof the MCMA. PAH concentrations near downtown exhibit a consistent diurnal patternand routinely exceed 200 ng m−3 during the morning rush hour. Weak correlations be-tween PAH and AS are indicative of the wide variety of sources and ages of particles10
present in Mexico City. PAH concentrations are poorly correlated in space, and there-fore PAHs should not be treated as a regional-scale pollutant. An important implicationof this result is that for risk assessment studies, a single monitoring site will not ade-quately represent an individual’s exposure. The stronger correlation of PAHs with NOx,rather than with CO and CO2, probably reflects the importance of diesel engines as15
sources of both PAH and NOx emissions. Mexico City’s PAH/BC ratio is similar to thatfound along freeways in Los Angeles and 8–30 times higher than that found in twoother cities. Aging of primary combustion particles by coating with secondary aerosolappears to result in a decrease in surface PAH/AS and PAH/BC ratios over the courseof the day and may prolong the lifetime of PAHs in the atmosphere.20
Acknowledgements. We thank C. Mazzoleni, E. Deustua, X. Yao, M. Cubison, and M. Alexan-der for their support; the managers of the supersites (T0 and T1) for the use of their facilities;and C. Kolb for the use of the Aerodyne Mobile Laboratory. Financial support was provided bythe U.S. National Science Foundation (ATM-0528227) and the U.S. Department of Energy (DE-FG02-05ER63980). This study was also supported by the Molina Center for Strategic Studies25
in Energy and the Environment. D. Thornhill is supported by a Fulbright Fellowship.
15708
ACPD7, 15693–15721, 2007
Particulate PAHspatial variability andaging in Mexico City
D. A. Thornhill et al.
Title Page
Abstract Introduction
Conclusions References
Tables Figures
J I
J I
Back Close
Full Screen / Esc
Printer-friendly Version
Interactive Discussion
EGU
References
Arnott, W. P., Zielinska, B., Rogers, C. F., Sagebiel, J., Park, K. H., Chow, J., Moosmuller, H.,Watson, J. G., Kelly, K., Wagner, D., Sarofim, A., Lighty, J., and Palmer, G.: Evaluation of1047-nm photoacoustic instruments and photoelectric aerosol sensors in source-sampling ofblack carbon aerosol and particle-bound PAHs from gasoline and diesel powered vehicles,5
Environ. Sci. Technol., 39, 5398–5406, 2005.Baumgardner, D., Kok, G. L., and Raga, G. B.: On the diurnal variability of particle properties
related to light absorbing carbon in Mexico City, Atmos. Chem. Phys., 7, 2517–2526, 2007,http://www.atmos-chem-phys.net/7/2517/2007/.
Brown, D. M., Wilson, M. R., MacNee, W., Stone, V., and Donaldson, K.: Size-dependent10
proinflammatory effects of ultrafine polystyrene particles: a role for surface area and oxidativestress in the enhanced activity of ultrafines, Toxicol. Appl. Pharmacol., 175, 191–199, 2001.
Bukowiecki, N., Kittleson, D. B., Watts, W. F., Burtscher, H., Weingartner, E., and Baltensperger,U.: Real-time characterization of ultrafine and accumulation mode particles in ambient com-bustion aerosols, J. Aerosol Sci., 33, 1139–1154, 2002.15
Burtscher, H., Leonardi, A., Steiner, D., Baltensperger, U., and Weber, A.: Aging of combustionparticles in the atmosphere – results from a field study in Zurich, Water Air Soil Poll., 68,137–147, 1993.
Choi, H., Jedrychowski, W., Spengler, J., Camann, D. E., Whyatt, R. M., Rauh, V., Tsai, W., andPerera, F. P.: International studies of prenatal exposure to polycyclic aromatic hydrocarbons20
and fetal growth, Environ. Health Perspectives, 114, 1744–1750, 2006.de Foy, B., Caetano, E., Magana, V., Zitacuaro, A., Cardenas, B., Retama, A., Ramos, R.,
Molina, L. T., and Molina, M. J.: Mexico City basin wind circulation during the MCMA-2003field campaign, Atmos. Chem. Phys., 5, 2267–2288, 2005,http://www.atmos-chem-phys.net/5/2267/2005/.25
de Foy, B., Fast, J. D., Paech, S. J., Phillips, D., Walters, J. T., Coulter, R. L., Martin, T. J.,Pekour, M. S., Shaw, W. J., Kastendeuch, P. P., Marley, N. A., Retama, A., and Molina,L. T.: Basin-scale wind transport during the MILAGRO field campaign and comparison toclimatology using cluster analysis, Atmos. Chem. Phys. Discuss., 7, 13 035–13 076, 2007.
de Foy, B., Varela, J. R., Molina, L. T., and Molina, M. J.: Rapid ventilation of the Mexico City30
basin and regional fate of the urban plume, Atmos. Chem. Phys., 6, 2321–2335, 2006,http://www.atmos-chem-phys.net/6/2321/2006/.
15709

ACPD7, 15693–15721, 2007
Particulate PAHspatial variability andaging in Mexico City
D. A. Thornhill et al.
Title Page
Abstract Introduction
Conclusions References
Tables Figures
J I
J I
Back Close
Full Screen / Esc
Printer-friendly Version
Interactive Discussion
EGU
Doran, J. C., Barnard, J. C., Arnott, W. P., Cary, R., Coulter, R., Fast, J. D., Kassianov, E. I.,Kleinman, L., Laulainen, N. S., Martin, T., Paredes-Miranda, G., Pekour, M. S., Shaw, W.J., Smith, D. F., Springston, S. R., and Yu, X.-Y.: The T1-T2 study: evolution of aerosolproperties downwind of Mexico City, Atmos. Chem. Phys., 7, 1585–1598, 2007,http://www.atmos-chem-phys.net/7/1585/2007/.5
Dzepina, K., Arey, J., Marr, L. C., Worsnop, D. R., Salcedo, D., Zhang, Q., Onasch, T. B.,Molina, L. T., Molina, M. J., and Jimenez, J. L.: Detection of particle-phase polycyclic aro-matic hydrocarbons in Mexico City using an aerosol mass spectrometer, Internat. J. MassSpectrometry, 263, 152–170, 2007.
Eiguren-Fernandez, A., Miguel, A. H., Froines, J. R., Thurairatnam, S., and Avol, E. L.: Sea-10
sonal and spatial variation of polycyclic aromatic hydrocarbons in vapor-phase and PM2.5 insouthern California and rural communities, Aerosol Sci. Technol., 38, 447–455, 2004.
Esteve, W., Budzinski, H., and Villenave, E.: Relative rate constants for the heterogeneousreactions of NO2 and OH radicals with polycyclic aromatic hydrocarbons adsorbed on car-bonaceous particles. Part 2: PAHs adsorbed on diesel particulate exhaust SRM 1650a,15
Atmos. Environ., 40, 201–211, 2006.Harley, R. A., Marr, L. C., Lehner, J. K., and Giddings, S. N.: Changes in motor vehicle emis-
sions on diurnal to decadal time scales and effects on atmospheric composition, Environ.Sci. Technol., 39, 5356–5362, 2005.
Jedrychowski, W., Galas, A., Pac, A., Flak, E., Camann, D., Rauh, V., and Perera, F.: Prenatal20
ambient air exposure to polycyclic aromatic hydrocarbons and the occurrence of respiratorysymptoms over the first year of life, European J. Epidemiol., 20, 775–782, 2005.
Jiang, M., Marr, L. C., Dunlea, E. J., Herndon, S. C., Jayne, J. T., Kolb, C. E., Knighton, W. B.,Rogers, T. M., Zavala, M., Molina, L. T., and Molina, M. J.: Mobile laboratory measurementsof black carbon, polycyclic aromatic hydrocarbons and other vehicle emissions in Mexico25
City, Atmos. Chem. Phys., 5, 3377–3387, 2005,http://www.atmos-chem-phys.net/5/3377/2005/.
Johnson, K. S., Zuberi, B., Molina, L. T., Molina, M. J., Iedema, M. J., Cowin, J. P., Gaspar, D.J., Wang, C., and Laskin, A.: Processing of soot in an urban environment: case study fromthe Mexico City Metropolitan Area, Atmos. Chem. Phys., 5, 3033–3043, 2005,30
http://www.atmos-chem-phys.net/5/3033/2005/.Kamens, R. M., Guo, Z., Fulcher, J. N., and Bell, D. A.: Influence of humidity, sunlight, and tem-
perature on the daytime decay of polyaromatic hydrocarbons on atmospheric soot particles,
15710
ACPD7, 15693–15721, 2007
Particulate PAHspatial variability andaging in Mexico City
D. A. Thornhill et al.
Title Page
Abstract Introduction
Conclusions References
Tables Figures
J I
J I
Back Close
Full Screen / Esc
Printer-friendly Version
Interactive Discussion
EGU
Environ. Sci. Technol., 22, 103–108, 1988.Kittleson, D. B., Watts, W. F., and Johnson, J. P.: Nanoparticle emissions on Minnesota high-
ways, Atmos. Environ., 38, 9–19, 2004.Kolb, C. E., Herndon, S. C., McManus, J. B., Shorter, J. H., Zahniser, M. S., Nelson, D. D.,
Jayne, J. T., Carnagaranta, M. R., and Worsnop, D. R.: Mobile laboratory with rapid response5
instruments for real-time measurements of urban and regional trace gas and particulatedistributions and emission source characteristics, Environ. Sci. Technol., 38, 5694–5703,2004.
Kwamena, N.-O. A., Staikova, M. G., Donaldson, D. J., George, I. J., and Abbatt, J. P. D.: Roleof the aerosol substrate in the heterogeneous ozonation reactions of surface-bound PAHs,10
J. Physical Chem. A, 111, 11 050–11 058, 2007.Lee, W. J., Wang, Y. F., Lin, T. C., Chen, Y. Y., Lin, W. C., Ku, C. C., and Cheng, J. T.: PAH
characteristics in the ambient air of traffic-source, Sci. Total Environ., 159, 185–200, 1995.Mantis, J., Chaloulakou, A., and Samara, C.: PM10-bound polycyclic aromatic hydrocarbons
(PAHs) in the greater area of Athens, Greece, Chemosphere, 59, 593–604, 2005.15
Marr, L. C., Black, D. R., and Harley, R. A.: Formation of photochemical air pollution in centralCalifornia 1. Development of a revised motor vehicle emission inventory, J. Geophys. Res.,107, 4047, doi:10.1029/2001JD000689, 2002.
Marr, L. C., Dzepina, K., Jimenez, J. L., Reisen, F., Bethel, H. L., Arey, J., Gaffney, J. S.,Marley, N. A., Molina, L. T., and Molina, M. J.: Sources and transformations of particle-20
bound polycyclic aromatic hydrocarbons in Mexico City, Atmos. Chem. Phys., 6, 1733–1745,2006,http://www.atmos-chem-phys.net/6/1733/2006/.
Marr, L. C., Grogan, L. A., Wohrnschimmel, H., Molina, L. T., Molina, M. J., Smith, T. J., andGarshick, E.: Vehicle traffic as a source of particulate polycyclic aromatic hydrocarbon expo-25
sure in Mexico City, Environ. Sci. Technol., 38, 2584–2592, 2004.Marr, L. C., Kirchstetter, T. W., Harley, R. A., Miguel, A. H., Hering, S. V., and Hammond, S.
K.: Characterization of polycyclic aromatic hydrocarbons in motor vehicle fuels and exhaustemissions, Environ. Sci. Technol., 33, 3091–3099, 1999.
Matter, U., Siegmann, H. C., and Burtscher, H.: Dynamic field measurements of submicron30
particles from diesel engines, Environ. Sci. Technol., 33, 1946–1952, 1999.Maynard, A. D.: Estimating aerosol surface area from number and mass concentration mea-
surements, Annals of Occupational Hygiene, 47, 123–144, 2003.
15711
ACPD7, 15693–15721, 2007
Particulate PAHspatial variability andaging in Mexico City
D. A. Thornhill et al.
Title Page
Abstract Introduction
Conclusions References
Tables Figures
J I
J I
Back Close
Full Screen / Esc
Printer-friendly Version
Interactive Discussion
EGU
Miguel, A. H., Kirchsetter, T. W., Harley, R. A., and Hering, S. V.: On-road emissions of partic-ulate polycyclic aromatic hydrocarbons and black carbon from gasoline and diesel vehicles,Environ. Sci. Technol., 32, 450–455, 1998.
Molina, L. T., Kolb, C. E., de Foy, B., Lamb, B. K., Brune, W. H., Jimenez, J. L., Ramos-Villegas, R., Sarmiento, J., Paramo-Figueroa, V. H., Cardenas, B., Gutierrez-Avedoy, V., and5
Molina, M. J.: Air quality in North America’s most populous city – overview of the MCMA-2003 campaign, Atmos. Chem. Phys., 7, 2447–2473, 2007,http://www.atmos-chem-phys.net/7/2447/2007/.
Molina, M. J., Ivanov, A. V., Trakhtenberg, S., and Molina, L. T.: Atmospheric evolution oforganic aerosol, Geophys. Res. Lett., 31, L22104, doi:10.1029/2004GL020910, 2004.10
Muller, J. F., Hawker, D. F., and Connel, D. W.: Polycyclic aromatic hydrocarbons in the atmo-spheric environment of Brisbane, Australia, Chemosphere, 37, 1369–1383, 1998.
Ntziachristos, L., Polidori, A., Phuleria, H., Geller, M. D., and Sioutas, C.: Application of a diffu-sion charger for the measurement of particle surface concentration in different environments,Aerosol Sci. Technol., 41, 571–580, 2007.15
Oberdorster, G.: Toxicology of ultrafine particles: in vivo studies, Phil. Trans. Royal Soc. LondonSer. A, 7, 111–124, 2000.
Ott, W. R. and Siegmann, H. C.: Using multiple continuous fine particle monitors to characterizetobacco, incense, candle, cooking, wood burning, and vehicular sources in indoor, outdoor,and in-transit settings, Atmos. Environ., 40, 821–843, 2006.20
Polidori, A., Hu, S., Biswas, S., and Sioutas, C.: Real-time characterization of particle-boundpolycyclic aromatic hydrocarbons (p-PAHs) in urban aerosols and from motor-vehicles ex-hausts, American Association for Aerosol Research, Reno, Nevada, 20–24 September2007.
Salcedo, D., Onasch, T. B., Dzepina, K., Canagaratna, M. R., Zhang, Q., Huffman, J. A., De-25
Carlo, P. F., Jayne, J. T., Mortimer, P., Worsnop, D. R., Kolb, C. E., Zuberi, B., Marr, L.C., Volkamer, R., Molina, L. T., Molina, M. J., Cardenas, B., Bernabe, R. M., Marquez, C.,Gaffney, J. S., Marley, N. A., Laskin, A., Shutthanandan, V., Xie, Y., Brune, W., Lesher, R.,Shirley, T., and Jimenez, J. L.: Characterization of ambient aerosols in Mexico City duringthe MCMA-2003 campaign with Aerosol Mass Spectrometry: results from the CENICA Su-30
persite, Atmos. Chem. Phys., 6, 925–946, 2006,http://www.atmos-chem-phys.net/6/925/2006/.
Siegmann, K., Scherrer, L., and Siegmann, H. C.: Physical and chemical properties of airborne
15712

ACPD7, 15693–15721, 2007
Particulate PAHspatial variability andaging in Mexico City
D. A. Thornhill et al.
Title Page
Abstract Introduction
Conclusions References
Tables Figures
J I
J I
Back Close
Full Screen / Esc
Printer-friendly Version
Interactive Discussion
EGU
nanoscale particles and how to measure the impact on human health, J. Molecular Structure(Theochem), 458, 191–201, 1999.
Stoeger, T., Reinhard, C., Takenaka, S., Schroeppel, A., Karg, E., Ritter, B., Heyder, J., andSchulz, H.: Instillation of six different ultrafine carbon particles indicates a surface areathreshold dose for acute lung inflammation in mice, Environ. Health Perspectives, 114, 328–5
333, 2006.Tang, D., Li, T.-Y., Liu, J. J., Chen, Y.-H., Qu, L., and Perera, F.: PAH-DNA adducts in cord
blood and fetal and child development in a Chinese cohort, Environ. Health Perspectives,114, 1297–1300, 2006.
Tran, C. L., Buchanan, D., Cullen, R. T., Searl, A., Jones, A. D., and Donaldson, K.: Inhalation of10
poorly soluble particles. II. Influence of particle surface area on inflammation and clearance,Inhalation Toxicol., 12, 1113–1126, 2005.
Velasco, E., Siegmann, P., and Siegmann, H. C.: Exploratory study of particle-bound polycyclicaromatic hydrocarbons in different environments in Mexico City, Atmos. Environ., 38, 4957–4968, 2004.15
Volkamer, R., Jimenez, J. L., San Martini, F., Dzepina, K., Zhang, Q., Salcedo, D., Molina, L.T., Worsnop, D. R., and Molina, M. J.: Secondary organic aerosol formation from anthro-pogenic air pollution: Rapid and higher than expected, Geophys. Res. Lett., 33, L17811,doi:10.1029/2006GL026899, 2006.
Westerdahl, D., Fruin, S., Sax, T., Fine, P. M., and Sioutas, C.: Mobile platform measurements20
of ultrafine particles and associated pollutant concentrations on freeways and residentialstreets in Los Angeles, Atmos. Environ., 39, 3597–3610, 2005.
Zheng, M. and Fang, M.: Particle-associated polycyclic aromatic hydrocarbons in the atmo-sphere of Hong Kong, Water Air Soil Poll., 117, 175–189, 2000.
15713

ACPD7, 15693–15721, 2007
Particulate PAHspatial variability andaging in Mexico City
D. A. Thornhill et al.
Title Page
Abstract Introduction
Conclusions References
Tables Figures
J I
J I
Back Close
Full Screen / Esc
Printer-friendly Version
Interactive Discussion
EGU
Table 1. PAH statistics at different sites.
Site (Dates in March) PAH (ng m−3)
Averagea Maximumb
Pedregal (4th–6th) 7±16 143Pico Tres Padres (7th–19th) 2±2 18T1 (19th–22nd) 20±33 229Santa Ana (22nd–25th) 4±4 29PEMEX (25th–27th) 13±14 80T0 (27th–31st) 114±121 604
a Mean ± one standard deviation of 1-min concentrations.b Maximum of 1-min concentrations.
15714

ACPD7, 15693–15721, 2007
Particulate PAHspatial variability andaging in Mexico City
D. A. Thornhill et al.
Title Page
Abstract Introduction
Conclusions References
Tables Figures
J I
J I
Back Close
Full Screen / Esc
Printer-friendly Version
Interactive Discussion
EGU
Table 2. Least-squares linear regression slope and R2 between PAHs and gaseous pollutants.
Site PAH/CO R2 PAH/NOay R2 PAH/CO2 R2
(ng m−3ppb−1) (ng m−3ppb−1) (ng m−3ppm−1)
Pedregal 0.0208±0.0009 0.69 0.12±0.02 0.18 0.61±0.04 0.51Pico Tres Padres 0.0027±0.0002 0.17 0.060±0.002 0.26 0.121±0.007 0.16T1 0.090±0.003 0.77 1.10±0.02 0.87 1.4±0.2 0.38Santa Ana 0.0122±0.0007 0.44 0.22±0.02 0.34 0.29±0.02 0.33PEMEX 0.047±0.004 0.34 0.62±0.02 0.86 1.1±0.1 0.37T0 0.066±0.004 0.47 1.19±0.03 0.77 3.3±0.1 0.70
a NOy is total nitrogen oxides measured by chemiluminescence with a molybdenum converter.The ratios are not significantly different when true NOx = NO + NO2 is used instead.
15715

ACPD7, 15693–15721, 2007
Particulate PAHspatial variability andaging in Mexico City
D. A. Thornhill et al.
Title Page
Abstract Introduction
Conclusions References
Tables Figures
J I
J I
Back Close
Full Screen / Esc
Printer-friendly Version
Interactive Discussion
EGU
Table 3. Total particulate PAH/BC mass ratios in Mexico City compared to other locations.
Location PAH/BC(mass ratio)
R2 Reference
Mexico City (T0)Ogden, UTa
Fresno, CA (Winter)Fresno, CA (Summer)Los Angeles, CA
1.2×10⁻²
1.25×10⁻³
1.2×10⁻³
3.3×10⁻⁴
1×10⁻²
0.770.750.780.750.82
This study(Arnott et al., 2005)(Arnott et al., 2005)(Arnott et al., 2005)(Westerdahl et al., 2005)
a Diluted vehicle exhaust, not ambient air.
15716

ACPD7, 15693–15721, 2007
Particulate PAHspatial variability andaging in Mexico City
D. A. Thornhill et al.
Title Page
Abstract Introduction
Conclusions References
Tables Figures
J I
J I
Back Close
Full Screen / Esc
Printer-friendly Version
Interactive Discussion
EGU
Fig. 1. Supersites (squares) and mobile laboratory measurement sites (diamonds) in theMCMA during the MILAGRO field campaign. The numbers in white are the Pearson correlationcoefficients between PAH measurements by the mobile laboratory and continuous measure-ments at T0.
15717
ACPD7, 15693–15721, 2007
Particulate PAHspatial variability andaging in Mexico City
D. A. Thornhill et al.
Title Page
Abstract Introduction
Conclusions References
Tables Figures
J I
J I
Back Close
Full Screen / Esc
Printer-friendly Version
Interactive Discussion
EGU
400
300
200
100
0
Activ
e su
rface
(mm
2 m-3
)
7 8 9 10 11 12 13 14 15 16 17 18 19 20 21 22 23 24 25 26 27 28 29 30 31 Date in March 2006
O3-South
O3-NorthCold Surge Convection
South Venting
400
300
200
100
0
PAH
(ng
m-3
)
7 8 9 10 11 12 13 14 15 16 17 18 19 20 21 22 23 24 25 26 27 28 29 30 31 Date in March 2006
Fig. 2. AS and PAH concentrations at T0 during the entire field campaign. Raw 1-min mea-surements are shown by the colored lines, where color indicates the wind transport episode,and 1-h averages are shown in black.
15718

ACPD7, 15693–15721, 2007
Particulate PAHspatial variability andaging in Mexico City
D. A. Thornhill et al.
Title Page
Abstract Introduction
Conclusions References
Tables Figures
J I
J I
Back Close
Full Screen / Esc
Printer-friendly Version
Interactive Discussion
EGU
250
200
150
100
50
0
PAH
(ng
m-3
)
00:0026 Mar
06:00 12:00 18:00 00:0027 Mar
06:00
PEMEX
250
200
150
100
50
0
PAH
(ng
m-3
)
00:0020 Mar
12:00 00:0021 Mar
12:00 00:0022 Mar
T1250
200
150
100
50
0
PAH
(ng
m-3
)00:00
23 Mar12:00 00:00
24 Mar12:00 00:00
25 Mar12:00
Santa Ana
600
500
400
300
200
100
0
PAH
(ng
m-3
)
00:0028 Mar
12:00 00:0029 Mar
12:00 00:0030 Mar
T0
250
200
150
100
50
0
PAH
(ng
m-3
)
12:004 Mar
18:00 00:005 Mar
06:00 12:00 18:00 00:006 Mar
06:00
Pedregal250
200
150
100
50
0
PAH
(ng
m-3
)
00:008 Mar
00:0010 Mar
00:0012 Mar
00:0014 Mar
00:0016 Mar
00:0018 Mar
Pico Tres Padres
Fig. 3. PAH concentrations (10-min averages) at sites visited by the AML. The y-axis maximumis larger in the T0 panel.
15719

ACPD7, 15693–15721, 2007
Particulate PAHspatial variability andaging in Mexico City
D. A. Thornhill et al.
Title Page
Abstract Introduction
Conclusions References
Tables Figures
J I
J I
Back Close
Full Screen / Esc
Printer-friendly Version
Interactive Discussion
EGU
600
500
400
300
200
100
0
PAH
(ng
m-3
)
300250200150100500
AS (mm2 m-3)
PAH = 0.80 AS - 13.27R = 0.452
(5:00-7:00)
(12:00-14:00)
20
15
10
5
0
600
500
400
300
200
100
0
PAH
(ng
m-3
)
302520151050
BC (µg m-3)
PAH = 11.7 * BC - 8.8R = 0.772
(5:00-7:00)
(12:00-14:00)
20
15
10
5
0
Fig. 4. PAH v. AS and PAH v. BC concentrations at T0 colored by hour. The solid line is thelinear regression for all times, and its equation is shown in the box. The dotted lines labeled05:00–07:00 and 12:00–14:00 are the regressions for a subset of data specific to these timeperiods. The equations of these lines are given in the text.
15720
ACPD7, 15693–15721, 2007
Particulate PAHspatial variability andaging in Mexico City
D. A. Thornhill et al.
Title Page
Abstract Introduction
Conclusions References
Tables Figures
J I
J I
Back Close
Full Screen / Esc
Printer-friendly Version
Interactive Discussion
EGU
100
90
80
70
60
50
40
BC
/AS
(ng mm
-2)
00:00 06:00 12:00 18:00
1.2
1.0
0.8
0.6
0.4
PA
H/A
S (
ng m
m-2
)
BC/AS PAH/AS
Fig. 5. Weekday average diurnal patterns in PAH/AS and BC/AS.
15721