Occurrence of Polycyclic Aromatic Hydrocarbons in Smoked Cheese
8
Occurrence of polycyclic aromatic hydrocarbons in the Soan River, Pakistan: Insights into distribution, composition, sources and ecological risk assessment $ Faiqa Aziz a , Jabir Husain Syed c,n , Riffat Naseem Malik b,nn , Athanasios Katsoyiannis d , Adeel Mahmood b , Jun Li c , Gan Zhang c , Kevin C. Jones e a Environmental Biology and Ecotoxicology Laboratory, Department of Environmental Sciences, Quaid-I-Azam University, 45320 Islamabad, Pakistan b Environmental Biology Laboratory, Department of Environmental Sciences, Quaid-I-Azam University, Islamabad, Pakistan c State Key Laboratory of Organic Geochemistry, Guangzhou Institute of Geochemistry, Chinese Academy of Sciences, Guangzhou, China d Norwegian Institute for Air Research (NILU) – FRAM High North Research Centre on Climate and the Environment, Hjalmar Johansens gt. 14, NO – 9296 Tromsø, Norway e Centre for Chemical Management, Lancaster Environment Centre, Lancaster University, Bailrigg, Lancaster, United Kingdom article info Article history: Received 26 May 2014 Received in revised form 19 July 2014 Accepted 21 July 2014 Available online 28 August 2014 Keywords: Polycyclic aromatic hydrocarbons Spatial distribution Source apportionment Ecological risk assessment Soan River abstract Present study investigates the occurrence, distribution and sources of ∑ 17 polycyclic aromatic hydro- carbons (PAHs) in the surface water of Soan River, Pakistan. The concentrations of total PAHs ranged from 61 to 207 ng/l. Low molecular weight (LMW) PAHs were recorded higher in concentrations (64.7 percent) as compared to high molecular weight (HMW) PAHs (35.6 percent). Principal component analysis (PCA) revealed domestic and industrial wastewater discharge, vehicular exhaust, petroleum residues and biomass combustion as the main sources for PAHs contamination. Using the USEPA toxic equivalency factor (TEF) approach: Benzo(a)Pyrene and Dibenzo(a,h)Anthracene contributed highly carcinogenic exposure equivalent. The surface water of the Soan River is found to be slightly polluted with PAHs thereby posing health risks to aquatic bodies. & 2014 Elsevier Inc. All rights reserved. 1. Introduction Polycyclic aromatic hydrocarbons (PAHs) are important group of organic compounds. They have compressed structures consisting of two or more aromatic rings and have variable physicochemical properties (Jan et al., 2013). Due to their carcinogeneticity and toxicity potential to both aquatic and terrestrial organisms, USEPA (1984) listed them as priority pollutants. Taioli et al. (2007) reported the clear evidence of DNA damage and the genotoxic effects related with exposure to PAHs. Exposure to air, water, fish and other food items contaminated with PAHs leads to negative impacts on human health (Martellini et al., 2012). PAHs find their way into the environment through natural (volcanoes, forest and prairie fires) and anthropogenic sources. Anthropogenic sources include automotive exhausts, tire degrada- tion, industrial emissions from catalytic cracking, air blowing of asphalt, domestic heating emissions from coal, oil, gas, and wood, refuse incineration, and biomass burning (Baek et al., 1991). PAHs may enter surface water mainly via atmospheric fallout (precipita- tion, dry deposition), urban runoff, municipal and industrial effluents, and oil spillage or leakage (Katayama et al., 2010). It has been estimated that 10–80 percent of PAHs contribution to the oceans is from atmospheric sources (Moore and Ramamoorthy, 1984). It is estimated that the atmospheric PAH deposition in the waterbodies of Hangzhou city was 530 t/y while surface runoff contributed 30.7 t/y (Chen et al., 2004). After entering the aquatic environment, due to their consequence of hydrophobic nature, PAHs rapidly tend to bound to the particulate matter and even- tually end up in the sediments (Qiu et al., 2009). In Pakistan, there is limitation of studies reported on the surface water pollution for organic contaminants including PAHs. There is lack of baseline data for PAHs pollution in surface water. Only surface water of Chenab River has been assessed to deter- mine its occurrence. The ecology of the Soan River has also been affected due to its proximity to densely inhabited areas and to the Contents lists available at ScienceDirect journal homepage: www.elsevier.com/locate/ecoenv Ecotoxicology and Environmental Safety http://dx.doi.org/10.1016/j.ecoenv.2014.07.022 0147-6513/& 2014 Elsevier Inc. All rights reserved. ☆ Capsule: Findings indicate low ecosystem risk by Polyaromatic Hydrocarbons in surface waters of the Soan River. n Corresponding author. Fax: þ86 20 8529 0706. nn Corresponding author. Fax: þ92 51 90643017. E-mail addresses: [email protected] (J.H. Syed), [email protected] (R.N. Malik). Ecotoxicology and Environmental Safety 109 (2014) 77–84
-
Upload
independent -
Category
Documents
-
view
0 -
download
0
Transcript of Occurrence of Polycyclic Aromatic Hydrocarbons in Smoked Cheese

Occurrence of polycyclic aromatic hydrocarbons in the Soan River,Pakistan: Insights into distribution, composition, sources andecological risk assessment$
Faiqa Aziz a, Jabir Husain Syed c,n, Riffat Naseem Malik b,nn, Athanasios Katsoyiannis d,Adeel Mahmood b, Jun Li c, Gan Zhang c, Kevin C. Jones e
a Environmental Biology and Ecotoxicology Laboratory, Department of Environmental Sciences, Quaid-I-Azam University, 45320 Islamabad, Pakistanb Environmental Biology Laboratory, Department of Environmental Sciences, Quaid-I-Azam University, Islamabad, Pakistanc State Key Laboratory of Organic Geochemistry, Guangzhou Institute of Geochemistry, Chinese Academy of Sciences, Guangzhou, Chinad Norwegian Institute for Air Research (NILU) – FRAM High North Research Centre on Climate and the Environment, Hjalmar Johansensgt. 14, NO – 9296 Tromsø, Norwaye Centre for Chemical Management, Lancaster Environment Centre, Lancaster University, Bailrigg, Lancaster, United Kingdom
a r t i c l e i n f o
Article history:Received 26 May 2014Received in revised form19 July 2014Accepted 21 July 2014Available online 28 August 2014
Keywords:Polycyclic aromatic hydrocarbonsSpatial distributionSource apportionmentEcological risk assessmentSoan River
a b s t r a c t
Present study investigates the occurrence, distribution and sources of ∑17 polycyclic aromatic hydro-carbons (PAHs) in the surface water of Soan River, Pakistan. The concentrations of total PAHs rangedfrom 61 to 207 ng/l. Low molecular weight (LMW) PAHs were recorded higher in concentrations (64.7percent) as compared to high molecular weight (HMW) PAHs (35.6 percent). Principal componentanalysis (PCA) revealed domestic and industrial wastewater discharge, vehicular exhaust, petroleumresidues and biomass combustion as the main sources for PAHs contamination. Using the USEPA toxicequivalency factor (TEF) approach: Benzo(a)Pyrene and Dibenzo(a,h)Anthracene contributed highlycarcinogenic exposure equivalent. The surface water of the Soan River is found to be slightly pollutedwith PAHs thereby posing health risks to aquatic bodies.
& 2014 Elsevier Inc. All rights reserved.
1. Introduction
Polycyclic aromatic hydrocarbons (PAHs) are important group oforganic compounds. They have compressed structures consisting oftwo or more aromatic rings and have variable physicochemicalproperties (Jan et al., 2013). Due to their carcinogeneticity andtoxicity potential to both aquatic and terrestrial organisms, USEPA(1984) listed them as priority pollutants. Taioli et al. (2007) reportedthe clear evidence of DNA damage and the genotoxic effects relatedwith exposure to PAHs. Exposure to air, water, fish and other fooditems contaminated with PAHs leads to negative impacts on humanhealth (Martellini et al., 2012).
PAHs find their way into the environment through natural(volcanoes, forest and prairie fires) and anthropogenic sources.
Anthropogenic sources include automotive exhausts, tire degrada-tion, industrial emissions from catalytic cracking, air blowing ofasphalt, domestic heating emissions from coal, oil, gas, and wood,refuse incineration, and biomass burning (Baek et al., 1991). PAHsmay enter surface water mainly via atmospheric fallout (precipita-tion, dry deposition), urban runoff, municipal and industrialeffluents, and oil spillage or leakage (Katayama et al., 2010). Ithas been estimated that 10–80 percent of PAHs contribution to theoceans is from atmospheric sources (Moore and Ramamoorthy,1984). It is estimated that the atmospheric PAH deposition in thewaterbodies of Hangzhou city was 530 t/y while surface runoffcontributed 30.7 t/y (Chen et al., 2004). After entering the aquaticenvironment, due to their consequence of hydrophobic nature,PAHs rapidly tend to bound to the particulate matter and even-tually end up in the sediments (Qiu et al., 2009).
In Pakistan, there is limitation of studies reported on thesurface water pollution for organic contaminants including PAHs.There is lack of baseline data for PAHs pollution in surface water.Only surface water of Chenab River has been assessed to deter-mine its occurrence. The ecology of the Soan River has also beenaffected due to its proximity to densely inhabited areas and to the
Contents lists available at ScienceDirect
journal homepage: www.elsevier.com/locate/ecoenv
Ecotoxicology and Environmental Safety
http://dx.doi.org/10.1016/j.ecoenv.2014.07.0220147-6513/& 2014 Elsevier Inc. All rights reserved.
☆Capsule: Findings indicate low ecosystem risk by Polyaromatic Hydrocarbons insurface waters of the Soan River.
n Corresponding author. Fax: þ86 20 8529 0706.nn Corresponding author. Fax: þ92 51 90643017.E-mail addresses: [email protected] (J.H. Syed),
[email protected] (R.N. Malik).
Ecotoxicology and Environmental Safety 109 (2014) 77–84
anthropogenic activities along the river. Moreover, heavy densityvehicular emissions in atmosphere and their dry or wet basedeposition in the water could impart PAHs and impair waterquality and ecology of the Soan River. Besides that, the River Soanreceives about 4�106 m3/y of domestic and industrial wastewaterfrom Rawalpindi and Islamabad cities. In recent years, fish produc-tion in the Soan River has been reduced from 450 to 600 tons/ydue to increased pollution (Zahra et al., 2014). In the light of thesefacts, present study was conducted to report the status of PAHs insurface water of the Soan River. It also investigates the level ofPAHs, their distribution, sources and health risk associatedwith PAHs.
2. Materials and methods
2.1. Study area
Soan River is the important watercourse of the Potohar region of Pakistan andis the major feeding tributary of Simly dam. It is spatially located betweenlongitude 71.045–73.0351 and latitude 32.045–33.0551. The Soan makes its originfrom springs of Bun village in the Murree Hills near Pathriata, flows from east to thewest and falls into the Indus River near Makhd. During its course it passes throughmajor cities viz., Islamabad, Rawalpindi, Fateh Jung, Pindi Ghab, Talagang andMianwali. The mean temperature of study area ranges from minimum of 3 1C inwinter to maximum of 45 1C in summer. The river flow decrease in summer whilemonsoon heavy rain brings flash flooding thereby increasing runoff. Also, SoanRiver is feded by four tributaries including Ling stream, Kurang River, Khad Nallahand Nallah Lai. Map of the study area has been provided in Fig. S1.
2.2. Sampling strategy
A total of ten composite surface water samples (n¼30) from different siteswere collected during summer in June 2013. Out of total ten sampling sites of SoanRiver, five (S5, S7, S8, S9 and S10) were on the Soan River, three sites on the KurangRiver (S1, S2 and S3) one site each on Ling stream (S3) and Nallah lai (S6) (Fig. S1).The two sites (S1, S2) on the Kurang River were situated up and down stream ofRawal Dam Reservoir. Site S3 was located on Ling stream before its confluencepoint with Soan River at S4. Site S7 was located at Soan Camp where Kurang Riverand Nallah lai merges with Soan River. All the sites were located near Rawalpindiand Islamabad except S9 and S10. The latter sites were located in Dhok Pathan andShah Muhammad Wali in Chakwal District. Description of site codes, location andactivities going on in the catchment area of sites is given in Table S1.
2.3. Sample collection & analysis
About 5 L (in triplicate) surface water samples collected in pre-cleaned brownglass bottles from different sites (about 500 m distance from up, mid and down-stream of each site). Sampling bottles were pre-washed with acetone to avoidcontamination. Then, the surface water sample was combined to get a compositesample. The water sample was stored in icebox, transported and refrigerated in thelaboratory at 4 1C until analysis.
Water samples were filtered using filter (pore size 125 mm) and were solventextracted following standard method (Separatory Funnel Liquid–Liquid Extraction,USEPA Method 3510C). Water sample (1 L) to be extracted and Dichloromethane(DCM) (25 mL) were transferred into the separating funnel. Recovery standard(naphthalene-d8; acenaphthened10; phenanthrene-d10; chrysene-d12 and pery-lene-d12) was added in the funnel with the sample. Funnel was shaken for 1–2 minand was vented periodically to release excess pressure. Separating funnel wasallowed to settle for the separation of organic layer from the aqueous phase. Theorganic layer was removed after 5–10 min, and the process was repeated twicewith the aqueous layer. Three of four equal portion of organic layer were collectedin rotary flask after filtering from a layer of anhydrous sodium sulfate and glasswool. Rotary evaporator was used to reduce the volume of the organic layer to oneand exchanged into n-hexane. The extracted samples were passed to a glasscolumn (200 mm, 4 mm diameter) filled with 3 cm of deactivated alumina,deactivated silica of 3 cm and anhydrous sodium sulfate of 1cm to purify thesample. Before using silica, alumina and sodium sulfate were baked in mufflefurnace at 180 1C, 210 1C and 450 1C for 4 h. The column was pre-washed with n-hexane before passing the extracted layer through the column. For elution70 mL ofDCM and n-hexane at a ratio of 3:7 were used. Nitrogen streamwas used to reducethe volume of elute to 0.5 mL. Before GC analysis, hexamethylbenzene (5 uL) wasadded in the elute as an internal standard.
Samples were analyzed by GC–MS (HP-5890 series II GC, HP-5972 MSD),equipped with a 30 m�0.25 mm�0.25 μm HP5-MS column. The chromatographic
conditions were as follows: injector temperature, 280 1C; ion source temperature,180 1C; temperature program: 60 1C for 2 min, 3 1C min�1 to 290 1C, and 290 1C for30 min. Helium was used as the carrier gas at flow rate of 1.4 mL/min. 1 μL samplevolume was injected into GC to analyze seventeen EPA PAHs which includes:naphthalene (Nap), acenaphthylene (Acy), acenaphthene (Ace), fluorene (Flu),phenanthrene (Phe), anthracene (Ant), fluoranthene (Flua), pyrene (Pyr), benzo[a]anthracene (BaA), chrysene (Chr), benzo(b)fluoranthene (BbF), benzo(k)fluor-anthene (BkF), benzo(a)pyrene (BaP), indeno(1,2,3 – c,d)pyrene (Ind), dibenzo(a,h)anthracene (dBahAn), benzo(ghi)perylene (BghiP), coronene (Coro).
2.4. Quality assurance and quality control (QA/QC)
Strict quality control and quality assurance procedures were implicatedthroughout the sampling and analysis. Samples were extracted within seven daysafter sampling. Field and lab blanks were analyzed routinely with samples forpossible contamination during transport, storage and analysis. No detectable PAHswere found in field and lab blanks. Naphthalene-d8; acenaphthened10; phenan-threne-d10; chrysene-d12 and perylene-d12 were used as a recovery standard withtheir mean recoveries calculated as follows: 68.34710.22 percent, 75.4674.25percent, 84.8376.15 percent, 86.3377.82 percent. Limit of detection (LOD) wascalculated as three times the standard deviation of the PAHs level in proceduralblanks. For PAHs which were not detected in lab and field blanks, LODs werecalculated as the amount of analytes per sample corresponding to the lowestcalibration standard. The LODs ranged between 2.1 and 7.9 pg/L in all samples. Forquantification purposes, calibration curves based on a set of six standards ofconcentration 5, 10, 20, 50, 100 and 200 ppb were drawn. Data acquisition andprocessing was controlled by Agilent MSD Productivity Chemstation software.
2.5. Characterization of samples
Physiochemical parameters viz., pH, total dissolved and suspended solids (TDSand TSS), electrical conductivity (EC), dissolved oxygen (DO) and total organiccarbon (TOC) of water sample were determined. pH of surface water was measuredby pH meter (Model no. P25). TDS and EC were recorded by TDS/EC meter (Modelno. UNE-EN 61326-1) and DO with DO Meter by HACH (2968800). Total suspendedsolids were measured using EPA method 160.2. Total organic carbon analyzer (TOCanalyzer, Analytical Jena) was used for analysis of TOC.
2.6. Statistical analysis
Statistical package for social science (SPSS 13.0) were applied to understand thecorrelation between physicochemical parameter of PAHs with their distributionpattern. Kruskal–Wallis test was applied to assess the significant differences(P¼0.05) in PAHs concentration at various sites based on the median valuesprovided that the data was not distributed normally. Diagnostic ratios (DR) andPrincipal component analysis (PCA) were used to determine PAHs contaminationsources. Data was standardized before PCA processing for the removal of dimen-sional effect on the components.
3. Results and discussion
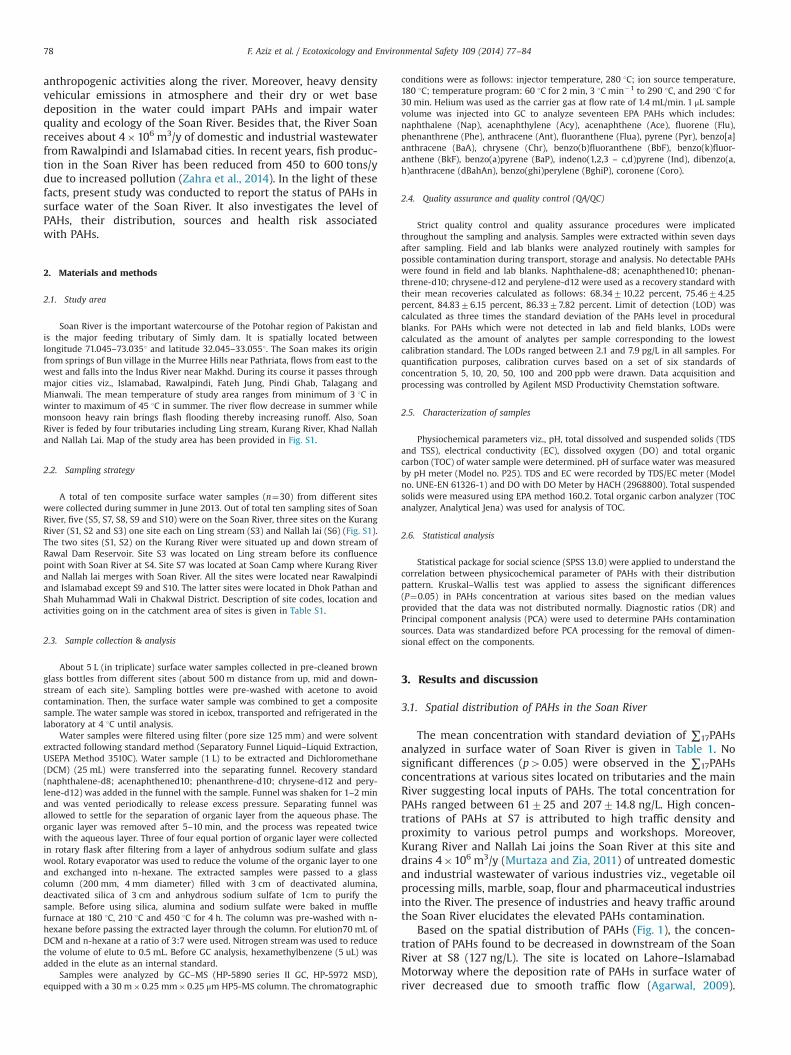
3.1. Spatial distribution of PAHs in the Soan River
The mean concentration with standard deviation of ∑17PAHsanalyzed in surface water of Soan River is given in Table 1. Nosignificant differences (p40.05) were observed in the ∑17PAHsconcentrations at various sites located on tributaries and the mainRiver suggesting local inputs of PAHs. The total concentration forPAHs ranged between 61725 and 207714.8 ng/L. High concen-trations of PAHs at S7 is attributed to high traffic density andproximity to various petrol pumps and workshops. Moreover,Kurang River and Nallah Lai joins the Soan River at this site anddrains 4�106 m3/y (Murtaza and Zia, 2011) of untreated domesticand industrial wastewater of various industries viz., vegetable oilprocessing mills, marble, soap, flour and pharmaceutical industriesinto the River. The presence of industries and heavy traffic aroundthe Soan River elucidates the elevated PAHs contamination.
Based on the spatial distribution of PAHs (Fig. 1), the concen-tration of PAHs found to be decreased in downstream of the SoanRiver at S8 (127 ng/L). The site is located on Lahore–IslamabadMotorway where the deposition rate of PAHs in surface water ofriver decreased due to smooth traffic flow (Agarwal, 2009).
F. Aziz et al. / Ecotoxicology and Environmental Safety 109 (2014) 77–8478

Gradual increase in PAHs concentration was observed as the Riverflows from S9 (150 ng/L) to S10 (181 ng/L). The aforementionedsites were located on the Soan River at Dhok Pathan and ShahMuhammad Wali. The S9 site is characterized by a transport hub,fromwhere thousands of trucks in addition to local traffic pass outeach day. This leads to traffic congestion, associated with loweringof traffic speed and frequent gear changing resulting in increasedPAHs emissions (Wilcke, 2000). Site S10 is situated in a rural areawhere PAHs may originate from combustion of wood and coal inhouses and solid waste in the agricultural fields. PAHs may reachthe aquatic environment by surface run-off, direct disposal ofwaste and atmospheric deposition. Similar PAHs concentrationswere recorded at S3 (123 ng/L) and S4 (127 ng/L) where S3 islocated on Ling stream and confluence to the Soan River at S4. Thiscould be an indication that there exists no other significant sourcenearby mixing point. Comparatively no difference in PAHs con-centrations were observed at S1 (136 ng/L) and S2 (141 ng/L) thatwere located on Kurang River at the up and downstream of Rawaldam reservoir, respectively. The PAHs detected at S1, S2, S3 and S4relates to urban run-off, burning of solid waste, discharge ofdomestic wastewater. Lowest PAHs contamination were observedin samples taken from S5 (61 ng/L) which reflects no potentialPAHs contamination sources.
A comparison of PAHs concentrations observed for Soan Riverwith other surface waters of the world has been shown in Fig. 2.The PAHs contamination in the surface water of Soan River wasfound to be of low level as compared to Chenab River, Pakistan(Farooq et al., 2011). Industrialization and urbanization along theSoan River is less compared to Chenab River. Moreover, theauthors reported increased use of fossil fuel and coal combustionas the major sources of contamination in the Chenab River. Thelevels of PAHs in the Soan River were relatively similar to the KorRiver, Iran (Kafilzadeh et al., 2011) and Bolgoda Lake, Sri Lanka(Pathiratne et al., 2007) where fossil fuel combustion and dis-charge of untreated wastewater from industries was the source ofPAHs. However, measured PAHs concentrations in the Soan Riverwere higher to those reported in surface water of Raba River,Hungary (Nagy et al., 2013), Todos Os Santo Bay (Celino et al.,2012) and River Tiber, Italy (Patrolecco et al., 2010). Increasedefficiency of energy utilization in these developed countriesattributed to low concentration of PAHs (Pacyna et al., 2003). Ingeneral, the PAH pollution in the Soan River found to be highercompared to studies reported in Europe, America, Australia, Africa,while its concentration is of moderate level when compared withthe Asian countries.
3.2. Tracking compositional dynamics of PAHs
The compositional pattern of PAHs was investigated by ringnumber in the surface water of Soan River and is shown in Fig. 3.The pattern of PAHs contamination on the basis of ring numberwere in order of 3 ring42 ring44 ring45 ring46 ring. Of theseventeen PAHs detected, fifteen percent of the total PAHs concen-tration was represented by Nap followed by Ace (13.8 percent) andAnt (12 percent). Dominance of Nap and Ace was attributed to theirhigh solubility and suggests typically local inputs of petroleumproducts and exhaust from vehicles in the study area (Shi et al.,2005). Flua (10.3 percent) and Pyr (7.6 percent) were dominantcompounds among HMW PAHs. It is illustrated in Fig. S2 that PAHsconcentration in the surface water were dominated by LMW PAHs(86.65 ng/L) and depleted in HMW PAHs (64.09 ng/L) except at S7and S10. Farooq et al. (2011) also found dominance of LMW PAHs inthe Chenab River, Pakistan, which was attributed to the tendency ofLMW PAHs for long range transport and high aqueous solubility.On the contrary, HMW PAHs have lower aqueous solubility andthey associate with particulate matter and deposited in sedimentsTa
ble
1Con
centrationsof
PAHs(ng/L)
insu
rfacewater
oftheSo
anRiver
atva
riou
ssamplin
gsites.
Compounds
Conce
ntration(M
ean7
S.D)
%Freq
uen
cy
S1S2
S3S4
S5S6
S7S8
S9S1
0Mea
n7
Std.
Nap
14.07
2.3
12.07
0.3
11.77
1.5
13.27
0.9
12.57
2.0
50.77
31.0
5.17
4.6
69.07
1.9
14.57
0.8
17.57
1.0
22.47
20.8
15.0
Ace
16.07
1.9
70.07
5.9
1.97
1.7
40.27
2.2
20.07
0.5
2.47
1.3
24.17
1.9
2.97
1.6
19.37
2.4
7.57
0.02
20.47
21.2
13.8
Acy
30.07
1.5
19.07
1.5
16.07
1.4
3.87
1.1
1.87
0.7
3.97
1.1
9.67
5.7
0.04
70.01
27.47
2.0
11.97
0.5
12.47
10.7
8.4
Flu
0.77
0.7
10.87
1.5
40.37
1.8
11.57
0.6
2.17
0.7
10.67
0.7
9.97
3.4
8.57
2.9
10.67
0.8
2.77
1.0
10.77
11.0
7.3
Phe
2.77
0.4
2.37
2.5
3.87
3.6
7.67
0.4
0.37
0.3
6.27
1.2
2.87
1.9
ND
4.17
0.1
2.17
1.1
3.27
2.4
2.2
Ant
28.07
1.4
8.77
0.9
16.47
1.9
13.27
0.2
12.77
0.9
20.17
2.5
15.37
0.2
18.07
5.5
21.47
1.5
22.57
1.4
17.77
5.7
12.0
Flua
7.57
2.9
0.97
0.6
0.17
0.2
0.57
0.1
0.77
0.2
2.27
0.9
3.57
0.6
1.57
0.4
18.77
6.2
65.07
2.4
10.17
20.3
7.0
Pyr
8.07
3.9
ND
2.87
2.6
17.07
2.5
ND
2.77
2.5
14.27
1.9
3.27
2.3
7.07
1.2
5.97
3.0
7.67
7.8
5.2
BaA
8.57
2.9
1.57
0.4
3.17
2.1
ND
0.17
0.04
5.07
0.5
0.97
0.2
3.87
3.1
0.37
0.5
3.17
1.2
2.57
2.6
1.7
Chr
0.77
0.2
0.27
0.2
7.57
0.7
5.47
1.6
2.57
2.3
2.17
0.8
1.67
0.6
0.37
0.2
1.87
0.4
5.67
1.7
2.87
2.5
1.9
BbF
8.57
2.9
1.57
0.5
3.17
2.5
ND
0.17
0.03
4.17
0.4
0.97
0.01
3.87
3.4
0.37
0.1
3.17
2.8
2.57
2.6
1.7
BkF
3.47
2.8
0.77
0.4
0.007
70.003
1.57
0.6
0.17
0.4
94.87
28.0
0.17
0.09
1.67
1.4
0.001
70.002
2.77
1.9
10.57
29.7
7.1
BaP
1.27
1.1
ND
0.87
0.4
0.27
0.5
0.47
0.3
0.01
70.002
ND
ND
ND
25.57
2.6
2.87
7.9
1.9
Ind
2.47
2.4
5.27
1.4
0.77
0.2
1.77
3.4
5.77
2.6
1.07
0.8
1.77
1.1
6.57
3.0
0.57
0.3
ND
2.47
2.8
1.6
dBah
An
1.57
1.3
2.87
1.7
8.27
3.6
5.97
1.3
0.57
0.4
0.37
0.3
0.27
0.1
ND
2.07
1.0
4.37
3.6
1.77
2.3
1.8
Bgh
ip2.17
1.9
4.17
3.5
6.27
0.2
2.87
1.6
2.37
0.5
2.87
1.1
ND
5.97
0.6
2.97
2.0
1.57
1.9
3.17
1.9
2.1
Coro
ND
ND
ND
2.97
1.2
ND
ND
1.07
0.9
ND
1.37
1.9
ND
0.97
0.9
0.4
∑LM
W92
.07
12.3
123.87
2590
.17
1489
.457
13.0
48.77
7.9
66.97
7.7
93.87
18.0
99.07
26.0
97.47
8.2
64.37
8.1
86.67
21.3
64.7
∑HMW
43.07
3.4
17.07
1.8
337
3.1
38.07
4.9
12.07
1.8
24.07
4.1
114.07
28.1
27.07
2.4
53.07
8.5
117.07
19.4
47.87
37.9
35.6
∑PA
Hs
136.07
33.0
141.07
7512
3.07
40.0
127.07
36.0
61.07
25.0
91.07
30.4
207.07
14.8
127.07
50.9
150.07
31.1
181.07
37.4
134.47
41.1
F. Aziz et al. / Ecotoxicology and Environmental Safety 109 (2014) 77–84 79
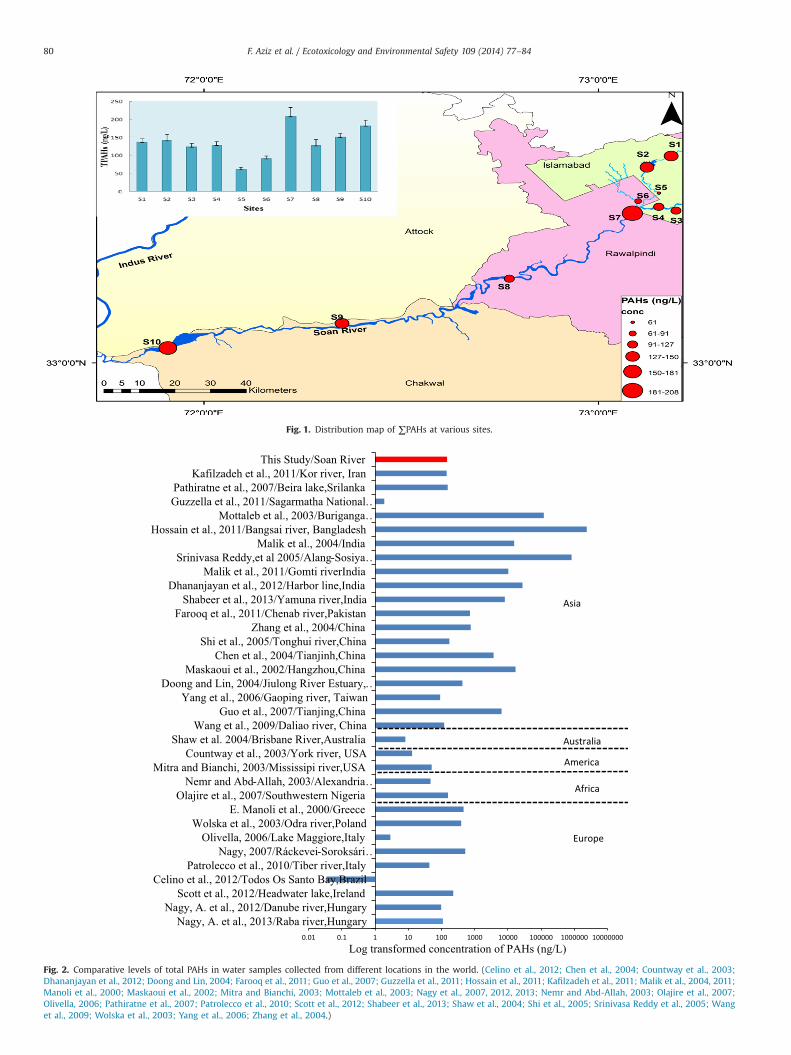
Fig. 1. Distribution map of ∑PAHs at various sites.
Nagy, A. et al., 2013/Raba river,HungaryNagy, A. et al., 2012/Danube river,Hungary
Scott et al., 2012/Headwater lake,IrelandCelino et al., 2012/Todos Os Santo Bay,Brazil
Patrolecco et al., 2010/Tiber river,ItalyNagy, 2007/Ráckevei-Soroksári …
Olivella, 2006/Lake Maggiore,ItalyWolska et al., 2003/Odra river,Poland
E. Manoli et al., 2000/GreeceOlajire et al., 2007/Southwestern Nigeria
Nemr and Abd-Allah, 2003/Alexandria …Mitra and Bianchi, 2003/Mississipi river,USA
Countway et al., 2003/York river, USAShaw et al. 2004/Brisbane River,Australia
Wang et al., 2009/Daliao river, ChinaGuo et al., 2007/Tianjing,China
Yang et al., 2006/Gaoping river, TaiwanDoong and Lin, 2004/Jiulong River Estuary, …
Maskaoui et al., 2002/Hangzhou,ChinaChen et al., 2004/Tianjinh,China
Shi et al., 2005/Tonghui river,ChinaZhang et al., 2004/China
Farooq et al., 2011/Chenab river,PakistanShabeer et al., 2013/Yamuna river,India
Dhananjayan et al., 2012/Harbor line,IndiaMalik et al., 2011/Gomti riverIndia
Srinivasa Reddy,et al 2005/Alang-Sosiya …Malik et al., 2004/India
Hossain et al., 2011/Bangsai river, BangladeshMottaleb et al., 2003/Buriganga …
Guzzella et al., 2011/Sagarmatha National …Pathiratne et al., 2007/Beira lake,Srilanka
Kafilzadeh et al., 2011/Kor river, IranThis Study/Soan River
Log transformed concentration of PAHs (ng/L)
Fig. 2. Comparative levels of total PAHs in water samples collected from different locations in the world. (Celino et al., 2012; Chen et al., 2004; Countway et al., 2003;Dhananjayan et al., 2012; Doong and Lin, 2004; Farooq et al., 2011; Guo et al., 2007; Guzzella et al., 2011; Hossain et al., 2011; Kafilzadeh et al., 2011; Malik et al., 2004, 2011;Manoli et al., 2000; Maskaoui et al., 2002; Mitra and Bianchi, 2003; Mottaleb et al., 2003; Nagy et al., 2007, 2012, 2013; Nemr and Abd-Allah, 2003; Olajire et al., 2007;Olivella, 2006; Pathiratne et al., 2007; Patrolecco et al., 2010; Scott et al., 2012; Shabeer et al., 2013; Shaw et al., 2004; Shi et al., 2005; Srinivasa Reddy et al., 2005; Wanget al., 2009; Wolska et al., 2003; Yang et al., 2006; Zhang et al., 2004.)
F. Aziz et al. / Ecotoxicology and Environmental Safety 109 (2014) 77–8480
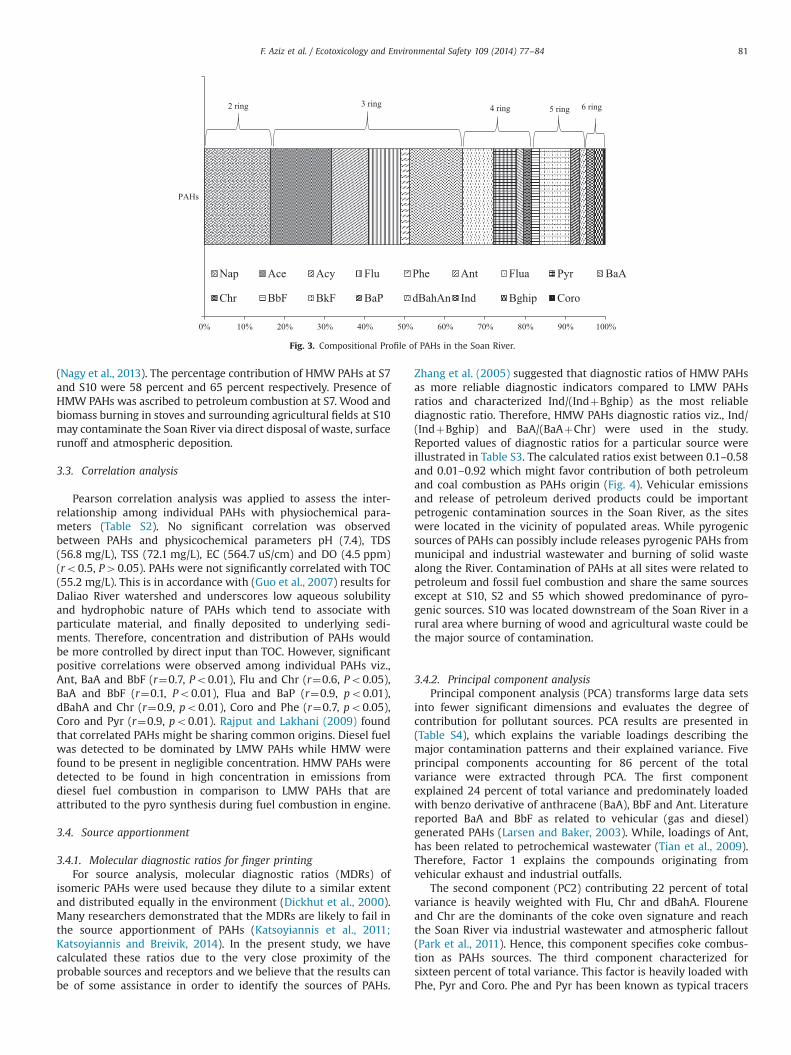
(Nagy et al., 2013). The percentage contribution of HMW PAHs at S7and S10 were 58 percent and 65 percent respectively. Presence ofHMW PAHs was ascribed to petroleum combustion at S7. Wood andbiomass burning in stoves and surrounding agricultural fields at S10may contaminate the Soan River via direct disposal of waste, surfacerunoff and atmospheric deposition.
3.3. Correlation analysis
Pearson correlation analysis was applied to assess the inter-relationship among individual PAHs with physiochemical para-meters (Table S2). No significant correlation was observedbetween PAHs and physicochemical parameters pH (7.4), TDS(56.8 mg/L), TSS (72.1 mg/L), EC (564.7 uS/cm) and DO (4.5 ppm)(ro0.5, P40.05). PAHs were not significantly correlated with TOC(55.2 mg/L). This is in accordance with (Guo et al., 2007) results forDaliao River watershed and underscores low aqueous solubilityand hydrophobic nature of PAHs which tend to associate withparticulate material, and finally deposited to underlying sedi-ments. Therefore, concentration and distribution of PAHs wouldbe more controlled by direct input than TOC. However, significantpositive correlations were observed among individual PAHs viz.,Ant, BaA and BbF (r¼0.7, Po0.01), Flu and Chr (r¼0.6, Po0.05),BaA and BbF (r¼0.1, Po0.01), Flua and BaP (r¼0.9, po0.01),dBahA and Chr (r¼0.9, po0.01), Coro and Phe (r¼0.7, po0.05),Coro and Pyr (r¼0.9, po0.01). Rajput and Lakhani (2009) foundthat correlated PAHs might be sharing common origins. Diesel fuelwas detected to be dominated by LMW PAHs while HMW werefound to be present in negligible concentration. HMW PAHs weredetected to be found in high concentration in emissions fromdiesel fuel combustion in comparison to LMW PAHs that areattributed to the pyro synthesis during fuel combustion in engine.
3.4. Source apportionment
3.4.1. Molecular diagnostic ratios for finger printingFor source analysis, molecular diagnostic ratios (MDRs) of
isomeric PAHs were used because they dilute to a similar extentand distributed equally in the environment (Dickhut et al., 2000).Many researchers demonstrated that the MDRs are likely to fail inthe source apportionment of PAHs (Katsoyiannis et al., 2011;Katsoyiannis and Breivik, 2014). In the present study, we havecalculated these ratios due to the very close proximity of theprobable sources and receptors and we believe that the results canbe of some assistance in order to identify the sources of PAHs.
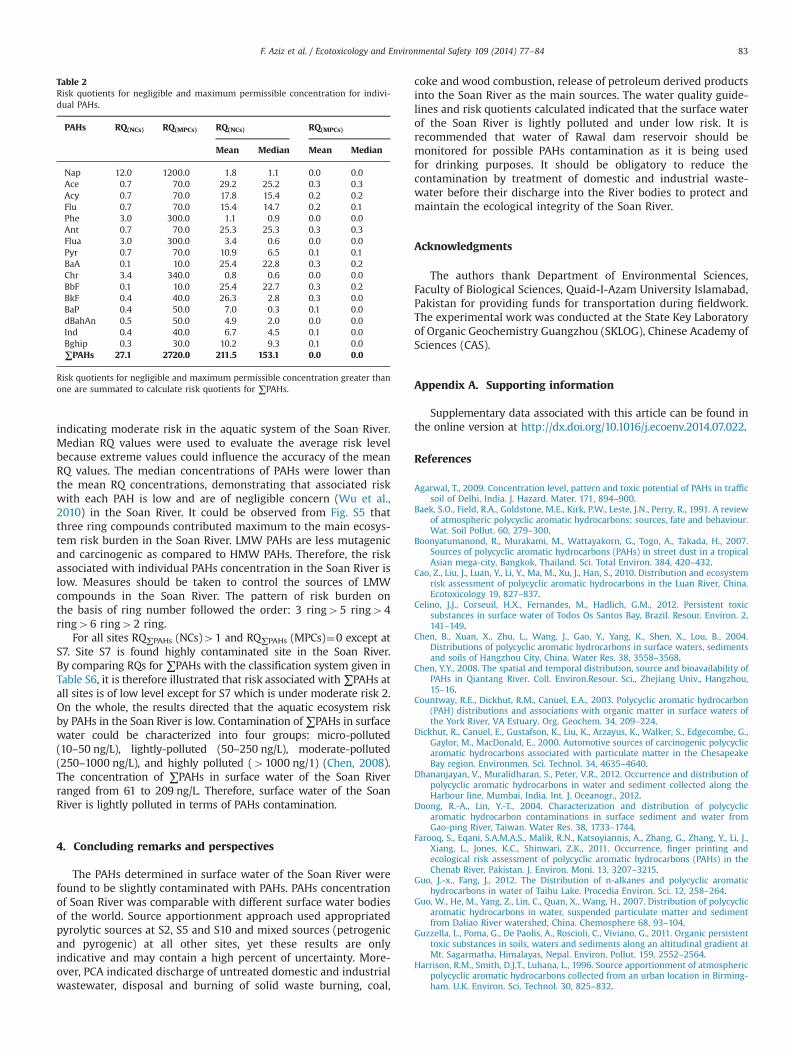
Zhang et al. (2005) suggested that diagnostic ratios of HMW PAHsas more reliable diagnostic indicators compared to LMW PAHsratios and characterized Ind/(IndþBghip) as the most reliablediagnostic ratio. Therefore, HMW PAHs diagnostic ratios viz., Ind/(IndþBghip) and BaA/(BaAþChr) were used in the study.Reported values of diagnostic ratios for a particular source wereillustrated in Table S3. The calculated ratios exist between 0.1–0.58and 0.01–0.92 which might favor contribution of both petroleumand coal combustion as PAHs origin (Fig. 4). Vehicular emissionsand release of petroleum derived products could be importantpetrogenic contamination sources in the Soan River, as the siteswere located in the vicinity of populated areas. While pyrogenicsources of PAHs can possibly include releases pyrogenic PAHs frommunicipal and industrial wastewater and burning of solid wastealong the River. Contamination of PAHs at all sites were related topetroleum and fossil fuel combustion and share the same sourcesexcept at S10, S2 and S5 which showed predominance of pyro-genic sources. S10 was located downstream of the Soan River in arural area where burning of wood and agricultural waste could bethe major source of contamination.
3.4.2. Principal component analysisPrincipal component analysis (PCA) transforms large data sets
into fewer significant dimensions and evaluates the degree ofcontribution for pollutant sources. PCA results are presented in(Table S4), which explains the variable loadings describing themajor contamination patterns and their explained variance. Fiveprincipal components accounting for 86 percent of the totalvariance were extracted through PCA. The first componentexplained 24 percent of total variance and predominately loadedwith benzo derivative of anthracene (BaA), BbF and Ant. Literaturereported BaA and BbF as related to vehicular (gas and diesel)generated PAHs (Larsen and Baker, 2003). While, loadings of Ant,has been related to petrochemical wastewater (Tian et al., 2009).Therefore, Factor 1 explains the compounds originating fromvehicular exhaust and industrial outfalls.
The second component (PC2) contributing 22 percent of totalvariance is heavily weighted with Flu, Chr and dBahA. Floureneand Chr are the dominants of the coke oven signature and reachthe Soan River via industrial wastewater and atmospheric fallout(Park et al., 2011). Hence, this component specifies coke combus-tion as PAHs sources. The third component characterized forsixteen percent of total variance. This factor is heavily loaded withPhe, Pyr and Coro. Phe and Pyr has been known as typical tracers
0% 10% 20% 30% 40% 50% 60% 70% 80% 90% 100%
PAHs
Nap Ace Acy Flu Phe Ant Flua Pyr BaA
Chr BbF BkF BaP dBahAn Ind Bghip Coro
2 ring 3 ring 4 ring 5 ring 6 ring
Fig. 3. Compositional Profile of PAHs in the Soan River.
F. Aziz et al. / Ecotoxicology and Environmental Safety 109 (2014) 77–84 81

for coal combustion (Harrison et al., 1996). Coal combustion inbrick kilns in near Soan River could impart PAHs to the River bodythrough atmospheric deposition. Coro has been identified as anindicative of diesel exhaust (Li and Kamens, 1993). Hence, compo-nent 3 is reflective of PAHs from coal combustion and dieselexhaust.
The fourth component contributed thirteen percent to the totalvariance and dominated by Flua and BaP. Dominance of fluor-anthene over other PAHs has been correlated to coal combustiongenerated PAHs (Masclet et al., 1986). While, wood burning incooking stoves explains the predominance of BaP (Li and Kamens,1993). Thus, this factor is selected to represent coal and woodcombustion as source of PAHs in the Soan River.
The fifth component is responsible for eleven percent of totalvariance and weighted by Nap, BkF and Acy. Naphthalene has beenassociated with vaporization or spill of petroleum related products(Zakaria et al., 2002). A lot of automobile service stations andworkshops emit their waste directly into the Soan River. Besidesthis, washing of heavy duty trucks and automobiles in the Rivercould increase the input of petroleum derived PAHs into the SoanRiver. Higher relative abundance of BkF and Acy has been identi-fied as a marker of diesel and gas-powered vehicle emissions(Boonyatumanond et al., 2007). Hence, component 5 is represen-tative of PAHs from petroleum related products and their combus-tion in automobile engine exhausts. The PCA has representedsimilarity of results obtained with MDRs for PAHs which assumedmixed sources of pyrogenic and petrogenic deriving PAHs in theSoan River.
3.5. Potential toxicity of carcinogenic PAHs
IARC (1987) has identified Chr, BaA, BkF, BbF, Ind, BaP, anddBahA as possible carcinogens. The level of carcinogenic PAHs(C-PAHs) in surface water ranged from 0.001 to 6.47 ng/l excludingexceptionally higher value (94.89 ng/L) of BkF at S7 and 25.54 ng/Lof BaP (the best known member of C-PAHs) at S10 (Fig. S3). Theconcentration of C-PAHs was relatively higher in Soan River (17.6percent) compared to Gomti River (6.93 percent) (Malik et al.,2011). BaP (a known carcinogen) was not detected at S2, S6, S8,and S9. Due to absence of threshold levels set by the governmentof Pakistan, concentration of BaP in the Soan River was comparedwith China Surface Water Environment Standard for BaP (2.8 ng/L)(Guo and Fang, 2012). Only S10 sample among all water samples isdetected to have BaP exceeding the limited value (Fig. S4). Wood
burning in cooking stoves explains the predominance of BaP (Liand Kamens, 1993).
In the present work, toxic equivalent factors (TEF) calculated byUSEPA, 1993 were employed to calculate the carcinogenicity ofseven carcinogenic PAHs (C-PAHs) with relevance to BaP. The toxicequivalents (TEQ) of the C-PAHs were calculated with the follow-ing equation (Nadal et al., 2004):
TEQ ¼ Ci� TEFi ð1Þwhere Ci and TEFi are the concentration and TEF of the C-PAHsrespectively. The total TEQ of PAHs in surface water of Soan Rivervaried from 0.57 ng/L (S6) to 30.5 ng/L (S10) with an average of6.13 ng/L. The total concentration of C-PAHs were recorded highestat Site 7 but ∑7PAH concentrations at S10 were found to havehighest carcinogenic potential (Figs. S3, S4). This is because of thehigher concentration of BaP at S10 which has higher carcinogenitypotential. TEQ value for BaP and DBahA, were found to be greaterthan one and it should have to be lowered to one. The meancontribution of the seven C-PAHs to the total TEQ decreased in thefollowing order (Table S5): BaP4DBahA4 Ind4BaA4BbF4BkF4Chr. We found that the level of carcinogenic PAHs in allwater samples have no harmful biological effects except for BaPand dBahA in the Soan River.
3.6. Ecological risk assessment
Ecological risk assessment (ERA) using Risk Quotients (RQ) isused for the evaluation of the undesirable impacts caused by theenvironmental pollutants in an ecological system. For evaluationof the ecosystem risk by PAHs in the Soan River, Risk Quotients ofnegligible concentration (RQ(NCs)) and maximum permissible con-centration (RQ(MPCs)) for individual PAHs and ∑PAHs were calcu-lated and compared with their reference quality values in thepresent study. In Pakistan, no data regarding reference valuesexists for organic contaminants, so the values reported by (Kalfet al., 1997) were used. The methodology for risk evaluation isdetailed elsewhere (Cao et al., 2010). In principle, if both RQNCs
and RQMPCs are 41 for individual PAH then the risk is high andimmediate actions should be taken. When RQNCs is 41 andRQMPCs is o1 then the risk associated with PAHs contaminationis mid-line. Risk classification for ∑PAHs is given in Table S6.
The mean and median concentration of RQNCs and RQMPCs forindividual PAHs was reported in Table 2. The results showed thatRQ(NCs) were 41 and RQ(MPCs) o1 for all individual PAHs
Fig. 4. Cross plot for the ratios: Ind/(IndþBghip) vs. BaA/(BaAþChr).
F. Aziz et al. / Ecotoxicology and Environmental Safety 109 (2014) 77–8482
indicating moderate risk in the aquatic system of the Soan River.Median RQ values were used to evaluate the average risk levelbecause extreme values could influence the accuracy of the meanRQ values. The median concentrations of PAHs were lower thanthe mean RQ concentrations, demonstrating that associated riskwith each PAH is low and are of negligible concern (Wu et al.,2010) in the Soan River. It could be observed from Fig. S5 thatthree ring compounds contributed maximum to the main ecosys-tem risk burden in the Soan River. LMW PAHs are less mutagenicand carcinogenic as compared to HMW PAHs. Therefore, the riskassociated with individual PAHs concentration in the Soan River islow. Measures should be taken to control the sources of LMWcompounds in the Soan River. The pattern of risk burden onthe basis of ring number followed the order: 3 ring45 ring44ring46 ring42 ring.
For all sites RQ∑PAHs (NCs)41 and RQ∑PAHs (MPCs)¼0 except atS7. Site S7 is found highly contaminated site in the Soan River.By comparing RQs for ∑PAHs with the classification system given inTable S6, it is therefore illustrated that risk associated with∑PAHs atall sites is of low level except for S7 which is under moderate risk 2.On the whole, the results directed that the aquatic ecosystem riskby PAHs in the Soan River is low. Contamination of∑PAHs in surfacewater could be characterized into four groups: micro-polluted(10–50 ng/L), lightly-polluted (50–250 ng/L), moderate-polluted(250–1000 ng/L), and highly polluted (41000 ng/1) (Chen, 2008).The concentration of ∑PAHs in surface water of the Soan Riverranged from 61 to 209 ng/L. Therefore, surface water of the SoanRiver is lightly polluted in terms of PAHs contamination.
4. Concluding remarks and perspectives
The PAHs determined in surface water of the Soan River werefound to be slightly contaminated with PAHs. PAHs concentrationof Soan River was comparable with different surface water bodiesof the world. Source apportionment approach used appropriatedpyrolytic sources at S2, S5 and S10 and mixed sources (petrogenicand pyrogenic) at all other sites, yet these results are onlyindicative and may contain a high percent of uncertainty. More-over, PCA indicated discharge of untreated domestic and industrialwastewater, disposal and burning of solid waste burning, coal,
coke and wood combustion, release of petroleum derived productsinto the Soan River as the main sources. The water quality guide-lines and risk quotients calculated indicated that the surface waterof the Soan River is lightly polluted and under low risk. It isrecommended that water of Rawal dam reservoir should bemonitored for possible PAHs contamination as it is being usedfor drinking purposes. It should be obligatory to reduce thecontamination by treatment of domestic and industrial waste-water before their discharge into the River bodies to protect andmaintain the ecological integrity of the Soan River.
Acknowledgments
The authors thank Department of Environmental Sciences,Faculty of Biological Sciences, Quaid-I-Azam University Islamabad,Pakistan for providing funds for transportation during fieldwork.The experimental work was conducted at the State Key Laboratoryof Organic Geochemistry Guangzhou (SKLOG), Chinese Academy ofSciences (CAS).
Appendix A. Supporting information
Supplementary data associated with this article can be found inthe online version at http://dx.doi.org/10.1016/j.ecoenv.2014.07.022.
References
Agarwal, T., 2009. Concentration level, pattern and toxic potential of PAHs in trafficsoil of Delhi, India. J. Hazard. Mater. 171, 894–900.
Baek, S.O., Field, R.A., Goldstone, M.E., Kirk, P.W., Leste, J.N., Perry, R., 1991. A reviewof atmospheric polycyclic aromatic hydrocarbons: sources, fate and behaviour.Wat. Soil Pollut. 60, 279–300.
Boonyatumanond, R., Murakami, M., Wattayakorn, G., Togo, A., Takada, H., 2007.Sources of polycyclic aromatic hydrocarbons (PAHs) in street dust in a tropicalAsian mega-city, Bangkok, Thailand. Sci. Total Environ. 384, 420–432.
Cao, Z., Liu, J., Luan, Y., Li, Y., Ma, M., Xu, J., Han, S., 2010. Distribution and ecosystemrisk assessment of polycyclic aromatic hydrocarbons in the Luan River, China.Ecotoxicology 19, 827–837.
Celino, J.J., Corseuil, H.X., Fernandes, M., Hadlich, G.M., 2012. Persistent toxicsubstances in surface water of Todos Os Santos Bay, Brazil. Resour. Environ. 2,141–149.
Chen, B., Xuan, X., Zhu, L., Wang, J., Gao, Y., Yang, K., Shen, X., Lou, B., 2004.Distributions of polycyclic aromatic hydrocarbons in surface waters, sedimentsand soils of Hangzhou City, China. Water Res. 38, 3558–3568.
Chen, Y.Y., 2008. The spatial and temporal distribution, source and bioavailability ofPAHs in Qiantang River. Coll. Environ.Resour. Sci., Zhejiang Univ., Hangzhou,15–16.
Countway, R.E., Dickhut, R.M., Canuel, E.A., 2003. Polycyclic aromatic hydrocarbon(PAH) distributions and associations with organic matter in surface waters ofthe York River, VA Estuary. Org. Geochem. 34, 209–224.
Dickhut, R., Canuel, E., Gustafson, K., Liu, K., Arzayus, K., Walker, S., Edgecombe, G.,Gaylor, M., MacDonald, E., 2000. Automotive sources of carcinogenic polycyclicaromatic hydrocarbons associated with particulate matter in the ChesapeakeBay region. Environmen. Sci. Technol. 34, 4635–4640.
Dhananjayan, V., Muralidharan, S., Peter, V.R., 2012. Occurrence and distribution ofpolycyclic aromatic hydrocarbons in water and sediment collected along theHarbour line, Mumbai, India. Int. J. Oceanogr., 2012.
Doong, R.-A., Lin, Y.-T., 2004. Characterization and distribution of polycyclicaromatic hydrocarbon contaminations in surface sediment and water fromGao-ping River, Taiwan. Water Res. 38, 1733–1744.
Farooq, S., Eqani, S.A.M.A.S., Malik, R.N., Katsoyiannis, A., Zhang, G., Zhang, Y., Li, J.,Xiang, L., Jones, K.C., Shinwari, Z.K., 2011. Occurrence, finger printing andecological risk assessment of polycyclic aromatic hydrocarbons (PAHs) in theChenab River, Pakistan. J. Environ. Moni. 13, 3207–3215.
Guo, J.-x., Fang, J., 2012. The Distribution of n-alkanes and polycyclic aromatichydrocarbons in water of Taihu Lake. Procedia Environ. Sci. 12, 258–264.
Guo, W., He, M., Yang, Z., Lin, C., Quan, X., Wang, H., 2007. Distribution of polycyclicaromatic hydrocarbons in water, suspended particulate matter and sedimentfrom Daliao River watershed, China. Chemosphere 68, 93–104.
Guzzella, L., Poma, G., De Paolis, A., Roscioli, C., Viviano, G., 2011. Organic persistenttoxic substances in soils, waters and sediments along an altitudinal gradient atMt. Sagarmatha, Himalayas, Nepal. Environ. Pollut. 159, 2552–2564.
Harrison, R.M., Smith, D.J.T., Luhana, L., 1996. Source apportionment of atmosphericpolycyclic aromatic hydrocarbons collected from an urban location in Birming-ham. U.K. Environ. Sci. Technol. 30, 825–832.
Table 2Risk quotients for negligible and maximum permissible concentration for indivi-dual PAHs.
PAHs RQ(NCs) RQ(MPCs) RQ(NCs) RQ(MPCs)
Mean Median Mean Median
Nap 12.0 1200.0 1.8 1.1 0.0 0.0Ace 0.7 70.0 29.2 25.2 0.3 0.3Acy 0.7 70.0 17.8 15.4 0.2 0.2Flu 0.7 70.0 15.4 14.7 0.2 0.1Phe 3.0 300.0 1.1 0.9 0.0 0.0Ant 0.7 70.0 25.3 25.3 0.3 0.3Flua 3.0 300.0 3.4 0.6 0.0 0.0Pyr 0.7 70.0 10.9 6.5 0.1 0.1BaA 0.1 10.0 25.4 22.8 0.3 0.2Chr 3.4 340.0 0.8 0.6 0.0 0.0BbF 0.1 10.0 25.4 22.7 0.3 0.2BkF 0.4 40.0 26.3 2.8 0.3 0.0BaP 0.4 50.0 7.0 0.3 0.1 0.0dBahAn 0.5 50.0 4.9 2.0 0.0 0.0Ind 0.4 40.0 6.7 4.5 0.1 0.0Bghip 0.3 30.0 10.2 9.3 0.1 0.0∑PAHs 27.1 2720.0 211.5 153.1 0.0 0.0
Risk quotients for negligible and maximum permissible concentration greater thanone are summated to calculate risk quotients for ∑PAHs.
F. Aziz et al. / Ecotoxicology and Environmental Safety 109 (2014) 77–84 83
Hossain, M.A., Yeasmin, F., Mizanur Rahman, S., Rana, M., 2011. Gas chromato-graph–mass spectrometry determination of carcinogenic naphthalene, anthra-cene, phenanthrene and fluorene in the Bangsai river water of Bangladesh.Arab. J. Chem..
IARC, 1987. Polynuclear aromatic compounds, Part 1. chemicals. IARC Monographson the Evaluation of the Carcinogenic Risk to Humans, Environmental andExperimental Data, Lyon, France.
Jan, F.A., Khan, S., Ishaq, M., Naeem, M., Ahmad, I., Hussain, S., 2013. Brick kilnexhaust as a source of polycyclic aromatic hydrocarbons (PAHs) in thesurrounding soil and plants: a case study from the city of Peshawar, Pakistan.Arab. J. Geosci..
Kafilzadeh, F., Shiva, A.H., Malekpour, R., 2011. Determination of PolycyclicAromatic Hydrocarbons (PAHs) in water and sediments of the Kor River, Iran.Middle-East J. Sci. Res. 10, 01–07.
Kalf, D.F., Crommentuijn, T., van de Plassche, E.J., 1997. Environmental qualityobjectives for 10 polycyclic aromatic hydrocarbons (PAHs). Ecotoxicol. Environ.Saf. 36, 89–97.
Katayama, A., Bhula, R., Burns, G.R., Carazo, E., Felsot, A., Hamilton, D., Harris, C.,Kim, Y.-H., Kleter, G., Koerdel, W., Linders, J., Peijnenburg, J.G.M.W., Sabljic, A.,Stephenson, R.G., Racke, D.K., Rubin, B., Tanaka, K., Unsworth, J., Wauchope, R.D., 2010. Bioavailability of xenobiotics in the soil environment. Rev. Environ.Contam. Toxicol. 203, 1–86.
Katsoyiannis, A., Breivik, K., 2014. Model-based evaluation of the use of polycyclicaromatic hydrocarbons molecular diagnostic ratios as a source identificationtool. Environ. Pollut. 184, 488–494.
Katsoyiannis, A., Sweetman, A.J., Jones, K.C., 2011. PAH molecular diagnostic ratiosapplied to atmospheric sources: a critical evaluation using two decades ofsource inventory and air concentration data from the UK. Environ. Sci. Technol.45, 8897–8906.
Larsen, R.K., Baker, J.E., 2003. Source apportionment of polycyclic aromatic hydro-carbons in the urban atmosphere: a comparison of three methods. Environ. Sci.Technol. 37, 1873–1881.
Li, C.K., Kamens, R.M., 1993. The use of polycyclic aromatic hydrocarbons as sourcesignatures in receptor modeling. Atmos. Environ. Part A. Gen. Top. 27, 523–532.
Malik, A., Singh, K., Mohan, D., Patel, D., 2004. Distribution of polycyclic aromatichydrocarbons in Gomti river system, India. Bull. Environ. Contam. Toxicol.72,1211–1218.
Malik, A., Verma, P., Singh, A.K., Singh, K.P., 2011. Distribution of polycyclic aromatichydrocarbons in water and bed sediments of the Gomti River, India. Environ.Monit. Assess. 172, 529–545.
Manoli, E., Samara, C., Konstantinou, I., Albanis, T., 2000. Polycyclic aromatichydrocarbons in the bulk precipitation and surface waters of Northern Greece.Chemosphere 41, 1845–1855.
Martellini, T., Giannoni, M., Lepri, L., Katsoyiannis, A., Cincinelli, A., 2012. One yearintensive PM2.5 bound polycyclic aromatic hydrocarbons monitoring in the areaof Tuscany, Italy. Concentrations, source understanding and implications.Environ. Pollut. 164, 252–258.
Masclet, P., Mouvier, G., Nikolaou, K., 1986. Relative decay index and sources ofpolycyclic aromatic hydrocarbons. Atmos. Environ. 20, 439–446.
Maskaoui, K., Zhou, J., Hong, H., Zhang, Z., 2002. Contamination by polycyclicaromatic hydrocarbons in the Jiulong River estuary and Western Xiamen Sea,China. Environ. Pollut. 118, 109–122.
Mitra, S., Bianchi, T., 2003. A preliminary assessment of polycyclic aromatichydrocarbon distributions in the lower Mississippi River and Gulf of Mexico.Mar. Chem. 82, 273–288.
Moore, J.W., Ramamoorthy, S., 1984. Organic chemicals in natural waters: appliedmonitoring and impact assessment.
Mottaleb, M., Sarma, D., Sultana, S., Husain, M., Alam, S., Salehuddin, S., 2003.Determination of normal saturated-and polycyclic aromatic hydrocarbons inthe river water of Bangladesh by liquid–liquid extraction and gas chromato-graphy. Bull.-Kor. Chem. Soc. 24, 99–105.
Murtaza, G., Zia, M.H., 2011. Individual's capacity development on the safe use ofwastewater in agriculture in Pakistan. Inst. Soil Environ. Sci., Univ. Agric.,Faislabad.
Nadal, M., Schuhmacher, M., Domingo, J., 2004. Levels of PAHs in soil andvegetation samples from Tarragona County, Spain. Environ. Pollut. 132, 1–11.
Nagy, A., Simon, G., Vass, I., 2012. Monitoring of polycyclic aromatic hydrocarbons(PAHs) in surface water of the Hungarian upper section of the Danube River.
Nagy, A.S., Simon, G., Szabó, J., Vass, I., 2013. Polycyclic aromatic hydrocarbons insurface water and bed sediments of the Hungarian upper section of the DanubeRiver. Environ. Monit. Assess. 185, 4619–4631.
Nagy, P., Fekete, J., Sharma, V.K., 2007. Polycyclic aromatic hydrocarbons (PAHs) insurface waters of Rackevei-Soroksari Danube Branch, Hungary. J. Environ. Sci.Health Part A 42, 231–240.
Nemr, A., E, Abd-Allah, A., M,A, 2003. Contamination of polycyclic aromatichydrocarbons (PAHs) in microlayer and subsurface waters along Alexandriacoast. Egypt. Chemosphere 52, 1711–1716.
Olajire, A.A., Alade, A.O., Adeniyi, A.A., Olabemiwo, O.M., 2007. Distribution ofpolycyclic aromatic hydrocarbons in surface soils and water from the vicinity of
Agbabu bitumen field of Southwestern Nigeria. J. Environ. Sci. Health 42,1043–1049.
Olivella, M.n., 2006. Polycyclic aromatic hydrocarbons in rainwater and surfacewaters of Lake Maggiore, a subalpine lake in Northern Italy. Chemosphere 63,116–131.
Pacyna, J.M., Breivik, K., Münch, J., Fudala, J., 2003. European atmospheric emissionsof selected persistent organic pollutants, 1970–1995. Atmos. Environ. 37,119–131.
Park, S.-U., Kim, J.-G., Jeong, M.-J., Song, B.-J., 2011. Source identification ofatmospheric polycyclic aromatic hydrocarbons in industrial complex usingdiagnostic ratios and multivariate factor analysis. Arch. Environ. Contam.Toxicol. 60, 576–589.
Pathiratne, K., De Silva, O., Hehemann, D., Atkinson, I., Wei, R., 2007. Occurrenceand distribution of polycyclic aromatic hydrocarbons (PAHs) in Bolgoda andBeira Lakes. 79. Bulletin of Environmental Contamination and Toxicology, SriLanka, pp. 135–140.
Patrolecco, L., Ademollo, N., Capri, S., Pagnotta, R., Polesello, S., 2010. Occurrence ofpriority hazardous PAHs in water, suspended particulate matter, sediment andcommon eels (Anguilla anguilla) in the urban stretch of the River Tiber (Italy).Chemosphere 81, 1386–1392.
Qiu, Y.-W., Zhang, G., Liu, G.-Q., Guo, L.-L., Li, X.-D., Wai, O., 2009. Polycyclicaromatic hydrocarbons (PAHs) in the water column and sediment core of DeepBay, South China. Estuar., Coast. Shelf Sci. 83, 60–66.
Rajput, N., Lakhani, A., 2009. Measurements of polycyclic aromatic hydrocarbons atan industrial site in India. Environ. Monit. Assess. 150, 273–284.
Scott, H.E., Aherne, J., Metcalfe, C.D., 2012. Fate and transport of polycyclic aromatichydrocarbons in upland irish headwater lake catchments. Sci. World J., 2012.
Shabeer, T., Saha, A., Gajbhiye, V., Gupta, S., 2013. Optimization and validation ofLLE/HPLC-DAD method to determine the residues of selected PAHs in surfacewater. Int. J. Agriculture, Environ. Biotechnol. 6, 241–248.
Shaw, M., Tibbetts, I.R., Müller, J.F., 2004. Monitoring PAHs in the Brisbane River andMoreton Bay, Australia, using semipermeable membrane devices and ERODactivity in yellowfin bream, Acanthopagrus australis. Chemosphere 56, 237–246.
Shi, Z., Tao, S., Pan, B., Fan, W., He, X., Zuo, Q., Wu, S., Li, B., Cao, J., Liu, W., 2005.Contamination of rivers in Tianjin, China by polycyclic aromatic hydrocarbons.Environ. Pollut. 134, 97–111.
Srinivasa Reddy, M., Basha, S., Joshi, H., Ramachandraiah, G., 2005. Seasonaldistribution and contamination levels of total PHCs, PAHs and heavy metalsin coastal waters of the Alang–Sosiya ship scrapping yard, Gulf of Cambay,India. Chemosphere 61, 1587–1593.
Taioli, E., Sram, R.J., Garte, S., Kalina, I., Popov, T.A., Farmer, P.B., 2007. Effects ofpolycyclic aromatic hydrocarbons (PAHs) in environmental pollution on exo-genous and oxidative DNA damage (EXPAH project): description of thepopulation under study. Mut. Res./Fundament. Mol. Mech. Mutagen. 620, 1–6.
Tian, F.L., Chen, J.W., Qiao, X.L., Wang, Z., Yang, P., Wang, D.G., Ge, L.K., 2009. Sourcesand seasonal variation of atmospheric polycyclic aromatic hydrocarbons inDalian, China: Factor analysis with non-negative constraints combined withlocal source fingerprints. Atmos. Environ. 43, 2747–2753.
USEPA, 1984. Guidelines Establishing Test Procedures for the Analysis of Pollutants.Proposed Regulations, United States Environmental Protection Agency, FederalRegister. EPA, Washington, DC p. 209.
Wang, L., Yang, Z., Niu, J., Wang, J., 2009. Characterization, ecological risk assess-ment and source diagnostics of polycyclic aromatic hydrocarbons in watercolumn of the Yellow River Delta, one of the most plenty biodiversity zones inthe world. J. Hazard. Mater. 169, 460–465.
Wilcke, W., 2000. Synopsis polycyclic aromatic hydrocarbons (PAHs) in soil—areview. J. Plant Nutr. Soil Sci. 163, 229–248.
Wolska, L., Zygmunt, B., Namieśnik, J., 2003. Organic pollutants in the Odra riverecosystem. Chemosphere 53, 561–569.
Wu, B., Zhang, Y., Zhang, X., Cheng, S., 2010. Health risk from exposure of organicpollutants through drinking water consumption in Nanjing, China. Bull.Environ. Contam. Toxicol. 84, 46–50.
Yang, Y., Shi, X., Wong, P., Dawson, R., Xu, F., Liu, W., Tao, S., 2006. An approach toassess ecological risk for polycyclic aromatic hydrocarbons (PAHs) in surfacewater from Tianjin. J. Environ. Sci. Health Part A 41, 1463–1482.
Zahra, A., Hashmi, M.Z., Malik, R.N., Ahmed, Z., 2014. Enrichment and geo-accumulation of heavy metals and risk assessment of sediments of the KurangNallah—Feeding tributary of the Rawal Lake Reservoir, Pakistan. Sci. TotalEnviron. 470, 925–933.
Zakaria, M.P., Takada, H., Tsutsumi, S., Ohno, K., Yamada, J., Kouno, E., Kumata, H.,2002. Distribution of polycyclic aromatic hydrocarbons (PAHs) in rivers andestuaries in Malaysia: a widespread input of petrogenic PAHs. Environ. Sci.Technol. 36, 1907–1918.
Zhang, X.L., Tao, S., Liu, W.X., Yang, Y., Zuo, Q., Liu, S.Z., 2005. Source diagnostics ofpolycyclic aromatic hydrocarbons based on species ratios: a multimediaapproach. Environ. Sci. Technol. 39, 9109–9114.
Zhang, Z., Huang, J., Yu, G., Hong, H., 2004. Occurrence of PAHs, PCBs andorganochlorine pesticides in the Tonghui River of Beijing, China. Environ.Pollut. 130, 249–261.
F. Aziz et al. / Ecotoxicology and Environmental Safety 109 (2014) 77–8484