Exudation of whey from cheese during storage
378
Copyright is owned by the Author of the thesis. Permission is given for a copy to be downloaded by an individual for the purpose of research and private study only. The thesis may not be reproduced elsewhere without the permission of the Author.
-
Upload
khangminh22 -
Category
Documents
-
view
1 -
download
0
Transcript of Exudation of whey from cheese during storage

Copyright is owned by the Author of the thesis. Permission is given for a copy to be downloaded by an individual for the purpose of research and private study only. The thesis may not be reproduced elsewhere without the permission of the Author.

EXUDATION OF WHEY FROM CHEESE DURING STORAGE
A thesis presented
in p artial fulfilment
of the requirements for the
degree of Doctor of Philosophy
in Food Technology at Massey University
Prabandha Kumar Samal
1991

Title of thesis:
Massey University Library Thesis Copyright Form
(1) (a) I give permission for my thesis to be made available to
readers in Massey University Library under conditions
determined by the Librarian.
(b) I do not wisfi m:y thesis to be ffiade available to readers without my written consent for . . . months.
(2) (a) I agree that my thesis, or a copy, may be sent to
another institution under conditions determined by the
Librarian.
(b) I do not wish my thesis, or a copy, to be sent to ·
another institution without my written consent for month�-
• • '*T'
(3) (a) I agree that my thesis may be copied for Library use.
(b) I do not wish my thesis to be copied for Library use for --.-.--.- mo:t:�.th�
Signed
The copyright of this thesis belongs to the author. Readers must
sign their name in the space below to show that they recognise
this. They are asked to add their permanent address.
NAME AND ADDRESS
Pv"' h � "'� � 'K lA W\P�. v So..'W'.o..l too.,\ T�cL..W>lo j':J 1)e_�.rt---�T tv\tAS�/ U�V(.¥�� P"'\�.e. '< s�� 1'\o./t. 15
N£A.J 2-e ..... \�"'J. .
MASSEY UNIVERSl l LIBRARY
DATE
\9.· 2· 144\
i i
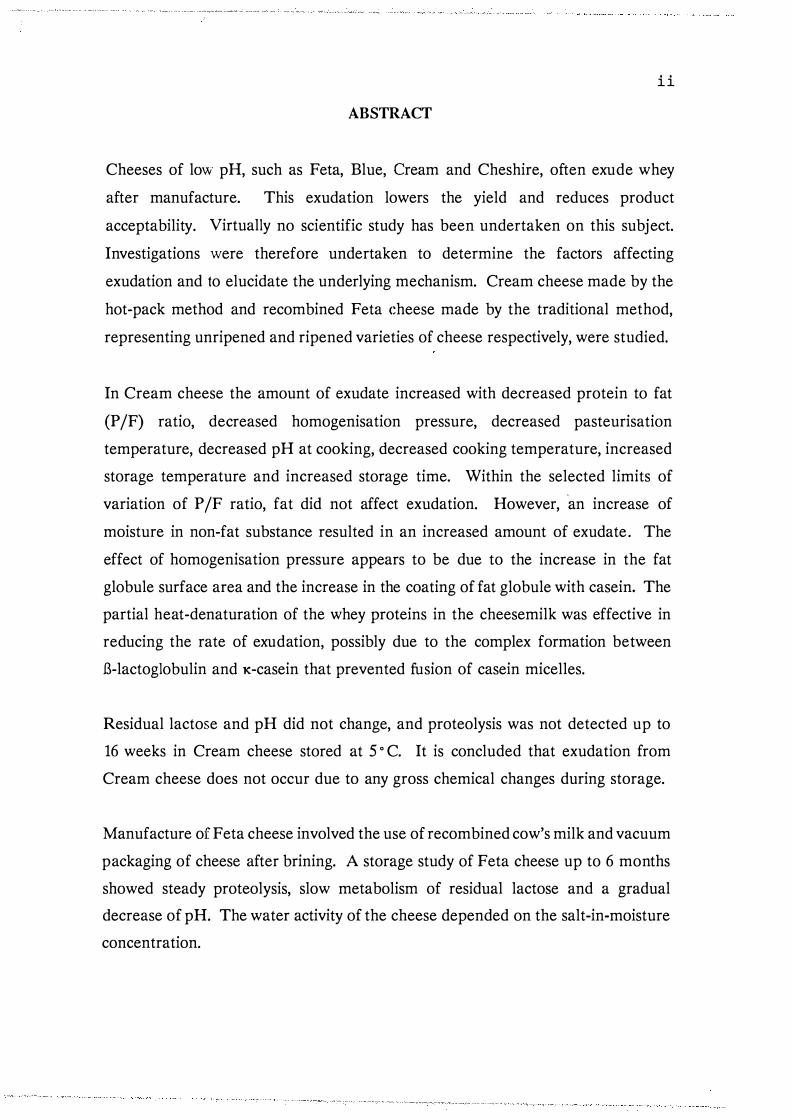
ABSTRACT
Cheeses of low pH, such as Feta, Blue, Cream and Cheshire, often exude whey
after manufacture. This exudation lowers the yield and reduces product
acceptability. Virtually no scientific study has been undertaken on this subject.
Investigations were therefore undertaken to determine the factors affecting
exudation and to elucidate the underlying mechanism. Cream cheese made by the
hot-pack method and recombined Feta cheese made by the traditional method,
representing unripened and ripened varieties of cheese respectively, were studied.
In Cream cheese the amount of exudate increased with decreased protein to fat
(P /F) ratio, decreased homogenisation pressure, decreased pasteurisation
temperature, decreased pH at cooking, decreased cooking temperature, increased
storage temperature and increased storage time. Within the selected limits of
variation of P /F ratio, fat did not affect exudation. However, 'an increase of
moisture in non-fat substance resulted in an increased amount of exudate . The
effect of homogenisation pressure appears to be due to the increase in the fat
globule surface area and the increase in the coating of fat globule with casein. The
partial heat-denaturation of the whey proteins in the cheesemilk was effective in
reducing the rate of exudation, possibly due to the complex formation between
13-lactoglobulin and K-casein that prevented fusion of casein micelles.
Residual lactose and pH did not change, and proteolysis was not detected up to
16 weeks in Cream cheese stored at 5 · C. It is concluded that exudation from
Cream cheese does not occur due to any gross chemical changes during storage.
Manufacture of Feta cheese involved the use of recombined cow's milk and vacuum
packaging of cheese after brining. A storage study of Feta cheese up to 6 months
showed steady proteolysis, slow metabolism of residual lactose and a gradual
decrease of pH. The water activity of the cheese depended on the salt-in-moisture
concentration.

i i i
In Feta cheese the amount of exudate increased with increased P /F ratio, increased
pH at draining, increased residual rennet, packaging cheese without vacuum,
increased storage temperature and increased storage time. Variation of priming
time, with a constant curd pH at draining, did not affect exudation. Unlike Cream
cheese, an increase in protein and a decrease in fat content in Feta correlated with
increase in the amount of exudate. The effects of change in pH and calcium
(within a range expected in normal Feta) on exudation were minor.
Homogenisation was effective in reducing the rate of exudation in Feta cheese.
However, a variation in the homogenisation pressure had no effect. The type of
material adsorbed to the fat globule surface influences syneresis during
manufacture as well as subsequent exudation during storage. The effect of a
reduction in the size of fat globules on exudation appears to be less important.
In Feta cheese the incorporation of heat-denatured whey proteins did not affect
exudation. However, there was a substantial increase in yield.
Proteolysis is the dominant factor affecting exudation. Its influence is apparently
due to the disintegration of the casein network and the release of water physically
held in the capillaries. Exudation is also substantially influenced by the gradient
in NaCl concentration in Feta cheese following brining.
Denaturation of whey proteins in Cream cheese; and homogenisation, controlled
proteolysis, decreased salt gradient, use of vacuum packaging in Feta cheese appear
to be the main factors available for reducing the extent of exudation. Based on the
findings of the investigation a hypothesis is proposed to explain the exudation from
cheeses.

IV
ACKNOWLEDGEMENTS
I wish to express my appreciation and deep sense of gratitude to my supervisors:
Dr John Lelievre, for providing guidance and the basic framework for the project
during the initial phase of study; Mr Rod J. Bennett, for the general supervision
and guidance, encouragement and the generous help in preparation of the
manuscript; Dr Kevin N. Pearce, for providing the major impetus to the
investigation, for his invaluable scientific critique, and for his patience during
numerous sessions of discussions and editing of the thesis; and
Mr Frank P. Dunlop, for arranging the facilities for cheesemaking trials and making
available his wealth of experience in cheese technology.
I am grateful to the New Zealand Dairy Research Institute (NZDRI) for the
facilities made available for carrying out the experimental work and the opportunity
to work with the distinguished scientists.
I am indebted to Dr Frank G. Martley, Dr Harjinder Singh, Mr Keith A. Johnston,
Dr Krish R. Aiyar, Dr Reyad R. Shaker (and their families) for the continued
guidance, support and friendship.
I am extremely grateful to the following staff members at the NZDRI:
Miss E. Jenni Madwick, for the help in designing the experiments and
statistical analysis of all the data.
Mr Arran D. Breslin, for the help with analyses involving PAGE and HPLC.
Dr Alastair K.H. MacGibbon, for useful discussions and help in DSC study.
Mr John Gilles, Dr Vaughan L. Crow, Dr R. C. Lawrence, Dr Lawrie
C. Creamer, Dr Rose L. Motion and Mr Gerhard K. Hoppe, for helpful
discussions.
Mr David C. W. Reid, Miss Nicky J. Maxwell, Miss Yvonne E. van der
Does, Miss Jillian M. Smith, Ms Mary-Jo Ray and Mrs Christina J. Coker
for the assistance received with some specific analyses.

V
Mr 0. J. Freese, Mrs. Joan M Bennett, Mr Keith Montgomorie, Mr G.
Steve Boleyn, Mr Malcolm J. Montgomorie, Mr Michael F. Lawson, and Mr
Derek C. Goodwin, for the help during cheesemaking.
Mr Errol F. Conaghan and his staff, for the help in chemical analysis of
some of the samples.
Mr Paul J. Le Ceve, for the preparation of the photographs.
Mr Peter J. Rykenberg and Mr Dan F. Legg, for assistance with the word
processor.
I extend my thanks to many friends, at Massey University (Food Technology
Department, in particular) and NZDRI, who have been of help in many little ways.
The financial support in the form of a Commonwealth scholarship, awarded by the
Government of New Zealand, is gratefully acknowledged. Thanks are due to the
Government of India, for having nominated me for this award; and the National
Dairy Development Board, Anand, India, for having granted study leave.
I am grateful to my parents and family members for providing the moral support
and encouragement for this study.
Finally, many thanks to my wife, Dolly, who was most understanding and readily
shared the stress and strain during the course of the study. Thanks are also due
to our daughter, Deepika, who had to put up without me for most of the time in
her second year.

Vl
TABLE OF CONTENTS
Page
ABSTRACT ii
ACKNOWLEDGEMENTS 1v
TABLE OF CONTENTS vi
LIST OF FIGURES xii
LIST OF TABLES xiv
LIST OF APPENDICES XIX
ABBREVIATIONS xxiii
CHAPTER 1 INTRODUCTION 1
CHAPTER 2 REVIEW OF LITERATURE 3
2.1 Introduction 3
2.2 Gels 3
2.2.1 Introduction 3
2.2.2 Rennet-induced gels in milk and cheese 4
2.2.3 Acid-induced gels in yoghurt 12
2.3 Emulsions 16
2.3.1 Introduction 16
2.3.2 Emulsification of fat in milk and cheese 17
2.3.3 Influence of materials at the fat-serum interface on
the emulsion stability 18
2.4 Incorporation of whey protein in cheese 21
2.4.1 Introduction 21
2.4.2 Incorporation of native whey protein in cheese by
ultrafiltration 22
2.4.3 Incorporation of denatured whey protein in cheese by
heat treatment of cheesemilk 23
2.4.4 Incorporation of whey protein in cheese by addition of
heat-denatured whey protein to cheesemilk
2.4.5 Role of whey proteins in proteolysis of cheese
2.5 Cream Cheese
2.5.1 Introduction
2.5.2 Composition
25
27
28
28
28

2.5.3 Manufacturing technique
2.5.4 Modified methods
2.6 Feta cheese
2.6.1 Introduction
2.6.2 Flavour
2.6.3 Texture
2.6.4 Colour
2.6.5 Composition
2.6.6 Manufacturing techniques
2.6.7 Changes in brine-stored Feta cheese during storage
2.7 Salt diffusion
2.7.1 Introduction
2.7.2 Theories on salt diffusion
2.7.3 Factors affecting salt diffusion
2.7.4 Influence of salt on ripening of cheese
2.8 Changes in cheese during storage
2.8.1 Residual lactose, acidity and pH of cheese
2.8.2 Residual enzymes in cheese
2.8.3 Calcium in cheese
2.8.4 Proteolysis in cheese
2.8.5 Water activity (�) of cheese
2.8.6 Water-binding properties of proteins
CHAPTER 3 SCOPE AND OBJECTIVES OF THE
PRESENT INVESTIGATION
CHAPTER 4 ANALYTICAL METHODS AND SENSORY
EVALUATION
4.1 Introduction
4.2 Section One: Specific methods
4.2.1 Sample preparation
4.2.2 Measurement of amount of exudate
4.2.3 Electrophoresis of cheese
4.2.4 Proteins adsorbed to fat globule surface
4.2.5 Whey protein nitrogen index
4.2.6 Hardness of Cream cheese
28
30
32
32
32
32
33
33
33
34
37
37
37
38
40
40
40
41
41
42
44
45
47
48
48
48
48
48
52
53
54
54
Vll

viii
4.2.7 Curd-fines lost in whey 55
4.2.8 Test for emulsion stability of manufactured cream 55
4.2.9 Gel strength 56
4.2.10 Differential Scanning Calorimetry 56
4.2.11 Microbiological tests 57
4.3 Section Two: Sensory evaluation 57
4.3.1 Introduction 57
4.3.2 Feta cheese 57
4.3.3 Cream cheese 58
CHAPTER 5 EXUDATION OF WHEY FROM CREAM CHEESE
DURING STORAGE
5.1 Introduction
5.2 Section One: Effect of selected manufacturing variables on
59
59
exudation from cheeses of constant moisture 60
5.2.1 Introduction 60
5.2.2 Experimental approach 60
5.2.3 Experimental plan 61
5.2.4 Experimental 63
5.2.5 Analytical methods 64
5.2.6 Sensory evaluation 64
5.2.7 Results and discussion 67
5.3 Section Two: Effect of manufacturing variables on exudation
from cheeses of constant MNFS 80
5.3.1 Introduction 80
5.3.2 Experimental approach 81
5.3.3 Experimental 82
5.3.4 Analytical methods 82
5.3.5 Sensory evaluation 83
5.3.6 Results and discussion 83
5.4 Overall summary and conclusion to Chapter 5 102
CHAPTER 6 EXUDATION OF WHEY FROM FETA CHEESE
DURING STORAGE
6.1 Introduction
104
104

6.2 Section One: Preliminary studies
6.2.1 Experimental
6.2.2 Results and discussion
6.3 Section Two: Chemical, biochemical and microbiological
changes in Feta cheese and exudate during storage at 10 • C
6.3.1 Experimental
6.3.2 Results and discussion
6.4 Section Three : Effect of selected manufacturing variables
on exudation from Feta cheese
6.4.1 Experimental plan
6.4.2 Experimental
6.4.3 Analytical methods
6.4.4 Sensory evaluation
6.4.5 Results and discussion
6.5 Summary and conclusion to Chapter 6
CHAPTER 7 EFFECf OF INCORPORATION OF
104
105
106
115
115
115
136
136
138
138
139
139
154
HEAT-DENATURED WHEY PROTEIN ON THE YIELD
AND EXUDATION OF WHEY FROM FETA CHEESE 156
7.1 Introduction 156
7.2 Experimental plan 157
7.3 Experimental 160
7.4 Methods of analysis 162
7.5 Sensory evaluation 162
7.6 Results and discussion 163
7.6.1 Composition of slurry, milk, whey, cheese and exudate 163
7.6.2 Manufacturing aspects and quality of cheese 164
7.6.3 Mass balance and cheese yield 166
7.6.4 Proteolysis in cheese 171
7.6.5 Exudation of whey from Feta cheese during storage 176
7.7 Summary 180
CHAPTER 8 EFFECf OF HOMOGENISATION, SOURCE OF MILK
SOLIDS AND FAT EMULSIFICATION ON THE
EXUDATION OF WHEY FROM FETA CHEESE
DURING STORAGE 181
IX

8.1 Introduction
8.2 Section One: Effect of homogenisation and source of milk solids
on the exudation of whey from Feta cheese during storage
8.2.1 Experimental
8.2.2 Analytical methods
8.2.3 Sensory evaluation
8.2.4 Results and discussion
8.2.5 Summary and conclusion
8.3 Section Two: Effect of fat emulsification on the exudation of
whey from Feta cheese during storage
8.3.1 Introduction
8.3.2 Preliminary studies
8.3.2.1 Experimental design
8.3.2.2 Experimental
8.3.2.3 Analytical methods
8.3.2.4 Results and discussion
8.3.3 Effect of material adsorbed to surface of fat globule in
Feta cheese on the exudation
8.3.3.1 Experimental
8.3.3.2 Analytical methods
8.3.3.3 Sensory evaluation
8.3.3.4 Results
8.3.3.5 Discussion
8.3.3.5 Conclusion
8.4 Overall conclusion to Chapter 8
CHAPTER 9 INFLUENCE OF PROTEOLYSIS ON THE EXUDATION
181
183
183
183
184
185
192
193
193
193
194
195
196
196
202
202
202
203
203
214
220
220
OF WHEY FROM FETA CHEESE DURING STORAGE 221
9.1 Introduction 221
9.2 Experimental plan 222
9.3 Experimental 223
9.4 Analytical methods 223
9.5 Sensory evaluation 224
9.6 Results and discussion 224
9.6.1 Cheese manufacture; and composition of milk, whey,
cheese and exudate 224
X

9.6.2 Sensory evaluation of cheese
9.6.3 Distribution and mass balance of rennet
9.6.4 Proteolysis in cheese
9.6.5 Exudation from cheese
9.7 Summary and conclusion
CHAPTER 10 OSMOSIS AND DIFFUSION IN FETA CHEESE
10.1 Introduction
10.2 Experimental plan
10.3 Experimental
10.4 Results
10.4.1 Optimisation of assay procedure
10.4.2 Influence of selected factors on mass transfer
Influence of proteolysis
Influence of protein breakdown material
Influence of NaCl
Influence of pH
Effect of calcium
10.5 Discussion
10.6 Summary and conclusion
CHAPTER 11 SALT DIFFUSION IN FETA CHEESE AND ITS
EFFECT ON EXUDATION
11.1 Introduction
11.2 Experimental
11.3 Results and discussion
11.4 Conclusion
CHAPTER 12 OVERALL DISCUSSION
APPENDICES
BIBLIOGRAPHY
225
225
227
232
235
237
237
238
239
241
241
244
244
245
246
246
248
249
251
252
252
253
253
259
260
266- 334
335- 350
XI

Xll
LIST OF FIGURES
Page
Fig. 4 .1 A sample of Cream cheese showing exudate on the surface 49
Fig. 4.2 Feta cheese samples at various stages after manufacture 5 1
Fig. 5 .1 Manufacturing process of Cream cheese 65
Fig. 5 .2 Selected stages in manufacture of Cream cheese 66
Fig. 5.3 EA'Udation of whey from Cream cheese during storage 78
Fig. 5.4 Urea-PAGE of Cream cheese during storage at 5°C 96
Fig. 6 . 1 Flow diagram for manufacture of Feta cheese 107
Fig. 6.2 Selected stages in Feta cheese manufacture 108
Fig. 6.3 Casein proteolysis in Feta cheese during storage at 10°C
(Urea-PAGE) 1 16
Fig. 6.4 Casein protein degradation during storage of Feta cheese 1 17
Fig. 6.5 SDS-PAGE on exudates from Feta cheeses of different age 1 19
Fig. 6.6 Pattern of distribution of peptides in exudates from Feta
cheeses of different ages (HPLC technique) 120
Fig. 6.7 Changes in pH of Feta cheese (after brining) with addition of
lactic acid 123
Fig. 6.8 Relationship between water activity and salt-in-moisture
concentration in Feta 128
Fig. 6.9 DSC thermogram showing a typical heating phase
(220 K - 285 K) of Feta cheese 131
Fig. 6. 10 Unfreezable water in Feta cheese and exudate during storage
(estimated using DSC technique) 135
Fig. 6. 1 1 Exudation of whey from Feta cheese during storage 152
Fig. 6 .12 Effect of protein to fat ratio on the exudation of whey from
Feta cheese during storage 153
Fig. 6.13 Effect of 'curd pH at draining' on the exudation of whey from
Feta cheese during storage 153
Fig. 7. 1 SDS-PAGE on six month old Feta cheeses incorporated with
heat-denatured whey protein 174
Fig. 8 .1 Process for preparation of manufactured cream 196

Xlll
Fig. 8.2 Formagraph curves showing the starting time of gel formation
and the subsequent firming of gels in renneted milks prepared
with different emulsifying agents 201
Fig. 8.3 Urea-PAGE showing proteins adsorbed to surface of fat
globules in fourteen month old Feta cheeses made using
different emulsifying agents 211
Fig. 8.4 Effect of emulsifying agents on the exudation of whey from
Feta cheese during storage 215
Fig. 9 .1 Effect of residual rennet on casein proteolysis in Feta cheese
during storage (Urea-PAGE) 228
Fig. 9.2 Effect of residual rennet on the hydrolysis of a51-casein
during storage of Feta cheese 229
Fig. 9.3 Effect of residual rennet on the hydrolysis of B-casein during
storage of Feta cheese 229
Fig. 9.4 HPLC plots showing the effect of residual rennet
concentration on the peptides formed in three week old Feta 231
Fig. 9.5 Effect of residual rennet on the exudation of whey from Feta
cheese during storage 236
Fig. 10. 1 Loss of total nitrogen from Feta cheeses of different age
during dialysis 243
Fig. 1 1 . 1 Cutting a block of Feta cheese into different layers 254
Fig. 1 1 .2 Pattern of NaCl distribution in various layers of Feta
cheese during storage 256
Fig. 1 1 .3 Pattern of moisture distribution in various layers of Feta
cheese during storage 256
Fig. 1 1.4 Pattern of distribution of salt-in-moisture in various layers
of Feta cheese during storage 257

XIV
LIST OF TABLES
Page
Table 5 .1 Selected manufacturing variables and their respective
levels of variation for studying the effects on exudation of
whey from Cream cheese during storage 61
Table 5.2 P /F ratio of standardised milk 67
Table 5.3 Effect of manufacturing variables on the composition of
curd 68
Table 5.4 Composition of Cream cheese with relation to the
manufacturing variables 69
Table 5.5 Effect of manufacturing variables on the pH of curd and
Cream cheese ( 1 day and 16 weeks old) 70
Table 5.6 Effect of manufacturing variables on the mean scores of
sensory parameters of cheeses 72
Table 5 .7 Effect of manufacturing variables on the exudation of whey
from Cream cheese during storage 73
Table 5.8 Effect of manufacturing variables on the exudation of whey
from Cream cheese during storage (g exudate per kg
moisture in cheese) : based on X2 test of significance 74
Table 5.9 Effect of storage temperature on the exudation 79
Table 5.10 Effect of manufacturing variables on the protein to fat
ratio of raw standardised milk 84
Table 5 . 1 1 Composition of Cream cheese with respect to the
manufacturing variables 85
Table 5 .12 Effect of manufacturing variables on the mean diameter of
fat globules in raw standardised milk and processed
(homogenised and pasteurised) milk 88
Table 5.13 Effect of manufacturing variables on the WPNI [ mg
undenatured whey protein/g milk (or whey)] 90
Table 5 .14 Effect of homogenisation of milk on the concentration of
proteins (casein and whey protein) adsorbed to fat globule
surface, and the mean diameter of fat globules 91
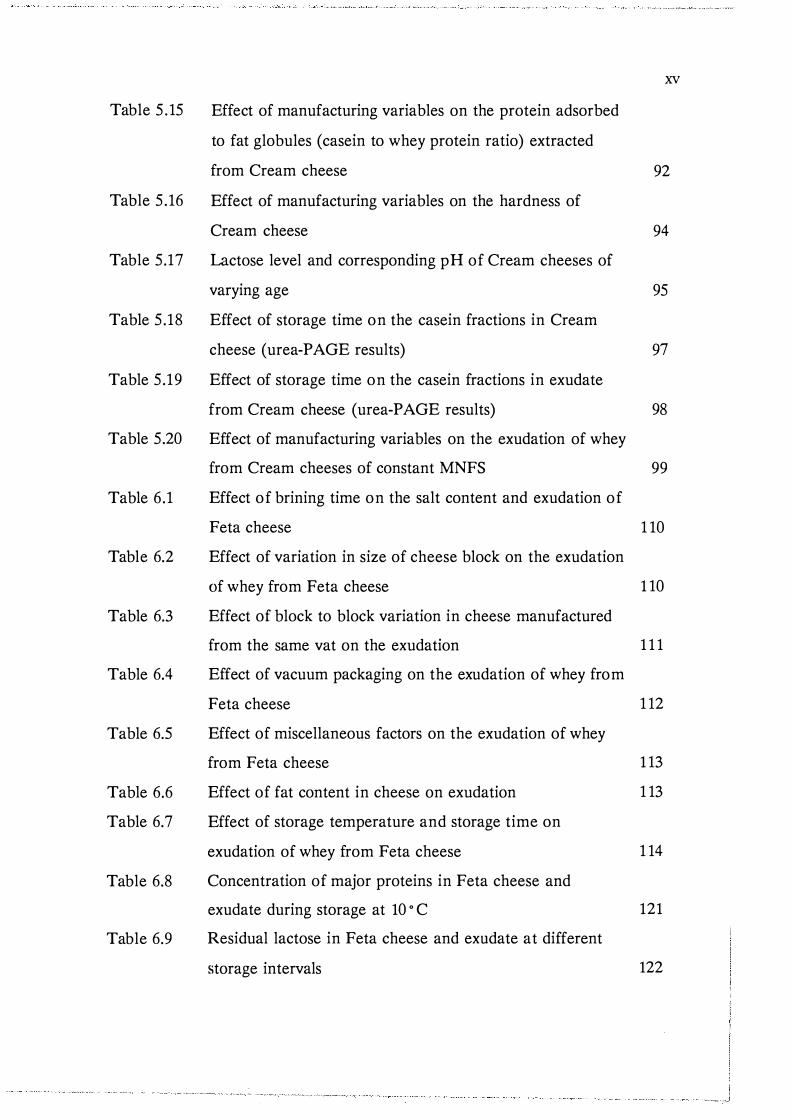
XV
Table 5 . 15 Effect of manufacturing variables on the protein adsorbed
to fat globules (casein to whey protein ratio) extracted
from Cream cheese 92
Table 5 .16 Effect of manufacturing variables on the hardness of
Cream cheese 94
Table 5.17 Lactose level and corresponding pH of Cream cheeses of
varying age 95
Table 5 .18 Effect of storage time on the casein fractions in Cream
cheese (urea-PAGE results) 97
Table 5 .19 Effect of storage time on the casein fractions in exudate
from Cream cheese (urea-PAGE results) 98
Table 5.20 Effect of manufacturing variables on the exudation of whey
from Cream cheeses of constant MNFS 99
Table 6 .1 Effect of brining time on the salt content and exudation of
Feta cheese 1 10
Table 6.2 Effect of variation in size of cheese block on the exudation
of whey from Feta cheese 1 10
Table 6.3 Effect of block to block variation in cheese manufactured
from the same vat on the exudation 1 1 1
Table 6.4 Effect of vacuum packaging on the exudation of whey from
Feta cheese 1 12
Table 6.5 Effect of miscellaneous factors on the exudation of whey
from Feta cheese 1 13
Table 6.6 Effect of fat content in cheese on exudation 1 13
Table 6.7 Effect of storage temperature and storage time on
exudation of whey from Feta cheese 1 14
Table 6.8 Concentration of major proteins in Feta cheese and
exudate during storage at 10 • C 121
Table 6.9 Residual lactose in Feta cheese and exudate at different
storage intervals 122

xvi
Table 6 . 10 Quantity of lactates present (mM/kg) in Feta cheese and
exudate at varying storage intervals 124
Table 6 . 1 1 Quantities of acetates and citrates present (mM/kg) in Feta
cheese and exudate during various storage intervals 125
Table 6 . 12 Microbial counts in cheesemilk and Feta cheese
(during storage) 127
Table 6 . 13 Reproducibility of DSC analysis of Feta cheese 130
Table 6 .14 Results from the DSC thermograms on the study of effect of
major components in exudate - heating phase 132
Table 6 . 15 Results from the DSC thermograms on the study of
exudates from Feta cheese of varying ages - heating phase 134
Table 6.16 Results from the DSC thermograms on the study of Feta
cheese of varying ages 134
Table 6 . 17 Selective manufacturing variables and their respective levels
of variation chosen for studying the effects on exudation of
whey from Feta cheese during storage 136
Table 6 .18 Composition of milks for Feta cheeses manufactured (with
respect to manufacturing variables) 140
Table 6 . 19 Effect of variation in homogenisation pressure on the mean
diameter of fat globules in 'manufactured cream' 141
Table 6.20 Effect of manufacturing variables on the composition of
four week old Feta cheeses 142
Table 6.21 Effect of manufacturing variables on the composition of
exudate from Feta cheese after 4 weeks of storage 145
Table 6.22 Effect of manufacturing variables on the exudation of whey
from Feta cheeses during storage at 10 ° C 148
Table 7.1 Treatment variables, and their respective levels of variation,
chosen for study of the effects of incorporation of
heat-denatured whey protein on yield, product characteristic
and exudation of whey from Feta cheese during storage 159
Table 7.2 Effect of process treatments on yield of cheese 167
Table 7.3 Effect of process treatments on the recovery of milk
constituents in cheese 169

XVII
Table 7.4 Effect of process treatments on the proteolysis in four week
old Feta cheese 174
Table 7.5 Effect of process treatments on the proteolysis in six month
old cheese 175
Table 7.6 Effect of process treatments on the exudation of whey from
Feta cheeses (incorporated with heat-denatured whey
proteins) during storage at 10 • C 177
Table 8.1 Variables used in cheese manufacture - combinations of
creams and skim milks from different sources used for
preparation of cheesemilk 184
Table 8.2 Results from Urea-PAGE on four week old cheeses to
assess the rate of proteolysis (Densitometer readings) 187
Table 8.3 Effect of homogenisation and milk solids source on the
amount of casein proteins adsorbed to surface of fat
globules in cheese (densitometer readings of SDS-gel) 189
Table 8.4 Effect of homogenisation of cream and selected sources of
milk solids in cheesemilk on the exudation of whey from
Feta cheese during storage 191
Table 8.5 Effect of use of selected emulsifying agents on the
properties of 'manufactured cream' and recombined milk 197
Table 8.6 Proportion of emulsifying agents 199
Table 8.7 Effect of emulsifying agents on the rennet coagulation
properties of skim milk 200
Table 8.8 Effect of emulsifying agents on the mean diameter of fat
globules in cheesemilk 205
Table 8.9 Effect of emulsifying agents on the composition of cheese
(four weeks) 206
Table 8.10 Effect of emulsifying agents on casein proteolysis of Feta
cheese 208
Table 8.1 1 Effect of emulsifying agents on the low molecular weight
peptides in exudate from four week old Feta cheese (HPLC
technique) 209

XVlll
Table 8 .12 Effect of emulsification of fat with different emulsifying
agents on the protein adsorbed to surface of fat globules
in Feta cheese 210
Table 8. 13 Effect of emulsifying agents on exudation of whey from
Feta cheese during storage 213
Table 9 .1 Quantity of calf-rennet used for manufacture of cheese 222
Table 9 .2 Variation in priming and setting time for different
amounts of calf-rennet added to milk 223
Table 9 .3 Effect of variation in the amount of rennet used during
cheesemaking on the rennet retained in cheese and whey 226
Table 9.4 Effect of variation in the quantity of rennet used in
cheesemaking on the exudation of whey from Feta
cheeses during storage at 10 • C 233
Table 10.1 Effect of temperature on mass transfer from cheese
( 16 wk old) during dialysis 244
Table 10.2 Effect of age of cheese on the mass transfer from Feta
cheese during dialysis 244
Table 10.3 Effect of low molecular weight protein breakdown material
on mass transfer from cheese and exudate 245
Table 10.4 Effect of variation in the concentration of PEG in SES on
the mass transfer from Feta cheese during dialysis 246
Table 10.5 Effect of variation in the N a Cl content in SES on the mass
transfer from cheese ( 12 wk old) during dialysis 246
Table 10.6 Effect of variation in pH of SES on the mass transfer from
cheese (15 wk old) during dialysis 247
Table 10.7 Effect of variation in pH of cheeses on the mass transfer
from cheeses (15 wk) during dialysis in SES of constant pH 247
Table 10.8 Effect of variation in calcium of SES on the mass transfer
from cheese (16 wk old) during dialysis 248
Table 10.9 Effect of variation in Ca2+ of cheese on the mass transfer
from cheeses during dialysis in SES of constant Ca2+ 249
Table 1 1. 1 NaCl and moisture distribution i n various layers of Feta
cheese at selected periods of storage 255

XIX
LIST OF APPENDICES
Page
Appendix 4 .1 Standard analytical (chemical) methods
(a) Chemical methods for analysis of milk, cream, whey
and exudate 266
(b) Chemical methods for analysis of curd and cheese 269
Appendix 4.2 Equations used to express the exudation of whey from
Feta cheese 274
Appendix 4.3 Questionnaire used to evaluate Feta cheese 275
Appendix 4.4 Questionnaire used to evaluate Cream cheese 276
Appendix 5.1 (a) Brief description of equipment and accessories used
during manufacture of Cream cheese 277
(b) Procedure for homogenising and pasteurising
standardised milk 278
Appendix 5.2 Manufacturing process for Cream cheese 279
Appendix 5.3 Calculations for the amount of water to be added to or
removed from curd for adjustment of moisture prior to
processing 281
Appendix 5.4 Composition of standardised milks used for cheese
manufacture with respect to the selected manufacturing
variables 282
Appendix 5.5 (a) Statistical technique used for the test of significance
of the manufacturing variables 283
(b) Example showing application of Chi-squared test of
significance 284
Appendix 5.6 Calculations for adjustment of curd to a constant MNFS 285
Appendix 5.7 Composition of standardised milk with respect to the
manufacturing variables 286
Appendix 5.8 Effect of manufacturing variables on the composition of
whey and fines lost in whey 287
Appendix 5.9 Effect of manufacturing variables on the composition of
curd 288
Appendix 5.10 Effect of manufacturing variables on the mean scores of
sensory parameters of cheeses 289

XX
Appendix 6 .1 Equipment and accessories used for manufacture of Feta
cheese 290
Appendix 6.2 Manufacturing process for Feta cheese 291
Appendix 6.3 Effect of manufacturing variables on the composition of
whey 292
Appendix 6.4 Effect of selected manufacturing variables on composition
of Feta cheese after six months of storage at 10 ° C 293
Appendix 6.5 Effect of manufacturing variables on the mean scores of
sensory parameters of cheese 294
Appendix 7. 1 An example showing calculations for the preparation of
cheese milk 295
Appendix 7.2 Composition of cheesemilk with respect to the process
treatments 296
Appendix 7.3 Effect of process treatments on the composition of whey 297
Appendix 7.4 Effect of process treatments on the composition of cheese
before brining 298
Appendix 7.5 Effect of process treatments on the composition of cheese
at four weeks 299
Appendix 7.6 Effect of process treatments on the composition of
exudate from four week old cheese 300
Appendix 7. 7 Effect of process treatments on the mean scores of
sensory parameters of cheeses 301
Appendix 7.8 (a) Data on quantities of input and output material, the
calculated values of mass balance, yields and recoveries
of the milk solids for all the trials 303
(b) An example of mass balance calculation : mass
balance of protein in trial no 2 305
(c) Effect of process treatments on the mass balance of
selected milk constituents for each trial 306
(d) Justification for the variations in the mass balances
of milk components 307

XXI
Appendix 7.9 Comparison of theoretical estimates of ratio of
B-lactoglobulin to para-K-casein (approximate estimates)
with the observed ratios in cheeses incorporated with
denatured whey protein 3 10
Appendix 8. 1 Effect of homogenisation and source of milk solids on
the mean scores of sensory parameters of eight week
old Feta cheeses 3 12
Appendix 8.2 Composition of cheesemilks with respect to the
experimental variations 3 13
Appendix 8.3 Effect of homogenisation and source of milk solids on
the composition of whey 3 14
Appendix 8.4 Effect of homogenisation and source of milk solids on the
composition of Feta cheese (before brining) 3 15
Appendix 8.5 Effect of homogenisation and source of milk solids on
the composition of Feta cheese (after brining) 3 15
Appendix 8.6 Effect of homogenisation and source of milk solids on
the composition of Feta cheese at three weeks 3 16
Appendix 8.7 Effect of homogenisation and source of milk solids on
the composition of exudate from three weeks old
Feta cheese 3 18
Appendix 8.8 Calculations for preparation of cheesemilk 3 19
Appendix 8.9 (a) Effect of use of emulsifying agents on the mass
balance of fat during cheesemaking 320
(b) Effect of use of emulsifying agents on the fat
recovery based on input (milk) or output (cheese & whey) 320
Appendix 8 .10 Effect of use of emulsifying agents on the mean sensory
scores of eight week old Feta cheese 321
Appendix 8. 1 1 Composition of cheesemilks for cheeses made with
different emulsifying agents 322
Appendix 8 .12 Effect of emulsifying agents on the composition of whey 323
Appendix 8. 13 Effect of emulsifying agents on the composition of
cheese (before brining) 324

XXll
Appendix 8 .14 Effect of emulsifying agents on composition of exudate
from four week old Feta cheese 325
Appendix 8.15 Proteins adsorbed to surface of fat globules in Feta
cheeses made using different emulsifying agents
(SDS-PAGE) 326
Appendix 8.16 Calculations to determine the distance between the fat
globules in Feta cheese 327
Appendix 9 .1 Composition of milk for cheeses made with varying
amounts of rennet 328
Appendix 9.2 Composition of whey as affected by the variation in the
amount of rennet used 329
Appendix 9.3 Composition of Feta cheese (before brining) as affected
by the variation in the amount of rennet used during
cheesemaking 330
Appendix 9.4 Composition of Feta cheese (after brining) as affected
by the variation in the amount of rennet used during
cheesemaking 330
Appendix 9.5 Composition of Feta cheese (three weeks old) as affected
by the variation in the amount of rennet used during
cheesemaking 331
Appendix 9.6 Composition of exudate from Feta cheese (three weeks
old) as affected by the variation in the amount of rennet
used during cheesemaking 332
Appendix 9. 7 Effect of variation in the quantity of rennet used in
cheesemaking on the sensory parameters of eight weeks
old cheese 333
Appendix 9.8 Approximate estimates for mass balance of rennet used
in manufacture of Feta cheeses with variations in the
quantity of rennet 334

xxiii
ABBREVIATIONS
ANOVA Analysis of variance
Aw Water activity BSA Bovine serum albumin cm Centimetre d Day DDM Dairy division manual DM Dry matter DTE Dithioerythritol EDTA Ethylene diamine tetra-acetic acid F F ratio FDM Fat in dry matter FFMR Fresh frozen milkfat for recombining FGS Fat globule size f.p. Freezing point g Gram GMS Glycero mono stearate h Hour HPLC High performance liquid chromatography HTST High temperature short time IDF International Dairy Federation kg Kilogram
kPa Kilopascal L Litre LHSMP Low heat skim milk powder LSM Least square mean m Metre M Molar concentration MFGM Milk fat globule membrane mg Milligram min Minute (time) ml Millilitre
mm Millimetre mMol Millimole MNFS Moisture in non-fat substance mo Month
m.p. Melting point
nm Nanometre

XXIV
ns Not significant NSLAB Non starter lactic acid bacteria NZDRI New Zealand Dairy Research Institute PAGE Poly acrylamide gel electrophoresis P/F Protein/fat pp m Parts per million psi Pounds per square inch rpm Revolutions per minute RSM Reconstituted skim milk RU Rennet unit s Second (time) S.D. Standard deviation SDS Sodium dodecyl sulphate SES Simulated external solution S/M Salt/moisture SMP Skim milk powder SNF Solids-not-fat TN Total nitrogen TS Total solids UF Ultrafiltration UHT Ultra-high temperature wk Week WPC Whey protein concentrate WPNI Whey protein nitrogen index wt Weight w/v Weight/volume vjv Volume /volume wjw Weight/weight a- Alpha-B- Beta-K- Kappa-oc Degree Celsius (Centigrade) j1.m Micrometre % Per centum > Greater than ;::; Greater than or equal to; not less than < Less than
:s; Less than or equal to; not greater than

1
CHAVfER 1
INTRODUCTION
Gels are two-phase systems with a continuous network of solid material forming a
matrix and enmeshing or holding an aqueous or other solvent phase which may also be
continuous or finely dispersed (Matz, 1965 ; Glicksman, 1 969) . Gels show resistance
under pressure and are capable of retaining a firm structural form.
Gels are frequently encountered in polysaccharide and protein based food products, eg.
jams, jellies, custards , yoghurts, condensed milks and cheeses. Some of these gels ,
particularly those in the intermediate and high moisture foodstuffs, tend to contract in
volume during storage resulting in the expression of part of the weakly held water or
liquid phase. This phenomenon is termed syneresis .
The formation of gels from milk proteins is irreversible in contrast to gels of most
other foods. The gels from casein include gels of renneted milk, yoghurt, stored
heated milk and whey proteins. Gels formed from mainly casein, such as j unket and
yoghurt, are soft and brittle, and tend to show syneresis .
Syneresis is undesirable in finished dairy products such as yoghurt, sour cream, Cream
cheese, Cottage cheese and quarg. However, in the manufacture of most cheese
varieties syneresis (draining of whey) is an essential processing step and has a vital role
in determining the quality. Syneresis involving contraction of the protein gel and
concomitant expulsion of an aqueous whey phase is a complex and poorly understood
process (Pearse et al., 1984) although there is considerable information on factors that
influence syneresis (Fox, 1987a) . Reports in the literature describe efforts to reduce
syneresis in yoghurts but the mechanism involved is not fully understood.
Cheeses of low pH and/or high moisture, such as Blue, Cheshire, Cream and Feta,
often exude whey (moisture with soluble material) during storage or ripening. This
exudation leads to considerable yield loss. Handling of product with exudate in the

2
bulk packs is inconvenient and difficult as the surface of the product is slippery.
At times exudation is also detected in consumer packs. This is unacceptable to the
consumer and brings disrepute to the image of the company or 'brand'.
The present investigation was undertaken to determine the factors affecting
exudation of whey from cheese during storage and to study the underlying
mechanism. It was of interest to find practical solutions for preventing exudation
of whey from Cheshire, Cream and Cast Feta cheeses exported from New Zealand.
In many food products the exudation is controlled by the addition of stabilisers or
hydrocolloids. However, this often has a detrimental effect on the flavour, body
and textural attributes of the product. Recent trends indicate that consumers are
demanding 'all natural or no additive' foods, and food processors are actively
attempting to attain the 'clean' ingredient label for their products (Best, 1990) . The
use of stabilisers and emulsifiers is restricted by the food regulations in the
individual countries. Moreover, in a complex food system as in cheese, particularly
with the ripened varieties, the usefulness of stabilisers is uncertain. The use of
stabilisers was therefore not considered in this study.
Very little is reported in the literature about the exudation of whey from cheese
during storage or ripening. In the absence of guidance from the literature, studies
on exudation were undertaken with hot-pack Cream cheese and Feta cheese made
from recombined milk by the traditional method of manufacture, representing
umipened and ripened varieties of cheese, respectively. It was hoped that the study
of exudation from these cheeses would provide the basic information applicable to
related varieties of cheese.
For the sake of convenience, some of the expressions used in the text have the
following connotations, unless specified otherwise.
Syneresis:
Exudation:
Exudate:
Storage of cheese:
The expression of whey during manufacture of cheese.
The expression of whey /liquid from cheese after manufacture.
The material that is expressed due to exudation.
Includes the ripening process where appropriate.

3
CHAPTER 2
REVIEW OF LITERATURE
2.1 Introduction
Very little has been reported on the exudation of whey from cheese during storage.
The survey of literature has been therefore extended to include similar processes
(syneresis of whey during cheese manufacture, salt diffusion during brining of
cheese) and to a related product (yoghurt) that also shows exudation. Attention
is given to milk proteins and their water-binding capacity, and the structure of milk
gels. Reference is also made to Cream and Feta cheese since manufacture of these
cheeses was undertaken during the course of the present study. Aspects related to
emulsification of fat, material adsorbed to fat globule surface and incorporation of
denatured whey protein in cheese are also included since they were expected to
provide an insight into mechanisms of exudation. This review consists of the
following sections:
(a) Gels
Rennet-induced gels in milk and cheese
Acid-induced gels in yoghurt
(b) Emulsions
(c) Incorporation of whey protein in cheese
(d) Cream cheese
(e) Feta cheese
(f) Salt diffusion
(g) Changes in cheese during storage
2.2 Gels
2.2.1 Introduction: Gels display the properties of both solids and liquids:
resembling solids in structural rigidity and elastic response when distorting forces
are applied; and liquids in vapour pressure, compressibility, and electrical
conductivity (Glicksman, 1969). Gel formation from solutions of long-chain

4
polymers occurs as adjacent molecules cross-link to form a continuous network
possessing mechanical stability in the final gelled state. A continuous liquid phase
consisting of the solvent and the solutes is entrapped, some of which may include
non-cross-linked polymeric materials.
The elastic properties of a gel depend on the number and character of the
cross-links at a given stage of strain and would largely depend upon what l inkages
have been broken and what linkages have been formed (Glicksman, 1969). The
gel is usually elastic when the degree of cross-linking is low and more rigid when
the degree of cross-linking is high and closely spaced.
The phenomenon of syneresis, which refers to exudation of solvent and some of the
solutes from a gel system, is often encountered. Syneresis takes place in freshly
prepared gels which tend to contract and occurs in both macromolecular gels with
water as well as in those with organic liquids as solvents (Hermans, 1963). The
degree of syneresis depends upon the concentration, temperature and the addition
of salts and other factors. Syneresis is a complex process but in general, added
compounds which favour swelling diminish syneresis and vice-versa.
Aging of gels leads to contraction and exudation of a portion of the liquid
(Glicksman, 1969). The occurrence of syneresis in a gel during aging is due to the
formation of additional intermolecular bonds with a consequent reduction in the
number of loci available for solvent binding and to a decrease in the dimensions
of the intermolecular spaces in which the solvent is contained (Matz, 1965).
2.2.2 Rennet-induced gels in milk and cheese
Aspects related to chemistry of curd making and syneresis of whey from curd
during cheese manufacture have been comprehensively reviewed (Patel et al., 1972;
Dijk, 1982; Walstra et al., 1985; Dijk & Walstra, 1986; Walstra & Vliet, 1986; Fox,
1987a; Pearse & Mackinlay, 1989).
Casein is a protein polymer composed of large molecules, each consisting of a large
number of repeating units (amino acids) joined by covalent bonds (peptide bonds).

5
The casein micelles in milk consist mainly of protein (a51-, a52-, B- and K-caseins),
calcium phosphate and water (Walstra & Jenness, 1984). The casein molecules are
present in small aggregates (submicelles) each containing different casein species
and having a predominantly hydrophobic core and predominantly hydrophilic outer
layer. The submicelles are clustered into spherical aggregates with interstitial
moisture and most probably kept together by undissolved and colloidal calcium
phosphate (Walstra et al., 1985).
Lin et al. (1972) suggested a model for the structure and dissociation of the casein
micelle: Ca2+ removal initially dissociates weakly bound caseins from the micelle,
while a size-determining micellar framework remains intact. This protein
framework was found to contain mainly a5-casein, while the dissociable protein
contained mainly 13- and K- casein. When the Ca2+ fell below a critical level, the
micelle completely dissociated.
Addition of appropriate enzymes to milk leads to the gelation of casein. First the
partial proteolysis of K-casein occurs and in the presence of ionic calcium, casein
micelles interact to form chains, which eventually cross-link to form a gel-matrix
(Carlson et al., 1986). The reaction rate increases with temperature as long as the
enzyme is stable, peaks with an optimum pH around 5 .0, and is partly influenced
by salts probably by promoting or reducing the binding between the enzyme and
the substrate. A model proposed by Carlson et al. (1986) states that the rate of gel
firming is controlled by two reactions, the enzymatic hydrolysis of K-casein to
expose cross-linking sites and the reaction of exposed sites to form such cross-links.
The enzymatic action of rennet is of the first order leading to flocculation of
micelles without the casinomacropeptide; gradual increase in flocculation leads to
the formation of a gel with a continuous network and the micelles gradually fuse,
increasing the contact area between them with a possible rearrangement of calcium
phosphate and submicelles (Walstra, 1985).
Green et al. ( 1977) reported that the gel formed by the rennet coagulation of milk
is the result of l inkage of groups of micelles together. The gel has an open,

6
irregular structure in which micelles are loosely packed, enabling much serum to
be entrapped. The casein micelles in rennet-treated separated (skim) milk form
a network type of gel, with similar structure in all dimensions (Green et al., 1978a).
The aggregation of casein micelles starts after about 60% of the rennet-clotting
time (visual clotting time of milk), when the enzymatic action is complete. The
micelles form chains which then link into a close network. Micelles, initially linked
by bridges, later on contract and bring the particles into contact and eventually
cause partial fusion (Green et al., 1978b). The rate of micellar aggregation is
proportional to rennet concentration, even after K-casein hydrolysis is complete.
The increase in viscosity of rennet-treated milks can be considered as a measure
of aggregation of casein micelles (Green, 1980).
A rennet coagulated gel formed undisturbed in a vessel of vertical walls, usually
does not show syneresis because the gel is constrained in the vessel and can not
shrink (Walstra et al., 1985). The gel does not show syneresis at the surface
because of being covered by a thin lipid-rich layer so that capillary forces prevent
the serum from leaving the matrix. Cutting the gel disrupts this network and causes
it to shrink, resulting in the expulsion of the aqueous phase (Pearse & Mackinlay,
1989). Syneresis is due to the shrinkage of the three-dimensional curd network,
which had been formed from continued aggregation of the casein following
coagulation (Casiraghi et al., 1987). The network therefore tends to shrink and
becomes more compact.
The continued action of chymosin (rennet) and the loss of calcium phosphate
caused by acid conditions are two of the factors which bring about the fusion of the
casein micelles (Brooker, 1987). The fusion of micelles continues until the protein
phase forms continuous tracts which bear little resemblance to the curd at cutting.
Kimber et al. (1974) reported that the gel formed by adding rennet to milk does
not reach a final rigidity, but continues getting firmer over several hours, by which
time considerable syneresis has occurred. Firming appears to involve the formation

7
of more linkages between micelles. The overall curd structure may be visualised
as a casein sponge in which fat globules are entrapped.
Cheese consists of a continuous protein matrix, throughout which a discontinuous,
discrete fat phase can be observed and it is only the casein which is involved in the
formation of the basic structure of cheese (Lawrence et al., 1983). The role of
casein is therefore expected to be of prime importance in the gel structure.
In low pH cheeses casein fractions form compact aggregates as they are close to
their iso-electric point. These are held together with strong ionic and hydrophobic
intra-aggregate forces while the inter-aggregate forces are weaker. In this most of
the water is in an inert interstitial state, and not distributed evenly throughout the
curd mass. The low pH cheeses may be considered as porous masses of casein and
fat particles (Creamer & Olson, 1982).
(i) Syneresis in renneted milk gels
Walstra et al. ( 1985) described syneresis as a rate process and hypothesised that
syneresis results from a contraction of the gel network by a gradual process of
re-alignment and bond interchange to conformations of lower energy. The rate of
syneresis is directly proportional to the pressure in the system (pressure exerted by
the network on the moisture) and the permeability (resistance against flow through
the matrix or the average cross section of the pores) of the network (Dijk, 1982);
and inversely proportional to the viscosity of the continuous phase and the
dimensions of the gel.
Syneresis in renneted milk gels is attributed to the increase in the degree of
cross-linking of polymer networks, the change in the charge on polymer chains and
the variation in solvent-polymer interaction coefficients (Lelievre, 1977). The
increase in the number of junction points due to the casein-casein interactions are
likely to be partly responsible for syneresis (Lelievre & Creamer, 1978) .
Pearse & Mackinlay ( 1989) have suggested that the chemical interactions inducing
syneresis of the curd network are in part an extension of the interactions that give

8
rise to curd formation. In the conversion of milk to cheese, casein micelles
aggregate to form a network that entraps the aqueous phase. Any alteration in the
composition of the casein micelles which form this curd network might be expected
to affect the coagulation and subsequently the syneresis. Specific and non-specific
interactions involving protein occur during curd formation and affect syneresis.
(ii) Factors affecting syneresis from milk coagulum and cheese curd
It is proposed that the exudation of whey during storage of low pH and high
moisture cheeses is an extension of the syneresis process that started during cheese
manufacture. The factors influencing syneresis during manufacture may therefore
be expected to have an effect on exudation during storage. There is general
agreement on a number of the factors affecting syneresis from renneted milk gels.
This review is intended to serve as a guide in selecting the manufacturing variables
for study of factors affecting exudation from cheese. Evidence for the likelihood
of manufacturing variables affecting exudation was supported by the findings that
the starter culture, rate of salt addition, temperature of overnight-drainage and the
whitening treatment for the cream all significantly influenced exudation from
60-day-old Blue cheese (Pederson et al., 1971). However, the above study did not
take into account the moisture lost during the initial 60 days, and the method used
to measure exudation was based on a temperature-stressed effect on cheese. The
need to determine more clearly the effects of manufacturing variables on exudation
is thus evident. Indeed, varying the manufacturing conditions may be the most
effective practical tool to control exudation. Once the cheese is made there are not
many options to regulate its properties during storage or ripening.
Concentration of milk or casein: Increase in protein concentration of milk by
ultrafiltration decreased syneresis (Peri et al., 1985) which may be attributed to
much more evenness of the gel and the increase in the number of bonds per
junction (Walstra & Vliet, 1986). Pearse & Mackinlay ( 1989) reported that the
syneresis is sensitive to the concentration of B-casein and also to low levels of
dephosphorylation of B-casein.

9
Role of fat: Syneresis decreased with increase in fat content in milk (Starry et al.,
1983; Lawrence & Gilles, 1987), although the total amount of fat lost in the whey
increased (Fox, 1987a). Fat mechanically blocks the casein-casein interactions
(Lelievre & Creamer, 1978) with an increased number of interstices within the
reticulum of the coagulum (Starry et al., 1983). This effect of fat on milk gels is
consistent with a lowering of attractive forces between the protein molecules
forming the gel structure (Johnston & Murphy, 1984).
Increasing the fat content in homogenised reconstituted non-fat dry milk resulted
in a reduction of curd firmness, hardness, rate of firming, and syneresis (Kebary &
Morris, 1990).
Role of whey protein: Syneresis is reduced in rennet-induced gels made from milk
in which whey proteins have been denatured by heat treatment (Fox, 1987a).
Gelling capacity of whey protein gels is approximately proportional to the
sulphydryl content of the whey protein powders. The whey protein gels are
stabilised by disulphide linkages and can be markedly influenced by small changes
such as salt concentration (Green, 1980). Moisture loss and coarseness of whey
protein gels decreased with increasing net charge on the proteins as pH was altered
away from the iso-electric point (Hermansson, 1983).
Effect of temperature: Syneresis increased significantly with temperature (Patel et al. ,
1972; Dijk, 1982; Walstra et al., 1985; Walstra & Vliet, 1986) though the rate of
heating during cooking did not seem to have a significant effect (Patel et al., 1972).
Effect of homogenisation: Cheese curd is composed primarily of a network structure
of casein in which fat globules are entrapped. In normal milk which has not been
homogenised, the fat globules behave as an inert filler and there is no cross-linking
between the fat globules and the casein network. However, when the cream (fat)
fraction of the milk has been homogenised, the casein is adsorbed onto the
fat-water interface (Mulder & Walstra, 1974). In this situation fat globules

10
participate in the formation of the casein matrix in the cheese (Vliet &
Dentener-Kikkert, 1982; Walstra & Vliet, 1986).
Syneresis is retarded by homogenisation (Vaikus et al., 1970; Emmons et al., 1980;
Storry et al., 1983; Fox, 1987a; Kebary & Morris, 1990), probably because of
alteration in coagulum structure and modification in the entrapment of fat globules
within the coagulum (Storry et al., 1983). In unhomogenised milk the fat globules
are presumably passively enmeshed in the reticulum of the coagulum as gelation
takes place. Homogenised milks will have fat dispersed into a greater number of
smaller globules, the surfaces of which will be modified by the presence of adhering
casein particles; and the stronger coagulum of the homogenised milk must reflect
a denser reticulum of finer lattice structure (Storry et al., 1983). The combined
effect of finer lattice and increased number of smaller fat globules together with
the possibility that the latter could be more tightly bound within the reticulum
owing to coagulation of adhering casein, could result in slower drainage of whey.
Green et al. ( 1983) observed that when Cheddar cheese was made from
homogenised milk, casein micelle aggregation occurred more slowly, protein
network in the curd was less coarse, curd fusion was poor and the rate of whey loss
was reduced.
Vaikus et al. ( 1970) concluded that homogenisation of whole milk has a different
effect on milk proteins compared to when only cream is homogenised and added
back to milk. They observed that syneresis from renneted milk gels was inversely
proportional to the extent of homogenisation of the whole milk or only the cream.
Further, syneresis was least when entire whole milk was homogenised, moderate
when only cream was homogenised, and maximum when milk was unhomogenised.
Effect of pH: Syneresis increases significantly with decreasing pH (Zittle et al., 1957;
Patel et al., 1972; Dijk, 1982; Walstra et al., 1985 ; Peri et al. , 1985; Walstra & Vliet,
1986). As acid is produced by the conversion of lactose to lactic acid, the pH is
lowered, more and more colloidal calcium phosphate goes into solution and
syneresis is greatly enhanced (Walstra & Vliet, 1986; Casiraghi et al., 1987).

1 1
The effect of lowering the pH may be explained by the decreased hydration of
casein as the isoelectric pH is approached, and the release of colloidal calcium
phosphate from the casein micelle (Patel et al., 1972).
Role of calcium : Syneresis increases with an increase of CaC12 (Dijk, 1982). Factors
that affect the state of colloidal and soluble fractions of calcium in milk, such as
acidification, pH, citrate addition, influence syneresis (Zittle et al., 1957; Casiraghi
et al., 1987).
Zoon et al. (1988) reported that a minimum amount of calcium is required for the
clotting of rennet-induced gels to occur and at constant calcium ion activity, a lower
micellar calcium phosphate concentration resulted in a longer clotting time.
Waugh et al. (1970) noted that one of the important primary reactions in rennet
coagulation of milk is the binding of calcium ions to the casein proteins which
renders the a5r and B-caseins liable to precipitation.
Miscellaneous: Czulak et al. ( 1969) found that during Cheddar cheese manufacture,
while the curd particles remain in contact with the whey, the lactose fermented in
the curd is replaced by the lactose diffusing from whey. Lactic acid produced in
the curd diffuses into the whey rather slowly. When the acid production during
cheese manufacture is too fast or too slow, the cheese becomes defective
apparently due to the lack of optimum distribution of lactose and lactic acid
between the curd and whey. When a high level of lactic acid was reached slowly,
the cheese became acid and crumbly. Liquid separation (exudation) from the
cheese occurred at 2 months of age. The authors suggest that the rate of
development of acidity and the time the curd is in whey were critical factors in
controlling Cheddar cheese quality.
During cheese manufacture the operations of cutting the coagulum, stirring and
cooking affect syneresis (Walstra & Vliet, 1986; Walstra et al., 1987). Increasing
the speed of stirring increases syneresis to a small extent (Patel et al., 1972). In
addition, a number of interactions occurring during manufacture, such as between

12
pH and agitation, between pH and CaC12, between temperature and agitation, have
significant effects on syneresis (Patel et al., 1972). Syneresis remains unaffected by
variations in concentration of rennet used (Dijk, 1982).
2.2.3 Acid-induced gels in yoghurt
Introduction: Acid-induced gels in cheese could be considered similar in many ways
to the acid-induced gels in yoghurt. This review is intended to serve as a guide in
selecting the manufacturing variables for study of factors affecting exudation from
Cream cheese, a unripened and non-rennet cheese, where few bio-chemical changes
are expected during storage.
Most authors have referred to whey separation from yoghurt during storage as
syneresis. Accordingly, in this section, exudation of whey from yoghurt during
storage is being referred as syneresis.
Characteristics of acid gels
The progressive acidification of milk by lactic acid starter bacteria (Brooker, 1987)
or by addition of mineral acid leads to the non-enzymic gelation of milk. The
branched network of micelles differs from that of rennet gels in their
ultra-structural characteristics. The fusion of micelles leads to contraction of the
protein network of the gel and expulsion of water from its interstices.
The casein gels induced by rennet and acid are both viscoelastic (Vliet et al., 1989).
However, the protein-protein bonds are less mobile in acid-induced gels.
During fermentation of yoghurt coalescence of the casein micelles improves the
texture of yoghurt (Mottar et al., 1989). In comparison to rennet gels, the changes
in the stages of acid gel formation are much slower and it is easier to distinguish
the individual 'micelles' for a longer period because of the absence of colloidal
calcium phosphate (Walstra & Vliet, 1986). In acid gels the permeability of the gel
network is of the same order of magnitude as renneted gels and shows little change
with time (Dijk, 1982).

13
In acid gels, particularly those produced by lactic acid bacteria, change in solubility
of curd particles may be a factor contributing to syneresis from sour milk products
(Walstra et al, 1985). In yoghurt (an acid-induced milk gel) syneresis is undesirable
(Harwalkar & Kalab, 1986), in contrast to renneted milk gels where controlled
syneresis is desirable. Controlled syneresis is also desired in some acid gels,
e.g. cottage cheese and quarg, and is brought about by cooking or salting the curd
during manufacture. Cottage cheese and quarg possess entirely different
ultrastructures compared to that of yoghurt (Brooker, 1987).
The microstructure of yoghurt is affected by the heat treatment of milk, bacterial
starter cultures, total solids content, and the presence of thickening agents (Kalab
et al., 1983), all of which affect the firmness of the gel and its susceptibility to
syneresis (Kalab et al., 1976; Davies et al., 1978).
Role of milk solids: The water-holding properties of the gel are improved and the
mechanical properties of the gel are changed by increasing the levels of milk solids
(Brooker, 1987). Weak body due to improper formulation and culturing may cause
syneresis in yoghurt (Harwalkar & Kalab, 1983).
Cultured milks were prepared using whey protein concentrates from ultrafiltered
acid whey, ultrafiltered rennet whey and industrial spray-dried process (Jelen et al.,
1987). The viscosity of soured milk decreased with increase in the amounts of
whey protein. Upon standing for several days the finished product with pH varying
between 4.4 and 4.55 showed whey syneresis. Syneresis increased in proportion to
the increase in whey protein content in the cultured milks.
The viscosity of yoghurt is almost wholly dependent on the protein content of the
milk. One way of increasing the protein level without increasing the lactose is to
fortify the milk with caseinate powders. In addition to improving the consistency,
added caseinates enhance the hydrophilic nature of protein and act as a stabiliser,
thereby decreasing the problem of syneresis (Tamime & Deeth, 1980).

14
Increasing the total solids also increases the density of the protein matrix and this
decreases syneresis (Harwalkar & Kalab, 1986).
While the rate and extent of syneresis appears to be related to total solids, not all
types of milk solids have a similar effect. Besides, it is not always easy to vary a
single solid component in milk. Therefore, parameters such as 'casein to fat ratio'
or 'protein to fat ratio', which are commonly used to standardise milk, need to be
carefully monitored.
Effect of heat treatment: Heat treatment of milk is an important step since it
determines the body and texture of yoghurt as well as syneresis. The usual heat
treatment of 85 ° C/30 min or 90-95 o C/5-10 min to yoghurt milk results in minimal
syneresis and maximal firmness of the yoghurt coagulum (Tamime & Deeth, 1980).
This relatively severe heat treatment results in the binding of B-lactoglobulin to
K-casein which prevents fusion of the casein micelles (Brooker, 19S7). Milk which
has not been sufficiently heated forms a soft gel from which liquid (whey) exudes
easily (Harwalkar & Kalab, 1986).
Parnell-Clunies et al. (1986) found that yoghurt from milk heated to
98 • C/0.5-1.87 min showed the highest water-holding capacity compared to UHT
(140 ° C/2-8 s) or vat (85 • Cj10-40 min) heat treatments. Data from these studies
indicated that denaturation of whey protein was not necessarily a precursor for
improved water-holding capacity.
Firmness and syneresis of yoghurt are associated with the extent to which micelles
coalesce during fermentation (Davies et al., 1978). The appendages of micelles in
heated milk appear to inhibit coalescence giving rise to a firmer curd with a lower
tendency towards syneresis. Electron microscope studies showed that yoghurt from
highly heated milks (95 o C/10 min or autoclaving at 121.7 ° C/15 min) had
filamentous appendages whereas that from raw milk had smooth contours with no
appendages. The appendages were composed of B-lactoglobulin and were sensitive
to sulphydryl blocking agents. The gel network in yoghurt from heat-treated milk

15
consists of thinner strands due to the reduced coalescence of casein micelles, which
probably gives a firmer gel with greater water-holding capacity (Green, 1 980).
The heat-induced association of a-lactalbumin with casem appeared to be
important for fusion and hydration of the micelles during subsequent fermentation,
which determined the rheological properties of yoghurt (Mottar et al., 1989).
Stabilisers or gums are often added to yoghurt to provide a desirable consistency
and prevent whey syneresis during storage. The stabiliser combines with water to
form gels, increases the viscosity and reduces syneresis. In countries where the use
of stabilisers is not permitted, there is heavy reliance on heat treatment regimes,
adjustment of total solids and pH etc. to reduce syneresis. The denaturation of
.B-lactoglobulin and its interaction with casein micelles on heating milk for yoghurt
manufacture helps in partly reducing this required increase in total solids and
addition of stabilisers (Dannenberg & Kessler, 1988). The extension of holding
time during heating beyond a certain point not only provides no improvement in
gel consistency but possibly weakens it.
It is apparent that controlled heating of yoghurt milk and denaturation of whey
protein are vital both for texture and reduction of whey syneresis in yoghurt.
Effect of homogenisation: Vaikus et al. (1970) observed that in acid gels from
homogenised milk, where cream was homogenised and added back to milk,
syneresis decreased only up to a certain pressure of homogenisation, i.e. 150 atm
( 15, 151 kPa), along with an increase in viscosity. Syneresis increased with further
increase in the homogenisation pressure. The increase in syneresis is attributed to
the possible destabilisation of fat globules.
Effect of pH: The effect of pH on syneresis may be attributed to the variation in
net electric charge of the casein micelles (Harwalkar & Kalab, 1986). Slow
acidification of milk can promote undesirable effects like whey syneresis in yoghurt
(Tamime & Deeth, 1980).

16
It is not clear whether lowering of pH causes syneresis or the problem is aggravated
at pH values close to the iso-electric point of caseins.
Miscellaneous: Vibrations during transportation of the finished product,
gravitational settling during storage and disruption of the microstructure of the
protein matrix by accidental freezing during storage can all aggravate syneresis in
yoghurt (Harwalkar & Kalab, 1983).
2.3 Emulsions
2.3.1 Introduction: An emulsion may be defined as "an intimate mixture of two
immiscible liquids in which one liquid phase is dispersed throughout the other in
the form of small, discrete droplets. In a good emulsion, these droplets remain
dispersed indefinitely and the mixture remains completely homogeneous and gives
the appearance of a uniform liquid e.g. homogenised milk" (Glicksman, 1969).
Emulsions are usually of two types: the oil-in-water type in which the oil is
dispersed in small droplets throughout the water phase e.g. milk; and the
water-in-oil kind in which the water is dispersed in small droplets throughout the
oil phase e.g. butter. The dispersed droplets are the discontinuous internal phase,
whereas the liquid surrounding the droplets is the continuous external phase. This
review is restricted to the emulsions encountered in milk and cheese which are of
the oil-in-water type.
An emulsifying agent or the stabilising agent in an emulsion assists in the formation
of the emulsion, prevents or inhibits the creaming and coalescence of oil droplets,
and contributes to the flow properties (e.g. pourability) and mouthfeel of the
product (Marrs et al., 1989).
Natural cheese is a nearly perfect emulsion, stabilized by natural surfactants - the
cheese proteins (Shimp, 1985). Cheese contains an oil phase consisting of fats and
oil-soluble substances, and a water phase consisting of a solution composed largely
of water-soluble proteins and minerals. The two phases are naturally incompatible,

17
but are emulsified by surface-active proteins. The surface-active proteins are
soluble in both the oil and water phases and tend to collect at the interfaces
between the two phases (Shimp, 1985).
Emulsions are affected by heat treatment, addition of electrolytes (such as mineral
acid, alkali, salt, alum etc.), centrifugation, mechanical agitation, and change in
calcium content and pH (Glicksman, 1969; Shimp, 1985).
2.3.2 Emulsification of fat in milk and cheese
Milkfat has no affinity for water. However, emulsification of fat in the aqueous
phase with the help of surface active agents influences the water-holding ability of
the milk coagulum, which is supported by the effect of fat on the syneresis of
renneted gels (described earlier). It is reported that the fat-casein interface in
Cheddar cheese was the region of highest water content in the mature cheese
where the fate of the membrane which originally surrounded the rilllk fat globule
was less certain (Kimber et al., 1974).
Homogenisation: Due to homogenisation, the average size of the fat globules in the
milk is reduced from around 4 J.Lm to as little as 1 J.Lm (Mulder & Walstra, 1974),
and the total fat globule surface area is increased by about six-fold (Morr &
Richter, 1988). The creation of this extra fat-serum interface results in the
adsorption of surface active material from the serum. The composition of the
newly-created membrane makes a significant contribution to the physical properties
of the emulsion, such as separation or coalescence and destabilisation (Darling &
Butcher, 1978). Homogenisation of milk or cream results in the surface of fat
globule being coated by casein micelles, and during the formation of this surface
some casein micelles stabilise part of the surface of two adjacent fat globules
(Brooker, 1987). During homogenisation, most of the caseins go to the oil-water
interface in the form of proteinaceous colloidal particles (casein micelles) and this
leads to a protein layer much greater than monolayer coverage
(Dickinson et al., 1989a).

18
Melsen & Walstra (1989) showed that creams made from anhydrous milk fat and
skim milk were more stable than comparable natural creams. The effects of
homogenisation in the former may explain the increase in emulsion stability.
Homogenisation of fat into reconstituted skim milk resulted in a soft rennet curd,
and poor whey syneresis (Emmons et al., 1980). The curd was similar to that
obtained with the use of high heat skim milk powder (SMP) or homogenised whole
milk. Reduced syneresis may be attributed to the adsorption of casein on the
newly created surfaces of fat (Maxcy et al., 1955).
Homogenisation of fat with whey protein concentrate, sodium caseinate and SMP
resulted in fat globules with mean diameters 2.6, 1 .4 and 1.3 J.Lm, respectively;
compared to 4.2 J.Lm in unhomogenised washed cream (Aguilera & Kessler, 1988).
Stability of the fat globules against coalescence increased as the mean fat globule
diameter decreased.
It has been suggested that the fat globules interfere mechanically with syneresis
(Lelievre & Creamer, 1978; Lawrence & Gilles, 1987), or act as filler particles in
an aqueous matrix of swollen proteinaceous material (Luyten, 1988). However, the
role of fat and materials adsorbed to fat globule surface on the water-holding
ability of the protein matrix in cheese is not fully understood.
2.3.3 Influence of materials at the fat-serum interface on the emulsion stability
(i) Phospholipids
Phospholipids comprise approximately 1% of the total lipid in bovine milk.
Phospholipids are able to form stable colloidal suspensions or emulsions in aqueous
solution and have an important role in the formation and secretion of milkfat
(Jensen & Clark, 1988).
Lecithins are a group of phospholipids, ubiquitous in the cell membranes of plants
and animals, in which phosphoric acid is joined through ester linkages to a
diglyceride and to an alcohol-containing group such as the amino alcohols, or
glycerol, depending on the source of the lecithin (Marrs et al., 1989). The lecithins
19
are soluble in fat but almost completely insoluble in water. When mixed with
water, lecithins hydrate and disperse in the form of spherical globules or liposomes,
which may be < 1J,£m in diameter. The principal components of soybean lecithin,
the major lecithin of commercial interest, are phosphatidyl choline, phosphatidyl
ionositol and phosphatidyl ethanolamine. Lecithin also occurs naturally in milk.
Lecithin was used to provide a coating of an inert layer free of milk proteins over
the newly created surface of homogenised milk fat (Lelievre et al., 1990b ) .
Melsen & Walstra ( 1989) observed that when fat globules in recombined milk were
associated with appreciable amount of phospholipid, they were distinctly less stable.
They were of the opinion that phospholipid will probably adsorb at the oil-water
interface (thereby displacing proteins), considering the low interfacial tension they
may cause. However, an appreciable amount of phospholipids would be needed
at the surface layers of fat globules to displace the proteins. If enough serum
proteins are present to cover newly-created surface, the phospholipid present in
buttermilk does not adsorb onto the fat-serum interface during or after
homogenisation, and when sufficient lecithin is added to the fat before
homogenising, very unstable emulsions result (Melsen, 1989).
(ii) Caseins
Caseins, the important structural and emulsifying proteins in cheese, usually contain
calcium phosphate groups carrying essentially all the protein charge at one end
which is water-soluble or hydrophilic, while the other end is organic and non-polar
in nature and is soluble in oil or lipophilic (Shimp, 1985). Compared to many
other food proteins, the caseins are disordered and substantially hydrophobic
(Dickinson et al. , 1988).
Sodium caseinate consists of the casein fraction of milk which has been precipitated
by acid at pH 4.6, collected, redissolved by the addition of alkali to neutral pH, and
then spray- or roller-dried (Dalgleish & Law, 1988). Although sodium caseinate
is composed mainly of a mixture of a51-casein and .13-casein, it behaves rather
differently at the oil-water interface than a simple mixture of these two individual
caseins (Dickinson et al., 1989a).

20
In oil-in-water emulsions stabilised by sodium caseinate (at concentrations of 1.8
to 5 .0%, and protein to fat ratios of 0.022 to 0.07, respectively) there was no
distinct preference for either a5ccasein or B-casein to be adsorbed at the fat
globule surface during homogenisation. On aging for 24 h B-casein replaced some
but not all of the surface a51-casein. Complete replacement was never observed,
indicating that some as1-casein may have been irreversibly adsorbed (Robson &
Dalgleish, 1987).
In studying the competitive adsorption of a51-casein and B-casein in oil-in-water
emulsions, Dickinson et al. ( 1988) detected that the ratio of individual casein
components to one another in the proteinaceous membrane of homogenised milk
is different to that found in skim milk. In particular, B-casein is generally found in
larger proportions in the membrane than in the serum.
(iii) Whey proteins
Emmons et al. ( 1980) observed that when fat was homogenised into reconstituted
dried whey, the fat globules became stabilised in the absence of casein, apparently
by adsorbing whey proteins. Dispersion of fat into whey rather than skim milk in
milk replacers yielded a stronger curd and more syneresis during cheesemaking.
Whey proteins are among the most water-soluble of all proteins. They tend to
remain in the water phase of the cheese and not concentrate at water-fat interfaces.
For this reason their emulsification power is poor. However, whey proteins are
capable of complexing with casein under certain circumstances (Shimp, 1985).
The ability of one whey protein to replace another whey protein previously
adsorbed at the oil-water interface is slow and limited in contrast to rapid and
reversible exchange characteristics of case ins (Dickinson et al., 1989b ). Of the two
whey proteins, B-lactoglobulin is much more difficult to displace. B-lactoglobulin,
which has a more ordered globular structure and is able to form a tightly-packed
viscoelastic structure at the oil-water interface, is more effective in relation to the
long-term stability of the emulsion (Dickinson et al., 1989a).

21
(iv) Competitive adsorption between caseins and whey proteins
When caseins and undenatured whey proteins are adsorbed to the fat-serum
interface during homogenisation, the caseins are the more dominant group, but
with no apparent preference for any individual protein. After subsequent
pasteurisation, and on storage, whey proteins become tightly bound and are no
longer readily removed by washing (Darling & Butcher, 1978).
While complete dominance of one protein over another does not occur on the fat
globule membrane during the formation of an oil-in-water type emulsion, caseins
generally tend to adsorb in preference to the whey proteins, and B-casein in
preference to the other caseins (Dickinson et al., 1989a). Whey protein does not
displace B-casein from the emulsion droplet (Dickinson et al., 1989b ) .
(v) Replacement of proteins at fat-serum interface by surfactants '
Feijter et al. ( 1987) showed that in 50% oil-in-water emulsions, displacement of
B-lactoglobulin and B-casein from the droplet surface by water- and oil-soluble
surfactants could occur, either partly or completely, depending on the surfactant
concentration and type. When water-soluble surfactants are used, binding occurs
to protein in the bulk solution. However, binding as such cannot explain the
displacement behaviour.
The presence of surfactants tends to lower the mass of protein adsorbed per unit
surface area of fat globule membrane. Addition of sweet-cream buttermilk,
monoglycerides or Tweens to milk or cream before homogenisation can thus
replace the proteins at the interface considerably (Walstra & Jenness, 1984).
2.4 Incorporation of whey protein in cheese
2.4.1 Introduction: Incorporation of whey protein into cheese offers the advantages
of increased yield, increased nutritional value of cheese and reduced amounts of
whey solids for disposal. The water-holding capacity of whey protein; particularly
heat-denatured whey protein, which has a higher water-holding capacity than casein
(Maubois, 1987) is of particular significance in the present study. The following

22
review includes aspects related to various methods of incorporating whey protein into
cheese with particular reference to the water-holding ability of cheese.
2.4.2 Incorporation of native whey protein in cheese by ultrafiltration (UF)
It is reported that the form in which the whey protein is incorporated into the UF
cheese i. e. denatured or undenatured , may be important, both in terms of proteolysis
and water-binding (Lawrence, 1989) . Aspects of the incorporation of native whey
protein into cheese, particularly by ultrafiltration, have been extensively reviewed by
Lelievre & Lawrence ( 1988) and Lawrence ( 1989).
In the manufacture of cheese from UF concentrated milk, a reduced amoun t of whey
is drained in comparison to the conventional process. This results in more whey
protein being retained in the finished product, thus increasing the yield of cheese for
a given volume of milk. Based on these principles, a continuous method of
manufacture of Cheddar cheese with a claimed increase of 6-8 % cheese yield, the
"APV-SiroCurd process" , has been developed (Jameson, 1987) . Another method of
incorporation of whey protein is to concentrate whey by ultrafiltration and add the
retentate to the cheesemilk (Abrahamsen , 1979) . In both the methods some
denaturation of whey protein occurs during ultrafiltration (Lawrence, 1989) , the degree
of denaturation depending upon the extent of ultrafiltration and whether diafiltration is
also being done (Lelievre & Lawrence, 1988) .
Sutherland & Jameson ( 198 1) concluded from laboratory-scale trials that Cheddar
cheese comparable to conventional Cheddar could be manufactured from milk
concentrated by ultrafiltration up to 4. 8-fold and diafiltered at pH 6.2-6.4 to produce
a retentate containing 3 . 3% lactose.
Abrahamsen ( 1979) reported an increase in yield and moisture content in St Paulin and
Gouda cheeses made from milk fortified with different amounts of whey protein
obtained by UF concentration . The soluble and amino nitrogen in cheeses with whey
protein concentrate was lower during ripening , indicating a slower breakdown of the
proteins. The quality of the cheeses was inferior.

23
Mozzarella cheese made from milk concentrated by ultrafiltration did not hold firm
after grinding and seepage of serum occurred. The poor quality of the cheese was
attributed to the presence of additional whey protein (Hansen, 1987). A
Mozzarella-type cheese was made using retentates of 40% total solids (TS) from
ultrafiltered and diafiltered milk (Covacevich, 1981). This milk was chemically
acidified and salt was added to milk prior to or during diafiltration. The cheese
had excellent stretch and melt properties. However, there was some exudation
during ripening.
Considerable success has been attained in incorporating whey protein in soft or
semi-soft cheeses using milk concentrated by ultrafiltration close to the level of
total solids of the final product. Usually whey is not drained during manufacture
which ensures retention of the whey protein in cheese. This process has been used
in the manufacture of soft ripened cheeses (Furtado & Partridge, 1988) and in Cast
Feta cheese. The presence of native whey protein in UF Cast Feta makes the
texture of the cheese different from the traditional product (Lelievre & Lawrence,
1988). Increase in the yield of such cheeses up to 30% have been claimed
(Hansen, 1977), but Lawrence ( 1989) was sceptical of the claimed yield increases,
particularly in view of the possible losses that would occur from exudation during
brining and storage.
Quarg, Ricotta and Cream cheeses may be manufactured using ultrafiltration
technology, and the quality of such cheese is comparable to that of the traditional
products. However, the economic advantages of the UF process in incorporating
whey protein may be limited as considerable amount of whey protein is already
retained in cheese made by the traditional processes where the heat applied is
usually sufficient to denature the whey protein (Lelievre & Lawrence, 1988).
2.4.3 Incorporation of denatured whey protein in cheese by heat treatment of
cheesemilk
Cheese made from pasteurised milk contains only a small fraction of whey protein,
most of which is lost in the whey. Efforts to retain whey protein in cheese by
treating milk at high temperatures have not been successful because of difficulties

24
in coagulating such milks with rennet. Hoodyonk et al. ( 1987) concluded that the
poor rennetability of heated milk was related to the impaired aggregation
properties of part of the rennet-converted casein micelles covered with denatured
whey proteins and the diminished attraction between these proteins due to
precipitation of calcium phosphate during heating. The retardation of rennet
enzymatic activity in heated milks was attributed to the denaturation of
13-lactoglobulin and its interaction with K-casein. Complete denaturation of
13-lactoglobulin caused a reduction of about 20% in the rate of K-casein breakdown.
Lowering of the pH was suggested as the most effective way to improve the
renneting properties of heated milk.
Marshall (1986) reported that heating milk to 97 • C/15 s did not inhibit enzyme
action of rennet, but additional Ca2+ and initial pH of 6.4 were required for normal
coagulation and curd-firming. Cheshire cheese made from this milk tended to be
too moist with poor curd fusion, but raising the scalding temperatures and
cheddaring the curds could possibly overcome this. An increase in yield was
recorded. The process was recommended as being suitable for cheese with high
moisture content and crumbly texture.
Banks et al., ( 1987) manufactured Cheddar cheese from extensively heat treated
milk ( llO • C/60 s). The rennet coagulability of the heated milk was improved by
acidification of milk to pH 5.8 prior to starter addition and renneting. They
claimed that improvement in cheese yield of the order of 10% (3.0 to 6.7% on a
dry solid basis) could be achieved. A bitter off-flavour and a weak-bodied product
resulted. The bitterness in cheese was attributed to the acidification process rather
than to the incorporation of the whey protein. Banks (1988) further optimised the
above process and eliminated the bitter flavour by using a reduced amount of
rennet. However, the development of high quality Cheddar flavour was impaired.
The yield increase resulted from a slight advantage in terms of fat retention and
marked increase in protein retention in cheese. The increase in fat recovery was
attributed to an increase in protein to fat ratio, and the increase in protein recovery
to complex formation between 13-lactoglobulin and K-casein.

25
The adverse effects of severe heat treatment of milk (95 ° C for 1 min) on rennet
coagulation may be reduced by the addition of low concentrations of CaC12,
acidification of the milk to pH 5.5 and reneutralisation to pH 6.0 (Singh et al.,
1988). It is suggested that the acidification of heated milks increases the Ca2+ and
the subsequent neutralisation of the acidified milk partly restores the Ca2+ , i.e.
acidified/reneutralised milk has a higher Ca2+ than normal milk. This accounts for
the improvement in the coagulability of the milk. It is further suggested that this
treatment of heated milks could be used to incorporate 50% of the whey protein
into renneted gels and thereby increase the cheese yield.
In a process described by Cercetare ( 1983) for manufacture of fresh cheese from
cow's milk 56-63% of the whey protein were retained in the cheese by
coprecipitating casein and whey protein. It is claimed that the product has a better
consistency and flavour in comparison to the conventional product.
2.4.4 Incorporation of whey protein in cheese by addition of heat-denatured whey
protein to cheesemilk
The incorporation of heat-denatured whey protein into soft and semi-soft cheese
in order to increase the water-holding capacity is a logical extension from the
manufacture of yoghurt and traditional Cream cheese (Lawrence, 1989).
The Centdwhey process for recovering whey proteins and incorporating them into
cheesemilk (Walker, 1970) involves the heating and acidification of whey to
coagulate the proteins, and their concentration by centrifugation. Normal cheese
whey is cooled to 8 o C to stop acidification, neutralised to pH 6.25, heated at 96 o C
for 20 min, acidified to the iso-electric point, held for 1 min, cooled to 40 o C,
centrifuged in de-sludging separator and finally cooled for storage. The method has
been used successfully in the manufacture of soft and semi-hard cheeses with the
addition of up to 2.8 g dry matter per litre of milk. It is recommended that fat be
added to maintain the desired protein to fat ratio in the cheese, and that slight
modifications with the manufacturing method be done with the aim of making a
slightly drier product. Another very similar process has been described by
Genvrain ( 1968).

26
Advantages claimed for the Centriwhey process include the following: increased cheese
yield due to the incorporation of albumin and globulin which are otherwise lost i n the
whey, greater uniformity of the weight of the cheeses, quicker ripening, suitability of
the protein-free whey for lactose manufacture, and reduction in the biological oxygen
demand of the whey for disposal as an effluent (Anon. , 1969a) .
Reported levels of incorporation of heat-denatured whey protein (on dry matter basis)
varied from 3 . 0 to 6 .0 g/kg cheesemilk (Kononova et al. , 1 973 ; Krasheninin et al. , 1974; Sakharov et al. , 1975) . Addition of heat-denatured whey protein was reported
to increase the retention of free and bound moisture in cheese considerably, due
primarily to the greater hydrophilicity of these proteins compared to casein
(Krasheninin et al., 1974) . An improvement in the dispersion of the denatured whey
protein in cheesemilk by homogenising at a pressure at 15 ,000 kPa resulted in reduced
loss of whey protein and a slight increase in yield. Homogenisation of milk with added
whey protein reduced hardness, and improved consistency and porosity of cheeses
(Kononova et al., 1973) .
Brown & Ernstrom ( 1982) made Cheddar cheese by incorporating whey solids,
obtained by ultrafiltering cheese whey to values from 9 . 8 to 20. 3 % solids and
heat-denaturing at 75 °C for 30 min. The acid production by starters was faster during
cheese manufacture. The rennet coagulation was also faster apparently due to presence
of residual enzyme from ultrafilterd whey. The cheese had a decreased fat content,
decreased pH, increased moisture and increased yield . The cheese was comparable to
the control cheese except for the 'acid ' flavour defect. The lower pH of cheese was
attributed to accelerated growth of starter organisms in the experimental cheese,
possibly due to high free nitrogen and lactose obtained from the heated whey
concentrate and due to the high moisture in cheese.
Pang ( 1989) reported similar trials involving manufacture of a Cheddar cheese base
from milk into which denatured whey protein concentrate was incorporated. He was
not able to obtain a consistent increase in yield . However, the cheese base was
successfully used to manufacture processed cheese.

27
2.4.5 Role of whey proteins in proteolysis of cheese
Native whey proteins: Koning et al. ( 1981) stated that undenatured whey proteins
in low fat semi-hard UF cheese form about 18.5% of the total protein. The whey
proteins themselves were completely resistant to the proteolytic enzymes of rennet
and starter during ripening. Proteolytic degradation of o:5r and B-caseins was
similar in cheeses with and without the undenatured whey proteins. In contrast,
however, Harper et al. (1989) showed that the native whey proteins decreased the
rate of o:51-casein proteolysis in Cheddar cheese slurries, probably due to chymosin
inhibition. B-casein proteolysis was also inhibited by native proteins, possibly due
to suppression of both plasmin and chymosin activity. Further, in five-fold
concentrated UF cheese, reductions were found in the activity of plasmin and in
the hydrolysis of B-casein, o:5r and o:5ci-casein (Hansen, 1990).
Denatured whey proteins: The hydrolysis of denatured whey proteins during cheese
ripening has been reported to give rise to atypical flavour and texture (Green et al.,
1981 ; Brown & Ernstrom, 1982; Banks & Muir, 1985). A study on the effect of
whey proteins on the proteolysis of Cheddar cheese slurries revealed that denatured
whey proteins had little effect on a:5rcasein degradation (Harper et al., 1989).
However, B-casein proteolysis was inhibited by the denatured whey proteins. The
inhibitory effect of a high molar mass protein present in whey protein concentrate,
which inhibited the action of chymosin and retarded proteolysis in cheese made
with incorporation of native whey protein, was found to be destroyed by the
heat-denaturation of whey protein (Lelievre et al., 1990a).
Overall, it appears that the presence of large amounts of whey protein in cheese
tends to change its textural properties and also its ripening pattern. The extent to
which this occurs is dependent upon the amount of whey protein incorporated and
the state of denaturation of the whey protein (Lawrence, 1989). The effect of an
increase in concentration of native or denatured whey proteins in cheese on the
proteolysis is not fully understood. It has not yet been established whether the rate
of proteolysis of casein in UF cheese is affected by the proportion of whey proteins
present or the extent to which they have been denatured (Lawrence, 1989). More
work is necessary to confirm these reports (Lelievre & Lawrence, 1988).

28
2.5 Cream Cheese
2.5.1 Introduction
Cream cheese is a soft, unripened, non-rennet cheese with a rich, mildly acid
flavour and a smooth, buttery consistency which permits slicing with a knife without
breaking or crumbling (Slyke & Price, 1949; Kosikowski, 1977) . It should have
good spreading qualities even at refrigerator temperature (Wilster, 1969). Cream
cheese is used for cheesecake, salads, dips, and as a sandwich spread.
2.5.2 Composition
A typical composition of commercial unripened Cream cheese (Kosikowski, 1977)
is as follows: 33.5% fat, 54.0% water, 9.8% protein, 0.75% salt, and 0.3% gums.
To comply with federal standards in USA, Cream cheese should contain at least
33% fat, and not more than 55% moisture. It is not legal to use sorbates or
propionates in hot-pack Cream cheese, though these are allowed in cold pack
natural ripened cheese.
Cream cheese is described as 'hot-packed' or 'cold-packed' depending on whether
or not the final blend of curd, salt, gums and condiments are heat treated prior to
packaging. The hot-pack method is the main method in use these days for reasons
of a much improved keeping quality (Kosikowski, 1977; Honer, 1988).
A common problem for manufacturers of Cream cheese and Cream cheese spread
is syneresis (exudation) after packaging (Modler et al., 1985). The addition of a
hydrocolloid or stabiliser prevents syneresis during cooling and storage (Wilster,
1969) and is more commonly used in the hot-packed Cream cheese (Slyke & Price,
1949). However, in some countries, e.g. Federal Republic of Germany, addition of
colloids or stabilisers in Cream cheese is not permitted (Holdt, 1971).

29
2.5.3 Manufacturing technique
The basic operations in the manufacture of Cream cheese (Zakariasen & Combs,
1941; Kosikowski, 1977; Scott, 1981 ; Honer, 1988) are quite similar in spite of
individual variations used by different manufacturers (Honer, 1988).
Typically a mix (standardised milk of about 1 1% fat and 8% solids-not-fat) is
blended from milk and cream (other mixes containing cream, whole milk,
condensed skim milk, SMP may be used), homogenised, pasteurised and acidified
by lactic starter to pH of about 4.6 to form a coagulum (curd). In the short-set
method of manufacture, � 5% starter is inoculated into the standardised processed
milk at � 3 1 • C. A small amount of rennet may be added just after the addition
of starter at the rate of 1 ml/1,000 kg standardised milk to facilitate setting. Acid
production is rapid and coagulation is completed in 5-6 h. In the long-set method,
starter is inoculated to standardised milk at � 0.5% at � 22 ·c, and it takes 14-16 h
for the curd to set.
The curd is either drained overnight in bags, or separated from whey through a
centrifugal separator. The drained curd is then heated to � 75 • C in a
kettle/tubular heater/scraped-surface heat exchanger or similar device. Salt,
stabilisers and condiments etc. are blended into the curd and the product is then
packed into foil-lined boxes or containers.
Some manufacturers homogenise the blended product at 2,500 to 4,000 psi ( 17,225
to 27,560 kPa) to minimise oiling-off in the product. Homogenisation of the final
blend ensures effective dispersion of the additives and their uniform distribution
into the hot mix. Electron microscope studies have shown that viable lactic
bacteria were killed in a whey protein-cream mixture base for making Cream
cheese spread, when heat treated in the processing kettle (Kalab & Modler, 1985).
The heat-treatment of the blend makes the product commercially sterile and
increases its shelf-life to � 60 days with refrigerated storage. Product deterioration
is thus mainly due to oxidative reactions and a low level of residual activity of
heat-resistant enzymes.

30
Process control
The fat content of the final product affects its texture. At lower levels of fat the
cheese tends to be grainy and crumbly, while at higher levels it tends to be
excessively smooth and sticky (Roundy & Price, 1941).
The pH at which the curd is cooked is important as it affects the whey drainage.
The optimum pH is 4.6 when a cooking temperature of 55 ° C is used. At higher
pH values and higher cooking temperatures the resulting curd tends to be dry,
crumbly and rubbery; while at lower pH values and lower cooking temperature the
curd is smooth, soft, sticky and undrainable (Lundstedt, 1954; Wilster, 1969). Curd
cooked at a pH of 4.6 results in cheese with a pH of 4.7 to 4.8.
The drainage of whey from curd is slowed with increase in fat content in
standardised milk, increase in pasteurisation temperature and homogenisation
pressure, decrease in cooking temperature, and addition of salt and neutralisers
before cooking (Lundstedt, 1954). In general, faster the drainage the coarser the
cheese; and slower the drainage the smoother the texture of the cheese.
2.5.4 Modified methods
(i) Cream cheese without whey drainage
The elimination of the curd-draining step in the manufacture of Cream cheese was
introduced over 60 years ago by Dahlberg (1927). In this a high solids mixture of
fresh cream (40 to 50% fat), skim milk powder (5% of the mixture) and gelatin
(1%) or agar (0.5%) was pasteurised. Salt and commercial starter were added to
the mixture. The mix was then homogenised, cooled to 21 ° C and held for 10 to
15 h for the acid to develop, and then stored at refrigerated temperature. The
effect of homogenisation in changing the fat from a dispersed to a continuous phase
improved the body and texture of the cheese. Reducing the fat content resulted
in some whey leakage. As this cheese was not hot-packed, the residual microflora
would be expected to be active to some extent which would increase acidity and
proteolyse caseins during refrigerated storage. More recently, somewhat similar
procedures have been developed (Forman et al., 1979; Davis, 1980).

3 1
Shchedushnov et al. ( 1978) developed a new Cream cheese by mixing homogenised
cream and condensed whey, heating to 90-95 ° C for 5-10 min and cooling. To this
skim milk curd is added and the mix passed through a colloid mill, packaged and
cold-stored.
Application of ultrafiltration: Protein-rich retentates from ultrafiltered milk have
b'een used for manufacture of Cream cheese (Kosikowski, 1974; Maubois, 1980).
The retentate is mixed with suitable proportions of cream, salt, gums and starter.
The mix is then pasteurised, homogenised and hot-packed into containers. A
similar method has been formulated with an exception in the use of
glucono-o-lactone for acidification instead of starters (Hansen, 1985).
(ii) Reduction in the rate of exudation from Cream cheese
Use of whey protein-rich protein base: Cream-type cheeses were prepared from
blends of whey protein-rich protein bases and high-fat sour cream (Modler et al.,
1985). The blends were standardised with buttermilk, pasteurised, homogenised
and hot-packed. The cheeses showed no evidence of syneresis (exudation) during
storage presumably due to the presence of large amounts of whey protein.
Direct acidification method: Roundy (1960) described a rapid process of making
Cream cheese by the direct acidification of a mixture of milk and cream with edible
acid to pH 4.6-4.7 at 10-50 ° C followed by centrifugal separation for removal of
whey. The method is claimed to produce a Cream cheese that has little or no
tendency to leak whey during storage. Corbin ( 1971) devised a process of direct
acidification by using phosphoric acid and D-glucono-0'-lactone.
Blending of curds: Carswell & Hurlburt ( 1970) described a process of preparing
Cream cheese with no non-dairy stabilisers, the cheese exhibiting minimal amount
of whey separation during storage. This process involves preparing a Cream cheese
mix (sour curd) to a predetermined acidity (say 0.85%) and adding a substantially
unripened second Cream cheese mix (sweet curd) to reduce the acidity of the
mixture to 0.7%. The mixture is then separated to Cream cheese and whey
according to the conventional process.

32
2.6 Feta cheese
2.6.1 Introduction
Feta cheese is one of the family of white brined cheese that originated in the
eastern Mediterranean countries (Caric, 1987). While Feta was originally
manufactured from sheep's or goat's milk, it is nowadays also made from cow's
milk (Lloyd & Ramshaw, 1979; Scott, 1981; Caric, 1987; Abd El-Salam, 1987).
These days Feta cheese is made in several other countries.
Feta is a soft, high salt, low pH, rennet coagulated, non-pressed, brine-stored
cheese. Specific characteristics of F eta vary widely depending on the milk used and
the methods employed in its manufacture and ripening.
2.6.2 Flavour: The flavour of Feta may vary from mild aromatic to strongly
lipolytic. Lipase is commonly used in manufacture, especially when pasteurised
cow's milk is used. The cheese is frequently very salty from storage in brine,
although excess salt is sometimes removed by soaking cheese portions in fresh
water prior to consumption.
A wide range of fatty acids and their derivatives have been reported (Efthymiou,
1967; Ada, 1987) that contribute to the flavour and aroma of Feta cheese. Acetic
acid is the most abundant acid present in Feta cheese. The presence of fatty acids
and their derivatives reflect the lipolytic activity of added lipase or the lipase
originally present in milk, and the activity of starter and non-starter
microorganisms. Aspects related to lipolytic activity in cheese are not being
reviewed here as it was not expected to influence exudation.
2.6.3 Texture: The texture of Feta cheese may vary from soft and crumbly, to
smooth and sliceable (Kosikowski, 1977; Pernodet, 1987; Efthymiou & Mattick,
1964). Mechanical openness in the curd structure is typical of traditional Feta
(Scott, 1981) but Cast Feta made by the UF process usually has a continuous
porcelain-like texture devoid of mechanical openness.

33
2.6.4 Colour: Feta made from sheep's or goat's milk is very pale, almost white,
whereas when made from cow's milk it has a yellow colour due to carotene that is
considered undesirable by most consumers of the traditional product.
2.6.5 Composition: The composition of Feta cheese varies widely according to the
milk type and composition, methods of manufacture, period of storage in brine, and
other factors. The composition of best quality Feta cheese in Greece made from
sheep's or goat's milk has been reported as moisture � 52.5% and fat ;::: 22%.
Lower quality cheeses had higher moisture and lower fat contents (Anifantakis,
1986). This is in good agreement with the observations of Siapentas ( 1981) on Feta
cheese made from cow's milk, the approximate composition from the best cheeses
being 50% moisture, 25% fat, 15% protein and 3% salt.
2.6.6 Manufacturing techniques
In a typical procedure for the manufacture of Feta cheese (Anon., 1969b; Mehran
& Kosikowski, 1972; Lloyd & Ramshaw, 1979; Scott, 1981 ; Anifantakis, 1986; Abd
El-Salam, 1987), fresh whole milk is inoculated with � 2% starter at about 32 • C
and ripened for � 2 h. Rennet and lipase are added, and after 45-90 min setting
time the coagulum is cut into � 2 cm cubes. The curd is held in the whey with
intermittent stirring for up to 60 min, ladled into hoops and drained for � 18 h
(overnight) with successive turns in the first few hours. The young cheese may be
either dry-salted by application of crystalline salt to the exterior of the cheese or
brine-salted (23% brine) before final storage in � 10% brine at 5-10 • C. Mansour
& Alais ( 1972) showed that the Cryovac process of vacuum wrapping the Feta
cheese after brining was an useful method for storage and ripening. The cheese
is usually ripened for about 2 months before being ready for consumption. In
earlier days pasteurisation of milk was not commonly practised. However, most
manufacturers now pasteurise the milk for reasons of public health and uniform
product quality. Homogenisation may form a part of the cheese manufacturing
process. Bleaching agents may be added, particularly when cow's milk is used.
Feta cheese of good flavour, colour and body can be manufactured from a
'recombined milk' prepared from low heat skim milk powder (LHSMP) and

34
anhydrous milk fat (Gilles , 1974) . Reconstituted skim milk (RSM) is prepared by
mixing suitable proportions of LHSMP and water. Anhydrous milk fat (AMF) and
LHSMP are used for preparation of reconstituted milk of 1 1 % solids-not-fat (SNF) and
3 % fat. AMF is emulsified with RSM as a 20% cream by two-stage homogenisation
at 200/50 kg/cm2 ( 19 ,58 1/4, 892 kPa) . The uniform composition of this milk ensures
that a cheese of consistent composition is obtained . CaC12 (0. 04%) is added to
reconstituted skim milk to get a firm curd. Commercial lipase is added to obtain a
more acceptable product. The most acceptable cheese was made with the use of a
starter comprising Streptococcus lactis and Lactobacillus casei or Lactobacillus
acidophilus, the addition of commercial lipase, and the addition of CaC12 (0. 04%) to
favour the formation of a firm coagulum.
Feta cheese made by the application of ultrafiltration technique differs greatly in body
and texture from the traditional variety due to incorporation of whey protein , and has
not been included in this review.
2.6. 7 Changes in brine-stored Feta cheese during Storage
(i) Loss and uptake of moisture, and change in weight of cheese
Because of the application of salt to the exterior of the cheese, either by dry or by
brine-salting, some time is required for the salt to penetrate to the interior of the
cheese and establish an equilibrium. This early imbalance in salt concentration between
the outside and the interior of the cheese allows more acid development to occur in the
interior of the cheese. This can lead to a rapid exudation of moisture from the young
cheese and consequently a lower moisture content. However, the moisture loss that
occurs in the early stages of salting and curing of Feta cheese i s partly
counterbalanced by an uptake of moisture from the brine after 10-30 days (Mansour &
Alais, 1 972; Alichanidis et al. , 1984; Vafopoulou et al. , 1989) . The reabsorption of
moisture has been attributed to the re-establishment of osmotic equilibrium (Mansour
& Alais, 1 972) and formation of new ionic groups due to peptide bond cleavage
(Vafopoulou et al. , 1989). This phenomenon of initial moisture loss and
subsequent rehydration has been observed particularly when the NaCl
concentration in the brine was = 1 0% . However, cheese stored in brine of

35
18% NaCl concentration lost moisture when stored at 5-15 ·c and never regained
weight (Mansour & Alais, 1972).
Omar & Buchheim ( 1983) showed a reduction in moisture content from 58.2% to
52.3% in case of Feta made from fresh milk in comparison to a reduction from 53.2
to 50.2% in cheese made from instant whole milk powder.
The loss of moisture from Feta-type cheese vacuum packed in Cryovac was only
2.4% in 120 d with a weight loss of 1.35%. There was slight exudation of whey
between the cheese and the plastic film. Likewise, Domiati cheeses showed less
weight loss when not stored in brine compared to when stored in 5% NaCl brine
or 5% salt permeate (Abd El-Salam, 1981).
(ii) Change in lactose content and acidity of cheese: The conflicting reports on the
changes of acidity in Feta-type cheeses may reflect the variety of conditions used
in the manufacturing process.
Mansour & Alais (1972) reported a decrease of pH during storage until 30 d, after
which pH started to rise again. According to Omar & Buchheim (1983) lactose in
Feta-type cheese disappeared within 1 month. Thomas & Crow ( 1983) reported
that 90% of the lactic acid present in commercial Feta was present as the
D-isomer. This would indicate that the activity of non-starter lactic acid bacteria,
salt-tolerant lactobacilli in particular, could be significant in completing the
utilisation of any residual lactose present in the cheese, or in the racemisation of
the L-isomer of lactic acid to the D-isomer.
In cheese stored traditionally in brine, some lactose and lactic acid may be
expected to diffuse out of the young cheese into the brine, and thus limit the
tendency for the acidity of cheese to increase during storage. In contrast, in Feta
type cheese stored in a Cryovac pack, acidity increased until 30 d and then
remained stable. The lactic acid concentration in this cheese was three times
higher than in brine-salted cheese (Mansour & Alais, 1972). This result may be

36
explained by the increased activity of microorganisms in the relatively low-salt
cheese and the absence of any loss of acid into a brine.
The concentration of the salt in the cheeses, or the salt concentration of the brine
in which the cheeses are stored, would be expected to have a marked effect on
microbial activity during cheese storage.
(iii) Proteolytic changes
Continuous proteolysis during storage of brine-stored cheeses is indicated by the
gradual decrease in total nitrogen (TN) and increase in the soluble nitrogen (Abd
El-Salam, 1987). The decrease in total nitrogen is attributed to the conversion of
proteins into the soluble fraction during proteolysis and the subsequent transfer of
the soluble fraction into the brine. The proteins are hydrolysed by milk-clotting
enzymes used during cheese manufacture and the protein breakdown products are
further proteolysed to the soluble nitrogen by the cheese microflora.
In general, the proteolytic activity of rennet during ripening of cheese is markedly
affected by the salt concentration (Fox & Walley, 1971). This could explain the
resistance of para-K-casein to hydrolysis throughout the storage period in Syrian
white brine-stored Feta-type cheese from cow's milk (Mansour & Alais, 1972).
A number of fast- and slow-moving degradation products were apparent in the
electrophoretogram of proteins from brine-stored cheeses. The breakdown
products with mobilities higher than a51-casein were comparable to those formed
by the action of chymosin on a51-casein, while the slow-moving fractions
corresponded to the gamma-caseins produced from J3-casein by the action of the
indigenous milk proteinase, plasmin (Eigel, 1977; Abd El-Salam, 1987).
J3-casein in Feta-type cheese from ewe's milk and cow's milk resists hydrolysis
whereas a5rcasein hydrolyses rapidly (Mansour & Alais, 1972; Alichanidis et al.,
1984). There was a loss of low molecular weight nitrogen (peptides, amino acids,
ammonia) into brine during storage (Mansour & Alais, 1972). The rate of
proteolysis that occurred in cheese stored at 10 o C in 15% brine was similar to that

37
observed in cheese stored at 20 ° C in 18% brine. Proteolysis of the cheese was
almost completely inhibited at 5 ° C.
The rapid proteolysis detected in Cryovac wrapped Feta-type cheese in comparison
to brine-stored cheese may have been due to the lower salt concentration in the
former which had been brined for only 6 h in 12% NaCl (Mansoor & Alais, 1972).
(iv) Texture changes
Partial loss of Ca2+ bridges in the cheese matrix as a consequence of lowering of
cheese pH and other soluble protein breakdown products into the brine (Mansour
& Alais, 1972), and the continuous proteolysis of a5ccasein lead to a change in the
protein matrix and provide a smooth body to the ripened cheese (Abd El-Salam,
1987). When the a51-casein molecules are cleaved so that they lose their ability to
act as a link in the protein network (Lin et al., 1972), then the network
disintegrates. This cleavage of a5ccasein in brine-stored cheeses causes a loose
structure, i.e. a crumbly texture.
2. 7 Salt diffusion
2.7.1 Introduction: In cheeses which are brined, or salted by application of dry salt
to the exterior surface, salt diffuses from the exterior to the interior over a period
of time. In soft, brined cheeses, salt diffusion affects the growth of acid-producing
lactic acid bacteria which in turn influences the cheese pH (Noomen, 1977). It is
reasonable that salt diffusion, which affects microbial activity, cheese pH and
consequently proteolysis, may also influence the exudation from cheese. It was
therefore considered useful to review the aspects related to salt diffusion.
2.7.2 Theories on salt diffusion
Geurts et al. (1974b) described the uptake of salt and concurrent loss of moisture
during brining of cheese as an impeded mutual diffusion process. Water is not
displaced because of independent shrinkage of the matrix. A reduction in the
volume of the cheese follows from the net transport of water and salt. Mansour

38
& Alais (1972) suggested that the osmotic equilibrium plays a major role in the
exchange of the moisture and salt between the cheese and the brine.
Romano cheese is a hard, low moisture, heavily salted (8 to 14% salt-in-moisture
concentration) cheese. The cheese is salted by immersion in brine as well as by
surface application of dry salt. Therefore, a large salt-in-moisture concentration
gradient occurs within a block of cheese and at different stages of ripening ( Guinee
& Fox, 1983). It is suggested that the transport of salt in Romano cheeses occurs
by mutual diffusion process - water is lost by a combination of mutual diffusion and
osmosis, the osmotic level being more pronounced as the surface to volume ratio
of the cheese block increases, due to the higher salt uptake (Guinee & Fox, 1986a).
Geurts et al. ( 1980) postulated that the actual quantity of salt which passes through
a flat cheese surface is proportional to the square root of the duration of the salting
and the moisture content of the cheese. They stated that, if the salt uptake was
known, it is possible to predict total salt uptake in spherical cheeses, the weight loss
of the freshly salted cheese and the final moisture content of the brined cheese.
2.7.3 Factors affecting salt diffusion
Salt diffusion in cheese is affected by ion exchange phenomenon, electrostatic
forces (as a consequence of charged groups on the protein matrix) and contraction
of the solution (Geurts et al., 1974b).
Cheese geometry: Cheese shape and size influence the rate at which salt (and
salt-in-moisture concentration) becomes uniformly distributed throughout the
cheese (Geurts et al., 1980; Guinee & Fox, 1986c). The time taken for attaining
equilibration of salt-in-moisture concentration in cheese was 8-12 d for Camembert
(Kieferle & Seyrer-Reindl, 1953), about 40 d for Greek white Feta (Georgakis,
1973) and 80-90 d for spherical Romano (Guinee & Fox, 1986c).
Fat: High-fat cheese loses moisture less readily than does low-fat cheese under all
manufacturing conditions (Geurts et al., 1974b). Effective salt mobility is reduced
by fat, hence the water flux will decrease when the fat content increases. The

39
sieving effect of the protein matrix, and the obstructions of the fat globules and
protein strands through which salt can not penetrate (which increase the real
distance travelled by a salt molecule on proceeding from one parallel to another),
reduce the apparent diffusion rate relative to that in the pure water (Guinee &
Fox, 1987).
Calcium in brine: Cheese takes up water and swells in the absence of calcium in
brine solutions of low salt concentration (Geurts et al., 1972). The use of CaC12 in
brine at a level similar to that already present in cheese is therefore recommended.
Moisture content of cheese: The cheese takes up more salt when its moisture
content is higher (Geurts et al., 1980).
Duration of brining: The duration of brining greatly influences the salt uptake, the
water content and the weight loss from cheese (Geurts et al., 1980; Hardy, 1987).
Temperature of brining: An increase in the temperature of brining in Feta-type
cheese increased moisture loss from the cheese and decreased the diffusion of salt
into the cheese (Mansour & Alais, 1972). However, Geurts et al. ( 1974b) were of
the opinion that salt uptake was not retarded or stopped during brining at a high
temperatures although it may be affected at extremely low temperatures.
Storage temperature: At higher storage temperatures the time required for
salt-in-moisture concentration to equilibrate in cheese after salting is expected to
be less than the lower temperatures (Guinee & Fox, 1987).
Salt concentration gradient: The application of dry salt to the exterior surface of
a cheese or the use of concentrated brines (:::: 23% salt) would result in a higher
salt concentration gradient between exterior and interior than if lower strength
brines were used. While the salt concentration gradient influences the rate of
absorption of salt by a cheese during salting, it does not however affect the
mobilities of the diffusing species except during brining in supersaturated salt
solutions (Geurts et al., 1974b; Guinee & Fox, 1987).

40
pH: Geurts et al. (1980) found that reducing the brine pH decreased the salt
uptake and increased the moisture loss from Gouda cheese. This was attributed
to the precipitation of casein in the outer layer of the cheese at pH values close to
the iso-electric point, and consequently the formation of a hard low-moisture rind.
When Camembert cheese was brined in brines at pH values from 1.5 to 8.3, the
salt absorption was unaffected. The acid brines tended to reduce the moisture
content of the cheese more than neutral or alkaline brines (Hardy & Weber, 1978).
2.7.4 Influence of salt on ripening of cheese
Salt has a major effect on the proteolytic activity of residual rennet and the varied
activities of the microbial flora during the ripening of cheese. In one-month old
Cheddar cheese containing 4% salt-in-moisture concentration, approximately 5%
of the as1-casein and 50% of the £-casein remained unhydrolysed (Thomas &
Pearce, 1981). In cheeses with 6% salt-in-moisture concentration, 30% of the
asrcasein and 80% of the £-casein were unhydrolysed, while in cheeses with 8%
salt-in-moisture concentration the corresponding figures were 60% and 95%.
Proteolysis of £-casein by rennin was completely inhibited in the presence of 10%
NaCl and was considerably reduced by 5% NaCl (Fox & Walley, 1971) . The
inhibitory effect of NaCl on the proteolysis of £-casein was independent of pH and
incubation temperature. Rennin hydrolysates of £-casein were bitter in flavour
whereas those of as-casein were not. The effectiveness of NaCl in controlling the
development of bitter Cheddar cheese may be due to its relatively greater
inhibitory effect on the proteolysis of £-casein than of as1-casein.
2.8 Changes in cheese during storage
2.8.1 Residual lactose, acidity and pH of cheese
The final stages of acid production in Cheddar cheese occur after the milled curd
fingers have been salted. The rate at which this acid production occurs depends
on the salt-in-moisture concentration. At high levels of salt-in-moisture
concentration ( 6-7%) lactose persists in cheese for at least 6 months (Thomas &
Pearce, 1981) . At lower levels residual lactose is utilised with the formation of
lactic acid. Consequently strong correlations are found between residual lactose

41
concentration and salt-in-moisture concentration, between cheese pH and
salt-in-moisture concentration, and between residual lactose concentration and pH
at 14 days after manufacture (Thomas & Pearce, 1981 ; Lawrence & Gilles, 1987).
The residual lactose, acidity and pH of cheese are interrelated, and may have a
significant effect on the proteolysis and quality of all varieties of ripened cheeses.
2.8.2 Residual enzymes in cheese
To a very large extent the amount of residual rennet retained in cheese curd will
determine the extent of proteolysis observed during ripening of cheese (Visser,
1977b; Koning et al., 1981). The amount of residual calf rennet retained in the
curd will be determined not only by the amount used initially to coagulate the milk,
but also by the pH of the curd at draining, and other manufacturing conditions.
In Swiss cheese calf rennet is almost completely inactivated at the high cooking
temperature of � 50 ° C used (Lawrence et al., 1987), whereas in Cheddar ( � 38 o C
cook) approximately 35% of the calf rennet activity is destroyed by the time the
whey is drained (Holmes et al., 1977). The distribution of calf rennet in cheese and
whey is pH-dependent. In freshly-coagulated milk 31% of activity was retained in
curd and 72% lost in the whey at pH 6.6; but 86% retained in the curd and 17%
lost in the whey at pH 5.2 (Holmes et al., 1977). The practical significance of this
was demonstrated by Creamer et al. (1985) who showed that addition of calf rennet
to milk of lower pH values resulted in Cheddar cheeses exhibiting more proteolysis,
the low pH favouring the retention of chymosin and reducing denaturation of
enzyme (Singh & Creamer, 1990). The age of cheese had no apparent effect on
the activity of residual chymosin, suggesting that the chymosin is stable and active
in cheese over a long period of ripening.
2.8.3 Calcium in cheese
The extent of acid production during cheese manufacture, especially before the
curd is separated from the whey largely determines the calcium content in cheese
(Lawrence & Gilles, 1987).

42
Cheddar cheese made from milk adjusted to a low pH value had lower
concentrations of calcium and phosphate than cheese made from normal milk with
a pH 6.6. Throughout maturation the texture of the cheeses made from the
acidified milk was more crumbly, and less force was required to fracture the curd
(Creamer et al., 1985). The texture, however, seems to be related more to the
differences in cheese pH than to the calcium content of the cheeses
(Creamer et al., 1988).
The extent to which the sub-microscopic structure of the casein micelles will be
retained in the cheese in its original undisrupted form is largely determined by the
loss of calcium phosphate. The quantity of micellar calcium phosphate lost is
determined by the acidity developed before the whey is drained from the curd. In
acid cheeses such as Feta, Cheshire, and the mould-ripened cheeses which have a
relatively low mineral content, the casein sub-micellar units have been disrupted
(Lawrence et al., 1983).
In low pH cheeses the mineral level is low and does not provide much scope for
variations in terms of calcium content in the final product. It needs to be
established if this reduced level of calcium in low pH cheeses has any influence on
the exudation of whey from cheese.
2.8.4 Proteolysis in cheese
This review summarises aspects of proteolysis, particularly related to soft and
brine-salted (Gouda-type) cheese, which may be of special relevance to the present
study. Proteolysis in cheese made with incorporation of whey protein and
proteolysis in brine-stored Feta cheese have been described earlier in this Chapter.
General aspects of proteolysis in cheese have recently been reviewed by Fox (1989).
The proteolytic enzymes potentially able to be involved in the ripening of cheese
include rennet ( chymosin), native milk protease (plasmin), and the enzymes of the
starter and non-starter bacteria.
Chymosin and plasmin are responsible for specific proteolysis, while the bacterial
and mould enzymes are responsible for non-specific proteolysis (Creamer, 1979).

43
In Gouda cheese rennet was shown to be responsible for the pnmary
decomposition of a51-casein and part of B-casein, while starter bacteria degraded
these proteins further during the long period of cheese ripening (Visser &
Groot-Mostert, 1977).
The approximate proportions of a51-casein, a52-casein, .B-casein and K-casein in milk
are 4 :1 :4 :1 . Presumably this ratio is carried over to freshly made cheese, except for
K-casein which is proteolysed during cheese manufacture. as1-casein is more easily
broken down than B-casein by rennet in the ripening of most varieties of cheese
(Mansour & Alais, 1972; Noomen, 1983; Fox, 1989). Hydrolysis of the most
susceptible bonds in a51-casein (Phe23-Phe24 or Phe24_va125) yields a51-I casein (Fox,
1989). The rate of breakdown of B-casein is reduced more than a51-casein due to
an increase in salt concentration. This aspect has been described earlier in Chapter
2.6.7.
Starter enzymes are capable of degrading protein to small peptides and free amino
acids (Noomen, 1983). Both a51- and B-caseins are broken down by starter
enzymes. However, a51-casein is hydrolysed by the starter enzymes at a much
slower rate than by chymosin. Free amino acids are generally not formed as a
result of rennet action on caseins.
Visser ( 1977b) reported that rennet appeared to be responsible for the greater part
of the soluble nitrogen production in Gouda cheese, with the starter bacteria and
milk protease also making contributions though to a lesser extent. Milk protease
on its own liberates amino acids and low molecular weight peptides but only in
small amounts. The action of rennet clearly stimulates the formation of low
molecular weight peptides and amino acids by the progressive degradation of the
higher molecular weight products (of rennet action) by starter peptidases.
In Gouda-type cheeses the degradation of as1-casein is nearly complete in about a
month's ripening; B-casein is more resistant, with about 50% of it still being intact
after 6 months of ripening (Visser & Groot-Mostert, 1977). Rennet plays the major
role in degrading a51-casein and decomposing B-casein in the first month of
ripening and the enzymes of the starter bacteria contribute to further degrading

44
!3-casein. Milk protease appeared to be responsible for the formation of the
minor caseins from B-casein during the ripening of Gouda cheese.
The consequences of proteolysis in cheese include changes in cheese texture and
the development of flavour. The texture of cheese is determined primarily by its
pH and the ratio of casein to moisture (Lawrence et al., 1987). The texture
generally changes markedly in the first 1 to 2 weeks of ripening as rennet
hydrolyses some of the a5ccasein to the peptide a51-I-casein, causing a general
weakening of the network (Jong, 1976). The relatively slow change in texture
thereafter is determined mainly by the rate of proteolysis, which in turn is
controlled largely by the proportion of residual rennet and plasmin in the cheese,
salt-in-moisture concentration and storage temperature (Lawrence et al., 1987).
Cheese texture may be significantly changed by the use of coagulants other than
calf rennet, addition of neutral proteases, and incorporation of whey protein.
2.8.5 Water activity (Aw) of cheese
The water activity of cheese is affected by the amount of free water and the soluble
material present in cheese. In soft cheeses Aw is determined almost solely by the
NaCl concentration in the aqueous phase in the cheese (Marcos & Esteban, 1982).
The additional lowering of Aw in ripened cheeses below that corresponding to N a Cl
molality must be caused to a great extent by the aqueous concentration of other
solutes such as low molecular weight non-protein nitrogen compounds released by
proteolysis (Marcos et al., 1981). Aw generally decreases with decreasing moisture
in cheese. The Aw of soft cheeses with a moisture content > 40% can be predicted
from the NaCl molality (M) in the total water of the product by the equation
Aw = 1 - 0.033 M (Marcos et al., 1981).
The Aw of fresh curd is around 0.99 and is reduced by the addition of salt. During
ripening of cheese there is a gradual fall in Aw due to evaporation, increased
amounts low molecular compounds (peptides, amino acids, lactic acid etc.) resulting
from proteolysis and possibly release of some bound salt (Kinsella & Fox, 1987).
The amount of free water in cheese and the manner in which it is affected by the
low molecular weight solutes, and the pH increase during ripening may influence
the rate and extent of proteolysis (Ruegg & Blanc, 1977; Lawrence et al., 1987).
45
2.8.6 Water-binding properties of proteins
The water sorption by milk proteins has been reviewed in detail by Kinsella & Fox
(1987). The water associated with proteins has been categorised in terms of
progressively increasing water activities, such as structural, monolayer, hydrophobic
hydration, multilayer, unfreezable, capillary and hydrodynamic hydration water.
Capillary water is defined as that water held physically in clefts, voids, or cavities
by surface and capillary forces in the protein molecule at � 0.5 - 0.95, e.g. water
entrapped in gels. It is similar to bulk water in physical properties, and is available
as a solvent and for chemical reactions. At high � > 0.9, the amount of water
bound ranges from 30 to 60 g water per 100 g protein.
Several types of interactions between water and food solids may occur at the
molecular level. These include coulombic interactions between charged groups and
bound ions, hydrogen bonding with polar groups, London-van der Waals forces,
steric effects, solution effects, capillary condensation, plasticising of molecular
structure and multiple effects between various components (Berg & Bruin, 1981) .
Water-protein interactions are affected by water content, amino acid composition,
surface polarity or charge, conformation and topography of the protein, pH, ion
species and temperature (Kinsella & Fox, 1987). Ionised amino acids bind 2 to 3
times more water than non-ionised groups.
Interaction of NaCl with paracasein was detected in the � range of 0.76 - 0.95
(Hardy & Steinberg, 1984). The amount of interacting salt increased with added
salt, decreasing � and moisture content. The binding of salt to the protein may
have reduced the net water sorption capacity of the protein by displacing water,
inducing some conformational changes, limited solubilisation or more likely by
reducing the effective concentration of salt per se thereby reducing the amount of
water bound by salt (Kinsella & Fox, 1987).
Water vapour sorption by whole casein and micellar casein was measured in the
water activity range of 0.2 to 0.98 (Ruegg & Blanc, 1976). At high water activities,
whole casein revealed minimum hydration near its isoelectric point (approximately
pH 4.6). Water sorption by micellar casein increased on either side of a pH close

46
to that of original milk serum. It is suggested that acidification during lactic acid
fermentation decreases the water activity in milk products significantly.
Pure casein or paracasein presumably binds (by chemi-sorption and ice-structuring)
about 0.55 g water/g protein (Geurts et al., 1974a). In milk products the bound
water is much less. In cheese, it is 0.10 to 0.15 gjg, which is hardly affected by pH
and salt content. In milk, the amount of bound water may be slightly higher than
cheese, but the bound water is not significantly affected by renneting or
acidification.
During proteolysis in cheese greater water-binding properties are exhibited by the
newly formed amino and carboxyl groups (Fox, 1989). As each peptide is cleaved
during ripening of Cheddar cheese, two new ionic groups are generated and each
will compete for the available water in the system (Creamer & Olson, 1982). Thus
the water previously available for solvation of the protein chains ·will become tied
up with new ionic groups making the cheese harder and less easily deformed.
The following relationship between water-holding ability of the protein gel matrix
in cheese, and exudation, appears probable. The water-holding ability of the gel
matrix is influenced by the composition of cheese and other forces described earlier
in this section. For a given set of conditions and composition of cheese, the gel
matrix will have the ability to hold a certain maximum amount of water. When the
moisture present in cheese is lower than the water-holding ability of the gel matrix,
as may be the case in hard varieties of cheese, exudation is unlikely, even when the
matrix is affected by changes that occur during storage. On the other extreme,
when the available moisture in cheese is in excess of the water-holding ability of
the gel matrix, e.g. Cottage cheese, exudation invariably occurs. However, when the
moisture content in the cheese is at equilibrium with the water-holding ability of
the gel matrix, changes in cheese during storage (such as proteolysis) that affect the
composition and structure of the protein matrix may have a marked influence on
the exudation. When the net effect of such changes during the storage of cheese
results in decreasing the water-holding ability of the gel matrix, it leads to
exudation.

47
CHAPTER 3
SCOPE AND OBJECTIVES OF THE PRESENT INVESTIGATION
The scope of the present investigation was primarily to determine the factors
affecting exudation during storage of cheeses of low pH and high moisture, and to
elucidate the underlying mechanism. The following were the broad objectives:
To study the effect of selected manufacturing variables and processing
conditions on the exudation of whey from Cream and Feta cheese.
To correlate the biochemical changes during storage of Cream and Feta
cheese with exudation.
To gain knowledge on aspects related to recombined milk cheese.
To investigate the role of some milk components on the exudation of whey
from Cream and Feta cheese.
To determine the effect of incorporation of heat-denatured whey proteins
on the yield and exudation of whey from Feta cheese.
To examine the effect of the type of material adsorbed to the fat globule
surface on exudation of whey from Feta cheese.

48
CHAPTER 4
ANALYfiCAL METHODS AND SENSORY EVALUATION
4.1 Introduction: Standard chemical methods of analyses of milk, cream, whey,
exudate, curd and cheese have been summarised in Appendix 4. 1 . Specific methods
used in this study, and modifications of the standard procedures, are described in
the first section of this Chapter. Procedures for sensory evaluation of Cream and
Feta cheese are described in the second section of this Chapter.
4.2 Specific methods
4.2.1 Sample preparation
SECTION ONE
Cream cheese: An entire cup of Cream cheese stored at 5 ° C was mixed and a
sample was drawn.
Feta cheese: A whole block (500-600 g) of Feta cheese was grated and a sample of
the grated mixture was drawn. When required, grated Feta samples were packed
tightly into sample bottles (so that very little air space was left) and frozen at
- 20 ° C for analysis at a later date. The frozen samples were thawed at 4 o C for
24 h before analysing the sample.
Exudate from Feta: The exudate that was released from Feta and accumulated in
the plastic pouch was centrifuged at 3,000 rpm for 5 min, filtered through Whatman
filter paper (No 41) and used for analysis.
4.2.2 Measurement of amount of exudate
(a) Exudate from Cream cheese: A typical example of exudation from Cream
cheese is illustrated in Fig. 4 .1 . The following procedure was used to isolate and
measure the amount of exudate from Cream cheese.
(i) Individual cups and lids to be filled with Cream cheese were coded and
their weights recorded separately.
(ii) The cups were filled up to the brim with Cream cheese and the lids
were applied. The cups were then turned upside-down.

Fig. 4.1 A sample of Cream cheese showing exudate on the
surface. The cups with Cream cheese were stored
upside-down. The exudate settled at the bottom. The
cups were inverted prior to measurement of exudation.
4 9

50
(iii) Any air entrapped in the body of the Cream cheese was removed by
gentle tapping of the cups.
( iv) The filled cups were stored in the upside-down position at the specified
temperatures. Storage of the cups in the upside-down position facilitated
easier measurement of the exudate at a later stage, because the exudate
being heavier than the Cream cheese tends to settle at the bottom of the
cup. Storing the cups upside-down also prevented mixing of the condensate
with the exudate.
(v) Prior to measurement of the amount of exudate, the cups were drawn
and stored at 5°C (not applicable to those already stored at 5°C) for an
hour. This was done to provide a firm body to the Cream cheese by the
cooling effect. Firming-up of the Cream cheese helps in the easy separation
of the liquid phase (exudate) from the solid phase.
(vi) The cup was weighed and then reverted back to the normal position.
The lid was taken off and the exudate on the top was poured out by holding
the cup at an angle of about 45°C to the horizontal for a minute. A
Whatman filter paper (No 41) was used to absorb some exudate sticking to
the cup or the lid. The weight of the cup with the lid and the Cream cheese
was taken.
Calculation
Amount of exudate (glkg moisture in cheese) = (Weight of exudate in g X 100 X 1000) I (weight of cheese in g X
moisture percent in Cream cheese)
Amount of exudate (glkg cheese) = (Weight of exudate in g X 1000) I weight of cheese in g
(b) Exudate from Feta cheese: A typical example of exudation from Feta cheese
is illustrated in Fig. 4.2. In a somewhat similar study, Pederson et al. ( 1971)
measured exudation in 60-day-old Blue cheeses by providing temperature-stressed
treatment to the cheeses. In the present study, however, the actual amount of
exudate that leaked during storage of cheese was measured. The following
procedure was used to determine the amount of exudate from Feta cheese.

Fig. 4.2
5 1
Feta cheese samples at various stages after manufacture.
Left to right: A block of Feta cheese after brining; Brined Feta
cheese vacuum packed in plastic pouch (and stored in this state);
Exudate released from Feta cheese in the vacuum packed pouch
during storage (= 6 months); A pack containing Feta cheese is cut
open to measure the amount of exudate.

52
(i) The initial weights of the blocks of Feta cheese were recorded immediately
after brining.
(ii) At the time of measurement of the amount of exudate, one block of Feta
was removed from the plastic pouch and the moisture on its surface was blotted
using paper towels.
(iii) The block of cheese was further rested on an absorbent paper towel for a
minute to ensure removal of all exudate sticking to its external surface of the
cheese and then weighed .
(iv) The difference between the weight of cheese after brining and the weight
of cheese after removal of exudate provided the net weight of the exudate.
Calculation
Exudation has been expressed in terms of g exudate/kg cheese, g exudate/kg
moisture in cheese, final moisture in non-fat substance and % reduction in
moisture in non-fat substance (MNFS). Details of the calculations are provided
in Appendix 4 .2.
4.2.3 Electrophoresis of cheese: Standard analytical methods for poly-acrylamide gel
electrophoresis (PAGE) were used (Appendix 4 . 1 ) .
Sample preparation : The procedure involved in the sample preparations for urea-PAGE
or Sodium dodecyl sulphate (SDS)-PAGE are similar except for the following:
Sample buffers are different as follows.
Urea-PAGE sample buffer: 0 :092 g EDTA, 1 .08 g Tris base, 0 .55 g boric acid,
36.0 g urea, 0 . 75 ml of 2-mercaptoethanol, 1 ml of 0 . 1 % bromophenol blue
solution made up to 100 ml and adjusted to pH 8 .4 with 1 N HCI.
SDS-PAGE sample buffer: 20.0 ml of 1 0 % (w/v) SDS solution , 1 0 ml glycerol,
5 ml of 2-mercaptoethanol , 12 .5 ml '0 .5 M pH 6 .8 ' Tris-HCl buffer , 2 . 5 ml
of 0 .05 % (w/v) bromophenol blue made up to 100 ml with distilled water.
For urea-PAGE usually few drops of a reducing agent, mercaptoethanol or
dithioerythritol (DTE) , are added to the sample extract prior to electrophoresis.
For SDS-PAGE the sample extract is imparted heat treatment at 95 °C for 10
min in the presence of the reducing agent so that the sulphide bonds of the
protein are reduced and complete protein denaturation occurs.
The samples are diluted to an extent such that the concentration of protein is 1 to 2 mg
per ml of the sample extract.
Sample preparation of cheese: Cream or Feta cheese was dissolved in sample buffer
in the proportion of 1 : 50 , held in a water-bath at 40°C for 2 h and then centrifuged at
10 ,000 rpm for 1 0 min. Samples were drawn from the fat-free portion and

53
diluted with the sample buffer in the ratio of 1 : 1 . The dilutions were altered, when
necessary, to achieve the desired concentration.
Sample preparation of exudate: Exudate from Cream cheese was diluted with the
sample buffer to a suitable level and used for electrophoresis. In exudate from Feta
cheese, presence of high concentration of NaCl acted as impurities, interfered with the
mobility of the proteins during electrophoresis and subsequently made it difficult to
identify and quantify the protein bands. This difficulty was overcome by dialysing the
exudate in water to remove the excess NaCl . The extent of dilution of the high
molecular weight proteins/peptides in the exudate sample during the dialysis was
determined from the recorded weights of the contents in the dialysis tubing before and
after dialysis. The dialysed exudate was further diluted with the sample buffer to
obtain 1 -2 mg protein/ml of sample extract. It may be noted that only the soluble and
low molecular weight material in the exudate is lost during dialysis (Chapter 1 0) and,
therefore, the determination of proteins/peptides of relatively high molecular weight by
SDS-PAGE would be unaffected .
4.2.4 Proteins adsorbed to fat globule surface
The objective was to identify and quantify the proteins adsorbed to the surface of fat
globules in cheese. This involved the separation of the fat content from cheese,
extraction of protein adsorbed to the fat globule surface and finally SDS-PAGE of the
fat-free extract. It would be nearly impossible to demarcate the protein adsorbed to
FGM from the rest of the protein in the cheese. Any washing procedure involved is
likely to take away some of the proteins adsorbed to the fat globule surface. Further,
the washing step could also change the proportions of adsorbed protein and result in
new configurations. Accordingly , it was intended to obtain a relative estimate of the
nature of the proteins firmly adsorbed to FGM. Preliminary trials were performed to
determine a suitable washing solution , the number of washings and the quantities of
washing solutions to be used for extracting the fat globules with least possible damage
to the fat globules. The procedure used is described below:
(i) About 5 g cheese was dissolved in 45 g of 0 .2 M sodium citrate solution and
held in a water bath at 55 °C for one hour. The contents in the flask were
swirled at regular intervals.
(ii) The contents were centrifuged at 7,000 rpm for 15 min at 4 oc. Fat layer
on top was scooped out (the contents were filtered at refrigerated temperatures,
if necessary) .
(iii) The fat was dissolved in 35 ml of 0 .2 M sodium citrate and held in the
water bath at 55 °C for another hour.
(iv) The contents were again centrifuged as done earlier, the fat layer on top
was collected and dissolved in 6 ml SDS sample buffer.

54
(v) A few grains of DTE were added, the contents heated at 95 ° C/10 min,
cooled and once again centrifuged.
(vi) The fat-free liquid (filtration was done at refrigerated temperature, if
required) was analysed by SDS-PAGE as described in the standard method.
4.2.5 Whey protein nitrogen index (WPNI): WPNI is a measure of the undenatured
whey proteins. Preliminary trials showed that it was difficult to ascertain the WPNI
of curd and Cream cheese because they did not dissolve fully in the NaCl solution.
Addition of NaOH to the mixture of NaCl and cheese/curd did not solubilise the
cheese/curd. Estimation of WPNI in milk and whey was, however, satisfactory.
The accuracy of the test method to determine WPNI was verified by comparing
with the results of the undenatured whey proteins determined by using SDS-PAGE
as the reference method. The samples used were skim milk powder of known
WPNI, whey from Cream cheese curd cooked at 60 o C and whey from Cream
cheese curd cooked at 75 ° C. The undenatured whey proteins present in the
samples were filtered from the solutions of the samples saturated with NaCl (as
described in the standard method for WPNI in Appendix 4. 1) . In the experimental
method, the filtrates were used to determine the WPNI by the dye-binding method.
In the reference method, the three filtrates were dialysed with water to get rid of
NaCl and then analysed by SDS-PAGE. The ratios of undenatured whey proteins
in the salt extracts of the three samples estimated by experimental and reference
methods were compared and found to be very close (20. 1 : 15.0:7.5 & 20. 1 : 15 . 1 :7.4).
The dye-binding method could be thus effectively used to obtain a quick estimate
of the amounts of the undenatured whey proteins in whey and milk.
Procedure: All the steps were identical to the reference method (outlined in
Appendix 4.1 ) for dried milks except for the use of 23.0 g of milk or whey, or 8.0 g
of Cream cheese or curd with 15.0 g water, instead of taking 3.0 g milk powder and
20.0 g of water.
4.2.6 Hardness of Cream cheese: A penetrometer attached with a cone-shaped
probe/plunger was used to measure the hardness of Cream cheese. Cream cheese

55
was tempered to a temperature at which the hardness was to be estimated. The
cheese was thoroughly mixed and its surface was smoothed flat using a spatula.
The cheese was placed in the penetrometer and the probe was moved to touch the
cheese surface. The probe was allowed to penetrate the Cream cheese for a fixed
time interval. The depth of penetration was used as an indicator of the hardness
of the product. Hardness was expressed in terms of hundredths of a centimetre.
4.2. 7 Curd-fines lost in whey: The standard method of centrifuging whey to obtain
an estimate of the amount of fines could not be used here because of the presence
of too much fat in the product. Association of proteins with fat resulted in some
curd-fines (mixture of protein and fat) floating on the supernatant liquid after
centrifugation. Use of a projection microscope to measure the fines did not
succeed because of too much variation in the sizes of curd fines. A simple method
was therefore developed to isolate the insoluble material in the whey. The method
is based on the assumption that the curd-fines were insoluble and that the total
insoluble dried matter provides an indication of the fines lost in whey.
Procedure: Weighed quantities of whey were filtered through pre-weighed Whatman
filter paper No 41 . Three washings were given to the residue on the filter paper
with distilled water. Following washing, the filter paper along with the residue on
it was carefully transferred into a pre-weighed petri dish, dried in an oven at 105 • C
for 16 h and weighed. The curd-fines were calculated as a percentage of the
quantity of dried residue in the whey (w jw).
4.2.8 Test for emulsion stability of 'manufactured cream' made from fresh frozen
milkfat for recombining and reconstituted skim milk: Presence of free fat and
formation of a cream plug during storage of the manufactured cream and
recombined milk over a certain period of time were the attributes considered in
measuring the emulsion stability.
Procedure: Cream samples were filled in 100 ml graduated cylinders up to the
100 ml-mark and stored at 20 · C. After 18 h any free fat or cream plug were
directly read from the markings on the cylinder and expressed as a
percentage (v jv). Presence of free fat, if any, was also recorded.

56
Further, the cream samples were mixed with reconstituted skim milk (RSM) in the
proportion of 1 :4 so as to have a composition similar to that of cheesemilk. The
recombined milks ( cheesemilks) were filled in 500 m1 beakers and stored at 20 o C.
The extent of free fat and cream layer formed were recorded visually after 18 h.
In context to the present study, cheese milk prepared from mixture of manufactured
cream and RSM was expected to provide more useful information. During cheese
manufacture the milk needs to retain emulsion stability up to whey drainage
c� 4 h). The emulsion stability of manufactured cream was considered satisfactory
if the cheesemilk did not have much phase separation over 18 h.
4.2.9 Gel strength: Formagraph (A/S N. Foss electric, Type 1 1700) was used for
measurement of curd gel strength. The instrument plots time-graphs as a measure
of firmness of the coagulating milk. The measurement is based upon tiny forces
picked up during linear oscillations of pendulums suspended in the coagulating
milk. The time-graph provides an indication of the time at which the gel formation
in the milk starts after the addition of rennet. As the gel firmness increases, the
forces resisting the linear oscillations of the pendulum are recorded on the output
chart as a bell-shaped projection. The increase in the width of the bell-shaped
curve is related to the increase in the firmness of the gel. However, this increase
is considered accurate until 15-20 min after the addition of rennet. Thereafter, the
results become doubtful due to the continuous shattering effect of the oscillations.
Procedure: RSM (10% total solids) was prepared by dissolving low heat skim milk
powder with water at 40 ° C. 0. 1% HCI was added to RSM to lower the pH of milk
to a level similar to the pH of milk ( � 6.5) at the time of rennet addition during
cheese manufacture. Calculated quantities of emulsifying agents and diluted calf
rennet were added in proportions similar to that added at cheese manufacture.
The samples were analysed in the Formagraph at 32 ° C up to 50 min.
4.2.10 Differential Scanning Calorimetry: The method is based on the principle of
measurement of the energy changes in a sample on heating (or cooling). The
measured heat flow rate is proportional to the instantaneous specific heat of the
sample. When phase change, or transitions involving an energy change, occur

57
during the temperature scan, the contribution to the heat flow is also measured.
A computer controlled differential scanning calorimeter (Perkin-Elmer, DSC - 2C,
Norwalk, Connecticut, USA) with a refrigerated block that allows a temperature
range of - 60 o C to 700 ° C was used.
Procedure: An empty sealed container was placed in the reference pan. Accurately
weighed samples of Feta cheese or exudate (� 10 mg) were packed in hermetically
sealed standard volatile sample pans, placed in a slot adjacent to the reference pan
in the calorimeter, allowed to equilibrate at 295 K and then cooled to 215 K at the
rate of 10 K/min. The sample was held at 215 K for 3 min and then heated at the
rate of 5 K/min. The energy transfer (Joules/g) during cooling and heating the
sample between 220 and 285 K was measured and plotted in a thermogram. At
around the melting or freezing point of the sample there is an onset of a peak in
the thermogram. The peak represents the phase conversion of the water in the
sample (refer to Chapter 6 for details) . The melting point was estimated by
extrapolating the onset of the peak from the DSC thermograms. The melting and
freezing points are only approximate estimates because of lack of a linear portion
in the peak for extrapolation. The lack of linearity may be attributed to the
experimental samples being complex mixtures.
4.2.11 Microbiological tests: Cheesemilk and cheese after brining were tested for
the presence of coliforms. Total counts and lactobacilli counts in cheese at various
stages of storage were determined as described in NZDDM (1984).
SECTION TWO
4.3 Sensory evaluation
4.3.1 Introduction: The objective of the sensory evaluation was to ensure that the
cheeses made with the wide range of manufacturing variations were generally of
acceptable quality.
4.3.2 Feta cheese: Feta cheese was assessed for flavour and textural characteristics
eight weeks after manufacture. The cheese was evaluated by a minimum of seven

58
judges from a trained and experienced panel of nine. The evaluation was carried out
at the NZDRI cheese grading room at 20°C. Prior to evaluation the cheeses were
tempered to 20°C . The blocks of cheese were removed from the vacuum sealed plastic
pouches and blotted with a paper towel to remove the moisture sticking to its surface.
Exudate present in the plastic pouches was discarded .
Sample presentation was random and the origins of the samples were not revealed to
the panel. The panellists were informed that no efforts had been made to reduce the
yellow colour of the cheese, nor to reproduce the characteristic rancid flavour in Feta
cheese, as lipase was never used. The panellists were advised not to downgrade the
cheese on these accounts.
The cheeses were evaluated for flavour attributes of acidity, saltiness, oxidised and
bitterness ; and for textural characteristics of mouthfeel and structure. The evaluation
was done on a freshly-cut (sliced-off) cheese. The flavour was evaluated by smell and
tasting . The body was assessed by rubbing a portion of the sample between the
forefinger and the thumb, by mouthfeel , and by slicing a layer of the cheese with a
knife. The evaluation was based on a five point scale ( 1 - 5) . Close distinctions
between samples were recorded by using decimal points in the specified scale. Based
on analysis of variance the data were statistically analysed using the SAS package
( 1985) in a micro-vax computer. The questionnaire used is presented in Appendix 4 .3 .
4.3.3 Cream cheese: Sensory evaluation of Cream cheese was identical to that of Feta
cheese except for the following changes:
Usually the cheese was evaluated 2 weeks after manufacture. Prior to
evaluation , the cheese stored at s o c was tempered to 20° C in about 2 h . The
cheese was presented in the cup it was stored for evaluation .
One of the ways of differentiating the smoothness, spreading properties and the
presence of coarse particles in the cheese was by spreading a portion of cheese
with a knife or spatula as a thin layer on a paper.
The questionnaire used is presented in Appendix 4.4 .

59
CHAPTER 5
EXUDATION OF WHEY FROM CREAM CHEESE DURING STORAGE
5.1 Introduction
Cream cheese (hot-packed) was chosen to study the exudation of whey because:
- it is an unripened cheese,
- use of rennet is not required,
- it is less complicated in comparison to other cheeses,
- exudation is commonly encountered, and
- it was expected to provide results in a short time ( 10-15 weeks).
Exudation of whey from Cream cheese during storage is a common defect (Modler
et al., 1985). A process modification to prevent this defect in Cream cheese has
been described (Carswell and Hurlburt, 1970). There are some passing remarks
in published reports on ways of reducing the extent of exudation (Dahlberg, 1927;
Modler et al., 1985). No scientific study has been undertaken to determine the
causes, and the extent to which the manufacturing variables influence exudation.
Therefore, the objective of this study was to investigate the effects of manufacturing
variables on the exudation of whey from Cream cheese and to establish practical
procedures to reduce the extent of exudation. Composition and quality aspects of
Cream cheese were also studied. The hot-pack method for making Cream cheese
was chosen because it provides a long shelf-life and is a widely used commercial
process.
This Chapter is divided into two sections. The first section describes the effect of
process variables on exudation from cheeses with constant moisture. The second
section describes the effect of process variables on cheeses with constant moisture
in non-fat substance (MNFS), the chemical changes occurring in cheese during
storage, and the possible mechanism of exudation.

SECTION ONE
5.2 EFFECT OF SELECTED MANUFACTURING VARIABLES ON
EXUDATION FROM CHEESES OF CONSTANT MOISTURE
60
5.2. 1 Introduction: Variation in manufacturing conditions during manufacture of
Cream cheese results in variable drainage of whey from curd (Lundstedt, 1954),
and consequently variable moisture content in the finished cheese. As the bulk of
the exudate is comprised of moisture, it is reasonable to assume that exudation
would be influenced by the moisture content in cheese. Exudation from cheeses
made with variations in the manufacturing conditions would thus be influenced by
not only the manufacturing variables, but also the resultant variation in moisture
contents. However, the objective of the present investigation was to clearly identify
the effect of the manufacturing variables. This was achieved by adjusting the
product to a constant moisture during heat-processing of curd.
A constant moisture of 54% was targeted to comply with the US federal standards
which prescribe a maximum of 55% moisture in the finished product. Lower
moisture in cheese reduces yield and is commercially unacceptable.
5.2.2 Experimental approach: A large number of manufacturing variables could
have been chosen for the study but it would have made the experiment excessively
complex and time-consuming. The variables chosen for study had to be readily
controlled by the cheesemaker. In choosing the high and low levels of the variables
two aspects were considered. Firstly, they should permit exudation from Cream
cheese during storage. Secondly, they should not significantly alter the quality and
properties of the cheese.
Based on findings from trials of a very preliminary nature, a set of manufacturing
variables and their respective levels were chosen.
The findings of this experiment are interpreted in terms of composition, quality and
cheese exudation.

6 1
5 .2 .3 Experimental plan: Manufacturing variables and the levels of variation chosen
for study are listed in Table 5 . 1 .
Table 5 . 1 Selected manufacturing variables respect ive levels of variation for effects on exudation of whey from dur ing s torage
and the ir studying the Cream cheese
Treatments
Protein to fat ratio in milk
Homogenisation pressure (ps i ) 1 ( two stage ) ( s ingle stage )
Levels
0 . 3 0 0 . 2 2
2 , 0 0 0 / 5 0 0 6 0 0
Reference in text
A High Low
B High Low
Pasteur isation temperature ( ° C ) 2 c High Low
Curd pH at cooking
Cooking temperature ( ° C )
Storage temperature ( ° C )
Storage t ime (weeks ) at 5 ° C at 2 0 ° C at 3 0 ° C
1 1 p s i = 6 . 8 9 kPa
8 2 . 0 7 2 . 0
4 . 9 5 - 5 . 0 4 . 6 5 - 4 . 7
7 5 . 0 6 0 . 0
5 . 0 2 0 . 0 3 0 . 0
D High Low
E High Low
G Refrigerated Ambient Elevated
s 2 , 4 , 6 , 8 , 12 , 1 6 2 , 3 , 4 , 6 , 9 1 , 2 , 3 , 4 , 6
2 The terms ' low ' and ' high ' have been used for describing
the levels of pasteuri sation temperature for convenience
only . ' Low pasteurisation temperature ' refers to the minimum
prescr ibed heat treatment for pasteuri sation and the ' high
pasteurisat ion temperature ' refers to a heat treatment higher
than the minimum prescr ibed l imit .

62
Basis of selection of the levels of manufacturing variables
The chosen protein to fat (P /F) ratios for standardised milk were based on
preliminary studies. The fat content of standardised milks with P /F ratios of 0.22
and 0.30 ranged from 9.0 to 12.0 % fat. A fat percentage of 10.5% is required in
milk for making Cream cheese with about 33% milkfat.
Homogenisation of milk is usually done in two stages: the first at high pressure,
typically 2,000 psi (13,780 kPa); and the second at low pressure, typically 500 psi
(3,445 kPa). The higher level of homogenisation pressure was arbitrarily chosen
as that of normal two-stage homogenisation (2000/500 psi). Single stage
homogenisation at 600 psi was chosen as the lower level of homogenisation
pressure because any further lowering was likely to result in a substantial amount
of fat rising to the top during the incubation period. Preliminary studies showed
that this would lead to high fat losses in the whey and a less smooth product.
The minimum prescribed legal requirement for pasteurisation (72 o C/15 s) was
chosen as the lower level. The higher pasteurisation temperature (82 o C) was
limited by the temperature that could be attained with the equipment available.
The lower level of curd pH at cooking ( 4.7) was chosen from a consideration of
practical handling. At pH ::; 4.6 the curd particles were too fine and clogged the
pores in the sieves. The upper limit of curd pH at cooking was chosen as 5.0
because a pH higher than this was likely to lead to less acid development in curd
and incomplete flavour in the final product.
The cooking temperatures ( 60 ° C, 75 o C) were chosen with a view to keep the
process close to the commercial method of manufacture which commonly involves
centrifugal separation of curd and whey at temperatures approximating 75 o C.
The three storage temperatures (5 o C, 20 ° C, & 30 ° C) were selected with the
objective of gaining information about: refrigerated temperature (5 o C) at which the
product would normally be stored, ambient temperature (20 o C) at which the
product would be expected to be handled by the consumers, and elevated

63
temperature of storage (30 · C) that might provide a quick indication of the trends
in exudation.
Statistical design of the experiment: A split-plot 24 factorial experiment was
performed. The combinations of high and low levels of four manufacturing
variables with which each trial was carried out were: P /F ratio, homogenisation
pressure, pasteurisation temperature and curd pH at cooking. Each trial was split
at the following three stages for study of the effect of other variables: cooking
temperature of curd, storage temperature of Cream cheese and storage time of
Cream cheese. A total of 16 trials were conducted. The experiment was
performed in two blocks of eight trials each, where the blocked effect was the time
and the defining contrast was I = ABCD (see Table 5 .1 for nomenclature). Trials
in each block were randomised.
The results were analysed by tests for analysis of variance using the statistical
computer package SAS ( 1985). However, for analyses on exudation data, this
statistical method was not appropriate and the Chi-squared test was used. The
details of statistical analyses are described in Chapter 5.2.7.(c) and Appendix 5.5.
SAS was used for calculating the least square mean (LSM) values of the variables.
5.2.4 Experimental: Preliminary trials were carried out to establish the general
manufacturing procedure, analytical methods, sampling frequency, and the method
of measurement of the amount of exudate.
Manufacturing process: The method of manufacture was similar to the
commercial 'long-set' and 'hot-pack' Cream cheese. The major deviation from the
commercially practised method of manufacture of Cream cheese (Honer, 1988;
Kosikowski, 1977) was that the product was not homogenised after heat processing.
This was because the product showed a satisfactory consistency even without
homogenisation and in some batches the product did not pass through the
homogeniser because of high viscosity. The other deviation was the use of
potassium sorbate in the processing mix. This was done to prevent mould growth
in cheese during storage. Preliminary trials had shown that in some samples,

64
particularly those stored at high temperatures, moulds grew and the exudate
became slimy. The slimy state of the exudate interfered with the accurate
measurement of the quantity of exudate.
The cheese was manufactured in the pilot-plant (Dairy Product Development
Centre) of New Zealand Dairy Research Institute (NZDRI). Brief descriptions of
the equipment and accessories used in milk processing and cheese manufacture
have been provided in Appendix 5 .1 . A flow diagram of the manufacturing process
of Cream cheese is outlined in Fig. 5 .1 . Some of the manufacturing steps have
been shown pictorially in Fig. 5.2. The manufacturing process for Cream cheese
is described in Appendix 5.2.
Moisture adjustment of curd: Preliminary trials showed that, due to evaporation
during heat-processing of curd, Cream cheese mixes calculated to have a moisture
content of 55% produced finished product with about 54% moisture. Adjustment
of the moisture content to the target value was achieved by either adding water,
when the curd had less than required moisture, or by heat-processing curd with the
lid open for varying periods, up to a maximum of 10 min, to allow evaporation
when the curd had more than the required moisture content. An example of the
calculation for the amount of water required to be added or removed for
adjustment of moisture in cheese has been provided in the Appendix 5.3.
5 .2.5 Analytical methods; Raw whole milk, cream and standardised milk were
analysed for fat, protein and total solids by the Milko-Scan . Curd was analysed for
pH, fat (Babcock) and moisture (microwave analyser) . Cream cheese was tested
for pH, fat (Babcock), moisture and salt (potentiometric method). Details of all
methods are reported in Chapter 4 and Appendix 4 .1 .
5 .2.6 Sensory evaluation: The product was evaluated by a panel after two weeks
of storage for body (firmness) and textural (softness and smoothness) characteristics
using a 5-point scale. Details of the evaluation procedure are provided in
Chapter 4.

Clarification and separation, 55 ° C
Pasteurisation (72 ° C/15 s)
Standardisation of milk (P /F ratio adjusted)
Homogenisation, 60 ° C
Pasteurisation j Heat treatment
Inoculation: Lactococcus lactis subsp. cremoris strains, 0. 1 - 0.2%
Incubation, 22 o C, 15 - 16 hours
Cooking of curd, 1 o C/min, 60 - 75 o C
Heat-processing, 80 ° C/10 min, 100 rpm
Packaging of Cream cheese
Fig 5.1 Manufacturing process of Cream cheese
65

Fig. 5.2
66
Selected stages in manufacture of Cream cheese.
Top row (left):
Bottom row (left):
Top row (right) :
Bottom row (right):
Cheese vat used for incubation of
standardised milk and cooking;
Sieves used for overnight draining of
curd;
Kettle used for heat-processing of
Cream cheese;
Following heat-processing the Cream
cheese was packed in cups, inverted and
stored at the specified temperature.

5.2.7 Results and discussion
For the sake of convenience, the results are described in 3 parts:
(a) Composition of milk, curd and cheese.
(b) Manufacturing aspects and cheese quality.
(c) Effect of manufacturing variables on exudation.
(a) Composition of milk, curd and cheese
67
Composition of milk: The desired variations in the P /F ratio of milk were achieved
(Table 5.2). Other details of composition of standardised milk are provided in
Appendix 5.4.
Table 5 . 2 P/F ratio of standardised milk
Source o f variation & the l eve l s
P/F ratio
LSM F
Prote in/Fat ratio 5 2 2 . 0 * * * High 0 . 3 0 2 Low 0 . 2 18
Homogenisation pressure High 0 . 2 6 3 Low 0 . 2 5 7
Pasteurisation temperature High 0 . 2 5 8 Low 0 . 2 6 2
Curd pH at cooking High 0 . 2 6 2 Low 0 . 2 5 8
Cooking temperature H igh 0 . 2 6 0 Low 0 . 2 6 0
S tandard deviation 0 . 0 0 7
LSM = Least square mean ; F = F rat i o ;
2 . 8 7
1 . 18
0 . 9 0
0 . 0 0
* * * p < 0 . 0 0 1 ; F values without any asterisks denote 'not significant'.

68
Composition of curd (Table 5.3) : The composition of the curd was affected by the
manufacturing variables. The variation in the composition may be attributed
primarily to the effects of the manufacturing variables on the syneresis of whey and
draining of curd. In general, increased amounts of moisture were retained in curd
made with lower P /F ratio, higher homogenisation pressure, higher pasteurisation
temperature and lower curd pH at cooking. These results are consistent with the
findings that the drainage of whey from curd is slowed by high pasteurisation
temperature, high homogenisation pressure and high acidity (Lundstedt, 1954 ) .
Variation of curd pH was achieved as planned. The data on curd pH at cooking
and cheese pH are pooled together in Table 5.5.
Table 5 . 3 E f fect of manufacturing variables on the compos ition of curd
Varia- Fat ( % ) Moisture ( % ) MNFS ( % ) FDM ( % ) bles ---------- ---------- ------ ---- ------ - ---- -
A High Low
B High Low
c High Low
D High Low
E High Low
LSM F LSM F LSM F LSM F
1 0 . 4 9 * 0 . 0 1 6 6 . 5 * * * 5 3 . 9 * * * 3 3 . 53 5 4 . 7 5 3 5 . 4 4 54 . 6 5
3 3 . 6 * * 3 2 . 7 8 5 6 . 7 4 3 6 . 19 5 2 . 7 1
18 . 5 * * 3 3 . 2 2 5 6 . 2 0 3 5 . 7 5 5 3 . 19
1 7 . 6 * * 3 5 . 7 2 5 2 . 9 5 3 3 . 2 5 5 6 . 3 0
3 0 . 0 * *
1 6 . 8 * *
2 2 . 9 * *
0 . 1 1 6 . 8 7 *
8 2 . 3 8 7 4 . 1 2 8 4 . 57 7 8 . 17
4 6 . 9 * * 8 4 . 4 0 7 5 . 8 4 8 2 . 5 5 7 6 . 4 5
3 0 . 5 * * 8 4 . 2 0 7 5 . 8 9 8 2 . 7 3 7 6 . 4 0
3 9 . 1* * 8 2 . 3 7 7 5 . 9 2 8 4 . 3 2 7 6 . 10
3 4 . 4 4 3 4 . 5 3
54 . 5 1 8 3 . 1 4 6 . 4 4 *
7 5 . 7 3 7 6 . 5 6 5 4 . 9 1 8 3 . 8 1
1 . 2 3
0 . 8 7
0 . 0 4
5 . 5 8 *
A = P /F ratio; B = Homogenisation pressure; C = Pasteurisation temperature; D = Curd pH at cooking; E = Cooking temperature; LSM = Least-square mean; F = F ratio; * p < 0.05; * * p < 0.01 ; * * * p < 0.001; F values without asterisks denote 'not significant'.
Composition of Cream cheese: The objective of attaining moisture of about 54% in all Cream cheeses was mostly achieved (Table 5.4) . The average moisture
content of the individual trials was 53.9% with a standard deviation of 1.3 1.

69
Tab l e 5 . 4 Compos ition o f Cream cheese with relation to the manufacturing variables
Variables
A High Low
B High Low
c High Low
D High Low
E High Low
Fat ( % ) Moisture ( % ) Salt ( % ) pH
LSM F LSM
14 . 8 3 * 3 3 . 0 6 5 3 . 8 7 3 4 . 6 6 54 . 2 3
2 . 5 1 3 3 . 5 3 5 4 . 2 1 3 4 . 19 5 3 . 8 9
4 . 1 6 3 3 . 4 4 54 . 58 3 4 . 2 8 5 3 . 5 3
0 . 2 8 3 3 . 9 7 5 3 . 7 6 3 3 . 7 5 5 4 . 3 4
0 . 14 3 3 . 8 1 5 3 . 9 8 3 3 . 9 1 5 4 . 12
F LSM F LSM F
0 . 7 8 0 . 15 0 . 2 2 1 . 13 4 . 9 6 1 . 13 4 . 9 4
0 . 59 2 . 0 5 0 . 2 5 1 . 14 4 . 9 6 1 . 12 4 . 9 4
6 . 7 6 * 2 . 9 7 0 . 7 7 1 . 14 4 . 9 3 1 . 12 4 . 9 7
2 . 0 8 8 . 8 4 * 52 . 5*** 1 . 12 5 . 1 1 1 . 15 4 . 8 0
1 . 0 6 4 . 4 0 . 9 1 . 12 4 . 9 5 1 . 14 4 . 9 6
Variables & level s
MNFS ( % ) FDM ( % ) S/M ( % )
A High Low
B High Low
c High Low
D High Low
E High Low
LSM
8 0 . 4 9 8 2 . 9 9
8 1 . 57 8 1 . 9 2
8 2 . 0 1 8 1 . 4 7
8 1 . 4 5 8 2 . 0 3
8 1 . 58 8 1 . 9 0
F LSM
3 4 . 6 7 * * 7 1 . 7 0 7 5 . 7 2
0 . 68
1 . 6 2
1 . 8 8
2 . 4 5
7 3 . 2 6 7 4 . 1 6
7 3 . 6 3 7 3 . 7 8
7 3 . 4 7 7 3 . 9 4
7 3 . 5 0 7 3 . 9 2
F LSM
4 3 . 7 0 * * 2 . 10 2 . 0 8
2 . 2 1
0 . 0 7
0 . 5 9
1 . 08
2 . 10 2 . 0 9
2 . 10 2 . 1 0
2 . 0 8 2 . 1 1
2 . 08 2 . 1 0
F
0 . 3 8
0 . 2 1
0 . 0 5
1 . 0 2
2 . 0
A = P/F ratio ; B = Homogenisation pressure ; c = Pasteurisation temperature ; D = Curd pH at cooking ; E = Cooking temperature ; LSM = Least-square mean ; F = F ratio ; * p < 0 . 0 5 ; * * p < 0 . 0 1 ; * * * p < 0 . 0 0 1 ; F values without asterisks denote ' not s igni ficant ' .

70
Constant moisture was attained in all cheeses except for slight difference between
two levels of 'pasteurisation temperature' treatment. Significant variations i n FDM
and MNFS for the two levels of P /F ratio were due to the imposed variations in
the standardised milk.
Table 5.5 shows the pH of curd and Cream cheese ( 1 d and 16 wk old). Variation
in pH of Cream cheeses is correlated to the variation of 'curd pH at cooking'. The
pH of Cream cheese was about 0.1 units higher than the pH at which curd was
cooked. This difference in pH is consistent with the earlier findings (Lundstedt,
1954). Cream cheese stored at 5 o C did not show a change in pH during storage.
Table 5 . 5 E f fect o f manufacturing variables on the pH o f curd and Cream cheese ( 1 day and 1 6 weeks o l d )
Source o f variation p H o f curd pH of Cream cheese at 5 o c & the l eve l s ---------- ------------------ - - - ----
1 day 1 6 weeks
LSM F LSM F LSM F
Protein/Fat ratio High
2 5 . 8 * * 0 . 2 2 2 . 9 2
Low
Homogenisat ion High Low
Pasteur isation High Low
4 . 9 8 4 . 9 6 4 . 9 8 4 . 9 0 4 . 9 4 4 . 9 4
pressure 1 . 3 5 0 . 2 5 4 . 9 5 4 . 9 6 4 . 9 7 4 . 9 3 4 . 9 4 4 . 9 5
temperature 0 . 8 4 0 . 7 7 4 . 9 4 4 . 9 3 4 . 9 5 4 . 9 5 4 . 9 7 4 . 9 7
0 . 7 9
1 . 0 5
Curd pH at cooking High
7 9 1 * * * 5 . 1 6
5 2 . 4 9 * * * 1 3 5 . 3 * * * 5 . 1 1 5 . 1 1
Low 4 . 7 2 4 . 8 0 4 . 8 1
Cooking temperature 1 . 6 8 0 . 9 High 4 . 9 4 4 . 9 5 Low 4 • 9 5 4 . 9 6
Storage t ime (weeks ) 2 6
1 2 1 6
4 . 9 7 4 . 9 6
4 . 9 5 4 . 9 5 4 . 9 7 4 . 9 7
A = P /F ratio; B = Homogenisation pressure; C =Pasteurisation temperature; D = Curd pH at cooking; E = Cooking temperature; LSM = Least-square mean; F = F ratio; ** p < 0.01; *** p < 0.001; F values without asterisks denote 'not significant'.
1 . 9 5
0 . 3 6

71
(b) Manufacturing aspects and cheese quality
Cheese manufacture: Cheeses made with the following combinations resulted in
a fluid-like, atypical and unsatisfactory product.
1 . High P /F ratio + low homogenisation pressure + low pasteurisation
temperature + low pH at cooking + low cooking temperature.
2. High P /F ratio + high homogenisation pressure + low pasteurisation
temperature + low pH at cooking + low cooking temperature.
The above products were unsatisfactory because of the separation of aqueous phase
from the fat phase. Cream cheese with the first combination had the phase
separation at all storage temperatures, while Cream cheese with the second
combination did so at storage temperatures of 20 ° C and 30 ° C. It was difficult to
estimate the amount of exudate in these products as the fat phase separated from
the aqueous phase. The statistical analyses had to be carried out with values for
these combinations missing.
In general, cheeses made with the higher pasteurisation temperature or higher
cooking temperature were more viscous. The viscous nature of the product was
indicated by its flow characteristics after heat-processing of curd. The curd made
from milk homogenised at higher pressure or pasteurised at higher temperature
was difficult to drain. When the curd was cooked to the higher temperature, it had
a thinner consistency and more curd-fines appeared to be lost in whey. Cream
cheeses made with the higher cooking temperature always had a thicker
consistency.
It was not always possible to adjust the moisture in the final product to below 55%,
as planned, particularly when very high moisture was retained in the curd.
Sensory evaluation: Except for the cheeses with an atypical fluid consistency, all
were graded 'acceptable' by the panel (Table 5.6). Cheeses of lower pH were rated
less smooth, which may be attributed to the fact that low pH cheeses tend to have
a 'short' body and are crumbly. The higher cooking temperature produced a firmer
cheese which is in accord with the earlier observation of a thick and viscous
product during cheese manufacture.

72
Table 5 . 6 E ffect o f manufacturing variables on the mean scores of sensory parameters of cheeses
S ource o f variation & the level s
Body Texture
LSM F LSM F - - - - - - - - - - - - - - - - - - - - - - - - - - - - - - - - - - - - - - - - - - - - - - - - - - - - - - - -
Protein to fat ratio 0 . 5 0 0 . 3 1 High 2 . 3 6 3 . 2 9 Low 2 . 55 3 . 3 6
Homogeni sation pressure 0 . 9 3 4 . 2 9 High 2 . 5 8 3 . 4 4 Low 2 . 3 3 3 . 2 0
Pasteurisation temperature 5 . 4 1 1 . 2 7 High 2 . 7 7 3 . 3 9 Low 2 . 14 3 . 2 6
Curd pH at cooking 6 . 2 7 4 0 . 2 4 * * High 2 . 12 2 . 9 5 Low 2 . 7 9 3 . 69
Cooking temperature 14 . 9 9 * * 0 . 0 1 High 2 . 7 2 3 . 3 4 Low 2 . 19 3 . 3 1
LSM = Least-square mean; F = F ratio; F values without asterisks denote 'not significant'; * * p < 0.01.
(c) Effect of manufacturing variables on exudation
In this Chapter exudation is expressed in terms of g exudate per kg moisture in the
cheese. Tests for correlations were also made for exudation expressed as: a
percentage of the total weight of cheese, percent MNFS of cheese, and percentage
reduction in MNFS. However, in all cases the correlations were similar or of lower
statistical significance.
The least-square mean values (calculated using analysis of variance) of the amount
of exudate for the selected levels of manufacturing variables are reported in
Table 5.7. Frequency distribution (incidences of exudation for the selected ranges)
and Chi-squared values for the manufacturing variables are shown in Table 5 .8.
Interpretation of the effect of manufacturing variables on exudation has been made
using results from both these tables.

73
Tab l e 5 . 7 E ffect o f manufacturing variables on the exudation of whey from Cream cheese during storage ( g exudate per kg moisture in chees e )
S ources o f variation
L . S . M . values o f amount o f exudate
and the l evel s o f variation
Storage temperature o f Cream cheese
s · c
Protein to fat ratio High 5 . 47 Low 4 . 3 9
Homogenisat ion pressure High 1 . 9 8 Low 7 . 8 8
Pasteurisation temperature High 0 . 9 6 Low 8 . 9 0
Curd pH at cooking High Low
Cooking temperature High Low
storage t ime 1 week 2 weeks 3 weeks 4 weeks 6 weeks 8 weeks 9 weeks
12 weeks 1 6 weeks
2 . 04 7 . 8 2
0 . 3 2 9 . 54
n . d . 1 . 16 n . d . 1 . 67 2 . 4 5 4 . 18 n . d . 6 . 0 6
14 . 07
2 o · c
16 . 4 5 19 . 2 3
10 . 01 2 5 . 6 6
7 . 58 2 8 . 09
10 . 14 2 5 . 53
1 . 5 9 3 4 . 08
7 . 9 9 8 . 59
12 . 9 9 13 . 6 0 19 . 3 7 n . d . 3 4 . 65 n . d . n . d .
3 0 • C Combi ned1
2 0 . 2 2 18 . 1 8
11 . 65 2 6 . 7 5
6 . 7 9 3 1 . 62
7 . 10 3 1 . 3 0
1 . 7 0 3 6 . 7 1
n . d . 1 0 . 8 8 19 . 03 2 4 . 2 4 3 3 . 8 6 n . d . n . d . n . d . n . d .
1 6 . 2 8 1 3 . 15
8 . 6 2 2 0 . 82
5 . 4 9 2 3 . 9 5
6 . 2 8 2 3 . 16
1 . 2 8 2 8 . 16
n . d . 7 . 7 2
n . d . 1 4 . 2 7 2 2 . 17 n . d . n . d . n . d . n . d .
1 Includes data on exudation at storage periods ( 2 , 4 , 6 weeks ) common to a l l the three storage temperatures ; L . S . M . = Least S quare Mean ; n . d . = not determined .

Table 5 . 8 Effect of manufacturing variables on the exudation of whey from Cream cheese during storage ( g exudate per kg moisture in cheese ) : based on x2 test of s igni ficance
S ource of variation & l evels
A High Low
B High Low
c High Low
D High Low
E High Low
Storage time
X
8 2 6 8
8 3 6 7
87 63
73 77
9 1 59
stored at 5 • c
y
6 2 2
11 17
8 2 0
2 1 7
5 2 3
z x2 X
10 . 74 ** 8 6 0 6 4 2
10 . 14** 2 55
12 4 7
19 . 3 *** 1 6 0
13 4 2
14 . 2*** 2 4 9
12 53
3 2 . 4 *** 0 7 2
14 3 0
2 . 9 3
stored at 2 o · c Stored at 3 0 " C Combined8
y
5 16
12 9
7 14
15 6
5 16
z x2 X
10 . 2 6** 15 55 22 3 6
4 . 3 3 ** 13 52 24 39
8 . 7 8 * 13 52 2 4 3 9
16 2 1
4 . 69
4 9 . 0***
4 4 4 7
3 6 5 3 4 2 6
0 . 4 3
y
11 24
18 17
16 19
25 10
13 22
z x2 X y
9 . 8 5 * * 14 1 1 0 1 4 2 0 8 2 3 4
1 0 2 4
1 2 2 2
7 . 65 *
5 . 06
10 . 7 6* * 11 2 3
4 5 . 5* * *
105 2 6 8 7 2 2
111 15 8 1 3 3
9 5 3 2 9 7 1 6
2 127 13 32 6 5 3 5
5 . 16
z
2 0 2 8
13 3 5
18 3 0
17 3 1
4 4 4
x2
13 . 7 5**
12 . 10**
14 . 4 ***
9 . 44**
63 . 4 ***
2 . 03
a Includes data on exudation at storage periods ( 2 , 4 & 6 wk) common to three storage temperatures ; A = P/F ratio ; B = Homogenisation pressure ; C = Pasteurisation temperature ; D = pH at cooking ; E = cooking temperature ; x = No of incidences of ' no exudation ' ; y = No of incidences of ' sl ight/moderate ( 1-20 gjkg cheese moisture ) ' exudation ; z = No o f incidences of ' exces s ' exudation ( > 2 0 gjkg cheese moisture ) ; X2 = Chi-square ; * p < 0 . 05 ; ** p < 0 . 0 1 ; * * * p < 0 . 0 0 1 ; x2 values without asterisks denote ' not signi ficant ' . -...l �

75
Statistical method: The data on exudation did not have a normal distribution . Attempts
to induce normality by various mathematical transformations did not succeed.
Therefore, ANOV A could not be used for the test of significance.
Chi-square test was used to determine the significant effect of treatments above the split
i. e. for P/F ratio , homogenisation pressure, pasteurisation temperature, curd pH at
cooking . The limiting factor for the Chi-squared test method is that it is based on a
frequency distribution 1 of observations, i. e . , the number of incidences (or occurrences)
of exudation (none/slight/excess) , rather than the actual amount of exudate. Thus, the
Chi-square test does not adequately take into account the exact increase in the amount
of exudate.
From a customer's viewpoint the findings of Chi-square test are important as it
indicates whether or not there was exudation . However, for gaining an insight into the
mechanism of exudation ANOVA is more useful because it takes into account the
actual data at the two levels and indicates the effect of manufacturing variable. The
details on why ANOV A could not be used for the test of significance, and how Chi
square test has been used to test the significance of variation has been provided with
an example in Appendix 5 . 5 .
Effect of P/F ratio (0.23 & 0.30) on exudation: The cheeses made from milk with
the high P/F ratio showed a lower incidence of exudation than the low P/F ratio at all
storage temperatures (Table 5 . 8) . However, when the high P/F ratio cheeses showed
exudation the amount of exudate was generally greater than the low pH cheeses (Table
5 . 7) . From a practical viewpoint a lower incidence of exudation is preferable even if
the .extent of exudation is greater. This is because the customer readily notices the
presence of exudate. The amount is of secondary importance.
All the cheeses had similar total solids. The increased protein, which has better
water-holding ability than fat in the cheeses made from milk with higher P/F ratio,
1 The criteria used in choosing the ranges for the frequency distribution of exudation (None/Slight/Excess) are outlined in Appendix 5 .5 .

76
may be responsible for the lower incidence of exudation in these cheeses. The
influence of fat on exudation is not clear from these experiments.
Effect of homogenisation pressure (2,000/500 psi & 600 psi) on exudation: Increase
in homogenisation pressure resulted in a decrease in the amount of exudate and
incidence of exudation at all storage temperatures (Table 5.7 & Table 5 .8). The
effect of the increase in homogenisation pressure may be explained by the increase
in fat globule surface area due to decrease in size and the increase in the number
of fat globules. Homogenisation is known to reduce syneresis during cheese
manufacture (Emmons et al., 1980; Starry et al., 1983; Vaikus et al., 1970). The
effect is possibly due to fat mechanically blocking casein-casein interaction
(Lelievre & Creamer, 1978). It is possible that the mechanism involved in reduced
syneresis due to homogenisation may also apply to exudation during storage of
cheese.
Effect of pasteurisation temperature (72 o C & 82 o C) on exudation: With an
increase in pasteurisation temperature, a decrease in the amount of exudate and
incidence of exudation was observed at all storage temperatures (Table 5.7 &
Table 5.8). This was in spite of a slightly higher moisture content in the cheese
made from milk pasteurised at a higher temperature. The effect of higher
temperature may be explained as similar to that of reduced syneresis in yoghurt
from high heat treated milk. Syneresis in yoghurt is eliminated by heating milk to
higher temperatures (95 ° C/10 min) due to binding of J3-Iactoglobulin to K-casein
and prevention of fusion of casein micelles (Brooker, 1987).
This effect of high heat denaturation of whey protein is a widely used practice to
retard syneresis in yoghurt (Tamime & Deeth, 1980; Brooker, 1987; Dannenberg
& Kessler, 1988). A linear increase in denatured whey protein from 10 to 40% of
the total protein has been reported when the pasteurisation temperature of milk
was increased from 72 to 85 ° C (Garrido et al., 1983). Modler et al. ( 1985)
observed better water retention and reduction in the amount of exudate in a
hot-packed Cream cheese spread, and were of the opinion that this might have
been due to the hydrating properties of whey protein.

77
Evidence for the effect of heat-denaturation of whey protein in Cream cheese in
reducing the extent of exudation has been provided in Section Two.
Effect of curd pH at cooking (4.7 & 5.0) on exudation: The amount of exudate
from cheese was higher with the lower curd pH at cooking (Table 5.7). This may
be explained by the fact that the lower pH is closer to the iso-electric point of the
casein protein at which the protein-protein interaction is maximal, the molecules
are compact and hydration is minimal (Kinsella & Fox, 1987). However, the total
incidence of exudation was less for lower curd pH at cooking (Table 5.8) . This
implies that the amount of exudate from cheese cooked at low pH was much
greater in quantity than cheese cooked at a higher pH. This supports the view that
exudation is commonly observed in low pH cheeses (Lawrence, 1989). The reason
for a greater number of high pH cheeses showing exudation than the low pH
cheeses could be due to the effect of interaction with other process variables.
Effect of cooking temperature (60 o C & 75 o C) on exudation: Cooking temperature
had a highly significant effect on exudation at all storage temperatures (Table 5.7
& Table 5.8). Temperature rise during cooking was 1 ° C per min. Thus, cheese
made with a high cooking temperature had an additional heating time of 15 min
to reach 75 o C from 60 ° C. Another 5 - 10 minutes was taken for cooling.
Therefore the net holding time for cheese made at higher cooking temperature was
considerable. This would have denatured a substantial amount of whey protein.
Details of the possible effect of high heat treatment has been described earlier
under the effect of 'pasteurisation temperature'.
Effect of storage time and storage temperature (5 o C, 20 o C & 30 o C) on exudation:
The effect of storage time and temperature on the exudation is shown in Fig. 5.3.
The average amounts of exudate, the frequency distribution of incidences of
exudation at the three storage temperatures, and the X2 value is shown in
Table 5.9. Until the sixth week of storage at 30 o C the increase in amount of
exudate had been proportional to the storage time. A similar pattern, though at
a slightly reduced rate, was observed for cheeses stored at 20 ° C. However, for
cheeses stored at 5 ° C, which is of more practical significance, the increase in the

r---, Q) L �
-r(1) 0 E Q) (!) Q) Q)
...c 0 0)
..::;{. �
0) '-..-/
Q) -r-0
-o � X Q)
'+-0
-r-e �
40 �------------------------------------------
I 30
20 /. /
1 0 :// •
� 0 �������===-�--+-�--�
�--��
�-r--+-��
��--� 0 3 6 9 1 2 1 5 1 8
St o ra g e t i m e ( w e e k s )
F i g 5 . 3 E x u d a t i o n o f w h ey f ro m C re a n1 c h ee s e d u ri n g s t o ra g e 0 Sto re d a t 5°C ( c o n s t a n t m o i s t u re ) ; • S t o re d a t 20°C ( c o n s t a n t m o i s t u re ) ; 6 S t o re d o r 30°C ( c o n st a n t m o i s t u re ) ; A. S t o r e d a t 5°C ( c o n s t a n t M N F S ) .
---..) 00

79
extent of exudation was much slower until about 9 weeks but started to rise
thereafter. The reduced amount of exudate from Cream cheese at the storage
temperature of 5 ° C is similar to ultrafiltered Cast Feta cheese where very little
moisture is lost during storage at 7 ° C compared to 15 ° C (Lawrence, 1989).
Increase in the amount of exudate with increase in storage temperature could be
due to the general decrease in water sorption of milk proteins with increasing
temperatures (Kinsella & Fox, 1987). Walstra et al. (1985) cited shrinkage of
casein particles with rise in temperature as the likely cause for increased syneresis
in acid coagulated gels of milk products.
It is hard to predict the pattern of exudation after 16 weeks, particularly for those
cheese which have shown exudation. Presumably further exudation would be
impeded by the decrease in the amount of potential exudate remaining in the
cheese. However, within the selected periods of study - which is of practical
relevance - the exudation increased with increase in storage temperature.
The Chi-square test on frequency distribution shows that the incidence of exudation
was not affected with increase in storage time. This is a reflection of the fact that
most cheeses had exudation in the first two weeks of storage and the subsequent
additional incidences of exudation were negligible.
Tab l e 5 . 9 E ffect o f storage temperature on the exudation
Storage temperature ( o C )
5 . 0
2 0 . 0
3 0 . 0
Least-square mean of exudation8 ( g exudate/kg
cheese moisture )
2 . 9 1
17 . 7 3
2 3 . 52
Nil
79
61
52
N o o f incidences of exudation
S l ight Exces s
1 3 4
14 2
2 1 2 3
2 1 . 9 1 * * *
a Data includes exudation from Cream cheeses at 2 , 4 and 6 weeks o f storage at the three storage temperatures ;
X2 = Chi-square ; *** = p < 0 . 0 0 1 .

80
Most of the microorganisms and enzymes would be inactivated during the high
heat-processing (:=:::: 74 o C/30 min/25-40 psi steam pressure) of curd with other
ingredients (Kosikowski, 1977; Kalab & Modler, 1985; Modler et al., 1985; Honer,
1988). It is unlikely that there would be any proteolysis during the selected periods
of storage. There is no evidence to link exudation in hot-packed Cream cheese
with proteolysis or chemical changes during the selected periods of storage. The
plausible explanation for the variation in amount of exudate in Cream cheese (or
even absence of exudation up to considerable periods of storage) appears to have
been influenced by the process treatments, casein gel structure, fat emulsion
stability and extent of whey protein denaturation. The effect of storage time on
syneresis could be attributed to the fact that the gel systems in foodstuffs have
cross-linkages that are not permanent (Oakenfull, 1984) and proteins are known to
have reduced water-holding capacity with increased temperature and time (Kinsella
& Fox, 1987). This is supported by the observation that all Cream cheeses stored
at 5 o C, irrespective of the process treatment, had clearly visible and profuse
exudation after 18 months of storage, though it has not been ascertained how far
the bio-chemical changes to the cheese contributed to this effect. Nevertheless, it
was encouraging to note the absence of exudation in some Cream cheeses stored
up to a year at 5 ° C.
SECTION TWO
5.3 EFFECT OF MANUFACTURING VARIABLES ON EXUDATION
FROM CHEESES OF CONSTANT MNFS
5 .3 . 1 Introduction: From the previous factorial experiment the role of fat and the
effect of curd pH at cooking on exudation was not clear. The experiment suffered
due to unsatisfactory product in two trials. The mechanism of how the process
variables affected exudation was only speculative. In the present experiment, it was
aimed to provide evidence to support the proposed theories and confirm the trends
observed in the previous experiment. The scope of the experiment was:
(i) To determine the role of fat on exudation.
(ii) To determine the effectiveness of heat-denatured whey protein in
retarding the extent of exudation.

81
(iii) To determine the residual lactose present in Cream cheese at various
periods of storage.
(iv) To determine the extent of proteolysis in Cream cheese during storage.
(v) To estimate the extent of loss of curd-fines through whey in relation to
process treatments.
(vi) To correlate hardness of Cream cheese with process variables, presence of
denatured whey proteins and exudation of whey.
(vii) To determine the effect of homogenisation pressure on fat globule size and
the protein adsorbed to the fat globule surface.
5 . 3 . 2 Experimental approach : The process variables and the limiting values for the
variables were the same as in the previous experiment (Table 5 . 1) . The major
difference was to have a constant MNFS in Cream cheeses instead of a constant
moisture. This was because, if the non-fat-substance in the cheese is considered to
have the ability to hold a certain maximum amount of moisture, an increase in the
amount of moisture in the non-fat-substance (MNFS) above this level would result in
a proportionate increase in the amount of moisture (i. e. exudate) . It was hoped that
a constant MNFS would negate any effect exerted by the non-fat-substance per se on
the exudation .
Only one storage temperature (5 °C) was chosen for study because the results at other
storage temperatures were unlikely to be of much practical use.
The combinations of manufacturing variables that did not provide a satisfactory product
in the previous experiment were eliminated from the present study to avoid any
possible missing data. The experiment was only fractional-factorial. The emphasis
was in providing supportive and conclusive evidence for the findings of previous
experiment.
Statistical design: A half replicate [2<4-1)] of the full factorial [2<4)] experiment was
performed. The trials were conducted with the following variables (see Table 5 . 1 for
nomenclature) : abed, aBeD, aBCd, AbeD , AbCd, ABed, ABCD, abCD. The upper
case refers to the higher level and the lower case refers to the lower level for the
respective manufacturing variablesAnalysis of variance (ANOV A) technique was
employed for the entire set of data using the statistical package SAS ( 1985) .
Chi-squared test of significance was performed with the data on the incidence of
exudation .

82
Because of insufficient error terms in the fractional factorial design, the effects of
manufacturing variables (particularly above the split) may not show the actual
significance. The results for the different levels of the variables are to be treated
on a relative basis except for the variable 'cooking temperature' which has the
appropriate error terms and is statistically accurate.
5.3.3 Experimental: The manufacturing conditions for Cream cheese were the
same as described in the previous experiment (page no. 65 & Appendix 5.2). The
only deviation was to aim for a constant MNFS (83.5%) in curd. This MNFS value
was chosen on the basis of the average value of the MNFS of curd obtained in the
previous experiment. Adjustment of moisture was done by adding a calculated
amount of the whey or by evaporation during processing of curd as explained in the
previous experiment. An example of the calculations for adjustment of MNFS level
in Cream cheese has been provided in Appendix 5.6.
5.3.4 Analytical methods; The Milko-Scan was used to measure fat, protein and
total solid contents of the skim milk, cream and standardised milk. Lactose content
of the standardised milk was also estimated by the Milko-Scan. Because of the
high fat content (� 1 1% fat), the standardised milk was diluted with an equal
quantity of skim milk prior to analysis. Raw standardised milk and processed
(homogenised and pasteurised) milk were analysed for calcium ( complexometric
method), WPNI (dye-binding method) and fat globule size (spectroturbidimetric
method).
Whey was analysed for fat, protein, lactose and total solids in the Milko-Scan. The
whey was also analysed for calcium, curd-fines and WPNI (dye-binding). Curd was
analysed for fat (Babcock method) and moisture (microwave analyser). Cream
cheese was tested for pH, fat (Babcock method), moisture, salt (potentiometric
method), calcium (complexometric) and hardness (Penetrometer). Urea-PAGE on
Cream cheeses was done at 0, 2, 4, 8 and 16 weeks after manufacture. Residual
lactose in Cream cheese was estimated at 2 and 16 weeks of manufacture. The
protein adsorbed to the surface of the fat globule was extracted from raw

83
standardised milk, homogenised milk and Cream cheese. The type and
concentration of proteins were estimated by SDS-PAGE.
Details of all these methods are outlined in Chapter 4 and Appendix 4. 1 .
5.3.5 Sensocy evaluation: The product was evaluated by a panel after two weeks
of storage for body (firmness) and textural (softness and smoothness) characteristics
using a 5-point scale. Details are provided in Chapter 4.
5.3.6 Results and Discussion
The results are discussed under the following headings:
(a) Composition of milk, whey, curd, cheese and exudate.
(b) Manufacturing aspects and cheese quality.
(c) Physical and biochemical aspects of cheese.
(d) Effect of manufacturing variables on exudation.
(a) Compositions of milk, whey, curd and cheese
Composition of standardised milk: Milks were standardised to the desired high and
low P /F ratios (Table 5.10). Details of composition of standardised milk have been
provided in Appendix 5.7.
Composition of whey (Appendix 5.8): Most variations with the composition of
whey are not of any practical concern. Protein content in whey from cheeses made
with higher pasteurisation temperature or higher cooking temperature were lower.
This could be due to the retention of heat-denatured whey protein in the curd.
Whey obtained during cheese manufacture at the lower level of curd pH at cooking
had significantly higher calcium. This was due to more of the soluble calcium
being lost in whey at a lower pH (Casiraghi et al., 1987).
Composition of curd (Appendix 5.9): The manufacturing variables influenced the
extent of syneresis and whey drainage during cheese manufacture, and consequently
the moisture retained in the curd. Variation of moisture, in turn, affected the fat

84
content in the curd. Results were similar to those described in the previous
experiment.
Table 5 . 10 E f fect of manufacturing variables on the p rotein to fat ( P/ F ) ratio o f raw standardi s ed m i l k
S ource o f variation & the level s
Protein/ Fat ratio
P/F ratio
LSM
High 0 . 3 0 1 Low 0 . 2 2 5
Homogeni sation pressure High 0 . 2 6 1 Low 0 . 2 64
Pasteurisat ion temperature High 0 . 2 6 1 Low 0 . 2 6 5
Curd pH at cooking High Low
Cooking temperature High Low
0 . 2 6 0 0 . 2 6 6
0 . 2 63 0 . 2 63
LSM = Least-square mean ; * * * p < 0 . 0 0 1 ;
F
3 4 4 . 8 * * *
0 . 54
0 . 9 6
2 . 15
0
F values without any asterisks denote ' not s igni ficant • .
Composition of Cream cheese (Table 5. 1 1) : Constant MNFS was attained in most
cheeses except for the variable P /F ratio. Variation in the curd pH at cooking had
the desired significant variation on the pH of Cream cheeses. The calcium content
in cheese reflected the extent of acid production before the curd was separated
from whey which is consistent with the findings of Lawrence & Gilles ( 1987).
Composition of Exydate obtained from Cream cheese: Often it was not possible to
analyse the exudate because of the small quantity. A typical composition of
exudate was: 0.32% fat, 3.51% protein, 1 .82% NaCl, 10.90% total solids, 4.72%
lactose, 24.3 mMoljkg calcium.

Table 5 . 11 Composition of Cream cheese with respect to the manufacturing variables - - - - - - - - - - - - - - - - - - - - - - - - - - - - - - - - - - - - - - - - - - - - - - - - - - - - - - - - - - - - - - - - - - - - - - - - - - - - - - - - - - - - - - - - - - - - - - - - - -
Source Fat ( % ) o f -----------variation LSM F
Moisture ( % )
LSM F
NaCl ( % )
LSM F
ca2+ (mM/kg)
LSM F
pH
LSM F - - - - - - - - ---- - ------- - - - --- - - - - - - - - - - - - --- - - - - - - - - - - - - - - - - - - - - ----- - - - - - - - - - - - - - - - - - - - - - - - - - - ---- - -A 11 . 55* 3 . 52 1 . 0 4 . 04 0 . 04 High 3 0 . 67 5 5 . 60 1 . 1 2 4 . 8 5 . 04 Low 3 4 . 22 5 3 . 94 1 . 1 2 3 . 3 5 . 02
B 6 . 4 1 6 . 4 1 2 . 7 8 0 . 11 1 . 87 High 3 1 . 12 5 5 . 89 1 . 1 2 3 . 9 4 . 9 9 Low 3 3 . 7 6 53 . 65 1 . 1 2 4 . 2 5 . 07
c 0 . 84 0 . 79 2 . 78 1 . 0 0 0 . 53 High 3 1 . 97 55 . 16 1 . 3 2 4 . 4 5 . 0 1 Low 3 2 . 9 2 54 . 3 8 1 . 1 2 3 . 7 5 . 05
D 4 . 7 2 5 . 59 9 . 01 13 . 57 * 2 0 . 5 0 * High 3 3 . 58 53 . 72 1 . 1 2 5 . 4 5 . 16 Low 3 1 . 3 1 5 5 . 8 2 1 . 1 22 . 7 4 . 8 9
E 0 . 15 0 . 8 2 3 . 95 1 . 5 0 17 . 4 8 * High 3 2 . 55 5 4 . 53 1 . 1 2 4 . 2 5 . 0 1 Low 3 2 . 34 5 5 . 0 1 1 . 1 2 3 . 9 5 . 04 - - - - - - ---- ---- - - - - - - --- - - -- - - - - - - -- - - - - - - ------ - - --- - - - - - --- - - - - - - - - -- -- - - - - - - - ---- - --- -- - - -- -----A = P/F ratio ; B = Homogenisation pressure ; C = Pasteurisation temperature ; D = Curd pH at cooking ; E = Cooking temperature ;
LSM = Least-square mean ; F = F ratio ;
* p < 0 . 05 ; F values without asterisks denote ' not s igni ficant ' .
Table 5 . 11 continued . . . 00 Vl

Table 5 . 11 continued - - - - - - - - - - - - - - - - - - - - - - - - - - - - - - - - - - - - - -- - - - - - - - - - -- - - - - - - - - - - - - - - - - - - -
Variables MNFS ( % ) FDM ( % ) S/M ( % ) & levels - - - - - - - - - - - - - - - - - - - - - - - - - - - - - - - - - - - - - - -
LSM F LSM F LSM F - - - - - - - - - - - - - - - - - - - - - - - - - - - - - - - - - - - - - - - - - - - - - - - - - - - - - - - - - - - - - - - - - - - - -A 50 . 7 2 * * 2 9 . 10** 3 . 82 High 8 0 . 07 69 . 07 2 . 0 Low 8 1 . 9 9 74 . 18 2 . 1
B 0 . 99 5 . 4 0 7 . 2 3 High 8 1 . 16 7 0 . 52 2 . 0 Low 8 0 . 89 72 . 7 2 2 . 1
c 0 . 2 3 0 . 9 3 0 . 3 3 High 8 0 . 97 7 1 . 16 2 . 1 Low 8 1 . 09 7 2 . 08 2 . 1
D 1 . 0 3 3 . 2 6 3 . 8 2 High 8 0 . 8 9 72 . 48 2 . 1 Low 8 1 . 17 7 0 . 77 2 . 0
E 5 . 60 0 . 64 1 . 9 5 High 8 0 . 87 7 1 . 44 2 . 1 Low 8 1 . 2 0 7 1 . 8 0 2 . 1
A = P/F ratio ; B = Homogenisation pressure ; c = Pasteurisation temperature ; D = curd pH at cooking ; E = Cooking temperature ; LSM = Least-square mean ; F = F ratio ; ** p < 0 . 0 1 ; F values without asterisks denote ' not significant ' .
00 0\

87
(b) Manufacturing aspects and cheese quality
Cheese manufacture: Manufacture of cheese did not pose any problems. A greater
quantity of curd-fines were lost in the whey when the cheese was made with a
higher cooking temperature (Appendix 5.8) which confirmed the visual observation.
The effect could be due to thermal (high heat treatment) and mechanical
(additional agitation) factors. However, this is less likely to be a concern in
commercia] scale manufacture where curd is mechanically separated.
Evaluation of Cream cheese: In general the cheeses were acceptable
(Appendix 5.10). The body of the product was rated as significantly firmer with
higher cooking temperature.
(c) Physical and biochemical aspects of Cream cheese
Fat globule size: The mean diameter of fat globules in raw standardised milk and
processed (homogenised and pasteurised milks) are provided in Table 5 . 12. The
mean diameter of fat globules in milk homogenised at a higher pressure was
significantly smaller when compared to that with lower homogenisation pressure.
The values of mean diameter compare favourably with the reported values of about
1 J.Lm for homogenised milks (Walstra, 1975).
The mean diameter of fat globules could not be estimated in some Cream cheeses
because the turbidity spectra did not match with the standard theoretical spectra
of known fat globule sizes. Interestingly, it was observed that the size of fat
globules for all Cream cheeses homogenised at higher homogenisation pressure
could be detected, and the values ranged from 0.303 - 0.574 J.Lm. The fat globule
size of all Cream cheeses made with homogenisation at a lower pressure could not
be estimated. This could have been due to the fat globules being very large, or
non-homogeneous. While dissolving Cream cheese in alkaline EDTA (ethylene
diamine tetra-acetic acid) solution during sample preparation for estimation of fat
globule size, free fat could be seen floating on the surface. This indicates that the
fat globules had undergone clumping and clustering during processing. Because of

88
some free-fat separation during sample preparation, it was difficult to draw a
representative sample. Therefore, the estimated fat globule sizes in Cream cheeses
are not likely to be very accurate. However, it can be safely interpreted that the
fat globules in Cream cheese made from milk homogenised at lower pressure were
larger than those from milks homogenised at higher pressure. The total area
occupied by the surface of the fat globules in Cream cheeses made from milk
homogenised at lower pressure may therefore be expected to be less than cheese
made with higher homogenisation pressure.
Table 5 . 1 2 E ffect o f manufacturing variables on the mean diameter of fat globules in raw standardised milk and processed (homogenised and pasteurised) milk
Mean diameter of fat globules ( �m )
Raw milk Processed milk
Levels LSM F LSM F
A 5 . 19 3 . 4 3 High 4 . 5 0 . 6 Low 3 . 9 0 . 8
B 3 . 53 4 1 . 8 7 * * High 3 . 9 0 . 4 Low 4 . 4 1 . 0
c 0 . 04 0 . 07 High 4 . 2 0 . 7 Low 4 . 1 0 . 7
D 0 . 0 1 0 . 2 3 High 4 . 2 0 . 7 Low 4 . 2 0 . 7
E o . oo 0 . 00 High 4 . 2 0 . 7 Low 4 . 2 0 . 7
A = P/F ratio ; B = Homogenisation pressure ; C = Pasteurisation temperature ; D = pH at cooking ; E = Cooking temperature ; LSM = Least-sqare mean ; F = F ratio ; * * p < 0 . 0 1 ; F values without asterisks denote ' not s ignificant ' .

89
Whey Protein Nitrogen Index (WPNI): The severity of heat treatment i s directly
related to the denatured whey protein and inversely related to the undenatured
whey protein (or WPNI) in milk or whey. In this experiment as WPNI values of
curd and Cream cheese could not be accurately estimated, the results are being
inferred from the WPNI values of raw standardised milk, processed (homogenised
and pasteurised) milk and whey. It is expected that with higher heat treatment
during pasteurisation, more whey protein would be denatured in the milk and
retained in the curd. An indication of the retention of the denatured whey protein
in the curd would be supported by a corresponding lower WPNI in whey. Likewise,
increased heat-denaturation of whey protein at a higher cooking temperature and
their retention in the curd would be indicated by a lower WPNI of whey.
The WPNI for the standardised milk, processed milk and whey are shown in
Table 5.13. The low WPNI of whey (alternatively, more denatured whey protein
retained m curd) for higher pasteurisation temperature is consistent with the
findings reported by Garrido et al. (1983) that increase in pasteurisation
temperature from 73 ° C to 85 o C resulted in linear increase in denatured whey
protein from 10 to 40%. A similar effect was also observed with increase in
cooking temperature. A low WPNI for the higher homogenisation pressure may
be traced to the initial difference in raw standardised milks. It is unlikely that the
effect could have been due to the treatment itself.
It is apparent that variation in heat treatment due to the process variables
'pasteurisation temperature' and 'cooking temperature' was effective in obtaining
a variation in the denaturation of whey protein. It follows from this that Cream
cheeses made with higher levels of pasteurisation temperature and cooking
temperature had increased amounts of heat-denatured whey protein.
Protein adsorbed to surface of fat globules in milk: Protein adsorbed to fat
globules in raw standardised milk and processed milks homogenised at high and
low pressures were extracted and analysed by SDS-PAGE. The visibility of protein
bands in the gels from samples of homogenised milks was not very clear. In some
instances even the densitometer failed to plot the bands clearly. This was due to

Table 5 . 13
Treatment & Levels
A High Low
B High Low
c High Low
D High Low
E High Low
Effect of manufacturing variables on the WPNI [mg undenatured whey proteinjg milk ( or whey ) ]
Raw standardised milk
LSM F
0 . 2 6 3 . 12 3 . 09
6 . 77 3 . 03 3 . 18
1 . 09 3 . 07 3 . 13
3 . 8 6 3 . 16 3 . 04
0 . 00 3 . 10 3 . 10
WPNI (mgjg)
Processed (pasteurised & homogenised milk)
LSM F
0 . 0 1 2 . 14 2 . 15
11 . 7 9 * 1 . 9 6 2 . 3 3
3 3 . 4 4 * 1 . 84 2 . 4 5
0 . 8 3 2 . 10 2 . 19
0 . 00 2 . 14 2 . 14
Whey
LSM F
0 . 2 8 1 . 55 1 . 4 6
3 . 5 6 1 . 3 4 1 . 6 6
6 . 44 1 . 2 9 1 . 7 1
0 . 57 1 . 5 6 1 . 4 4
4 1 . 5 4 * * 1 . 2 7 1 . 7 3
A = P/F ratio ; B = Homogenisation pressure ; C = Pasteurisation temperature ; D = pH at cooking ; E = Cooking temperature ; LSM = Least-square mean ; F = F ratio ; * p < 0 . 05 ; ** p < 0 . 01 ; F values without asterisks denote ' not significant ' .
\0 0

91
insufficient recovery of 'homogenised fat' by centrifugation during the extraction
procedure.
Both raw and homogenised milks had all the major milk proteins. The effect of
homogenisation on the concentration of casein and whey protein adsorbed to the
fat globule surface, and the fat globule size, have been reported in Table 5.14.
With increase in homogenisation pressure more casein was adsorbed to the fat
globule surface. This observation is consistent with the reported literature that
during homogenisation the newly created fat globules are coated by the casein
protein (Vliet & Dentener-Kikkert, 1982; Brooker, 1987).
Table 5 . 14 E ffect of homogenisation of milk on the concentration of proteins ( casein and whey protein ) adsorbed to fat globule surface , and the mean diameter of fat globules
Particulars Fat Results from densitometer plots globul e -------------------------------
Raw standardised
size ( J.Lm )
milk 4 . 0
Processed milk ( Homogenised at 6 0 0 ps i ) 0 . 9
Processed milk ( Homogenised in two stages at 2 0 0 0/ 6 0 0 p s i ) 0 . 5
Area of casein protein
0 . 13
0 . 13
0 . 2 0
Area of whey protein
0 . 0 9 5
0 . 07
0 . 05
Note : Areas of the proteins have arbitrary units ; 1 psi = 6 . 8 9 kPa .
Ratio of casein to whey protein
1 . 3 7
1 . 8 6
4 . 0
Protein adsorbed to surface of fat globules in Cream cheeses: SDS-PAGE showed
the presence of major milk proteins in the proteins adsorbed to the fat globule
surface in cheese. These were similar to the proteins extracted from fat globule
surface of homogenised milks. However, unlike the protein bands from fat globule
surface of homogenised milks, these were clearly visible and were present in much

92
higher concentration. The ratio of casein and whey protein as estimated with the
densitometer plots are reported in Table 5 .15. The casein to whey protein ratio
was significantly higher with higher P /F level. This may be due to availability of
more protein in proportion to fat. Further, the ratio of casein to whey protein was
significantly lower for pasteurisation treatment of milk at a higher level.
Availability of increased amounts of denatured whey proteins in the milk at the
higher pasteurisation, which followed immediately after homogenisation, might have
facilitated the adsorption of increasing amounts of whey proteins onto the fat
globule surface.
A slightly increased casein to whey protein ratio was observed in fat extracted from
cheese made with higher homogenisation pressure. This is due to the increased
adsorption of casein proteins to fat globules in the milk at the higher
homogenisation pressure.
Table 5 . 15 Effect of manufacturing variables on the protein adsorbed to fat globules ( casein to whey protein ratio ) extracted from Cream cheese
Source of variation & the level s
Casein t o whey protein ratio1
Least square mean
Protein/Fat ratio High 2 . 164 Low 1 . 6 2 1
Homogenisation pressure High 2 . 02 5 Low 1 . 7 6 0
Pasteurisation temperature High 1 . 6 14 Low 2 . 17 1
Curd pH at cooking High 1 . 8 6 3 Low 1 . 9 2 3
Cooking temperature High 1 . 8 0 0 Low 1 . 9 8 5
F rati o
14 . 1 4 *
3 . 37
14 . 9 3 *
0 . 17
0 . 4 4
1 Densitometer plots from gel s of S DS-PAGE ; * p < 0 . 0 5 ; F values without any asterisks denote ' not s ignificant ' .

93
Hardness of Cream cheese: Hardness of cheese was estimated by a penetrometer
(Table 5 . 16) . Cream cheese made with a higher cooking temperature was significantly
harder than that with a lower cooking temperature. This is in accord with the cheese
made at higher cooking temperature being rated as firmer by the panel of judges
(described earlier) .
Slightly firmer body was noticed in Cream cheeses made with the following process
variables: lower P/F ratio , higher homogenisation pressure, higher pasteurisation
temperature, lower curd pH at cooking . Some of these effects may have been due to
the presence of more fat (solidified state of the fat contributing to hardness) , or more
denatured whey protein (better water-binding ability) .
Cream cheeses at 5 °C were firmer in comparison to 20°C . This may be attributed to
more of the fat fraction in Cream cheese being in a solid state at the lower temperature
(MacGibbon & McLennan, 1987) . Cream cheeses after 16 weeks were firmer than
those after two weeks of storage. The increase in firmness was detected in all the
cheeses, irrespective of whether or not there was exudation. This increase in firmness
during storage may be similar to a process of setting in butter where hardness of the
butter increases rapidly immediately after manufacture and then at a decreasing rate,
approaching a final value asymptotically (Taylor et al. , 1 973) . It is also possible that
the cross-linking in the protein network of the Cream cheese increases during aging and
increase the firmness.
No relationship between hardness of Cream cheese and exudation could be established.
In a separate experiment it was found that addition of stabilisers e. g. Locust bean gum
at the rate of 0. 025 % , helped considerably in firming the Cream cheese body. The
stabilised product showed no exudation over eight months of storage at 5 °C .
Residual lactose in Cream cheese: Lactose content and the corresponding pH i n
Cream cheeses o f varying age are tabulated i n Table 5 . 17 . Lactose was detected in
Cream cheese at 16 weeks after manufacture. Repeatability of lactose estimates

94
in Cream cheese at 16 weeks was not satisfactory. This was due to the difficulty
in drawing a representative sample from the thawed Cream cheese. It is unlikely
that there has been any breakdown of lactose during storage, because the pH of
Cream cheese did not change during this period. In a similar process involving
manufacture of Cream cheese spread, electron microscope studies on the
microstructure showed that viable lactic bacteria were killed by the heat treatment
resulting in highly vacuolised dead cells (Kalab & Modler, 1985).
Table 5 . 16 E ffect of manufacturing variables on the hardness o f Cream cheese . Hardness is expressed i n terms of distance of penetration ( one hundredths of a centimetre) of the cone, with a total weight o f 5 0 g, in a fixed time .
Hardness of product at s · c Hardness o f product at 2 o • c Source of variation & level s
Storage period storage period
Two weeks S ixteen weeks Two weeks S ixteen weeks
LSM F LSM F LSM F LSM F - - - - - - - - - - - - - - - - - - - - - - - - - - - - - - - - - - - - - - - - - - - - - - - - - - - - - - - - - - - - -
A 0 . 16 1 . 9 2 0 . 59 0 . 51 High 2 4 2 . 4 2 07 . 9 5 1 9 0 . 9 1 5 6 . 3 1 Low 2 13 . 5 12 1 . 4 5 1 6 0 . 7 1 4 2 . 5 1
B 0 . 13 0 . 8 8 0 . 4 4 2 . 35 High 2 14 . 9 1 3 5 . 4 1 1 6 2 . 7 1 3 4 . 58 Low 2 4 0 . 9 193 . 9 8 188 . 9 1 6 4 . 2 3
c 1 . 10 3 . 57 0 . 3 4 4 . 66 High 19 0 . 5 105 . 7 8 164 . 4 1 2 8 . 52 Low 2 65 . 4 2 3 3 . 6 1 187 . 2 1 7 0 . 3 0
D 1 . 4 5 1 . 7 8 1 . 18 2 . 67 High 2 7 0 . 9 2 0 6 . 3 2 197 . 2 1 65 . 2 0 Low 1 8 5 . 0 12 3 . 07 154 . 4 1 3 3 . 6 2
E 10 . 4 4 * 2 . 58 2 2 . 7 6 * 99 . 1** High 118 . 6 1 2 5 . 8 1 144 . 1 1 2 4 . 1 1 Low 3 3 7 . 3 2 03 . 58 2 07 . 6 1 7 4 . 7 1
S . D . 1 3 5 . 4 9 6 . 8 2 6 . 6 1 0 . 2 - - - - - - - - - - - - - - - - - - - - - - - - - - - - - - - - - - - - - - - - - - - - - - - - - - - - - - - - - - - -
A = P /F ratio; B = Homogenisation pressure; C = Pasteurisation temperature; D = Curd pH at cooking; E = Cooking temperature; LSM = Least-square mean; S.D. = Standard deviation of raw data; F = F ratio; * p < 0.05; * * p < 0.01; * * * p < 0.001; F values without asterisks denote 'not significant'.

95
Table 5 . 17 Lactose level and corresponding pH of Cream cheeses of varying age
Age of cheese
One day
S ixteen weeks
Lactose content 1
(mMoljkg cheese) ( % )
7 4 . 6 0 2 . 68 7 4 . 07 2 . 67 7 3 . 97 2 . 6 6 68 . 4 1 2 . 4 6
7 0 . 50 2 . 54 7 1 . 02 2 . 5 6 4 9 . 8 9 1 . 8 0 57 . 5 1 2 . 07
1 Results of repl icates .
pH
5 . 0 8
5 . 04
Proteolysis in Cream cheese: Urea-PAGE on Cream cheeses of varying age showed
that the casein fractions did not undergo any significant change during the 16 week
storage period (Fig 5.4). The areas of caseins determined from densitometer plots
are provided in Table 5.18. There was no evidence of any proteolysis in Cream
cheese during storage. The ratios of et5ccasein to 13-casein should have been close
to 1 for the standard casein and the Cream cheeses. This was not so because the
bands in the gel were thicker at the centre and gradually narrowed towards the
sides for some unknown reason. However, no new bands had appeared in the gel,
and visual observation of the protein bands showed no signs of proteolysis.
Proteolysis in exudate of Cream cheese: Urea-PAGE showed that the exudate had
a slight increase in the casein fractions with increase in storage time (Table 5 . 19) .
This may be due to a general trend, or to a lack of accuracy in quantitative
electrophoretic studies (Creamer, 1991). However, no new casein bands or
sub-bands had appeared, which further confirmed the absence of proteolysis in
Cream cheese.
HPLC studies showed that the amount of peptides detected in the molecular weight
range 500 - 10,000 daltons were very low. A small amount of amino acids was
detected. Most of the peaks were in the region of casein proteins. It was difficult

K-casein ----
B-casein ------
a,2-casein T asl-casem
� .,... � en "' t) '"0 I-. "' '"0 � "' ...... Cl'.l
'"0 ....... '"0 0 0 � � '"0 I-. '"0 :?; 8 ,....; N
� en � � ...c:: t) E "' � I-. u E 0 ob '"0 '"0 '"0 ....... ....... 0 � 0 0 ......
� � � "' '"0 � :?; :?; � � 00 \0 ,....;
Fig. 5.4 Urea-PAGE of Cream cheese during storage at 5°C.
96

97
to identify the peak for whey proteins as they might have overlapped with that of
casein.
Conclusion : Proteolysis did not occur during storage of Cream cheese up to 16
weeks. Thus, occurrence of exudation was not caused by any proteolytic changes
in Cream cheese. It has been shown earlier that there was no change of pH of
Cream cheese during storage. It follows from these findings that exudation is more
likely to be influenced by manufacturing conditions rather than the changes during
storage.
Table 5 . 18 Effect of storage time on the casein fracti ons in Cream cheese (urea-PAGE results )
Particulars
Sample - I Standard Casein Curd
Cream cheese 1 day 2 weeks 4 weeks 8 weeks
1 6 weeks
Sample - I I Standard Casein Curd
Cream cheese 1 day 2 weeks 4 weeks 8 weeks
1 6 weeks
Area occupied by Casein bands1
as, - as2-casein casein
1 . 0 9 0 . 1 0 . 4 9 0 . 12
0 . 3 9 0 . 1 1 0 . 4 3 0 . 08 0 . 3 9 0 . 11 0 . 4 6 0 . 0 9 0 . 4 2 0 . 07
0 . 8 6 0 . 2 3 0 . 3 9 0 . 15
0 . 4 6 0 . 18 0 . 4 1 0 . 2 0 0 . 4 1 0 . 15 0 . 4 0 0 . 12 0 . 4 8 0 . 15
{3 -casein
0 . 4 6 0 . 3 2
0 . 2 3 0 . 2 3 0 . 2 3 0 . 2 5 0 . 2 3
0 . 5 5 0 . 2 6
0 . 2 9 0 . 3 0 0 . 2 6 0 . 2 8 0 . 2 8
K casein
0 . 03 0 . 05
n . d . 0 . 04 0 . 04 0 . 04 0 . 02
0 . 14 0 . 03
0 . 0 3 0 . 03 0 . 04 0 . 07 0 . 05
Ratio of as1
- to {3-c:asein
2 . 3 6 1 . 53
1 . 69 1 . 8 7 1 . 7 0 1 . 8 4 1 . 8 3
1 . 5 6 1 . 5 0
1 . 5 9 1 . 3 7 1 . 5 8 1 . 4 3 1 . 7 1
1 Estimated from the dens itometer plots . The units are arbitrary . n . d . = Not detected by the dens itometer plots .

98
Table 5 . 19 Effect of storage time on the casein fracti ons in exudate from Cream cheese (urea-PAGE results )
Age of Cream Area occupied by Casein bands1 cheese from -------------------------------------------which exudate a - a52 - {3 - K - Ratio of s1 , • , , was obtained
8 weeks 18 weeks
case1n case1n case1n case1n
0 . 19 0 . 2 1
n . d . 0 . 02
0 . 2 3 0 . 2 9
n . d . 0 . 15
0 . 8 3 0 . 7 2
1 Estimated from the densitometer plots . The units are arbitrary . n . d . = Not detected by the densitometer plots .
(d) Effect of manufacturing variables on exudation: The effects of the
manufacturing variables on the exudation (mean values estimated using ANOVA
and test of significance using X2 test) are listed in Table 5.20. Most of the effects
were similar to the previous experiment. Since the statistical design was only
fractional-factorial, the effects detected were less significant.
Effect of P /F ratio (0.23 & 0.30) on exudation: Similar MNFS values for the two
levels of P /F ratio could not be attained apparently due to lack of adequate control
during cheese manufacture and analyses. Estimation of the moisture content in the
microwave analyser, though quick, provides only a rough estimate. This might have
been the biggest source of error.
Cheese made from milk standardised to the lower level of P /F ratio had higher
MNFS and the amount of exudate from this was greater (Table 5.20). The increase
in the amount of exudate with increased MNFS is consistent with the presumed
concept that an increase in the moisture content of the non-fat substance, beyond
the limit of what it can hold, would be proportional to the amount of exudate
released from cheese.
The moisture content of cheese made from milk with the lower level of P /F ratio
was slightly lower, and the fat content was significantly higher (Table 5 . 1 1). In
spite of a slightly lower moisture and a higher fat content, the amount of exudate

Table 5 . 2 0
Sources of variation & levels
A
B
c
D
E
High Low
High Low
High Low
High Low
High Low
Storage time 2 weeks 4 weeks 6 weeks 8 weeks
12 weeks 16 weeks
99
Effect of manufacturing variables on the exudation of whey from Cream cheeses of constant MNFS
Least-square means of exudation ( g/kg cheese moisture )
0 . 8 7 10 . 3 1
2 . 4 3 8 . 7 5
0 11 . 17
1 . 5 6 9 . 6 1
0 11 . 17
1 . 07 3 . 09 4 . 7 4 5 . 9 6 9 . 4 6 9 . 2 1
No of incidences of exudation
Nil S l ight8 Excessb
4 3 3 6
3 7 4 2
4 8 3 1
4 2 3 7
4 8 3 1
14 13 1 3 1 3 13 13
5 7
1 1 1
0 12
6 6
0 12
2 2 2 2 2 2
0 5
0 5
0 5
0 5
0 5
0 1 1 1 1 1
5 . 9 5 *
1 3 . 6 5 * *
2 0 . 6 6 * * *
5 . 3 2 #
2 0 . 6 6 * * *
0 . 0 5ns
a sl ight = 1-2 0 g exudate/kg cheese moisture ; b excess = > 2 0 g exudate/kg cheese moisture ;
A = P/F ratio ; B = Homogenisation pressure ; c = Pasteurisation temperature ; D = Curd pH at cooking ; E = Cooking temperature ;
X2 = Chi-square ; * p < 0 . 05 ; ** p < 0 . 0 1 ; *** p < 0 . 0 0 1 ; # = p < 0 . 1 0 ; ns = not s ignificant .
MASSEY UNIVERSln LIBRARY

100
from these cheeses was significantly higher. This clearly showed that fat was not
effective in reducing the extent of exudation. It is reported that in yoghurt the
mechanical properties of the milk gel is changed and the water-binding capacity of
the gel is improved by increasing the levels of milk solids (Brooker, 1987).
However, present findings on Cream cheese indicate that it is primarily the protein
that accounts for the water-binding capacity of the gel structure, and that fat is not
effective in binding the moisture.
Effect of homogenisation pressure (2000/500 psi & 600 psi) on exudation: The
average amount of exudate was significantly less in Cream cheeses made from milk
homogenised at a higher pressure (Table 5.20). This happened in spite of a slightly
higher moisture in cheese. It was shown earlier that increase in homogenisation
pressure resulted in a decrease in the mean diameter of the fat globules. Walstra
(1975) reported that size-reduction of fat globules in milk occurs due to
homogenisation with about a six-fold rise in fat globule surface area. It was found
that with an increase in homogenisation pressure more casein are adsorbed to the
fat globule surface. This is expected to make the casein gel structure of casein
matrix more rigid due to a net increase in the number of linkages of molecules
between fat and protein. The gel matrix is also likely to be less permeable to water
due to an increase in the fat globule surface area. These effects of homogenisation
would have contributed to the reduction in the amount of exudate from Cream
cheese made with higher homogenisation pressure.
While the amount of exudate was higher from cheese made with low pressure
homogenisation, the incidence of exudation was lower. This was due to a large
amount of exudate released from the cheeses in which exudation occurred. The
practical implication of this is significant. If it is possible to reduce the amount of
exudate in the cheese by interaction with other manufacturing conditions, it would
be possible to use the low homogenisation pressure during cheese manufacture.
Effect of pasteurisation temperature (72 o C & 82 o C) and cooking temperature
(60 o C & 75 ° C) on exudation: Cream cheese made from milk pasteurised at a
higher temperature did not have any exudation (Table 5.20). Similarly, cooking

101
curd at a higher temperature also prevented exudation from Cream cheese. The
analyses on WPNI showed that more whey protein was denatured due to the higher
heat treatments. The effect of denatured whey protein in binding more moisture
and providing a firm body to the product is likely to have prevented exudation.
These results are comparable with the studies on yoghurt where the effect of
heating milk results in greater water-binding ability due to interaction of denatured
whey protein (13-lactoglobulin) with casein micelles (Dannenberg and Kessler,
1988). The high water-holding capacity and greater firmness due to high heat
treatment was explained as due to the formation of a compact, heavily branched
protein network of the gel (Parnell-Clunies et al., 1987).
Effect of curd pH at cooking (4.7 & 5.0) on exudation: The average amount of
exudate and the incidence of exudation were both greater at the lower curd pH at
cooking (Table 5.20). This might have been caused by the fact that the lower curd
pH at draining, and consequently the cheese pH, were both closer to the isoelectric
point of casein at which the hydrating properties of casein is expected to be the
minimum.
Effect of storage time (Table 5.20): The Chi-squared test showed that the increase
in the incidence of exudation was not affected by the increase in storage time.
Pooled data from all the trials on Cream cheeses showed that of all the cheeses
that had exudation, 90% exuded within the first two weeks of manufacture. This
observation may have a practical relevance. Usually it would take over a week for
the product to reach the costumers. This time provides an opportunity for the
manufacturer to examine whether or not the cheeses exude and to decide about
releasing the product to the market.
The least-square mean values of the amount of exudates are consistent with the
earlier findings of a gradual increase in the amounts with increase in storage time
(Fig. 5 .3, page no. 78).

5.4 OVERALL SUMMARY AND CONCLUSION TO CHAPTER 5
102
Composition of curd was primarily influenced by the effect of the selected
manufacturing variables on the amount of whey drained during the manufacture of
cheese. Pasteurisation of milk at a higher temperature, homogenisation of milk at
a higher pressure and cooking curd at a lower pH resulted in slow drainage of whey
(during cheese manufacture) and increased moisture in curd. Accurate process
control is required, particularly during heat-processing of curd, to adjust the
moisture or MNFS to the desired level in Cream cheese. A greater amount of
curd-fines are lost at a higher cooking temperature. The curd pH at cooking
primarily determined the pH of Cream cheese.
There was no evidence of proteolysis up to 16 weeks in Cream cheese stored at
5 · C. Residual lactose was detected in Cream cheese at the end of 16 weeks of
storage. There was very little change in pH of Cream cheese during this storage
period.
The amount of exudate increased with increase in the MNFS in Cream cheese.
Within the selected levels of variation of P /F ratio, change in fat content of Cream
cheese did not affect exudation. Homogenisation resulted in a decrease in the
mean diameter of fat globules in the milk. Homogenisation of milk at a higher
pressure resulted in adsorption of increased amounts of casein on the fat globule
surface, both in the milk and Cream cheese. Coating of fat globules with casein
resulted in fat globules behaving as part of the casein matrix. The increase in the
fat globule surface area and casein-coating over the fat globule surface explain the
reduced amount of exudate in Cream cheese made from milk homogenised at a
higher pressure. Increased heat treatment through pasteurisation and cooking of
curd resulted in increased denaturation of whey protein which was effective in
reducing the amount of exudate. In most cases cooking of curd at the higher
temperature prevented exudation from Cream cheese. The curd pH at cooking had
a smaller effect on exudation in comparison to other variables. Increase in the
amount of exudate from cheese at lower pH is possibly due to the closeness of the
pH of cheese to the iso-electric point of casein, the major protein in Cream cheese.

103
Increase in the amount of exudate was observed with increase in storage
temperature and increase in storage time. Use of a stabiliser, locust bean gum at
the rate of 0.025%, was effective in preventing exudation.
The effect of the selected manufacturing variables in reducing the extent of
exudation from Cream cheese was in the following decreasing order of importance:
cooking temperature > pasteurisation temperature > homogenisation pressure � P /F ratio in milk > curd pH at cooking.
Cream cheeses which do not develop exudation in the first two weeks are unlikely
to exude at later stages of storage. No relationship could be established between
the hardness of Cream cheese and the exudation. It is concluded that exudation
is not caused by any gross change in the composition of hot-packed Cream cheese.

CHAPTER 6
EXUDATION OF WHEY FROM FETA CHEESE DURING STORAGE
6.1 Introduction
104
Feta cheese was chosen as a model cheese for the study on exudation because:
it is a ripened cheese,
exudation occurs during storage of all Feta cheeses,
it is an important variety of cheese and has commercial significance,
it represents brine salted cheese,
it was desirable to improve the understanding about recombined1 milk
cheeses, and
it was expected to provide results in a reasonably quick time ( < 6 months).
Very little is reported on factors affecting exudation from Feta cheese during
storage and the mechanism of exudation. However, some information is reported
on the change in weight of Feta type cheeses during storage (Mansour & Alais,
1972; Abd El-Salam et al., 1981; Alichanidis et al., 1984; Abd El-Salam, 1987;
Vafopoulou et al., 1989) and variation in moisture content during storage (Omar
& Buchheim, 1983). Most of these studies are related to storage of cheese in
brine. Mansour and Alais (1972) investigated some aspects on Feta type cheese
vacuum-packed in Cryovac wrapped plastic bags. They reported that the loss of
weight in this cheese was about 1 .35% (2.4% moisture) when stored at 10°C for 120
days, which was less compared to the weight loss from brine-stored cheese. The
present investigation is restricted to vacuum-packed Feta cheese made from
recombined milk.
1 Feta cheese is normally made from fresh milk. In this study Feta cheese was made using recombined milks. The technology of recombined milk cheese was important for New Zealand cheese industry in view of its potential for export. The other advantage of using recombined cheese is described later in this Chapter.

105
The scope of this study was to determine the effect of selected manufacturing
variables on exudation and determine the possible causes. This Chapter is divided
to following sections:
(a) Preliminary studies.
(b) Chemical, biochemical and microbiological changes in Feta cheese and
exudate during storage at 10 o C.
(c) Effect of selected manufacturing variables on exudation from Feta cheese.
SECTION ONE
6.2 PRELIMINARY STUDIES
The objective of the preliminary studies was to develop a scientific method for
study of exudation of whey from Feta cheese during storage. The scope of this
experiment was:
(i) To standardise the manufacturing process for Feta cheese using low heat
skim milk powder (LHSMP) and fresh frozen milkfat for recombining
(FFMR).
(ii) To study the effect of vacuum packing cheese in plastic pouches and
determine the suitability of the vacuum-packed cheese for the measurement
of the amount of exudate.
(iii) To determine the effect of storage temperature of F eta cheese on exudation.
(iv) To determine the effect of factors related to handling of cheese on the
exudation, e.g. size of cheese blocks, temperature variation, turning the
blocks, vacuum packaging.
6.2.1 Experimental
Major deviations in the manufacture of Feta cheese from the conventional process
were:
Cheese after brining was packed in vacuum sealed plastic bags instead of
storing in brine. The procedure was similar to that described by Mansour
106
& Alais ( 1972) . This form of packaging is more suitable as a consumer pack
and also convenient to measure the amount of exudate during storage. It was
hoped that the findings from this study could be easily applied to other cheeses
because of the packaging resemblance to most other varieties of cheeses.
Recombined cow's milk was used instead of fresh sheep' s milk. The process
is similar to that described by Gilles ( 1974) .
Feta cheese made during these studies was used to acquaint the panel of j udges with
the product characteristics, and develop the sensory profile. Variations were applied
as described in the results and discussion.
Cheese manufacture
Raw Materials: LHSMP and FFMR were used as the source of milk solids . In the text
Cream prepared using FFMR and reconstituted skim milk i s referred as manufactured
cream. Recombined milk was chosen for manufacture of Feta cheese to avoid the
effect of seasonal variation in the compostion of fresh milk, and to gain knowledge on
aspects related to recombined milk cheese.
Manufacturing process: The equipment and accessories used for manufacture of Feta
cheese are outlined in Appendix 6. 1 . The flow-diagram for the manufacturing process
is outlined in Fig. 6. 1 . Detailed description of the process is provided in Appendix
6 .2 . Some of the manufacturing stages are shown pictorially in Fig. 6 .2 .
6.2.2 Results and discussion
This is described in two parts - the first part is on aspects related to cheese manufacture
and the second part is on aspects related to exudation.
(a) Aspects related to cheese manufacture
(i) Bacteriological quality: The recombined milk, cheese before brining and cheese
after brining were analysed for bacteriological quality periodically. Coliforms were

107
Low heat skim milk powder RSM & fresh frozen milkfat for & water at 40 ° C (1 8.5) recombining (3 1 ), single stage
homogenisation, 1000 psi , 60 o C
� w Reconstituted skim milk (RSM) J I Manufactured cream I � Cheesemilk, P/F ratio
J 0.73, 34 ° C
L.. = r
CaC12 (0.02%) I J,
Addition of starter Lactococcus cremoris subsp. cremoris strains (2.0%) Streptococcus thermophilus (0.1%) Lactobacillus casei (0. 1%)
1frens*I8!:::mm \I! I Rennet addition, 16 ml/100 kg milk, 33 ° c I
��:�m,P.g�::::��::::m \V I Cutting, three standard cuts, 12 mm I <!r
Dwell, 15 min I J, I Gentle stirring, once every 10 min I J, I Draining whey, pH 6.2 I J,
Overnight draining of whey in hoops (no pressing), 20 ° C, 3-4 turns over first 2-3 hours
J. I Brining, 22 h, 20% brine, 12 ° C l
<!, I Vacuum packed in plastic bags I J, I Stored at 10 o C I
Fig. 6.1 FLOW DIAGRAM FOR MANUFACfURE OF FETA CHEESE

Fig. 6.2
108
Selected stages in Feta cheese manufacture.
Top row (left) :
Top row (right) :
Bottom row (left) :
Bottom row (right) :
Reconstitution of low heat skim milk
powder in water;
Cheesemilk in vat;
Hoops used in cheese manufacture;
One-half of a block of Feta cheese,
removed from a hoop after overnight
draining (cheese before brining) .

109
usually absent in milk and cheese, which indicated that satisfactory hygienic
conditions were maintained during manufacture of cheese. Details of total
microbiological counts have been described later (Chapter 6.3.2).
(ii) Sensory evaluation: Feta cheeses were generally found acceptable by the
sensory panel .
(iii) Type of SMP: Low heat, medium heat and high heat SMP were used for
making Feta cheese. With the use of high heat SMP the curd was extremely soft
and difficult to handle, too many fines were lost in whey, and the moisture in
cheese before brining was about 60%. The problem was less severe with medium
heat SMP. There was no such problems with the use of low heat SMP and
moisture content in cheese before brining was around the desired value of 52%.
(iv) Cutting of curd: With two cuts, too many curd-fines were lost into whey and
the moisture content of cheese before brining was slightly high (54.0% ) . With
three standard cuts, the moisture dropped to about 52.0% and fewer fines were lost
to whey.
(v) Curd size: When the curd was cut with 9 mm knives the moisture in cheese
was lower, i.e. 48 - 50%. This was overcome by using 12 mm knives.
(vi) Brining time: Typical data on the effect of brining time and block size on
S /M in cheese, and consequently on exudation is presented in Table 6. 1. The
effects are similar to findings on Gouda cheese (Geurts et al., 1980) in that the
duration of brining affected the salt uptake, the water content and weight loss. The
period of brining was chosen as 22 h for block sizes of (100 X 100 X 50) mm.
Amount of exudate decreased with increase in brining time probably because of
reduced moisture content in cheese.

Table 6 . 1
Brining
time
h
1 10
Effect of brining time on the salt content and
exudation of Feta cheese
Approximate Moisture Salt S/M Exudate amount
block s i z e a fter 7 weeks
mm � 0 � 0 � 0 gjkg cheese - - - - - - - - - - - - - - - - - - - - - - - - - - - - - - - - - - - - - - - - - - - - - - - - - - - - - - - - -
4 8 2 0 0 X 1 0 0 X 5 0 4 9 . 0 5 . 56 11 . 3 4 4 . 9
2 8 2 0 0 X 1 0 0 X 5 0 5 2 . 9 4 . 65 8 . 8 4 9 . 5
2 4 2 0 0 X 1 0 0 X 5 0 5 6 . 1 3 . 8 8 6 . 9 7 4 . 8
2 2 1 0 0 X 1 0 0 X 5 0 5 1 . 0 4 . 3 4 8 . 5 n . d .
n . d . = not determined
(b) Aspects related to exudation
(i) Effect of variation in size of cheese block on exudation: The exudation was
expected to be influenced by the geometric constraints of the curd, like surface area
and distance over which the exudate has to flow. Variation of size had a slight
effect on the amount of exudate during the early stages of storage, but this was not
detected with increase in storage time (Table 6.2).
Table 6 . 2
Weight of
block ( g )
1 5 5 0
8 7 4
Effect o f variation i n s i z e of cheese block on
the exudation of whey from Feta cheese
Amounts of exudate ( gjkg cheese) at 10 ° C
7 days
9 . 7
11 . 4
3 5 days 7 7 days 1 0 5 days
2 0 . 6
2 2 . 9
3 4 . 2
3 4 . 3
4 1 . 3
4 1 . 2
Note : Data presented above is a typical example . A number
of such trials were carried out and the trend in the results
were s imilar .
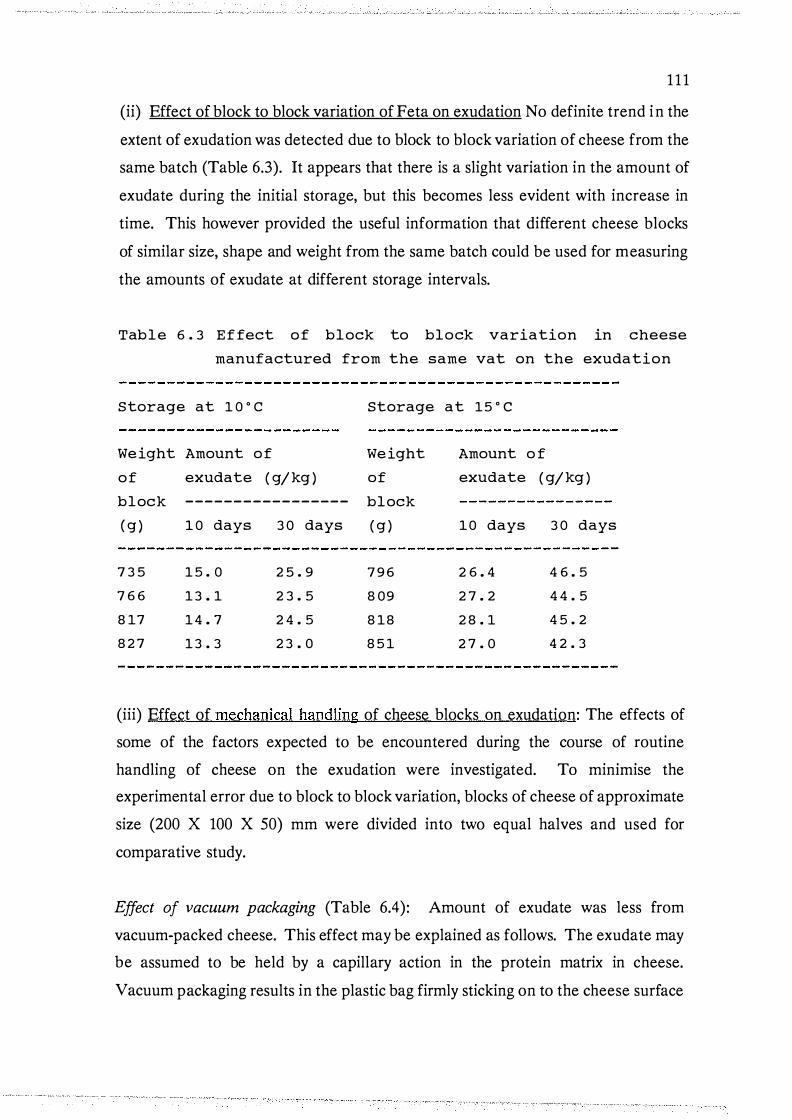
1 1 1
(ii) Effect of block to block variation of Feta on exudation No definite trend in the
extent of exudation was detected due to block to block variation of cheese from the
same batch (Table 6.3). It appears that there is a slight variation in the amount of
exudate during the initial storage, but this becomes less evident with increase in
time. This however provided the useful information that different cheese blocks
of similar size, shape and weight from the same batch could be used for measuring
the amounts of exudate at different storage intervals.
Table 6 . 3 Effect of block to block variation in cheese
manufactured from the same vat on the exudation
Storage at 1 0 o c
Weight Amount of
of exudate ( gjkg )
block -----------------
( g )
7 3 5
7 6 6
8 17
8 2 7
1 0 days 3 0 days
1 5 . 0
1 3 . 1
14 . 7
1 3 . 3
2 5 . 9
2 3 . 5
2 4 . 5
2 3 . 0
Storage at 15 ° C
Weight
of
block
( g )
7 9 6
8 09
8 18
8 5 1
Amount o f
exudate ( gjkg )
10 days 3 0 days
2 6 . 4
2 7 . 2
2 8 . 1
2 7 . 0
4 6 . 5
4 4 . 5
4 5 . 2
4 2 . 3
(iii) Effect of mechanical handling of cheese blocks on exudation: The effects of
some of the factors expected to be encountered during the course of routine
handling of cheese on the exudation were investigated. To minimise the
experimental error due to block to block variation, blocks of cheese of approximate
size (200 X 100 X 50) mm were divided into two equal halves and used for
comparative study.
Effect of vacuum packaging (Table 6.4): Amount of exudate was less from
vacuum-packed cheese. This effect may be explained as follows. The exudate may
be assumed to be held by a capillary action in the protein matrix in cheese.
Vacuum packaging results in the plastic bag firmly sticking on to the cheese surface

1 12
and thereby blocking the openings at the ends of the capillaries. This restricts the
outward flow of exudate. The concept of plastic layer sticking to the opening of
capillaries and restricting the release of exudate was experimentally verified by
providing space between the cheese and the plastic bag. Free space was artificially
created around cheese by wrapping it with cheese cloth or cleaning pads before
vacuum packing. Large amounts of exudate were released (Table 6.5). In addition
to the advantage of reducing the extent of exudation from cheese, vacuum
packaging of cheese was considered a necessity for reasons of controlled microbial
activity and increased shelf-life of the cheese.
Unpacking and repacking of cheese in vacuum each day significantly affected the
amount of exudate released (Table 6.5). This implied that one block of cheese
could be used only once for determining the amount of exudate.
Table 6 . 4
Treatment
No vacuum
Vacuum packed
E ffect of vacuum packaging on the exudation of
whey from Feta cheese
Amount of exudate ( gjkg cheese )
Storage at 10 ° C storage at 15 • c
1 0 days 3 0 days 10 days 3 0 days
3 1 . 8
18 . 0
3 3 . 2
3 0 . 4
6 1 . 6
4 2 . 9
7 4 . 2
5 8 . 6
Turning and piling (Table 6.5): Turning and piling cheese blocks (one on top of
another) over a period of two weeks did not affect the exudation.
Thermal shock: Thermal shock provided to the cheese by shifting the product from
10 o C to 20 ° C for 30 min every day resulted in an increase in the amount of
exudate (Table 6.5). The product is expected to have thermal shocks during
transfer at different stages after manufacture, such as during transportation from

1 13
factory to retail outlet and then to the consumer. These results are consistent with
the observation that exudation occurs during shipment of Blue cheeses, particularly
when temperature fluctuations occur (Pedersen et al., 1971).
Table 6 . 5
Treatment
Effect of miscellaneous factors on the exudation of whey from Feta cheese
Amount o f exudate ( gjkg cheese) after 1 wk of storage at 1 o • c
Control 11 . 1 5 Cheese cloth wrapped between vacuum-packed cheese and plastic pouch 7 1 . 4 2
Control 2 4 . 1 6 Cleaning pad wrapped between vacuum-packed cheese and plastic pouch 1 3 9 . 57
Control 1 0 . 3 7 Vacuum-packed cheese unpacked and vacuum packed on 3 rd and 5th days 17 . 0
Control 14 . 68 Turning/pil ing every day 14 . 58
Control 2 0 . 5 1 Pack left at 2 o • c for 3 0 min every day 2 3 . 77
( iv ) Effect of fat content in cheese on exudation: A decrease in the amount of
exudate was observed in cheese with increased fat content (Table 6.6).
Table 6 . 6 Effect of fat content in cheese on exudation
Age of cheese
(weeks )
1 7
1 5
Amount of exudate ( gjkg cheese) a t 1 o • c
Control ( 2 3 % )
8 . 7 3 0 . 2 4 7 . 7
High fat ( 2 9 % }
6 . 8 2 2 . 6 3 5 . 0
( v ) Effect of storage temperature on exudation: Increase in storage temperature
increased the amount of exudate obtained from cheese during storage (Table 6.7).
This effect may be the result of a variation in solid fraction of fat due to variation

1 14
in storage temperature (MacGibbon & McLennan, 1987), or decrease in water
sorption by milk proteins with increasing temperatures (Kinsella & Fox, 1987). The
mechanism of increase in the amount of exudate with increased storage
temperature may be somewhat similar to the increase in syneresis in renneted gels
with increase in temperature during cheese manufacture (Dijk, 1982; Walstra &
Vliet, 1986). Increase in storage temperatures in this range has an increasing effect
on proteolysis (Lawrence et al., 1987). It is likely that exudation and proteolysis
are interrelated.
Table 6 . 7 Effect of storage temperature and storage t ime on exudation of whey in Feta cheese ( Composition of cheese : 2 3 % fat , 5 0 . 7 % moisture , 4 . 1% NaCl , pH 4 . 7 )
Age of cheese
(weeks )
1 7 1 5
Amount of exudate ( g per k g cheese )
storage temperature
5 ° C
4 . 7 12 . 8 2 1 . 5
1 0 o c
8 . 7 3 0 . 2 4 7 . 7
2 0 o c
2 5 . 9 6 3 . 6
1 3 7 . 0
(vi) Suitability of measurement of the amount of exudate: It was easy to isolate the
cheese from the exudate and record the weights. Details on measurement of
exudation are provided in Chapter 4.
(vii) Conclusion: Some of the findings of the above study have important
commercial and scientific implications. It appears that the exudate is readily
available for exudation from cheese. The thermodynamic effect helps accelerate
the process of exudation; while the kinetic effect on exudation is impeded by
barriers, such as blockage of the ends of capillaries of the protein matrix and the
presence of fat in the protein matrix. From a commercial viewpoint the
cheesemaker may find it an advantage to be able to pile cheese blocks one over
another. However, it is important to ensure proper vacuum packaging and impart
minimal thermal shocks to the product during transportation and distribution.

1 15
From a scientific viewpoint, it is worthwhile noting that the number of times of
vacuum packaging of the product, particularly every time a plug of cheese is drawn for
sampling , could be contributing to the exudation from cheese.
SECTION TWO
6.3 CHEMICAL, BIOCHEMICAL AND MICROBIOLOGICAL CHANGES IN
FETA CHEESE AND EXUDATE DURING STORAGE AT w o e
The aim of this study was to investigate some of the chemical , biochemical and
microbiological changes in Feta cheese during storage at W°C.
6 .3 . 1 Experimental: Cheese was manufactured as described in Chapter 6 .2 . 1 .
Cheese samples were drawn at the required storage interval . Usually one whole block
of cheese was grated and a representative sample was drawn for analysis . Exudate
from cheese was centrifuged at 3 , 000 rpm at 4 o C for 5 m in and filtered through
Whatman filter paper (No. 4 1) prior to analysis . Analyses were performed as specified
in the results and discussion . Details on analytical methods are provided in Chapter 4.
6. 3 . 2 Results and discussion
(a) Proteolysis
Urea-PAGE of Feta cheese: The proteolysis of casein proteins in Feta cheese at various
stages of storage is shown in Fig . 6 .3 . Breakdown of a.1-casein and .B-casein during
storage of cheese is shown in Fig. 6 .4 .
The asccasein had undergone substantial degradation by the end of four weeks.
Subsequent breakdown appeared to be much slower in comparison. After twelve weeks
very little of the asccasein remained and further breakdown was very slow. In
contrast, the .B-casein was resistant to proteolysis with very little degradation in the first
seven weeks. This was followed by a slow and gradual breakdown up to 26 weeks.

B-casein
as2-casein
Fig. 6.3
� < � u --, r-gf ·s ...... 1-< .0 s 1 1 1-< <1) � en s .:::: � � en � en 1 1 en � � � en � � � � �
s J2 V)
t\1 <1) <1) <1) <1) <1) <1) <1) <1) <1) t\1 <1) <1) <1) <1) <1) <1) <1) <1) <1)
....... ::: ::: ::: ::: ::: ::: ::: ::: ::: <1) .,..... N � V V) t- 0\ N V) f.l.. .,..... .,.....
Casein proteolysis in Feta cheese during storage at l0°C
(Urea-PAGE). A, B and C are different gels.
<1) <1) ::: \0 N
1-' 1-' 0\

(f) -+-0 o_ L GJ
-+-GJ E 0
-+-
(f) c GJ
-o 0) c (f) :J
-o ())
-+-0 E
-+({) GJ 0 GJ L
<{
1 . 0�--------------------------------�----------------�
•
0 . 8 •
• • 0 . 6 •
• Be t a - c a s e i n
0 . 4
0 0 . 2 A l p h a s 1 - c a s e i n
0 . 0+---,_--�--�---r---+--�--�----r---�--+---+---� 0 5
F i g . 6 . 4
1 0 1 5 20 2 5 3 0 Sto ra g e t i me (w e e k s ) C a s e i n p ro t e i n d e g ra d a t i o n d u r i n g s t o ra g e o f Fe ta c h e e s e ( U re a - PAG E )
....... ....... .._.)

1 18
Nearly half of the ,8-casein was intact in cheese after 26 weeks (Table 6.8). These
results are similar to proteolysis reported for Gouda cheese (Visser &
Groot-Mostert, 1977). Alichanidis et al. (1984) reported that B-casein in Feta
cheese from ewe's milk resists hydrolysis, with a5ccasein hydrolysing rapidly.
Proteolysis in Feta cheese was thus detected in the early stages after manufacture
and continued at least up to 26 weeks of storage. a5rcasein was most susceptible
to proteolysis. ,8-casein was more resistant to proteolysis though it was slowly
degraded at later stages of storage.
Proteins in exudate and their proteolysis
SDS-PAGE on exudates from Feta cheese during storage: Fig. 6.5 shows the proteins
present in exudates at various storage intervals. The exudate contained mostly
whey proteins and virtually no casein proteins. Densitometer plots were used to
measure the area of a-lactalbumin and B-lactoglobulin bands in the gel (Table 6.8).
The areas are relative estimates with arbitrary units. A slight increase in the whey
protein content was detected with increase in storage time. This was probably due
to the release of whey proteins held in the protein matrix into the aqueous fraction.
This may be explained by the gradual weakening of the casein gel matrix due to
proteolysis during storage. Both a-lactalbumin and B-lactoglobulin did not degrade
during this period, and no new bands appeared. It was concluded that the whey
protein fraction was not affected by proteolysis during storage.
HPLC on exudate: Profiles of low molecular weight peptides from exudates at
different storage intervals have been provided in Fig. 6.6. The whey protein
fraction ( 10,000 - 50,000 daltons) appears to have had little change all along this
period. The peptides below molecular weight 5,000 daltons were presumably casein
fragments. There was a gradual increase in the peptides in this lower molecular
weight range, and the breakdown products seem to contain di- and tri-peptides, and
amino acids. The protein fractions eluting prior to whey proteins (molecular weight
> 50,000 daltons) are probably serum albumins and immunoglobulins. There is
indication of ongoing casein proteolysis during storage.

0:5z·'-a"yJ.H-..
asl·casem
� ..... 13-casein
· ·
K-casein
13-lactoglobulin
a-lactalbumin
< o::l
I 1 1 l � ·a "8 "' 'g "' Vi
Fig. 6.5
e :;;c VJ
� � � � � � <""� (f) -.::t" VI
� � ["'-- 0\
� <""� �
� VI �
SDS-PAGE on exudates from Feta cheeses of different age.
A and B are different gels. )-\ )-\ \0

Fig. 6. 6
Molecular Weight Olslrlbullon
---1 . . �··
7 week•
. � � 15 weeks _/ \i \ ,
�' ... ., __ - Aft - � IJ V - \ .
26 weeks 1\ j\�_j . .. . · - · 4 - -
52 weeks ·--- f-... k ___ )
71 weeks J\ -·-- . . . .. - · --· · -·'
Molecular Weight Vo � i � � � �
, , \ . •
120
Pattern of distribution of peptides in exudates from Feta cheeses of
different ages (HPLC technique) .

121
Table 6 . 8 Concentration of maj or proteins in Feta cheese and exudate during storage at 1 0 o c
Area ( arbitrary units ) obtained using densitometer
Storage period Feta cheese Exudate from Feta -- - ---- - --- - -------- -- - --- - ------- - - - ---
(weeks ) o:81-casein B-casein o:-la 1 B-l g2
---- - ------ - ------------- -------- - ----------- - --- - ------ -0 0 . 87 0 . 87 n . a . 1 0 . 50 0 . 68 0 . 55 2 0 . 50 0 . 8 3 0 . 67 3 0 . 3 3 0 . 6 6 0 . 56 4 0 . 2 7 0 . 68 0 . 60 5 0 . 2 7 0 . 74 0 . 7 6 7 0 . 2 3 0 . 9 1 0 . 7 1 9 0 . 18 0 . 68 0 . 7 3
12 0 . 14 0 . 63 0 . 69 15 0 . 13 0 . 5 6 0 . 7 1 2 6 0 . 09 0 . 4 0 n . d .
1 = a-l actalbumin ; 2 = B-lactoglobulin ; n . d . = not determined ; n . a . = not appl icable .
n . a . 1 . 3 1 1 . 3 3 1 . 3 2 1 . 3 1 1 . 6 4 1 . 5 9 1 . 5 6 1 . 5 3 1 . 4 9 n . d .
(b) Changes in pH and residual lactose of Feta cheese and exudate during storage
A substantial amount of residual lactose was detected in Feta cheese and exudate
after 26 weeks of manufacture (Table 6.9). The pH of Feta cheese decreased very
slowly during this storage period. These results are in contrast to the reported
findings that lactose in Feta type cheeses disappeared within one month of storage
(Omar & Buchheim, 1983) and the acidity of Feta cheese stored in Cryovac
wrapped cheese stopped increasing after 30 days (Mansour and Alais, 1972).
However, this is consistent with the evidence that lactose persisted for at least six
months in Cheddar cheese with 6-7% S/M (Thomas and Pearce, 1981). The
decrease in lactose content was very slow during storage. This is consistent with
the findings that at high S/M levels (about 6%) in Cheddar cheese, starter
metabolism virtually stopped (Turner and Thomas, 1980). In a study on
'Noordhollandse Meshanger' cheese, Noomen (1977) reported that the pH of
cheese was regulated by the growth of very slow-producing lactic acid bacteria,
whose activity depended upon the salt to moisture ratio in cheese. Here it is very
unlikely that any of the lactic organisms would have survived the low pH and high

122
salt concentration for such a long time except for the lactobacilli strain
(Lactobacillus casei) and the non-starter lactic acid bacteria (NSLAB). Anon.
( 1969b) determined that after two months of manufacture Feta cheese made with
Lactobacillus casei strain had much higher total counts than Feta cheese made
without it. This showed the ability of Lactobacillus casei to survive in conditions
of high acid and low pH.
Table 6 . 9 Res idual lactose in Feta cheese and exudate at different storage intervals
Storage time
Before brining After brining
4 weeks 9 weeks
15 weeks 2 0 weeks 2 6 weeks 5 2 weeks 7 7 weeks
Feta cheese
Lactose pH (mM/kg)
4 8 . 0 4 . 8 4 3 8 . 0 4 . 67 3 5 . 7 4 . 64 3 4 . 4 4 . 57 2 4 . 5 4 . 56 2 8 . 1 4 . 5 0 2 7 . 0 4 . 4 8 n . d . n . d . n . d . n . d .
Exudate of Feta
Lactose pH (mM/kg )
n . a . n . a . n . a . n . a . n . d . 4 . 64 6 7 . 5 n . d . 57 . 6 4 . 54 n . d . n . d . 4 7 . 6 4 . 4 4 4 6 . 1 n . d . n . d . 4 . 2 0
n . a . = not app l icable ; n . d . = not determined
It was hypothesised that metabolism of residual lactose to lactic acid could be
contributing to the slow decrease in pH during storage. An experiment was carried
out to check if the drop in pH of cheese during storage was proportional to the
presumed conversion of lactose to lactic acid. Feta cheese after brining was grated
and aliquots of this (20 g) were mixed with increasing amounts of lactic acid of
known concentration at 20 o C. The corresponding changes in pH values were
measured. To negate the effect of water present in lactic acid, equal quantities of
milli-Q2 water were added to aliquots of cheese, and the corresponding change in
pH were measured. The net difference in pH values obtained were plotted against
the added lactic acid (Fig. 6.7). The curve in the normal pH range for Feta cheese
(4.7-4.3) was nearly a straight line. The buffering capacity of curd, largely
2 Water is purified by reverse osmosis and Milli-Q treatment (Millipore Corporation, Bedford, MA).

Q) (/)
Q)
Q) ..c () 0
-+-Q) u._ '+-0
I 0.
123
4.80 -,----------------------------,
4 . 6 0 0
0
4 . 40
4.20
4.00 -j---t--+--+--+--+--+--+--+--+--+--+--+----+--+----l 0 . 0
0 . 0
0 . 0
0 . 3 0 . 6 0.9 1 . 2 1 . 5 V o l u m e o f 0 . 9 8 5 M La c t i c a c i d a d d e d ( m l )/ 2 0 g c h e e s e
1 5 .2 30.5 45. 7 6 0 . 9 E q u iv a l e n t l a c tic a c i d a d d e d ( m M / k g c h e e s e )
3 . 8 7 . 6 1 1 . 4 1 5. 2 E q u iv a l e n t l a c t o s e i n c h e e s e ( m M /k g )
7 6 . 1
1 9 . 0
F i g . 6 . 7 C h a n g e i n p H o f Fe ta c h e e s e ( a fte r b ri n i n g ) w i t h a d d i t i o n o f l a c t i c a c i d .

124
determined by the protein and the phosphates present (Lawrence and Gilles, 1987),
was very low due to a reduced pH and reduced mineral level in the cheese. Using
this curve it was estimated that the lactic acid formed as a result of the decrease
in quantity of lactose in cheese over six months of storage would have lowered the
cheese pH slightly more than the observed decrease. This 'reduced decrease' in pH
may be attributed to the formation of proteolytic breakdown products like
ammonia (Fox, 1989), which neutralises some of the effects of lactic acid.
(c) Formation of lactates in Feta cheese and exudate during storage (Table 6.10):
Detection of lactates in stored cheese and exudate indicated the metabolism of
lactose to lactic acid by the microbial flora. Starter bacteria produce only
L-( + )-lactate. Conversion of L-( + )- to D-(-)- lactates represents racemisation and
indicates the presence of non-starter lactic acid bacteria (NSLAB). 90% of the
lactates present in Feta cheese obtained from a commercial source were in D-form,
suggesting growth of adventitious bacteria (Thomas & Crow, 1983). However, in
this experiment both Feta cheese and exudate contained negligible amounts of D-(
)-lactate while most of the lactates were present as L-( + )-Lactate. This suggested
that NSLAB were not active in cheese. Even if NSLAB were present in cheese,
they were probably inactive due to the high salt concentration and low pH of
cheese.
Table 6 . 10 Quantity of lactates present in Feta cheese and exudate at varying storage intervals (mM/kg )
Storage time
Lactates in Feta cheese Lactates in exudate
L- ( + ) D- ( - ) Total L- ( + )
BB1 114 . 9 1 . 7 116 . 6 n . a . 3 days 1 04 . 7 1 . 9 1 0 6 . 6 n . d . 4 weeks 1 0 5 . 7 2 . 3 1 08 . 0 n . d . 9 weeks 1 07 . 0 2 . 5 1 09 . 5 2 07 . 5 2 6 weeks n . d . n . d . n . d . 19 1 . 9 5 2 weeks n . d . n . d . n . d . 2 3 4 . 2
1 BB = Before brining ; n . d . = not determined ; n . a . = not applicable .
D- ( - ) Total
n . a . n . a . n . d . n . d . n . d . n . d . 2 . 6 2 10 . 0 9 . 2 2 0 1 . 1 7 . 8 2 4 2 . 0

125
(d) Citrates and acetates in Feta cheese and exudate (Table 6.1 1) : The quantity of
citrates present in Feta cheese and exudate are comparable to the 0.2% w jw
( 6.8 mM/kg) citrates normally present in Cheddar cheese curd (Thomas, 1987).
The quantity of citrates did not decrease and the acetates did not increase with
increase in storage time. This supports the earlier proposed view that NSLAB were
not active. The level of acetates present in Feta cheese were in contrast to reports
that acetic acid is abundantly available in pickled Feta type cheeses (Efthymiou &
Mattick, 1964; Efthymiou, 1967; Ada, 1987).
Table 6 . 11 Quantities of acetates and citrates present in Feta cheese and exudate during various storage intervals (mM/kg )
Storage time
8 weeks 15 weeks 2 0 weeks 2 6 weeks 5 2 weeks
Feta cheese
Citrate Acetate
n . d . n . d . 7 . 8 1 . 6 8 . 5 2 . 7 7 . 3 1 . 3 n . d . n . d .
n . d . = not determined
Exudate
Ci trate Acetate
5 . 1 2 . 6 6 . 0 1 . 3 4 . 1 2 . 5 5 . 9 7 . 6 5 . 4 3 . 0
(e) Microbial counts in Feta cheese: In Cheddar cheese a decrease in pH is observed
up to 7 - 10 days after manufacture due to the fermentation of lactose to lactic acid
(Turner & Thomas, 1980), followed by an increase in pH due to release of proteolytic
breakdown products like ammonia (Fox, 1989). However, in Feta cheese a slow and
gradual decrease of pH during storage at 10 ° C was detected up to at least six months,
even though there was evidence of proteolysis during this period. The explanation for
this could be metabolism of residual lactose by starter bacteria or NSLAB. Evidence
of presence of residual lactose and formation of lactates in stored Feta cheese partly
supported this concept. It was necessary to prove the presence of viable bacteria
capable of fermenting lactose to lactic acid in conditions of high salt in moisture
(S/M) concentration and low pH of Feta cheese. The following experiment was
performed to find evidence for this.

126
Starter bacte1ia (Lactococcus lactis subsp. cremoris strains - 2 % , Streptococcus
thermophilus - 0 . 1 % and Lactobacillus casei - 0. 1 %) used during cheesemaking were
individually inoculated in selected media to determine the growth patterns. Growth of all
three starter bacteria took place in M17 broth at 30°C incubated for 2 days. Growth in
MRS (pH 5 . 3) at 30°C in anaerobic conditions for two days was limited to only
Lactobacillus casei. M17 broth and MRS (pH 5 . 3) were therefore used to estimate the
total counts and Lactobacillus casei counts respectively in cheesemilk and cheese
(Table 6. 12) .
Total microbial counts and Lactobacillus casei counts in cheesemilk had multiplied by 4-6
generations and 2-3 generations respectively in cheese (before brining) . Thereafter, there
was a rapid decrease of streptococci and only a slow decrease in Lactobacillus casei until
two weeks. By four weeks the bulk of the total microflora appeared to be only
Lactobacillus casei (or NSLAB) .
There was growth of starter bacteria during the manufacture of cheese but growth of
Lactobacillus casei was less. The streptococci did not survive for long in cheese after
brining while the Lactobacillus casei strain was able to survive during storage at 10°C in
conditions of high salt and low pH. This may be primarily responsible for the proteolysis
of large casein peptides arising from the enzymatic action of rennet. Lactobacillus casei
also probably metabolises lactose to lactic acid. It is likely that the activity of
Lactobacillus casei is very low due to conditions of high salt and low pH. This may
explain the gradual decrease in pH of cheese with increase in storage time. The
production of lactic acid by NSLAB can not be ruled out, particularly because the growth
of NSLAB has been shown to dominate at a concentration of 6 % SIM in Cheddar cheese
(Turner & Thomas, 1 980) . However, the high S/M ( > 9 . 0%) and low pH of cheese that
inhibits the growth of starter bacteria would also be expected to inhibit the growth of
NSLAB (Lawrence & Gilles, 1982) . Tests on lactates, acetates and citrates have shown
that NSLAB is unlikely to be active.

127
Table 6 . 12 Microbial counts in cheesemilk and Feta cheese ( during storage)
Particulars
Inoculated milk ( cfu/ml )
Total counts o f starter bacteria in M 17 broth ( 3 0 ° C/ 2 days )
I I I
2 . 2X10⁷ 1 . 3X10⁷
Adj usted milk sol ids in milk8 ( c fu/ml ) 6 . 7X10⁷ 4 . 0X107
Cheese before brining ( cfu/g ) 1 . 2X10⁹ 2 . 8X10⁹
Cheese/ 3 d ( cfujg) 2 . 3X10⁸ 3 . 5X10⁸
Cheese/ 16 d (cfu/g ) 3 . 1X10⁶ 1 . 3X1 07
Cheese/ 2 8 d ( cfuj g ) 1 . 6X10⁶ 5 . OX106
Cheese/ 6 6 d ( cfu/g ) 1 . 8X10⁶ 1 . 8X10⁵
Cheese/ 124 d ( cfu/g ) n . d . 1X10⁵
Estimate of Lactobaci l l i counts in MRS broth ( pH 5 . 3/ 3 0 ° C/2 daysjanaerobic )
I I I
2 . 1X10⁵
4 . OX105
3 . 5X10⁶ 1 . 2X10⁶
2 . 2X1 06 1 . 2 X 1 06
1 . 5X10⁶ 9 . 5X10⁵
1 . 1X1 06 2 . OX105
8 . 5X10⁴ 1 . 6X10⁵
n . d . n . d .
a The microbial counts in milk have been increased in proportion to the sol id levels in cheese ( before brining ) for a better comparison ; n . d . = not determined .
(f) Water activity (Aw) : Aw of Feta cheese and its exudate were identical. This
indicated that the exudate was in equilibrium with the aqueous phase of cheese.
Marcos et al. ( 1981) reported that the Aw of soft cheeses with a moisture content
above 40% can be predicted from the NaCl molality (M) in the total water of the
product by the equation Aw = 1 - 0.033 M. Using this equation the Aw of cheeses
were determined and were found to be greater than the estimated values (Fig. 6.8).
The lower values of the Aw of Feta cheese may be attributed to the formation of
low molecular weight protein breakdown products due to proteolysis. Aw of the
cheeses mostly ranged from 0.9 1 1 to 0.943 during storage. In comparison, reported
values of Aw in other cheeses are: processed Cheese = 0.93, natural Cheese = 0.93,

0 . 9 70 1 ·· · ······· ... ... . t
• ····• ········ ··· ····· .. ... .. . · • ···· · .. . . f 0 9 5 0 f
� 0 . 9 3 0
I 3 l 0 . 9 1 o
I
0 0
0 E s ti m a t e d va I u e
·· . .. ··· .... ....... .
0 0
. ... · •··· ....• '-···. ... .
128
• P re d i c t e d v a l u e ( M a rc o s et a l . , 1 9 8 1 )
0 . 8 9 0 +�----�------L-----+-----�----�----�------�--� 6 . 0
F i g . 6 . 8
8 . 0 1 0 . 0 1 2 . 0 S a l t - i n - m o i s t u re ( % )
R e l a t i o n s h i p b e tw e e n w a t e r a c t i v i ty a n d s a l t - i n - m o i s t u re i n F e ta c h e e s e .
1 4 . 0
Note: Th e predicted line is based on the findings of Marcos et al. (1981). They
reported that the water activity (Aw) of soft cheeses with a moisture content above
40% can b e predicted from the NaCl molality (M) in the total water of the product
by the equation Aw = 1 - 0.033 M.

129
Muenster cheese = 0.94, Swiss cheese = 0.94, Provolone cheese = 0.92, 8% NaCl
= 0.95, 12% NaCl = 0.92 (Troller & Christian, 1978).
No relationship between the estimated values of � and age of the Feta cheese
could be established. A number of factors may contribute to � of cheese.
Increase in soluble nitrogen with proteolysis of cheese would decrease � provided
that the breakdown products are of very low molecular weight. � generally tends
to decrease with decreasing moisture in cheese (Marcos et al., 1983). A decrease
in moisture content of cheese due to exudation should therefore reduce the �·
However, with proteolysis some of the water bound to the protein may be released.
This may lead to an increase in free moisture. The increase in available free water
is expected to increase the �· It is therefore difficult to predict the net effect on
� of Feta cheese during storage.
Relationship between Aw and S/M: Estimated values of � of Feta cheese and
their respective S/M ratios were inversely related regardless of the age of the
cheese (Fig. 6.8). The correlation coefficient (r) was - 0.979 (constant = 0.99, slope
= - 6. 34 ). Thus NaCI content of the cheese influenced the � more than other
solubles.
(g) Differential Scanning Calorimetry on Feta cheese
Cheese contains water in various states ranging from that entrapped in pores and
cavities within the cheese to that tightly bound to charged groups in the protein.
Water which is tightly bound to charged or polar groups within the cheese will be
highly ordered and will not freeze when the temperature is lowered. Typically
proteins bind around 50 g water per 100 g protein. Only the water entrapped in
the gels or loosely associated in the protein matrix is available for exudation. It is
of interest to know whether there is a change in the proportions of the various
types of water as the cheese ripens.
Differential Scanning Calorimetry (DSC) has been used to determine the
unfreezable water in caseins (Ruegg et al., 1974), whey protein concentrates (Berlin
et al., 1973), soy proteins (Muffett & Snyder, 1980) and several model systems

130
(Ross, 1978). No previous study appears to have been reported on application of
DSC to estimate the unfreezable water in cheese. In the present study the DSC
was applied to Feta cheese and its exudate to determine the amount of unfreezable
water.
The reproducibility of the calorimetry was tested with 8 replicates from the same
lot of grated cheese. The results are reported in Table 6.13.
Table 6 . 13 Reproducibi l ity of DSC analys is of Feta cheese
Range
Mean
S . D .
Heat transfer8
Jjg cheese f . p . m . p .
Warming Cooling K K
8 5 . 0 -
9 4 . 7
8 8 . 6
2 . 8
9 2 . 0 -
1 00 . 0
9 5 . 1
2 . 5
2 5 0 . 0 - 2 4 0 . 0 -
2 5 2 . 2 2 3 6 . 3
2 5 1 . 3 2 3 8 . 2
0 . 7 2 1 . 3
a Latent heat transfer for phase conversion of water in cheese;
b Temperature at which heat transfer is maximum;
Pea k
temp . b
K
2 69 . 1 -
2 68 . 1
2 68 . 6
0 . 3 2
m.p. = melting point; f.p. = freezing point; S.D. = Standard deviation.
Feta cheese was subjected to two rates of cooling, 5 K/min and 10 K/min, to
determine if supercooling was occurring. The two rates of cooling produced
identical thermograms which suggests that supercooling does not occur. For
convenience, the samples were cooled at 10 K/min.
Details of the method used for analysis are described in Chapter 4. A typical DSC
thermogram for the heating of Feta cheese is shown in Fig. 6.9. The area under
the curve represents the total amount of energy required for warming the cheese

" 0 0 z w
1 . 511 --NORMALIZED FETA .. ""' 4 WEEI<S OLD WT: 1 1 . 32 mg '""' S C A N R A T E : 5 . 00 d e'�m i n - - - - % SOLID
PEAK FROM: 238 . 89
TO: 274
J/GAAM: 98 . 74
TEMP
268 . 7
% 22 . 3
' \ '
\ I
\
HAX: 268 . 59
I
\ ' (/} 0 . 75 -·-1-1-<t: 3: :L
\ I
\ I __ \�
\ I \ I \ ' \ '
0 . 00 2 220 . 00 230 .00 2�0 . 00 250 . 00 260 . 00 270 . 00 00 . 00 2!10 . 00 300 . 00 310 . 00
Fig. 6. 9
TEMPERATURE (I<) DSC thennogram showing a typical heating phase (220 K - 285 K)
of Feta cheese.
DSC
t-" w t-"

132
from 220 K to 285 K. The sharp rise in energy is attributed to the latent heat
required for phase conversion of ice to water in the cheese. The latent heat for the
phase conversion was calculated from the area of the peak above the extended
baseline. The heat required to convert ice to water is 333.5 Jfg. The measured
value was 331 .8 indicating that the DSC has been correctly calibrated. Energy
requirement for phase changes for other components in cheese, particularly fat, is
negligible in the range 220 - 290 K. It is assumed that the amount of unfreezable
water in cheese can be calculated directly from the amount of heat energy
absorbed, given that 333.5 J is required to melt 1 g of ice.
Effect of water soluble components: Investigations on the effect of major
components in exudate on the amount of freezable water were carried out. The
extent to which the components contribute to the amount of the unfreezable water
is shown in Table 6 .14 . Polyethylene glycol (molecular mass 20,000 daltons) was
used as a substitute for protein breakdown material. The unfreezable water in
simulated exudate solution (Table 6. 14) is considerably less than the unfreezable
water in the actual exudate (Table 6. 15). The simulated exudate solution failed to
match the actual exudate. This may be attributed to the presence of protein
breakdown material of variable molecular mass, mostly lower than 20,000 daltons,
in the exudate. It is apparent that the low molecular weight protein breakdown
material increase the unfreezable water in Feta cheese.
Table 6 . 14 Results from the DSC thermograms on the study of effect of maj or components in exudate : heating phase
Particulars
Mil l i-Q water Lactic acid ( 1 % ) Calcium lactate ( 1% ) Lactose solution ( 1 . 8% ) NaCl solution ( 9 % ) SES without PEG8 SES with PEGb
m . p . ( K) Latent Unfreez able
2 7 3 . 3 2 7 2 . 3 2 7 1 . 3 2 7 2 . 3 2 5 1 . 5 2 49 . 0 2 4 9 . 1
heat (Jjg ) water ( % )
3 3 1 . 8 3 08 . 8 3 14 . 7 3 10 . 6 2 87 . 5 2 5 3 . 4 2 3 2 . 3
0 . 5 6 . 5 2 . 5 5 . 2 5 . 3
1 0 . 6 14 . 6
Mil l i-Q water : Water filtered by reverse osmosis and Mill ipore treatment ; SES : S imulated exudate solution ; 8 Moisture = 8 5 % ; b Moisture = 8 1 . 6% .

133
Effect of storage time : Proteolysis is expected to increase the unfreezable water
because of the production of the low molecular weight protein breakdown material
and the water-binding properties of the newly formed amino and carboxyl groups.
The results of DSC analyses on Feta cheese and its exudates at different periods
of storage are reported in Table 6. 16 and Table 6.15, respectively. The effect of
aging on the unfreezable water in cheese and exudate is shown in Fig. 6. 10. The
amount of unfreezable water increased with aging of cheese. The results are not
conclusive because of lack of sufficient data points and experimental errors. The
major source of experimental error appears to have been in drawing a
representative sample of 10 mg from Feta cheese, which is not homogeneous.
Another source of error is the estimation of the peak limits in the thermogram for
determination of area. It is difficult to detect the cut-off points at the base-line as
the peak becomes broader, particularly in complex mixtures as that of Feta cheese.
As a result the areas tend to be underestimated. A slight decrease of unfreezable
water in exudate up to about 20 weeks of storage may have· been due to a
corresponding decrease in salt-in-moisture concentration. It is probable that the
low molecular weight protein breakdown material has an effect on the unfreezable
water only after being reduced to a specific size. Such reductions may be occurring
after about 20 weeks of storage of cheese. No definite relationship could be
established between the unfreezable water and the amount of exudate released.
The amount of unfreezable water in cheese is markedly higher than in exudate.
The exudate is in equilibrium with the aqueous phase of cheese as evidenced by
their similar water activities (reported earlier in this section). Thus, the effect of
water soluble components on the unfreezable water may be assumed to be identical
both in exudate and cheese. The higher amount of unfreezable water in Feta
cheese in comparison to that in exudate may therefore be attributed to the water
bound to the casein gel.
The freezing points of cheeses of varying ages were also estimated using the DSC
thermograms. The changes in the freezing points were small and a definite trend
in their relationship was not detected. More detailed study is required to establish
the application of DSC technique with cheese.

Table 6 . 15
Age o f cheese from which exudate was obtained
4 weeks 14 weeks 2 6 weeks 6 5 weeks
Table 6 . 16
Age o f cheese
1 day 4 weeks
15 weeks 2 6 weeks 3 3 weeks
Results from the DSC thermograms on the study of exudates from Feta cheese of varying ages - heating phase
Composition of exudate
Moisture NaCl S/M
% % %
8 2 . 4 8 1 . 6 8 2 . 0 8 1 . 5
9 . 98 9 . 61 7 . 53 7 . 02
12 . 1 11 . 8
9 . 2 8 . 6
m . p . ( K) 2 4 0 . 8 2 3 8 . 4 2 3 8 . 7 2 40 . 2
Results from DSC thermograms
Latent heat
(Jjg material ) (Jjg water)
2 17 . 4 2 2 3 . 0 2 2 0 . 3 158 . 2
2 63 . 8 2 7 3 . 3 2 68 . 6 193 . 9
Unfreezable water ( % )
2 0 . 9 18 . 1 19 . 5 4 1 . 8
Results from the DSC thermograms on the study of Feta cheese of varying ages
Composition of cheese
Moisture NaCl
% %
52 . 7 3 . 6 4 9 . 9 4 . 2 4 9 . 1 4 . 0 4 9 . 5 4 . 1 4 9 . 2 4 . 1
S/M
%
6 . 8 8 . 4 8 . 1 8 . 3 8 . 3
f . p . ( k)
2 54 . 5 2 50 . 0 2 50 . 8 2 4 9 . 7 2 51 . 0
Results from DSC thermograms
m . p . ( K)
2 59 . 3 2 59 . 3 2 59 . 3 2 58 . 7 2 58 . 0
Latent heat
(Jjg (Jjg material ) water )
107 . 6 2 04 . 2 9 8 . 7 197 . 8 9 3 . 4 1 9 0 . 2 9 6 . 7 195 . 4 8 8 . 0 17 8 . 9
Unfreezable water ( % )
3 8 . 8 4 0 . 7 4 3 . 0 4 1 . 4 4 6 . 4
- - - - - - - - - - - - - - - - - - - - - - - - - - - - - - - - - - - - - - - - - - - - - - - - - - - - - - - - - - - - - - -- - - - - - - - - - - - - - - - - - - - - - - - - - - - - - - - - - - - - -
...... tJ..) -10-

,.--.....
� '-..._./
!...._ (})
-+-0 � (}) -
..0 0 N (}) (}) !...._
'-!-c
=:>
50
t • 45 I - Fe ta c h e e s e
I ..... -------------- • 40
3 5
3 0
2 5
i- - / E x u d a te 2 0
1 5+---�--�---+---4--��--�--+---�--�---r---+--�----�� 0 1 0 2 0 3 0 40 5 0
Sto ra g e t i m e ( w e e k s ) 6 0 7 0
F i g . 6 . 1 0 U n f re e z a b l e w a t e r i n F e t a c h e e s e a n d e x u d a t e d u ri n g s t o ra g e ( e s t i m a t e d u s i n g D S C t e c h n i q u e ) .
........ w Vl

SECTION THREE
6.4 EFFECf OF SELECfED MANUFACTURING VARIABLES
ON EXUDATION FROM FETA CHEESE
136
The effect of selected manufacturing variables on exudation was investigated with
the following objectives:
To determine practical measures to reduce the extent of exudation.
To gain an insight into the mechanism of exudation.
6.4.1 Experimental plan: The selected manufacturing variables chosen for the
study are reported in Table 6.17.
Table 6 . 17 Selective manufacturing variables and their respective level s of variation chos en for studying the effects on exudation of whey from Feta cheese during storage
Treatments
Repl icates First 9 trials Next 9 trial s
Protein t o fat ratio
Homogenisation pressure ( single stage ) ( single stage) ( two stage )
Priming time (min )
Curd pH at draining
Levels
1 2
0 . 56 0 . 7 3 0 . 9 0
( ps i ) a 6 0 0 1 0 0 0 2 0 0 0/ 5 0 0
6 . 1 6 . 2 6 . 3
Reference in the text
A First repl icate S econd replicate
B Low Control High
c Low Control High
D Low Control High
E Low Control High
s Storage time (weeks ) 1 , 3 , 5 , 7 , 9 , 12 , 1 5 , 2 0 , 2 6 , 3 9
a 1 psi = 6.89 kPa; b c d : Corresponding setting times were 60, 45, 30 min, respectively.

137
(i) Basis of selection of manufacturing variables and the levels of variation: The
criteria involved in the selection of variables was that they should be readily
controllable by the cheesemaker. The limiting values of the variables were chosen
with the objective of having maximum variation, so as to clearly detect the effect
on exudation, without however affecting the quality of cheese.
Protein to fat ratio (P /F ratio) : P /F ratio was selected as a variable because the
commercial practice of cheese manufacture is generally based on the
standardisation of casein to fat ratio of cheesemilk. This was expected to provide
evidence about the role of protein, fat, and total solids. A variation of P /F ratio
from 0.58 to 0.90 in cheesemilk resulted in variation of fat content from 4.2 to
6.5% in cheesemilk and 20 to 30% in cheese, respectively.
Homogenisation pressure: The homogenisation process was necessary in order to
prepare 'manufactured cream' using FFMR and RSM. An increase in
homogenisation pressure was expected to decrease the size of fat globules, increase
the total number of fat globules and increase the total area of fat globule surface
in cheese. Variation in homogenisation pressure was expected to provide evidence
on the role of fat globules and the fat-protein interaction on exudation of whey
during storage. The upper limit was arbitrarily chosen as two-stage homogenisation
at a pressure of 13,780/3,445 kPa (2000/500 psi). Single stage homogenisation of
milk at 4,134 kPa ( 600 psi) was chosen as the lower limit of homogenisation
because at a further lower pressure it was difficult to obtain a reasonably good
emulsion of FFMR.
Priming time: A variation in priming time alters the mineral balance of milk
(Creamer et al., 1985). It was intended to study the effect of minerals on the
exudation by variation of priming time. A variation only in priming time would
affect the curd strength, coagulation time and pH of whey at draining; and this
would complicate interpretation of results on exudation. To avoid interactions with
the other factors and determine the effect of priming time per se, cheeses were
made with a fixed total time of priming and setting. A variation in the priming
time, with a fixed total time for priming and setting, did not significantly affect curd
strength (subjective analysis by slicing the curd with fingers) and other

138
manufacturing processes. This was expected to result in nearly identical cheese in
terms of moisture and pH while providing an indication to the effect of the priming
time on the mineral balance and exudation of whey from cheese.
Curd pH at draining: This is an important step in the manufacture of most types of
cheese (Lawrence et al., 1983) as it affects the residual rennet and mineral balance
(Lawrence & Gilles, 1987), residual lactose (Czulak et al., 1969), and moisture in
cheese. Mter cutting, the time taken for attaining curd pH values of 6.3, 6.2, 6. 1
were 50-60 min, 80-90 min and 1 10 - 120 min, respectively.
Storage study: Preliminary studies clearly indicated an increase in the amount of
exudate with an increase in storage temperature. It was therefore decided to have
only one storage temperature, i.e. 10 o C, which is of practical relevance. Selected
periods of storage intervals were chosen as specified (Table 6.17) .
(ii) Statistical design: The experiment was fractional-factorial designed. The trials
were carried out using the combinations of 'low' and 'high' levels of four variables
(P /F ratio, homogenisation pressure, priming time, and curd pH at draining). Each
trial was split at the time of study of the variable 'storage time'. The trials were
conducted with the following variables (refer Table 6.17 for nomenclature):
Control. bcde. BCde. BcDe. BCDE. BcdE. bCdE, bCDe, bcDE
Note: Upper case refers to the higher level and lower case refers to the lower level
for the respective manufacturing variables.
The above trials were replicated twice. Trials in each replicate were randomised.
6.4.2 Experimental: Feta cheeses were manufactured using the procedure
outlined in Section One. The variations were applied as described in Table 6.17.
6.4.3 Analytical methods: 'Manufactured cream' and reconstituted skim milk
(RSM) were tested for fat and protein by the Milko-Scan. Standardised milk and
whey obtained after draining were analysed for fat, protein, lactose, total solids by
the Milko-Scan; and calcium by complexometric method. Feta cheese at four

139
weeks was analysed for pH, fat (Babcock), moisture, protein (Kjeldahl), NaCl
(potentiometric titration), and calcium (complexometric method). Exudate of Feta
cheeses were analysed for total solids, N a Cl (potentiometric method), calcium
( complexometric method) and protein (Kjeldahl). The distribution pattern of
peptides in exudates from four week old Feta were analysed by HPLC. Proteolysis
was determined in control cheese and exudate from Feta cheese at different storage
periods by urea-PAGE and SDS-PAGE, respectively. The amount of exudate were
measured at the selected storage intervals. Details of all the above methods are
outlined in Chapter 4 and Appendix 4.1.
6.4.4 Sensory evaluation: The product was evaluated by a sensory panel at eight
weeks after manufacture for flavour and textural characteristics. Details of these
are reported in Chapter 4.
6.4.5 Results and Discussion
This is described under the following headings:
(a) Composition of milk, whey, cheese and exudate.
(b) Manufacturing aspects and quality of cheese.
(c) Effect of manufacturing variables on exudation.
(a) Composition of milk, whey, cheese and exudate
(i) Composition of standardised milk (or cheesemilk) (Table 6. 18): The milk was
standardised to the desired P /F ratios.
The composition of milks for the replicates were different. This was primarily due
to experimental error involved in standardising 'manufactured cream' and adjusting
the total solids in reconstituted skim milk. While the P /F ratio of milk was
standardised accurately, the level of total solids was not adjusted to a constant
value and this affected the composition of cheese. Ideally, a slightly concentrated

Table 6 . 18 Composition of milks for Feta cheeses manufactured (with respect to manufacturing variables )
Treatment · Fat ( % ) Protein ( % ) Lactose ( % ) TS ( % ) ca2+ (mM/kg ) P/F ratio & levels
LSM F LSM F LSM F LSM F LSM F LSM F
A 3 4 . 8*** 2 6 . 4 * * 8 . 3 7 * 2 1 . 6 2 * * 2 0 . 52 ** 7 . 67 * First 5 . 64 3 . 87 5 . 44 15 . 3 7 3 4 . 9 0 . 7 19 Second 5 . 3 9 3 . 74 5 . 3 2 14 . 87 3 6 . 3 0 . 7 2 7
B 3 105*** 4 6 . 5*** 18 . 57** 3 4 7 . 6*** 2 . 61 1 2 6 3 7 * * * High 4 . 3 5 3 . 89 5 . 47 14 . 12 3 5 . 9 1 0 . 89 Low 6 . 69 3 . 7 1 5 . 2 9 16 . 11 3 5 . 4 0 . 55
c 0 . 3 2 0 . 01 0 . 00 0 . 14 11 . 7 5 * 1 . 64 High 5 . 51 3 . 79 5 . 3 8
. 15 . 09 3 6 . 2 0 . 7 2 5
Low 5 . 53 3 . 8 0 5 . 3 8 15 . 13 3 5 . 1 0 . 72 1
D 0 . 74 0 . 7 9 0 . 03 0 . 29 2 . 3 6 0 . 08 High 5 . 50 3 . 79 5 . 3 8 15 . 09 3 5 . 9 0 . 7 2 3 Low 5 . 54 3 . 8 1 5 . 39 15 . 15 3 5 . 4 0 . 7 2 4
E 1 . 48 0 . 0 1 0 . 00 0 . 2 0 4 . 04 2 . 87 High 5 . 4 9 3 . 8 0 5 . 3 8 15 . 09 3 5 . 3 0 . 7 2 6 Low 5 . 54 3 . 79 5 . 38 15 . 14 3 6 . 0 0 . 7 2 1
Control 5 . 18 3 . 8 0 5 . 34 14 . 7 3 3 5 . 6 0 . 7 3 2
A = Replicates ; B = P/F ratio o f milk ; c = Homogenisation pressure for ' manufactured cream ' ; D = Priming time ; E = Curd pH at draining ; S = Storage time ;
LSM = Least-square mean ; F = F ratio ;
*** p < 0 . 00 1 ; ** p< 0 . 0 1 ; * p < 0 . 05 ; F values without asterisks denote ' not significant ' .
I-" .J>. 0

141
milk with the desired P /F ratio should have been prepared first and then diluted
to the pre-determined level of total solids.
The mean diameter of fat globules in standardised milk decreased with increase in
homogenisation pressure (Table 6. 19).
Table 6 . 19 Effect of variation o f homogenisation pressure
on the mean diameter of fat globules in
' manufactured cream ' ( FFMR + RSM )
Level Homogenisation pressure1 Mean diameter ( �m )
High Two stage ( 2 0 0 0/ 5 0 0 psi ) 0 . 53
Control S ingle stage ( 10 0 0 psi ) 0 . 8 3
Low S ingle stage ( 60 0 psi ) 0 . 99
1 1 psi = 6 . 89 kPa
(ii) Composition of whey (Appendix 6.3) : Most of the treatments did not have any
effect on the composition of whey. Calcium content of whey was slightly higher for
the lower 'curd pH at draining'. This difference was however not detected in
'entire whey' collected over 17 h following draining. This was probably because the
variation in pH of curd at the time of draining was not retained by overnight
draining.
(iii) Composition of Feta cheese at four weeks after manufacture: (Table 6.20)
Fat and moisture contents in the cheese were significantly affected by the process
treatments. High fat content in the cheeses of first replicate was due to a
corresponding high fat in the standardised milk. Variation in protein and fat
contents for the P /F ratio was due to the treatment effect. Increased calcium
content in cheese made from milk with higher P /F ratio was due to the higher
solids-not-fat (SNF) content. When calcium is represented in terms of Ca2+ /SNP
(g/100 g), this difference was not detected.
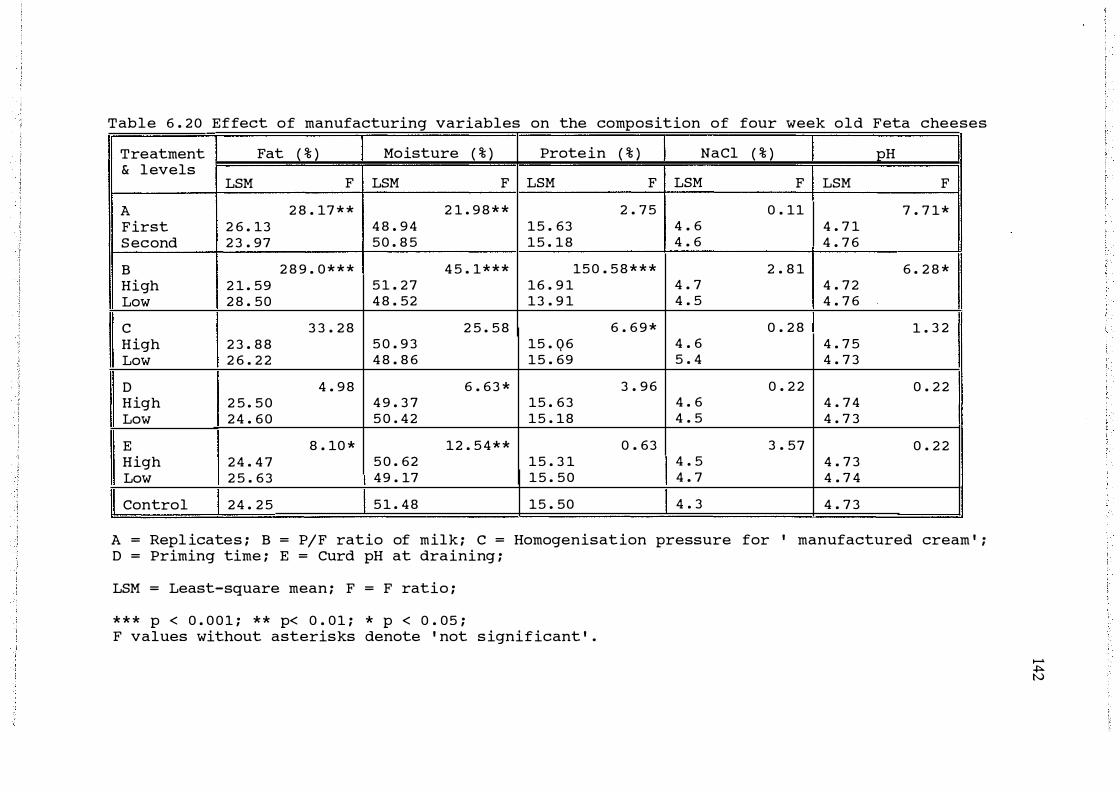
Table 6 . 20 Effect of manufacturing variables on the composition of four week old Feta cheeses
Treatment Fat ( % ) Moisture ( % ) Protein ( % ) NaCl ( % ) pH & levels
LSM F LSM F LSM F LSM F LSM F
A 2 8 . 17 * * 2 1 . 9 8 * * 2 . 75 0 . 11 7 . 7 1* First 2 6 . 13 4 8 . 94 15 . 63 4 . 6 4 . 7 1 Second 2 3 . 97 50 . 8 5 15 . 18 4 . 6 4 . 7 6
B 2 8 9 . 0 * * * 4 5 . 1*** 150 . 5 8 * * * 2 . 8 1 6 . 2 8 * High 2 1 . 59 5 1 . 27 16 . 9 1 4 . 7 4 . 72 Low 2 8 . 50 4 8 . 52 13 . 9 1 4 . 5 4 . 7 6
c 3 3 . 2 8 2 5 . 58 6 . 6 9 * 0 . 2 8 1 . 3 2 High 2 3 . 88 5 0 . 9 3 15 . Q6 4 . 6 4 . 7 5 Low 2 6 . 2 2 4 8 . 8 6 15 . 69 5 . 4 4 . 7 3
D 4 . 98 6 . 63 * 3 . 96 0 . 2 2 0 . 2 2 High 2 5 . 5 0 4 9 . 3 7 15 . 63 4 . 6 4 . 74 Low 24 . 60 5 0 . 42 15 . 18 4 . 5 4 . 7 3
E 8 . 10 * 12 . 54** 0 . 63 3 . 57 0 . 2 2 High 24 . 4 7 5 0 . 62 15 . 3 1 4 . 5 4 . 7 3 Low 2 5 . 63 49 . 17 15 . 50 4 . 7 4 . 7 4
Control 24 . 2 5 5 1 . 48 15 . 50 4 . 3 4 . 7 3
A = Repl icates ; B = P/F ratio of milk ; c = Homogenisation pressure for ' manufactured cream ' ; D = Priming time ; E = Curd pH at draining ;
LSM = Least-square mean ; F = F ratio ;
* * * p < 0 . 0 0 1 ; ** p< 0 . 01 ; * p < 0 . 05 ; F values without asterisks denote ' not significant ' .
....... � N

Table 6 . 2 0 continued
Treatment & ca2+ (mM/kg ) FDM ( % ) S/M ( % ) levels
LSM F LSM F LSM F
A 4 . 78 2 9 . 00** 1 . 4 9 First 8 4 . 1 5 0 . 9 5 9 . 3 2 Second 9 5 . 1 4 8 . 59 9 . 04
B 1 1 . 6 3 * 63 5 . 8** 0 . 13 High 9 8 . 3 44 . 2 4 9 . 14 Low 8 1 . 0 55 . 29 9 . 2 2
c 0 . 01 3 5 . 3 3 * * 1 . 44 High 8 9 . 9 4 8 . 4 6 9 . 04 Low 89 . 4 5 1 . 07 9 . 3 2
D 0 . 06 4 . 00 1 . 7 6 High 9 0 . 2 5 0 . 2 1 9 . 3 3 Low 89 . 0 4 9 . 3 3 9 . 02
E 0 . 59 3 . 96 9 . 7 6 * High 9 1 . 6 4 9 . 3 3 8 . 8 1 Low 87 . 7 5 0 . 2 0 9 . 54
Control 98 . 2 5 0 . 0 8 . 4
A = Replicates ; B = P/F ratio of milk ; c = Homogenisation pressure for ' manufactured cream ' ; D = Priming time ; E = curd pH at draining ; LSM = Least-square mean ; F = F ratio ; *** p < 0 . 0 0 1 ; ** p< 0 . 01 ; * p < 0 . 05 ; F values without asterisks denote ' not significant ' .
MNFS ( % )
LSM F
6 . 4 7 6 6 . 29 6 6 . 92
1 0 1 . 3 ** * 6 5 . 3 7 67 . 84
7 . 2 1* 6 6 . 94 6 6 . 2 8
5 . 62 * 6 6 . 3 2 6 6 . 89
13 . 8 4 * * 67 . 07 6 6 . 15
68 . 0
Ca2+/SNF ( g/ lOOg )
LSM
1 . 3 5 1 . 5 1
1 . 4 5 1 . 4 1
1 . 4 3 1 . 4 3
1 . 4 4 1 . 4 2
1 . 4 6 1 . 3 9
1 . 6 2
F
2 . 8 1
0 . 11
o . oo
0 . 03
0 . 66
....... -+:-. v.>

144
An increase in moisture was detected in cheeses made with 'manufactured cream'
homogenised at a higher pressure. This was possibly due to the increase in the
amount of casein coated to the newly created fat globule surface area (Chapter 8).
Slight variations of fat, moisture, FDM and MNFS for two levels of priming time
may have been due to the variation in gel strength of the coagulum that was not
detected visually during manufacture. There was no effect of 'priming time' and
'curd pH at draining' on calcium contents in Feta cheese and whey. Variation in
priming time did not affect calcium levels possibly due to having a constant total
time of priming and setting. This resulted in a constant draining pH for all the
trials. Lawrence et al. (1983) had suggested that calcium level in Cheddar type
cheeses can be controlled by the priming time. Present findings suggest that
variation in priming time per se (without affecting the draining pH) does not
influence calcium content in cheese. The effect of priming on calcium levels or
mineral balance is due to an effect on draining pH.
Cheese drained at lower curd pH had lower moisture. This is consistent with the
findings of increased syneresis in renneted gels as a function of low pH (Patel et al.,
1972; Walstra et al., 1985; Walstra & Vliet, 1986). Slight increase in S/M ratio in
cheese made with higher curd pH at draining is surprising because normally cheese
with higher moisture would be expected to have a higher S /M ratio ( Geurts et al.,
1980) due to a higher diffusion coefficient.
The statistical analysis shows a significant variation for some of the treatment
variables. However, the variations are small and are not of much practical concern.
(iv) Composition of exudate from four week old Feta cheese (Table 6 .21) : The
composition of exudate was mostly unaffected by the process variables. The effect
of increased protein content at the higher P /F ratio may be attributed to the
treatment itself. Increased NaCl (also high S/M) values for 'lower curd pH at
draining' was due to an increased salt content in cheese.

Table 6 . 2 1 Effect of manufacturing variables on the composition of exudate from Feta cheese after 4 weeks of storage .
Treatment TS ( % ) ca2+ (mM/kg) Protein1 ( % ) NaCl ( % ) S/M ( % ) & Levels
LSM F LSM F LSM F LSM F LSM F A 0 . 7 0 0 . 01 1 . 7 6 0 . 00 0 . 04 First 16 . 29 1 2 2 . 1 2 . 9 8 7 . 7 3 9 . 2 Second 16 . 08 122 . 7 3 . 15 7 . 7 2 9 . 2
B 1 . 9 3 0 . 3 4 8 . 62 * 0 . 19 0 . 3 9 High 16 . 3 7 1 2 0 . 6 3 . 2 5 7 . 7 6 9 . 3 Low 16 . 0 1 124 . 3 2 . 8 8 7 . 69 9 . 2
c 0 . 02 2 . 3 5 0 . 5 1 0 . 05 0 . 05 High 16 . 17 117 . 6 3 . 02 7 . 7 1 9 . 2 Low 16 . 2 1 127 . 3 3 . 11 7 . 74 9 . 2
D 1 . 0 7 0 . 00 0 . 05 0 . 4 9 0 . 58 High 16 . 3 2 122 . 6 3 . 08 7 . 78 9 . 3 Low 16 . 06 122 . 3 3 . 0 5 7 . 68 9 . 1
E 5 . 14 0 . 3 4 0 . 18 2 5 . 8 * * 2 3 . 3 ** High 15 . 9 0 124 . 3 3 . 04 7 . 3 6 8 . 7 I Low 16 . 48 1 2 0 . 6 3 . 09 8 . 10 9 . 7
Control 15 . 8 5 1 2 1 . 7 3 . 3 6 7 . 11 8 . 4
1 This is an estimate of the nitrogenous material in the exudate . Total nitrogen content in the exudate was multiplied by a factor 6 . 38 to obtain this protein content .
A = Replicates ; B = P/F ratio of milk ; C = Homogenisation pressure for ' manufactured cream ' ; D = Priming time ; E = Curd pH at draining ; LSM = Least-square mean ; F = F ratio ; * * p< 0 . 01 ; * p < 0 . 05 ; F values without asterisks denote ' not significant ' .
...... � V1

146
HPLC studies on exudate: The HPLC profiles of exudates did not show much
variation in the nature of peptides and their quantities. This implied that the
pattern of degradation of large peptides in the cheeses were similar. The range of
peptides and their sizes indicated that a steady and substantial proteolysis had
occurred in Feta cheese by the end of four weeks. The whey proteins did not
appear to have undergone any change. It was concluded that the selected
manufacturing variables did not influence the proteolysis.
(v) Composition of Feta cheese at six months (Appendix 6.4) : The major change
detected in all cheeses was the decrease in pH value to � 4.5 when compared to
composition of cheese at four weeks (Table 6.20). The change in pH was however
not affected by the treatment variables. Changes in moisture, MNFS, fat and FDM
were due to the exudation of whey from Feta cheese during storage.
(b) Manufacturing aspects and quality of cheese
(i) Cheese manufacture: Standardised milks made using 'manufactured cream'
homogenised in two stages at pressures of 13,780/3,445 kPa (2000/500 psi) had no
cream layer. The milk appeared satisfactory when manufactured cream was
homogenised at a pressure of 6,890 kPa ( 1000 psi). A thin cream layer was visible
when milk was homogenised at 4,134 kPa (600 psi). Typically, the pH profile
during cheese manufacture was as follows: 6.65 for standardised milk; 6 .54 after
addition of starter, 6.42 at the time of cutting, � 4.9 for cheese before brining, � 4.75 for cheese after brining, and � 4.65 after four weeks of storage. A typical
temperature profile during cheese manufacture was: 34 ° C for cheesemilk, 33.5 o C
after the addition of starter, 33 o C at the time of adding rennet, 32 o C at the time
of cutting, 3 1.5 ° C at stirring and 28-29 ° C at the time of draining whey. When the
P /F ratio was low the curd was softer, the whey had more fines and some curd
floated in whey till draining. Before brining, cheeses made with low curd pH at
draining appeared more elastic and pliable, and cheeses made with high curd pH
at draining were relatively crumbly and brittle. However, these differences were
not detected in cheeses after brining.

147
(ii) Sensory evaluation of Feta cheese (Appendix 6.5): Increased acidity for the
second replicate may be attributed to possible increased microbial activity at a high
moisture in cheese. Cheese made with lower curd pH at draining was perceived
salty which is consistent with the increased salt in cheese. Bitter and oxidised
flavours were mostly not detected as evidenced by the lower scores allotted by the
panel of judges.
Increased smoothness of the cheeses made at lower P /F ratio was due to the
increased fat content. The structure (sliceability) was more crumbly for cheese
made with lower curd pH at draining and the first replicate. This was probably due
to lower moisture in the respective cheeses.
Overall, the cheeses were considered acceptable and their quality not significantly
altered by the manufacturing variables.
(iii) Quality of cheese: The quality of the experimental cheeses was of high
standard, as evidenced from the microbiological results (described earlier in this
Chapter) and the sensory evaluation. This could be attributed to the use of: raw
material of uniform and good quality, active starters of defined strains, sanitised
equipment, clean and hygienic pilot plant facilities, and good process control.
(c) Effect of manufacturing variables on exudation of whey from Feta cheese
during storage: The effect of selected manufacturing variables on the exudation of
whey from Feta cheeses during storage is shown in Table 6.22.
(i) Effect of replicates: The amount of exudate was significantly different between
the replicates (Table 6.22). This variation was probably due to the variation in the
composition of standardised milks and composition of Feta cheeses (moisture,
MNFS and FDM) for the replicates, as discussed earlier in this section. Increase
in the amount of exudate was observed with increased moisture, increased MNFS
and decreased FDM. It was not intended to study the effects of replication as a
variable. However, the results showed an increase in the amount of exudate with
increased moisture and decreased fat contents in cheese. The effect of an increase

148
Table 6 . 2 2 E ffect of manufacturing variables on the exudation8 o f whey from Feta cheeses during storage at l0 ° C
Source Exudate in o f gjkg cheese variation & levels - - - - - - - - - -
LSM F
A First Second
B High Control Low
c High Control Low
D High Control Low
E H igh Control Low
s 1 3 5 7 9
1 2 1 5 2 0 2 6 3 9
3 9 . 9 4 9 . 6
5 1 . 6 4 4 . 2 3 8 . 0
4 6 . 3 4 4 . 2 4 3 . 2
4 5 . 1 4 4 . 2 4 4 . 5
4 9 . 0 4 4 . 2 4 0 . 6
1 5 . 2 2 0 . 5 2 6 . 5 3 2 . 6 3 9 . 8 4 8 . 1 5 5 . 3 6 1 . 1 6 6 . 8 8 1 . 8
Interactions B X S C X S D X S E X S
S . D . 4 . 89
6 . 6 1*
1 8 . 8 * *
0 . 9 6
0 . 04
7 . 18 *
2 4 9 ** *
9 . 2 4 ** * 1 . 0 1 0 . 2 3 3 . 9 1* * *
Exudate in gjkg cheese moisture
LSM F
4 . 9 0 # 7 9 . 8 9 5 . 5
12 . 5 7 * 9 8 . 6 8 4 . 8 7 6 . 8
0 . 2 0 8 9 . 1 8 4 . 8 8 6 . 3
8 9 . 3 8 4 . 8 8 6 . 1
0 . 2 8
5 . 2 6 # 9 4 . 7 8 4 . 8 8 0 . 7
2 7 3 ** * 3 0 . 0 4 0 . 4 5 1 . 9 6 3 . 7 7 7 . 8 9 4 . 2
108 . 3 119 . 6 1 3 0 . 8 1 60 . 2
7 . 4 5 * * * 0 . 55 0 . 3 4 3 . 5 2 * * *
9 . 07
Final MNFS ( % ) in cheese
% reduction in MNFS of cheese
LSM F LSM F
0 . 2 7 4 . 1 6 5 . 9 1 . 3 9 6 6 . 4 1 . 62
6 4 . 8 6 7 . 5 6 7 . 5
6 6 . 5 6 7 . 5 6 5 . 8
6 5 . 8 6 7 . 5 6 6 . 5
6 6 . 6 67 . 5 6 5 . 7
6 6 . 8 6 6 . 7 6 6 . 6 6 6 . 4 6 6 . 3 6 6 . 1 6 5 . 9 6 5 . 8 6 5 . 6 6 5 . 2
1 0 3 * * *
5 . 7 6 #
5 . 3 3 #
1 0 . 1 8 *
1 . 8 2 1 . 3 4 1 . 2 0
1 . 5 0 1 . 3 4 1 . 5 2
1 . 5 6 1 . 3 4 1 . 4 5
1 . 5 9 1 . 3 4 1 . 4 3
13 2 * * * 0 . 4 9 0 . 66 0 . 8 6 1 . 0 6 1 . 3 1 1 . 6 0 1 . 8 6 2 . 09 2 . 2 9 2 . 87
7 . 5 8 * * * 0 . 14 0 . 3 0 1 . 3 0
0 . 15 5 0 . 16 0
3 1 . 4 * *
0 . 0 1
1 . 0 4
2 . 2 5
2 7 3 ***
1 8 . 4 * * * 0 . 2 1 0 . 74 2 . 3 4 *
- - - - - - - - - - - - - - - - - - - - - - - - - - - - - - - - - - - - - - - - - - - - - - - - - - - - - - - - - - - -
a Equations to calculate exudation values are provided in Appendix 4.2; A = Replicates; B = P /F ratio of milk; C = Homogenisation pressure for 'manufactured cream'; D = Priming time; E = Curd pH at draining; S = Storage time; LSM = Least-square mean; F = F ratio; S.D. = Standard deviation; *** p < 0.001; ** p < 0.01; * p < 0.05; # p < 0.10; 'F values without asterisks denote 'not significant'.

149
in the amount of exudate for cheese with increased moisture is consistent with the
findings of Pedersen et al. (1971) who reported that Blue cheeses made with higher
overnight drainage temperature released a reduced amount of exudate due to a
reduction of the moisture in the cheese.
(ii) Effect of 'P IF ratio' (0.56 & 0.90) on exudation: An increase in the amount of
exudate was observed from cheese made using milk at a higher P /F ratio
(Table 6.22). A lower MNFS content in cheese was of no avail. This is in contrast
to the effects of P /F ratio on exudation from Cream cheese (Chapter 5) . Thus
increased available protein in the cheese was not effective in reducing the amount
of exudate during storage of cheese. The two major changes taking place in Feta
cheese during storage are proteolysis and a slow decrease in pH. The effect can
not be attributed to pH because the pH values were similar for all cheeses after six
months of storage (Appendix 6.4 ) . Proteolysis therefore is likely to have caused the
difference in the amounts of exudate. It is possible that proteolysis cleaves the
protein matrix (mainly casein), and the moisture held in the casein gel structure is
released with the solubles as exudate. Increase in the amount of exudate at the
higher P /F ratio may also have been due to reduced fat content (and FDM) in
cheese. It was shown earlier with the replicates that increase in the amount of
exudate was observed in cheeses with an increased MNFS and decreased FDM.
These results are comparable to decreased syneresis in renneted milk gels with
increased fat content (Starry et al., 1983). The role of fat as a mechanical barrier
(Lelievre & Creamer, 1978), or coating of fat globules with casein may be causing
the reduction of the amount of exudate (discussed in Chapter 8).
(iii) Effect of pressure of homogenisation for 'manufactured cream'
(13.780/3445 kPa & 4.134 kPa) on exudation: Exudation of whey from Feta cheese
was not affected by the selected levels of homogenisation for manufactured cream
(Table 6.22). In renneted milk gels Vaikus et al. ( 1970) observed that syneresis was
inversely proportional to the extent of homogenisation of milk or cream. Increase
in the area occupied by the fat globule surface and the increase in protein-fat
interaction (Vliet & Dentener-Kikkert, 1982; Walstra & Vliet, 1986) due to the
increase in pressure of homogenisation was expected to reduce the amount of

150
exudate. Absence of such a trend suggests that either these factors have no effect
on exudation, or that the differences that existed in cheesemilk due to the variation
in homogenisation pressures did not exist in cheese.
(iv) Effect of priming time (15 &45min) on exudation: No significant difference
in the amounts of exudate was detected at the different levels of priming time
(Table 6.22). Priming time was chosen as a treatment variable to determine the
effect of minerals in cheese on the exudation of whey. The variation in priming
time was performed with corresponding variation in setting time so that the curd
pH at draining was not affected. However, Feta cheese and whey at the different
levels did not show any difference in calcium level. Thus priming time per se did
not influence the mineral balance of cheese and the exudation. The role of
calcium in cheese on the exudation could not be ascertained from this study.
(v) Effect of curd pH at draining (6.1 & 6.3) on exudation: The exudation of whey
from Feta cheese was significantly influenced by the curd pH at draining
(Table 6.22). The effect could be due to a combination of factors as curd pH at
draining is known to influence the mineral balance (Dolby et al., 1937), residual
rennet (Holmes et al., 1977; Lawrence et al., 1983; Singh & Creamer, 1990) and the
moisture content. There is some uncertainty about the effect of variation in time
of holding the curd in the whey on the residual lactose in cheese (Lawrence &
Gilles, 1982).
More calcium was found in whey drained at lower pH of draining. However, the
lack of any difference in calcium contents in 'whole' whey (pooled from all the
whey drained overnight) suggests that the differe11ce in calcium levels at the time
of draining was possibly restored during the overnight drainage of whey. Lack of
any difference is further evident from similar pH and calcium values in cheese
before brining. Thus it is unlikely that the observed difference in the amounts of
exudate was related to calcium content.
Similarly, any difference in residual rennet in curd at draining is likely to have been
restored during overnight draining of whey. This is supported by attainment of a
151
similar pH value for all cheeses. Further, the lack of any variability in proteolysis
of exudates indicates a similar residual rennet level in all cheeses.
Czulak et al. (1969) found that in addition to the pH at draining the rate of acid
development and the time the curd is in whey were critical factors in controlling
the quality of Cheddar cheese. They observed that when a high lactic acid was
developed slowly, the curd did not cheddar well. On maturing, even though the pH
was within normal limits up to 3 weeks, the cheese became acid, crumbly and liquid
separation (exudation) occurred at two months age. However, in this experiment
there is no indication of a difference in pH of cheese as observed at four weeks
and twenty-six weeks of storage. Residual lactose in cheese and pH of cheese
during storage are therefore not likely to have influenced exudation.
A significantly higher moisture at the higher pH at draining (resulting in higher
MNFS and lower FDM) is likely to have caused the increase in the amount of the
exudate.
An important implication from the above findings is that, in contrast to hard
varieties of cheese, variations in the manufacturing variables 'priming time' and
'curd pH at draining' are unlikely to have the desired effect in cheeses such as
Feta that are drained overnight.
(vi) Effect of Storage time: Storage time had a highly significant effect on
exudation of whey (Fig 6.11 ) . The amount of exudate increased steadily up to
about 20 weeks. Thereafter, the increase in the amount of exudate was slower.
Rapid rise in the amount of exudate at the start of storage was caused by the
external mechanical effect of vacuum packing. The increase in the amount of
exudate during storage may be attributed to increase in proteolytic activity or to the
spontaneous expulsion of liquid from gels with aging (Matz, 1965).
(vii) Interactions of storage time with P/F ratio: Interactions of storage time with
P /F ratio (Fig. 6 .12) and pH at draining (Fig. 6.13) significantly affected exudation.

,--.... (]) 1 6 0 L. ::J
-+-(/) 1 40 · -
0 E 1 2 0 (]) (/) (]) 1 00 (])
_c u 0) 8 0
..:::1. � 6 0 en '---../
(]) 40 -+-0
u ::J 2 0 X
w 0
F I G . 6 . 1 1
�
0 5 1 0 1 5 2 0 2 5 3 0 3 5 4 0
S t o ra g e t i m e ( w e e k s )
E X U D AT I O N O F W H E Y F R O M F E TA C H E E S E D U R I N G S T O R A G E t--1 u. N

............. Q) I... 1 60 :::l
....... (/) 0 1 40 E Q) 1 20 (/) Q) Q) 1 00 ...c 0 CJ) 80 �
'-...... CJ) 60 Q)
-+-0
v :::l X
w
5 1 0
0 -- 0 D. -- D. · -- ·
H i g h P /F ra t io C o n t ro l Low P / F ra t io
1 5 20 25 Sto ra g e t i m e ( w e e k s )
153
30 35 40
F i g . 6 . 1 2 E f f e c t o f p ro t e i n t o f a t ra t i o ( P / F r a t i o ) o n t h e e x u d a t i o n o f w h ey f ro m Fe ta c h e e s e d u r i n g s t o ra g e .
1 80 .............
Q) I... 1 60 :::l -(/) 0 1 40 E Q) 1 20 (/) Q) Q) 1 00 ...c 0 CJ) 80
� '-......
CJ) 60 '--./
Q) -+- 40 0 v :::l 20 X
w r
------6 6 • 6� •--o / --------
�! 6 �=------0
6/./ /�/ 6� /• /�;o · - · C o n t ro l
D. - 6. H i g h c u rd p H a t d ra i n i n g i� 0 - 0 Low c u rd p H a t d ra i n i n g
0 5 1 0 1 5 20 2 5 30 3 5 40 Sto ra g e t im e ( w e e k s )
F i g 6 . 1 3 E f f e c t o f ' c u rd pH a t d ra i n i n g ' o n t h e e x u d a t i o n o f w h ey f ro m Fe ta c h e e s e d u r i n g s t o ra g e .

154
Increase in the amount of exudate was more for the high P /F ratio with increase
in storage time. Likewise, the increase in the amount of exudate at higher curd pH
at draining was more with increase in storage time. This further emphasised the
significant individual effects of the treatment variables P /F ratio and curd pH at
draining on exudation.
6.5 SUMMARY AND CONCLUSION TO CHAPTER 6
Vacuum packaging of Feta cheese reduced the rate of exudation by blocking the
the ends of the capillaries of the protein matrix in cheese. However, an increase
in the number of times of repacking (with vacuum) the same block of cheese
increased the amount of exudate. Piling of the blocks of cheese one over the other
did not affect the exudation. The thermal shocks imparted to the product during
storage increased the amount of exudate.
The amount of exudate from Feta cheese increased with: increased P /F ratio,
increased curd pH at draining, increased storage time and increased storage
temperature. Variations in 'homogenisation pressure for manufactured cream' and
'priming time' had no effect on the extent of exudation. Variations brought about
by process treatments (priming time and curd pH at draining) on mineral balance,
residual lactose, and residual rennet in curd at the time of draining were apparently
neutralised during the overnight draining of whey from curd.
Increased moisture (and MNFS) and decreased fat content in Feta cheese resulted
in increase in the amount of the exudate. The effect of fat in reducing the amount
of exudate may be similar to its role as a mechanical barrier during syneresis of
renneted gels (Lelievre & Creamer, 1978).
Protein content in cheese may be primarily responsible for the initial water-holding
capacity in cheese. However, an increase in the amount of exudate coincided with
an increase in proteolysis. Proteolysis was rapid in the first four weeks and
continued during the storage. a5ccasein was degraded rapidly and most of it was
hydrolysed by six months. B-casein was more resistant and ::::l 50% of it was still

155
intact after six months of storage. These results are comparable to the proteolysis
in Gouda cheese (Visser & Groot-Mostert, 1977) and in Feta cheese (Alichanidis
et al., 1984). The NSLAB did not appear to be active during the storage of cheese.
The water activity of Feta cheese was primarily regulated by the S/M
concentration. The amount of unfreezable water increased in both cheese and
exudate during storage. However, no relationship could be established between the
unfreezable water in cheese and the extent of exudation from cheese.
Substantial amount of residual lactose was detected in Feta cheese after six months
of storage. Residual lactose in cheese was metabolised slowly during storage,
apparently by Lactobacillus casei, resulting in a slow decrease of cheese pH. The
slow rate of metabolism was probably due to the high S/M concentration and low
pH of cheese. This is consistent with the findings that when Cheddar cheese
contained 6% SjM, residual lactose was found up to at least six months (Thomas
& Pearce, 1981).

156
CHAPTER 7
EFFECT OF INCORPORATION OF HEAT-DENATURED WHEY PROTEIN
ON THE YIELD AND EXUDATION OF WHEY FROM FETA CHEESE
7. 1 Introduction
Partial denaturation of whey protein by heating the cheesemilk is an effective
means of reducing the amount of exudate from Cream cheese during storage
(Chapter 5). The effectiveness of whey protein in reducing the rate of exudation
in ripened cheese, e.g. Feta, was unknown. In addition to the possibility of
restricting the rate of exudation, incorporation of denatured whey protein had the
wider commercial implication of a possible increase in cheese yield.
Various techniques for the incorporation of whey protein into cheese were
considered. Native whey protein does not considerably improve the water-binding
ability and thus its incorporation was considered unlikely to retard the rate of
exudation. Besides, there are reports of native whey protein hindering the activity
of plasmin (Hansen, 1990), and lowering the proteolytic activity in cheese
(Abrahamsen, 1 979).
Incorporation of partially heat-denatured whey protein by high heat treatment of
milk was another option. However, heating milk is known to impair the rennet
coagulation (Hoodyonk et al., 1987). The commercial feasibility of this procedure
has not been reported. Although this method has the potential for reducing the
rate of exudation, doubts about the suitability of the process for cheese
manufacture, and lack of adequate equipment and facilities were the reasons for
not experimenting. Another method that could have been tried was the application
of ultrafiltration to concentrate milk to a level such that draining of whey during
cheesemaking is not necessary, e.g. Cast Feta. However, the primary objective of
this project was to find a solution to the problem of exudation in Cheshire cheese.
The 'Cast Feta' method of cheesemaking, which involves no drainage of whey, is
different from the traditional methods of cheesemaking and is not suitable. The
option left was to try the incorporation of heat-denatured whey protein by the

157
Centriwhey method (Walker, 1970). This method has the advantages of utilising the
greater water-binding ability of denatured whey protein and the avoidance of any
difficulty with rennet coagulation.
The literature on aspects related to incorporation of whey protein is reported in
Chapter 2.
The scope of this experiment was to study the effect of incorporation of
heat-denatured whey protein on: the exudation of whey during storage, the yield
of cheese, the product acceptability and the proteolysis of Feta cheese.
7.2 Experimental plan
The procedure for preparation of heat-denatured whey protein suitable for cheese
manufacture was optimised based on the principle involved in the Centriwhey
method (Walker, 1970). The Centriwhey method involves pH adjustment of whey,
heat-denaturation of whey proteins and centrifugal separation of the denatured
whey proteins. In the present study the retentate from ultrafiltered acid casein
whey was taken as the base material, heat treated, diluted to required
concentration and milled in a colloid mill. Details of the method are outlined in
the following section (Chapter 7.3).
It was expected that the increase in cheese yield, and the reduction in the amount
of exudate, would depend partly on the quantity of incorporated denatured whey
protein. Therefore, the quantity of denatured whey protein to be added was chosen
as one of the variables for study.
It has been recommended that the fat level in the cheese should be increased in
proportion to the amount of denatured whey protein incorporated (Walker, 1 970),
in order to maintain the quality of cheese. Accordingly, this factor was chosen as
a variable for study.

158
particle size of the whey proteins. Size reduction was achieved by passing the product
through a colloid mill . Further size reduction was accomplished by homogenisation
(Pang, 1 989) . Homogenisation of heat-denatured whey protein has also been reported
to result in slight increased yield (Krasheninin et al. , 1 974) . As homogenisation
formed a part of the process for preparation of cheesemilk, there was a possibility of
homogenising the slurry (containing denatured whey protein) in combination with
homogenisation of reconstituted skim milk (RSM) and fresh frozen milkfat for
recombining (FFMR) while making 'manufactured cream' . Therefore, the effect of
homogenisation of denatured whey protein on the product characteristics, yield and
exudation of Feta cheese was selected as another variable for study.
Addition of slurry containing heat-denatured whey protein lowered the pH of
cheesemilk from 6 .67 to about 6 .45 , depending on the quantity of denatured whey
protein added. If cheeses were to be made from these milks without adjustment of pH
to a fixed value it would have resulted in variations in gel strength during rennet
coagulation , and variations in draining pH. Gel strength affects syneresis while
draining pH influences MNFS , mineral balance and residual rennet in cheese. It was
necessary to minimise these effects and maintain uniformity in all cheeses . This was
achieved by adjusting the pH of cheesemilk to a constant value of 6 . 55 at the start of
the process by addition of NaOH or HCl, and having a fixed time (from inoculation
of starter until draining of whey) for all the trials.
Experimental design: Details of the variables and their respective levels of variation
are listed in Table 7 . 1 . The experimental design was a 2231 factorial with 3 control
trials. A total number of 15 trials (one trial for each combination of process variables
involving ' incorporation of heat-denatured whey protein ' , ' fat adjustment' , and
'homogenization' plus three control trials) was performed in a random sequence. For
each of the 15 trials , 10 blocks of cheese were packed and stored , and one block was
used for each selected storage time. The process variables for the control runs did not
have any addition of heat-denatured whey protein , and therefore did not have fat
adjustment or homogenisation. Analysis of variance was performed using SAS (SAS
Institute Inc. , 1985) .

159
Table 7. 1 Treatment variables, and their respective levels of variation, chosen for study of the effects of incorporation of heat-denatured whey protein on yield, product characteristic and exudation of whey from
Feta cheese during storage.
Treatment variables Levels of variation Abbreviated as
Quantity of heat-denatured 0 Control whey protein added [on dry matter (DM) basis] per kg 4.5 g W 1 cheesemilk
9.0 g W 2
Fat adjustment in proportion Not adjusted F 1 to the denatured whey protein incorporated Adjusted (0.74) F 2 (adjustment of P /F ratio)
Homogenisation of slurry No homogenisation H 1 containing heat-denatured whey protein Homogenised separately H 2
(2,000 psi\ 60 o C)
Homogenised with FFMR and RSM (during H 3 preparation of
manufactured cream)
Storage time (weeks) 2 weeks S 2 4 weeks S 4 6 weeks S 6 9 weeks S 9
12 weeks s 12 15 weeks s 15 20 weeks s 20 26 weeks s 26 39 weeks s 39
1 1 psi = 6.89 kPa

160
7.3 Experimental
7.3 .1 Preparation of slurry containing heat-denatured whey protein: Retentate from
ultrafiltered acid casein whey was used as the source of whey proteins. This
retentate was obtained from Tui Milk Products Ltd., Palmerston North. Typically
the retentate had 24% total solids. The retentate was heated to 85 ° C in a water
bath and held for 30 min1• It was then diluted with water to approximately 20%
total solids, cooled to about 70 ° C and milled in a colloid mill2 with one-pass. It
was then diluted with water to about 15% total solids. A portion of this slurry
(unhomogenised) was stored at 2 ° C until addition to cheesemilk. The rest of the
slurry was homogenised at 60 o C/2,000 psi ( 13,780 kPa) in single stage. The
homogenised slurry was stored at 2 ° C until used.
7.3.2 Cheesemaking
The experimental procedure for making Feta cheese was similar to that described
in Chapter 6, except for the following differences.
(i) Cheesemilk consisted of RSM, manufactured cream, and the slurry
containing heat-denatured whey protein (not added in control).
(ii) When the slurry containing heat-denatured whey protein was to be
homogenised in combination with manufactured cream, the calculated amount of
1The viscosity of the retentate increased with increase in temperature during heat treatment, presumably due to heat-denaturation of whey proteins. It was not possible to stir the highly viscous product beyond a temperature of 85 o C. Instead of attempting a further rise in temperature, the retentate was therefore held at 85 o C for 30 min. It is assumed that most of the whey proteins are heat denatured due to this heat treatment. In the text heat denatured whey protein refers to whey protein denatured at a heat treatment of 85 ° C/30 min.
2 A Probst und Class colloid mill (Model JVlO, power rating 9.2 kW) was used. The colloid mill has a rotor that revolves at a high speed within the stator. This creates a large amount of mechanical stress, shear, tangential and frictional forces with impact stress on the product.

161
slurry was mixed with FFMR and RSM, and was homogenised by a procedure
similar to the standard practice of manufactured cream.
(iii) The pH of cheesemilk was adjusted to 6.55 using 0. 1% NaOH or
0.035% HCI. The possible localised effect of acid/alkali on milk protein was
minimised by continuous and thorough agitation of milk during the addition of
acid/ alkali.
(iv) The quantity of acid or alkali to be added was unknown as it
depended upon the buffering index of milk and the pH of the slurry containing
denatured whey protein. Provision was made for the dilution effect of the added
acid/alkali by using a slightly concentrated RSM (ratio of SMP and water was
adjusted to 1:7.95 ratio instead of 1:8.5). A calculated amount of water up to 2 kg
was then added at the end to bring the RSM concentration to the required value.
An example of the calculations for this is provided in Appendix 7.1.
(v) 12 ml of rennet was added per 100 kg milk instead of the standard
practice of 16 ml per 100 kg cheesemilk. The amount of rennet was reduced to
negate the effect of a reduction in the pH of cheesemilk due to the addition of
slurry containing denatured whey protein. This aspect was investigated earlier in
a separate study (Pang, 1989).
(vi) Incorporation of denatured whey protein has been reported to result
in cheese with high moisture (Abrahamsen, 1979; Furtado & Partridge, 1988; Pang,
1989). In the present study it was planned to have uniform MNFS in all cheeses
so that MNFS was not a factor affecting exudation. In order to attain the MNFS
level in cheeses incorporated with denatured whey protein similar to that in the
control cheese, the following modifications were used: 9 mm knives instead of 12
mm, and cooking temperatures of 34 ° C for the lower level of whey proteins and
36 o C for the higher level.
(vii) The draining pH was 6.15.

162
7.3.3 Mass balance studies: To support the findings on cheese yield mass balance
studies were performed for fat, protein, total solids, calcium and moisture.
7.4 Methods of analysis
Slurry containing heat-denatured whey protein was analysed for total solids by
microwave analyser at various stages of preparation. Final slurry containing
denatured whey proteins was analysed for total solids (gravimetrically), total
nitrogen (Kjeldahl), and calcium (complexometric) .
Cheesemilk and whey were analysed for total solids (gravimetric), fat
(Rose-Gottlieb), total nitrogen (Kjeldahl), and calcium (complexometric) .
Cheeses before brining and after four weeks of storage were analysed for fat
(Schmidt-Bonzynski-Ratzlaff), total nitrogen (Kjeldahl), moisture, calcium
(complexometric) and pH. Cheeses were analysed for NaCl (potentiometric) after
four weeks. Proteolysis in cheeses at four weeks and six months of storage were
determined by SDS-PAGE. Exudation of whey was measured at the stipulated
storage intervals. Exudates were analysed for total solids, total nitrogen (Kjeldahl),
calcium (complexometric), NaCl (potentiometric) and distribution pattern of low
molecular weight peptides (HPLC).
Details of the analytical methods for the above analyses are provided in Chapter 4
and Appendix 4.1 .
7 .5 Sensory evaluation
Cheeses were evaluated by a panel after four and eighteen weeks of storage.
Details of the product testing and grading are reported in Chapter 4.

7.6 Results and discussion
The results are described under the following headings:
(i) Composition of slurry, milk, whey, cheese and exudate.
(ii) Manufacturing aspects and quality of cheese.
(iii) Mass balance and cheese yield.
(iv) Proteolysis in cheese.
(v) Exudation from cheese.
7.6.1 Composition of slurry, milk, whey, cheese and exudate.
163
Slurry containing denatured whey protein: Composition of the slurries were in the
following range: Total solids = 14.0 - 15.0%, Protein = 1 1.10 - 12.38%,
Ca2+ = 16 - 19 mM/kg, pH = 4.7 - 4.8.
Cheesemilk: Variation in the fat and protein of cheesemilks for the different levels
of process treatments was in accord with the experimental design. Details of the
composition of cheesemilk (including added denatured whey protein) are provided
in Appendix 7.2.
Whey (Appendix 7.3) : A slight increase in fat loss into the whey was detected when
cheese was made with higher amount of heat-denatured whey protein, and also in
cheese with higher level of fat. Fat loss into the whey was lower when the slurry
containing the heat-denatured whey protein was homogenised separately. However,
none of these variations are of any practical concern. Slightly increased calcium
level of whey was detected when cheese was made with higher level of fat. This
may have been due to a corresponding lower pH of cheese.
Cheese before brining (Appendix 7.4): A higher percentage of fat and FDM in
cheese with fat level adjusted in proportion to the added whey protein were
expected. A similar MNFS for all cheeses showed good control during cheese
manufacture. As a consequence of having similar MNFS in all cheeses, the
moisture was slightly higher in cheese samples manufactured with a higher amount
of denatured whey protein.

164
Cheese after four weeks of storage (Appendix 7.5): A slight shift in moisture and
MNFS in cheeses were noted in comparison to the respective values of cheese
before brining. This may be attributed to the effects of brining and exudation.
Mostly the composition was typical of Feta cheeses.
Exudate from four week old Feta cheese: The composition of exudate was mostly
uniform and typical (Appendix 7.6). Variations in total solids (of cheese with lower
fat), calcium and protein (for cheeses with different levels of added whey protein)
of exudate may have been simply due to slight variation in the corresponding
amounts of exudates released.
7.6.2 Manufacturing aspects and quality of cheese
Cheese manufacture: All cheeses (including control) appeared firmer in comparison
to Feta cheese made in other experiments. This might have been due to the
lowering of pH of milk to 6.55 at the start of the cheesemaking process. The curd
strength appeared satisfactory for all cheeses and there was no difficulty in cutting
the gels. However, the gels appeared firmer and whey turbidity increased with
increase in the level of added denatured whey protein. Homogenisation of slurry
containing denatured whey protein in combination with manufactured cream
resulted in a softer gel and increased moisture in cheese. Too many curd-fines
appeared to be lost during manufacture of cheese with a higher level of denatured
whey protein. The texture of cheese manufactured with a high level of denatured
whey protein appeared to be brittle and soft. In cheeses where the fat level was
adjusted in proportion to the added denatured whey protein the curd was seen
floating in whey for most of the duration of stirring and the whey appeared turbid.
Sensory evaluation of cheese (Appendix 7.7): The major objectives of the sensory
evaluation of the cheeses were to determine the effect of incorporation of
heat-denatured whey protein on the acceptability of cheese and the changes in the
product quality with increase in storage time.
For most attributes of flavour and texture, cheeses manufactured with
heat-denatured whey protein were perceived to be similar to control cheese. A

165
statistically significant variation was observed for 'acidity'. However, this variation
was not of any practical concern. Scores for bitterness and oxidised flavours were
in the bottom range, and therefore may be considered as insignificant for all
samples. The only significant change detected with increase in storage time was
with salt content in cheese. A decrease in saltiness of the cheeses with increase in
storage time may be related to the loss of NaCl through the exudate, or to the
development of cheese flavour that provided a masking effect on saltiness of the
cheese. The texture attributes (mouthfeel, sliceability)and overall acceptability ('\
were not affected due to the incorporation of the heat-denatured whey protein, and
did not change with increase in storage period.
The major implications of the sensory evaluation was that the quality of Feta
cheese manufactured with heat-denatured whey protein was comparable to that of
control cheese. Cheddar cheese manufactured from extensively heat treated milk
had developed bitter flavour (Banks et al., 1987), while Cheddar cheese
manufactured with ultrafiltered cheese whey had developed 'acid' flavour (Brown
& Ernstrom, 1982). It was encouraging to note that no such flavour could be
detected in this experiment. A general feeling conveyed by the panel was that most
cheeses evaluated after four weeks were somewhat dry/ crumbly /brittle (except for
cheeses from trials 9, 13, 14, and 15). This could have been due to the fact that the
cheeses were only four weeks old and had not matured enough. The extent to
which the presence of heat-denatured whey protein could have contributed to the
dryness of cheese could not be ascertained because the control cheeses fared no
better. With the benefit of hindsight, it now appears that lowering the pH of
cheesemilk at the beginning of cheese manufacture could have contributed to the
dryness as it resulted in generally lowering the level of moisture, and thus affected
the cheese texture. Remarks by the panel for cheese at eighteen weeks were much
more favourable, even though the dryness was still perceived. The Feta cheeses
had definitely obtained a more 'cheesy' flavour. Some of the best rated cheeses
were with added heat-denatured whey protein.
It was concluded that the incorporation of heat-denatured whey protein did not
adversely affect the organoleptic properties of cheese.

7.6.3 Mass balance and cheese yield
166
(i) Mass balance studies: Mass balances were carried out for fat, protein, total
solids, calcium and moisture. The calculations were based on the method reported
by Lelievre et al. (1983). The input comprised of milk (including slurry containing
denatured whey protein), starter and rennet. The output was cheese (before
brining) and whey. Appendix 7.8 provides: (a) the data on quantities of input and
output material, the calculated values of mass balance, yields and recoveries of the
milk solids for each of the 15 trials; (b) an example of mass balance calculation;
(c) the effect of process treatments on the mass balance of the selected milk
constituents; (d) justification for variations in mass balances of selected milk
constituents.
Mass balance values of the milk constituents for the individual trials were mostly
reasonable. Instances where the values were very high or low, it was mostly due
to the specific nature of process variable. Increased loss of fat occurred in trials
with combined homogenisation of denatured whey proteins and manufactured
cream. This was possibly due to the increased adsorption of denatured whey
protein to the fat globules. Increased loss of protein was detected when the
denatured whey protein was added without homogenisation. Mass balance for
calcium and moisture were reasonable for all trials. Variation in mass balance for
total solids was related to the variations in fat and protein in the individual trial.
The mass balance was satisfactory and supported the findings, particularly with
respect to cheese yield.
(ii) Cheese yield
Table 7.2 shows the yield of cheese as affected by the process variables. A
comparison of the 'control' trials with that of all other trials showed a significant
increase in yield with incorporation of denatured whey proteins.

167
Table 7 . 2 E ffect of process treatments on yield o f cheese8
Source of variation and levels
Control Others
Added whey protein (W) w 2 w 1
Fat ( F ) F 2 F 1
Homogenis-at ion ( H ) H 1 H 2 H 3
S . D .
kg cheese per 1 0 0 kg milk
LSM F
18 . 4 2 1 1 . 9 6 2 0 . 13 *
12 . 7 1 * 2 0 . 92 19 . 3 4
3 . 15 2 0 . 52 19 . 7 4
0 . 8 3
19 . 7 9 2 0 . 11 2 0 . 4 9
0 . 7 6 6
Yield
kg cheese ( adj usted to 5 0 . 0% moisture ) per 100 kg milk
LSM F
17 . 2 4 1 9 . 59 18 . 3 4 *
7 . 69 * 18 . 65 18 . 03
3 7 . 1 2 ** 19 . 02 17 . 66
0 . 07
18 . 3 3 18 . 4 0 18 . 3 0
0 . 3 8 6
a All data relate to weights of cheese as determined before brining
Control = Cheese prepared without any added whey protein ; ' Others ' = Includes al l trials ( 12 out of 15 ) in which denatured whey protein was incorporated ;
W 2 = Incorporation of denatured whey protein ( on DM basi s ) at the rate o f 9 . 0 gjkg milk ; W 1 = Incorporation of denatured whey protein ( on DM basi s ) at the rate of 4 . 5 gjkg milk ;
F 2 = Fat level in cheesemilk adj usted in proportion t o added whey protein ; F 1 = Fat level not adj usted ;
H 1 = Denatured whey protein added without homogenisation ; H 2 = Denatured whey protein homogenised separately ; H 3 = Denatured whey protein homogenised in combinati on with manufactured cream ;
LSM = Least-square mean ; F = F ratio ; S . D . = Standard deviation of raw data ;
* = p < 0 . 05 ; * * = p < 0 . 0 1 ; * * * = p < 0 . 0 0 1 ; F ratios without asterisks denote ' not s igni ficant ' .

168
Effect of process variables on the yield of cheese
Increase in quantity of denatured whey protein added: The yield of cheese increased
with increase in amount of denatured whey protein incorporated in cheesemilks.
Fat adjustment in proportion to the added whey protein : A significant increase in
yield was obtained when fat content in cheesemilk was increased in proportion to
the added denatured whey protein.
Method of homogenisation of sluny with denatured whey protein: Cheese yields were
similar with different treatments of homogenisation.
Effect of process variables on the recovery of milk solids in cheese
The variation in percentage of milk solids (fat, calcium, protein and nitrogen)
retained in cheese due to the process variables are reported in Table 7.3. The
recovery of milk solids has been expressed in two ways; firstly as a percentage of
input (milk solids present in milk) which accounts for the losses during
cheesemaking, and secondly as a percentage of output (milk solids in cheese and
whey) which ignores handling losses and is more realistic when handling losses are
not entirely due to process treatments.
Recovery of fat: Recovery of fat was not greatly influenced by any of the process
variables. Although some treatments show a statistical significance, the variation
does not appear to be of much practical relevance. The trends indicate that the
fat loss increased marginally due to the incorporation of denatured whey protein,
increased slightly with increased fat level, decreased slightly when whey protein was
added without homogenisation, and increased when the whey protein was
incorporated by homogenising it along with the manufactured cream.
Recovery of protein: The recovery of protein decreased with an increase in the
amount of denatured whey protein incorporated. The recovery of protein was not
influenced by the fat levels and was minimum when the added whey protein was
not homogenised.
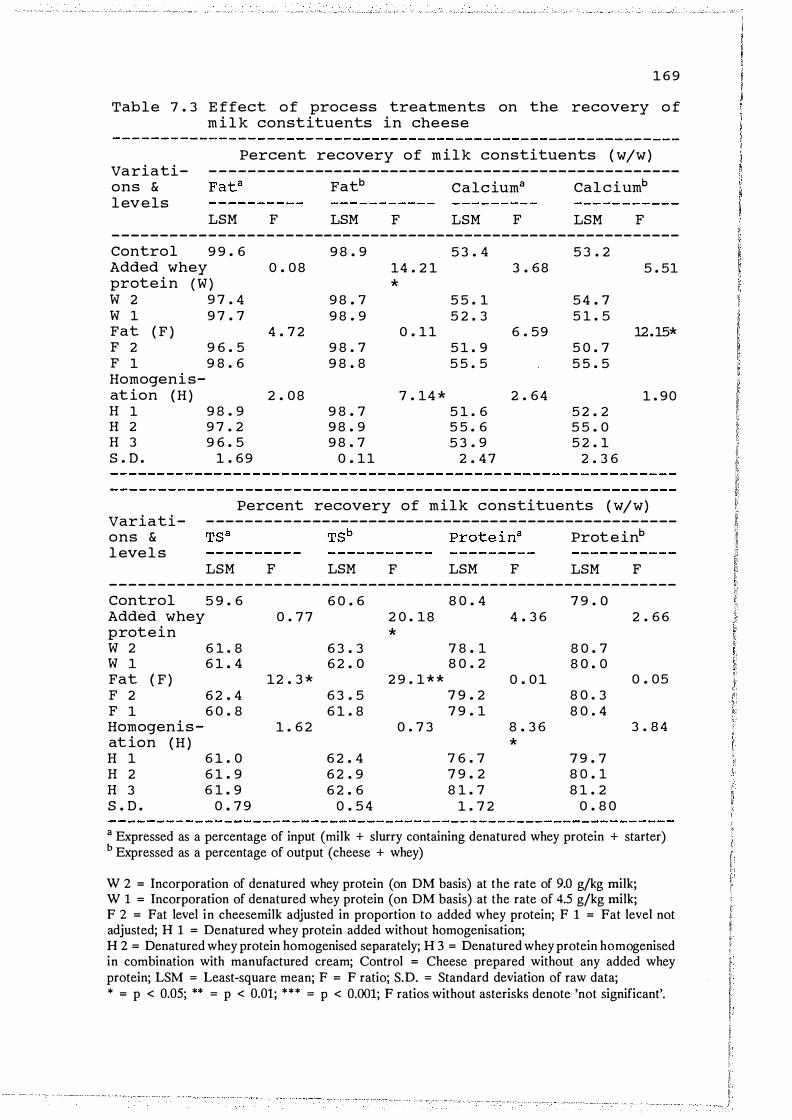
1 6 9
Table 7 . 3 E ffect of process treatments on the recovery o f m i l k constituents in cheese
Percent recovery of milk constituents ( wjw) Variati- --------------------------------------------------ons & levels
LSM F
Fatb Calciuma
LSM F LSM F
Calciumb
LSM F ------------------------------------------------------------Control 9 9 . 6 9 8 . 9 5 3 . 4 5 3 . 2 Added whey 0 . 08 14 . 2 1 3 . 68 5 . 51 protein (W ) * w 2 9 7 . 4 9 8 . 7 5 5 . 1 5 4 . 7 w 1 9 7 . 7 9 8 . 9 5 2 . 3 5 1 . 5 Fat ( F ) 4 . 7 2 0 . 11 6 . 59 12.15* F 2 9 6 . 5 9 8 . 7 5 1 . 9 5 0 . 7 F 1 9 8 . 6 9 8 . 8 5 5 . 5 5 5 . 5 Homogenis-at ion (H ) 2 . 08 7 . 14 * 2 . 64 1 . 90 H 1 9 8 . 9 9 8 . 7 5 1 . 6 5 2 . 2 H 2 9 7 . 2 9 8 . 9 5 5 . 6 5 5 . 0 H 3 9 6 . 5 9 8 . 7 5 3 . 9 5 2 . 1 S . D . 1 . 69 0 . 11 2 . 47 2 . 3 6
Percent recovery of milk constituents ( wjw) Variati- --------------------------------------------------ons & level s
LSM F LSM F
Proteinb
LSM F LSM F ------------------------------------------------------------Control 5 9 . 6 6 0 . 6 8 0 . 4 7 9 . 0 Added whey 0 . 77 2 0 . 18 4 . 3 6 2 . 6 6 protein * w 2 6 1 . 8 6 3 . 3 7 8 . 1 8 0 . 7 w 1 6 1 . 4 6 2 . 0 8 0 . 2 8 0 . 0 Fat ( F ) 12 . 3 * 2 9 . 1 * * 0 . 0 1 0 . 05 F 2 6 2 . 4 6 3 . 5 7 9 . 2 8 0 . 3 F 1 6 0 . 8 6 1 . 8 7 9 . 1 8 0 . 4 Homogenis- 1 . 6 2 0 . 7 3 8 . 3 6 3 . 84 at ion (H ) * H 1 6 1 . 0 6 2 . 4 7 6 . 7 7 9 . 7 H 2 6 1 . 9 6 2 . 9 7 9 . 2 8 0 . 1 H 3 6 1 . 9 6 2 . 6 8 1 . 7 8 1 . 2 S . D . 0 . 7 9 0 . 54 1 . 7 2 0 . 8 0
a Expressed as a percentage of input (milk + slurry containing denatured whey protein + starter) b Expressed as a percentage of output (cheese + whey)
W 2 = Incorporation of denatured whey protein (on DM basis) at the rate of 9.0 g/kg milk; W 1 = Incorporation of denatured whey protein (on DM basis) at the rate of 4.5 g/kg milk; F 2 = Fat level in cheesemilk adjusted in proportion to added whey protein; F 1 = Fat level not adjusted; H 1 = Denatured whey protein added without homogenisation; H 2 = Denatured whey protein homogenised separately; H 3 = Denatured whey protein homogenised in combination with manufactured cream; Control = Cheese prepared without any added whey protein; LSM = Least-square mean; F = F ratio; S.D. = Standard deviation of raw data; * = p < 0.05; ** = p < 0.01; *** = p < 0.001; F ratios without asterisks denote 'not significant'.

170
Recovery of calcium : The process treatments did not cause a great variation in
calcium levels.
Recovery of TS: Recovery of total solids increased with increase in the amount of
denatured whey protein incorporated, and increase in the fat level. There was no
difference between cheeses with high and low levels of incorporated whey protein
in terms of % TS recovered. However, it was encouraging to note that the % TS
recovered had not decreased with the increase in the amount of whey protein
incorporated.
It is interesting to note that the total solids recovered in cheeses incorporated with
whey protein are higher than 'control' even though the percentages of fat and
protein recovered in control cheeses were higher. The cheeses manufactured with
heat-denatured whey protein retained moisture in excess of control. Additional
soluble solids and salts appear to have been retained with this extra moisture. This
resulted in an overall increase in recovery of TS even though fat and protein
contents recovered were slightly low. It is thus likely that the cheeses with added
whey protein retained a greater amount of lactose.
Conclusion: Incorporation of heat-denatured whey protein [on dry matter (DM)
basis] up to 9.0 gjkg cheesemilk resulted in an increase in yield of Feta cheese.
The increase in yield was due to retention of: a proportionate amount of added
whey protein and fat, extra water (retained in proportion to the incorporated
heat-denatured whey protein to obtain a constant MNFS), and additional soluble
solids (probably lactose) retained along with the extra water. These results are
consistent with the reported increase in yield and satisfactory quality of semi-hard
cheeses with incorporation of heat-denatured whey protein (DM basis) up to
4.0 g/L milk (Anon, 1969a; Walker, 1970; Krasheninin et al., 1974).
Adjustment of fat level in proportion to the increased denatured whey protein
resulted in an increase of cheese yield. Addition of denatured whey protein
without any homogenisation resulted in a slightly lower yield than when
homogenised. From the yield point of view, the heat-denatured whey protein may
be incorporated by homogenising it in combination with manufactured cream.

7.6.4 Proteolysis in cheese
171
SDS-PAGE: The objective was to determine the effect of incorporation of
heat-denatured whey protein on the proteolytic pattern of Feta cheese. In order
to determine the rate of proteolysis the results have been expressed as the ratio of
areas of individual proteins/peptides ( a51-casein, B-casein and the breakdown
bands) to the area of para-K-casein. Para-K-casein was chosen as the reference
protein because it resolved well in the gel, it was isolated from other bands in the
gel, and it did not appear to have been affected by proteolysis.
Proteolysis in cheese at four weeks: The pattern of proteolysis was similar in all
cheeses and was typical of Feta cheese (Table 7.4). The rate of breakdown of
a5-casein ( a51- & a52-) was mostly similar in all cheeses. B-casein was more stable,
though it was difficult to accurately determine whether B-casein was being
proteolysed. Cheeses incorporated with denatured whey protein had increased
amounts of whey protein, as detected from the density of B-lactoglobulin bands.
However, the increase in B-lactoglobulin was not in proportion to the increase in
the amount of denatured whey protein incorporated. This was due to experimental
error involved in the recovery of all the whey proteins. It was found that not all
of the added denatured whey proteins were soluble when cheese was dispersed in
SDS sample buffer, and some sedimented during the centrifugation operation
involved in protein extraction from cheese. In subsequent analyses this was
overcome by adding dithioerythritol (DTE) to cheese and sample buffer, heat
treating (95 ° C/10 min), and then centrifuging. Addition of DTE before heat
treatment and centrifugation helped reduce the disulphide linkages in the
denatured whey proteins and solubilised the insoluble whey protein. There was no
indication of a reduced proteolysis in cheeses manufactured with denatured whey
protein. The ratio of peptide representing the first breakdown band to
para-K-casein was identical in all cheeses. The ratio of peptide representing the
second breakdown band to para-K-casein was slightly higher in cheeses
manufactured with denatured whey protein. This suggested a slightly faster
proteolysis, a trend similar to that observed by Sakharov ( 1975). However, this is
very unlikely as denatured whey proteins have been reported to have little effect
on as1-casein degradation, and to retard B-casein proteolysis (Harper et al., 1989).
It is possible that in control cheeses the peptide representing the second band was

1 7 2
Table 7 . 4 E ffect o f process treatments on the proteoly s is in four week old Feta cheese . Proteolysis has been expressed in terms of ratio of areas of selected proteinsjpeptides to that of para-K -casein . The areas have been estimated us ing the densitometer plots of SDS-PAGE .
Ratio of areas
Variat ion
B-lg I para-K-en
a81-casein
lpara-K-cn
LSM F LSM
Control 0 . 64 2 . 3 6
Added whey 2 . 4 4 protein (W ) w 2 1 . 0 2 2 . 3 1 w 1 0 . 8 3 2 . 3 8
Fat ( F ) 3 . 7 6 F 2 0 . 8 0 2 . 3 7 F 1 1 . 04 2 . 3 2
Homogenis- 0 . 5 1 at ion (H ) H 1 0 . 9 1 2 . 4 1 H 2 0 . 8 5 2 . 3 6 H 3 1 . 0 0 2 . 2 6
S . D . 0 . 2 11 0 . 2 02
1 First breakdown product . 2 Second breakdown product .
para-K -en = para-K -casein ;
F
0 . 4 1
0 . 2 4
0 . 55
Peptide1 I para-K -en
LSM F
0 . 3 8
0 . 12
0 . 4 0 0 . 3 9
0 . 11 0 . 3 9 0 . 4 0
1 . 4 9
0 . 4 0 0 . 4 2 0 . 3 7
0 . 04 3
Peptide2 I para-K -en
LSM F
0 . 4 6
2 . 4 6
0 . 53 0 . 55
4 . 4 1 0 . 55 0 . 53
6 . 2 1
0 . 52 0 . 57 0 . 54
0 . 02
W 2 = Incorporation of denatured whey protein ( on DM bas i s ) at the rate of 9 . 0 gjkg milk ; W 1 = Incorporation of denatured whey protein ( on DM basi s ) at the rate of 4 . 5 gjkg mil k ;
F 2 = Fat level i n cheesemilk adj usted i n proportion to added whey protein ; F 1 = Fat l evel not adj usted ;
H 1 = Denatured whey protein added without homogenisation ; H 2 = Denatured whey protein homogenised separately ; H 3 = Denatured whey protein homogenised in comb ination with manufactured cream ;
Control = Cheese prepared without any added whey protein ; LSM = Least-square mean ; F = F ratio ; S . D . = Standard deviation of raw data ; * = p < 0 . 05 ; ** = p < 0 . 01 ; * * * = p < 0 . 0 0 1 ; F ratios without asterisks denote ' not signi ficant ' .

173
proteolysed rapidly to smaller molecular weight peptides or amino acids leading to
the observed effect. The other possibility could be the difficulty in recovering all
proteins as described earlier. It was decided that a better assessment of the rate
of proteolysis could be made with storage study on cheese at a later stage.
Proteolysis in cheese at six months: The pattern of proteolysis was similar in all
cheeses (Fig. 7. 1 & Table 7.5) . Substantial amount of as-casein ( asr & as2- ) had
been extensively proteolysed. It was difficult to establish the extent to which
B-casein had been hydrolysed. Most of it however appeared intact. There are
reports that the activity of plasmin is retarded by denatured B-lactoglobulin
( Grufferty & Fox, 1986; Rollema & Poll, 1986; Harper et al., 1989). B-casein is
usually hydrolysed by plasmin. In this experiment it is difficult to ascertain the
extent to which the presence of denatured B-lactoglobulin would have retarded
proteolysis of B-casein. This is because proteolysis of B-casein may have been
partly retarded in Feta cheese even in the absence of denatured whey proteins
(control cheese) due to low pH and high salt in cheese. Para-K-casein,
B-lactoglobulin and a-lactalbumin did not appear to have been proteolysed during
storage. The rate of proteolysis appeared to be about the same in all the cheeses
as there was no difference in ratios of as-casein to para-K-casein and the ratio of
breakdown products with para-K-casein.
The ratios of B-lactoglobulin with para-K-casein in the cheeses indicated the
following: increase in amount of B-lactoglobulin in proportion to the increased
incorporation of denatured whey protein in cheesemilk, increase in B-lactoglobulin
when fat level was adjusted in proportion to the added whey protein, increase in
B-lactoglobulin when the slurry containing heat-denatured whey protein was
homogenised with manufactured cream, and a decrease in B-lactoglobulin when the
slurry containing heat-denatured whey protein was added without homogenisation.
These findings are in agreement with the results of mass-balance studies. One of
the important implications of this study is that the added denatured whey protein
did not hydrolyse during storage and did not influence the proteolysis in cheese.
It is assumed here that the amount of B-lactoglobulin retained in cheese provided
a proportional representation of the whey proteins in cheese. Appendix 7.9

� -0 ,....; 1-< f;.l... � ...... t:: -V) 0 � � u
� N ,....; N ('f') ('f') V') ('f') :r: :r: :r: :r: :r: � :r:
0 "'0 ,....; N N N ,....; 0 N f;.l... f;.l... f;.l... f;.l... 1-< f;.l... ...... f;.l... ...... 0 � t:: 1:::: � - ,....; - N = � 0 V) � � � � Q) u � �
,....; ,....; ('f') ,....;
- :r: ::c ::c :r: 0 ,....; N ,....; -1-< f;.l... f;.l... f;.l... f;.l... +-' t:: - � ,....; � 0 � � u
N :r: >. 0 ...c: N � f;.l... u · -
� ...... u j
� V') � "'0 0 ...... 0
1:::: d !!) �
as-casein
( as2- & asl-)
B-casein
K-casein
B-lactoglobulin
Para-K-casein
a-lactalbumin
sos-PAGE _on six month oid. :Feta cheeses Incorporated. with heat-denatured whey protein .
W2 = I ncorporat i on of hea t -denatured whey prote i n ( on dry matter bas i s ) at the rate of 9 . 0 g/kg cheesemi l k; W1 = I ncorporat i on of hea t - denatured whey prote i n ( on dry matter basi s ) at the rate of 4 . 5 g(kg cheesemi l k ; F2 = F a t l evel i n cheesemi l k adj usted i n proport i on t o i ncorporated whey prote i n; F 1 = Fat l eve l i n cheesemi l k not adj usted ( and therefore h i gher protei n/ f a t rat i o i n cheesemi l k ) ; H 1 = S lurry cont a i n i ng denatured whey prote i n added to cheesemi l k w i thout any homogen i sa t i on treatmen t ; H2 = S l urry conta i n i ng denatured whey prote i n was homogen i sed at 1 3 , 780 kPa ( s i ng l e stage) and then added to cheesemi l k ; � H3 = S l urry cont a i n i ng denatured whey prot e i n homogeni sed a l ong wi th manufactured c ream; � RSM = Recons t i tuted s k i m mi l k ; Cont rol = Cheesemi l k wi thout i ncorporat i on of hea t -denatured whey prot e i n .

175
Table 7 . 5 Effect of process treatments on the proteoly s i s in s ix month old cheese . Proteolysis has been expressed in terms of ratio of areas of selected proteinsjpeptides to that of para-K -casein . The areas have been estimated us ing the densitometer plots of SDS-PAGE .
Variation
B-lg I para-K -en
LSM F
Ratio of areas
a51-casein Peptide1 1
/para-K -en para-K -en
LSM F LSM F
Peptide2 I para-K -en
LSM F ----------------------------- - ----------------------------Control 0 . 4 5 3 4 1 1 . 0 2 Others 2 . 2 1 * * * 1 . 0 2
Added whey 2 12 protein (W) * * * w 2 2 . 8 3 0 . 9 8 w 1 1 . 58 1 . 0 6
Fat ( F ) 12 . 0 * F 2 2 . 3 5 1 . 0 6 F 1 2 . 06 0 . 9 9
Homogenis- 9 . 3 9 at ion (H ) * H 1 1. . 9 6 0 . 97 H 2 2 . 2 4 1 . 0 9 H 3 2 . 4 1 0 . 9 9
S . D . 0 . 15 0 . 13
1 First breakdown product . 2 Second breakdown product .
para-K -en = para-K -casein ;
0 . 0 0 0 . 9 0 0 . 2 5 0 . 7 8 1 . 19 0 . 8 1 0 . 67
1 . 1 3 0 . 5 1 0 . 0
0 . 7 6 0 . 67 0 . 87 0 . 67
0 . 8 3 2 . 07 0 . 0 0 . 9 2 0 . 67 0 . 7 0 0 . 67
0 . 9 2 0 . 8 6 0 . 12
0 . 7 3 0 . 66 0 . 9 5 0 . 6 5 0 . 7 5 0 . 7 0
0 . 2 6 0 . 15
Control = Cheese prepared without any added whey protein ; Others = Includes all trials ( 12 out of 1 5 } other than the control trials ; W 2 = Incorporation of denatured whey protein ( on DM bas is ) at the rate of 9 . 0 gjkg milk ; W 1 = Incorporation of denatured whey protein ( on DM basis ) at the rate of 4 . 5 gjkg milk ; F 2 = Fat level in cheesemilk adj usted in proportion to added whey protein ; F 1 = Fat level not adj usted ; H 1 = Denatured whey protein added without homogenisat ion ; H 2 = Denatured whey protein homogenised separately ; H 3 = Denatured whey protein homogenised in comb ination with manufactured cream ; LSM = Least-square mean ; F = F ratio ; S . D . = standard deviation of raw data ; * = p < 0 . 05 ; * * = p < 0 . 0 1 ; * * * = p < 0 . 00 1 ; F ratios without asterisks denote ' not s igni ficant ' .

176
provides the detailed calculations involved in determining that most of the added
B-lactoglobulin did not undergo any change during storage of cheese up to six
months.
HPLC profile of peptides in exudate from four week old cheese
HPLC profiles showed that the pattern of proteolysis was similar in all the trials.
Slight variation of the peak eluting at about 32.5 s (� 4,000 daltons) was observed
in a few trials. However, statistical analysis did not show any significant effect of
the treatment variables. Therefore, this variation could not be attributed to any
process treatment.
Conclusion: It was concluded that the pattern of proteolysis and the extent of
proteolysis progressed steadily and fairly uniformly for all the cheeses. Presence
of heat-denatured whey proteins did not affect proteolysis in Feta cheese.
7.6.5 Exudation of whey from Feta cheese during storage
Exudation of whey from Feta cheese was expressed in different ways as explained
in Appendix 4.2. The general trend in exudation was typical of Feta cheese. The
effect of the process variables on the exudation is reported in Table 7.6.
Effect of incorporation of heat-denatured whey protein: The exudation was not
significantly affected by the incorporation of heat-denatured whey protein. The
denatured whey protein did not improve the water-binding ability of the cheese.
Fat is present in cheese as an inert filler. The study on proteolysis of cheese
showed that the heat-denatured whey protein was present also as an inert material.
However, unlike fat, the denatured whey protein was not effective in reducing the
extent of exudation. From this study it is not clear as to why the denatured whey
protein was not effective in increasing the water-binding ability of cheese. The
study showed that mere presence of inert material in the cheese may not
necessarily be effective in reducing the amount of exudate. Further, the study
showed that the form in which the whey protein is incorporated may have an

177
Table 7 . 6 E ffect of process treatments on the exudation o f whey from Feta cheeses ( incorporated with heat-denatured whey proteins ) during storage at 1 0 ° C
Source of variation & levels
Exudate in gjkg cheese
Exudate in gjkg cheese moisture
Final MNFS ( % ) in cheese
% reduction in MNFS of cheese
Control Others
LSM
2 3 . 6 2 2 . 9
Added whey proteins (W)
w 2 2 4 . 0 w 1 2 1 . 8
Fat ( F) F 2 F 1
Homogenisation ( H )
H 1 H 2 H 3
2 0 . 7 2 5 . 1
2 2 . 7 2 1 . 2 2 4 . 8
F
0 . 8 2
0 . 02
0 . 9 3
0 . 3 3
LSM
4 7 . 4 4 4 . 6
4 5 . 8 4 3 . 4
4 1 . 1 4 8 . 1
4 4 . 8 4 1 . 7 4 7 . 3
F
0 . 11
0 . 11
0 . 8 2
0 . 17
LSM
6 7 . 5 6 7 . 8
6 8 . 8 6 6 . 8
6 7 . 8 6 7 . 7
6 7 . 5 6 7 . 4 6 8 . 5
F
0 . 07
0 . 07
0 . 0 1
0 . 4 9
LSM
0 . 8 1 0 . 7 5
0 . 7 2 0 . 7 7
0 . 7 0 0 . 7 9
0 . 7 6 0 . 7 2 0 . 7 5
Control = Cheese prepared without any added whey protein ; ' Others ' = Includes all trials ( 12 out of 1 5 ) in which
denatured whey protein was incorporated ;
F
0 . 2 9
0 . 2 3
0 . 68
0 . 07
W 2 = Incorporation of denatured whey protein ( on DM basis ) at the rate of 9 . 0 gjkg milk ;
W 1 = Incorporation of denatured whey protein ( on DM basis ) at the rate of 4 . 5 gjkg milk ;
F 2 = Fat level in cheesemilk adj usted in proportion to added whey protein ;
F 1 = Fat level not adj usted ;
H 1 = Denatured whey protein added without homogenisation ; H 2 = Denatured whey protein homogenised separately ; H 3 = Denatured whey protein homogenised in combination with
manufactured cream ;
LSM = Least-square mean ; F = F ratio ; F ratios without asterisks denote ' not s ignificant ' .
Details of calculation of exudation values are provided in Appendix 4 . 2 .
Table 7 . 6 continued in next page

Table 7 . 6 continued
Source o f variation & levels
Exudate in gjkg cheese
LSM
Interactions W X F 2 X 2 2 X 1 1 X 2 1 X 1
W X H 2 X 1 2 X 2 2 X 3 1 X 1 1 X 2 1 X 3
F X H 2 X 1 2 X 2 2 X 3 1 X 1 1 X 2 1 X 3
2 3 . 7 2 4 . 4 17 . 8 2 5 . 8
2 5 . 9 2 4 . 2 2 1 . 9 19 . 5 18 . 1 2 7 . 7
17 . 8 2 3 . 4 2 1 . 0 2 7 . 6 19 . 0 2 8 . 6
Storage time ( S )
F
0 . 66
0 . 8 0
0 . 9 6
2 week 1 3 . 4 2 9 . 04 4 week 14 . 0 * * * 6 week 1 6 . 0 9 week 18 . 6
12 week 2 0 . 8 15 week 2 3 . 8 2 0 week 2 8 . 5 2 6 week 3 1 . 3 3 9 week 3 9 . 6
S X W S X F S X H
S . D . 4 . 4 7
0 . 18 0 . 8 6 0 . 16
Exudate in gjkg cheese moisture
LSM
4 5 . 8 4 5 . 7 3 6 . 4 5 0 . 4
4 9 . 2 4 6 . 4 4 1 . 6 4 0 . 3 3 7 . 0 5 2 . 9
3 6 . 6 4 6 . 0 4 0 . 7 5 2 . 9 3 7 . 4 5 3 . 8
2 6 . 1 2 7 . 3 3 1 . 3 3 6 . 3 4 0 . 6 4 6 . 3 5 5 . 4 6 0 . 9 7 7 . 0
8 . 1
F
0 . 8 5
0 . 7 8
1 . 0 3
3 3 . 9 2 * * *
0 . 16 0 . 7 8 0 . 14
Final MNFS ( % ) in cheese
LSM
69 . 7 67 . 9 6 6 . 0 67 . 6
6 9 . 2 68 . 4 6 8 . 9 6 5 . 9 66 . 4 6 8 . 1
67 . 1 6 8 . 3 6 8 . 2 6 8 . 0 6 6 . 5 68 . 8
6 8 . 0 6 8 . 0 67 . 9 67 . 9 67 . 8 67 . 8 67 . 7 67 . 6 67 . 4
0 . 58
F
2 . 7 1
0 . 5 1
0 . 7 0
0 . 9 3
0 . 0 1 0 . 02 0 . 0
178
% reduction in MNFS of cheese
LSM
0 . 7 0 0 . 7 4 0 . 7 1 0 . 8 3
0 . 7 7 0 . 7 5 0 . 65 0 . 7 6 0 . 6 9 0 . 8 6
0 . 67 0 . 7 7 0 . 68 0 . 8 5 0 . 67 0 . 8 3
0 . 4 3 0 . 4 5 0 . 52 0 . 6 0 0 . 68 0 . 7 7 0 . 9 3 1 . 0 2 1 . 3 1
0 . 12
F
0 . 18
0 . 67
0 . 7 6
4 8 . 4 3 ***
0 . 4 0 0 . 8 9 0 . 13
- - - - - - - - - - - - - - - - - - - - - - - - - - - - - - - - - - - - - - - - - - - - - - - - - - - - - - - - - - - -
S = Storage time; W = Added whey proteins; F = Fat level; H = Homogenisation; W 2 = Incorporation of denatured whey protein (on DM basis) at the rate of 9.0 g/kg milk; W 1 = Incorporation of denatured whey protein (on DM basis) at the rate of 4.5 gjkg milk; F 2 = Fat level in cheesemilk adjusted in proportion to added whey protein; F 1 = Fat level not adjusted; H 1 = Denatured whey protein added without homogenisation; H 2 = Denatured whey protein homogenised separately; H 3 = Denatured whey protein homogenised in combination with manufactured cream; LSM = Least-square mean; F = F ratio; S.D. = Standard deviation of raw data; * * * = p < 0.001; F ratios without asterisks denote 'not significant'.

179
an important role (Lawrence, 1989) ; and that the complex formation between B
lactoglobulin and K-casein due to heat-denaturation of whey protein in milk as in
acid coagulated milk (Brooker, 1987) may be a prerequisite for improved water
holding ability of whey protein.
It must be noted that the presence of heat-denatured whey protein in cheese did
not make the problem of exudation any worse. The whey protein incorporated in
cheese were able to hold as much water as other proteins. This might be an useful
attribute when considered from other aspects such as increasing the yield of cheese.
Fat content in cheese: Adjustment of fat content of cheesemilk in proportion to the
incorporated denatured whey protein resulted in slight reduction of the amount of
exudate, though statistically it was not significant. This further confirms the
effectiveness of increased fat level in reducing the amount of exudate from Feta
cheese.
Homogenisation of heat-denatured whey protein: The different methods of
homogenisation of the heat-denatured whey protein did not significantly affect the
exudation from cheese. The amount of exudates from these cheeses were also very
close to that of control. Homogenisation of denatured whey protein with
manufactured cream was less effective when considered strictly from the view point
of reducing the amount of exudate from cheeses.
Interaction of the above variables: None of the interactions had a significant effect
on the exudation. However, the amount of exudate released was slightly lower in
cheeses made with the following combinations.
Incorporation of denatured whey protein at the lower level with fat level
adjusted.
Incorporation of denatured whey protein at the lower level without any
homogenisation.
Incorporation of denatured whey protein at the lower level with separate
homogenisation.
Addition of unhomogenised denatured whey protein with fat level adjusted.

180
Homogenisation of the added whey protein separately without adjusting the
fat level.
Some of these interactions which show a decreasing trend with the amount of
exudate might have a pronounced effect in reducing the rate of exudation in other
cheeses, e.g. Cheshire, where the moisture level is lower and the pH is higher. It
is likely that the statistical analysis has not picked up differences that may be
considered real or of practical importance. It is possible that if replication or a
larger number of trials were performed, some of these differences might have been
detected significant. It is not clear at this stage which of these combinations may
have a practical significance. The reader is advised to exercise caution in making
any definite conclusions.
Effect of Storage time: There was a steady and significant rise in the amount of
exudate with increase in storage time. The initial high amount of exudate was due
to the mechanical effect of vacuum packing the cheese. The interactions of storage
time with process treatments had no significant effect on the exudation.
7.7 Summary
Incorporation of heat-denatured whey protein (on DM basis) up to 9.0 g/kg
cheesemilk resulted in a significant increase in the cheese yield, and had no effect
on the exudation of whey from Feta cheese. Incorporation of heat-denatured whey
protein did not lead to any adverse effect on the acceptability of cheese.
Hydrolysis of incorporated denatured whey protein was not detected up to six
months. There was no indication of proteolysis of casein in Feta cheese being
retarded due to the presence of heat-denatured whey protein. Adjustment of fat
content of the cheese milk in proportion to incorporated heat-denatured whey
protein resulted in an increase in yield and slight reduction of the amount of
exudate from Feta cheese. While incorporation of heat-denatured whey protein in
cheesemilk by homogenising it in combination with the manufactured cream did
not affect the cheese yield, it resulted in a slight increase in the amount of exudate.

181
CHAPTER 8
EFFECT OF HOMOGENISATION, SOURCE OF MILK SOLIDS AND FAT
EMULSIFICATION ON THE EXUDATION OF WHEY FROM FETA CHEESE
DURING STORAGE
8.1 Introduction
A variation in the pressure of homogenisation from single stage, 4134 kPa ( 600 psi)
to double stage, 13780/3445 kPa (2000/500 psi) during preparation of
'manufactured cream' did not show any noticeable effect on the exudation of whey
(Chapter 6). However, this did not indicate whether the homogenisation process
per se has any effect on the exudation. A number of reports suggest that
homogenisation of milk leads to a decrease in syneresis in renneted gels during
manufacture of cheese (Vaikus et al., 1970; Emmons et al., 1980; Storry et al., 1983;
Walstra et al., 1985; Fox, 1987a). It is reasonable to expect a similar effect of
homogenisation on exudation. Thus it became necessary to establish whether
homogenisation of cream affected the exudation during storage of Feta cheese.
All the experiments related to Feta cheese have been performed using recombined
milks. Fresh frozen milkfat for recombining (FFMR) and skim milk powder (SMP)
were the source of milk solids. The fat in the recombined milk differs from the fat
in fresh milk due to the absence of milk fat globule membrane (MFGM) and the
effects of homogenisation. The properties of solids-not-fat in recombined milk may
differ from solids-not-fat in fresh milk due to the concentration and drying effects
during powder making. The extent to which these variations affected exudation was
uncertain. The role of combinations of milksolid from fresh milks and recombined
milk on exudation was another factor that needed to be studied.
Study on the exudation of whey from Feta cheese (from recombined milk) during
storage (Chapter 6) revealed that increase in fat level decreased the amount of
exudate. However, the mechanism of this was not clear. It was also uncertain
whether fat would be effective in reducing the amount of exudate when cheese was
made from unhomogenised milk. Syneresis in renneted gels during cheese

182
manufacture is reduced by increase in fat content (Storry et al., 1983). This may
be explained as possibly due to fat mechanically blocking casein-casein interactions,
that are likely to cause syneresis (Lelievre & Creamer, 1978); or fat globules acting
as filler particles in an aqueous matrix of swollen proteinaceous material (Luyten,
1988). The decreased syneresis due to increased fat may be similar to the effect
of fat impeding the salt diffusion in brined cheese (Geurts et al., 1974 ) . It is
proposed that the effect of fat on the exudation of whey from Feta cheese may be
considered similar to that during syneresis in renneted gels during cheese
manufacture. The effect may, however, be diminished due to the considerable
increase in concentration of milk solids and the decrease in moisture content.
Casein provides the basic structure in cheese (Lawrence et al., 1983). In low pH
cheeses water is held within the interstitial structure of the three-dimensional
casein network in an inert state (Creamer & Olson, 1982). In cheese from
unhomogenised milk, fat globules are trapped between the casein chains and
function as inert filler. However, in homogenised milks the fat particles
predominantly contain casein at the fat-water interface (Mulder & Walstra, 1974)
and therefore participate in the formation of the casein matrix in cheese (Vliet &
Dentener-Kikkert, 1982; Walstra & Vliet, 1986). Such fat particles function as
permanent cross-links (Vliet & Dentener-Kikkert, 1982; Walstra & Vliet, 1986).
This theory was used to explain the effect of homogenisation in the manufacture
of Halloumi cheese and Mozzarella cheese from recombined milks (Lelievre et al.,
1990b ) . The participation of fat globules as part of the casein matrix, due to
homogenisation, may be the cause for reduced syneresis during cheese manufacture
and the subsequent effect on the extent of exudation during storage of cheese. A
study of the role of material adsorbed to fat globules was expected to provide
evidence on the proposed role of fat on the exudation.
Section One of this Chapter includes the study of the effect of homogenisation and
source of milk solids on the exudation. In Section Two the effect of emulsification
of fat with different emulsifying agents on the exudation is described.

183
SECTION ONE
8.2 EFFECT OF HOMOGENISATION AND SOURCE OF MILK SOLIDS
ON THE EXUDATION OF WHEY FROM FETA CHEESE DURING
STORAGE
8.2.1 Experimental
Feta cheese was manufactured using the procedure outlined in Chapter 4 except
for variations in the combinations of 'creams' and 'skim milks' from different
sources as listed in Table 8 .1 . Raw whole milk was obtained from the bulk supply
from Tui Milk Products Ltd., Palmerston North. Skim milk and fresh cream (25%
fat) were obtained by separation of whole milk. Cream was homogenised at a
pressure of 6,890 kPa (1 ,000 psi), wherever applicable. After standardisation of
recombined milk to a protein to fat ratio of 0.73, the milk was diluted with water
so that the protein content in the milk was close to the average protein in whole
milk ( �3.3% ).
The experiment was based on one-way classification of analysis of variance. A total
of 10 trials, spread over two weeks, were performed using two replications of each
combination. The trials were randomly selected in each replicate. The sources of
variation were 'replicates' and 'source of milk solids'. The data were analysed using
the statistical package of SAS Institute Inc. (1985).
8.2.2 Analytical methods: Milk and whey were analysed for fat, protein, lactose and
total solids by the Milko-Scan. Milk was also analysed for calcium ( complexometric
method) and mean diameter of fat globules (spectroturbidimetric method). Feta
cheese at three weeks was analysed for pH, fat (Schmidt-Bonzynski-Ratzlaff
method), protein (Kjeldahl), moisture, NaCl (potentiometric titration) and calcium
(complexometric). Exudate from Feta cheese at three weeks was analysed for total
solids, NaCl (potentiometric), calcium (complexometric) and protein (Kjeldahl).
The distribution pattern of low molecular weight peptides in exudate from four
week old Feta was estimated by HPLC. Proteolysis in Feta cheese and exudate at
four weeks was estimated by Urea-PAGE. The proteins adsorbed to fat globule
surface in Feta cheeses were extracted and identified by SDS-PAGE (after brining

184
and at four weeks after manufacture). Exudation of whey from cheese was
measured at selected intervals.
Details of the above analytical methods are outlined in Chapter 4 and
Appendix 4.1.
Table 8.1 Variables used in cheese manufacture : combinations of creams and
skim milks from different sources used for preparation of
cheesemilk
Source of creams Source of skim milks
Manufactured cream 1 Reconstituted skim milk
Pasteurised, Reconstituted skim milk
homogenised cream2 (RSM)
Pasteurised, Pasteurised skim milk
unhomogenised cream2
Manufactured cream 1 Pasteurised skim milk
Pasteurised, Pasteurised skim milk
homogenised cream2
1 Prepared from FFMR and RSM ( 1 :3 ratio) ; 2 Fresh cream.
8.2.3 Sensory evaluation
Reference in the
Tables/ Appendices
A (control)
B
C (unhomogenised
milk or cream)
D
E
Cheese was evaluated by a sensory panel at eight weeks after manufacture for
flavour and textural characteristics. Details of the procedure for sensory evaluation
are provided in Chapter 4.

8.2.4 Results and discussion
This is described under the following headings:
(i) Manufacturing aspects and quality of cheese.
(ii) Composition.
(iii) Proteolysis in cheese during storage.
(iv) Proteins adsorbed to surface of fat globules.
(v) Exudation.
(i) Manufacturing aspects and quality of cheese
185
Cheese manufacture: There were no major problems in cheesemaking. All the
cheeses were very similar and typical of Feta cheese (Chapter 6.3), except for that
made using unhomogenised fresh cream. Cheese made using unhomogenised fresh
cream was elastic and continuous. During the manufacture of cheese there was
increase in the syneresis of whey and the whey was turbid in appearance.
Sensory evaluation (Appendix 8.1) : The 'control' cheese (reconstituted skim milk
& manufactured cream) was perceived significantly more acidic than other cheeses.
There might have been an increased microbial activity because of a slightly lower
salt-in-moisture (S/M) concentration in cheese. The control cheese was also rated
as slightly oxidised and bitter. This could reflect the panel's reduced preference for
a recombined milk cheese (control) in comparison to the other cheeses. Cheese
made using unhomogenised fresh cream was described as 'tough', which may be
attributed to the reduced moisture in non-fat substance (MNFS) in the cheese.
In general, except for cheese made using unhomogenised fresh cream, all other
cheeses resembled typical Feta cheese.
(ii) Composition
Composition of cheesemilk: Composition of cheesemilk was alike for the replicates
and treatments, except for calcium and fat globule size (Appendix 8.2). The
variation in Ca2+ was not noticed when expressed as Ca2+ /SNF (g/100 g). The
variation in the calcium contents may therefore be attributed to the use of

186
milk-solids from different sources. As expected, the cheesemilk usmg
unhomogenised fresh cream had a significantly higher mean diameter of fat
globules in comparison to all other cheesemilks. Most other variations are not of
practical concern and may be attributed to experimental error.
Composition of whey: Appendix 8.3 shows the composition of whey obtained during
manufacture of cheeses. Whey obtained during manufacture of cheese made using
unhomogenised fresh cream had higher fat. The mechanism of reduced fat loss in
whey with the use of homogenised creams may be attributed to the increased
retention of casein-coated fat globules in the casein matrix of curd.
Composition of cheese: The composition of cheeses before brining, after brining,
and at three weeks is shown in Appendices 8.4, 8.5 and 8.6 respectively. Cheese
made with unhomogenised fresh cream had increased syneresis of whey during
manufacture of cheese. This is consistent with other findings (Vaikus et al., 1970;
Emmons et al., 1980; Storry et al., 1983) . The increase in syneresis resulted in a
significantly reduced moisture and MNFS content in the cheese. Cheeses made
using reconstituted skim milk (RSM) had slightly higher moisture. This may be
attributed to a reduced syneresis during cheese manufacture due to the presence
of more heat denatured whey protein in RSM. Cheeses made using skim milks had
low moisture in comparison to cheeses made using RSM, and consequently a higher
FDM content.
Composition of exudate: Composition of exudates was generally typical. Variations
in composition of exudates were mostly observed in replicates (Appendix 8.7). The
cause of variation in the protein content of replicates was not clear. Exudate
available was insufficient to allow analyses in duplicate, and therefore the results
could not be verified.
(iii) Proteolysis in cheese during storage
Urea-PAGE on cheeses at four weeks: The protein bands in the
electrophoretogram showed a similar pattern of proteolysis in all cheeses. The
ratio of areas of a51-casein to .B-casein determined by densitometry was used to

187
obtain an approximate idea of the rate of proteolysis in cheeses (Table 8.2) . It has
been observed before that B-casein does not proteolyse in the first four weeks of
storage. A higher ratio of a51-casein to B-casein would therefore represent reduced
hydrolysis of as1-casein and a decreased proteolysis. Reduced proteolysis was
observed in cheese made using unhomogenised fresh cream. This could have been
due to a significantly lower moisture in cheese. Reduced proteolysis was also
observed in cheese made using a combination of skim milk and homogenised
cream. The cause of this is not clear.
Table 8 . 2 Results from Urea-PAGE on four week old cheeses to
assess the rate of proteolysi s ( Densitometer
readings )
S ource of variation
Replicates
1
2
Treatments
A ( control )
B c D
E
S . D .
Ratio of areas o f
a51-casein t o .B-casein
( Least squared mean values )
0 . 8 1
0 . 8 6
0 . 7 6
0 . 77
0 . 9 6*
0 . 77
0 . 9 0 *
0 . 04
A = Milk made from manufactured cream & reconstituted skim milk;
B = Milk made from homogenised fresh cream & reconstituted skim milk;
C = Milk made from fresh cream (unhomogenised) & skim milk;
D = Milk made from manufactured cream and skim milk;
E = Milk made from homogenised fresh cream and skim milk;
S.D. = Standard deviation of raw data; * = p < 0.05.

188
HPLC profiles of exudates: The low molecular weight profile (500 to 10,000
daltons) of peptides in exudates from four week old cheeses showed no significant
variations in either the area or size of the peaks, or the total number of peaks.
This indicated a similar pattern of degradation of high molecular weight peptides
for all cheeses.
It was concluded that the pattern of proteolysis was similar in all cheeses. The rate
of proteolysis was slower in cheese made using unhomogenised fresh cream.
(iv) Proteins adsorbed to surface of fat globules
Proteins adsorbed to surface of fat globules in cheese were estimated at two stages;
after brining and after four weeks of storage. Table 8.3 provides an estimate of the
extent to which casein proteins are adsorbed to the fat globule surface. The units
for the area are arbitrary and are for the same amount of fat in cheese.
No change in the type and the concentration of proteins adsorbed to the surface
of fat globules at brining and four weeks was detected. SDS-PAGE of fat globules
from cheeses made using homogenised creams showed the presence of casein and
whey proteins, which was similar to that observed from homogenised milks
(Anderson et al., 1977; Darling & Butcher, 1978). Markedly more protein was
adsorbed to the fat globule surface in cheese made using manufactured cream than
those made from cream (fresh). Cheese made using unhomogenised fresh cream
had little or no protein adsorbed to the fat globule surface. This observation may
be explained by the amount of milk fat globule membrane (MFGM) material
present, and the relatively small surface area of the fat globules. Manufactured
cream prepared from FFMR has little MFGM material, and therefore most of the
fat globule surface are coated with milk proteins during homogenisation. MFGM
in fresh cream is mostly intact, and provides a coating to the surface of the fat
globules. However, in homogenised fresh cream, since the amount of available
MFGM material is not sufficient to cover the increased fat globule surface area
due to homogenisation, skim-milk proteins adsorb to some of the newly created fat
globule surface (Darling & Butcher, 1978; McPherson & Kitchen, 1983). The

189
MFGM material is intact in unhomogenised fresh cream and does not allow other
milk proteins to be adsorbed onto the fat globule surface in cheese.
Table 8.3 Effect of homogenisation and 'milk solids source' on the amount of
casein proteins adsorbed to surface of fat globules in cheese
(densitometer readings of SDS-gel)
Source of
variation
Replicates
1
2
Treatments
A (control)
B
c D
E
Storage time
O week
4 weeks
S.D.
Total area of casein proteins1
(Least square mean)
1.02
1 .19
2.24
0.73 * *
0.00* *
2.06
0.5 1 * *
1 .06
1 . 15
0.43
1 The units for area are arbitrary and are for the same amount of fat in cheese;
A = Milk made from manufactured cream & reconstituted skim milk;
B = Milk made from homogenised fresh cream & reconstituted skim milk;
C = Milk made from fresh cream (unhomogenised) & skim milk;
D = Milk made from manufactured cream and skim milk;
E = Milk made from homogenised fresh cream and skim milk;
S.D. = Standard deviation of raw data; * * = p < 0.01.

190
(v) Exudation in cheeses during storage
Least-squared means and 'F ratios' for the amount of exudate from Feta cheeses
as affected by source of milk solids and homogenisation at different periods of
storage are shown in Table 8.4.
There was no difference in the amount of exudate between the replicates.
Exudation from all cheeses, except for cheese made using unhomogenised fresh
cream, was similar. The amount of exudate from all the cheeses increased with
time. There was no significant effect of interaction of treatments on the exudation
during storage.
Cheese made using unhomogenised fresh cream released significantly more amount
of exudate than the control (FFMR & RSM). This difference was noticed when
exudation was expressed in terms of 'final MNFS' or '% reduction in MNFS'.
Exudation was not found to be statistically significant when expressed as
'g exudate/kg cheese' or 'g exudate/kg moisture in cheese' because the initial
moisture content (and MNFS) of cheese made using unhomogenised fresh cream
was significantly low.
In the cheeses made using homogenised creams, fat globules coated with casein
(Mulder & Walstra, 1974) formed a part of the casein matrix (Vliet &
Dentener-Kikkert, 1982; Walstra & Vliet, 1986) and were effective in blocking or
retarding the flow of moisture in the casein matrix.
Cheeses made using manufactured cream contained more fat-bound protein than
cheeses made using homogenised cream (Table 8.3) . If participation of fat globules
in the casein matrix of the cheese was the only factor to restrict the process of
exudation, the cheeses made with manufactured cream should have had the least
amount of exudate. As this did not happen, it indicates that exudation is influenced
by other factors. There is evidence that in addition to casein and whey proteins,
the surface of the fat globule from homogenised milk consists of MFGM material
(Anderson et al., 1977; Darling & Butcher, 1978). It is therefore expected that fat
globules in cheeses made using homogenised cream (fresh) will also consist of

191
Table 8 . 4 E ffect of homogenisation of cream and selected sources of milk sol ids in cheesemilk on the exudation8 of whey from Feta cheese during storage
Source Exudate in Exudate in Final of gjkg cheese gjkg MNFS ( % ) variation moisture
in cheese - - - - - - - - - - - - - - - - - - - - - - - - - - - - - - - -
LSM F LSM F LSM F
Repl icates 3 . 68 3 . 4 5 6 . 8 6
1 3 9 . 8 7 8 . 9 6 7 . 6 2 4 2 . 9 8 3 . 9 6 9 . 1
Treatments
A ( control ) 4 4 . 4 B 4 1 . 9 c 3 9 . 4 D 3 9 . 3 E 4 1 . 8
1 . 4 4
8 2 . 8 7 9 . 3 8 4 . 6 7 7 . 6 8 2 . 8
0 . 9 0
6 9 . 5 69 . 6 6 5 . 1 * * 6 8 . 7 6 9 . 0
8 . 4 3 *
� 0 reduction in MNFS
- - - - - - - - - - - -
LSM
1 . 3 8 1 . 3 6
1 . 3 2 1 . 2 0 1 . 6 8 * 1 . 3 0 1 . 3 5
F
0 . 2 1
9 . 52 *
- - - - - - - - - - - - - - - - - - - - - - - - - - - - - - - - - - - - - - - - - - - - - - - - - - - - - - - - - - -
Storage time 152 . 5 * * * 157 . 4 * * * 14 6 . 9 * * * 14 3 . 4***
2 weeks 19 . 6 4 weeks 2 4 . 4 6 weeks 2 9 . 0 9 weeks 3 7 . 3
12 weeks 4 3 . 8 1 5 weeks 4 9 . 6 2 0 weeks 6 2 . 3 2 6 weeks 6 5 . 0
Interaction Treatments X Storage time
S . D . c . v . ( % )
4 . 3 3 1 0 . 4 6
1 . 4 8
3 8 . 8 4 8 . 3 57 . 4 7 3 . 5 8 6 . 1 9 7 . 2
1 2 2 . 4 1 2 7 . 8
8 . 3 3 1 0 . 2 3
1 . 0 8
6 8 . 9 6 8 . 8 6 8 . 7 6 8 . 5 6 8 . 3 68 . 2 6 7 . 9 67 . 8
0 . 1 0 5 0 . 15
0 . 66
0 . 64 0 . 7 9 0 . 9 5 1 . 2 2 1 . 4 4 1 . 6 3 2 . 10 2 . 2 0
0 . 1 5 3 1 1 . 1 8
a Details for calculation of exudation values are provided i n Appendix 4.2;
A = Milk made from manufactured cream & reconstituted skim milk;
0 . 59
B = Milk made from homogenised fresh cream & reconstituted skim milk; C = Milk made from fresh cream (unhomogenised) & skim milk; D = Milk made from manufactured cream and skim milk; E = Milk made from homogenised fresh cream and skim milk; F = F ratio; LSM = Least-square mean; S.D. = Standard deviation of raw data; C. V. = Coefficient of variation; * = p < 0.05 ; * * = p < 0.01; * * * = p < 0.001; F values without asterisks are 'not significant' ; Individual LSM values marked with asterisks show their significant variation in comparison to control.

192
MFGM material. Indirect evidence for this has been already shown earlier in this
Chapter in the form of absence of proteins on the fat globule surface. MFGM
material are known to contain phospholipid as a principal component. It is
possible that phospholipid-phospholipid interaction keeps the fat globules close to
each other, or may be in contact with each other. This chain or cluster of fat
globules may restrict the flow of moisture and retard the process of exudation.
This is consistent with a reduced rate of exudation from Feta cheese due to coating
of fat globules with lecithin, a phospholipid (described in Section Two).
Variation in the source of skim milks (fresh or reconstituted) did not appear to
have any effect on the exudation.
8.2.5 Summary and conclusion
Feta cheese made using homogenised creams had reduced syneresis of whey during
manufacture, and consequently a significantly higher amount of MNFS than cheese
made using unhomogenised fresh cream. The amounts of exudate from both these
cheeses were similar when expressed as a percentage of the weight of cheese.
However, it was apparent that the cheese made using unhomogenised fresh cream
had a higher rate of exudation when expressed as a percentage of MNFS.
Homogenisation of cream (fresh or manufactured) was therefore an effective
means of retarding exudation of whey from Feta cheese during storage.
The source of skim milk (fresh or reconstituted) did not affect exudation.
The relative amounts of protein adsorbed to fat globule surface was negligible in
cheese made from unhomogenised fresh cream, moderate in cheese made from
homogenised fresh cream, and substantial in cheese made from manufactured
cream. This showed that the presence of MFGM deters the adsorption of protein
onto the fat globule surface.
Exudation is possibly influenced by the size of the fat globules, casein-coating on
the fat globules and the type of material adsorbed to the fat globule surface.

SECTION TWO
8.3 EFFECT OF FAT EMULSIFICATION ON THE EXUDATION OF
WHEY FROM FETA CHEESE DURING STORAGE
8.3.1 Introduction
193
The objective of this study was to investigate the mechanism by which fat and
homogenisation affect the rate of exudation.
The scope of this study was:
To determine the influence of material adsorbed to fat globule surface on
emulsion stability of fat.
To study the effect of participation of fat in the protein (casein) matrix.
To confirm the influence of fat on exudation.
Before proceeding to the major experimental part it was necessary to perform some
preliminary studies. These are described in the first part of this section. The
second part describes the effect of material adsorbed to surface of fat globule on
exudation.
8.3.2 PRELIMINARY STUDIES
The preliminary study involved:
Selection of a set of emulsifying agents.
Optimisation of the rate of addition of emulsifying agents.
Standardisation of the method for preparing 'manufactured cream'.
An emulsifying agent assists in the formation of an emulsion, prevents or inhibits
the creaming and coalescence of oil droplets, and contributes to the flow properties
and mouthfeel of the product (Marrs et al., 1989). In this experiment both proteins
and non-proteins used for emulsifying milkfat in the aqueous phase to form an
oil-in-water emulsion have been referred to as emulsifying agents. Caseins are
known for their emulsifying abilities (Shimp, 1985), and whey proteins for their

194
functional properties (Marshall & Harper, 1988). Thus skim milk powder, which
contains casein and whey proteins, is referred as an emulsifying agent in the text.
8.3.2. 1 Experimental design
Selection of emulsifYing agents: This was guided by the following considerations:
the material naturally occurring in the MFGM, ability to form a suitable emulsion
with FFMR and the commercial adaptability of the process for cheese manufacture.
Skim Milk Powder (SMP) was selected as the 'control'. Lecithin was chosen to
represent the phospholipids, a major fraction of MFGM. Sodium caseinate was
selected because of its excellent emulsifying properties, and the fact that in
homogenised milks casein proteins are known to be preferentially adsorbed
(Dickinson et al., 1989a). Whey protein was chosen as an emulsifying agent
because it was expected to provide an inert coating on the surface of fat globules.
This was expected to provide explanation for the effect of incorporation of
denatured whey proteins on exudation (Chapter 7), and also to provide an
indication of any preferential adsorption of proteins to the fat globule surface
irrespective of the initial coating. A mixture of sodium caseinate and lecithin was
expected to be nearest to that of the control. Butter milk powder was chosen
because it is cheap, easily available and could be used as 'lecithin-substitute' for
commercial applications. Depending upon concentration and type, surfactants are
known to displace milk proteins partly or completely (Oortwijn & Walstra, 1979;
Walstra & Jenness, 1984; Feitjer et al., 1987). Glycero mono-stearate (GMS), and
combinations of Tween-60 & Span-60 were intended to be used as surfactants that
have good emulsifying ability but are not naturally present in MFGM.
Preparation of 'manufactured cream': Manufactured cream was to be prepared
using a mixture of FFMR, water and the emulsifying agent. The rate of addition
of emulsifying agents was to be optimised with the following considerations:
To have similar fat globule size for all the manufactured creams because the
average diameter of the fat globules correlates well with the emulsion
stability of cream (Aguilera & Kessler, 1988).

195
To have a certain minimum emulsion stability suitable for cheese
manufacture.
To ensure that the addition of protein emulsifying agents resulted in
minimal additional protein to the cheesemilk.
8.3.2.2 Experimental
Materials: Low heat SMP from the same batch was used throughout the
experiment. Sodium caseinate (Alanate - 180, New Zealand Dairy Board) of the
following typical composition was used: protein = 92. 7%, lactose = 0. 1 %,
ash = 3.6%, moisture = 3.5%, milkfat = 0.7%, pH = 6.6, sodium = 1.3%, and
calcium = 0.02%. A typical concentration of whey protein concentrate (WPC)
powder (Alacen - 312, New Zealand Dairy Board) was: Total Nitrogen = 12.83%,
Lactose = 5.1 %, Fat = 3.93%, moisture = 5.32%, ash = 2.59%,
calcium = 105 mM/kg, NPN = 0.78%, NCN = 12.02%. Composition of butter
milk powder (made in NZDRI) was: fat = 9.0%, protein = 34.5%,
lactose = 45.5%, minerals = 7.2%, moisture = 3.8%. Deodorised lecithin
(Blendmax 322, code no. 6230-00, PO Box - 1400, Fort Wayne, Indiana) was used.
Tween-60 and Span-60 were obtained from Sigma chemical company, USA.
Preparation of 'manufactured cream': The process for preparation of manufactured
cream is outlined in Fig. 8 .1 . During the preparation of manufactured creams the
emulsifying agents were used as follows: lecithin and Span-60 were dissolved in
FFMR at 60 o C; SMP was dissolved in water at 40 • C; and sodium caseinate, WPC
powder, Tween-60 and butter milk powder were dissolved in water at 60 ° C. The
desired fat globule size in the cream was targeted to 0.5-0.6 }.Lm, which was the
approximate value for the control (using SMP as the emulsifying agent).

196
Fresh frozen milkfat for recombining [.....
(FFMR ), 60 ° C: 1 Qart
Emulsifying agent dissolved in
water or fat (as applicable)
Water, 60 ° C : :2 pans / '
Temporary emulsion: Ultra-turraxing, 8,000 rpm, 60 ° C, 5 min
Two stage homogenisation, ( 13,780/3,445 kPa), single pass, 55 ° C
I; Manufactured cream / Emulsified cream � 25% fat
Fig. 8.1 Process for preparation of 'manufactured cream'.
8.3.2.3 Analytical methods: Manufactured cream was tested for average diameter
of the fat globules (spectroturbidimetric method) and emulsion stability.
Manufactured cream was mixed with reconstituted skim milk (RSM) in proportions
of 1 :4 ratio to obtain a composition close to that in cheesemilk, and tested for
emulsion stability. Aliquots of RSM were incorporated with emulsifying agents and
analysed for gel strength (Formagraph). The detailed procedures for the analytical
methods are outlined in Chapter 4.
8.3.2.4 Results and discussion
Optimisation of the amount of emulsifYing agents: Based on the effect of the use
of emulsifying agents (as compiled in Table 8.5) on the properties of manufactured
cream (mean diameter of fat globules and the emulsion stability), the rate of

Table 8 . 5 Effect of use of selected emulsifying agents on the properties of ' manufactured cream ' and recombined milk
- - - - - - - - - - - - - - - - - - - - - - - - - - - - - - - - - - - - - - - - - - - - - - - - - - - - - - - - - - - - - - - - - - - - - - - - - - - - - - - - - - - - - - - - - - - - - - - -
E mu l s i fy i ng agent
E m u l s i fier to FFMR ratio ( % )
P/F ratio in cream
Mean d i ameter of fat globules ( J.'m)
Observation of cream1 stored for 18 h at 2 0°C
Observation of recombined milk stored for 18 h at 2 0°C
- - - - - - - - - - - - - - - - - - - - - - - - - - - - - - - - - - - - - - - - - - - - - - - - - - - - - - - - - - - - - - - - - - - - - - - - - - - - - - - - - - - - - - - - - - - - - - - -
SMP ( Control ) 3 1 . 5 0 . 11 0 . 66 Thin layer of fat Very thin cream on top . layer .
3 1 . 5 0 . 11 0 . 55 No cream plug . A Very thin cream small ring of fat layer .
Repl icates sticking to glass surface .
3 1 . 5 0 . 11 0 . 47 3 % cream layer . slight cream layer . 3 1 . 5 0 . 11 0 . 54 No cream layer . S l ight cream layer .
- - - - - - - - - - - - - - - - - - - - - - - - - - - - - - - - - - - - - - - - - - - - - - - - - - - - - - - - - - - - - - - - - - - - - - - - - - - - - - - - - - - - - - - - - - - - - - - -
Sodium caseinate
Butter powder
milk
WPC powder
5 . 55 4 . 4 0 2 . 20
12 . 5
12 . 5 10 . 0
5 . 0
0 . 05 1 0 . 04 0 0 . 02 0
0 . 04 3
0 . 10 0 . 08 0 . 04
0 . 56 0 . 7 2 0 . 66
1 . 07
0 . 55 0 . 54 0 . 67
49% cream layer . 4 0% cream layer . 4 3% cream layer .
Viscous and thick cream .
Thin cream l ayer . No cream plug . <1 . 0% cream plug .
Thin fat layer . Thin fat layer . Thin fat layer .
Cream separation .
Thin cream layer . Thin cream layer . Thin cream layer .
1 cream layers quoted in percentages indicate the percent of a thick top layer in the entire cream .
f-' \0 -...)

Table 8 . 5 continued Effect of use of selected emulsifying agents on the properties of ' manufactured cream ' and recombined milk
E mu l s i fy i n g agent
Lecithin
E mu l s i fier to FFMR ratio ( % )
1 . 0
2 . 0
4 . 0 4 . 0 8 . 0 8 . 0
Lecithin & sodium caseinate ( 1 : 5 . 5 ) 3 . 28 ( 1 : 9 . 0 ) 2 . 45
Span- 6 0 & Tween-6 0 ( 1 . 0 . 5 ) 1 . 0 .
( 1 : 0 . 47 ) 2 . 0 ( 1 . 1 . 08 ) 2 . 0 . ( 1 : 2 . 57 ) 2 . 0 ( 1 . 5 . 67 ) 2 . 0 . ( 0 : 1 . 0 ) 2 . 0
P/F ratio in cream
-
-
----
0 . 02 6 0 . 02 0
-
-----
Mean d iameter of fat globules (J.Lm)
4 . 05
2 . 37
0 . 80 0 . 61 0 . 58 0 . 58
0 . 56 0 . 59
3 . 86
1 . 21 0 . 99 0 . 71 0 . 89 0 . 55
Observation of cream1 stored for 18 h at 2 0°C
8% cream layer .
3 % cream plug .
8 % cream layer . 7% cream layer . 2 % cream layer . 2 % cream layer .
1% cream layer . 2 . 5% cream plug .
1% fat & 11% cream . 3 % cream layer . 2 % cream layer . 1% cream layer . 1% cream layer . 1% cream layer . 1% cream layer .
Observation of recombined milk stored for 18 h at 2 0°C
sol id fat layer . Phase separation on warming . Thick cream layer persists on warming . Cream layer on top . Thick layer on top . Cream layer on top . Thick cream on top .
Thin fat layer . Thin fat layer . Dissolved on warming .
Fat separation on warming . S light cream layer . Sl ight cream layer . S l ight cream layer . Sl ight cream layer . Sl ight cream layer .
- - ---------------------- ---------------- - --------------------- - - - - - - - - - - - - - - - - ------------------1 Cream layers quoted in percentages indicate the percent of a thick top layer in the entire cream .
� \0 00

199
addition of emulsifying agents in proportion to the FFMR (%) were selected as
reported in Table 8.6. Wit et al., (1977) reported that to achieve sufficient
dispersion stability in 4% oil-in-water emulsion, a protein concentration to a level
of protein to fat ratio of 0.1 is required, and that more protein would be required
for 35% oil-in-water emulsions. In this instance the ratios are much lower. This
is probably because only a temporary emulsion was required. The emulsion needed
to be stable until the drainage of whey during cheese manufacture, which is about
4 h from the time milk is inoculated with the starter.
Butter milk powder was not used as an emulsifying agent because it did not provide
a satisfactory emulsion. Addition of Span-60 in admixture with Tween-60 was not
necessary as Tween-60 on its own provided a satisfactory emulsion.
An accurate estimate of the mean diameter of the fat globules in manufactured
cream made using lecithin could not be determined as the experimental turbidity
curve did not fit the theoretical standard curves. This indicated that the fat
globules in manufactured cream did not have a monomodal size distribution or that
they were aggregated. This is consistent with the findings that milk fat globules
associated with appreciable amounts of phospholipids in recombined milk are not
very stable (Melsen & Walstra, 1989). This showed the unsuitability of lecithin as
an emulsifying agent.
Table 8 . 6 Proportion of emulsifying agents
Emulsifying
agent
SMP ( Control )
Sodium caseinate
Lecithin
Sodium caseinate & l ecithin ( 8 . 8 : 1 )
Tween-6 0
WPC powder
Proportion
to FFMR ( % )
3 1 . 5
2 . 2
6 . 0
2 . 4 5
2 . 0
5 . 0
P/F
ratio
0 . 1 1
0 . 02
0 . 02
0 . 04

200
Gel strength of renneted 'emulsified milks': The influence of the protein and
non-protein emulsifying agents on rennet-induced gels in milk was studied. A
Formagraph was used to measure the on-set of gelation and gel-strength of
renneted skim milks made with the emulsifying agents as described m
Chapter 4.2.9. The Formagraph curves (Fig. 8.2) show the on-set of gel formation,
the time taken for the bell-shaped curve to reach a width of 15 mm (expressed as
the distance from the point of on-set of gel formation = D15) and the gel-strength
40 min after rennet addition [expressed as the width (L40) of the bell-shaped curve].
The results are tabulated in Table 8.7.
Rennet coagulation of milks with WPC powder, lecithin and SMP (control)
occurred at the same time. The coagulation occurred a little earlier with lecithin
and Tween-60, and was slightly delayed with sodium caseinate. From the distance
measured for attaining a width of 15 mm, it was observed that milks with sodium
caseinate and lecithin took a slightly longer time while all others took a similar
time. This meant that the gel firmed slowly in these two milks. From the width
of the bell-shape after 40 min it was found that milk with Tween-60 had a
considerably weaker gel (29.3 mm) and all others were alike (41 - 47 mm).
The above results show that RSM with lecithin and Tween-60 have slightly different gel forming characteristics than control. The effect of lecithin is doubtful because
it did not dissolve well in RSM. It was hoped that cheese manufacture would not
be significantly affected because of the slight variations in the gel strengths.
Table 8 . 7 Effect of emulsifying agents on the rennet coagulation properties o f skim milk
Emulsifying Distance in mm Width of the bell-shape agent for a spread of (mm) after 4 0 min o f
1 5 mm1 = D15 rennet addi tion2 = L40
SMP 9 . 6 4 6 . 5
Sodium 12 . 2 5 4 2 . 8 5 caseinate
WPC powder 9 . 15 4 6 . 65
Tween- 6 0 9 . 6 2 9 . 3
Lecithin3 12 . 3 4 1 . 0
1 The distance is a measure of the time taken from the on-set of coagulation for the coagulation firmness to reach a fixed value. 2 The width is a measure of curd firmness after a ftxed time (40 min) of addition of rennet. 3 Results may not be very accurate as lecithin did not mix completely in the aqueous phase.

Emu ls i fy ing agents : Skim mi lk powder Sodium caseinate WPC powder Tween-60 Lecith in
I �-�-
1 I I I l l 1 \ l 1 b Ji ;•, , . ' ./· ••••• •••• ••• •
� ..
•' / ·· , /.. ., / ··•.. ' . .. �·' '•. / · . . · ,.-· ----.t ; , / ._ / \ ;'
-' 1 I : \ · I· 4 i I I
. · � '. ! ( \
I I · 1 5 mm/� \. ' / \ �� X \ ,1\
I \ ;\ ' I
(
!, "'
Fig. 8.2
Note:
L4o
I -..1 '1
Fonnagraph curves showing the start ing t ime of gel formation a n d the su bsequent firmi ng o f gels i n ren neted milks p repa red w i t h d i fferent emulsifying agents. The original cu rves have been reduced in size.
The point at which the bell-shaped curve starts to form is the t ime when the gel starts to form. 0 15 i ndicates the d istance i n mm (a function of t ime) unti l a width of 15 mm is formed. L-1o i ndicates the width in mm after 40 m in from add ing rennet.
40 min
10 0 ,.._,.

202
8.3.3 EFFECT OF MATERIAL ADSORBED TO SURFACE OF FAT GLOBULE
IN FETA CHEESE ON THE EXUDATION
The objective of the following investigation was to gain an understanding of the effect
of material adsorbed to fat globule surface on exudation.
8.3.3 . 1 Experimental
Selected emulsifying agents were used in the proportions established earlier for
preparation of manufactured cream (Table 8 .6) . Details of preparation of manufactured
cream have been described in the preliminary studies (Chapter 8 . 3 .2 & Fig . 8 . 1 ) . The
method of manufacture of Feta cheese was similar to that described in Chapter 6 (Fig.
6 . 1 & Appendix 6.2) .
Ingredients used in the preparation of manufactured cream were FFMR, water and the
emulsifying agent. SMP was used only for control. Thus, the manufactured creams
had a lower amount of milk solids-not-fat than that of control. This reduced amount
of SMP was made up by adding concentrated RSM (not applicable to control) while
preparing cheesemilk. A sample calculation for this is provided in Appendix 8. 8 .
As formation of the emulsion was one of the critical steps, mass-balancing of fat was
done. The calculations for fat mass balance were similar to the procedure followed
earlier for mass balance studies (Appendix 7 .8 .b) .
The experiment was designed o n the basis of analysis of variance (one-way
classification) . A total of 12 trials were randomly performed using two replications for
each emulsifier. The sources of variation were ' replicates' and 'emulsifying agents' .
The results were statistically analysed using SAS package ( 1985) .
8.3.3.2 Analytical methods Cheesemilk and whey were analysed for fat, protein , lactose and total solids by the
Milko-Scan. Milk and whey were also analysed for fat (Rose-Gottlieb method) and
calcium (complexometric method) . The mean diameter of the fat globules in the

203
cheesemilks was determined by the spectroturbidimetric method. Feta cheese after
brining and after four weeks of storage were analysed for pH, fat (Schmidt
Bonzynski-Ratzlaff method), protein (Kjeldahl), moisture, NaCl (potentiometric
titration) and calcium (complexomteric). Exudate from Feta cheeses was analysed
for total solids, N a Cl (potentiometric), calcium ( complexometric ), protein
(Kjeldahl) and distribution pattern of low molecular weight peptides (HPLC).
Proteolysis in Feta cheese and exudate at four weeks was estimated by urea-PAGE.
The proteins adsorbed to fat globule surface in Feta cheeses were identified by
SDS-PAGE (after brining and at four weeks after manufacture) and by
Urea-PAGE (after fourteen months of manufacture). The amount of exudate
released from cheese was measured at selected intervals.
Details of these analytical methods are described in Chapter 4 and Appendix 4.1.
8.3.3.3 Sensory evaluation: The product was evaluated by a sensory panel at eight
weeks after manufacture for flavour and textural characteristics. Details of the
evaluation procedure are provided in Chapter 4.
8.3.3.4 RESULTS
The results are described under the following headings:
(a) Manufacturing aspects, fat mass balance and cheese quality.
(b) Composition of milk, whey, cheese and exudate.
(c) Proteolysis.
(d) Protein adsorbed to fat globule surface in cheese.
(e) Exudation.
(a) Manufacturing aspects, fat mass balance and cheese quality
Cheese manufacture: 'Manufactured cream' and 'emulsified milks' (cheesemilks)
were generally satisfactory although in some instances the cheesemilk had a slight
cream layer similar to that observed during the preliminary studies. Manufacture
of Feta cheese did not pose any specific problems. Manufacture of cheese with
Tween-60 resulted in a substantial amount of fat being lost in the whey. The
cheese had a hard texture. However, the cheesemilk with Tween-60 had

204
satisfactory emulsion of fat and the renneted curd had the desired gel
characteristics. The loss of fat was possibly due to the ability of surfactant
Tween-60 to replace the proteins in the oil-in-water type emulsions (Walstra and
Jenness, 1984). Coating of fat globules with Tween-60 may have made them
behave as water-soluble particles and thereby increased the fat loss into whey.
Cheese made using WPC powder as emulsifying agent had a slower rate of draining
during manufacture. The renneted coagulums of the cheesemilks made using
Tween-60 and WPC powder were weaker (subjective testing) at manufacture. The
pH profile at various stages of manufacture was typical.
Mass balance of fat content: The results of mass balance are shown in
Appendix 8.9. The variation in fat content was reasonable. Increased recovery of
fat with the use of lecithin was due to the additional fat from 'lecithin source' . The
mass balance confirms the increased fat loss to the whey with the use of Tween-60
as the emulsifying agent.
Sensory evaluation: All cheeses except those made using lecithin and Tween-60
were rated satisfactory (Appendix 8.10).
Cheese made using lecithin had an undesirable flavour. This originated from the
lecithin. Because of the undesirable flavour the panel was advised not to evaluate
the flavour of this cheese. The texture of cheese made using lecithin was adjudged
smooth, sticky and atypical. Use of lecithin involving a similar method of
manufacture with Halloumi cheese resulted in increased stretchability and
meltability of the cheese (Lelievre et al., 1990).
Cheese made using Tween-60 was rated very hard. This was due to low fat in the
cheese that resulted in low ratio of moisture to casein (Lawrence & Gilles, 1987).
The cheese also had a different flavour which was traced back to the emulsifying
agent itself. The panel perceived the undesirable flavour as oxidised.
(b) Composition of milk, whey, cheese and exudate
Composition of cheesemilk: The composition of milk was generally satisfactory
(Appendix 8.1 1) . The mean fat globule diameters were nearly uniform in the

205
cheesemilks, except with lecithin where the results are doubtful because the
turbidity spectra did not fit well with any standard curve (Table 8.8). Uniformity
in the size of the fat globules implied that the emulsification of fat was mostly
satisfactory. Slightly increased fat content in milk made with lecithin could be due
to some additional fat from 'lecithin source'. Sodium caseinate and WPC powder
marginally increased protein and SNF contents in the respective cheesernilks.
Table 8 . 8 E ffect of emulsifying agents on the mean diameter of fat globules in cheesemilk
Source o f variation and l evel s
Replicate 1 2
Emulsify ing agents SMP ( contro l ) Sodium caseinate Sodium caseinate & lecithin Lecithin Tween-6 0 WPC powder
Standard deviation
Mean diameter ( �m )
LSM F ratio
0 . 6 1 0 . 47
0 . 49 0 . 62 0 . 4 6 0 . 61 0 . 52 0 . 56 0 . 2 2 3
1 . 2 6ns
0 . 17ns
ns = not s igni ficant ; L . S . M . = Least square mean .
Composition of whey (Appendix 8. 12): As reported earlier, considerable loss of fat
to the whey occurred during manufacture of cheese with Tween-60. Slightly higher
fat loss with the use of emulsifying agent WPC powder is probably an indication
of fat not being able form a part of the casein gel matrix as effectively as some
other emulsifying agents.
Composition of cheese before brining (Appendix 8. 13): Most cheeses had a typical
Feta composition. However, fat and FDM values were lower for cheese with
Tween-60 because of considerable loss of fat to the whey. Moisture content of
cheese made with lecithin was lower which partly contributed to the significantly
higher fat level since the sum of the cheese components must equal 100%.
Composition of four week old cheese: The composition of cheeses was fairly
consistent and typical (Table 8.9). The general levels of S/M concentration were

206
slightly higher which was possibly due to the higher moisture level in cheese before
brining. The high level of moisture could be due to two-stage homogenisation of
manufactured cream.
Reduced moisture in cheese made using lecithin was a result of increased syneresis
during manufacture of cheese. Increase in syneresis might have been caused by
strong agglomeration of the fat globules in emulsion and consequently larger fat
globules in cheesemilk, or incomplete participation of fat globules in the casein
matrix of renneted gel.
The low moisture in the cheese with Tween-60 was due to increased syneresis at
manufacture. This resulted in significant variations in MNFS and protein contents.
Composition of exudate from four week old cheese: The composition of exudate
from cheeses made with the emulsifying . agents was mostly uniform
(Appendix 8. 14). In exudate from cheese with Tween-60 higher total solids was
due to the higher salt content, while the lower contents of calcium and protein was
probably due to the release of large amounts of exudate.
Table 8 . 9 Effect of emulsifying agents on composition of cheese ( four weeks )
the
S ource o f variation
Repl i cate 1 2
Emulsify ing
Fat ( % ) Moisture ( % )
LSM F LSM F
1 . 8 8ns 1 . 4 8 ns 2 5 . 3 4 4 9 . 5 2 5 . 87 4 8 . 8
agent 14 . 89 5 . 63 * * *
SMP ( control ) 2 5 . 15 5 0 . 2 8
S odium caseinate 2 6 . 15 4 9 . 3 3
Sodium caseinate & l ecithin 2 6 . 3 0 4 9 . 11
Lecithin 2 8 . 4 8 * * 4 7 . 1 2 * Tween- 6 0 2 3 . 2 5 * 4 7 . 9 6 * WPC powder 2 4 . 3 0 5 1 . 0 9
S . D . 0 . 66 6 0 . 8 6 9
FDM ( % ) MNFS ( % )
LSM F LSM F
0 . 8 4ns 0 .6ns 5 0 . 1 5 0 . 6
3 0 . 3 2 * * *
5 0 . 57
5 1 . 60
5 1 . 6 8 5 3 . 8 5 * * 4 4 . 6 6 * * * 4 9 . 68
0 . 7 9 9
6 6 . 2 6 5 . 9
6 7 . 2
6 6 . 8
6 6 . 6 6 5 . 9
1 1 . 9 * *
62 . 5 * * 67 . 5
0 . 7 5 6 --- - -- - - --- - -- -------------------------------- -- - - - - ------
F = F ratio; L.S.M. = Least square mean; S.D. = Standard deviation of raw data; * = p � 0.05; ** = � 0.01; *** � 0.001; ns = not significant; Individual L.S.M. values marked with asterisks denote their significant variation in comparison to the control. Table 8.9 continued •••••

207
. • . . . Table 8 . 9 continued
E ffect of emulsifying agents on the compos ition of cheese ( four weeks )
S ource o f variation
Repl icate 1 2
Emulsifying agents SMP ( control ) S odium caseinate S odium caseinate
& lecithin Lecithin Tween-6 0 WPC powder
S . D .
S ource o f variation
Calcium (mMolesjkg ) LSM F
9 8 . 3 1 01 . 6
1 0 1 . 6 9 7 . 8
103 . 2 9 6 . 2
1 08 . 0 9 3 . 0
NaCl ( % ) LSM F
4 . 4 8
1 . 64ns
2 . 9 1ns
S/M ( % ) LSM F
pH
LSM F
0 . 13ns 4 . 6 6 4 . 65
1 . 6 3 ns 4 . 65 4 . 65
4 . 67 4 . 68 4 . 6 5 4 . 64
0 . 0 1 6
Protein ( % ) LSM F
Replicate 3 . 6 3ns 1 . 4 7ns 3 . 0 6ns 1 5 . 8 9 1 1 . 9 1 5 . 88 2 5 . 64 1 1 . 6 16 . 57
Emulsify ing agents 4 . 5 6ns 2 . 7 2ns 7 . 94 *
SMP ( contro l ) 6 . 10 1 2 . 1 Sodium caseinate 5 . 54 11 . 2 Sodium caseinate
& lecithin 5 . 4 4 * 1 1 . 1 Lecithin 5 . 4 1 * 1 1 . 5 Tween-6 0 6 . 11 1 2 . 7 WPC powder 6 . 02 1 1 . 8
S . D . 0 . 2 2 6 0 . 53
F = F ratio ; L . S . M . = Least square mean ; S . D . = standard deviation of raw data ; * = p � 0 . 05 ; * * = � 0 . 0 1 ; *** � 0 . 0 0 1 ; ns = not s igni ficant ;
1 5 . 3 1 15 . 9 2
16 . 11 1 5 . 98 18 . 8 8 * * 15 . 12
0 . 6
Individual L . S . M . values marked with asterisks denote their s ignificant variation in comparison to the control .

208
(c) Proteolysis
Urea-PAGE on four week old Feta cheeses: All cheeses showed similar
electrophoretic patterns with comparable band densities. Proteolysis was therefore
similar in all cheeses. The degree of proteolysis has been expressed as the ratio
of the amount of a51-casein or B-casein in the cheeses to the amount of B-casein of
standard casein run in the same gel (Table 8. 10). The ratios were calculated using
areas under densitometer plots. The amount of B-casein and as1-casein were
greater in cheeses made using Tween-60 and lecithin (ratio = 0.37) than in the
control (ratio = 0.27). The other samples had similar composition (ratio = 0.27
to 0.30). The higher casein content in cheese containing Tween-60 could be due
to reduced moisture in cheese leading to a reduced rate of proteolysis or due to
reduced fat content in cheese leading to a proportionate increase of casein in the
total solids. The increase in the density of casein bands in cheese made with
lecithin may have been due to a reduced moisture content in cheese, and
consequently a slightly reduced rate of proteolysis. It could also be due to
experimental error in loading the sample because a corresponding increase in B
casein was detected.
T ab l e 8 . 10 E ffect of emulsifying agents on casein proteolysis of four week old Feta cheese
Sources of variation
Repl icate 1 2
Emulsifying agents SMP ( control ) S odium caseinate Sodium caseinate & Lecithin Lecithin Tween-6 0 WPC powder
Standard dev iation
Ratio of a51-casein in cheese to B-casein of standard casein
LSM F ratio
0 . 3 8ns 0 . 3 03 0 . 3 16
3 . 8 2 ns 0 . 2 6 9 0 . 2 8 1
0 . 2 67 0 . 3 7 1* 0 . 3 7 2 * 0 . 2 9 6
0 . 08 2
Ratio o f B-casein in cheese to B-casein of standard casein
LSM F ratio
o . 5 7 ns 0 . 3 8 9 0 . 4 2 5
1 . 4 4 ns 0 . 3 5 6 0 . 3 5 1
0 . 3 8 2 0 . 5 0 7 0 . 4 8 6 0 . 3 62
0 . 03 6 - - - - ------------------------------------- - --------- - ------* = p � 0.05; ns = not significant; LSM = Least square mean; L.S.M. values of individual emulsifying agents marked with asterisks show their significant variation in comparison to control.

209
HPLC studies on exudate from Feta cheese stored for four weeks: The distribution
pattern of low molecular weight protein breakdown products in all the exudates
appeared typical (Table 8 .1 1). The peaks for amino acids, peptides and other
protein breakdown products in the molecular mass range 500 - 10,000 daltons was
mostly similar in exudates from all the cheeses. The only peak with slight variation
was observed at the molecular mass of � 4,000 daltons at an elution time of 34 s.
Exudate from cheese made using WPC powder had a decrease in the amount of
breakdown product appearing at 34 s elution time. This variation was however less
than the variation between the replicates. It is unlikely that this variation was due
to a reduced rate of proteolysis, particularly in view of a higher moisture content
in the cheese. The variation is more likely to have been caused by a dilution effect
due to increase in the amount of exudate during the initial stage of storage.
Table 8 . 11 E ffect of emulsifying agents on the low molecular weight peptides in exudate from four week old Feta cheese (HPLC techni que )
Source o f variation & levels
Repl icate 1 2
Emulsifying agents SMP ( control ) Sodium caseinate S odium caseinate Lecithin Tween-6 0 WPC powder
Concentration of peak at 34 s elution time (molecular mass � 4 , 0 0 0 daltons )
Least square mean
17 . 74 19 . 6 7
19 . 10 19 . 5 5
& lecithin 19 . 5 6 2 0 . 3 9 17 . 03 1 6 . 6 1 *
F ratio
12 . 3 9 *
5 . 13 *
Standard deviation o f raw data 0 . 9 5 2
* = p � 0.05; LSM = Least square mean; L.S.M. values of individual emulsifying agents marked with asterisks show their significant variation in comparison to control.
Conclusion: In general, proteolysis was typical of Feta cheese. a61-casein
proteolysed rapidly, while there was no evidence of proteolysis of B-casein in the
first four weeks. Pattern of proteolysis was similar in all cheeses. The proteolytic
rate could have been slightly slower in cheeses made with Tween-60 and lecithin.

210
(d) Protein adsorbed to fat globule surface in cheese
SDS-PAGE: The effect of fat emulsification with selected emulsifying agents on the
protein adsorbed to the surface of fat globules is described in Table 8. 12 (refer
Appendix 8. 15 for photograph). There was no change in the proteins adsorbed to
the surface of fat globules in cheese analysed before brining and at four weeks.
Table 8 .12 Effect of emulsification of fat with different emulsifying agents on the protein adsorbed to surface of fat globules in Feta cheese
Emulsifying agents Identification and comparison of proteins adsorbed to fat globule surface in Feta cheeses made with the emulsifying agents by SDS-PAGE.
SMP (control) All major milk proteins were present. Increased amounts of proteins (particularly case ins) were detected in comparison to cheeses with other emulsifying agents, as evidenced by the band densities of the electrophoretic patterns.
Sodium caseinate Electrophoretic pattern was similar as control but the bands were less dense.
Sodium caseinate & This was similar to cheese made with emulsifying Lecithin agent sodium caseinate.
All major milk proteins were present. Density of WPC powder casein bands were similar as that of sodium
caseinate. There was considerable increase in whey proteins, particularly B-lactoglobulin.
Lecithin Electrophoretic pattern showed faint bands in the casein region and one or two bands in the high molecular mass region, i.e. > 60,000 daltons.
Tween-60 No proteins were detected.
Unhomogenised milk1 No proteins were detected.
1 Data from Section One.
Urea-PAGE: Proteins absorbed to fat globules in fourteen month old cheeses were
extracted in Urea-sample buffer and SDS-sample buffer. These extracts were
analysed by Urea-PAGE (Fig. 8.3). Fat and whey protein present in the extracted

211
Proteins extracted
Proteins extracted from fat globules
from fat globules using Urea sample
using SDS sample buffer (standard
buffer. method) .
c c:: ..c ..c ..... ..... "<:) "<:) V V
� � .... .... V <t) 0 <t) <t) 0 "0 ...... ...... "0 - ...... c c;:l :-;! ::: c;:l :-;!
·- ::: c c:: c c:: !-.. 0 0 ·o !-.. 0 en 0 0 0.. 0 <t) 0 ro 0.. en (J:l "0 en (J:l "0 u = ro :-;! ::: ,.!.:: ro :-;! ::: u u u u "0 "§ 0 s 0 .s !-.. E E 0.. E E 0.. ro ..c "0 E .2 .2 u E .2 .2 u ...... c "0 "0 � "0 "0 � ·u ro :.g 0 0 � :.g 0 0 � j -\/.) en \/.) en en \/.) en
"K-casein --
as-casein (asz- & asc) --
Fig. 8.3 Urea-PAGE showing proteins adsorbed to surface of fat globules in
fourteen month old Feta cheeses made using different emulsifying
agents.
Note: Urea-PAGE of fat from fourteen month old Feta cheese made using
Tween-60 showed no protein bands. It was identical to that of
cheese made using lecithin as shown above.

212
samples appear to have obscured the protein bands in the gel. The
electrophoretogram showed B-casein, asccasein and possibly asci-casein bands. It
was difficult to quantitatively determine the proteins using the densitometer. There
were no proteins in fat extracted from cheeses made with Tween-60 and lecithin.
Conclusion: A variation in the amount of casein adsorbed to the fat globules was
observed. This provides an estimate of the extent to which fat globules participated
in the casein matrix of the Feta cheeses. It is uncertain if the casein adsorbed to
the fat globule surface is proteolysed at the same rate as in rest of the cheese.
(e) Effect of emulsifying agents on exudation of whey from Feta cheese during
storage (Table 8.13)
The general trend of an increase in the amount of exudate with time was detected
up to 9 months of storage. This pattern of exudation is typical of Feta cheese. The
pattern of exudation was variable during the initial stages of storage, which steadied
after 15 weeks. The rapid increase in the amount of exudate in the first two weeks
of storage was partly due to some exudate being drawn out from cheese during
vacuum packaging.
Effect of replicates: There was no difference between the two replicates. This
indicated that the manufacturing conditions during cheese manufacture did not vary
significantly.
Effect of emulsifying agents: The use of emulsifying agent SMP (control) was most
effective in reducing the amount of exudate; followed by lecithin, combination of
sodium caseinate and lecithin, sodium caseinate, WPC powder and Tween-60. The
least square mean values for the amount of exudates from cheeses with different
emulsifying agents indicate that, in comparison to control (SMP), the increase in
the amount of exudate was: little with lecithin; slight with sodium caseinate, and

213
Table 8 . 1 3 E ffect of emulsifying agents o n exudation o f whey from Feta cheese during storage
--------- --- ----- -- - --- - - ----- - - -- - - --- - - - --- ----- - - -- - ----Source of variation
Repl icates
1 2
Exudate in gjkg cheese
- - ---------LSM
4 1 . 5 3 9 . 8
F
0 . 7 5 ns
Emuls ifiers 13 . 0 * *
S odium caseinate 4 0 . 3 #
Exudate in gjkg moisture in cheese - - ---- - - --LSM F
0 . 3 4 ns
8 0 . 1 7 8 . 4
18 . 7 * *
7 8 . 6* S odium caseinate & lecithin
3 7 . 8 7 4 . 5 # Lecithin
3 3 . 6 6 8 . 3 SMP ( control )
3 2 . 2 6 1 . 9 Tween-6 0
5 4 . 5 * * * 107 . 1 * * * WPC powder
4 5 . 6 * * 8 5 . 1* *
Storage T ime (weeks ) 1 6 5 1 6 6 . 5
* * * * * * 2 2 3 . 0 4 4 . 9 4 2 5 . 5 4 9 . 7 6 2 8 . 8 5 6 . 1 9 3 2 . 6 6 3 . 5
12 3 7 . 7 7 3 . 5 1 5 4 6 . 0 8 9 . 7 2 0 5 0 . 6 9 8 . 6 2 6 5 5 . 7 108 . 6 3 9 6 6 . 0 1 2 8 . 6
Emulsify ing agents X storage time
S . D c . v . ( % )
3 . 9 9 9 . 8
2 . 2 2 2 . 18 **
7 . 7 4 9 . 77
* *
Final MNFS ( % )
-- - - - -----LSM
6 7 . 8 6 7 . 1
68 . 0ns
67 . 6
6 7 . 3
6 8 . 4
6 4 . 3 * *
6 9 . 3ns
F
2 . 0 ns
8 . 2 4 *
147 * * *
6 7 . 8 6 7 . 8 6 7 . 7 6 7 . 6 6 7 . 5 6 7 . 4 67 . 3 67 . 2 6 6 . 9
0 . 0 8 9 0 . 13
2 . 3 8 * *
% reduction in MNFS
- - - ------LSM
1 . 2 1 . 2
1 . 1*
1 . 1*
1 . 0 #
0 . 9
F
1 . 9 ns
5 3 . 1 * * *
1 . 9 * * *
1 . 1*
0 . 66 0 . 7 3 0 . 8 3 0 . 9 5 1 . 11 1 . 3 6 1 . 50 1 . 6 6 2 . 0
0 . 13 1 1 . 2
14 1 * * *
2 . 4 7 * *
L . S . M . = Least square mean ; F = F ratio ; c . v . = Coefficient of variation ; S . D . = Standard deviation of raw data ; # = p � 0 . 10 ; * = p � 0 . 05 ; * * = � 0 . 01 ; * * * � 0 . 0 0 1 ; ns = not s igni ficant ; LSM values of individual emu l s i fying agents marked with asterisks show their s igni ficant variation in comparison to control .

214
combination of sodium caseinate & lecithin; significant with WPC powder; and
highly significant with Tween-60.
Interaction of storage time with emulsifying agents: The effect of emulsifying agents
on the exudation from Feta cheese became evident during storage (Fig. 8.4).
Throughout the storage study cheese made with SMP as the emulsifying agent
(control) had the least amount of exudate, and cheeses with emulsifying agents
Tween-60 and WPC powder had significantly higher amounts of exudate. The
amounts of exudates from cheeses with sodium caseinate, and sodium caseinate &
lecithin were significantly higher in comparison to the control only after 15 weeks
of storage. There was no difference in the amount of exudates from cheeses with
lecithin and SMP. The amount of exudate from cheese made using a combination
of sodium caseinate and lecithin was mid-way between that of cheeses with
individual emulsifying agents sodium caseinate and lecithin.
8.3.3.5 Discussion
Size of fat globules: It was of interest to determine whether the effect of
homogenisation on exudation was due to the reduction in the size of the fat
globules (and an increase in the number) or to the protein adsorbed to the fat
globules or both. Homogenisation was effective in reducing the amount of exudate
(Section One in this Chapter) while a change in homogenisation pressure did not
affect exudation markedly (Chapter 6.4.5.c). Homogenisation of cream, even at the
lower pressure [single stage 600 psi ( 4134 kPa)], reduced the size of the fat globules
substantially (from � 4.0 J.Lm to � 1 J.Lm) while homogenisation of cream at higher
pressure [double stage, 2,000/500 psi (13780 kPa/3445 kPa)] reduced the size of
the fat globules to about 0.5 J.Lm. As the fat globule size is expected to change to
some extent during cheesemaking, it is uncertain whether the difference in fat
globule sizes obtained in cheesemilks (0.5 to 1.0 J.Lm) due to homogenisation at
different pressures was carried over to the cheese without a change. Evidence from
SDS-PAGE on fat globules from cheese made using lecithin and Tween-60 as
emulsifying agents suggests that the fat globules were not coated with casein. A
reduction in size was presumably obtained due to homogenisation. It is not

� Q) 1 60 L ::::J
-+-(/) 1 40 0 E Q) (f) Q) Q)
_c u 0)
_y �
0) .........___,
Q) -t-
1 20
1 00
80
60
40 -
0
0
0 'f' •
/0�0---------:
/0 .�· A 0 .�· � • / /::;;;� o�i 0 / // /!:. ----·-0/
/ >Y A
/ ��-;z;�? o -- o S o d i u m c a s e i n a t e 0 .., !:.
� ... --:;:::�� - • -- • S o d i u m c a s e i n a t e & l e c i t h i n ... �6/ / . ---;::;:; t 16 o� ... ...------ 6 -- 6 Le c i t h i n
o -- o Tw e e n - 6 0 o
u ::::> X
w
�'�0t • - • S M P ( c o n t ro l )
2o + ... -- ... WPC p o w d e r h
0 5 1 0 1 5 20 25 3 0 35
Sto ra g e t i m e ( w e e k s ) 4 0
F i g . 8 . 4 E f f e c t o f e m u l s i f y i n g a g e n t s o n t h e e x u d a t i o n o f w h ey f ro m Fe ta c h e e s e d u ri n g s t o ra g e .
N ...... Vl

216
possible to draw any conclusion from the observations on exudation from cheese
made with Tween-60 because of the reduction in the amount of fat in cheese. It
is also difficult to draw any conclusion from the observations on cheese made using
lecithin as the results have to be considered in light of other possible effects of
lecithin, as described later in this section.
When spheres are suspended in a continuous medium and are sparsely distributed
such that there is no interaction between them, and the volume concentrations of
the media remain unchanged, the diffusion coefficient of the suspension is
independent of the size of the suspended particles (Crank, 1983). If the fat
globules in cheese are considered as spherical particles embedded in the continuous
heterogenous mixture of water and soluble material (exudate), a change in volume
of fat would affect the diffusion coefficient. However, when the volume of fat is
constant and change in size of fat globules in cheese occurs due to homogenisation,
it is difficult to predict whether or not the diffusion coefficient would be affected.
This is because in cheese the fat particles are not all spherical, the fat globules are
likely to have coalesced and clumped, and the volume fraction of the fat is high.
The available evidence is insufficient to draw conclusion on the effect of a
reduction in the size and an increase in the number of fat globules, when the mass
of fat is constant, on the exudation of whey from Feta cheese during storage.
Type of material adsorbed to the surface of fat globules: Based on the evidence of
the effect of homogenisation (Section One in this Chapter) and of the material
adsorbed to the surface of the fat globules (Table 8 .12), the following hypothesis
is proposed for high-moisture cheeses. The fat globules in cheese are trapped in
a three dimensional casein network. In the case of cheese made from
unhomogenised milk SDS-PAGE showed little or no protein adsorbed to the fat
globule surface, indicating that the MFGM is intact. The MFGM has little affinity
for casein as homogenised fresh cream is easily washed free of casein. Electron
microscope studies on mature Cheddar cheese (presumably made from
unhomogenised milk) showed that the layer adjacent to the fat had the highest
content of free water (Kimber et al., 1974). Large proportions of the fat globules
217
in cheese are likely to be close to each other due to either agglomeration or
natural statistical fluctuations. Such clusters create pockets or regions of weak
structure in the casein matrix. Water is available in abundance in these regions.
In cheese made from unhomogenised milk the water is loosely held and unevenly
distributed around the unevenly distributed fat. Fissures, crevices and cracks within
the block of Feta cheese further contribute to the lack of homogeneity in the
cheese. This unevenly distributed and loosely held water facilitates exudation
caused by osmotic pressure difference or other factors within the three-dimensional
casein matrix.
In cheese made from homogenised milk the fat globules are coated with casein and
form an integral part of the three dimensional casein matrix (Vliet &
Dentener-Kikkert, 1982; Walstra et al., 1985; Kebary & Morris, 1990).
Casein-coated fat behaves as casein. The effect of fat globules in creating the
regions of instability or weakness in the casein matrix is greatly reduced by the
casein-coats. This results in a significantly reduced rate of exudation. As proteolysis proceeds, the casein matrix is gradually weakened and the moisture held
in the matrix exudes (Chapter 9). Further, the role of fat globules, as part of the
network, in hindering the shrinkage of the para-casein matrix (Walstra et al., 1985)
may explain the reduced rate of exudation.
The above concept can also be used to explain the pattern of exudation from
cheeses made with emulsifying agents SMP and sodium caseinate. The fat globules
in the former may be expected to be more firmly embedded in the casein matrix
which may have accounted for the difference in the amount of exudates. It is
possible that the proteins adsorbed to the fat globule surface hydrolyse as
proteolysis progresses (Walstra & Jenness, 1984). If this were true, the amount of
caseins adsorbed to the fat globules in cheese made with sodium caseinate, being
less in comparison to control, would be hydrolysed sooner. This would undo the
effect of casein-coated fat globules on exudation. The fact that a significant
variation between the two was noticed only after 15 weeks of storage suggests that
this may be happening after a certain storage period when caseins are no longer
available to hold the fat in the weakening casein matrix. In the control cheese

218
some of the caseins adsorbed to fat globules may still be intact and thereby enable
fat to remain a part of the casein matrix. However, in an oil-in-water emulsion,
peptide bonds in some regions were inaccessible to proteinases (Shimizu et al.,
1986), suggesting that the proteins adsorbed to the fat globule surface may not be
easily hydrolysed because the peptide bonds susceptible for hydrolysis are not
available. The present study on the proteins adsorbed to the fat globule surface
showed some proteolysis. However, it is not certain whether the rate of breakdown
is the same as in the rest of the cheese.
If all the fat present in cheese were to be assumed as spherical, uniform in size and
equidistant from each other, the distance between each fat globule would be about
0.25 J,£m and 1 .2 J,Lm when the diameters of the fat globules are 1 J,Lm and 5 J,Lm,
respectively. The calculations to determine the distance between the fat globules
are provided in Appendix 8.16. The distance between the fat globules indicates
that in cheeses with lecithin, where casein is not adsorbed to the surface of the fat
globule, the fat globules may be expected to be very close to each other and in
many instances joined to each other. The rate of exudation from cheese made with
lecithin was not very different from that of the control. The lecithins are soluble
in fat but almost completely insoluble in water. When mixed with water, lecithins
hydrate and disperse in the form of spherical globules or liposomes, which may be
smaller than 1 J,Lm in diameter. The structure within the liposomes is likely to be
affected by phospholipid-phospholipid interactions, which are known to occur in
soybean lecithin (Kanamoto et al., 1981). It is possible that the closely located
lecithin-coated fat globules in cheese interact with each other and form chains,
entrapping water molecules within clusters of fat globules. These hydrophobic
chains may also repel the flow of exudate in their direction. The tendency of fat
globules to cluster was evident in manufactured cream and cheesemilk made using
lecithin, where creaming was observed. Cheese made with lecithin also had a sticky
texture. Phospholipids are known to form stable colloidal suspensions or emulsions
in aqueous solutions and play an important role in the formation and secretion of
milkfat (Long & Patton, 1978; Jensen & Clark, 1988). Thus lecithin may have
formed water-in-oil type of emulsions with the free water and restricted its release.

219
Yet another explanation could be that the lecithins interacted with caseins, reduced
casein proteolysis and thereby reduced the rate of exudation.
Cheese made using Tween-60 had reduced fat and MNFS. Despite a reduced
MNFS exudation continued rapidly during storage. The increased amount of
exudate from cheese made with Tween-60 could have been due to a reduced fat
content in cheese or to the hydrophilic nature of the emulsifying agent coated on
the fat globule surface. Increase in the amount of exudate due to a reduction in
the amount of fat in cheese is consistent with the earlier findings of an effect of
protein to fat ratio on exudation (Chapter 6). The effect of fat quantity on
exudation is also consistent with the earlier explained theory that when spheres are
suspended in a continuous medium, a change in volume concentration would affect
the diffusion coefficient of the suspension (Crank, 1983). It is possible that an
increase in fat level increases the resistance of the casein matrix to contract or
change in volume (Geurts et al., 1972), and thereby reduces the amount of exudate.
In cheeses where the casein-coating of fat globules was not pronounced or did not
occur, the rate of exudation decreased when the adsorbed material was lipophilic
[lecithin, MFGM (refer Section One)], and increased when the adsorbed material
was hydrophilic (Tween-60, WPC powder). It is likely the hydrophilic material
create regions of weak structure in the casein matrix in cheese, as explained earlier.
The material adsorbed to the fat globule surface in cheese made using WPC
powder comprised predominantly whey protein and some casein. The whey protein
adsorbed to the fat globules is expected to be denatured and insoluble. However,
the adsorption of greater amounts of WPC powder to the fat globule surface may
have restricted fat globules from becoming part of the casein matrix and thereby
created some regions of weak structure and loosely-held water in the casein matrix.
Use of WPC powder was therefore not effective in reducing exudation. These
results are comparable to the findings that when fat is homogenised into whey
instead of skim milk, the decrease in syneresis during manufacture of cheese as a
consequence of the homogenisation process was reduced (Emmons et al., 1980).
The effectiveness of B-lactoglobulin in providing a long-term stability of emulsion
(Darling & Butcher, 1978; Dickinson et al., 1989b ), and presumably the absence of

220
proteolysis of denatured whey proteins may explain slightly lower exudation towards
the later stages of storage with cheeses emulsified with WPC powder in comparison
to that with sodium caseinate.
8.3.3.5 Conclusion: Adsorption of casein to the fat globule surface in cheese, due
to homogenisation, reduces syneresis during manufacture of cheese and
subsequently the rate of exudation. When casein does not coat the fat globule
surface in cheese from homogenised milk, the type of material adsorbed at the
surface of the fat globule (hydrophilic or lipophilic) appears to influence exudation.
Hydrophilic substance promotes and lipophilic substance lowers the rate of
exudation. Evidence on the effect of size reduction of fat globules and increase in
the number of fat globules, as a result of homogenisation, in reducing the amount
of exudate from Feta cheese was inconclusive. A decrease of fat content in cheese
from homogenised milk increases the amount of exudate. A hypothesis is proposed
to explain the effect of homogenisation on exudation.
6.4 OVERALL CONCLUSION TO CHAPTER 8
Homogenisation is an effective process to reduce the amount of exudate.
Adsorption of casein to the fat globule surface in cheese, due to homogenisation,
reduces the rate of exudation. Evidence on the effect of size reduction of fat
globules and increase in the number of fat globules, as a result of homogenisation,
in reducing the amount of exudate from Feta cheese was inconclusive.
The properties of the material adsorbed to the fat globule surface influence
exudation considerably. Syneresis of whey from cheese during manufacture is also
influenced by material adsorbed to the fat globule surface. The amount of exudate
decreased with an increase in the fat content in cheese. The use of cheesemilk
made from combinations of homogenised creams (fresh and manufactured) and
skim milks (fresh and recombined) did not affect the exudation.

221
CHAPTER 9
INFLUENCE OF PROTEOLYSIS ON THE EXUDATION OF WHEY FROM
FETA CHEESE DURING STORAGE
9.1 Introduction
Previous studies indicated that exudation could be related to proteolysis in cheese
(Chapter 6). The underlying mechanism for this relationship is postulated to be as
follows. Moisture is held in the three-dimensional protein (casein) network that
gives cheese its form and substance. The manner and extent of water-protein
interactions are affected by various factors such as amino acid composition, protein
surface polarity and charge, conformation and topography, pH, ion species and
temperature (Kinsella & Fox, 1987). The casein matrix gradually becomes weaker
and starts to disintegrate as proteolysis proceeds. The water molecules held in the
interstices of the casein gel are released. Unless stopped by some other
mechanism, the moisture and soluble material leak out of the cheese as exudate.
Visser ( 1977b) showed that a variation in residual rennet in cheese resulted in a
corresponding variation in the rate of proteolysis in starter-free Gouda cheeses.
Rennet is involved primarily in the formation of large peptides in Cheddar cheese
(O'Keeffe et al., 1978) and the residual rennet retains its milk clotting activity
throughout ripening (Dulley, 1974). It is expected that rennet in Feta cheese will
have a similar effect of forming large peptides. Earlier studies in Chapter 6
suggested that Lactobacillus casei was proteolytic in Feta cheese during storage
even in conditions of low pH and high salt-in-moisture (S/M) concentration. The
other microbial strains inoculated through the starter were destroyed in about two
weeks after manufacture of cheese. In Feta cheese the larger peptides formed by
the action of rennet may be expected to be further proteolysed into smaller
peptides and amino acids by the lactobacilli bacteria.
If the proteolytic activity of chymosin is proportional to the amount of residual
rennet in cheese (Creamer, 1979), a variation of residual rennet in Feta cheese

222
should correlate with the rate of proteolysis and exudation. The objective of this
study was to determine the effects of varying levels of residual rennet in cheese on
proteolysis and exudation.
In general, calf-rennet is referred as rennet throughout this Chapter.
9.2 Experimental plan
Feta cheese was manufactured using three levels of calf-rennet (Table 9 .1 ) . Setting
time was adjusted according to the amount of calf-rennet added so that the
gel-strength at cutting was similar for all the trials. However, the total time from
inoculation of starter until draining of whey was kept constant so that curd pH at
draining was identical in all cheeses. This was expected to ensure rennet retention
in cheese in proportion to the quantity of rennet added to milk. The distribution
and mass balance of rennet in cheese and whey were monitored.
The experiment was designed to statistically analyse the results by analysis of
variance (one-way classification). A total number of 6 trials were performed using
two replications for each level of rennet. The sequence of trials were randomised.
The sources of variation were 'replicates', 'level of rennet' and 'storage time'. The
data were analysed using the statistical package of SAS Institute Inc. ( 1985).
Table 9.1 Quantity of calf-rennet (strength = 59 RU lml) used for manufacture
of cheese
Quantity of rennet added to cheesemilk Reference in the text
8 ml / 100 kg milk Low rennet
16 ml I 100 kg milk Control
32 ml I 100 kg milk High rennet

223
9.3 Experimental
Feta cheese was manufactured using the procedure outlined in Chapter 6, except
for the following changes:
(i) After standardisation of milk to a P /F ratio of 0.73, it was diluted with water
so that the protein content was close to the average protein content in whole milk
(3.3 - 3.4% ) .
(ii) The time of renneting milk was varied depending upon the amount of
calf-rennet added (Table 9.2).
Table 9 . 2 Variation in priming and setting time for
different amounts of cal f-rennet added to milk
Processing step Cumulative time in minutes
Low rennet
cheese
Inoculation of starter
Addition of rennet
Cutting
9.4 Analytical methods
0
10
70
Control
cheese
0
3 0
7 0
High rennet
cheese
0
5 0
7 0
Cheesemilk and whey were analysed for fat, protein, lactose and total solids by the
Milko-Scan. Calcium content in cheesemilk and whey were estimated by
complexometric method. The mean diameter of the fat globules in the cheese milk
was determined by the spectroturbidimetric method.
Feta cheeses before and after brining were analysed for moisture, pH and calcium
(complexometric method). Feta cheese at three weeks was analysed for fat

224
(Schmidt-Bonzynski-Ratzlaff method), protein (Kjeldahl), NaCl (potentiometric
titration), moisture and calcium (complexometric) at three weeks. Cheese (after
brining) and whey were analysed for residual rennet.
Exudate from three week old Feta cheese was analysed for protein (Kjeldahl), total
solids, calcium (complexometric), NaCl (potentiometric) and the distribution
pattern of low molecular weight peptides (HPLC).
Proteolysis in Feta was determined by urea-PAGE at the following stages: after
brining (0 week), 4 weeks, 15 weeks and 26 weeks. Exudation of whey from cheese
was determined at selected storage periods as described in Chapter 4.
Details of the analytical methods of all the above analyses are provided in
Chapter 4 and Appendix 4.2.
9.5 Sensory evaluation
Feta cheese was evaluated by a sensory panel at eight weeks after manufacture for
flavour and textural characteristics. The detailed procedure is described in
Chapter 4.
9.6 Results and Discussion
This section is described under the following headings:
(i) Cheese manufacture; and composition of milk, whey, cheese and exudate.
(ii) Sensory evaluation of cheese.
(iii) Distribution and mass balance of rennet.
(iv) Proteolysis in cheese.
(v) Exudation from cheese.
9.6.1 Cheese manufacture; and composition of milk, whey, cheese and exudate
There was no specific problems in the manufacture of cheeses with varying amounts
of rennet.

225
The composition of milk (Appendix 9.1) was uniform for all the experiments. The
variation in the mean diameter of fat globules for replicates is not of practical
significance.
The composition of whey (Appendix 9.2) was not affected by the variation in the
quantity of rennet used. The composition of cheeses before brining (Appendix 9.3),
after brining (Appendix 9.4) and after 3 weeks of storage (Appendix 9.5) was not
affected by the variation in the amount of rennet used for coagulation.
The major variation was in the amounts of residual rennet in cheese and whey,
which is described later in this Chapter.
The composition of exudate from three week old Feta cheeses (Appendix 9.6)
shows an increase in protein content (protein breakdown products) with the
increase in the amount of rennet used during cheesemaking. This may be
attributed to the increase in soluble nitrogen, presumably due to increased
proteolysis.
9.6.2 Sensory evaluation of cheese (Appendix 9.7)
No difference could be detected for most of the attributes in cheeses made with
variable amounts of rennet. However, the panel was of the opinion that cheeses
with high rennet had an unusual flavour. In a study on Gouda cheese with
increased amount of rennet, bitterness was detected with increased intensity in the
early stages of maturation (Visser, 1977a). In this case the panel did not
specifically detect bitterness in cheeses with high rennet but indicated a flavour
variation in terms of 'lower acidity'. It is possible the high NaCl in cheese masked
the bitter flavour.
9.6.3 Distribution and mass balance of rennet
Rennet distribution in cheese and whey (Table 9.3): The desired variation of
residual rennet in cheeses was achieved.

226
Table 9 . 3 E ffect of variation in the amount o f rennet used
during cheesemaking on the rennet retained in
cheese and whey
S ources o f variation & levels
Rennet activity (RU/kg)
Cheese after brining
Whey
LSM F LSM F
Repl icates 159 . 3 * * 3 . 8 6 ns 1 8 . 87 7 . 2 1 2 1 0 . 4 3 6 . 8 5
Quantity o f rennet 4 6 2 7 * * * 8 5 3 . 3 * *
Low 3 . 7 8 * * 3 . 0 0 * * Control 7 . 3 9 5 . 94 High 17 . 7 8 * * * 12 . 1 6 * *
S . D . 0 . 15 1 0 . 2 2 6
LSM = Least-square mean ; F = F ratio ; S . D . = Standard deviation ; ns = not s igni ficant ; * p < 0 . 05 ; ** p < 0 . 0 1 ; * * * p < 0 . 0 0 1 .
Mass balance of rennet activity: Details of the calculation of the mass balance of
rennet activity are shown in Appendix 9.8. The percentage of total rennet activity
(rennet added to milk) recovered in cheese and whey ranged between 64 to 70%.
The various sources of losses may be attributed to the following:
Some rennet activity is lost due to the process treatments. Holmes et al.
( 1977) reported that in Cheddar cheese approximately 35% of the rennet
activity was destroyed by the time whey was drained.
Some whey diffuses out of cheese during brining. Rennet activity would be
lost through this whey.
The method used for measurement of rennet activity (Singh & Creamer,
1990) was standardised with Cheddar cheese. The rennet activity recovered
by this method represents approximately 80% of the total rennet activity in
cheese. A correction factor is applied to obtain the absolute figures. In this
instance the correction factor for Feta cheese is not known and could not
be applied. The reported rennet activity for cheese is therefore less than
the actual value.
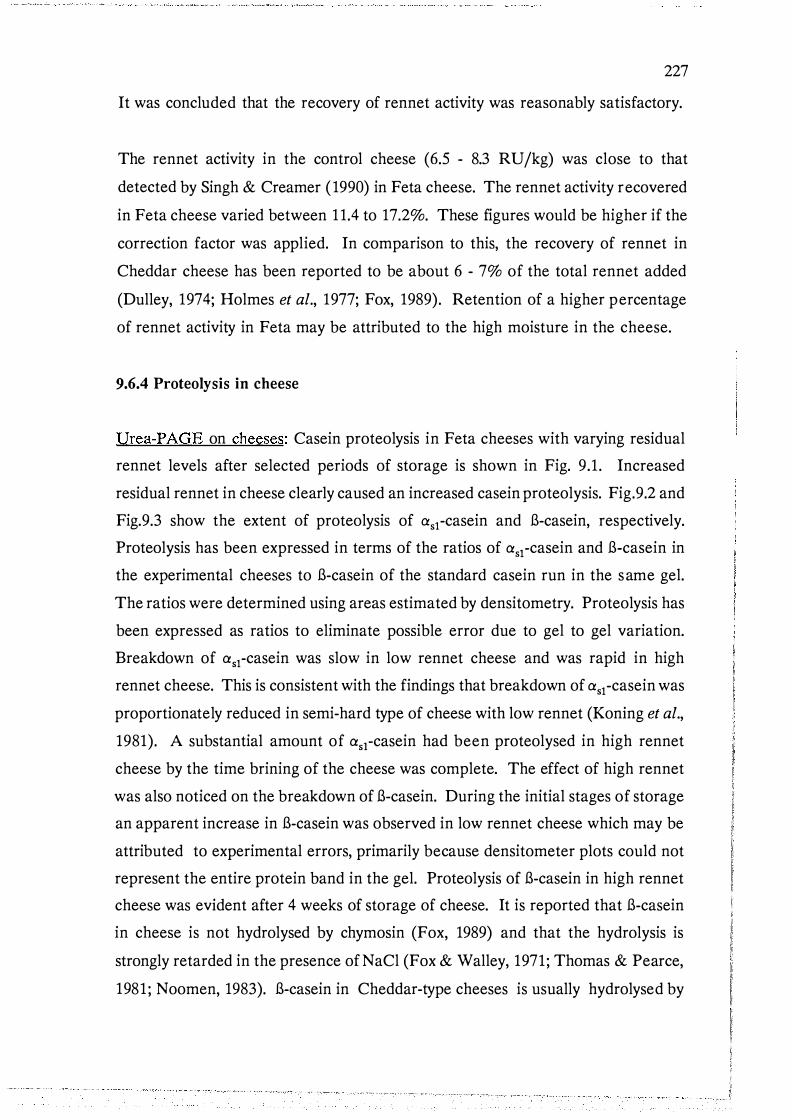
227
It was concluded that the recovery of rennet activity was reasonably satisfactory.
The rennet activity in the control cheese (6.5 - 8.3 RU/kg) was close to that
detected by Singh & Creamer ( 1990) in Feta cheese. The rennet activity recovered
in Feta cheese varied between 1 1.4 to 17.2%. These figures would be higher if the
correction factor was applied. In comparison to this, the recovery of rennet in
Cheddar cheese has been reported to be about 6 - 7% of the total rennet added
(Dulley, 1974; Holmes et al., 1977; Fox, 1989). Retention of a higher percentage
of rennet activity in Feta may be attributed to the high moisture in the cheese.
9.6.4 Proteolysis in cheese
Urea-PAGE on cheeses: Casein proteolysis in Feta cheeses with varying residual
rennet levels after selected periods of storage is shown in Fig. 9 .1 . Increased
residual rennet in cheese clearly caused an increased casein proteolysis. Fig.9.2 and
Fig.9.3 show the extent of proteolysis of a51-casein and B-casein, respectively.
Proteolysis has been expressed in terms of the ratios of a51-casein and B-casein in
the experimental cheeses to B-casein of the standard casein run in the same gel.
The ratios were determined using areas estimated by densitometry. Proteolysis has
been expressed as ratios to eliminate possible error due to gel to gel variation.
Breakdown of a51-casein was slow in low rennet cheese and was rapid in high
rennet cheese. This is consistent with the findings that breakdown of a51-casein was
proportionately reduced in semi-hard type of cheese with low rennet (Koning et al.,
1981). A substantial amount of a5ccasein had been proteolysed in high rennet
cheese by the time brining of the cheese was complete. The effect of high rennet
was also noticed on the breakdown of B-casein. During the initial stages of storage
an apparent increase in B-casein was observed in low rennet cheese which may be
attributed to experimental errors, primarily because densitometer plots could not
represent the entire protein band in the gel. Proteolysis of B-casein in high rennet
cheese was evident after 4 weeks of storage of cheese. It is reported that B-casein
in cheese is not hydrolysed by chymosin (Fox, 1989) and that the hydrolysis is
strongly retarded in the presence of NaCl (Fox & Walley, 1971; Thomas & Pearce,
1981 ; Noomen, 1983). B-casein in Cheddar-type cheeses is usually hydrolysed by

K-casein
.13-casein
as2-casein
asl-casem
a 51-I -casein
Feta cheese 4 wk old Feta 15 wk old Feta 26 wk old Feta 1=: after brining 1=: 1=: . ...... . ...... . .... 0 0 0 Vl ....... ....... � Vl ....... ....... ro ...... ...... ro ..... ...... u � 0 V 0 u u � 0 V V
1=: s § � § s § � '0 1::: 1::: '0 '0 1::: 1-o 0 0 0 0 1-o 1-o 0 0 0 0 ro 0 1-o 0 1-o ro ro 0 1-o 0 1-o "0 1-o 1-o 1-o 1-o "0 "0 1-o 1-o 1-o 1-o ...... ,..c:; ...... ,..c:; ...... ,..c:; ...... ,..c:; 1::: � 1::: 01) � 1::: 01) 1::: 1::: � 1::: 01) � 1::: 01) ro j 0 � j 0 � ro ro j 0 � j 0 . ..... ..... u u ..... ..... u u ::r: � � �
Fig. 9.1 Effect of residual rennet on casein proteolysis in Feta cheese during storage (Urea-PAGE).
1=: . ..... 0 Vl ro u '0 1-o ro "0 1::: ro ..... �
�

c · -(J) (/) 0 ()
0 u I... ...... 0 c Q) u
E c 'i: 0 Q) -1-
0.. (/) X c Q) ·-
c c ·-c (J)
Q) (/) Vl 0 0 () (.) I I 0
-1-Vl (J) 0 _o .c 0.. 0 0 -1-
._ (J) 0 (/) 0 (J) ...... (J) 0 ..s::: 0::: ()
0.80 .,---------------------------,
0. 60
0 . 40
0 . 20 � H i g h re n n e t
�-------------------- · 0 .00 -1-----+---11----�----+--o----+---+---ll----1---+--'
0 5 1 0 1 5 20 2 5 Sto ra g e t i m e ( w e e k s )
229
Fi g . 9 . 2 E f f e ct o f re s i d u a l re n n et o n t h e hyd ro l y s i s o f a l p h a s 1 - c a s e i n d u ri n g sto ra g e o f Fe ta c h e e s e .
QJ Vl QJ QJ .c (.)
2 c c QJ Q) E Vl 'i: 0 QJ (.) 0.. ""0 X L QJ 0 c ""0 c c 0 -QJ Vl Vl c 0 (.) c I 0 Q) ...... Vl QJ 0 ..D (.)
'+- I 0 0 ...... .2 Q) ...... ..D 0 .2 0:::
1 . 50..,--------------------------,
1 . 2 0 --6
--0 L o w re n n e t
0.90 �. � 0 C o n t ro l
0 . 60
�. 0 . 30
0 5 1 0 1 5 20 2 5 S to ra g e ti m e ( w e e k s )
F i g . 9 . 3 E f f e c t o f re s i d u a l re n n e t o n t h e h y d ro l y s i s o f b et a - c a s e i n d u r i n g sto ra g e o f Fe ta c h e e s e .

230
plasmin (Lawrence et al., 1987) and by starter bacteria enzymes to some extent
(Visser & Groot-Mostert, 1977). Present studies clearly showed that a high amount
of residual rennet in cheese was effective in proteolysing B-casein in spite of high
S/M and low pH of cheese.
It was concluded that the breakdown of a51-casein and B-casein during storage or
ripening of Feta cheese was correlated to the level of rennet in cheese.
HPLC analysis of exudate: The distribution pattern of lower molecular weight
peptides/amino acids in exudates from 3 week old Feta cheese is shown in Fig.9.4.
An increase in the peak size at the molecular weight of about 4,000 daltons was
observed with increased residual rennet in cheese. Storage studies on Feta cheese
(Chapter 6) had revealed that this was indicative of increased proteolytic activity.
It follows from this that increased proteolysis occurred with increased amount of
rennet in cheese. Rennet is primarily responsible for the formation of larger
peptides while small peptides and free amino acids are principally produced by the
starter (O'Keeffe et al., 1978). It is difficult to predict whether this increase in the
peptides was the result of direct action of rennet or the action of proteolytic
bacteria Lactobacillus casei and milk protease on the breakdown product of casein.
It is presumed here that the contribution of other starter microorganisms towards
proteolytic activity is negligible because they were destroyed in about two weeks
after manufacture of cheese (Chapter 6.3.2.e ), and in these two weeks large amount
of low molecular weight peptides is not available for proteolytic action by the
microorganisms. However, variation of peptides at only a specific molecular weight
range suggests a relationship with the specific nature of proteolytic action of rennet.
The peak sizes increased with an increase in the use of rennet. Whether or not
rennet has a role with the production of these peptides, the role of 'quantity of
rennet' can not be undermined as the action of rennet clearly stimulates the starter
bacteria to accumulate amino acids and low molecular weight peptides (Visser,
1977b ) . The change in this particular peak size shows that the increased enzyme
activity with increased amount of rennet has been specific.

Fig. 9.4
Molecular Weight Distribution
c.�ontrol _ _ _ AM� !V\f\1\
E J'5 H i g h rennet 0 C\J
-:;; Q) (.) iii Low rennet
.0 ..... 0 en .0 <(
High rennet
Molecular We ight
231
HPLC plots showing the effect of residual rennet concentration o n
the peptides formed i n three week old Feta cheese.

232
9.6.5 Exudation from cheese
Effect of residual rennet: The effect of variation in the quantity of rennet used in
cheesemaking on the exudation of whey from Feta cheeses during storage is shown
in Table 9.4. A significant increase in the amount of exudate was observed with
an increase in the amount of rennet. It has been reported earlier in this section
that increased proteolysis was detected with an increased amount of rennet. Thus,
a relationship between proteolysis and exudation appears probable. Occurrence of
exudation from other varieties of cheese provides evidence to support a strong
correlation between exudation and proteolysis. It is well known that there is
extensive proteolysis in blue-veined cheese, and exudation in this cheese is a major
problem (Pedersen et al., 1971). Exudate is released from nearly all the
blue-veined cheeses during ripening. Further, it is known from practical experience
that exudation is often observed in vintage Cheddar cheese (:::::: 2 years old). In
contrast, proteolysis is much less in Mozzarella cheese, and exudation from the
cheese is rare even though it has a high moisture content of about 48%.
It has been suggested that a51-casein can interact strongly with two, or possibly
more, casein molecules (either a5rcasein or B-casein) and can thus be a link in the
protein network (Lin et al., 1972). As proteolysis of a51-casein proceeds, the casein
network weakens and gradually disintegrates, releasing moisture held in its
interstices as exudate. Proteolysis of B-casein may be expected to further disrupt
the three-dimensional casein matrix.
R1 Rz I I
-NH- CH- C-NH- CH- C-11 11 0 0
---> R1 I
-NH-CH-C-0- + 11 0
Rz I
+NH -CH-C-3 11 0
As shown in the above chemical equation, when a peptide bond in a protein or
peptide is hydrolysed one molecule of water is consumed in the reaction and a new
pair of carboxyl and amino groups are formed. It is readily shown that for Feta
and other cheeses the water used in the hydrolysis is negligible compared to the

2 3 3
Table 9 . 4 Effect o f variation in the quantity o f rennet used in cheesemaking on the exudation 1 o f whey from Feta cheeses during storage at 1 o · c
Source of variation & l evels
Exudate in Exudate in Final gjkg cheese gjkg cheese MNFS { % )
% reduction in MNFS
Replicates
1 2
Quantity of rennet
(R ) Low Control High
Storage time { S )
2 weeks 4 weeks 6 weeks 9 weeks
12 weeks 15 weeks 2 0 weeks 2 6 weeks
LSM
4 3 . 3 4 8 . 5
3 9 . 7 4 4 . 4 5 3 . 6
2 1 . 1 2 5 . 6 3 1 . 6 4 1 . 8 5 0 . 5 5 7 . 9 6 6 . 6 7 2 . 1
Interaction
F
5 8 . 69 *
1 4 4 . 52 * *
9 8 . 4 0 * * *
S X R 0 . 9 7
S . D . 4 . 69
moisture in cheese of cheese
LSM
8 2 . 3 8 9 . 2
F
2 5 . 4 5 *
1 3 0 . 9 0 * *
7 3 . 8 8 2 . 8
1 0 0 . 5
10 0 . 3 9 ***
3 9 . 4 4 7 . 9 5 9 . 1 7 8 . 0 9 4 . 3
1 08 . 2 1 2 4 . 3 1 3 4 . 6
8 . 67
0 . 9 7
LSM
6 9 . 4 7 1 . 3
7 1 . 0 6 9 . 5 7 0 . 5
7 0 . 8 7 0 . 7 7 0 . 6 7 0 . 4 7 0 . 2 7 0 . 1 6 9 . 9 6 9 . 8
F
7 . 07
1 . 4 7
105 . 57 * * *
LSM
1 . 2 7 1 . 2 8
1 . 0 8 1 . 3 2 1 . 4 2
0 . 5 6 0 . 68 0 . 8 5 1 . 13 1 . 4 0 1 . 6 2 1 . 8 9 2 . 0 6
F
0 . 0 0
1 6 . 58 #
1 0 3 . 4 * * *
1 . 2 2 1 . 2 4
0 . 09 4 0 . 13 4
1 Exudation has been expressed in various ways . Details of calculations are provided in Appendix 4 . 2 ;
LSM = Least-square mean ; F = F ratio ; S . D . = Standard deviation of raw data ; # p < 0 . 10 ; * p < 0 . 05 ; * * p < 0 . 0 1 ; *** p < 0 . 0 0 1 ; F values without asterisks denote ' not s igni ficant ' .

234
total water in cheese. For example, the average residue weight in paracasein is
about 1 17 daltons. If hydrolysis was complete one mole of water would be used for
each mole of peptide bonds or residues. For Feta cheese containing 15% casein
protein this amounts to ( 15 x 18) / 1 17 = 2.3 g of the 50 g total water in cheese.
However, additional water is required to hydrate the new electrically charged
terminal groups. No reliable data seems to be available for the acidity constants
of these groups but it seems likely that they will be fully charged at the pH of the
cheese, typically 4.6. Kuntz ( 1971) has calculated that some 6 or 7 water molecules
are required to hydrate protein side chain carboxyl groups and perhaps 4 or 5 water
molecules for the € -amino groups. No information is available for a-carboxyl and
a-ammo groups. Thus, about 10 water molecules are required for each peptide
bond hydrolysed. A total of 30 g of water would be bound in 100 g of completely
hydrolysed Feta, a substantial portion of the total 50 g of water.
As hydrolysis of peptide bonds (i.e . proteolysis) proceeds in the ripening cheese
more and more water-binding groups are formed. A portion of these water-binding
groups will be attached to the protein network and the remainder to small peptides
and amino acids dissolved in the fluid which permeates the cheese. The first group
will inhibit exudation by binding water to the protein network. The effect is
inherently small because only a few peptide bonds can be broken before the
fragments cease to be part of the protein network. The second group will have a
more neutral effect on exudation as the bound water is already part of the
continuous aqueous phase of the cheese. It is concluded that binding of newly
created terminal groups will have only a small negative effect on exudation.
One way of verifying the above hypothesis would be to analyse the cheese and the
exudate for the composition of amino acids, particularly glutamic acid, aspartic
acid, histidine, lysine and arginine, which have electrical charged side chains at
pH 4.6. If the exudate is relatively rich in these components it would show that
with proteolysis the smaller peptides are not a part of the protein network and
therefore the water bound to these electrically charged groups does not add to the
water-binding ability of the protein network in cheese. The evidence of increased
amount of exudate in high rennet cheese is consistent with this view.

235
Effect of replicates: Variation in the amount of exudates for the replicates may
have been due to a variation in the amount of residual rennet in the respective
cheeses. Here also an increase in the amount of exudate is observed with increase
in residual rennet in cheese. This further shows a direct relationship between
residual rennet in cheese and the exudation.
Interaction of residual rennet with storage time: Exudation of whey from cheese
increased with increase in residual rennet and increase in storage time (Fig. 9.5).
Analysis of variance showed that interaction of rennet levels and storage time did
not have a significant effect on the exudation from cheese.
9.7 Summary and conclusion
A change in the amount of rennet added to cheesemilk resulted in a corresponding
variation of residual rennet in cheese. Casein proteolysis in cheese was related to
the amount of residual rennet in cheese. Degradation of asrcasein was rapid and
increased with increase in the amount of residual rennet in cheese. After 4 weeks
of storage proteolysis of B-casein was clearly detected in high rennet cheese.
Exudation of whey from cheese correlated with the residual rennet and proteolysis
in cheese. It is likely that with proteolysis the three-dimensional casein network
becomes weaker and gradually disintegrates. The water-holding ability of the
casein gels is thereby greatly reduced. Moisture is released from the interstices of
the casein gel. This free moisture and the soluble material, including peptides and
amino acids formed during proteolysis, are released as exudate during storage of
F eta cheese.
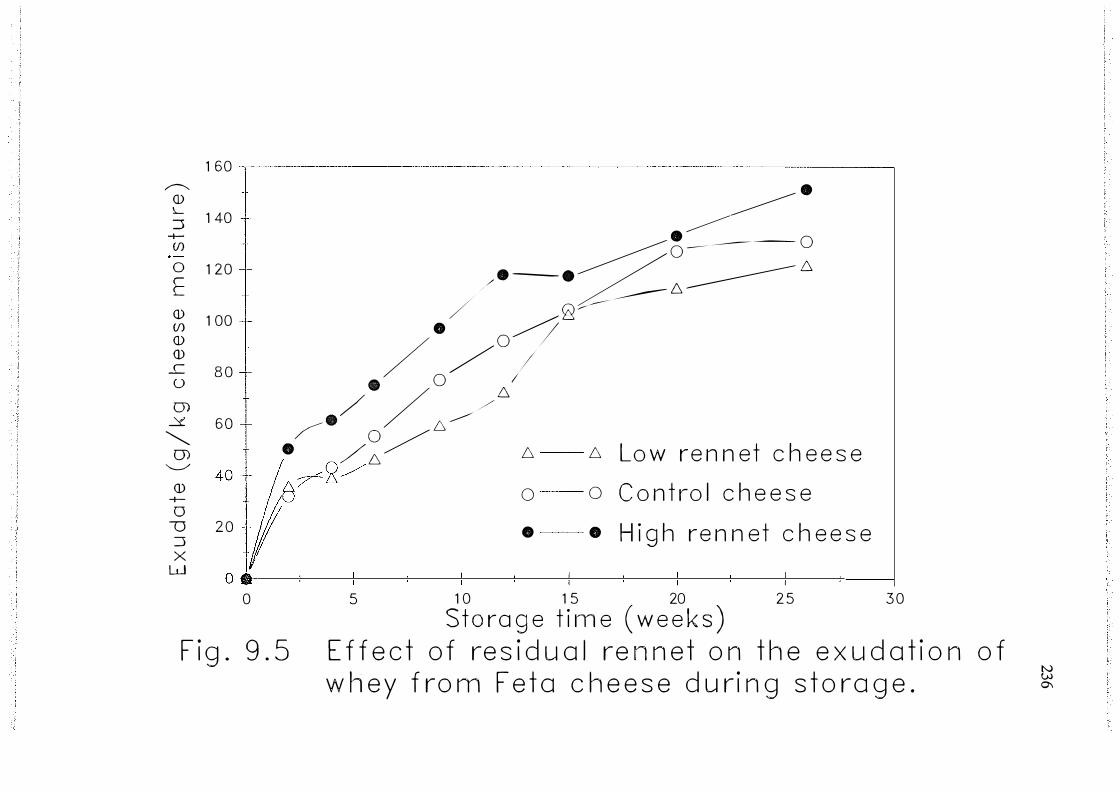
1 6 0 �
�· Q) � 1 40 �
� �· ------------ 0 � 0 o 1 2 0 ·� .-z_ --------------- 6 E / �� 6 � 1 00 •
1 Q) / /0 1 8 0 - 0 (_) ./ 6 0) / / ..Y 6 0 /. h,
6:; • /�/ D D Lo w r e n n e t c h e e s e
; 40
! /e-:rCJ1/ o o C o n t ro l c h e e s e 0
u :::J X
w
2 0 tYI 0
F i g . 9 . 5
• • H i g h r e n n e t c h e e s e
5 1 0 1 5 20 2 5 3 0 S t o ra g e t i m e ( w e e k s )
E f f e c t o f re s i d u a l re n n e t o n t h e e x u d a t i o n o f w h e y f ro m F e t a c h e e s e d u r i n g s t o ra g e .
N (.;J 0\

CHAPTER 10
OSMOSIS AND DIFFUSION IN FETA CHEESE
10.1 Introduction
237
Osmosis is the spontaneous flow of solvent from a less to a more concentrated
solution when the two liquids are separated from each other by a suitable
membrane. Osmosis tends to equilibrate the concentrations on both sides of the
membrane and strictly refers to the flow of solvent only. If there is a flow of solute
in the opposite direction the behaviour is called diffusion. Membranes which
permit the passage to some solutes but not others are said to be semipermeable.
Membranes may discriminate the flow of solutes mainly on the basis of molecular
size or on the basis of the electric charge of the solute particle. Membranes with
a uniform pore size may show sharp cutoffs, excluding all molecules above a certain
molecular mass. If the pores are less uniform, solutes of a range of sizes may pass
through the membrane with increasing difficulty.
Cheese consists of a three-dimensional casein network containing fat globules
embedded in it. The network is saturated with a complex solution which has a
composition similar to that of whey. The cheese may be considered to be a very
thick, rather imperfect, semipermeable membrane having a wide range of pores.
When cheese is placed in brine, salt penetrates into cheese by the process of
diffusion and water is lost from the cheese by the process of osmosis. Some cheese
solutes are also lost into the brine.
After cheese is removed from the brine further osmosis and salt diffusion occurs
until osmotic equilibrium is attained. At this stage cheese and any exudate in
contact with it can be assumed to be in equilibrium as they both have the same
water activities (Chapter 6.3.2.f).
It is of interest to know the factors affecting the movement of exudate from cheese.
Placing cheese in a suitable non-equilibrium solution should either promote
exudation or cause the uptake of water by the cheese. Experiments of this type

238
have been carried out on Gouda cheese by Geurts et al. (1972, 1974b, 1980).
Unfortunately, such experiments are not practical with small blocks of Feta cheese,
as it is not sufficiently coherent. In an effort to overcome this problem an
investigation involving packing cheese into dialysis tubing was undertaken. The
purpose of the dialysis tubing was to permit the flow of exudate material (water,
NaCl and milk salts) as a result of which equilibrium would be attained during
dialysis. It was envisaged that the attainment of equilibrium would be influenced
by the osmotic effect as well as the other associated factors. The mass transfer
during dialysis would therefore indicate the actual movement of exudate from Feta
cheese under similar conditions.
The presumption that the mass transfer during dialysis would not be influenced
merely by the osmotic effect was supported by the observation from another
experiment in which blocks of 3 month old Cheddar cheese ( 64 g) and 9 month old
Feta cheese (506 g) were immersed in water and the change in their weight were
measured at selected time intervals. Data on change in weight of cheeses up to
72 h showed a consistent gain in weight of Cheddar cheese ( 12.3%) and a gradual
loss of weight from Feta cheese (3.75% ). It is apparent from this that the mass
transfer during the process of attainment of equilibrium was influenced by a
number of factors.
Following standardisation of the experimental procedure, the effect of selected
factors on exudation was investigated.
10.2 Experimental plan
Ideally the cheese inside the dialysis tubing should have been dialysed in exudate
obtained from the same cheese. However, the exudate was available only in small
quantities. Preliminary experiments were therefore carried out to identify a
solution similar in composition to the exudate for use as the external solution when
dialysing cheese. This simulated solution will be hereafter referred as "simulated
external solution" (SES). SES was prepared by using NaCl (cheese salt), lactose
(commercial grade), calcium lactate, lactic acid (� 88%), polyethylene glycol (PEG)

239
of molecular mass 20,000 daltons, miiii-Q water1 and 50% NaOH solution. PEG
was used as a substitute for slow or non-dialysing protein/peptides in exudate.
Grated Feta cheese was packed and sealed in dialysis tubings and dialysed in SES.
The composition of the SES was varied, one constituent at a time. Alternately, the
composition or pH of the cheese was varied by mixing it with an appropriate
reagent prior to packing. A large quantity of SES (2-3 kg) was used so that the
change in its composition due to diffusion of material from the cheese was
negligible. The change in weight of cheese due to mass transfer during dialysis was
measured. The influence of N a Cl, pH, calcium and proteolysis on weight change
during dialysis was investigated.
Initially it was planned to carry out a complete factorial designed experiment and
use statistical analysis to interpret the effect of selected variables and their
interactions. However, during the course of the preliminary experiments it became
evident that some of the selected factors, such as pH and calcium, had a minor
influence on the mass transfer. In some of the experiments the changes in the
weight of cheese during dialysis were small. This made it difficult to infer from the
data on mass transfer as the change in weight could also have occurred partly due
to the experimental errors. The loss of weight from material inside the tubing due
to evaporation during weighing and inaccuracies involved in wiping the tubing dry
increased the source of experimental error. Further the test method became
complicated due to rapid loss of low molecular weight protein breakdown material
during the initial stages of dialysis. Plans to carry out a statistical designed
experiment were therefore abandoned.
10.3 Experimental
10.3. 1 Material: Feta cheeses and exudates of about 2-3 months of age were used,
unless specified otherwise. Dialysis membranes, size 20 DM (Union Carbide,
1 Water purified by reverse osmosis and Milli-Q treatment (Millipore
Corporation, Bedford, MA).

240
Chicago) of pores in the molecular mass range of 12,000 - 20,000 daltons (Stewart,
1977), were used. Milli-Q water was used for the preparation of SES. Exudate
obtained from the cheese was analysed for calcium ( complexometric method),
lactose ( enzymatic calorimetric), lactate ( enzymatic calorimetric), N a Cl
(potentiometric titration), total nitrogen (Kjeldahl), total solids and pH. SES was
made with composition similar to that of the exudate.
The approximate composition of Feta used for the dialysis studies was: 26.5% fat,
16.2% protein, 51 . 1% moisture, 4.3% NaCI, 91 mM/kg calcium and pH 4.67.
The approximate composition of exudate from 2 - 3 month old Feta cheese was: Calcium 1 10 mM/kg Lactose 50 mM/kg
Lactates 210 mM/kg
NaCl
Total nitrogen
Total solids
pH
9.0%
0.455%
16.0%
4.55
10.3.2 Preparation of simulated external solution
The SES was prepared using the following.
PEG2
NaCl
Lactose
(%) (mM/kg)
3.4
9.0
1.8
1.7
1540.0
50.0
Calcium lactate 3.2 110.0
Lactic acid (88%) 1.0 97.7
Water 81 .6 45333.0 The pH of the SES was adjusted to 4.55 by adding 50% NaOH.
10.3.3 Cheese in dialysis tubing: Dialysis tubes, each of 20 cm length, were soaked
in water for 2 h and tied at one end. About 10 g of grated Feta cheese was packed
into the weighed tube with the help of a funnel and a spatula. The weight of the
2 Details of optimisation of the concentration of PEG in the SES has been provided later on in this Chapter.

241
tube with cheese was recorded. The cheese inside the tube was compacted by
squeezing. The length of the filled cheese in the tube was adjusted to 5.5 cm. The
open end of the tube was tied. This was put in a beaker containing 2-3 kg SES for
dialysis at room temperature (20 • C). The SES was continuously stirred on a
magnetic stirrer. The weights of the dialysis tubings with cheese were recorded
after selected time intervals. Each dialysis tubing was wiped dry using tissue paper
before weighing. Usually 5-6 dialysis tubings with cheese were put into the SES at
the same time for dialysis. One dialysis tubing was drawn at each specified time
interval for weighing. After dialysis, the contents in the tubing were analysed for
total solids, calcium ( complexometric method) and N a Cl (potentiometric titration).
The details of the analytical methods are outlined in Appendix 4. 1 .
10.4 Results
The results are described in two parts. The first part refers to optimisation of the
test method and the second part describes the influence of selected factors on
exudation.
10.4.1 Optimisation of assay procedure
The objective was to optimise the composition of SES so that cheese would be
close to equilibrium with the SES when dialysis commenced, except for the factor
under study.
Material for dialysis: 'Feta cheese', 'exudate from Feta' and 'mixture of cheese and
exudate' were dialysed in SES to determine the appropriate material for
experimentation. Concentrations of NaCl in simulated external solutions were
varied ( 10, 20 & 25%). The dialysis time taken to reach equilibrium between NaCl
contents of the dialysed material and SES was about: one hour for exudate; 3-4 h
for mixture of cheese and exudate; and longer (� 12 h) for cheese. Equilibrium
was attained rather too soon with the use of exudate. The gross composition of
exudate is expected to have changed with the attainment of equilibrium. In such
a short time it was difficult to predict the trend in change of weight of exudate or
the mixture of cheese and exudate. Cheese was therefore selected as the material
to be dialysed.

242
Variability: The standard deviations for the percent mass transfers from cheese
during dialysis ranged between 0.1 - 0.3% when measured at varying time-intervals.
The pooled standard deviation was 0.2%. The reproducibility of the test method
was satisfactory.
Loss of nitrogenous material through dialysis membrane: When dialysis extended
beyond 24 h the cheese in the dialysis tubing lost weight irrespective of the initial
concentrations of PEG, NaCl and Ca2+ in the SES. This can be explained as being
due to gradual diffusion of lower molecular weight protein breakdown material
from the cheese into the SES. PEG, used as the substitute for proteins/peptides
in exudate, is of uniform high molecular weight and does not pass through the
dialysis membrane. This creates an imbalance in osmotic pressure across the
dialysis membrane and consequently a continuous loss of water from cheese. The
gross composition of cheese is therefore affected over a long period of dialysis.
The effect of increase in time of dialysis and age of cheese on the loss of total
nitrogen from cheese during dialysis was investigated (Fig. 10.1 ). It appears that
most of the protein breakdown material of lower molecular weight that can pass
through the dialysis membrane does so rapidly. Increased loss of protein
breakdown material from 26 week old cheese after 2 h of dialysis may be attributed
to the presence of large amounts of low molecular weight protein breakdown
material. Duration of dialysis up to 4 hours for cheeses of about 9 weeks old was
chosen as standard time for subsequent trials. It is assumed that the loss of low
molecular protein breakdown material, being less than an equivalent of 5 % of the
total nitrogen in the cheese, would not significantly alter the trend of mass transfer.
Influence of temperature: The effect of temperature of dialysis on mass transfer is
shown in Table 10.1 . The variations in the weight of cheeses at the two
temperatures are small. It is apparent that temperature would not markedly affect
the trend in 'mass transfer' in 4 h of dialysis. For convenience, the temperature of
20 • C was chosen as the standard for dialysis.

� 1,�
�
c (!) (J) 0 L
-+-c
-
0 +-0
-+-'+-0 (/) (/) 0 (!) >
8 . 0�----------------------------------------------�
6 . 0
4.0 -6
0 •
0 2 . 0 1:::. o 2 w k o l d c h e e s e • 9 w k o l d c h e e s e 6 2 6 w k o l d c h e e s e
:J E :J
(_)
0 . 0 6����--��--��--.-��--��--���__j 0.0 2 . 0 4 .0 6 . 0 8 . 0
F i g . 1 0 . 1 D u ra t i o n o f d i a ly s i s ( h o u rs )
Lo s s o f t o t a l n i t ro g e n f ro m F e t a c h e e s e s o f d i f f e re n � a g e d u ri n g d i a l y s i s . N � v.>

Table 1 0 . 1
244
E ffect of temperature on mass transfer from cheese ( 16 wk old) during dialysis
Dialysis time Cumulative change in weighta of chees e ( % )
( hours ) Dialysis at 2 0 ° C Dialysis at 4 o c
0 . 5 - 0 . 3 5 - 0 . 52 1 . 0 + 0 . 17 - 0 . 3 2 2 . 0 + 0 . 3 6 - 0 . 11 4 . 0 + 0 . 3 3 + 0 . 2 3 6 . 0 + 0 . 61 + 0 . 54 7 . 5 + 0 . 54 + 0 . 54
a + denotes gain of weight , - denotes loss of weight .
Age of the cheese: The effect of age on the mass transfer from dialysed cheese is
shown in Table 10.2. Cheeses of less than 14 weeks age were not greatly affected
by mass transfer during dialysis. Accordingly, about 2-3 month old cheese was
considered satisfactory for conducting the experiment. Increased mass transfer
from very old Feta may be attributed to the presence of large amounts of low
molecular weight protein breakdown material that occurs as a result of increased
proteolysis.
Table 1 0 . 2
Duration of dialysis ( h )
0 . 5 1 . 0 1 . 5 2 . 0 2 . 5 3 . 5 4 . 5 6 . 5
Effect of age of cheese on the mass transfer from Feta cheese during dialysis
Cumulative change in weight8 of cheese ( % )
4 wk cheese 14 wk cheese 77 wk cheese
+ 0 . 19 + 0 . 00 + 0 . 64 + 0 . 3 8 + 0 . 10 + 1 . 6 6 + 0 . 2 8 + 0 . 3 1 + 1 . 9 1
0 . 0 0 + 0 . 2 1 + 2 . 4 2 - 0 . 47 + 0 . 2 1 + 2 . 9 3 - 1 . 04 + 0 . 2 1 + 2 . 9 3 - 1 . 7 1 - 0 . 3 1 + 2 . 9 3 - 2 . 3 7 - 1 . 0 3 + 2 . 8 1
a + denotes gain of weight , - denotes loss o f weight .
10.4.2 Influence of selected factors on mass transfer
Influence of proteolysis: Proteolysis causes an increase in the amount of low
molecular weight protein breakdown material in cheese. The effect of this material

245
on the mass transfer was determined by dialysing 3 month old Feta cheese (and
exudate) in exudate from 18 month old Feta cheese (Table 10.3) . The exudate was
used as the external solution to reduce the experimental error involved in using
SES. Persistent loss of weight from both exudate and cheese was detected. The
loss of weight may be attributed to the increased osmotic pressure exerted by the
large amount of low molecular weight protein breakdown material in exudate
(external solution).
Table 1 0 . 3
Duration o f dialysis ( h )
0 . 5 1 . 0 2 . 0 3 . 0
18 . 0 2 6 . 0
E ffect of low molecular weight protein breakdown material on mass transfer from cheese and exudate : estimated by dialysing cheese8 ( 3 mo ) and exudateb ( 3 mo ) in exudatec from older Feta cheese ( 1 8 mo ) .
Cumulative change in weightd of cheese in dialysis tubing ( % )
- 0 . 2 1 - 0 . 4 2 - 0 . 9 5 - 1 . 3 7 - 3 . 89 - 4 . 8 4
CUmulative change in weightd of exudate in d ialysis tubing ( % }
- 1 . 59 - 3 . 4 9 - 6 . 0 3 - 7 . 9 3 - 14 . 6 - 14 . 5
a Composition of cheese: 5.8% NaCl, 85.7 mM/kg Ca2+ , 50.8% moisture; b Composition of exudate: 9.5% NaCl, 1 17.5 mM/kg Ca2+ , 18.3% TS; c Composition of old exudate: 6.67 % NaCl, 147 mM/kg Ca2+ , 18.2% TS; d + denotes gain of weight, - denotes loss of weight.
Influence of protein breakdown material: Cheese dialysed in SES without PEG
always recorded a gain in weight. This was probably due to the higher osmotic
pressure exerted by the protein breakdown material in the cheese. High molecular
weight PEG was therefore used in SES as a substitute for protein and protein
breakdown products. Effect of variation in the amount of PEG in SES on the mass
transfer from cheese are shown in Table 10.4. The standard amount of PEG used
in SES was chosen as 3.4%.

Table 1 0 . 4
246
Effect of variation in the concentrati on of PEG in SES on the mass transfer from Feta cheese ( 14 wk old) during d ialysis
Dialysis time
Cumulative change in weighta of cheese ( % )
( h ) 0 % PEG 3 . 3 % PEG 3 . 6% PEG 3 . 9 % PEG 6 . 0 % PEG
0 . 5 + 2 . 2 6 0 . 00 - 0 . 57 - 0 . 3 7 - 0 . 0 1 1 . 0 + 3 . 3 4 + 0 . 10 - 0 . 3 8 - 0 . 7 3 - 0 . 4 0 1 . 5 n . d . + 0 . 3 1 - 0 . 2 8 - 0 . 8 5 n . d . 2 . 0 + 4 . 7 1 + 0 . 2 1 - 0 . 2 8 - 1 . 10 - 0 . 9 6 2 . 5 n . d . + 0 . 2 1 - 0 . 19 - 1 . 10 n . d . 3 . 5 + 6 . 08 + 0 . 2 1 - 0 . 2 8 - 1 . 58 - 2 . 08 4 . 5 n . d . - 0 . 3 1 - 0 . 57 - 2 . 2 0 n . d . 6 . 5 n . d . - 1 . 0 3 - 0 . 57 - 2 . 56 n . d .
a + denotes gain o f weight , - denotes loss of weight ; n . d . denotes not determined .
Influence of NaCl: The effect of NaCl concentration in SES on the mass transfer
from cheese is shown in Table 10.5. An increase in weight of cheese was detected
with reduced NaCl concentration in SES and vice versa.
Table 1 0 . 5
Duration of dialysis (h )
0 . 5 1 . 0 1 . 5 2 . 0 3 . 0 6 . 0 7 . 0
Effect of variation in the NaCl content in SES on the mass transfer from cheese ( 12 wk old) during dialysis
Cumulative change in weight8 o f cheese ( % )
0 % NaCl 9 . 0% NaCl 2 0% NaC l
+ 2 . 51 + 0 . 2 3 - 1 . 9 6 + 3 . 9 3 + 0 . 57 - 3 . 08 + 5 . 2 4 + 1 . 3 7 - 3 . 7 4 + 6 . 3 3 + 1 . 4 8 - 4 . 58 + 7 . 64 + 1 . 9 4 - 5 . 3 3 + 1 0 . 2 6 + 3 . 08 - 6 . 54 + 1 0 . 7 0 + 3 . 3 1 - 6 . 7 3
a + denotes gain o f weight , - denotes loss of weight .
Influence of pH: The effect of variation in the pH of SES on the mass transfer
from cheese during dialysis is shown in Table 10.6. The limiting values of pH, 4.3
& 4.8, were chosen based on the extreme values of pH expected during storage of
Feta cheese. Even though there is a trend in the pattern of mass transfer with
respect to pH, the changes in weight are too small to be of practical significance.

247
Table 1 0 . 6 E ffect of variation in pH of SES8 on the mass transfer from cheese ( 15 wk old} during dialysis
Dialysis time (h )
0 . 5 1 . 0 2 . 0 4 . 0 6 . 0 7 . 5
Cumulative change in weightb of cheese8 ( % }
Low pH ( 4 . 3 } Control ( 4 . 54 } High pH ( 4 . 8 }
- 0 . 8 9 - 0 . 17 - 0 . 13 - 0 . 4 0 + 0 . 17 + 0 . 12 + 0 . 05 + 0 . 3 6 + 0 . 3 9 + 0 . 14 + 0 . 3 3 + 0 . 7 0 + 0 . 54 + 0 . 6 1 + 0 . 8 0 + 0 . 63 + 0 . 54 + 1 . 0 8
a pH of cheeses and the respective simulated external solutions had not changed after dialysis; b + denotes gain of weight, - denotes loss of weight.
In the above trial the pH of the cheese did not change during dialysis. It is
possible that the apparent differences in mass transfer were not related to pH.
Therefore, another trial was carried out where the pH of cheeses was changed
before dialysis. This was done by adding the same volume of lactic acid or 50%
NaOH or water to the cheese to produce low pH, high pH and control cheeses,
respectively. The pH of SES was kept constant. Dialysis of these cheeses in SES
also did not show any specific trend or substantial mass transfer (Table 10.7). It
was therefore concluded that a variation of pH within the normal pH range of Feta
cheese had little influence on the mass transfer.
Table 1 0 . 7
Dialysis time (h )
0 . 5 1 . 0 2 . 0 3 . 0 4 . 0
E ffect of variation in pH of cheeses8 on the mass trans fer from cheeses ( 7 wk old} during dialysis in SES of constant pH
Cumulative change in weightb of cheese8 ( % )
Low pH ( 4 . 15 } Control ( 4 . 4 5 } High pH ( 4 . 68 }
- 0 . 4 0 - 0 . 4 9 - 0 . 16 - 0 . 62 - 0 . 64 - 0 . 67 - 1 . 0 2 - 1 . 2 7 - 0 . 9 5 - 1 . 2 0 - 1 . 8 6 - 1 . 12 - 1 . 4 5 - 1 . 9 6 - 1 . 2 2
a pH of cheeses and the respective SES had not changed after dialysis. Loss of weight in all cheeses was probably due to use of younger cheese (7 weeks) and addition of some water for pH adjustment; b + denotes gain of weight, - denotes loss of weight.

248
In both the above trials the pH of simulated external solutions did not change due to
dialysis. It was therefore not necessary to buffer the SES .
Effect of calcium: The effect of calcium concentration on mass transfer from cheese
was studied by changing the calcium levels in the SES (Table 10 .8) . The levels
(80 mM/kg for low, 1 10 mM/kg for control, 140 mM/kg for high) were chosen on the
basis of maximum variation expected in normal Feta cheese. The mass transfer from
cheese due to variation of calcium in SES was small. The cheese gained weight with
the low level of calcium in SES and vice-versa. It is however uncertain whether the
weight change was due to the calcium concentration or due to differences in the
osmotic pressure. The calcium contents in the cheeses after dialysis were 82 , 96 and
1 10 mM/kg for low, control and high levels, respectively. To further investigate the
effect, the calcium contents of cheeses were altered to different levels (98 , 1 1 8 & 140
mM/kg) by addition of calculated amounts of 3 M CaC12 solution or water, and the
modified cheeses were dialysed in SES of constant calcium (Table 10 . 9) . The
magnitude of mass transfers were again small. A trend opposite to that observed
earlier was detected. It is worth noting here that in all cases there was a loss of
weight. The loss of weight in control cheese was apparently due to experimental error
in standardising a suitable composition for SES . Once again the changes could have
occurred due to osmotic pressure differences. As the weight changes in both instances
were small, it was concluded that calcium concentration of cheese did not have a
noticeable effect on the mass transfer from cheese during dialysis.
Table 10 . 8
Dialysis time (h )
0 . 5 1 . 0 2 . 0 4 . 0 8 . 0
Effect of variation in calcium of SESa on the mass transfer from cheese ( 16 wk old ) during dialysis
Cumulative change in weightb of cheesea ( % )
Low Ca2+ SES Control SES High Ca2+ SES
+ 0 . 54 + 0 . 58 - 0 . 2 2 + 0 . 3 2 + 0 . 54 - 0 . 3 2 + 0 . 7 7 + 0 . 4 5 - 0 . 4 1 + 1 . 2 5 + 0 . 3 8 - 0 . 2 2 + 1 . 8 6 + 0 . 9 2 + 0 . 2 0
a Calcium of cheeses and the respective SES had not equilibrated after dialysis; b + denotes gain of weight, - denotes loss of weight; SES = Simulated external solution.

Table 1 0 . 9
249
Effect of variation in calcium o f cheese on the mass transfer from cheeses ( 1 wk old ) during dialysis in SES of constant calcium
- - - - - - - - - - - - - - - - - - - - - - -- - - -- - --- - - - -- - - - - - - - - - - - - - - - - - - - - -
Dialysis t ime
Cumulative change in weight8 of cheese ( % )
(h )
0 . 5 1 . 0 2 . 0 3 . 0 4 . 0
ca2+ in cheese = 9 8 mM/kg
- 0 . 4 9 - 0 . 64 - 1 . 2 7 - 1 . 8 6 - 1 . 9 6
ca2+ in cheese = 118 mM/kg
- 0 . 4 4 - 0 . 8 8 - 1 . 3 7 - 1 . 6 7 - 2 . 64
ea Z+ in cheese = 1 4 0 mM/kg
- 0 . 2 8 - 0 . 51 - 0 . 9 5 - 1 . 56 - 1 . 5 6
a + denotes gain o f weight , - denotes loss o f weight .
10.5 Discussion
The study was aimed to develop a suitable test method and then to use the method
as a model for investigating the effect of selected factors on exudation. However,
the test method that was developed did not prove to be very accurate. Contrary
to earlier expectations, the proteinjpeptides in exudate made a significant
contribution to the mass transfers. PEG could substitute only for the large
molecular weight protein breakdown material. Ideally a membrane impervious to
all material except water was required. The dialysis tubing could not fulfil this.
Rapid loss of low molecular weight protein breakdown material from cheese during
dialysis increased the experimental error. The loss of nitrogenous material in the
first four hours of dialysis represented an equivalent of � 0.6% of the total weight
of cheese. While studying the effects of selected factors on exudation, instances
where the loss of weight is around this figure, the mass transfer could not solely be
attributed to the experimental variation. Nevertheless, the study provided some
very useful information. The results of this investigation are to be treated only as
an indication of the trend.
Cheese lost weight when dialysed with exudate from older Feta. Thus a mass
transfer took place from the region of high molecular weight protein breakdown
material towards the region of low molecular weight protein breakdown material.
It is proposed that a similar process goes on within cheese during storage resulting

250
in increase in the amount of exudate. Moisture in Feta cheese may be grouped
into three types: moisture bound to the protein; moisture held in the capillaries of
the protein gel; and the moisture in the form of exudate or the moisture that is
loosely associated to the proteins, such as in crevices, voids and surface of the
cheese. These moistures co-exist in a state of dynamic equilibrium. The moisture
that remains bound to the protein is not available for exudation. However, with
the hydrolysis of protein, some of the bound water may become available for
exudation. As proteolysis progresses, the protein breakdown material become
soluble, and together with the water bound to the ionic groups of peptide bonds,
form part of the exudate (Chapter 9). Some moisture is released from part of the
protein matrix (casein gel structure) that weakens or disintegrates with proteolysis.
Thus, the amounts of protein breakdown material increase in the exudate as a
consequence of proteolysis. This creates an unequal distribution of protein
breakdown material between the exudate and moisture held in the intact part of
protein matrix. The exudate which has a larger amount of low molecular weight
protein breakdown material draws out moisture from the protein matrix to attain
equilibrium. This process is similar to that observed during dialysis of young
cheese in older exudate.
Another important implication from the findings of dialysis of younger cheese in
older exudate is that the exudates are unlikely to be reabsorbed back into the intact
protein matrix because of the higher osmotic pressure exerted by the low molecular
weight protein breakdown material. Thus once exudation commences, it may be
impossible to stop or reverse the process.
An increase in NaCl content in SES during dialysis produced considerable loss of
mass from cheese in dialysis tubing, and vice versa. A similar situation occurs in
cheese during brining when the brine is about 20% NaCl and the cheese has no
NaCl. After brining, the outer layers of cheese would be expected to have higher
percentages of NaCl while the inner layers may have very little NaCl. This
difference in NaCl concentration would persist until equilibrium in NaCl
distribution is attained throughout the cheese. There would thus be a difference
of osmotic pressure throughout the cheese. A process similar to that of mass

251
transfer with the dialysis trial would occur: the moisture from the inner layers of
cheese would flow out to the outer layers, and come out as exudate because the
moisture is not reabsorbed by the outer layers (Chapter 1 1) . It follows from the
effect of NaCl concentration that cheeses dry salted on the surface would lose an
increased amount of exudate due to a higher NaCl concentration gradient.
Proteolysis would be faster in the inner layers of cheese due to a reduced NaCl
concentration. This will further increase the amount of exudate. A combined
effect of increased proteolysis and salt gradient appear to provide the ideal
conditions for the occurrence of exudation.
Exudation does not seem to be appreciably affected by the calcium content in
cheese. A decrease in pH of cheese ( 4.8 to 4.3) during storage did not have any
discernible effect on the exudation. The effect of residual lactose in reducing
cheese pH may therefore have a minor influence on exudation. The lowering of
cheese pH due to the residual lactose may however influence proteolysis and
indirectly affect exudation.
10.6 Summary and conclusion
A test method was devised, based on the principles of osmosis and diffusion, to
study the effect of selected factors on the movement of exudate. Feta cheese was
dialysed in selected non-equilibrium solutions. The change in weight of the cheese
during dialysis was used as an estimate of the effect of a variable on exudation.
The test method provided only an i�dication of the trends in exudation as
experimental errors were expected to be high.
It is concluded that exudation is influenced by the gradient in the salt concentration
and the protein breakdown material. The effects of change in pH and calcium in
cheese on exudation were minor.

252
CHAPTER 1 1
SALT DIFFUSION I N FETA CHEESE AND ITS EFFECT O N EXUDATION
11.1 Introduction
The uptake of NaCl and the concurrent loss of moisture during brining of cheese
is an impeded mutual diffusion process (Geurts et al., 1974b ). Osmotic equilibrium
is reported to play a significant role in transport of water (Guinee & Fox, 1986a),
particularly in brine-stored Feta-type cheeses (Mansour & Alais, 1972).
In the case of brine salted cheeses, such as Feta, the exterior layers of cheese
initially have a high NaCl content and low moisture. It is suggested that during
storage diffusion of NaCl from the region of higher concentration (outer layers of
Feta) to the region of lower concentration (inner layers of Feta) is accompanied
by displacement of substantial amount of moisture in the opposite direction
(Chapter 10). The moisture displaced from the inner layers would be retained in
the cheese if the displaced moisture is absorbed in the protein matrix at the outer
layers due to the fall in NaCl concentration. However, if the moisture is not
reabsorbed it would exude from the cheese, along with some soluble material, as
exudate.
The amount of exudate is expected to be related to the concentration gradients of
NaCl and water, existing within the block of cheese at the time of packing. It is of
interest to know the time taken for the equilibration of the concentration gradients
of N a Cl and water in the cheese. The scope of this investigation was to determine:
the gradient in concentration of NaCl within a block of Feta cheese after
brining,
the time taken until substantial equilibrium of NaCl concentration in the
entire block of cheese is attained, and
the pattern of moisture distribution in different layers of cheese until
equilibrium of salt-in-moisture (S/M) concentration was attained.

253
11.2 Experimental Feta cheese was manufactured using the method outlined in Chapter 6 (Fig 6 . 1 and
Appendix 6 .2) . Blocks of Feta cheese were drawn for analysis at selected storage
intervals . The approximate dimensions of a typical block of cheese were
10 X 10 X 5 cm. A slice of 2 .5 cm thickness was cut from each of the four 5 X 10
cm faces of the block leaving a 5 cm long cube of cheese (Fig. 1 1 . 1) . Using a special
cutting device the cubic middle portion of the cheese was sliced horizontally into 10
equal parts. The pairs of corresponding layers from the top and bottom of the cube
were combined and mixed . Thus the central portion of the cheese was subdivided into
5 portions. These layers have been referred as outer to inner layers in cheese. Each
of these five portions weighed about 30 g. These five portions , the initial cut-out
portions (four sides) and the exudate from Feta were weighed ; and the cheese portions
separately grated. The cheese portions and the exudate were analysed for pH, moisture
and NaCl (potentiometric titration) . Details of analytical methods are provided in
Chapter 4 and Appendix 4. 1 . The NaCl and moisture of the entire block of cheese was
calculated from the known weights, NaCl and moisture contents of these portions. All
the analyses were carried out with at least two lots of cheese.
11.3 Results & discussion Table 1 1 . 1 shows a typical example of NaCl and moisture distribution in various layers
of Feta cheese at selected periods of storage. Fig . 1 1 .2, Fig. 1 1 .3 and Fig. 1 1 .4 show
the distribution of NaCI, moisture and salt-in-moisture, respectively , in different layers
of cheese.
The pH values of different layers of Feta cheese after brining were similar. The cut
out portions were the segments with highest NaCl and S/M concentration following
brining. As expected , the S/M and NaCl concentrations were higher at the outer layers
and decreased gradually towards the inner layer. These concentration gradients
decreased with time. The outer layers were always the region of lowest moisture
content. The moisture content of cheese increased towards the inner layers. The
moisture content of cut-out portions was mostly close to the average moisture in
cheese. The initial gradient in moisture concentration of cheese also decreased with
time. During storage, the moisture content in all the layers either decreased or
remained steady, but never showed an increase.

5.0
Fig. 1 1 .1
I I
I
;� - - _t[ - - - -I I
I I 2.5 __,
I 1 I I I I f- - - - - � - - - - -{
I I
I I
I
I }- - - - - 1 - - - -I I I 1 I I I
I
I
I I
I : �r I I l I l l
k:__ _ _ _ _ _ _ _ y
A
10.0
-- 5.0
B C D E
I
1 0 tri
l
Cutting a block of Feta cheese into different layers. All the mensurements
nrc a pproximate estlmntes and are reported In cm.
Top: The continuous lines represent the outline of the block of Feta cheese
Bottom:
(10 X 10 X 5 cm). A slice of 2.5 cm thickness was cut from each of the
fou r 5 X 1 0 cm faces of the block leaving a 5 cm long cube of cheese. The
dotted lines show the outline of the middle portion of the block of Feta.
Middle portion of the block of Feta showing the sliced layers. The pairs
of corresponding layers fro m the top and bottom of the cube were
combined and mixed. A: Outer layer; B: Second layer fro m outside;
C: Third layer fro m outside; D: Fourth layer fro m outside; E: Inner layer.
254
T 5.0
J

255
Table 1 1 . 1 NaCl and moisture distribution in various layers of Feta cheese at selected periods of storage
Layer
After brining1 One week old
NaCl Moisture S/M NaCl Moisture S/M % % %
----------------------------------------------------------1st ( outer) 3 . 2 7 5 0 . 0 6 6 . 53 3 . 8 5 4 8 . 0 3 8 . 02 2nd 2 . 11 5 3 . 87 3 . 9 2 3 . 94 5 1 . 4 4 7 . 6 6 3 rd 0 . 8 5 5 5 . 4 8 1 . 5 3 3 . 8 6 5 1 . 8 8 7 . 4 4 4th 0 . 3 8 5 6 . 2 0 0 . 68 3 . 77 5 1 . 3 4 7 . 3 4 5th ( Inner) 0 . 19 5 6 . 8 1 0 . 3 3 3 . 67 5 1 . 5 1 7 . 12
cut-outs2 4 . 65 5 1 . 67 9 . 0 0 4 . 3 1 5 1 . 2 0 8 . 4 2
overal l3 3 . 7 1 5 2 . 52 7 . 06 3 . 8 6 5 1 . 9 9 7 . 4 2
Exudate n . a . n . a . n . a . 7 . 52 8 6 . 17 8 . 7 3 ---------- --------------------- --------------------- --------------------------------------------------- - - - - - - - - - - - - -
Two weeks old Three weeks old --------- ---- ------ ------------------- --
Layer NaCl Moisture S/M NaCl Moisture S/M % % % % % %
1st ( Outer) 3 . 48 4 7 . 7 5 7 . 2 9 3 . 4 2 4 6 . 9 7 7 . 2 8 2nd 3 . 52 4 9 . 97 7 . 04 3 . 57 4 9 . 57 7 . 2 0 3 rd 3 . 56 5 0 . 4 6 7 . 06 3 . 58 5 0 . 10 7 . 15 4th 3 . 59 5 0 . 59 7 . 10 3 . 62 4 9 . 9 8 7 . 2 4 5th ( Inner ) 3 . 58 5 0 . 5 0 7 . 09 3 . 59 5 0 . 9 7 7 . 04
cut-outs2 3 . 7 3 5 0 . 6 0 7 . 37 3 . 60 5 0 . 2 2 7 . 17
Overal l3 3 . 7 5 5 1 . 2 5 7 . 3 2 3 . 67 5 0 . 9 4 7 . 2 0
Exudate 6 . 2 7 8 4 . 9 2 7 . 3 8 6 . 13 8 5 . 57 7 . 16
1 The pH o f the portions from outer to inner layers o f cheese were 4 . 69 , 4 . 69 , 4 . 7 1 , 4 . 7 2 and 4 . 7 1 , respectively ; 2 ' Cut-outs ' refers to the vertical segments , each o f 2 . 5 cm thickness , cut from the cross-section ( 4 s ides ) of the cheese ; 3 ' Over-all ' refers to estimates of weighted average of all the portions of cheese and exudate ; n . a . = not app l i cable .

c 0
-+-0 L -+-c Q) (.) c 0 (.)
u 0
z
5 �--------------------------------------------------.
o --- o O u t e r l a y e r
• --- • S e c o n d l a y e r f ro m o u t s i d e
e; -- t; T h i rd l a y e r f ro m o u t s i d e
... --- ... Fo u rt h l a y e r f ro m o u t s i d e o --- o I n n e r l a y e r
• - • C u t - o u t p o rt i o n s ( 4 s i d e s ) 0+-------�-------.--------�-------.------�------�
0
F i g . 1 1 . 2
1 2 3 S t o ra g e t i m e ( w e e k s )
P a t te rn o f N a C I d i s t ri b u t i o n i n v a r i o u s l a y e rs o f F e t a c h e e s e d u ri n g s to ra g e .
60�------------------------------------------------� o --- o O u t e r l a y e r · --- ·
57 1 ------. t � "---" 5 4
· --- · o --- o
S e c o n d l a y e r f ro m o u t s i d e
T h i rd l a y e r f ro m o u t s i d e
F o u rt h l a y e r f ro m o u t s i d e
I n n e r l a y e r
Q) L ::;
-(/) 0
2
• --- 11 C u t - o u t p o rt i o n s ( 4 s i d e s ) 1 5 1 ·---------------------=::i�������:::::l
48 °'---------o·---------1 45+-------�------�--------�------�------�------�
0 2 3
S t o ra g e t i m e ( w e e k s ) F i g . 1 1 . 3 P a tt e rn o f m o i s t u re d i s t r i b u t i·o n i n v a r i o u s
l a y e rs o f F e t a c h e e s e d u r i n g s t o ra g e .
256

1 0 . 0-,---------------------,
· ------
r--.. • 6� 8 . 0 ���������
'-....____/
(]) !:... j �)--------- /$ "t; 6 . 0 0 E I I / / / !
4 . 0 / 4
w 2 . 0 1 0 -- 0
· -- ·
t::,. -- 6
A. --- A
D -- D
O u te r l a y e r
S ec o n d l a y e r f ro m o u t s i d e
T h i rd l a y e r f ro n1 o u t s i d e
F o u rt h I a y e r f r o m o u t s i d e
I n n e r l a y e r
• - • C u t - o u t p o rt i o n s ( 4 s i d e s ) 0 . 0+-------�------�------�------�------�----�
0 . 0
F i g . 1 1 . 4
1 . 0 2 . 0 3 . 0 Sto ra g e t i m e ( w e e k s )
P a tt e rn o f d i s t r i b u t i o n o f s a l t - i n - m o i s t u r e i n va r i o u s l a y e rs o f Fe ta c h e e s e d u r i n g s t o ra g e .
� -...l

258
Substantial equilibrium of NaCl distribution was attained in about two weeks after
brining. By the third or fourth week equilibration of NaCl was nearly total in the
whole of the cheese and the exudate. It follows from this that the concentration
gradient of NaCl in cheese can affect exudation only in the first few weeks after
brining, i.e. until such time the concentration gradient exists. As exudation
continues beyond this period it is evident that, in addition to NaCl concentration
gradient, exudation is influenced by other factors.
The time taken for attaining NaCl concentration equilibration was less than the
40 days stated by Georgakis ( 1973). This may be attributed to the size and shape
of the cheese block, diffusion coefficient and method of salting (dry salting on
surface/method of brine-storing). By influencing NaCl diffusion in cheese these
factors are expected to indirectly affect the exudation.
With an increase in storage time there was an increase in the uptake of N a Cl by
the inner layers of cheese from the outer layers. This was simultaneously
accompanied by loss of moisture from the inner layers of cheese. The loss of
moisture, however, does not appear to have been matched by an uptake of
moisture in the outer layers. In fact, none of the layers of cheese showed an
increase in the moisture content at any stage of storage (Fig. 11 .2) . This shows that
the protein gel in Feta cheese is not in a position to take up moisture, once it is
affected by high N a Cl concentration. The moisture displaced from the inner layers
of cheese as a consequence of NaCl diffusion is released as the exudate.
The inability of the protein gel to take up moisture may be explained as follows:
Cheese probably contains more moisture than the equilibrium amount but is slow
to lose this excess. High NaCl brings about a loss of the excess moisture which is
not taken up when the NaCl concentration falls. Equilibrium is a dynamic state
rather than one of very slow or no change. The test for equilibrium is to perturb
the system and see if it returns to its original state when the perturbation is
removed. If it does not return then it is not in equilibrium. In the present case the
perturbation is caused by high N a CL

259
Factors that are likely to be associated with the failure of the protein gel in cheese
to take up moisture are ongoing proteolysis, solubilisation of part of casein by N a Cl
(McDowall & Whelan, 1938), reduction in the water-holding capacity of proteins
due to interaction of paracasein with NaCl (Hardy & Steinberg, 1984), and
closeness of the pH of cheese to the iso-electric point of casein (Ruegg & Blanc,
1976). Another possible factor could be the effect of NaCl per se on the
water-binding ability of proteins, via its effect on electrostatic interactions (Kinsella
& Fox, 1987). Monovalent electrolytes at around 2 M decrease bound water
because at this concentration ions compete with protein groups for water, suppress
the electrical double layer surrounding the macromolecules, change protein
conformation and thereby diminish protein hydration. The average concentration
of NaCl in the moisture content of Feta cheese is around 1.5 M. This
concentration is even greater at the outer layers of cheese following brining. The
high N a Cl concentration could have reduced the water-binding ability of case ins.
The gradients of NaCl and moisture concentration within a block of cheese would
affect microbial activity and hydrolysis of casein. It is therefore reasonable to
expect a variation in proteolysis at different layers of cheese until NaCl
equilibration is achieved. The proteolysis pattern for whole Feta cheese showed
considerable proteolysis of et5ccasein after brining, rapid proteolysis by the end of
four weeks, and a rather slow and steady proteolysis thereafter (Chapter 6) . One
of the factors contributing to this typical proteolytic trend could be the gradient in
NaCl concentration in different layers of Feta cheese in the first few weeks.
11.4 Conclusion
The pH values of various layers of Feta cheese after brining are similar. Initially
there is less NaCl but more water in the interior of cheese. The NaCl and water
concentration gradients tend to even out rather quickly, i.e. in about two weeks
after brining of cheese. Exudation is expected to be influenced by this NaCl
concentration gradient (Chapter 10). Moisture released from the interior of the
cheese as a result of NaCl diffusion is not taken up by the outer layers even though
the concentration of NaCl decreases. This moisture along with the solubles are
released as exudate.

CHAPTER 12
OVERALL DISCUSSION
260
Exudation of whey from Cream cheese was affected by the method of manufacture
(Chapter 5). Cream cheese showed no signs of proteolysis during storage. In the
case of Feta cheese manufacturing variables, except for homogenisation, did not
have a pronounced effect on exudation (Chapter 6). Proteolysis in the ripening
Feta cheese was the predominant factor affecting exudation (Chapter 9) . Cream
cheese made by the hot-pack method, and Feta cheese made from recombined milk
by the traditional method, proved to be suitable examples for study of exudation
of unripened and ripened varieties, respectively.
An overview of the factors affecting exudation and their possible causes is
described below:
Protein to fat ratio in the cheesemilk: Variation of the protein to fat ratio in
cheesemilk had the desired effect on the composition of Cream and Feta cheeses.
The effect of protein to fat ratio on exudation varied depending on whether or not
the cheese was ripened. For Cream cheese an increase in the protein to fat ratio
resulted in a decrease in the amount of exudate. For Feta cheese the effect was
the opposite. This difference could be explained by the effect of proteolysis on the
water-holding ability of the protein matrix. In Cream cheese there is no proteolysis
and the water-holding ability of the protein gel is not greatly reduced during
storage. The effect of proteolysis on exudation from Feta cheese is described later
in this Chapter.
Effect of fat content: Within the selected limits of variation of P /F ratio, fat
content did not affect exudation from Cream cheese. However, an increase in the
fat content reduced the amount of exudate from Feta cheese of comparable
moisture in non-fat substance (MNFS). In Feta cheese fat appears to have
mechanically hindered the flow of exudate.

261
Effect of MNFS in cheese: The amount of exudate increased with an increase in
MNFS in both the types of cheese. This was in agreement with the proposed
hypothesis that, for a given set of conditions, the non-fat substance in cheese has
the ability to hold a certain maximum amount of moisture, and that a variation in
the moisture in the non-fat substance (MNFS) above this limit would result in a
proportional variation of the available moisture for exudation.
Homogenisation: Cream cheese made from cheesemilk homogenised at a higher
pressure showed a decrease in the amount of exudate (Chapter 5). This reduction
is attributed to the increase in the fat globule surface area and coating of the fat
globules with casein.
In Feta cheese homogenisation of cream was effective in decreasing syneresis of
whey during manufacture and subsequent exudation during storage (Chapter 8).
Further, a variation in the 'homogenisation pressure' had little · or no effect on
exudation (Chapter 6). This suggests that the effect of homogenisation on reducing
the amount of exudate is more due to change in the surface coat of the fat globules
than to the size reduction. The effect of homogenisation in reducing the size and
increasing the number of fat globules, on exudation, needs to be further examined.
The type of material adsorbed to the fat globule surface had a significant influence
on exudation from cheese and syneresis of whey during cheese manufacture
(Chapter 8). The mechanism by which the material adsorbed to the fat globule
affects the exudation and syneresis needs further study. While experimental
evidence is lacking, it is suggested that the material adsorbed to fat globule surface
may also affect the diffusion of NaCl in cheese during brining. Standardisation of
a method for quantitative measurement of protein adsorbed to the fat globule
surface would be useful.
Handling of Feta cheese (Chapter 6): Feta cheese subjected to thermal shocks
during storage showed an increase in the amount of exudate. However, turning and
piling of Feta cheese blocks did not have a significant effect on exudation. Vacuum
packaging of cheese reduced the extent of exudation considerably. It is suggested

262
that the moisture is held by the capillary forces in the protein network. Vacuum
packaging seals the ends of the capillaries and impedes exudation.
pH and mineral balance: Exudation is common in cheeses that have a pH close to
the iso-electric point of casein. This may be attributed to the micellar structure of
casein being affected by the low pH (Rose, 1968), and the minimal water sorption
of casein in the pH range from 4.0 to 5.0 (Ruegg & Blanc, 1976; Kinsella & Fox,
1987). As expected, the amount of exudate increased with the lowering of pH of
Cream cheese (Chapter 5) . In Feta cheese, a noticeable change in amount of
exudate was not detected over the normal pH range of 4.8 to 4.3 (Chapter 10).
Residual lactose, which causes a lowering of cheese pH during storage by
conversion to lactic acid, was therefore considered not to be significantly
contributing to exudation. The effect of variation of calcium content, usually
related to the pH changes, on the exudation of whey from Feta cheese was small
(Chapter 10). It is likely that the colloidal calcium phosphate is completely
solubilised at the low pH of � 4.6 (Pyne & McGann, 1960) and not associated with
the casein in cheese, and that the micellar casein structure is affected because of
the absence of colloidal calcium (Rose, 1968). Calcium therefore does not affect
the process of exudation.
Whey proteins: Partial heat-denaturation of whey protein through heat treatments
such as pasteurisation of cheesemilk, cooking of curd and heat-processing of curd
proved to be an effective means of controlling exudation in Cream cheese
(Chapter 5). This effect is attributed to complex formation between B-lactoglobulin
and K-casein that prevents fusion of casein micelles and consequently exudation,
a process similar to that occurring in yoghurt (Brooker, 1987). In Feta cheese,
incorporation of heat-denatured whey protein did not affect exudation and resulted
in a substantial increase of cheese yield (Chapter 7). Presence of heat-denatured
whey protein did not affect proteolysis. It is suggested that incorporation of heat
denatured whey proteins may prove effective in retarding the extent of exudation
in other cheeses, such as Cheshire, where exudation is less severe.
Heat-denaturation of whey protein in cheesemilk has the potential for reducing the
extent of exudation in cheese and needs to be investigated further.

263
NaCI in cheese: Salts, via their effects on electrostatic interactions, markedly affect
water-binding by protein. At low concentrations of NaCl (0. 1 - 0.15 M) the amount
of water bound to protein increases (Kinsella & Fox, 1987). However, at NaCl
concentrations of around 2 M and water activity in the range 0.75 - 0.95, the water
bound to protein decreases (Hardy & Steinsberg, 1984). At this concentration ions
compete with protein groups for water, suppress the electrical double layer
surrounding the macromolecule, change protein conformation and thereby diminish
protein hydration (Kinsella & Fox, 1987). The concentration of NaCl in the
moisture content of Feta cheese is about 1.5 M (� 9.0% S/M). This concentration
is even higher in the outer layers of a cheese block following brining. It is possible
that high NaCI concentration in Feta cheese may be an inherent cause of
exudation. This aspect needs to be investigated.
NaCl gradient in Feta cheese (Chapter 1 1) : Concentration gradients of NaCl and
moisture exist between the outer and inner layers of Feta cheese following brining.
These concentrations equilibrate over the next 2-3 weeks with NaCl from the
exterior diffusing inwards and moisture from the centre migrating outwards.
Although the concentration of NaCl decreases in the outer layers during this
equilibrium, the curd is unable to re-absorb the moisture diffusing from the centre.
This moisture is consequently lost from the surface as exudate. This suggests that
the level of moisture present in Feta cheese after brining is higher than what the
protein matrix can hold and that the concentration gradients of N a Cl and moisture
help in the release of the excess moisture.
Proteolysis (Chapter 9): A variation in proteolytic rate was brought about by
varying residual rennet levels in the Feta cheese. An increase in the rate of
exudation was concomitant with an increase in the rate of proteolysis. Residual
rennet in cheese can therefore influence exudation. The effect of proteolysis on
exudation is probably due to disintegration of the casein network in cheese and the
release of free moisture held in the capillaries.
Proteolysis appears to be one of the primary factors influencing exudation. The
option of controlling proteolysis in cheese to reduce the extent of exudation is

264
however limited by the need to have some proteolysis for desired flavour and
texture. Coagulants and starter microorganisms influence proteolysis and may
therefore be expected to influence exudation. This aspect needs further
examination.
Storage time and temperature (Chapters 5 & 6): The amount of exudate increased
with an increase in storage time and storage temperature for both the types of
cheese. The effect may be partly due to the thermodynamic effect of a decrease
in water sorption of milk proteins with increasing temperatures (Kinsella & Fox,
1987). Increase in the amount of exudate from Feta cheese with an increase in
storage time and storage temperature could be explained by the initial NaCl
concentration gradient and the ongoing proteolysis.
Exudation could not be correlated to the changes in water activity and the amount
of unfreezable water in Feta cheese during storage. The water activity depended
on the salt-in-water concentration in the cheese. Differential Scanning Calorimetry
studies showed that the amount of unfreezable water in Feta cheese was markedly
higher than in exudate. This difference was apparently due to a large proportion
of the water being bound to the casein gels in cheese.
The results of this investigation are consistent with the following hypothesis:
"The protein in cheese binds the moisture. Moisture is held in the
three-dimensional casein network of the cheese by physical entrapment, capillary
and electrostatic forces. The ability of the network to hold moisture is influenced
by amino acid composition, surface polarity or charge, conformation and
topography of the protein, pH, ion species and temperature (Kinsella & Fox, 1987).
Fat acts as a mechanical barrier to the flow of moisture within the protein matrix.
Presence of fat, which is surrounded by water loosely-bound to the casein matrix
(Kimber et al., 1974), disturbs the continuity of the casein network and creates
regions of weak structure. When the fat globule surface is coated by casein, as
happens with the newly-created fat globule surface during homogenisation, the
casein-coated fat globules behave as casein and form a part of the casein network.

265
The slow diff11sion of NaCl into the cheese during and after brining causes the
moisture held in the casein network to exude as the protein gel does not reabsorb
the moisture. Proteolysis leads to several changes in cheese. The casein network
is weakened and tends to disintegrate. The moisture held in the capillaries of the
casein network is released. Proteolysis products bind some of the moisture due to
the increase in the electrical charged terminal groups. Some of the protein
breakdown material becomes soluble and forms a part of the exudate. Excess
moisture containing the protein breakdown material and the other solubles is
released as exudate."
Conclusion: In Cream cheese partial heat-denaturation of whey protein can be used
to control exudation. In Feta cheese homogenisation of cream and vacuum
packaging of cheese are effective means of reducing the extent of exudation. Other
factors influencing exudation from Feta cheese are protein to fat ratio, material
adsorbed to fat globules, NaCl gradient, thermal shocks during storage and
proteolysis.


Appendix 4 . 1 STANDARD ANALYTICAL ( CHEMICAL) METHODS
( a ) Chemical methods for analysis o f milk, cream, whey and exudate
Particulars I Method
Fat ,
I Milko-Scan
protein , 13 3 B
lactose and total sol ids .
WPNI Amido-black
dye binding
Reference
A/S N . Foss Electric ( Denmark)
Sanderson
( 197 0 )
Principle of the method
The Milko-Scan 13 0 series is a semi-automatic , microprocessor controlled instrument for the determination of fat , protein and lactose in milk and other dairy products . Its basic operation is
similar to that of an infra-red spectrophotometer . It ' involves an infra-red beam which is focused to pass through the sample and strike a detector . The energy detected is then ampl i fied and , through
microprocessors , converted to a read-out . Measurement of the components is based on their
infra-red energy absorption at specific
wavelengths . The analytical results are expressed
as percentages of milk (wjv) .
Casein and denatured whey protein are precipitated
from the reconstituted milk powder using sodium chloride and filtered . The undenatured whey
protein in the filtrate is precipitated using
amido-black dye , and the excess dye determined
spectrophotometrically . N 0\ 0\

Total Gravimetric NZDDM 1 . 12 . a , sol ids IDF 2 1 . 1962 .
Fat Rose-Gottlieb NZDDM 1 . 4 . la , IDF lA : 1969
Total Kj eldahl NZDDM nitrogen l . ll . la , ( TN ) and IDF 2 0 . 1962 . protein
Calcium Complexometric Pearce method ( 19 77 ) ,
NZDDM 1 . 2 . la
NaCl Potentiometric IDF 8 8 : 1979 titration
pH
A weighed sample is dried in an oven for 5 h at 1o3 · c .
Fat is extracted from an ammoniacal solution of the sample with diethyl ether and petroleum ether , the solvents evaporated and the residue weighed .
A weighed sample is catalytically digested with sulphuric acid , converting the organic nitrogen into ammoniacal nitrogen . The ammonia is released by the addition of sodium hydroxide , distilled and absorbed in boric acid and then titrated . This provides the estimate for TN . The protein content was obtained by multiplying the TN by 6 . 3 8 .
A sodium hydroxide solution of the sample is titrated with a standard EDTA solution in the presence of Patton and Reed ' s indicator .
The sample is suspended in dilute nitric acid solution and titrated potentiometrically for chloride with standard silver nitrate solution using a measuring electrode system for determination of the end-point . A Mettler DL 4 0 RC Memo Titrator was used .
The pH was directly read using a pH meter ( PHM 8 0 Portable pH meter , Radiometer , Copenhagen) .
N 0\ -...l

Peptides
Fat globule size
High performance liquid chromatography (HPLC)
Spectreturbidimetric method
Swergold and Rubin ( 19 8 3 )
Walstra ( 19 65 , 19 68 )
HPLC separates peptides according to their molecular size ( optimum range 5 0 0-10 , 00 0 molecular weight) using a gel permeati on column ( by s ize exclusion chromatography) . The peptides can be quantitatively measured . The equipment used was a Shimadzu LC 6A HPLC with auto- inj ector . It contained TSK G20 0 0SW 6 0 cm with TSK Guard column . Elution solvent consisted of 3 6% Fat UV-grade acetonitrile , 0 . 1% Trifluoroacetic acid in Mill i-Q water . The flow rate was 0 . 5 mljmin . The absorbance was detected at 2 05 nm . 1-2 mg of sa�ple was weighed and dissolved in 10 ml elution solvent . Both solvent and sample were filtered through 0 . 4 5 �m pore size PTFE filters before use .
This is based on the l ight-scattering effect by milk fat globules . A small alkaline solution is used to dilute the milk/cream and the absorbance of the emulsion is measured in a spectrophotometer at several wavelengths ; and with other data such as concentration and refractive indices , a speci fic turbidity spectrum is calculated and plotted . This is compared with theoretical spectra that are computed for assumed globule-size distributions to determine the fat globule size . A computer programme ( Kevin N . Pearce , NZDRI , unpubl ished) was used for the calculations .
N 0\ 00

( b ) Chemical methods for analysi s o f curd and cheese
Particulars \ Method \ Reference
Moisture I ( i ) Gravimetric 1 NZDDM 4 . 4 . 3 . 0
Fat
Calcium
pH
( ii ) Microwave
( i ) Babcock
( ii ) SchmidtBonzynskiRatzlaff
Complexometric method
( i ) NZDDM 4 . 1 . 3a , APHA ( 197 8 ) ( ii ) NZDDM, 4 . 1 . 1a IDF-:-5A ( 19 6 9 )
Pearce ( 19 7 7 ) NZDDM 4 . 4 . 8 . 1
NZDDM 4 . 5 . 1a
Principle of the method
Drying in oven at 1os · c for 1 6 hours .
A microwave moisture analyser ( Photo Volt Corporation , New York , model Apollo mark-12 ) was used .
( i ) Use of sulphuric acid breaks down any membranous material , solubil ises the cheese and enqbles the l iberated fat to rise to the surface . ( ii ) Fat is extracted from a hydrochloric acid digest of the sample with diethyl ether and petroleum ether , the solvents evaporated , and the residue weighed .
Grated cheese is dissolved in weak HCl and diluted, with water . NaOH is added and titrated against EDTA. Calcium ion is determined by complexometric titration using Patton and Reed ' s indicator .
The pH of curd or grated cheese was directly read using the EMF between a glass electrode and a reference electrode in a pH meter ( PHM 8 2 standard pH meter , Radiometer , Copenhagen) .
N 0\ \0

Total
nitrogen
and protein
casein
proteins
Casein
proteins
and Whey
proteins
Semi-micro
Kj eldahl
Urea
polyacrylamide
gel
electrophoresis
(Urea-PAGE )
Sodium dodecyl
sulphate-
polyacrylamide
gel
electrophoresis
( SOS-PAGE)
NZOOM
1 . 11 . 19 ,
IOF 2 0 : 1 9 62
Creamer
( 19 9 1 )
IOF : 1991
( In press)
Creamer
( 19 9 1 )
IOF : 1 991
( In press )
The princ iple is similar as that described for
milk. 1 . 0- 1 . 5 g sample was used for analysis .
The protein content was obtained by multiplying
the TN by a factor 6 . 3 8 .
Casein proteins are separated e lectrophoretically
on the basis of molecular size and net electric
charge in a polyacrylamide mini-gel in the
presence of high concentration of urea . A Biorad
mini Protean II apparatus was used for running the
gels . Concentration of the stained protein bands
was measured using a densitometer .
The ability of sodium dodecyl sulphate (SOS } , an
amphiphillic detergent , in forming SOS -protein
complex involving the monomer protein is used to
electrophoretically separate the caseins and maj or
whey proteins , mainly on the basis of mol ecular
size , in a polyacrylamide mini-gel . A Biorad mini
Protean II apparatus was used for running the
gels . Concentration of the stained protein bands
was measured using a densitometer .
� 0

NaCl
Water activity
Res idual rennet ( in
cheese and whey)
Glucose
Potentiometric
titration
Novasina water activity meter
Enzymatic method
Enzymatic colorimetric method
( Peridochrome
glucose)
IDF 8 8 : 1979
Novasina A-G , Zurich ,
Switzerland
S ingh and
Creamer
( 19 9 0 )
Trinder
( 19 6 9 }
The principle i s similar a s described for milk . About 0 . 5 g of Feta cheese or 1 . 5 -2 . 0 g Cream
cheese sample was taken for analysis .
The humidity sensor measures the relative humidity based on conductivity changes in a hygroscopic electrolyte . The instrument is composed of a
measuring station (type EEJA - 3/BAG) and a temperature controlled chamber ( type : AW - Box) .
The method is based on the time-dependent decrease in ' coagulation time of a milk coagulation system
caused by a low level of an additional enzyme
added to the system . Apparatus for measuring milk clotting times consisted of glass bottles rotated
by an electric motor connected to a shaft rotating
at 7 rpm at an angle of 3 0 " to the horizontal .
Glucose is oxidised by glucose-oxidase to form
D-glucono-o-lactone and hydrogen peroxide . The hydrogen peroxide reacts with a chromophore
( 4-aminophenazone + phenol ) in the presence of
peroxide to form a red dye . The intensity of the
colour developed , measured at 5 1 0 nm , is
proportional to the glucose content .
� t-4

Lactose
L (+ )
Lactate
D ( - )
Lactate
Enzymatic
colorimetric
Enzymatic
colorimetric
Enzymatic
colorimetric
Trinder
( 19 69 )
Gutmann & Wahlefeld
( 19 7 4 )
Gawehn & Bergmeyer
( 1974 )
p-galactosidase and MgC12 are used to hydrolyse
lactose to glucose and galactose . Glucose content
is then estimated using the normal assay . Free
glucose already present in the sample is accounted
by estimating glucose in the absence of
p-galactosidase .
L (+ ) -LDH catalyses the reaction of L (+ ) -lactate
and NAD+ to form NADH and pyruvate . This is not a
favourable reaction thermodynamically , hence the
re�ction must be carried out at high pH and in the
presence of hydraz ine . Hydraz ine reacts
chemically with pyruvate , prevents pyruvate from
taking part in the reaction and thus allows all
the L (+ ) -lactate to be measured . NADH is measured
by the increase in absorbance at 3 4 0 nm .
The principle is the same as for L (+ ) -Lactate
except the use of D ( - ) LDH instead of L (+ ) LDH .
( LDH stands for Lactate dehydrogenase) .
id

C itrate
Acetate
Enzymatic calorimetric
Enzymatic calorimetric
Dagley ( 197 4 )
Bergmeyer & Mollering ( 197 4 )
citrate is hydrolysed in the presence of citrate lyase to Oxaloacetate ( OA) and acetate . Some of the oxaloacetate formed is decarboxylated by OA-decarboxylase to pyruvate . The pyruvate and oxaloacetate react with NADH in the presence of Lactate dehydrogenase and malate dehydrogenase respectively to form lactate , malate and NAD+ . The decrease of the NADH concentration , as measured by the change in absorbance at 3 4 0 nm is proportional and stoichiometric to the concentration of citrate .
Acetate is phosphorylated by Adenosine Triphosphate in the presence of acetate kinase to form acetyl-phosphate . Acetyl-phosphate reacts with coenzyme-A ( CoA) in the presence of phosphotransacetylase to form Acetyl-CoA . Acetyl-CoA reacts with oxaloacetate in the presence of citrate synthase to form citrate and CoA. The required oxaloacetate is obtained by the conversion of added malate in the presence of malate dehydrogenase and NAD+ . This reduction of NAD+ to NADH , which is a quantitative measure of oxaloacetate formed , is thus indirectly related to acetate though not l inearly proportional . The change in NADH is measured by the change in absorbance at 3 4 0 nm .
�

274
Appendix 4.2 Equations used to express the exudation of whey from Feta cheese
(a) Exudate in g/kg cheese = (Initial weight of cheese in g - final weight of
cheese in g) 1000 I initial weight of cheese in g
(b) Exudate in g/kg moisture in cheese ==
(Initial weight of cheese in g - final weight of cheese in g) 1000 X 100 I
(initial weight of cheese in g X % initial moisture in cheese)
(c) Final MNFS in cheese. % =
[(Initial weight of cheese in g X % initial moisture I lOO) - { (initial weight
of cheese in g - final weight of cheese in g) % moisture in exudate I 100}]
100 I {final weight of cheese in g - (% initial fat in cheese X initial weight
of cheese in g I 100)}
(d) % reduction in MNFS = (Initial % MNFS in cheese - final % MNFS in
cheese) 100 I initial % MNFS in cheese
Some of the values in the above equations have been calculated as follows:
Initial moisture in cheese = [{Weight of cheese (without exudate) at four weeks in g X moisture % in
cheese at four weeks I 100} + { (weight of exudate from cheese at four
weeks in g) X (100 - % total solids in exudate) I 100}] 100 I {initial weight
of cheese in g}.
Initial fat % in cheese = (Weight of cheese at four weeks in g X fat % in
cheese at four weeks) I Initial weight of cheese in g
Initial MNFS % in cheese = (Initial moisture % in cheese X 100) I
( 100 - initial fat % in cheese)
Note: In the above equations initial refers to the state of cheese before exudation
i.e. the cheese immediately after brining. Likewise, final refers to the cheese after
exudation and therefore applies to cheese after the respective storage interval.

275
Appendix 4 . 3 QUESTIONNAIRE USED TO EVALUATE FETA CHEESE
Name : EVALUATION OF FETA CHEESE Date :
Please evaluate the Feta cheese samples for the following attributes in l ine with the scale given below . Desirable Feta cheese is expected to have scores close to 3 for acidity , saltiness and mouthfeel ; and close to 1 for oxidised , b itterness , structure and overall acceptabi l ity .
Flavour : Acidity Saltiness Oxidised Bitterness
Texture Mouthfeel Structure
Low Low None None
1 2 3 4 1 2 3 4 1 2 3 4 1 2 3 4
Too smooth 1 2 3 4 S l iceable 1 2 3 4
5 High 5 High 5 High 5 High
5 Crumbly 5 Brittle
Overal l acceptability : Very good 1 2 3 4 5 Unacceptable
Sample No . Attributes ----- -----
Acidity
Saltiness Flavour
Bitterness
Oxidised
Mouthfeel Texture - - - - - - - - - - - - - -
Structure
Overal l acceptabi l ity
Comments :
1 2 -----r-----
4 5 ----- -----
Note : The attribute ' overall acceptabil ity ' for the cheese was normal ly not expected to be given a score of 1 . A good qual ity o f cheese would have an overal l acceptabi l ity score o f 2 , while an average and acceptable qual ity of cheese was expected to score 3 out of 5 ( not quoted in the questionnaire ) .

276
App endix 4 . 4 QUESTIONNAIRE USED TO EVALUATE CREAM CHEESE
Name : EVALUATION OF CREAM CHEESE Date :
Please evaluate the Cream cheese samples for the following
attributes in l ine with the scale given below .
Flavour Pleasant 1 2 3 4 5 Unpleasant
Body Too softjweak 1 2 3 4 5 over- firm/hard
Texture Too smooth 1 2 3 4 5 Lacks smoothness
Overal l
acceptability : Very good 1 2 3 4 5 Unacceptable
Attributes Samples 11
1 2 3 4 5 6 7 8
Flavour
Body
Texture
overal l
acceptabi l ity
comment s :
Not e : I f the flavour , body or texture i s found
undesirable , the defect may be speci f ied . Some of
the common defects are l isted below .
Flavour defects : flat , sour , yeasty , rancid , salty etc .
Body and texture defects : grainy , gritty , lumpy , sandy ,
sticky , coarse etc .

277
Appendix 5.1
(a) Brief description of equipment and accessories used during manufacture of
Cream cheese
1. Cream Separator: APV make, model MSD 50-01-076, 3,000 L/h capacity
self-desludging separator.
2. Rectangular vats: 100 L jacketed stainless steel vats with variable speed
mechanical agitators.
3. Homogeniser: APV Manton Goulin make, Model K 3 with a pumping capacity
of 500 L/h.
4. Plate heat exchanger (PHE): Alfa-laval make, Model No A 3 HRB, with
heating, holding and cooling sections. It is designed for a flow capacity of 500 L/h
and a corresponding residence time of 15 s in the holding section.
5. Positive pump: Waukesha D25, positive lobe pump with a variable speed drive
and a flow capacity of 2,000 L/h. This was used to supply hot water to the PHE.
6. Cheese vat (NZDRI designed, drawing No 6164): A 100 L capacity jacketed
stainless steel circular vat with provisions for indirect heating by steam or by a
1 KW electric element. The jacket is connected to a Dan Foss thermostat to
automatically regulate the electric heater to the set temperature during incubation
of milk and has an in-built provision to record the temperature of the contents
inside the vat. The vat is also connected with a steam inlet at the bottom to heat
the water in the jacketed portion for indirect heating of the vat contents. The lid
on top of the vat has openings, one to inoculate starter and another to act as an air
vent. These openings were plugged with non-adsorbent cotton wool during the
operation. The inner chamber of the vat used for incubation of milk is also
connected with a drain outlet at the bottom end to remove the contents.

278
7. Sieves: Kadova sieves, 10 kg capacity inner plastic liners for Gouda cheese
hoops.
8. Dry blender: Crypto Peerless blender, Model EB 20B with a variable 3-speed
agitator.
9. Processing kettle (NZDRI designed): A 4.0 kg capacity processing kettle
jacketed for indirect heating was used. Some of the attached accessories include
a variable speed agitator, an inlet for steam, an outlet valve for steam, pressure
gauge to measure steam pressure, and a temperature recorder for measuring the
temperature of the contents in the kettle.
10. Cups for packing: Supplied by Plastic Wholesalers (Waikato ) , Te Rapa,
Hamilton, New Zealand (Code No 420 for pots and 421 for lids). These are honey
pots, 125 ml capacity, natural polyethylene pots with white caps.
(b) Procedure for homogenising and pasteurising standardised milk: The
homogeniser and plate heat exchanger (with heating, holding and cooling sections)
were set up in-line to facilitate the continuous and enclosed operations of
homogenisation followed by high-temperature-short-time pasteurisation. Milk was
indirectly heated in the plate heat exchanger by passing hot water at 93 - 95 o C from a 400 L vat through a speed-adjustable positive pump. Likewise, milk was
indirectly cooled (after holding) by passing tap water through the plates ( 16-18 o C).
The temperature of milk in the plate heat exchanger in the heating and cooling
sections was controlled by regulating the flow of hot or cold water in the respective
sections. The flow of milk through the plate heat exchanger was regulated by the
homogeniser pump. In-place-cleaning was done before and after the
'homogenisation & pasteurisation' operation by the usual cleaning regime. To
ensure the destruction of bacteriophage and to provide a near-sterile environment
the unit was sanitized by chlorine (100 ppm) and then circulated with hot water at
75 - 80 ° C for half-an-hour before milk processing began. The holding vat for milk,
cheese vat, cans and other containers used during the process were chlorine washed
and steamed.

279
Appendix 5.2 Manufacturing process for Cream cheese
Bulk whole milk was supplied by Tui Milk Products Limited. The raw milk was
clarified and separated in a cream separator at 55 o C. Cream was then pasteurised
by high-temperature-short-time pasteurisation. Skim milk was cooled and stored
at 4 ° C until used. About 100 kg of standardized milk of desired protein to fat
ratio was prepared by adding a calculated amount of pasteurised cream to skim
milk.
The standardized milk was pumped into a double-jacketed, rectangular stainless
steel vat, continuously stirred by a mechanical agitator and heated to 60-65 ° C. The
milk was then homogenized, pasteurised, cooled to about 22 ° C and collected in a
sanitized cheese vat. The first 20 - 30 L of milk was discarded to ensure that
pasteurising conditions were uniform. Usually about 70 L of milk were pumped
into the cheese vat and held for about an hour to ensure that the temperature was
stable and uniform. The temperature of milk in the cheese vat was thermostatically
controlled at 22 ° C.
Starter was inoculated into the milk in the cheese vat at the rate of 0 .1 - 0.2%
(NZDRI strain, Lactococcus lactis subsp. cremoris strains) and incubated for 15-16 h
until the desired pH was attained. The curd was then cooked to the desired
temperature. The temperature of the continuously stirred curd was raised at the
rate of 1 ° C per min by indirect steam-heating in the jacket. Once the desired
lower cooking temperature ( 60 ° C) was attained, approximately half of the curd was
immediately removed and filtered through sieves placed on top of buckets. The
remaining curd in the cheese vat was heated to the higher cooking temperature
(75 ° C) and filtered. Although both lots of curd were processed separately from
this point onwards, the procedure was identical.
During initial stages of draining the curd in the sieve was turned 5-6 times at hourly
intervals to facilitate better drainage. After that it was left to drain overnight.
After draining, the curd was blended in a dry blender for one minute at the lowest

280
speed, then sampled and tested for moisture, pH and fat. The moisture of curd
and whey were determined in a microwave moisture analyser.
To produce 4 kg of the final product calculated amounts of curd, whey (or water),
cheese salt ( 1% in the final product) and potassium sorbate (0.02% in the final
product) were weighed into the processing kettle. The kettle was closed and the
contents mixed by gradually increasing the speed of the agitator to 100 rpm. The
cold-mixing was continued up to 1 min from the start of the operation. The
contents were then indirectly heated with steam at a pressure of 20 psi to a
temperature of 80 ° C. The steam supply was stopped when the temperature
reached 75 ° C as the heat retained in the jacket was usually enough to take the
product up to 80 o C. The total heating time was typically 3 min. The contents
were further held with continuous stirring until a total of 10 minutes had elapsed
from the start of heating. During the final minute of stirring the speed of the
agitator was reduced. After 10 min of stirring the agitator was turned off, the lid
opened and the contents poured quickly into polyethylene cups. The cups were
sealed, and turned upside-down so that the contents rested on the lid. These
containers were then stored in the upside-down position at the specified storage
temperatures. Samples were then drawn at appropriate intervals for analysis,
grading and storage studies.
As air pockets in the Cream cheese tended to become filled with exudate during
storage care was required when filling the cups to ensure that no air was entrapped
within the body of Cream cheese.

281
Appendix 5.3
Calculations for the amount of water to be added to or removed from curd durin�:
processin2 for adjustment of moisture in Cream cheese
Total quantity of mix used in the kettle
Required moisture in Cream cheese (for calculations only)
Total quantity of moisture required in the processing mix
Quantity of salt to be added ( 1% in cheese) in mix
Quantity of potassium sorbate to be added (0.02% in cheese)
Total quantity of curd and water = 4.0 - (0.040 + 0.0008)
Let the amount of curd used in the mix = C kg
Moisture in the curd = M %
(i) Amount of water required to be added
Let the amount of water required to be added to the mix = W kg
C + W = 3.9592 Equation (i)
(C X M/100) + W = 2.2 Equation (ii)
= 4.0 kg
= 55.0%
= 2.2 kg
= 0.04 kg
= 0.0008 kg
= 3 .9592 kg
M was determined by analysis. Using the two above equations the quantity of curd
(C) and the quantity of water (W) to be added were calculated.
(ii) Amount of water to be removed from curd
Let the amount of water to be removed from curd = w kg
C - w = 3.9592 Equation (iii)
(C X M/100) - w = 2.2 Equation (iv)
M was determined by analysis. Using the two above equations the quantity of curd
(C) and the quantity of water (w) to be removed were calculated.
Note : The amount of moisture that evaporated during processing in the open
kettle was about 150 g in 5 min. This amount did not vary much with variation in
batch size. When there was a need for excess amount of moisture to be removed,
a proportionately reduced amount of mix was taken for processing. However, it
was not easy to have an accurate control over this process. This increased the
source of experimental error.

282
Appendix 5 . 4 Compos ition of standardised milks used for cheese manufacture with respect to the selected manufacturing variables
Source & l evels of variation
A
High Low
B High Low
c High Low
D High Low
E (High &
S . D .
Low )
Fat ( % )
LSM F
3 3 3 * * *
9 . 3 6 1 1 . 5 1
1 . 0 4 1 0 . 3 7 1 0 . 4 9
11 . 0 1* 1 0 . 2 4 1 0 . 6 3
4 . 3 4 1 0 . 3 1 1 0 . 55
1 0 . 4 3
0 . 2 3 5
Protein ( % )
LSM F
4 5 . 7 **
2 . 8 3 2 . 5 1
0 . 64 2 . 69 2 . 65
8 . 57 * 2 . 6 0 2 . 7 4
0 . 07 2 . 6 6 2 . 6 8
2 . 67
0 . 0 9 4
T S ( % )
LSM F
6 5 . 8 * * *
17 . 3 2 19 . 0 8
0 . 14 18 . 2 4 18 . 16
5 . 7 4 17 . 9 4 18 . 4 6
4 . 0 2 17 . 9 8 18 . 4 1
18 . 2
0 . 4 3 4
A = PjF ratio ; B = Homogenisation pressure ; C= Pasteurisation temperature ; D = curd pH at cooking ; E = Cooking temperature ;
LSM = Least-square mean ; F = F ratio ; S . D . = Standard deviation of raw data ;
* p < 0 . 0 5 ; ** p < 0 . 0 1 ; * * * p < 0 . 0 0 1 ; F values without asterisks denote ' not s igni ficant ' .

283
Appendix 5.5
(a) Statistical technique used for the test of significance of the manufacturing
variables
Analysis of variance (ANOV A) was performed on the exudation data (g/kg cheese
moisture) using the statistical package SAS ( 1985). The distribution of data on
exudation was not normal, as only 30.5% of the total number of experimental
cheeses had exudation during storage. Among the cheeses that had exudation, the
variation in the quantity was very large, e.g. some had as much as 200 g/kg cheese
moisture. A study of the residuals indicated that the data contravened the
assumptions of the general linear model in that the residuals were non-normally
distributed. Attempts to induce normality in the residuals, and thereby in the
response variables (i.e . amount of exudate), were made using a variety of
transformation techniques (viz. arcsin, square root, and natural logarithm). None
of these resulted in a residual distribution that satisfied the assumptions of
ANOV A. Further attempts to induce normality involved transforming the response
variables, i.e. expressing the exudation data in other forms. However, these
procedures also failed because the distribution of the transformed data was always
skewed. Because of the above limitations in the construction of an ANOVA
model, Chi-squared analysis was used to test the significance of variation.
ANOV A was used to obtain least square mean values (LSM). The data estimated
by missing value technique appeared unrealistic. The LSM values were therefore
calculated from the actual data.
Chi-square tests were performed by partitioning the data on the amount of exudate
(g/kg cheese moisture) into the following sub-groups: 'none', 'slight/moderate
(range 1-20 g/kg)', and 'excess' ( > 20 g/kg). The sub-groups were chosen such
that they satisfied the assumption for the Chi-squared test which states that the
expected counts should be always greater than 5. Majority of the cheeses which did
not have exudation were classified into one group (i. e. none). Of the samples that
had exudation, most of them exuded in moderate quantities which were grouped

284
as 'slight/moderate'. The cut-off point at 20 g/kg was chosen arbitrarily to
represent slight or moderate exudation. The cheeses that had extensive exudation
were categorised under 'excess'.
(b) Example showing application of Chi-squared test of significance
The data in this instance refers to exudation of whey at storage temperature of 5 • C
(Chapter 4, Section One) for the two levels of P /F ratio. The observed data on
exudation (g/kg cheese moisture) is grouped into three categories as 'none',
'slight/moderate' (range 1 - 20) and 'excess'( > 21) and tabulated as below.
Level s of P/F ratio
Low High
Total
Number of incidences of exudation
Nil
6 8 ( 7 5 ) 8 2 ( 7 5 )
1 5 0
S l ight/Moderate Excess
2 2 ( 14 ) 6 ( 14 )
2 8
6 ( 7 ) 8 ( 7 )
14
Tota l
9 6 9 6
19 2
Note: The values outside parentheses denote the actual number of incidences of
the event and the values inside the parentheses denote the expected number of
incidences of the event.
Null hypothesis: The values in the rows are independent of the values in the
columns. Here it implies that the incidences of exudation is independent of the
P/F ratio.
Assumption: The above hypothesis is based on the assumption that the expected
counts should be always greater than 5.
Calculation of Chi square (X2)
xz = [(68 - 75? 1 75] + [(22 - 14? 1 14] + . . . . . . . . . . . . . . = 10.735
Degrees of freedom = (No of rows - 1) X (no of columns -1) = (3-1) (2-1) = 2
Observation: Calculated value of X2 is greater than that the tabulated value of 9 .21
(at 1% level of significance with 2 degrees of freedom).
Conclusion: The hypothesis of P /F ratio being independent of the incidences of
exudation is rejected at 1% level (* *) of significance .
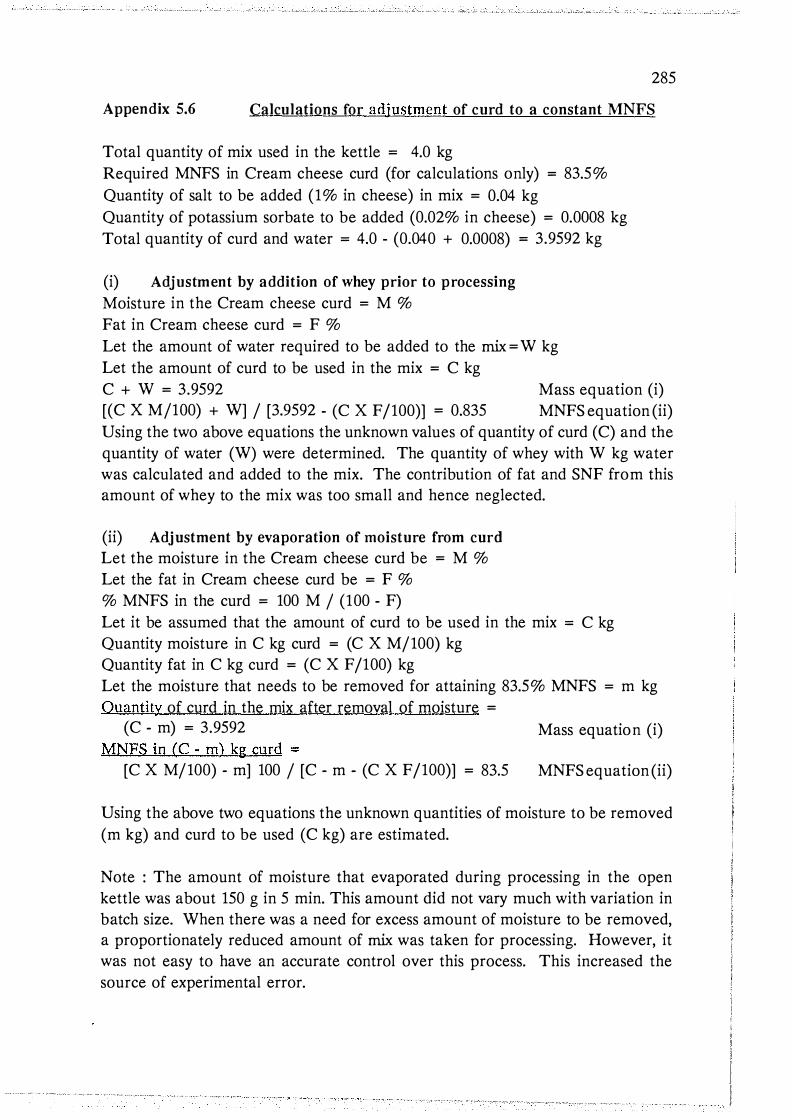
285
Appendix 5.6 Calculations for adjustment of curd to a constant MNFS
Total quantity of mix used in the kettle = 4.0 kg Required MNFS in Cream cheese curd (for calculations only) = 83.5% Quantity of salt to be added (1% in cheese) in mix = 0.04 kg Quantity of potassium sorbate to be added (0.02% in cheese) = 0.0008 kg Total quantity of curd and water = 4.0 - (0.040 + 0.0008) = 3.9592 kg
(i) Adjustment by addition of whey prior to processing
Moisture in the Cream cheese curd = M % Fat in Cream cheese curd = F % Let the amount of water required to be added to the mix = W kg Let the amount of curd to be used in the mix = C kg C + W = 3.9592 Mass equation (i) [(C X Ml100) + W] I [3.9592 - (C X F 1100)] = 0.835 MNFS equation (ii) Using the two above equations the unknown values of quantity of curd (C) and the quantity of water (W) were determined. The quantity of whey with W kg water was calculated and added to the mix. The contribution of fat and SNF from this amount of whey to the mix was too small and hence neglected.
(ii) Adjustment by evaporation of moisture from curd
Let the moisture in the Cream cheese curd be = M % Let the fat in Cream cheese curd be = F % % MNFS in the curd = 100 M I (100 - F) Let it be assumed that the amount of curd to be used in the mix = C kg Quantity moisture in C kg curd = (C X Ml100) kg Quantity fat in C kg curd = (C X F 1100) kg Let the moisture that needs to be removed for attaining 83.5% MNFS = m kg Quantity of curd in the mix after removal of moisture =
(C - m) = 3.9592 Mass equation (i) MNFS in (C - m) kg <;nrd =
[C X Ml100) - m] 100 I [C - m - (C X F 1100)] = 83.5 MNFS equation (ii)
Using the above two equations the unknown quantities of moisture to be removed (m kg) and curd to be used (C kg) are estimated.
Note : The amount of moisture that evaporated during processing in the open kettle was about 150 g in 5 min. This amount did not vary much with variation in batch size. When there was a need for excess amount of moisture to be removed, a proportionately reduced amount of mix was taken for processing. However, it was not easy to have an accurate control over this process. This increased the source of experimental error.

Appendix 5 . 7 Composition of standardised milk with respect to the manufacturing variables
Source of
Fat ( % )
variation LSM
A High Low
B High Low
c High Low
D High Low
E High Low
10 . 28 12 . 8 9
11 . 5 1 11 . 66
11 . 84 11 . 3 3
11 . 68 11 . 49
11 . 58 11 . 58
F
57 . 8 8 * *
0 . 2 1
2 . 2 6
0 . 2 9
0 . 00
Protein ( % )
LSM
3 . 09 2 . 8 9
2 . 9 6 3 . 0 3
3 . 0 3 2 . 9 6
2 . 9 9 3 . 0 1
2 . 9 9 2 . 9 9
F
9 . 3 1
1 . 2 0
1 . 03
0 . 09
0 . 00
Lactose ( % )
LSM F
14 . 95* 4 . 66 4 . 3 8
4 . 4 9 4 . 5 5
4 . 4 9 4 . 55
4 . 4 8 4 . 56
4 . 52 4 . 52
0 . 62
0 . 7 3
0 . 99
o . oo
TS ( % )
LSM
18 . 4 3 2 0 . 54
19 . 3 4 19 . 6 3
19 . 7 8 19 . 2 0
19 . 5 2 19 . 4 6
19 . 4 9 19 . 4 9
F
2 3 . 9 8 *
0 . 4 6
1 . 7 9
0 . 02
0 . 00
ca2+ (mM/g)
LSM F
2 8 . 2 2 9 . 1
2 8 . 4 2 8 . 9
2 8 . 1 2 9 . 3
2 8 . 3 2 9 . 0
2 8 . 7 2 8 . 7
0 . 3 2
0 . 1 1
0 . 64
0 . 19
0 . 00
A = P/ F ratio ; B = Homogenisation pressure ; C = Pasteurisation temperature ; D = Curd pH at cooking ; E = Cooking temperature ;
LSM = Least-square mean ; F = F ratio ;
* p < 0 . 05 ; ** p < 0 . 0 1 ; F values without asterisks denote ' not significant ' . N 00 0\

Appendix s . a Effect of manufacturing variables on the compos ition of whey and fines lost in whey
Source Fat ( % ) of -----------variation LSM F
A High Low
B High Low
c High Low
D High Low
E High Low
0 . 52 0 . 4 3
0 . 3 8 0 . 57
0 . 4 6 0 . 4 9
0 . 4 8 0 . 4 7
0 . 4 9 0 . 4 5
2 . 3 7
10 . 00
0 . 2 9
0 . 06
1 . 56
Protein ( % ) Lactose ( % )
LSM F LSM F
4 . 00 3 . 54 0 . 84 4 . 2 2 0 . 8 0 4 . 06
15 . 50* 1 . 2 7 0 . 79 4 . 09 0 . 86 4 . 19
14 . 50 * 0 . 0 3 0 . 79 4 . 14 0 . 8 6 4 . 13
10 . 00 2 . 09 0 . 8 5 4 . 19 0 . 79 4 . 07
2 5 5 . 6*** 12 . 7 1* 0 . 77 4 . 15 0 . 87 4 . 12
TS ( % )
LSM F
5 . 99 5 . 69
5 . 66 6 . 03
5 . 8 0 5 . 89
5 . 9 5 5 . 7 4
5 . 8 3 5 . 8 6
5 . 4 7
8 . 3 6
0 . 4 7
2 . 66
0 . 3 6
ca2+ (mM/kg)
LSM F
3 4 . 5 3 3 . 4
3 4 . 9 3 2 . 9
3 5 . 9 3 1 . 9
3 1 . 5 3 6 . 3
3 4 . 1 3 3 . 8
0 . 7 4
2 . 4 3
9 . 7 9
13 . 9 1
0 . 07
Fines l ost ( % )
LSM F
3 . 2 4 5 . 53
4 . 8 9 3 . 8 7
4 . 6 5 4 . 11
4 . 60 4 . 1 6
4 . 9 4
0 . 97
0 . 2 7
0 . 18
3 1 . 9 1* 5 . 7 8 2 . 9 8
A = P/F ratio ; B = Homogenisation pressure ; C = Pasteurisation temperature ; D = Curd pH at cooking ; E = Cooking temperature ;
LSM = Least-square mean ; F = F ratio ;
* p < 0 . 05 ; *** p < 0 . 001 ; F values without asterisks denote ' not significant ' .
N 00 -.l

Appendix 5 . 9 Effect of manufacturing variables on the composition of curd
Source of
Moisture ( % )
variation LSM
A High Low
B High Low
c High Low
D High Low
E High Low
53 . 67 55 . 4 1
57 . 2 3 51 . 8 6
56 . 03 53 . 06
52 . 3 9 5 6 . 69
54 . 56 54 . 53
F
15 . 0 0 *
14 2 . 77**
4 3 . 7 4 * *
9 1 . 9 1**
0 . 00
Fat ( % )
LSM
3 3 . 94 3 3 . 7 7
3 1 . 3 6 3 6 . 3 4
3 2 . 58 3 5 . 13
3 5 . 7 8 3 1 . 92
3 3 . 9 5 3 3 . 7 5
F
0 . 16
13 5 . 8 9 **
3 5 . 4 7 **
8 1 . 47* *
0 . 08
MNFS ( % )
LSM
8 1 . 16 8 3 . 59
8 3 . 3 1 8 1 . 4 4
8 3 . 06 8 1 . 69
8 1 . 53 8 3 . 2 3
8 2 . 54 8 2 . 2 1
F
13 . 2 4 *
7 . 8 3
4 . 16
6 . 4 7
2 . 0 3
FDM ( % )
LSM
7 3 . 19 7 5 . 56
7 3 . 2 6 7 5 . 4 9
7 3 . 9 7 7 4 . 77
7 5 . 13 7 3 . 62
7 4 . 6 3 7 4 . 11
F
8 . 4 3
7 . 4 6
0 . 9 6
3 . 4 1
2 . 3 1
A = P/F ratio ; B = Homogenisation pressure ; C = Pasteurisation temperature ; D = Curd pH at cooking ; E = Cooking temperature ;
LSM = Least-square mean ; F = F ratio ;
* p < 0 . 05 ; ** p < 0 . 01 ; *** p < 0 . 001 ; F values without asterisks denote ' not signi ficant • . N 00 00

Appendix 5 . 10 Effect of manufacturing variables on the mean scores of sensory parameters of cheeses
Source of
Flavour Body . Texture Overal l acceptabil ity
variation LSM F LSM F LSM F LSM
A 4 . 9 6 2 . 4 9 1 . 3 2 High 2 . 7 6 2 . 6 1 2 . 7 3 2 . 7 4 Low 3 . 07 2 . 2 5 2 . 3 4 2 . 8 3
B 7 . 07 3 . 19 3 . 2 3 High 2 . 7 3 2 . 64 2 . 8 4 2 . 67 Low 3 . 10 2 . 2 3 2 . 2 3 2 . 9 0
c 4 . 8 8 2 . 4 9 0 . 3 1 High 2 . 7 6 2 . 6 1 2 . 63 2 . 5 3 Low 3 . 07 2 . 2 5 2 . 44 3 . 04
D 3 . 4 1 0 . 16 1 . 4 6 High 2 . 7 8 2 . 4 8 2 . 3 3 2 . 6 8 Low 3 . 04 2 . 3 9 2 . 74 2 . 8 9
E 7 . 52 17 . 09* 0 . 17 High 2 . 7 6 2 . 7 3 2 . 57 2 . 57 Low 3 . 06 2 . 13 2 . 4 9 3 . 00
A = P/F ratio ; B = Homogenisation pressure ; C = Pasteurisation temperature ; D = Curd pH at cooking ; E = Cooking temperature ;
LSM = Least square mean ; F = F ratio ;
* p < 0 . 05 ; F values without asterisks denote ' not significant ' .
F
0 . 3 4
2 . 3 4
11 . 9 3 *
2 . 04
4 . 6 6
N 00 \0

Appendix 6.1
290
Equipment and accessories used for manufacture of Feta
cheese
1. Reconstitution unit: This included a funnel for introducing milk powder, a
powder liquid reconstitution pump (Alfa CM open impeller, centrifugal pump) and
a rectangular holding vat.
2. Homogeniser: Manton Goulin homogeniser, APV Ltd., UK, Model K 3 with
a puppet valve and a pump capacity of 500 L/h.
3. Cheese Vats: 100 L jacketed stainless steel vats with variable speed agitators.
4. Hoops: Rectangular stainless steel 'Perfora' hoops with perforations.
5. Heat sealer: Gray Pak make, standard Model 220/240 - 1, with provision for
controlled vacuum packaging.
6. Plastic pouches: Wrightvac Pouches Code No C-40, supplied by Courtaulds
Packaging, Fielding, New Zealand. These are high barrier, heat sealable,
non-shrink pouches.

291
Appendix 6.2 Manufacturing process for Feta cheese
Reconstituted Skim Milk (RSM) was prepared by mixing low heat skim milk
powder (LHSMP) and tap water at 40 ° C in the ratio of 1 :8.5 in the reconstitution
unit. The RSM was circulated for 10 min to ensure proper reconstitution.
Cream of about 25% fat was prepared by heating a mixture of fresh frozen milkfat
for recombining (FFMR) and RSM (1 :3 ratio) to 60 ° C, and homogenising the
mixture at single stage, 6890 kPa (1,000 psi) or as specified. Cream prepared in
this manner is referred as manufactured cream to distinguish it from fresh cream.
RSM and 'manufactured cream' were mixed in suitable proportions to obtain a
protein to fat (P /F) ratio of 0.73 (or as specified) in the standardised milk.
The standardised milk (or cheese milk) was taken into the cheese vats for the
manufacturing process. Usually 35 to 40 kg of milk was used for each vat. The
temperature of cheese milk was adjusted to 34 ° C by circulating hot or cold water
through the jacket. 0.02% CaC12 (w jw) was added to the cheesemilk. Starter was
inoculated into milk (2.0% Lactococcus lactis subsp. cremoris strains - NZDRI
strains 584/2128, 0. 1% Streptococcus thennophilus and 0 .1% Lactobacillus casei) and
the milk was then primed for 30 min (or as specified). Calf rennet (from New
Zealand Cooperative Rennet Company, Eltham, 59 RU/rnl) was added at the rate
of 16 ml/100 kg of milk. The milk was allowed to set for 45 min (or as specified).
The curd was cut (standard three cuts) after 45 min using 12 mm cheese knives.
After a dwell time of 15 min, the resultant curd and whey were subjected to gentle
manual stirring for about 30 s after every 10 min so that the curd remained
homogeneous in the whey. When the curd attained the desired pH (usually 6.2),
it was scooped into hoops and allowed to drain overnight (16-17 h) at room
temperature (20 ° C). In the first few hours of draining, hoops with the curd were
turned three to four times. After overnight draining the blocks of curd (cheese
before brining) were taken out of the hoops, weighed, cut into two similar blocks
(this was done to have enough number of blocks for analysis and storage studies)
and salted in 20-21% (w jv) brine at 1 1-13 ° C for 22 h. After brining the blocks
were drained on paper towels for 10 min, packed into plastic bags, and vacuum
sealed. Feta cheese was stored at 10 ° C. Samples were drawn at specified intervals
for analysis, grading and storage studies.

Appendix 6 . 3 Effect of manufacturing variables on the composition of whey .
11 Whey at draining Entire Whey
Treatment Fat ( % ) Protein ( % ) Lactose ( % ) TS ( % ) ca2+ (mM/kg ) ca2+ (mM/kg) & Levels
LSM F LSM F LSM F LSM F LSM F LSM F
A 0 . 02 0 . 59 0 . 8 5 0 . 8 2 6 . 2 5 * 3 . 77 First 0 . 081 0 . 7 9 5 5 . 04 6 . 3 3 14 . 6 2 2 . 6 Second 0 . 079 0 . 8 2 5 5 . 2 5 6 . 58 13 . 4 19 . 7
B 0 . 16 1 . 18 2 . 08 1 . 8 6 9 . 7 2 * 0 . 53 High 0 . 084 0 . 7 89 4 . 99 6 . 2 7 14 . 8 2 1 . 7 Low 0 . 076 0 . 8 3 1 5 . 3 1 6 . 64 13 . 2 2 0 . 6
c 0 . 02 0 . 02 0 . 09 0 . 06 7 . 3 1* 0 . 8 3 High 0 . 078 0 . 8 0 8 5 . 18 6 . 4 9 13 . 4 2 0 . 5 Low 0 . 081 0 . 8 1 3 5 . 12 6 . 4 2 14 . 7 2 1 . 8
D 1 . 47 0 . 2 0 0 . 15 0 . 18 0 . 7 1 0 . 7 7 High 0 . 068 0 . 8 0 1 5 . 11 6 . 3 9 14 . 2 2 0 . 5 Low 0 . 091 0 . 819 5 . 19 6 . 5 1 13 . 8 2 1 . 8
E 0 . 16 0 . 59 2 . 4 9 2 . 0 1 15 . 7 5 * * 0 . 2 7 High 0 . 084 0 . 8 2 5 5 . 3 2 6 . 64 13 . 0 2 0 . 8 Low 0 . 07 6 0 . 79 5 4 . 97 6 . 2 7 15 . 0 2 1 . 5
Control 0 . 12 0 . 8 5 5 5 . 4 3 6 . 8 1 13 . 0 2 0 . 5
A = Replicates ; B = P/F ratio of milk ; C = Homogenisation pressure for ' manufactured cream ' ; D = Priming time ; E = Curd pH at draining ; LSM = Least-square mean ; F = F ratio ; * p < 0 . 05 ; ** p < 0 . 0 1 ; *** p < 0 . 0 0 1 ; F values without asterisks denote ' not signi ficant ' .
N \0 N

Appendix 6 . 4 Effect of selected manufacturing variables on compos ition of Feta cheese after six months of storage at 10 ° C
- - - - - - - - - - - - - - - - - - - - - - - - - - - - - - - - - - - - - - - - - - - - - - - - - - - - - - - - - - - - - - - - - - - - - - - - - - - - - - - - - - - - - - - - - - - -
Treatment Moisture ( % ) Fat ( % ) MNFS ( % ) FDM ( % ) pH & level - - - - - - - - - - - - - - - - - - - - - - - - - - - - - - - - - - - - - - - - - - - - - - - - - - - - - - - - - - - - - - - - - -
LSM F LSM F LSM F LSM F LSM F - - - - - - - - - - - - - - - - - - - - - - - - - - - - - - - - - - - - - - - - - - - - - - - - - - - - - - - - - - - - - - - - - - - - - - - - - - - - - - - -- - - - - - - - - - - -
A 0 . 3 3 3 . 03 0 . 3 7 4 . 4 4 2 . 55 First 48 . 2 5 2 6 . 97 66 . 13 5 2 . 06 4 . 54 Second 4 8 . 55 2 6 . 16 65 . 7 9 50 . 5 9 4 . 5 1
B 12 . 8 * * 179 * * * 3 0 . 5 * * * 2 17 * * * 1 . 2 6 High 49 . 34 2 3 . 4 4 64 . 4 2 4 6 . 2 1 4 . 53 Low 47 . 4 6 2 9 . 69 67 . 50 5 6 . 4 4 4 . 5 1
c 18 . 0 3 * * 19 . 5 * * 4 . 2 5 7 . 3 4 * 1 . 0 1 High 4 9 . 51 2 5 . 5 3 66 . 54 5 0 . 3 9 4 . 5 3 Low 4 7 . 29 2 7 . 59 65 . 3 9 5 2 . 2 6 4 . 5 1
D 6 . 57 * 7 . 16 * 1 . 7 2 . 2 5 0 . 2 8 High 47 . 7 3 2 7 . 19 65 . 59 5 1 . 8 5 4 . 53 Low 4 9 . 07 2 5 . 9 4 66 . 3 2 50 . 8 0 4 . 5 2
E 1 . 66 4 . 0 3 0 . 02 2 . 7 6 1 . 54 High 48 . 74 2 6 . 09 65 . 99 5 0 . 7 5 4 . 5 1 Low 48 . 06 2 7 . 03 65 . 9 2 5 1 . 9 0 4 . 54
S . D . 1 . 05 0 . 9 3 1 . 12 1 . 3 9 0 . 04 - - - - - - - - - - - - - - - - - - - - - - - - - - - - - - - - - - - - - - - - - - - - - - - - - - - - - - - - - - - - - - - - - - - - - - - - - - - - - - - - - - - - - - - - - - - -
A = Repl icate ; B = P/F ratio ; C = Homogenisation pressure ; D = Priming time ; E = Curd pH at draining ; LSM = Least square mean ; F = F ratio ; S . D . = Standard deviation of raw data , * * * p < 0 . 00 ; * * p < 0 . 01 ; * p < 0 . 05 ; ' F ' values without any asterisks are ' not significant ' .
N \0 w

Appendix 6 . 5 Effect of manufacturing variables on the mean scores of sensory parameters of cheese .
... ::::,::,:.::/: .. :.::::,,,::,;. :>.:;·; .. :;•:: :,:,:,::::;:::;.,,.,; FLAVOUR TEXTURE . : : ,·:·:·' /' ' , .( (/ �>
Treatment Acidity Saltiness Bitterness Oxidised Mouthfeel Structure Overall & Levels acceptabil ity
LSM F LSM F LSM F LSM F LSM F LSM F LSM F
A 67 . 07*** 1 . 60 1 . 66 1 . 7 6 0 . 0 0 6 . 4 3 * 0 . 08 First 2 . 53 3 . 3 2 1 . 5 1 1 . 41 3 . 0 1 3 . 2 3 2 . 8 5 Second 2 . 9 2 3 . 19 1 . 6 9 1 . 56 3 . 02 2 . 9 9 2 . 8 2
B 1 . 8 6 7 . 0 5 * 1 . 24 0 . 2 6 1 0 . 3 4 * 4 . 79 2 . 0 1 High 2 . 7 6 3 . 3 9 1 . 68 1 . 4 6 3 . 2 4 3 . 2 1 2 . 9 3 Low 2 . 69 3 . 12 1 . 5 2 1 . 52 2 . 8 1 3 . 0 1 2 . 7 4
c 2 . 0 1 1 . 19 0 . 6 6 0 . 77 0 . 5 5 1 . 8 5 0 . 08 High 2 . 69 3 . 3 1 1 . 66 1 . 54 3 . 07 3 . 05 2 . 8 5 Low 2 . 7 6 3 . 2 0 1 . 54 1 . 44 2 . 9 7 3 . 17 2 . 8 1
D 3 . 9 8 0 . 06 0 . 5 3 0 . 00 1 . 2 0 1 . 08 0 . 09 High 2 . 77 3 . 2 7 1 . 55 1 . 4 9 3 . 09 3 . 0 6 2 . 8 1 Low 2 . 68 3 . 2 4 1 . 6 5 1 . 4 8 2 . 9 5 3 . 16 2 . 8 6
E 6 . 62 * 10 . 2 5 * 0 . 18 1 . 59 1 . 2 4 8 . 3 1 * 0 . 9 3 High 2 . 66 3 . 09 1 . 57 1 . 5 6 2 . 9 5 2 . 9 8 2 . 77 Low 2 . 7 8 3 . 4 2 1 . 6 3 1 . 4 1 3 . 09 3 . 2 5 2 . 9 0
Control 3 . 06 3 . 16 2 . 3 5 1 . 5 2 . 6 3 2 . 8 8 2 . 6 9
A = Replicates ; B = P/F ratio o f milk ; C = Homogenisation pressure for 1 manufactured cream ' ; D = Priming time ; E = Curd pH at draining ; s = Storage time ; LSM = Least-square mean ; F = F ratiQ ; * p < 0 . 05 ; * * * p < 0 . 00 1 ; F values without asterisks denote ' not s ignificant • .
!
N \.0 .j:;..

2 9 5
Appendix 7 . 1 An example showing calcul ations f o r the
preparation of chee s emi lk
( i ) Quantity of slurry containing heat-denatured whey protein to be added Rate of addition of whey protein ( dry matter) = 9 . o gjkg milk Protein concentration of slurry = 12 . 0%8 Total quantity of milk taken = 3 5 . 2 5 kg ( control ) Quantity o f slurry to be added = [ 3 5 . 2 5 ( 9/ 1 0 0 0 ) ( 10 0/ 12 ) ]
= 2 . 64 4 kg
( ii ) Quantity o f fat ( i . e . FFMR) to be added for adj ustmentb
o f protein to fat ( P/F ) ratio Protein to fat ratio required in cheesemilk = 0 . 7 4 Quantity of additional protein incorporated
= 2 . 64 4 ( 12/ 1 0 0 ) = 0 . 3 17 kg Quantity of additional fat required = 0 . 3 17/0 . 7 4 = 0 . 4 2 8 kg
( ii i ) Details for preparation of cheesemilk Quantity o f reconstituted skim milk (RSM) and cream to be taken in cheesevat ( control ) = Less FFMR used for control ( 5 . 1% fat in milk) = RSM used for control
manufactured 3 5 . 2 5 0 kg
1 . 8 0 0 kgc
( 3 . 52 0 kg SMP + 2 9 . 9 3 0 kg water) Less provision for addition of acid/alkal i Quantity RSM (concentrated ) to be used
= = 3 3 . 4 5 0 kg
2 . 0 0 0 kg = 3 1 . 4 5 0 kgd
Let the quantity of dilute alkal i/acid used 1 . 0 0 0 kg Quantity of make-up water added after addition of alka l i
= ( 2 - 1 ) = 1 . 0 0 0 kg
Procedure : Initially RSM was prepared . Then manufactured cream was prepared using FFMR and RSM ( 1 : 3 ratio ) . I f required , slurry with heat-denatured whey protei n was homogenised with FFMR and RSM . ' Manufactured cream ' , RSM , and slurry were taken into the cheesevat . pH o f the cheesemilk was adj usted to 6 . 5 5 us ing 0 . 1% NaOH or 0 . 0 3 5% HCl and then make-up water ( 2 kg - quantity of acid/alka l i ) was added to the cheesevat . 0 . 0 2 % CaC12 was added to the cheesemilk . The milk was ready for cheese manufacture .
a For calculations the protein content in slurry was a ssumed to be 8 0 % of the total sol ids . b This was done only when P/F ratio needed adj ustment . c Where fat was to be adj usted in proportion to the whey protein added , an increased quantity of FFMR was taken . d 3 . 52 0 kg SMP and 2 7 . 7 3 0 kg water .

2 9 6
Appendix 7 . 2 Compos ition o f cheesemilka with respect t o the process treatments
Variation
P/F ratio Fat ( % )
LSM F LSM F
TS ( % ) Protei n ( % )
LSM F LSM F - - --- - -- - - - - - - - - - - - - - - - - - - - -- - -- - - - - -- - - - - - - - - -- - - - - - - - - - - - -
Control 0 . 7 5
Added whey protein (W ) w 2 w 1
Fat ( F )
F 2 F 1
Homogeni-sation ( H ) H 1 H 2 H 3 S . D .
Source of variation
Control
0 . 8 3 0 . 7 7
0 . 7 3 0 . 8 7
0 . 8 0 0 . 7 9 0 . 8 1 0 . 0 2 7
1 5 . 58 *
7 2 . 67 * * *
0 . 7
Added whey protein (W ) w 2 w 1
Fat ( F ) F 2 F 1
Homogenisation ( H ) H 1 H 2 H 3 S . D .
4 . 9 0 14 . 2 6
0 . 8 5
5 . 2 3 14 . 8 9 5 . 15 14 . 4 9
77 . 3 1 * * *
5 . 6 0 15 . 05 4 . 7 8 14 . 3 3
0 . 7 2
5 . 2 4 14 . 8 2 5 . 2 2 14 . 6 6 5 . 11 14 . 5 9 0 . 1 6 3 0 . 2 4 3
Calcium (mM/kg)
LSM
3 6 . 1
3 5 . 2 3 5 . 7
3 5 . 1 3 5 . 7
3 5 . 1 3 5 . 5 3 5 . 7
1 . 7 1
F
0 . 2 7
0 . 3 1
0 . 11
a Includes slurry containing heat-denatured whey protein.
3 . 6 6
8 . 4 6 7 5 . 1 * * * *
4 . 2 9 3 . 9 4
2 6 . 18 0 . 67 * *
4 . 10 4 . 13
0 . 9 5 1 . 79
4 . 1 6 4 . 0 6 4 . 13 0 . 0 6 9
W 2 = Incorporation of denatured whey protein (on OM basis) at the rate of 9.0 g/kg milk; W 1 = Incorporation of denatured whey protein (on OM basis) at the rate of 4.5 g/kg milk; F 2 = Fat level in cheesemilk adjusted in proportion to added whey protein; F 1 = Fat level not adjusted; H 1 = Denatured whey protein added without homogenisation; H 2 = Denatured whey protein homogenised separately; H 3 = Denatured whey protein homogenised in combination with manufactured cream; Control = Cheese prepared without any added whey protein; LSM = Least-square mean; F = F ratio; S.D. = Standard deviation of raw data; * = p < 0.05; * * = p < 0.01; * * * = p < 0.001; F ratios without asterisks denote 'not significant'.

Appendix 7 . 3 Effect of process compos ition of whey
treatments
2 9 7
on the
Variat ion
Fat ( % ) TS ( % ) Protein ( % ) ca2+ (mM/kg )
LSM F LSM F LSM F LSM F - - - - - - - - - - ---- - - - ---- - - ---- - - --- - --- - - - - - - - - --- - ---- - - - - -Control 0 . 0 67 6 . 8 0 0 . 9 7 2 1 . 0
Added whey 2 6 . 18 0 . 9 3 2 . 7 4 3 . 3 3 protein (W) * * w 2 0 . 08 8 6 . 7 7 1 . 0 2 2 0 . 5 w 1 0 . 0 6 8 6 . 8 0 0 . 9 9 2 2 . 1
Fat ( F ) 1 1 . 6 * 4 . 2 5 0 . 2 2 8 . 14* F 2 0 . 0 8 5 6 . 8 2 1 . 0 1 2 2 . 6 F 1 0 . 07 2 6 . 7 5 1 . 0 0 2 0 . 1
Homogeni- 8 . 9 1 2 . 8 2 1 . 3 6 1 . 7 7 sat ion ( H ) * H 1 0 . 0 8 8 6 . 8 2 1 . 0 2 2 1 . 0 H 2 0 . 0 6 8 6 . 7 2 1 . 0 1 2 0 . 5 H 3 0 . 08 0 6 . 8 0 0 . 9 9 2 2 . 4
S . D . 0 . 0 0 67 0 . 0 6 3 0 . 0 3 1 1 . 5 2
W 2 = Incorporation of denatured whey protein ( on DM basis ) at the rate of 9 . 0 gjkg milk ;
W 1 = Incorporation of denatured whey protein ( on DM basis ) at the rate of 4 . 5 gjkg milk ;
F 2 = Fat level in cheesemilk adj usted in proportion to added whey protein ;
F 1 = Fat l evel not adj usted ;
H 1 = Denatured whey protein added without homogenisation ; H 2 = Denatured whey protein homogenised separately ; H 3 = Denatured whey protein homogenised in combination with
manufactured cream ;
Control = Cheese prepared without any added whey protein ;
LSM = Least-square mean ; F = F ratio ; S . D . = Standard deviation of raw data ;
* = p < 0 . 0 5 ; * * = p < 0 . 0 1 ; * * * = p < 0 . 0 0 1 ; F ratios without asterisks denote ' not s ignificant ' .

Appendix 7 . 4
Variat ion
Control
Added whey protein (W ) w 2 w 1
Fat ( F )
F 2 F 1
Homogenisation (H ) H 1 H 2 H 3 S . D .
Effect of process treatments on compos ition of cheese before brining
Fat ( % ) Ca2+ (mM/Kg ) Protein ( % )
LSM F LSM F LSM F
2 6 . 5 0 1 07 . 1 1 6 . 3 3
2 4 . 12 0 . 7 3 0 . 6 0 * *
2 4 . 2 8 9 4 . 7 1 6 . 3 3 2 6 . 0 2 9 8 . 6 1 6 . 7 2
2 6 . 3 8 2 3 . 9 2
2 6 . 18 2 5 . 2 0 2 4 . 08
0 . 6 11
4 8 . 8 4 * *
11 . 8 2 *
9 0 . 8 102 . 5
9 3 . 6 10 0 . 5
9 5 . 9 7 . 9
6 . 53
0 . 7 9
1 6 . 14 1 6 . 9 1
16 . 4 0 1 6 . 4 0 1 6 . 7 8
0 . 7 7
2 . 8 5
0 . 3 0
2 9 8
the
Variat ion
Moisture ( % ) pH FDM ( % ) MNFS ( % )
LSM F LSM F LSM F LSM F
Control 5 3 . 17 4 . 7 7 5 6 . 6 0 7 2 . 3 2
Added whey 6 . 0 5 0 . 2 3 1 5 . 2 9 1 . 9 0 protein (W) * w 2 5 5 . 4 0 4 . 7 7 5 4 . 4 0 7 3 . 18 w 1 5 3 . 3 3 4 . 7 6 5 5 . 6 9 7 2 . 07
Fat ( F ) 3 . 7 8 2 . 10 1 0 9 . 9 5 0 . 07 * * *
F 2 5 3 . 55 4 . 7 5 5 6 . 7 9 7 2 . 7 3 F 1 5 5 . 18 4 . 7 8 5 3 . 3 1 7 2 . 5 2
Homogenis- 1 . 4 1 0 . 13 19 . 9 6 0 . 15 at ion ( H ) * * H 1 5 3 . 65 4 . 7 6 5 6 . 4 0 7 2 . 67 H 2 5 4 . 13 4 . 77 5 4 . 9 2 7 2 . 3 4 H 3 5 5 . 3 3 4 . 7 6 5 3 . 8 4 7 2 . 8 7 S . D . 1 . 4 5 5 0 . 04 2 0 . 57 5 1 . 3 8 5
W 2 = Denatured whey protein (DM) added at the rate of 9.0 g/kg milk; W 1 = Denatured whey protein (DM) added at the rate of 4.5 g/kg milk; F 2 = Fat level in cheesemilk adjusted in proportion to added whey protein; F 1 = Fat level not adjusted; H 1 = Denatured whey protein added without homogenisation; H 2 = Denatured whey protein homogenised separately; H 3 = Denatured whey protein homogenised in combination with manufactured cream; Control = Cheese prepared without added whey protein; LSM = Least-square mean; F = F ratio; S.D. = Standard deviation of raw data; * = p < 0.05; * * = p < 0.01; * * * = p < 0.001; F ratios without asterisks denote 'not significant'.

Appendix 7 . 5 Effect of process treatments on composition of cheese at four weeks
Variat ion
Moisture ( % ) Fat ( % ) NaCl ( % ) pH
LSM F LSM F LSM F LSM
2 9 9
the
F - - - - - - - - - - - - - - - - - - - - - - - - - - - - - - - - - - - - - - - - - - - - - - - - - - - - - - - - - - - -
Control 4 8 . 3 4 2 7 . 4 3
Added whey protein (W ) 7 . 69 * 9 . 64 * w 2 5 1 . 04 2 4 . 9 0 w 1 4 8 . 59 2 6 . 5 0
Fat ( F ) 3 . 08 2 4 . 8 1 * *
F 2 4 9 . 04 2 6 . 9 8 F 1 5 0 . 59 2 4 . 4 2
Homogenis- 2 . 12 6 . 04 at ion ( H ) H 1 4 9 . 0 0 2 6 . 6 5 H 2 4 9 . 3 7 2 5 . 9 5 H 3 5 1 . 08 2 4 . 5 0 S . D . 1 . 5 2 6 0 . 8 9 3
Variation
Protein ( % ) FDM ( % )
LSM F LSM F
Control 16 . 3 5 53 . 0 9
Added whey 1 . 4 3 3 . 4 0 protein (W) w 2 16 . 4 5 5 0 . 8 0 w 1 16 . 97 5 1 . 5 1
Fat ( F ) 3 . 18 8 6 . 8 * * *
F 2 16 . 3 2 5 2 . 9 5 F 1 17 . 10 4 9 . 3 7
Homogenis- 0 . 57 10 . 0 1 at ion ( H ) * H 1 1 6 . 59 5 2 . 17 H 2 17 . 0 3 5 1 . 2 4 H 3 16 . 5 1 5 0 . 0 7 S . D . 0 . 7 54 0 . 6 67
4 . 67 4 . 63
1 . 2 5 0 . 3 1 4 . 63 4 . 65 4 . 4 9 4 . 64
7 . 5 4 0 . 0 3
4 . 3 9 4 . 65 4 . 7 3 4 . 65
1 . 8 0 0 . 2 4
4 . 5 2 4 . 6 6 4 . 4 4 4 . 64 4 . 7 2 4 . 65 0 . 2 17 0 . 0 3 1
MNFS ( % ) S/M ( % )
LSM F LSM F
6 6 . 6 0 9 . 67
5 . 9 5 1 . 0 3
67 . 9 8 9 . 07 6 6 . 09 9 . 2 4
0 . 10 5 . 6 1
67 . 16 8 . 9 5 6 6 . 9 2 9 . 3 6
0 . 65 0 . 8 4
6 6 . 77 9 . 2 3 6 6 . 18 9 . 0 0 67 . 6 6 9 . 2 4
1 . 3 4 1 0 . 2 9 8
W 2 = Denatured whey protein (DM) added at the rate of 9.0 g/kg milk; W 1 = Denatured whey protein (DM) added at the rate of 4.5 g/kg milk; F 2 = Fat level in cheesemilk adjusted in proportion to added whey protein; F 1 = Fat level not adjusted; H 1 = Denatured whey protein added without homogenisation; H 2 = Denatured whey protein homogenised separately; H 3 = Denatured whey protein homogenised in combination with manufactured cream; Control = Cheese prepared without added whey protein; LSM = Least-square mean; F = F ratio; S.D. = Standard deviation of raw data; * = p < 0.05; ** = p < 0.01; *** = p < 0.001; F ratios without asterisks denote 'not significant'.

Appendix 7 . 6
Variation
TS ( % )
LSM
3 0 0
Effect o f process treatments on the composition of exudate from four week old cheese
ca2+ (mM/Kg ) NaCl ( % ) Protein ( % )
F LSM F LSM F LSM F ------------------------------------------------------ -----Control 15 . 5 6 1 3 9 . 3 8 . 15 2 . 8 6
Added whey 0 . 02 2 . 2 2 0 . 9 1 2 . 6 9 protein (W ) w 2 15 . 2 6 1 2 3 . 7 7 . 8 3 1 . 4 1 w 1 1 5 . 2 2 1 3 5 . 3 8 . 0 1 2 . 7 3
Fat ( F ) 9 . 3 9 * 0 . 15 0 . 08 0 . 0 F 2 14 . 7 6 1 2 8 . 0 7 . 8 9 2 . 54 F 1 15 . 7 2 1 3 1 . 0 7 . 9 5 2 . 6 0
Homogenis- 0 . 4 7 0 . 13 0 . 02 0 . 3 1 at ion ( H ) H 1 15 . 2 1 1 2 9 . 9 7 . 9 1 2 . 57 H 2 15 . 08 1 3 1 . 8 7 . 8 9 2 . 67 H 3 15 . 4 4 1 2 6 . 9 7 . 9 5 2 . 4 6
S . D . 0 . 5 3 9 13 . 4 9 0 . 3 3 1 0 . 2 7 4
W 2 = Incorporation o f denatured whey protein ( on DM bas i s ) at the rate o f 9 . 0 gjkg milk ; W 1 = Incorporation o f denatured whey protein ( on DM bas i s ) at the rate o f 4 . 5 gjkg milk ;
F 2 = Fat level in cheesemilk adj usted in proportion to added whey protein ; F 1 = Fat level not adj usted ;
H 1 = Denatured whey protein added without homogenisation ; H 2 = Denatured whey protein homogenised separately ; H 3 = Denatured whey protein homogenised in combination with manufactured cream ;
Control = Cheese prepared without any added whey protein ;
LSM = Least-square mean ; F = F ratio ; S . D . = Standard deviation of raw data ;
* = p < 0 . 0 5 ; * * = p < 0 . 0 1 ; * * * = p < 0 . 0 0 1 ; F ratios without asterisks denote ' not s igni ficant ' .

3 0 1
Appendix 7 . 7 Effect of process treatments on the mean scores of sensory parameters of cheeses
S ource Flavour o f varaition & l evels
Acidity Saltiness Bitterness Oxidi s ed
LSM F LSM
Control Others
2 . 7 4 57 . 8 3 . 1 2 . 6 6 * 3 . 1
Added whey protein (W) w 2 2 . 8 w 1 2 . 7
Fat ( F ) F 2 F 1
Homogenisation (H ) H 1 H 2 H 3
Storage t ime
4 weeks 18 weeks
S . D .
2 . 7 2 . 7
2 . 8 2 . 7 2 . 8
2 . 7 2 . 8
0 . 2 6
9 . 0
1 . 0
111 . 0 **
1 . 5 4
3 . 1 3 . 1
3 . 0 3 . 2
3 . 1 2 . 9 3 . 3
3 . 2 2 . 9
0 . 2 3
F LSM
0 . 7 5 1 . 5 1 . 5
1 . 9 2
17 . 3
4 2 . 1 *
4 . 7 7 *
1 . 4 1 . 5
1 . 4 1 . 5
1 . 5 1 . 5 1 . 5
1 . 5 1 . 5
0 . 14
F LSM
2 . 4 5 1 . 5 1 . 3
3 0 . 3 *
2 0 . 3 *
4 . 0
0 . 58
1 . 3 1 . 4
1 . 3 1 . 4
1 . 3 1 . 3 1 . 3
1 . 3 1 . 4
0 . 2 0
F
3 . 17
2 . 15
0 . 4
0 . 0 3
2 . 03
W 2 = Incorporation of denatured whey protein ( on DM bas i s ) a t the rate of 9 . 0 gjkg milk ; W 1 = Incorporation o f denatured whey protein ( on DM bas is ) a t the rate of 4 . 5 gjkg milk ;
F 2 = Fat l evel in cheesemilk adj usted in proportion to added whey protein ; F 1 = Fat level not adj usted ;
H 1 = Denatured whey protein added without homogenisat ion ; H 2 = Denatured whey protein homogenised separately ; H 3 = Denatured whey protein homogenised in combination with manufactured cream ;
Control = Cheese prepared without any added whey protein ; ' Others ' = Includes all trials ( 12 out of 15 ) in which denatured whey protein was incorporated ;
LSM = Least-square mean ; F = F ratio ; S . D . = Standard deviation of raw data ; * = p < 0 . 0 5 ; ** = p < 0 . 0 1 ; * * * = p < 0 . 0 0 1 ; F ratios without asterisks denote ' not s ignificant ' .
Continued on next page . . . . .
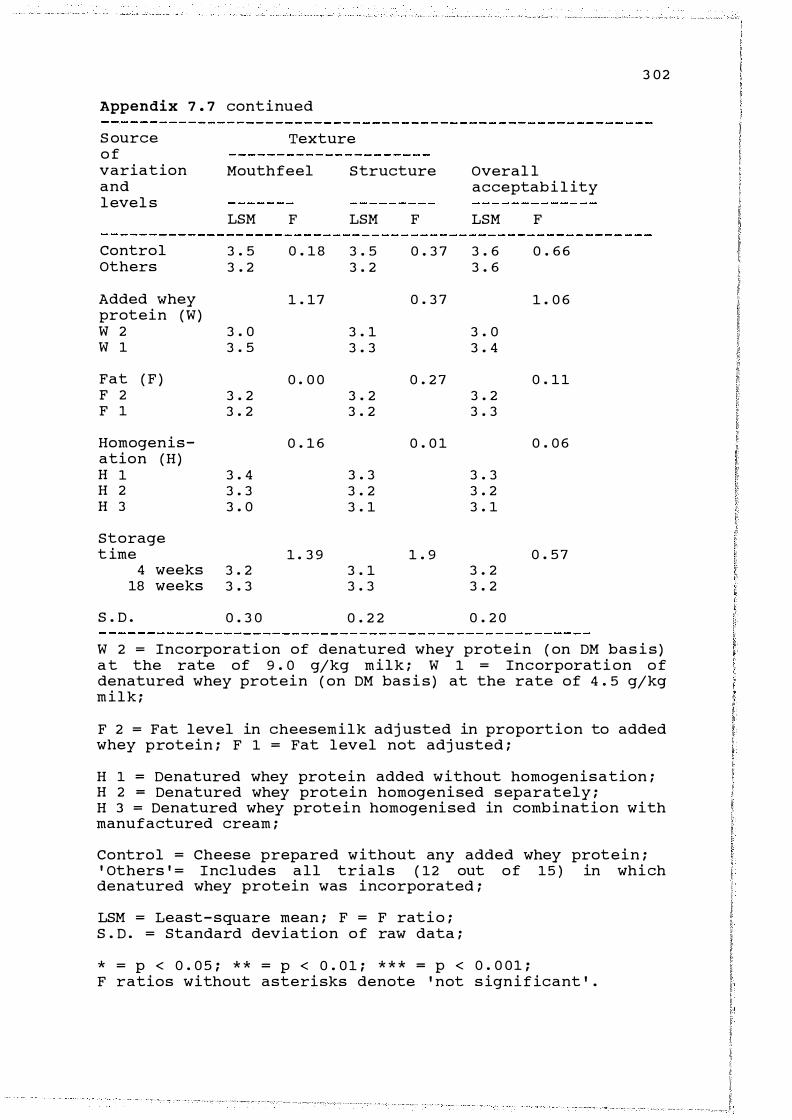
Appendix 7 . 7 continued
S ource Texture o f variation and level s
Control Others
Added whey protein (W ) w 2 w 1
Fat ( F ) F 2 F 1
Homogenisation (H ) H 1 H 2 H 3
Storage t ime
4 weeks 18 weeks
S . D .
Mouth feel
LSM
3 . 5 3 . 2
3 . 0 3 . 5
3 . 2 3 . 2
3 . 4 3 . 3 3 . 0
3 . 2 3 . 3
0 . 3 0
F
0 . 18
1 . 17
0 . 0 0
0 . 1 6
1 . 3 9
Structure
LSM
3 . 5 3 . 2
3 . 1 3 . 3
3 . 2 3 . 2
3 . 3 3 . 2 3 . 1
3 . 1 3 . 3
0 . 2 2
F
0 . 3 7
0 . 3 7
0 . 2 7
0 . 0 1
1 . 9
Overal l acceptabi l ity
LSM
3 . 6 3 . 6
3 . 0 3 . 4
3 . 2 3 . 3
3 . 3 3 . 2 3 . 1
3 . 2 3 . 2
0 . 2 0
F
0 . 6 6
1 . 0 6
0 . 1 1
0 . 0 6
0 . 57
3 02
W 2 = Incorporation of denatured whey protein ( on DM bas i s ) a t the rate of 9 . 0 gjkg milk ; W 1 = Incorporati on o f denatured whey protein ( on DM bas i s ) at the rate of 4 . 5 gjkg milk ;
F 2 = Fat level in cheesemilk adj usted in proportion to added whey protein ; F 1 = Fat level not adj usted ;
H 1 = Denatured whey protein added without homogenisation ; H 2 = Denatured whey protein homogenised separately ; H 3 = Denatured whey protein homogenised in combination with manufactured cream ;
Control = Cheese prepared without any added whey protein ; ' Others ' = Includes all trials ( 12 out of 15 ) in which denatured whey protein was incorporated ;
LSM = Least-square mean ; F = F ratio ; S . D . = Standard deviation of raw data ;
* = p < 0 . 0 5 ; * * = p < 0 . 0 1 ; * * * = p < 0 . 0 01 ; F ratios without asterisks denote ' not significant ' .

3 0 3
Appendix 7.8
(a) Data o n quantities of input and output material, the calculated values of mass balance, yields and recoveries of the milk solids for all the trials
� :OIHROL �\.lP ?!'R HYPE MQTY ;.tTOT _.:AT )I TOT _�S HTOT _nH .�TOT _V. \IQTY \ITOT_FAT \ITOT_rs 'JTOT_0TH 'JTOT_:A :JTY :70T_�H
3
� 1 a
1 1
1 2
1 3
1 1.
: 5
J 0
0
0
0
0
0
( kg ) ( kg ) ( kg ) ( \(g) (ll'f1/kg) (kg ) ( kg ) ( kg ) ( \( g ) (mM/kg) (kg ) ( kg )
o •J a 3S . oa o 1 . 6975 � . 3860 1 . 2591.1 13a5 . 5 28 . '165 o . o 1 71. 1 . 91.93 0 . 232739 56 1 . 9 � . 3 1 9 : . 68a8
· I · 1 2 36 . , 1 5 1 . ?989 5 . 21 46 1 . � 1 25 5 1281 . 3 29 . 38a 0 . 0 1 79 1 . 9631 0 . 230233 5 79 . f> 6 . 337 : . :776
· 1 37.330 1 . 7175 5 . 2924 1 . f>0981. 1 3 1 2 . 7 3a .675 0 . 01 81. 2 . 021.5 0 • .3 0 7259 5 79 . 7 7 . � 0 1 ; . ;"1 70
· 1 36 . 6 5 0 2 . 0561 5 . �572 1 . �3570 1 3 23 . : 29 . 345 0 . 0 1 79 2 . 035.:. 0 . 237521 7'37. : 7. J71. 1 . ;>91.3
· 1 36.f>35 1 . �636 5 .3890 1 . �2 1 2 1 282 . 2 29 .360 0 . 0 1 79 2 . 05 1 1. 0 .302906 686 . 7 7 . JS3 1 . Y01.3
· 1 36 .f>50 1 . '1058 5 . !821 1 . �3 1 02 1 275 . � 29 . 7'30 u . 0208 2 . 0276 0 . 290206 7'2 3 . 3 7 . 22!! ; .36.:.3
D a 35 . oo o 1 . n1 0 5 . 1 1 00 1 . 3085.:. 1231 . 0 29 . 03 5 o . o2o3 1 3 91.7 u . 268603 f> 5 3 . 2 6 .390 1 . 7'3 16
· I 37 . .:>45 1 . m1 5 . �3 5 1 .6 1 1 57 1325 . 1 30 . 1 9 0 o . o1 8 1 2 . o288 a . 236992 621 . � 7 .65u : . .s9B3
1 38 . 085 2 . 11.80 5 . 3727 1 . 64985 1 321 . 6 30 . 1 85 0 . 0332 2 . 01.35 0 . 2981.99 632 . ; 3 . :so 2 . 0859
o 35 . oo o 1 . 6765 '- . 9no 1 . 27501. 12a1. . o 28 . 66a o . a2aa 1 .9489 o . 287a76 60 1 .3 o . f>30 1 . :1 05
· 1 · 1 1 36.322 1 . 7689 5 . 27a3 1 . �6224 1 271 .3 29 . 775 a . 0238 2 . 03a7 0 . 30 5 843 565 . 7 6 . 70:.0 1 . 7726
1 3 8 . a85 2 . 2a 1 3 5 .9 1 08 1 . .:>4499 1 264 . :. 30 • .:.as 0 . 0365 2 . 0645 0 .3 1 23 1 1. 6a5 . ·J 7 . 325 2 . 1 261.
·1 · 1 3 36 . r.35 1 . 78 1 7 5 . 2248 1 . �ss 1 7 13ao .1 Z9 . zso o . o234 a . o2o3 o .Joo7sa 6 ... .:. . 1 7 . 4:.5 1 .�97.:.
· 1 37.371 1 . 7799 5 . :.383 1 . !>5266 1 367. 1 3 a . :9 5 0 . 0272 2 . 0711. 0 .3 2 1 716 6 1 5 . 9 7 . 365 1 . 3089
38.33a 2 . 3a75 5 . 9833 1 . 6a666 1 4 1 8 . 2 29 .355 0 . 0269 2 . 04 5 1 0 .325712 6 1 5 . J 3 . 7'50 2 . : 5 2 5
� CTOT_TS CiOT_.>TH CTOT_C>. SQTY SiOT_FAT STOT_TS STOT_?TH SiOT_CA RQTY
(kg) H L _ QTY HL_>RCNT Y_Hl.'MSi
O:gl ( kgl (mM/kgl (kgJ
1 2. 9888 1 . 0401
3 . 2065 1 . 1602
3 . 2934 1 . 2654
� 3 . :.a96 1 . 1328
3 . :.207 1 . 1 879
6 3 .. .3537 1 .. 245 1
; 3 . 0863 1 . 0844
3 3 . 3507 1 .347a
9 3 . 71 3 7 1 .336a
1 0 2 . 9768 1 . 0363
1 1 3 . 16 1 0 1 . 1 6 1 a
i 2 3 ,..:;,64. 1 . 2381
1 3 3 . 2087 1 . 1 827
14 3 . �37a 1 .3046
IS 3 . 3 1 5 0 1 . 2839
736 . 1
73 1 . 5
75 1 . 2
657.3
691 . 1
650 . 5
f>86 , 765 . 0
7a5 . 9
646 .. �
.:)49 .7
798 . 1
308 . 5
831. . 7
o . n
o . n
a . n
o . n
o . n
a . n
a . n
0 . 77
o . n
a . n
o . n
O .. i7 0 .. 77 o . n
o . n
( kg ) ( kg )
0 . 0006 0 . 07<'.2
o . oaa6 0 . 071.2
o . oao6 0 . 0742
o . oaa6 0 . 0742
0 . 0006 0 . 0742
•J . oao6 0 . 071.2
o . oaa6 0 . 0742
o . ooa6 0 . 0742
a . ooa6 o . 071.2
o . aoa6 0 . 0742
o . aoa6 0 . 0742
•J . 0006 0 . 07<'.2
0 . 0006 0 . 0742
o . oao6 0 . 0742
0 . 0006 0 . 0742
( kg )
0 . 0292
0 . 0292
0 . 0292
0 . 0292
0 . 0292
0 . 0292
0 . 0292
0 . 0292
0 . 0292
0 . 0292
O . J292
0 . 0292
O . J292
0 . 0292
0 . 0292
(mM/kg)
26 . 9
26 . 9
26 . 9
26 . 9
26 . 9
26 . 9
26 . 9
26 . 9
26 . 9
26 . 9
26 . 9
26 . 9
26 . 9
26 . 9
26 . 9
(kg) (::)
0 . 00<'.2 0 . 4902 1 .3 7
O . Oa42 0 . �722 1 . 27
O . Oa42 0 .5282 1 . 37
0 . 0042 O .Sa52 1 . 35
0 . 0042 0 . �962 1 . 33
0 . 0042 :) . �2 1 . 25
0 . 0042 0 .3492 0 . 98
0 . 0042 0 . 5792 1 . 5 1
O . Oa42 0 . �942 1 .2 7
a . 0042 0 . �842 1 . 3 5
O . Oa42 a . 58 1 2 1 . 5 7
0 . 0042 0 . 6292 1 . 62
o . 0042 o . :.842 1 . 3 0
0 . 001.2 0 . 5852 1 . 5 1
0 . 0042 0 . "992 1 . 28
1 8 . 05
18 .. T7 1 9 . 5 6
1 9 • .3 0
1 9 . 25
1 9 . 72
! 8 . 25
20 .32
1 8 . 9<'.
1 8 .. 5 5
2 0 . 5 4.
20 . :.3
2a . 76
22 . 32
1 7 . 079
1 7 . 6 i 1
1 8 . 606
: 8 . 6it.
: a . 3 a 1
1 7 . f>36
1 7 . 3 0 1
1 9 . 5 0 2
1 7 . ·0 1 0
1 7 . �05
19. ! l.9
: 7 . 6 1 3
1 8 . 1 5 1
1 9 . 906
� ;u _3AL 0._3AL iS_3AL PTH_SAL )1ST _3Al :AR .�
c::J C>.R_C'J
(:;)
iSR_)I
(::)
iSR_C'.J .=»TNR_� ?TNR_C'..I �S iR_� �Si�_:'.J
(::) (:;)
1 0 0 . 00
99 . 77
1 0 1 .00
:. �7.36
97.36
6 98 . ]1 ; �8 .39
3 96 . 77
9 98 . 62
1 0 1 0 3 . ! 8
i 1 1 0 1 . 5 2
: 2 �8.31
:3 Y 6 . 5 5
1 4 : a 3 . 1 2
: 5 9t. . :.2
97 . �2
: a o . 1 8
� 9 . .3 5
1 0 3 . 33
1 0 5 . 25
1 0 5 .37
1 0 2 . :. 1
1 a 2 . 5 7
1 a2 . 93
1 0 1 . :.a
93 . 6 2
96.6a
1 0 2 . :04
: o2 . 1 a
i O O • .J i
c::J c::J c::J
99 .557 654. .97 98 .• 9
�7 . 746 637. �6 98 . 9a
99 . 093 6 1 2 . 1 8 98 . 5 6
98 . �0 6 1 8 .60 98 . 69
1 00 . 1 62 .:>46 . 47 98.�3
1a2.375 670 . 31 98 . 1 7
98 . 0 1 0 .:)45 .3a 99 . 2a
98.98 98 .97 55 . 2t. 5 6 . 71
98 . 78 99 . oa 55 . 39 55 . 79
99 . 93 98.93 S 6 . J 7 So . �:. 96 . 99 99. 1 1 :.<1 . 73 :.7 . 1 5
96 . 94 99 .J6 5 2 . 79 5 0 . 1 6
97.31 98 . 39 :.9 .9l. �7 . 1 7
97. 7<'. 98 . 33 5 2 . �7 5 1 . 23
97. �95 635 . 39 98.f>7 95 . ;"4 98 . 94 5 6 . 58 55 . 1 5
96 . 3 1 a 62� . 08 99 . 0 8 9 7 . 08 98 . :.3 5 2 . 34 5 0 .35
97 .5 1 6 .:)47.38 98 . 34 1 01 . 99 98 . 34 52.51 5 1 . �
97 . 1 4a 627 . :.9 98.66 1 00 . 1 7 98.67 s a . 04 5 3 . 45
95 .:.21 590 . 33 98.93 96 .66 98 . 3 1 �9 . 7'4 5 1 .49
98.f>81 637 . 71 98 . 71 95 . 2� 98.ci3 56.�9 5 5 .33
99 . 925 6 1 6 . 95 98 . 25 1 a 1 . 59 98 . 5 2 5 7 . 99 56 . 7'5
96 . 7t.a 627. 79 99 . 09 93 . 25 98 . 76 57. �6 5 7 . 5 7
c::1 c:;1 c:;1 (7.1 C7.l
oa . zs 60.52 3a . 71 78 . f>2
o o . �2 � . o2 a a . :-8 s a . s.:.
61 • .36 6 1 . 93 n . zo ao . �6
61 ..:>4 62 . 6 1 n. 33 79 . 75
5 2 . f> 1 62. 5 1 30 . 74 79 . 6 8
f>3 .3a 62.32 35 . 26 3 1 . 09
5 9 .53 60 . 7� 31 . J 6 so. ! 1.
oO . n 62. 28 3 2 . : o 3 2 . :.3
62. � .:>4 . 50 79 . 3 7 31 . 73
� . � � - � � - � � . 30
59 . 1 4 6o . as n . 34 �- 1s � . ?2 f>3.g 73 . H � . g 60 . 5 5 :> 1 .36 � . .:>9 � . 72 62. 31. 62 .39 77 . 57 sa . 2 1
62 . 97 65 . 1 0 78.�9 ?9 . 76
1 a . 3a
1 1 . 3 8
1Z . 3 5
� 1 . {,.9
1 1 .37
1 2 . Jt.
: a . 30
1 3 . J7
: 3' . 3i 1 1 . .39
1 1 . 27
1 2 . 71
1 3 .. 27
1 3 .36
1 4 . 93
1 0 . ;>7
1 1 . 5 0
i 2 .3�
1 1 . 64
� L 5 5
1 2 . 2�
1 0 . 38
1 3 . 24
1 3 . �9 1 Z . J3
1 1 . �2
1 2 . 34
13 . • s !3 . f>a
1 5 . J7
Note: Full forms of the abbreviations are provided in the following page.

Abbrev i a t i ons used in Append i x 7 . 8 • a
N = Tr i a l N o ;
Control = C nc l udes tr i a l s � i thout incorpo ra t i on o f denatured �hey pro t e i n ,
des i gnated as 1 , 0 i nd i cates ' o thers ' ;
0WP Level of incorpo ra t i on of heat denatured �hey pro t e i n
0 i s none ( con tro l ) , · 1 i s t. . Sg/lcg , 1 i s 9.0 g;lc g ;
?F� ?ro t e i n to " a t rat i o of m i l lc : 0 is contro l , · 1 i s fat not adjusted in
prooo r t i on to added Dena tured Whey P ro t e i n (DWP ) ,
1 i s f a t adjus ted i n proport i on eo added DWP ;
Type of homogen i sa t i on : 0 is contro l , 1 i s s l urry conta t n t ng OWP no t
homogen i sed , 2 i s s l u r ry conta i n ing DWP homogeni sed sepa r a te{y, 3 i s
s l u r ry � i th OWP homogen i s ed i n comb i na t i on � i th manufactured cream;
MQTY = Quant i ty o f m i l lc ; �TOT_FAT = Total fat i n m i l lc ;
MTOT_TS = T o t a l T S i n mi l k ; �TOT_PTN = To ta l pro t e i n i n mi l k ;
MTOT_CA = Tota l ea i n m i l k ; WCTY = Quan t i ty o f �hey;
·�TOT_FAT = Tota l fat i n �hey; wTOT_Ts = Tota l T S in �hey;
\JTOT_?TN = T o t a l pro t e i n in whey; \JTOT_CA = Tota l c a l c i um in whe y ;
caTY = Quan t i ty o f cheese; CTOT_FAT = Tot a l fat i n cheese;
CTOT_TS = T o t a l TS i n cheese ; CTOT_PTN = Tota l pro t e i n in cheese ;
CTOT_CA = T o t a l c a l c i um i n cheese ; SQTY = Quan t i ty o f starter ;
SiOT_FAT = Tota l f a t in s t a r t e r ; STOT_TS = Tota l TS in start e r ;
STOT_PTN = T o t a l protein i n s t a r t e r ; STOT_CA = Tota l ca l c i um i n s t a r t e r ;
RQTY = Quan t i ty o f renne t ; HL_QTY = Hand l i ng l oss of ma t eri a l expressed in terms of quant i ty ;
HL_PRCNT = Hand l i ng l oss of ma t er i a l a s a percentage of mi l k used ;
Y_TS = Y i e l d of cheese expressed in terms of recovery of tota l s o l i d s ;
3 04
Y_HLFM = Y i e ld of cheese ( constant mo i s ture of 50%) expressed i n terms of percentage of �e i gh t of m i l k ;
FAT_SAL = F a t ba l ance; CA_SAL = Ca l c i um ba l ance ; TS_SAL = Tot a l s o l i ds ba l anc e ;
.\iST_aAL = Mo i s tu r e ba l ance ;
FR_M = Recovery of f a t in cheese expressed as a percentage of f a t in m i l k and starter;
FR_C\1 = R ecovery of f a t i n cheese expressed as a percentage o f f a t i n cheese and �hey;
CAR_M = Recovery of ca l c i um i n cheese expressed as a percentage o f ca l c i um in m i l k and starter ;
CAR _C'.J = Recovery of ca l c i um i n cheese expressed as a percentage of ca l c i um in cheese and �hey;
TSR_M = R ecovery of tota l so l ids i n cheese expressed as a percen t a g e of tota l s o l i ds in m i l k and star�er;
TSR_C� = �ecovery of tota l s o l ids i n cheese expressed as a percentage of total so l i d s i n ch eese and �ehy;
?TNR_M = Recovery o f pro t e i n in cheese expressed as a percentage of prote i n i n m i l lc and s t a r t e r ;
PTNR_C� = Recovery of pro t e i n i n cheese expressed as a percentage of pro t e i n i n c h e e s e and �hey;
MSTR_� = � ecovery of mo i s ture i n cheese expressed as a percen t a g e o f mo i s ture i n m i l lc , starter and renne t ;
MST�_C� = Recovery o f mo i s ture i n cheese expressed a s a percent age of mo i sture i n cheese and �hey .

3 0 5
Appendix 7.8 continued
(b) An example of mass balance calculation : mass balance of protein in trial no 2
Quantity of protein in milk
= Quantity of milk X (% protein / 100)
= 36.415 X 3.879 I 100 = 1 .4 125 kg
Quantity of protein in starter
= Quantity of starter X (% protein / 100)
= 0.770 X 3 .7897 I lOO = 0.0292 kg
Quantity of protein in whey
= Quantity of whey X (% protein / 100)
= 29.880 X 0.9379 I 100 = 0.2802 kg
Quantity of protein in cheese
= Quantity of cheese X (% protein / 100)
= 6.837 X 16.9708 I lOO = 1 . 1603 kg
Protein balance (%) = 100 (Output of protein/Input of protein)
= [(Protein in cheese + protein in whey) 100 /
(protein in milk + protein in starter)]
= (1 .1603 + 0.2802) 100 1 (1 .4125 + o.o292)
= 99.916 %
Protein recovery on the basis of input (%)
= [(Protein recovered in cheese X 100) /
(protein in milk + protein in starter)]
= (1 .1603 X 100) I (1 .4125 + 0.0292) = 80.48 %
Protein recovery on the basis of output (%)
= [(Total protein recovered in cheese X 100) /
(protein in cheese + protein in whey)]
= ( 1 . 1603 X 100) I (1 . 1603 + 0.2802) = 80.55 %

3 0 6
Appendix 7.8 continued
(c) Effect of process treatments on the mass balance of selected milk
constituents for each trial
Fat balance : Trial no 15 had the greatest loss of fat followed by trials 13 and 8.
Other trials did not have much variation. In trial 15 increased fat level could be
one of the causes for increased fat loss. This is because in other trials involving
manufacture of cheese with higher fat level, there is also a lower fat recovery,
though of a smaller magnitude. However, the common variable in trials 15, 13 &
8 was the 'type of homogenisation', i.e. homogenisation of manufactured cream in
combination with the added heat-denatured whey protein. This might have caused
the increased fat loss. It will be observed in the following Chapter (Chapter 8) that
a greater amount of whey protein is firmly adsorbed to the fat globules when fat
is homogenised in the presence of whey protein. It appears that this leads to
coating of the fat globules with a water soluble protein and consequently failure of
fat globules to be firmly embedded in the casein matrix, causing the increased fat
loss through whey.
Calcium balance: The end-point (colour change) obtained during complexometric titration (method for estimation of calcium) is not very stable. This reduces the
accuracy of the analytical method. The accuracy of the test-method has been reported to be ± 3.0 mM/kg cheese (Creamer et al., 1985). Considering this
variability, it was not surprising that some of the values were outside the limits.
Overall, the calcium balance was interpreted as reasonable.
Protein balance: Increased loss of protein in trials 12, 4, 14 were noted . In all
these trials the heat-denatured whey protein were incorporated without
homogenisation. This is likely to have caused the increased loss. The increased
levels of denatured whey protein and fat in these trials could also have added to
the protein loss. Trial 3 also had an increased loss of protein and this may have been due to the increased amount of denatured whey protein incorporated. All other values of protein balance are reasonable.
TS balance: Increased loss of total solids in trials 12 & 15 may be related to the
increased losses of protein and fat contents, respectively (already described).
Moisture balance: The data on moisture balance, ranged between 98.18 to 99.21%,
appears very reasonable. As all the values are less than 100, it implies that errors
mostly in terms of only losses have occurred. However, it is more likely that loss
of moisture due to evaporation has had an over-riding effect on most other factors.
Conclusion: The overall mass balance was satisfactory and supports the findings,
particularly with respect to the cheese yield.

307
Appendix 7.8 continued
(d) Justification for the variations in the mass balances of milk components (i) Approximate estimates of loss or gain of weight of milk components due to
experimental errors
Details of possible variation in weight of milk components due to some of the experimental errors
Sources of error Varia- E ffect on individual tion components
Variations due to weighing scale :
- Weighing of FFMR - Weighing o f slurry - Weighing of milk
( Can+milk) 5+2 0 - Weighing of cheese
in weight ( g )
± 5 ± 5
± 2 5
Hoop & cheese ( 5+5 ) ± 1 0 - Weight of whey
Can & whey ( 5+2 0 ) ± 2 5
Loss o f material - Handl ing losses 1 ( - ) - Fines2 ( - )
Variat ion in compos i-t ion of starter ( ± )
Variation due to analyses4 - Milk ( ± )
- Cheese
- Whey
Total Variation5 ( + ) ( - )
Total quanti ty6
Variation , %
Note
( + ) ( - )
( ± )
( ± )
Fat ( g )
5 . 0
1 . 2 13
2 . 5 0
0 . 0 1 5
3 . 3 9 5 5 . 0
TS ( g )
5 . 0 0 . 7 5
3 . 5
5 . 0
1 . 5 8 5
9 . 8 1 0 . 0
1 9 . 2 5
Protein ( g )
0 . 6 0 0
0 . 9 12
1 . 6 4 6
0 . 2 5 5
2 . 52 0 3 . 2 9 2
0 . 67 0
ca2+ (mM)
0 . 8 7 5
1 . 1 6 6
0 . 4 8 5
2 . 4 5 2 . 3 3
0 . 674
3 . 8 5 14 . 7 0 4 . 2 4 3 1 2 . 9 5 ( 0 . 0 11 % ) ( 0 . 0 4 2 % ) ( 0 . 0 0 2 % ) ( 0 . 3 7 % ) 6 . 3 19 12 . 0 0 6 1 0 . 8 8 4 6 . 3 2
( 0 . 1% ) ( 0 . 1 9 % ) ( 0 . 0 2 7 % ) ( 1 . 0% ) 5 . 8 6 . 67 1 1 . 8 4 1 1 0 . 7 3
( 0 . 0 2 % ) ( 0 . 0 2 3 % ) ( 0 . 0 02 4 % ) ( 0 . 3 7 % )
2 4 . 6 9 7 68 . 4 6 1 3 1 . 0 5 1 3 3 . 2 0 0 -3 3 . 0 9 2 -8 8 . 2 6 1 - 3 6 . 8 6 3 - 3 7 . 9 8
1 7 0 0 . 0 4 9 6 0 . 0 1 2 8 8 . 0 1 3 3 4 . 0
1 . 4 5 1 . 9 5
1 . 3 8 1 . 7 8
2 . 4 1 2 . 8 0
2 . 4 9 2 . 8 5
- Details for moisture have not been calculated as it was expected to be inversely related to the TS . - Details of footnotes are provided in the following page .

308
1 The handling losses have been considered to be 70 g milk-equivalent. This
estimate was calculated by assuming certain values as provided in the following
break-up.
- sticking to sides of can
- sticking to sides of knife
- sticking to sides of vat and other parts
15 g
S g
50 g
- evaporation at manufacture and overnight draining (could lead to slight
concentration of milk/whey)
2 One source of loss of unaccounted fines was through whey. The composition of
whey did not show these because whey was filtered prior to analysis. The other
form of loss as fines occurred while turning the hoops. For calculation purposes
it is taken as equivalent to 15 g cheese, though these could be much more
depending on the quantity and method of incorporation of denatured whey protein.
3 Starters were not analysed on a regular basis for the composition. The possible
variation has been taken as ± 2.5% of the SNP content.
4 Theses values are computed from standard deviations of analytical data compiled
(over 1 year) in Chemistry Lab of NZDRI.
5 Some of the assumptions made in arriving at these values are provided below.
The actual values were always close to these figures.
FFMR S lurry Milk Whey Cheese Starter
Quantity ( kg )
1 . 7 0 0
3 5 . 0 0 0 2 8 . 9 6 5
6 . 3 19 0 . 77 0
Fat ( % )
10 0 . 0 1 5 . 0
4 . 8 5 0 . 06
2 5 . 0
TS ( % )
1 00 . 0 1 1 . 9 9 14 . 0
6 . 3 4 5 0 . 0
9 . 7 5
Protein ( % )
3 . 64 1 . 0 2
1 6 . 4 6 3 . 8 3
ca2+ (mM/ kg )
3 5 . 0 1 9 . 4
1 16 . 5 3 6 . 0
6 Values obtained from trial no . 1 involving control cheese .

309
Appendix 7.8.d continued .. . .
(ii) Variations observed in the trials: Actual variations in the trials are about twice
(Section 'a') of that estimated above. This may be attributed to some of the
following sources of experimental error which could not be quantified but
influenced the variability.
Variability in sampling: The accuracy of analytical results depends on the sample
being representative. This, in turn, depends on homogeneity of the entire product.
In this instance the cheesemilks were not very homogeneous because the
incorporated heat-denatured whey proteins tended to sediment rapidly. This made
initial sampling difficult. This difficulty was further experienced in redrawing
another sample during analysis.
Loss of fines: Actual loss of fines are expected to be much more than the figures
mentioned earlier. Increased losses were noticed in trials where fat level was
adjusted in proportion to the added denatured whey proteins.
Block to block variation in cheese: A sample of cheese was drawn from only one
block because the other blocks had to be used for storage studies. Thus,
experimental error due to block to block variation could not be eliminated.
Quantity of milk: The operational losses are high when a small quantity of milk is
handled.
(iii) Conclusion: It was concluded that the observed variations in mass balance
values of the components of milk were within reasonable limits.

3 10
Appendix 7.9 Comparison of theoretical estimates of ratio of 6-lactoglobulin
to para-K-casein (approximate estimates) with the observed
ratios in cheeses incorporated with denatured whey protein
Proportion of whey protein retained in control cheese
Approximate values of protein composition in milk (Walstra & Jenness, 1 984):
as-casein = 38.6%
B-casein = 28.4%
K-casein = 10. 1%
B-lactoglobulin = 9.8%
a-lactalbumin = 3.7%
Protein in 1 kg milk (3.75% protein) = 37.5g
B-lactoglobulin in 1 kg milk = (37.5 X 0.098) = 3.68 g
K-casein in 1 kg milk = (37.5 X 0.101) = 3 .79 g
Para-K-casein in 1 kg milk = 3 .79 (105 I 169)1 = 2.35 g
Observed ratio of B-lactoglobulin to para-K-casein (from densitometer plots of
SDS-PAGE) in control cheese = 0.45
To have this ratio, amount of B-lactoglobulin that needs to be retained in cheese
from 1 kg of milk (assuming that all of para-K-casein from milk is retained in
cheese) = 0.45 X 2.35 = 1 .06 g
Thus, percentage of B-lactoglobulin retained in cheese = (1 .06 1 3.68) 100 = 28.8%
Assuming that B-lactoglobulin in cheese i s proportionate of the whey protein, the
theoretical value of B-lactoglobulin retained in cheese = 28.8%
Total moisture retained in Feta cheese as a percentage of moisture in cheesemilk
� 12%
At least 12% of the native whey protein is expected to be retained with the
moisture in cheese. In addition to this, whey protein that is in a denatured state
1 Para-K-casein constitutes 105 of the 169 amino acid residues in K-casein.

3 11
would also be retained. Therefore, a figure of 28.8% of the original whey protein
being retained in cheese appears reasonable.
Proportion of whey protein retained in cheese incorporated with heat-denatured
whey protein
Assuming that the theoretical values calculated above were correct, the quantity of
13-lactoglobulin in control cheese may be considered equal to 1 .06 g, and the
amount of para-K-casein in control cheese equal to 2.35 g per kg of milk.
Amount of denatured whey protein incorporated per kg cheesemilk = 4.5 g
Amount of 13-lactoglobulin in 4.5 g whey protein (using the earlier quoted
percentages) = [4.5 (9.8113.5)] = 3.27g
Percentage of added whey protein recovered in cheese (from mass balance data)
:;::; 80%
Quantity of 13-lactoglobulin that may be expected to have been recovered in cheese
= 3.27 (80 I lOO) = 2.616 g
Total amount of 13-lactoglobulin in cheese
= 1 .06 + 2.616 = 3.676 g
Theoretical ratio of 13-lactoglobulin to para-K-casein
= 3.676 1 2.35 = 1 .564
Observed ratio of 13-lactoglobulin to para-K-casein ( 1.58) is thus close to the
theoretically calculated value.
Similarly, when 9.0 g (DM basis) denatured whey protein was incorporated per kg
cheesemilk, the calculated value for the ratio of 13-lactoglobulin to para-K-casein
was found to be 2.68 which is again not very far from the observed value of 2.83.
Conclusion: It is concluded that (a) most of the added 13-lactoglobulin, in the form
of denatured whey protein, was present in cheese, and (b) there was no indication
of decrease in the 13-lactoglobulin in cheese after six months of storage.

3 12
Appendix 8 . 1 Effect of homogenisation and source o f milk sol ids on the mean scores of sensory parameters of eight week old Feta cheeses
S ource of Acidity variation - - - - - - - - -
LSM F
Saltiness oxidised Bitterness
LSM F LSM F LSM F
Replicates 6 . 0 2 . 3 5 1 . 0 5 o . o 1 2 . 8 3 . 2 1 . 5 1 . 5 2 2 . 7 2 . 9 1 . 7 1 . 5
Treatments 2 2 . 6 7 * * 1 . 54 4 . 7 0 6 . 4 0 * A (control ) 3 . 2 2 . 8 2 . 2 1 . 7 B 2 . 6 ** 3 . 0 1 . 3 * 1 . 3 * c 2 . 5 ** * 2 . 9 1 . 6 1 . 3 * D 2 . 8 * * 3 . 5 1 . 5 * 1 . 6 E 2 . 8 ** 3 . 2 1 . 5 * 1 . 5
S . D . 0 . 08 0 . 2 9 0 . 2 2 0 . 1
C . V . ( % ) 2 . 8 3 9 . 4 1 3 . 5 6 6 . 7 6 - - - - - - - - - - - - - - - - - - - - - - - - - - - - - - - - - - - - - - - - - - - - - - - - - - - - - - - - - - - -
Source of variation
Repl icates 1 2
Treatments A ( control ) B c D E
S . D .
C . V . ( % )
Structure
LSM F
6 . 9 2 3 . 0 2 . 7
1 . 4 9 3 . 0 2 . 8 2 . 9 3 . 1 2 . 8
0 . 18
6 . 2 4
Mouthfeel
LSM F
2 . 4 2 3 . 3 3 . 2
3 . 3 6 3 . 1 3 . 0 3 . 6 3 . 5 3 . 2
0 . 18
5 . 6 3
Overal l acceptabi l ity
LSM
3 . 0 3 . 0
3 . 4 2 . 5 3 . 2 3 . 2 2 . 8
0 . 3 0
10 . 1
F
0 . 0
3 . 2 7
A = Milk made from manufactured cream & reconstituted skim milk; B = Milk made from homogenised fresh cream & reconstituted skim milk; C = Milk made from fresh cream (unhomogenised) & skim milk; D = Milk made from manufactured cream and skim milk; E = Milk made from homogenised fresh cream and skim milk; F = F ratio; LSM = Least-square mean; S.D. = Standard deviation of raw data; C. V. = Coefficient of variation; * = p < 0.05, * * = p < 0.01, * * * = p < 0.001 ; F values without asterisks are 'not significant' ; Individual LSM values marked with asterisks show their significant variation in comparison to control.

3 13
Appendix 8 . 2 Composition of cheesemilks with respect to the experimental variations
Sou:ce.of Fat ( % ) Protein ( % ) Lactose ( % )
var1at1on ----------- --------- -- ----------LSM F LSM F LSM F
Repl icates 4 . 07 3 . 3 9 1 . 5 3 1 4 . 3 8 3 . 2 5 4 . 89 2 4 . 52 3 . 4 2 4 . 9 6
Treatments 1 . 4 7 0 . 8 4 3 . 17 A ( control ) 4 . 3 7 3 . 2 9 4 . 9 3 B 4 . 5 1 3 . 3 5 5 . 0 8 c 4 . 5 0 3 . 3 0 4 . 8 8 D 4 . 3 3 3 . 2 3 4 . 78 E 4 . 54 3 . 3 4 4 . 9 6
S . D . 0 . 11 0 . 08 0 . 0 8 7
c . v . ( % ) 2 . 5 0 2 . 2 9 1 . 7 7
SNF ( % )
LSM F
1 . 5 5 8 . 8 5 9 . 2 0
0 . 2 0 8 . 9 2 9 . 13 8 . 8 8 9 . 2 1 8 . 9 9
0 . 4 4 1
4 . 8 9 - - - - - - --- - - - - - - - - - - - - - - - - - - -- - --- - -------- - - - - - - - - - - - - - - - - - -
Source of ca2+ variation (mM/kg )
FGS ( J-Lm )
Ca2+/SNF ( g/ 1 0 0g )
P/F ratio ( % )
LSM F LSM F LSM F LSM F
Repl icates 11 . 8 6 * 2 8 . 9 * * 2 . 4 3 0 . 3 1 1 3 2 . 8 1 . 4 1 1 . 4 9 0 . 74 4 2 3 5 . 0 1 . 6 5 1 . 5 3 0 . 7 3 9
Treatments 2 . 97 9 3 0 . 9 * * * 3 . 5 1 1 . 04 A ( control ) 3 5 . 1 0 . 8 8 1 . 5 8 0 . 7 5 B 3 5 . 3 0 . 8 8 1 . 5 5 0 . 7 4 c 3 2 . 9 4 . 2 9 * * * 1 . 4 9 0 . 7 3 D 3 2 . 6 0 . 92 1 . 4 2 0 . 7 5 E 3 3 . 7 0 . 6 6 * 1 . 5 0 0 . 7 3
S . D . 1 . 0 4 0 . 07 0 . 04 7 0 . 0 1 1
C . V . ( % ) 3 . 0 6 4 . 69 3 . 08 1 . 5 2
A = Milk made from manufactured cream & reconstituted skim milk; B = Milk made from homogenised fresh cream & reconstituted skim milk; C = Milk made from fresh cream (unhomogenised) & skim milk; D = Milk made from manufactured cream and skim milk; E = Milk made from homogenised fresh cream and skim milk; F = F ratio; LSM = Least-square mean; S.D. = Standard deviation of raw data; C. V. = Coefficient of variation * = p < 0.05, * * = p < 0.01, * * * = p < 0.001; F values without asterisks are 'not significant'; Individual LSM values marked with asterisks show their significant variation in comparison to control.

3 14
App endix 8 . 3 Effect of homogenisation and source of milk sol ids on the compos ition of whey
Source of Fat ( % ) variation - - - - - - - - -
LSM F
Protein ( % ) Lactose ( % ) SNF ( % )
LSM F LSM F LSM F
Rep l icates 0 . 0 4 0 . 6 2 5 . 2 0 1 . 3 0 1 0 . 19 0 . 7 6 4 . 8 1 6 . 2 6 2 0 . 19 0 . 7 7 4 . 9 5 6 . 3 7
Treatments 1 1 . 0 6 * 3 . 3 9 1 . 3 1 A ( control ) 0 . 15 0 . 7 3 4 . 8 4 6 . 2 7 B 0 . 17 0 . 7 4 4 . 9 9 6 . 2 7 c 0 . 3 3 * * 0 . 7 9 4 . 8 6 6 . 3 5 D 0 . 14 0 . 7 8 4 . 7 8 6 . 2 6 E 0 . 17 0 . 7 9 4 . 9 4 6 . 4 4
S . D . 0 . 0 3 2 0 . 02 4 0 . 103
c . v . ( % ) 17 . 18 3 . 17 2 . 1 0 3 2 . 3 7
0 . 5 2
0 . 14 9
- - - - - - - - - - - - - - - - - - - - - - - - - - - - - - - - - - - - - - - - - - - - - - - - - - - - - - - - - - - -
Source of variation
Repl icates 1 2
Treatments A ( control ) B c D E
S . D .
c . v . ( % )
ca2+ (mM/kg )
LSM F
19 . 5 2 3 . 0
19 . 6 2 1 . 2 2 1 . 9 2 0 . 7 2 3 . 2
2 . 2 8
10 . 6 9
5 . 8 4
0 . 69
A = Milk made from manufactured cream & reconstituted skim milk; B = Milk made from homogenised fresh cream & reconstituted skim milk; C = Milk made from fresh cream (unhomogenised) & skim milk; D = Milk made from manufactured cream and skim milk; E = Milk made from homogenised fresh cream and skim milk; F = F ratio; LSM = Least-square mean; S.D. = Standard deviation of raw data; C.V. = Coefficient of variation; * = p < 0.05, * * = p < 0.01 , * * * = p < 0.001; F values without asterisks are 'not significant' ; Individual LSM values marked with asterisks show their significant variation in comparison to control.

3 1 5
App endix 8 . 4 Effect of homogenisation and source of milk solids on the composition of Feta cheese (before brining )
Source of variation
Repl icates 1 2
Treatments A ( control ) B c D E
S . D .
C . V . ( % )
Moisture ( % )
LSM F
0 . 3 6 5 3 . 4 8 5 3 . 16
17 . 2 7 * * 5 5 . 2 3 5 5 . 47 4 9 . 1 6 * * 5 3 . 2 6 5 3 . 4 8
0 . 8 6 1
1 . 6 2
pH ca2+ (mM/kg )
LSM F LSM F
0 . 04 2 . 0 6 4 . 74 104 . 3 4 . 7 3 113 . 1
2 . 15 0 . 4 4 4 . 7 5 112 . 3 4 . 7 4 104 . 9 4 . 7 3 113 . 5 4 . 77 103 . 1 4 . 7 3 109 . 8
0 . 0 1 6 9 . 7 1
0 . 3 4 8 . 9 4 - - - - - - - - - - - - - - - - - - - - - - - - - - - - - - - - - - - - - - - - - - - - - - - - - - -
Appendix 8 . 5 Effect of homogenisation and source of milk sol ids on the composition of Feta cheese ( a fter brining )
Source of variation
Moisture ( % )
LSM F
pH
LSM
ca2+ (mM/kg )
F LSM F - - - - - - - - - - - - - - - - - - - - - - - - - - - - - - - - - - - - - - - - - - - - - - - - - - - - - -
Replicates 0 . 08 6 . 05 0 . 0 6 1 4 9 . 9 4 . 6 6 1 0 3 . 6 2 4 9 . 5 4 . 7 3 104 . 6
Treatments 16 . 11* 0 . 2 5 1 . 5 9 A ( control ) 5 2 . 1 4 . 67 1 0 5 . 8 B 5 1 . 7 4 . 7 0 9 7 . 8 c 4 4 . 9 * * 4 . 69 111 . 1 D 5 0 . 0 4 . 7 2 1 08 . 3 E 4 9 . 9 4 . 7 1 9 7 . 7
S . D . 0 . 9 6 0 . 04 2 6 . 87
c . v . ( % ) 1 . 9 3 0 . 8 9 6 . 60 - - - - - - - - - - - - - - - - - - - - - - - - - - - - - - - - - - - - - - - - - - - - - - - - - - - - - - -
A = Milk made from manufactured cream & reconstituted skim milk; B = Milk made from homogenised fresh cream & reconstituted skim milk; C = Milk made from fresh cream ( unhomogenised) & skim milk; D = Milk made from manufactured cream and skim milk; E = Milk made from homogenised fresh cream and skim milk; F = F ratio; LSM = Least-square mean; S.D. = Standard deviation of raw data; C.V. = Coefficient of variation; * = p < 0.05, * * = p < 0.01, * * * = p < 0.00 1 ; F values without asterisks are 'not significant' ; Individual LSM values marked with asterisks show their significant variation in comparison to control.

3 1 6
App endix 8 . 6 Effect of homogenisation and source o f milk sol ids on the composition of Feta cheese at three weeks
Source o f Fat ( % ) Protein ( % ) variation ----------- --- - - - - ----
LSM F LSM F
Moisture ( % )
LSM F
pH
LSM F
Repl icates 13 . 2 7 0 . 3 1 0 . 2 2 2 . 6 7 1 2 6 . 9 * 17 . 0 2 2 7 . 9 17 . 1
4 8 . 6 2 4 . 7 0 4 8 . 8 5 4 . 6 6
Treatments 5 8 . 9 1 * * * 2 8 . 4 2 * * 2 7 . 7 8 * * 0 . 4 7 A ( control ) 2 4 . 5 16 . 0 5 5 1 . 6 6 4 . 67 B 2 5 . 7 16 . 3 0 5 0 . 8 9 4 . 7 1 c 3 0 . 6 * * * 18 . 8 5 * * * 4 4 . 2 0 * * * 4 . 67 D 2 8 . 0 ** 16 . 9 7 * 4 8 . 5 5 * 4 . 7 0 E 2 8 . 5 * * * 16 . 9 4 * 4 8 . 3 8 * 4 . 67
S . D . 0 . 4 4 0 . 2 9 1 0 . 7 8 2 0 . 03 5
C . V . ( % ) 1 . 62 1 . 7 1 1 . 6 0 0 . 7 4
Source of NaCl ( % ) variation - - - - - - - - - -
LSM F
S/M ( % ) FDM ( % ) MNFS ( % )
Replicates 1 4 . 19 2 3 . 8 8
2 . 8 2
LSM F
3 . 0 0 8 . 6 8 . 0
LSM F
2 6 . 7 * * 5 2 . 3 5 4 . 5
LSM F
6 6 . 5 67 . 7
6 . 05
Treatments 0 . 5 3 2 . 0 1 1 5 . 9 * 12 . 4 9 * A ( control ) 3 . 8 3 7 . 4 5 0 . 6 68 . 4 B 4 . 2 2 8 . 3 5 2 . 2 68 . 5 c 4 . 0 1 9 . 1 5 4 . 7 * * 6 3 . 6 * * D 4 . 14 8 . 5 5 4 . 3 ** 67 . 4 E 3 . 9 9 8 . 2 5 5 . 1* * 67 . 6
S . D . 0 . 2 8 8 0 . 59 0 . 6 8 0 . 7 9
C . V . ( % ) 7 . 14 7 . 07 1 . 2 8 1 . 18
A = Milk made from manufactured cream & reconstituted skim milk; B = Milk made from homogenised fresh cream & reconstituted skim milk; C = Milk made from fresh cream (unhomogenised) & skim milk; D = Milk made from manufactured cream and skim milk; E = Milk made from homogenised fresh cream and skim milk; F = F ratio; LSM = Least-square mean; S .D . = Standard deviation of raw data; C. V. = Coefficient of variation; * = p < 0.05, * * = p < 0.01, * * * = p < 0.00 1 ; F values without asterisks are 'not significant' ; Individual LSM values marked with asterisks show their significant variation m comparison to control.
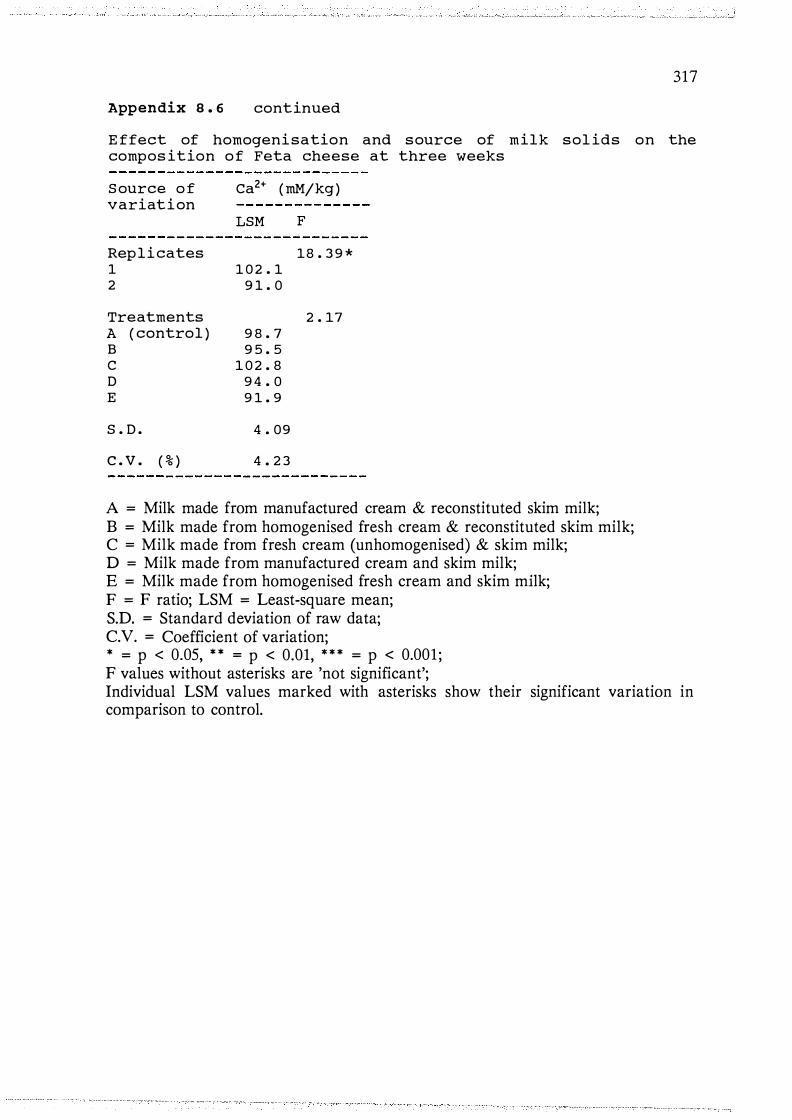
317
Appendix 8 . 6 continued
E ffect of homogenisation and source of milk sol ids on the compos ition of Feta cheese at three weeks
Source o f variation
Replicates 1 2
Treatments A ( control ) B c D E
S . D .
c . v . ( % )
ca2+ (mM/kg)
LSM F
18 . 3 9 * 1 0 2 . 1
9 1 . 0
2 . 17 9 8 . 7 9 5 . 5
1 0 2 . 8 9 4 . 0 9 1 . 9
4 . 09
4 . 2 3
A = Milk made from manufactured cream & reconstituted skim milk; B = Milk made from homogenised fresh cream & reconstituted skim milk; C = Milk made from fresh cream (unhomogenised) & skim milk; D = Milk made from manufactured cream and skim milk; E = Milk made from homogenised fresh cream and skim milk; F = F ratio; LSM = Least-square mean; S.D. = Standard deviation of raw data; C. V. = Coefficient of variation; * = p < 0.05, * * = p < 0.01, * * * = p < 0.001 ; F values without asterisks are 'not significant'; Individual LSM values marked with asterisks show their significant variation in comparison to control.

318
Appendix 8 . 7 Effect of homogenisation and source of milk sol ids on the composition of exudate from three weeks old Feta cheese
Source of NaCl ( % ) variation - - - - - - - - -
LSM F
Replicates 10 . 3 * 1 7 . 4 9 2 6 . 8 9
Treatments 2 . 0 3 A ( control ) 6 . 68 B 7 . 2 4 c 7 . 44 D 7 . 3 5 E 7 . 2 6
S . D . 0 . 2 9 8
C . V . ( % ) 4 . 14
TS ( % )
LSM F
3 . 8 4 * 1 5 . 10 14 . 8 2
4 . 03 14 . 60 1 5 . 3 9 1 5 . 2 0 14 . 74 14 . 8 8
0 . 2 3 1
1 . 5 4
S/M ( % )
LSM F
1 0 . 1* 8 . 8 8 . 1
2 . 04 7 . 8 8 . 6 8 . 8 8 . 6 8 . 5
0 . 3 7
4 . 3
Protei n 1 ( % )
LSM F
1 6 . 11* 2 . 4 6 3 . 02
1 . 5 6 2 . 77 2 . 7 3 2 . 63 3 . 04 2 . 52
0 . 2 2
8 . 02 - - - - - - - - - - - - - - - - - - - - - - - - - - - - - - - - - - - - - - - - - - - - - - - - - - - - - - - - - - - -
Source of variat ion
Repl icates 1 2
Treatments A ( control ) B c D E
S . D .
c . v . ( % )
ca2+ (mM/kg )
LSM F
147 . 7 1 5 1 . 7
1 3 5 . 1 1 5 0 . 8 1 6 1 . 2 * 1 5 5 . 8 * 1 4 5 . 5
6 . 8 6
4 . 58
0 . 8 6
4 . 2 7
1 For convenience the total nitrogen in exudate is multiplied by the factor 6.38 to represent the protein content. This however includes proteins, peptides and amino acids.
A = Milk made from manufactured cream & reconstituted skim milk; B = Milk made from homogenised fresh cream & reconstituted skim milk; C = Milk made from fresh cream (unhomogenised) & skim milk; D = Milk made from manufactured cream and skim milk; E = Milk made from homogenised fresh cream and skim milk; F = F ratio; LSM = Least-square mean; S.D. = Standard deviation of raw data; C.V. = Coefficient of variation; * = p < 0.05, * * = p < 0.01, * * * = p < 0.001, F values without asterisks are 'not significant'; Individual LSM values marked with asterisks show their significant variation in comparison to control.

3 19
Appendix 8 . 8 Calculations for preparation o f chees emi lk
Amount of cheesemilk to be taken in the vat =
Less sample to be drawn =
Net amount of cheesemilk taken in vat =
Less FFMR present =
Reconstituted skim milk in cheesemilk =
Less SMP =
Water in milk =
Less water to be added with cream =
Water to be added to make concentrated
reconstituted skim milk (RSM) =
Note
3 5 . 2 5 kg
0 . 2 5 kg
3 5 . 0 0 kg
1 . 8 0 kg
3 3 . 4 5 kg
3 . 52 kg
2 9 . 9 3 kg
5 . 4 0 kg
2 4 . 53 kg
Concentrated RSM was prepared by blending 3 . 5 2 kg SMP in
2 4 . 5 3 kg water .
1 . 8 kg of FFMR was used for preparation o f each batch of
manufactured cream . Aqueous solutions o f emulsifying agents
were prepared by dissolving calculated amounts of emul s i f ier
in 5 . 4 kg water at 6 0 ° C . A temporary emulsion of the mixture
of the emulsifying agent , FFMR and water was created by
mixing in the ultra-turrax homogeniser . This mixture of
temporary emuls ion was further homogenised to obtain
manufactured cream . The manufactured cream was then added
to calculated amounts of concentrated RSM to obtain
cheesemilk .
In case of lecithin , it was dissolved in FFMR at 6 0 ° C . To
this 5 . 4 kg of water was added . This was then blended by the
ultra-turrax homogeniser .
While using SMP as the emulsifying agent , 4 . 5 3 0 kg
concentrated RSM was made up to 5 . 4 kg (diluted to the
desired concentration) with water , mixed with FFMR and
homogenised . 4 . 53 kg water was added to the ' manufactured
cream ' and the rest of the total weight of cheesemilk was
made up by adding concentrated RSM .

3 2 0
Appendix 8 . 9
( a ) Effect o f use of emulsifying agents o n the mass balance of fat during cheesemaking
S ource Weight of Weight of Weight o f o f milk ( kg ) whey ( kg ) cheese ( kg ) variation ----- - ---- - - ------- -- ---------------
LSM LSM F LSM F
Replicate 1 . 12ns 0 . 9 9ns 1 3 5 . 0 5 3 2 8 . 4 3 9 6 . 9 1 5 2 3 5 . 0 5 3 2 8 . 5 8 8 6 . 77 4
Emuls i fying agent 9 . 8 5 * 8 . 1 5 * SMP ( control ) 3 5 . 0 0 0 2 8 . 4 3 8 6 . 89 0 Sodium caseinate 3 5 . 0 3 9 2 8 . 2 8 8 6 . 97 5 Sodium caseinate
& lecithin 3 5 . 0 4 4 2 8 . 2 3 5 7 . 0 6 3 Lecithin 3 5 . 108 2 8 . 9 5 7 6 . 58 6 Tween-6 0 3 5 . 0 3 6 2 9 . 3 2 8 * 6 . 0 3 7 * WPC powder 3 5 . 0 9 0 2 7 . 8 3 5 7 . 5 1 6
S . D . 0 . 2 4 3 0 . 2 4 6
( b ) Effect o f use o f emulsifying agents on the fat recovery based on input (milk) or output ( cheese & whey)
S ource of variation
Fat balance ( % )
LSM F
Fat recovery on input ( % )
LSM F
Fat recovery on output ( % )
LSM F
Replicate 1
0 . 0 7ns 9 3 . 1 9 4 . 1
0 . 3 5ns 4 . 3 9ns
2 9 9 . 6
1 0 0 . 0
Emuls i fying agent SMP ( control ) 9 6 . 8 Sodium caseinate
9 8 . 1 Sodium caseinate
& lecithin 9 9 . 6 Lecithin 1 0 1 . 8 Tween-6 0 1 0 1 . 2 WPC powder 1 0 1 . 4
S . D . 2 . 9 6
0 . 9 4ns 9 6 . 2
9 6 . 7
2 7 . 8 * *
9 8 . 2 1 00 . 5
7 3 . 2 * * * 9 6 . 8
2 . 7 1
F = F ratio ; L . S . M . = Least square mean ;
9 3 . 6 9 4 . 1
1 9 8 1 * * * 9 9 . 4
9 8 . 6
9 8 . 6 9 8 . 7 7 2 . 4 ** * 9 5 . 5 * * *
0 . 3 4
S . D . = Standard deviation of raw data ; ns = not s igni ficant ; * = p � 0 . 05 ; * * = � 0 . 0 1 ; * * * = � 0 . 0 0 1 ; L . S . M . values of individual emulsifying agents marked with asterisks show their s igni ficant variation in comparison to control .

3 2 1
Appendix 8 . 10 Effect o f use o f emulsifying agents on the mean sensory scores of eight week old Feta cheese
S ource o f variation
Acidity
LSM F
Saltiness Bitterness
LSM F LSM F
Oxidised
LSM F --------------------------------- ----------------------------Repl icate 4 . 2 4 ns 1 . 0 3 ns 2 . 3 5ns 1.4ns
1 2 . 6 3 . 4 1 . 6 1 . 2 2 2 . 7 3 . 3 1 . 4 1 . 3
Emulsify ing agent 2 . 5 3ns 1 . 5 0ns 0 . 8 8ns 13 . 3 * SMP ( control )
2 . 6 3 . 7 1 . 6 1 . 1 Sodium caseinate
2 . 6 3 . 2 1 . 3 1 . 1 Sodium caseinate & lecithin
2 . 7 3 . 1 1 . 4 1 . 1 Lecithin1 Tween-6 0 2 . 8 3 . 4 1 . 5 1 . 6 * * WPC powder 2 . 5 3 . 2 1 . 6 1 . 1
S . D . 0 . 09 0 . 2 8 0 . 2 1 0 . 08
Source o f variation
Mouth feel Structure Overal l acceptab i l ity
LSM F LSM F LSM F
Repl icate 2 . 2 9ns 0 . 7 2ns 1 . 19ns 1 3 . 2 2 . 8 3 . 0 2 3 . 0 2 . 7 2 . 9
Emulsify ing agent 7 . 4 5 * 4 . 2 1ns 4 2 . 3 3 * * SMP ( control ) 3 . 1 2 . 6 2 . 8 Sodium
caseinate 3 . 0 2 . 7 2 . 5 Sodium caseinate
& lecithin 2 . 8 2 . 5 2 . 4 * Lecithin1 2 . 4 * 2 . 5 Tween-6 0 4 . 0* 3 . 4 * 3 . 7 * * WPC powder 3 . 0 2 . 7 3 . 1
S . D . 0 . 2 7 0 . 2 4 0 . 12
1 Cheese made using lecithin was not evaluated for flavour characteristics and overal l acceptab i l ity .
F = F ratio ; L . S . M . = Least square mean � S . D . = Standard deviation of raw data ; * = p � 0 . 05 ; * * = � 0 . 01 ; * * * = � 0 . 00 1 ; ns = not s ignificant ; L . S . M . values o f individual emuls i fying agents marked with asterisks show their s ignificant variation in comparison to control .

Appendix 8 . 11 Composition of cheesemilks for cheeses made with different emuls ifying agents
Source of variation
Fat ( % ) Protein ( % ) Lactose ( % ) SNF ( % ) Calcium (mM/kg )
LSM F LSM F
Repl icate 0 . 6 4 ns 16 . 0 3 * 1 4 . 94 3 . 8 2 2 4 . 98 3 . 9 0
Emulsifying 1 . 4 2 24 . 4 1 agent ns * *
SMP (control ) 4 . 84 3 . 7 8
Sodium caseinate 4 . 94 * * 3 . 9 2
Sodium caseinate & lecithin 4 . 96 3 . 9 3 * *
Lecithin 5 . 05 3 . 7 2 Tween-60 5 . 00 3 . 7 9 \�PC powder 4 . 9 5 4 . 0 4 * * *
S . D . 0 . 08 3 0 . 0 3 4
LSM F LSM F
1 . 5 2ns 5 . 8ns 5 . 51 9 . 74 5 . 56 9 . 87
0 . 7 5 3 . 9 ns ns
5 . 5 1 9 . 69
5 . 54 9 . 8 7
5 . 55 9 . 8 8 5 . 4 9 9 . 6 3 5 . 61 9 . 8 0 5 . 5 3 9 . 97 *
0 . 066 0 . 09 1
LSM
3 8 . 9 3 7 . 9
3 7 . 5
3 7 . 6
3 7 . 7 3 9 . 6 * 3 9 . 1 3 8 . 8
0 . 67
F
6 . 4 9 ns
3 . 5 1 ns
F = F ratio ; L . S . M . = Least square mean ; S . D . = Standard deviation of raw data ; * = p � 0 . 05 ; ** = � 0 . 0 1 ; * * * � 0 . 00 1 ; ns = not significant ; L . S . M . values of individual emulsifying agents marked with asterisks show their significant variation in comparison to control .
V) �

App endix 8 . 12 Effect o f emul sifying compos ition of whey
agents on
S ource o f variation
Repl icate 1 2
Emuls i fying agent
SMP ( control ) S odium caseinate S odium caseinate
& lecithin Lecithin Tween- 6 0 WPC powder
S . D .
S ource o f Variation
Repl icate 1 2
Emulsifying agent SMP ( contro l ) S odium caseinate S odium caseinate
& lecithin Lecithin Tween- 6 0 WPC powder
S . D .
Fat ( % ) Protein ( % ) Lactose ( % )
LSM F LSM
3 . 14ns 0 . 3 9 0 . 9 2 0 . 3 6 0 . 9 5
9 5 6 . 2 * * *
0 . 0 4 0 . 8 8 0 . 0 9 0 . 9 2 *
F
1 6 . 8 7 * *
4 2 . 7 5 * * *
LSM F
2 . 9 9ns 5 . 0 9 5 . 1 6
2 . 7 6 ns
5 . 04 5 . 17
0 . 09 0 . 9 5 * * 5 . 2 7 * 0 . 0 8 0 . 9 1 1 . 6 7 * * * 0 . 9 1 0 . 2 9 * * * 1 . 0 5 * * *
0 . 0 2 9 0 . 0 1 2
SNF ( % )
LSM F
10 . 8 6 * 6 . 6 2 6 . 7 4
7 . 0 1* 6 . 5 2 6 . 6 6
6 . 7 7 * * 6 . 5 9 6 . 7 2 * 6 . 8 3 * *
0 . 0 6 2
5 . 0 7 5 . 0 8 5 . 15
0 . 07 1
Calcium (mM/kg)
LSM F
0 . 6 2 ns 2 5 . 1 2 4 . 0
0 . 9 6ns 2 2 . 0 2 4 . 1
2 4 . 8 2 4 . 7 2 4 . 4 2 7 . 4
2 . 4 9
F = F ratio ; L . S . M . = Least square mean ; S . D . = Standard deviation of raw data ;
3 2 3
the
* = p � 0 . 05 ; * * = � 0 . 0 1 ; * * * � 0 . 0 0 1 ; ns = not s ignificant ; L . S . M . values o f individual emulsifying agents marked with asterisks show their significant variation in comparison to contro l .

3 2 4
Appendix 8 . 13 E ffect o f emulsifying agents on the composition of cheese ( before brining)
Source o f variation
Fat ( % ) Moisture ( % )
LSM F LSM F
Repl icate 1 . 6 1ns 0 . 7ns 1 2 3 . 3 5 5 6 . 9 2 2 4 . 17 5 6 . 0
Emulsifying agent 6 . 13 * 2 . 2 3 ns
SMP ( control ) 2 3 . 6 5
Sodium caseinate 2 4 . 0
Sodium caseinate & lecithin 2 4 . 15
Lecithin 2 7 . 0 5 * Tween-6 0 WPC powder
S . D .
Source of variation
Repl icate 1 2
2 1 . 2 5 2 2 . 4 5
1 . 1 1 6
Emulsifying agent SMP ( control ) Sodium caseinate Sodium caseinate
& lecithin Lecithin Tween-6 0 WPC powder
S . D .
5 7 . 3
57 . 1
5 6 . 1 5 2 . 9 57 . 0 5 8 . 6
1 . 8 2 5
pH
LSM F
4 . 79 4 . 7 6
4 . 79 4 . 7 6
4 . 7 8 4 . 7 8 4 . 77 4 . 7 7
0 . 03 9
2 . 15ns
0 . 1 5ns
FDM ( % ) MNFS ( % )
LSM F LSM F
3 . 0 4ns 0 . 2ns 5 4 . 1 7 4 . 2 5 4 . 9 7 3 . 9
2 6 . 3 * * 1 . 9ns
5 5 . 4 7 5 . 1
5 5 . 9 7 5 . 1
5 4 . 9 7 3 . 9 5 7 . 4 7 2 . 5 4 9 . 4 * * * 7 2 . 3 5 4 . 1 7 5 . 5
0 . 7 6 1 . 3 9
Calcium (mMolesjkg )
LSM F
1 0 6 . 5 1 0 9 . 0
1 06 . 2 1 06 . 4
107 . 7 1 07 . 5 118 . 7 1 00 . 3
5 . 7 0
0 . 5 8ns
2 . 2ns
F = F ratio ; L . S . M . = Least square mean ; S . D . = Standard deviation o f raw data ; * = p � 0 . 0 5 ; * * = � 0 . 0 1 ; * * * � 0 . 0 0 1 ; ns = not s igni ficant ; L . S . M . values o f individual emulsifying agents marked with asterisks show their signi ficant variat ion in compari son to control .

3 2 5
App endix 8 . 1 4 Effect of emul sifying agents on composition of exudate from four week old Feta cheese
Source o f variation
Repl i cates 1 2
Emulsifying agent
SMP ( control ) Sodium caseinate Sodium caseinate
& lecithin Lec ithin Tween- 6 0 WPC powder
S . D .
Source o f variation
Repl icate 1 2
Emulsifying agent
SMP ( control ) Sodium caseinate Sodium caseinate
& lecithin Lecithin Tween- 6 0 WPC powder
S . D .
Ca lcium (mMolesjKg ) LSM F
7 . 3 7 * 119 . 9 109 . 3
2 . 17ns
1 2 6 . 8 11 1 . 2
113 . 4 118 . 8 108 . 5 * 108 . 9 *
6 . 7 8
NaCl ( % ) LSM F
1 . 16ns 10 . 0 3
9 . 7 7
1 . 6 1ns
9 . 9 4 9 . 6 2
9 . 5 9 9 . 6 8
10 . 57 10 . 0 1
0 . 4 12
TS ( % ) LSM F
3 . 03 17 . 7 1 17 . 54
8 . 9 8 *
17 . 55 17 . 5 8
17 . 2 7 17 . 6 0 18 . 3 3 * * 17 . 4 4
0 . 17 2
S/M ( % ) LSM F
1 . 2 6ns 12 . 19 11 . 8 5
1 . 8 1ns
12 . 0 6 11 . 67
1 1 . 5 9 11 . 7 5 12 . 9 4 12 . 11
0 . 5 2 3
ca2+/TS ( g/ 1 0 0g ) LSM F
4 . 5ns 2 . 7 1 2 . 5 0
2 . 09ns
2 . 8 9 2 . 54
2 . 63 2 . 7 1 2 . 3 7 * 2 . 50
0 . 17 7
Protein 1 ( % ) LSM F
1. 65ns 2 . 0 3 2 . 3 0
l .OSns
1 . 9 7 2 . 18
2 . 2 3 2 . 7 2 1 . 8 7 2 . 03
0 . 4 0 4
1 For convenience the total nitrogen i n exudate i s multip l ied by the factor 6 . 3 8 to represent the protein content . This however includes proteins , peptides and amino acids .
F = F ratio ; L . S . M . = Least square mean ; S . D . = Standard deviation of raw data ; * = p � 0 . 0 5 ; * * = � 0 . 0 1 ; ns = not signi ficant ; L . S . M . values of individual emulsifying agents marked with asterisks show their significant variation in comparison to control .

Immunoglobulin - .
as2-casem "-.__ a,ccasein� //=
B-casem �� K-casein //1
£-lactoglobulin
Para-x-casein
a-lactalbumin
.....-.. ....... 0 .... .... � 0 u '-" � ....... ...... s s ...... � Cfl
� ·-.r::: ...... ·o <1) � 1-< <1) <!) <1) '0 ...... ...... ro C\$ � � � 0 ...... "Q) 0.. <!) Ul Vl
� ro ' C\$ ........ u u "§ s s s ;::l ;::::1
;a ;a · -� 0 0 {/) Cfl {/)
326
EmulsifYing agents
,....-J-
1-< .....-.. <1) '0 '0 .... � ro .... 0 '0 <!) 0... � '"0 ro � � ..... 0 - en 0 .,..., � '-" \0 0.. 8 I :a !=:: 1::: u 8 ..... "Q) <1) ·u <1) � ·- en
� � � ro Cfl u
Appendix 8.15 Proteins adsorbed to surface of fat globules in Feta cheeses made
using different emulsifYing agents (SDS-PAGE). Skim milk and
standard casein have been used in the gel for identification of the
protein bands in the experimental cheeses.

3 2 7
Appendix 8 . 1 6
Calculations to determine the distance between the fat
globules in Feta cheese
Assumption : All the fat globules are spheres of same s i z e and
are equidistant from each other .
Let the s i z e of the block of cheese be = 1 0 0 X 1 0 0 X 5 0 mm
Volume of the block of cheese = 5 X 1 05 mm3 = 5 X 10 14 J..Lm3
Let the fat fraction in cheese = 2 7 % (vlv)
Volume of milkfat in the block of cheese = 5 X 1 0 14 X o . 2 7 J..Lm3
Let the diameter of the fat globule = 1 J..Lm (Radius = 0 . 5 J..Lm )
Volume of one fat globule =
( 4 X 2 2 X 0 . 5 X 0 . 5 X 0 . 5 ) I ( 3 X 7 ) = 0 . 5 2 3 8 j..Lm3
Total no . of fat globules in the cheese =
( 5 X 1 0 1 4 X 0 . 2 7 ) I 0 . 52 3 8
Assuming that all the fat globules are spherical and
equidistant from each other , the cheese can be subdivided
into cubes equal to the number of fat globules .
Volume o f each such cube in the cheese
= ( 5 X 10 14 ) I [ ( 5 X 1 0 14 X 0 . 2 7 ) I 0 . 5 2 3 8 ]
= 1 . 94 j..Lm3
Each s ide of the cube = 1 . 2 4 7 J..Lm
Distance between two fat globules = 1 . 2 4 7 - 1 = 0 . 2 4 7 J..Lm
Calculations by the above method show that when the diameter
of each fat globule is 5 J..LID the distance between two fat
globules is 1 . 2 3 6 J..Lm .

3 2 8
Appendix 9 . 1 Composition o f milk for cheeses made with varying amounts of rennet
Variables & l evels
Fat ( % ) Protein ( % ) Lactose ( % ) SNF ( % )
LSM F LSM F LSM F LSM F - - - - - - - - - - - - - - - - - - - - - - - - - - - - - - - - - - - - - - - - - - - - - - - - - - - - - - - - - - -
Repl icates 1 2
Quantity o f rennet
Low Control High
S . D .
Variables & levels
0 . 19 0 . 8 9 4 . 53 3 . 3 5 5 . 0 5 4 . 4 1 3 . 3 0 4 . 9 7
0 . 4 2 0 . 7 8 4 . 4 9 3 . 3 7 5 . 09 4 . 3 7 3 . 2 9 4 . 9 3 4 . 4 4 3 . 3 2 5 . 02
0 . 13 1 0 . 0 6 5 0 . 1 6 0
Ca2+ (mM/kg ) FGSa ( JJ.m )
LSM F LSM F
0 . 3 7 0 . 4 9 9 . 09 8 . 97
0 . 5 3 0 . 62 9 . 16 8 . 9 2 9 . 0 2
0 . 2 1 6
P/F ratio
LSM F - - - - - - - - - - - - - - - - - - - - - - - - - - - - - - - - - - - - - - - - - - - - - - - - - - - - - - - - - - -
Repl icates 0 . 05 3 3 . 08 * 1 3 6 . 4 0 . 8 13 0 . 7 5 2 2 3 5 . 9 0 . 9 2 8 0 . 7 4 8
Quantity o f rennet 0 . 3 2 0 . 4 7
Low 3 6 . 4 0 . 8 6 3 0 . 7 5 0 Control 3 5 . 1 0 . 8 8 5 0 . 7 5 3 High 3 7 . 0 0 . 8 6 6 0 . 7 4 7
S . D . 2 . 3 7 3 0 . 0 2 4 0 . 0 0 8
a Fat globule s i z e expressed a s mean diameter ;
LSM = Least-square mean ; F = F ratio ; * p < 0 . 05 ;
0 . 2 9
0 . 3 0
F values without asterisks denote ' not s igni ficant ' ; S . D . = Standard deviation of raw data .

3 2 9
Appendix 9 . 2 Compos ition of whey as affected by the variation in the amount of rennet used
Variables & levels
Fat ( % )
LSM F
Protein ( % )
LSM F
Lactose ( % ) SNF ( % )
LSM F LSM F -------------- -- -- - --- - --- - --- -- -- -- ---- -- - ---- --- - ---- -- - - -Replicates
1 2
Quantity of rennet
Low Control High
S . D .
Variables & levels
Replicates 1 2
Quantity of rennet
Low Control High
S . D .
0 . 13 0 . 14
0 . 14 0 . 15 0 . 13
0 . 0 2 5
0 . 4 3 0 . 7 4 0 . 7 1
0 . 19 0 . 7 3 0 . 7 3 0 . 7 2
0 . 0 3 2
ca2+ (mM/Kg )
LSM F
1 . 0 5
0 . 11
4 . 7 2 1·9 . 9 2 0 . 7
4 . 7 5 2 0 . 8 1 9 . 6 2 0 . 7
0 . 4 3 2
LSM = Least-square mean ; F = F ratio ;
4 . 9 4 4 . 8 8
4 . 9 9 4 . 8 4 4 . 9 1
0 . 16 6
S . D . = Standard deviation o f raw data ; * p < 0 . 0 5 ; * * p < 0 . 0 1 ;
0 . 2 2 6 . 2 9 6 . 19
0 . 3 8 6 . 2 7 6 . 2 7 6 . 19 *
0 . 0 1 1
F values without asterisks denote ' not s igni ficant ' .
1J2.0**
32.14*

3 3 0
Appendix 9 . 3 Composition of Feta cheese (before brining ) as affected by the variation in the amount of rennet used during cheesemaking
Variables & levels
Moisture ( % ) pH
LSM F LSM
ca2+ (mM/ kg )
F LSM F --------------------------- - ---- -- -------------------- -- - --Repl icates 0 . 0 1
1 5 5 . 59 2 5 5 . 4 8
Quantity of rennet 0 . 19
Low 5 5 . 8 9 Control 5 5 . 2 4 High 5 5 . 4 8
S . D . 1 . 0 7 1
LSM = Least-square mean ; F = F ratio ;
0 . 4 3 4 . 7 4 4 . 7 5
1 . 2 9 4 . 7 3 4 . 7 5 4 . 7 6
0 . 0 19
S . D . = Standard deviation of raw data ;
0 . 8 3 1 1 2 . 9 1 10 . 4
0 . 2 5 11 0 . 3 1 1 2 . 3 112 . 3
3 . 3 6
F values without asterisks denote ' not s ignificant ' .
Appendix 9 . 4 Composition of Feta cheese ( a fter brining ) as affected by the variation in the amount of rennet used during cheesemaking
Variables & levels
Moisture ( % ) a pHa
LSM F
Repl icates 1 . 6 1 1 5 2 . 14 2 5 2 . 2
Quantity of rennet 1 2 7 . 9
Low 53 . 1 Control 5 1 . 8 High 5 1 . 6
S . D . 0 . 09 5
a Raw data had missing values .
LSM = Least-square mean ; F = F ratio ;
LSM
4 . 7 1 4 . 7 1
4 . 7 0 4 . 7 1 4 . 7 2
3 . 8 2
F
0 . 4 0
1 . 9 0
S . D . = Standard deviation o f raw data ;
ca2+ (mM/ kg )
LSM F
2 . 9 2 1 0 1 . 3 1 0 3 . 3
0 . 1 1 9 8 . 4
1 05 . 8 1 0 2 . 9
6 . 3 5
F values without asterisks denote ' not s ignificant ' .

3 3 1
Appendix 9 . 5 Composition of Feta cheese (three weeks old ) as affected by the variation in the amount o f rennet used during cheesemaking
Variables & levels
Fat ( % )
LSM F
Protein ( % )
LSM F
Moisture ( % ) pH
LSM F LSM F - ------- - ---- - - ----- - - -- - - - - - - - - - - - - - - - - - --- - -- - - - - - - - - - -- -
Rep licates 0 . 2 6 3 . 8 6 8 . 65 16 . 89# 1 2 5 . 63 16 . 16 5 0 . 74 4 . 7 2 2 2 5 . 3 7 15 . 97 5 1 . 9 6 4 . 63
Quantity o f rennet 4 . 53 2 0 . 6 2 * 4 . 5 6 2 . 5 1
Low 2 5 . 7 1 5 . 69 5 1 . 9 1 4 . 7 1 Control 2 4 . 5 1 6 . 0 5 # 5 1 . 6 6 4 . 67 High 2 6 . 4 1 6 . 4 6 # 5 0 . 4 9 4 . 65
S . D . 0 . 64 0 . 119 0 . 50 4 0 . 02 5
----- - --- - -- - -- - - ---- - ---- - - - - - - ---- - -- - - ------- - --- - ---- - -
Variables NaCl ( % ) S/M ( % ) FDM ( % ) MNFS ( % ) & levels -- - - ---- - -- - - - - - - - --- - - - - - - - - -- ----- - - - ---
LSM F LSM F LSM F LSM F --- --- -- - - - - - - ---- - - -- - - --- - - -- - - --- - - -- - - -- - - --- - -- - ------Repl icates
1 2
Quantity o f rennet
Low Control High
S . D .
Variables & levels
Repl icates 1 2
Quantity of rennet
Low Control High
S . D .
4 . 19 3 . 9 0
4 . 3 2 3 . 8 3 3 . 9 9
0 . 2 7 7
1 . 7 2 8 . 2 6 7 . 5 0
1 . 5 9 8 . 3 1 7 . 4 3 7 . 9 1
0 . 59 7
ca2+ (mM/kg )
LSM F
8 . 9 4 9 9 . 0 9 5 . 2
2 . 3 8 9 5 . 4 9 8 . 7 9 7 . 3
1 . 54
2 . 4 5 5 2 . 03 5 2 . 8 0
1 . 10 5 3 . 4 5 5 0 . 6 0 5 3 . 2 1
1 . 4 8
LSM = Least-square mean ; F = F ratio ; S . D . = standard deviation of raw data ; # = p < 0 . 10 ; * = < 0 . 05 ;
0 . 3 9 6 8 . 2 69 . 6
2 . 2 6 6 9 . 9 68 . 4 6 8 . 5
0 . 9 6
F values without asterisks denote ' not s igni ficant ' ;
3 . 0 5
1 . 4 4
LSM values marked with asterisks show their s igni ficant variation in comparison to contro l .

3 3 2
Appendix 9 . 6 Composition of exudate from Feta cheese ( three weeks old) as affected by the variation in the amount of rennet used during cheesemaking
Variables & levels
NaCl ( % )
LSM F
TS ( % )
LSM
S/M ( % ) Protein a ( % )
F LSM F LSM F --------- ----------------- ---- ---- - ---- - ---- ----- -- ------- -Repl icates
1 2
Quantity of rennet
Low Control High
S . D .
Variables & levels
Repl icates 1 2
Quantity of rennet
Low control High
S . D .
7 . 2 7 6 . 6 6
7 . 2 8 6 . 68 6 . 9 4
0 . 4 3 5
2 . 8 9 1 5 . 16 14 . 6 0
0 . 9 7 14 . 5 3 14 . 6 0 15 . 5 3
0 . 5 1 5
ca2+ (mM/Kg )
LSM F
1 3 6 . 2 13 7 . 0
0 . 59
1 5 . 19 1 3 3 . 9 1 3 5 . 1 1 4 0 . 8
1 . 3 3
1 . 7 8 2 . 8 9 0 . 8 6 8 . 57 2 . 7 1 7 . 8 0 2 . 8 2
2 . 3 4 0 . 8 1 67 . 94* 8 . 5 2 2 . 04 7 . 8 2 2 . 6 1 8 . 2 2 3 . 65 *
0 . 5 5 0 . 14
a It includes whey proteins , peptides and amino acids . These values have been obtained by multiplying the total nitrogen content in exudate by a factor 6 . 3 8 ;
LSM = Least-square mean ; F = F ratio ; S . D . = Standard deviation of raw data ; * p < 0 . 0 5 ; F values without asterisks denote • not s igni ficant • ; LSM values marked with asterisks show thei r signi ficant variation in comparison to control .

3 3 3
Appendix 9 . 7 E ffect of variation in the quantity of rennet used in cheesemaking on the sensory parameters of eight week old cheese
Variables & levels
Acidity
LSM F
Saltiness
LSM F
oxidised Bitterness
LSM F LSM F --------- - - - - - - -- - - - - - - - - - - - - - - ---- -- - - - - - - - - - - -- - - - - - - -- - -Replicates 12 . 0 3 . 69 0 . 08 0 . 57
1 3 . 0 3 . 2 1 . 7 1 . 7 2 2 . 8 2 . 8 1 . 8 1 . 6
Quantity of rennet 2 1 . 0 * 1 . 5 6 2 . 7 1 1 . 0
Low 2 . 9 3 . 1 1 . 6 1 . 5 Control 3 . 2 2 . 8 2 . 2 1 . 7 High 2 . 7 * 3 . 3 1 . 6 1 . 8
S . D . 0 . 07 0 . 2 5 0 . 2 9 0 . 2 2
Variables & levels
Structure Mouthfeel Overal l acceptabi l ity
Repl icates 1 2
Quantity of rennet
Low Control High
S . D .
LSM F
1 . 0 3 . 2 3 . 1
4 . 0 3 . 2 3 . 0 3 . 2
0 . 08
LSM F
3 . 0 3 . 4 3 . 2
4 . 0 3 . 5 3 . 1 3 . 3
0 . 14
LSM = Least-square mean ; F = F ratio ; S . D . = Standard deviation of raw data ; * p < 0 . 0 5 ;
LSM F
3 . 57 3 . 3 3 . 1
9 . 57 3 . 0 3 . 4 3 . 3
0 . 11
F values without asterisks denote ' not s ignificant ' ; LSM values marked with asterisks show their signi ficant variation in comparison to control .

Appendix 9 . 8
Variables
Replicates
Low rennet I
( 8mlj 1 0 0Kg ) II
Control I
( 16ml / 100Kg ) II
High rennet I
( 3 2ml/ 10 0Kg ) II
Approximate estimates for mass balance of rennet used in manufacture of Feta
cheeses with variations in the quantity of rennet
Rennet activity Total rennet1 Rennet Rennet Rennet Rennet
(RU/kg) activity (RU) activity activity activity activity - - - - - - - - - - - - - - - - - - - - - - - - - - - - - - - - - recovered added to recovered recovered
Cheese Whey Cheese Whey in cheese milk in cheese in cheese
( 7 kg) ( 3 3 kg) & whey (RU) (RU ) & whey ( % ) ( % ) 2
3 . 08 3 . 02 2 1 . 5 6 9 9 . 6 6 12 1 . 2 2 1 8 8 . 8 64 . 2 1 1 . 4 2
4 . 4 8 2 . 9 7 3 1 . 3 6 9 8 . 01 1 2 9 . 3 7 188 . 8 6 8 . 5 1 6 . 6 1
6 . 4 9 6 . 2 8 4 5 . 4 3 2 07 . 2 4 2 52 . 67 3 7 7 . 6 6 6 . 9 12 . 03
8 . 2 9 5 . 59 5 8 . 03 184 . 47 2 4 2 . 5 3 7 7 . 6 64 . 2 1 5 . 3 7
17 . 04 12 . 3 3 1 19 . 28 4 0 6 . 8 9 5 2 6 . 17 7 55 . 2 6 9 . 7 1 5 . 7 9
18 . 51 11 . 9 8 1 2 9 . 57 3 9 5 . 3 4 5 2 4 . 9 1 7 5 5 . 2 6 9 . 5 17 . 16
1 It i s assumed that each trial yielded 7 kg cheese and 3 3 kg whey from a batch of 4 0 kg milk .
2 This is to be multiplied by a correction factor ( it is about 1 . 2 5 for Cheddar chees e ) for the
absolute values .
w w ..j:::..

I •
•
•
-•
• •
•
I
• •
..
•
• •
•
I • •
• •
•
•
... .. ... • •
•
--- �- � �-- --
• • :.. •
•
. .. .
•
· .
• • • . ..
• .. •
•
• _, . . . . . . ... . . � .. .._. -=--. _.. ... . ..... -.... �-. . 1 - -
• . .. . .. .
•
I . ..
•
, -
• • • •
-. � ... . . - .. . . . ... . .
I • _. • • •
• ..
• . ... - •
-:.1. � - · · . 1 ......
.
) .
...2r: _. ..
. .. .: · .. ..... .. . . ........ .
.. -• •
•
•
:. -: ... ..... - �
· •
.I �i" •
• . • I . . ' J
I 1 -._ .:-_.
.. . .. .-.. •
•
•
•
._ -•
•
._
• -. ..
. .. •
• •
• - .. I •
.. I
.. ..
•
• •
• • •
- � · . f;- . -. - --�-
- ... .. ........ .... ...
. --:. • -: 1 : :
•
. . r
.
I
•
.r -.. _
• •
I • • •
• • • • • I
-:-ij : .,� I .. ... .. . l • .r
---:..... .- • •
. - - .. � � r:� • .. 1 · . l l · lr
I • •
BIBLIOGRAPHY
• •
... I ---r:Ar
. .. • •
• ..
. .. • I •
. ..• . . -
• • •
.. .
I •
-• -
• I •
•
•
·
. .. .
I 4
- �
. - . J - . •
•
•
•
I
• • • -
· . .. .
• •
• •
• I _.
• •
• •
.... - � ·
..- I • r
-•
•
• •
• •
I
...
• • •
• •
•
I
•
p N · ? .......... ' . .. .. . ...
•
•
•
• . I I
• •
• •
• • •
•
• -
. -•
•
• -
I
•
•
T •
•
1 -.-. - . I • •
• • I
• -I
•
•
...
•
• • •
335
BIBLIOGRAPHY
Abd El-Salam, M.H. (1987) . Domiati and Feta type cheeses. p.277-310. In Cheese: C!zemist1y,
Physics and Microbiology, Vol-2. Edited by P.F. Fox. Elsevier Applied Science, London, New York.
Abd El-Salam, M.H., El-Shibiny, S., Ahmed, N.S. and Ismail, AA. (1981). The use of ultrafiltration in manufacture of Domiati cheese from Buffalo's milk. Egyptian Joumal of Dairy Science : 9 (2) 151-158.
Abrahamsen, R.K. (1979). Cheesemaking from milk fortified with ultrafiltered whey protein concentrate. Milchwissenschaft : 34 (2) 65-68.
Ada, J. (1987) . Flavour formation - Feta. p.337. In Cheesemaking: Science and Technology. Edited by A. Eck. 2nd Edition, New York, Lavoisier Publishing, New York.
Aguilera, J.M. and Kessler, H.G. (1988). Physico-chemical and rheological properties of milk fat globules with modified membranes. Mi/chwissenschaft : 43 (7) 411-415.
Alichandidis, E., Anifantakis, E.M., Polychroniadou, A. and Nanou, M. (1984). Suitability of some microbial coagulants for Feta cheese manufacture. Joumal of Dairy Research : 51, 141-147.
Anderson, M., Brooker, B.E., Cawston, T.E. and Cheeseman, G.C. (1977) . Changes during storage in stability and composition of ultra-heat-treated aseptically-packed cream of 18% fat content. Joumal of Dairy Research : 44, 111-123.
Anifantakis, E.M. (1986). Production and utilisation of Ewe's milk. Bulletin of the Intemational Dairy
Federation No. 202, p.131-132.
Anon. (1969a). A new method of using whey proteins in cheesemaking. The Milk Industry : 65 (3) 18-21.
Anon. (1969b ). Feta cheese: now it's made from cow's milk. Dairy & Ice Cream Field : 51 ( 4) 60-66.
Banks, J.M. (1988). Elimination of the development of bitter flavour in Cheddar cheese from milk containing heat-denatured whey protein. Joumal of the Society of Dairy Technology : 41 (2) 37-41.
Banks, J.M and Muir, D.D. (1985) . Effect of incorporation of dent\tUr!(d whey prot&:in QU th!( yi�tld and quality of Cheddar cheese. Joumal of the Society of Dairy Technology : 38 (1) 27-32.
Banks, J.M., Stewart, G., Muir,D.D., West, I.G. (1987) . Increasing the yield of Cheddar cheese by the acidification of milk containing heat-denatured whey protein. Milclzwissenschaft : 42 (4) 212-215.

336
Berg, C. van den and Bruin, S. (1981). Water activity and its estimation in food systems. p.1-61. In Water activity: influence of food quality. Edited by L. Rockland and G. Stewart. Academic Press, New York.
Bergmeyer, H.U. and Mollering, H. (1974). Acetate determination. p.1520-1537. In Methods of
enzymatic analysis, 2nd edition, vol. 3. Edited by H.U. Bergmeyer. Verlag Chemie, Weinheim.
Berlin, E., Kliman, P.G., Anderson, BA. and Pallansch, J. (1973). Water-binding in whey protein concentrates. Joumal of Dairy Science : 56 (8) 984-987.
Best, D. (1990). Preservatives - now you see them, now you don't. Prepared Foods : 159 (9) 113, 114, 116, 118.
Brooker, B.E. (1987). The behaviour of casein micelles m food processing. Dairy Industries
lntemational : 52 (8) 17-20.
Brown, R.J. and Ernstrom, A. (1982) Incorporation of ultrafiltration concentrated whey solids into Cheddar cheese for increased yield. Jouma/ of Dairy Science : 65, 2391-2395.
Caric, M. (1987). Mediterranean cheese varieties: ripened cheese varieties native to the Balkan countries. p.257-276. In Cheese: Chemistry, Physics and Microbiology, Vol-2. Edited by P.F. Fox. Elsevier Applied Science, London.
Carlson, A., Hill, G.C. and Olson, N.F. (1986). The coagulation of milk with immobilized enzymes: a critical review. Enzyme and Microbial Technology : 8, 642-650.
Carswell, D.R. and Hulburt, J.C. (1970) . Method of making Cream cheese. U.S. Patent 3 492 129. Cited in Dairy Science Abstracts : 33, [2253].
Casiraghi, E.M., Peri, C. and Piazza, L. (1987). Effect of calcium eguilibria on the rate of syneresis and on the firmness of curds obtained from milk UF retentates. Milchwissenschaft : 42 ( 4) 232-235.
Cercetare, L. de. (1983). Improvement of milk utilization and product quality in manufacture of fr!fsh cheese from cow's milk by coprecipitation of casein and whey proteins. Institutal de Chimie
Alimentara : 14, 45-50. Cited in Dairy Science Abstracts : 47 [2582].
Covacevich, H. (1981). Recent experiences in pasta-filata cheesemaking by ultrafiltration. p.237-244. Proceedings of the 2nd Biennial Marshal/ Intemational Cheese Conference. Madison, Wisconsin.
Crank, J. (1983). The mathematics of diffusion. 2nd edition. p.266-285. Oxford University Press, London.

337
Creamer, L.K. (1979). Degradation of casein components during cheese maturation. Proceedings
of the fifth International Congress of Food Science and Technology. Edited by Chiba, H., Fujimaki, M., Iwai, K., Mitsuda, H., and Morita, Y. Elsevier Applied Science, New York.
Creamer, L.K. (1991). Electrophoresis applied to proteolysis in cheese. In chemical methods for evaluating proteolysis in cheese during maturation. Bulletin of the International Dairy
Federation (In Press) .
Creamer, L.K., Gilles, J. and Lawrence, R.C. (1988) . Effect of pH on the texture of Cheddar and Colby cheese. New Zealand Journal of Dairy Science and Technology : 23, 23-35.
Creamer, L.K., Lawrence, R.C. and Gilles, J. (1985). Effect of acidification of cheese milk on the resultant Cheddar cheese. New Zealand Journal of Dairy Science and Technology : 20,
185-203.
Creamer, L.K. and Olson, N.F. (1982). Rheological evaluation of matured Cheddar cheese. Journal
of Food Science : 47 (2) 631-636, 646.
Czulak, J., Conochie, J. Sutherland, B.J. and Leeuwen, H.J.M. van (1969). Lactose. lactic acid and mineral equilibria in Cheddar cheese manufacture. Journal of Dairy Research : 36, 93-101.
Dagley, S. (1974). Citrate: UV spectrophotometric determination. p.1562-1569. In Methods of
enzyrnatic analysis, 2nd edition, vol. 3. Edited by H.U. Bergmeyer. Verlag Chemie, Weinheim.
Dahlberg, A.C. (1927). A new method of manufacturing Cream cheese of the Neufchatel type. Journal of Dairy Science : 10, 106-116.
Dalgleish, D.G. and Law, A.J.R. (1988). Sodium caseinates - composition and properties of different preparations. Journal of the Society of Dairy Technology : 41 (1) 1-22.
Dannenberg, F. and Kessler, H.G. (1988). Effect of denaturation of f3-lactoglobulin on texture properties of set-style nonfat yoghurt. 2. Firmness and flow properties. Milchwissenschaft : 43 (11) 700-704.
Darling, D.F. and Butcher, D.W. (1978). Milk fat globule in homogenised cream. Journal of Dairy
Research : 45, 197-208.
Davies, F.L., Shankar, P A., Brooker, B.E. and Hobbs, D.G. (1978). A heat-induced change in the ultrastructure of milk and its effect on gel formation in yoghurt. Journal of Dairy Research : 45, 53-58,
Davis, J. (1980). Cheesemaking without liquid milk. Dairy Industries International : 45 (10) 7-8, 10, 12, 15.
Dickinson, E., Mauffret, A., Rolfe, S.E. and Woskett, C.M. (1989a). Adsorption at interfaces in dairy systems. Journal of the Society of Dairy Technology : 42 (1) 18-22.

338
Dickinson, E., Rolfe, S.E. and Dalgleish, D.G. (1988). Competitive adsorption of o:5rcasein and B-casein in oil-in-water emulsions. Food Hydrocolloids : 2 (5) 397-405.
Dickinson, E., Rolfe, S.E. and Dalgleish, D.G. (1989b). Competitive adsorption in oil-in-water emulsions containing a:-lactalbumin and 13-Iactoglobulin. Food Hydrocolloids : 3 (3) 193-203.
Dijk, H.J.M. van (1982). Syneresis of curd. Doctoral thesis. Landbonwhogeschool (Agricultural
University), Wageningen, Netherlands.
Dijk, H.J.M. van and Walstra, P. (1986) . The syneresis of curd. 2. One-dimensional syneresis of rennet curd in constant conditions. Netherlands Milk and Dairy Journal : 40, 3-30.
Dolby, R.M., McDowall, F.H., McDowell, A.K.R. (1937). Studies on the chemistry of Cheddar cheese making. V. Factors influencing the acidity and mineral content of cheese. Journal
of Dairy Research : 8, 74-85.
Dulley, J.R. (1974). The contribution of rennet and starter enzymes to proteolysis in cheese. The
Australian Journal of Dairy Technology : 29, 65-69.
Efthymiou, C. (1967). Major free fatty acids of Feta cheese. Journal of Dairy Science : 50 (1) 20-24.
Efthymiou, C.C. and Mattick, J.F. (1964). Development of domestic Feta cheese. Journal of Dairy
Science : 47, 593-598.
Eigel, W.N. (1977). Formation of r1-A� r2-A2 and r3-A caseins by in-vitro proteolysis of B-casein A2 with bovine plasmin. International Journal of Biochemistry : 8 (3) 187-192.
Emmons, D.B., Lister, E.E., Beckett, D.C. and Jenkins, K.J. (1980). Quality of protein in milk replacers for young calves. V. Effect of method of dispersing fat on curd formation and whey syneresis. Journal of Dairy Science : 63 (3) 417-425.
Feijter, JA. de, Benjamins, J. and Tamboer, M. (1987). Adsorption displacement of proteins by surfactants in oil-in-water emulsions. Colloids and Surfaces : 27, 243-266.
Forman, L., Pech, Z., Svoboda, K. and Sevcik, Z. (1979) . Method for production of heat-treated Cream cheese. Czechoslovak Patent : 1 88 592. Cited in Dairy Science Abstracts : 43, [1985].
Foss, N. (A/S). (1987). Instruction Manual, Milko-scan 130 series Type 10 900, Hillerod, Denmark.
Fox, P.F. (1987a). Cheese manufacture: chemical, biochemical and physical aspects. Dairy Industries
International : 52 (7) 11-13.
Fox, P.F. (1987b). Significance of salt in cheese ripening. Dairy Industries International : 52 (9) 19-22.
Fox, P.F. (1989). Proteolysis during cheese manufacture and ripening. Journal of Dairy Science : 72
(6) 1379-1400.
339
Fox, P.F. and Walley, B.F. (1971). Influence of sodium chloride on the proteolysis of casein by rennet and by pepsin. Journal of Dairy Research : 38, 165.
Furtado, M.M. and Partridge, JA. (1988). Characterisation of nitrogen fractions during ripening of a soft cheese made from ultrafiltration retentates. Journal of Dairy Science : 71 (11) 2877-2884.
Garrido, T., Acuna, A.M. and Romero, A. (1983). Relationships between whey protein denaturation and levels of reducing protein in milk subjected to different heat treatments. Alimentos : 8
(1) 40-41. Cited in Dairy Science Abstracts : 46, [3148].
Gawehn, K. and Bergmeyer, H.U. (1974). D-(-)- Lactate. p.1492-1493. In Methods of enzymatic
analysis, 2nd edition, vol. 3. Edited by H.U. Bergmeyer. Verlag Chemie, Weinheim.
Georgakis, SA. (1973). Studies on the manufacture of Greek brine cheese "Feta". 1. Relation between the amount of salt used and temperature of salting. Milchwissenschaft : 28 (8) 500-502.
Genvrain, SA. (1968). Extraction of proteins from whey. French Patent 1 536 183. Cited in Dairy Science Abstracts : 31, [2057]
Geurts, T J., Walstra, P. and Mulder, H. (1972). Brine composition and the prevention of the defect 'soft rind' in cheese. Netherlands Milk and Dairy Journal : 26, 168-179.
Geurts, T.J., Walstra, P. and Mulder, H. (1974a). Water binding to milk protein. with particular reference to cheese. Netherlands Milk and Dairy Journal : 28, 46-72 .
•
Geurts, TJ., Walstra, P. and Mulder, H. (1974b). Transport of salt and water during salting of cheese. 1. Analysis of the process involved. Netherlands Milk and Dairy Journal : 28, 102-129.
Geurts, T J., Walstra, P. and Mulder, H. (1980). Transport of salt and water during salting of cheese. 2. Quantities of salt taken up and of moisture lost. Netherlands Milk and Dairy Journal : 34, 229-254.
Gilles, J. (1974). Feta cheese manufactured from skim milk powder and anhydrous fat. XIX International Dairy Congress : lE, 782-783.
Glicksman, M. (1969). Gum Technology in Food Industry. p.23-31. Academic Press, Inc., New York and London.
Green, M.L. (1980). The formation and structure of milk protein gels. Food Chemistry : 6, 41-49.
Green, M.L., Glover, FA., Scurlock, E.M.W., Hatfield, D.S. (1981). Effect of use of milk concentrated by ultrafiltration on the manufacture and ripening of Cheddar cheese. Journal
of Dairy Research : 48, 333-341.

340
Green, M. L., Hobbs, D.G. and Morant, S.V. (1977). The process of milk coagulation by rennet. Biochemical Society Transactions : 5 (5) 1328-1331.
Green, M. L., Hobbs, D.G. and Morant, S.V. (1978a). Intermicellar relationships in rennet-treated
separated milk. I. Preparation of representative electron micrographs. Journal of Dairy
Research : 45, 405-411.
Green, M. L., Hobbs, D.G., Morant, S.V. and Hill, VA. (1978b). Intermicellar relationships in rennet-treated separated milk. II. Process of gel assembly. Journal of Dairy Research : 45, 413-422.
Green, M.L., Marshall, RJ. and Glover, FA. (1983). Influence of homogenisation of concentrated
milks on the structure and properties of rennet curds. Journal of Dairy Research : 50, 341-348.
Grufferty, M.B. and Fox, P.F. (1986). Potassium iodate-induced proteolysis in ultra heat treated milk during storage: the role of B-lactoglobulin and plasmin. Journal of Dairy Research : 53, 601-613.
Guinee, T.P. and Fox, P.F. (1983). Changes in sodium chloride and moisture levels in Romano-type cheese during ripening. Irish Journal of Food Science and Technology : "l (2) 119-128.
Guinee, T.P. and Fox, P.F. (1986a). Transport of sodium chloride and water in Romano cheese slices during brining. Food Chemistry : 19 (1) 49-64.
Guinee, T.P. and Fox, P.F. (1986b). Influence of cheese geometry on the movement of sodium chloride and water during brining. Irish Journal of Food Science and Technology : 10 (2) 73-96.
Guinee, T.P. and Fox, P.F. (1986c). Influence of cheese geometry on the movement of sodium chloride and water during brining. Irish Journal of Food Science and Technology : 10 (2) 97-118.
Guinee, T.P. and Fox, P.F. (1987). Salt in cheese: physical, chemical and biological aspects. p.251-298. In Cheese: Chemistry, Physics and microbiology, Vol. 1. Edited by P.F. Fox. Elsevier Applied Science, London and New York.
Gutmann, I. and Wahlefeld, A.W. (1974). L-( +)-Lactate. Determination with lactate dehydrogenase and NAD. p.1464-1468. In Methods of enzymatic analysis, 2nd edition, vol. 3. Edited by H.U. Bergmeyer. Verlag Chemie, Weinheim.
Hansen, J .P. (1985). A process for making portioned cheese. PCT International Patent Application :
WO 85 00 501. Cited in Dairy Science Abstracts : 48, [2362].
Hansen, K. (1990). Stability and activity of plasmin in UF retentate and cheese. Report - 17Je Danish
Government Research Institute for Dairy Industry No. 276, DK-3400, Hillerod, Denmark. 22 p.

341
Hansen, R. (1977) . Feta cheese production by ultrafiltration. North European Dairy Journal : 43 (9) 304-310.
Hansen, R. (1987). Mozzarella cheese without whey proteins. North European Dairy Journal : 53, 21-23.
Hardy, J. (1987). Water activity and the salting of cheese. In Cheesemaking: Science and Technology.
Chapter 3. p.37-58. Edited by Eck, A. Lavoisier Publishing Inc., New York.
Hardy, J.J. and Steinberg, M.P. (1984) . Interaction between sodium chloride and paracasein as determined by water sorption. Journal of Food Science : 49, 127-131.
Hardy, J. and Weber, F. (1978). Influence of the brine characteristics on the quality of soft cheeses. XX International Dairy Congress, Brief Communications : p.826-827.
Harper, J., Iyer,M., Knighton,D. and Lelievre, J. (1989). Effects of whey proteins on the proteolysis of Cheddar cheese slurries (A model for the maturation of cheeses made from ultrafiltered milk). Journal of Dairy Science : 72, 333-341.
Harwalkar, V.R. and Kalab, M. (1983). Susceptibility of yoghurt to syneresis. Comparison of centrifugation and drainage methods. Milchwissenschaft : 38 (9) 517-522.
Harwalkar, V.R. and Kalab, M. (1986). Relationship between microstructure and susceptibility to syneresis in yoghurt made from reconstituted nonfat dry milk. Food Microstructure : 5, 287-294.
Hermans, p.H. (1963). �. Chapter XII. p.483-651. In Colloid Science, vol. ;l. Reversible systems.
Second reprint. Edited by H. R. Kruyt, Elsevier Publishing company, Inc. New York.
Hermansson, A.M. (1983). Relationships between structure and water binding properties of protein gels. Proceedings of the 6th International Congress of Food Science and Technology : 2,
107-108.
Holdt, P. (1971). Continuous manufacture of double Cream cheese. Milchwissenschaft : 26 (9) 529-532.
Holmes, D.G., Duersch, J.W. and Ernstrom, CA. (1977). Distribution of milk clotting enzymes between curd and whey and their survival during Cheddar cheesemaking. Journal of Dairy
Science : 60 (6) 862-869.
Holt, C. (1985). The size distribution of casein micelles: A review. Food Microstntcture : 4, 1-10.
Honer, C. (1988). Cream cheese processing methods. Cheese Market News (formerly the National D airy News). A Gorman Publication : 7 (51) 6,8.
Hooydonk, A.C.M., Koster, P.G. de, and Boerrigter, IJ. (1987). The renneting properties of heated
milk. Netherlands Milk and Dairy Journal : 41, 3-18.

342
Jameson, G.W. (1987). Manufacture of Cheddar cheese from milk concentrated by ultrafiltration: the development and evaluation of a process. Food Technology in Australia : 39 (12) 560-564.
Jelen, P., Buchheim,W. and Peters, K.H. (1987). Heat stability and use of milk with modified casein: whey protein content in yoghurt and cultured milk products. Milchwissenschaft : 42 (7) 418-421.
Jensen, R.G. and Clark, R.W. (1988). Lipid composition and properties. p.183. In Fundamentals
of Dairy Chemistry. Edited by Noble P. Wong. Third Edition. An AVI Book. Van Nostrand Reinhold Company. New York.
Johnston, D.E. and Murphy, RJ. (1984) . Effects of fat content on properties of rennet-induced milk
gels. Milchwissenschaft : 39 (10) 585-587.
Jong, L. de (1976). Protein breakdown in soft cheese and its relation to consistency. I. Proteolysis and consistency of 'Noordhollandse Meshanger' cheese. Netherlands Milk and Dairy Joumal : 30, 242-253.
Kalab, M., Allan-Wojtas, P. and Phipps-Todd, E. (1983) . Development of micro-structure in set-style nonfat YOI�hurt - A review. Food Microstmcture : 2, 51-56.
Kalab, M., Emmons, D.B. and Sargant, A.G. (1976). Milk gel structure 5. Microstructure of yoghurt as related to the heating of milk. Milchwissenschaft : 31 (7) 402-408.
Kalab, M. and Modler, H.W. (1985). Milk gel structure. XV. Electron microscopy of whey protein-based Cream cheese spread. Milchwissenschaft : 40 (4) 193-196.
Kanamoto, R., Wada, Y., Miyajima, G. and Kito, M. (1981). Phospholipid-phospholipid interaction in soybean oil. Journal of the American Oil Chemists' Society : 58 (12) 1050-1053.
Kebary, K.M.K and Morris, HA. (1990) . Effect of homogenisation of reconstituted nonfat dry milk and butter oil mixtures on curd formation and characteristics. Cultured Dairy Products
Joumal : 25 (1) 12-18.
Kieferle, F. and Seyrer-Reindl, E. (1953). Fat content in the dry matter of cheese. 2. Variations and distribution of the fat in the dry matter. Deutsche Molkerei-Zeitzmg : 74 ( 43) 1467-69. Cited in Dairy Science Abstracts : 16 (2) 154.
Kimber, AM., Brooker, B.E., Hobbs, D.G. and Prentice, J.H. (1974). Electron microscope studies of the development of structure in Cheddar cheese. Journal of Dairy Research : 41, 389-396.
Kinsella, J.E. and Fox, P.F. (1987). Water Sorption by Milk Proteins. Bulletin of the Intemational
Dairy Federation No. 209, p.12-40.
Koning, P J. de, Boer, R. de, Both, P. and Nooy, P.F.C. (1981). Comnarison of proteolysis in a low-fat semi-hard type of cheese manufactured by standard and by ultrafiltration techniques.
Netherlands Milk and Dairy Journal : 35, 35-46.

343
Kononova, E.V., Tabachnikov, V.P., Nebert, V.K. and Krasheninin, P.F. (1973). Effect of homogenization and of whey protein additions on structural and mechanical properties of cheese. Trudy, Vsesoyuznyi Nauchno-issledovatel'skii Institut Maslodel'noi i Syrodel'noi Promyshlennosti : (12) 53-55,83. Cited in Dairy Science Abstracts : 41 [4690].
Kosikowski, F.V. (1974). Cheesemaking by ultrafiltration. Journal of Dairy Science : 57 ( 4) 488-491.
Kosikowski, F. V. (1977). Cheese and Fermented Milk Foods. 2nd edition. Distributed by Edwards Brothers, Inc., Michigan. 711 p.
Krasheninin, P.F., Tabachnikov, V.P., Nebert, V.K. and Kononova, E. V. (1974). Effect of denatured whey proteins on the structure and consistency of cheese. XIX International Dairy Congress : lE, 822.
Kuntz, I.D. (1971). Hydration of macromolecules. Ill. Hydration of polypeptides. Joumal of the
American Chemical Society : 93, 514-516.
Lawrence, R.C. (1989). The use of ultrafiltration technology in cheesemaking. Bulletin of the
International Dairy Federation No 240.
Lawrence, R.C., Creamer, L.K. and Gilles, J. (1987). Texture development during cheese ripening. Journal of Dairy Science : 70, 1748-1760.
Lawrence, R.C. and Gilles, J. (1982). Factors that determine the pH of young Cheddar cheese. New
Zealand Journal of Dairy Science and Technology : 17, 1-14.
Lawrence, R.C. and Gilles, J. (1987). Cheese composition and quality. In Proceedings of the XXII International Dairy Congress : Milk - The vital force, p.111-121. D. Reidel Publishing Company, Holland.
Lawrence, R.C., Gilles, J. and Creamer, L.K. (1983) . The relationship between cheese texture and flavour. New Zealand Journal of Dairy Science and Technology : 18, 175-190.
Lelievre, J. (1977). Rigidity modulus as a factor influencing the syneresis of renneted milk gels. Journal of Dairy Research : 44, 611-614.
Lelievre, J. and Creamer, L.K. (1978). An NMR study of the formation and syneresis of renneted milk gels. Milchwissenschaft : 33 (2) 73-76.
Lelievre, J., Creamer, L.K. and Tate, K.L. (1990a). Inhibition of calf cell and microbial rennet action by whey protein concentrate. Milchwissenschaft : 45 (2) 71-75.
Lelievre, J., Freese, OJ. and Gilles, J. (1983). Prediction of Cheddar cheese yield. New Zealand
Journal of Dairy Science and Technology : 18, 169-172.
Lelievre, J. and Lawrence, R.C. (1988). Manufacture of cheese from milk concentrated by
ultrafiltration. Journal of Dairy Research : 55, 465-478.

344
Lelievre, J., Shaker, R. R. and Taylor, M.W. (1990b ). The role of homogenisation in the manufacture of Halloumi and Mozzarella cheese from recombined milk. Journal of Society of Dairy
Technology : 43 (1) 21-24.
Lin, S.H.C., Leong, S.L., Dewan, R.K., Bloomfield, V A. and Morr, C. V. (1972). Effect of calcium ion on the structure of native bovine casein micelles. Biochemistry: 11 (10) 1818-1821.
Lloyd, G.T. and Ramshaw, E.H. (1979) . Manufacture of Bulgarian-style Feta cheese - A review. The
Australian Journal of Dairy Technology : 34, 180-183.
Long, CA. and Patton, S. (1978). Formation of intracellular fat droplets: interrelation of newly synthesised phosphatidylcholine and triglyceride in milk. Journal of Dairy Science : 61 (10) 1392-1399.
Lundstedt, E. (1954) . Manufacture of quality Cream cheese - A means of utilizing some of our excess milk fat. Journal of Dairy Science : 37, 243-246.
Luyten, H. (1988). The rheological and fracture properties of Gouda cheese. Ph.D thesis. Wageningen Agricultural University, Wageningen. Netherlands. Summary reported in Netherlands Milk and Dairy Journal : 42, 353-355.
MacGibbon, A.K.H. and McLennan, W.D. (1987). Hardness of New Zealand patted butter: seasonal and regional variations. New Zealand Journal of Dairy Science and Technology : 22, 143-156.
Mansour, A. and Alais, C. (1972). Salting and ripening of cheese in brine. I. Biochemical aspects :
development of cheese composition and yield. Lait : 52, 515-535.
Marcos, A., Alcala, M., Lean, F., Fernandez-Salguero, J., and Esteban, MA. (1981). Water activity and chemical composition of cheese. Journal of Dairy Science : 64 ( 4) 622-626.
Marcos, A. and Esteban, MA. (1982). Nomograph for predicting water activity of soft cheese. Journal of Dairy Science : 65 (9) 1795-1797.
Marcos, A., Millan, R., Esteban, MA., Alcala, M. and Fernandez-Salguero, J. (1983). Chemical composition and water activity of Spanish cheeses. Journal of Dairy Science : 66 (12) 2488-2493.
Marrs, W.M., Sworn, G. and Hart, R.J. (1989). Emulsifying and stabilising properties of lecithin/carrageenan systems. Research report No. 636, British Manufacturing Industries Research Association, Leatherhead, U.K. 35p.
Marshall, K.R. and Harper, W.J. (1988). Whey protein concentrates. Bulletin of the International
Dairy Federation No. 233, p.21-32.
Marshall, RJ. (1986). Increasing cheese yields by high heat treatment of milk, Journal of Dairy
Research : 53 (2) 313-321.

345
Matz, S.A. (1965). Water in foods. p.230-232. The AVI Publishing Company, Inc., Westport, Connecticut.
Maubois, J.L. (1987). Changes in protein content of milk for cheesemaking. p.156-164. In Cheesemaldng: Science and Technology. Edited by A. Eck. 2nd Edition, New York, Lavoisier Publishing, New York.
Maubois, J.L., Mocquot, G.P.C.B. and Vassal, L.J. (1980) . Preparation of soft cheese using ultrafiltration. United States Patent : US 4 205 090. Cited in Dairy Science Abstracts : 43, [1346].
Maxcy, R.B., Price, W.V. and lrvine, D.V. (1955). Improving curd-forming properties of homogenised milk. Joumal of Dairy Science : 38, 80-86.
McDowall, F.H. and Whelan, L.A. (1938). The solubility of Cheddar cheese curd in sodium chloride solutions. Joumal of Dairy Research : 9, 339-341.
McPherson, A. V. and Kitchen, B.J. (1983). Reviews of the progress of dairy science; the bovine milk fat globule membrane - its formation, composition, structure and behaviour in milk and dairy products. Joumal of Dairy Research ; 50, 107-133.
Mehran, M. and Kosikowski, F. V. (1972). New ripened cow's milk cheese adapted from sheep milk cheesemaking principles. Joumal of Dairy Science ; 55 (5) 672.
Melsen, J.P. (1989). The stability of recombined milk fat globules. Netherlands Milk and Dairy
Joumal ; 43, 89-95.
Melsen, J.P. and Walstra, P. (1989) . Stability of recombined milk fat globules. Netherlands Milk and
Dairy Joumal ; 43, 63-78.
Modler, H.W., Poste, L.M. and Butler, G. (1985) . Sensory evaluation of an all-dairy formulated cream-type cheese produced by a new method. Joumal of Dairy Science : 68 (11) 2835-2839.
Morr, C.V. and Richter, R.L. (1988). Chemistry of processing. p.743. In Fundamentals of Dairy
Chemistry. Edited by Noble P. Wong. Third Edition. An AVI Book. Van Nostrand Reinhold Company. New York.
Mottar, J., Bassier, A., Joniau, M. and Baert, J. (1989). Effect of heat-induced association of whey proteins and casein micelles on yoghurt texture. Joumal of Dairy Science ; 72 (9) 2247-2256.
Muffett, D.J. and Snyder, H.E. (1980) . Measurement of unfrozen and free water in soy proteins by Differential Scanning Calorimetry. Joumal of Agricultural and Food Chemistry : 28 (6) 1303-1305.
Mulder, H. and Walstra, P. (1974). The milk fat globule: emulsion science as applied to milk products and comparable foods. Commonwealth Agricultural Bureaux Farnham Royal, Bucks, England. 296 p.

346
Noomen, A. (1977). Noordhollandse Meshanger cheese: a model for research on cheese ripening. 2. The ripening of the cheese. Netherlands Milk and Dairy Journal : 31, 75-102.
Noomen, A. (1983). Proteolysis in cheese: sources and consequences. Netherlands Milk and Dairy
Journal : 37, 96-97.
NZDDM. (1979). Chemistry: Standard Laboratory Methods. Dairy Division Manual. New Zealand Ministry of Agriculture and Fisheries, Wellington.
NZDDM. (1984) . Microbiology: Standard Laboratory Methods. Dairy Division Manual 3, New Zealand Ministry of Agriculture and Fisheries, Wellington.
Oakenfull, D.G. (1984). Food gels. CSIRO Food Research Quarterly : 44 (3) 49-55.
O'keeffe, A.M., Fox, P.F. and Daly, C. (1978). Proteolysis in Cheddar cheese: role of coagulant and starter bacteria. Journal of Dairy Research : 45, 465-477.
Omar, M.M. and Buchheim, W. (1983). Composition and microstructure of soft brine cheese made from instant whole milk powder. Food Microstmcture : 2, 43-50.
Oortwijn, H. and Walstra, P. (1979). The membranes of recombined fat globul(;(s. z. Composition. Netherlands Milk and Dairy Journal : 33, 134-154.
Pang, J. (1989). The manufacture of cheese base incorporating denatured whey protein. Dissertation
for diploma in Food Technology, Massey University, Palmerston North, New Zealand.
Parnell-Clunies, E.M., Kakuda, Y., Mullen, K., Arnott, D.R. and Man, J.M. de (1986). Physical properties of yoghurt: A comparison of vat versus continuous heating systems of milk. Journal of Dairy Science : 69 (10) 2593-2603.
Parnell-Clunies, E. M., Kakuda, Y., Smith, A.K. (1987). Microstructure of yoghurt as affected by heat treatment of milk. Milchwissenschaft : 42 (7) 413-417.
Patel, M.C., Lund, D.B. and Olson, N.F. (1972). Factors affecting syneresis of renneted m ilk gels. Journal of Dairy Science : 55 (7) 913-917.
Pearce, K.N. (1977). The complexometric determination of calcium in dairy products. New Zealand
Journal of Dairy Science and Technology : 12, 113-115.
Pearse, M.J. and Mackinlay, A.G. (1989). Biochemical aspects of syneresis: A review. Journal of
Dairy Science : 72 , 1401-1407.
Pearse, M.J., Mackinlay, A.G., Hall, R.J. and Linklater, P.M. (1984). A microassey for the syneresis of cheese curd. Journal of Dairy Research : 51, 131-139.

347
Pedersen, D.H., Vedamuthu, E.R., Reinbold, G.W. and Washam, C.J. (1971). Effect of some manufacturing variables on the leakage defect of Blue cheese. Joumal of Dairy Science : 54
(11) 1651-1621.
Peri, C., Lucisano, M. and Donati, E. (1985). Studies on coagulation of milk ultrafiltration retentates. II. Kinetics of whey syneresis. Milchwissenschaft : 40 (1) 650-652.
Pernodet, G. (1987). Feta and similar cheeses. p.246. In Cheesemaking: Science and Technology.
Edited by A. Eck. 2nd Edition, New York, Lavoisier Publishing, New York.
Robson, E.W. and Dalgleish, D.G. (1987). Interfacial composition of sodium caseinate emulsions. Joumal of Food Science : 52 (6) 1694-1698.
Rollema, H.S. and Poll, J.K. (1986). The alkaline milk proteinase system: Kinetics and mechanism of heat-inactivation. Milchwissenschaft : 41 (9) 536-540.
Rose, D. (1968). Relation between micellar and serum casein in bovine milk. Joumal of Dairy
Science : 51 (12) 1897-1902.
Ross, K.D. (1978). Differential Scanning Calorimetry of non freezable water in solute-macromoleculewater systems. Joumal of Food Science : 43, 1812-1815.
Roundy, Z.D. (1960). Manufacture of cheese. US Patent 2 963 370. Cited in Dairy Science Abstracts : 23, [1877].
Roundy, Z.D. and Price, W.V. (1941). The influence of fat on the quality of Cream cheese. Joumal
of Dairy Science : 24, 235-243.
Ruegg, M. and Blanc, B. (1976). Effect of pH on water vapour sorption by caseins. Joumal of Dairy
Science : 59 (6) 1019-1024.
Ruegg, M. and Blanc, B. (1977). Relationships between water activity, water sorption capacity and cheese composition. Milchwissenschaft : 32 ( 4) 193-201.
Ruegg, M., Luscher, M. and Blanc, B. (1974). Hydration of native and rennin coagulated caseins as determined by Differential Scanning Calorimetry and Gravimetric Sorption measurements. Joumal of Dairy Science : 57 (4) 387-393.
Sakharov, S.D., Tabachnikov, V.P., Nebert, V.K., and Krasheninin, P.F. (1975). Role of fat and proteins in cheese gel structure formation. Trudy, Vsesoyuznyi Nauchno-issledovatel'skii Institut Maslodel'noi i Syrodel'noi Promyshlennosti : (18) 29-36, 121, 128. Cited in Dairy Science Abstracts : 41, [3403].
Sanderson, W.B. (1970). Determination of undenatured whey protein nitrogen in skim milk powder by dye binding. New Zealand Joumal of Dairy Science and Technology : 5, 46-48.
SAS Institute Inc. (1985). SAS user's Guide: Statistics, version 5. SAS Institute Inc., Cary, NC. 956 p.

348
Schedushnov, E.V., Kutilina, S .K. and Ryabova, N. Ya. (1979) . Cream cheese and method for its manufacture. USSR patent : 649 393. Cited in Dairy Science Abstracts : 42, [601].
Scott, R. (1981). Cheesemaking Practice. Applied Science Publishers Ltd., London. 475 p.
Shimizu, M., Ametani, A., Kaminogawa, S. and Yamauchi, K. (1986). The topography of as1-casein adsorbed to an oil/water interface: an analytical approach using proteolysis. Biochimica et
Biophysica Acta: 869, 259-264.
Shimp, LA. (1985). Process cheese principles. Food Technology : 39 (5) 63-64, 68, 70.
Siapantas, L. (1981). Quality improvements in Feta cheese with the proper application of cultures and enzymes. p.225-227. Proceedings from the second biennial Marsha/1 International Cheese
Conference, Madison, Wisconsin, USA.
Singh, H. and Creamer, L.K. (1990). A sensitive quantitative assay for milk coagulants in cheese and whey products. Journal of Dairy Science : 73 (5) 1158-1165.
S ingh, H., Shalabi, S.I., Fox, P.F., Flynn, A. and Barry, A. (1988). Rennet coagulation of heated milk: Influence of pH adjustment before and after heating. Journal of Dairy Research : 55,
205-215.
Slyke, L.L. van and Price, W.V. (1949). Cheese. Orange Judd Publishers Company, Inc., New York. 522 p.
Standard methods for the examination of dairy products. (1978). 14th Edition. Edited by Elmer H. Marth. American Public Health Association (APHA), Washington, D.C. 416 p.
Stewart, K.K. (1977). Thin film dialysis. p.135-186. In Advances in protein chemistry. Edited by Anfinsen, C.B., Edsale, J.T. and Richards, F.M. Academic press, New York.
Starry, J.E., Grandison, A.S., Millard, D., Owen, A.J. and Ford, G. (1983). Chemical composition and coagulating properties of renneted milks from different breeds and species of ruminant. Journal of Dairy Research : 50, 215-229.
Sutherland, B.J. and Jameson, G.W. (1981). Composition of hard cheese manufactured by ultrafiltration. The Australian Journal of Dairy Technology : 36, 136-143.
Swergold, G.D. and Rubin, C.S. (1983). High-performance gel-permeation chromatography of polypeptides in a volatile solvent: rapid resolution and molecular weight estimations of proteins and peptides on a column ofTSK-G3000-PW. Analytical Biochemistry : 131, 295-300.
Tamime, A.Y. and Deeth, H.C. (1980) . Yogurt: technology and biochemistry. Journal of Food
Protection : 43 (12) 939-977.
Taylor, M.W., Dolby, R.M. and Russell, R.W. (1973) . The effect of manufacturing conditions on the setting rate of butter. Journal of Dairy Research : 40, 393-402.

349
Thomas, T.D. (1987) . Acetate production from lactate and citrate by non-starter bacteria in Cheddar cheese. New Zealand Joumal of Dairy Science and Technology : 22, 25-38.
Thomas, T.D. and Crow, V.L. (1983). Mechanism of D(-)-Lactic acid formation in Cheddar cheese. New Zealand Joumal of Dairy Science and Technology : 18, 131-141.
Thomas, T.D. and Pearce, K.N. (1981). Influence of salt on lactose fermentation and proteolysis in Cheddar cheese. New Zealand Joumal of Dairy Science and Technology : 16, 253-259.
Trinder, P. (1969). Determination of glucose in blood using glucose oxidase with an alternative oxygen acceptor. Annals of Clinical Biochemistry : 6, 24.
Trailer, JA. and Christian, J.H.B. (1978) . Water activity and food. Academic Press, New York. 235 p.
Turner, K.W. and Thomas, T.D. (1980) . Lactose fermentation in Cheddar cheese and the effect of salt. New Zealand Joumal of Dairy Science and Technology : 15, 265-276.
Vafopoulou, A., Alichanidis, E. and Zerfiridis, G. (1989) . Accelerated ripening of Feta cheese, with heat shocked cultures or microbial proteinases. Joumal of Dairy Research : 56, 285-296.
Vaikus, V., Lubinskas, V. and Mitskevichus, E. (1970). The effect of homogenisation on the properties of the acid- and rennet- gels of milk. Proceedings of 18th Intemational Dairy
congress : lE, 320.
Visser, F.M.W. (1977a). Contribution of enzymes from rennet. starter bacteria and milk to proteolysis and flavour development in Gouda cheese. 2. Development of bitterness and cheese flavour. Netherlands Milk and Dairy Joumal : 31, 188-209.
Visser, F.M.W. (1977b ). Contribution of enzymes from rennet, starter bacteria and milk to proteolysis and flavour development in Gouda cheese. 3. Protein breakdown: analysis of the soluble nitrogen and amino acid nitrogen fractions. Netherlands Milk and Dairy Joumal : 31,
210-239.
Visser, F.M.W. and Groot-Mostert, A.EA. de (1977). Contribution of enzymes from rennet, starter bacteria and milk to proteolysis and flavour development in Gouda cheese. 4. Protein breakdown: a gel electrophoretical study. Netherlands Milk and Dairy Jouma/ : 31, 247-264.
Vliet, T. van and Dentener-Kikkert, A. (1982) . Influence of the composition of milkfat globyle membrane on the rheolo!Pcal properties of acid milk gels. Netherlands Milk and Dairy
Joumal : 36, 261-265.
Vliet, T. van, Roefs, S.P.F.M., Zoon, P. and Walstra, P. (1989). Rheolo!Pcal properties of casein gels. Jouma/ of Dairy Research : 56, 529-534.
Walker, Y. (1970). The Centriwhey process for increasing yield in the manufacture of cheese. Proceedings of the XVIII Intemational Dairy congress, Brief communications, vol. lE, 327.

350
Walstra, P. (1965). Light scattering by milk fat globules. Netherlands Milk and Dairy Joumal : 19 (2) 93-109.
Walstra, P. (1968). Estimating globule-size distribution of oil-in-water emulsions by spectroturbidimetry. Joumal of Colloidal and Interface Science : 27 (3) 493-500.
Walstra, P. (1975). Effect of homogenisation on the fat globule size distribution in milk. Netherlands
Milk Dairy Joumal : 29, 279-294.
Walstra, P., Dijk, H.J.M. van and Geurts, T.J. (1987) . The syneresis of curd. p.135-178. In Cheese:
Chemistry, Physics and Microbiology, Vol-I. Edited by P.F. Fox. Elsevier Applied Science, London and New York.
Walstra, P., Dijk, H.J.M. van and Geurts, T.J. (1985). The syneresis of curd. 1. General conditions and literature review. Netherlands Milk and Dairy Joumal : 39, 209-246.
Walstra, P. and Jenness, R. (1984). Dairy Chemistry and Physics. p.98-122, 255-278. A Wiley-Interscience Publication, John Wiley & sons, New York.
Walstra, P, and Vliet, T. van (1986). The physical chemistry of curd making. Netherlands Milk and
Dairy Joumal : 40, 241-259.
Waugh, D.F., Creamer, L.K. and Dresdner, C.W. (1970) . Core polymers of casein micelles. Biochemistry : 9, 786-795.
Wilster, G.H. (1969). Practical Cheese Making. Eleventh edition. O .S.U. Book Stores, Inc. USA.
Wit, J.N. de, Klarenbeek, G. and Swinkels, GA.M. (1977) . [Zuivelzicht 68 (1976) 442-445.; Voedingsmiddelentechnologie (1976) (17) 14-17]. Summaries reported in Netherlands Milk
and Dairy Joumal : 31, 150.
Zakariasen, B.M. and Combs, W.B. (1941) . Some factors influencing the quality of Cream cheese. Joumal of Dairy Science : 24, 543.
Zittle, CA., DellaMonica, E.S., Rudd, R.K. and Custer, J.H. (1957). The binding of calcium ions by B-lactoglobulin both before and after aggregation by heating in the presence of calcium ions. Joumal of the American Chemical Society : 79 (17) 4661-66.
Zoon, P., Vliet, T. van and Walstra, P. (1988) . Rheological properties of rennet-induced skim milk gels. 3. The effect of calcium and phosphate. Netherlands Milk and Dairy Joumal : 42, 295-312.