RHEOLOGY AND PROCESSING OF MOZZARELLA CHEESE
134
RHEOLOGY AND PROCESSING OF MOZZARELLA CHEESE by EDWARD BUDI MULIAWAN B.A.Sc. (Chem. Eng.), The University of British Columbia, 2001 M.A.Sc. (Chem. Eng.), The University of British Columbia, 2004 A THESIS SUBMITTED IN PARTIAL FULFILMENT OF THE REQUIREMENTS FOR THE DEGREE OF DOCTOR OF PHILOSOPHY in THE FACULTY OF GRADUATE STUDIES (Chemical and Biological Engineering) THE UNIVERSITY OF BRITISH COLUMBIA (Vancouver) February 2008 © Edward Budi Muliawan, 2008
-
Upload
khangminh22 -
Category
Documents
-
view
5 -
download
0
Transcript of RHEOLOGY AND PROCESSING OF MOZZARELLA CHEESE

RHEOLOGY AND PROCESSING OF MOZZARELLACHEESE
by
EDWARD BUDI MULIAWAN
B.A.Sc. (Chem. Eng.), The University of British Columbia, 2001M.A.Sc. (Chem. Eng.), The University of British Columbia, 2004
A THESIS SUBMITTED IN PARTIAL FULFILMENT OFTHE REQUIREMENTS FOR THE DEGREE OF
DOCTOR OF PHILOSOPHY
in
THE FACULTY OF GRADUATE STUDIES(Chemical and Biological Engineering)
THE UNIVERSITY OF BRITISH COLUMBIA(Vancouver)
February 2008© Edward Budi Muliawan, 2008

ABSTRACT
Taken as an engineering material, mozzarella cheese can be considered
as a complex food system that has dynamic structure and complex flow
properties. Food scientists have been actively developing methods to
characterize mozzarella cheese rheologically, but most of these methods are
empirical in nature. In the past decades, there has been a paradigm shift towards
the utilization of well-developed rheological methods which have been widely
applied in the study of commercial synthetic polymers.
In this work, the rheology of mozzarella cheese was studied using well-
developed rheological techniques. Utilizing various rheometers, the linear and
non-linear rheology of mozzarella cheese was examined. General practical
properties of mozzarella cheese such as meltability, flowability and stretchability
were extracted from these results. Capillary flow and rolling experiments were
also performed to determine their suitability as innovative post-production
processing techniques for mozzarella cheese. Finally, a comparative study on
the effect of frozen storage on the rheology of three different brands of
mozzarella cheese was performed.
In general, it was found that mozzarella cheese can be classified as a
pseudoplastic (shear thinning) semi-solid material possessing a yield stress at
room temperature. Upon heating, the yield stress gradually diminishes and it can
be considered as a viscoelastic fluid. The results obtained from the various
rheometers indicate that the yield stress, duration of experiment, sample
geometry and temperature greatly affect the consistency of the results. It was
also shown that extrusion can be used as a processing technique for mozzarella
cheese above a certain temperature where the cheese is in a melt state. Rolling
was also found to be a potentially feasible processing method. Finally, in terms of
the effect of frozen storage, in general, the dynamic moduli decrease with the
period of storage due to the freezing of the proteins in the cheese.
ii

TABLE OF CONTENTS
ABSTRACT^ ii
LIST OF TABLES^ vi
LIST OF FIGURES^ vii
NOMENCLATURE^ xii
ACKNOWLEDGEMENTS^ xiv
1 FUNDAMENTALS^ 11.1 Introduction^ 11.2 Commercial Production of Cheese^ 11.3 Cheese Structure and Melting Behavior^ 31.4 Importance of Rheology of Cheese^ 7
2 GENERAL REVIEW^ 102.1 Introduction^ 102.2 Rheological Techniques^ 10
2.2.1^Empirical Measurements of Cheese Rheology^ 102.2.2^Fundamental Measurements of Cheese Rheology^ 12
2.3 Generalized Maxwell Model ^ 182.4 Basic Equations of the Principles of Operations of the
Experimental Equipment^ 202.4.1^Parallel Plate Flow^ 202.4.2^Extensional Flow^ 232.4.3^Capillary Flow^ 252.4.4^Rolling^ 31
3 SCOPE OF WORK^ 343.1 Introduction^ 343.2 Thesis Objectives^ 343.3 Thesis Organization^ 35
4 EXPERIMENTAL WORK^ 37
4.1 Introduction^ 374.2 Material^ 374.3 Experimental Equipment^ 39
4.3.1^Concentric Parallel Plate Rheometer^ 394.3.2^Extensional Rheometer^ 394.3.3^Capillary Rheometer^ 41
iii

5
TABLE OF CONTENTS
4.4 Experimental Procedures^ 42
^
4.4.1^Concentric Parallel Plate Rheometry^ 42
^
4.4.2^Extensional Rheometry^ 43
^
4.4.3^Capillary Rheometry^ 44
^
4.4.4^Rolling / Calendaring ^ 44
LINEAR VISCOELASTICITY^ 46
5.1 Introduction^ 465.2 Dynamic Time Sweep^ 465.3 Dynamic Stress Sweep^ 485.4 Dynamic Frequency Sweep^ 505.5 Dynamic Temperature Sweep^ 515.6 Time-Temperature Superposition^ 545.7 Generalized Maxwell Model Fit^ 565.8 Summary^ 59
6 NON -LINEAR VISCOELASTICITY^ 60
6.1 Introduction^ 606.2 Step Strain Relaxation^ 606.3 Yield Stress Measurements^ 656.4 Summary^ 67
7 EXTENSIONAL RHEOLOGY^ 68
7.1 Introduction^ 687.2 Transient Extensional Flow^ 687.3 Comparison with Linear Shear Rheology^ 717.4 Summary^ 75
8 CAPILLARY FLOW^ 77
8.1 Introduction^ 778.2 Flow Curves^ 778.3 Wall Slip ^ 838.4 Effects of Die Geometry^ 848.5 Extrudate Appearance^ 858.6 A Viscoplastic Model for Capillary Flow of Mozzarella Cheese ^878.7 Comparison with Linear Rheology^ 898.8 Summary^ 91
9 ROLL FORMING^ 92
9.1 Introduction^ 929.2 Roll Forming of Mozzarella Cheese^ 929.3 Summary^ 97
iv
TABLE OF CONTENTS v
10 COMPARATIVE STUDY OF FREEZING AND RHEOLOGY OFDIFFERENT BRANDS OF MOZZARELLA CHEESE^98
10.1 Introduction^ 9810.2 Extensional Properties^ 9910.3 Limit of Linear Viscoelasticity and Sample Stability^ 10110.4 Dynamic Frequency Sweep: Effects of Frozen Storage^ 10310.5 Summary^ 108
11 CONCLUSIONS^ 109
11.1 General Conclusions^ 10911.2 Practical Implications^ 11011.3 Contributions to Knowledge^ 11111.4 Recommendations for Future Work^ 112
BIBLIOGRAPHY^ 116

LIST OF TABLES
Table 4.1 Compositional analysis of Best Buy mozzarella cheese^38
Table 5.1 Stress and strain limits of linear viscoelasticity of mozzarellacheese at different temperatures^ 49
Table 5.2 Generalized Maxwell model parameters for mozzarellacheese at different temperatures^ 58
Table 8.1 A summary of end pressure corrections for theextrusion of mozzarella cheese for dies having differentdiameters, different apparent shear rate values andat various temperatures^ 81
Table 8.2 Rabinowitch correction for the capillary extrusion ofmozzarella at different temperatures^ 83
Table 10.1 Compositional analysis of the different brands of mozzarellacheese^ 99
vi

LIST OF FIGURES
Fig. 1.1 Schematic of casein micelle agglomeration and theentrapment of fat globules; structure of cheese (Johnson, 2000) .. 3
Fig. 1.2 Confocal laser scanning micrographs of 5 day-oldfull fat Cheddar cheese at a) room temperature and b) 95 °C.The micrographs show protein, as red areas, and fat, asgreen areas (Guinee and Fox, 2001)^ 7
Fig. 2.1 Schematic diagram of a parallel plate rheometer^20
Fig. 2.2 Schematic diagram of Sentmanat ExtensionalRheometer (SER)^ 24
Fig. 2.3 Schematic diagram of capillary rheometer^ 26
Fig. 2.4 Pressure distribution in a reservoir and capillary^30
Fig. 2.5 Bagley plot (schematic)^ 31
Fig. 2.6 A schematic of the set up of SER for rolling/calendaringexperiments^ 32
Fig. 2.7 Schematic of one of the SER drums in rolling^33
Fig. 4.1 Gross structural uniformity check of the different batches ofmozzarella samples at 25°C. Different symbols and grey shadescorrespond to different experimental runs performed atdifferent times throughout the completion of the project^39
Fig. 4.2 A schematic of the Sentmanat Extensional Rheometer (SER) ^40
Fig. 4.3 A schematic of the computer-controlled capillary rheometer^41
Fig. 5.1^Effect of time on the linear viscoelastic properties of mozzarellacheese at different temperatures^ 47
Fig. 5.2 Stress amplitude sweep of mozzarella cheese at differenttemperatures. Shown also are the corresponding strain valuesand the linear viscoelastic region at T = 25 °C^49
Fig. 5.3 Dynamic frequency sweeps of mozzarella cheese at A) 25 °C,B) 40°C, C) 50°C, and D) 60°C^ 50
vii

LIST OF FIGURES viii
Fig. 5.4 Dynamic temperature sweep of mozzarella cheese at afrequency of 1.5Hz^ 53
Fig. 5.5 Two-direction temperature sweep of mozzarella cheese,showing its thermal hysteresis behavior^ 53
Fig. 5.6 Cryo-scanning electron microscope of A) virgin mozzarellaCheese at 25 °C and B) mozzarella cheese heated to 60 °Cand cooled down to 25 °C 54
Fig. 5.7 Master curve of mozzarella cheese at a reference temperatureof 60°C, obtained from shifting the linear viscoelastic datagathered at 40°C and 50 °C^ 56
Fig. 5.8 Shift factors of mozzarella cheese as a function of temperatureand its Arrhenius fit^ 57
Fig. 5.9 Maxwell model fits of the dynamic linear viscoelastic data formozzarella cheese at A) 25 °C, B) 40 °C, C) 50°C, and D) 60°C ....58
Fig. 6.1^Stress relaxation after imposition of step strains on mozzarellacheese at A) 25°C, B) 40°C, C) 50°C, and D) 60 °C^61
Fig. 6.2 Transient analysis of step strain relaxation of mozzarellacheese at 25 °C^ 62
Fig. 6.3 Shift of the data plotted in Fig. 6.1 in order to determine thedamping functions of mozzarella cheese at A) 25 °C, B) 40 °C,C) 50°C, and D) 60°C^ 63
Fig. 6.4 Damping function of mozzarella cheese at differenttemperatures. Lines correspond to fitting of dampingfunction with the Zapas generalized model^ 64
Fig. 6.5 Typical stress ramp test for mozzarella cheese at 25 °C todetermine its yield stress^ 66
Fig. 6.6 Typical stress ramp test for mozzarella cheese at 40 °C todetermine its yield stress^ 66
Fig. 6.7 Typical stress ramp test for mozzarella cheese at 50°C todetermine its yield stress^ 67
Fig. 7.1 Tensile stress growth coefficient of mozzarella cheese samplesprepared by cutting in three different directions at a Henckystrain rate of 0.113 s -1 and temperature of 25 °C^69

LIST OF FIGURES ix
Fig. 7.2 Tensile stress growth coefficients of mozzarella cheese atA) 25°C, B) 40°C, C) 50 °C, and D) 60°C^ 70
Fig. 7.3 Tensile stress-strain curves of mozzarella cheese at a Henckystrain rate of 4.5 s -1 at different temperatures^ 71
Fig. 7.4 Comparison of tensile stress growth coefficients of mozzarellacheese with the linear viscoelastic envelope predicted from thegeneralized Maxwell model fit of linear viscoelastic data atA) 25°C, B) 40°C, C) 50°C, and D) 60 °C^ 73
Fig. 7.5 Moisture loss in the mozzarella cheese as a function of timeat 50°C for A) oscillatory sample and B) SER sample^74
Fig. 7.6 Tensile stress growth coefficient of mozzarella cheese at 50 °Cand the linear viscoelastic envelope predicted from the fittingof the generalized Maxwell model fit of the linear viscoelasticdata obtained from mozzarella cheese samples which havebeen dried in the oven at 50°C for a certain period of time^75
Fig. 8.1^Pressure transients in capillary extrusion of mozzarellacheese obtained by using a capillary die with a diameterof 0.813 mm, L/D of 15 and entrance angle of 180° atshear rates of 57.2 s -1 (dotted line), 572 s -1 (dashed line),and 1716 s -1 (solid line), at 25°C^ 78
Fig. 8.2 The apparent flow curve of mozzarella cheese obtainedfrom capillary extrusions using capillary dies having adiameter of 0.43 mm, L/D ratios of 15, 30, and 47, andan entrance angle of 180° at 25°C^ 79
Fig. 8.3 End pressure corrections (Bagley plot) of mozzarella cheesefor different shear rates and for a capillary die with adiameter of 0.43 mm and an entrance angle of 180° at 25°C.The straight lines are obtained by linear regression analysisof the data (R 2 = 0.99 for all curves) ^ 80
Fig. 8.4 The Bagley corrected flow curves of mozzarella cheese atthe temperatures of 25°C, 40°C, 50°C, and 60°C obtainedusing capillary dies with various diameters, L/D ratios andan entrance angle of 180°. The straight lines shown areobtained by linear regression analysis of the data(R2 = 0.97, 0.98, 0.99, and 0.93 for 25°C, 40°C, 50°Cand 60°C respectively)^ 82

LIST OF FIGURES x
Fig. 8.5 The true flow curves of mozzarella cheese at temperaturesof 25°C, 40°C, 50°C, and 60°C obtained using capillary dies withvarious diameters, L/D ratios and an entrance angle of 180°.The straight lines shown are obtained by linear regressionanalysis of the data (R2 = 0.97, 0.98, 0.99, and 0.93 for 25°C,40°C, 50°C and 60°C respectively)^ 84
Fig. 8.6 The effect of entrance angle, 2a, on the apparent shearstress in the extrusion of mozzarella cheese at 25 °C andseveral apparent shear stress values 85
Fig. 8.7 Extrudate appearance of mozzarella cheese obtained fromcapillary extrusion at different shear rates at A) 25 °C,and B) 60°C^ 86
Fig. 8.8 Extrudate appearance of mozzarella cheese obtainedfrom capillary extrusion using capillary dies with alength of 10.2 mm (0.4"), diameter of 0.508 mm (0.02") anddifferent entrance angles at a shear rate value of 38 s -1at 25°C^ 87
Fig. 8.9 True flow curve of mozzarella cheese obtained fromcapillary and sliding plate rheometers at 25 °C. Solid line isa Herschel-Bulkley viscoplastic model fit of theexperimental data^ 88
Fig. 8.10 Comparison of viscosities of mozzarella cheese obtainedfrom linear oscillatory shear and capillary extrusion experimentsat A)25°C, B)40°C, C)50°C, and D)60°C^ 90
Fig. 9.1 Typical transient rolling curves of mozzarella cheese at areduction ratio of 2.1 and at 25 °C for various roller speed^93
Fig. 9.2 Rolling curves of mozzarella cheese for different reductionratios at 25 °C^ 94
Fig. 9.3 Rolling shear stress as a function of reduction ratio fordifferent linear speed for mozzarella cheese at 25 °C^95
Fig. 9.4 The effect of roller speed on the exit thickness of thesamples for reduction ratios of 1.4, 1.7. and 2.3 at 25°C.The exit thickness is normalized by the gap between therollers (0.241 cm)^ 96
Fig. 9.5 Typical images of rolled mozzarella cheese samples at 25 °C ^96

LIST OF FIGURES xi
Fig. 10.1 Tensile stress growth coefficient of Kraft mozzarella cheesesamples prepared by cutting in three different directions at aHencky strain rate of 1.13 s -1 and temperature of 25°C 100
Fig. 10.2 Tensile stress growth coefficient of Ziggy's mozzarella cheesesamples prepared by cutting in three different directions at aHencky strain rate of 1.13 s-1 and temperature of 25°C^ 101
Fig. 10.3 Tensile stress growth coefficients of Kraft mozzarella cheeseat 25°C^ 102
Fig. 10.4 Tensile stress growth coefficients of Ziggy's mozzarella cheeseat 25°C^ 102
Fig. 10.5 Dynamic moduli of the three different brands of mozzarellacheese at 25 °C^ 104
Fig. 10.6 Time-temperature superposed dynamic moduli of thethree different brands of mozzarella cheese at a referencetemperature of 60 °C^ 104
Fig. 10.7 The effect of frozen storage on the dynamic moduli of Best Buymozzarella cheese at a temperature of A)25°C, B)40 °C,C)50°C, and D) 60 °C^ 105
Fig. 10.8 The effect of frozen storage on the dynamic moduli of Kraftmozzarella cheese at a temperature of A)25°C, B)40°C,C)50°C, and D) 60°C^ 106
Fig. 10.9 The effect of frozen storage on the dynamic moduli of Ziggy'smozzarella cheese at a temperatue of A)25 °C, B)40°C,C)50°C, and D) 60 °C^ 107

NOMENCLATURE
a f^ : horizontal shift factor for time-temperature superposition.
b^: Rabinowitsch correction.
G(t)^: relaxation modulus.G'^: storage/elastic modulus.G"^: loss/viscous modulus.
K, n^: consistency index and power-law index parameters for Herschel-Bulkley equation, respectively.
L/D^: length to diameter ratio of a capillary die.N^: number of Maxwell elements.
RR^: defined as tF/tG in rolling experiments.
tF^: thickness of feed samples in rolling experiments.
tG^: gap between the SER rollers.
tE^: thickness of exit samples in rolling experiments.
2a^: entrance angle of a capillary die.
6^: phase shift in oscillatory shear experiments.
cH,eH^: Hencky strain and strain rate, respectively.
70^: strain amplitude in oscillatory shear experiments.
: rate of deformation tensor.
2 .1 ,4^: apparent shear rate.
: time constant (the relaxation time).
Xi and 1 0,i^: relaxation time and shear viscosity of the i th Maxwellian elementrespectively.
110^: zero shear viscosity.
T1 *^: complex modulus.
rIE^: tensile stress growth coefficient.
1:^: shear stress growth coefficient.
co^: stress amplitude in oscillatory shear experiments.
6A^ apparent shear stress.
crE^: tensile stress.
xii

NOMENCLATURE xiii
01,„^: wall shear stress.
cY^: the yield stress.
t^: stress tensor.=
w^: frequency of oscillations in oscillatory shear experiments.

CHAPTER 1:
FUNDAMENTALS
1.1 Introduction
A class of food that has attracted the attention of rheologists and scientists
is the dairy products due to their structural dynamics and properties. One diary
product that has showed tremendous growth commercially is cheese. For
example, in the 1990s, the production of only Mozzarella cheese in Australia has
increased more than 100% (Rowney et al., 1999) and in the United States, the
total production of cheese is estimated to be around 3.5 million tonnes, with
Cheddar and Mozzarella being the most dominant varieties (Gunasekaran and
Ak, 2003).
In this chapter, the typical commercial production technique of cheese is
presented. In addition, the morphology and physical properties of cheese will be
examined and finally, the importance of understanding the rheology of cheese is
discussed.
1.2 Commercial Production of Cheese
Milk is the raw material in the manufacture of cheese. Major constituents
of milk are fat, water, protein (casein in colloidal form and albumen/whey in
soluble form), sugar (lactose) and enzymes (Gunasekaran and Ak, 2003). Other
minor constituents include vitamins and ash.
Pasteurization is usually the first step in cheese making (NEM Business
Solutions, 2002). In this step, milk is heated (72 °C) for a short period of time (-15
seconds) to destroy any harmful bacteria (Gunasekaran and Ak, 2003). While the
milk is warm (20°C to 40°C), special starter cultures are added to breakdown a
1

CHAPTER 1 - FUNDAMENTALS 2
small amount of the milk sugar into lactic acid. This acidifies the milk and
prepares the milk for the next step; coagulation.
Rennet, a coagulant enzyme, is then added to the milk after which a curd
is formed. During coagulation, the enzyme breaks down the K-casein present on
the surface of the casein micelle. This destabilizes the casein micelles and
causes them to gel. As they form gel, the coagulum tends to shrink and expel
entrapped liquid. This liquid is called whey. To improve whey expulsion, the curd
is usually cut into small cubes to increase its surface area to volume ratio
(Gunasekaran and Ak, 2003). Throughout these stages, fat exists as globules
and as the coagulum shrinks, the fat is entrapped within the casein matrix
(Johnson, 2000). The void space within the casein is called serum. Coagulation
period can vary from 30 minutes to 36 hours, depending on the cheese type
(Gunasekaran and Ak, 2003).
The next step is to drain off the whey which contains water soluble
substances such as lactose, whey proteins, salts, peptides, other non-protein
nitrogeneous substances and fat which is released during cutting. The manner by
which the whey is removed is important in determining the resulting texture and
flavour of the cheese. For example, Cheddar and Swiss type cheeses require
cooking and stirring during whey drainage, whereas soft cheese such as
Camembert cheese does not require stirring.
After the whey is drained, the curd is shaped and salted. Shaping is also
an important step at which the texture of cheese is determined. For example,
Mozzarella cheese needs to be kneaded (heated and stretched) in warm water to
give its unique texture. Hard cheeses, on the other hand, need just to be pressed
to mat the coagulum into a large slab of cheese. Shaping is then followed by
salting to improve the textural quality and flavour of the cheese.

CHAPTER 1 - FUNDAMENTALS 3
The last step in cheese making is ripening. Ripening allows continued
microbial and biochemical processes in the cheese which further develop its
unique texture and taste as the proteins, lipids and carbohydrates are broken
down. Ripening can vary from a few days (eg. Mozzarella) to a few months (eg.
Cheddar) depending on the cheese types (Gunasekaran and Ak, 2003).
Variations to the basic steps described above are possible. For example,
milk acidification can be achieved by addition of lactic acid or hydrochloric acid,
instead of starter culture. Also, heating and lowering pH helps to facilitate more
efficient whey expulsion.
1.3 Cheese Structure and Melting Behavior
A schematic of a typical structure of cheese is shown in Fig. 1.1 (Johnson,
2000). The major components in most varieties of cheese are casein, fat, and
water (or an aqueous component). In most varieties of full fat cheese, these
major components co-exist in approximately equal proportions by weight.
However, since the specific gravity of casein is about twice that of water and
slightly higher than that of the fat, approximately one-sixth of the cheese total
volume is casein (Prentice, 1992).
Figure removed for copyright reasons. Original source Fig. 1, p.2 (Johnson,
2000).
Fig. 1.1 Schematic of casein micelle agglomeration and the entrapment of fatglobules; structure of cheese (Johnson, 2000).
At normal room temperatures, the casein is solid and exists as micelles,
having a molecular weight of about 10 4 g/mol to 10 5 g/mol and their sizes range
from 0.05 1.1m to 1 p.m. The casein gives a cheese its "solid" appearance and the

CHAPTER 1 - FUNDAMENTALS 4
interactions within and among these casein micelles provide the elastic property
of the cheese. In a cheese, the casein micelles actually agglomerates and form
into chains (Prentice, 1992). At the minimum, these chains must occupy the
space around the fat globules and this provides the rigidity of the cheese. The
actual amount of casein in a cheese depends on the number, size, and size
distribution of the fat globules and on the sizes of the casein micelles themselves.
Once the minimum amount of casein has been exceeded, any further casein
present in a cheese provides additional strength to the chains and their junctions,
making the cheese more rigid (Prentice, 1992). In a study on the firmness of
several cheese varieties, it is estimated that a minimum of about 25 wt. % casein
must be present in order for a cheese to have a rigid framework (Chen et al.,
1979).
At normal room temperatures, fat in the cheese exist as a mixture of liquid
and solid fractions. The fat particles have a molecular weight in the range of 10 5
to 106 g/mol and diameter in the range of 0.5 ii.m to larger than 10 p.m. The fat
globules are normally held in place by entrapment within the casein network.
These fat globules are relatively large in size and they do not interact with each
other. The only interaction between the fat particles and the casein is through
friction. Thus, it has been suggested that the fat globules are inert fillers as they
do not contribute much to the elastic property of the cheese (Prentice, 1992).
However, at sufficiently low temperatures, the fat globules are able to add rigidity
of the casein matrix. Nevertheless, fat is an important component of a cheese
because it provides a critical role in the sensory perception of consumers as the
cheese is consumed.
The aqueous phase in the cheese is usually made up of the soluble
constituents of the milk serum (eg. minerals, lactic acid, peptides, and amino
acids) and any enzyme or salt (eg. residual rennet) that may have been added
during the manufacturing process (Fox et al., 2000). Although, some of the
aqueous phase is bound to the casein and therefore largely immobilized, most of

CHAPTER 1 - FUNDAMENTALS 5
the aqueous phase is free and fills the interstices between the fat and the casein
matrix (Prentice, 1992). The aqueous phase, thus, serves as a low viscosity
lubricant between the surfaces of the fat and the casein. Consequently, the
amount of aqueous phase in a cheese affects its firmness. For example, if a
cheese has a relatively high content of aqueous phase, the space between the
fat and the casein will also be relatively larger. This causes the flow of the water
within this space easier and provides less restraint on the movement of the
casein mesh around the enclosed fat. Consequently, the cheese exhibits less
firmness.
Although different treatments and manufacturing processes result in
different cheeses having different characteristics, in general, cheese has an
open, meshlike structure of casein, composed of overlapping and cross-linked
strands of partially fused casein aggregates (micelles) (Prentice, 1992; Fox et al.,
2000). The integrity of the casein matrix is maintained by various intra- and inter-
aggregate hydrophobic and electrostatic forces. The fat, which had its origin as
the fat globules of the milk, and the aqueous phase are entrapped within the
casein network. The casein network is essentially continuous, extending in all
directions, although some discontinuities in the matrix exist due to the presence
of curd granule junctions and/or curd chip junctions. These junctions are devoid
of fat and exhibit different molecular attractions with the casein molecules mainly
due to the differences in cheese composition between the junctions and the
interior of the cheese particles (Fox et al., 2000).
The structure of the cheese is highly dependent on the temperature. As
the cheese melts, the fat, together with the moisture in the cheese, can become
important as they can alter the rheological properties of the cheese. Since
cheese is composed of constituents that have significantly different properties, it
is expected that the melting of cheese occurs at a range of temperature,
depending on the casein to fat ratio. At room temperature, fat exists as solid and
liquid. As the temperature is increased, the ratio of solid fat to liquid fat decreases

CHAPTER 1 - FUNDAMENTALS 6
(Prentice, 1992). Significant changes in the structure of the cheese which alter
the rheological properties of the cheese occur within the temperature range of
20°C to 45°C. Within this temperature range, the cheese undergoes heat induced
softening which is mainly due to the melting of the fat and increase in casein
salvation or hydration (Guinee et al, 2000). Total melting of the fat usually occurs
at around 40 °C (Muthukumarappan et al., 1999). Total protein mobilization, on
the other hand, occurs at relatively higher temperature. For example, Wetton and
Marsh (1990) and Guinee and Fox (2001) investigated the dynamic phase angle
of mild Cheddar cheese as a function of temperature and they found a peak at
approximately 75 °C, which was attributed to the total mobilization of the protein
matrix. However, a similar peak for a different type of cheese may occur at a
different temperature, depending on the arrangement of the fat within the casein
network and the presence of additives (eg. melting salts) (Gunasekaran and Ak,
2003).
As the temperature increases beyond 40 °C, the protein network starts to
disassociate as the electrostatic and van der Walls' interactions and hydrogen
bonds are weakened (Gunasekaran and Ak, 2003). At the same time, there are
greater hydrophobic interactions among the protein, which causes an increase in
protein aggregates density and size (Pastorino et al., 2002) and viscosity of the
cheese melt. The aggregation of the protein which leads to the constriction of the
casein network causes the moisture to be squeezed out of the network. This
results in larger gaps between the casein aggregates which makes it much easier
for the fat to "leak" out and phase separate from the protein (Johnson, 2000). Fig.
1.2 shows confocal laser scanning micrographs of Cheddar cheese at room
temperature and at 95 °C (Guinee and Fox, 2001). The Figure clearly shows the
phase separation between the fat and the proteins as the cheese is heated. It
has also been suggested that as the fat coalescence, it forms a large oil pools
which form a lubricating film between the protein layers and this facilitates the
mobility of the protein phase. Physically, this causes an overall reduction in the
rigidity of the cheese (Guinee and Fox, 2001).

CHAPTER 1 - FUNDAMENTALS 7
Figure removed for copyright reasons. Original source Fig. 2, p. 8 (Guinee and
Fox, 2001)
Fig. 1.2 Confocal laser scanning micrographs of 5 day-old full fat Cheddarcheese at a) room temperature and b) 95°C. The micrographs showprotein, as red areas, and fat, as green areas (Guinee and Fox, 2001).
1.4 Importance of Rheology of Cheese
Research on cheese is currently concentrated on areas such as
production of cheese, improvement of taste and texture in low fat cheese, and
post-production processing and product development.
To efficiently produce and process cheese, one must understand its
rheology. Understanding its rheology allows the design of optimized processes
and cheese handling equipment. In addition, the rheology of the raw material;
milk, intermediate product; cheese curd, and the final product; cheese, is highly
dependent on the different variables associated with the different production
stages of cheese. Thus, full understanding of the rheology during manufacture of
cheese is essential.
In analyzing cheese texture, various empirical and subjective methods of
characterization have been developed (Voisey, 1976; Bourne, 1982;
Gunasekaran and Ak, 2003). The development in the area of material science
and testing, however, has allowed more consistent measurements of rheological
properties of materials in general. Thus, a logical way to develop non-subjective
methods to characterize cheese texture is to correlate its rheological properties
with its sensory data/properties. In this way, the rheological properties of a

CHAPTER 1 - FUNDAMENTALS 8
cheese can be correlated to its textural attributes such as chewiness,
cohesiveness, firmness, adhesiveness, stickness, etc. Besides utilizing the
rheological properties to predict the textural behaviour of cheese, these
properties can be useful in predicting the quality of the final product as cheese is
sometimes used as raw material and processed into other food products.
Post-production processes of cheese can be done to increase the shelf life
of the cheese or to add value to the cheese by improving its texture, shape and
overall commercial attractiveness. Value added food products make them
commercially attractive and allow manufacturers to obtain higher profit margins
for their products. Again, understanding the rheology of cheese will aid in the
development and improvement of practical post-production processing
techniques such as extrusion or rolling. Application of such processing
techniques that are widely used in the processing of commercial synthetic
polymers to food materials allows the development of novel food products (for
example, co-extruding different types of cheeses using an industrial extruder to
manufacture a unique product; shaping cheese using an extruder and dies with
unique profiles to create cheese products with commercially attractive profiles). In
addition, understanding the performance of cheese during these operations may
be beneficial to the dairy industry as they may identify alternative ways of more
efficient and more economical ways of continuous processing. In fact, a recent
US patent illustrates how extrusion process can be used to manufacture string
cheese (Cortes-Martines, 2005).
It is clearly illustrated above that a common aspect in the aforementioned
fields of interests and research areas is the study of the rheological behaviour of
cheese. It is noted that rheology is the study of deformation and flow of materials
when they are subjected to external forces and it plays a critical role in
understanding the practical characteristics of the material and its processing
behavior. Although empirical measurements on the rheological properties of
cheese have been around for sometime (Bourne, 1982; Arnott et al., 1957; Fife et

CHAPTER 1 - FUNDAMENTALS 9
al., 2002; Gunasekaran and Ak, 2003), these methods result in parameters that
are not acceptable rheologically since they depend on the geometry of the
equipment and/or the shape and size of the sample. Fundamental
measurements, using well established methods yielding consistent and
comparable material properties parameters, have gained more importance over
the past decades. However, most of these have been restricted to dynamic
oscillatory and uniaxial or biaxial extensional experiments; while other rheological
characterization techniques such as capillary extrusion and rolling have not been
widely utilized. A more detailed study of the rheology of cheese using
rheologically acceptable measurement techniques is, therefore, necessary and
will be the main focus of this thesis.

CHAPTER 2:
GENERAL REVIEW
2.1 Introduction
The importance of understanding the rheology of complex food material as
a means for quality control has been realized since the early 1950s (see for
example, Arnott et al., 1957; Olson and Price, 1958). As discussed earlier, this
has led to the development of various rheological measurement techniques
which were mostly empirical in nature during these early years. In the past
decades, however, there has been a paradigm shift in how food manufacturers
utilize their understanding of food rheology. Now, understanding the rheology of
various food products (raw or otherwise) is critical as it does not only serve as a
means for quality control, but also forms the basis for product development.
In this chapter, a general review of the experimental and theoretical
aspects in the study of cheese rheology is presented. A brief summary of some
of the empirical experimental techniques that have been developed to study the
rheology of cheese will be presented first. This is followed by a discussion of the
more fundamental rheological measurements using well-established methods. A
simple model to describe linear viscoelasticity (the generalized Maxwell Model)
will also be presented. This chapter ends with a review of the basic equations
and the principles of operations of the experimental equipment utilized in this
work.
2.2 Rheological Techniques
2.2.1 Empirical Measurements of Cheese Rheology
In empirical measurements, tests are usually done to obtain rheological
properties that are poorly defined but which, from experience, are found to be
1 0

CHAPTER 2 - GENERAL REVIEW 11
related to the physical property and textural quality of the sample. These tests
are usually easy to perform, rapid and frequently use inexpensive equipment
(Bourne, 1982).
Meltability is an attribute of cheese that is widely examined empirically.
Traditional melt tests include one that was suggested by Arnott et al. (1957), and
the Tube (Olson and Price, 1958) and Schreiber tests (Kosikowski, 1977). In
each of these tests, a piece of cheese with specific dimensions is placed on a
dish or in a tube and then into an oven. There, it is heated to a specific
temperature for a specific period of time. The final dimensions (e.g. final height of
sample or diameter of spread) of the cheese are measured to determine its
meltability. Park et al. (1984), however, found that there is a significant lack of
correlation between Arnott and Schreiber tests.
One notable modification was proposed by Muthukumarappan et al.
(1999) who suggested a modified Schreiber test, where the cheese is placed
onto an aluminum dish, instead of glass and subjected to a much lower
temperature of 90 °C, instead of 232°C. In addition, they recommended that the
area covered by the melted specimen be used as an indicator of the meltability. It
was found that these modifications result into a better correlation between the
Schreiber and Arnott tests (Muthukumarappan et al., 1999).
Consistency (apparent yield stress) of cheese can be estimated using an
empirical method that uses cone penetrometer (Gunasekaran and Ak, 2003). In
this test, a cone assembly of specific mass and dimension is placed onto a
cheese sample and allowed to sink into its smooth and flat surface. Variation of
the penetrometer includes a spherical tip instead of a cone.
An empirical measurement to determine the stretchability of mozzarella
cheese is the "fork" test (Gunasekaran and Ak, 2003). In this empirical test, a fork
is used to vertically lift up a lump of melted cheese until the bulk of the cheese

CHAPTER 2 - GENERAL REVIEW 12
strands break. The length at which these cheese strands breaks indicates the
stretchability of the cheese. This test has low reproducibility, but it has been
found useful in comparisons between samples manufactured within the same
plant (Gunasekaran and Ak, 2003). Various modifications to the "fork" test have
also been developed (Gunasekaran and Ak, 1997; Fife et al., 2002;
Apostolopoulos, 1994). This includes the incorporation of a universal testing
machine to ensure consistent drawing speed of the probe. Thus, this is also
called the vertical elongation test.
In an empirical version of the horizontal uniaxial extension test, Guinee
and O'Callaghan (1997), cut a pizza base in half, without separating them.
Shredded cheese is sprinkled over the base at a density of 0.35g/cm 2 and heated
for 4 minutes at 280 °C. One half of the base is held constant, and the other is
pulled away at a constant speed of 3.3 to 10 cm/s until the cheese strands fail.
The distance between the pizza bases is used to indicate the stretchability of the
cheese.
2.2.2 Fundamental Measurements of Cheese Rheology
In fundamental tests, well-defined rheological properties are quantified.
However, the results from these tests do not necessarily reflect the feeling when
the food is masticated (Bourne, 1982). Fundamental tests can be classified
according to the type of deformations: shear, extension, shear/extension and
compression.
Shear Deformation
The most common shear deforming tests is the small amplitude oscillatory
shear. These dynamic oscillatory tests on cheese have been used extensively
(Ak and Gunasekaran, 1996; Venugopal and Muthukumrappan, 2003; Taneya et
al., 1979; Nolan et al., 1989; Subramanian and Gunasekaran, 1997a and 1997b).
In performing dynamic oscillatory tests, it is important to determine first the region
of linear viscoelasticity. In this region, materials are deformed at relatively small

CHAPTER 2 - GENERAL REVIEW 13
scale and slow rate. In addition, in this region, the Boltzmann superposition
principle applies to describe the behaviour of a linear viscoelastic material (see
Section 2.3). Subramanian and Gunasekaran (1997a) determined the region of
linear viscoelasticity of Mozzarella cheese at various conditions. In general, linear
viscoelastic range decreases with an increase in temperature and age. From the
tests (temperature range of 10 °C to 70°C and age of 1 week to 12 weeks), it was
determined that a range of 0.05% shear strain ensures that tests are within the
linear viscoelastic limit. It was also found that the region of linear viscoelasticity
decreases with an increase in test frequency. In addition, previous studies on the
viscoelastic behaviour of various types of cheeses have been limited to a shear
strain of less than 1% (Nolan et al., 1989; Wium and Qvist, 1997; Ak and
Gunasekaran, 1996; Drake et al., 1996).
If cheese is compressed or heated, fat tends to be exuded from the
cheese sample, a process called "oiling-off'. This poses a unique challenge as
the fat will induce significant slip. Using waveform analysis, Nolan et al. (1989)
found that using pitted aluminum plates and bonding the cheese sample onto the
plates with cyanoacrylate resin can prevent slippage and ensure that the test can
be performed under constant temperature with relatively short equilibrium time
(within 70°C ± 2°C within 30 seconds). Subramanian and Gunasekaran (1997a
and 1997b) used coarse sand paper glued onto the plates to prevent slippage in
their experiments.
With respect to storage, Subramanian and Gunasekaran (1997b)
performed small amplitude oscillatory shear tests on Mozzarella cheese. They
found that proteolysis during storage causes the cheese to soften, thus
decreasing the dynamic moduli. The effect was found to be significant in the first
four weeks of ripening. This finding is further supported by Joshi et al. (2004), Ak
and Gunasekaran (1996), Tunick et al. (2000), Diefes et al. (1993), Yun et al.
(1994), and Subramanian and Gunasekaran (1997a). The changes that occur
during storage can be attributed to the break down of proteins which causes the

CHAPTER 2 - GENERAL REVIEW 14
moisture from the fat channels to be absorbed into the protein matrix. As a result,
the protein network becomes more hydrated and weakened, resulting in the
decrease of the dynamic moduli (Joshi et al., 2004). Further, the elastic modulus
decreases due to the softening of internal structure (Joshi et al., 2004). Tunick et
al. (1997) suggested that the coalescence of fat globules causes the decrease of
dynamic moduli and Ak and Gunasekaran (1996) suggested that the binding of
water by ionic groups produced during storage (and proteolysis) causes the
viscous modulus to decrease.
With increase in temperature, the dynamic moduli were noticed to
decrease (Joshi et al., 2004; Hsieh et al., 1993; Venugopal and
Muthukumarappan, 2003; Guinee et al., 2002; Karoui et al., 2003). Guinee et al.
(2002) also noticed a steep reduction of the dynamic moduli in the temperature
range of 20°C to 45°C, which was attributed to the melting of the fat phase. They
further observed a decrease in elastic modulus up to a temperature of 80 °C. Loss
tangent, on the other hand, is expected to increase with temperature as observed
by Karoui et al. (2003) who performed experiments with Comte and Emmental
hard cheeses.
Subramanian and Gunasekaran (1997b) were able to perform time-
temperature superposition on the dynamic rheological properties (G', G" and if)
of Mozzarella cheese successfully over a temperature range of 10 °C to 70 °C. In
the same work, the storage modulus was used to predict the generalized Maxwell
model parameters such as Newtonian viscosity and relaxation time. It was found
that generally, as the cheese matures, the viscosity of corresponding Maxwell
elements shifts towards smaller values.
To investigate the effect of large and small scale deformations on various
food products, including cream cheese, Bistany and Kokini (1983) utilized the
Cox-Merz rule to determine the consistency of the viscosities obtained from small
and large scale deformations. They found that the rheology of the food product is

CHAPTER 2 - GENERAL REVIEW 15
dependent on the scale of deformations and suggested that a modified Cox-Merz
rule with an experimentally determined constant to shift one of the viscosities be
used to describe such systems. Yu and Gunasekaran (2001), on a similar work
on other various food products, including mozzarella cheese, also made similar
observations. They have provided further discussion and essentially have
attributed the dependencies of the rheology of the cheese on the scale of
deformations and the ability of the cheese to maintain its structure as a solid.
Extensional Deformation
Ak and Gunasekaran (1995) performed a vertical uniaxial extension of low
moisture part skim Mozzarella cheese in an oil bath that was kept at 60 °C by
applying a constant force. It was found that strain rate and sample temperature
increase simultaneously during the test and a sample extension of more than
400% was achieved. In addition, it was also observed that the transient
elongational viscosity of the sample decreases during the test, with the authors
attributing this effect to the increase in temperature. It was also found that aging
the cheese up to 28 days does not significantly affect the transient elongational
viscosity. However, this might be due to the low sensitivity of the apparatus used
in their experiment (Ak and Gunasekaran, 1995).
Horizontal uniaxial extension tests on Mozzarella cheese were done by Ak
et al. (1993). This was achieved using a universal testing machine and a set of
pulleys that translate the downward crosshead motion of the universal testing
machine to a horizontal movement of one of the clamps that held the cheese
sample. The clamps and the cheese sample were held in a constant
temperature-heated oil bath to allow testing at elevated temperature and to
prevent sagging. It was found that fracture stress and deformability modulus
decreases with an increase in temperature. On the other hand, the fracture strain
increases with temperature.
Wang and co-workers (1998) developed a device (UW meltmeter) that is

CHAPTER 2 - GENERAL REVIEW 16
capable of performing lubricated squeezing flow to subject the cheese sample to
biaxial extensional. Using this device, Wang et al. (1998) generated the biaxial
stress growth coefficient as a function of biaxial extensional strain rate to
determine the meltability of Mozzarella and Cheddar cheeses under various
conditions (temperature, fat level and compression force). The result suggested
that at constant compression force, higher fat and higher temperature resulted in
the Mozzarella and Cheddar cheeses to have lower biaxial stress growth
coefficients, thus they flow more easily. Using a modified UW Melt Profiler,
Gunasekaran et al. (2002) found that the softening points of various cheese
samples compare reasonably well with the temperature at crossover modulus
determined from temperature sweep under small amplitude oscillatory shear test.
A common problem that is faced most commonly in performing extension
tests is the rapid localized build up of stress concentrations at the fixed ends of
the sample (Pesenti and Luginbuhl, 1999). It was found that dumbbell sample
shape, i.e. having smaller cross sectional area at the middle of the sample helps
in ensuring that fracture does not occur near the clamps, without the need to
apply a notch (Pesenti and Luginbuhl, 1999). In the present study, extensional
tests will be performed using the Sentmanat Extensional Rheometer (SER) (see
section 4). Its unique design prevents localized buildup of stresses at the fixed
end of the sample, thus allowing true extensional deformations and fracture to
occur in the middle of the fixed ends. Again, "oiling-off' will be a major challenge,
especially since the clips that hold the sample in the SER are relatively small.
However, tests have shown that the usage of sand paper helps in eliminating
slip.
Shear/Extensional Deformations
Shear and extensional deforming tests can be achieved by using a
capillary rheometer (Cogswell, 1977). Capillary rheometry has been widely used
to characterize and analyze the processing behaviour of molten polymers (Dealy,
1982, Ferry, 1980). The basic equations utilized in the analysis of capillary flow

CHAPTER 2 - GENERAL REVIEW 17
can be found in section 2.4.3. Several authors have also used a capillary
rheometer to characterize viscoelastic food materials due to their similarities with
molten polymer (Smith et al., 1980; Shukla and Rizvi, 1995; Taneya et al., 1992;
Sharma et al., 1993). However, very few of these are done on cheese. Smith et
al. (1980), have used a capillary rheometer, to test Mozzarella cheese. They
have found that Mozzarella cheese is a Herschel-Bulkley fluid. It was also found
that the drop in viscosity in the 55 °C to 70°C temperature range is more
pronounced than in the 40 °C to 55°C range. It was reported that fat separation of
Cheddar and American process cheeses induces a serious slippage problem
during capillary flow (Smith et al., 1980).
Compression Deformation
Another common test that is usually carried out to characterize cheese is
compression. Jaros and Rohms (1994) conducted compression tests of 136
Swiss cheese samples with an Instron testing machine under constant strain
rate. They found that fracture stress and strain are significantly lower in constant
strain rate compression than in constant speed compression. However, the
modulus of deformability was found to be unaffected by the different test setups.
Compression tests have also been used to characterize Leicester cheese
(Vernon Carter and Sherman, 1978), Cheddar cheese (Hort and Grys, 2000; Ak
and Gunasekaran, 1992) and various kinds of cheeses (Shama and Sherman;
1973). It was shown that typically, initially compression force increases almost
linearly with the degree of compression before it plateaus or decreases slightly
followed by a sharp increase in the compression force. In these compression
tests, it was shown that compression force varies enormously from sample to
sample and that it depends on the compression rate (Shama and Sherman,
1973; Wium et al., 1997; Wium and Qvist, 1997; Ak and Gunasekaran, 1992). At
higher deformation rates, stress achieved higher values because cheese has
less time to relax (Wium et al., 1997).

CHAPTER 2 - GENERAL REVIEW 18
Ak (1993) examined the effect of anisotropy of Mozzarella cheese on
compression deformation. It was found that at relatively high deformations (50%
and 75%), the associated force is higher when the fibers in the sample are
perpendicular to the compression direction. This is also supported by previous
finding by Cervantes et al. (1983). This anisotropy has also been attributed to a
type of Swiss hard cheese; the Gruyere de Comte cheese (Grappin et al., 1993).
Compression tests have also been used to investigate the effect of water
in the cheese. It was found that as moisture content decreases, the modulus of
deformability and fracture stress increase (Tunick et al., 1993; Prentice, 1992;
Visser, 1991; Rohm et al., 1992; Tunick et al., 1991). Prentice (1992) suggested
that as moisture content increases, less protein is present in the cheese. In
addition, water, having a low viscosity, provides a good lubrication between the
fat and the protein. These and the fact that the diffusion of water into the protein
creates swollen protein particles that causes cheese with higher moisture content
to deform more easily (Prentice, 1992). The fracture strain, however, was found
to show more dependence on the age of the cheese than on the moisture content
(Visser, 1991; Rohm et al., 1992).
2.3 Generalized Maxwell Model
A very simple model of a linear viscoelastic material, a Maxwell element,
consists of a spring in series with a dashpot containing a Newtonian fluid. If the
spring constant is taken to be analogous to the modulus of the Hookean solid,
and the dashpot constant analogous to the viscosity of the Newtonian fluid, then
the Maxwell model is (Dealy, 1982):
dtT +X
dt-le- =11
° 'if
= ^=(2.1)
where t is the stress tensor, X is a time constant (the relaxation time), n o is the

CHAPTER 2 - GENERAL REVIEW 19
zero shear viscosity of the linear viscoelastic material, and Y is the rate of
deformation tensor.
This equation can be solved for the stress tensor to result:
r-r
ti = f^y(t)dti^
(2.2)
When written in this form, the model states that the stress at the present time t
depends on the rate of strain at all past times t' (- co < t' t), with a weighting
factor that decays exponentially.
Actual relaxation processes cannot be described by a single exponential
function. More flexibility can be obtained by the use of the generalized Maxwell
model, which is achieved by connecting a number of Maxwell elements in
parallel. Then the total stress is a superposition of the partial contributions of
each element:
di± X. =r=1^dt
= 11 0 , 1 If and t i = ET,-^1, 1
(2.3)
or
N -/-1'
= fE 0
e= _00=1 Xi
(2.4)
where N is the number of Maxwell elements, and X i and ri o,i are the relaxation
time and shear viscosity of the i th Maxwellian element respectively.

0)0)
Fluidsample
RPressuretransducer
HI
CHAPTER 2 — GENERAL REVIEW 20
2.4 Basic equations of the principles of operations of the experimental
equipment
2.4.1 Parallel Plate Flow
Rotational rheometers equipped with parallel-plate or cone-and-plate
geometries are commonly used to perform rheological measurements at low
shear rates and small deformations (linear viscoelasticity). A simple schematic of
a concentric parallel plate geometry is shown in Fig. 2.1. In this setting, the
sample is placed in between the two concentric plates which are mounted on a
common axis of symmetry.
Fig. 2.1 Schematic diagram of a parallel plate rheometer.
Under steady shear mode, the upper plate is rotated at a specified steady
angular velocity co to impose a steady shear deformation to the sample. The
resulting torque, M is measured which can then be converted to meaningful
rheological parameters such as shear stress and shear viscosity. The shear rate
in parallel plate rheometer experiments is given by the following expression
(Dealy, 1982):
)2 = r • co
H(2.5)

CHAPTER 2 — GENERAL REVIEW 21
where a is a rotational speed, r is the distance from the center of the plate, and H
is the gap size between plates. Rotational rheometer can also be operated in a
stress-controlled mode, where the torque is fixed and the displacement is
measured.
Since the shear rate is a function of the plate radius, the shear rate in the
gap is not uniform. This makes it impossible to calculate values of material
functions on the basis of a single experiment, and differentiation data is required
as indicated by the following equations, obtained by performing a force balance
(Dealy, 1982):
2F =[1+ 1 dlnF ] xr tz \ AT , w, \
IY IVR) iv 2kiRiIrR 2^2 din) R
3M 1+ 1 dlnM)770/R)= 27rR 37R 3 din)*/ R
where R is the radius of the plate, F and M are the force and the torque needed
to rotate the plate, respectively, N1 and N2 are the forces exerted by the material
perpendicular and along the plate, respectively, and 17(2 R )is the viscosity at the
shear rate value calculated at r = R.
Rotational rheometer can also be operated in a dynamic mode to obtain
the linear viscoelastic properties (storage and loss moduli and dynamic viscosity)
of the sample. In this mode, the sample is subjected to small amplitude
oscillatory shear deformations given by:
(2.6)
(2.7)
70= yo sin(cot)^ (2.8)
where yo the strain amplitude and w is the frequency. The stress is then

CHAPTER 2 - GENERAL REVIEW 22
measured as a function of time. If the amplitude does not exceed its small linear
viscoelastic limit, it can be shown that the shear stress is sinusoidal in time and
independent of strain:
a-(t) = 60 sin(cot + 8)^ (2.9)
where o is the stress amplitude and 6 is a phase shift, or the mechanical loss
angle.
Using a trigonometric identity, one can rewrite eqn. 2.9 in the following
form:
^a -(t) = 7 0 [G'(w) sin(wt) + G" (co) cos(wt)]^(2.10)
where G'(0)) is the storage modulus and G"(co) is the loss modulus. These two
quantities can be calculated from the amplitude ratio, Gd = 60 /70 , and the phase
shift, 8, as follows:
^G' = Gd cos(8) and G" = Gd sin(8)^(2.11)
For a parallel plate rheometer, which was used in this work, the equations
for calculating the storage and loss moduli in terms of the actual test variables
are as follows:
2G' =
Mhcos and G" =
2M°^h
sin g71R 4 0000^71R4
(2.12)
where Mo is the torque amplitude, R is the plate radius, and 0,, is the angular
amplitude.

CHAPTER 2 - GENERAL REVIEW 23
The complex viscosity, ii', which approximately equals the real viscosity
under small deformation, can be calculated as:
77^(1 2 G") 2
A co^co(2.13)
To better understand the physical meaning of the storage and loss moduli,
it is useful to examine two limiting cases: a Newtonian fluid, which is linear and
purely viscous, and a Hookean solid, which is linear and purely elastic. In the
case of a Newtonian fluid, G' is zero and G" equals to rico, where ri is the fluid
viscosity. The mechanical loss angle is at its maximum, 90°. This means that in a
Newtonian fluid, the shear stress is in phase with the shear rate and out of phase
with the strain. For a Hookean solid, G' equals to its shear modulus, G" is zero,
and the mechanical loss angle is zero. This means that in a Hookean solid, the
shear stress is in phase with the strain.
2.4.2 Extensional Flow
In this work, the Sentmanat Extensional Rheometer (SER) is used to
investigate the extensional properties of the cheese sample. A schematic of the
SER is shown in Fig. 2.2.
In an extensional flow, the Hencky strain, E H , is defined as:
c, = ln()Lo
(2.14)
where L is the length of the specimen at any time, and Lo is its initial sample
length.

SlaveDrum
Sample
rMastDrum
AM,
IntermeshingGears^
Lo
Clips
CHAPTER 2 - GENERAL REVIEW 24
Fig. 2.2 Schematic diagram of Sentmanat Extensional Rheometer (SER).
The Hencky strain rate, e i, , is then obtained by taking the derivative of the
Hencky strain with respect to time
.^de H 1 dL^E H = dt L dt
(2.15)
For small deformations, the change of length with time can be
approximated to the initial length and eqn. 2.15 becomes
.^1 dLSH -Lo dt
(2.16)
Since the change of length with respect to time is essentially the linear
velocity at which the sample is been stretched, it can be converted into angular
velocity taking into account the drive shaft rotation rate, f), and the radii of the
drums, R (Sentmanat, 2003). Thus, eqn. 2.16 becomes

CHAPTER 2 - GENERAL REVIEW 25
.^2C2REH = Lo
(2.17)
The instantaneous torque reading, T(t), acquired from the instrument can
be converted into instantaneous force, F(t), by:
T(t) = 2RF(t)^ (2.18)
The instantaneous cross sectional area, A(t), of the stretched specimen
changes with respect to the initial cross sectional area, Ao , in an exponentially
fashion as follows:
A(t) = Ao exp(-i.H t)^ (2.19)
The tensile stress, QE, can be then estimated as
F(t)^F(t) GE =^=
A(t) Ao exp(4 H t )(2.20)
Finally, for a constant Hencky strain rate, the tensile stress growth
function, 7 1E+ (t), of the stretched sample can be expressed as
11 +E(t)= . E =^.F(t)
=^F(t)
s H A(t)sH Ao exp(-e H t )E H(2.21)
2.4.3 Capillary Flow
The simplest and most popular industrial type of rheometer is the capillary
rheometer shown in Fig. 2.3 (Dealy, 1982). In this partially controllable flow, a
sample flows from a large reservoir into a capillary of small diameter. The flow
can be imposed either by means of an imposed pressure or a piston moving at a
fixed speed. Far from the capillary entrance where the flow is fully developed, the

Sintered PTFE(to minimizebackflow)
Rheometer barrel
Motor drivenpiston
Electrical heatersThermocouple
Db(Barreldiameter)
Die entrance(contraction) zone
Die capillaryzone (L)
Tapered capillary die
Fig. 2.3 Schematic diagram of capillary rheometer.
CHAPTER 2 — GENERAL REVIEW 26
streamlines are parallel to the channel axis, but the velocity profile depends on
the rheological nature of the fluid. Unless a specific constitutive equation is
known to be valid for the fluid, as in the case of a Newtonian fluid or a power-law
fluid, special computational techniques are required to calculate the shear stress,
shear rate and viscosity.
For the steady flow of an incompressible fluid in a tube of radius R, driven
by a pressure gradient dP/dz, the Cauchy equation (momentum balance) on a
cylindrical element of the fluid gives (Dealy and Wissbrun, 1990):
dp 1 a0 = --
dz +–
r—ar
fro-,) (2.22)
By integrating and assuming P = P(z), and that stress is finite at the centerline,

2L
-AP • Rc. ' -crzt-R = (2.24)
CHAPTER 2 - GENERAL REVIEW 27
c,(r)=; (1)^(2.23)
When the flow is fully-developed over length L, the absolute value of the shear
stress at the wall 6,, is:
where AP is the pressure drop over the length of tube. The pressure drop, AP, is
always a negative quantity, because the flow is in the direction of the axial
coordinate, z.
For a Newtonian fluid, the shear stress is proportional to the shear rate:
c = 177 (2.25)
and the viscosity, 77, does not change with y . Combining eqn. 2.22 with eqn.
2.25, using j/ = du I dr and assuming that the velocity at the wall is zero, the
velocity profile can be obtained as:
u(r) _ 2Q2 [1 (Rr7r^)21(2.26)
where Q is the volumetric flow rate. This is the velocity profile for "fully developed
flow" in which the effects of the entrance and exit are assumed negligible and
there is thus no velocity component in the radial direction. The velocity
distribution is parabolic and the shear rate at the wall is given by:

CHAPTER 2 - GENERAL REVIEW 28
4Q
r=R 7R 3
(2.27)
For non-Newtonian fluids, if a specific constitutive equation is assumed,
one can derive equations analogous to those valid for Newtonian fluids. For
example, if shear stress depends on shear rate according to the power law
relationship
cr = Kr^ (2.28)
where K is the consistency index and n is the power-law exponent, it can be
shown that the wall shear rate is (Dealy and Wissbrun, 1990):
3n + 1^4Q(2.29)
4n^n-R 3
(
and the velocity profile is given by:
1+1
40= 3n + 1 Q 1
( r1?) n(2.30)
n +1 ,rR 2
The bracketed quantity in eqn. 2.29, which is equal to the wall shear rate in the
case of a Newtonian fluid, no longer has this significance when the fluid is non-
Newtonian. It is, however, referred to as the "apparent shear rate", 2, 4 .
Using eqn. 2.27, eqn. 2.28 and eqn. 2.29, it can be shown that the wall
shear rate, oi,„, is:

CHAPTER 2 - GENERAL REVIEW 29
Kr 3n+1)1 4Q j n _Kr3n±lj n . n4n ) g R 3^4n 1 A (2.31)
Therefore, a plot of log(01,) versus log()>) will be a straight line for a power-law
fluid, and the constants K and n can be determined from the slope and theintercept.
However, even if there is no constitutive equation relating the shear stress
to the shear rate, a special technique can be used to determine the true wall
shear rate and the viscosity for any non-Newtonian fluid. This technique requires
pressure drop data for several different flow rates. It can be shown that these
data should fall on a single curve when a plot of log(o - ) versus log(yA ) is made.
The shear rate at the wall is given by
3+114Q) 3+b .— 4^771?3^4 TA
where b is the Rabinowitsch correction given by
b =d(log ;,, )
d(logo- ,„)
(2.32)
(2.33)
This correction term is a measure of the deviation of a polymeric fluid from
Newtonian behaviour. It equals unity for a Newtonian fluid and 1/n for a power-
law fluid.
In a capillary rheometer, there is a large pressure drop associated with the
flow in the entrance region (see Fig. 2.4), especially in the extrusions of pastes
(Corfield et al., 1999; Halliday and Smith, 1995). This must be taken into account,

CHAPTER 2 — GENERAL REVIEW 30
if the reservoir pressure is the quantity measured to determine the wall shear
stress. There also appears to be a small residual pressure at the exit of the
capillary. The total pressure drop for flow from the reservoir, through the capillary
and out to the ambient pressure can be considered to consist of three
components:
AP = APe,„ + AP „p^exit^AP„p^(2.34)
where APent is the excess pressure drop due to entrance flow, LPcap is the
pressure drop for fully developed flow in a capillary, and APexit is the excess
pressure drop due to exit flow. The end correction, LPend, can be corrected by
using a technique outlined by Bagley (1957). In this correction, the driving
pressure, Pd, is measured for various values of the flow rate using a variety of
dies with different length-to-diameter ratio. For each value of Y A , the driving
pressure is plotted versus UD and a straight line is drawn through the points.
Extrapolating the lines corresponding to various values of 2 ./A to UD=0, an end
correction is obtained, which is often called "Bagley correction" (Fig. 2.5). Thus,
the true wall shear stress which is obtained over most of the length of the
capillary (except in the entrance) can be calculated as follows:
crw = (Pd — APend) (4LID)
Wall pressure
exit
AP.„.„ ce
Distance from entrance
Fig. 2.4 Pressure distribution in a reservoir and capillary.
(2.35)

CHAPTER 2 — GENERAL REVIEW 31
Pd
it = const
APend {
L/DFig. 2.5 Bagley plot (schematic).
2.4.4 Rolling
Roll forming experiments can be performed using the Sentmanat
Extensional Rheometer (SER). A schematic of the set-up of the SER for rolling
experiment is shown in Fig 2.6.
The shear force on each roller can be calculated from the total torque of
the rheometer as follows:
Fs —AR^ (2.36)
where Fs is the shear force, Tis the torque, and R is the radius of the roller.
However, since the area of contact between the sample and the rollers is usually
different for each run, it is proper to normalize the shear force by the area of
contact, A, to obtain an average shear stress, a s , according to:
0- -- 17s^2. R • A (2.37)
The area of contact can be calculated based on the sample width and the arc
formed by the angle 0 as illustrated in Figs. 2.6 and 2.7.

MasterDrum
Lo
^SlaveDrum
IntermeshingGears^
Sample
MasterDrum
CHAPTER 2 — GENERAL REVIEW 32
°41)
Fig. 2.6 A schematic of the set up of SER for rolling/calendaring experiments.
Referring to Fig 2.7, one can calculate the arc of contact of the sample
and the drum as follows:
SlaveDrum
Arc of contact^= OR
= (91 + 02 )R

Drum
tF = Feed sample thicknesstG = Gap between the rollerstE = Exit sample thickness
CHAPTER 2 — GENERAL REVIEW 33
_1(RRcos^Fj+ cos- ' (-E 1R
where R = + R tF^+ tG —tF^tE^+ tG — tF
=2R and =
2R=^+R^2^2
cos
^
[^2R
REE^2^2^2
+ cos
2
thus,
Arc of contact =^1 (2R + tG — tF _1 (2R + tG —t 1,)1R
2R
6 — t F ) —tE ) R=[cos -' (1 (t ^+ cos- 1 1 (tG
2R^2R(2.38)
It must be noted, however, that the arc of contact defined above is half of the
total arc of contact.
Fig. 2.7 Schematic of one of the SER drums in rolling.

CHAPTER 3:
SCOPE OF WORK
3.1 Introduction
Although many studies on the rheology of mozzarella cheese have been
performed, they are mostly empirical in nature. This limits the leverage that can
be accomplished based on these studies. Consequently, optimization on
manufacturing and production processes is also limited.
Fundamental measurements, using well established methods yielding
consistent and comparable material properties/parameters, have gained more
importance over the past decades. However, most of these have been restricted
to dynamic oscillatory and uniaxial or biaxial extensional experiments. Studies on
other rheological characterization techniques such as capillary extrusion and
rolling are scarce, even though these techniques have the potential for being
used as a much more efficient post production processing method. Furthermore,
to well-characterize a cheese, one must not only consider thoroughly the
consistency of the measurements obtained from a rheometer, but also
consistency of measurements obtained from a variety of rheometers. This allows
characterization to span over a wide range of stress and time scales and capture
the processing and post production behavior of the cheese.
3.2 Thesis Objectives
The research project is mainly experimental. The main focus of the project
is to provide a clearer insight on the rheology of mozzarella cheese and its
relations to practical processing possibilities.
The particular objectives of the project are summarized as follows:
34

CHAPTER 3 - SCOPE OF WORK 35
1. To apply well-established fundamental rheological techniques to characterize
mozzarella cheese. In specific, linear and non-linear viscoelastic
measurements are performed in order to characterize the materials
rheologically.
2. To understand the relationships between the rheological measurements
obtained from different modes and scales of deformations. In other words,
consistency of experimental results from different rheometers is sought.
3. To assess the processability of these materials in capillary flow and rolling.
Important parameters to be studied are the surface texture and smoothness
of the extrudates, wall slip of materials during flow and the effects of pressure
and temperature on the flow curve of mozzarella cheese.
4. To identify the rheological properties which play a role in the processability
and shapeability of mozzarella cheese, together with possible structural and
texture changes that may take place during capillary flow and rolling.
5. To assess the effect of storage duration on the structure of mozzarella cheese
by means of small amplitude linear oscillatory method.
3.3 Thesis Organization
The first chapter of the thesis provides fundamental information on
manufacture, structure and properties of cheese. The motivation for the work is
also discussed in Chapter 1. This is followed by some important literature review
on cheese rheology, with particular emphasis to empirical and fundamental
rheological measurements of cheese (Chapter 2). Chapter 2 includes a review of
linear viscoelasitcity and the basic equations that are utilized in rheological
analysis throughout the project. Chapter 3 is a summary of the detailed
objectives of the work and the thesis organization. This is followed by a
CHAPTER 3 - SCOPE OF WORK 36
description of the experimental apparatus, procedures and materials used in the
present study (Chapter 4). A discussion of the linear viscoelastic behavior of the
mozzarella cheese is presented in Chapter 5 (objective 1), while Chapter 6
focuses on the non-linear viscoelastic behavior and its consistency with linear
viscoelasticity (objective 1). The extensional behavior of mozzarella cheese and
its consistency with linear rheology is described in Chapter 7 (objective 1).
Following this, the capillary extrusion of mozzarella cheese, with thorough
discussion on end pressure corrections, wall slip, effect of die geometries and the
comparison with linear rheology, is presented in Chapter 8 (objectives 2, 3, and
4). Chapter 9 provides results on the roll forming of mozzarella cheese
(objectives 3 and 4) and Chapter 10 discusses the effect of frozen storage on the
linear viscoelastic properties of different brands of mozzarella cheese (objective
5).Finally, the thesis is concluded in Chapter 11, with a general summary of the
main findings of this work and their practical implications, contributions to
knowledge, and some recommendations for future work.

CHAPTER 4:
EXPERIMENTAL WORK
4.1 Introduction
This chapter describes the mozzarella cheese used in this study and
provides a description of the experimental equipment and procedures used to
study the rheological behaviour of the mozzarella cheese. The three most basic
rheometers; the concentric parallel plate rheometer to study the linear and non-
linear viscoelastic behaviour, the extensional rheometer to carry out large scale
extensional deformation measurements, and the capillary rheometer to study the
post-production processing behaviour of mozzarella cheese, are the main pieces
of equipment in this study. Hence, the bulk of this chapter is devoted to the
description of these rheometers. It is noted that the basic equations associated
with these rheometers are discussed in Chapter 2. The present chapter also
describes other characterization technique such as the use of the extensional
rheometer to perform rolling/calendaring experiments. Reproducibility of
measurements is very important in working with a material such as mozzarella
cheese. Some experimental techniques employed in addressing some of the
challenges in generating consistent measurement are also described.
4.2 Material
Best Buy Mozzarella cheese manufactured by Lucerne Foods (Calgary,
AB Canada) available at a local grocery store is used as the main material for
this study. Table 4.1 summarizes the chemical composition of the mozzarella
cheese (J.R. Laboratory, Burnaby, BC).
Since the cheese is obtained as a ready to eat consumer product, there is
limited control on its quality. Hence, its gross structural uniformity and suitability
as a testing material was investigated initially. The main purpose of assessing its
gross uniformity was to ensure that any observations made in the rheological
37

CHAPTER 4 — EXPERIMENTAL WORK 38
measurements during the completion of the project were not due to experimental
artifact arising from the heterogeneity of the samples. Sample gross structural
uniformity was assessed by performing small amplitude oscillatory shear
measurements periodically and before every major testing. On average, this type
of measurement was performed on new batches of cheese about every two
months.
Table 4.1 Compositional analysis of Best Buy mozzarella cheese.
Component ContentDetection
LimitMethod
Carbohydrate 6.08 wt.% -Calculated as (100 — wt.%moisture — wt.%protein— wt.%fat — wt.%ash)
Fat 25.29 wt.% 0.10%
Modification of AOAC 991.36 (extraction time atboiling was 3.5 hours instead of 25 minutes;drying oven temperature was 100 °C instead of125°C)
Moisture 42.44 wt.% 0.10% AOAC 950.46
Protein-total 22.60 wt.% 0.50%
Modification of AOAC 981.10 (weight of samplewas 1.0 g instead of 2.0 g; digestion time was 2.5hours instead of 45 minutes; acid used fortitration was sulfuric acid instead of hydrochloricacid)
Calcium 745.2 mg/100g -Modification of AOAC 985.35 (microwavedigestion instead of ashing)
A summary of typical result from these periodic measurements are plotted
in Fig 4.1. As can be seen, there are some variations in the dynamic viscoelastic
properties of the different batches of the mozzarella cheese. The maximum and
average standard deviations in the measurements from the average are about
13.7% and 7.3%, respectively. These values are in the range expected for this
kind of material, where sample heterogeneity is prominent (Peck et al., 2006;
Cheyne et al., 2005). In fact, these values can be considered relatively low and
acceptable compared to other reported results in the literature (eg. about 10%
variations in Bagley et al. 1998; 5%-10% variations in Cheyne et al., 2005).

CHAPTER 4 — EXPERIMENTAL WORK 39
106
0_ED 105
0
0E
EC.)
104
C
0
103
107
106
106
104
103
10 2
Temperature = 25°C
4 14G' .t.IINIMesawittionfittflifilifrirfrfrt:
9,6
^G" i>s*6 fe:12 Atteatfig wi
tt/^rfillrr
s"-40:114VI8
*Syat,v
el4t th,f
* °a19a
.„ .■^I^lid",^
I^11.11111
10-2^10-1^10°^101^
102^
103
Frequency, co (rad/s)
Fig. 4.1 Gross structural uniformity check of the different batches of mozzarellasamples at 25 °C. Different symbols and grey shades correspond todifferent experimental runs performed at different times throughout thecompletion of the project.
4.3 Experimental Equipment
4.3.1 Concentric Parallel-Plate Rheometer
A Bohlin C-VOR (Malvern Instruments, Worcestershire, UK), a stress-
controlled concentric parallel-plate rheometer, was used to measure the linear
and non-linear viscoelastic properties of mozzarella cheese. Since this is a
stress-controlled rheometer, a constant stress is applied on the sample and the
deformation is measured. This technique allows yield stress measurements to be
carried out. The C-VOR is also equipped with a convective oven with PID
temperature controller, which allows measurements at higher temperatures with
accuracy ± 0.1 °C.
4.3.2 Extensional Rheometer
The Sentmanat Extensional Rheometer (SER, Xpansion Instruments,
Akron, OH, USA) was used to perform extensional experiments. A schematic of

wque Response
Windup drums
Sample
Stretching ForceExerted By Sample
Intermeshing Gears
Drive Shalt Rotation
Housing
CHAPTER 4 — EXPERIMENTAL WORK 40
this rheometer is shown in Fig. 4.2. This rheometer is designed to be fitted into a
Bohlin VOR rheometer (strain-controlled rotational rheometer). Its unique design
allows the rotational motion of the Bohlin VOR motor to wind up the two drums on
which a sample is attached. As the drums wind, the sample is stretched uniformly
from its two ends. This results in uniform extensional deformation and failure
which occurs in the middle section of the sample.
The SER is also designed to fit into the chamber of the convective oven of
the Bohlin VOR. Thus, experiments can be carried out at high temperatures. In
addition, a separate data acquisition system that is capable of collecting data at a
rate of up to 5000 Hz is connected to the SER. This allows torque data to be
sampled every 0.005 second, which allows the measurement of transient
extensional behavior of mozzarella cheese. Practically, however, a sampling time
of 100 Hz was used.
Fig. 4.2 A schematic of the Sentmanat Extensional Rheometer (SER).
The SER was also used to perform rolling experiments. The set-up for
such an experiment using the SER is shown schematically in Fig. 2.6. The

------------ 0-------- 0--
IM M
0000 :
E
DataAcquisitionSystem
IBM Comp.
CHAPTER 4 - EXPERIMENTAL WORK 41
cheese sample is fed into the gap between the drums (which act now as rollers)
which are set to rotate at a specified speed. Although the rheometer does not
have the capabilities to measure the roll separating force, it yields other equally
important parameter such as the torque required to roll the sample.
4.3.3 Capillary Rheometer
A constant speed lnstron capillary rheometer (Instron, Norwood, MA,
USA) was used to simulate the process of ram extrusion, which is the most
common processing technique in synthetic polymer processing. The cross head
that drives the plunger is capable of traveling at a maximum speed of 51 cm/min
(20"/min). A 890 N (200 lb) load cells is connected to the plunger and it is used to
measure the extrusion load. The rheometer is connected to a computer that is
able to control the rheometer and record force-deformation data. The barrel has a
diameter of 0.9525 cm (0.375") and is equipped with PID-controlled heaters. The
effective length of the barrel is approximately 30.5 cm (12").
Load Cell
Plunger
Barrel
TemperatureControllers
1:1
El ControlPanel
Die
0^
0^
Thermocouple__Is
I IFig. 4.3 A schematic of the computer-controlled capillary rheometer
Capillary dies with various length and diameters were used to correct the
measurements for end pressures and to assess wall slip. All of these dies have

CHAPTER 4 - EXPERIMENTAL WORK 42
entrance angles of 180 ° . In addition, capillary dies with different entrance angles
were used to assess the effect of entrance angle on the extrusion pressure and
the extrudate appearance.
4.4 EXPERIMENTAL PROCEDURES
4.4.1 Concentric Parallel Plate Rheometry
As already discussed, parallel-plate rheometry was one of the methods
used to rheologically characterize mozzarella cheese. In using the rheometer,
sample preparation was found to be very crucial because the cheese samples
needed to be in contact with both the bottom and lower plates to ensure
consistent results. At the same time, the samples cannot be over-compressed as
liquid/fat migration will affect the measurement. Also over-compression may
cause the material to be under a stressed state and this may cause experimental
artifacts.
Thin slices (2 - 3 mm) were cut from a freshly procured block of cheese
using a cheese slicer. Circular samples (25 mm in diameter) were then cut from
these slices using a biscuit cutter. It was found that the best way to prepare the
samples was when the material had been cooled at low temperature (— 4 °C). At
this temperature, the cheese was firmer and this helped in producing good
samples. The cheese samples were left to equilibrate at room temperature for
about 2 hours in an air-tight container before experiments were carried out.
Shear experiments were done at 25 °C, 40°C, 50°C, and 60 °C and in general, the
experimental runs were repeated at least twice with fresh new samples as a
mean to gauge the accuracy of the measurements.
In these experiments, slip and moisture loss was a major issue. Sand
paper was found to be very practical in eliminating slip between the sample and
the plates. In addition, mineral oil was used to coat the outer circumferential area
of the sample to prevent moisture loss (Venugopal and Muthukumarappan,

CHAPTER 4 - EXPERIMENTAL WORK 43
2003). However, as will be discussed later, moisture loss cannot be completely
prevented.
4.4.2 Extensional Rheometry
In extensional rheometry, thin samples (- 0.8 mm thick) were used. For
the mozzarella cheese, this was obtained by cutting the samples, using a cheese
slicer, from a freshly procured cheese block which again had been cooled at low
temperature (-4 °C). These thin slices of cheese had different widths (-5 mm to
-12 mm), so that their cross sectional area could be controlled, and thus to
ensure that the extensional experiments were operated within the acceptable
range of operation of the torque transducer of the rheometer. The actual lengths
of the samples were not critical, as long as the cheese samples could be
clamped onto the SER drums. This is because the SER has a fixed sample
deformable length (which is the axis to axis distance between the two windup
drums of the SER). The cheese samples were again left to equilibrate to room
temperature for about 2 hours in an air-tight container before they were used for
the experiments.
In extensional tests, it is also important to ensure uniform width along the
length of the sample. This was achieved by using a dual blade cutter with
adjustable gap spacing. This allows preparation of cheese samples with different
uniform widths. The thickness and widths of the samples were measured using a
caliper and these dimensions were used to calculate the initial cross sectional
area (and used in the subsequent data analysis). In using this rheometer, slip
was also found to be a major challenge. It was found, however, that using sand
paper glued to the clips that clamp the sample onto the drums was able to limit
slippage. Moisture loss, especially, at relatively high temperatures were found to
be significant as will be discussed later. However, there was no practical way to
avoid this effect. Extensional experiments were done at 25 °C, 40°C, 50°C, and
60°C. In general, extensional runs were repeated at least three times to assess
the accuracy of the measurements.

CHAPTER 4 - EXPERIMENTAL WORK 44
4.4.3 Capillary Rheometry
Preliminary extrusion tests for the extrusion of cheese following the
method typically used for polymers (chopped and loaded into the barrel) did not
result into a steady state extrusion pressure. This was due to the air that was
trapped in the barrel during loading. A loading method where a mold was initially
used to cut a cylindrical cheese samples with diameter slightly less than the
barrel was used. A typical cylindrical cheese sample had a diameter of about 9
mm and a length of about 50 mm. These cylindrical samples were cut from a
freshly procured block of cheese at a low temperature (-4 °C) and were left to
equilibrate at room temperature for about 2 hours before being inserted into the
capillary barrel. This method proved to be an excellent way of loading the
rheometer reservoir and generating consistent measurements.
The actual extrusion process started first by heating the sample reservoir
and the capillary die to the desired temperature. After thermal equilibrium was
achieved, the cylindrical pieces of the cheese sample were loaded into the
sample reservoir of the rheometer. The piston of the capillary rheometer was
then driven into the capillary barrel at a constant speed to compress the cheese
until a pressure of about 10 to 20 N (2 to 5 lb) was achieved. At this pressure, the
piston was stopped and the cheese was allowed to rest for about 5 minutes. This
compression squeezes some of the air out of the barrel and facilitates more
efficient sample heating. The cheese sample was then extruded by driving the
piston at a constant speed. Force-deformation data was recorded throughout the
extrusion process and the steady state extrusion pressures were used to
construct the flow curves. Experiments were done at temperatures of 25 °C, 40°C,
50°C, and 60 °C and the extrudates obtained during steady state extrusion were
collected and analyzed visually and by means of an optical microscope. In
general, extrusions were repeated at least twice.
4.4.4 Rolling/Calendaring
The gap between the drums/rollers of the SER is fixed at a distance of

CHAPTER 4 - EXPERIMENTAL WORK 45
0.241 cm, thus samples with different thickness were prepared in order to
achieve different reduction ratios (the ratio of the sample thickness to the size of
gap between the rollers) for rolling/calendaring experiments. Slabs of cheese with
average thickness of 3.40, 4.20, 5.14, and 5.48 mm were used to achieve
reduction ratios of 1.4, 1.7, 2.1, and 2.3 respectively. The slabs of cheese were
cut from a freshly procured cheese block using a cheese slicer. Again, sample
cutting were done at a sufficiently low temperature (at —4 °C) and the samples
were left to equilibrate to room temperature in an air-tight container for about 2
hours. The slabs of cheese also had different widths (-5 mm to —12 mm), so that
the contact area between the sample and the rollers could be manipulated. This
ensures that the rolling experiments were operated within the acceptable range
of the torque transducer. The sample with the smallest thickness would be the
widest and vice versa. Six different linear roller speeds (1.44E-01, 7.19E-02,
2.86E-02, 1.44E-02, 7.19E-03, and 3.61E-03 (all speeds in m/s)) were used in
these experiments and rolling experiments were repeated at least three times.
The steady thickness of each sample after it had passed the rollers was also
measured using a caliper and recorded. Each value of thickness and width were
based on three measurements at different locations on the cheese sample.
During a rolling experiment, the rollers of the SER were set to rotate at a
specific speed and a slab of cheese was manually fed in between the rollers. The
torque needed to roll the sample was measured and recorded. The transient
response in the torque was discarded and the steady torque values were used to
calculate the average shear force. Although, the SER is designed to fit into the
convective heating oven of the rotational rheometer (Bohlin VOR, Malvern
Instruments, Westborough, MA, USA), so that measurements can be performed
at elevated temperatures, it was not practical to perform rolling experiments at
elevated temperatures as the rolling experiment involves manually feeding the
slab of cheese into the gap between the rollers. Rolling experiments were
performed at ambient temperature (around 25 °C) and no temperature control
was utilized.

CHAPTER 5:
LINEAR VISCOELASTICITY
5.1 Introduction
Linear viscoelasticity is the most basic characterization technique for
viscoelastic materials. Although techniques to perform linear viscoelastic
measurements are well established, especially for polymer melts, this is not the
case for mozzarella cheese. This is largely due to the fact that mozzarella cheese
is made up of both solid and liquid phases that complicates matter further. Both
these solid and liquid phases, their mixing and morphology are highly
temperature dependent. Nevertheless, there have been several studies on the
linear viscoelasticity of mozzarella cheese (for example those by Nolan et al.,
1989; Hsieh et al., 1993; Diefes et al., 1993; Tunick et al., 1993; Yun et al., 1994;
Ak and Gunasekaran, 1996; Subramanian and Gunasekaran, 1997a, 1997b;
Joshi et al., 2004)
In this chapter, the linear viscoelastic properties of the mozzarella cheese
under study are discussed. The linear viscoelastic properties were obtained from
small amplitude oscillatory shear measurements and experiments were
performed at 25°C, 40°C, 50°C, and 60 °C. Applicability of time-temperature
superposition is examined to provide an insight into the thermorheological
property of mozzarella cheese. Finally, the linear viscoelasticity results are
represented by a generalized Maxwell model.
5.2 Dynamic Time SweepDynamic time sweep experiments were performed in order to check the
stability of the materials at various temperatures. In a dynamic time sweep
experiment, the frequency and temperature are kept constant and the dynamic
properties are recorded as a function of time. Typical results are shown in Fig.
5.1 which depicts the complex modulus of the mozzarella cheese at different
46

C7
0E(1)
Frequency = 1.5 Hz
O O 0 o occca
■
111■111^t^all III
llll
• V, l
• 25°C• 40°CA 50°C^ 60°C
• V V V '97
^ ^ ^ Do
A^A A AA
••IIIII lllll 11111111111110 1 1 1
♦ A ••••4/0/////////
CHAPTER 5 — LINEAR VISCOELASTICITY 47
temperatures as a function of time. At room temperature, it seems that the
sample was quite stable up to 30 minutes. With increasing temperature, there is
a gradual decrease in the sample stability which is indicated by the earlier onset
of increase in the modulus. At 60°C, the complex modulus starts to increase
quite sharply after about 100 seconds.
106
0_1.13- 105
0E0 10 3
102
10°^
101^
102^103^
104
Time (s)
Fig. 5.1 Effect of time on the linear viscoelastic properties of mozzarella cheeseat different temperatures.
In their work with bread dough, Ng et al. (2006) observed similar increase
in the complex modulus with rest time and they attributed this increase to the
gelation or crosslinking process that occurred continuously within the dough. This
is, however, not a valid explanation for mozzarella cheese. Unlike bread dough
which continuously develops its structure through hydrophobic and sulphide
bonds even after mixing is completed, mozzarella cheese does not exhibit such
dynamics. For mozzarella cheese to have this type of dynamics, the increase of
modulus has to occur almost instantaneously (just like in bread dough), but this is
not the case. At 25 °C, for example, the mozzarella cheese needs about 30
minutes to exhibit significant sample hardening. Thus, the proteins micelles in the

CHAPTER 5 - LINEAR VISCOELASTICITY 48
mozzarella cheese can be considered as thermodynamically stable at a specific
temperature. Thus, the increase of modulus can be mainly attributed to the loss
of moisture and possibly due to loss of fat from within the sample, despite the fact
that mineral oil was used to coat the exposed area of the sample (Muliawan and
Hatzikiriakos, 2007a). The loss of moisture and/or fat causes the cheese to
harden which increases both its dynamic moduli. To minimize the time effect on
the linear viscoelastic measurements, all small amplitude oscillatory experiments
were completed before significant increase (-10% increase) in the moduli was
observed. For example, for the experiments performed at 60°C, tests were
completed within 100 seconds.
5.3 Dynamic Stress Sweep
Dynamic stress amplitude sweeps at different temperatures were
performed on the mozzarella cheese samples in order to determine the region of
linear viscoelasticity. This is the region where the stress is proportional to the
strain and the modulus is independent of the magnitude and rate of deformation.
In a dynamic stress amplitude sweep test, the frequency of oscillation and the
temperature are kept constant and the stress amplitude applied onto the sample
is varied. The dynamic properties and the resulting strain are recorded as a
function of the stress amplitude. The stress amplitude sweep results are plotted
in Fig. 5.2 where the complex modulus, G* (left vertical axis) and the strain (right
vertical axis) are plotted as functions of applied stress at a frequency of 1.5 Hz.
The span of linear viscoelasticity is temperature dependent. The higher the
temperature, the smaller should be the applied stress in order to be within the
limits of linear viscoelasticity.
Typical results for the limits of linear viscoelasticity as a function of
temperature are summarized in Table 5.1. It should be noted that these linear
limits were identified visually from the stress sweep curves shown in Fig 5.2.
From Table 5.1, one can see that the stress for the onset of non-linearity
decreases from 1500 Pa to 100 Pa with an increase of temperature (from 25 °C to
106
105
(.9 104
U)
103OI
a 102
10 1
10°
104
1 03
102
10 1
10°
10 -1 f3.-65
10-2
10-3
10 -4
10 -5
10-6
Open symbol - ModulusFrequency = 1.5 Hz^Filled symbol - Strain
V
25°C40°C50°C60°C
•1^1^1 / tald e^1^111111a^e^1111111
4;149808‘Limit of linear viscoelasticity at T = 25°C
CHAPTER 5 — LINEAR VISCOELASTICITY 49
60°C). On, the other hand, the corresponding strain limit increases from 0.02 to
0.15. As the temperature increases, mozzarella cheese melts, becomes less
elastic and flows rather easily. A decrease in applied stress does not necessarily
result into a decrease of strain. In general, the observed trends in Table 5.1 are
consistent with other reported results in the literature (Nolan et al., 1989; Ak and
Gunasekaran, 1996; Subramanian and Gunasekaran, 1997a).
10-2^10-1^10°^101^102^103^
104^
105
Shear stress (Pa)
Fig. 5.2 Stress amplitude sweep of mozzarella cheese at different temperatures.Shown also are the corresponding strain values and the linearviscoelastic region at T = 25 °C.
Table 5.1 Stress and strain limits of linear viscoelasticity of mozzarella cheese atdifferent temperatures.
Temperature ( °C) Stress limit (Pa) Strain limit (-)
25 1500 0.02
40 500 0.09
50 200 0.1
60 100 0.15

G'
? °'2°'000 0. 0^.0222"AA G"
^^
00 n0 00
- Temperature = 50 °CShear Stress = 10 Pa
AA 4
104
0
106a
102
10 -2^10-1^10°^101 102^10-2^10-1^10°^101
C) 102
(7)10' 0 -o0 o
.0
N E 102102 75.
0
10 1^101
105^104ale aa_ c)104
Temperature = 60°CShear Stress = 1 Pa
el a. 0 0
0 00 g ° g
4 A °^° 0 0
0,,, t1^0
^ Orr
^^
G'
10210 1
103
CHAPTER 5 — LINEAR VISCOELASTICITY 50
5.4 Dynamic Frequency Sweep
Dynamic frequency sweep experiments were performed at 25°C, 40°C,
50°C, and 60°C. At each temperature, the stress amplitude is maintained at a
constant value and the dynamic viscoelastic properties are measured as a
function of frequency. The results are plotted in Fig. 5.3.A^ B
a0
C)
O
106
Temperature = 40 °CShear Stress = 100 Pa
102
10-2^10-1^10°^101
Temperature = 25 °CShear Stress = 1000 Pa
G'
000000000000218058r
00000000000000000000000000
104 /,,,,,,,,A444■814444444,5>126t4444.644444PAP46.4444z,G "
%%00.0
00000.‹.
10 3
10 -2^10-1^10°^101
^ 10 7
o_106 a- b
U 104106§ O
104 •g.0pg ^10'
7i10 3 E ccis
^ 102102
106
10°
10400
10' g
102 1"O
10 1
102
10 6
Frequency (Hz)^ Frequency (Hz)
C^
D
Frequency (Hz)^
Frequency (Hz)
Fig. 5.3 Dynamic frequency sweeps of mozzarella cheese at A) 25 °C, B) 40°C,C) 50 °C, and D) 60 °C.
At 25°C, G' is always higher than G" over the whole frequency range. The
parallelism of G' and G" implies the typical behaviour of a viscoelastic solid, also
reported by Subramanian and Gunasekaran (1997b), Nolan et al. (1989) and
Diefes et al. (1993). The highly shear thinning behavior of mozzarella cheese is
also clearly illustrated at 25°C. At 40 °C, the cheese exhibits lower dynamic
moduli and there is a change in the slopes of the dynamic moduli curves. The
sample has started exhibiting liquid-like behaviour due to the melting of the fat
and increase in protein mobilization. The constant change in the linear

CHAPTER 5 - LINEAR VISCOELASTICITY 51
viscoelastic properties of the mozzarella cheese continues at 50 °C, where at the
lower frequency range, G' and G" overlaps. Finally, at 60°C, the loss modulus
starts to dominate the linear viscoelastic properties of the sample and the
behaviour resembles that of a viscoelastic fluid i.e. similar to that of a molten
polymer (Dealy and Wissbrun, 1990).
5.5 Dynamic Temperature Sweep
The transition (from a solidlike to a fluidlike behaviour) of mozzarella
cheese can be seen more clearly from a dynamic temperature-sweep
experiment, where the dynamic properties are measured as a function of
temperature (see Fig. 5.4). As the temperature increases, there is initially a
constant decrease of the complex modulus (— -2.3 kPa/°C), followed by a more
significant decrease (— -6.7 kPa/°C) as the temperature increases to more than
45°C. The sudden significant decrease in the complex modulus is due to the
mobilization of the protein matrix. The melting and transition from solid-like to
liquid-like behavior is better illustrated by the phase angle, defined as
8 a- tan-' (G" G' ') As can be seen from Fig. 5.4., 6 is relatively constant at
temperatures below 40°C (solid-like behaviour). There is perhaps a slight peak at
around 34°C, which indicates the melting of the fat. As the temperature is
increased beyond 45°C, 6 increases sharply, indicating sudden transition to
liquid-like behavior. This temperature region is dominated by both the continuous
melting of the fat and the mobilization of the protein matrix which dramatically
reduces the interactions between the casein micelles aggregates. Consequently,
the viscous properties of the mozzarella cheese are enhanced. At 60 °C, the
mozzarella cheese melts completely and this is translated in a significant peak in
the tan 6 curve.
Mozzarella cheese also exhibits significant thermal hysteresis. As can be
seen clearly from Fig. 5.5, the linear viscoelastic properties of mozzarella cheese
exhibit dependence on heating or cooling. As mozzarella cheese is heated,

CHAPTER 5 - LINEAR VISCOELASTICITY 52
although there is a rather constant decrease in the viscous modulus, there is a
significant decrease in the elastic modulus at around 45 °C (as discussed earlier).
As mozzarella cheese is cooled, the changes in both the elastic and viscous
moduli seem to be constant throughout the temperature range. This is also
reflected in the tan 6 versus temperature curve. The thermal hysteresis of
mozzarella cheese can be explained by the fact that the melt process of virgin
mozzarella cheese occurs in 2 phases. The first phase involves the melting of fat
at around 30°C. The second phase, which is more significant, occurs at around
55°C, where the proteins gain significant thermal energy to mobilize. As
mozzarella cheese melts, there is a rearrangement of the fat and protein phases.
As the temperature is increased, there is reduced moisture content in the cheese
and this causes the protein aggregates to constrict due to hydrophobic
interactions (Johnson, 2000). This constriction causes the fat to phase separate
and forms much larger fat particles, most of which are still embedded in the
protein matrix. Some of these fat particles, however, are able to escape from the
protein matrix (Johnson, 2000). A combination of these processes; loss of
moisture, formation of larger fat particles within the protein matrix, and
simultaneous loss of some fat particles from the protein matrix, results in a
formation of a more cohesive and a more thermally stable mass of cheese. Thus,
when this mass of cheese is cooled, it exhibits a more constant change in its
physical properties; a behavior that is significantly different than when it is
heated.
The thermal hysteresis of the mozzarella cheese can be captured and
illustrated from its microscopic images after heating. Fig. 5.6 shows the
microscopic images of virgin mozzarella cheese (Fig. 5.6a) and cheese that has
been heated to 60 °C and cooled to room temperature (Fig 5.6b). These images
are obtained from using a cryo-Scanning Electron Microscope (Hitachi S4700
SEM with Emitech K1250 Cryo System, Pleasonton, CA, USA). The samples
collected for imaging were stored in an air tight container before their microscopic
images were taken and all microscopic images were taken within 24 hours.

1050_
106
104E
0E00 103
60
50
40
30
20
10
0
aSrnafa)U)to_C0-
8G*
•11.
•• • • • • •
• • • • •.••
•
X ■
■
Frequency = 1.5 HzShear Stress = 1 Pa
60 70102
20^30^40^50
Temperature (°C)
106
...a^0T^5a.
0LM7
104020E
10 3
80
60
6-
a)cr)
40a)ns0_
20
0
Frequency = 1.5 HzShear Stress = 1 Pa Filled symbol - Heating (3°C/min)
Open symbol - Cooling (3°C/min)
—40— Elastic modulus, G'—s-- Viscous modulus, G"--t— Phase angle
CHAPTER 5 – LINEAR VISCOELASTICITY 53
Before imaging, the samples were flash frozen using liquid nitrogen and they
were fractured to expose the internal surface. The microscopic images are taken
at random locations within the cheese samples and only representative images
are shown.
102^020^30^40^50
Temperature (°C)
Fig. 5.4 Dynamic temperature sweep of mozzarella cheese at a frequency of1.5Hz.
.........^I
60^
70
Fig. 5.5 Two-direction temperature sweep of mozzarella cheese, showing itsthermal hysteresis behavior.

$0.0um$4700 2.0kV 21.amm x1.004 se(41 7/27MS
lor77,311Li'
Sheared at 60°C
pa'rticle
$47002.OkV &Om x1.01* SE& trams
A B
CHAPTER 5 — LINEAR VISCOELASTICITY 54
From Fig 5.6a, it can be seen that the unprocessed cheese has a structure
which is mostly made up of protein matrix with dispersed fat globules, as
described earlier. As the mozzarella cheese is heated to 60 °C and cooled, one
can see from Fig. 5.6b that the fat particles aggregate and form much larger fat
particles (which is due to the constriction of the casein network). These large fat
particles do not re-disperse themselves back when the mozzarella cheese is
cooled. This results in the different rheological behavior of the mozzarella cheese
during heating and cooling, as has been found by other researchers as well (for
example, see Prentice, 1987; Gunasekaran and Ak, 2003; Venugopal and
Muthukumarappan, 2003).
Fig. 5.6 Cryo-scanning electron microscope of A) virgin mozzarella cheese at25°C and B) mozzarella cheese heated to 60 °C and cooled down to25°C.
5.6 Time-Temperature Superposition
A thermorheologically simple polymer system is usually found to obey
time-temperature superposition principle which simplifies the significant thermal
dependence of its linear viscoelastic properties. Time-temperature superposition
allows the shifting of linear viscoelastic data obtained at several temperatures to
a single master curve at the selected reference temperature. The shift factors can
be related with temperature according to either the Arrhenius or the Williams-
Landel-Ferry equations, depending on the glass transition temperature of the

CHAPTER 5 - LINEAR VISCOELASTICITY 55
polymer system. Utilizing the shift factors, one can efficiently obtain linear
viscoelastic data corresponding to very low frequency range (which can take
hours) at a specific temperature by shifting the linear viscoelastic data gathered
at relatively higher frequencies and high temperature.
The time-temperature superposition principle was applied on the linear
viscoelastic data of the mozzarella cheese to obtain the master curve. This is
plotted in Fig. 5.7. The reference temperature was selected to be 60°C. It is
noted that the data obtained at 25°C were not able to be superposed
satisfactorily to the data obtained at 40°C, 50°C, and 60°C. This agrees with the
results from the dynamic temperature sweep, where it was found that at a
temperature below 40°C, the cheese behaves as a solid. As the temperature
exceeds 40°C, the cheese starts melting, undergoing structural changes. These
(structural changes) include increased separation of fat from the protein matrix
(Guinee and Fox, 2001), increased ratio of liquid to solid fat (Prentice, 1987),
increased mobility of the protein phase (Wetton and Marsh, 1990), and loss of
moisture. This means that, essentially, the data obtained at higher temperatures
(> 40°C) corresponds to a physically different material. This is supported from the
works done by Mavridis and Shroff (1992) and Van Gurp and Palmen (1998) who
attribute the failure of time-temperature superposition as an indication of the
presence of relaxation time (or moduli) having non-uniform temperature
dependence such as those exhibited by multiphase systems or those that
undergo physical changes during the rheological measurements. As illustrated
earlier, cheese can be classified as a multiphase system that exhibits a solid-like
behaviour, which gradually changes to a liquid-like behaviour as the temperature
is increased. Thus, it is not surprising that only the data obtained at the melt state
(> 40°C) can be superposed. This indicates that mozzarella cheese can be
considered as a thermorheologically simple material for T > 40 °C.
The horizontal shift factors, aT were found to follow the Arrhenius
equation

CHAPTER 5 — LINEAR VISCOELASTICITY 56
aT = exp [E; (T1 7;lef
^(5.1)
where Ea is the energy of activation in cal•mo1 -1 , R is the gas constant (1.987
cal.mol-l 1K-1 ), and Tref is the reference temperature in K. A plot showing this
relationship is shown in Fig. 5.8. From the equation of the fit, Ea can be
determined and was found to be 4.21 E04 kcal.kma l .
a_
U). u)5N
E0
Shifted frequency, (war (Hz)
Fig. 5.7 Master curve of mozzarella cheese at a reference temperature of 60°C,obtained from shifting the linear viscoelastic data gathered at 40°C and50°C.
5.7 Generalized Maxwell Model Fit
The generalized Maxwell model was used to describe the linear
viscoelastic data of the mozzarella cheese. The linear viscoelastic moduli data is
used to determine the relaxation spectrum in terms of a discrete spectrum of
Maxwell relaxation times (Dealy and Wissbrun, 1990). The storage and loss
moduli in terms of the discrete Maxwellian spectrum can be expressed as

CHAPTER 5 - LINEAR VISCOELASTICITY 57
(02, )2G' (co) =
1
G" (co) = G,co2,
1+ (co.02
where w is the frequency of oscillations and G, and 2are the generalized Maxwell
model parameters. The parameters (G„2,) of equations 5.2 and 5.3 were
determined using a nonlinear optimization program following the algorithm
developed by Baumgartel and Winter (1989). The program results into the least
number of (G 1 ,2,) parameters (Parsimonious spectra). Table 5.2 lists the values
of these parameters for mozzarella cheese at different temperatures.
0.00295 0.00300 0.00305 0.00310 0.00315 0.00320 0.00325
1/T (K-1 )
Fig. 5.8 Shift factors of mozzarella cheese as a function of temperature and itsArrhenius fit.
The predicted fits of the linear viscoelastic data are shown in Fig. 5.9. The
fits obtained from these parameters are satisfactory. It should be noted that in
(5.2)
(5.3)

10°^10110 -2 10-1
Frequency (Hz)
105
Temperature = 50°CShear Stress = 10 Pa
105^105 ^-(7)' o_
104 a..^
104 -
10' 8, 2 10 3
102 Ta.^102 _
10 1^101 -102^10-2
102 10°10'^10 4
- Maxwell model fit
10-1^10°^10 1^10 2
Frequency (Hz)
10' .c»
N
10 5
104
10'
10210-2^10-1^10°^101
Frequency (Hz)
D
106COO
10 5
104O(7)
10 2 E00
10 1102
A
Frequency (Hz)
C
B.^,^.
Temperature = 40 °CShear Stress = 100 Pa
Oa_
b 105.'5-00E
104
O
10 3
10 -2^10 - 1^10°^101
106
102
a.
000
OEEO
Temperature = 25°CShear Stress = 1000 Pa
1 0 7
105
104 .Y2
N103 E
O
102
G"
10'17)'co
102
0.E
Master CurveReference Temperature = 60 °C
CHAPTER 5 - LINEAR VISCOELASTICITY 58
Fig. 5.9, the plot corresponding to the temperature of 60 °C is shown as master
curve (from Fig. 5.7).
Table 5.2 Generalized Maxwell model parameters for mozzarella cheese atdifferent temperatures.
T = 25 °C T = 40°C T = 50°C T = 60°CXi Gi Xi Gi ?■.; G1 Xi Gi
1.00E-06 1.00E+08 1.00E-06 2.30E+07 - - 1.00E-06 7.00E+05
9.43E-03 5.07E+04 9.77E-03 8.41E+03 4.87E-03 1.37E+04 4.37E-04 6.95E+03
6.73E-02 2.62E+04 5.48E-02 3.56E+03 3.09E-02 3.23E+03 4.64E-03 3.92E+03
4.19E-01 1.80E+04 2.41E-01 2.16E+03 1.39E-01 1.98E+03 4.62E-02 1.13E+03
2.82E+00 1.42E+04 1.04E+00 1.47E+03 7.64E-01 9.54E+02 3.22E-01 2.42E+02
4.83E+01 2.53E+04 8.73E+00 1.56E+03 1.12E+01 4.67E+02 4.90E+00 4.77E+01
Fig. 5.9 Maxwell model fits of the dynamic linear viscoelastic data for mozzarellacheese at A) 25°C, B) 40°C, C) 50°C, and D) 60°C.

CHAPTER 5 - LINEAR VISCOELASTICITY 59
5.8 Summary
Linear viscoelasticity can be utilized to probe the microscopic behavior of
mozzarella cheese. At room temperature, mozzarella cheese behaves like a
semi-solid material. Upon heating, mozzarella cheese undergoes a gradual
transition from a viscoelastic solid towards a viscoelastic fluid. It was also found
that moisture loss which occurs prominently at relatively high temperatures has a
significant effect on the stability of the sample. The irreversible thermal effect on
the structure and rheological behavior of mozzarella cheese was also illustrated.
As a result of this thermal effect, over the temperature range of 25 °C to 40 °C,
mozzarella cheese can be considered as a thermorheologically complex material.
Thus, time-temperature superposition was only applicable to data obtained at
40 °C and above. It was also determined that the linear viscoelastic data can be
described by a generalized Maxwell model with 6 relaxation modes.
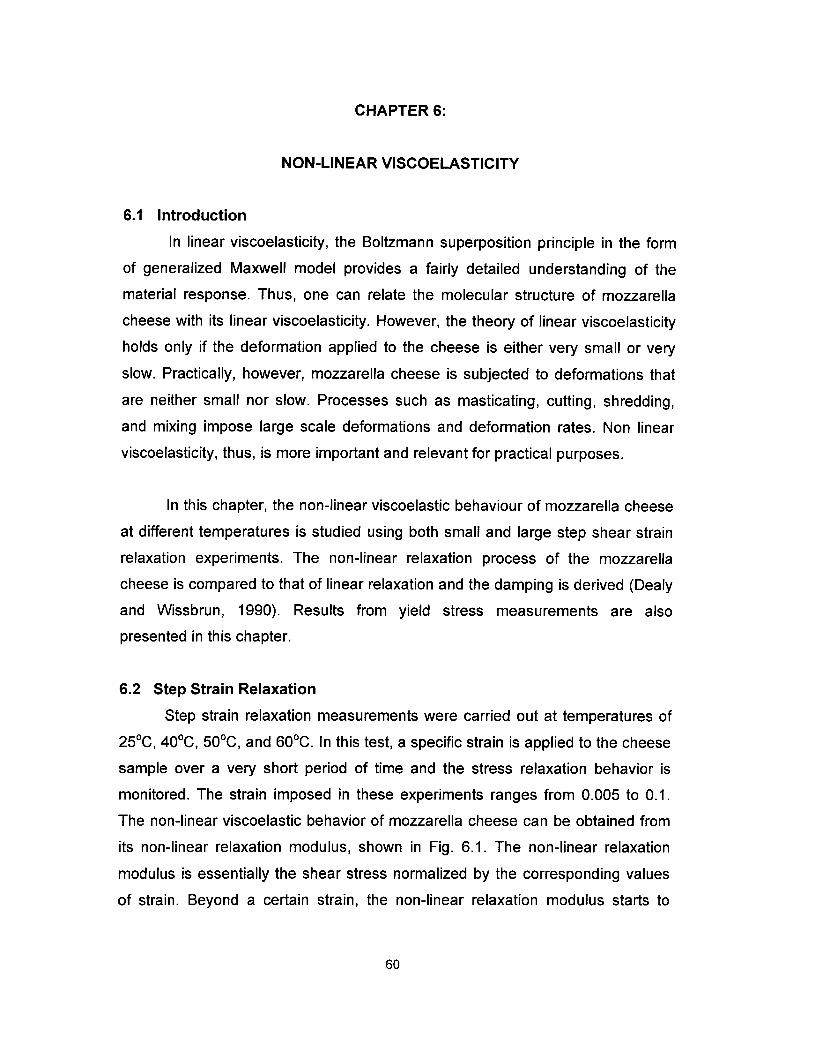
CHAPTER 6:
NON-LINEAR VISCOELASTICITY
6.1 Introduction
In linear viscoelasticity, the Boltzmann superposition principle in the form
of generalized Maxwell model provides a fairly detailed understanding of the
material response. Thus, one can relate the molecular structure of mozzarella
cheese with its linear viscoelasticity. However, the theory of linear viscoelasticity
holds only if the deformation applied to the cheese is either very small or very
slow. Practically, however, mozzarella cheese is subjected to deformations that
are neither small nor slow. Processes such as masticating, cutting, shredding,
and mixing impose large scale deformations and deformation rates. Non linear
viscoelasticity, thus, is more important and relevant for practical purposes.
In this chapter, the non-linear viscoelastic behaviour of mozzarella cheese
at different temperatures is studied using both small and large step shear strain
relaxation experiments. The non-linear relaxation process of the mozzarella
cheese is compared to that of linear relaxation and the damping is derived (Dealy
and Wissbrun, 1990). Results from yield stress measurements are also
presented in this chapter.
6.2 Step Strain Relaxation
Step strain relaxation measurements were carried out at temperatures of
25°C, 40°C, 50°C, and 60 °C. In this test, a specific strain is applied to the cheese
sample over a very short period of time and the stress relaxation behavior is
monitored. The strain imposed in these experiments ranges from 0.005 to 0.1.
The non-linear viscoelastic behavior of mozzarella cheese can be obtained from
its non-linear relaxation modulus, shown in Fig. 6.1. The non-linear relaxation
modulus is essentially the shear stress normalized by the corresponding values
of strain. Beyond a certain strain, the non-linear relaxation modulus starts to
60
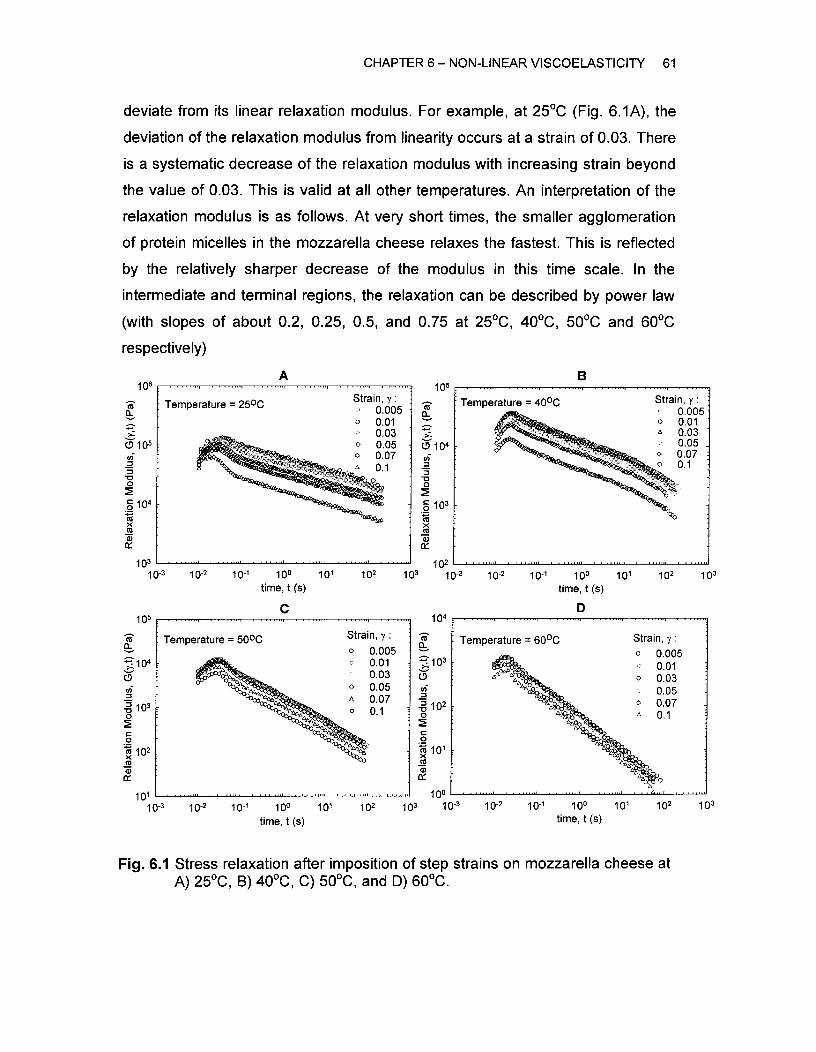
10 -3^10-2^10-1^10°^101time, t (s)
102103^10-3 10-2^10-1^10°^101
time, t (s)102 102 103
103
106
a_
0 105
0
g 104
• • •^■ • •^•^• ,^•
Strain, y :0.005-
o 0.01A 0.03
0.05 _O 0.07o 0.1
Temperature = 40°CTemperature = 25°C Strain, y :0.005
o 0.010.03
O 0.05 -O 0.07 :A^0.1
10 -3^10-2^10-1^10°^101time, t (s)
10 4
103
a-71 1020
a
101
10°103^10-3 10 -2^10-1^10°^101
time, t (s)102 10 2 103
10 1
105
a-
20
Strain, y :O 0.005
0.01O 0.03AAA
0.05O 0.07
ANilb^A 0.1
Temperature = 60°C
.^•
Temperature = 50°C Strain, y :
o 0.005• 0.01
0.03O 0.05A 0.07O 0.1
CHAPTER 6 — NON-LINEAR VISCOELASTICITY 61
deviate from its linear relaxation modulus. For example, at 25 °C (Fig. 6.1A), the
deviation of the relaxation modulus from linearity occurs at a strain of 0.03. There
is a systematic decrease of the relaxation modulus with increasing strain beyond
the value of 0.03. This is valid at all other temperatures. An interpretation of the
relaxation modulus is as follows. At very short times, the smaller agglomeration
of protein micelles in the mozzarella cheese relaxes the fastest. This is reflected
by the relatively sharper decrease of the modulus in this time scale. In the
intermediate and terminal regions, the relaxation can be described by power law
(with slopes of about 0.2, 0.25, 0.5, and 0.75 at 25 °C, 40°C, 50°C and 60°C
respectively)
A^
B
C^
D
Fig. 6.1 Stress relaxation after imposition of step strains on mozzarella cheese atA) 25°C, B) 40°C, C) 50°C, and D) 60°C.

: T = 25°CI II",^1^1^f 11111,^■^■^I • 111111f^I^I^11111,
Filled symbol - Shear stressOpen symbol - Strain
AA*
^VP'^
Still̂ .41,11,0111111111..l1111111111
vvdP•
voc9
1^e^■ i 1■119^1^I^1 I ittel^1^..^I .1.11^i^1^il Aled^1^111.1.1^I^1^111.11
10°
1 0 - 1
10 -2
10-3
CHAPTER 6 — NON-LINEAR VISCOELASTICITY 62
It should be noted that the initial increase in the shear stress at the early
times is an experimental artifact due to the transient material response as the
plate starts to rotate to achieve the desired strain as illustrated in Fig. 6.2. It takes
about 0.05 seconds for the rheometer to achieve the desired strains. This
corresponds to an increase in the shear stress at this short time scale. Similarly,
the presence of slight overshoots in the applied strains, most noticeably at
relatively higher strains, results in a small peak in the transient shear stress
response.
105
104
103
102
10 110-3^10-2^10-1^10°
^10 1^1 02
^1 03
Time, t (s)
Fig. 6.2 Transient analysis of step strain relaxation of mozzarella cheese at25°C.
The data in Fig. 6.1 can be shifted to superpose on the linear viscoelastic
envelope in order to determine the damping function. The results are shown in
Fig. 6.3. The shift factors which depend on the strain make up the damping
functions. These factors are plotted as a function of strain, 7, in Fig. 6.4 at
different temperatures. It can be seen that the damping function can be described
accurately by the Zapas damping function (Dealy and Wissbrun, 1990):

10-1^10°time, t (s)
73 104
0
6)
103
103^10-3
B
10-2^10-1^10°^101time, t (s)
10 -3 10-2 101 102 102 103
106
a)
1 04
105
0
A
Strain, y :0.005
o 0.010.030.050.070.1
Temperature = 40°C
Maxwell Model Fit
Temperature = 25°C Strain, y :0.005
o 0.01V 0.03A 0.05
0.070 0.1
Maxwell Model Fit
105
0104
el;
103z
102
10 1
10-3^10-2^10-1^10°^101time, t (s)
10°103^10-3 10-2^10-1^10°^101
time, t (s)102 102 103
1 04
0
-3 102
0x 10 1
Temperature = 50°C Strain, y :0 0.005
0.010.030.050.070.1
Maxwell Model Fit
Strain, y :o 0.005v 0.01
0.030.05
o 0.07A 0.1
Temperature = 60°C
...
Maxwell Model Fit•^,
CHAPTER 6 - NON-LINEAR VISCOELASTICITY 63
h(y) =1 (6.1)
1+ ay e
with a = 214, 159, 128, and 97 for temperatures of 25 °C, 40°C, 50°C, and 60°Crespectively.
C^
D
Fig. 6.3 Shift of the data plotted in Fig. 6.1 in order to determine the dampingfunctions of mozzarella cheese at A) 25 °C, B) 40°C, C) 50°C, and D)60°C.
In addition, it can be seen from Fig. 6.4 that the damping function is a
function of temperature. This indicates that the rheological behavior of mozzarella
cheese comes closer to its linear viscoelastic counterpart with increase of
temperature.

CHAPTER 6 — NON-LINEAR VISCOELASTICITY 64
C0UC4-
C)C*aEa
1 0 °
10 -110 -3 10-2
^10-1
Strain, y
Fig. 6.4 Damping function of mozzarella cheese at different temperatures. Linescorrespond to fitting of damping function with the Zapas generalizedmodel.
From the Maxwell model parameters, one can also calculate the linear
relaxation modulus from
G(t) = E G1 exp (6.2)
where t is the time and G, and A. are the generalized Maxwell model parameters.
The linear relaxation moduli as predicted from the Maxwell model fit for the
different temperatures are also plotted on Fig. 6.3. The agreement between the
linear relaxation moduli with those predicted by the Maxwell model fit is overall
satisfactory in the intermediate region. At long times, the Maxwel model fit fails to
predict the linear relaxation modulus. This is due to the fact that the Maxwell
parameters are obtained from linear viscoelastic data determined over a limited
frequency range. The linear viscoelastic experiments do not capture the
response at very small and large frequencies.

CHAPTER 6 - NON-LINEAR VISCOELASTICITY 65
6.3 Yield Stress Measurements
Cheese has been known to exhibit yield stress due to the presence of
protein matrix that forms its structure. Thus, determining the yield stress can
provide an insight on the structural changes that occur at high deformations.
Initially, an attempt was made to determine the yield stress using creep tests.
However, a disadvantage with creep tests is that a very long time (hours) is
sometimes necessary to determine the steady creep compliance. This has been
discussed by Cheng (1986) as one of the main problems. Structural changes on
cheese within this period of time can affect the result significantly as
demonstrated by the time sweep experiments. Hence, in this particular case, we
used the stress ramp method. Although this method may not provide an accurate
value of yield stress, it is a good alternative to the creep test.
Typical stress ramp test results used to determine the yield stress values
at various temperatures are shown in Figs. 6.5 to 6.7. As can be seen, the peak
of the curves, which corresponds to the yield stress, shifts towards smaller shear
stress values as the temperature increases. This means that the yield stress
value decreases with increase of temperature. Mozzarella cheese possesses
yield stress because of the presence of solid protein phase which is able to
support its own structure at small deformations. However, as the temperature is
increased, the protein phase softens and the mozzarella cheese as a whole flows
more readily; hence exhibiting lower yield stress. At the temperature of 60 °C, the
structure of the cheese has been broken completely due to the complete fat
melting and protein mobilization. Consequently, it was not possible to determine
a yield stress value at this temperature. At lower temperatures, however, the
yield stress values were found to be 1620 ± 93 Pa (Fig. 6.5) at 25°C, 216 ± 19
Pa at 40°C (Fig. 6.6) and 1.4 + 0.3 Pa 50 °C (Fig. 6.7).

CHAPTER 6 — NON-LINEAR VISCOELASTICITY 66
3.0x10⁶
2.5x10⁶
a-
67) 2.0X10⁶
tn0
8
•^
1.5x10⁶
ccE'• 106
5.0x10⁵
0^
103^2x10³^
3x10³^4x10³
Applied shear stress (Pa)
Fig. 6.5 Typical stress ramp test for mozzarella cheese at 25 °C to determine itsyield stress.
3.5x10⁴
3.0x10⁴
2.5x10⁴
2.0x10⁴
1.5x10⁴
104
102^2x10²^3x10²^4x10²^
5x10²^
6x10²
Applied shear stress (Pa)
Fig. 6.6 Typical stress ramp test for mozzarella cheese at 40 °C to determine itsyield stress.

Temperature = 50°C
III
--e— Run 1Run 2
.^•^,
2.0x10⁴
1.8x10⁴
1.6x10⁴
1.4x10⁴
1.2x10⁴
104
8.0x10³
6.0x10³
4.0x10³
2. Ox 103
0
CHAPTER 6 — NON-LINEAR VISCOELASTICITY 67
10-1^10°^101^
102
Applied shear stress (Pa)
Fig. 6.7 Typical stress ramp test for mozzarella cheese at 50 °C to determine itsyield stress.
6.4 SummaryUnderstanding the non-linear rheology of mozzarella cheese is
important because more often than not, mozzarella cheese is subjected to highly
non-linear deformation during manufacturing, processing and consuming. It has
been shown that the damping function of mozzarella cheese, which is a measure
of the degree of non-linearity, can be described by a generalized Zapas model. In
general, the linearity of the rheological behavior of mozzarella cheese increases
with temperature because of the ability for the cheese to flow easier at higher
temperatures. The generalized Maxwell model parameters obtained from the
linear viscoelastic data were also found to describe the linear relaxation
dynamics of the mozzarella cheese satisfactorily.

CHAPTER 7:
EXTENSIONAL RHEOLOGY
7.1 Introduction
A unique property of mozzarella cheese which makes it the most common
pasta filata cheese is its flowability or stretchability. Consumers expect a high
quality mozzarella cheese to exhibit significant stretchability. In stretching
mozzarella cheese, one is applying an extensional deformation to the cheese.
Although the stretchability of a mozzarella cheese depends on the control of its
manufacturing process variables, such as pH and temperature, mechanical work
(repeated kneading) on the mozzarella curd during manufacture is as important
(Gunasekaran and Ak, 2003). Comprehending the extensional rheology of
mozzarella cheese, hence, is an important aspect to the overall understanding of
the rheology of mozzarella cheese.
In this chapter, the extensional rheology of mozzarella cheese at different
temperatures is studied. Extensional measurements are carried out using the
Sentmanat Extensional Rheometer (SER) described in section 2.4.2 and the
extensional strain rates range from linear to non-linear. The extensional results
are compared to linear rheology and discrepancies are discussed.
7.2 Transient Extensional Flow
The extensional properties of the mozzarella cheese sample were
determined by using the SER at 25°C, 40°C, 50°C and 60°C. At 25°C,
extensional tests were initially performed on samples cut in three different
directions; perpendicular, parallel and in transverse directions to determine if the
mozzarella cheese exhibit anisotropic behavior. This preliminary test was
performed at a Hencky strain rate of 0.113 s -1 . As can be seen from Fig. 7.1, the
samples being cut from the three different directions do not show significant
differences with each other, which indicates that this mozzarella cheese (Best
68

Cut direction:^ Parallel
PerpendicularTransverse
1 0310-2 10-1 10° 101
106Temperature = 25°C
eH = 0.113 s-1cc0
105
O
O
(J)^104
a)'7)ca)
CHAPTER 7 — EXTENSIONAL RHEOLOGY 69
Buy) is isotropic. This is in contrast to a result presented by Ak and Gunasekaran
(1997), which reported anisotropic behavior in their mozzarella cheese. The
reason for this difference is perhaps due to the different manufacturing
techniques or the relatively small sample size that the SER uses (which can
conceal the fiber orientation effects).
Time (s)
Fig. 7.1 Tensile stress growth coefficient of mozzarella cheese samples preparedby cutting in three different directions at a Hencky strain rate of 0.113 s -1and temperature of 25°C.
Extensional results at different temperatures are shown in Fig. 7.2 in terms
of tensile stress growth coefficient, /7E+ 6E as a function of time for various
Hencky strain rates, eif , where as is the tensile stress. In general, very good
agreement between the tensile stress growth curves at the different temperatures
are obtained. At 25°C (Fig. 7.2), a rapid increase can be observed that is
followed by a sudden decrease in the tensile stress growth curves for the
different Hencky strain rates. This sudden decrease is consistent with a brittle-
type failure of a solid like material. As the temperature is increased, a gradual
change in the type of cheese failure (from brittle to ductile) was observed. At

106
0
4----`" 10'
C
O= 104
20)2:12
103
105
FWC 104
11644))
03
&5'102
0.45 s'1.13 s
0.045 s'Temperature = 25°C
0.226 s''
0.714 5 . '
= 4.50
105
a.
rw-- 104C
16
'8)
0 1 03
102
10'
Temperature = 60°C
CHAPTER 7 - EXTENSIONAL RHEOLOGY 70
60°C, a plateau in the tensile stress growth was obtained as the cheese exhibited
significant strain softening and ductile failure. Practically, this illustrates the
unique stretchability property of mozzarella cheese, which makes it one of the
most highly demanded pasta filata cheeses.
A B
0.01 0.1 10 0.01 0.1 10
Time (s)
CTime (s)
D
Temperature = 50°C0.226 6'
0.45 s''
0.714 s'
1.13 s'
= 4.50 54
0.01 0.1 10 0.01 0.1 10
Time (s) Time (s)
Fig. 7.2 Tensile stress growth coefficients of mozzarella cheese at A) 25 °C, B)40°C, C) 50°C, and D) 60°C.
This is also clearly illustrated in the typical stress-strain curves plotted in
Fig. 7.3 at different temperatures. These curves are obtained at a Hencky strain
rate of 4.5 s1 shown earlier in Fig. 7.2. In general, as the temperature increases,
the peak diminishes and transforms into a plateau. This transformation can be
associated with the fact that at higher temperature the mozzarella cheese necks
after yielding, before failing.

CHAPTER 7 — EXTENSIONAL RHEOLOGY 71
7.3 Comparison with Linear Shear Rheology
As described in section 2.3, the linear rheology of a viscoelastic material
can be described adequately using the discrete relaxation spectrum obtained
from the fitting of the generalized Maxwell model. Section 5.8 illustrates the fitting
of the generalized Maxwell model to the linear viscoelastic properties of
mozzarella cheese. The discrete relaxation spectrum obtained from the fitting of
the generalized Maxwell model can be used to calculate the linear shear stress
growth as follows
t7: (t) = E G, 2,[1 — exp(— —21^
(7.1)
where tijt) is the shear stress growth as a function of time, t is the time
and G, and 2, are the generalized Maxwell model parameters.
2.5x10⁴
2.0x10⁴
1.5x10⁴
104
5.0x10³
0.0^
0.2^
0.4^0.6^
0.8^
1.0
Strain
Fig. 7.3 Tensile stress-strain curves of mozzarella cheese at a Hencky strain rateof 4.5 s -1 at different temperatures.

CHAPTER 7 — EXTENSIONAL RHEOLOGY 72
The linear extensional stress growth can then be determined according to
the following expression,
17; =T • q's =T •EG,A,,[1 — exp (- 0 2,A^(7.2)
where T is the Trouton's ratio taken equal to 3 for incompressible homogeneous
materials (Bird et al., 1977). This linear extensional stress growth forms the linear
viscoelastic envelope. Alternatively, the linear viscoelastic envelope can also be
obtained from a start-up of steady shear test at a very low shear rate i.e., typically
0.05 s -1 , using a rotational or a sliding plate rheometer. However, this method is
more appropriate for more viscous materials such as polymer melts.
Consequently, the comparison of the extensional rheology with the linear
shear rheology is done by comparing the linear viscoelastic envelope (equation
7.2) with the extensional stress growth curves, 17E+ obtained from the SER. The
comparison of the various curves is shown in Fig. 7.4. It can be seen that there is
lack of agreement between the two sets of shear and extensional data as noticed
before. At the temperature higher than 25°C, the Maxwell model fits are well
below extensional ones. As the temperature increases, the disagreement
between the two sets of data (shear vs. extensional) seems to be more
pronounced.
The discrepancy between the tensile stress growth and the linear
viscoelastic envelope is mainly due to moisture loss that is more pronounced at
elevated temperatures (Muliawan and Hatzikiriakos, 2007). In performing the
extensional tests, a very small amount (— 1 g) of sample having a relatively high
surface-to-volume ratio (— 1600 m -1 ) was used. For comparison, an oscillatory
test sample in the rotational rheometer usually has a surface area to volume ratio
of approximately 0.16 m -1 . Although the extensional tests typically lasted less
than 2 minutes including equilibration time, the minute amount of sample used

107
Temperature = 250C
106LVE maxwell model fit -
6)(7.)^ 0.045 s'
105^
0 113 s'00^
0.226 s'
0.45 s'
2 1041.13 s'
0.714 s'
eH = 4.50 s'
Sliding Plate,^0,08 s'1 6)
10,
1.130
Temperature = 50°C^0.226 s'^4,
^
...."^•0.45„ss ,
.....,^ _..."..
a714 s'
ti 105
w
a"' 104
Ex = 4.50
LVE maxwell model fit - rrls+
0.1^1
Time (s)
0.01
7
10102
0.226
'1345
0.714
1.13
Temperature = 40°C
4„, 4.50 4'
LVE maxwell model fit - rns+
102
0.01 100.1
0.1Time (s)
D
0.45 s'
0.714
1.13 s"
=4.50 51
0.01
8
10
LVE maxwell model fit - nis+Ce
cia
Time (s)
CHAPTER 7 — EXTENSIONAL RHEOLOGY 73
(notably thin) was significantly affected within this period of time. As the sample is
heated up in the oven prior to and during testing, significant loss of moisture
occurs, which definitely affects the extensional measurements. For comparison, it
was presented earlier that even for samples used in dynamic oscillatory tests,
significant changes can occur in as little as 100 seconds at the temperature of
60°C. At 25°C where moisture loss is insignificant as can be seen from the time
sweep experiment, there is a very good agreement between the shear data
obtained from the sliding plate rheometer and the extensional data.
A^
B
0.01 0.1^1Time (s)c
105
w
104
1032
102
10^100
Fig. 7.4 Comparison of tensile stress growth coefficients of mozzarella cheesewith the linear viscoelastic envelope predicted from the generalizedMaxwell model fit of linear viscoelastic data at A) 25 °C, B) 40°C, C)50°C, and D) 60°C.
To quantify the moisture loss, a simple mass balance experiment was
conducted. Mozzarella cheese samples were cut into typical testing dimensions

Oscillatory sample
Temperature = 50°C
1000^2000^3000^4000
18
16
14
12
10
8
6
a)a)0
O
O2 2
0
CHAPTER 7 — EXTENSIONAL RHEOLOGY 74
and they were placed into the oven for a certain period of time at a temperature
of 50°C. The mass of the sample before and after being placed into the oven was
measured. The difference in mass was taken to be the moisture loss from the
cheese. A plot that summarizes the result is shown in Fig. 7.5. It can be seen that
during the extensional tests (SER), moisture loss is significant. For example, for
the extensional sample to achieve a 5 % loss of moisture is only 0.6 minutes
compared to about 20 minutes for the oscillatory test sample. This ratio of about
33 is quite high.
A^ B12
10
SER sample
Temperature = 50°C
10^20^30^40^50^60^70
Time (s)^ Time (s)
Fig. 7.5 Moisture loss in the mozzarella cheese as a function of time at 50 °C forA) oscillatory sample and B) SER sample.
Samples which have been placed into the oven at 50°C for various rest
times before testing were tested for their linear viscoelastic properties. The
obtained data were subsequently analyzed in terms of the relaxation spectrum
and eqn. 7.2 was used to predict the transient shear stress growth as explained
earlier. The results are plotted in Fig. 7.6. Satisfactory agreement between shear
and extensional data is achieved if the oscillatory sample is left in the oven for
about 30 minutes. Referring back to Fig. 7.5, it can be seen that after this period
of time, there is about a 6% loss of moisture in the sample used for the oscillatory
test. This corresponds to about 42 seconds in the extensional test. This value
compares very well with the equilibration time of the sample loaded into the SER
in extensional tests. This experiment demonstrates that moisture loss (due to
increased temperature) is a crucial factor that can significantly affect the
Temperature = 50°C
...--"^ eH =0.450 s-1
,..,e...
,. = 0.714 s -1
ef, =0.226s"
e H = 1.13 s"LVE maxwell model fit:
EH =4.50e^—^0 rest time- 10 min rest time at 50°C
30 min rest time at 50°C60 min rest time at 50 °C
CHAPTER 7 – EXTENSIONAL RHEOLOGY 75
rheological properties of cheese, especially for samples having a relatively high
surface-to-volume ratio. Obviously other structural changes such as degradation,
increased separation of fat from the protein matrix, increased ratio of liquid to
solid fat and increased mobility of the protein phase with exposure time cannot
be excluded (Muliawan and Hatzikiriakos, 2007).
106
td0-
W 1 05
P-
ta)
• 104
or)• 1036)
1021 0-2^10-1
^10°^
101^
102
Time (s)
Fig. 7.6 Tensile stress growth coefficient of mozzarella cheese at 50 °C and thelinear viscoelastic envelope predicted from the fitting of the generalizedMaxwell model fit of the linear viscoelastic data obtained frommozzarella cheese samples which have been dried in the oven at 50°Cfor a certain period of time.
7.4 SummaryExtensional rheology can be used to gain an understanding on the
extensional property of mozzarella cheese. It has been shown that under
extensional deformation, mozzarella cheese exhibit brittle type of fracture at room
temperature. This is indicative of its solid like structure. Upon heating, mozzarella
cheese exhibits significant strain softening and ductile type of fracture.
Comparison between extensional and linear viscoelastic data was done by
generating the extensional stress growth using the generalized Maxwell model

CHAPTER 7 - EXTENSIONAL RHEOLOGY 76
parameters. It was found that there is significant disagreement between the two
set of data, especially at higher temperatures. This is due to moisture loss, which
is more pronounced in the extensional sample. The extensional sample has a
much higher surface area to volume ratio and it was not possible to coat the
sample with heavy oil to minimize moisture loss.

CHAPTER 8:
CAPILLARY FLOW
8.1 Introduction
Pressure driven flow through tubes, slits and other types of channels are
commonly used to assess the rheology and processability of many polymers. The
most commonly used equipment to imitate such a flow is capillary rheometer.
Besides typically being used to study flow behaviour of synthetic polymer melts,
capillary extrusion has also been widely used in the study of starch-based food
products such as cereals, doughs, and potatoes, as it mimics the flow of some
food processing technique such as extrusion cooking. Despite this, work done on
cheese using capillary rheometer is scarce.
In this chapter, the suitability of capillary rheometry to characterize
mozzarella cheese is studied. The rheological data obtained from the capillary
rheometer are compared to the linear viscoelasticy to assess the consistency of
the measurements. This chapter also provides an assessment of pressure driven
flows as a potential post-processing technique for mozzarella cheese.
8.2 Flow Curves
Capillary extrusion experiments were performed at 25°C, 40°C, 50°C, and
60°C. Typical pressure transients obtained from the capillary rheometer are
shown in Fig. 8.1. The variance of the steady state extrusion pressure was
significant in some cases, as typically expected in the testing of food materials
such as cheese (Cheyne et al., 2005). In the present case, the standard deviation
of the steady state value for most cases was about ± 8 %. The variation was due
to the heterogeneity of the sample and to the way the sample was extruded. It
was observed that the sample did not extrude smoothly, but rather exhibited a
stick-slip type of extrusion, particularly at the lower and higher ends of the
experimental range of shear rates. This behaviour was also persistent at low
77

5- T = 25°C" Die: D=0.813 mm, L/D=15, 2a=180°
4
3
2
:****•.* *** ' 1^A = 57.2 5 -11
00.00^0.05^0.10^0.15^0.20 0.25
CHAPTER 8 - CAPILLARY FLOW 78
temperatures where the cheese exhibits a certain degree of solid like behaviour.
Smith et al. (1980), in their extrusion study on cheddar cheese, associated the
variations in the extrusion pressure with fat separation in the cheddar cheese. In
the same study, however, they found that the extent of fat separation in
mozzarella cheese was not as significant and they were able to gather
meaningful extrusion results. In the current work, similar observations were
made. Although the extrudates were to some degree "oily" (which indicated some
degree of fat separation), it was found that the extrusion data was not
significantly affected by the fat separation.
Distance travelled in the barrel (m)
Fig. 8.1 Pressure transients in capillary extrusion of mozzarella cheeseobtained by using a capillary die with a diameter of 0.813 mm, L/D of15 and entrance angle of 180° at shear rates of 57.2 s -1 (dotted line),572 s -1 (dashed line), and 1716 s -1 (solid line), at 25°C.
Fig. 8.2 depicts the apparent flow curves of cheese obtained from dies
having different geometries. As the length of the die decreases, there is a

I^I.^011,11
- Temperature = 25 °CDie: D=0.43 mm, 2a=180°
i I
! !
^•• L/D=15
L/D=30■ L/D=47
1^1^1^I^III .^.^.^,^.^.^I^.
ii?0_<b
NU)2V)
_co°'E'"a)
8-7a10 1
CHAPTER 8 - CAPILLARY FLOW 79
corresponding increase in the apparent shear stress. This is because a shorter
die has a higher end pressure contribution, compared to that of a longer capillary
die. In other words, the end pressure correction in shorter dies are more
significant than that in longer capillary dies and this observation is true at all
temperatures.
102
10 1^102^103^
104
Apparent shear rate, YA (s- 1 )
Fig. 8.2 The apparent flow curve of mozzarella cheese obtained from capillaryextrusions using capillary dies having a diameter of 0.43 mm, L/D ratiosof 15, 30, and 47, and an entrance angle of 180° at 25°C.
To determine the end pressure corrections at the different temperatures,
the Bagley method is used, where the extrusion pressure is plotted as a function
of L/D for several apparent shear rate values. A typical Bagley plot is shown in
Fig. 8.3, where the data at 25 °C are presented. As can be noticed in Fig. 8.3, a
linear relationship exists between the extrusion pressure and the L/D. This is
valid at each temperature. This shows that pressure and viscous heating have no
significant effect on the viscosity of the sample, although these have opposite
effects in a Bagley plot and can eliminate each other (Rosenbaum and
Hatzikiriakos, 1997). Extrapolation of the straight lines to zero L/D, results in the

Temperature = 25°CDie: D=0.43 mm, 2a=180 °
10^20^30^40
L/D
CHAPTER 8 - CAPILLARY FLOW 80
end pressure, APendsends for the specific apparent shear rates. The true shear stress
can then be obtained from eqn. 2.35. It is noted that the Bagley correction can be
significant and should always be taken into account. For example, at 25 °C and at
the shear rate of 38 s -1 , the end correction accounts for as much as 26 % of the
total extrusion pressure. The significance of end pressure in this type of semi
solid material has also been reported elsewhere (Smith et al., 1980: Senouci and
Smith, 1988; Bagley et al., 1998).
8000
a__se
cnco=
6000
40000C
2000
Fig. 8.3 End pressure corrections (Bagley plot) of mozzarella cheese for differentshear rates and for a capillary die with a diameter of 0.43 mm and anentrance angle of 180° at 25°C. The straight lines are obtained by linearregression analysis of the data (R 2 = 0.99 for all curves).
A summary of the end pressures at the different temperatures, die
diameters and shear rates are tabulated in Table 8.1. Generally, it can be
concluded that the end pressures decrease with an increase in temperature.
Again, this can be attributed to the fact that mozzarella cheese softens and
deforms easily with an increase in temperature.
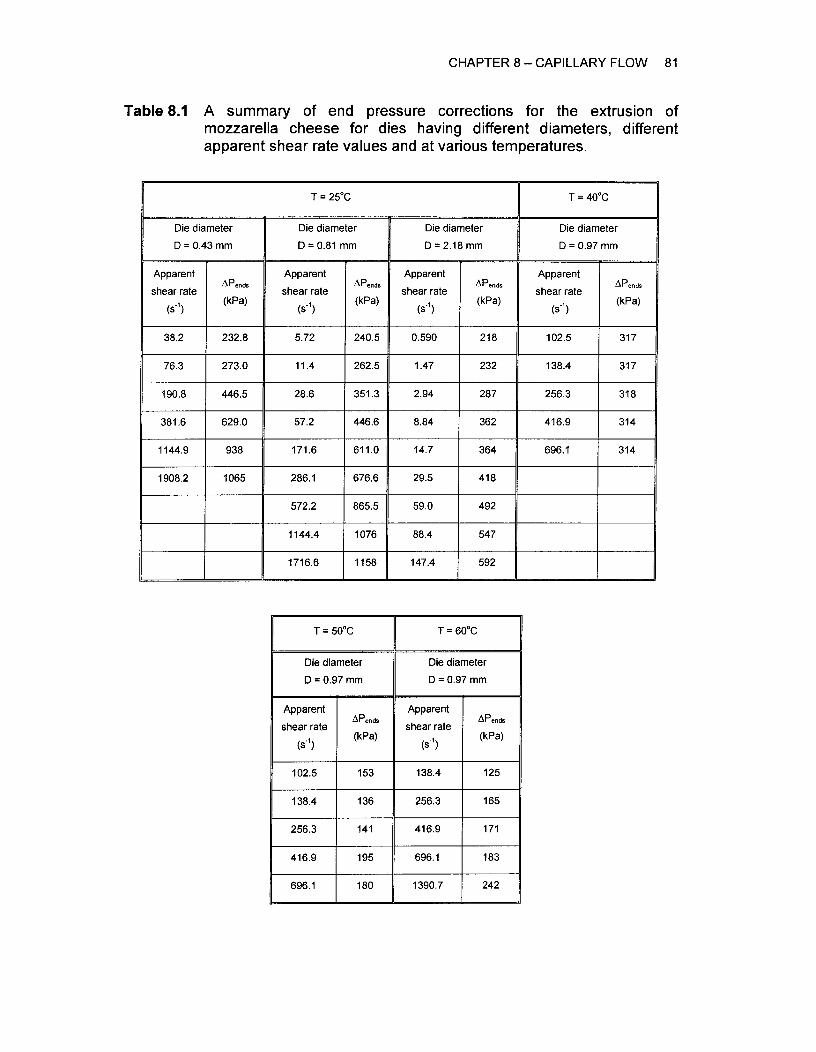
CHAPTER 8 - CAPILLARY FLOW 81
Table 8.1 A summary of end pressure corrections for the extrusion ofmozzarella cheese for dies having different diameters, differentapparent shear rate values and at various temperatures.
T = 25°C T = 40 °C
Die diameter
D = 0.43 mm
Die diameter
D = 0.81 mm
Die diameter,^D= 2.18 mm
Die diameter
D = 0.97 mm
Apparent
shear rate
(s -1 )
APends
(kPa)
Apparent
shear rate
(5-1)
APends
(kPa)
Apparent
shear rate
(e)
APends
(kPa)
Apparent
shear rate(s-1)
APends
(kPa)
38.2 232.8 5.72 240.5 0.590 218 102.5 317
76.3 273.0 11.4 262.5 1.47 232 138.4 317
190.8 446.5 28.6 351.3 2.94 287 256.3 318
381.6 629.0 57.2 446.6 8.84 362 416.9 314
1144.9 938 171.6 611.0 14.7 364 696.1 314
1908.2 1065 286.1 676.6 29.5 418
572.2 865.5 59.0 492
1144.4 1076 88.4 547
1716.6 1158 147.4 592
T = 50 °C T = 60°C
Die diameter
D= 0.97 mm
Die diameter
D= 0.97 mm
Apparent
shear rate
(e)APends
(kPa)
Apparent
shear rate
(s-1)
APends
(kPa)
102.5 153 138.4 125
138.4 136 256.3 165
256.3 141 416.9 171
416.9 195 696.1 183
696.1 180^I 1390.7 242

I'^I^IIIII^11. 51^ I
Mozzarella cheeseDie: 2a=180°
T = 25°C^_-• D=0.43 mm, UD=15■ D=0.43 mm, UD=30• D=0.43 mm, UD=47♦ D=0.76 mm, UD=7.8♦ D=0.76 mm, UD=15• D=0.76 mm, UD=33
D=2.1 mm, UD=4D=2.1 mm, UD=15
T = 40°Co D=0.038", UD=9• D=0.038", UD=53
T = 50°C• D=0.038", UD=9• D=0.038", L/D=53
T = 60°CO D=0.038", L/D=9A D=0.038", UD=53
T =60°C
- T = 25°C
T = 40°C
T = 50°C
A^a^a^a^a^tal^ I^I^a^a^a imi
102
10 1
10°
CHAPTER 8 - CAPILLARY FLOW 82
The Bagley corrected flow curves of Mozzarella cheese at different
temperatures are shown in Fig. 8.4. At each temperature, the flow curves
corresponding to the dies with different L/D ratios now falls on a single line,
defining uniquely the apparent flow curve of the mozzarella cheese. In addition,
as the temperature increases, the wall shear stress decreases. The flow curve at
25°C has a slope of about 0.24 which is significantly different from those at the
higher temperatures (- 0.40). This is obviously due to the different nature
(structure) of cheese at low temperature (solid-like) compared to that at higher
temperatures (liquid-like), as previously illustrated in temperature sweep linear
viscoelastic measurements.
10 1^102^
103^
104^
105
Apparent shear rate, TA (s- 1 )
Fig. 8.4 The Bagley corrected flow curves of mozzarella cheese at thetemperatures of 25°C, 40°C, 50°C, and 60°C obtained using capillarydies with various diameters, L/D ratios and an entrance angle of 180°.The straight lines shown are obtained by linear regression analysis ofthe data (R2 = 0.97, 0.98, 0.99, and 0.93 for 25°C, 40°C, 50°C and60°C respectively).

CHAPTER 8 — CAPILLARY FLOW 83
The slopes of these Bagley corrected flow curves are used to determine
the Rabinowitch correction for each temperature as discussed in section 2.4.3.
Table 8.2 summarizes the Rabinowitch correction at each temperature. Table 8.2
lists the decrease of Rabinowitch correction with an increase in temperature. The
Rabinowitch correction is then used to calculate the true wall shear rate at the
different temperatures following equation (2.32). The true flow curves of
mozzarella cheese for the different temperatures can then be constructed, and
these are shown in Fig. 8.5. Comparing to Fig. 8.4, these flow curves are
essentially shifted along the shear rate axis according to the value of the
Rabinowitch corrections.
Table 8.2 Rabinowitch correction for the capillary extrusion of mozzarella atdifferent temperatures.
Temperature(°C)
Rabinowitchcorrection
25 4.1
40 2.7
50 2.4
60 2.4
8.3 Wall Slip
Possible wall slip effects can be observed from the flow curves of the
material obtained using dies of different diameters. As can be seen clearly from
Fig. 8.5, at 25°C, the flow curve of mozzarella cheese is independent of the die
diameter and therefore no slip effects are present in capillary extrusion up to wall
shear stress values of about 30 KPa. This value is perhaps too low to observe
wall slip. In fact, reports by Corfield et al. (1999) and Halliday and Smith (1995)
on the extrusion of potato pastes show that the critical shear stress for the onset
of wall slip is in the range of 40 to 60 KPa, which is outside the wall shear stress
window encountered in this study (Muliawan and Hatzikiriakos, 2007b).

1 02
Mozzarella cheeseDie: 2a=180°
10°10 1^102^ 103 104
10 1
CHAPTER 8 — CAPILLARY FLOW 84
Wall shear rate, 'w(5 -1 )
Fig. 8.5 The true flow curves of mozzarella cheese at temperatures of 25°C,40°C, 50°C, and 60°C obtained using capillary dies with variousdiameters, LID ratios and an entrance angle of 180°. The straight linesshown are obtained by linear regression analysis of the data (R = 0.97,0.98, 0.99, and 0.93 for 25°C, 40°C, 50°C and 60°C respectively).
8.4 Effects of Die Geometry
Dies of different entrance angles were also used to extrude the mozzarella
cheese. The apparent shear stress, crA , is depicted as a function of the
contraction angle, 2a for several values of the apparent shear rate, )> A in Fig. 8.6.
There seems to be an optimum value of entrance angle at which the wall shear
stress is minimized. This trend has also been observed in the extrusion of
polytetrafluoroethylene (PTFE) paste where it was found that at sufficiently small
entrance angle, the flow of the material in the die conical section follows a plug
flow type of pattern known as "radial flow" (Ariawan et al., 2002). The decrease of
the apparent shear stress at small entrance angles is consistent with the
lubrication approximation for flow of molten polymer and other materials (Dealy
and Wissburn, 1990). The slight increase in the apparent shear stress beyond a
certain entrance angle (30 °) is also consistent with the trends observed in the

0 20^40^60^80 100 120
60- Temperature: 25°C: Capillary die: D=0.508 mm, UD=20
10
50
40
30
20
CHAPTER 8 - CAPILLARY FLOW 85
extrusion of elastic solids (Horrobin and Nedderman, 1998; Ariawan et al., 2002).
Although this set of experiment was performed only at a temperature of 25°C, it
is expected that at higher temperatures, where the flow properties of the
mozzarella cheese are similar to those of molten polymer, the effect of die
geometry on the flow curve will exhibit similar trend.
Entrance angle, 2a ( ° )
Fig. 8.6 The effect of entrance angle, 2a, on the apparent shear stress in theextrusion of mozzarella cheese at 25 °C and several apparent shearstress values.
8.5 Extrudate Appearance
Typical extrudates collected from the extrusion experiments are shown in
Fig. 8.7. The extrudates were obtained from the extrusion of the cheese sample
at 25°C using a die with a diameter of 0.813 mm, L/D of 15 and entrance angle of
180° . These pictures were taken using an optical microscope (Olympus Mic-D,
Olympus, Center Valley, PA, USA). Surface defects appear even at very small
shear rate values. At such relatively low temperature, the mozzarella cheese
retains its solid like behavior and tends to fracture as it is extruded. Surprisingly,
the surface of the extrudates improves as the shear rate increases. A possible

CHAPTER 8 - CAPILLARY FLOW 86explanation is that the extrusions at relatively high shear rates may generate
sufficient shear heating which causes the cheese in contact with the die wall to
melt locally and thus flow easily. At 60°C (Fig. 8.7b), the extrudates all show
relatively smooth surface (even for shear rate as low as 27 s -1 ). At 60°C, cheese
is in a melt state and it flows through the contraction instead of fracturing. This
results in a defect free extrudate surface. Furthermore, it has also been reported
that at 60°C, there is an absence of yield stress which should induce capillary
flow readily, even at relatively low shear rates (Muliawan and Hatzikiriakos,
2007b).
A^II if 11 11^11^11
2 ./A 0_1) 7 11 14 II 35^11 A 11 a69^208^347^694^1389 2083
IA (s - 1 ) =^27^138^256^417
Fig. 8.7 Extrudate appearance of mozzarella cheese obtained from capillaryextrusion at different shear rates at A) 25°C, and B) 60°C.

CHAPTER 8 - CAPILLARY FLOW 87
It appears that the entrance angle of the die does not have any significant
effect on the extrudate appearance as can be seen from Fig. 8.8. Furthermore,
extrusions using dies with different lengths and diameters have shown that these
geometrical characteristics have no significant effect on the extrudate
appearance.
2a = 15° 30° 60° 90°Fig. 8.8 Extrudate appearance of mozzarella cheese obtained from capillary
extrusion using capillary dies with a length of 10.2 mm (0.4"), diameter of0.508 mm (0.02") and different entrance angles at a shear rate value of38 s -1 at 25°C.
8.6 A Viscoplastic Model for Capillary Flow of Mozzarella Cheese
In Fig. 8.9, the true flow curve is given for mozzarella cheese as derived
from capillary experiment at 25 °C. The flow curve obtained from the sliding plate
is also shown. At sufficiently low shear rates, the data obtained from the sliding
plate rheometer is more reliable because the sliding pate rheometer has a
smaller force transducer capacity. It can be seen from Fig.8.9 that there is
generally a very good agreement between the two sets of data. The experimental
data were successfully fitted with the Herschel-Bulkley viscoplastic model:
a = o-Y + Ki, n
y= 00
fora > ay
for 101 ^ ay
(8.1a)
(8.1 b)
where a is the shear stress, y is the shear rate, ay is the yield stress, K is the
consistency index, and n is the power-law index. In this case, Ty, =1.93 KPa,
K = 3.34 kPa-s, and n = 0.25. Note that when n =1 and K = ,u (a constant), the

102
Temperature = 25°C
10°^' ■■■■■11^ ■■■■,11^1^111..1^1^1^1^kil^ 1..1
10 1
• Capillary• Sliding plate
CHAPTER 8 - CAPILLARY FLOW 88
Herschel-Bulkley model reduces to the Bingham model. When r = 0 , the power-
law model is recovered, and when 1-, =0 and n =1 , the Newtonian model is
obtained.
1 0-2^10-1^10°^101^102^103^104
Wall shear rate, 'kw(s 1 )
Fig. 8.9 True flow curve of mozzarella cheese obtained from capillary and slidingplate rheometers at 25 °C. Solid line is a Herschel-Bulkley viscoplasticmodel fit of the experimental data.
As was presented earlier in chapter 6, the yield stress value acquired from
the shear-ramp viscometry test for mozzarella cheese at 25 °C was 1620 ± 93 Pa.This agrees reasonably well with the yield stress value derived from the fitting of
capillary data, i.e., Ty = 1930 kPa. An interesting point to note is also the fact that
this stress value is in close proximity of the limit of linear viscoelasticity which is
about 1500 Pa (see Fig. 5.2). Thus, it is clearly illustrated here that at 25 °C, yieldstress exists for mozzarella cheese and that to impose a flow under thiscondition, the structure of the mozzarella cheese has to be broken. As will bepresented below, this will form the basis to explain the consistencies (orinconsistencies) between the result obtained from linear rheology and capillary
flow.

CHAPTER 8 - CAPILLARY FLOW 89
8.7 Comparison with Linear Rheology
Plots that depict a comparison between the dynamic and absolute
viscosity in shear are shown in Fig. 8.10. Viscosity data obtained from the sliding
plate rheometer at 25°C are also plotted (Muliawan and Hatzikiriakos, 2007).
Very good agreement can be seen between the viscosity determined from the
sliding plate and capillary rheometers. On the other hand, the dynamic and
steady viscosities are different at 25°C, 40°C and 50°C. First of all, it should be
stressed that this disagreement is not due to moisture loss as the samples in
these tests were exposed minimally and structural changes occurred much
slower compared to those in extensional tests. The lack of agreement shows that
cheese does not follow the classical Cox-Merz rule that typically applies to simple
polymer melts at least over a range of shear rates. Bistany and Kokini (1983)
reported similar result for various types of food materials such as butter, ketchup,
margarine and cream cheese. They suggested that the dynamic and steady
shear data can be superposed by shifting the dynamic data; no scientific reason
was given for the necessity to this shift. Similar observation has also been
reported by Doraiswamy et al. (1991) for concentrated suspension systems and
Yu and Gunasekaran (2001) for different types of food such as ketchup, yogurt,
mayonnaise, and mozzarella cheese. These systems including mozzarella
cheese possess structure and therefore exhibit a yield stress at relatively low
temperatures.
As presented in chapter 6, the yield stress of cheese found using the
shear ramp viscometry method were 1620 ± 93 Pa at 25°C, 216 ± 19 Pa at 40 °C
and 1.4 + 0.3 Pa 50°C. At 60°C, however, it was not possible to determine a yieldstress value as the cheese loses its structure due to melting. Based on theseobservations, it can be presumed that at 25°C, 40°C and 50°C, the cheesesample is viscoplastic, possessing a structure, whereas at 60°C, the structurebreaks and as a result the cheese behaves like a viscoelastic fluid.

1 04
0_1 03
102
10 1
A106
10°10 .2^10 -1^10°^10 1^102
;,4 (0), co (rad s -1 )
C
B
103^104^10-1^10°^101^102^103
A (0) co (rad s -1 )D
1 04
• • •• Capillary• Oscillatory
106
104U)
o_ 103
1 02
10 1
10°
• ■
CapillaryOscillatorySliding Plate
T = 40°C
• "1
• . 4.• Capillary• Oscillatory
p- 10 1
10°
103
(/)co 102
104
_1 03
4 102
10 1
10°
LAA•A^T = 50°C .....
A„AAAAA
CHAPTER 8 — CAPILLARY FLOW 90
10 -1^10°^101^102^
103^104^10-1^10°^101^102^103^
10 4
A(S-1 ) ,O) (rad s-1) YA (s- 1 ), co (rad s -1 )
Fig. 8.10 Comparison of viscosities of mozzarella cheese obtained from linearoscillatory shear and capillary extrusion experiments at A)25 °C,B)40 °C, C)50°C, and D)60°C.
Based on this yield stress analysis, the discrepancy between the dynamic
and steady shear viscosity data plotted in Fig. 8.10 can be explained. At 25°C,
the dynamic oscillatory data are collected using a very small stress well below
the yield stress. This causes no destruction of the structure. On the other hand, in
extrusion and sliding plate experiments, the deformations are non-linear and
result in stresses that are well beyond the yield stress. These essentially break
any existing structure in the material and the material exhibits its fluid-like
character (Muliawan and Hatzikiriakos, 2007). This observation has also been
reported by Yu and Gunasekaran (2001) on their work on yogurt. They attribute
the discrepancy to the presence of a weak gel structure that is broken in the large
scale deformation but stays intact during small amplitude oscillatory shear
experiments. Similarly, at 40°C and 50°C, the fact that yield stress exists at these

CHAPTER 8 - CAPILLARY FLOW 91
temperatures show that the cheese still maintains the structure of the protein
matrix to a certain extent as the protein has not been totally mobilized. Again,
extrusions at these temperatures involve large strain deformations that
essentially break the structure of the cheese. Small amplitude oscillatory shear
experiments at these temperatures are again performed at deformations which
are small enough that the structures are preserved. This causes the
disagreement between the capillary and oscillatory rheological data.
At 60°C, the mozzarella cheese loses its structure as most of the protein is
highly mobile. This is reflected in its insignificant yield stress. Thus, at 60°C,
dynamic oscillatory tests were performed at a deformation which causes the
cheese sample to actually flow; consistent with the large scale deformation
imposed during capillary flow. This explains the agreement between the dynamic
and steady shear data at 60°C.
8.8 Summary
In this chapter, capillary extrusions were used to characterize mozzarella
cheese rheologically. Bagley or end-pressure corrections were found to be
significant, especially at lower temperatures. Surprisingly, wall slip was found to
be insignificant in this specific study due to small shear rates attained. In general,
the flow of mozzarella cheese can be described by a Herschel-Bulkley model.
The extrudates collected during the extrusions were analyzed visually and it was
found that at 25 °C, the extrudates obtained were highly distorted. On the other
hand, at 60°C, the extrudates have smooth profile. This indicates that extrusion
can be used as processing method for mozzarella cheese at relatively high
temperatures. In comparing with linear rheology, it was found that at lower
temperatures, there is a significant disagreement between capillary and linear
viscoelastic data. This was attributed to the presence of yield stress. This
discrepancy disappears at 60°C due to the absence of yield stress.

CHAPTER 9:
ROLL FORMING
9.1 Introduction
Forming using rollers are commonly used in the forming of metals and
sheeting of synthetic polymers; processes known as cold or hot rolling and
calendaring respectively. In the food industry, rolling is mostly performed to sheet
dough for bread and cookie production. Consequently, roll forming experiments
to characterize dough and to model the sheeting process have been done by
several authors (Levine, 1996; Engmann et al., 2005; Peck et al., 2006). Rolling
of cheese, however, has not been used before as an alternative method of
cheese processing.
In this chapter, the results obtained from roll forming experiments of
mozzarella cheese at 25 °C are presented. Rolling experiments were performed
for the different reduction ratios and the shear stress on the rollers is calculated
(according to Eqn. 2.37). The results presented here also include the initial and
exit thickness of the mozzarella cheese samples at the different reduction ratios.
Finally, several images of the rolled samples are presented.
9.2 Roll Forming of Mozzarella Cheese
Roll forming experiments were performed at 25°C. Similar to the extrusion
experiments, the variance of the steady state rolling force is significant in some
cases. Typical transient rolling curves are plotted in Fig. 9.1. In this case, the
standard deviation of the steady state value for most cases can be as high as ±
20 %. Peck et al. (2006), on their rolling experiments on flour dough, observed
data variation of about 17%. Thus, it appears that such variation is typical in food
materials where sample heterogeneity can be significant. To minimize the effect
of these variations, replicates of at least four runs were performed to generate
the rolling curves. The measurement data presented is an average of these
92

CHAPTER 9 – ROLL FORMING 93
different runs, with pooled standard deviations taken as an indication for error of
these data.
0.05 ^Temperature = 25°CRR = 2.1^ Linear speed of rollers:
2.8 cm/s11.5 Cm/s
— • - 28.8 cm/s
0.04 -
•^t
djo • 0011,j%
;i
f^Li
vE 0.03 -Za)
0' 02 -
0.01 -
#1410.00^IA^. liana-LUAU
0^100^200^300^400^500^600^700^800
Sample number
Fig. 9.1 Typical transient rolling curves of mozzarella cheese at a reductionratio of 2.1 and at 25 °C for various roller speed.
The rolling shear stress as a function of the roller linear speed for the
different reduction ratio (RR) is shown in Fig. 9.2. The rolling shear stress and the
linear speed of the roller follow a power law relationship for a given reduction
ratio value. An increase in roller speed results in an increase in shear stress. The
rate dependence can be represented with a power law index of 0.26, 0.27, 0.28,
and 0.25 for the reduction ratios of 1.4, 1.7, 2.1, and 2.3 respectively. These
values compare well with the slope of the flow curve obtained from the capillary
extrusion experiments at 25°C (see Fig. 8.5). Roughly speaking, dividing the
roller speed by the distance between the rollers results in a characteristic shear
rate and thus such agreement is not surprising. Furthermore, these values
appear to be in good agreement with those observed in the rolling of bread
dough (Engmann et al., 2005). A higher reduction ratio also results in a higher
rolling shear stress due to the higher extensional strain rate required to roll the

■ RR = 2.3• RR = 2.1• RR = 1.7• RR = 1.4
1 0 3
10 -3 1 0-2 1 0-1 10°
105
CHAPTER 9 — ROLL FORMING 94
cheese into the gap. The shear stress appears to increase with the reduction
ratio exponentially (see Fig. 9.3) which is in agreement with the rolling of soft and
hard flour doughs at comparable reduction ratios (Peck et al., 2006).
Roller linear speed (m s -1 )
Fig. 9.2 Rolling curves of mozzarella cheese for different reduction ratios at25°C.
The thickness of the sample as it exits the rollers was also measured in
order to determine the elastic recovery of the material. The recovery in thickness
can be used as a measure of elasticity i.e. the ability of the material to store
energy when it passes through the rolls which is being released after and
manifests itself as recovery in thickness (Muliawan and Hatzikiriakos, 2007b).
The rolled samples were allowed to relax fully before the thickness were
measured using a caliper. Fig. 9.4 shows the recovery of thickness (exit
thickness/roller gap) as a function of the roller speed for different reduction ratios.
For a constant reduction ratio, the thickness recovery of the sample increases
with roller speed. Thus, samples that are rolled at higher roller speed experience
higher degree of swelling. It can also be seen that for a reduction ratio of 2.3, the

70
60
50
40
30
20
1 0
CHAPTER 9 - ROLL FORMING 95
reduction in the thickness of the samples can be quite significant (as high as 22%
of the initial sample thickness). It must also be noted that the standard deviation
of the measurements at the reduction ratio of 2.3 is relatively higher than those
corresponding to lower reduction ratios. This is because the deformation at such
reduction ratio is quite significant which causes the sample to fracture.
Temperature = 25 °C
aa i^-i Linear speed (m•s -1 ):
• 0.58 _■^0.29 ._
s^ i• •^0.11#
I va^*^ v^0.06
:^ ♦^0.03 -• 0.01 -
2.5^
3.0
Reduction ratio
Fig. 9.3 Rolling shear stress as a function of reduction ratio for different linearspeed for mozzarella cheese at 25°C.
Fig. 9.5 shows pictures of typical rolled samples. In general, at relatively
low reduction ratios (<2.1), the cheese was able to be rolled cleanly, without any
significant adherence of the cheese on the rollers. Significant sample deformation
occurs at reduction ratios of 2.3 and 2.7 which causes some cheese samples to
stick to the rolling drums as rolling occurs. In any case, rolling seems to be a
viable option to shape mozzarella cheese as long as the reduction is kept
relatively small (< 2.1) to maintain the structure of the cheese (Muliawan and
Hatzikiriakos, 2007b).
01.0^1.5^2.0

- Temperature = 25 °C
-2111
ak RR:• 2.3• 1.7• 1.4
2.5
2.0
1.5
1.0
RR = 2.3
RR = 2.1
RR = 2.3
CHAPTER 9 — ROLL FORMING 96
0.0^
0.2^
0.4^
0.6^
0.8
Roller linear speed (m s -1 )
Fig. 9.4 The effect of roller speed on the exit thickness of the samples forreduction ratios of 1.4, 1.7. and 2.3 at 25°C. The exit thickness isnormalized by the gap between the rollers (0.241 cm).
RR = 1.4
Fig. 9.5 Typical images of rolled mozzarella cheese samples at 25°C.

CHAPTER 9 - ROLL FORMING 97
9.3 Summary
In the food industry, rolling is a technique which is widely used in the
processing of dough. It has been shown that rolling can be used to process
mozzarella cheese. In general, the rolling curves are consistent with the flow
curves obtained from capillary extrusions. Based on the rolled samples, rolling
has the potential to be a feasible technique for cheese processing, as long as the
reduction ratio is kept to minimum.

CHAPTER 10:
COMPARATIVE STUDY OF FREEZING AND RHEOLOGY OF DIFFERENTBRANDS OF MOZZARELLA CHEESE
10.1 Introduction
In the last few years, the emergence of frozen foods has prompted the
food industry to investigate the effect of storage on their products. In products
such as frozen pizzas and lasagnas, the stability of cheese is very crucial
because it is usually the only cooked ingredient in these products. Consequently,
several studies on the effect of frozen storage on the viscoelastic properties of
mozzarella cheese have been done (Ak and Gunasekaran, 1996; Bertola et al.,
1996; Chaves et al., 1999; Cervantes et al., 1983). They have concluded that, in
general, ripened mozzarella cheese can be stored frozen (sub zero temperature)
for several weeks without significant effects. Storage at cold temperatures (0 °C to
10°C), however, results in refrigerated aging, which causes the mozzarella
cheese to have reduced dynamic moduli (Ak and Gunasekaran, 1996).
In this chapter, the extensional and linear viscoelastic properties of
different brands of mozzarella cheese are studied and compared. The three
different brands are namely Best Buy mozzarella cheese (Lucerne, Canada),
which has already been studied extensively in the previous chapters, Kraft
processed mozzarella cheese (Kraft Foods, Canada) and Ziggy's mozzarella
cheese (President's Choice, Canada). The linear viscoelastic properties of the
mozzarella cheese after sub-zero refrigerated storage are also determined.
Several blocks of these different brands of cheese were purchased from a local
grocery store and they were stored in a freezer at approximately -10 °C. Before
testing, the cheese was thawed at room temperature for about 12 hours.
Table 10.1 summarizes the chemical composition of these mozzarella
cheeses (J.R. Laboratory, Burnaby, BC). The Table shows that the three different
98

CHAPTER 10 — COMPARATIVE STUDY OF FREEZING AND RHEOLOGYOF DIFFERENT BRANDS OF MOZZARELLA CHEESE 99
brands of mozzarella cheese do not exhibit significant differences in terms of
their compositions. However, as will be illustrated later, these different mozzarella
cheeses exhibit quite different linear viscoelastic properties.
Table 10.1 Compositional analysis of the different brands of mozzarella cheese.
Component Best Buy Kraft Ziggy's Detection Limit Method
Carbohydrate 6.08 wt.% 4.34 wt.% 6.97 wt.% -
—Calculated as (100wt.%moisture —wt.%protein — wt.%fat —wt.%ash)
Modification of AOAC991.36 (extraction time atboiling was 3.5 hours
Fat 25.29 wt.% 23.05 wt.% 24.45 wt.% 0.10% instead of 25 minutes;drying oven temperaturewas 100oC instead of125°C)
Moisture 42.44 wt.% 43.69 wt.% 40.77 wt.% 0.10% AOAC 950.46
Modification of AOAC981.10 (weight of samplewas 1.0 g instead of 2.0 g;digestion time was 2.5
Protein-total 22.60 wt.% 24.92 wt.% 24.31 wt.% 0.50% hours instead of 45minutes; acid used fortitration was sulfuric acidinstead of hydrochloricacid)
Calcium745.2
mg/100g752.5
mg/100g715.5
mg/100g -Modification of AOAC985.35 (microwavedigestion instead of ashing)
10.2 Extensional PropertiesSamples cut in three different directions; perpendicular, parallel and in
transverse directions were tested under extensional deformation at 25 °C to
determine if the mozzarella cheese exhibit anisotropic behavior. Figs 10.1 and
10.2 summarize the results for Kraft and Ziggy's mozzarella cheese respectively.
As can be seen from Fig. 10.1, the Kraft processed mozzarella cheese exhibits
some degree of anisotropic behavior. This anisotropic behavior is shown as an
increase of extensional stress growth for a specific sample cut, which indicates

Kraft mozzarella cheese- Temperature = 25°C
E H= 1.13
Cut direction:
ParallelPerpendicularTransverse
Time, t (s)
CHAPTER 10 — COMPARATIVE STUDY OF FREEZING AND RHEOLOGYOF DIFFERENT BRANDS OF MOZZARELLA CHEESE 100
that the specific cut is along the direction of the protein fiber orientation (Ak and
Gunasekaran, 1997). Ziggy's mozzarella cheese, on the other hand, does not
seem to exhibit such anisotropy (Fig. 10.2). This is similar to the behaviour found
in Best Buy mozzarella cheese (see section 7.2). Thus, most probably, the
anisotropic behavior in the Kraft processed mozzarella cheese arises due to the
different technique used to manufacture the processed cheese. Unfortunately,
the details of the technique is unavailable, thus it is not possible to further assess
this behavior.
Fig. 10.1 Tensile stress growth coefficient of Kraft mozzarella cheese samplesprepared by cutting in three different directions at a Hencky strain rateof 1.13 s -1 and temperature of 25 °C.
Stress growth extensional curves for the two different brands of cheese
are shown in Figs 10.3 and 10.4. In general, the extensional behavior of these
cheeses are very similar to that exhibited by Best Buy mozzarella cheese (see
Fig 7.2). In all cases, for the different Hencky strain rates, a rapid increase in the
extensional stress growth can be observed which is followed by a sudden
decrease in the tensile stress growth curves. This is, as explained earlier, an
indication of the solid like behavior of the mozzarella cheese.

Cut direction:
ParallelPerpendicularTransverse
.111111111. 01111111.
Ziggy's mozzarella cheeseTemperature = 25°CE H = 1.13 s -1
CHAPTER 10 — COMPARATIVE STUDY OF FREEZING AND RHEOLOGYOF DIFFERENT BRANDS OF MOZZARELLA CHEESE 101
105
U)ca
a)
a)O
104
-g2rnU)U)
a)
a)I-
1031 0-2^
10-1^ 10°
Time, t (s)
Fig. 10.2 Tensile stress growth coefficient of Ziggy's mozzarella cheese samplesprepared by cutting in three different directions at a Hencky strain rateof 1.13 s -1 and temperature of 25°C.
10.3 Limit of Linear Viscoelasticity and Sample StabilityDynamic stress amplitude sweeps at 25 °C, 40°C, 50°C and 60°C were
performed for the different brands of cheese. It was found that for up to eight
weeks of frozen storage, there was no significant difference. The limits for the
onset of non-linearity for Kraft and Ziggy's mozzarella cheese are very similar to
Best Buy's (see Table 5.1).
Time sweep experiments were also performed on the different brands of
cheese to determine the stability of the cheese during experiment. Again, the
result is very similar to that exhibited by Best Buy (see Section 5.1). This
observation is consistent for all of the samples which were frozen stored for up to
eight weeks. Thus, in parallel with was done in the testing of Best Buy mozzarella
cheese, all dynamic measurements were conducted within the time before the
moduli increase sharply, as explained in section 5.1.

Kraft mozzarella cheeseTemperature = 25 0C
Ziggy's mozzarella cheeseTemperature = 250C
CHAPTER 10 - COMPARATIVE STUDY OF FREEZING AND RHEOLOGYOF DIFFERENT BRANDS OF MOZZARELLA CHEESE 102
1 06
U)o_
1054-a
a)5
8^104
Ocr)(t)v)
(^1030.01^
0.1^
1^
10
Time, t (s)
Fig. 10.3 Tensile stress growth coefficients of Kraft mozzarella cheese at 25 °C.
106
105Ca)
oo..c^104
2
cnv)
(7)^1030.01
Time, t (s)
0.1^
1^
1 0
Fig. 10.4 Tensile stress growth coefficients of Ziggy's mozzarella cheese at25°C.

CHAPTER 10 - COMPARATIVE STUDY OF FREEZING AND RHEOLOGYOF DIFFERENT BRANDS OF MOZZARELLA CHEESE 103
10.4 Dynamic Frequency Sweep: Effects of Frozen StorageDynamic frequency sweep experiments were performed at 25°C, 40°C,
50°C, and 60°C for the different brands of cheese and for the different frozen
storage periods. Figs 10.5 and 10.6 summarize the linear viscoleastic properties
for the different brands of cheese. It can be seen that at 25 °C (Fig 10.5), the
different brands of cheese exhibit strikingly similar viscoelastic behaviour.
Differences in their viscoelasticity are observed at an elevated temperature of
60°C (Fig 10.6; the curves are obtained from time-temperature superposition of
data obtained at 40°C, 50 °C, and 60 °C to a reference temperature of 60 °C). It
must be noted that for clarity, the viscous modulus data has been multiplied by a
factor of 0.1. At 60 °C, Kraft and Ziggy's mozzarella cheeses exhibit the highest
and lowest dynamic moduli respectively. The phenomenon that causes the
different levels of moduli decrease for the different brands of cheese is most
likely due to the way the cheeses were manufactured, which dictates the
molecular arrangements of the protein matrix. It is expected that the Kraft
mozzarella cheese, being a processed cheese, has a much tighter and more
uniform protein matrix. In this configuration, upon heating, the interactions among
the casein molecules are still maintained to a considerable degree. This results in
Kraft cheese to exhibit less reduced dynamic moduli compared to the other
brands of cheese. The other mozzarella cheeses are not processed cheese and
they have more liberated casein particles which make these cheeses more
sensitive to temperature changes.
The effect of long term frozen storage of the different brands of cheese up
to 60 weeks on their linear viscoelasticity is determined. The results are
summarized in Figs 10.7, 10.8 and 10.9 for Best Buy, Kraft, and Ziggy's
mozzarella cheese respectively. It should be noted that some of the viscous
modulus data in these plots have been multiplied by a factor of 0.1 or 0.01 for the
sake of clarity.

o Best BuyO Ziggy'sA Kraft
Best Buy 7,Ziggy's :Kraft
CHAPTER 10 - COMPARATIVE STUDY OF FREEZING AND RHEOLOGYOF DIFFERENT BRANDS OF MOZZARELLA CHEESE 104
1 06
irs'a_
Z.D_(..9
= 105O20_E05c>.,o
104
10-3^10-2^10-1^10°^101^
1 02^
103
Frequency, co (Hz)Fig. 10.5 Dynamic moduli of the three different brands of mozzarella cheese at
25 °C.
105
-Fasa. 1040_ -cp• 10 3O20_ECO 102a
10 1
1 0 -2^
1 0 -1^1 0°^10 1^
102^103^
1 04^
105
Shifted Frequency, o.).a_r (Hz)
Fig. 10.6 Time-temperature superposed dynamic moduli of the three differentbrands of mozzarella cheese at a reference temperature of 60°C.

105
103
Best Buy mozzarella cheeseTemperature = 25°C
• 0 week■ 2 weekA 6 week^ 18 week• 58 week
Best Buy mozzarella cheeseTemperature = 40°C
447.:G"-
• 0 week■ 2 weekA 6 week^ 18 week• 58 week
Best Buy mozzarella cheeseTemperature = 50°C^
G '
G"* 0.1data • "
41.000,01,A020. • 0 week4•0^• 2 week
A 6 week^ 18 week• 58 week
0-104
(0
• 103
O
• l>-•
10 110 -2^10-1
Frequency, co (Hz)
105
10° 101 102
CHAPTER 10 - COMPARATIVE STUDY OF FREEZING AND RHEOLOGYOF DIFFERENT BRANDS OF MOZZARELLA CHEESE 105
O1 05
22E
10 4
106
A B
10-2^10-1^
10°^101^
102^103^
10 -2^10-1^10°^
10 1^102
Frequency, co (Hz)^
Frequency, co (Hz)
C^
DBest Buy mozzarella cheese
. Temperature = 60°C^a / ItS.P
1.144striC °
*• ■,t$411411'7840 week1,__."4 ■ 2 week• - to.
• —47% % 4. • ̂ A 6 week^ 18 week
G"* 0.1 i • °
• 58 week
10-2^10 -1^10°^
10 1^10 2
Frequency, co (Hz)
Fig. 10.7 The effect of frozen storage on the dynamic moduli of Best Buymozzarella cheese at a temperature of A)25 °C, B)40°C, C)50°C, andD) 60°C.
From Fig 10.7, it can be seen that the dynamic moduli of Best Buy
mozzarella cheese at the different temperatures do not seem to be significantly
altered from frozen storage up to 58 weeks, except perhaps at 60 °C. This is not
the case, however, for Kraft and Ziggy's mozzarella cheese, as seen in Figs 10.8and 10.9. For these brands, the dynamic moduli at 25 °C do not seem to be
affected by frozen storage up to 60 weeks. However, at relatively highertemperatures, there seems to be a more obvious effect of frozen storage and theeffect is more pronounced with an increase in temperature. Observing the data at
60°C, it can be seen that the dynamic moduli of the Kraft and Ziggy's mozzarella
104
103
102
10 1

Kraft mozzarella cheeseTemperature = 25°C
• 0 week• 1 week• 3 week• 8 week• 20 week• 60 Week
(5
(5202
ECO
10'
104
10'10-'^10-2^10-1^10°^101
106
102 10'
•• 704611.4.4i'r'. •^*. • •
::#/.:••••:^
G" * 0.01
•104•Vtle.• •_0:^191.... •
0 week
*47° • •^• 1 week
• °•••^3
•• 20 week
8 wweeeekk
o 60 Week
Kraft mozzarella cheeseTemperature = 60°C
CHAPTER 10 - COMPARATIVE STUDY OF FREEZING AND RHEOLOGYOF DIFFERENT BRANDS OF MOZZARELLA CHEESE 106
cheese decrease after 1 week of frozen storage. The dynamic moduli remain
relatively constant after this initial 1 week of storage, until up to 20 weeks of
storage. The dynamic moduli decrease further after frozen storage of 60 weeks.
A^
BKraft mozzarella cheeseTemperature = 40°C^t•Zrg (10*•
................. .....
pg44:0;;;:$g'°° ^°°°°°
°°°°°°°°°°°°°°° v.•••^• 0 week• °°°° 0 °°^■ 1 week
• 3 week^ 8 week• 20 week •• 60 Week
10-2^10-1^
10°^10'^
102
Frequency, on (Hz)^
Frequency, on (Hz)
C^
D
105
-o 1030
E03 IW
10 1
10'
17 104
0..9^10'
02 1020E
rj 10 1
1 0°10-2
.....,^.^.^.• •---^.•.....,Kraft mozzarella cheese^ G'
:
Temperature = 50°C ... 461),V14;
fellet°541181141114:1!...*
G"* 0.1•°°°°°°°°°°°°
te^. re .5?: : : . • .......t : °° °°°°0,4 INeormtAl;
• 0 week■ 1 week 3 week
^ 8 week ,• 20 week• 60 Week
.^.^.^.....
10'
104a-
to 103
102
2 10 1
O 10°
10-110- "^100^10 1^102^10-2^101^10°
^101^
102
Frequency, on (Hz)^
Frequency, on (Hz)
Fig. 10.8 The effect of frozen storage on the dynamic moduli of Kraft mozzarellacheese at a temperature of A)25 °C, B)40°C, C)50°C, and D) 60°C.
The significant decrease in dynamic moduli for the different brands of
mozzarella cheese, at least in the first few weeks, is most likely due to the
freezing of the proteins, since it is unlikely for the mozzarella cheese to undergo
some degree of proteolysis activities while kept in a frozen storage within this
time frame (Chaves et al. 1999). The change in the linear viscoelasticity with
frozen storage time can also be due to the rate of cooling and the cooling cycle of
the freezer. It has been found that rapid cooling of cheese is required to maintain

Ziggy's mozzarella cheeseTemperature = 25°C
• 0 week• 1 week• 3 week• 8 week• 20 week• 60 Week
Ziggy's mozzarella cheeseTemperature = 400C
• 0 week• 1 week •A 3 week• 8 week• 20 week• , 60 Week
10-2^
10 -1^10°^10'^
102^
10-3^10-2^
10.1^10°^
10 110-3 102
106
105
103
105
0 104(0
(5
: 1030-o
cs 102
10 1
Ziggy's mozzarella cheeseTemperature = 50 0C
G '
istlf#214tett.""to.^G"*0 1
lit."446 "1"144141
e^
• 0 week• ■ 1 week
A 3 week^ 8 week• 20 week• 60 Week
.^•^•^•^ •^•^ •^•^,^■
Ziggy's mozzarella cheese
Temperature = 60°C
0.0i
;11
▪
^week
11140; week
A 3
week• •^
v
8R week
•20 week
•60 Week
10 -2^10-1^10°^101^
102 10 -2^10 .1^10°^
10 1^102
104
10 3
isz.9^102
-o
• 1
•
0 112
In
•
10°
101
105
a. 104
s 103
0 1022E
a 10 1
10°
CHAPTER 10 — COMPARATIVE STUDY OF FREEZING AND RHEOLOGYOF DIFFERENT BRANDS OF MOZZARELLA CHEESE 107
its textural attributes (Luck, 1977; Gunasekaran and Ak, 2003). If a cheese is
slowly frozen, it may need some tempering time to regain the desired functional
attributes of unfrozen cheese (Gunasekaran and Ak, 2003). In this project, the
cheese was kept in a residential freezer and thus the rate of freezing was slow.
Furthermore, with a residential freezer, there was also the possibility of a cooling
cycle in the freezer, which may present additional variable to consider in
assessing the effect of frozen storage. It seems, then, that the effect of frozen
storage on the mozzarella cheese really dependent on the cheese type,
temperature of storage, rate of cooling, cooling cycle, as well as thawing period;
as noted also by Gunasekaran and Ak (2003).
A^
B
Frequency, co (Hz)^
Frequency, (1) (Hz)
C^
D
Frequency, co (Hz) Frequency, w (Hz)
Fig. 10.9 The effect of frozen storage on the dynamic moduli of Ziggy'smozzarella cheese at a temperatue of A)25 °C, B)40°C, C)50 °C, and D)60°C.

CHAPTER 10 - COMPARATIVE STUDY OF FREEZING AND RHEOLOGYOF DIFFERENT BRANDS OF MOZZARELLA CHEESE 108
10.5 SummaryIn this chapter, the rheological properties of three different brands of
mozzarella cheese were compared. The different mozzarella cheeses do not
exhibit linear viscoelastic differences at room temperature. They do, however,
show significant difference at 60 °C. This illustrates the different heating
properties of the different brands of mozzarella cheese. In terms of the
extensional property, the processed mozzarella cheese exhibit anisotropy which
is due to the orientation of its protein fiber, while the other two brands of
mozzarella cheese were isotropic. As more food products are available as frozen
foods, understanding the rheological changes of mozzarella cheese during frozen
storage is very practical. It was illustrated that the effect of frozen storage is
dependent on the cheese type, temperature of storage, rate of cooling, cooling
cycle, as well as thawing period. However, it can be generally inferred that
freezing of the cheese results in the weakening of the protein, causing the
cheese to exhibit decreased dynamic moduli. Over a longer period of frozen
storage, proteolysis activities may additionally weaken the protein matrix and
causes further decrease of dynamic moduli.

CHAPTER 11:
CONCLUSIONS
11.1 General ConclusionsIn this thesis, a study on the rheology of mozzarella cheese has been
performed. Rheology provides insights on the practical characteristics, such as
melting and flow properties of mozzarella cheese as a consumer end product. Its
linear rheology was probed using a parallel plate rheometer, while its extensional
behavior was assessed using an extensional rheometer. Capillary rheometer was
used to determine the non-linear flow properties as well as to assess the
suitability of extrusion process as a post-production technique for mozzarella
cheese. The general deformation behavior of mozzarella cheese under roll
forming was also assessed. Finally, the effect of frozen storage of different
mozzarella cheese on the rheological properties was investigated. Experimental
work were performed at varying temperatures (25°C to 60°C) and due to the
highly complex and dynamic structure of mozzarella cheese, its rheology is
fundamentally different than that of most synthetic polymers.
According to its linear rheology, at room temperature, mozzarella cheese
is a visco-elasto-plastic material and upon heating, exhibits a continuous and
gradual change towards a viscoelastic fluid. In general, the linear viscoelasticity
of mozzarella cheese can be described by a multi-mode generalized Maxwell
model. This behavior was also reflected on its extensional properties, where at
room temperature, mozzarella cheese exhibits brittle fracture, and at higher
temperatures, it exhibits significant strain softening. It has also been illustrated
that the capillary flow of mozzarella cheese at room temperature can be
described by a Herschel Bulkley model. Furthermore, it was proved that extrusion
and rolling are techniques which could and should be further investigated to be
adopted as a post-production method for mozzarella cheese.
109

CHAPTER 11 - CONCLUSIONS 110
The structure of mozzarella cheese was found to be highly temperature-
dependent. With continuous increase in temperature, mozzarella cheese loses its
moisture and at the same time, the fat melts and the protein becomes mobile.
Consequently, phase separation between the fat and protein occurs, which led to
the agglomeration of fat particles and re-arrangement of the protein matrix.
These changes cause irreversible thermal effect on the structure of the cheese.
This was the principal cause of the inconsistencies between the rheological
properties obtained from the experimental methods, where temperature effects
are significant (parallel plate and extensional). In capillary extrusion, structural
changes on the mozzarella cheese due to temperature are relatively less
significant, due to the highly destructive nature of the extrusion process. In this
case, yield stress is a more relevant variable that affects the consistency of its
measurements with linear rheology.
Mozzarella cheese is also commonly found as an ingredient in frozen
foods. Thus, its stability under long term frozen storage is of interest
commercially. Three different brands of mozzarella cheese were tested under the
same frozen storage conditions. Although, at room temperature, there were no
obvious differences, these different mozzarella cheeses exhibit markedly different
linear viscoelastic properties at higher temperatures, which point to the possible
presence of different preservatives/additives which affect their properties
differently at higher temperatures. Furthermore, the effect of frozen storage on
these different mozzarella cheeses seems to be more pronounced at elevated
temperatures. This illustrates the sensitivity of the structure of mozzarella cheese
with an increase in temperature.
11.2 Practical Implications
Although more in-depth study should be done to understand the
implications of the applied processing techniques on the composition and texture
of mozzarella cheese, a few design guidelines, derived purely from this thesis
can be extracted. These are as follows:

CHAPTER 11 - CONCLUSIONS 111
1. Extrusions should be done at 60°C while the cheese is in the melt state.
This not only reduces the extrusion pressure, but also ensures that the
extruded products are more cohesive and exhibit a smooth profile. Of
course, in food industry, one may find distortions on the extrudate surface
to be a marketable property, in which case, extrusion should be done at
lower temperature (eg. 25 °C).
2. It was found that mozzarella cheese exhibits non-reversible thermal
effects. Thus, extrusion of mozzarella cheese at high temperature can be
performed during its manufacture (kneading step, which is usually carried
out in the melt state). In this way, the processing can be done efficiently
and at the same time, the thermal effects on the finished products are
avoided.
3. Roll forming at 25 °C can be used to shape mozzarella cheese as long as
the reduction ratio is kept below 2.3. This ensures that the rolled samples
do not disintegrate. Although, hot rolling (60 °C > T > 35°C) was not
performed in the current work, it is of interest as it is expected that higher
reduction ratios can be achieved when the cheese is near its melt state.
4. Subtle changes which occur in mozzarella cheese during storage can be
assessed using rheological measurements, especially if the
measurements are performed at higher temperatures. Thus, it may be
more practical for quality measurements to be performed at high
temperature (60°C).
11.3 Contributions to Knowledge
The research work has yielded a few novel contributions to knowledge.
The most significant are identified as follows.
1. The consistencies of the behaviors of mozzarella cheese under different
deformations have been studied. In essence, this illustrates the effects of
relevant variables such as moisture, yield stress, duration of experiments,
sample size, and testing geometry on the rheological properties under
different deformation modes.

CHAPTER 11 - CONCLUSIONS 112
2. The capillary flow of mozzarella cheese has been studied. The results
provide an understanding on how capillary extrusion can be used as a
feasible mean of post-production processing technique of mozzarella
cheese. This is novel experimental work that can lead to improved
manufacturing and processing technique to produce improved cheese
products (for example, see Cortes-Martines et al., 2005).
3. Roll forming behavior of mozzarella cheese has been studied. Although,
this work is in its preliminary stage, it can lead to novel post-production
processing technique for mozzarella cheese.
In summary, the research work has provided a clearer insight on the
rheology and structure-property of mozzarella cheese, as determined from well-
developed rheological techniques. More in-depth studies need to be performed to
understand completely this highly complex material and implement the results
into practical applications as discussed earlier. This research work, however,
provided the initial steps towards these practical applications, and therefore,
hopefully stimulate food engineers and scientists to take on new approaches in
the post-production processing of mozzarella cheese (or food materials in
general for that matter).
11.4 Recommendations for Future Work
As stated earlier, the research work is an initial step towards a full
understanding of the rheology of mozzarella cheese (or cheese in general) and
the implementation of synthetic polymer processing methods in food processing.
As such, there are several important aspects of the rheological study of
mozzarella cheese that need further examination. These are recommended
below.
1.^The rheological characterization performed in this study was limited to a
temperature range of 25 °C to 60°C. It would be ideal to study the rheology
at relatively low temperatures to simulate the property of a mozzarella
cheese being consumed immediately from refrigerated storage.

CHAPTER 11 - CONCLUSIONS 113
Regretfully, this was not performed in the current research due to the
unavailability of the proper experimental instruments.
2. Utilizing visualization tools such as cameras, microscopes, and
transparent measuring systems, the flow and deformational behavior of
mozzarella cheese can be better understood. This will help, for example,
in the analysis of slip phenomenon, especially at elevated temperatures
and also in providing a better understanding of the thermal effects on the
properties of the cheese.
3. In order to make the capillary flow study of mozzarella cheese more
complete, the effects of such deformation on the composition of the
cheese can be studied. Further study can also include the textural analysis
of the extruded cheese. In addition, extrusions using other types of dies
such as hyperbolic and annular dies can be carried out, as these dies can
have more practical applications. For example, annular dies can be used
to co-extrude different cheeses (or a cheese with other food material
together) to produce complex and commercially attractive products.
4. More detailed roll forming experiments can be carried out, with particular
emphasis on the roll forming at elevated temperatures. Also, it would be
ideal to obtain a more complete set of rheological parameters, such as roll
separating force and points of attachment and detachment to and from the
rollers from this experiment for modeling purposes.
5. A mathematical model to describe the processing of mozzarella cheese,
especially for capillary extrusion and roll forming operations, can be
developed. This can be used to improve manufacturing and develop
innovative processing equipments.

BIBLIOGRAPHY
Ak M.M. 1993.Rheological measurements on Mozzarella cheese. University ofWisconsin-Madison, Ph.D. thesis.
Ak, M.M. and S. Gunasekaran. 1992. Stress-strain curve analysis of Cheddarcheese by uniaxial compression. Journal of Food Science 57:1078-1081.
Ak, M.M. and S. Gunasekaran. 1995. Measuring elongational properties ofMozzarella cheese. Journal of Texture Studies 26(2):147-160.
Ak, M.M. and S. Gunasekaran. 1996. Dynamic rheological properties ofMozzarella cheese during refrigerated storage. Journal of Food Science61(3):556-568, 584.
Ak, M.M. and S. Gunasekaran. 1997. Anisotropy in tensile properties ofMozzarella cheese. Journal of Food Science 62(5):1031-1033.
Ak, M.M., D. Bogenrief, S. Gunasekaran, and N.F. Olson. 1993. Rheologicalevaluation of Mozzarella cheese by uniaxial horizontal extension. Journal ofTexture Studies 24:437-453.
Apostolopoulos, C. 1994. Simple empirical and fundamental methods todetermine objectively the stretchability of Mozzarella cheese. Journal ofDairy Research 61:405-413.
Ariawan, A. B., S. Ebnesajjad, and S.G. Hatzikiriakos. 2000. Paste extrusion ofpolytetrafluoroethylene (PTFE) fine powder resins. The Canadian Journal ofChemical Engineering, 80:1153-1165.
Arnott, D.R., H.A. Morris, and W.B. Combs. 1957. Effect of certain chemicalfactors on the melting quality of process cheese. Journal of Dairy Science40:957-963.
Bagley, E.B. 1957. End corrections in the capillary flow of polyethylene. Journalof Applied Physics 28:624-627.
Bagley, E.B., F.R. Dintzis, and S. Chakrabarti. 1998. Experimental andconceptual problems in the rheological characterization of wheat flourdoughs. Rheologica Acta 37:556-565.
Baumgartel, M., and H.H. Winter. 1989. Determination of discrete relaxation andretardation time spectra from dynamic mechanical data. Rheologica Acta,28:511-519.
114

BIBLIOGRAPHY 115
Bertola, N.C., A.N. Califano, A.E. Bevilacqua, and N.E. Zaritzky. 1996. Effect offreezing conditions on functional properties of low moisture Mozzarellacheese. Journal of Dairy Science 79:185-190.
Bird, R. B., R.C. Armstrong, and 0. Hassager. 1977. Dynamics of PolymericLiquids, Volume 1. New York: John Wiley & Sons.
Bistany, K.L. and J.L. Kokini. 1983. Dynamic viscoelastic properties of foods intexture control. Journal of Rheology 27:605-620.
Bourne, M. 1982. Food Texture and Viscosity: Concept and Measurement. NewYork: Academic Press.
Cervantes, M., D. Lund, and N. Olson. 1983. Effects of salt concentration andfreezing on Mozzarella cheese texture. Journal of Dairy Science 66:204-213.
Chaves, W., H. Viotto, and C.R.F. Grosso. 1999. Proteolysis and functionalproperties of Mozzarella cheese as affected by refrigerated storage. Journalof Food Science 64:202-205.
Chen, A.H., J.W. Larkin, C.J. Clark, and W.E. Irvine. 1979. Textural analysis ofcheese. Journal of Dairy Science 62:901-907.
Cheng, D.C-H. 1986. Yield stress: A time-dependent property and how tomeasure it. Rheologica Acta 25:542-554.
Cheyne, A., J. Barnes, and D.I. Wilson. 2005. Extrusion behaviour of cohesivepotato starch pastes: I. Rheological characterization. Journal of FoodEngineering 66:1-12.
Cogswell, F.N. 1977. Stretching flow instabilities at the exits of extrusion dies.Journal of Non-Newtonian Fluid Mechanics 2:37-47.
Corfield, G.M., M.J. Adams, B.J. Briscoe, P.J.Fryer, and C.J. Lawrence. 1999. Acritical examination of capillary rheometry for foods (exhibiting wall slip).Transactions of the Institution of Chemical Engineers 77(c):3-10.
Cortes-Martines, E., Schroeder, A., Wolfschoon, A., Schmid, T., & Mehnert, D.(2005). Mozzarella-type string cheese product. United States PatentApplication # 20050208193
Dealy J.M. 1982. Rheometers for Molten Polymers: A Practical Guide to Testingand Property Measurement. New York: Van Nostrand Reinhold Company.

BIBLIOGRAPHY 116
Dealy J.M. and K.F. Wissbrun. 1990. Melt Rheology and Its Role in PlasticsProcessing. New York: Van Nostrand Reinhold Company.
Diefes, H.A., S.S. Rizvi, and J.A. Bartsch. 1993. Rheological behavior of frozenand thawed low-moisture, part skim Mozzarella cheese. Journal of FoodScience 58:764-769.
Doraiswamy, D., A.N. Mujumdar, I. Tsao, A.N. Beris, S.C. Danforth, and A.B.Metzner. 1991. The Cox-Merz rule extended: A rheological model forconcentrated suspensions and other materials with a yield stress. Journal ofRheology 35:647-685.
Drake, M.A., W. Herrett, T.D. Boylston, and B.G. Swanson. 1996. Lecithinimproves texture of reduced fat cheeses. Journal of Food Science 61:639-642.
Engmann, J., M.C. Peck, and D.I. Wilson. 2005. An experimental and theoreticalinvestigation of bread dough sheeting. Food and Bioproducts Processing83(C3):175-184.
Ferry, J.D. 1980. Viscoelastic Properties of Polymers. New York: John Wiley&Sons.
Fife R.L., D.J.McMahon, and C.J. Oberg. 2002. Test for measuring thestretchability of melted cheese. Journal of Dairy Science 85:3549-3556.
Fox, P.F., T.P. Guinee, T.M. Cogan, and P.L.H. McSweeney. 2000.Fundamentals of Cheese Science. Gaithersburg, Maryland: AspenPublication.
Grappin, R., D. Lefler, A. Dasen, and S. Pochet. 1993. Characterizing ripening ofGruyene de Comte: Influence of time x temperature and salting conditionson eye and slit formation. International Dairy Journal 3:313-328.
Guinee T.P. and P.F. Fox. 2001. Biochemical and functional relationships incheese. Dairy products research centre: Teagasc end of project report 2000DPRC No. 30 Armis No. 4537.
Guinee, T.P. and D.J. O'Callaghan. 1997. The use of a simple empirical methodfor objective quantification of the stretchability of cheese on cooked pizzapies. Journal of Food Engineering 31:147-161.
Guinee, T.P., E.P. Feeney, M.A.E. Auty, and P.F. Fox. 2002. Effect of pH andcalcium concentration on some textural and functional properties ofMozzarella cheese. Journal of Dairy Science 85:1655-1669.

BIBLIOGRAPHY 117
Gunasekaran, S. And M.M. Ak. 1997. Measuring physical and functionalproperties of cheese. National Cheese Technology Forum, Dec 9-10,Chicago, IL.
Gunasekaran, S. and M.M. Ak. 2003. Cheese rheology and texture. Boca Ration,Florida: CRC Press LLC.
Gunasekaran, S., C.-H. Hwang, and S. Ko. 2002. Cheese melt/flowmeasurement methods — recent developments. Australian Journal of DairyTechnology 57:128-133.
Halliday, P.J. and A.C. Smith. 1995. Estimation of the wall slip velocity in thecapillary flow of potato granule pastes. Journal of Rheology 39:139-149.
Horrobin, D. J., and R.M. Nedderman. (1998). Die entry pressure drops in pasteextrusion. Chemical Engineering Science 53:3215-3225.
Hort, J. and G. Le Grys. 2000. Rheological models of Cheddar cheese textureand their application to maturation. Journal of Texture Studies 31:1-24.
Hsieh, Y.L., J.J. Yun, and M.A. Rao. 1993. Rheological properties of Mozzarellacheese filled with dairy, egg, soy proteins, and gelatin. Journal of FoodScience 58:1001-1004.
Jaros, D. and H. Rohm. 1994. Uniaxial compression of cheese at constant strainrate. Rheology 4:77-82.
Johnson, M. 2000. The melt and stretch of cheese. Dairy Pipeline 12:1-5.
Joshi, N.S, K. Muthukumarappan, and R.I. Dave. 2004. Viscoelastic properties ofpart skim Mozzarella cheese: Effects of calcium, storage, and testtemperature. International Journal of Food Properties 7:239-252.
Karoui, R., A. Laguet, and E. Dufour. 2003. Fluorescence spectroscopy: A toolfor the investigation of cheese melting — Correlation with rheologicalcharacteristics. Lait 83:251-264.
Kosikowski, F. V. 1977. Cheese and Fermented Milk Foods. Brooktondale, NY:F.V. Kosikowski and Associates.
Levine, L. 1996. Model for the sheeting of dough between rolls operating atdifferent speeds. Cereal Foods World 41:690-697.
Luck, H. 1977. Preservation of cheese and perishable dairy products by freezing.South African Journal of Dairy Technology 9:127-132.

BIBLIOGRAPHY 118
Mavridis, H. and R.N. Shroff. 1992. Temperature dependence of polyolefin meltrheology. Polymer Engineering and Science 32:1778-1791.
Mooney, M. 1931. Explicit formulas for slip and fluidity. Journal of Rheology2:210-222.
Muthukumarappan, K., Y.-C. Wang, and S. Gunasekaran. 1999. Shortcommunication: Modified Schreiber test for evaluation of Mozzarella cheesemeltability. Journal of Dairy Science 82:1068-1071.
Muliawan, E.B. and S.G. Hatzikiriakos. 2007a. Rheology of Mozzarella Cheese.International Dairy Journal 17:1063-1072.
Muliawan, E.B. and S.G. Hatzikiriakos. 2007b. Rheology of Mozzarella Cheese:Extrusion and Rolling. International Dairy Journal, manuscript accepted forpublication.
N.E.M. Business Solutions. 2002. The basics of making cheese.http://www.cip.ukcentre.com/cheese.htm.
Ng, T.S.K., M. Padmanabhan, G.H. McKinley. 2006. Constitutive modelling of thelinear and nonlinear rheology of flour-water doughs and other complexentangled materials. SOR Annual Meeting, Portland, ME, USA.
Nolan E., V. Holsinger, and J. Shieh. 1989. Dynamic rheological properties ofnatural and imitation Mozzarella cheese. Journal of Texture Studies 20:179-189.
Olson, N.F. and W.V. Price. 1958. A melting test for pasteurized process cheesespreads. Journal of Dairy Science 41:999-1000.
Park, J., J.R. Rosenau, and M. Peleg. 1984. Comparison of four procedures ofcheese meltability evaluation. Journal of Food Science 49:1158-1170.
Pastorino, A.J., R.I. Dave, C.J. Oberg, and D.J. McMahon. 2002. Temperatureeffect on structure-opacity relationships of nonfat mozzarella cheese.Journal of Dairy Science 85:2106-2113.
Peck, M.C., S.L. Rough, J. Barnes and D.I. Wilson. 2006. Roller extrusion ofbiscuit doughs, Journal of Food Engineering 74:431-450.
Pesenti, V. and W. Luginbuhl. 1999. Assessment of cohesion in Gruyere-typecheese by rheological methods. Journal of Texture Studies 30:1-6.
Prentice J.H. 1992. Dairy Rheology: A Concise Guide. New York: VCHPublishers, Inc.

BIBLIOGRAPHY 119
Prentice, J.H. 1987. Cheese rheology, in Cheese: Chemistry, Physics, andMicrobiology, P.F. Fox. Ed., pp 299-314. New York: Elsevier.
Rohm, H., H. Lederer, and W. Ginzinger. 1992. Relationship between rheologicalproperties and composition of Swiss-type cheese. 1. Multiple regressionanalysis. Lebensmittel-Wissenschaft und-Technologie 25:253-260.
Rosenbaum, E.E. and S.G. Hatzikiriakos. 1997. Wall slip in the capillary flow ofmolten polymers subject to viscous heating. American Institute of ChemicalEngineers Journal 43:598-608.
Rowney, M., P. Roupas, M.W. Hickey, and D.W. Everett. 1999. Factors affectingthe functionality of Mozzarella cheese. The Australian Journal of DairyTechnology 54:94-102.
Senouci, A. and A.C. Smith. 1988. An Experimental Study of Food MeltRheology. II. End Pressure Effects. Rheologica Acta 27:649-655.
Sentmanat M.L. 2003. SER-HV-A01 Universal testing platform instrumentmanual. Xpansion Instruments, 1-7-1-8.
Shama, F. and P. Sherman. 1973. Evaluation of some textural properties offoods with the Instron universal testing machine. Journal of Texture Studies4:344-352.
Sharma, N., M.A. Hanna, and Y.R. Chen. 1993. Flow behavior of wheat flour-water dough using a capillary rheometer. I. Effect of capillary geometry.Cereal Chemistry 70:59-63.
Shukla, A. and S. Rizvi. 1995. Measurement of flowability of butter by capillaryrheometry. Journal of Texture Studies 26:299-311.
Smith, C.E., J.R. Rosenau, and M. Peleg. 1980. Evaluation of the flowability ofmelted Mozzarella cheese by capillary rheometry. Journal of food science45:1142-1145.
Subramanian, R. and S. Gunasekaran. 1997a. Small amplitude oscillatory shearstudies on Mozzarella cheese. Part I. Region of linear viscoelasticity.Journal of Texture Studies 28:633-642.
Subramanian, R. and S. Gunasekaran. 1997b. Small amplitude oscillatory shearstudies on Mozzarella cheese. Part II. Relaxation spectrum. Journal ofTexture Studies 28:643-656.
Taneya, S., T. Izutsu, T. Kimura, and T. Shioya. 1992. Structure and rheology ofstring cheese. Food Structure 11:61-71.

BIBLIOGRAPHY 120
Tunick, M.H., D.L. van Hekken, P.W. Smith, E.L. Malin, V.H. Holsinger. 2000.Characteristics of Mozzarella cheese made with fortified milk or non fat drymilk. Milchwissenschaft 55:450-453.
Tunick, M.H., E.L. Malin, P.W. Smith., J.J. Shieh, B.C. Sullivan, K.L. Mackey, andV.H. Holsinger. 1993. Proteolysis and rheology of low fat and full fatMozzarella cheeses prepared from homogenized milk. Journal of DairyScience 76:3621-3628.
Tunick, M.H., K.L. Mackey, P.W. Smith, and E.L. Malin. 1991. Effects ofcomposition and storage on the texture of Mozzarella cheese. NetherlandsMilk and Dairy Journal 45:117-125.
Tunick, M.H., P.H. Cooke, E.L. Malin, P.W. Smith, and V.H. Holsinger. 1997.Reorganization of casein submicelles in Mozzarella cheese during storage.International Dairy Journal 7:149-155.
Van Gurp, M. and J. Palmen. 1998. Time temperature superposition forpolymeric blends. Rheology Bulletin 67:5-8.
Venugopal, V. and K. Muthukumarappan. 2003. Rheological properties ofCheddar cheese during heating and cooling. International Journal of FoodProperties 6:99-114.
Vernon Carter, E.J. and P. Sherman. 1978. Evaluation of the firmness ofLeicester cheese by compression testing with Instron universal testingmachine. Journal of Texture Studies 9:311-324.
Visser, J. 1991. Factors affecting the rheological and fracture properties of hardand semi-hard cheese, in Rheological and Fracture Properties of Cheese,Anon, Ed., IDF Bulletin No. 268:49-61. Brussels, Belgium: InternationalDairy Federation.
Voisey, P.W. 1976. Instrumental measurement of food texture, in Rheology andTexture in Food Quality, J.M. deMan, P.W. Voisey, V.F. Rasper, and D.W.Stanley, Eds., pp 79-141. Westport, Connecticut: AVI Publishing Company,Inc.
Wang, Y.-C., K. Muthukumarappan, M.M. Ak., and S. Gunasekaran. 1998. Adevice for evaluating melt/flow characteristic of cheeses. Journal of TextureStudies 29:43-55.
Wettton, R. and R. Marsh. 1990. Dynamic mechanical thermal analysis (DMTA)of food materials, in Rheology of Food, Pharmaceutical and BiologicalMaterials with General Rheology, R. Carter, Ed., 231-247. London: ElsevierApplied Science.

BIBLIOGRAPHY 121
Wium, H. and K.B. Qvist. 1997. Rheological properties of UF-Feta cheesedetermined by uniaxial compression and dynamic testing. Journal of TextureStudies 28:435-454.
Wium, H., M. Gross, and K.B. Qvist. 1997. Uniaxial compression of UF-Fetacheese related to sensory texture analysis. Journal of Texture Studies28:455-476.
Yu. C. and S. Gunasekaran. 2001. Correlation of dynamic and steady flowviscosities of food materials. Applied Rheology 11:134-140.
Yun, J.J., Y.L. Hsieh, D.M. Barbano, and P.S. Kindstedt. 1994. Draw pH andstorage affect rheological properties of Mozzarella cheese. Journal of FoodScience 59:1302-1304.