Optimized method for determination of 16 FDA polycyclic ...
13
Jeffery et al. Chemistry Central Journal (2018) 12:27 https://doi.org/10.1186/s13065-018-0397-2 RESEARCH ARTICLE Optimized method for determination of 16 FDA polycyclic aromatic hydrocarbons (PAHs) in mainstream cigarette smoke by gas chromatography–mass spectrometry Jana Jeffery 1* , Maria Carradus 2 , Karolina Songin 2 , Michael Pettit 2 , Karl Pettit 2 and Christopher Wright 1 Abstract A gas chromatography–mass spectrometry (GC–MS) method was validated for the determination of 16 polycyclic aro- matic hydrocarbons (PAHs) from the FDA list of 93 harmful or potentially harmful constituents of mainstream cigarette smoke (MCS). Target analytes were extracted from total particulate matter using accelerated solvent extraction with a toluene/ethanol solvent mixture. Matrix artefacts were removed by two-step solid-phase extraction process. Three different GC–MS systems [GC–MS (single quadrupole), GC–MS/MS (triple quadrupole) and GC–HRMS (high resolu- tion, magnetic sector)] using the same separation conditions were compared for the analysis of MCS of 3R4F Kentucky reference cigarettes generated under ISO and intense smoking regimes. The high mass resolution (m/∆m ≥ 10,000) and associated selectivity of detection by GC–HRMS provided the highest quality data for the target PAHs in MCS. Owing to the HR data acquisition mode enabling measurement of accurate mass, limits of quantification for PAHs were 5 to 15-fold lower for GC–HRMS than for GC–MS/MS and GC–MS. The presented study illustrates that the optimised sample preparation strategy followed by GC–HRMS analysis provides a fit-for-purpose and robust analytical approach allowing measurement of PAHs at (ultra)low concentrations in MCS. Furthermore, the study illustrates the importance and ben- efits of robust sample preparation and clean-up to compensate for limited selectivity when low-resolution MS is used. Keywords: Polycyclic aromatic hydrocarbons (PAHs), Mainstream cigarette smoke, Gas chromatography–mass spectrometry, High resolution mass spectrometry, Low resolution mass spectrometry, Accelerated solvent extraction © The Author(s) 2018. This article is distributed under the terms of the Creative Commons Attribution 4.0 International License (http://creativecommons.org/licenses/by/4.0/), which permits unrestricted use, distribution, and reproduction in any medium, provided you give appropriate credit to the original author(s) and the source, provide a link to the Creative Commons license, and indicate if changes were made. The Creative Commons Public Domain Dedication waiver (http://creativecommons.org/ publicdomain/zero/1.0/) applies to the data made available in this article, unless otherwise stated. Introduction Mainstream cigarette smoke (MCS) is an extremely com- plex aerosol comprising of vapour phase and particulate phase (total particulate matter, TPM) [1]. MCS contains over 6500 compounds [2], more than 100 of which are established toxicants [3]. Polycyclic aromatic hydrocarbons (PAHs) are a class of compounds containing hydrogen and carbon that comprise multiple aromatic rings. PAHs are formed dur- ing the incomplete combustion of organic material such as gas, coal, wood, tobacco and even chargrilled meat. Interestingly, PAHs do not occur naturally in tobacco plants; however, they can be introduced during tobacco curing and also deposited from vehicle exhaust during transport [4–6]. PAHs are further formed during ciga- rette combustion—in fact, more than 500 different PAHs have been identified in cigarette smoke at yields varying from sub-ng/cigarette to µg/cigarette [2]. In June 2009, the Family Smoking Prevention and Tobacco Control Act became law in the United States and assigned authority to the Food and Drug Administra- tion (FDA) to regulate the manufacture, distribution and marketing of tobacco products as well as to drive require- ments for testing and reporting for selected chemicals to protect public health [7]. In 2012, the FDA Tobacco Prod- ucts Scientific Advisory Committee (TPSAC) established a list of 93 harmful and potentially harmful constituents Open Access *Correspondence: jana_jeff[email protected] 1 British American Tobacco, Research and Development, Southampton, UK Full list of author information is available at the end of the article
-
Upload
khangminh22 -
Category
Documents
-
view
2 -
download
0
Transcript of Optimized method for determination of 16 FDA polycyclic ...

Jeffery et al. Chemistry Central Journal (2018) 12:27 https://doi.org/10.1186/s13065-018-0397-2
RESEARCH ARTICLE
Optimized method for determination of 16 FDA polycyclic aromatic hydrocarbons (PAHs) in mainstream cigarette smoke by gas chromatography–mass spectrometryJana Jeffery1* , Maria Carradus2, Karolina Songin2, Michael Pettit2, Karl Pettit2 and Christopher Wright1
Abstract
A gas chromatography–mass spectrometry (GC–MS) method was validated for the determination of 16 polycyclic aro-matic hydrocarbons (PAHs) from the FDA list of 93 harmful or potentially harmful constituents of mainstream cigarette smoke (MCS). Target analytes were extracted from total particulate matter using accelerated solvent extraction with a toluene/ethanol solvent mixture. Matrix artefacts were removed by two-step solid-phase extraction process. Three different GC–MS systems [GC–MS (single quadrupole), GC–MS/MS (triple quadrupole) and GC–HRMS (high resolu-tion, magnetic sector)] using the same separation conditions were compared for the analysis of MCS of 3R4F Kentucky reference cigarettes generated under ISO and intense smoking regimes. The high mass resolution (m/∆m ≥ 10,000) and associated selectivity of detection by GC–HRMS provided the highest quality data for the target PAHs in MCS. Owing to the HR data acquisition mode enabling measurement of accurate mass, limits of quantification for PAHs were 5 to 15-fold lower for GC–HRMS than for GC–MS/MS and GC–MS. The presented study illustrates that the optimised sample preparation strategy followed by GC–HRMS analysis provides a fit-for-purpose and robust analytical approach allowing measurement of PAHs at (ultra)low concentrations in MCS. Furthermore, the study illustrates the importance and ben-efits of robust sample preparation and clean-up to compensate for limited selectivity when low-resolution MS is used.
Keywords: Polycyclic aromatic hydrocarbons (PAHs), Mainstream cigarette smoke, Gas chromatography–mass spectrometry, High resolution mass spectrometry, Low resolution mass spectrometry, Accelerated solvent extraction
© The Author(s) 2018. This article is distributed under the terms of the Creative Commons Attribution 4.0 International License (http://creativecommons.org/licenses/by/4.0/), which permits unrestricted use, distribution, and reproduction in any medium, provided you give appropriate credit to the original author(s) and the source, provide a link to the Creative Commons license, and indicate if changes were made. The Creative Commons Public Domain Dedication waiver (http://creativecommons.org/publicdomain/zero/1.0/) applies to the data made available in this article, unless otherwise stated.
IntroductionMainstream cigarette smoke (MCS) is an extremely com-plex aerosol comprising of vapour phase and particulate phase (total particulate matter, TPM) [1]. MCS contains over 6500 compounds [2], more than 100 of which are established toxicants [3].
Polycyclic aromatic hydrocarbons (PAHs) are a class of compounds containing hydrogen and carbon that comprise multiple aromatic rings. PAHs are formed dur-ing the incomplete combustion of organic material such as gas, coal, wood, tobacco and even chargrilled meat.
Interestingly, PAHs do not occur naturally in tobacco plants; however, they can be introduced during tobacco curing and also deposited from vehicle exhaust during transport [4–6]. PAHs are further formed during ciga-rette combustion—in fact, more than 500 different PAHs have been identified in cigarette smoke at yields varying from sub-ng/cigarette to µg/cigarette [2].
In June 2009, the Family Smoking Prevention and Tobacco Control Act became law in the United States and assigned authority to the Food and Drug Administra-tion (FDA) to regulate the manufacture, distribution and marketing of tobacco products as well as to drive require-ments for testing and reporting for selected chemicals to protect public health [7]. In 2012, the FDA Tobacco Prod-ucts Scientific Advisory Committee (TPSAC) established a list of 93 harmful and potentially harmful constituents
Open Access
*Correspondence: [email protected] 1 British American Tobacco, Research and Development, Southampton, UKFull list of author information is available at the end of the article

Page 2 of 13Jeffery et al. Chemistry Central Journal (2018) 12:27
(HPHCs) present in tobacco products or tobacco smoke and drafted an abbreviated list of 20 HPHCs that are required to be reported by US tobacco product manufac-turers and importers [8, 9]. Although the abbreviated list contains only benzo[a]pyrene (B[a]P), the full 93 HPHC list includes 16 PAHs (naphthalene, benzo[c]phenan-threne, benzo[a]anthracene, chrysene, cyclopenta[c,d]pyrene, 5-methylchrysene, benzo[b]fluoranthene, benzo[k]fluoranthene, benzo[j]aceanthrylene, B[a]P, indeno[1,2,3-cd]pyrene, dibenzo[ah]anthracene, dibenzo[a,l]pyrene, dibenzo[a,e]pyrene, dibenzo[a,i]pyrene and dibenzo[a,h]pyrene) for which reporting may be required in due course.
The development of reliable methods for the quantitative measurement of PAHs in MCS at toxicologically relevant (i.e. very low) concentrations is therefore a priority. However due to the complexity of the MCS matrix and the variation of PAH concentrations, the development of such methods is challenging and very few data have been published for measurement of the full FDA suite of PAHs in MCS (most published data are for naphthalene and B[a]P only).
Several methods have been published for the quan-tification of PAHs in MCS using a variety of chromato-graphic applications, such as gas chromatography–mass spectrometry (GC–MS) [10–14], high-performance liq-uid chromatography (HPLC)—fluorescence detection [15–18] or tandem mass spectrometry (MS/MS) [19, 20].
There are also several GC–MS based methods for measurement of B[a]P in MCS adopted by laboratories in respective regions; ISO 22634 [21], which originated from CORESTA Recommended Method 58 [11], WHO TobLabNet SOP 05 [22] and Health Canada T-120 [23].
During the FDA Center for Tobacco Products (CTP) Scientific Workshop on Tobacco Product Analysis held in July 2013 [24], the suites of PAHs routinely measured by commercial testing laboratories and cigarette manufac-turers were noted to differ from those in the FDA HPHCs list [8, 10, 12, 13, 19]. Furthermore, the differences in methodologies observed at the CTP meeting [24], as well as large temporal variation of of the yields of smoke constituents [25], have highlighted the need for a harmo-nized fit-for-purpose analytical method.
To meet the need for ultra-low quantification limits for PAHs, techniques commonly applied to trace residue analysis in regulated industries such as food and envi-ronment must be applied. These include the of stable isotope dilution and the selection of suitable solvent(s)—either a single solvent or a solvent mixture that max-imises the recovery of PAHs from the MCS matrix. For example, a solvent mixture combining polar and non-polar solvents was reported to increase PAH recoveries from soot, sediment and Standard Reference Material (SRM) diesel particulate matter [26, 27]. Additionally,
chromatographic selectivity can be optimised by using the most appropriate GC stationary phase (e.g., DB-EUPAH, which was developed specifically for the sepa-ration of PAHs) [28]. In some cases, low-resolution mass spectrometers may not achieve the required quan-tification limits and more sensitive detection may be required. Alternatively, thorough and highly selective sample preparation and clean up may remove enough chemical background to enable the use of low-resolution MS if high-resolution MS is not available.
The aim of the present study was to evaluate an ana-lytical method and to compare three GC–MS systems for the measurement of the 16 PAHs of the FDA HPHC list (GC–MS, GC–MS/MS and GC–HRMS). To our knowl-edge, this is the first study of measurement of all FDA specified PAHs in MCS for which the majority of data exceed the limit of quantification.
ExperimentalMaterialsGlass fibre filter pads (92-mm; Cambridge filter pads, CFPs) were purchased from Borgwaldt KC (Hamburg, Germany). University of Kentucky 3R4F reference cigarettes were obtained from the Center for Tobacco Reference Prod-ucts (University of Kentucky, USA), see Table 1 for 3R4F main characteristics [29]. Base-modified silica cartridges 70 ml/10 g were sourced from Biotage (Uppsala, Sweden).
ChemicalsAs mentioned in the Introduction, there are 16 PAH sub-stances are on FDA HPHC list (Additional file 1: Figure S1). PAH calibration solutions were obtained from Wellington Laboratories (Guelph, Canada) and contained a mixture of native and deuterium (D)-labelled PAHs, and internal standards (Additional file 1: Table S1). The native standards were supplied at concentrations of 2, 10, 40, 200 and 800 ng/ml (product codes PAH-A-CS1, PAH-A-CS2, PAH-A-CS3, PAH-A-CS4 and PAH-A-CS5, respectively); each solution contained the mass labelled analogues each at 100 ng/ml.
Table 1 3R4F Kentucky reference cigarette main charac-teristics
TPM total particulate matter, NFPDM nicotine-free dry particulate matter (TPM with nicotine and water subtracted; ‘tar’)
Parameter Mean value (mg/cigarette)
Weight 1060
TPM [30] 11.0
Nicotine [31] 0.73
NFDPM [30] 10.27
CO [32] 12.0
Puff count [33] 9.0

Page 3 of 13Jeffery et al. Chemistry Central Journal (2018) 12:27
The standard mixes were supplied in toluene/isooctane con-taining toluene at 2, 2.1, 2.4, 4 and 10%, respectively.
Mixed solutions containing only the D-labelled PAHs at 2000 ng/ml (product code PAH-CVS-A) or internal standards at 2000 ng/ml (PAH-ISS-A) were also obtained from Wellington Laboratories. The PAH-CVS-A stand-ard was diluted in toluene:isooctane (2:98, v/v) to obtain standards of lower concentration for GC–HRMS cali-bration. The D-labelled internal standards (from PAH-ISS-A) were prepared at 100 ng/ml in isooctane:toluene (75:25, v/v).
A mixed solution of 16 13C-labelled PAHs at 5 µg/ml; 99% purity in nonane (US EPA 16 PAH; product code ES-4087) was obtained from Cambridge Isotope Labora-tories (Tewksbury MA, USA; Additional file 1: Table S2). The following individual standards also from Cambridge Isotope Laboratories were used as well: dibenzo[a,e]pyrene-13C6 (chemical purity 96.3%), 100 µg/ml in n-nonane:distilled toluene (80:20) (product code CLM-3835-1.2); dibenzo[a,i]pyrene-13C12 50 µg/ml in nonane (chemical purity 99.2%, product code CLLM-3774-A-T-S); and benzo[e]pyrene-9,10,11,12-13C4 100 µg/ml in nonane (chemical purity 99%, product code CLM-6170-S). In addition, a benz[j]aceanthrylene-13C2,d2 and benz[e]aceanthrylene-13C2,d2 standard mix (product code B197912), and a mixture of benz[j]aceanthrylene to benz[e]aceanthrylene in the ratio of 70:30 (product code B197910), both with chemical purity of all compounds of 98% were obtained from Toronto Research Chemicals (North York, Canada).
All solvents (ethanol, toluene, cyclohexane) were ana-lytical grade and purchased from Rathburn Chemicals (Walkerburn, UK). Silica was obtained from MP Biomed-icals (Loughborough, UK). All other reagents including concentrated formic acid were analytical grade and pur-chased from Sigma Aldrich (Gillingham, UK).
SamplesThe test cigarettes 3R4F and CFPs were conditioned per ISO 3402 (22 ± 1 °C and 60 ± 3% relative humidity for a minimum of 48 h but not exceeding 10 days) to ensure their consistency [30, 34]. Total Particulate Matter (TPM) was collected on 92 mm Cambridge Filter Pads by smoking 20 or 10 cigarettes under ISO [35] or Health Canada Intense T-115 (HCI, vents fully blocked) smok-ing regimes [36], respectively, using a rotary smoking machine RM200A (Borgwaldt KC, Hamburg, Germany). CFPs were stored in 60 ml amber glass containers in the freezer set at − 20 °C until extraction and analysis.
Sample extraction and clean‑upBefore extraction, each CFP was fortified with 100 ng of D-labelled and 13C-labelled PAH internal standards in
cyclohexane and left to equilibrate for 24 h in the refrig-erator set at 4 °C. Sample extraction was performed by Accelerated Solvent Extraction (ASE) using a Buchi 916 instrument with a 40-ml cell (Buchi, Oldham, UK). A sin-gle cycle of ASE was used to extract the CFP in 40 ml of solvent (ethanol/toluene 1:9, v/v) at 100 °C with a hold time of 5 min.
For sample clean-up, 4 ml of the CFP extract was added to 20 ml of concentrated formic acid. The mixture was shaken for 2 min on a laboratory shaker set at 300 rpm, and then centrifuged for 5 min at 1500 rpm for phase partitioning. The upper organic layer was removed and retained, and 25 ml of toluene was added to the aqueous layer, which was then shaken and centrifuged as above. The upper layer was again removed and added to the first organic layer. The combined organic extract was added to 25 ml of concentrated formic acid and shaken for 2 min at 300 rpm; 20 ml of water was then added, and the extract was shaken for a further 2 min. Samples were then centrifuged for 5 min at 1500 rpm to allow phase partitioning. The upper organic layer was removed and filtered through sodium sulphate and concentrated to 5 ml using a rotary evaporator set at 40 °C.
The organic extract was first passed through a 70 ml/10 g base-modified silica cartridge containing 20 g layer of acid silica [prepared by mixing 100 g of silica (MP Biomedicals, Loughborough, UK) with 40 g of for-mic acid]. The column was pre-washed with 70 ml of cyclohexane, the sample was loaded and then eluted with 70 ml of cyclohexane. The eluate was collected and con-centrated to 10 ml. Aliquots of this sample (2 ml) were passed through a TELOS Solid-Phase Extraction (SPE) column 1.5 g/6 ml (Part No. 550-015G-006T, Kinesis, St Neots, UK) conditioned with cyclohexane. The column was eluted with 2 × 5 ml of cyclohexane, and the eluate was concentrated to 2 ml final volume. To ensure con-sistency of the sample and minimise any variations, the extract was then divided into three aliquots for the analy-sis by gas chromatography–mass spectrometry (GC–MS). GC–MS systems with three different mass analysers were compared: low resolution with a single quadrupole (GC–MS), low resolution with triple quadrupole (GC–MS/MS) and high resolution with double-focussing mag-netic sector (GC–HRMS). A schematic flow chart of the analytical procedure is summarised in Fig. 1.
GC separation conditionsThe same separation conditions were used for all three types of MS analysis1 (Table 2). For GC–MS/MS only,
1 These were based on a United Kingdom Accreditation Service (UKAS)-accredited method (ISO 17025) for the analysis of PAH compounds by GC–HRMS (Marchwood Scientific Services, Southampton, UK).

Page 4 of 13Jeffery et al. Chemistry Central Journal (2018) 12:27
QQQ collision cell, EPC helium quench gas flow was 2.25 ml/min and N2 collision gas flow was 1.5 ml/min.
Mass spectrometryThe single-quadrupole mass analyser used for GC–MS was an Agilent Technologies 6890N GC system coupled to an Agilent 5973N Quadrupole Mass Spectrometer with Agilent Mass Hunter Version E.02.1431 (Agilent Technologies, Wokingham, UK). The triple-quadrupole mass analyser used for GC–MS/MS was an Agilent 7890N with Mass Hunter software version B05.02. The magnetic sector high-resolution mass spectrometer used for GC–HRMS was an Agilent 6890N GC system cou-pled to a Waters AutoSpec P716 HRMS with MassLynx software version 4.1 SCN815 (Waters, Elstree, UK). The MS data acquisition parameters for GC–MS, GC–MS/MS and GC–HRMS are presented in Additional file 1: Tables S3–S7.
Data analysisData analysis was conducted using the above-mentioned software.
Quality assuranceUnfortified CFPs were extracted to provide method blank samples. For regular monitoring of analytical method performance, unsmoked/blank CFPs were fortified with 40 ng of native standards, 100 ng of internal standards and extracted following the analytical procedure (Addi-tional file 1: Table S8). Recoveries of native PAHs in quality control samples were calculated by division of the mass of PAHs quantified per CFP by the fortifica-tion mass. Values were multiplied by 100 to obtain the percentage recovery. Internal standards recovery was assessed for each analytical sequence to monitor the method performance.
Fig. 1 Flow chart of analytical procedure
Table 2 GC conditions used for analysis of PAHs in mainstream smoke
GC separation conditions
Injection Multimode (PTV) injection, splitless mode
Injection volume 2 µl
Carrier gas Helium; 1 ml/min (50 min), then 2 ml/min (until the end of the analytical run)
Column Agilent DB-EUPAH (60 m × 250 mm × 0.25 µm)
Oven temperature programme 50 °C (0.8 min), ramp 45 °C/min to 200 °C, ramp 2.5 °C/min to 225 °C, ramp 5 °C/min to 266 °C, ramp 14 °C/min to 300 °C, ramp 10 °C/min up to 320 °C (48 min). Total run time 74.762 min
Page 5 of 13Jeffery et al. Chemistry Central Journal (2018) 12:27
The limit of quantitation (LOQ) was established as the lowest concentration of an analyte in a sample that can be determined with acceptable precision and accuracy under the stated conditions of test [37]. The LOQs were determined for each MS system from the respective S/N ratio of each analyte in 3R4F mainstream smoke extract to represent analytical conditions.
Results and discussionThe complexity of mainstream smoke can result in a multitude of co-extracted matrix components that may significantly compromise the analysis. As mentioned in the introduction, thorough optimisation of several key aspects of an analytical method is critical to achieve the required selectivity and sensitivity.
Solvent selectionInitially, methanol and cyclohexane were assessed as the most frequently referenced solvents for extraction of PAHs. Visual inspection of the CFP after extraction indicated that a more polar solvent such as methanol might extract TPM more efficiently from the CFP (the pad appeared visually clean after extraction) compared with the non-polar cyclohexane (TPM residues remained visible on the pad). However, several papers reported advantages of using a mixture of polar and non-polar solvents for gaining higher recoveries of PAHs from com-plex matrices such as soot and diesel particulate matter [26, 27]. For example, Masala et al. [27] reported 2–17× higher concentrations of PAHs found in diesel particu-lar matter when a solvent system of toluene/ethanol (9:1, v/v) coupled to ASE was used compared to toluene [27]. Therefore, toluene/ethanol (9:1, v/v) was selected.
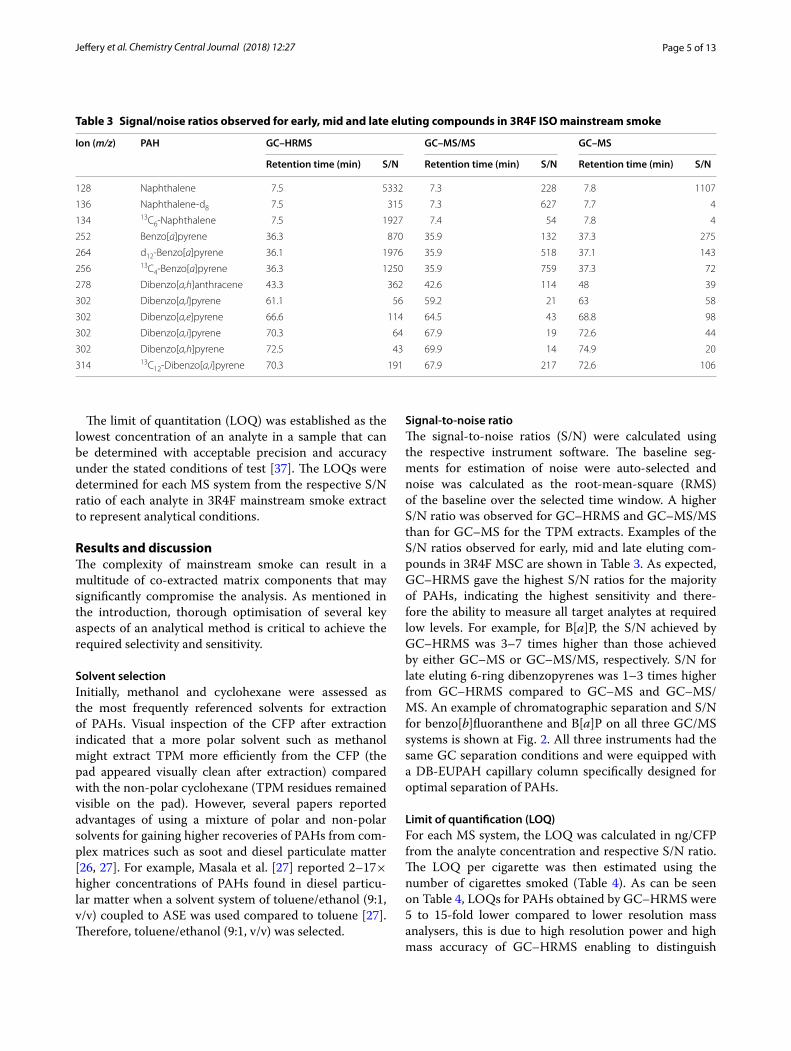
Signal‑to‑noise ratioThe signal-to-noise ratios (S/N) were calculated using the respective instrument software. The baseline seg-ments for estimation of noise were auto-selected and noise was calculated as the root-mean-square (RMS) of the baseline over the selected time window. A higher S/N ratio was observed for GC–HRMS and GC–MS/MS than for GC–MS for the TPM extracts. Examples of the S/N ratios observed for early, mid and late eluting com-pounds in 3R4F MSC are shown in Table 3. As expected, GC–HRMS gave the highest S/N ratios for the majority of PAHs, indicating the highest sensitivity and there-fore the ability to measure all target analytes at required low levels. For example, for B[a]P, the S/N achieved by GC–HRMS was 3–7 times higher than those achieved by either GC–MS or GC–MS/MS, respectively. S/N for late eluting 6-ring dibenzopyrenes was 1–3 times higher from GC–HRMS compared to GC–MS and GC–MS/MS. An example of chromatographic separation and S/N for benzo[b]fluoranthene and B[a]P on all three GC/MS systems is shown at Fig. 2. All three instruments had the same GC separation conditions and were equipped with a DB-EUPAH capillary column specifically designed for optimal separation of PAHs.
Limit of quantification (LOQ)For each MS system, the LOQ was calculated in ng/CFP from the analyte concentration and respective S/N ratio. The LOQ per cigarette was then estimated using the number of cigarettes smoked (Table 4). As can be seen on Table 4, LOQs for PAHs obtained by GC–HRMS were 5 to 15-fold lower compared to lower resolution mass analysers, this is due to high resolution power and high mass accuracy of GC–HRMS enabling to distinguish
Table 3 Signal/noise ratios observed for early, mid and late eluting compounds in 3R4F ISO mainstream smoke
Ion (m/z) PAH GC–HRMS GC–MS/MS GC–MS
Retention time (min) S/N Retention time (min) S/N Retention time (min) S/N
128 Naphthalene 7.5 5332 7.3 228 7.8 1107
136 Naphthalene-d8 7.5 315 7.3 627 7.7 4
134 13C6-Naphthalene 7.5 1927 7.4 54 7.8 4
252 Benzo[a]pyrene 36.3 870 35.9 132 37.3 275
264 d12-Benzo[a]pyrene 36.1 1976 35.9 518 37.1 143
256 13C4-Benzo[a]pyrene 36.3 1250 35.9 759 37.3 72
278 Dibenzo[a,h]anthracene 43.3 362 42.6 114 48 39
302 Dibenzo[a,l]pyrene 61.1 56 59.2 21 63 58
302 Dibenzo[a,e]pyrene 66.6 114 64.5 43 68.8 98
302 Dibenzo[a,i]pyrene 70.3 64 67.9 19 72.6 44
302 Dibenzo[a,h]pyrene 72.5 43 69.9 14 74.9 20
314 13C12-Dibenzo[a,i]pyrene 70.3 191 67.9 217 72.6 106

Page 6 of 13Jeffery et al. Chemistry Central Journal (2018) 12:27
two peaks of slightly different mass-to-charge ratios. This increases selectivity and sensitivity in complex matrices (especially when trace analysis is required), which was a significant requirement for this study.
The LOQs for GC–MS and GC–MS/MS were of a sim-ilar order of magnitude compared to GC/MS published data [13]. Ding et al. reported limits of detection (LODs) between 0.01 and 0.1 ng/cigarette from blank CFP (i.e. no smoke matrix) fortified with PAHs using HPLC–MS/MS [19].
Quantification of PAHs by GC–HRMS, GC–MS/MS and GC–MSThe PAH levels in the TPM of 3R4F cigarettes smoked under both ISO and HCI conditions were quantified by the three types of GC–MS using 13C-labelled stand-ards for calibration. The recovery of the internal stand-ards was also calculated by dividing the peak area of the internal standard in each replicate by the average peak area obtained for the calibration standard. As mentioned in “Experimental” section, the same extracts were ana-lysed on all three GC–MS systems. The recoveries of internal standards as measured by the different meth-ods are compared in Additional file 1: Tables S9 and S10.
Although in general, the apparent recoveries were com-parable between the three GC–MS systems, some inter-nal standards (e.g. naphthalene, benzo[j]aceanthrylene, dibenzo[ah]anthracene) had consistently lower recover-ies for both smoking regimes in both low resolution sys-tems. The recoveries were the most stable and consistent in GC–HRMS, therefore GC–HRMS accuracy and preci-sion data were used in the text below as examples illus-trating method performance. For 3R4F ISO mainstream smoke, internal standard recoveries ranged from 66% (benzo[j]aceanthrylene) to 86% (dibenzo[a,i]pyrene) and the repeatability from 3% (benzo[a]anthracene, B[a]P) to 13% (dibenzo[a,i]pyrene). Similar results were obtained in the case of 3R4F HCI mainstream smoke with internal standard recoveries 66% (dibenzo[ah]anthracene) to 92% (benzo[b]fluoranthene and benzo[j]fluoranthene) and repeatability from 4% (naphthalene) to 12% (benzo[b]fluoranthene).
For the ISO TPM extracts, all 16 analytes were quan-tified by GC–HRMS (Table 5). In contrast, four PAHs were below the LOQ for GC–MS/MS analysis (benzo[c]phenanthrene, 5-methylchrysene, benzo[j]aceanthrylene and dibenzo[a,l]pyrene), and three were not detected by GC–MS (dibenzo[a,l]pyrene, dibenzo[a,i]pyrene and
Fig. 2 Benzo[b]fluoranthene and B[a]P separation and sensitivity (S/N) on tested GC/MS systems in 3R4F ISO MCS

Page 7 of 13Jeffery et al. Chemistry Central Journal (2018) 12:27
dibenzo[a,h]pyrene). The mean yields (6 replicates) of detected analytes were comparable between the three GC–MS techniques and were also comparable to the limited published data that are available (Table 5) [10, 13, 38]. For example, Roemer et al. [38] reported the concentrations of PAHs in the smoke of 2R4F and 3R4F cigarettes, but with the exception of dibenzo[a,e]pyrene, the dibenzopyrenes were all below the limit of quanti-fication. Dibenzo[a,h]anthracene, dibenzo[a,l]pyrene, dibenzo[a,e]pyrene, dibenzo[a,i]pyrene and dibenzo[a,h]pyrene yields were lower for GC–HRMS than for GC–MS/MS or GC–MS. This might be due to the higher selectivity of the HR instrument and associated removal of matrix contributions to the signal for some analytes. The repeatability of six replicates, expressed as the rela-tive standard deviation (RSD, %) was expected to be the poorest for PAHs present at sub-ng levels (diben-zopyrenes) and remaining analytes had RSDs largely less than 20%. Figure 3 shows a graphical comparison of PAHs measured in 3R4F ISO mainstream smoke by all three GC/MS systems (presented are mean values, n = 6 replicates).
Similar results were obtained for the 3R4F HCI extracts; all analytes were quantifiable by GC–HRMS (Table 6) [38], whereas three were below the LOQ by GC–MS/MS (5-methylchrysene, benzo[j]aceanthrylene and dibenzo[a,l]pyrene), and three were not detected by
GC–MS at all (dibenzo[a,l]pyrene, dibenzo[a,i]pyrene and dibenzo[a,h]pyrene). The PAH yields were compara-ble among the three techniques and with published data (Table 6) [38], although the information on HCI yields is very sparse.
Because of its high mass resolution (M/∆M ≥ 10,000), accurate mass (typically < 5 ppm accuracy) and associated high selectivity of detection, GC–HRMS provided the highest quality data, which were reflected in the ability of GC–HRMS to quantitatively measure all 16 PAHs in complex mainstream smoke compared to both low reso-lution systems. The comparative limitations of GC–MS/MS and GC-LRMS were illustrated by the case of dibenz-opyrene isomers, which are present at low levels and may contribute to overall toxicity but are commonly reported as non-detect results.
The availability of quantitative data is especially rel-evant for toxicologically significant PAHs such as dibenzo[j]aceanthrylene and dibenzopyrene isomers (dibenzo[a,l]pyrene, dibenzo[a,e]pyrene, dibenzo[a,i]pyrene and dibenzo[a,h]pyrene).
Quantification using deuterated (D) and 13C calibrationStable isotope dilution is a robust technique of measure-ment by ratio [39]. Deuterium-labelled analogues are typically less expensive and more commercially avail-able with shorter lead times compared to 13C-labelled
Table 4 Comparison of LOQs for 16 PAHs achieved by GC–HRMS, GC–MS/MS and GC–MS
ND analyte not detected in the samplea 20 cigarettes per CFP were smoked under ISO smoking regime
Analytes GC–HRMS GC–MS/MS GC–MS
LOQ, (ng/CFPa)
Estimated LOQ, (ng/cig)
LOQ, (ng/CFPa)
Estimated LOQ, (ng/cig)
LOQ, (ng/CFPa)
Estimated LOQ, (ng/cig)
Naphthalene 0.51 0.026 1178.71 58.94 108.17 5.41
Benzo[c]phenanthrene 0.04 0.002 ND ND 66.80 3.34
Benzo[a]anthracene 0.03 0.002 38.57 1.93 38.11 1.91
Chrysene 0.04 0.002 50.13 2.51 49.61 2.48
Cyclopenta[c,d]pyrene 0.02 0.001 48.84 2.44 60.04 3.00
5-Methylchrysene 0.04 0.002 ND ND 2.48 0.12
Benzo[b]fluoranthene 0.04 0.002 11.44 0.57 5.08 0.25
Benzo[k]fluoranthene 0.05 0.003 12.41 0.62 5.07 0.25
Benzo[j]aceanthrylene 0.09 0.005 ND ND ND ND
Benzo[a]pyrene 0.04 0.002 5.01 0.25 3.03 0.15
Indeno[1,2,3-c,d]pyrene 0.02 0.001 5.46 0.27 1.54 0.08
Dibenzo[a,h]anthra-cene
0.07 0.004 0.83 0.04 1.48 0.07
Dibenzo[a,l]pyrene 0.05 0.003 ND ND ND ND
Dibenzo[a,e]pyrene 0.04 0.002 0.80 0.04 0.28 0.01
Dibenzo[a,i]pyrene 0.06 0.003 1.33 0.07 ND ND
Dibenzo[a,h]pyrene 0.07 0.004 2.99 0.15 ND ND

Page 8 of 13Jeffery et al. Chemistry Central Journal (2018) 12:27
Tab
le 5
PA
H le
vels
in 3
R4F
ISO
MC
S o
bta
ined
by
thre
e G
C/M
S sy
stem
s u
sin
g 13
C-l
abel
led
inte
rnal
sta
nd
ard
s
IS in
tern
al s
tand
ard,
NA
not
ap
plic
able
, NR
not r
epor
ted,
RSD
rela
tive
stan
dard
dev
iatio
na R
ecov
ery
calc
ulat
ed fr
om G
C–H
RMS
data
b n
= 6
rep
licat
esc 13
C m
ass
lab
elle
d in
tern
al s
tand
ards
wer
e no
t ava
ilab
le
PAH
GC
–HRM
SG
C–M
S/M
SG
C–M
SIS
reco
very
aPu
blis
hed
val
ues,
(n
g/c
ig) [
10]
Pub
lish
ed v
alue
s,
(ng
/cig
) [13
]Pu
blis
hed
val
ues,
(n
g/c
ig) [
37]
Mea
n, (
ng
/cig
)bRS
D, (
%)
Mea
n, (
ng
/cig
)bRS
D, (
%)
Mea
n, (
ng
/cig
)bRS
D, (
%)
Mea
n, (
%)
RSD
, (%
)
Nap
htha
lene
385.
37
367.
36
479.
622
737
287 ±
36
360.
8N
R
Benz
o[c]
phen
an-
thre
ne2.
035
< 0
.5N
A4.
85
–c–
NR
NR
NR
Benz
o[a]
anth
ra-
cene
12.6
511
.223
13.3
381
313
± 1
.414
.111
.8
Chr
ysen
e15
.310
18.5
1217
.610
594
17 ±
1.8
16.2
NR
Cycl
open
ta-[c,d
]py
rene
5.0
2210
.713
7.0
5–
–N
RN
RN
R
5-M
ethy
lchr
ysen
e0.
214
< 1
.5N
A0.
213
––
NR
NR
< 0
.4
Benz
o[b]
fluor
an-
then
e5.
114
5.5
75.
76
794
8.3 ±
1.0
5.4
5.09
Benz
o[k]
fluor
an-
then
e2.
213
2.4
62.
94
833
1.6 ±
0.3
2.2
2.02
Benz
o[j]a
cean
-th
ryle
ne0.
420
< 2
.5N
A0.
315
668
NR
NR
NR
Benz
o[a]
pyre
ne6.
712
6.2
57.
34
753
7.0 ±
0.8
6.6
6.73
Inde
no[1,2,3
-cd]
pyre
ne3.
19
0.7
850.
46
785
NR
3.8
2.87
Dib
enzo
[ah]
anth
race
ne0.
46
3.2
73.
16
804
NR
NR
< 0
.97
Dib
enzo
[a,l]
pyre
ne0.
0334
< 7
.5N
A<
0.2
NA
––
NR
NR
< 0
.19
Dib
enzo
[a,e
]py
rene
0.1
320.
416
0.3
882
10N
RN
R0.
173
Dib
enzo
[a,i]
pyre
ne0.
179
0.4
32<
0.2
NA
8613
NR
NR
< 0
.22
Dib
enzo
[a,h
]py
rene
0.1
590.
42
< 0
.2N
A–
–N
RN
R<
0.2
3

Page 9 of 13Jeffery et al. Chemistry Central Journal (2018) 12:27
analogues. However, 13C-labelled analogues are not affected by deuterium–proton exchange and have simi-lar mass spectra to the native substance (deuterated analogues can undergo different mass losses if a deuter-ated moiety fragments) [40, 41]. Although in theory a single labelled analogue per homologue group is accept-able, in practice a labelled analogue per target substance accounts more fully for any matrix artefacts.
D- and 13C-labelled internal standards calibration was compared for quantification of PAH yields by GC–HRMS. Both quantification methods produced compa-rable masses of PAH compounds in 3R4F mainstream cigarette smoke generated under ISO and HCI condi-tions (Table 7) indicating consistency between both methods of calibration. RSD values for both D- and 13C calibrations were broadly comparable between both ISO and HCI sample sets. Interestingly, in ISO extracts, RSDs for some analytes including dibenzopyrenes were higher when D-labelled calibration was used compared to 13C. In HCI extracts, the opposite trend was observed. RSDs of < 20% was observed for all PAH compounds quanti-fied using D-labelled analogues as the internal standards
apart of dibenzo[a,e]pyrene (22%). For 13C-HCI quan-titation, the RSD was < 10% for all analytes except dibenzo[a,l]pyrene (RSD, 16%). The RSD was < 15% for 11 and 9 of the 16 analytes using D- and 13C-labelled cali-bration, respectively. Calibration was observed to be gen-erally consistent for most compounds using either set of mass-labelled internal standards.
ConclusionsIn this study, three GC–MS systems were assessed for quantitative measurement of the 16 PAHs required by FDA (naphthalene, benzo[c]phenanthrene, benzo[a]anthracene, chrysene, cyclopenta-[c,d]pyrene, 5-methyl-chrysene, benzo[b]fluoranthene, benzo[k]fluoranthene, benzo[j]aceanthrylene, benzo[a]pyrene, indeno[1,2,3-cd]pyrene, dibenzo[ah]anthracene, dibenzo[a,l]pyrene, dibenzo[a,e]pyrene, dibenzo[a,i]pyrene, dibenzo[a,h]pyr-ene) in mainstream cigarette smoke.
Sample preparation strategy was improved by using exhaustive ASE extraction and a mixture of ethanol and toluene. The two-phase SPE clean up resulted in efficient removal of matrix artefacts. This allowed quantification
Fig. 3 PAHs in 3R4F ISO MCS (a). Zoom view PAHs at (ultra)low levels (b)

Page 10 of 13Jeffery et al. Chemistry Central Journal (2018) 12:27
of PAHs at very low levels using GC–HRMS, and prob-ably also compensated for increased potential interfer-ence when low-resolution mass selective detection was used.
The GC separation conditions were the same for all three modes of detection and all three systems were equipped with a DB-EUPAH column, which is the opti-mal stationary phase for this separation. GC–HRMS detection system was found have the highest selectivity and sensitivity, providing a reduction in the interference of matrix co-extracts while achieving the lowest LOQs
as compared with GC–MS/MS and GC–MS. Owing to the HR data acquisition mode enabling measurement of accurate mass, LOQs for PAHs were 5 to 15-fold lower for GC–HRMS than for GC–MS/MS and GC–MS.
These data demonstrate that the optimised sample preparation strategy followed by GC–HRMS analy-sis provides a fit-for-purpose and robust analytical approach, allowing fully quantitative determination of 16 PAHs and due to its robustness has a scope for fur-ther extension (both analytes and matrices/products), if required. Generation of such data is especially helpful
Table 6 PAH levels in 3R4F HCI MCS obtained by three GC/MS systems using 13C-labelled internal standards
IS internal standard, NA not applicable, NR not reported, RSD relative standard deviationa Recovery calculated from GC–HRMS datab n = 6 replicatesc 13C mass labelled internal standards were not available
PAH compound GC–HRMS GC–MS/MS GC–MS IS recoverya Published data, (ng/cig) [38]
Mean, (ng/cig)b RSD, (%) Mean, (ng/cig)b RSD, (%) Mean, (ng/cig)b RSD, (%) Mean, (%) RSD, (%)
Naphthalene 1249 13 1197 10 1564 9 73 4 NR
Benzo[c]phenan-threne
4.4 40 7.6 45 8.5 14 –c – NR
Benzo[a]anthra-cene
30.6 11 33.0 6 29.8 5 87 10 29.80
Chrysene 35.3 12 38.3 9 35.9 3 75 11 NR
Cyclopenta-[c,d]pyrene
9.7 17 19.1 16 17.5 4 – – NR
5-Methyl-chrysene
0.4 10 < 1.5 NA 0.4 7 – – < 0.1
Benzo[b]fluoran-thene
12.1 14 13.1 7 12.6 2 92 12 13.20
Benzo[k]fluoran-thene
5.1 9 5.7 7 5.5 7 92 11 5.38
Benzo[j]acean-thrylene
0.7 28 < 2.5 NA 0.5 39 82 1 NR
Benzo[a]pyrene 15.2 11 13.9 7 16.2 9 85 6 16.20
Indeno[1,2,3-cd]pyrene
6.8 10 1.2 13 0.8 9 70 6 7.37
Dibenzo[ah]anthracene
0.9 9 7.1 10 7.0 2 66 5 < 2.4
Dibenzo[a,l]pyrene
0.1 19 < 7.5 NA < 25 – – – < 0.475
Dibenzo[a,e]pyrene
0.5 30 0.8 7 0.7 5 70 6 0.86
Dibenzo[a,i]pyrene
0.4 46 0.8 30 < 75 – 75 6 < 0.55
Dibenzo[a,h]pyrene
0.3 27 1.1 29 < 75 – – – < 0.575
Page 11 of 13Jeffery et al. Chemistry Central Journal (2018) 12:27
Tab
le 7
PA
H le
vels
in 3
R4F
MC
S q
uan
tifi
ed b
y G
C–H
RM
S u
sin
g D
- or
13C
inte
rnal
sta
nd
ard
s
Dat
a ar
e no
t bla
nk-s
ubtr
acte
d, a n
= 5
rep
licat
es, b
n =
3 re
plic
ates
. c Onl
y 13
C s
tand
ards
wer
e us
ed
IS in
tern
al s
tand
ard,
NC
not c
alcu
late
d—no
inte
rnal
sta
ndar
d fo
r the
indi
cate
d PA
H),
NR
not r
epor
ted
PAH
com
pou
nd
ISO
sm
okin
g re
gim
eH
CI s
mok
ing
regi
me
D‑l
abel
led
IS13
C‑l
abel
led
ISIS
reco
very
cD
‑lab
elle
d IS
13C
‑lab
elle
d IS
IS re
cove
ryc
Mea
n, (
ng
/cig
)aRS
D, (
%)
Mea
n, (
ng
/cig
)bRS
D, (
%)
Mea
n, (
%)b
RSD
, (%
)M
ean
, (n
g/c
ig)c
RSD
, (%
)M
ean
, (n
g/c
ig)b
RSD
, (%
)M
ean
, (%
)bRS
D, (
%)
Nap
htha
lene
369.
83
372.
24
73.0
713
267
1381
372
.84
Benz
o[c]
phen
anth
rene
1.6
163.
19
NC
NC
3.9
178.
24
NC
NC
Benz
o[a]
anth
race
ne12
.45
12.5
281
.03
28.0
329
.32
86.8
10
Chr
ysen
e14
.18
14.6
1359
.04
31.0
837
.04
74.6
11
Cycl
open
ta-[c,d
]pyr
ene
4.0
124.
319
NC
NC
7.6
510
.06
NC
NC
5-M
ethy
lchr
ysen
e0.
29
0.2
11N
CN
C0.
49
0.4
8N
CN
C
Benz
o[b]
fluor
anth
ene
4.4
105
879
.34
10.4
1313
.92
92.4
12
Benz
o[k]
fluor
anth
ene
2.0
122.
14
82.7
34.
79
5.4
291
.511
Benz
o[j]a
cean
thry
lene
0.3
150.
417
66.3
80.
612
0.8
781
.75
Benz
o[a]
pyre
ne6.
011
6.4
275
.03
13.6
1415
.93
84.6
6
Inde
no[1,2,3
-cd]
pyre
ne2.
87
3.0
777
.75
6.3
87.
33
69.5
6
Dib
enzo
[ah]
anth
race
ne0.
46
0.4
780
.04
0.8
110.
95
65.5
5
Dib
enzo
[a,l]
pyre
ne0.
026
0.03
45N
CN
C0.
116
0.1
16N
CN
C
Dib
enzo
[a,e
]pyr
ene
0.2
160.
240
81.7
100.
422
0.7
270
.06
Dib
enzo
[a,i]
pyre
ne0.
115
0.2
7786
.013
–c–c
0.5
675
.06
Die
nzo[a,h]
pyre
ne0.
114
0.2
67N
CN
C–c
–c0.
49
NC
NC

Page 12 of 13Jeffery et al. Chemistry Central Journal (2018) 12:27
where the toxicological assessment of the consumer exposure is missing or limited (all PAHs except naphtha-lene and B[a]P).
AbbreviationsASE: accelerated solvent extraction; B[a]P: benzo[a]pyrene; CFP: Cambridge filter pad; CO: carbon monoxide; CTP: Center for Tobacco Products; FDA: Food and Drug Administration; GC: gas chromatography; GC–HRMS: gas chromatography–high resolution mass spectrometry; GC–MS/MS: gas chro-matography–tandem mass spectrometry; GC–MS: gas chromatography–mass spectrometry; HCI: Health Canada Intense; HPHC: harmful or potentially harm-ful constituent; HPLC: high-performance liquid chromatography; HPLC–MS/MS: high performance liquid chromatography–tandem mass spectrometry; HR: high resolution; IS: internal standard; LOD: limit of detection; LOQ: limit of quantification; MA: Massachusetts; MCS: mainstream cigarette smoke; MS: mass spectrometry; NA: not applicable; NFPDM: nicotine-free dry particulate matter (“tar”); NR: not reported; PAHs: polycyclic aromatic hydrocarbons; QQQ: triple quadrupole; RMS: root-mean-square; RSD: relative standard deviation; S/N: signal to noise; SPE: solid-phase extraction; TPM: total particulate matter; UK: United Kingdom; US EPA: United States Environmental Protection Agency.
Authors’ contributionsCW and JJ designed the study. KP, MP and KS conducted all experimental work. MC wrote the analytical report. JJ and CW wrote the manuscript and analysed the data, with support from MC and KP. All authors read and approved the final manuscript.
Author details1 British American Tobacco, Research and Development, Southampton, UK. 2 Marchwood Scientific Services, 371 Millbrook Rd W, Southampton, UK.
AcknowledgementsThe authors would like to acknowledge Marchwood Scientific Services for conducting the experimental work, generation of the data, analytical report-ing and manuscript review.
Competing interestsThe authors are employees of British American Tobacco or contracted by Brit-ish American Tobacco. Marchwood Scientific Services, Southampton, UK, con-ducted all experimental work and were funded by British American Tobacco.
Availability of data and materialsThe datasets supporting the conclusions of this article are included within the article (and its additional file(s)).
Ethics approval and consent to participateNot applicable.
FundingThe project was solely funded by British American Tobacco.
Publisher’s NoteSpringer Nature remains neutral with regard to jurisdictional claims in pub-lished maps and institutional affiliations.
Received: 15 September 2017 Accepted: 2 March 2018
Additional file
Additional file 1. Details of the chemical standards used for the analysis; MS acquisition parameters for all three GC/MS systems, PAH levels in blank samples together with their respective Limits of Detection (LODs) and Limits of Quantification (LOQs) as well as repeatability and accuracy of fortified Quality Control (QC) samples.
References 1. Ingebrethsen BJ (1986) Aerosol studies of cigarette smoke. Recent Adv
Tob Sci 12:54–142 2. Rodgman A, Perfetti TA (2013) The chemical components of tobacco and
tobacco smoke, 2nd edn. CRC Press, Boca Raton 3. Fowles J, Dybing E (2003) Application of toxicological risk assessment
principles to the chemical constituents of cigarette smoke. Tob Control 12(4):424–430
4. Bentley HR, Burgan JG (1960) Polynuclear hydrocarbons in tobacco and tobacco smoke. Part II. The origin of 3:4-benzopyrene found in tobacco and tobacco smoke. Analyst 85:723–727
5. Hoffmann D, Adams JD, Lisk D, Fisenne I, Brunnemann KD (1987) Toxic and carcinogenic agents in dry and moist snuff toxic and carcinogenic agents in dry and moist snuff. J Natl Cancer Inst 79:1281–1286
6. European Food Safety Authority (EFSA) (2008) EFSA J 724:1–114 7. Food and Drug Administration. Overview of the family smoking preven-
tion and tobacco control act, updated June 2015. http://www.fda.gov/downloads/TobaccoProducts/GuidanceComplianceRegulatoryInforma-tion/UCM336940.pdf. Accessed 19 May 2016
8. Food and Drug Administration. Harmful and potentially harmful constitu-ents in tobacco products and tobacco smoke; Established List, April 2012. http://www.fda.gov/downloads/TobaccoProducts/GuidanceCompli-anceRegulatoryInformation/UCM297981.pdf. Accessed 19 May 2016
9. Food and Drug Administration. Guidance for industry: reporting harmful and potentially harmful constituents in tobacco products and tobacco smoke under section 904(a)(3) of the federal food, drug, and cosmetic act, March 2012. http://www.fda.gov/downloads/TobaccoProducts/Guid-anceComplianceRegulatoryInformation/UCM297828.pdf. Accessed June 2016
10. Vu T, Taylor KH, Holman RH, Ding YS, Hern B, Watson CW (2015) Polycyclic aromatic hydrocarbons in the mainstream smoke of popular U.S. ciga-rettes. Chem Res Toxicol 28:1616–1626
11. CORESTA Recommended Method No. 58: determination of benzo[a]pyrene in cigarette mainstream smoke—gas chromatography–mass spectrometry method. Cooperation Centre for Scientific Research Rela-tive to Tobacco; Paris, France, July 2014
12. Ding YS, Trommel JS, Yan XJ, Ashley D, Watson CH (2005) Determina-tion of 14 polycyclic aromatic hydrocarbons in mainstream smoke from domestic cigarettes. Environ Sci Technol 39:471–478
13. Tarrant JE, Mills K, Williard C (2009) Development of an improved method for the determination of polycyclic aromatic hydrocarbons in mainstream tobacco smoke. J Chromatogr A 1216:2227–2234
14. Zha Q, Qian NX, Moldoveanu SC (2002) Analysis of polycyclic aromatic hydrocarbons in the particulate phase of cigarette smoke using a gas chromatographic-high-resolution mass spectrometric technique. J Chro-matogr Sci 40:403–408
15. Sinclair NM, Frost BE (1978) Rapid method for the determination of benzo[a]pyrene in the particulate phase of cigarette smoke by high-performance liquid chromatography with fluorimetric detection. Analyst 103:1199–1203
16. Lodovici M, Akpan V, Evangelisti C, Dolara P (2004) Sidestream tobacco smoke as the main predictor of exposure to polycyclic aromatic hydro-carbons. J Appl Toxicol 24:277–281
17. Mahanama KRR, Gundel LA, Daisey JM (1994) Selective fluorescence detection of polycyclic aromatic hydrocarbons in environmental tobacco smoke and other airborne particles. Int J Environ Anal Chem 56:289–309
18. Tomkins BA, Jenkins RA, Griest WH, Reagan RRJ (1985) Liquid chromato-graphic determination of benzo[a]pyrene in total particulate matter of cigarette smoke. Assoc Off Anal Chem 68:935–940
19. Ding YS, Ashley D, Watson CH (2007) Determination of 10 carcinogenic polycyclic aromatic hydrocarbons in mainstream cigarette smoke. J Agric Food Chem 55:5966–5973
20. Luo YB, Chen XJ, Zhang HF, Jiang XJ, Li X, Li XY, Zhu FP, Pang YQ, Hou HW (2016) Simultaneous determination of polycyclic aromatic hydrocarbons and tobacco-specific N-nitrosamines in mainstream cigarette smoke using in-pipette-tip solid-phase extraction and on-line gel permeation chromatography-gas chromatography–tandem mass spectrometry. J Chromatogr A 1460:16–23
21. ISO (2008) Cigarettes—determination of benzo[a]pyrene in cigarette mainstream smoke—method using gas chromatography/mass spec-trometry. ISO 22634, Geneva
Page 13 of 13Jeffery et al. Chemistry Central Journal (2018) 12:27
22. WHO TobLabNet SOP 05—standard operating procedure for determi-nation of benzo[a]pyrene in mainstream cigarette smoke. http://apps.who.int/iris/bitstream/10665/174003/1/9789241508322_eng.pdf?ua=1. Accessed 19 May 2016
23. Benzo[a]pyrene, Health Canada, Tobacco reporting regulations—meth-ods (2007) Available by request to Health Canada. http://www.hc-sc.gc.ca/hc-ps/tobac-tabac/legislation/reg/indust/method/index-eng.php. Accessed 20 Apr 2017
24. Food and Drug Administration. Tobacco product analysis—a scientific workshop. July 30–31, 2013. http://www.fda.gov/TobaccoProducts/NewsEvents/ucm355041.htm. Accessed 14 Mar 2016
25. Oldham MJ, DeSoi DJ, Rimmer LT, Wagner KA, Morton MA (2014) Insights from analysis for harmful and potentially harmful constituents (HPHCs) in tobacco products. Regul Toxicol Pharmacol 70:138–148
26. Jonker MT, Koelmans AA (2002) Sorption of PAHs and PCBs to soot and soot-like materials in the aqueous environment: mechanistic considera-tion. Environ Sci Technol 36(17):3725–3734
27. Masala S, Ahmed T, Bergvall C, Westerholm R (2011) Improved efficiency of extraction of polycyclic aromatic hydrocarbons (PAHs) from the National Institute of Standards and Technology (NIST) Standard Refer-ence Material Diesel Particulate Matter (SRM 2975) using accelerated solvent extraction. Anal Bioanal Chem 401:3305–3315
28. Smith D, Lynam K (2010) Agilent Application Note 5990-4833EN 29. Kentucky Reference cigarette 3R4F preliminary analysis. https://ctrp.
uky.edu/resources/pdf/webdocs/3R4F%20Preliminary%20Analysis.pdf. Accessed 15 Feb 2017
30. ISO (2000) Cigarettes—determination of total and nicotine-free dry particulate matter using a routine analytical smoking machine, ISO 4387. ISO, Geneva
31. ISO (2000) Methods for chemical analysis of tobacco and tobacco products, Part 12: determination of nicotine in smoke condensate of cigarettes (gas-chromatographic method). ISO 10315. ISO, Geneva
32. ISO (2007) Cigarettes—determination of carbon monoxide in the vapour phase of cigarette smoke—NDIR method. ISO 8454. ISO, Geneva
33. ISO (2000) Routine analytical cigarette smoking machine—definition and standard conditions. ISO 3308. ISO, Geneva
34. ISO (1999) Tobacco and tobacco products—atmosphere for conditioning and testing, ISO 3402. ISO, Geneva
35. ISO (2012) Routine analytical cigarette-smoking machine—definitions and standard conditions. ISO 3308. ISO, Geneva
36. Health Canada. Tobacco reporting regulations. T-115/SOR/2000–272. http://www.wipo.int/wipolex/en/text.jsp?file_id=222850. Accessed 17 Jan 2017
37. Thompson M, Ellison SL, Wood R (2002) Harmonized guidelines for single laboratory validation of methods of analysis. Pure Appl Chem 74:835
38. Roemer E, Schramke H, Weiler H, Buettner A, Kausce S, Weber S, Berges A, Stueber M, Muench M, Trelles-Sticken E, Pype J, Kogrueber K, Voelkel H, Wittke S (2012) Mainstream smoke chemistry and in vitro and in vivo toxicity of the reference cigarette 3R4F and 2R4F. Beitr Tabakforsch Int 25:316–335
39. Vogl J, Pritzkow W (2010) Isotope dilution mass spectrometry—a primary method of measurement and its role for RM certification. MAPAN 25(3):135–164
40. Ripszam M, Grabic R, Haglund P (2013) Elimination of interferences caused by simultaneous use of deuterated and carbon-13 standards in GC–MS analysis of polycyclic aromatic hydrocarbons (PAHs) in extracts from passive sampling devices. Anal Methods 5:2925
41. Chang WT, Smith J, Liu RH (2002) Isotopic analogs as internal standards for quantitative GC/MS analysis–molecular abundance and retention time difference as interference factors. J Forensic Sci 47(4):873