RECYCLED CARPET MATERIALS FOR INFRASTRUCTURE ...
100
OTCREOS9.1-49-F E CONOMIC E NHANCEMENT THROUGH I NFRASTRUCTURE S TEWARDSHIP R ECYCLED C ARPET M ATERIALS FOR I NFRASTRUCTURE A PPLICATIONS R ANJI V AIDYANATHAN , P H .D., P.E. R AMAN P. S INGH , P H .D. T YLER L EY , P H .D., P.E . Phone: 405.732.6580 Fax: 405.732.6586 www.oktc.org Oklahoma Transportation Center 2601 Liberty Parkway, Suite 110 Midwest City, Oklahoma 73110
-
Upload
khangminh22 -
Category
Documents
-
view
3 -
download
0
Transcript of RECYCLED CARPET MATERIALS FOR INFRASTRUCTURE ...
OTCREOS9.1-49-F
ECONOMIC ENHANCEMENT THROUGH INFRASTRUCTURE STEWARDSHIP
RECYCLED CARPET MATERIALS FOR INFRASTRUCTURE APPLICATIONS
RANJI VAIDYANATHAN, PH.D., P.E.
RAMAN P. SINGH, PH.D. TYLER LEY, PH.D., P.E.
Phone: 405.732.6580
Fax: 405.732.6586
www.oktc.org
Oklahoma Transportation Center
2601 Liberty Parkway, Suite 110
Midwest City, Oklahoma 73110
DISCLAIMER
The contents of this report reflect the views of the authors, who are responsible for the facts and
accuracy of the information presented herein. This document is disseminated under the
sponsorship of the Department of Transportation University Transportation Centers Program, in
the interest of information exchange. The U.S. Government assumes no liability for the contents
or use thereof.
i
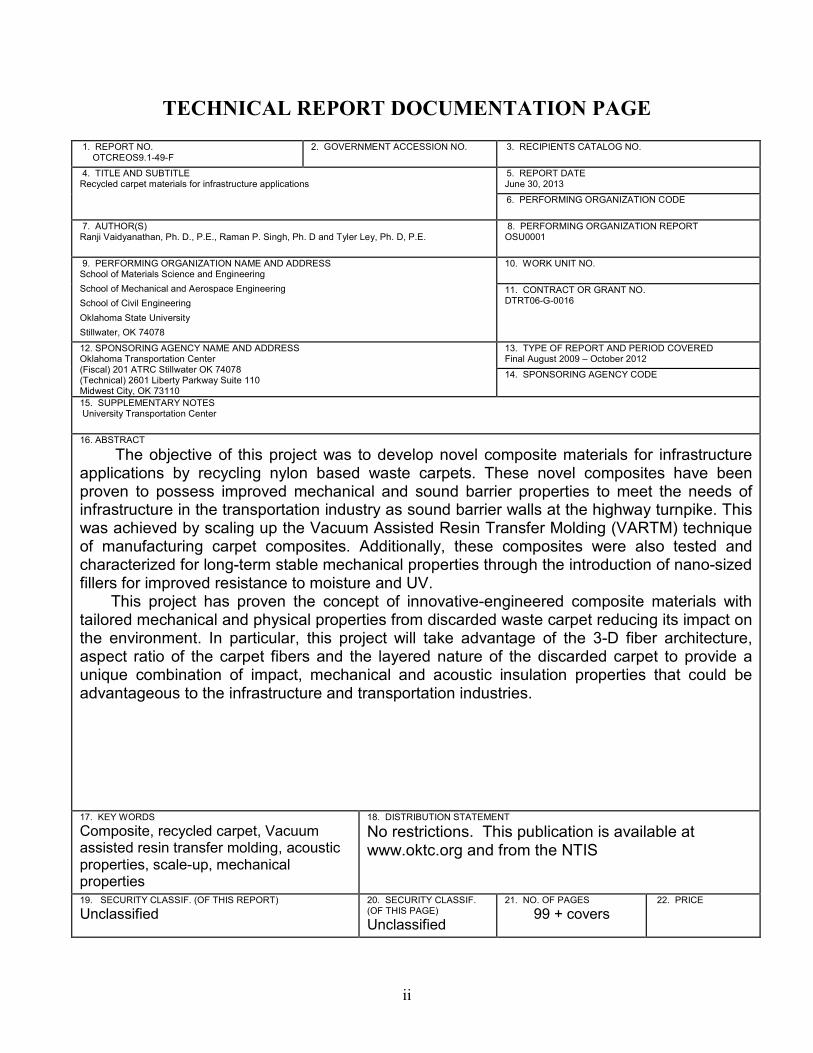
TECHNICAL REPORT DOCUMENTATION PAGE 1. REPORT NO. OTCREOS9.1-49-F
2. GOVERNMENT ACCESSION NO.
3. RECIPIENTS CATALOG NO.
4. TITLE AND SUBTITLE Recycled carpet materials for infrastructure applications
5. REPORT DATE
June 30, 2013 6. PERFORMING ORGANIZATION CODE
7. AUTHOR(S) Ranji Vaidyanathan, Ph. D., P.E., Raman P. Singh, Ph. D and Tyler Ley, Ph. D, P.E.
8. PERFORMING ORGANIZATION REPORT OSU0001
9. PERFORMING ORGANIZATION NAME AND ADDRESS School of Materials Science and Engineering School of Mechanical and Aerospace Engineering School of Civil Engineering Oklahoma State University Stillwater, OK 74078
10. WORK UNIT NO. 11. CONTRACT OR GRANT NO. DTRT06-G-0016
12. SPONSORING AGENCY NAME AND ADDRESS Oklahoma Transportation Center (Fiscal) 201 ATRC Stillwater OK 74078 (Technical) 2601 Liberty Parkway Suite 110 Midwest City, OK 73110
13. TYPE OF REPORT AND PERIOD COVERED Final August 2009 – October 2012 14. SPONSORING AGENCY CODE
15. SUPPLEMENTARY NOTES University Transportation Center 16. ABSTRACT The objective of this project was to develop novel composite materials for infrastructure applications by recycling nylon based waste carpets. These novel composites have been proven to possess improved mechanical and sound barrier properties to meet the needs of infrastructure in the transportation industry as sound barrier walls at the highway turnpike. This was achieved by scaling up the Vacuum Assisted Resin Transfer Molding (VARTM) technique of manufacturing carpet composites. Additionally, these composites were also tested and characterized for long-term stable mechanical properties through the introduction of nano-sized fillers for improved resistance to moisture and UV. This project has proven the concept of innovative-engineered composite materials with tailored mechanical and physical properties from discarded waste carpet reducing its impact on the environment. In particular, this project will take advantage of the 3-D fiber architecture, aspect ratio of the carpet fibers and the layered nature of the discarded carpet to provide a unique combination of impact, mechanical and acoustic insulation properties that could be advantageous to the infrastructure and transportation industries.
17. KEY WORDS Composite, recycled carpet, Vacuum assisted resin transfer molding, acoustic properties, scale-up, mechanical properties
18. DISTRIBUTION STATEMENT No restrictions. This publication is available at www.oktc.org and from the NTIS
19. SECURITY CLASSIF. (OF THIS REPORT) Unclassified
20. SECURITY CLASSIF. (OF THIS PAGE) Unclassified
21. NO. OF PAGES
99 + covers 22. PRICE
ii

SI (METRIC) CONVERSION FACTORS
Approximate Conversions to SI Units
Symbol When you know
Multiply by
LENGTH
To Find Symbol
in inches 25.40 millimeters mm
ft feet 0.3048 meters m
yd yards 0.9144 meters m
mi miles 1.609 kilometers km
AREA
in² square
inches 645.2
square
millimeters mm
ft² square
feet 0.0929
square
meters m²
yd² square
yards 0.8361
square
meters m²
ac acres 0.4047 hectares ha
mi² square
miles 2.590
square
kilometers km²
VOLUME
fl oz fluid
ounces 29.57 milliliters mL
gal gallons 3.785 liters L
ft³ cubic
feet 0.0283
cubic
meters m³
yd³ cubic
yards 0.7645
cubic
meters m³
MASS
oz ounces 28.35 grams g
lb pounds 0.4536 kilograms kg
T short tons
(2000 lb) 0.907 megagrams Mg
TEMPERATURE (exact)
ºF degrees
Fahrenheit
(ºF-32)/1.8 degrees
Celsius
ºC
FORCE and PRESSURE or STRESS
lbf poundforce 4.448 Newtons N
lbf/in² poundforce
per square inch
6.895 kilopascals kPa
Approximate Conversions from SI Units
Symbol When you know
Multiply by
LENGTH
To Find Symbol
mm millimeters 0.0394 inches in
m meters 3.281 feet ft
m meters 1.094 yards yd
km kilometers 0.6214 miles mi
AREA
mm² square
millimeters 0.00155
square
inches in²
m² square
meters 10.764
square
feet ft²
m² square
meters 1.196
square
yards yd²
ha hectares 2.471 acres ac
km² square
kilometers 0.3861
square
miles mi²
VOLUME
mL milliliters 0.0338 fluid
ounces fl oz
L liters 0.2642 gallons gal
m³ cubic
meters 35.315
cubic
feet ft³
m³ cubic
meters 1.308
cubic
yards yd³
MASS
g grams 0.0353 ounces oz
kg kilograms 2.205 pounds lb
Mg megagrams 1.1023 short tons
(2000 lb) T
TEMPERATURE (exact)
ºC degrees
Celsius
9/5+32 degrees
Fahrenheit
ºF
FORCE and PRESSURE or STRESS
N Newtons 0.2248 poundforce lbf
kPa kilopascals 0.1450 poundforce
per square inch
lbf/in²
iii
ACKNOWLEDGMENTS
The authors gratefully acknowledge the research funding from the Oklahoma Transportation
Center under project number OTCREOS9.1-49, “Recycled carpet materials for infrastructure
applications.” The authors would like to express their thanks to undergraduate students Bessie
Phiri, Aaron Laney and Sohrab Bassiri for their contributions to this project conducted at the
Next Generation Materials Laboratory at Oklahoma State University.
iv
Recycled Carpet Materials for Infrastructure Applications
Ranji Vaidyanathan, Ph. D, P.E. School of Materials Science and Engineering
Raman P. Singh, Ph. D
School of Mechanical and Aerospace Engineering
Tyler Ley, Ph. D, P.E. School of Civil Engineering
Oklahoma State University
Stillwater, OK 74078
FINAL REPORT
Project OTCREOS9.1-49
June 2013
Oklahoma Transportation Center 2601 Liberty Parkway Suite 110
Midwest City, OK 73110
v
TABLE OF CONTENTS
1. INTRODUCTION ...................................................................................................................... 1 2. BACKGROUND AND LITERATURE REVIEW .................................................................... 6
2.1 CARPET – A BRIEF REVIEW ........................................................................................... 6 2.2 CARPET RECYCLING ..................................................................................................... 10 2.3 WASTE CARPET RECYCLING ...................................................................................... 17 2.4 HIGHWAY NOISE BARRIERS ........................................................................................ 18 2.5 ENVIRONMENTAL DEGRADATION OF CARPET COMPOSITES ........................... 21 2.6 CLAY-POLYMER NANOCOMPOSITES ........................................................................ 24
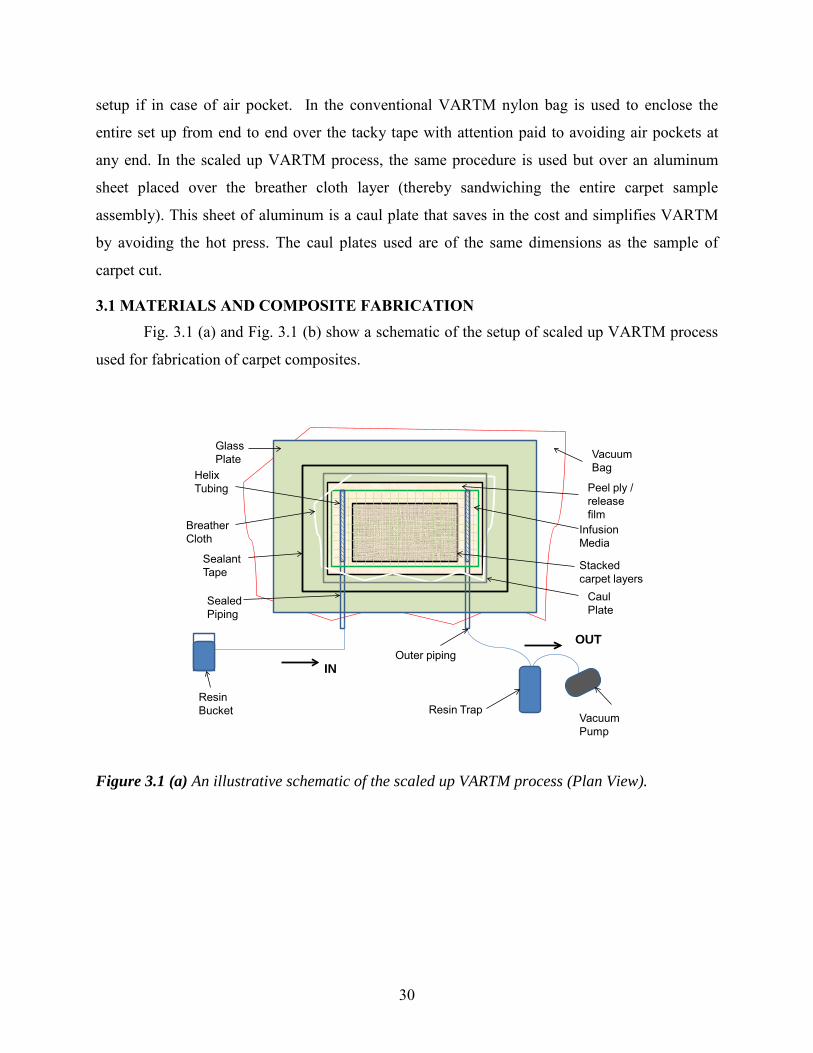
3. COMPOSITE FABRICATION ................................................................................................ 29 3.1 MATERIALS AND COMPOSITE FABRICATION ........................................................ 30 3.2. SCALING UP OF VARTM PROCESS ............................................................................ 35 3.3 COST ECONOMICS .......................................................................................................... 37 3.4 FABRICATION OF COMPOSITES WITH NANOFILLERS .......................................... 39
4. MECHANICAL TESTING AND CHARACTERIZATION OF ENVIRONMENTAL DURABILITY OF CARPET COMPOSITES .............................................................................. 42
4.1. ENVIRONMENTAL DURABILITY AND FIRE RETARDANCY OF CARPET COMPOSITES .......................................................................................................................... 42 4.2. FLEXURAL STRENGTH AND MODULUS .................................................................. 42 4.3. MOISTURE ABSORPTION TESTS ................................................................................ 43 4.5. FIRE RETARDANCY TESTS .......................................................................................... 45 4.6. MOISTURE ABSORPTION ............................................................................................. 46 4.7. MECHANICAL PROPERTIES ........................................................................................ 48 4.8. CYCLIC EXPOSURE OF UV AND CONDENSATION ................................................ 50 4.9. FIRE TEST ........................................................................................................................ 53 4.10. WIND LOAD TESTS ...................................................................................................... 54
5. ACOUSTIC PROPERTIES OF RECYCLCED CARPET COMPOSITES ............................. 58 5.1 OBJECTIVE ....................................................................................................................... 58 5.2 BACKGROUND ................................................................................................................ 58 5.3 THEORY ............................................................................................................................ 59 5.4 SCOPE, STANDARD AND SIGNIFICANCE .................................................................. 60 5.5 MATERIAL CHARACTERISTICS .................................................................................. 65 5.6 RESULTS ........................................................................................................................... 67
6. CONCLUSIONS AND OTHER SIGNIFICANT RESULTS .................................................. 77 REFERENCES ............................................................................................................................. 80
vi
LIST OF FIGURES
Figure 1.1. A chart adapted from the data by EPA on characterization of municipal solid waste. 3 Figure1.2. An illustrative diagram of VARTM process to make carpet composites. 5 Figure 2.1 An illustrative diagram of carpet (cut- pile type) and its constituents 6 Figure 2.2 An adapted figure illustrating the 3-D architecture of carpet 7 Figure 2.3 Illustrative diagram of cut- pile type carpet 9 Figure 2.4 Illustrative diagram of loop - pile type carpet 9 Figure 2.5 An illustrative diagram of patterned loop type carpet 9 Figure 2.6 An illustrative diagram of cut & loop type carpet 9 Figure 2.7 An adapted block diagram of Nylon recycling process used by Polyamid 2000 11 Figure 2.8 Ilustrative chart listing major companies in depolymerization of nylon carpets 12 Figure 2.9 An adapted block diagram of Dupont’s Nylon recycling process 15 Figure 2.10 A diagram of products obtained by traditional carpet recycling processes 18 Figure 2.11 An illustration to show the reasons for traffic noise on highways 19 Figure 2.12 Types of Highway Noise Barriers 20 Figure 2.13: Possible chain scission reaction of nylon chain due to UV 24 Figure 2.14: Schematic illustration of different clay- polymer composites 25 Figure 2.15: Illustration of Neilson's tortuous path model for reduction in permeability 26 Figure 2.16: Flame propagation model proposed by Norman Grassie 27 Figure 3.1 (a) An illustrative schematic of the scaled up VARTM process (Plan View) 30 Figure 3.1 (b) An illustrative schematic of the scaled up VARTM process (Elevation View) 31 Figure 3.2 Images of carpet configurations used for VARTM 32 Figure 3.3: Structure of nanoclay (left) and modifier (right) 35 Figure 3.4 A picture of VARTM process using multiple resin inlet ports 36 Figure 3.5 Image of a curved composite fabricated by scaled up VARTM process 37 Figure 3.6. Preliminary cost model 38 Figure 3.7: Coating of carpet composite with epoxy- nanoclay 41 Figure 4.1: Flexural test set up for carpet composites 42 Figure 4.2: Moisture absorption test set up of carpet composites 44 Figure 4.3: Test chamber used for alternating exposure of UV and condensation 45 Figure 4.4: Test setup for determining flame propagation rate 45 Figure 4.5. Moisture absorption behavior of different carpet composites at 80°C. 46 Figure 4.6: Change in mass in carpet composites as a function of square root of time 48 Figure 4.7: Change in mass of carpet composites due to alternating environmental exposure 51 Figure 4.8: Linear burning rate of neat and clay carpet composites 54 Figure 4.9. A design model for wind load test 55 Figure 4.10. A picture taken during wind load test 56 Figure 4.11. Pressure Deflection wind load plot of a BTTB Epoxy carpet composite 56 Figure 4.12. Wind Load curve plot of a BTTB Epoxy carpet composite 57 Figure 5.1 A diagram illustrating the nature of unidirectional sound waves 60 Figure 5.2 A schematic diagram to show the apparatus used for acoustic test based on noise absorption coefficient 61 Figure 5.3 An image of the oscilloscope reading 63 Figure 5.4 Noise Absorption coefficients of various noise absorbing materials 68
vii
Figure 5.5 Comparison of Noise Absorption coefficients different carpet composite materials 69 Figure 5.6 Comparison of Noise Absorption coefficients of 4 layer carpet composite 71 Figure 5.7 Similarity of acoustic behavior of carpet composite material and Epoxy Matrix 72 Figure 5.8 Acoustic property comparison of concrete and 4 layer carpet composite 73 Figure 5.9 Noise Reduction Coefficients of all the materials 74 Figure 5.10 Correlation of Noise Reduction Coefficients (NRC) with Specific Gravity (SG) 75
viii
LIST OF TABLES
TABLE 1.1. A table indicating the national discard estimates provided by the carpet and rug institute ............................................................................................................................................ 4 TABLE 2.1. A table indicating the composition of a typical carpet with PP/SBR construction .... 7 TABLE 3.1. A table indicating time taken for fabrication of carpet composites using scaled up VARTM process ........................................................................................................................... 40 Table 4.1: flexural strength of different Carpet composites before and after moisture ................ 49 Table 4.2: Flexural modulus of carpet composites before and after moisture absorption ............ 50 Table 4.3: Flexural strength of carpet composites before and after exposure to UV and condensation ................................................................................................................................. 52 Table 4.4: Flexural modulus of carpet composites before and after exposure to UV and condensation ................................................................................................................................. 53 TABLE 5.1 A table of 12 sound absorbing materials and their surface properties ...................... 66
ix
EXECUTIVE SUMMARY
The objective of this project was to develop novel composite materials for infrastructure
applications by recycling nylon based waste carpets. These novel composites have been proven
to possess improved mechanical and sound barrier properties to meet the needs of infrastructure
in the transportation industry as sound barrier walls at the highway turnpike. This was achieved
by scaling up the Vacuum Assisted Resin Transfer Molding (VARTM) technique of
manufacturing carpet composites. Additionally, these composites were also tested and
characterized for long-term stable mechanical properties through the introduction of nano-sized
fillers for improved resistance to moisture and UV.
This project has proven the concept of innovative-engineered composite materials with
tailored mechanical and physical properties from discarded waste carpet reducing its impact on
the environment. In particular, this project will take advantage of the 3-D fiber architecture,
aspect ratio of the carpet fibers and the layered nature of the discarded carpet to provide a unique
combination of impact, mechanical and acoustic insulation properties that could be advantageous
to the infrastructure and transportation industries.
Composites were fabricated from recycled carpet materials and exposed to a variety of
environmental conditions including moisture, ultra violet radiation and a combination of the two.
Significant reduction in flammability in the carpet composites was observed due to use of clay.
The linear burning rate as per ASTM D 635-10 was reduced by 20 % for composite samples
coated with the epoxy-clay coating, while it was reduced by 34 % for composite samples infused
with 4 % nanoclay.
Moisture exposure for these samples indicated that both clay coating and clay infusion
reduced the deleterious effect of moisture on the composites. Significant reduction in diffusivity
was found in clay coated and clay infused composites. All composites showed a reduction in
flexural strength and modulus, where severity of degradation was less in clay coated and clay
infused carpet composites. For alternating moisture and UV exposure cycles, the clay-coated
samples exhibited the lowest change in mass, while the neat epoxy recycled carpet composites
showed the highest mass gain. However, It was also observed that the combined moisture/UV
exposure resulted in an increase in strength in the case of all composite types. Finally, wind load
tests proved that the composite is strong and withstands extreme wind conditions similar to
tornadoes.
x
Three graduate students have completed their Masters work on this funded project. A
patent based on this work was applied for during the project and has recently been issued – A. K.
Singh, G. Pandey, R. Vaidyanathan, and R. P. Singh, “Fabrication Method of Multi-functional
Composites from Pre/Post-Customer Carpet,” U.S. Patent Application No. 12/695730, August 5,
2010. An Oklahoma manufacturer (K. T. Plastics, Calera, OK) has signed an option to license for
this patent. It is expected that KT Plastics will be providing the technology to another Oklahoma
manufacturer of highway sound barriers (Apache Precast, Jenks, OK).
Several papers have been published and presented, while also giving the opportunity to
intern for undergraduate students at Oklahoma State University.
xi

1. INTRODUCTION
This project has proven the concept of innovative-engineered composite materials with
tailored mechanical and physical properties from discarded waste carpet reducing its impact on
the environment. In particular, this project will take advantage of the 3-D fiber architecture,
aspect ratio of the carpet fibers and the layered nature of the discarded carpet to provide a unique
combination of impact, mechanical and acoustic insulation properties that could be advantageous
to the infrastructure and transportation industries.
The world’s primary energy needs have increased by 66 percent in the last 30 years and
today’s energy path would mean rapidly increasing dependence on fossil fuels with alarming
consequences for climate change and energy security [1]. Experts accurately predicted large and
permanent increases in oil prices after the year 2000 due to increasing scarcity. A series of
episodes including the oil reaching a record price of $120 a barrel in March 2008 has made this
evident. The president of OPEC (Organization of Petroleum Exporting Countries) has warned of
oil reaching $200 a barrel clearly indicating huge demand for oil. The rapid economic
development of developing countries around the world (including India and China) has produced
insatiable demand for oil and other energy sources [2]. However, apart from its demand-supply
problem, there are even larger challenges in the energy industry, such as consumption of energy
yielding to increase in greenhouse gas emissions that in turn results in increase of global
temperature. Hence energy is crucial for sustainable development and World Energy Outlook
2009 report suggests that there is an urgent need to limit the global temperature rise to 20C [1].
For sustainable development, the materials recovery and recycling industry has to deliver
marketable products which are based on cost effective technologies and have a positive life cycle
environmental impact [3]. This served as a motivation to address a solution to the problem of
recycling of waste carpet lying in the landfills. Land-filling is not an environmentally friendly
solution because carpet fibers are not biodegradable [4]. In the United States, environmental
concerns and governmental regulations have started putting efforts in the direction of recycling
all synthetic polymers, of which carpet and carpet fibers constitute a significant percentage [4].
Carpet is a petroleum-based product and it is estimated that carpet recycling can save more than
700,000 barrels of oil per year, conserving 4.4 trillion BTUs of energy [5].
In the United States alone, about 200 million tons of carpet waste is generated every year,
and only 2 % of this amount is recycled [6]. Out of the 5 billion pounds of carpet sent to landfill
1

only 1 % of old carpet has been recovered as per Carpet America Recovery Effort (CARE), an
organization committed to carpet recycling in USA [6]. In every municipal solid-waste stream of
USA, post - consumer carpets account for 1 wt% of the stream thereby indicating the high usage
of carpet. Carpet offers compelling benefits like underfoot comfort, sound absorption, improved
slip resistance and thermal comfort and has therefore been the reason for covering 60 percent of
all floors in the United States [7]. The Carpet and Rug Institute sustainability report says that
“carpet industry in USA produces more than 19 billion square feet of carpet each year” [7].
Carpet waste is both an environmental and economical problem because of the cost
involved in disposal of waste carpet. The cost also involves discarding of valuable raw material
in the form of high engineering value fibers like Nylon 6,6, polyester, polyvinyl chloride (PVC),
polypropylene (PP), other olefins etc. going to landfills apart from the cost of transporting the
waste to landfills. Thus post - consumer carpet represents a significant environment burden on
the landfills, tax burden due to state sponsored subsidies, and a lost economic opportunity. Hence
it is imperative to recycle post - consumer carpets for a sustainable society.
The chart in Fig. 1.1 has been adapted from the data provided by the Environment
protection agency on Municipal Solid Waste (MSW). Waste carpet is an important constituent of
the MSW and the chart below gives an idea about the steady trend in recovery of carpets over the
decade. The rapid economic development throughout the world has increased the generation of
municipal solid waste. The imbalance between the amount of discarded waste and its minimal
recovery indicates a deplorable outlook for the recycling industry. However the steady increase
in awareness for recovery of municipal solid waste gives a hope for the waste recycling industry.
In 2009, CARE reported that 311 million pounds of post - consumer carpet were diverted
from landfills, of which 246 million pounds were diverted due to a direct result of reuse and
recycling [9]. This indicates that there is an increasing trend in awareness of carpet recycling and
the products that fall under the topic of recycled carpets would be well received.
2

Figure 1.1. Adapted from EPA data on characterization of municipal solid waste (MSW) by
weight in Thousands of Tons [8].
The 2010 Annual report by CARE pointed out that Nylon 6 and Nylon 6,6 represent 80
percent of all carpet diverted from landfills in 2009 [9]. The two predominant forces driving the
waste nylon based carpet’s reclamation are – 1) the opportunities for usage of recycled nylon
fiber in various end markets and 2) the huge market share of nylon carpet sold in United States
[9]. The carpets made of other face fiber materials like polyester, PVC and PP are therefore not
economical to recycle with current technology because these face fiber materials are cheaper
virgin materials and to recycle them is uneconomical [11]. Among the carpets sold in the United
States, about 65 percent of them are nylon based because nylon is a more durable fiber and has
excellent performance characteristics [12]. There has been extensive research on recycle of
nylon-based carpets due to the huge market for nylon fibers. Nylon 6 fibers are derived from
caprolactum, which has a significant market value and are thereby recycled by chemical
recycling methods. However the chemical recycling techniques for carpet fail to deliver in
sustainable product development due to their characteristic requirement of high-energy inputs.
3

Literature suggests that the energy consumed in manufacture of nylon fibers for
polymerization, spinning and finishing is between 369 and 432 MJ/kg [13]. The calorific value
of crude oil is between 38 and 46 MJ/kg and therefore it can be concluded that for 1 kg of fiber
about 11 kg of crude oil is necessary [13]. Though thermal utilization is a lucrative option, the
process of thermal utilization uses only the calorific value which is about the same or slightly
lower compared to crude oil [13]. Hence it is imperative to evaluate a process to save the 11 kg
of crude oil getting wasted for every 1 kg of nylon wasted in the carpet waste. Therefore carpet
recycling becomes critical and to ensure sustainable development.
TABLE 1.1. NATIONAL DISCARD ESTIMATES PROVIDED BY THE CARPET AND RUG
INSTITUTE [10]
(In millions of pounds) 2002 2005 2008 2010 2012
Total Discards
4678 5038 5642 6020 6772
Reuse 0 25 113 211 203 - 339
Recycling 180 353 620 903 1354 - 1693
Waste to Energy
(Maximum)
NA 50 56 60 68
Cement Kilns*
(Maximum)
0 100 300 200 200
Landfill NA 4510 4552 4646 4812
Recycling Rate 3.8% 7% 11% 15% 20-25%
Landfill Diversion Rate 3.8% 10% 19% 23% 27-34%
Note* - (1) Cement kilns use incineration of carpets as a fuel supplement in kilns (2) NA - Not
available.
At Oklahoma State University (OSU), an innovative carpet recycling technology has
been developed to recycle waste carpets from landfills into structural composites using VARTM.
The main advantage of VARTM is that the carpets are recycled without any physical or chemical
4
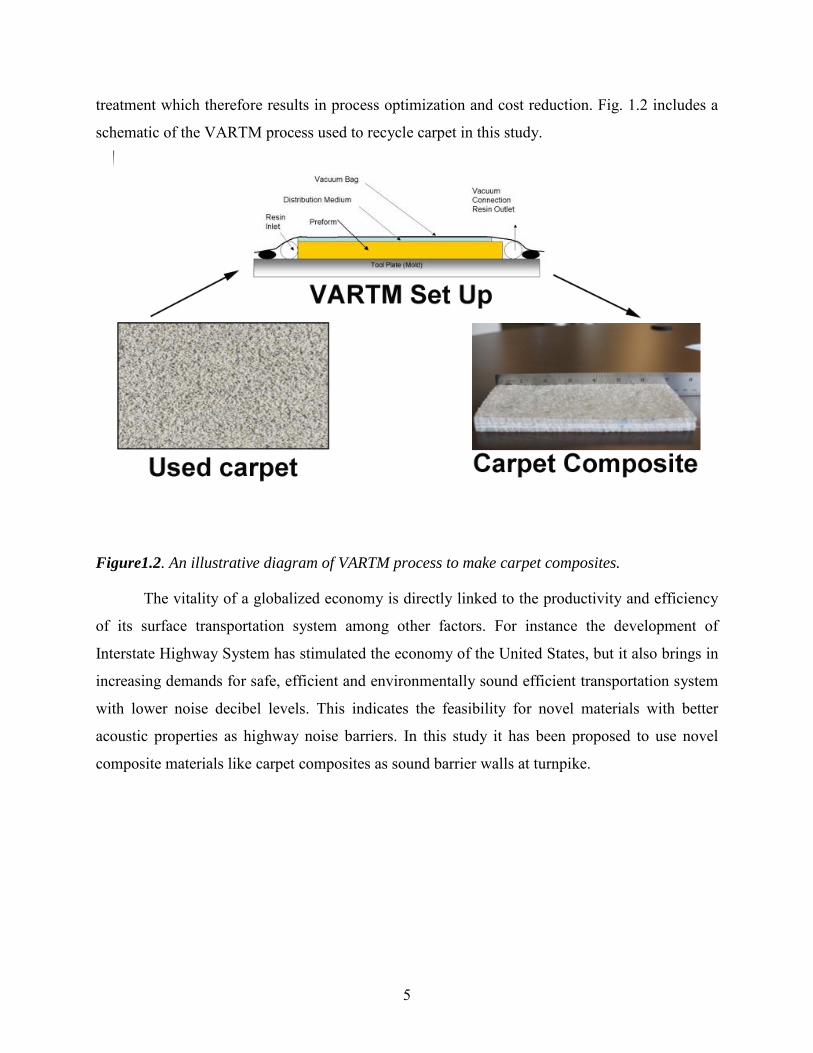
treatment which therefore results in process optimization and cost reduction. Fig. 1.2 includes a
schematic of the VARTM process used to recycle carpet in this study.
Figure1.2. An illustrative diagram of VARTM process to make carpet composites.
The vitality of a globalized economy is directly linked to the productivity and efficiency
of its surface transportation system among other factors. For instance the development of
Interstate Highway System has stimulated the economy of the United States, but it also brings in
increasing demands for safe, efficient and environmentally sound efficient transportation system
with lower noise decibel levels. This indicates the feasibility for novel materials with better
acoustic properties as highway noise barriers. In this study it has been proposed to use novel
composite materials like carpet composites as sound barrier walls at turnpike.
5
2. BACKGROUND AND LITERATURE REVIEW
2.1 CARPET – A BRIEF REVIEW
2.1.1 Carpet Construction
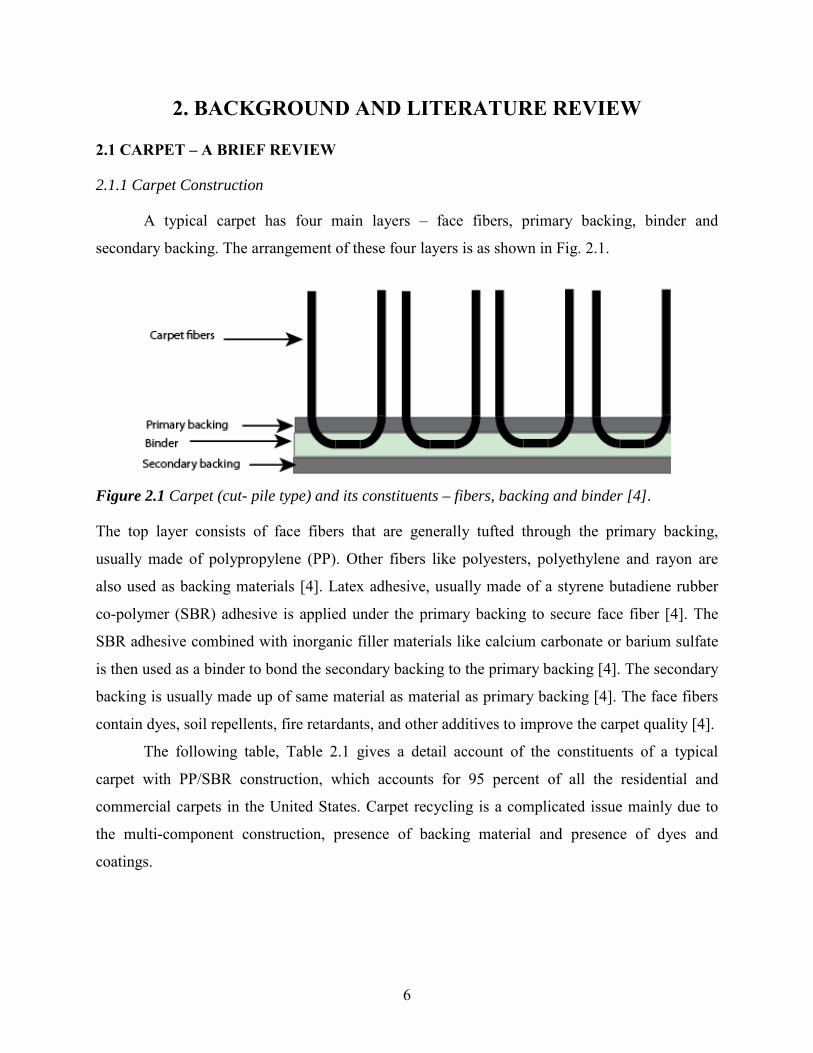
A typical carpet has four main layers – face fibers, primary backing, binder and
secondary backing. The arrangement of these four layers is as shown in Fig. 2.1.
Figure 2.1 Carpet (cut- pile type) and its constituents – fibers, backing and binder [4].
The top layer consists of face fibers that are generally tufted through the primary backing,
usually made of polypropylene (PP). Other fibers like polyesters, polyethylene and rayon are
also used as backing materials [4]. Latex adhesive, usually made of a styrene butadiene rubber
co-polymer (SBR) adhesive is applied under the primary backing to secure face fiber [4]. The
SBR adhesive combined with inorganic filler materials like calcium carbonate or barium sulfate
is then used as a binder to bond the secondary backing to the primary backing [4]. The secondary
backing is usually made up of same material as material as primary backing [4]. The face fibers
contain dyes, soil repellents, fire retardants, and other additives to improve the carpet quality [4].
The following table, Table 2.1 gives a detail account of the constituents of a typical
carpet with PP/SBR construction, which accounts for 95 percent of all the residential and
commercial carpets in the United States. Carpet recycling is a complicated issue mainly due to
the multi-component construction, presence of backing material and presence of dyes and
coatings.
6
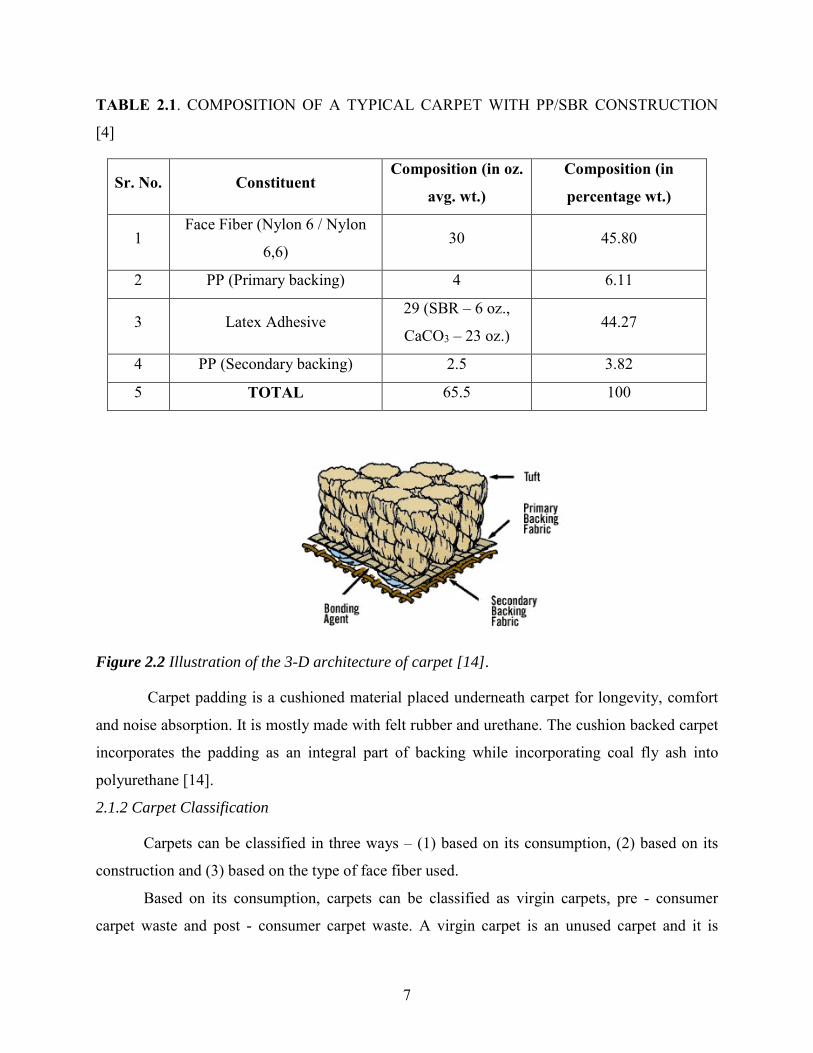
TABLE 2.1. COMPOSITION OF A TYPICAL CARPET WITH PP/SBR CONSTRUCTION
[4]
Sr. No. Constituent Composition (in oz.
avg. wt.)
Composition (in
percentage wt.)
1 Face Fiber (Nylon 6 / Nylon
6,6) 30 45.80
2 PP (Primary backing) 4 6.11
3 Latex Adhesive 29 (SBR – 6 oz.,
CaCO3 – 23 oz.) 44.27
4 PP (Secondary backing) 2.5 3.82
5 TOTAL 65.5 100
Figure 2.2 Illustration of the 3-D architecture of carpet [14].
Carpet padding is a cushioned material placed underneath carpet for longevity, comfort
and noise absorption. It is mostly made with felt rubber and urethane. The cushion backed carpet
incorporates the padding as an integral part of backing while incorporating coal fly ash into
polyurethane [14].
2.1.2 Carpet Classification
Carpets can be classified in three ways – (1) based on its consumption, (2) based on its
construction and (3) based on the type of face fiber used.
Based on its consumption, carpets can be classified as virgin carpets, pre - consumer
carpet waste and post - consumer carpet waste. A virgin carpet is an unused carpet and it is
7
typically a carpet without any history of foot traffic. Virgin carpets are free of dirt, but they
mainly consist of fibers, backing and a variety of chemical adhesives, fire retardants, dirt
resistant, stain resistant dyes, color dyes and other materials. Pre-consumer carpet waste consists
of the waste generated at the landfills largely due to the manufacturing process of carpet and the
carpet fitting process. In the carpet manufacturing process, the edges of carpet need to be
trimmed. These edge trims and off-cuts are disposed as pre - consumer carpet waste. The amount
of carpet waste in the form of trimmings and waste is about 12% of the total carpet production
[4]. In the automotive industry, a process called fitting process is used, where the carpets are cut
into various irregular shapes and sizes. These cut edge trims and the waste carpet contribute to
pre-consumer carpet waste in the landfill. Post-consumer carpet waste is defined as, “A used
carpet generated at the landfills due to disposal of old carpets from residential and industrial
areas.” The average age of a carpet is 8 to 10 years. The weight of post-consumer carpet waste is
20 percent more than virgin carpet due to presence of dirt, dog hair, nails, metal fragments, food,
bacteria and other microorganisms etc.
In this study the focus has been on the recycle of post consumer carpet. The recycling
process suggested could also be applied to pre-consumer carpet but it would need further
improvement in process modifications of the established scale-up process which is not desired.
Moreover the amount of pre-consumer carpet waste is low in comparison to post consumer
carpet waste. Virgin carpets are not a part of the research to develop carpet composites in this
study because this study aims at recycling the waste carpets in the landfills into highway noise
barriers and it would defeat the objective of the study if virgin carpets are included in recycling
of carpet composites.
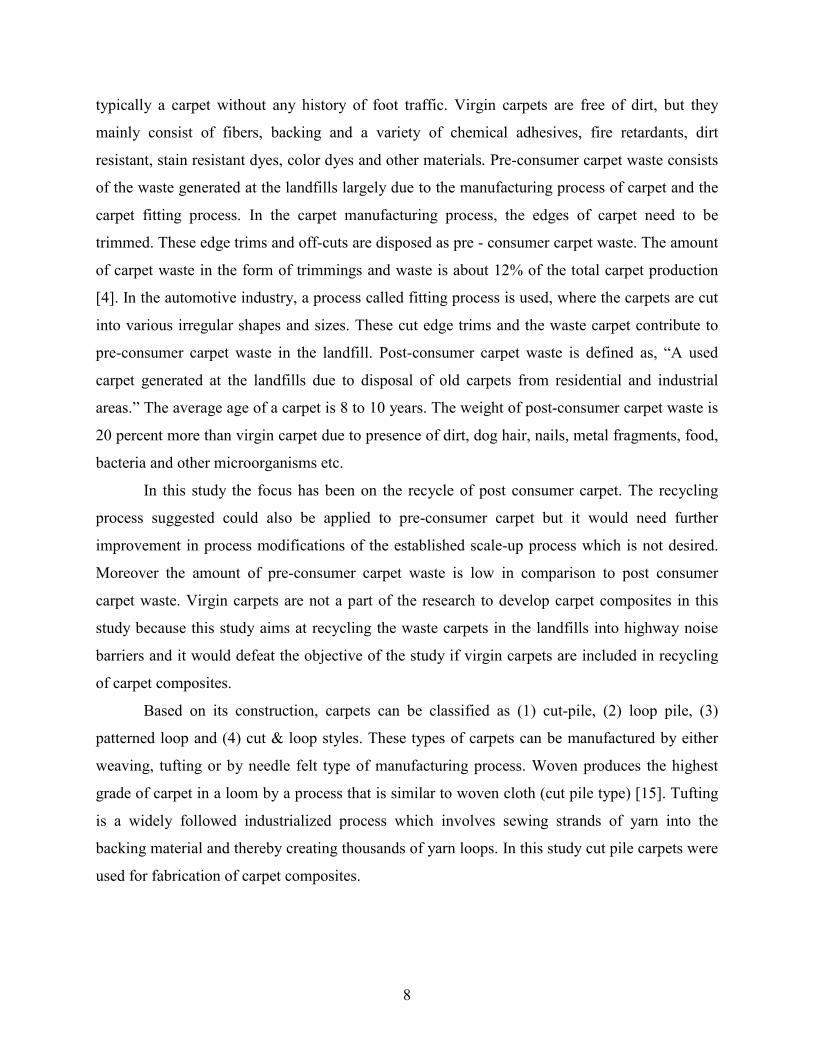
Based on its construction, carpets can be classified as (1) cut-pile, (2) loop pile, (3)
patterned loop and (4) cut & loop styles. These types of carpets can be manufactured by either
weaving, tufting or by needle felt type of manufacturing process. Woven produces the highest
grade of carpet in a loom by a process that is similar to woven cloth (cut pile type) [15]. Tufting
is a widely followed industrialized process which involves sewing strands of yarn into the
backing material and thereby creating thousands of yarn loops. In this study cut pile carpets were
used for fabrication of carpet composites.
8
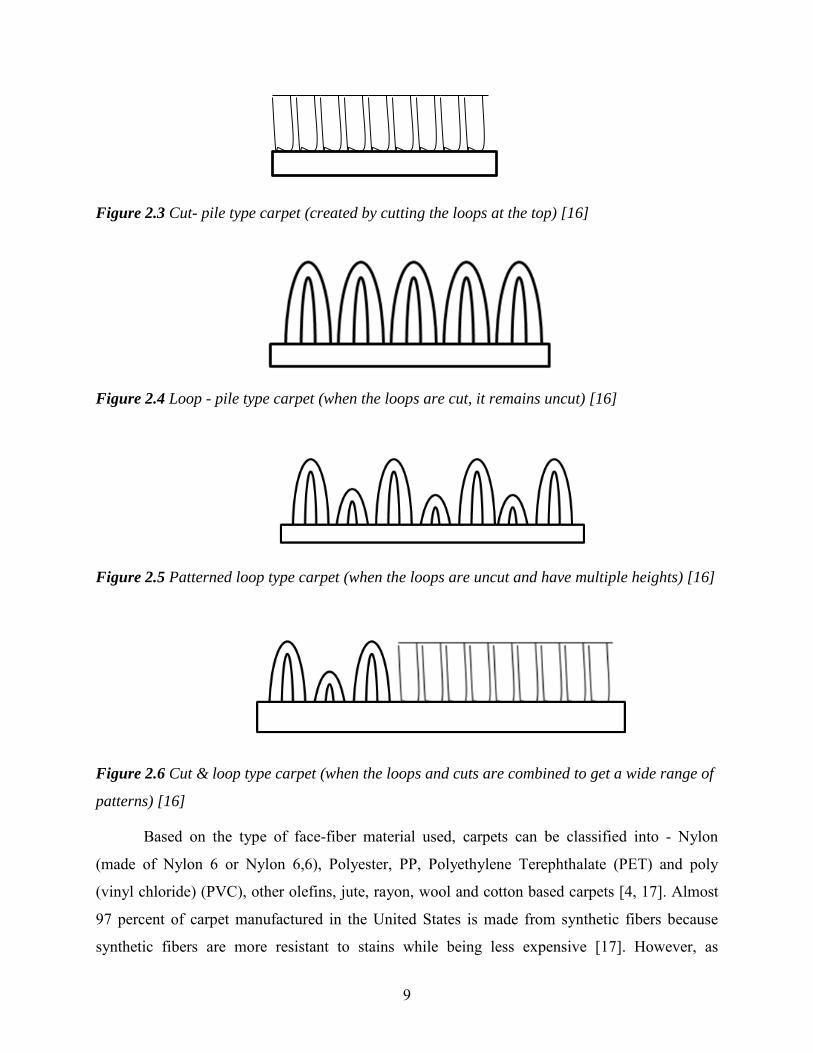
Figure 2.3 Cut- pile type carpet (created by cutting the loops at the top) [16]
Figure 2.4 Loop - pile type carpet (when the loops are cut, it remains uncut) [16]
Figure 2.5 Patterned loop type carpet (when the loops are uncut and have multiple heights) [16]
Figure 2.6 Cut & loop type carpet (when the loops and cuts are combined to get a wide range of
patterns) [16]
Based on the type of face-fiber material used, carpets can be classified into - Nylon
(made of Nylon 6 or Nylon 6,6), Polyester, PP, Polyethylene Terephthalate (PET) and poly
(vinyl chloride) (PVC), other olefins, jute, rayon, wool and cotton based carpets [4, 17]. Almost
97 percent of carpet manufactured in the United States is made from synthetic fibers because
synthetic fibers are more resistant to stains while being less expensive [17]. However, as
9
mentioned earlier nylon based carpets are used more significantly in the consumer world. About
90 percent of all residential carpets and 65 percent of all carpets are made of nylon fiber [17].
Nylon 6 and Nylon 6,6 account for 45 and 55 percent of the nylon carpet market [11]. In this
study Nylon 6,6 based cut pile carpet was used for fabrication of carpet composites.
2.1.3 Nylon fibers
In the field of material science, there is a wealth of information about the invention of
synthetic fibers for advancement in quality and availability of textiles. The discovery of Nylon
6,6 in 1931, by the chemists at E. I. DuPont de Nemours and Company pioneered the revolution
of textile industry and a huge impact of scientific world in the society [4]. Nylon 6,6 is a
polyamide made from two monomers of 6 carbon atoms each, therefore the designation 6,6 [4].
Nylon 6,6 is formed by a polymerization reaction between its monomers hexamethylene diamine
and adipic acid [4]. Currently, Nylon 6,6 is made by Dupont, Solutia and other manufacturers
and is sold as fibers [11]. By around 1940, Paul Schlack of I.G. Farben Company in Germany
obtained a different form of polyamide called Nylon 6 by using caprolactum as a monomer [4].
Currently, Nylon 6 is made by Honeywell, BASF and several other manufacturers and is
extruded in to fibers by these companies or by the carpet manufacturers. The manufacturers of
carpet procure the nylon material from these companies or have their own stand-alone nylon
production.
2.2 CARPET RECYCLING
Carpet recycling poses significant challenges due to the inhomogeneous and chemically
diverse nature of the materials that constitute a carpet. However literature suggests that there is
an increasing trend in research and development of carpet recycling methods. The carpet
recycling methods can be broadly classified into four categories:
1) Primary recycling or depolymerization: It involves methods to breakdown the long
polymer chains into their original monomers that can be repolymerized [4].
2) Secondary Recycling: It involves recovery of individual components of a polymeric
mixture without breaking them into monomeric forms but by extraction and separation
methods [4].
10
3) Tertiary Recycling: It consists of preparing a thermoplastic mixture by melt blending of
carpet waste by reactive extrusion and compatibilization. Injection molding on this blend
would yield products of lower quality [4].
4) Quaternary Recycling: It involves energy recovery by incineration of carpet waste [4].
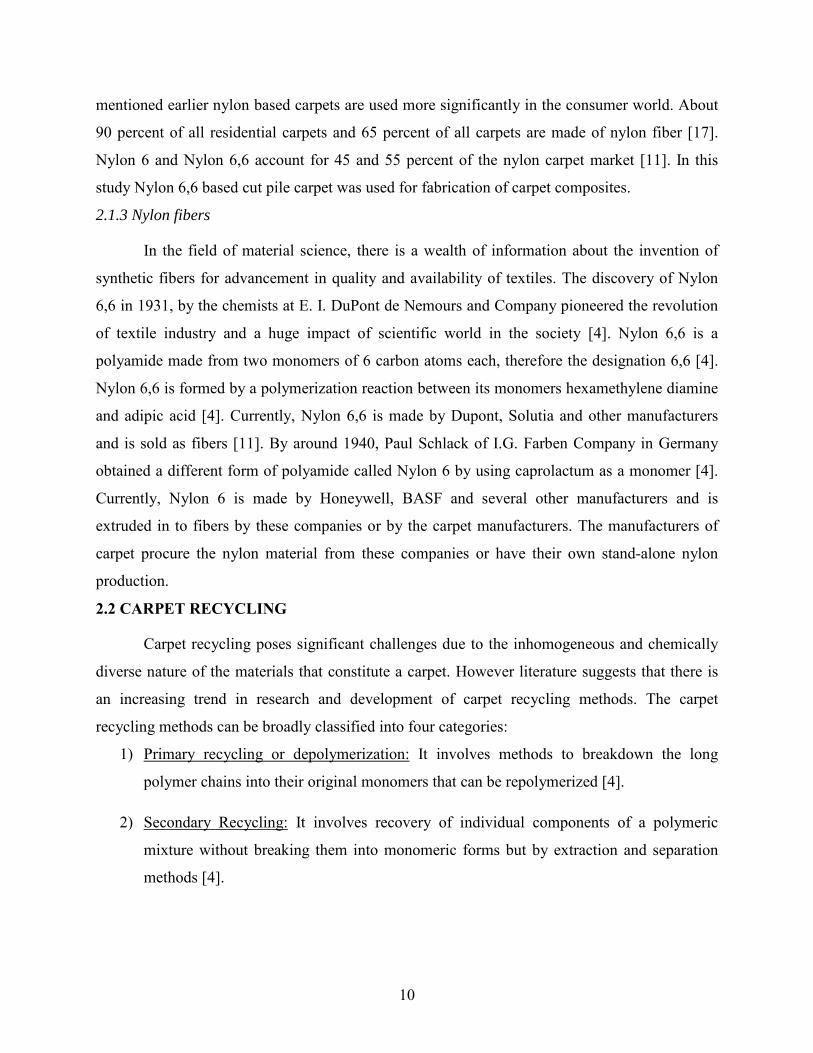
Research and development of carpet recycling has mostly been a part of one of the above four
recycling techniques. However, there are companies like Polyamid 2000 that have processes to
integrate all the above four recycling techniques into one recycling process. Polyamid 2000 has a
plant at Premnitz (near Berlin, Germany) at operation since 2000 that uses a recycling process
similar to the one illustrated in Fig. 2.7.
Figure 2.7 An adapted block diagram of Nylon recycling process used by Polyamid 2000 [18]
The following sections cover a detailed technical literature review of the carpet recycling
methods, covering patent and non-patent literature review.
2.2.1 Primary Recycling
Primary Recycling or Depolymerization is currently the most preferred route for the
carpet recycling industry, since it allows recovery of monomers from carpet fibers (nylon 6
and/or nylon 6,6) which can be repolymerized into new nylon products of high quality [4]. In the
non patent literature review, the paper by Mihut C et al. has provided valuable background
information. Mihut C et al. mentioned the following depolymerization techniques of carpet in
their paper [4] –
(a) Depolymerization with Ammonia (Ammonolysis)
11

(b) Acid/Base Catalyzed Depolymerization
(c) Depolymerization with water
(d) Pyrolysis
The depolymerization reaction of nylon 6 is a thermodynamically favored at low
pressures and high temperatures, above the boiling point of caprolactum (around 267oC). At low
pressures it becomes easier to separate the monomers from the melt. High temperature using
superheated steam is maintained because the process is endothermic. For depolymerization of
nylon 6,6 the key focus is the recovery of hexamethylene diamine and adipic acid. Some
depolymerization processes include addition of catalyst for easier processing of polymeric melt
by decreasing its viscosity [4]. The following Fig. 2.8 illustrates the companies involved in
depolymerization process of nylon based carpet.
Figure 2.8 An illustrative chart listing major companies in depolymerization of nylon carpets
Depolymerization of nylon 6 with superheated steam is a highly researched
depolymerization technique. Patent literature review suggests that Sifniades et al. of Allied
Signal Inc have several patents on the recovery of caprolactum from nylon 6. In their patent they
developed a depolymerization technique using superheated steam [19]. In multicomponent
mixtures or composites like waste carpets that contain nylon 6, the recovery of caprolactum is
complicated due to presence of other components [20]. Sifniades et al. August 1999, mention in
their patent that, “In the absence of added catalyst, contacting the multi component waste
material with superheated steam at a temperature of about 250oC to about 400oC and at a
pressure within the range of about 1 atm to about 100 atm and substantially less than the
12
saturated vapor pressure of water at the temperature wherein a caprolactum- containing vapor
stream is formed.
The formed caprolactum may then be used in the production of engineering resins and
fibers” [20]. Mayer et al. of Allied Signal Inc. modified the depolymerization process by stating
that “if the crude caprolactum from depolymerization of polyamide-containing carpet is
subjected to a simple flashing operation, the condensed flashed material may be crystallized from
the aqueous solution and good quality, washable crystals are obtained. The resulting caprolactum
has purity greater than 99.9 weight percent (excluding water) and a permanganate number less
than 3 and a color number less than 2 and thus, is world class caprolcatum.” [21]. Hendrix et al.
(1997), mention that depolymerization can take place at a pressure of between 0.5 and 5 atm in
the presence of a nitrogen containing compound [22]. By this process, the carpet waste would
undergo a depolymerization reaction to yield monomeric components and by - products.
These by - products can be removed with a nitrogen containing compound via gas phase
[22]. Allied Signal Inc. patented a process to remove caprolactum from hydrolyzable polymer
like nylon based carpet waste by depolymerization with water [23]. The process by Jenczewski
et al. (1997), uses “whole carpet,” that is carpet that has not been subject to any mechanical
separation, including cleansing of carpet [23]. The whole carpet is then fed to a continuous
stirred tank reactor (CSTR) or a series of CSTR’s via a gear pump, wherein it is mixed with
water to form a multicomponent polymeric waste material [23]. This mixture is then subjected to
heat and pressure to form a liquid aqueous solution and therefore dissolution of nylon 6 and
partial depolymerization of nylon 6 is achieved [23].
Caprolactum is obtained by flash distillation while the water insoluble waste is sent to
centrifuging to obtain solids which are combusted in a separate step to provide process heating
and evaporation [23]. Frentzen et al. suggest their patent process for depolymerizing nylon 6 and
recovering caprolactum from the depolymerized products by extraction with alkyl phenolic
compounds [24]. Corbin et al. 1999, focused on the process improvement in depolymerization of
nylon-6 carpet with water [25]. Corbin et al. invented the process in which the carpet is fed in a
separator to prepare a scrap containing nylon -6 and auxiliary materials, from which, the scrap is
fed to a depolymerizing reactor to produce a distillate rich in epsilon – caprolactum [25]. Here in
the distillate epsilon - caprolactum is separated from other volatiles and the auxiliary materials
are recovered and reused [25]. While most of the patents focused on recycling of nylon -6 to
13

caprolactum by depolymerization with water, Dos Santos et al. 1999, focused on treatment of
material comprising nylon 6,6 to recover adipic acid and other diacids [26].
A patent literature review revealed that depolymerization of nylon fibers into its
monomers by pyrolysis is not as studied in comparison to other depolymerization techniques.
However a few like Moens et al. (1999), invented a process to purify caprolactum from recycled
nylon by pyrolysis [27]. Moens et al. (1999), used carbon dioxide to form a precipitate in a
solvent dissolved pyrozylate containing caprolactum mixture [27]. The precipitate is removed
from the solution and pure caprolactum is recovered from the solution [27].
The non-patent literature suggests that depolymerization of carpet fibers by acid/ base
catalysis has been a highly reviewed and widely researched topic. Recovery of epsilon -
caprolactum from waste polyamide 6 is competitive with traditional synthesis process and has a
significant environmental impact [28]. The Zimmer AG process, which is applicable only for
pure polyamide 6 materials, performs depolymerization using steam and a liquid catalyst like
phosphoric acid [28]. The disadvantage of Zimmer process is the high yield of salts and traces of
phosphoric acid in the recovered ε-caprolactum [28]. Generally, depolymerization of carpet
using acid catalysis requires separation of fibers (beneficiation) from other components because
CaCO3 present in fillers can consume an equivalent amount of acid catalyst used [4]. Moran and
McKinney have worked extensively on the subject of depolymerization using catalysts using
acid catalysts using aliphatic carboxylic acid like acetic acid and propionic acid to obtain
caprolactum and adipic acid. According to the patent by Moran et al. for DuPont the following
process for depolymerization of waste carpet was developed -
“Waste carpets can be entirely dissolved in the aliphatic acids used, at temperatures of
about 110oC and atmospheric pressures. Carpet components, such as the primary and secondary
backings and adhesive binder, which are insoluble in the acid solution, can be separated by hot
filtration. The acid filtrate, containing the nylon fibers, can then be subjected to the
depolymerization process” [4].
Bockhorn et al. investigated the use of two types of catalysts – basic catalysis by
NaOH/KOH and acidic catalysis by H3PO4 (by Zimmer procedure), which remain liquid under
degradation conditions [28]. Bockhorn et al. concluded that “The basic catalyzed degradation of
polyamide 6 proceeds via an anionic chain mechanism, which explains high reaction rates in
contrast to the non-catalyzed and acid catalyzed reaction. For these reasons, basic catalyzed
14
degradation of polyamide 6 is the best suited for an application in a procedure for epsilon -
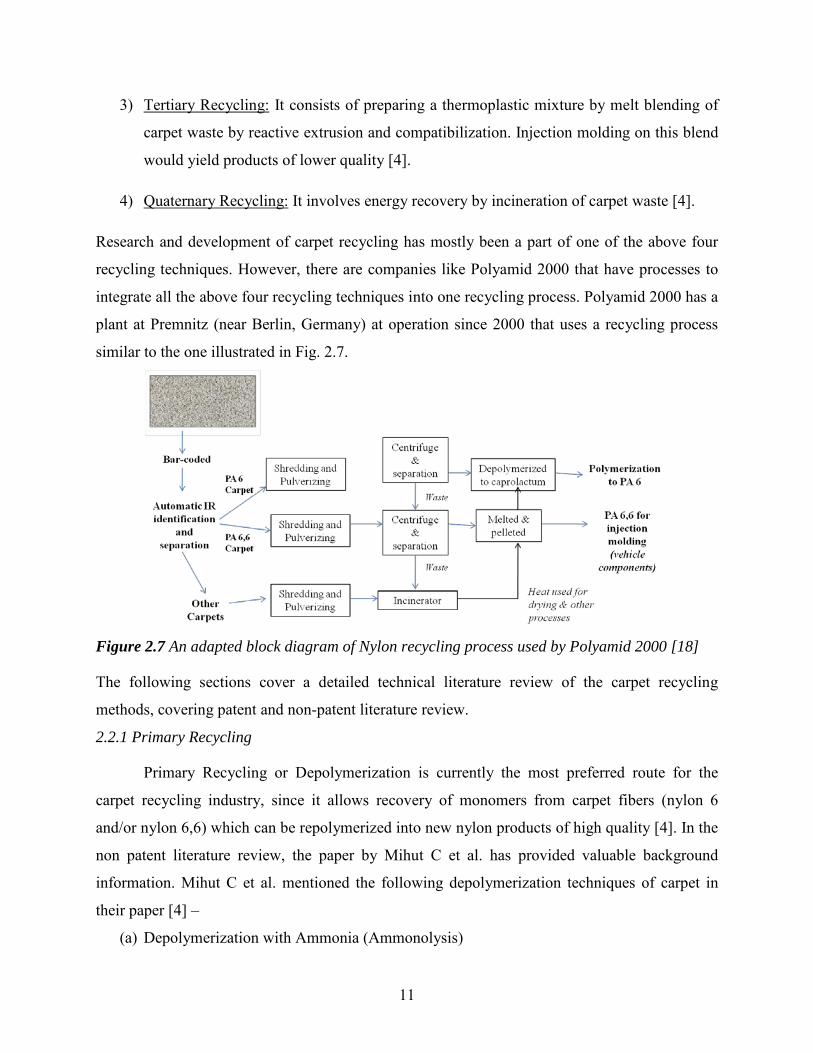
caprolactum recovery from polyamide 6 wastes” [28]. Depolymerization with ammonia involves
heating of a mixture of polyamide 6 and polyamide 6,6 in the presence of ammonia at high
temperatures and pressures [4]. Lewis acid catalyst precursors makes the process highly efficient
[4].
Figure 2.9 An adapted block diagram of Dupont’s Nylon recycling process [18]
2.2.2 Secondary Recycling
In the process of secondary recycling, the entire waste carpet is dissolved in a solvent at
high temperature and nylon can be extracted from its fibers in its polymeric forms by extraction
process. Although the final product can be used in various applications by further processing
using injection molding, the problem associated with this process is the selection of a suitable
solvent that selectively dissolves the nylon fibers and does not interact with or dissolve with any
of the other carpet components [4].
A patent literature review of secondary recycling of carpet reveals that Roberts et al. in
1997 patented a process for recovering and recycling carpet waste by contacting the carpet waste
with a solvent (like formic acid or phenol) which selectively dissolves nylon to form a polymer
solution. The solvent and polymer solution is then contacted with an anti-solvent (like carbon
dioxide) which causes the polymer to nucleate and precipitate from the solution [29]. The
process is efficient in terms of safety and cost because it can be operated using low temperature
solvents and anti-solvent like carbon dioxide for re-crystallization of nylon [29]. Costello et al.
devised a method to remove the adhesive material from the waste carpet material feedstock to
15

obtain a mixture containing face fiber material which is passed with a liquid medium to a
hydrocyclone for separation of solids on the basis of specific gravity for recovery [30].
2.2.3 Tertiary Recycling
Tertiary recycling of carpet materials consists of melting or extruding the waste carpet to
form a blended mixture which is then used in production of injection molding and thermoplastics
[4]. Although melt blending is cost effective compared to the expensive separation and
depolymerization procedures it produces low quality melt blended plastics due to poor chemical
compatibility of carpets [4].
Kotlair and Fountain developed a simple process to convert carpet waste to individual
shreds, which on coating with structural adhesives gives fibrous composites like “synthetic
wood” [4]. Young et al. focused on recycling of automotive carpet scrap by extruding the
shredded and granulated carpet scraps [4]. The melt produced is then pelletized and used in
injection molding applications [4]. This process for Lear Corporation included applications like
flexible floor mats, automotive carpet backing with superior sound-insulating properties and
rigid materials like door panels and truck liners [4]. David et al. developed an alternative method
of melt blending for Monsanto in which, the carpet waste without excess dirt is fed into a twin
screw extruder at a shear rate of 200 to 400 sec-1, a temperature between 250oC and 350oC and a
pressure of 350 to 450 psi [4]. Intense mixing converts the carpet into a flowing homogenous
mixture containing all the components of carpet - face fiber, backing and SBR adhesive, which
on cooling yields a resulting material exhibiting thermoplastic characteristics in the form of
pellets or chips [4].
2.2.4 Quaternary Recycling
Incineration or quaternary recycling helps in partial recovery of the energy content of the
waste materials like carpet waste. Two types of ash are produced by the incineration process: fly
ash (fine particles entrained in the incinerator exhaust gases) and bottom ash (the large and heavy
particles removed from the bed of the incinerator) [31]. Land filling these ash residues is not
always acceptable because of the potential for groundwater and soil pollution due to leachate
carrying heavy metals like lead and cadmium [31]. Even though there has been public resistance
for incineration due to its emission of toxic fumes, there has been significant improvement in
technology which makes incineration a robust recycling option [31]. Most of the municipal solid
waste (MSW) combustion currently practiced in the United States involves recovery of an
16
energy product (generally steam or electricity). The resulting energy reduces the amount needed
from other sources, and the sale of the energy helps to offset the cost of operating the facility [8].
The USEPA report of 2009, in its chapter on Management of Municipal Solid Waste states that
“Total U.S. MSW combustion with energy recovery, referred to as waste-to-energy (WTE)
combustion, had a 2009 design capacity of 94,721 tons per day. There were 87 WTE facilities in
2009, down from 102 in 2000” [8].
There is also a trend in facilities seeking combustion of source separated MSW for use of
rubber tires and used paper / wood products in boilers, cement kilns, pulp and paper mills,
industrial boilers and dedicated scrap tire to energy facilities [8]. The use of tires have decreased
the air emissions by 30 % for a plant at Atlanta, Georgia and has therefore helped the company
to meet the stringent nitrogen oxides (NOx) guidelines [32].It is estimated that about 3.1 million
tons of MSW were combusted in this manner in 2009, with tires being the majority in this
contribution [8]. However, the volume of these MSW is reduced by about 75% after incineration
and the post-combustion ash needs to be treated separately and then land filled thereby owing to
general public concerns [32]. The use of carpet waste in cement kilns is also an attractive option
since the relatively high fuel value of carpet polymers can reduce the need for fuels, and the
calcium carbonate in carpet could become a raw material for cement [32].
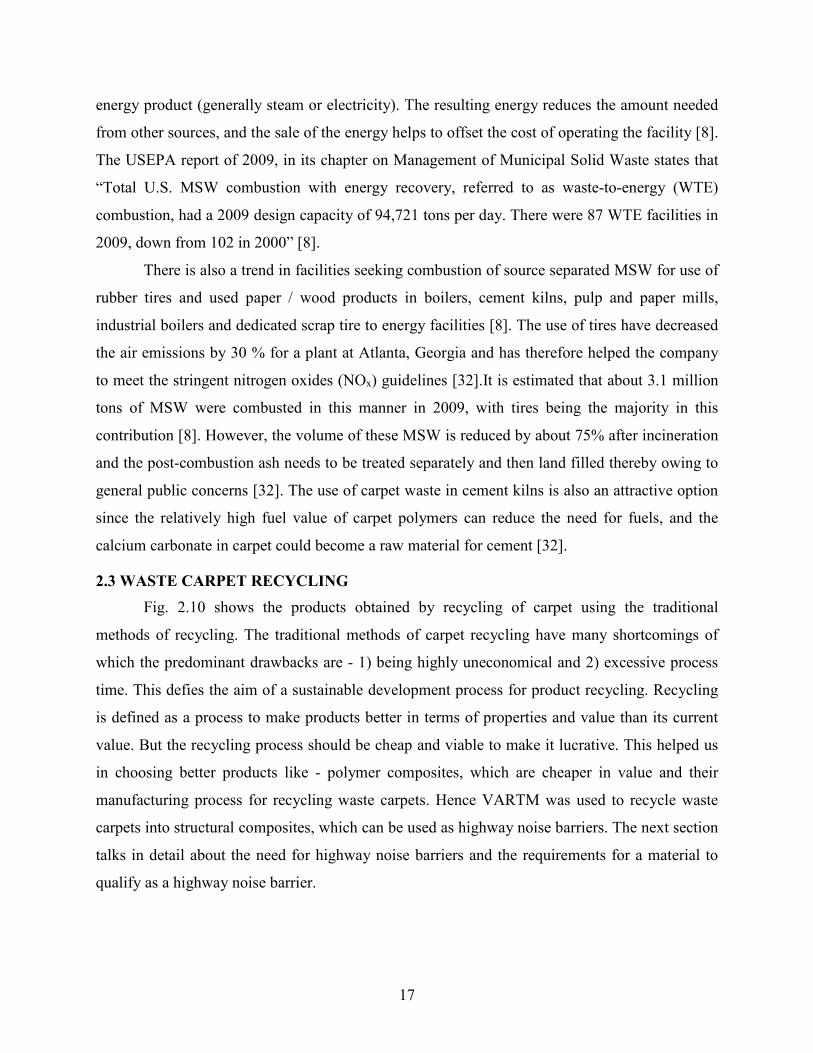
2.3 WASTE CARPET RECYCLING Fig. 2.10 shows the products obtained by recycling of carpet using the traditional
methods of recycling. The traditional methods of carpet recycling have many shortcomings of
which the predominant drawbacks are - 1) being highly uneconomical and 2) excessive process
time. This defies the aim of a sustainable development process for product recycling. Recycling
is defined as a process to make products better in terms of properties and value than its current
value. But the recycling process should be cheap and viable to make it lucrative. This helped us
in choosing better products like - polymer composites, which are cheaper in value and their
manufacturing process for recycling waste carpets. Hence VARTM was used to recycle waste
carpets into structural composites, which can be used as highway noise barriers. The next section
talks in detail about the need for highway noise barriers and the requirements for a material to
qualify as a highway noise barrier.
17
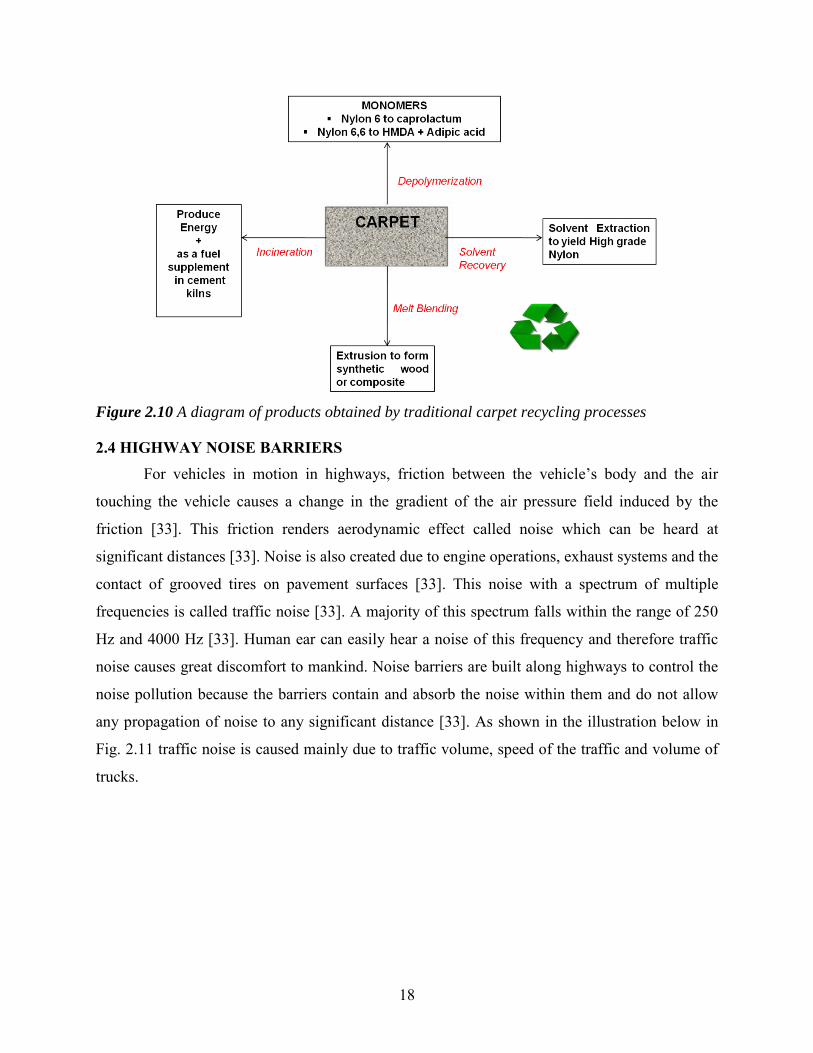
Figure 2.10 A diagram of products obtained by traditional carpet recycling processes
2.4 HIGHWAY NOISE BARRIERS For vehicles in motion in highways, friction between the vehicle’s body and the air
touching the vehicle causes a change in the gradient of the air pressure field induced by the
friction [33]. This friction renders aerodynamic effect called noise which can be heard at
significant distances [33]. Noise is also created due to engine operations, exhaust systems and the
contact of grooved tires on pavement surfaces [33]. This noise with a spectrum of multiple
frequencies is called traffic noise [33]. A majority of this spectrum falls within the range of 250
Hz and 4000 Hz [33]. Human ear can easily hear a noise of this frequency and therefore traffic
noise causes great discomfort to mankind. Noise barriers are built along highways to control the
noise pollution because the barriers contain and absorb the noise within them and do not allow
any propagation of noise to any significant distance [33]. As shown in the illustration below in
Fig. 2.11 traffic noise is caused mainly due to traffic volume, speed of the traffic and volume of
trucks.
18
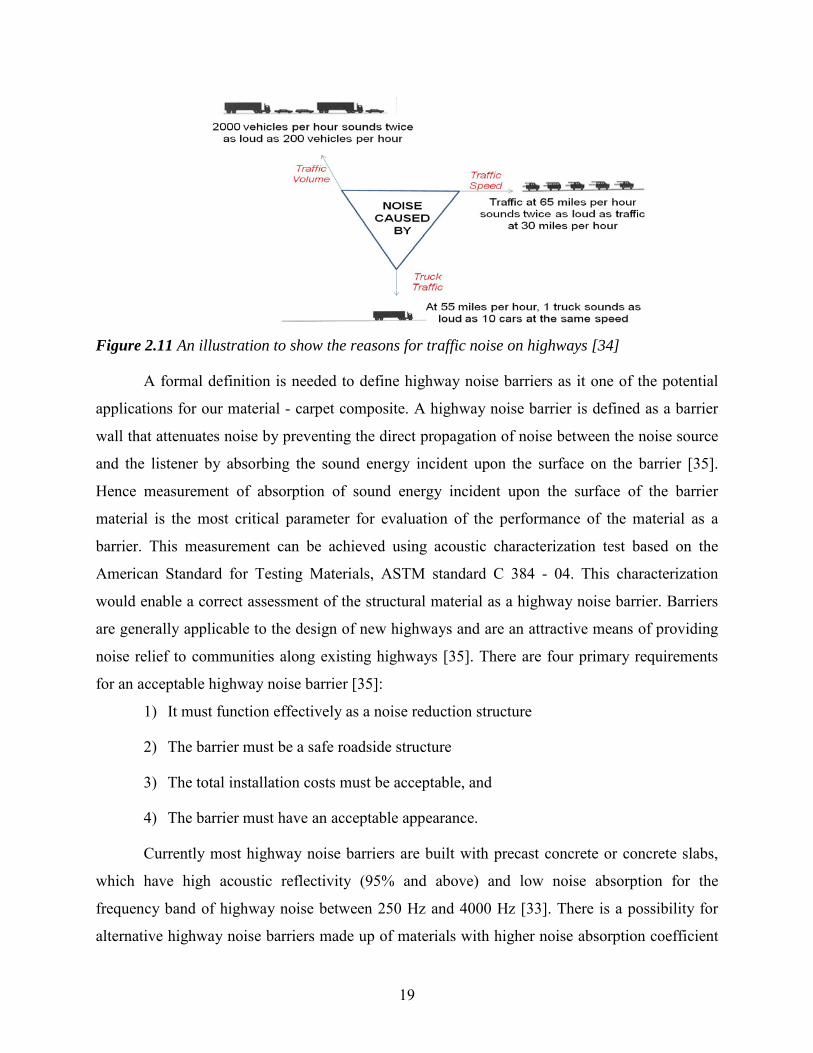
Figure 2.11 An illustration to show the reasons for traffic noise on highways [34]
A formal definition is needed to define highway noise barriers as it one of the potential
applications for our material - carpet composite. A highway noise barrier is defined as a barrier
wall that attenuates noise by preventing the direct propagation of noise between the noise source
and the listener by absorbing the sound energy incident upon the surface on the barrier [35].
Hence measurement of absorption of sound energy incident upon the surface of the barrier
material is the most critical parameter for evaluation of the performance of the material as a
barrier. This measurement can be achieved using acoustic characterization test based on the
American Standard for Testing Materials, ASTM standard C 384 - 04. This characterization
would enable a correct assessment of the structural material as a highway noise barrier. Barriers
are generally applicable to the design of new highways and are an attractive means of providing
noise relief to communities along existing highways [35]. There are four primary requirements
for an acceptable highway noise barrier [35]:
1) It must function effectively as a noise reduction structure
2) The barrier must be a safe roadside structure
3) The total installation costs must be acceptable, and
4) The barrier must have an acceptable appearance.
Currently most highway noise barriers are built with precast concrete or concrete slabs,
which have high acoustic reflectivity (95% and above) and low noise absorption for the
frequency band of highway noise between 250 Hz and 4000 Hz [33]. There is a possibility for
alternative highway noise barriers made up of materials with higher noise absorption coefficient
19
or even the use of vegetation as a noise barrier. Vegetation can decrease highway traffic noise if
it is high, wide and dense enough. A 200 ft width of dense vegetation can reduce noise by 10 dB,
which cuts the traffic loudness into half, but is impractical to plant such scale of vegetation – at
this era of rapid development [34].
Figure 2.12 Types of Highway Noise Barriers [34]
Due to exponential economic growth of the world economy in the past few decades,
there has been a drastic increment in highway traffic and a need to develop new and better noise
reduction barriers for highways and airports. This trend in increase of highway traffic is likely to
continue in the near future and so has been an increase in dedicated research efforts to develop
new noise barriers. Polycarbonate noise reduction panels made by a California based company,
“Quitite International”, have been used to build polycarbonate noise wall near Culver City park
in Los Angeles, California in 1996 [33].Also a jet engine testing center was installed at Albany
airport, Albany, New York in 1997 using polycarbonate noise barrier [33]. In both these cases
the polycarbonate was made from Lexan plastic produced by GE Plastics [33]. Carsonite
International of Early Branch, South Carolina developed hollow panels made planks of
reinforced composite material crumbed rubber tires as nano-fillers [33].
The literature review indicates that Wolfe et al. investigated the usage of cement wood
composite as highway noise barriers while Watts et al. studied the effects on roadside noise
levels by applying sound absorptive materials to the traffic face of noise barriers [36, 37]. Watts
et al. also used the boundary element method to study the combined effects of porous asphalt
surfacing and noise barriers on traffic noise [37]. Yamaguchi et al. studied the sound absorption
mechanisms, void ratio and acoustic properties of porous asphalt surface by comparison with
other porous materials like mineral wool and synthetic wool [38]. Meiarashi et al. and Oshino et
al. studied the sound absorption mechanism of porous asphalt pavement and proposed a model
20
for predicting vehicle noise propagation on asphalt pavement [39] [40]. Shukla et al. investigated
the effect of addition of cenospheres on the acoustic properties of cement matrix and asphalt
concrete [41]. Hence this shows clear evidence that replacement of concrete noise barriers with
better acoustic composite materials is feasible.
The factors that influence the structural design of barriers are both acoustic and non-
acoustic. Non acoustic factors include wind loads, fire-retardancy, and the weather and aging
effects (which cause warping and corrosion) [42].
2.5 ENVIRONMENTAL DEGRADATION OF CARPET COMPOSITES The performance of the carpet composite demonstrated high potential as a new material
for highway sound barrier and other structural application in terms of acoustic and mechanical
properties. However, during long-term outdoor type of applications, the composite panels would
be exposed to UV, moisture, heat, wind, dust and other pollutants that could potentially
deteriorate the properties of the composite panels. [43] Among all the environmental elements,
moisture and UV play important roles in physical and chemical change or degradation process of
polymers. [43]
The following section is about the possible degradation that the carpet composites may
undergo due to the interaction with moisture and Ultra-violet (UV) radiation.
2.5.1 Effect of water on polymer
Chemical and physical changes are observed in polymers due to interaction with
moisture. Chemical changes involve hydrolysis and leaching of additives. As a result,
plasticization effect can be seen in polymers that lead to changes in mechanical properties. [44]
The water absorption kinetics in polymers is generally divided into two types: 1) Fickian
and 2) non- Fickian. For the first kind, absorption follows the Fickian law of diffusion, which in
one-dimensional case is governed by the following equation:
2
2
xcD
tc
∂∂
=∂∂
……………………………….(1)
This equation can be simplified in the following form relating mass gain to diffusivity and
thickness h with time[14] :
21
24
=
∞ hDt
MM t
π…………………………..(2)
21
Taking initial mass M∞, thickness h, and diffusivity D as constant, mass gain becomes
proportional to square root of time. As a result Fickian diffusion can easily be identified from
linear relationship of mass change and square root of time. Fickian diffusion of polymers
involves absorption through nano or micropores of the polymer, where non-Fickian indicates
boundary separation in different polymer phase and causes swelling and residual stresses in
polymers. [45]
Epoxy has strong affinity towards water. Absorption and transportation mechanism of
water has been of interest for many researchers. Different techniques have been utilized to figure
out whether the absorbed water molecules are in motion or static. Most of the findings came to
the conclusion that water is stable inside the epoxy and water molecules are attached to specific
locations of the molecular chain of epoxy. It is assumed that nano voids open spaces for the
water and polarity of the epoxy facilitates attachment of water molecules with polymer chain.
NMR study by Fuller et al. indicated absorbed water molecules by epoxy is not in motion. [46]
They also found hydrogen exchange in between water and epoxy. [47] Similar findings was
reported by Ellis and Karasz and they suggested that one water molecule can interact with six
OH sites of epoxy polymer. [48, 49] Along with the polarity, free void of epoxy facilitates water
motion. During the formation of covalent bond in curing process, nanopores of 5-6 Å size are
created which is big enough to occupy water molecule. [50] As the absorption process goes on,
water absorption is slowed down not only because of the decrease of free void, but also for the
hindrance created by the other water molecules strongly attached to the polar sites of the epoxy
chain. [51]
However, epoxy can be saturated by 1 to 7% of water of its weight depending on the
nature of epoxy. [52] Due to interaction with water, there can be change in physical and
mechanical properties. One of the after effects of water absorption is depression of glass
transition temperature (Tg) that is attributed to plasticization of epoxy. [53] Moy and Karasz
reported that depression of Tg increases with the increase in amount of absorbed water. [54]
Absorption of water leads to formation of microvoid and microcracking, as a result of which loss
of mechanical properties is observed. [55]
Similar effect of moisture is observed in nylon. Nylon 66 can absorb up to 9% of
moisture of its weight. [43] Reduction in tensile strength and modulus has been reported due to
degradation by moisture. Reduction in elastic modulus may occur in nylon, and high temperature
22
hygrothermal ageing can increase crystallinity. [56] Reduction in strength has been found as
much as 82% after exposure to 100% relative Humidity in 100 °C up to saturation moisture
absorption. [57]
In fiber matrix composites, interfacial bond between fiber and matrix is highly affected
due to moisture absorption process. Debonding and weakening of the fiber-matrix bond is
observed due to interaction with water. [57-59]
2.5.2 Effect of UV on polymer
Ultra violet (UV) radiation is responsible for chain scission, cross linking reaction, and
photo-oxidation of polymer. UV exposure of epoxy leads to chain scission and surface cracking.
[60] Due to irradiance of UV, surface damage and initiation of crack have been found in glass
epoxy composites. [61]
Chemical, mechanical and physical changes in nylon are found when exposed to UV.
Many authors have studied chain scission of nylon after UV exposure. Figure 2.13 shows chain
scission reaction in the most possible order [62]. FT-IR analysis showed that chain scission
reaction of nylon 6,6 can be accompanied with emission of gases such as H2, CO, NH3, carbonyl
compound. [62, 63]. Longer exposure of UV can lead to increased cross-linking reaction. [64]
Along with the chain scission and cross-linking reaction, photo oxidation is another possible way
of degradation of nylon in presence of UV. [65] Chain scission makes the polymer weaker and
cross-linking leads to brittleness and cracking.
Synergistic effect of UV and moisture is seen on polymer and polymer matrix
composites. Kumer et al reported results of combined effect of UV and condensation on carbon
fiber reinforced epoxy composites. Degradation process is accelerated and erosion can happen in
polymer matrix by alternative exposure of UV and condensation. [66] It is assumed that the role
of moisture in the combined effect of UV and moisture is to increases the mobility of the catalyst
and thus enhance the degradation process.
23
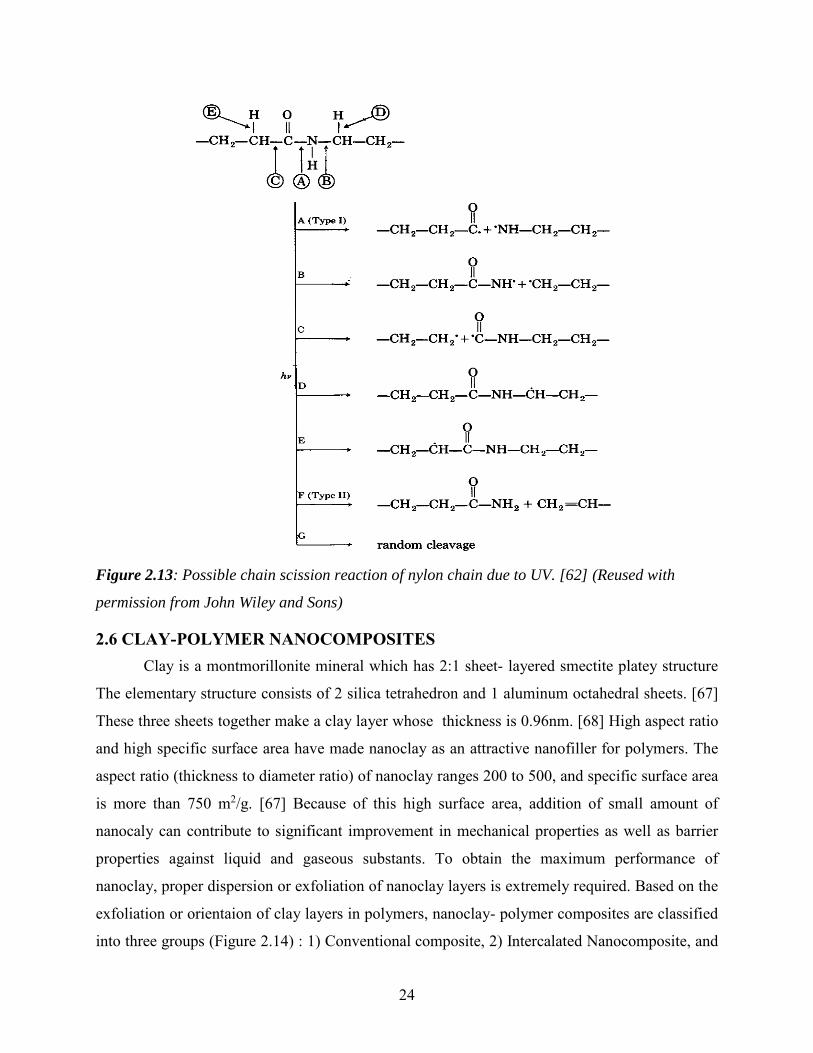
Figure 2.13: Possible chain scission reaction of nylon chain due to UV. [62] (Reused with
permission from John Wiley and Sons)
2.6 CLAY-POLYMER NANOCOMPOSITES Clay is a montmorillonite mineral which has 2:1 sheet- layered smectite platey structure
The elementary structure consists of 2 silica tetrahedron and 1 aluminum octahedral sheets. [67]
These three sheets together make a clay layer whose thickness is 0.96nm. [68] High aspect ratio
and high specific surface area have made nanoclay as an attractive nanofiller for polymers. The
aspect ratio (thickness to diameter ratio) of nanoclay ranges 200 to 500, and specific surface area
is more than 750 m2/g. [67] Because of this high surface area, addition of small amount of
nanocaly can contribute to significant improvement in mechanical properties as well as barrier
properties against liquid and gaseous substants. To obtain the maximum performance of
nanoclay, proper dispersion or exfoliation of nanoclay layers is extremely required. Based on the
exfoliation or orientaion of clay layers in polymers, nanoclay- polymer composites are classified
into three groups (Figure 2.14) : 1) Conventional composite, 2) Intercalated Nanocomposite, and
24
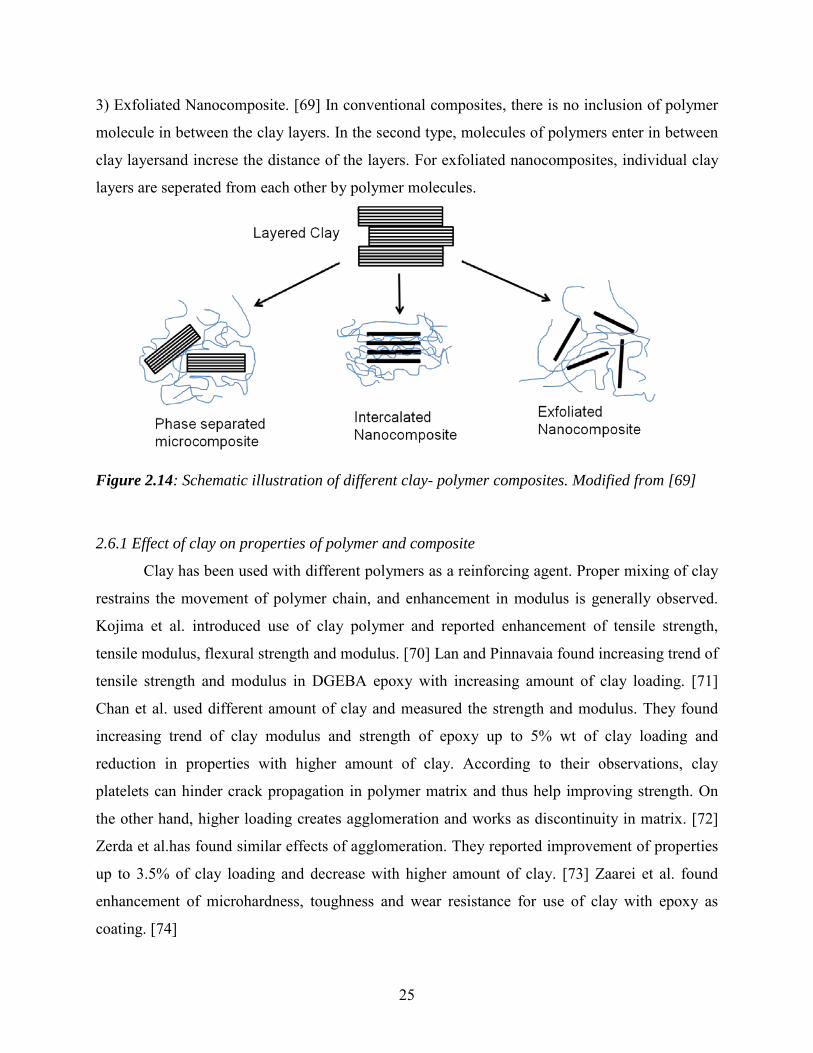
3) Exfoliated Nanocomposite. [69] In conventional composites, there is no inclusion of polymer
molecule in between the clay layers. In the second type, molecules of polymers enter in between
clay layersand increse the distance of the layers. For exfoliated nanocomposites, individual clay
layers are seperated from each other by polymer molecules.
Figure 2.14: Schematic illustration of different clay- polymer composites. Modified from [69]
2.6.1 Effect of clay on properties of polymer and composite
Clay has been used with different polymers as a reinforcing agent. Proper mixing of clay
restrains the movement of polymer chain, and enhancement in modulus is generally observed.
Kojima et al. introduced use of clay polymer and reported enhancement of tensile strength,
tensile modulus, flexural strength and modulus. [70] Lan and Pinnavaia found increasing trend of
tensile strength and modulus in DGEBA epoxy with increasing amount of clay loading. [71]
Chan et al. used different amount of clay and measured the strength and modulus. They found
increasing trend of clay modulus and strength of epoxy up to 5% wt of clay loading and
reduction in properties with higher amount of clay. According to their observations, clay
platelets can hinder crack propagation in polymer matrix and thus help improving strength. On
the other hand, higher loading creates agglomeration and works as discontinuity in matrix. [72]
Zerda et al.has found similar effects of agglomeration. They reported improvement of properties
up to 3.5% of clay loading and decrease with higher amount of clay. [73] Zaarei et al. found
enhancement of microhardness, toughness and wear resistance for use of clay with epoxy as
coating. [74]
25
2.6.2 Effect on barrier properties
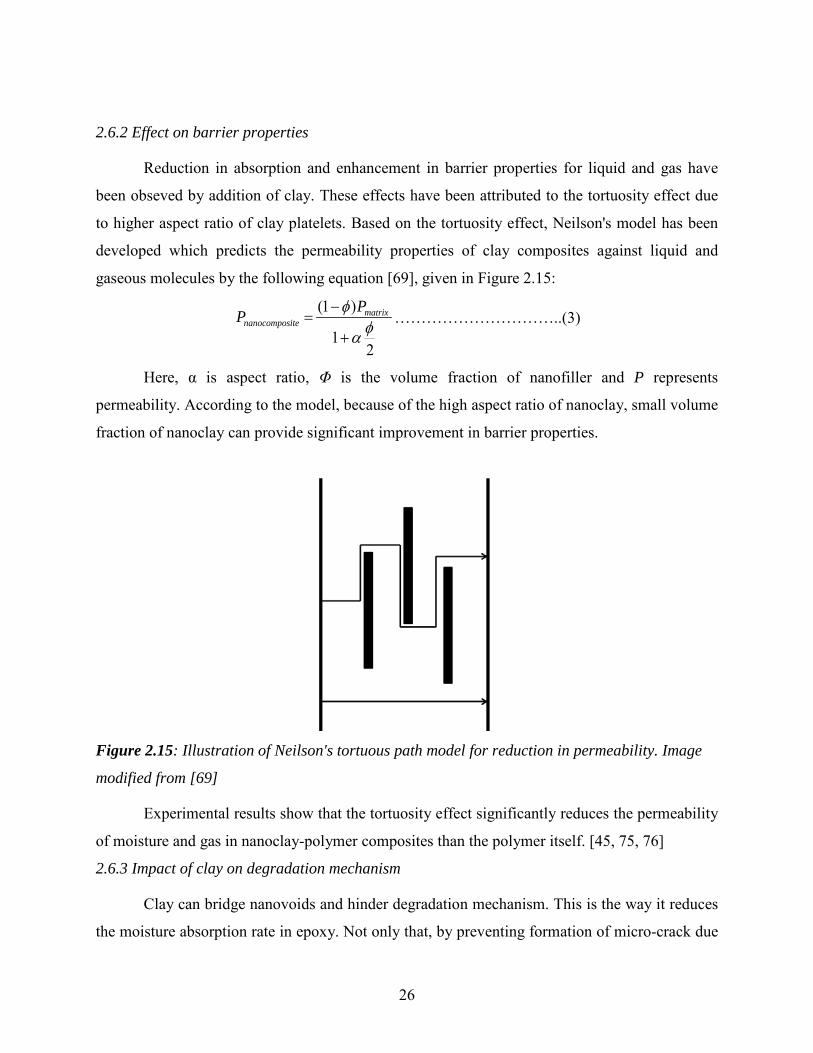
Reduction in absorption and enhancement in barrier properties for liquid and gas have
been obseved by addition of clay. These effects have been attributed to the tortuosity effect due
to higher aspect ratio of clay platelets. Based on the tortuosity effect, Neilson's model has been
developed which predicts the permeability properties of clay composites against liquid and
gaseous molecules by the following equation [69], given in Figure 2.15:
21
)1(φα
φ
+
−= matrix
itenanocomposPP …………………………..(3)
Here, α is aspect ratio, Φ is the volume fraction of nanofiller and P represents
permeability. According to the model, because of the high aspect ratio of nanoclay, small volume
fraction of nanoclay can provide significant improvement in barrier properties.
Figure 2.15: Illustration of Neilson's tortuous path model for reduction in permeability. Image
modified from [69]
Experimental results show that the tortuosity effect significantly reduces the permeability
of moisture and gas in nanoclay-polymer composites than the polymer itself. [45, 75, 76]
2.6.3 Impact of clay on degradation mechanism
Clay can bridge nanovoids and hinder degradation mechanism. This is the way it reduces
the moisture absorption rate in epoxy. Not only that, by preventing formation of micro-crack due
26
to environmental effect, it can reduce the effect of degradation on mechanical properties. Kim et
al. used different types of clay and found reduction in moisture absorption while compared to
neat epoxy. [45] Studies of effect of NOx on the mechanical properties have also suggested that
clay-polymer composites can retain tensile strength better than neat polymer after degradation.
[77] Fractographic analysis by woo et al. indicated that initial degradation process by UV cannot
be delayed by the use of clay, but effect of longer UV exposure is prevented. Clay can hinder
diffusion of oxygen and other free radicals and thus prevents crack propagation along the
thickness of the material. [60] Bagherzadeh et al. applied 60±5μ coating of epoxy-clay on metal
and found better anti-corrosive behavior. [78] Singh et al. reported the effect of clay on retention
of mechanical properties of epoxy against alternating exposure of UV and condensation.
According to them, clay decreases the formation of cracks and micro-channels, and provides
higher flexural strength and modulus after combined degradation. [79]
2.6.4 Effect of clay on fire retardancy of polymer
Polymers are more vulnerable than metal, ceramic, or concrete as construction materials
because of their flammability. Polymer can start a flame once the surface temperature reaches
ignition point. For most polymers, ignition temperature ranges from 275°C to 475°C. [80]
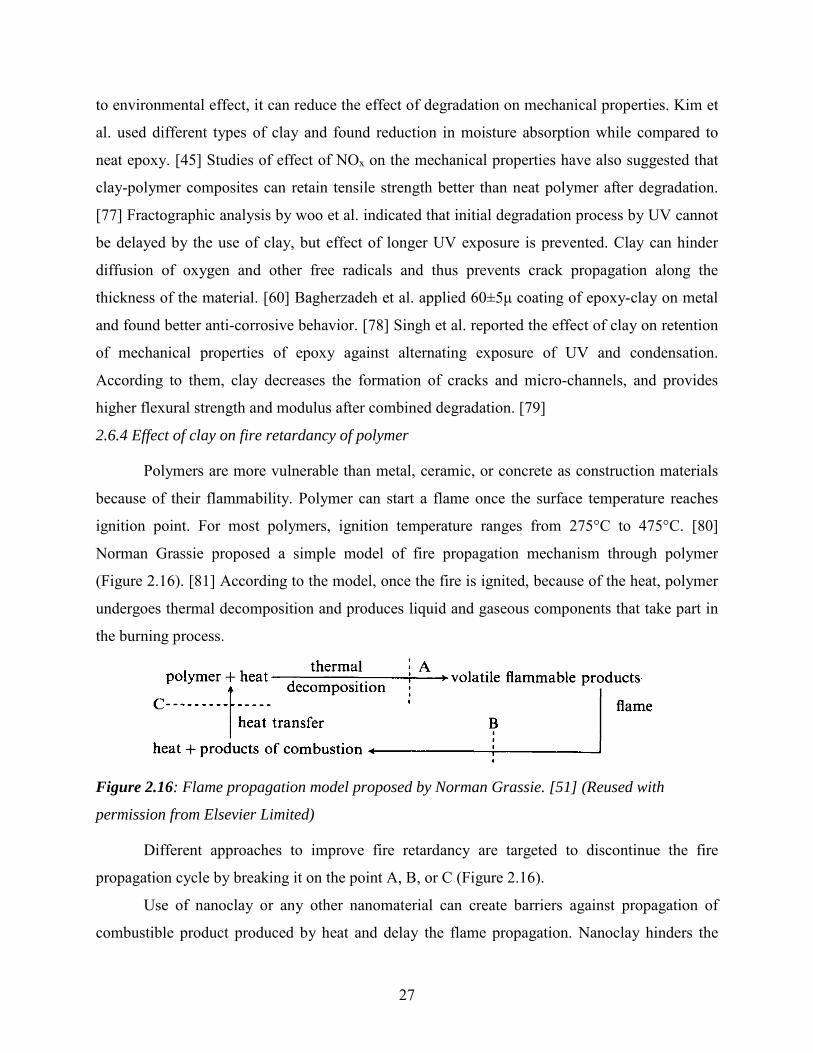
Norman Grassie proposed a simple model of fire propagation mechanism through polymer
(Figure 2.16). [81] According to the model, once the fire is ignited, because of the heat, polymer
undergoes thermal decomposition and produces liquid and gaseous components that take part in
the burning process.
Figure 2.16: Flame propagation model proposed by Norman Grassie. [51] (Reused with
permission from Elsevier Limited)
Different approaches to improve fire retardancy are targeted to discontinue the fire
propagation cycle by breaking it on the point A, B, or C (Figure 2.16).
Use of nanoclay or any other nanomaterial can create barriers against propagation of
combustible product produced by heat and delay the flame propagation. Nanoclay hinders the
27
physical movements of flammable product by two methods: 1) Barrier effect and, 2) formation
of char. [82]
The network structure formed by nano particles creates a thermal shield for heat, oxygen
and other combustible product and reduces supply of fuel for flame. On the other hand, in many
cases, use of nano components helps formation of robust char that prevents flow of combustible
product produced by heat during burning process. [82] Kashiwagi used nanosilica, nanoclay, and
carbon nanotube with PMMA, polyamide, and polypropylene, respectively, and observed fire
properties in a cone calorimeter. It was reported that addition of nanoparticles can delay ignition
time, reduces peak, and average heat release rate compared to neat polymers. The aspect ratio of
the nanoparticle was attributed as the controlling parameter on the effect of flame retardancy.
Analysis of the final burning product showed higher aspect ratio of the particle is favorable for
formation of char and reducing crack during burning process. [83] Clay has been used in
polymer with other flame redardant chemicals and reduced flammability was reported. Nazare et
al used nanoclay in polyester with different flame-retardants and found delay in ignition time and
decrease in total and peak heat release. [84]
28
3. COMPOSITE FABRICATION
The VARTM process for recycling carpet has several advantages compared to traditional
carpet recycling techniques like depolymerization and melt blending that require high energy.
Singh et al. (2009) [6] made a detailed analysis of recycling waste carpet into carpet composites
by VARTM with various thermoset resins. Singh et al. (2009) [6] used hot pressing for high
temperature post curing step to achieve carpet composites as a final product. The use of hot
press limits the fabrication of composites of different shapes and sizes primarily because hot
press is designed for flat composite panels of a fixed size. Jain (2010) [85] extended the work
performed on feasibility of carpet composites by studying the effect of carpet fiber treatment
with Lewis acid / base chemicals on resulting carpet composites by VARTM. Jain (2010) [85]
makes use of hot pressing as a post curing step to make carpet composites
However the challenge remains to scale-up carpet composites of larger dimensions and
different shapes. Hence a scaled - up process of fabricating large-scale carpet composites was
required. The following process of scaling up of VARTM was followed -
Samples were fabricated using a simple, vacuum assisted resin transfer molding
fabrication technique with different combinations of layers. In the scaled up VARTM fabrication
process caul plates and green mesh cloth (similar to SCRIMP process) are used. Initially, the
glass plate is cleaned with acetone. Three layers of mold release wax and one layer of PVA
release film coat are applied over the surface to ensure an easy removal of composite after
completion of resin curing period.
Nylon bagging material (procured from Airtech International Inc.), tacky tape and
connecting tubes (procured from Fiberlay Inc.) are cut to the required size. The tacky tape is laid
to a size slightly greater than the size of effective material (e.g., the infusion area over the glass
plate) and the carpet is placed between the tapes. The scaled-up VARTM fabrication process
involves use of a thin release sheet placed over the carpet for minimum resin use. Thin pores on
the sheet allow excess resin to flow out of the pores, which is then carried to the next level of
green mesh (SCRIMP model) which adds local stress points inside the bag so that resin runs
through carpet sample to reach the vacuum end of the set-up. A polyester release cloth is placed
over the green mesh cloth to ensure that the resin does not stick to the vacuum bag and the bag
can be attempted to be made reusable. Breather cloth is placed over the release cloth to ensure
distribution of air (if any) in the vacuum bag. The breather cloth distributes the air evenly in the
29
setup if in case of air pocket. In the conventional VARTM nylon bag is used to enclose the
entire set up from end to end over the tacky tape with attention paid to avoiding air pockets at
any end. In the scaled up VARTM process, the same procedure is used but over an aluminum
sheet placed over the breather cloth layer (thereby sandwiching the entire carpet sample
assembly). This sheet of aluminum is a caul plate that saves in the cost and simplifies VARTM
by avoiding the hot press. The caul plates used are of the same dimensions as the sample of
carpet cut.
3.1 MATERIALS AND COMPOSITE FABRICATION Fig. 3.1 (a) and Fig. 3.1 (b) show a schematic of the setup of scaled up VARTM process
used for fabrication of carpet composites.
Resin Bucket
IN
OUT
Peel ply / release film
Infusion Media
Stacked carpet layers
Outer piping
Vacuum Pump
Resin Trap
Vacuum Bag
Helix Tubing
Sealant Tape
Sealed Piping
Glass Plate
CaulPlate
Breather Cloth
Figure 3.1 (a) An illustrative schematic of the scaled up VARTM process (Plan View).
30
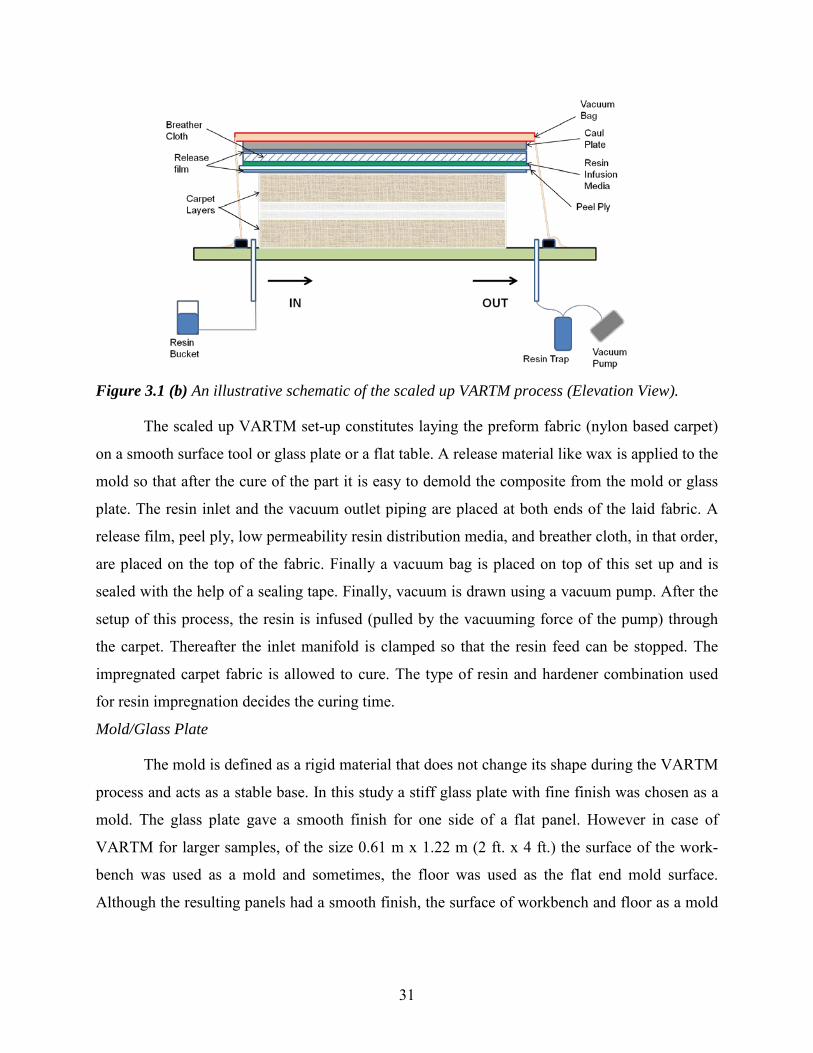
Figure 3.1 (b) An illustrative schematic of the scaled up VARTM process (Elevation View).
The scaled up VARTM set-up constitutes laying the preform fabric (nylon based carpet)
on a smooth surface tool or glass plate or a flat table. A release material like wax is applied to the
mold so that after the cure of the part it is easy to demold the composite from the mold or glass
plate. The resin inlet and the vacuum outlet piping are placed at both ends of the laid fabric. A
release film, peel ply, low permeability resin distribution media, and breather cloth, in that order,
are placed on the top of the fabric. Finally a vacuum bag is placed on top of this set up and is
sealed with the help of a sealing tape. Finally, vacuum is drawn using a vacuum pump. After the
setup of this process, the resin is infused (pulled by the vacuuming force of the pump) through
the carpet. Thereafter the inlet manifold is clamped so that the resin feed can be stopped. The
impregnated carpet fabric is allowed to cure. The type of resin and hardener combination used
for resin impregnation decides the curing time.
Mold/Glass Plate
The mold is defined as a rigid material that does not change its shape during the VARTM
process and acts as a stable base. In this study a stiff glass plate with fine finish was chosen as a
mold. The glass plate gave a smooth finish for one side of a flat panel. However in case of
VARTM for larger samples, of the size 0.61 m x 1.22 m (2 ft. x 4 ft.) the surface of the work-
bench was used as a mold and sometimes, the floor was used as the flat end mold surface.
Although the resulting panels had a smooth finish, the surface of workbench and floor as a mold
31

gave other operational problems like cleaning the spillage of excessive resin and change in flow
pattern of resin.
In case of curved shaped panels, a thin aluminum plate was curved to the shape of an arch
and used as a mold.
Reinforcing Fabric - Carpet
Reinforcing fibers are the backbone of any composite material. In this study Nylon, cut
loop type of carpet of the commercial name ESSENTL TWTGO, color Sandstone by Shaw
Industries was chosen.
These carpets of size 3.66 m x 1.22 m (12 ft. x 4 ft.) were bought from M/s Georgia
Carpet Industries Inc., Atlanta, Georgia, and then pieces of sizes 0.15 m x 0.15 m (0.5 ft. x 0.5
ft.), 0.15 m x 0.24 m (0.5 ft. x 0.8 ft.), 0.24 m x 0.24 m (0.8 ft. x 0.8 ft.), 0.30 m x 0.30 m (1 ft. x
1 ft.), 0.61 m x 0.61 m (2 ft. x 2 ft.) and 1.22 m x 0.61 m (4 ft. x 2 ft.) were cut in the sample
preparation process for fabrication of composites.
The carpet was laid up in three different configurations - TBBT, BTTB and TBBTTBBT
(4 layer carpet), shown in Figure 3.2.
Figure 3.2 Images of carpet configurations used for VARTM
32
Resin
The sole purpose of the use of thermoset resin is to impregnate the carpet layers and act
as a matrix for the resulting carpet composite. The characteristics of the resin that directly affect
the VARTM process are viscosity, gel time and the type of resin. Less viscous resins might
infuse quickly, resulting in deformed parts. This deformation is due to uneven wetting of the
fabric making some portions resin rich and others full of voids with dry - spots, while faster
curing resins, with high viscosity gel too quickly and cannot sometimes impregnate the entire
part [53].
In this study, the resin systems used were vinyl ester, polyester and epoxy resins. Even
though vinyl ester and polyester resins are available cheaply in the market, styrene emissions is a
problem, causing shrinkage in the parts resulting in stresses between the layers [86]. There were
attempts to do VARTM with epoxidized soybean oil (ESO) but it proved to be unsuccessful
because it could not crosslink.
In this study, the resins - Epoxy 2000 (hardener Epoxy Hardener 2120) and polyester and
vinyl ester (with hardener: methyl-ethyl-ketone-peroxide) (MEKP) were procured from
Fiberglast Corporation. The Epoxy 2000 resin was prepared by mixing with hardener with a
weight ratio of 27/100. For example for every 1000 grams of epoxy resin, 270 grams of hardener
was added and then stirred for effective cross linking. The pot life of the resin was 120 minutes
due to the addition of Epoxy 2120 hardener used for mixing and therefore proved advantageous
for larger samples. Polyester resin was prepared by adding hardener MEKP in the weight ratio of
1/100 while on the other hand for vinyl ester resin MEKP was added in the weight ratio of
1.25/100. Thus for every 1000 grams of polyester or for every 1000 grams of vinyl ester resin, 10
gm of MEKP and 12.5 grams of MEKP are added respectively. Since the curing temperature of
both polyester and vinyl ester resins takes place at room temperature itself, the pot life for these
resins is as low as 20 minutes. A curing period of 24 hours was maintained to ensure complete
curing for all resin types.
A Mettler Toledo weigh balance was used to measure the accurate amount of resin and
accurate amount of hardener mixture before infusion. The weigh balance needs to be accurate as
improper ratios can cause uneven curing, change the properties of resin flow inside the preform
33
and cause gel times to change [86]. A balance with an error range of 0.01 gm was used because
the proportion of hardener to the resin should match exactly the manufacturer specifications.
The resin distribution media is used to accentuate the distribution of resin from the inlet
piping to the preform and makes the resin moves faster due to the pressure gradient created. The
resin resin distribution media used was “Greenflow 75” bought from Airtech International Inc.
The resin resin distribution media efficiently distributes resin with little waste due to its low
profile and tight construction.
Generally, the resin distribution media is placed from the inlet-piping end to the outlet,
without touching the outlet helix tubing. Generally, the gap between the outlet helix tubing and
the resin distribution media is 31.75 mm (1.25 in) [87]. However in the scale-up of VARTM
process, the resin resin distribution media covers the entire area including the outlet tubing. This
would create micro voids in the composite panels fabricated. This is because there is always a
possibility that some air gets trapped in the helix tubing and addition of the resin resin
distribution media over the outlet tubing would aggravate the problem by actually trapping air in
the micro - gradients created.
One of the main aims for scale-up of VARTM is to produce composites with excellent
acoustic properties. Creation of micro-voids ensures that there is an increase in porosity, which
in turn results in improvement of acoustic performance of composites.
3.1.2 Nanoclay
The nano-filler used in this study was Nanomer I.28 (Nanocor, Inc., IL, USA). This clay
had been selected because of its compatibility with epoxy. This clay has particle size of 15 -20
micron. The clay surface was modified with trimethyl octadecyl ammonium chloride (Figure 3.3)
and modifier concentration is 25-30%. In order to allow the dispersion of clay in an organic
medium, a surface modification was required to make it organophilic. I.28 clay has been chosen
for the longer chain of modifier salt. Longer chain of the modifier helps better dispersion and
higher mechanical strength of the nanocomposites than the clay modified with shorter chain. [88]
34

Figure 3.3: Structure of nanoclay (left) and modifier (right)
3.2. SCALING UP OF VARTM PROCESS The following section discusses in detail the changes made in order to achieve scale up of
VARTM process.
Vacuum Degassing
Mixing of the resin and hardener cause air bubbles while mixing that get trapped in the
resin. These air bubbles are the main reason for formation of micro - voids because these air
bubbles stay in the resin, even after catalysis of resin and travel through the fabric during
infusion and contribute to an increase in void volume fraction.
Vacuum degassing set-up can address the arrest of these pre existing air bubbles in the
resin pot after mixing of resin and hardener. The vacuum degassing set - up consists of a vacuum
chamber in which the pre - mixed resin pot is placed. Vacuum is drawn into the chamber and
therefore the air bubbles rise up to the top of the resin pot and get collected there. After a while
there is reduction in the air bubbles. Literature suggests that the process of vacuum degassing
creates micro bubbles, which are not seen by naked eye and there is always scope for
improvement in degassing, such as addition of nucleation agent [89-90].
However in this study, for scaled up VARTM process, it was intended to retain (or rather
incorporate, if possible) micro - voids in the resultant composite. This is because of the unique
research objective in the study to develop carpet composites with better acoustic properties.
Literature suggests that in energy absorption testing, composite made out of higher void content
out-performed a composite made of the same materials and a void content of less than 1% [91].
35

This indicates that the design of the composite structure should be made keeping in mind the
product application intended for the composite. In this study, it was advantageous to have
composite samples with higher void content for their use as highway noise barriers in terms of
their superior acoustic characteristics.
Large and Complex structures
In the conventional VARTM setup for fabrication of large-scale composites, there is
structural instability in the final part for composites of the size dimensions 1.22 m x 0.61 m (4 ft.
x 2 ft.) and greater sizes. This is because the vacuum bag side is not smooth, which leads to
structural instability due to thickness variation throughout the part [86]. Therefore it is quite
often a problem to fabricate large scale composite by the conventional VARTM process. This
problem could also occur due to inability of the vacuum end in achieving greater compaction of
stacked up carpet layers.
This problem was arrested in the scaled up VARTM process where a caul plate could
ensure smoothness of surface on the vacuum bag side and thereby possibly minimizes the
thickness variation throughout the part. Hence it was observed that it is advantageous to use
scaled up VARTM process for fabrication of large-scale composite panels.
For instance multiple inlet ports can be used for fabrication of large-scale composites of
the order of size 0.61 m x 1.22 m (2 ft. x 4 ft.) and greater sizes. This has been shown in the
following Fig. 3.4 where multiple inlet ports were used for fabrication of large composites
because the resin covers a larger area quickly.
Figure 3.4 A picture of VARTM process using multiple resin inlet ports
It was envisaged to demonstrate the feasibility of fabrication of complex structures using
scaled up VARTM process. Therefore fabrication of complex shapes like arch was planned as an
36

experiment. The mold prepared for this sample was an empty round shaped canister with an
external flat base. One of the caul plates was stuck to the canister to form an arch shaped base of
the mold. Carpet layers were stacked in the BTTB configuration. The scaled up VARTM process
was rigorously followed and the mold was sealed with a vacuum bag on the top and a caul plate
below the bag. Essentially there are two caul plates - in the top of the mold to give a shape to the
resulting composite and in the bottom of the mold for aiding in providing an arch shaped base for
mold. The BTTB carpet layer configuration was placed between the caul plates after waxing and
the standard procedure for fabrication of carpet composites by scaled up VARTM process was
followed. During the resin infusion it was observed that the flow of resin is only because of the
vacuum inside the bag and was not influenced by other forces like gravity. Post-infusion, a
curved shape composite was observed as shown in Fig. 3.5 with an arch with inside diameter of
18 cm.
Figure 3.5 Image of a curved composite fabricated by scaled up VARTM process
3.3 COST ECONOMICS A preliminary cost model has been developed by monitoring the VARTM process, which
has been regarded as a cost effective manufacturing method. VARTM provides significant
savings in tooling cost because it requires only a one - piece mold and a vacuum bag is required
to close the mold [63]. The total manufacturing cost (TC) consists of material cost (MC), direct
labor cost (LC), equipment cost (EC) and the overhead cost (OC) as shown in the following
equation 3.2.
𝑇𝑇𝑇𝑇 = 𝑀𝑀𝑇𝑇 + 𝐿𝐿𝑇𝑇 + 𝐸𝐸𝑇𝑇 + 𝑂𝑂𝑇𝑇 (3.1)
37
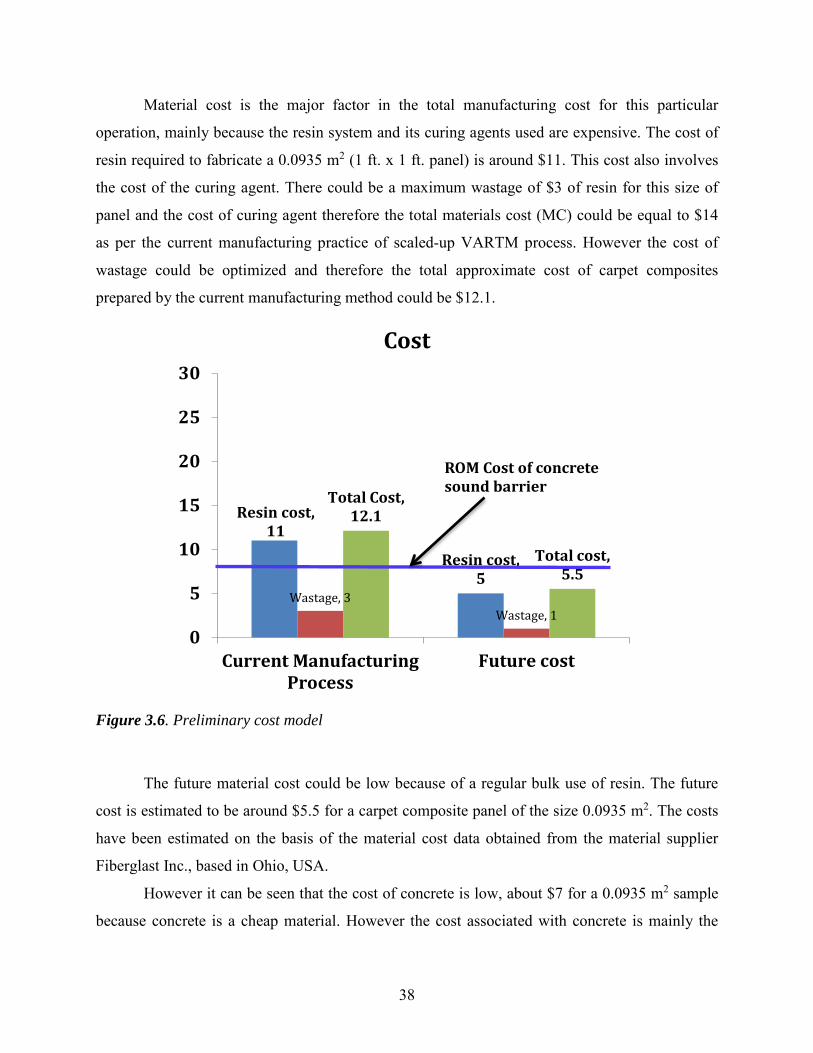
Material cost is the major factor in the total manufacturing cost for this particular
operation, mainly because the resin system and its curing agents used are expensive. The cost of
resin required to fabricate a 0.0935 m2 (1 ft. x 1 ft. panel) is around $11. This cost also involves
the cost of the curing agent. There could be a maximum wastage of $3 of resin for this size of
panel and the cost of curing agent therefore the total materials cost (MC) could be equal to $14
as per the current manufacturing practice of scaled-up VARTM process. However the cost of
wastage could be optimized and therefore the total approximate cost of carpet composites
prepared by the current manufacturing method could be $12.1.
Figure 3.6. Preliminary cost model
The future material cost could be low because of a regular bulk use of resin. The future
cost is estimated to be around $5.5 for a carpet composite panel of the size 0.0935 m2. The costs
have been estimated on the basis of the material cost data obtained from the material supplier
Fiberglast Inc., based in Ohio, USA.
However it can be seen that the cost of concrete is low, about $7 for a 0.0935 m2 sample
because concrete is a cheap material. However the cost associated with concrete is mainly the
Resin cost, 11
Resin cost, 5
Wastage, 3Wastage, 1
Total Cost, 12.1
Total cost, 5.5
0
5
10
15
20
25
30
Current ManufacturingProcess
Future cost
ROM Cost of concrete sound barrier
Cost
38
cost of labor and its transportation. The cost of $7 for a concrete panel is a rough order of
magnitude cost for the concrete panel of size 0.0935 m2.
The cost analysis in this study has been non-conclusive and therefore a judgment cannot
be made on the basis of the data presented above. The material cost data suggested in this section
is preliminary in nature and has been developed on the basis of lab scale experience. It is an
attempt to give a precursor to the detailed cost estimation recommended for this study. A rough
understanding of labor involved could be made due to experience in fabrication of composites in
this study. VARTM method of manufacturing could be cheap but it is highly labor intensive. The
primary labor cost would be the labor involved for 1 worker with 100 % presence for making a
carpet composite panel of size 0.3045 m x 0.3045 m (0.0935 m2). However as the size of the
panel increases to 0.371 m2 (0.609 m x 0.609 m) there will be a need for the presence of another
worker at a 50 % presence factor. This understanding of the requirement of labor at various
presence factors was developed during the fabrication of the carpet composites of different sizes
in the laboratory.
The following table, Table 3.1 enlists the time taken for various process steps in the
scaled up VARTM process for fabrication of carpet composites for a square panel with an area of
0.0935 m2 (0.3045 m x 0.3045 m).
3.4 FABRICATION OF COMPOSITES WITH NANOFILLERS Two types of composites were fabricated for evaluating the effect of nanoclay fillers in
the recycled carpet composites. a) clay coated, and b) clay infused composites.
To fabricate clay coated composite, epoxy resin and clay in the weight ratio of 100:4 clay
were mixed by magnetic stirring for 24 hours at 120°C, and hardener was added in the mixture.
Neat epoxy composite demolded from the vacuum mold was coated with this mixture by a paint
roller (Figure 3.7). After coating, the coated material was pre-cured in room temperature for 24
hours and post- cured at 49°C for 6 hours. For clay infused carpet composites, 4 wt% clay were
dispersed in the epoxy by magnetic stirring for 24 hours at 120 °C, and the clay- epoxy mixture
was infused through the carpet layers by VARTM process. The resin was pre-cured for 24 hours
in room temperature, and then, post-cured at 49°C for 6 hours.
39

TABLE 3.1. TIME TAKEN FOR FABRICATION OF CARPET COMPOSITES USING
SCALED UP VARTM PROCESS
Sr.
No.
Process Steps Time (min.)
1 Mold Preparation 15 min
2 Cut materials (Carpet, Vacuum bag, breather
cloth, resin resin distribution media, peel ply,
release film and visually inspect each of these
sheets)
45 min
3 Installation (stacking the carpet layers and
adding clay films on its top), connection of
vacuum pump to resin trap, cut inlet and outlet
helix tubes and connecting outlet pipes to the
resin trap.
20 min
4 Seal the vacuum bag and vacuum the system 40 min
5 Resin Preparation 15 min
6 Resin injection Depends on resin
(Generally less than 10
min)
7 Resin Cure 420 min
8 Part removal after resin cure 15 min
9 Cleaning 20 min
10 Cutting and Machining of the composite 15 min
40
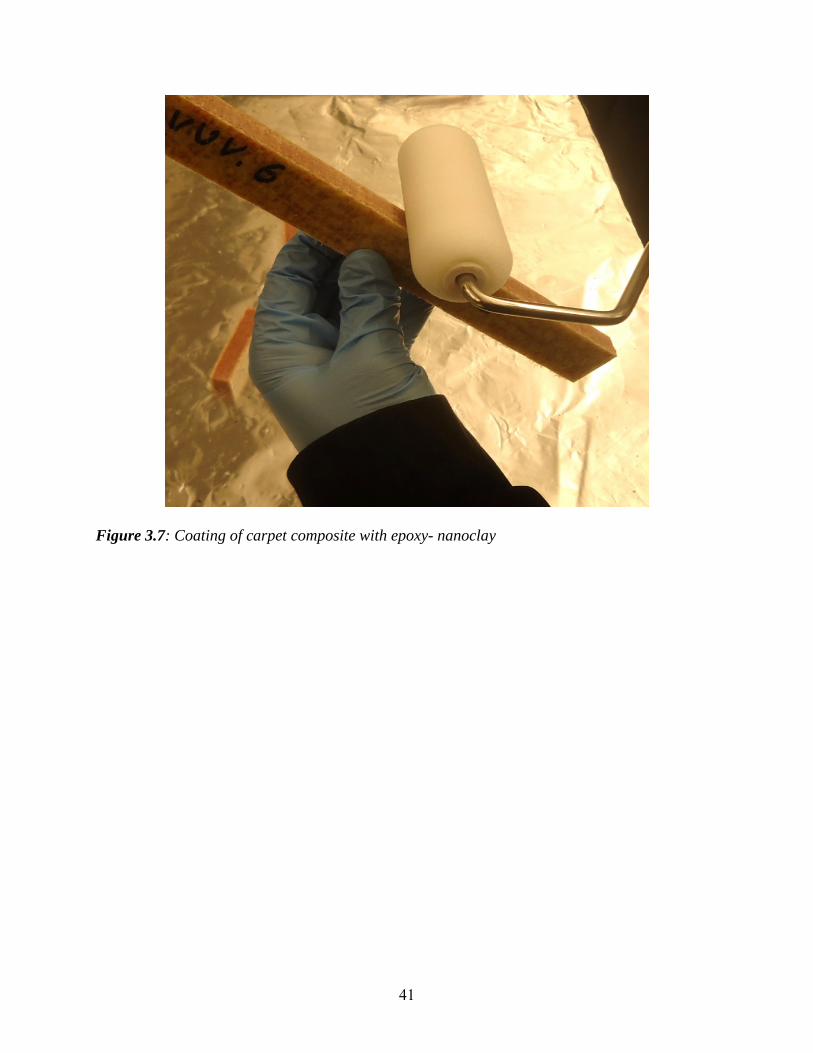
Figure 3.7: Coating of carpet composite with epoxy- nanoclay
41
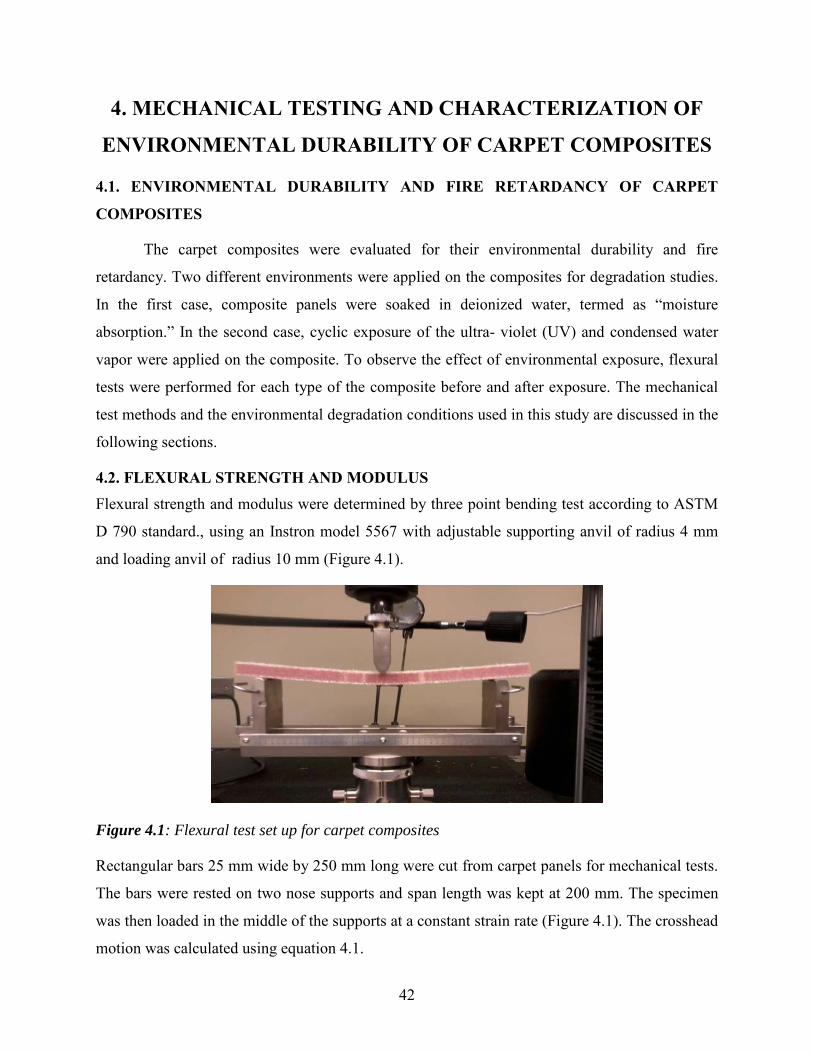
4. MECHANICAL TESTING AND CHARACTERIZATION OF
ENVIRONMENTAL DURABILITY OF CARPET COMPOSITES
4.1. ENVIRONMENTAL DURABILITY AND FIRE RETARDANCY OF CARPET
COMPOSITES
The carpet composites were evaluated for their environmental durability and fire
retardancy. Two different environments were applied on the composites for degradation studies.
In the first case, composite panels were soaked in deionized water, termed as “moisture
absorption.” In the second case, cyclic exposure of the ultra- violet (UV) and condensed water
vapor were applied on the composite. To observe the effect of environmental exposure, flexural
tests were performed for each type of the composite before and after exposure. The mechanical
test methods and the environmental degradation conditions used in this study are discussed in the
following sections.
4.2. FLEXURAL STRENGTH AND MODULUS Flexural strength and modulus were determined by three point bending test according to ASTM
D 790 standard., using an Instron model 5567 with adjustable supporting anvil of radius 4 mm
and loading anvil of radius 10 mm (Figure 4.1).
Figure 4.1: Flexural test set up for carpet composites
Rectangular bars 25 mm wide by 250 mm long were cut from carpet panels for mechanical tests.
The bars were rested on two nose supports and span length was kept at 200 mm. The specimen
was then loaded in the middle of the supports at a constant strain rate (Figure 4.1). The crosshead
motion was calculated using equation 4.1.
42
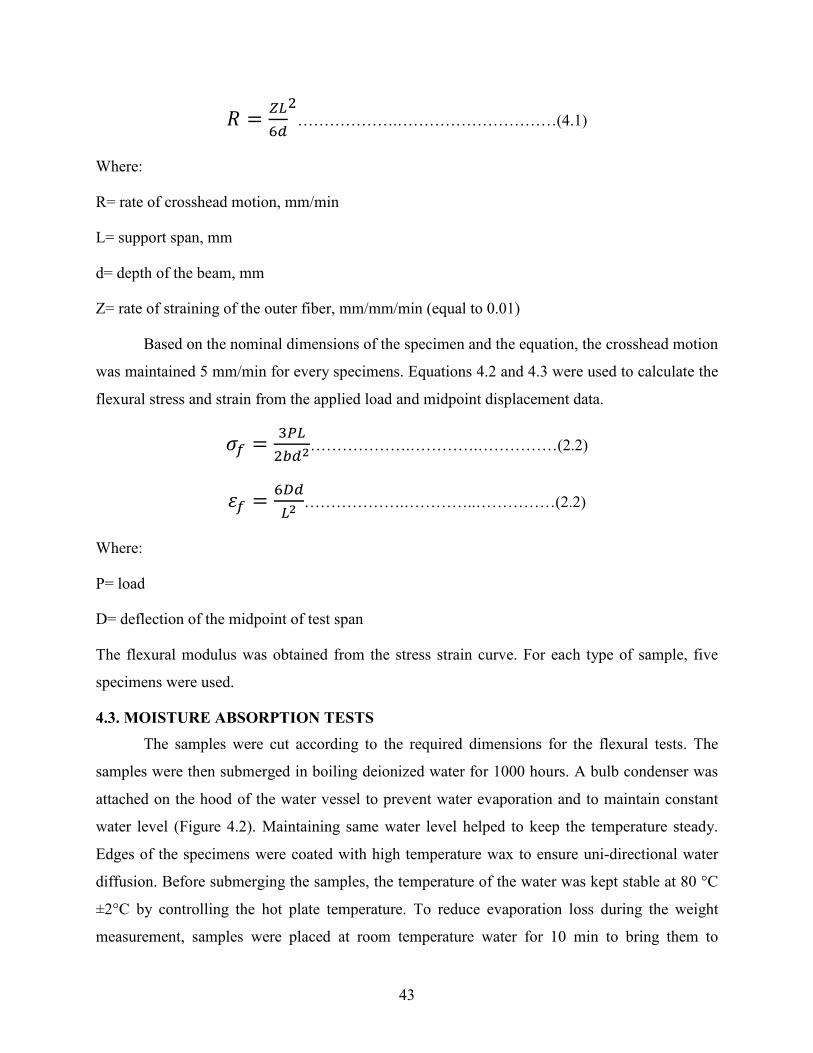
𝑅𝑅 = 𝑍𝑍𝑍𝑍6𝑑𝑑
2……………….…………………………(4.1)
Where:
R= rate of crosshead motion, mm/min
L= support span, mm
d= depth of the beam, mm
Z= rate of straining of the outer fiber, mm/mm/min (equal to 0.01)
Based on the nominal dimensions of the specimen and the equation, the crosshead motion
was maintained 5 mm/min for every specimens. Equations 4.2 and 4.3 were used to calculate the
flexural stress and strain from the applied load and midpoint displacement data.
𝜎𝜎𝑓𝑓 = 3𝑃𝑃𝑍𝑍2𝑏𝑏𝑑𝑑2
……………….………….……………(2.2)
𝜀𝜀𝑓𝑓 = 6𝐷𝐷𝑑𝑑𝑍𝑍2
……………….…………..……………(2.2)
Where:
P= load
D= deflection of the midpoint of test span
The flexural modulus was obtained from the stress strain curve. For each type of sample, five
specimens were used.
4.3. MOISTURE ABSORPTION TESTS The samples were cut according to the required dimensions for the flexural tests. The
samples were then submerged in boiling deionized water for 1000 hours. A bulb condenser was
attached on the hood of the water vessel to prevent water evaporation and to maintain constant
water level (Figure 4.2). Maintaining same water level helped to keep the temperature steady.
Edges of the specimens were coated with high temperature wax to ensure uni-directional water
diffusion. Before submerging the samples, the temperature of the water was kept stable at 80 °C
±2°C by controlling the hot plate temperature. To reduce evaporation loss during the weight
measurement, samples were placed at room temperature water for 10 min to bring them to
43
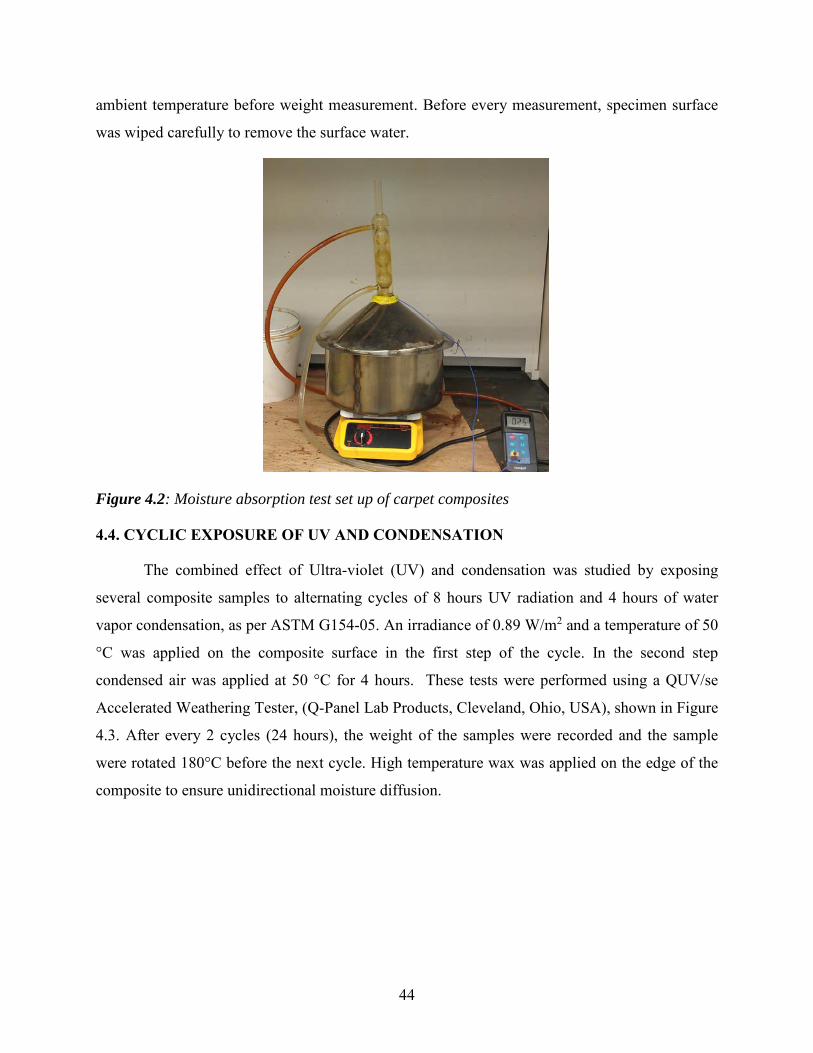
ambient temperature before weight measurement. Before every measurement, specimen surface
was wiped carefully to remove the surface water.
Figure 4.2: Moisture absorption test set up of carpet composites
4.4. CYCLIC EXPOSURE OF UV AND CONDENSATION
The combined effect of Ultra-violet (UV) and condensation was studied by exposing
several composite samples to alternating cycles of 8 hours UV radiation and 4 hours of water
vapor condensation, as per ASTM G154-05. An irradiance of 0.89 W/m2 and a temperature of 50
°C was applied on the composite surface in the first step of the cycle. In the second step
condensed air was applied at 50 °C for 4 hours. These tests were performed using a QUV/se
Accelerated Weathering Tester, (Q-Panel Lab Products, Cleveland, Ohio, USA), shown in Figure
4.3. After every 2 cycles (24 hours), the weight of the samples were recorded and the sample
were rotated 180°C before the next cycle. High temperature wax was applied on the edge of the
composite to ensure unidirectional moisture diffusion.
44

Figure 4.3: Test chamber used for alternating exposure of UV and condensation
4.5. FIRE RETARDANCY TESTS The flammability resistance of different types of composite was determined according to
ASTM D 635-10. In this set up, a composite bar of 125 ± 5 mm length was placed horizontally,
and the free end of the samples were exposed to a standard test flame for 30 s and then flame was
removed, as shown in Figure 4.4. The time of flame propagation in between two-fixed position
of the composite bar with 75± 1mm distance was recorded. From the recorded time flame
propagation rate was measured in mm/min unit. An average of 11 samples were tested for each
type of composite.
Figure 4.4: Test setup for determining flame propagation rate
45
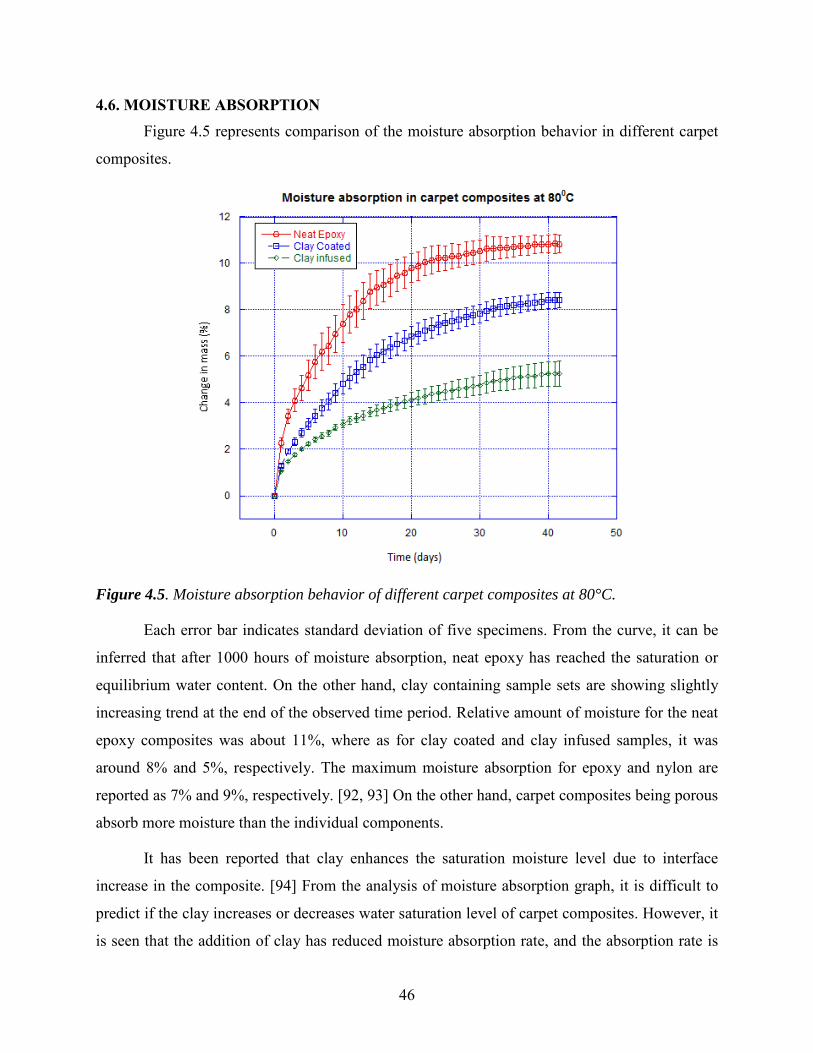
4.6. MOISTURE ABSORPTION Figure 4.5 represents comparison of the moisture absorption behavior in different carpet
composites.
Figure 4.5. Moisture absorption behavior of different carpet composites at 80°C.
Each error bar indicates standard deviation of five specimens. From the curve, it can be
inferred that after 1000 hours of moisture absorption, neat epoxy has reached the saturation or
equilibrium water content. On the other hand, clay containing sample sets are showing slightly
increasing trend at the end of the observed time period. Relative amount of moisture for the neat
epoxy composites was about 11%, where as for clay coated and clay infused samples, it was
around 8% and 5%, respectively. The maximum moisture absorption for epoxy and nylon are
reported as 7% and 9%, respectively. [92, 93] On the other hand, carpet composites being porous
absorb more moisture than the individual components.
It has been reported that clay enhances the saturation moisture level due to interface
increase in the composite. [94] From the analysis of moisture absorption graph, it is difficult to
predict if the clay increases or decreases water saturation level of carpet composites. However, it
is seen that the addition of clay has reduced moisture absorption rate, and the absorption rate is
46
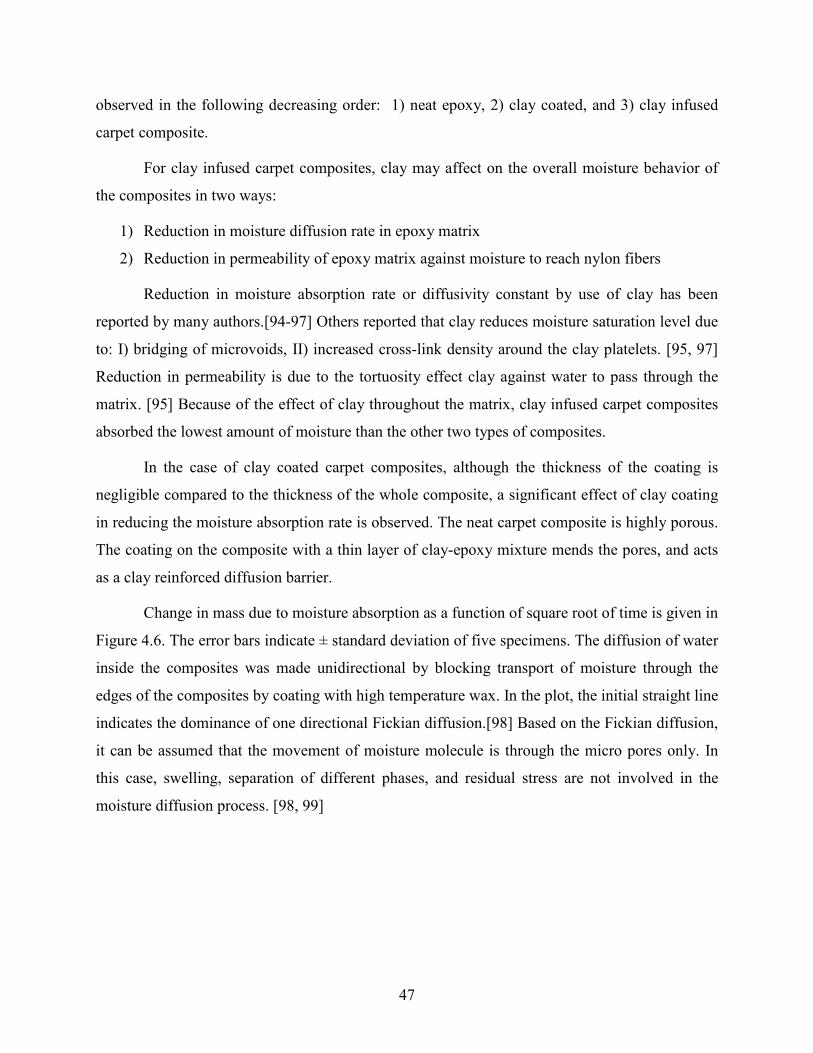
observed in the following decreasing order: 1) neat epoxy, 2) clay coated, and 3) clay infused
carpet composite.
For clay infused carpet composites, clay may affect on the overall moisture behavior of
the composites in two ways:
1) Reduction in moisture diffusion rate in epoxy matrix
2) Reduction in permeability of epoxy matrix against moisture to reach nylon fibers
Reduction in moisture absorption rate or diffusivity constant by use of clay has been
reported by many authors.[94-97] Others reported that clay reduces moisture saturation level due
to: I) bridging of microvoids, II) increased cross-link density around the clay platelets. [95, 97]
Reduction in permeability is due to the tortuosity effect clay against water to pass through the
matrix. [95] Because of the effect of clay throughout the matrix, clay infused carpet composites
absorbed the lowest amount of moisture than the other two types of composites.
In the case of clay coated carpet composites, although the thickness of the coating is
negligible compared to the thickness of the whole composite, a significant effect of clay coating
in reducing the moisture absorption rate is observed. The neat carpet composite is highly porous.
The coating on the composite with a thin layer of clay-epoxy mixture mends the pores, and acts
as a clay reinforced diffusion barrier.
Change in mass due to moisture absorption as a function of square root of time is given in
Figure 4.6. The error bars indicate ± standard deviation of five specimens. The diffusion of water
inside the composites was made unidirectional by blocking transport of moisture through the
edges of the composites by coating with high temperature wax. In the plot, the initial straight line
indicates the dominance of one directional Fickian diffusion.[98] Based on the Fickian diffusion,
it can be assumed that the movement of moisture molecule is through the micro pores only. In
this case, swelling, separation of different phases, and residual stress are not involved in the
moisture diffusion process. [98, 99]
47
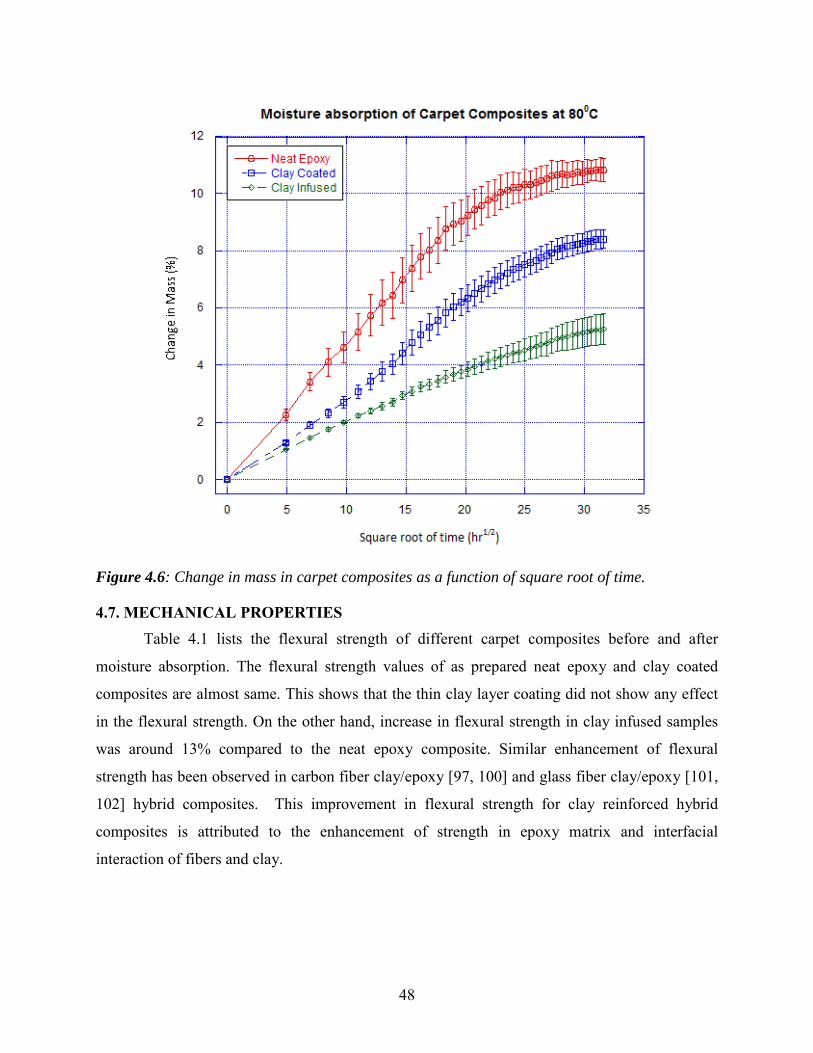
Figure 4.6: Change in mass in carpet composites as a function of square root of time.
4.7. MECHANICAL PROPERTIES Table 4.1 lists the flexural strength of different carpet composites before and after
moisture absorption. The flexural strength values of as prepared neat epoxy and clay coated
composites are almost same. This shows that the thin clay layer coating did not show any effect
in the flexural strength. On the other hand, increase in flexural strength in clay infused samples
was around 13% compared to the neat epoxy composite. Similar enhancement of flexural
strength has been observed in carbon fiber clay/epoxy [97, 100] and glass fiber clay/epoxy [101,
102] hybrid composites. This improvement in flexural strength for clay reinforced hybrid
composites is attributed to the enhancement of strength in epoxy matrix and interfacial
interaction of fibers and clay.
48
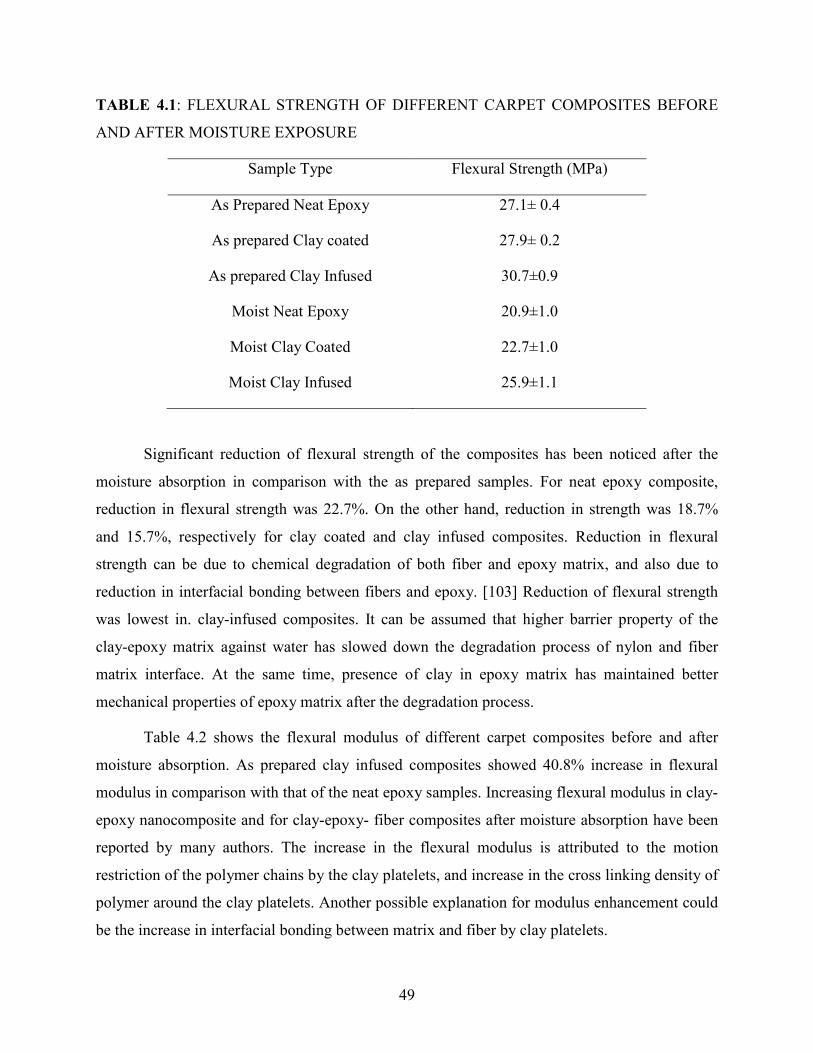
TABLE 4.1: FLEXURAL STRENGTH OF DIFFERENT CARPET COMPOSITES BEFORE
AND AFTER MOISTURE EXPOSURE
Sample Type Flexural Strength (MPa)
As Prepared Neat Epoxy 27.1± 0.4
As prepared Clay coated 27.9± 0.2
As prepared Clay Infused 30.7±0.9
Moist Neat Epoxy 20.9±1.0
Moist Clay Coated 22.7±1.0
Moist Clay Infused 25.9±1.1
Significant reduction of flexural strength of the composites has been noticed after the
moisture absorption in comparison with the as prepared samples. For neat epoxy composite,
reduction in flexural strength was 22.7%. On the other hand, reduction in strength was 18.7%
and 15.7%, respectively for clay coated and clay infused composites. Reduction in flexural
strength can be due to chemical degradation of both fiber and epoxy matrix, and also due to
reduction in interfacial bonding between fibers and epoxy. [103] Reduction of flexural strength
was lowest in. clay-infused composites. It can be assumed that higher barrier property of the
clay-epoxy matrix against water has slowed down the degradation process of nylon and fiber
matrix interface. At the same time, presence of clay in epoxy matrix has maintained better
mechanical properties of epoxy matrix after the degradation process.
Table 4.2 shows the flexural modulus of different carpet composites before and after
moisture absorption. As prepared clay infused composites showed 40.8% increase in flexural
modulus in comparison with that of the neat epoxy samples. Increasing flexural modulus in clay-
epoxy nanocomposite and for clay-epoxy- fiber composites after moisture absorption have been
reported by many authors. The increase in the flexural modulus is attributed to the motion
restriction of the polymer chains by the clay platelets, and increase in the cross linking density of
polymer around the clay platelets. Another possible explanation for modulus enhancement could
be the increase in interfacial bonding between matrix and fiber by clay platelets.
49

TABLE 4.2: FLEXURAL MODULUS OF CARPET COMPOSITES BEFORE AND AFTER
MOISTURE ABSORPTION
Sample Type Flexural Modulus (MPa)
As prepared Neat epoxy 1842± 97
As prepared Clay coated 1878± 75
As prepared Clay infused 2594± 64
Moist Neat Epoxy 898± 45
Moist Clay Coated 1107± 44
Moist Clay Infused 1393± 167
Reduction in elastic modulus due to moisture absorption is observed (Table 4.2) in carpet
composites. Reduction in modulus is directly related to scission of polymer chain. [102] For neat
epoxy carper composites, reduction was 51.2%, while it was 41.1% and 46.32%, respectively for
clay coated and clay infused composites. The improvement in modulus for moisture absorbed
clay composites compared to neat composites is attributed to the less scission of polymer chains
as a result of low moisture diffusion due to the presence of clay platelets.
4.8. CYCLIC EXPOSURE OF UV AND CONDENSATION Variation in mass in neat and clay carpet composites due to the cyclic exposure to Ultra
Violet (UV) and condensation is shown in Figure 4.7. It is observed that during 1000 hours
alternative exposure, neat epoxy composites gained more weight than clay composites. Among
the clay composites, clay infused composites showed more weight change than clay-coated
composites. The reason is attributed to the number of voids present on the surface of composites.
The neat composites gained more weight because of the presence of numerous voids. These
voids are minimum for clay-coated composites as a result of thin coating of clay- epoxy on the
composites’ surface. The voids are not closed for infused carpet composite, but the weight gain
is lower than neat composite because moisture diffusion is hindered due to tortuosity by clay
platelets. No erosion or decrease of weight has been noticed during exposure of 1000 hours.
50
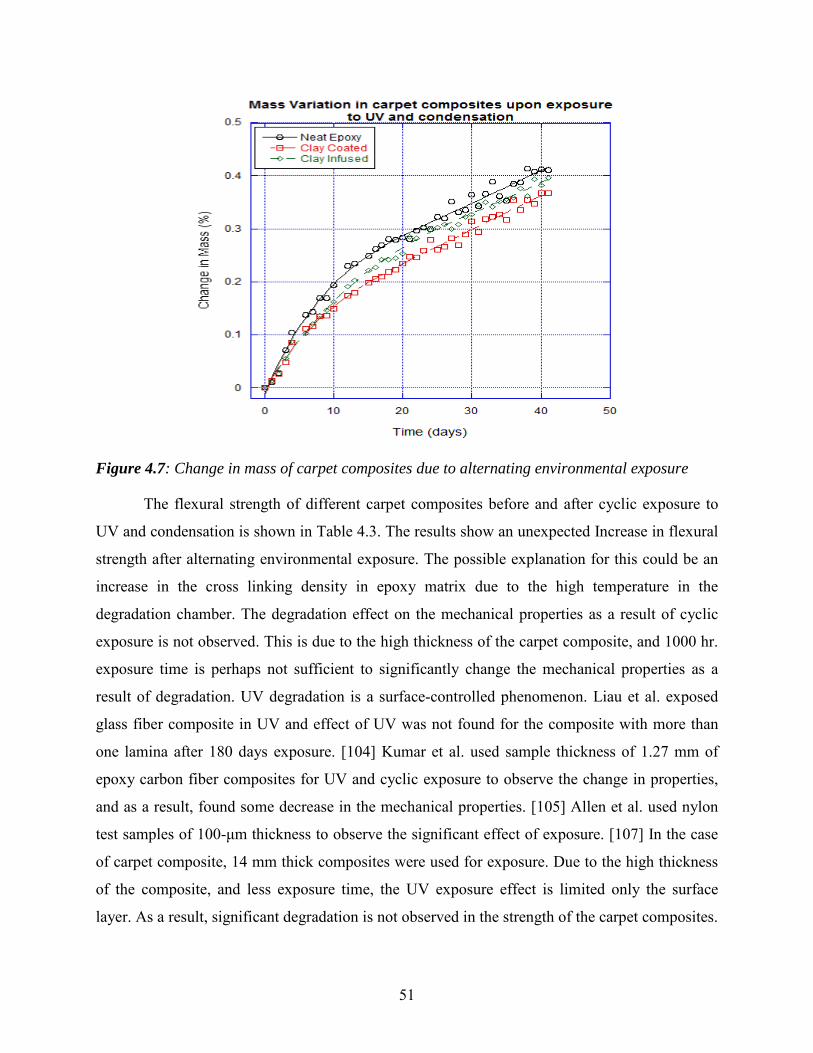
Figure 4.7: Change in mass of carpet composites due to alternating environmental exposure
The flexural strength of different carpet composites before and after cyclic exposure to
UV and condensation is shown in Table 4.3. The results show an unexpected Increase in flexural
strength after alternating environmental exposure. The possible explanation for this could be an
increase in the cross linking density in epoxy matrix due to the high temperature in the
degradation chamber. The degradation effect on the mechanical properties as a result of cyclic
exposure is not observed. This is due to the high thickness of the carpet composite, and 1000 hr.
exposure time is perhaps not sufficient to significantly change the mechanical properties as a
result of degradation. UV degradation is a surface-controlled phenomenon. Liau et al. exposed
glass fiber composite in UV and effect of UV was not found for the composite with more than
one lamina after 180 days exposure. [104] Kumar et al. used sample thickness of 1.27 mm of
epoxy carbon fiber composites for UV and cyclic exposure to observe the change in properties,
and as a result, found some decrease in the mechanical properties. [105] Allen et al. used nylon
test samples of 100-μm thickness to observe the significant effect of exposure. [107] In the case
of carpet composite, 14 mm thick composites were used for exposure. Due to the high thickness
of the composite, and less exposure time, the UV exposure effect is limited only the surface
layer. As a result, significant degradation is not observed in the strength of the carpet composites.
51
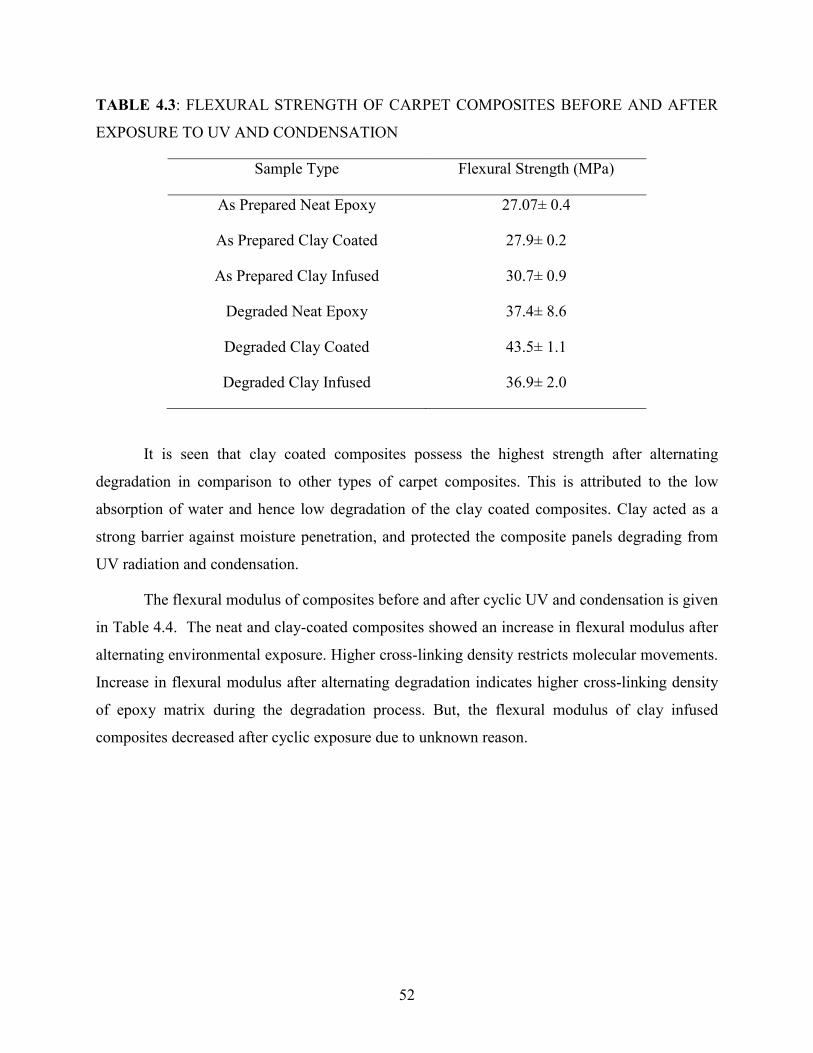
TABLE 4.3: FLEXURAL STRENGTH OF CARPET COMPOSITES BEFORE AND AFTER
EXPOSURE TO UV AND CONDENSATION
Sample Type Flexural Strength (MPa)
As Prepared Neat Epoxy 27.07± 0.4
As Prepared Clay Coated 27.9± 0.2
As Prepared Clay Infused 30.7± 0.9
Degraded Neat Epoxy 37.4± 8.6
Degraded Clay Coated 43.5± 1.1
Degraded Clay Infused 36.9± 2.0
It is seen that clay coated composites possess the highest strength after alternating
degradation in comparison to other types of carpet composites. This is attributed to the low
absorption of water and hence low degradation of the clay coated composites. Clay acted as a
strong barrier against moisture penetration, and protected the composite panels degrading from
UV radiation and condensation.
The flexural modulus of composites before and after cyclic UV and condensation is given
in Table 4.4. The neat and clay-coated composites showed an increase in flexural modulus after
alternating environmental exposure. Higher cross-linking density restricts molecular movements.
Increase in flexural modulus after alternating degradation indicates higher cross-linking density
of epoxy matrix during the degradation process. But, the flexural modulus of clay infused
composites decreased after cyclic exposure due to unknown reason.
52

TABLE 4.4: FLEXURAL MODULUS OF CARPET COMPOSITES BEFORE AND AFTER
EXPOSURE TO UV AND CONDENSATION
Sample Type Flexural Modulus (MPa)
As Prepared Neat Epoxy 1842± 97
As Prepared Clay Coated 1878± 75
As Prepared Clay Infused 2594± 64
Degraded Neat Epoxy 2032± 214
Degraded Clay Coated 2183± 41
Degraded Clay Infused 2173± 40
4.9. FIRE TEST Figure 4.8 shows the comparison of the linear flame propagation rate for different carpet
composites. The error bar shows ± standard deviation of eleven specimens. 20% and 34%
reduction in the average linear burning rate for clay-coated and clay infused samples,
respectively are observed when compared to neat composites.
Clay coated samples have clay only on the surface and it can be assumed that clay-epoxy
coating delayed the ignition time to initiate the flame propagation. The formation of initial flame
is important in flame propagation in absence of any other external heat source. Delayed ignition
time can be attributed to the thermal stability enhancement of epoxy/ clay coating composites.
[71] Among all the prepared composites, lowest flame propagation rate is observed in clay
infused composite. This indicates that the presence of clay platelets throughout the matrix in the
clay infused composite reduces the flame propagation in the bulk sample. The result is in
accordance with the reported observation of reduction in flammability of clay-polymer compared
to neat polymer. [53] Nano particles, like clay, when present in the polymer matrix help in
forming network like structure against decomposed flammable product and hinder the burning
process.
53
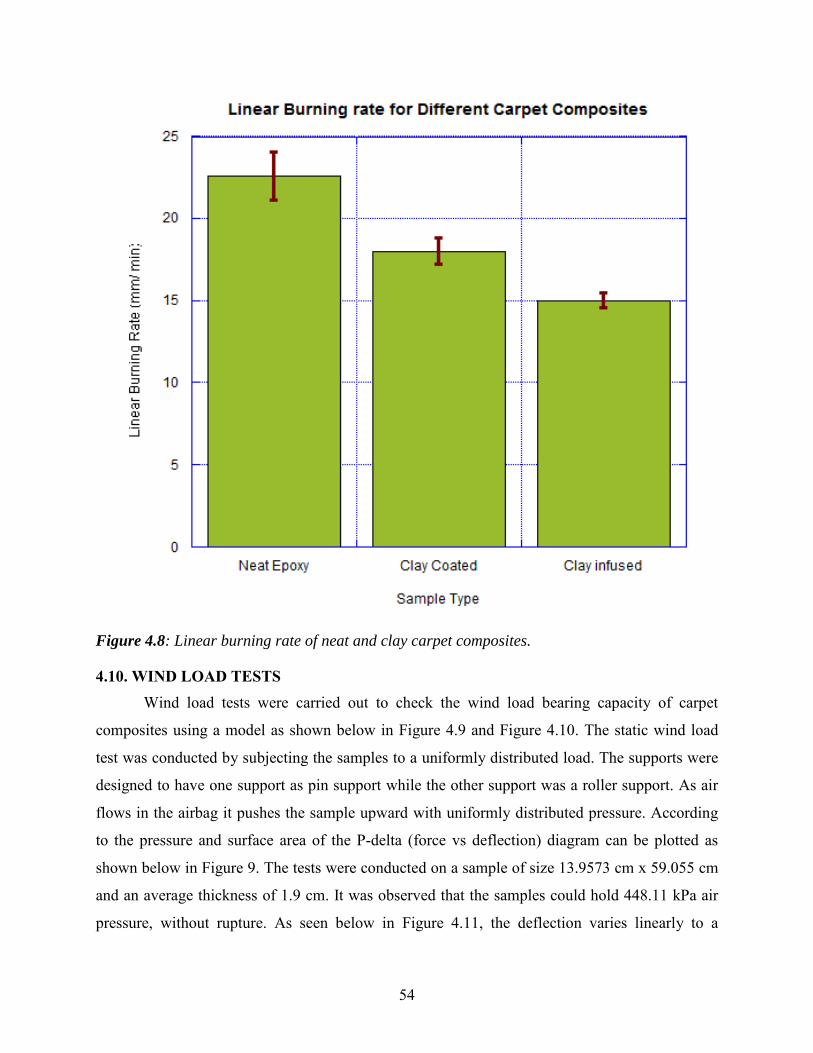
Figure 4.8: Linear burning rate of neat and clay carpet composites.
4.10. WIND LOAD TESTS Wind load tests were carried out to check the wind load bearing capacity of carpet
composites using a model as shown below in Figure 4.9 and Figure 4.10. The static wind load
test was conducted by subjecting the samples to a uniformly distributed load. The supports were
designed to have one support as pin support while the other support was a roller support. As air
flows in the airbag it pushes the sample upward with uniformly distributed pressure. According
to the pressure and surface area of the P-delta (force vs deflection) diagram can be plotted as
shown below in Figure 9. The tests were conducted on a sample of size 13.9573 cm x 59.055 cm
and an average thickness of 1.9 cm. It was observed that the samples could hold 448.11 kPa air
pressure, without rupture. As seen below in Figure 4.11, the deflection varies linearly to a
54

pressure of 150 kPa, at this point the material cracks and is exposed to the carpet fibers inside the
composite. However the wind load on encountering the perfect fiber matrix combination at 150
kPa cannot break the composite at this pressure. The airbag pressure of 448.11 kPa is required to
break the carpet composite, thereby indicating its superior strength. The carpet composite can
hold a load of 199.45 kg/cm for a deflection of 10 cm as shown in the Load curve plot below in
Figure 4.12.
Figure 4.9. A design model for wind load test
55

Figure 4.10. A picture taken during wind load test
Figure 4.11. Pressure Deflection wind load plot of a BTTB Epoxy carpet composite
56
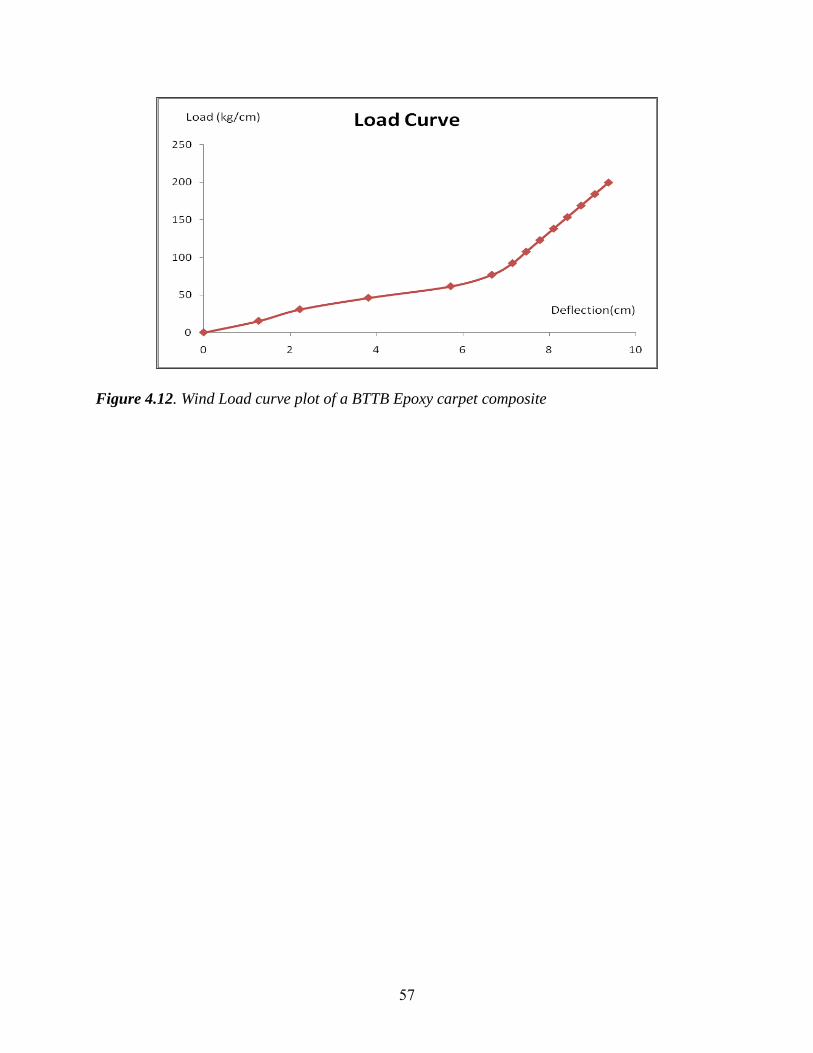
Figure 4.12. Wind Load curve plot of a BTTB Epoxy carpet composite
57
5. ACOUSTIC PROPERTIES OF RECYCLCED CARPET
COMPOSITES
5.1 OBJECTIVE The noise absorption coefficients of carpet composites were measured using the
impedance tube method (ASTM C 384-04) to evaluate their feasibility as highway noise barriers.
5.2 BACKGROUND Sound waves are longitudinal waves which require a medium for travelling, like air or
water, and are measured in cycles per second or Hertz (Hz). The human ear can detect a wide
range of frequencies from 20 to 20,000 Hz, but it is most sensitive to the sounds over a frequency
range of 200 to 5000 Hz. The human ear does not respond in a uniform manner to different
frequency sounds – a sound pressure level of 70 dB is perceived as much louder at 1000 Hz than
at 100 Hz. The absorption of sound results from dissipation of sound energy as heat and this
dissipation mechanism is mainly due to one of two phenomena:
1) Energy loss due to flexural vibrations in the specimen [41].
2) Porosity effects, where the energy is dissipated due to multiple reflections of sound
waves within the voids in the structure [41].
For porous materials like sponge and mineral wool which have interconnected pores the
incoming sound waves are reflected within the pores, causing them to vibrate and therefore
convert sound energy into heat [41]. This is also true in the case of composites as concluded in
the study by Hargrove that, “the mechanism that causes composites to reduce noise has been
shown to be the reverberations of sound waves against the sides of many voids in the composite.
This causes a transformation of acoustic to heat energy” [109]. The nature of composites is a
multitude of minute voids in the material. Sound waves reverberate from wall to wall of these
voids and are attenuated by the conversion of a large amount of noise to a relatively small
amount of heat [91]. Also for a completely porous material, sound is lost isothermally near the
walls of the voids and to a lesser extent in or near the center of the hollow spaces [109].
For homogeneous and isotropic materials, acoustic performance is defined by a set of five
experimentally determined constants: noise absorption coefficient (NAC), pressure reflection
58
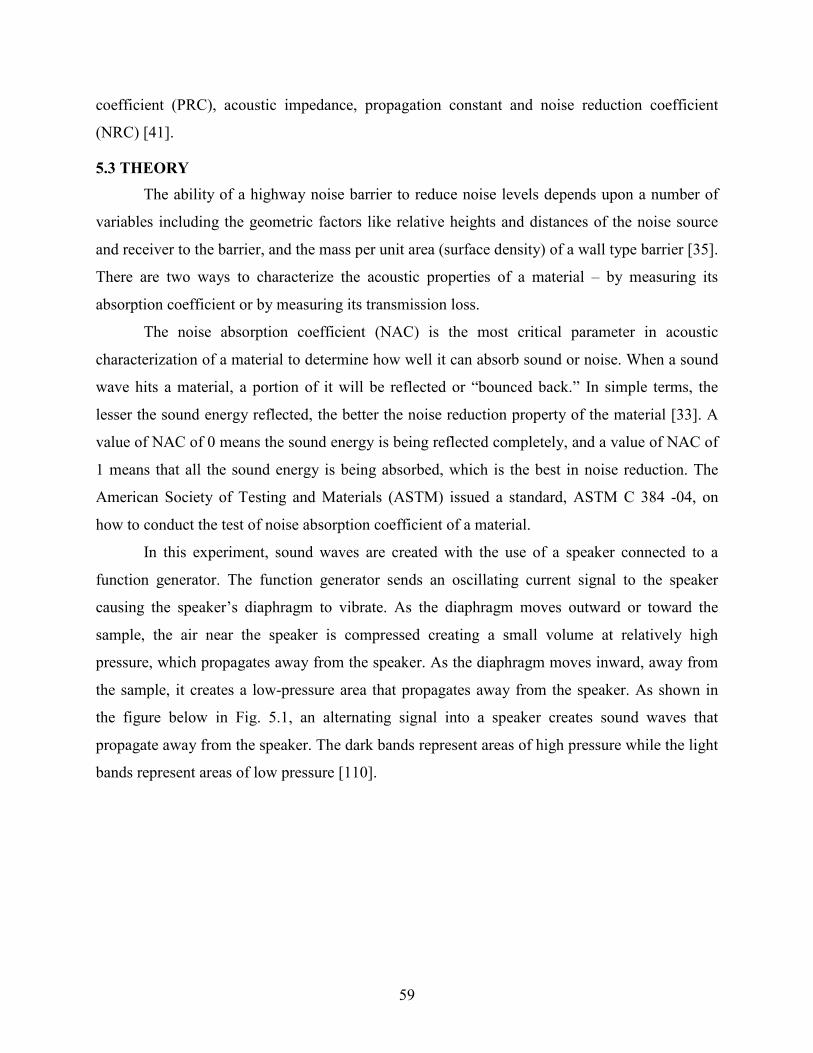
coefficient (PRC), acoustic impedance, propagation constant and noise reduction coefficient
(NRC) [41].
5.3 THEORY The ability of a highway noise barrier to reduce noise levels depends upon a number of
variables including the geometric factors like relative heights and distances of the noise source
and receiver to the barrier, and the mass per unit area (surface density) of a wall type barrier [35].
There are two ways to characterize the acoustic properties of a material – by measuring its
absorption coefficient or by measuring its transmission loss.
The noise absorption coefficient (NAC) is the most critical parameter in acoustic
characterization of a material to determine how well it can absorb sound or noise. When a sound
wave hits a material, a portion of it will be reflected or “bounced back.” In simple terms, the
lesser the sound energy reflected, the better the noise reduction property of the material [33]. A
value of NAC of 0 means the sound energy is being reflected completely, and a value of NAC of
1 means that all the sound energy is being absorbed, which is the best in noise reduction. The
American Society of Testing and Materials (ASTM) issued a standard, ASTM C 384 -04, on
how to conduct the test of noise absorption coefficient of a material.
In this experiment, sound waves are created with the use of a speaker connected to a
function generator. The function generator sends an oscillating current signal to the speaker
causing the speaker’s diaphragm to vibrate. As the diaphragm moves outward or toward the
sample, the air near the speaker is compressed creating a small volume at relatively high
pressure, which propagates away from the speaker. As the diaphragm moves inward, away from
the sample, it creates a low-pressure area that propagates away from the speaker. As shown in
the figure below in Fig. 5.1, an alternating signal into a speaker creates sound waves that
propagate away from the speaker. The dark bands represent areas of high pressure while the light
bands represent areas of low pressure [110].
59
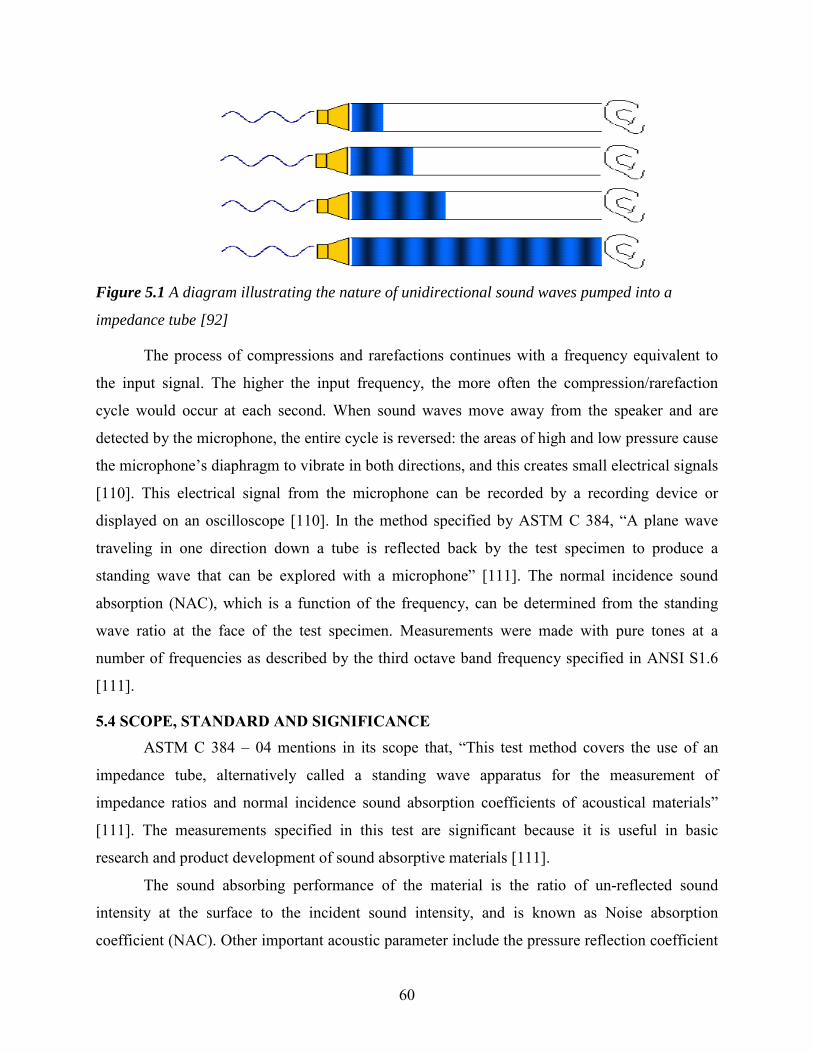
Figure 5.1 A diagram illustrating the nature of unidirectional sound waves pumped into a
impedance tube [92]
The process of compressions and rarefactions continues with a frequency equivalent to
the input signal. The higher the input frequency, the more often the compression/rarefaction
cycle would occur at each second. When sound waves move away from the speaker and are
detected by the microphone, the entire cycle is reversed: the areas of high and low pressure cause
the microphone’s diaphragm to vibrate in both directions, and this creates small electrical signals
[110]. This electrical signal from the microphone can be recorded by a recording device or
displayed on an oscilloscope [110]. In the method specified by ASTM C 384, “A plane wave
traveling in one direction down a tube is reflected back by the test specimen to produce a
standing wave that can be explored with a microphone” [111]. The normal incidence sound
absorption (NAC), which is a function of the frequency, can be determined from the standing
wave ratio at the face of the test specimen. Measurements were made with pure tones at a
number of frequencies as described by the third octave band frequency specified in ANSI S1.6
[111].
5.4 SCOPE, STANDARD AND SIGNIFICANCE ASTM C 384 – 04 mentions in its scope that, “This test method covers the use of an
impedance tube, alternatively called a standing wave apparatus for the measurement of
impedance ratios and normal incidence sound absorption coefficients of acoustical materials”
[111]. The measurements specified in this test are significant because it is useful in basic
research and product development of sound absorptive materials [111].
The sound absorbing performance of the material is the ratio of un-reflected sound
intensity at the surface to the incident sound intensity, and is known as Noise absorption
coefficient (NAC). Other important acoustic parameter include the pressure reflection coefficient
60
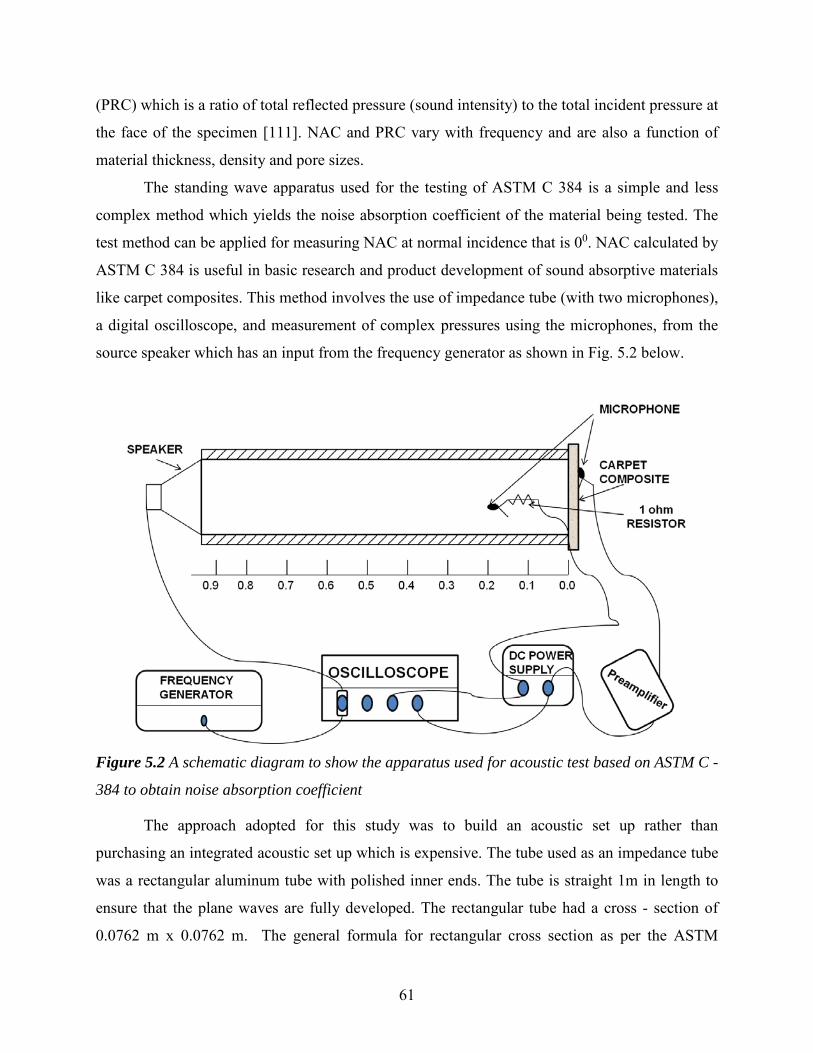
(PRC) which is a ratio of total reflected pressure (sound intensity) to the total incident pressure at
the face of the specimen [111]. NAC and PRC vary with frequency and are also a function of
material thickness, density and pore sizes.
The standing wave apparatus used for the testing of ASTM C 384 is a simple and less
complex method which yields the noise absorption coefficient of the material being tested. The
test method can be applied for measuring NAC at normal incidence that is 00. NAC calculated by
ASTM C 384 is useful in basic research and product development of sound absorptive materials
like carpet composites. This method involves the use of impedance tube (with two microphones),
a digital oscilloscope, and measurement of complex pressures using the microphones, from the
source speaker which has an input from the frequency generator as shown in Fig. 5.2 below.
Figure 5.2 A schematic diagram to show the apparatus used for acoustic test based on ASTM C -
384 to obtain noise absorption coefficient
The approach adopted for this study was to build an acoustic set up rather than
purchasing an integrated acoustic set up which is expensive. The tube used as an impedance tube
was a rectangular aluminum tube with polished inner ends. The tube is straight 1m in length to
ensure that the plane waves are fully developed. The rectangular tube had a cross - section of
0.0762 m x 0.0762 m. The general formula for rectangular cross section as per the ASTM
61
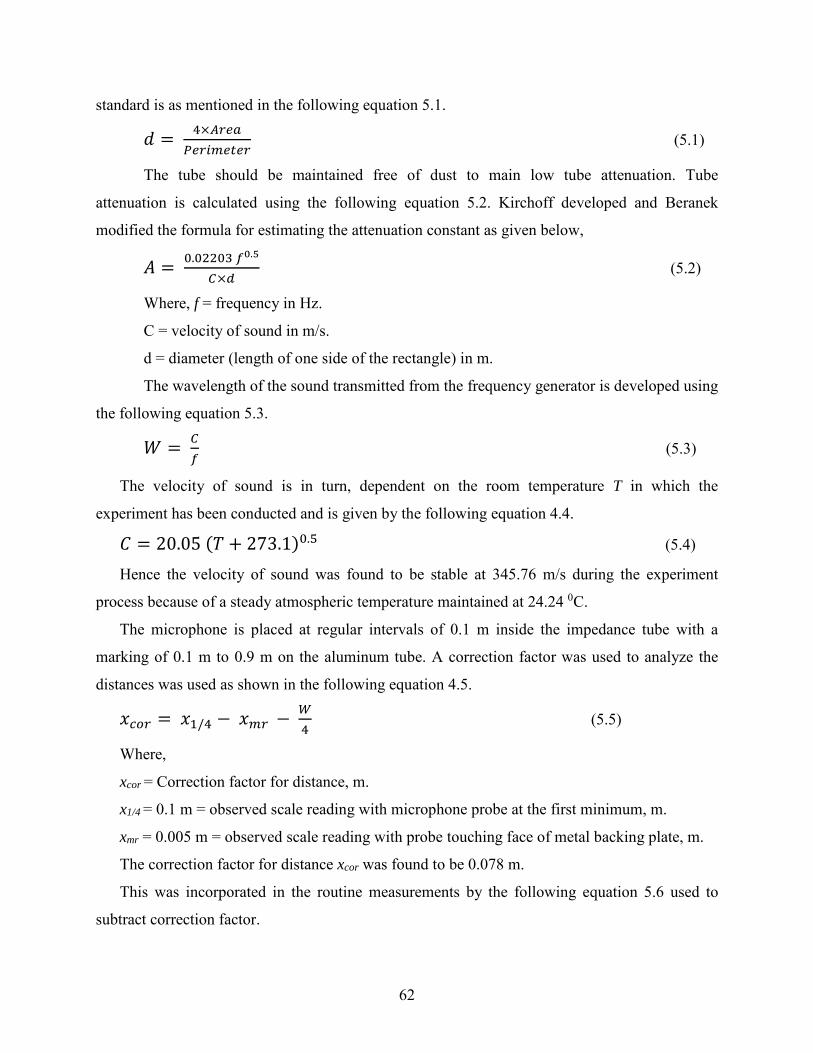
standard is as mentioned in the following equation 5.1.
𝑑𝑑 = 4×𝐴𝐴𝐴𝐴𝐴𝐴𝐴𝐴𝑃𝑃𝐴𝐴𝐴𝐴𝑃𝑃𝑃𝑃𝐴𝐴𝑃𝑃𝐴𝐴𝐴𝐴
(5.1)
The tube should be maintained free of dust to main low tube attenuation. Tube
attenuation is calculated using the following equation 5.2. Kirchoff developed and Beranek
modified the formula for estimating the attenuation constant as given below,
𝐴𝐴 = 0.02203 𝑓𝑓0.5
𝐶𝐶×𝑑𝑑 (5.2)
Where, f = frequency in Hz.
C = velocity of sound in m/s.
d = diameter (length of one side of the rectangle) in m.
The wavelength of the sound transmitted from the frequency generator is developed using
the following equation 5.3.
𝑊𝑊 = 𝐶𝐶𝑓𝑓
(5.3)
The velocity of sound is in turn, dependent on the room temperature T in which the
experiment has been conducted and is given by the following equation 4.4.
𝑇𝑇 = 20.05 (𝑇𝑇 + 273.1)0.5 (5.4)
Hence the velocity of sound was found to be stable at 345.76 m/s during the experiment
process because of a steady atmospheric temperature maintained at 24.24 0C.
The microphone is placed at regular intervals of 0.1 m inside the impedance tube with a
marking of 0.1 m to 0.9 m on the aluminum tube. A correction factor was used to analyze the
distances was used as shown in the following equation 4.5.
𝑥𝑥𝑐𝑐𝑐𝑐𝐴𝐴 = 𝑥𝑥1/4 − 𝑥𝑥𝑃𝑃𝐴𝐴 − 𝑊𝑊4
(5.5)
Where,
xcor = Correction factor for distance, m.
x1/4 = 0.1 m = observed scale reading with microphone probe at the first minimum, m.
xmr = 0.005 m = observed scale reading with probe touching face of metal backing plate, m.
The correction factor for distance xcor was found to be 0.078 m.
This was incorporated in the routine measurements by the following equation 5.6 used to
subtract correction factor.
62
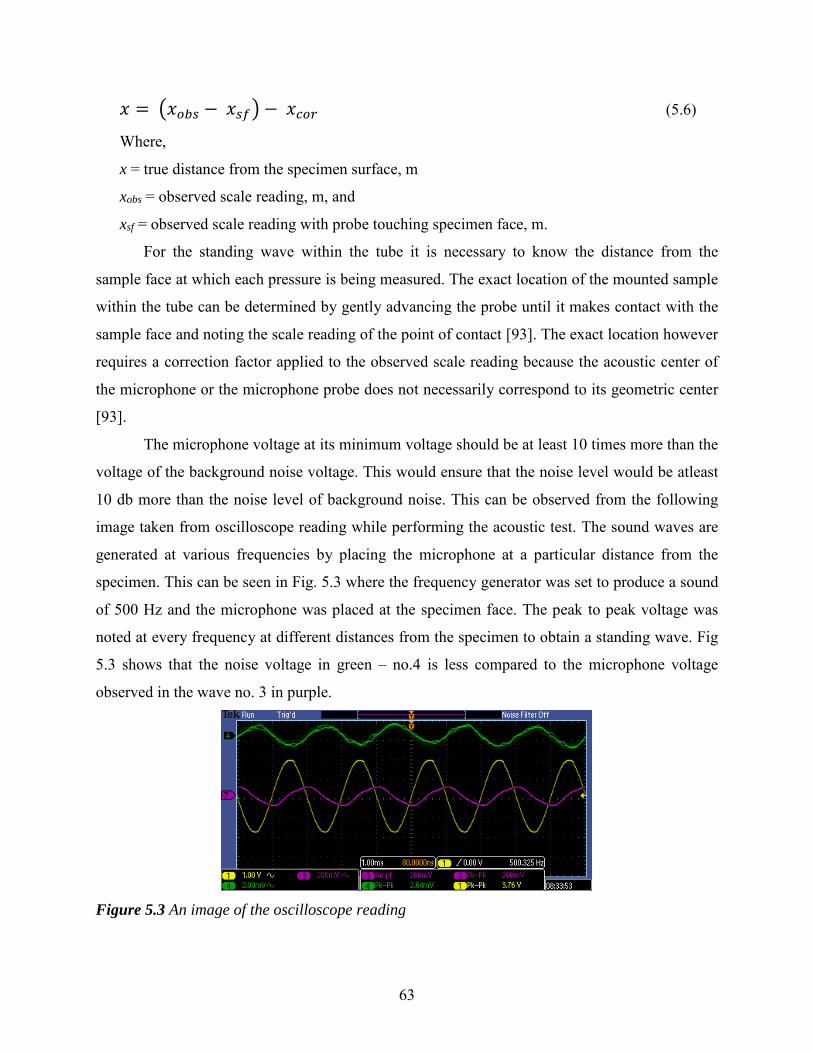
𝑥𝑥 = �𝑥𝑥𝑐𝑐𝑏𝑏𝑜𝑜 − 𝑥𝑥𝑜𝑜𝑓𝑓� − 𝑥𝑥𝑐𝑐𝑐𝑐𝐴𝐴 (5.6)
Where,
x = true distance from the specimen surface, m
xobs = observed scale reading, m, and
xsf = observed scale reading with probe touching specimen face, m.
For the standing wave within the tube it is necessary to know the distance from the
sample face at which each pressure is being measured. The exact location of the mounted sample
within the tube can be determined by gently advancing the probe until it makes contact with the
sample face and noting the scale reading of the point of contact [93]. The exact location however
requires a correction factor applied to the observed scale reading because the acoustic center of
the microphone or the microphone probe does not necessarily correspond to its geometric center
[93].
The microphone voltage at its minimum voltage should be at least 10 times more than the
voltage of the background noise voltage. This would ensure that the noise level would be atleast
10 db more than the noise level of background noise. This can be observed from the following
image taken from oscilloscope reading while performing the acoustic test. The sound waves are
generated at various frequencies by placing the microphone at a particular distance from the
specimen. This can be seen in Fig. 5.3 where the frequency generator was set to produce a sound
of 500 Hz and the microphone was placed at the specimen face. The peak to peak voltage was
noted at every frequency at different distances from the specimen to obtain a standing wave. Fig
5.3 shows that the noise voltage in green – no.4 is less compared to the microphone voltage
observed in the wave no. 3 in purple.
Figure 5.3 An image of the oscilloscope reading
63

The standing wave ratio (SWR) at the specimen face is calculated using the extrapolation
method by measuring the voltages (corresponding pressure levels) at various frequencies and at
various distances.
The standing wave ratio at specimen face is measured using the following three cases -
a) When two or more minima are present in the sine wave obtained
𝑉𝑉𝑃𝑃𝑃𝑃𝑚𝑚 (0) = 𝑉𝑉(𝑥𝑥1) − 𝑥𝑥1 [𝑉𝑉(𝑥𝑥2)− 𝑉𝑉(𝑥𝑥1)]
𝑥𝑥2− 𝑥𝑥1 (5.7)
b) One minimum and one maximum present
In this case the maximum voltage at the sample face Vmax (0). In this case there is only one
minimum and a graphical extrapolation back to the specimen face cannot be used. A valid
approximation can be given by the following equation.
𝑉𝑉𝑃𝑃𝑃𝑃𝑚𝑚 (0) = 𝑉𝑉(𝑥𝑥1) − 𝐴𝐴 × 𝑥𝑥1 × 𝑉𝑉𝑃𝑃𝐴𝐴𝑥𝑥 (0) (5.8)
where, A can be calculated from equation B.2.
c) Only one minimum and no maximum present
When there is no actual maximum measured in the tube, a maximum level can be inferred
from a measurement of the sound pressure level at W/8 distance on either side of the minimum
as per the ASTM C - 384 Standard. The following equation B.9 is suggested in the standard for
this kind of situations.
𝑉𝑉𝑃𝑃𝐴𝐴𝑥𝑥 = �2 × 𝑉𝑉𝑊𝑊/82 − 𝑉𝑉𝑃𝑃𝑃𝑃𝑚𝑚2 �
2 (5.9)
Thus when no maximum and only one minimum can be measured, an additional voltage
measurement at a distance of W/8 from the measured minimum should be taken and used as VW/8
in B.9 to arrive at an estimated Vmax value.
Hence using any of the above three conditions the values can be substituted to calculate
SWR (0) at the specimen face.
The impedance tube is used to generate a standing wave in the tube which is enclosed
with a speaker at one end and a specimen on the other end. The interference of an incident wave
and reflected wave from the specimen creates a standing wave in the impedance tube, which is
measured as standing wave ratio (SWR). SWR is a function of the distance between the speaker
and the microphone (x), and is given as,
𝑆𝑆𝑊𝑊𝑅𝑅 (𝑥𝑥) = 𝑉𝑉𝑚𝑚𝑚𝑚𝑚𝑚(𝑥𝑥)𝑉𝑉𝑚𝑚𝑚𝑚𝑚𝑚(𝑥𝑥)
(5.10)
64
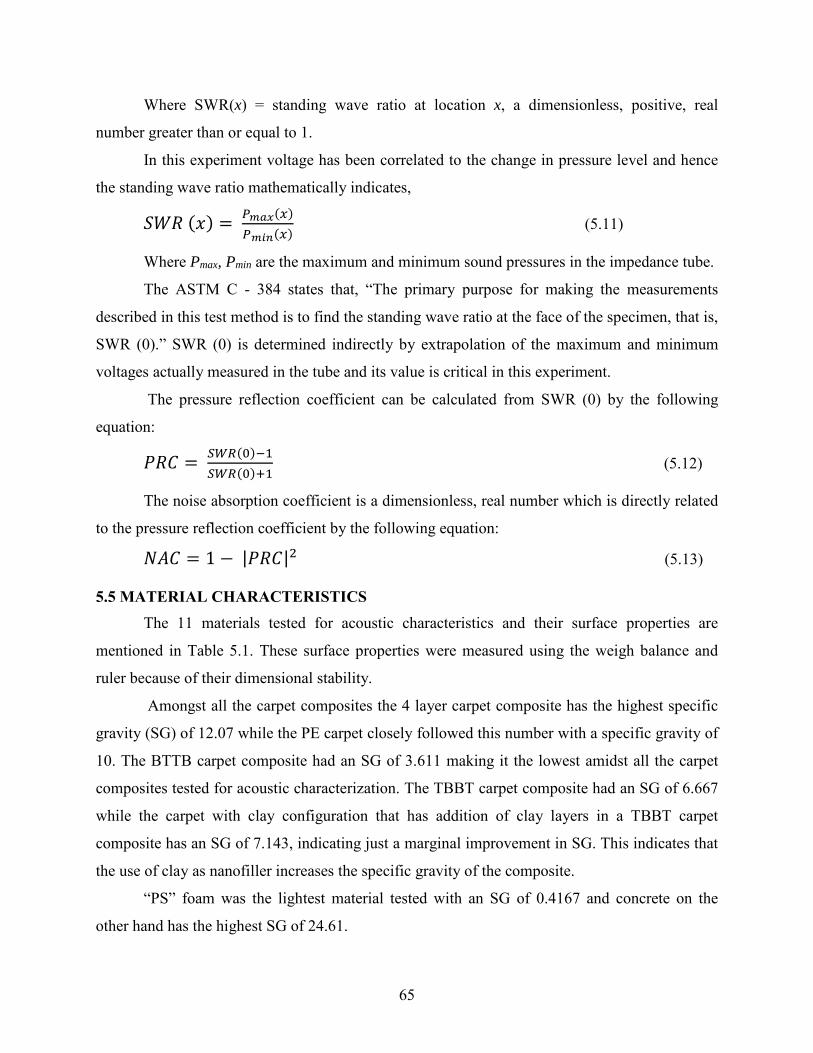
Where SWR(x) = standing wave ratio at location x, a dimensionless, positive, real
number greater than or equal to 1.
In this experiment voltage has been correlated to the change in pressure level and hence
the standing wave ratio mathematically indicates,
𝑆𝑆𝑊𝑊𝑅𝑅 (𝑥𝑥) = 𝑃𝑃𝑚𝑚𝑚𝑚𝑚𝑚(𝑥𝑥)𝑃𝑃𝑚𝑚𝑚𝑚𝑚𝑚(𝑥𝑥)
(5.11)
Where Pmax, Pmin are the maximum and minimum sound pressures in the impedance tube.
The ASTM C - 384 states that, “The primary purpose for making the measurements
described in this test method is to find the standing wave ratio at the face of the specimen, that is,
SWR (0).” SWR (0) is determined indirectly by extrapolation of the maximum and minimum
voltages actually measured in the tube and its value is critical in this experiment.
The pressure reflection coefficient can be calculated from SWR (0) by the following
equation:
𝑃𝑃𝑅𝑅𝑇𝑇 = 𝑆𝑆𝑊𝑊𝑆𝑆(0)−1𝑆𝑆𝑊𝑊𝑆𝑆(0)+1
(5.12)
The noise absorption coefficient is a dimensionless, real number which is directly related
to the pressure reflection coefficient by the following equation:
𝑁𝑁𝐴𝐴𝑇𝑇 = 1 − |𝑃𝑃𝑅𝑅𝑇𝑇|2 (5.13)
5.5 MATERIAL CHARACTERISTICS The 11 materials tested for acoustic characteristics and their surface properties are
mentioned in Table 5.1. These surface properties were measured using the weigh balance and
ruler because of their dimensional stability.
Amongst all the carpet composites the 4 layer carpet composite has the highest specific
gravity (SG) of 12.07 while the PE carpet closely followed this number with a specific gravity of
10. The BTTB carpet composite had an SG of 3.611 making it the lowest amidst all the carpet
composites tested for acoustic characterization. The TBBT carpet composite had an SG of 6.667
while the carpet with clay configuration that has addition of clay layers in a TBBT carpet
composite has an SG of 7.143, indicating just a marginal improvement in SG. This indicates that
the use of clay as nanofiller increases the specific gravity of the composite.
“PS” foam was the lightest material tested with an SG of 0.4167 and concrete on the
other hand has the highest SG of 24.61.
65
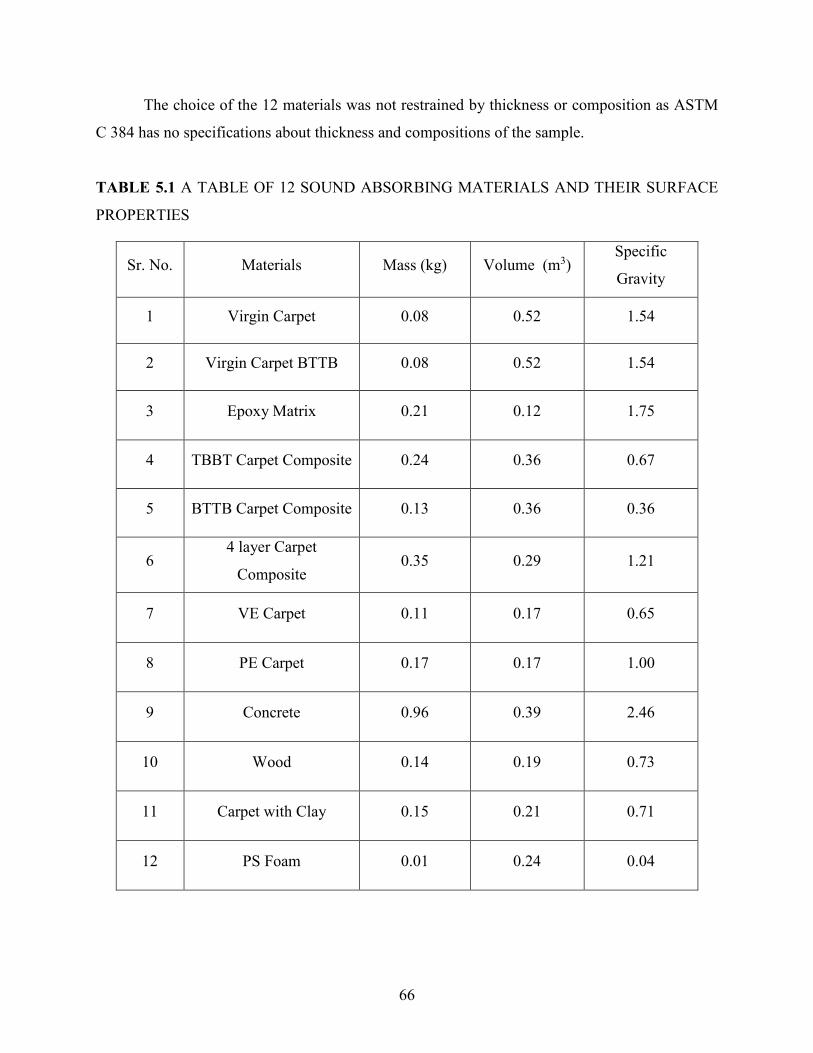
The choice of the 12 materials was not restrained by thickness or composition as ASTM
C 384 has no specifications about thickness and compositions of the sample.
TABLE 5.1 A TABLE OF 12 SOUND ABSORBING MATERIALS AND THEIR SURFACE
PROPERTIES
Sr. No. Materials Mass (kg) Volume (m3) Specific
Gravity
1 Virgin Carpet 0.08 0.52 1.54
2 Virgin Carpet BTTB 0.08 0.52 1.54
3 Epoxy Matrix 0.21 0.12 1.75
4 TBBT Carpet Composite 0.24 0.36 0.67
5 BTTB Carpet Composite 0.13 0.36 0.36
6 4 layer Carpet
Composite 0.35 0.29 1.21
7 VE Carpet 0.11 0.17 0.65
8 PE Carpet 0.17 0.17 1.00
9 Concrete 0.96 0.39 2.46
10 Wood 0.14 0.19 0.73
11 Carpet with Clay 0.15 0.21 0.71
12 PS Foam 0.01 0.24 0.04
66
5.6 RESULTS The NAC measurements were conducted using the ASTM C - 384 standards at the 3rd
octave band frequency range from 125 Hz to 4000 Hz. The 3rd octave band frequencies chosen
for this test were - 125 Hz, 250 Hz, 500 Hz, 1000 Hz, 2000 Hz and 4000 Hz.
Fig. 5.4 shows the result obtained for 11 different materials tested for noise absorption
coefficient (NAC) using ASTM C 384-04 and it can be concluded from the result that the virgin
carpet (which means carpet without any resin treatment or usage) has the highest noise
absorption at low frequencies of 125 Hz but drops down in absorption at frequency range of 250
– 500 Hz. Polystyrene (“PS”) foam is the best absorber material among all the other materials
compared in the frequency range of 250 – 500 Hz. However it can also be seen that PS foam
gives up at frequency above 500 Hz that is, in the higher frequency range of 1000 Hz to 4000 Hz
it performs poorly.
The following observations were made based on the results displayed in Fig. 5.4 for NAC
obtained at different frequencies -
The four layer carpet composite performs exceptionally well in the frequency range from
1000 Hz to 4000 Hz. This proves that among all the materials the best material best
suited for a highway noise barrier is the four layer carpet composite material. The
material is robust in its noise absorption in the low frequency range of 125 Hz to 500 Hz.
This is because it is only third to virgin carpet and PS foam in the low frequency range.
Virgin carpet BTTB was tested to check if the properties had any difference in properties
in comparison to the other virgin carpet sample which has a configuration of TBBT.
Results from Fig. 5.4 indicate that probably the backing surface of the carpet is very
weak due to lesser porosity in comparison to the carpet fibers. A porous medium can be
looked at as a mixture of two phases, air and solid material, both of which react
differently to the sound wave. Hence there is a higher NAC indicating greater noise
absorption in porous materials like Virgin carpet than in the flat Virgin carpet BTTB.
67

Figure 5.4 Noise Absorption coefficients of various noise absorbing materials calculated at the
third octave band range of frequencies using ASTM C 384 -04
The material that performed the poorest among the 11 materials is concrete. Concrete has
a steady absorption rate of around 0.125 at all frequencies that is significantly low.
There was a steady trend observed at 500 Hz where all the materials displayed high
sound absorption. A similar trend was observed for a dip in acoustic absorption for all
materials at 1000 Hz. This could probably be because the frequencies could be harmonic
frequency of the materials.
It was necessary to understand the behavior of different carpet composites and the effect
of different resin systems; layup arrangements that is, TBBT, BTTB, 4 layer; addition of
nanocomposite fillers and other general comparisons on the acoustic performance of the
composites. Hence a comparison of 6 different carpet composites has been presented in Fig. 5.5
from which the following observations were made -
68
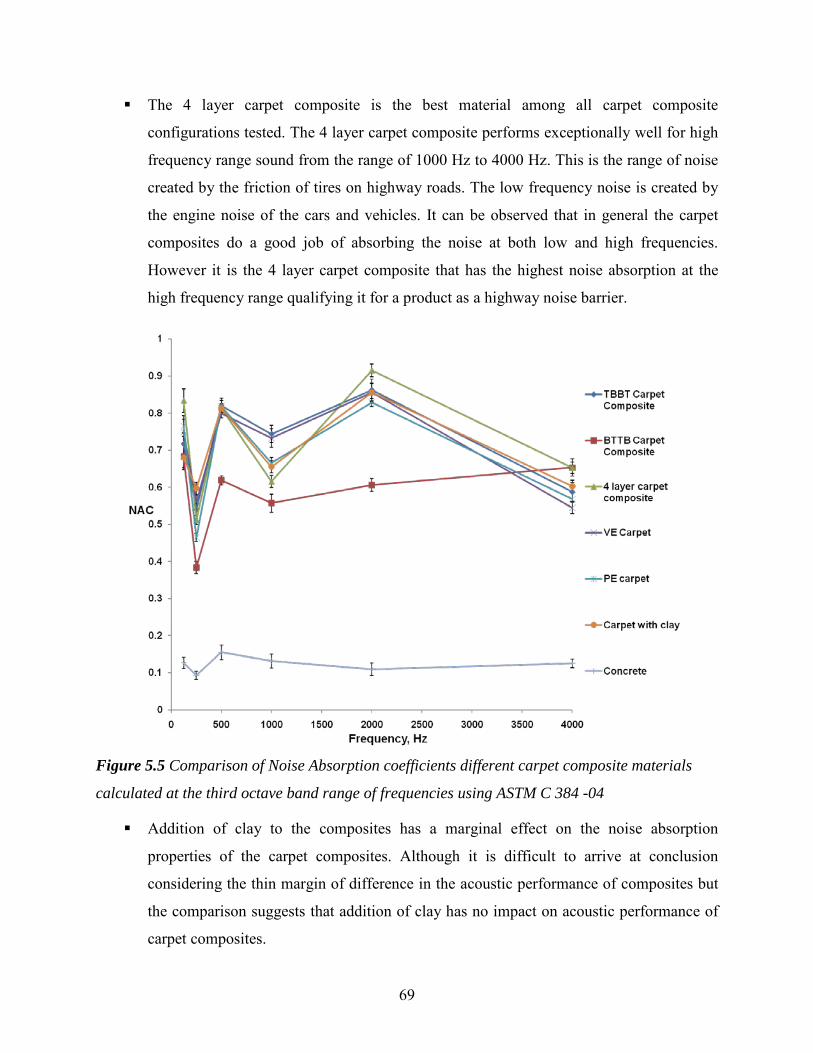
The 4 layer carpet composite is the best material among all carpet composite
configurations tested. The 4 layer carpet composite performs exceptionally well for high
frequency range sound from the range of 1000 Hz to 4000 Hz. This is the range of noise
created by the friction of tires on highway roads. The low frequency noise is created by
the engine noise of the cars and vehicles. It can be observed that in general the carpet
composites do a good job of absorbing the noise at both low and high frequencies.
However it is the 4 layer carpet composite that has the highest noise absorption at the
high frequency range qualifying it for a product as a highway noise barrier.
Figure 5.5 Comparison of Noise Absorption coefficients different carpet composite materials
calculated at the third octave band range of frequencies using ASTM C 384 -04
Addition of clay to the composites has a marginal effect on the noise absorption
properties of the carpet composites. Although it is difficult to arrive at conclusion
considering the thin margin of difference in the acoustic performance of composites but
the comparison suggests that addition of clay has no impact on acoustic performance of
carpet composites.
69
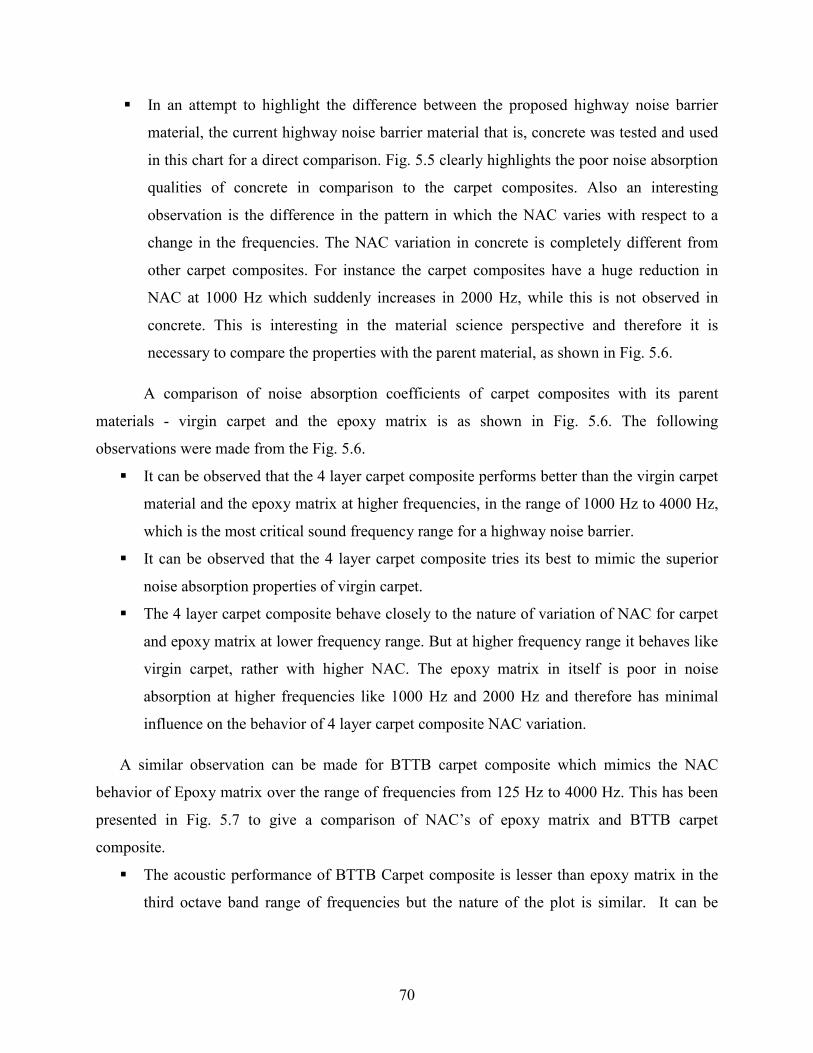
In an attempt to highlight the difference between the proposed highway noise barrier
material, the current highway noise barrier material that is, concrete was tested and used
in this chart for a direct comparison. Fig. 5.5 clearly highlights the poor noise absorption
qualities of concrete in comparison to the carpet composites. Also an interesting
observation is the difference in the pattern in which the NAC varies with respect to a
change in the frequencies. The NAC variation in concrete is completely different from
other carpet composites. For instance the carpet composites have a huge reduction in
NAC at 1000 Hz which suddenly increases in 2000 Hz, while this is not observed in
concrete. This is interesting in the material science perspective and therefore it is
necessary to compare the properties with the parent material, as shown in Fig. 5.6.
A comparison of noise absorption coefficients of carpet composites with its parent
materials - virgin carpet and the epoxy matrix is as shown in Fig. 5.6. The following
observations were made from the Fig. 5.6.
It can be observed that the 4 layer carpet composite performs better than the virgin carpet
material and the epoxy matrix at higher frequencies, in the range of 1000 Hz to 4000 Hz,
which is the most critical sound frequency range for a highway noise barrier.
It can be observed that the 4 layer carpet composite tries its best to mimic the superior
noise absorption properties of virgin carpet.
The 4 layer carpet composite behave closely to the nature of variation of NAC for carpet
and epoxy matrix at lower frequency range. But at higher frequency range it behaves like
virgin carpet, rather with higher NAC. The epoxy matrix in itself is poor in noise
absorption at higher frequencies like 1000 Hz and 2000 Hz and therefore has minimal
influence on the behavior of 4 layer carpet composite NAC variation.
A similar observation can be made for BTTB carpet composite which mimics the NAC
behavior of Epoxy matrix over the range of frequencies from 125 Hz to 4000 Hz. This has been
presented in Fig. 5.7 to give a comparison of NAC’s of epoxy matrix and BTTB carpet
composite.
The acoustic performance of BTTB Carpet composite is lesser than epoxy matrix in the
third octave band range of frequencies but the nature of the plot is similar. It can be
70
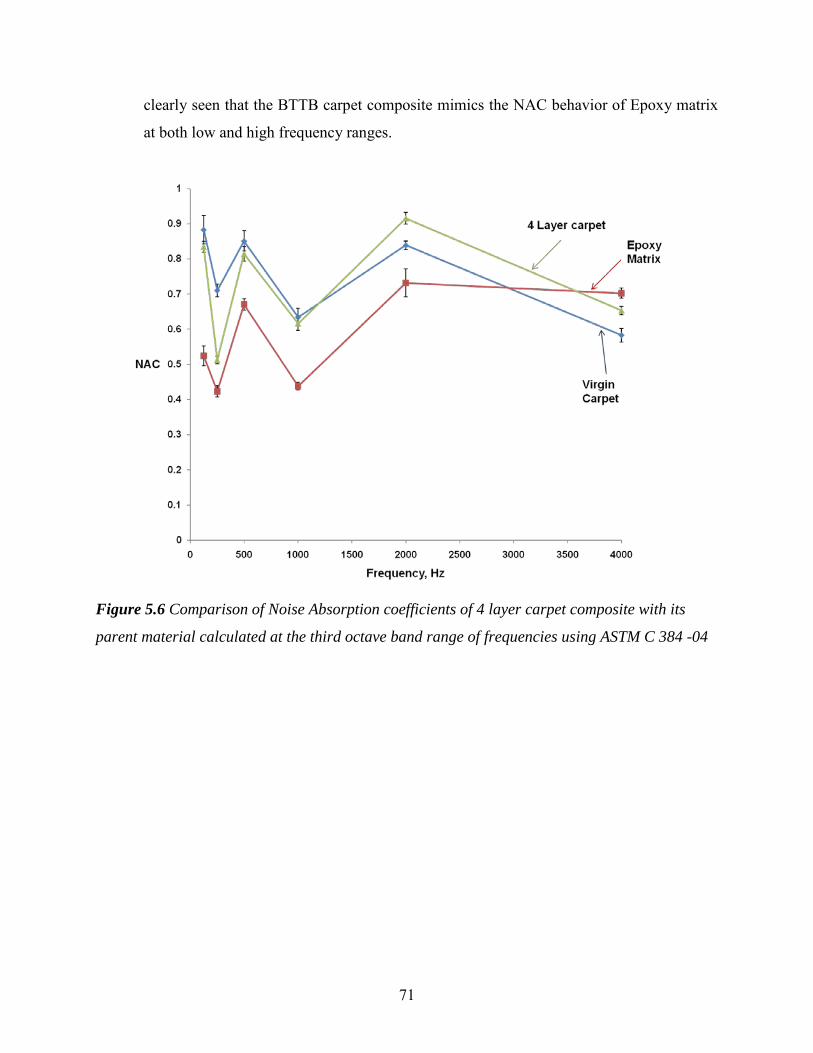
clearly seen that the BTTB carpet composite mimics the NAC behavior of Epoxy matrix
at both low and high frequency ranges.
Figure 5.6 Comparison of Noise Absorption coefficients of 4 layer carpet composite with its
parent material calculated at the third octave band range of frequencies using ASTM C 384 -04
71
Figure 5.7 Similarity of acoustic behavior of BTTB carpet composite material and Epoxy Matrix
calculated at the third octave band range of frequencies using ASTM C 384 -04
BTTB carpet composites have the poorest acoustic performance in comparison to the
acoustic performance of all the carpet composites. Because BTTB arrangement has
Bottom - Top - Top - Bottom, type of arrangement the reinforcement for BTTB carpet
composites is provided by the Polypropylene backing of the carpet instead of the nylon
fibers. The Polypropylene backing is the flat end of the carpet and therefore has no
obstruction for the resin flow during VARTM. This could be a potential reason for the
epoxy matrix to play a dominant role in influencing the acoustic performance of the
carpet composites instead of the virgin carpet. Hence the BTTB carpet composites mimic
the NAC variation behavior of epoxy matrix composites.
Therefore it is safe to conclude that amongst all the carpet composite configurations, it is
safe to avoid BTTB carpet composite, because it would not make good highway noise
barriers due to poor noise absorption characteristics.
72
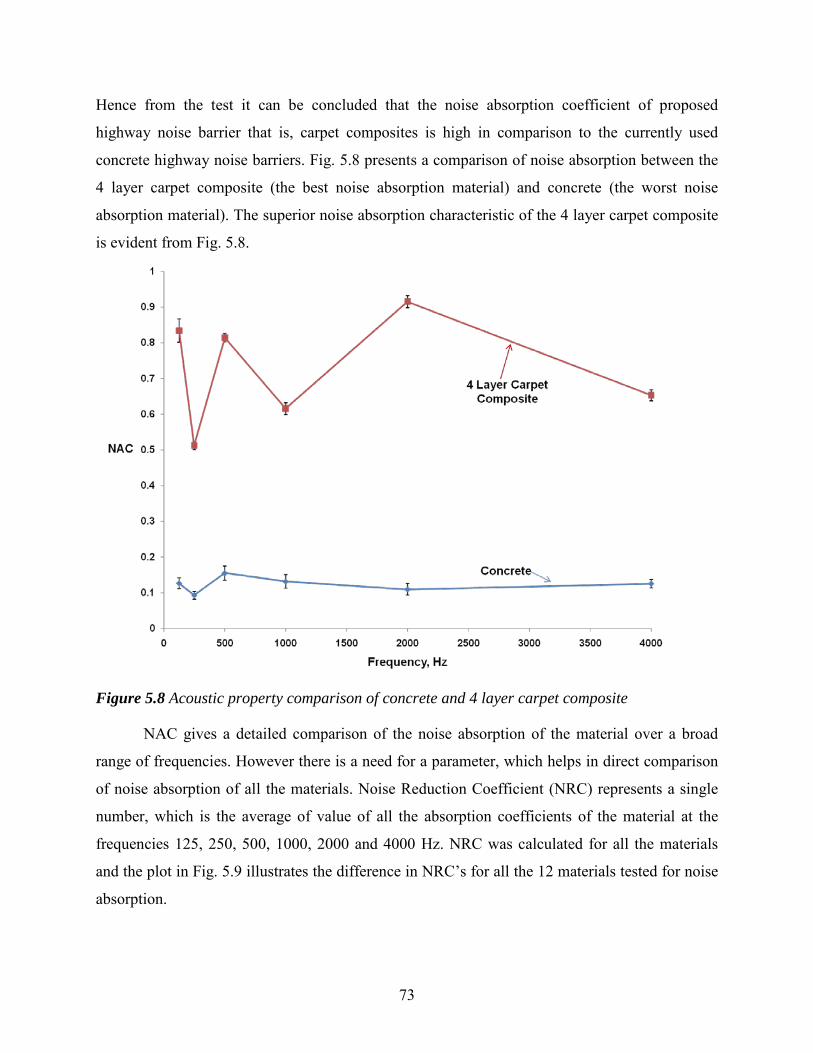
Hence from the test it can be concluded that the noise absorption coefficient of proposed
highway noise barrier that is, carpet composites is high in comparison to the currently used
concrete highway noise barriers. Fig. 5.8 presents a comparison of noise absorption between the
4 layer carpet composite (the best noise absorption material) and concrete (the worst noise
absorption material). The superior noise absorption characteristic of the 4 layer carpet composite
is evident from Fig. 5.8.
Figure 5.8 Acoustic property comparison of concrete and 4 layer carpet composite
NAC gives a detailed comparison of the noise absorption of the material over a broad
range of frequencies. However there is a need for a parameter, which helps in direct comparison
of noise absorption of all the materials. Noise Reduction Coefficient (NRC) represents a single
number, which is the average of value of all the absorption coefficients of the material at the
frequencies 125, 250, 500, 1000, 2000 and 4000 Hz. NRC was calculated for all the materials
and the plot in Fig. 5.9 illustrates the difference in NRC’s for all the 12 materials tested for noise
absorption.
73
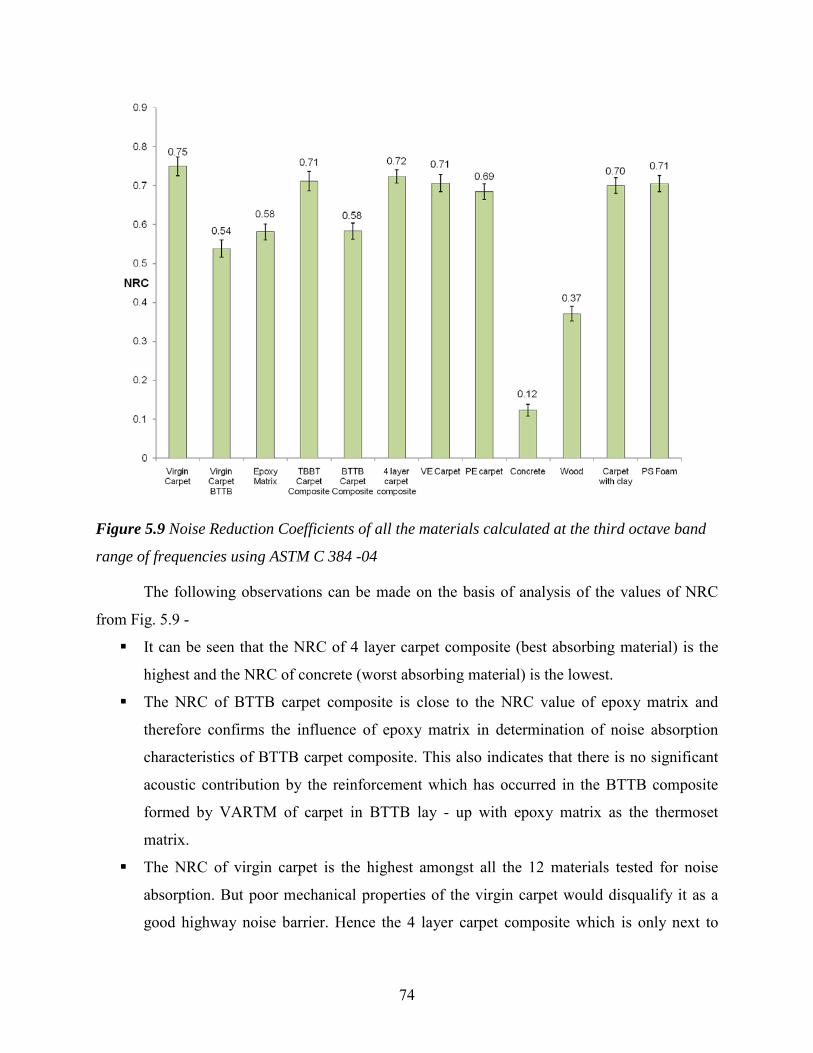
Figure 5.9 Noise Reduction Coefficients of all the materials calculated at the third octave band
range of frequencies using ASTM C 384 -04
The following observations can be made on the basis of analysis of the values of NRC
from Fig. 5.9 -
It can be seen that the NRC of 4 layer carpet composite (best absorbing material) is the
highest and the NRC of concrete (worst absorbing material) is the lowest.
The NRC of BTTB carpet composite is close to the NRC value of epoxy matrix and
therefore confirms the influence of epoxy matrix in determination of noise absorption
characteristics of BTTB carpet composite. This also indicates that there is no significant
acoustic contribution by the reinforcement which has occurred in the BTTB composite
formed by VARTM of carpet in BTTB lay - up with epoxy matrix as the thermoset
matrix.
The NRC of virgin carpet is the highest amongst all the 12 materials tested for noise
absorption. But poor mechanical properties of the virgin carpet would disqualify it as a
good highway noise barrier. Hence the 4 layer carpet composite which is only next to
74
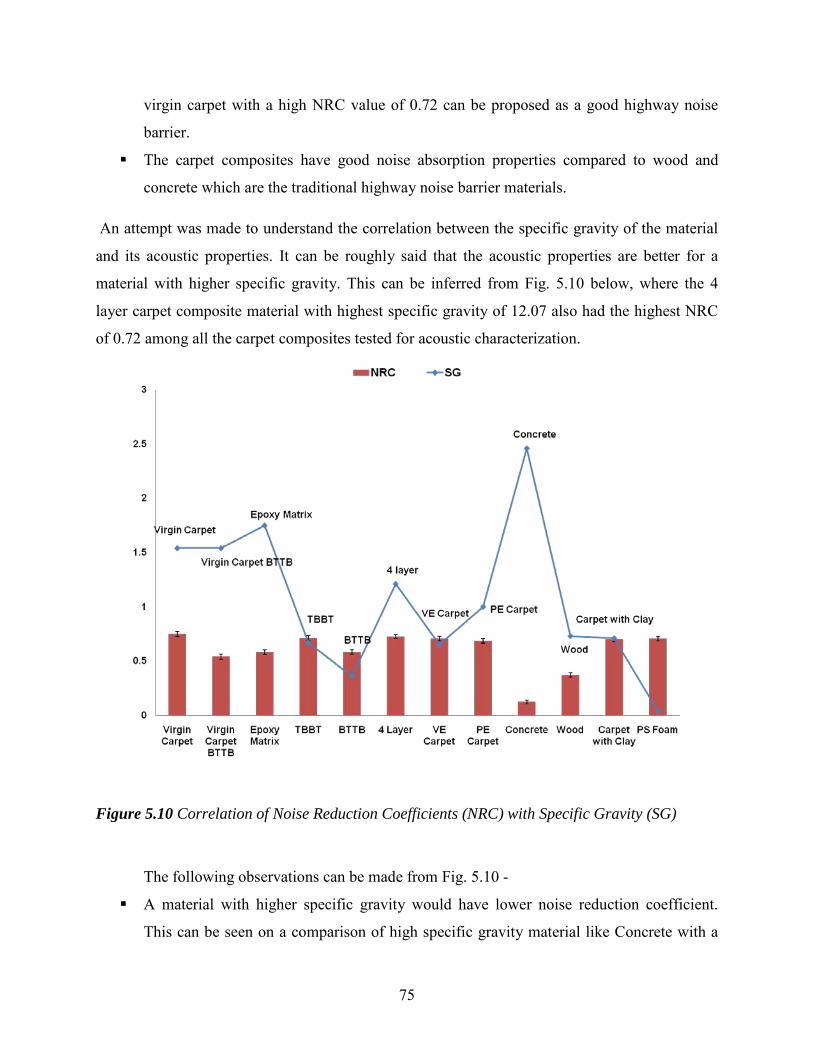
virgin carpet with a high NRC value of 0.72 can be proposed as a good highway noise
barrier.
The carpet composites have good noise absorption properties compared to wood and
concrete which are the traditional highway noise barrier materials.
An attempt was made to understand the correlation between the specific gravity of the material
and its acoustic properties. It can be roughly said that the acoustic properties are better for a
material with higher specific gravity. This can be inferred from Fig. 5.10 below, where the 4
layer carpet composite material with highest specific gravity of 12.07 also had the highest NRC
of 0.72 among all the carpet composites tested for acoustic characterization.
Figure 5.10 Correlation of Noise Reduction Coefficients (NRC) with Specific Gravity (SG)
The following observations can be made from Fig. 5.10 -
A material with higher specific gravity would have lower noise reduction coefficient.
This can be seen on a comparison of high specific gravity material like Concrete with a
75

low specific gravity material like PS Foam, where PS Foam yielded better noise
reduction characteristics in comparison to concrete.
Carpet composites have lower specific gravity and therefore have higher noise reduction
coefficient in comparison to materials like concrete and wood. Hence it can be concluded
that carpet composites have better noise reduction capabilities than concrete or wood.
76
6. CONCLUSIONS AND OTHER SIGNIFICANT RESULTS
The acoustic results for six different set of carpet composites indicated excellent
absorption properties of the carpet composites and therefore it could have a potential application
as highway noise barriers. The contributions of this work include:
1) Scaling up of VARTM process for fabrication of large-scale carpet composites. The
capabilities of the scale up include:
1. Feasibility of making large composites of size more than 0.61 m x 0.61 m with
uniform thickness.
2. Fabrication of curved shaped panels by the scale up of VARTM process.
3. One of the powerful features of the process scale-up of VARTM practiced is the
exclusion of hot press used in VARTM process. Hot press restricts the size and
shape of the final part of the composite and by avoiding it, the scaled up the
process.
2) Product scale up included the addition of PVP-clay 3% nanocomposite films in the carpet
composite by the scaled up VARTM process. The clay nanofiller can act as a fire
retardant and probably prevent the carpet composites from undergoing environmental
degradation by UV and moisture. The PVP Clay 3% nanocomposite film used as filler
was a well-exfoliated film.
3) Application of the carpet composites prepared by scaled up VARTM process as Highway
Noise Barriers:
a. It was demonstrated that Carpet composites have excellent absorption properties
with a noise absorption coefficient in the range of 0.70.
b. Addition of clay to the carpet composites did not make a significant difference in
the noise absorption capabilities of the carpet composites.
c. Changing the resin system did not make any significant improvement of decline
in the noise absorption of carpet composites.
d. The BTTB carpet composites have an acoustic performance similar to the epoxy
matrix – which indicates that the noise absorption properties of carpet have no
contribution in this type of configuration of composites.
77
e. The acoustic test results indicated that the carpet composites could have an
acoustic performance better then the epoxy matrix, but they do not seem to match
the sound absorption capabilities of virgin carpet material. However on the basis
of the experiments, the performance of the carpet composites is estimated to be
better than both the virgin carpet and the epoxy matrix at higher frequencies.
f. On the basis of the acoustic measurements of concrete and other materials it can
be estimated that the carpet composites can absorb more sound than concrete.
Hence there is a possibility for carpet composites as alternative highway noise
barrier material.
For evaluating the effect of the environment and fire, composites were fabricated with
neat epoxy, and further coated with a mix of epoxy and I.28E nanoclay. Composite samples were
also fabricated by infusing them with a mixture of epoxy and 4 % I.28E nanoclay. Composites
were then exposed to moisture and cycling exposure of ultra violet radiation and condensed
vapor. Flexural properties were tested before and after each degradation process.
Significant reduction in flammability in the carpet composites was observed due to use of
clay. The linear burning rate as per ASTM D 635-10 was reduced by 20 % for composite
samples coated with the epoxy-clay coating, while it was reduced by 34 % for composite
samples infused with 4 % nanoclay.
Moisture exposure for these samples indicated that both clay coating and clay infusion
reduced the deleterious effect of moisture on the composites. Significant reduction in diffusivity
was found in clay coated and clay infused composites. All composites showed a reduction in
flexural strength and modulus, where severity of degradation was less in clay coated and clay
infused carpet composites. After 1000 hours exposure of moisture clay infused carpet composite
demonstrated higher strength and modulus than other other two composites. It was also observed
that moisture absorption was a Fickian diffusion mechanism.
For alternating moisture and UV exposure cycles, the clay-coated samples exhibited the
lowest change in mass, while the neat epoxy recycled carpet composites showed the highest
mass gain. However, It was also observed that the combined moisture/UV exposure resulted in
an increase in strength in the case of all composite types. It can assumed that high temperature
exposure of composites will lead to higher cross linking of the polymer. However, the exposure
time for cyclic environmental condition was not long enough to observe the effect of
78

degradation. Longer exposure and molecular analysis can be conducted to determine the effect of
UV on the carpet composite.
Finally, wind load tests proved that the composite is strong and withstands extreme wind
conditions similar to tornadoes.
Three graduate students have completed their Masters work on this funded project. A
patent based on this work was applied for during the project and has recently been issued – A. K.
Singh, G. Pandey, R. Vaidyanathan, and R. P. Singh, “Fabrication Method of Multi-functional
Composites from Pre/Post-Customer Carpet,” U.S. Patent Application No. 12/695730, August 5,
2010. An Oklahoma manufacturer (K. T. Plastics, Calera, OK) has signed an option to license for
this patent. It is expected that KT Plastics will be providing the technology to another Oklahoma
manufacturer of highway sound barriers (Apache Precast, Jenks, OK).
Several papers have been published and presented, while also giving the opportunity to
intern for undergraduate students at Oklahoma State University.
79
REFERENCES
[1] World Energy Outlook Special Report 2013: Redrawing the Energy Climate Map.
http://www.iea.org/publications/freepublications/publication/name,38764,en.html.
[Accessed 7/18/2013].
[2] Leigh J. Beyond Peak Oil in Post Globalization Civilization Clash. The Open Geography
Journal. 2008;1;51-24.
[3] Daniels EJ. Advanced Process Research and Development to Enhance Materials
Recycling. Polymer-Plastics Technology and Engineering. 1999;38;569-579.
[4] Mihut C, Dinyar KC, Francis GM, Amiridis MD. Review: Recycling of Nylon From
Carpet Waste. Polymer Engineering & Science. 2001;41;1457-1470.
[5] Carpet Cycle, LLC. Carpet Recycling Comes of Age Page.
http://www.carpetcycle.com/images/Carpet_Recycling_2007.pdf. [Accessed 6/4/2011].
[6] Singh AK, Jain A, Vaidyanathan R, Singh RP. Structural Composites from Recycled
Carpet. Presented at the SAMPE, Baltimore, MD (May 2009).
[7] The Carpet and Rug Institute. Sustainability Report 08 Page.
http://www.carpet-rug.org/pdf_word_docs/2008_CRI_SustainabilityReport.pdf.
[Accessed 6/20/2011].
[8] US Environment Protection Agency. Municipal Solid Waste in the United States Page.
http://www.epa.gov/osw/nonhaz/municipal/pubs/msw2009rpt.pdf. [Accessed 7/18/2013].
[9] Stroop J. Wastage Magazine - Pulling the Rug Out Page.
http://waste360.com/Recycling_And_Processing/carpet-diversion-201012.
[Accessed 7/18/2013].
[10] Carpet and Rug Institute. Board Meeting - Agenda Item 10 in California Integrated
Waste Management Board (2004).
[11] Fishbein BK. Carpet Take-Back: EPR American Style. Inform. 2000;10;25-36.
[12] Cooper J. The Carpet Buyers Handbook - Carpet Fibers Page.
http://www.carpetbuyershandbook.com/carpet-basics/construction-fibers/pile-fibers.php.
[Accessed 7/13/2013].
[13] Bartl HA, Hackl A, Mihalyi B, Wistuba M, Marini I. Recycling of Fibre Materials.
Process Safety and Environmental Protection, 2005;83;351-358.
80
[14] Carpet Recycling – Northwest Project Overview, July 2009.
http://your.kingcounty.gov/solidwaste/linkup/documents/carpet-workgroup-overview-
07-2009.pdf. [Accessed 7/18/2013].
[15] Fir A. Ezinearticles - 12 Types of Carpet Page.
http://ezinearticles.com/?12-Types-of-Carpet&id=301884. [Accessed 7/18/2013].
[16] Antron Carpet Fiber, Carpet and Fiber Glossary.
http://dfsgreen.com/documents/K02505_Carpet__amp__Fiber_Glossary.pdf. [Accessed
7/18/2013].
[17] Carpet.org website. Carpet Fiber Page.
http://www.carpet.org/types_of_fiber.htm. [Accessed 7/18/2013].
[18] The Greener Industry - UK website. Polyamide Recycling Page.
http://www.greener-industry.org.uk/pages/nylon/8nylonPM3.htm. [Accessed 7/18/2013].
[19] Sifniades S, Levy AB, Hendrix JA. (Allied Signal Inc., DSM N.V.). Process for
depolymerizing nylon-containing whole carpet to form caprolactum. U.S. Patent
5,929,234. (May 21, 1998).
[20] Sifniades S, Levy AB, Hendrix JA. (Allied Signal Inc., DSM N.V.). Process for
depolymerizing nylon-containing waste to form caprolactum. U.S. Patent 5,932,724. (Apr
16, 1997).
[21] Mayer RE, Crescentini L, Jenczewski TJ. (Allied Signal Inc.). Process for the
purification of caprolactam obtained from the depolymerization of polyamide-containing
carpet. U.S. Patent 6,187,917. (Oct 29, 1999).
[22] Hendrix JA, Booij M, Frentzen YH. (DSM N.V.). Depolymerization of polyamides. U.S.
Patent 5,668,277. (Apr 15, 1996).
[23] Jenczewski TJ, Crescentini L, Mayer RE. (Allied Signal Inc.). Monomer recovery from
multi-component materials. U.S. Patent 5,656,757. (Aug 10, 1995).
[24] Frentzen YH, Thijert MP, Zwart RL. (DSM N.V.). Process for the recovery of
caprolactam from waste containing nylon. U.S. Patent 6,111,099. (Jan 12, 1998).
[25] Corbin TF, Handermann AC, Kotek R, Porter WD, Dellinger JA, Davis EA. (BASF
Corp.). Reclaiming epsilon-caprolactam from nylon 6 carpet. U.S. Patent 5,977,193. (Sep
11, 1992).
81
[26] Santos ED, Mettvier P, Gubelmann M. (Rhone-Poulenc Chimie). Process for treating a
material comprising a polymer by hydrolysis. U.S. Patent 5,905,168. (Jul 25, 1995).
[27] Moens L. (Midwest Research Institute).Purification of caprolactam from recycled nylon.
U.S. Patent 5,919,927. (Apr 9, 1998).
[28] Bockhorn H, Donner S, Gernsbeck M, Hornung A, Hornung U. Pyrolysis of polyamide 6
under catalytic conditions and its application to reutilization of carpets. Journal of
Analytical and Applied Pyrolysis. 2001;58-59;79-94.
[29] Roberts CB, Griffith T. (Auburn University). Process for Recovering polymers from
commingled materials. U.S. Patent 5,994,417. (Jun 4, 1997).
[30] Costello MR, Keller BR. (Allied Signal Inc.). Process for separation and recovery of
waste carpet components. U.S. Patent 5,722,603. (Nov 28, 1998).
[31] Siddique R, Khatib J, Kaur I. Use of recycled plastic in concrete: A review. Waste
Management. 2007;28;1835-1852.
[32] Wang YW. Carpet Recycling Technologies Page.
http://www.prism.gatech.edu/~yw6/Fiberrecycling/Recycling%20in%20Textiles%20YW
ang%20Ch6.pdf. [Accessed 7/18/2013].
[33] Zhu H, Carlson DD. A spray based crumb rubber technology in highway noise reduction
application. The Journal of Solid Waste Technology and Management. 1999;16;27-33.
[34] Federal Highway Administration. Highway Traffic Noise Page.
http://www.fhwa.dot.gov/environment/htnoise.htm. [Accessed 7/18/2013].
[35] Manhart JK (Manhart). Noise Reduction Barrier. U.S. Patent 3,983,956. (Nov 4, 1974).
[36] Wolfe RW, Gijinolli A. Durability and Strength of Cement bonded wood particle
composites made from Construction Waste. Forest Products Journal. 1999;49;24-31.
[37] Morgan PA, Watts GR. A novel approach to the Acoustic Characterisation of porous road
surfaces. Applied Acoustics. 2003;64;1171-1186.
[38] Yamaguchi NH, Mizuno MT. Sound absorption mechanism of porous asphalt pavement.
Journal of Acoustic Society Japan E. 1999;20;29-43.
[39] Meiarashi S, Ishida M, Nakashiba F, Niimi H, Hasebe M, Nakatsuji T. Improvement in
the effect of drainage asphalt road surface on noise reduction. Applied Acoustics.
1996;47;189-204.
82
[40] Oshino Y, Mikami T, Ohnishi H, Tachibana H. Investigation into road vehicle noise
reduction by drainage asphalt pavement. Journal of Acoustic Society Japan E.
1999;20;75-84.
[41] Tiwari V, Shukla A, Bose A. Acoustic properties of cenosphere reinforced cement and
asphalt concrete. Applied Acoustics. 2004;65;263-275.
[42] May DN. The optimum weight of highway noise barriers. Journal of Sound and
Vibration. 1980;68;1-13.
[43] A. Davis and D. Sims, Weathering of polymers: Springer, 1983.
[44] H. Abeysinghe, W. Edwards, G. Pritchard, and G. Swampillai, "Degradation of
crosslinked resins in water and electrolyte solutions," Polymer, vol. 23, pp. 1785-1790,
1982.
[45] J. K. Kim, C. Hu, R. S. C. Woo, and M. L. Sham, "Moisture barrier characteristics of
organoclay–epoxy nanocomposites," Composites Science and Technology, vol. 65, pp.
805-813, 2005.
[46] T. Alfrey Jr, E. Gurnee, and W. Lloyd, "Diffusion in glassy polymers," 1966, pp. 249-
261.
[47] R. Fuller, R. Fornes, and J. Memory, "NMR study of water absorbed by epoxy resin,"
Journal of Applied Polymer Science, vol. 23, pp. 1871-1874, 1979.
[48] R. T. Fuller, S. Sherrow, R. Fornes, and J. Memory, "Hydrogen exchange between water
and epoxy resin," Journal of Applied Polymer Science, vol. 24, pp. 1383-1385, 1979.
[49] L. W. Jelinski, J. J. Dumais, R. E. Stark, T. S. Ellis, and F. E. Karasz, "Interaction of
epoxy resins with water. A quadrupole echo deuterium NMR study," Macromolecules,
vol. 16, pp. 1019-1021, 1983.
[50] L. Jelinski, J. Dumais, A. Cholli, T. Ellis, and F. Karasz, "Nature of the water-epoxy
interaction," Macromolecules, vol. 18, pp. 1091-1095, 1985.
[51] C. L. Soles, F. T. Chang, B. A. Bolan, H. A. Hristov, D. W. Gidley, and A. F. Yee,
"Contributions of the nanovoid structure to the moisture absorption properties of epoxy
resins," Journal of Polymer Science Part B: Polymer Physics, vol. 36, pp. 3035-3048,
1998.
83
[52] C. L. Soles and A. F. Yee, "A discussion of the molecular mechanisms of moisture
transport in epoxy resins," Journal of Polymer Science Part B: Polymer Physics, vol. 38,
pp. 792-802, 2000.
[53] C. L. Soles, F. T. Chang, D. W. Gidley, and A. F. Yee, "Contributions of the nanovoid
structure to the kinetics of moisture transport in epoxy resins," Journal of Polymer
Science Part B: Polymer Physics, vol. 38, pp. 776-791, 2000.
[54] T. Ellis and F. Karasz, "Interaction of epoxy resins with water: the depression of glass
transition temperature," Polymer, vol. 25, pp. 664-669, 1984.
[55] P. Moy and F. Karasz, "Epoxy‐water interactions," Polymer Engineering & Science,
vol. 20, pp. 315-319, 1980.
[56] H. Hahn, "Hygrothermal damage in graphite/epoxy laminates," 1985, p. 1985.
[57] R. Seltzer, P. M. Frontini, and Y. W. Mai, "Effect of hygrothermal ageing on morphology
and indentation modulus of injection moulded nylon 6/organoclay nanocomposites,"
Composites Science and Technology, vol. 69, pp. 1093-1100, 2009.
[58] Z. Ishak and J. Berry, "Hygrothermal aging studies of short carbon fiber reinforced nylon
6.6," Journal of Applied Polymer Science, vol. 51, pp. 2145-2155, 2003.
[59] A. Bergeret, I. Pires, M. Foulc, B. Abadie, L. Ferry, and A. Crespy, "The hygrothermal
behaviour of glass-fibre-reinforced thermoplastic composites: a prediction of the
composite lifetime," Polymer testing, vol. 20, pp. 753-763, 2001.
[60] J. Arnold, "Environmental effects on crack growth in composites," Comprehensive
Structural Integrity, I. Milne, Ed., Elsevier, vol. 428, 2007.
[61] R. S. C. Woo, Y. Chen, H. Zhu, J. Li, J. K. Kim, and C. K. Y. Leung, "Environmental
degradation of epoxy–organoclay nanocomposites due to UV exposure. Part I: Photo-
degradation," Composites Science and Technology, vol. 67, pp. 3448-3456, 2007.
[62] W. Liau and F. Tseng, "The effect of long‐term ultraviolet light irradiation on polymer
matrix composites," Polymer composites, vol. 19, pp. 440-445, 1998.
[63] C. Do, E. Pearce, B. Bulkin, and H. Reimschuessel, "FT–IR spectroscopic study on the
photo‐and photooxidative degradation of nylons," Journal of Polymer Science Part A:
Polymer Chemistry, vol. 25, pp. 2301-2321, 2003.
84
[64] C. Stephenson, J. Lacey, and W. Wilcox, "Ultraviolet irradiation of plastics III.
Decomposition products and mechanisms," Journal of Polymer Science, vol. 55, pp. 477-
488, 2003.
[65] J. Zimmerman, "Degradation and crosslinking in irradiated polyamides and the effect of
oxygen diffusion," Journal of Polymer Science, vol. 46, pp. 151-162, 2003.
[66] N. Allen and J. McKellar, "The photochemistry of commercial polyamides," Journal of
Polymer Science: Macromolecular Reviews, vol. 13, pp. 241-281, 2003.
[67] B. G. Kumar, R. P. Singh, and T. Nakamura, "Degradation of carbon fiber-reinforced
epoxy composites by ultraviolet radiation and condensation," Journal of Composite
Materials, vol. 36, pp. 2713-2733, 2002.
[68] F. Uddin, "Clays, nanoclays, and montmorillonite minerals," Metallurgical and Materials
Transactions A, vol. 39, pp. 2804-2814, 2008.
[69] J. H. Koo, Polymer nanocomposites: processing, characterization, and applications:
McGraw-Hill New York, 2006.
[70] P. C. Nanocomposites, "Pinnavaia, TJ, Beall, GW, Eds," ed: Wiley Series in Polymer
Science, 2000.
[71] Y. Kojima, A. Usuki, M. Kawasumi, A. Okada, Y. Fukushima, T. Kurauchi, and O.
Kamigaito, "Mechanical properties of nylon 6-clay hybrid," Journal of Materials
Research(USA), vol. 8, pp. 1185-1189, 1993.
[72] T. Lan and T. J. Pinnavaia, "Clay-reinforced epoxy nanocomposites," Chemistry of
Materials, vol. 6, pp. 2216-2219, 1994.
[73] M. Chan, K. Lau, T. Wong, M. Ho, and D. Hui, "Mechanism of reinforcement in a
nanoclay/polymer composite," Composites Part B: Engineering, vol. 42, pp. 1708-1712,
2011.
[74] A. S. Zerda and A. J. Lesser, "Intercalated clay nanocomposites: morphology, mechanics,
and fracture behavior," Journal of Polymer Science Part B: Polymer Physics, vol. 39, pp.
1137-1146, 2001.
[75] D. Zaarei, A. A. Sarabi, F. Sharif, M. M. Gudarzi, and S. M. Kassiriha, "The Impact of
Organoclay on the Physical and Mechanical Properties of Epoxy-Clay Nanocomposite
Coatings," Journal of Macromolecular Science, Part B, vol. 49, pp. 960-969, 2010.
85
[76] G. Choudalakis and A. Gotsis, "Permeability of polymer/clay nanocomposites: A
review," European Polymer Journal, vol. 45, pp. 967-984, 2009.
[77] S. Pavlidou and C. Papaspyrides, "A review on polymer–layered silicate
nanocomposites," Progress in Polymer Science, vol. 33, pp. 1119-1198, 2008.
[78] J. Shelley, P. Mather, and K. DeVries, "Reinforcement and environmental degradation of
nylon-6/clay nanocomposites," Polymer, vol. 42, pp. 5849-5858, 2001.
[79] M. Bagherzadeh and F. Mahdavi, "Preparation of epoxy–clay nanocomposite and
investigation on its anti-corrosive behavior in epoxy coating," Progress in Organic
Coatings, vol. 60, pp. 117-120, 2007.
[80] R. P. Singh, M. Khait, S. C. Zunjarrao, C. S. Korach, and G. Pandey, "Environmental
degradation and durability of epoxy-clay nanocomposites," Journal of Nanomaterials,
vol. 2010, p. 6, 2010.
[81] A. B. Morgan and C. A. Wilkie, Flame retardant polymer nanocomposites: Wiley-
Interscience, 2007.
[82] N. Grassie, "Polymer degradation and the fire hazard," Polymer Degradation and
Stability, vol. 30, pp. 3-12, 1990.
[83] A. Castrovinci and G. Camino, "Fire-retardant mechanisms in polymer nano-composite
materials," Multifunctional Barriers for Flexible Structure, pp. 87-108, 2007.
[84] Harris B. Engineering Composite Materials. 2nd ed. Institute of Materials, London; 1999
[85] Jain A. Effect of Fiber surface treatment in carpet recycling. Thesis presented at the
Oklahoma State University, Tulsa, OK, in partial fulfillment of the requirements for the
degree of Master of Science, Mechanical Engineering (2010).
[86] Dhyani A. VARTM process with some modifications. Thesis presented at the Michigan
State University, MI, in partial fulfillment of the requirements for the degree of Master of
Science, Mechanical Engineering (2008).
[87] Afendi Md, Banks WM, Kirkwood D. Bubble free resin for infusion process. Composites
Part A: applied science and manufacturing. 2004;36;739-746.
[88] Kuentzer PS, Advani SG, Walsh S. Correlation of void distribution to VARTM
manufacturing techniques. Composites Part A: applied science and manufacturing.
2007;38;802-813.
86
[89] Li JK, Gillespie Jr. JW, Heider D. Process and Performance Evaluation of the Vacuum-
Assisted Process. Journal of Composite Materials. 2004;38;1803-1814.
[90] Claire SM, Simacek P, Advani SG, Yarlagadda S, Walsh S. A model for thermoplastic
melt impregnation of fiber bundles during consolidation of powder-impregnated
continuous fiber composites. Composites Part A: applied science and manufacturing.
2010;41;93-100.
[91] McCaffery TR, Zguris ZZ, Durant YG. Low cost mold development for prototype parts
produced by Vacuum Assisted Resin Transfer Molding (VARTM). Journal of Composite
Materials. 2003;37;899-912.
[92] A. Davis and D. Sims, Weathering of polymers: Springer, 1983.
[93] C. L. Soles, F. T. Chang, D. W. Gidley, and A. F. Yee, "Contributions of the nanovoid
structure to the kinetics of moisture transport in epoxy resins," Journal of Polymer
Science Part B: Polymer Physics, vol. 38, pp. 776-791, 2000.
[94] Т. Glaskova and A. Aniskevich, "Moisture absorption by epoxy/montmorillonite
nanocomposite," Composites Science and Technology, vol. 69, pp. 2711-2715, 2009.
[95] J. K. Kim, C. Hu, R. S. C. Woo, and M. L. Sham, "Moisture barrier characteristics of
organoclay–epoxy nanocomposites," Composites Science and Technology, vol. 65, pp.
805-813, 2005.
[96] S. U. A. HAMIM, "VARIATION OF MECHANICAL PROPERTIES DUE TO
HYGROTHERMAL AGEING AND PERMANENT CHANGES UPON REDRYING IN
CLAY/EPOXY NANOCOMPOSITES," MASTER OF SCIENCE, Oklahoma State
University, OK, USA, 2011.
[97] Y. Zhou, M. Hosur, S. Jeelani, and P. Mallick, "Fabrication and characterization of
carbon fiber reinforced clay/epoxy composite," Journal of Materials Science, pp. 1-11,
2012.
[98] M. G. Mcmaster and D. S. Soane, "Water sorption in epoxy thin films," Components,
Hybrids, and Manufacturing Technology, IEEE Transactions on, vol. 12, pp. 373-386,
1989.
[99] Y. Xu and S. V. Hoa, "Mechanical properties of carbon fiber reinforced epoxy/clay
nanocomposites," Composites Science and Technology, vol. 68, pp. 854-861, 2008.
87
[100] J. L. Tsai and M. D. Wu, "Organoclay effect on mechanical responses of glass/epoxy
nanocomposites," Journal of Composite Materials, vol. 42, pp. 553-568, 2008.
[101] N. H. M. Zulfli and C. W. Shyang, "Flexural and Morphological Properties of
Epoxy/Glass Fibre/Silane-Treated Organo-montmorillonite Composites," Journal of
Physical Science, vol. 21, pp. 41-50, 2010.
[102] B. De'Nève and M. Shanahan, "Water absorption by an epoxy resin and its effect on the
mechanical properties and infra-red spectra," Polymer, vol. 34, pp. 5099-5105, 1993.
[103] J. Arnold, "Environmental effects on crack growth in composites," Comprehensive
Structural Integrity, I. Milne, Ed., Elsevier, vol. 428, 2007.
[104] W. Liau and F. Tseng, "The effect of long‐term ultraviolet light irradiation on polymer
matrix composites," Polymer composites, vol. 19, pp. 440-445, 1998.
[105] B. G. Kumar, R. P. Singh, and T. Nakamura, "Degradation of carbon fiber-reinforced
epoxy composites by ultraviolet radiation and condensation," Journal of Composite
Materials, vol. 36, pp. 2713-2733, 2002.
[106] N. S. Allen and A. Parkinson, "Ultraviolet derivative absorption spectra of nylon 6, 6:
Effect of photolysis versus photo-induced oxidation," Polymer Degradation and Stability,
vol. 4, pp. 239-244, 1982.
[107] S. J. Park, D. I. Seo, and J. R. Lee, "Surface modification of montmorillonite on surface
acid–base characteristics of clay and thermal stability of epoxy/clay nanocomposites,"
Journal of colloid and interface science, vol. 251, pp. 160-165, 2002.
[108] T. Kashiwagi, "Flammability of Nanocomposites–Effects of the Shape of Nanoparticles,"
Fire Retardancy of Polymers. Royal Society of Chemistry, London, pp. 81-99, 2005.
[109] Hargrove A, "Modeling of Acoustic Noise Attenuation By The Use of Composites,"
presented at the Proceedings of South East Con ‘ 93, IEEE, Charlotte, NC (Apr 1993).
[110] Clemson University. Physics Lab - Acoustic Resonance Page.
http://www.clemson.edu/ces/phoenix/labs/224/resonance/. [Accessed 7/18/2013].
[111] ASTMC-384-04, "Standard Test Method for Impedance and Absorption of Acoustical
Materials by Impedance Tube Method," in ASTM C-384-04, ed. 2004.
88