Separation of xylose oligomers using centrifugal partition ...
Upload
stimiktunasbangsaCategory
view
3download
0
Journal of Atmospheric Chemistry 47: 223–241, 2004.© 2004 Kluwer Academic Publishers. Printed in the Netherlands.
223
Particle Size Distribution and Gas-ParticlePartition of Polycyclic Aromatic Hydrocarbonsin Helsinki Urban Area
MASAHIKO SHIMMO 1, KARRI SAARNIO 1, PASI AALTO 2,KARI HARTONEN 1, TUULIA HYÖTYLÄINEN 1�, MARKKU KULMALA 2
and MARJA-LIISA RIEKKOLA 1
1Laboratory of Analytical Chemistry, Department of Chemistry, PO Box 55, FIN-00014,University of Helsinki, Finland, e-mail: [email protected] of Atmospheric Sciences, Department of Physical Sciences, PO Box 64, FIN-00014,University of Helsinki, Finland
(Received: 23 September 2002; accepted: 18 December 2003)
Abstract. Ambient concentrations of polycyclic aromatic hydrocarbons (PAHs) were measured inHelsinki (Finland). Particle mass size distributions were obtained with a cascade impactor (12 stages)with glass fibre filters as substrates. Simultaneously with the impactor measurements, particulate andgaseous PAHs were collected on a quartz filter and XAD-2 adsorbent, respectively, for evaluationof gas-partition coefficients. Samples were analysed for PAHs by on-line coupled supercritical fluidextraction – liquid chromatography – gas chromatography – mass spectrometry. The impactor resultsshowed that most of the PAHs in Helsinki urban area were concentrated in fine particles (<2.5 µmdiameter) with unimode peak at about 1 µm. The results were comparable with the number distri-bution measured with a differential mobility particle sizer. Total amounts of PAHs (gas + particle)varied from 15 (acenaphthylene) to 1990 (fluorene) pg/m3. The PAHs lighter than 202 amu (pyreneand fluoranthene) were exclusively in gas phase, whereas those heavier than 202 amu were mostly as-sociated with particles. A plot of the partition coefficients (logKp) versus the temperature dependentsub-cooled vapour pressures (logp0
L) showed a gradient of –0.66, which deviated from equilibriumstate (gradient = –1).
Key words: polycyclic aromatic hydrocarbons, cascade impactor, size distribution, supercritical fluidextraction, liquid chromatography – gas chromatography.
1. Introduction
Due to the emission of harmful gases and particles, air pollution is a serious envi-ronmental problem in many urban areas. Polycyclic aromatic hydrocarbons (PAHs)are classified as pollutants because some of them are carcinogenic and mutagenic.PAHs are formed during incomplete combustion of organic materials, and theirsources in cities are exclusively anthropogenic. Because of their many sources,PAHs are present almost everywhere.
� Corresponding author.
224 MASAHIKO SHIMMO ET AL.
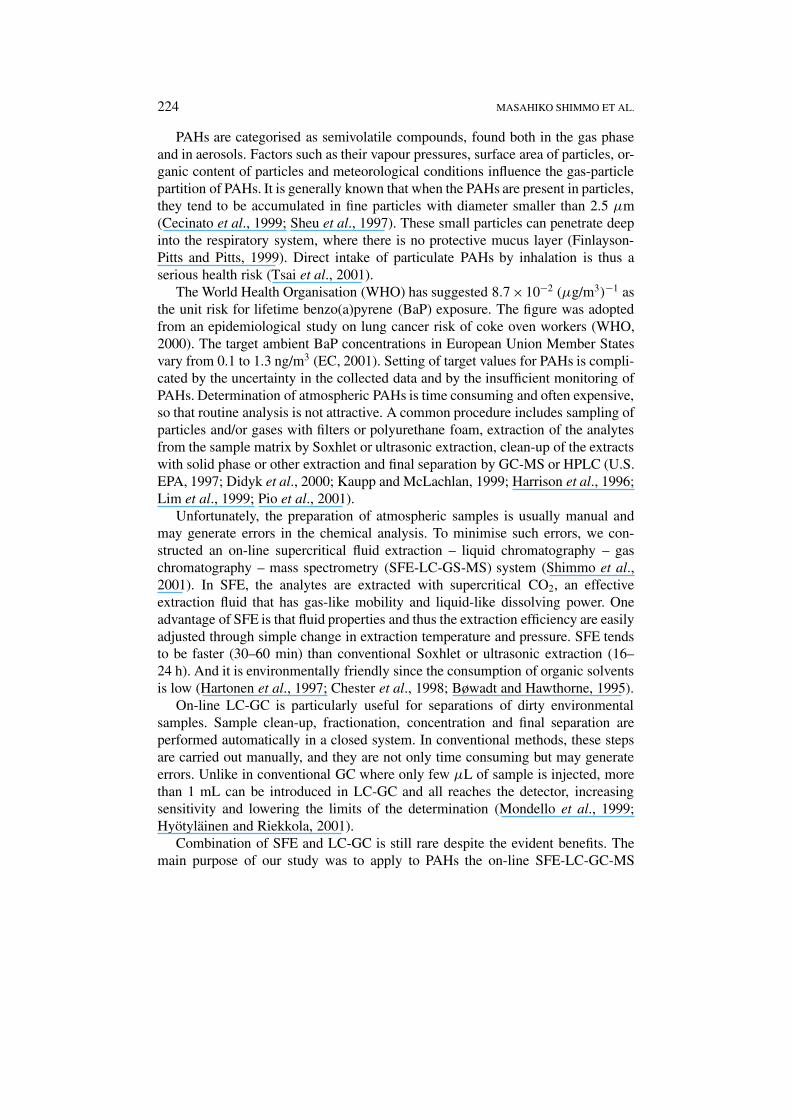
PAHs are categorised as semivolatile compounds, found both in the gas phaseand in aerosols. Factors such as their vapour pressures, surface area of particles, or-ganic content of particles and meteorological conditions influence the gas-particlepartition of PAHs. It is generally known that when the PAHs are present in particles,they tend to be accumulated in fine particles with diameter smaller than 2.5 µm(Cecinato et al., 1999; Sheu et al., 1997). These small particles can penetrate deepinto the respiratory system, where there is no protective mucus layer (Finlayson-Pitts and Pitts, 1999). Direct intake of particulate PAHs by inhalation is thus aserious health risk (Tsai et al., 2001).
The World Health Organisation (WHO) has suggested 8.7×10⁻² (µg/m3)−1 asthe unit risk for lifetime benzo(a)pyrene (BaP) exposure. The figure was adoptedfrom an epidemiological study on lung cancer risk of coke oven workers (WHO,2000). The target ambient BaP concentrations in European Union Member Statesvary from 0.1 to 1.3 ng/m3 (EC, 2001). Setting of target values for PAHs is compli-cated by the uncertainty in the collected data and by the insufficient monitoring ofPAHs. Determination of atmospheric PAHs is time consuming and often expensive,so that routine analysis is not attractive. A common procedure includes sampling ofparticles and/or gases with filters or polyurethane foam, extraction of the analytesfrom the sample matrix by Soxhlet or ultrasonic extraction, clean-up of the extractswith solid phase or other extraction and final separation by GC-MS or HPLC (U.S.EPA, 1997; Didyk et al., 2000; Kaupp and McLachlan, 1999; Harrison et al., 1996;Lim et al., 1999; Pio et al., 2001).
Unfortunately, the preparation of atmospheric samples is usually manual andmay generate errors in the chemical analysis. To minimise such errors, we con-structed an on-line supercritical fluid extraction – liquid chromatography – gaschromatography – mass spectrometry (SFE-LC-GS-MS) system (Shimmo et al.,2001). In SFE, the analytes are extracted with supercritical CO2, an effectiveextraction fluid that has gas-like mobility and liquid-like dissolving power. Oneadvantage of SFE is that fluid properties and thus the extraction efficiency are easilyadjusted through simple change in extraction temperature and pressure. SFE tendsto be faster (30–60 min) than conventional Soxhlet or ultrasonic extraction (16–24 h). And it is environmentally friendly since the consumption of organic solventsis low (Hartonen et al., 1997; Chester et al., 1998; Bøwadt and Hawthorne, 1995).
On-line LC-GC is particularly useful for separations of dirty environmentalsamples. Sample clean-up, fractionation, concentration and final separation areperformed automatically in a closed system. In conventional methods, these stepsare carried out manually, and they are not only time consuming but may generateerrors. Unlike in conventional GC where only few µL of sample is injected, morethan 1 mL can be introduced in LC-GC and all reaches the detector, increasingsensitivity and lowering the limits of the determination (Mondello et al., 1999;Hyötyläinen and Riekkola, 2001).
Combination of SFE and LC-GC is still rare despite the evident benefits. Themain purpose of our study was to apply to PAHs the on-line SFE-LC-GC-MS

PARTICLE SIZE DISTRIBUTION AND GAS-PARTICLE PARTITION OF PAHS 225
method optimised in our previous study (Shimmo et al., 2002). Atmosphericsamples in Helsinki were collected with a cascade impactor, filters and XAD-2adsorbent. Particle mass size distributions and gas-particle partitions of PAHs wereinvestigated.
2. Experimental
2.1. SAMPLING SITE
Atmospheric sampling of PAHs was carried out on the roof of the Departmentof Physical Sciences, University of Helsinki (60◦12′ N, 24◦58′ E and 50 m abovesea level) in a location where the major emission source of PAHs is traffic Thesampling site is about 6 km north-east of the city centre, and about 200 m awayfrom a busy road that feeds to a major motorway. Average weekday traffic at theentrance to the motorway for the year 2001 was 53000 vehicles. The correspondingnumber for heavy traffic at the same site was 5500, of which full and semi-trailersaccounted for 1660.
Impactor sampling was carried out three times: 28.09.2001–08.10.2001 (Sam-ple 1), 17.01.2002–25.01.2002 (Sample 2) and 01.02.2002–08.02.2002 (Sample 3).Temperature during sampling was +1 to +15 ◦C (average +10.2 ◦C) for Sample 1,–11 to +3 ◦C (average –0.7 ◦C) for Sample 2, and –11 to +5 ◦C (average +0.4 ◦C)for Sample 3. The air was humid during all sampling periods usually with morethan 80% relative humidity and with the occasional shower. The amount of solarradiation was limited during winter owing to the high latitude of Helsinki. Dur-ing the third sampling period, gases and particles were collected simultaneouslyonto quartz filter and XAD-2 adsorbent. At the same time, particle number sizedistribution was measured with a differential mobility particle sizer (DMPS). Theinstrument included a TSI model 3071 electrostatic classifier (EC) and TSI model3022 condensation particle counter (CPC). Aerosol was neutralised with TSI 3077aerosol neutraliser. The measured size range was from 7 to 400 nm with timeresolution of 10 min.
2.2. IMPACTOR SAMPLING
Aerosol particles were collected with a Dekati Low Pressure Impactor (model LP1,Dekati, Tampere, Finland). The cascade impactor consisted of 12 stages with 50%cutoff size: 0.27, 0.29, 0.31, 0.42, 0.61, 0.97, 1.5, 2.4, 3.6, 5.8, 9.7, and 14.9 µm(aerodynamic diameter) in 900 mbar vacuum with the air flow rate set at 14 L/min.Uncoated 25-mm glass fibre filters (Whatman, CF/C, Maidstone, U.K.) were ap-plied as impaction substrates (Alves et al., 2000; Sugiyama et al., 1999). The filterswere baked at 500 ◦C for 12 h and kept in a clean dessicator until the sampling.After sampling, each filter was transferred to a glass vial and stored at –20 ◦C indark. Two days before chemical analysis, the glass vials containing the filters weretransferred to a dessicator at 4 ◦C in the dark for drying.
226 MASAHIKO SHIMMO ET AL.
2.3. XAD-2 AND FILTER SAMPLING
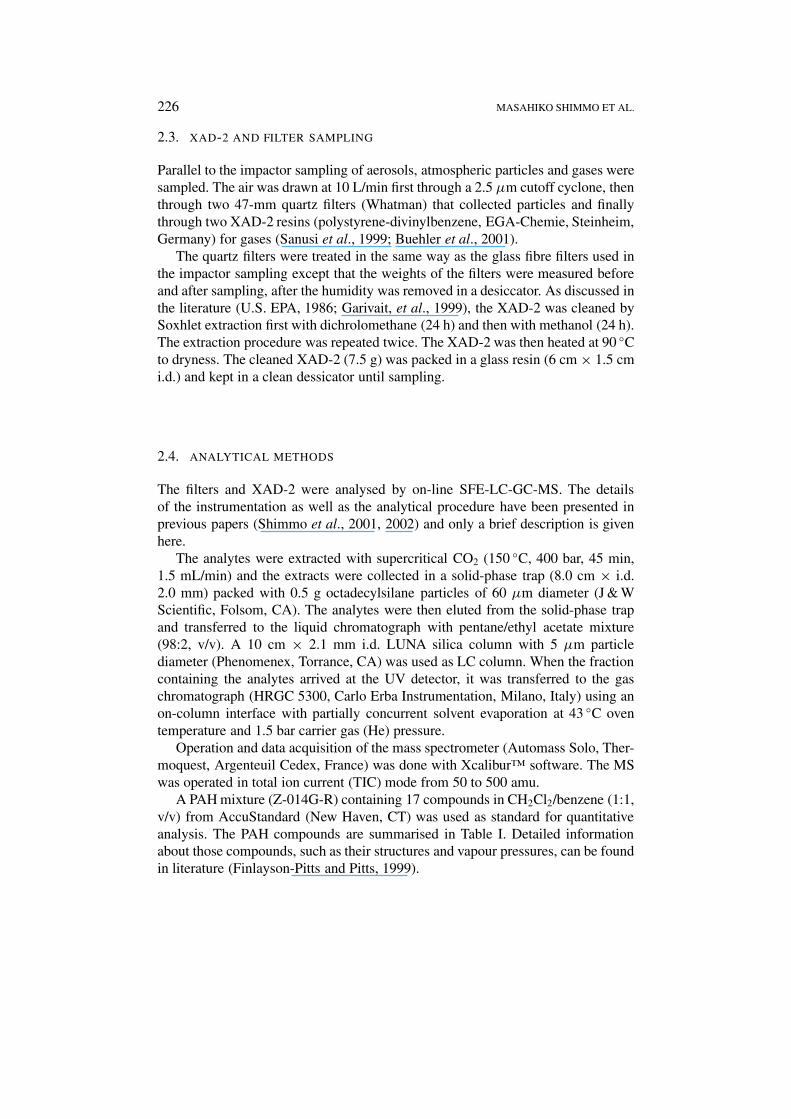
Parallel to the impactor sampling of aerosols, atmospheric particles and gases weresampled. The air was drawn at 10 L/min first through a 2.5 µm cutoff cyclone, thenthrough two 47-mm quartz filters (Whatman) that collected particles and finallythrough two XAD-2 resins (polystyrene-divinylbenzene, EGA-Chemie, Steinheim,Germany) for gases (Sanusi et al., 1999; Buehler et al., 2001).
The quartz filters were treated in the same way as the glass fibre filters used inthe impactor sampling except that the weights of the filters were measured beforeand after sampling, after the humidity was removed in a desiccator. As discussed inthe literature (U.S. EPA, 1986; Garivait, et al., 1999), the XAD-2 was cleaned bySoxhlet extraction first with dichrolomethane (24 h) and then with methanol (24 h).The extraction procedure was repeated twice. The XAD-2 was then heated at 90 ◦Cto dryness. The cleaned XAD-2 (7.5 g) was packed in a glass resin (6 cm × 1.5 cmi.d.) and kept in a clean dessicator until sampling.
2.4. ANALYTICAL METHODS
The filters and XAD-2 were analysed by on-line SFE-LC-GC-MS. The detailsof the instrumentation as well as the analytical procedure have been presented inprevious papers (Shimmo et al., 2001, 2002) and only a brief description is givenhere.
The analytes were extracted with supercritical CO2 (150 ◦C, 400 bar, 45 min,1.5 mL/min) and the extracts were collected in a solid-phase trap (8.0 cm × i.d.2.0 mm) packed with 0.5 g octadecylsilane particles of 60 µm diameter (J & WScientific, Folsom, CA). The analytes were then eluted from the solid-phase trapand transferred to the liquid chromatograph with pentane/ethyl acetate mixture(98:2, v/v). A 10 cm × 2.1 mm i.d. LUNA silica column with 5 µm particlediameter (Phenomenex, Torrance, CA) was used as LC column. When the fractioncontaining the analytes arrived at the UV detector, it was transferred to the gaschromatograph (HRGC 5300, Carlo Erba Instrumentation, Milano, Italy) using anon-column interface with partially concurrent solvent evaporation at 43 ◦C oventemperature and 1.5 bar carrier gas (He) pressure.
Operation and data acquisition of the mass spectrometer (Automass Solo, Ther-moquest, Argenteuil Cedex, France) was done with Xcalibur™ software. The MSwas operated in total ion current (TIC) mode from 50 to 500 amu.
A PAH mixture (Z-014G-R) containing 17 compounds in CH2Cl2/benzene (1:1,v/v) from AccuStandard (New Haven, CT) was used as standard for quantitativeanalysis. The PAH compounds are summarised in Table I. Detailed informationabout those compounds, such as their structures and vapour pressures, can be foundin literature (Finlayson-Pitts and Pitts, 1999).

PARTICLE SIZE DISTRIBUTION AND GAS-PARTICLE PARTITION OF PAHS 227
Table I. Names, abbreviations and molecular masses of PAHcompounds used in this study
Compounds Abbreviations Molecular masses
Naphthalene N 128
Acenaphthylene Ay 152
Acenaphthene Ace 154
Fluorene Fl 166
Carbazole Cab 167
Phenanthrene Phe 178
Anthracene Ant 178
Fluoranthene Fla 202
Pyrene Pyr 202
Benzo(a)anthracene BaA 228
Chrysene Chry 228
Benzo(b)fluoranthene BbF 252
Benzo(k)fluoranthene BkF 252
Benzo(a)pyrene BaP 252
Indeno(1,2,3-cd)pyrene IdP 276
Benzo(g,h,i)perylene Bghi 276
Dibenzo(a,h)anthracene DbA 278
3. Results and Discussion
3.1. SAMPLING
Material such as glass fibre or quartz tends to become contaminated during manu-facture and storage. It is important therefore to clean the material before sampling.The filters used in this study could be baked at high temperature to remove compo-nents causing interferences for GC analysis. High temperature could not be appliedin the cleaning of XAD-2, therefore, and solvents were used. No PAHs were ob-served in the adsorbent after the cleaning procedure. However, it was contaminatedwith some other compounds, from washing solvents or from the oven atmosphere.
Sampling of semivolatile compounds such as PAHs may be biased in impactorsampling owing to the evaporation of compounds in vacuum. Furthermore, humid-ity may increase the growth rate of aerosols in the impactor. Estimation of thosebiases is difficult especially when the sampling time had to be as long as one week.The sampling was, therefore, done under ambient conditions without correctionsof those biases.
In ideal impactor sampling, it is assumed that all particles larger than the cutoffsize stick when they strike the surface of the impaction substrate. In reality, someparticles will bounce off the substrate. The degree of ‘bounce off’ depends on the

228 MASAHIKO SHIMMO ET AL.
material of the filter used as the impaction substrate (Hinds, 1982). One effectiveimpaction substrate is greased aluminium foil (Hillamo and Kauppinen, 1991).Unfortunately the grease can cause problems in chemical analysis with GC. Wetherefore decided to apply uncoated glass fibre filters.
Sampling by impactor often also suffers from time resolution, which varieswith the number of substrates and the sampling flow rate. Long sampling timewas necessary in this study to obtain sufficient particle mass that the amounts ofPAHs were above the determination limits for each impaction substrate.
Particle sampling using quartz filters may be biased by the adsorption of gaseouscompounds on the front filter or the evaporation of compounds from collectedparticles (Mader and Pankow, 2001a). A backup filter was therefore installed toallow correction of biases by subtraction of the concentrations of the backup filtersfrom those of the front filters, assuming that the front and backup filters collect thesame amount of gases (Turpin et al., 2000; Peters et al., 2000). This assumptionmay not be correct, however, if the sampling is of long duration or the adsorptioncapacity of the filters is different (Kirchstetter et al., 2001).
Two XAD-2 resins were employed to estimate the breakthrough of gaseouscompounds. Significant breakthrough was not observed for XAD-2 sampling.
3.2. INSTRUMENT PERFORMANCE
The great advantage of on-line SFE-LC-GC-MS is the low limits of detection. Inaddition, only a small amount of sample is necessary because virtually all analytesreach the detector when the extraction is coupled to LC-GC. Also, filters could beanalysed without pretreatment (except drying). The limits of detection for PAHsextracted from impactor substrates varied from 0.01 to 0.02 ng, after the massspectra with TIC were reconstructed using specific ions of PAHs (i.e., molecularmass). The linear range of the instrument was excellent for 5–200 ng (R2 > 0.99).The relative standard deviations of repeated analysis (n = 5), calculated fromthe average of relative peak area (peak area of the analyte divided by peak areaof the standard), ranged from 0.5% (Pyr) to 23% (Ace). Some of the PAHs withidentical molecular mass were separated poorly, especially from dirty samples. Inthose cases, the peaks were calculated as their sum.
3.3. PARTICLE MASS DISTRIBUTION OF PAHs
Particle mass distributions of PAHs are shown in Figures 1–3. In general, concen-trations of light PAHs such as Fl and the sum of Phe and Ant are small owing to thehigh vapour pressure. These compounds also are distributed more or less evenly inall size ranges. There is a small peak at about 1 µm and a second peak in the coarseparticle size, >10 µm. As the PAHs increase in mass and their vapour pressuresdecrease, they become concentrated in narrower size range (Fla, Pyr and the sum of

PARTICLE SIZE DISTRIBUTION AND GAS-PARTICLE PARTITION OF PAHS 229
Figure 1. Mass distribution of PAH compounds for Sample 1 (28.09.2001–08.10.2001).
BaA and Chry). When the masses of PAHs exceed 252 amu, a sharp peak appearsat about 1 µm.
Table II summarises the total particulate PAH concentrations and their relativeamounts in particles smaller than 440 nm and 2.5 µm. For every PAH the totalconcentration was smaller for Sample 1 than Sample 2 and 3. This finding agreeswith our previous study, which showed that PAH levels in particles are highest inwinter due to the low temperature (Shimmo et al., 2002). In all cases, significant

230 MASAHIKO SHIMMO ET AL.
Tabl
eII
.To
tal
part
icul
ate
PAH
sco
llec
ted
bya
casc
ade
impa
ctor
(pg/
m3)
and
the
prop
orti
ons
ofsu
bmic
ron
(<44
0nm
)an
dfi
nepa
rtic
les
(<2.
5µ
m)
Sam
ple
1S
ampl
e2
Sam
ple
3
�(p
g/m
3)
<44
0nm
<2.
5µ
m�
(pg/
m3)
<44
0nm
<2.
5µ
m�
(pg/
m3)
<44
0nm
<2.
5µ
m
Fl
1247
%71
%12
721
%72
%14
226
%80
%
Phe
+A
nt34
36%
76%
665
23%
91%
444
25%
91%
Fla
135
47%
86%
1729
39%
96%
1145
23%
85%
Pyr
129
47%
86%
1557
38%
93%
1125
26%
84%
BaA
+C
hry
6252
%95
%43
146
%95
%37
224
%85
%
B(b
+k)
F12
570
%98
%29
534
%92
%41
522
%89
%
BaP
145
79%
100%
286
29%
91%
397
21%
92%
IdP
+B
ghi
3780
%10
0%14
822
%93
%99
26%
94%

PARTICLE SIZE DISTRIBUTION AND GAS-PARTICLE PARTITION OF PAHS 231
Figure 2. Mass distribution of PAH compounds for Sample 2 (17.01.2002–25.01.2002).
fractions (20–80%) of PAHs were associated with particles smaller than 440 nm.The fine particles (<2.5 µm) accounted for 70–100% of the particle associatedPAHs. Total concentrations of particle bound PAHs first increased with mass dueto decreasing vapour pressure. The highest level of PAHs was at amu 202 (Fla andPyr). Concentrations then decreased for the heavier PAHs. Similar observationshave been made in other studies (Kiss et al., 2001; Allen et al., 1996). This decrease

232 MASAHIKO SHIMMO ET AL.
Figure 3. Mass distribution of PAH compounds for Sample 3 (01.02.2002–08.02.2002).
in concentration may in part be due to the lower capacity of SFE to extract heavierPAHs caused by the limited solubility of those compounds in supercritical CO2. Ithas been shown that the extraction efficiency of Bghi and DbA collected on glassfibre filters is lower for SFE by 10–30% compared with that of Soxhlet extraction(Shimmo et al., 2002). Application of those values to correct the extraction effi-ciency of SFE must be, however, carried out with caution because Soxhlet is not
PARTICLE SIZE DISTRIBUTION AND GAS-PARTICLE PARTITION OF PAHS 233
free of errors either because of a number of manual sample pre-treatment stepsrequired before GC-MS analysis.
The results presented in Figures 1–3 and Table II agree reasonably well withthe results reported from other locations (Garivait et al., 2001; Sheu et al., 1997;Alves et al., 2000; Kaupp and McLachlan, 1999, 2000; Offenberg and Baker, 1999;Mészáros et al., 1997), though direct comparison may be misleading because thelevels of PAHs as well as the mass size distribution may vary significantly withthe sampling location (e.g., meteorological conditions, local sources of PAHs,sampling devices).
The difference in distribution patterns between light and heavier PAHs has beenexplained by gas-solid partitioning (Venkatarman et al., 1999; Allen et al., 1996).PAHs are emitted by sources (in this study mainly by vehicles) either as gases orin fine particles. The lighter PAHs with high vapour pressures repeat the processof condensation to particles and evaporation from particles. The degree of partitiondepends on the meteorological conditions (e.g., temperature, humidity), the amountof available surface of particles as well as contents of the particles (e.g., amount ofhydrophobic surface). As a result, the lighter PAHs are present in a wide range ofparticle sizes. The heavier PAHs, on the other hand, do not undergo the evaporationand condensation process owing to their lower vapour pressure. They stay in theparticles that are originally emitted, and they were observed in the accumulationmode as the particles grow.
3.4. COMPARISON OF IMPACTOR AND DMPS DATA
The mass distributions of PAHs were further evaluated with the particle numberdistribution obtained by the DMPS. In Figure 4(a), the solid line represents themeasured average of the number distributions for Sample 3. The number distribu-tion was then assumed to contain two log-normally distributed modes. The resultsof the curve fitting suggest the concentration median diameter (CMD) of 21 nmwith the geometrical standard deviation (GSD) of 1.71 for the first mode and CMDof 55 nm and GSD of 2.42 for the second mode. The patterns of these log-normaldistributions appear as dashed lines in Figure 4(a).
The volume median diameters (VMD) can be calculated from the log-normalnumber distributions using the equation (Seinfeld and Pandis, 1998)
ln(VMD) = ln(CMD) + 3 ln2(GSD) . (1)
Solving of the equation gave VMDs of 49 nm and 570 nm. The log-normal vol-ume distributions were further converted to the log-normal mass distributions bymultiplying by density. In this procedure, it was assumed that all the particles arespherical with uniform density of 1.0 g/cm3. The log-normal mass distributions areplotted as dashed lines in Figure 4(b). Despite the smaller number of particles inthe second mode, the mass occupied in that mode (peak at 570 nm) completelydominates the mass of the first mode (peak at 49 nm), as the volume increases

234 MASAHIKO SHIMMO ET AL.
Figure 4. (a) Average particle number distribution for Sample 3 measured by differentialmobility particle sizer (solid line). Log-normal fittings with two modes (dashed line). Thefitted curves show the concentration median diameters (CMD) of 21 and 55 nm with geomet-rical standard deviations of 1.71 and 2.42, respectively. (b) Mass distribution calculated fromthe log-normal fittings (dashed line). Density was assumed to be 1.0 g/cm3. Volume mediandiameters (VMD) for the curves were 49 and 570 nm. The second mode was extrapolatedfor larger diameters (dots). (c) Mass distribution of the total PAHs measured with a cascadeimpactor.
by an order of three with diameter. As a result, the mass distribution for the firstmode cannot even be seen in the figure. The mass distribution of the second modecontinued beyond the maximum particle size that was measured by the DMPS(400 nm). The dots in Figure 4(b) represent the curve of the second mode fitted asa log-normal function.
The mass size distribution of the sum of PAHs in Sample 3 is depicted inFigure 4(c). Good agreement can be seen for the data obtained by the impactorand the DMPS. These results support the general concept, as discussed above, thatthe heavier PAHs are generated by combustion sources that emit fine particles. Asparticles in accumulation mode tend to contain organic layers, and also becauseof their low vapour pressure, heavier PAHs are exclusively found in particles inaccumulation mode.
The results visualised in Figure 4 may be criticised on at least five counts.(1) The average density of particles is assumed to be 1.0 g/cm3, but it can behigher. We note, however, that higher density does not change the values of VMDs.(2) Particles are assumed to be uniform in density and shape, but are not. (3) The

PARTICLE SIZE DISTRIBUTION AND GAS-PARTICLE PARTITION OF PAHS 235
Table III. Gaseous and particulate concentrations of PAHs(pg/m3) and the proportion (%) of the gas concentrations forSample 3
Gas (pg/m3) Particle (pg/m3) Gas %
Ay 15 – 100
Ace 192 3 98
Fl 1862 21 99
Phe + Ant 1223 150 89
Fla 170 328 34
Pyr 399 587 40
BaA + Chry 74 530 12
B(b + k)F 37 498 7
BaP 13 565 2
IdP 8 212 4
Bghi 13 276 5
DbA – 195 0
DMPS did not measure particles larger than 400 nm, and it is possible that there isanother mode at the larger size. As a consequence, the curve fitting in Figure 4(b)may not be appropriate. (4) The mass of the total PAHs is only a fraction of thetotal mass of particles, and thus the mass distribution may appear different whenother compounds are taken into account. (5) Different definitions of diameters areused for the impactor (classical aerodynamic diameter) and DMPS measurements(electrical mobility equivalent diameter). If the average density of ambient particlesis greater than 1.0 g/cm3, as is often the case, the classical aerodynamic diameterbecomes smaller by a square root of the corresponding Stokes diameter that issimilar to the electrical mobility equivalent diameter (Seinfeld and Pandis, 1998).
3.5. GAS-PARTICLE PARTITION
XAD-2 and the quartz filter for Sample 3 were analysed to study the gas-particlepartition. The concentrations of gaseous and particulate PAHs as well as the pro-portions of gaseous PAHs are summarised in Table III. The total concentration ofindividual PAH varied from 15 to 1900 pg/m3. These concentrations are similar toor slightly lower than those found at other suburb locations with similar gas-particledistribution patterns, i.e., more gaseous phase for the lighter and more particulatephase for the heavier PAHs (Dachs and Eisenreich, 2000; Gigliotti et al., 2000;Harrison et al., 1996; Lim et al., 1999; Didyk et al., 2000; Garivait et al., 2001).
The concentrations of particulate PAHs presented in Table III differ from thoseobtained with the impactor (Table II). For smaller PAHs up to Pyr, the concen-

236 MASAHIKO SHIMMO ET AL.
trations obtained by the impactor sampling were higher than those obtained bythe filter sampling. However, the concentrations of large PAHs were lower in theimpactor sampling than the filter sampling. The difference was most pronouncedfor Fl, whose concentrations were 114 (142 × 80% pg/m3 for <2.5 µm) and21 pg/m3 in the impactor and filter sampling, respectively. This result is not con-sistent with the generally accepted theory that more volatile compounds shouldbe underestimated in impactor sampling because of enhanced vapour pressure invacuum.
One reason for the lower than expected concentrations of smaller PAHs in filtersampling than impactor sampling could be the use of a back filter for error correc-tion. Possiblly the back filter collected more gases than predicted, which caused thecorrected particle concentration (particle concentration = front filter – back filter)to be underestimated (Kirchstetter et al., 2001; Turpin et al., 2000). Although arte-facts caused by filter sampling have been investigated in laboratory scale and theirimportance has been pointed out (Mader and Pankow, 2000, 2001b), applicationof the results is not straightforward in field measurement. At the moment it is notknown which sampling method is more reliable.
The gas percentages of Fla and Pyr in this study (34 and 40%, respectively) werelower than those obtained in other studies: 83–85% Pyr in New Jersey (Gigliottiet al., 2000), 83–94% Pyr and 83–91% Fl in Birmingham (Harrison et al., 1996)and 70–90% Pyr in Bangkok (Garivati et al., 2001). The partition balance is moresensitive for Fla and Pyr than for lighter (exclusively in gas phase) and heavierPAHs (exclusively in particle phase). The probable reason for the smaller gaseouspartition in our case is the relatively low temperature during sampling (average+0.4 ◦C with min. –10 ◦C and max. +6 ◦C) which forced those compounds toassociate more strongly with particles.
To obtain a better understanding of the temperature dependence of gas-particlepartition, we compared partition coefficients (Kp) with the sub-cooled liquidvapour pressures of PAHs (Offenberg and Baker, 2002; Simcik et al., 1998;Garivait et al., 2001):
Kp = (F/TSP)
A, (2)
where Kp (m3/µg) is the partition coefficient, F and A are the particulate andgaseous concentrations of the analytes (ng/m3) and TSP (µg/m3) is the weight ofthe total suspended particulate matter on the filter. The measured partition coef-ficients were further correlated with the sub-cooled liquid vapour pressures, p0
L
(mmHg), of the analytes:
log(Kp) = m log(p0L) + b , (3)
where m and b are constants. The sub-cooled liquid vapour pressure is tempera-ture dependent. The values for several PAHs at the sampling temperature in thisstudy (0.4 ◦C) were calculated using the Clausius-Clapeyron equation and the data

PARTICLE SIZE DISTRIBUTION AND GAS-PARTICLE PARTITION OF PAHS 237
Figure 5. Relationship between partition coefficients (Kp) and temperature correlated sub-cooled vapour pressures (p0
L) for Sample 3.
obtained by Yamasaki et al. (1984), assuming that the enthalpy of vaporisation isconstant over small changes of temperature.
Figure 5 shows a linear relationship between log(Kp) and log(P0L). The regres-
sion was excellent (R2 > 0.96) with gradient of –0.66 and interception of –5.92. Inideal equilibrium, the gradient is expected to be –1. Wide varieties have been ob-served in the values of the gradient –(0.43–0.89), the interception –(2.26–6.66) andR2 (0.60–0.97) (Garivait et al., 2001; Lohmann et al., 2000; Simcik et al., 1998).The gradient depends on the nature of the sorption process and on the composi-tion and chemical activity coefficients of particles, which in turn are dependent onambient temperature and humidity, and on changes in PAH concentrations duringsampling (Goss and Schwarzenbach, 1998). The non-exchangeability of PAHs, andespecially light PAHs, may be important if they are irreversibly trapped inside thesoot particles during the emission process (Fernández et al., 2002). Volatilisationof particle phase PAHs from filter is relevant to underestimation of light particulatePAHs (Turpin et al., 2000). Thus, the nonequilibrium state is not necessarily thecase when the gradient deviates from –1 (Simcik et al., 1998).
Besides the biases associated with sampling and the nonequilibrium state inthe atmosphere, we should also note the errors caused by the analytical procedureitself. The extraction efficiency of a given method tends to be matrix dependent, soa difference in recoveries may be expected from filter and XAD-2. Furthermore,PAHs are bound to the same matrix in different strengths depending on their mass.It is known that the extraction by SFE may be less efficient for heavier PAHs thanfor light PAHs.

238 MASAHIKO SHIMMO ET AL.
4. Conclusions
The levels of PAHs measured in this study are comparable with those reportedfrom other urban areas (level of ng/m3). The mass distributions showed that mostof the PAHs were associated with fine particles (<2.5 µm in diameter). The distri-bution showed that the accumulation mode accounts for the highest concentrationsof PAHs, which is important information for inhalation toxicology. The gradientfor partition coefficient (logKp) expressed as a function of temperature correlatedsub-cooled vapour pressure (logp0
L) was –0.66. The value varied from the expectedvalue of –1 for equilibrium partition. However, still shallower gradients have beenreported in other studies. The particulate PAHs collected by impactor and filterdiffered significantly. The error estimation for atmospheric sampling has been animportant topic for decades, and requires further investigation.
Besides the attention needed to the non-equilibrium of gas-particle partitioningand sampling artefacts, errors during chemical analysis need to be minimised. Theon-line SFE-LC-GC-MS provided an alternative to conventional methods. Thoughthe instrument is fairly complicated, the whole analysis could be carried out semi-automatically in a closed system, providing more accurate results and low limits ofdetection.
Acknowledgements
The authors thank the Finnish Road Administration for traffic data, and the FinnishMeteorological Institute for temperature data. Mr. Pekka Tarkiainen, Workshopof Department of Chemistry, is acknowledged for technical support. This workwas supported by the University of Helsinki (three-year project 20588) and theAcademy of Finland (Kari Hartonen and Tuulia Hyötyläinen, project 48865).
References
Allen, J. O., Dookeran, N. M., Smith, K. A., Sarofim, A. F., Taghizadeh, K., and Lafleur, A. L., 1996:Measurement of polycyclic aromatic hydrocarbons associated with size-segregated atmosphericaerosols in Massachusetts, Environ. Sci. Technol. 30 (3), 1023–1031.
Alves, C. A., Pio, C. A., and Duarte, A. C., 2000: Particulate size distributed organic compounds ina forest atmosphere, Environ. Sci. Technol. 34 (20), 4287–4293.
Buehler, S. S., Basu, I., and Hites, R. A., 2001: A comparison of PAH, PCB, and pesticideconcentrations in air at two rural site on Lake Superior, Environ. Sci. Tecchnol. 35 (12),2417–2422.
Bøwadt, S. and Hawthorne, S. B., 1995: Supercritical fluid extraction in environmental analysis, J.Chromatogr. A 703 (1+2), 549–571.
Cecinato, A., Marino, F., Di Filippo, P., Lepore, L., and Possanzini, M., 1999: Distribution of n-alkanes, polynuclear aromatic hydrocarbons and nitrated polynuclear aromatic hydrocarbonsbetween the fine and coarse fractions of inhalable atmospheric particulates, J. Chromatogr. A846 (1+2), 255–264.
Chester, T. L., Pinkiston, J. D., and Raynie, D. E., 1998: Supercritical fluid chromatography andextraction, Anal. Chem. 70 (12), 301–319.

PARTICLE SIZE DISTRIBUTION AND GAS-PARTICLE PARTITION OF PAHS 239
Dachs, J. D. and Eisenreich, S. J., 2000: Adsorption onto aerosol soot carbon dominates gas-particlepartitioning of polycyclic aromatic hydrocarbons, Environ. Sci. Technol. 34 (17), 3690–3697.
Didyk, B. M., Simoneit, B. R. T., Pezoa, L. A., Riveros, M. L., and Flores, A. A., 2000: Urban aerosolparticle of Santiago, Chile: organic contents and molecular characterization, Atmos. Environ.34 (8), 1167–1179.
European Commission, 2001: Ambient air pollution by polycyclic aromatic hydrocarbons (PAH),Position Paper, Luxembourg.
Fernández, P., Grimalt, J. O., and Vilanova, R. M., 2002: Atmospheric gas-particle partitioning ofpolycyclic aromatic hydrocarbons in high mountain regions of Europe, Environ. Sci. Technol.36 (6), 1162–1168.
Finlayson-Pitts, B. J. and Pitts, J. N. Jr., 1999: Chemistry of the Upper and Lower Atmosphere:Theory, Experiments, and Applications, Academic Press, California, pp. 21–23.
Garivait, H., Polprasert, C., Yoshizumi, K., and Reutergardh, L. B., 1999: Airborne polycyclicaromatic hydrocarbons (PAH) in Bangkok urban air I. Characterization and quantification,Polycyclic Aromat. Compd. 13, 313–327.
Garivait, H., Polprasert, C., Yoshizumi, K., and Reutergardh, L. B., 2001: Airborne polycyclic aro-matic hydrocarbons (PAH) in Bangkok urban air II. Level and distribution, Polycyclic Aromat.Compd. 18, 325–350.
Gigliotti, C. L., Dachs, J., Nelson, E. D., Brunciak, P. A., and Eisenreich, S. J., 2000: Polycyclicaromatic hydrocarbons in the New Jersey coastal atmosphere, Environ. Sci. Technol. 34 (17),3547–3554.
Goss, K -W. and Schwarzenbach, R. P., 1998: Gas/solid and gas/liquid partitioning of organic com-ponents: Critical evaluation of the interpretation of equilibrium constants, Environ. Sci. Technol.32 (14), 2025–2032.
Harrison, R. M., Smith, D. J. T., and Luhana, L., 1996: Source appointment of atmospheric polycyclicaromatic hydrocarbons collected from an urban location in Birmingham, U.K., Environ. Sci.Technol. 30 (3), 825–832.
Hartonen, K., Bøwadt, S., Hawthorne, S., and Riekkola, M.-L., 1997: Supercritical fluid extractionwith solid-phase trapping of chlorinated and brominated pollutants from sediment samples, J.Chromatogr. A 774, 229–242.
Hillamo, R. E. and Kauppinen, E. I., 1991: On the performance of the Berner low pressure impactor,Aerosol Sci. Technol. 14 (1), 33–47.
Hinds, W. C., 1982: Aerosol Technology, Wiley, New York, p. 122.Hyötyläinen, T. and Riekkola, M.-L., 2001: Potential of on-line coupled liquid chromatography-gas
chromatography in the analysis of complex samples, Recent Res. Devel. Anal. Chem. 1, 21–43.Kaupp, H. and McLachlan, M .S., 1999: Atmospheric particle size distributions of polychlorinated
dibenzo-p-dioxins and dibenzofurans (PCDD/Fs) and polucyclic aromatic hydrocarbons (PAHs)and their implications for wet and dry deposition, Atmos. Environ. 33 (1), 85–95.
Kaupp, H. and McLachlan, M. S., 2000: Distribution of polychlorinated dibenzo-P-dioxins and fiben-zofurans (PCDD/Fs) and polycyclic aromatic hydrocarbons (PAHs) within the full size range ofatmospheric particles, Atmos. Environ. 34 (1) 73–83.
Kirchstetter, T. W., Corrigan, C. E., and Novakov, T., 2001: Laboratory and field investigation of theadsorption of gaseous organic compounds onto quartz filters, Atmos. Environ. 35 (9), 1663–1671.
Kiss, G., Puchony-Varga, Z., Tolnai, B., Varga, B., Gelencser, A., Krivácsy, Z., and Hlavay, J., 2001:The seasonal changes in the concentration of polycyclic aromatic hydrocarbons in precipitationand arosol near Lake Balaton, Hungary, Environ. Pollut. 114, 55–61.
Lim, L. H., Harrison, R. M., and Harrad, S., 1999: The concentration of traffic to atmosphericconcentrations of polycyclic aromatic hydrocarbons, Environ. Sci. Technol. 33 (20), 3538–3542.
Lohmann, R., Harner, T., Thomas, G. O., and Jones, K. C., 2000: A comparative study of the gas-particle partitioning of PCDD/Fs, PCBs, and PAHs, Environ. Sci. Technol. 34 (23), 4943–4951.

240 MASAHIKO SHIMMO ET AL.
Mader, B. T. and Pankow, J. F., 2000: Gas/solid partitioning of semivolatile organic compounds(SOCs) to air filters. 1. Partitioning of polychlorinated dibenzodioxins, polychlorinated dibenzo-furans and polycyclic aromatic hydrocarbons to Teflon membrane filters, Atmos. Environ. 34 (28),4879–4887.
Mader, B. T. and Pankow, J .F., 2001a: Gas/solid partitioning of semivolatile organic compounds(SOCs) to air filters. 2. Partitioning of polychlorinated dibenzodioxins, polychlorinated diben-zofurans, and polycyclic aromatic hydrocarbons to quartz fiber filters, Atmos. Environ. 35 (7),1217–1223.
Mader, B. T. and Pankow, J. F., 2001b: Gas/solid partitioning of semivolatile organic compounds(SOCs) to air filters. 3. An analysis of gas adsorption artifacts in measurements of atmosphericSOCs and organic carbon (OC). When using teflon membrane filters and quartz fiber filters,Environ. Sci. Technol. 35 (17), 3422–3432.
Mészáros, E., Barcza, T., Gelencsér, A., Hlavay, J., Kiss, G., Krivácsy, Z., Molnár, A., and Polyák, K.,1997: Size distributions of inorganic and organic species in the atmospheric aerosol in Hungary,J. Aerosol Sci. 28 (7), 1163–1175.
Mondello, L., Dugo, P., Dugo, G., Lewis, A. C., and Bartle, K. D., 1999: High-performance liquidchromatography coupled on-line with high resolution gas chromatography. State of the art, J.Chromatogr. A. 842 (1+2), 373–390.
Offenberg, J. H. and Baker, J. E., 1999: Aerosol size distributions of polycyclic aromatic hydrocar-bons in urban and over-water atmosphere, Environ. Sci. Technol. 33 (19), 3324–3331.
Offenberg, J. H. and Baker, J. E., 2000: The influence of aerosol size and organic carbon contenton gas/particle partitioning of polycyclic aromatic hydrocarbons (PAHs), Atmos. Environ. 36 (7),1205–1220.
Peters, A. J., Lane, D. A., Gundel, L. A., Northcott, G. L., and Jones, K. C., 2000: A comparison ofhigh volume and diffusion denuder samplers for measuring demivolatile organic compounds inthe atmosphere, Environ. Sci. Technol. 34 (23), 5001–5006.
Pio, C., Aves, C., and Duarte, A., 2001: Organic components of aerosols in a forested area of centralGreece, Atmos. Environ. 35 (2), 389–401.
Sanusi, A., Millet, M., Mirabel, P., and Wortham, H., 1999: Gas-particle partitioning of pesticides inatmospheric samples, Atmos. Environ. 33 (29), 4941–4951.
Seinfeld, J. H. and Pandis, S. N., 1998: Atmospheric Chemistry and Physics: From Air Pollution toClimate Change, Wiley, New York, p. 426.
Sheu, H.-L., Lee, W.-J., Lin, S. J., Fang, G.-C., Chang, H.-C., and You, W.-C., 1997: Particle-boundPAH contents in ambient air, Environ. Pollut. 96 (3), 369–382.
Shimmo, M., Hyötyläinen, T., Hartonen, K., and Riekkola, M.-L., 2001: On-line coupled super-critical fluid extraction-liquid chromatography-gas chromatography-mass spectrometry for theanalysis of organic acids, J. Microcol. Sep. 13 (5), 202–210.
Shimmo, M., Adler, H., Hyötyläinen, T., Hartonen, K., Kulmala, M., and Riekkola, M.-L., 2002:Analysis of particulate polycyclic aromatic hydrocarbons by on-line coupled supercriticalfluid extraction-liquid chromatography-gas chromatography-mass spectrometry, Atmos. Environ.36 (18), 2985–2995.
Simcik, M. F., Franz, T .P., Zhang, H., and Eisenreich, S. J., 1998: Gas-particle partitioning of PCBsand PAHs in the Chicago urban and adjacent coastal atmosphere: States of equilibrium, Environ.Sci. Technol. 32 (2), 251–257.
Sugiyama, T., Amagai, T., Matsushita, H., and Soma, M., 1999: Size distribution of indoor airborneparticulates collected by a low, Indoor Built. Environ. 8, 361–369.
Tsai, P.-J., Shieh, H.-Y., Lee, W.-J., and Lai, S.-O., 2001: Health-risk assessment for workers exposedto polycyclic aromatic hydrocarbons (PAHs) in a carbon black manufacturing industry, Sci. Total.Environ. 278, 137–150.
Turpin, B. J., Saxena, P., and Andrews, E., 2000: Measuring and simulating particulate organics inthe atmosphere: problems and prospects, Atmos. Environ 34 (18), 2983–3013.

PARTICLE SIZE DISTRIBUTION AND GAS-PARTICLE PARTITION OF PAHS 241
U.S. Environment Protection Agency, 1986: Modified method 5 sample train, Method 0010.U.S. Environment Protection Agency, 1997: Determination of polycyclic aromatic hydrocarbons in
ambient air using gas chromatography/mass spectrometry, Compendium method TO-13A.Venkataraman, C., Thomas, S., and Kulkarni, P., 1999: Size distribution of polycyclic aromatic
hydrocarbons – gas/particle partitioning to urban aerosols J. Aerosol Sci. 30 (6), 759–770.World Health Organization, 2000: Air Quality Guidelines for Europe, WHO European Series, WHO
Regional Bureau, Copenhagen.Yamasaki, H., Kuwata, K., and Kuge, Y., 1984, Determination of vapor pressure of polycyclic aro-
matic hyderocarbons in the supercooled liquid phase and their adsorption on airborne particulatematter, Nippon Kagaku Kaishi 8, 1324–1329.
Copyright © 2022 FDOKUMEN