Heavy metals, polycyclic aromatic hydrocarbons and polychlorinated biphenyls in surface sediments of...
12
Heavy metals, polycyclic aromatic hydrocarbons and polychlorinated biphenyls in surface sediments of the Naples harbour (southern Italy) Mario Sprovieri * , Maria Luisa Feo, Lidia Prevedello, Daniela Salvagio Manta, Simone Sammartino, Stella Tamburrino, Ennio Marsella Istituto per l’Ambiente Marino Costiero (IAMC)—CNR, Napoli, Italy Received 14 March 2006; received in revised form 20 October 2006; accepted 22 October 2006 Available online 8 December 2006 Abstract The Naples’s harbour is one of the largest and most important commercial and tourist port of the Mediterranean basin. It is located on the southeast coast of Italy and receives industrial and municipal wastewaters from the city of Naples. Due to its social and economic impact, a comprehensive assessment of levels and sources of contamination of bottom sediments in this area of the Mediterranean basin is essential to identify potential danger due to mobilization of contaminants produced by managing of the same sediments. In this study, superficial sediments collected from 189 sampling sites were analyzed for grain size, heavy metals (Cr, Cu, Ni, Pb, V, Zn, Co, Sn, Cd, Hg, As, Al and Fe), 16 priority polycyclic aromatic hydrocarbons (PAHs) and perylene and 38 individual polychlorinated biphenyl (PCB) congeners. Compared to the estimated local background, Cu, Zn, Pb, Cd, Sn and Hg show enrichment factors >3 and only Hg evidences a median value higher than the NOAA (effects range median) guidelines. Principal component analysis allowed us to clearly discriminate two areas mainly affected by heavy metals contamination and influenced by different sources related to industrial, commercial and/or urban activities. Priority PAHs are predominantly represented by three-five-ring compounds with concentrations ranging between 9 and 31 774 ng g 1 and frequently higher than the NOAA ER-M index. A prevalent pyrolitic origin of PAH was assessed on the basis of the relative abun- dance of the different congeners and selected isomer ratios. The concentrations of PCBs, as sum of the 38 congeners, ranged from 1 to 899 ng g 1 , with a predominance of highly chlorinated (tetra- and penta-chlorobiphenyls) congeners. WHO-TEQ values, calculated for the PCDD-like PCB congeners, suggest a relatively high level of toxicity. Generally, the concentration of PAHs and PCBs were higher near the sites of intense industrial, shipping and/or commercial activities suggesting a direct influence of these sources on the pollutant distribution patterns. Ó 2006 Elsevier Ltd. All rights reserved. Keywords: Heavy metals; Polycyclic aromatic hydrocarbons; Polychlorinated biphenyls; Naples’s harbour; Sediment toxicity 1. Introduction The Naples’s harbour receives municipal discharges (either untreated or with only primary treatment) of 1.5 million people. In addition, it is the receptor of multiple industrial activities (petroleum refineries, metallurgy, cement and food production), port activities (shipbuilding, good stocking, commercial and tourist transaction), com- mercial discharges, and urban wastewaters. Therefore, it represents an useful case study for investigating levels and typologies of heavy metals and organic compounds contamination in the bottom sediments of a high polluted central Mediterranean harbour area. 0045-6535/$ - see front matter Ó 2006 Elsevier Ltd. All rights reserved. doi:10.1016/j.chemosphere.2006.10.055 * Corresponding author. Present address: IAMC (CNR), Calata Porta di Massa, Interno Porto di Napoli 80133 Napoli, Italy. Tel.: +39 0815423818; fax: +39 0815423888. E-mail address: [email protected] (M. Sprovieri). www.elsevier.com/locate/chemosphere Chemosphere 67 (2007) 998–1009
Transcript of Heavy metals, polycyclic aromatic hydrocarbons and polychlorinated biphenyls in surface sediments of...

www.elsevier.com/locate/chemosphere
Chemosphere 67 (2007) 998–1009
Heavy metals, polycyclic aromatic hydrocarbonsand polychlorinated biphenyls in surface sediments
of the Naples harbour (southern Italy)
Mario Sprovieri *, Maria Luisa Feo, Lidia Prevedello, Daniela Salvagio Manta,Simone Sammartino, Stella Tamburrino, Ennio Marsella
Istituto per l’Ambiente Marino Costiero (IAMC)—CNR, Napoli, Italy
Received 14 March 2006; received in revised form 20 October 2006; accepted 22 October 2006Available online 8 December 2006
Abstract
The Naples’s harbour is one of the largest and most important commercial and tourist port of the Mediterranean basin. It is locatedon the southeast coast of Italy and receives industrial and municipal wastewaters from the city of Naples. Due to its social and economicimpact, a comprehensive assessment of levels and sources of contamination of bottom sediments in this area of the Mediterranean basinis essential to identify potential danger due to mobilization of contaminants produced by managing of the same sediments.
In this study, superficial sediments collected from 189 sampling sites were analyzed for grain size, heavy metals (Cr, Cu, Ni, Pb, V, Zn,Co, Sn, Cd, Hg, As, Al and Fe), 16 priority polycyclic aromatic hydrocarbons (PAHs) and perylene and 38 individual polychlorinatedbiphenyl (PCB) congeners.
Compared to the estimated local background, Cu, Zn, Pb, Cd, Sn and Hg show enrichment factors >3 and only Hg evidences a medianvalue higher than the NOAA (effects range � median) guidelines. Principal component analysis allowed us to clearly discriminate two areasmainly affected by heavy metals contamination and influenced by different sources related to industrial, commercial and/or urban activities.
Priority PAHs are predominantly represented by three-five-ring compounds with concentrations ranging between 9 and 31774 ng g�1
and frequently higher than the NOAA ER-M index. A prevalent pyrolitic origin of PAH was assessed on the basis of the relative abun-dance of the different congeners and selected isomer ratios.
The concentrations of PCBs, as sum of the 38 congeners, ranged from 1 to 899 ng g�1, with a predominance of highly chlorinated(tetra- and penta-chlorobiphenyls) congeners. WHO-TEQ values, calculated for the PCDD-like PCB congeners, suggest a relatively highlevel of toxicity.
Generally, the concentration of PAHs and PCBs were higher near the sites of intense industrial, shipping and/or commercial activitiessuggesting a direct influence of these sources on the pollutant distribution patterns.� 2006 Elsevier Ltd. All rights reserved.
Keywords: Heavy metals; Polycyclic aromatic hydrocarbons; Polychlorinated biphenyls; Naples’s harbour; Sediment toxicity
1. Introduction
The Naples’s harbour receives municipal discharges(either untreated or with only primary treatment) of 1.5
0045-6535/$ - see front matter � 2006 Elsevier Ltd. All rights reserved.
doi:10.1016/j.chemosphere.2006.10.055
* Corresponding author. Present address: IAMC (CNR), Calata Portadi Massa, Interno Porto di Napoli 80133 Napoli, Italy. Tel.: +390815423818; fax: +39 0815423888.
E-mail address: [email protected] (M. Sprovieri).
million people. In addition, it is the receptor of multipleindustrial activities (petroleum refineries, metallurgy,cement and food production), port activities (shipbuilding,good stocking, commercial and tourist transaction), com-mercial discharges, and urban wastewaters. Therefore, itrepresents an useful case study for investigating levelsand typologies of heavy metals and organic compoundscontamination in the bottom sediments of a high pollutedcentral Mediterranean harbour area.

M. Sprovieri et al. / Chemosphere 67 (2007) 998–1009 999
A previous study (Adamo et al., 2005), conducted on 20top sediment samples from the harbour of Naples provideda first picture of the heavy metals contamination of thearea emphasizing the risk associated to the elevated mobil-ity of Zn, Cd and Cr that the authors suggested to be sub-stantially tied to the organic and more labile mineralogicalphases. However, the sparseness of the collected samplesdid not allowed the authors to clearly define the contami-nation sources for the different heavy metals. On the otherhand, concentrations of organic compounds have neverbeen determined in these sediments, thus limiting a clearunderstanding of modes and sources of contamination inthis key industrialised and commercial area of the Mediter-ranean basin.
Sediments are considered a suitable medium to study thecontamination of aquatic environments because they repre-sent the sink of multiple contaminant sources. Moreover,dredging of seaports is currently highly required to main-tain navigational depth in harbours. Removed sedimentsare often heavily contaminated, resulting in waste manage-ment problem. Actually, pollutants are not necessarily per-manently immobilized in dredged sediments, and heavymetals and organic compounds remobilisation from sedi-ments due to bioturbation and resuspension constitutes apotential danger.
Polychlorinated biphenyls (PCBs), were detected inworldwide investigated marine sediments over the last30 years. Despite a 1970s ban on the use of PCBs in manycountries these compounds are ubiquitous and persistentin various environmental media and biota. Thus, theyremain a cause for concern. Due to their high persistence,their hydrophobic nature, and their low solubility inwater, PCBs are adsorbed on the particulate mattersand finally accumulate in sediments (Kang et al., 2000;Wiberg and Harris, 2002). Consequently, the sedimentsapart from the final acceptors of these pollutants, act assecondary contamination sources (Lee et al., 2001) in rela-tion to sudden changes in environmental physico-chemicalcharacteristic. Similarly, polycyclic aromatic hydrocar-bons (PAHs) are a group of organic contaminants, manyof which are known to be mutagenic and carcinogenic(e.g., Connel et al., 1997). Combustion of fossil fuels,waste incineration, and oil spills are the potential sourcesof PAHs in the environment (e.g., Law, 1994; Savinovet al., 2000; Kannan et al., 2005). Because of their hydro-phobicity, also PAHs show high persistence in marinesediments.
The aims of the study can be summarised as follows: (i)analysis of the degree of contamination (by heavymetals, PAHs and PCBs) of the surface sediments of theNaples harbour, (ii) comparison of the results obtainedfor each class of contaminants with worldwide distributedcommercial and industrial ports, (iii) assessment of thesources of the different pollutants, and (iv) evaluation ofthe potential toxic effects of contaminants bound to bottomsediments.
2. Study area
Naples, a heavily populated and industrialized city ofsouthern coast of Italy, has one of the largest and mostimportant commercial port of the Mediterranean (Fig. 1).Industrial complexes, and intense commercial and trans-port activities insist on this area. The port has twoentrances and it is subdivided in six principal districts(Fig. 1) characterised by a direct influence of different activ-ities (commercial, industrial, shipping, tourism, etc.).
The bottom topography is rather complex and shows aprogressive deepening towards the outer part of the harbour.
3. Materials and methods
3.1. Sampling
Surface sediment samples (0–20 cm, following the direc-tives of the national program for assessment of marine pol-lution of highly contaminated Italian coastal areas) werecollected from 189 locations (Fig. 1) of the Naples harbourin November 2004. A differential global positioning system(DGPS) was used to identify each location precisely. Sedi-ments were collected using a hydraulic vibro-corer with aninner diameter of 10 cm, and 6 m long. Three sub-sampleswere collected from the superficial 20 cm of sediments,homogenized with a plastic spoon, placed into pre-cleanedhigh-density polyethylene (HDPE) bottles for chemicalanalyses and stored at �18 �C on board within an hourof collection.
3.2. Grain size analysis
Samples for grain size analysis were treated with H2O2,then washed and dried at 40 �C. Grain size analyses werecarried out to establish the percentage of silt and clay(<0.063 mm) using a laser particle-size analyzer, and sandfraction (2–0.063 mm) by means of a microsieve. A coarserfraction (>2 mm), made up of gravels, was sometimespresent. The Shepard (1954) grain-size classification wasused.
3.3. Total organic carbon (TOC)
Total organic carbon was determined by a ThermoElec-tron Flash EA 1112 elemental analyzer on freeze-driedpowdered samples. Carbonates were eliminated through aHCl treatment in silver capsules.
3.4. Redox potential
After collection, each sample was immediately analysedfor Eh using a 7-cm long microprobe (Hanna ModelHI3190T Platinum Redox Electrode). Probe was calibratedprior to use for each sample.

Fig. 1. Location map of the studied samples and subdivision of the harbour area in six different districts (see text for details).
1000 M. Sprovieri et al. / Chemosphere 67 (2007) 998–1009
3.5. Heavy metals
Heavy metal concentrations were measured by totaldigestion of samples previously air-dried and sievedthrough a 2 mm sieve, with HNO3:HCl:HF = 3:1:1 acidin Teflon bombs using a microwave oven (CEM Mars 5equipment) at controlled pressure and temperature (step1: 300 psi, 165 �C, 900 W power for 10 min; step 2:300 psi, 175 �C, 900 W power for 5 min) followed by a finalstep (step 3: 100 psi, 170 �C, 600 W power for 10 min) withboric acid. Arsenic, Cr, Cu, Ni, Pb, V, Zn, Al and Fe con-centrations were measured by inductively coupled plasmaatomic absorption (ICP-AES) using a Varian Vista MPX.Concentrations of Co, Sn, Cd and Hg were measured byinductively coupled plasma mass spectrometry (ICP-MS)using the Varian ICP-MS. All calibration standards wereprepared in the same acid matrix used for the sedimentanalyses. Replicated measures of international referencematerials (PACS2), reagent blanks, and duplicated sedi-ment samples (about 20% of the total number of samplesrandomly selected from the set) were used to assess accu-racy (estimated as >95%) and precision (estimated on trip-licate samples >93%).
3.6. Polycyclic aromatic hydrocarbons (PAHs)
Only the PAHs indicated by the US-EPA Clear WaterAct as priority ones, were analysed: NAP, naphthalene;ACP, acenaphthene; ACL, acenaphthylene; FL, fluorene;PHE, phenanthrene; AN, anthracene; PHL, fluoranthene;PYR, pyrene; B(a)A, benzo[a]anthracene; CRY, chrysene;B(b)F, benzo[b]fluoranthene; B(k,j)F, benzo[k,j]fluoranth-ene; B(e)P, benzo[e]pyrene; B(a)P, benzo[a]pyrene; IND,indeno[1,2,3-cd]pyrene; D(a,h)A, dibenzo[a,h]anthracene;B(g,h,i)P, benzo[ghi]perylene.
Sediment samples were air dried and homogenised beforethe analysis. Two grams sediment samples together with a1.0 ml solution of six deuterated PAHs were extracted withaccelerate solvent extraction (DIONEX ASE 200) using hex-ane/acetone (80:20 v/v) mixture. The extraction cells wereheated to 113 �C until the pressure reached 1500 psi. Thesolution of deuterated PAHs included: acenaphthene-d10,fluoranthene-d10, phenantrene-d10, benzo[a]anthracene-d12,benzo[a]pyrene-d12, dibenzo[a,h]anthracene-d12. The extracts,concentrated and re-dissolved with 0.5 ml of cyclohexane,were purified by column chromatography using solid phaseextraction cartridges containing 2 g silica and eluted first
M. Sprovieri et al. / Chemosphere 67 (2007) 998–1009 1001
with 10 ml of n-hexane and then with 20 ml cyclohex-ane:acetone (70:30) mixture. The final extracts were con-centrated and re-dissolved with 400ll solution of twodeuterated PAHs (acenaphthylene-d8 and chrysene-d12)and finally analysed by capillary column gas chromatogra-phy with mass spectrometric detection. An analyticalcolumn DB-5 (95% dimethyl–5% diphenylpolysiloxane)30 m · 0.25 mm · 0.25 mm was used. The temperature pro-gram was the following: 80 �C (held for 1.5 min) to 200 �Cat 15 �C/min, then 305 �C (held for 10 min) at 7 �C/min.The injection volume was 1 ll in splitless mode. Operativeconditions were: ion source 280 �C, inlet 250 �C and carriergas He 1.2 ml/min. The mass spectrometer was operated atan EI of 70 eV and in selective ion monitoring (SIM) mode.Laboratory quality control procedures included analyses ofblanks, reference material and spiked samples. The refer-ence material used for quality control was BCR 535.Instrument stability and response was checked using NISTstandard solutions. Estimated recoveries for each analyteranged between 94% and 107%. Accuracy estimated onmultiple analysis of the reference material was estimatedbetter than ±10% for each single analyte. Reproducibilityestimated on triplicate samples was >90%. The limit ofdetection was estimated as 1 ng g�1 for each PAHs.
3.7. Polychlorinated biphenyls (PCBs)
Thirty-eight different PCB congeners (29, 52, 49, 44, 28,74, 70, 66, 95, 60, 101, 99, 81, 82, 87, 110, 77, 151, 149, 118,114, 146, 153, 105, 179, 138, 158, 126, 166, 187, 183, 128,177, 156, 180, 169, 170, 189) were analysed. It implies thesum of PCBs (expressed as
PPCB) is underestimated. Sed-
iment samples were air dried and homogenised before theanalysis, then 2 g together with a 1.0 ml solution of 13CPCB-105 were extracted with accelerate solvent extraction(DIONEX ASE 200) using a hexane/acetone (80:20 v/v).The extraction cells were heated to 113 �C until the pres-sure reached 1500 psi. The extracts concentrated and re-dissolved with a 0.5 ml hexane:isoctane (1:1 v/v) mixture,were then purified using Florisil (1 g) column and elutedwith a 20 ml mixture hexane:isoctane (1:1 v/v). Theextracts, concentrated and re-dissolved with dichlorometh-ane, were shaked with mercury to favour the precipitationof HgS, then eliminated by filtration on Na2SO4 columnswith pentane. The final solutions were concentrated andre-dissolved with 400 ll internal standard solution ofPCB-209 and finally analysed by capillary column gaschromatography with mass spectrometric detection. Ananalytical column DB-5 (95% dimethyl–5% diphenyl-polysiloxane) 30 m · 0.25 mm · 0.25 lm was used. Thetemperature program was the fallowing: 40 �C (held for2 min) to 140 �C at 18 �C/min, then 290 �C at 6 �C/minand finally 315 �C at 50 �C/min. A volume of 1 ll wasinjected in splitless mode. Operative conditions were: ionsource 280 �C; inlet 250 �C and carrier gas He 1.4 ml/min. The mass spectrometer was operated at an EI of70 eV in selective ion monitoring (SIM) mode. Laboratory
quality control procedures included analyses of sampleblanks, reference material and spiked samples. The refer-ence material used for quality control was BCR 536.Instrument stability and response was checked using NISTstandard solutions. Estimated recoveries for each analyteranged between 96% and 105%. Accuracy estimated onmultiple analysis of the reference material was estimatedbetter than ±10% for each single analyte. Reproducibilityestimated on triplicate samples was >95%. The limit ofdetection was estimated as 1 ng g�1 for each PCBs. Allresults were calculated with respect to dry weight (dry wt).
3.8. Geostatistics
Spatial georeferenced data were processed with the ISA-TIS geostatistical software package. Geodetic reference sys-tem is the Universal Transverse Mercator (fuse 33)projection on the ellipsoid World Geodetic System (WGS,1984). All the information were managed in a GIS georefer-enced environment, using ArcGis 9.0 software package. Fac-tor analysis performed with the ISATIS geostatisticalsoftware package was applied to reduce the number ofdimensions and extracting synthetic information about thedistribution of heavy metals in the studied environment.The extracted factor scores were exported in a geostatisticalframework, in order to treat them with structural analysisand Kriging (factorial Kriging). Omnidirectional vario-grams were computed for each factor and kriging estima-tions were returned. In such a way the spatial distributionof the single factor was taken into account, in order to imple-ment the interpretation of spatial distribution of the varianceexplained by the variables. Due to the lognormal like distri-bution of most of them, in the statistical calculations, themedian parameter, rather than the mean one, was selectedas the most appropriate measure of centrality of distribution.
4. Results
4.1. Grain size, total organic carbon (TOC) and redox
potential
Sediment grain size fractions were classified as fine (silt-clay; <0.063 mm), sand (0.063–2 mm) and gravel (>2 mm).Sand generally predominates (>50%) in bottom sedimentsexcept at stations located in the shipping and industrialareas where two ‘‘plumes’’ of fine sediments, NE–SW andNW–SE elongated, were recognised.
Total organic carbon (TOC) contents range between0.05% and 4.02%, with a median value of 1.13%. No statis-tically significant correlation between TOC and grain sizefractions was detected.
Eh values measured in sediments range between �507and 498 eV, with a median value of �170 eV. Positive val-ues were recorded only in the external area of the harbourwhere a more efficient bottom water circulation advects O2
at the water-sediments interface.

1002 M. Sprovieri et al. / Chemosphere 67 (2007) 998–1009
4.2. Heavy metals
Concentration values and basic statistics of the measuredheavy metals are synthetically presented in the Box-Wiskersplots of Fig. 2A. Among the metals, Zn has the highest val-ues (17–7234 mg kg�1), followed by Cu (12–5743 mg kg�1),Pb (19–3083 mg kg�1), V (37–2114 mg kg�1), Cr (7–1798 mg kg�1), and Ni (4–362 mg kg�1). Lower concentra-tions were found for Sn (1–265 mg kg�1), As (1–1121mg kg�1), Co (1–30 mg kg�1), Cd (0.01–3 mg kg�1) andHg (0.01–139 mg kg�1). Compared to the local backgroundvalues (Fig. 2B), calculated for each element as median of120 samples collected at 480–500 cm below seafloor (andassumed as free from anthropic influences), superficial sed-iments generally show enrichment factors (i.e.,EF = [metal]surface sediment/[metal]estimated local background or
average shales) higher than 3 for Cr, Cu, Pb, Zn, Cd, Sn andHg. On the contrary, Ni, V, Co and As appear not to beenriched in superficial sediment with respect to their back-
Fig. 2. (A) Basic statistics of the concentration values measured forselected heavy metals. Vertical thick bar indicate the ERL-ERM concen-tration interval (Sediment Quality Guidelines – SQGs from NOAA). (B)Estimated enrichment factors versus estimated local background (grayfilling) and average shale concentration values (black filling) such asreported by Taylor et al. (1983).
grounds. Compared with the NOAA ER-L (effects ran-ge � low) and ER-M (effects range � median) guidelines(Long et al., 1995; Ligero et al., 2002), most heavy metals,but not Hg, fall below the ER-M level.
Arsenic concentrations, though high (EF > 12) com-pared to average shales (Taylor et al., 1983), are very sim-ilar to the local background. This feature reflects the localinfluence of active hydrothermal circulation, with relateddissolution of As-bearing sulphides, already documentedby De Vivo et al. (1989) and Federico et al. (2002) in differ-ent areas of the Gulf of Naples.
Grain size and total organic carbon (TOC) are not cor-related to any of the heavy metals, this suggesting a domi-nant role of anthropic sources in driving their distributions.
4.3. Polycyclic aromatic hydrocarbons
Total concentrations of the priority PAHs vary from 9to 31774 ng g�1 (Table 1). In particular, phenanthrene, flu-oranthene, pyrene, benzo[a]anthracene, chrysene and ben-zo[a]pyrene were the most important contributors (morethan 6% each) to PAH burdens in sediments (Table 1).Generally, three and four rings PAHs appear dominantin the studied sediments with median concentration valuesgenerally higher than the 60–70% of the PAH total concen-trations. The PAH distribution pattern shows a ratherpatched behaviour with highest values (medians of 3074and 2351 ng g�1, respectively) generally localised in theshipping and commercial areas and in the internal part ofmost of the inner docks.
Neither grain size nor TOC are correlated with the dis-tribution of either
PPAHs or single congeners.
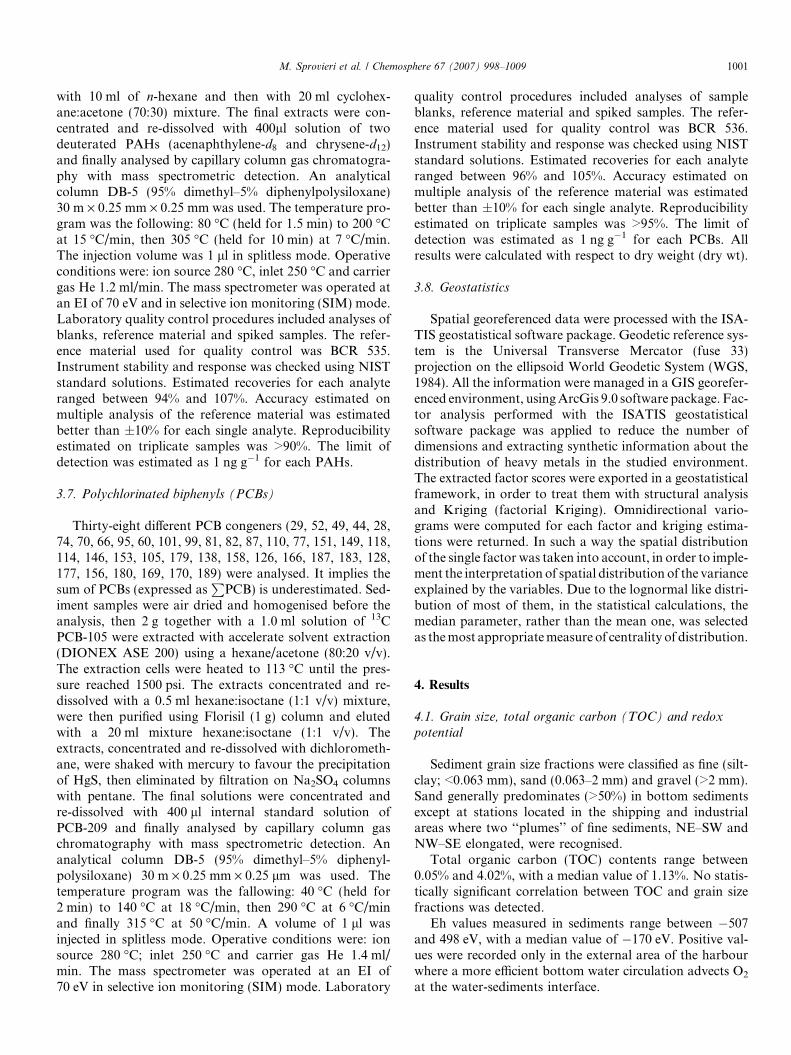
When compared to other important harbour areas(Fig. 3), the PAH concentrations in superficial sedimentsof the Naples harbour show a median and a range of var-iability higher than most of other Mediterranean and Euro-pean ports (Sardinia, Corsica, Spain, France and England)but similar to those measured in USA, Middle East andAustralian commercial harbours.
Polychlorinated biphenyls (PCBs)
The distribution of PCBs in the Naples harbour showsthe highest level (up to �899 ng g�1) in the tourist andcommercial areas and more homogeneous values (medianof 41 ng g�1) in the remaining zones (Table 1).
The tetra-chlorobiphenyls (T4CB), penta-chlorobiphe-nyls (P5CB), and hexa-chlorobiphenyls (H6CB), accountedfor 75–80% of the total measured PCBs (Table 1).
The general uniformity in the pattern of PCB distribu-tion and composition in the superficial sediments of theNaples’s harbour suggests: (i) the existence of a singlemajor source in the area, possibly related to the industrialactivities (intense use of heat transfer fluids, hydraulic flu-ids, solvent extenders, flame retardants and dielectric flu-ids); and (ii) minor effects of sediment redistributionprocesses on the relative abundances of PCB congeners.

Table 1Basic statistics for single PAH congeners,
PPAHs, carcinogenic PAH (CPAHs),
PPCBs and different groups of PCB congeners, TEQPAH and TEQPCB. Results are arranged in different districts as defined in Fig. 1
District NAP
(mg kg�1)
ACP
(mg kg�1)
ACL
(mg kg�1)
FL
(mg kg�1)
PHE
(mg kg�1)
AN
(mg kg�1)
PHL
(mg kg�1)
PYR
(mg kg�1)
B(a)A
(mg kg�1)
CRY
(mg kg�1)
B(b)F
(mg kg�1)
B(k,j)F
(mg kg�1)
B(e)P
(mg kg�1)
B(a)P
(mg kg�1)
IND
(mg kg�1)
D(a,h)A
(mg kg�1)
B(g,h,i)P
(mg kg�1)
CPAH
(mg kg�1)
PPAH
(mg kg�1)
T3CB
(mg kg�1)
T4CB
(mg kg�1)
P5CB
(mg kg�1)
H6CB
(mg kg�1)
H7CB
(mg kg�1)
PPCB
(mg kg�1)
TEQPCB
(ng g�1)
TEQPAH
(pg g�1)
Commercial area
Min. 0.001 0.001 0.001 0.001 0.001 0.001 0.001 0.001 0.001 0.001 0.001 0.001 0.001 0.001 0.001 0.001 0.001 0.003 0.009 0.001 0.001 0.002 0.002 0.001 0.008 0.001 0.006
Max. 0.059 0.239 1.496 1.967 4.837 0.887 3.286 2.765 0.710 2.140 0.976 0.384 0.721 0.953 2.304 4.160 3.893 9.102 31.774 0.004 0.045 0.066 0.079 0.051 0.193 0.388 4.528
Mean 0.014 0.027 0.188 0.109 0.447 0.218 0.355 0.311 0.232 0.281 0.230 0.117 0.199 0.278 0.245 0.214 0.217 1.199 3.682 0.001 0.014 0.025 0.023 0.016 0.079 0.092 0.614
Dev.st. 0.017 0.041 0.253 0.298 0.815 0.206 0.537 0.454 0.172 0.346 0.261 0.105 0.177 0.258 0.466 0.774 0.589 1.932 5.769 0.001 0.011 0.020 0.021 0.014 0.061 0.106 0.902
Median 0.006 0.014 0.112 0.039 0.242 0.189 0.219 0.203 0.217 0.190 0.158 0.094 0.151 0.209 0.142 0.035 0.132 0.760 2.351 0.001 0.013 0.022 0.013 0.012 0.066 0.046 0.310
Eastern area
Min. 0.001 0.001 0.001 0.001 0.001 0.001 0.001 0.001 0.001 0.001 0.001 0.001 0.001 0.001 0.001 0.001 0.001 0.003 0.009 0.001 0.001 0.001 0.001 0.001 0.003 0.001 0.002
Max. 1.385 0.041 2.514 0.277 2.306 0.610 0.632 0.762 1.784 2.027 1.389 0.492 0.992 1.559 0.213 0.102 0.266 5.047 17.351 0.008 0.144 0.050 0.100 0.068 0.244 0.282 1.973
Mean 0.071 0.010 0.237 0.043 0.207 0.087 0.166 0.178 0.160 0.180 0.119 0.070 0.097 0.139 0.066 0.030 0.069 0.514 1.928 0.002 0.016 0.010 0.020 0.010 0.058 0.049 0.198
Dev.st. 0.271 0.011 0.518 0.071 0.442 0.127 0.183 0.197 0.352 0.397 0.271 0.104 0.198 0.306 0.073 0.031 0.075 1.034 3.628 0.002 0.036 0.014 0.025 0.017 0.070 0.073 0.378
Median 0.006 0.008 0.033 0.014 0.115 0.058 0.131 0.135 0.053 0.085 0.035 0.042 0.035 0.049 0.040 0.017 0.051 0.193 0.906 0.001 0.003 0.005 0.012 0.004 0.033 0.021 0.105
External area
Min. 0.001 0.001 0.001 0.001 0.001 0.001 0.001 0.001 0.001 0.001 0.001 0.001 0.001 0.001 0.001 0.001 0.001 0.003 0.009 0.001 0.001 0.001 0.001 0.001 0.003 0.005 0.002
Max. 0.045 0.107 1.057 0.229 1.483 0.833 1.133 0.855 0.760 0.934 1.572 0.571 1.067 1.359 0.307 0.111 0.260 4.109 12.680 0.001 0.006 0.009 0.012 0.007 0.033 0.218 1.629
Mean 0.010 0.013 0.183 0.035 0.291 0.156 0.280 0.246 0.193 0.209 0.275 0.119 0.210 0.265 0.095 0.038 0.090 0.866 2.710 0.000 0.003 0.003 0.003 0.002 0.013 0.081 0.296
Dev.st. 0.013 0.027 0.308 0.059 0.411 0.246 0.339 0.258 0.220 0.251 0.448 0.161 0.294 0.393 0.095 0.031 0.093 1.187 3.647 0.000 0.002 0.003 0.004 0.002 0.010 0.099 0.520
Median 0.003 0.001 0.042 0.013 0.115 0.047 0.174 0.174 0.147 0.137 0.059 0.046 0.059 0.071 0.060 0.028 0.051 0.364 1.227 0.001 0.004 0.003 0.001 0.002 0.010 0.012 0.112
Industrial area
Min. 0.001 0.001 0.001 0.001 0.001 0.001 0.001 0.001 0.001 0.001 0.001 0.001 0.001 0.001 0.001 0.001 0.001 0.003 0.009 0.001 0.001 0.001 0.001 0.001 0.001 0.001 0.004
Max. 0.102 0.087 1.132 0.275 1.362 0.367 6.061 0.568 0.480 0.624 0.681 2.805 0.458 4.597 0.268 0.290 0.247 6.316 20.403 0.003 0.042 0.068 0.056 0.034 0.146 0.304 4.723
Mean 0.022 0.011 0.190 0.045 0.152 0.103 0.398 0.178 0.124 0.161 0.124 0.170 0.088 0.281 0.082 0.059 0.064 0.670 2.249 0.001 0.012 0.020 0.020 0.012 0.065 0.051 0.375
Dev.st. 0.029 0.019 0.307 0.071 0.273 0.106 1.190 0.140 0.135 0.156 0.175 0.556 0.129 0.915 0.088 0.079 0.078 1.392 4.447 0.001 0.011 0.020 0.017 0.010 0.050 0.079 0.931
Median 0.009 0.004 0.017 0.015 0.096 0.086 0.148 0.179 0.079 0.117 0.046 0.027 0.030 0.030 0.043 0.040 0.022 0.239 0.987 0.001 0.010 0.008 0.014 0.009 0.040 0.035 0.109
Shipping area
Min. 0.001 0.001 0.001 0.001 0.001 0.041 0.001 0.017 0.006 0.089 0.007 0.001 0.001 0.001 0.007 0.002 0.001 0.021 0.173 0.001 0.001 0.002 0.003 0.001 0.014 0.002 0.045
Max. 0.099 0.388 1.062 1.046 4.407 1.574 2.677 3.061 1.349 1.406 1.296 0.499 0.795 1.183 0.554 3.451 0.344 7.832 25.189 0.006 0.049 0.081 0.074 0.043 0.222 0.710 3.578
Mean 0.025 0.061 0.294 0.147 0.630 0.358 0.505 0.552 0.348 0.423 0.376 0.163 0.244 0.331 0.134 0.185 0.093 1.374 4.869 0.003 0.016 0.030 0.021 0.014 0.084 0.132 0.623
Dev.st. 0.026 0.092 0.345 0.208 0.908 0.381 0.609 0.698 0.269 0.285 0.359 0.142 0.226 0.303 0.148 0.622 0.104 1.701 5.726 0.002 0.014 0.024 0.020 0.013 0.067 0.171 0.629
Median 0.017 0.027 0.164 0.083 0.322 0.206 0.375 0.295 0.273 0.359 0.256 0.119 0.166 0.267 0.066 0.039 0.041 0.901 3.074 0.003 0.013 0.021 0.014 0.010 0.055 0.065 0.438
Touristic area
Min. 0.001 0.001 0.001 0.001 0.001 0.001 0.001 0.001 0.001 0.001 0.001 0.001 0.001 0.001 0.001 0.001 0.001 0.003 0.009 0.001 0.001 0.001 0.001 0.001 0.006 0.004 0.010
Max. 0.088 0.113 0.641 0.335 1.713 0.571 1.862 3.085 3.063 3.373 2.741 0.712 1.339 1.278 0.886 1.912 1.456 9.879 25.166 0.008 0.346 0.102 0.324 0.120 0.899 0.710 2.250
Mean 0.016 0.020 0.135 0.053 0.296 0.137 0.358 0.387 0.324 0.381 0.310 0.139 0.220 0.262 0.141 0.122 0.114 1.160 3.415 0.003 0.028 0.026 0.036 0.018 0.110 0.119 0.461
Dev.st. 0.019 0.026 0.198 0.072 0.381 0.158 0.440 0.643 0.532 0.616 0.496 0.174 0.291 0.328 0.214 0.320 0.255 1.891 5.164 0.002 0.073 0.024 0.070 0.026 0.188 0.163 0.535
Median 0.010 0.010 0.032 0.030 0.099 0.066 0.220 0.187 0.113 0.126 0.096 0.047 0.055 0.082 0.052 0.031 0.010 0.375 1.267 0.002 0.010 0.024 0.018 0.010 0.070 0.062 0.228
Total
Min. 0.001 0.001 0.001 0.001 0.001 0.001 0.001 0.001 0.001 0.001 0.001 0.001 0.001 0.001 0.001 0.001 0.001 0.003 0.009 0.001 0.001 0.001 0.001 0.001 0.001 0.001 0.002
Max. 1.385 0.388 2.514 1.967 4.837 1.574 6.061 3.085 3.063 3.373 2.741 2.805 1.339 4.597 2.304 4.160 3.893 9.879 31.774 0.008 0.346 0.102 0.324 0.120 0.899 0.710 4.723
Mean 0.026 0.024 0.204 0.072 0.337 0.176 0.344 0.309 0.230 0.272 0.239 0.129 0.176 0.259 0.127 0.108 0.108 0.964 3.142 0.002 0.015 0.019 0.021 0.012 0.068 0.087 0.428
Median 0.007 0.009 0.057 0.028 0.141 0.093 0.181 0.167 0.126 0.145 0.093 0.054 0.071 0.101 0.058 0.027 0.044 0.405 1.402 0.001 0.008 0.012 0.010 0.007 0.039 0.034 0.186
All concentration data are reported with respect to dry weight.
M.
Sp
rovieri
eta
l./
Ch
emo
sphere
67
(2
00
7)
99
8–
10
09
1003
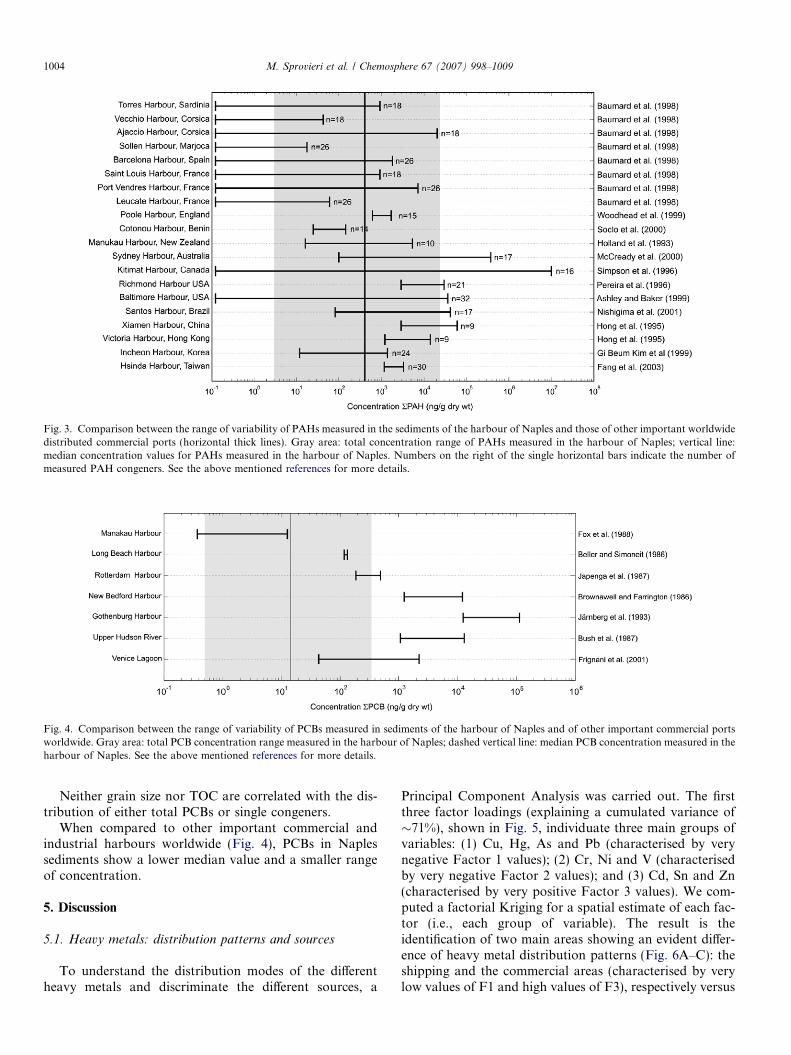
Fig. 3. Comparison between the range of variability of PAHs measured in the sediments of the harbour of Naples and those of other important worldwidedistributed commercial ports (horizontal thick lines). Gray area: total concentration range of PAHs measured in the harbour of Naples; vertical line:median concentration values for PAHs measured in the harbour of Naples. Numbers on the right of the single horizontal bars indicate the number ofmeasured PAH congeners. See the above mentioned references for more details.
Fig. 4. Comparison between the range of variability of PCBs measured in sediments of the harbour of Naples and of other important commercial portsworldwide. Gray area: total PCB concentration range measured in the harbour of Naples; dashed vertical line: median PCB concentration measured in theharbour of Naples. See the above mentioned references for more details.
1004 M. Sprovieri et al. / Chemosphere 67 (2007) 998–1009
Neither grain size nor TOC are correlated with the dis-tribution of either total PCBs or single congeners.
When compared to other important commercial andindustrial harbours worldwide (Fig. 4), PCBs in Naplessediments show a lower median value and a smaller rangeof concentration.
5. Discussion
5.1. Heavy metals: distribution patterns and sources
To understand the distribution modes of the differentheavy metals and discriminate the different sources, a
Principal Component Analysis was carried out. The firstthree factor loadings (explaining a cumulated variance of�71%), shown in Fig. 5, individuate three main groups ofvariables: (1) Cu, Hg, As and Pb (characterised by verynegative Factor 1 values); (2) Cr, Ni and V (characterisedby very negative Factor 2 values); and (3) Cd, Sn and Zn(characterised by very positive Factor 3 values). We com-puted a factorial Kriging for a spatial estimate of each fac-tor (i.e., each group of variable). The result is theidentification of two main areas showing an evident differ-ence of heavy metal distribution patterns (Fig. 6A–C): theshipping and the commercial areas (characterised by verylow values of F1 and high values of F3), respectively versus

Fig. 5. 3D Plot of the three first factor loadings extracted by factoranalysis of the heavy metals dataset. Thick lines contour groups ofelements grouped along the same factor loadings.
M. Sprovieri et al. / Chemosphere 67 (2007) 998–1009 1005
the eastern area (characterised by very low values of F2and F3). Such a spatial distribution of the different groupsof heavy metals well reflects the different pollution sourcesexisting in the studied area. Actually, the Eastern area,characterised by the presence of important shipyard andindustrial activities, may represent a primary source forCr, Ni, V and Co, extensively used in alloy and metallurgi-cal components. On the other hands, the high concentra-tions of Hg, Pb and Cu in the commercial area may berelated to the important influence of urban and industrialwastewaters. Moreover, the vehicle emissions associatedto the high traffic volume recorded in the city centre ofNaples (close to the commercial district of the harbour)may represent a major source of Pb and secondarily ofZn and Cu to marine sediments, as previously suggestedby Imperato et al. (2003). In the case of commercial vessels,the toxic properties of paints are further enhanced by add-ing more Cu and Hg. Therefore, elevated concentrations ofCu and Hg are expected due to the washout of the antifoul-ing paints used for ships in the harbour of Naples. Finally,tyre and line abrasion processes in the rail and tramwaysmay be also responsible for the high concentrations ofCu in the commercial area of the harbour.
5.2. Total concentration of carcinogenic PAH
Anthropogenic polycyclic aromatic hydrocarbons(PAHs) are introduced to coastal areas via urban runoff(e.g., Benlahcen et al., 1997; McCready et al., 2000), indus-trial processes (Simpson et al., 1996), vehicle exhausts andspillage of fossil fuels (e.g., Wang et al., 1999a). In mostcases, identifying specific pollutant sources from compli-cated routes is a great challenge.
Our results indicate that PAHs contamination does existin the harbour of Naples and the pollution level is generallycomparable or higher than that of other European com-mercial ports (Fig. 3).
Several PAHs, and especially their metabolic products,are known to be carcinogenic (Connel et al., 1997). Totalconcentration of potentially carcinogenic PAHs (CPAH)(sum of benzo[a]anthracene, benzofluoranthenes, benzo[a]-pyrene, indeno[1,2,3-cd]pyrene and dibenzo[a,h]anthra-cene) varied from 3 to 9879 ng g�1, and accounted for21–32% of PAHs in sediments from the Naples harbour(Table 1).
Among all known potentially carcinogenic PAHs, ben-zo[a]pyrene is the only PAH for which toxicological dataare sufficient for derivation of a carcinogenic potency factor(Peters et al., 1999). Data are available, however, to quan-tify the toxicities of other PAHs relative to benzo[a]pyrene,expressed as toxic equivalency factors (TEFs). These areused to estimate benzo[a]pyrene-equivalent doses (BaPeq
dose). According to the US Environmental ProtectionAgency (US EPA, 1993), TEFs for benzo[a]anthracene,benzo[a]pyrene, benzo[b]fluoranthene, benzo[k]fluoranth-ene, indeno[1,2,3-cd]pyrene and dibenzo[a,h]anthraceneare 0.1, 1, 0.1, 0.01, 0.1 and 1, respectively. According toIARC (1987) total toxic benzo[a]pyrene equivalent (TEQ)of all these PAHs is
BaPeq dosei ¼ TEFi � dosei
Total TEQ ¼X
BaPeq dosei
Total TEQ calculated for all samples investigated variedfrom 2 to 4723 ngTEQg�1 (Table 1). The maximum valueof Total TEQ was found at stations located in the indus-trial areas and in most of the inner docks of the harbourindicating the presence of local sources. Average valuesof relative contents BaPeqdoses in Total TEQ decreased inthe order: B(a)P (55%), D(a,h)A (24%), B(k,j)F (0.5%),B(b)F (6%), IND (5%) as shown in Table 1.
5.3. Genesis of PAH
Generally, in marine sediments, PAH congeners aredivided into three categories: petrogenic, pyrogenic andbiogenic, based upon diagnostic ratios and/or predomi-nance of different PAHs congeners (Boehm et al.,1998a,b; Burns et al., 1997; Page et al., 1999). In particular,the use of ratios of PAH components of the same molecu-lar mass has been established as a reliable method of infer-ring PAH sources and diagenesis of PAHs according to: (i)the different thermodynamic stability of congeners, (ii) thecharacteristic composition of different PAH sources, and(iii) the changes in PAH relative abundances betweensource and sediment (e.g., Yunker et al., 1996, 1999).
The isomers with 202 mass (fluoranthene and pyrene)have the greatest range in stability and hence are good indi-cators of thermodynamic vs. kinetic (e.g. petroleum vs.combustion) effects (see Yunker and Macdonald, 1995
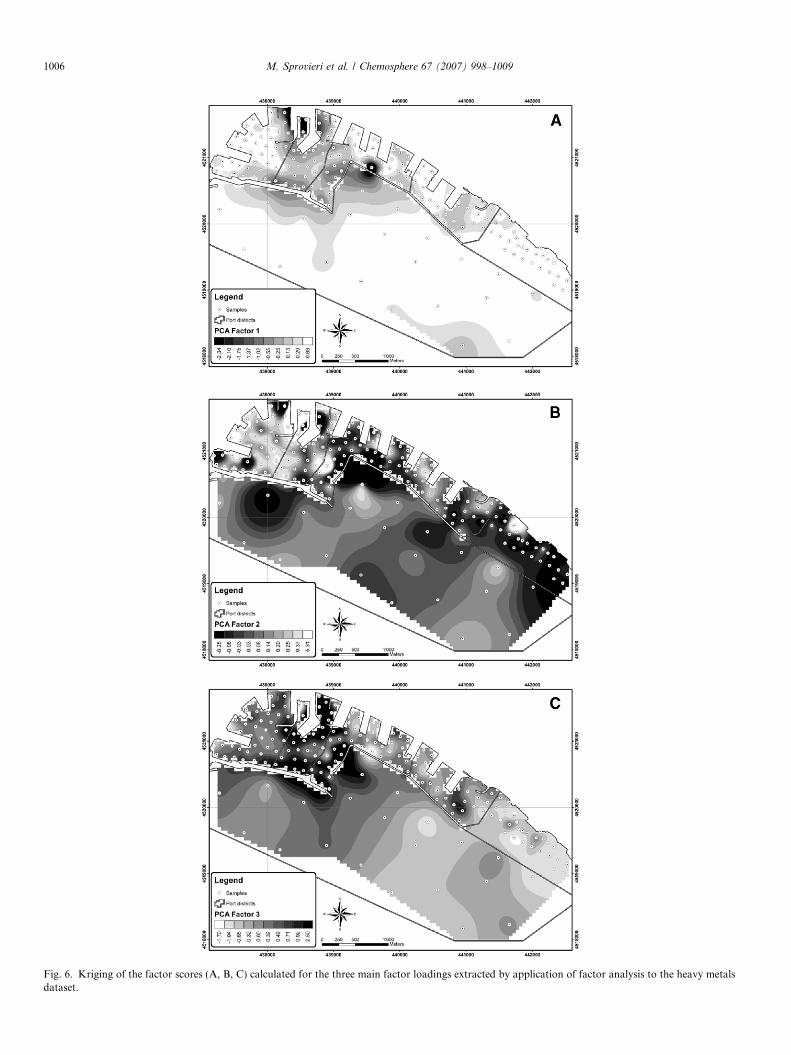
Fig. 6. Kriging of the factor scores (A, B, C) calculated for the three main factor loadings extracted by application of factor analysis to the heavy metalsdataset.
1006 M. Sprovieri et al. / Chemosphere 67 (2007) 998–1009

Fig. 7. Triangular plot of the selected PAHs isomer pairs. Gray areacorresponds to values of the three PAH isomer ratios typical of pyrogeniceffects.
M. Sprovieri et al. / Chemosphere 67 (2007) 998–1009 1007
for a complete definition of ‘‘kinetic’’ and ‘‘thermody-namic’’ isomers). Also phenantrene and anthracene (mass178) are commonly used to distinguish between combus-tion and petroleum sources (e.g., Gschwend and Hites,1981; Budzinski et al., 1997; Soclo et al., 2000). Anthra-cene/anthracene + phenanthrene ratios lower than 0.10are usually taken as an indication of petroleum unburned,while a ratio higher than 0.10 indicates a dominance ofcombustion effect (Budzinski et al., 1997). A fluoranth-ene/fluoranthene + pyrene ratio of 0.50 is usually definedas the petroleum/combustion transition point (Budzinskiet al., 1997), but in practice this boundary appears to beless definitive than 0.10 for anthracene/anthracene + phen-anthrene. The fluoranthene/fluoranthene + pyrene ratio isbelow 0.50 for most unburned petroleum polluted samplesand above 0.50 in kerosene, grass, most coal and woodcombustion samples and creosote, but it is below 0.40–0.50 for gasoline, diesel, fuel oil and crude oil combustionand emissions from cars and diesel trucks. PAHs of molec-ular masses 228 (benzo[a]anthracene and crysene) and 276(indeno[1,2,3-cd]pyrene and benzo[g,h,i]perylene) are usedless frequently as PAH source indicators and few guidelineshave been established for their interpretation (e.g., Gogouet al., 1996; Yunker et al., 1996, 1999). However, highermass PAHs usually are minor contributors to refinedpetroleum products (Williams et al., 1986; Wang et al.,1999a,b) and generally are present in significant amountsonly in higher fractions such as asphalt (Readman et al.,2002), and possibly in bitumen or coal (Yunker et al.,1996, 2002). A B(a)A/B(a)A + CRY ratio over 0.50 hasbeen taken to indicate combustion while a ratio below0.50 has been attributed to low temperature diagenesis(Soclo et al., 2000).
The triangle graph of Fig. 7 synthesises the resultsobtained for the studied sediments. More than 85% of themevidences a pyrolytic origin with a limited number of sam-ples (generally located in the External area of the harbour)characterised by PAHs of petrogenic origin.
Concentrations of perylene, which can have both a ter-rigenous (terrigenous plant residues, peaty deposits) andmarine (diatoms, bacterial degradation of organic matterin anoxic sediments) origin (Venkatesan, 1988; Yunkeret al., 1993; Page et al., 1999), varied in the studied sedi-ments from 3 to 240 ng g�1 and did not represent morethan 8.2% of total PAHs (median of 3.2%). An anomaloushigh perylene/
PPAH ratio of 25.3% was found at station
150, indicating a diagenetic origin from either oceanic orterrestrial precursors in this sediment. The highest concen-trations of perylene are generally located in more externalareas of the harbour that are less influenced by directanthropogenic inputs.
5.4. Composition of PCB, sources and toxicity of bottom
sediments
MacDonald et al. (2000) proposed a threshold effectguideline of 60 ng g�1 and a probable effect guideline of
676 ng g�1 for total PCBs in sediments. To account forthe varying toxicity of the PCB congeners, the WHO–European Centre for Environmental Health (WHO–ECEH) and the International Programme on ChemicalSafety (IPCS) have developed a suite of TEFs for ‘PCDD-like’ PCBs (Ahlborg et al., 1994). These PCDD-like PCBcongeners are classified according to the number of chlo-rines in the ortho-position: four non-ortho (IUPAC nos.77, 81, 126 and 169) and eight mono-ortho (IUPAC nos.105, 114, 118, 123, 156, 157, 167 and 189) (Van den Berget al., 1998). All of these twelve congeners, as well as the17 toxic PCDD/F congeners, have an assigned toxicityequivalence factor (WHO–TEF).
A no observed effect concentration of 200 pg TEQg�1 insediments was derived, but when chronic toxicity data arescarce a safety factor of 10 is applied, which resulted in asafe sediment value of 20 pg TEQg�1 (Evers et al., 1996).
WHO–TEQPCB toxicity level estimated for the 12PCDD-like PCBs measured in the sediments of the Naples’sharbour reached the maximum value of 710 pg TEQg�1
with a median value of 34 pg TEQg�1, exceeding the20 pg TEQg�1 safe sediment value above mentioned. More-over, if we consider that the sum of congeners does notaccount for the entire sample, the figures relative to PCBsare largely underestimated.
In all cases, the largest contribution to WHO–TEQPCB
came from the non-ortho PCBs (from 62% to 91%), fol-lowed by the mono-ortho PCBs (from 9% to 38%). PCBcongeners 126, 118 and 156 were the predominant contrib-utors to WHO–TEQPCBs.
6. Conclusions
In the light of our findings the following conclusions canbe drawn:

1008 M. Sprovieri et al. / Chemosphere 67 (2007) 998–1009
1. Spatial distributions of heavy metals, PAHs and PCBsin superficial sediments of the Naples’s harbour showthat the sources of the different contaminants are inde-pendent of each other with a limited effects of grain sizeand TOC on their spatial control.
2. Cadmium, Cu, Zn, Pb, Cu, Sn, and Hg show an impor-tant anthropic contribution with a spatial pattern distri-bution that clearly reflects the different influence ofindustrial and/or commercial activities located in thevarious areas of the harbour. Potential risk associatedto the relatively high contents of these heavy metals inthe surface sediments of the Naples harbour is relatedto the low Eh values measured in sediments (rangingbetween �507 and 498 eV, with a median of �170 eV).Such redox conditions may favour extensive dissolutionof Fe and Mn oxides leading to release of heavy metalsat the sediment–water interface (e.g., Lindsay, 1979;Sposito, 1984; Kersten, 2002).
3. PAHs appear related to local inputs with a dominanteffect of pyrolytic genesis, while high-chlorinated PCBsseem to suggest localised sources influenced by industrialuse and uncontrolled discharge of these contaminants.
4. WHO–TEQ levels calculated for PAH and PCB classesof contaminants suggest a relatively elevated level oftoxicity of the studied sediments which recommendsan efficient control of the inputs not to further compro-mise and promote a recovery of the quality of marineenvironment.
Acknowledgements
Authors thank the Naples Port Authority for providinguseful information for study area description and data inter-pretation. Chemical analyses were assisted by S. Gherardi, S.Musella and P. Capone. Thanks are due also to M. Iavaronefor his constant and invisible attention to the thousands ofdetails which made our geochemistry laboratory perform-ing. We are grateful to M. Frignani and an anonymous ref-eree for their constructive reviews and comments.
References
Adamo, P., Arienzo, M., Imperato, M., Naimo, D., Nardi, G., Stanzione,D., 2005. Distribution and partition of heavy metals in surface andsub-surface sediments of Naples city port. Chemosphere 61, 800–809.
Ahlborg, U., Becking, G.C., Birnbaum, L.S., Brouwer, A., Derks,H.J.G.M., Feeley, M., Golor, G., Hanberg, A., Larsen, J.C., Liem,A.K.D., Safe, S.H., Schlatter, C., Wærn, F., Younes, M., Yrjanheikki,E., 1994. Toxic equivalency factors for PCDD-like PCBs. Chemo-sphere 28, 1049–1067.
Ashley, J.T.F., Baker, J.E., 1999. Hydrophobic organic contaminants insurficial sediments of Baltimore Harbour: inventories and sources.Environ. Toxicol. Chem. 18, 838–849.
Baumard, P., Budzinski, H., Garrigues, P., 1998. Polycyclic aromatichydrocarbons (PAHs) in sediments and mussels of the westernMediterranean Sea. Environ. Toxicol. Chem. 17, 765–776.
Beller, H.R., Simoneit, B.R.T., 1986. Polychlorinated biphenyls andhydrocarbons. 18 Distribution among bound and unbound lipid
fractions of estuarine sediments. In: Sohn, M.L. (Ed.), 19 OrganicMarine Geochemistry. ACS, Washington, DC, pp. 198–213.
Benlahcen, K.T., Chaoui, A., Budzinski, H., Bellocq, J., Garrigues, Ph.,1997. Distribution and sources of polycyclic aromatic hydrocarbons insome Mediterranean Coastal sediments. Mar. Pollut. Bull. 34, 298–305.
Boehm, P.D., Dougals, G.S., Burns, W.A., Mankiewicz, P.J., Page, D.S.,Bence, A.E., 1998a. Application of petroleum hydrocarbon chemicalfingerprinting and allocation techniques after the Exxon Valdez Oilspill. Mar. Pollut. Bull. 34, 599–613.
Boehm, P.D., Page, D.S., Gilfillan, E.S., Bence, E.A., Burns, W.A.,Mankiewicz, P.J., 1998b. Study of the fates and effects of the ExxonValdez Oil Spill on benthic sediments in two bays in Prince WilliamSound, Alaska. Study design, chemistry, and source fingerprinting.Environ. Sci. Technol. 32, 567–576.
Brownawell, B., Farrington, J., 1986. Biogeochemistry of PCBs interstitialwaters of a coastal marine sediment. Geochim. Cosmochim. Acta 50,157–169.
Budzinski, H., Jones, I., Bellocq, J., Pierard, C., Garrigues, P., 1997.Evaluation of sediment contamination by polycyclic aromatic hydro-carbons in the Gironde estuary. Mar. Chem. 58, 85–97.
Burns, W.A., Mankiewicz, P.J., Bence, A.E., Page, D.S., Parker, K., 1997.A least squares method for allocating sediment hydrocarbons tomultiple sources. Environ. Toxicol. Chem. 16, 1119–1131.
Bush, B., Shane, L.A., Wahlen, M., Brown, M.P., 1987. Sedimentation of74 PCB congeners 17 in the Upper Hudson River. Chemosphere 16,733–744.
Connel, D.W., Hawker, D.W., Warne, M.J., Vowles, P.P., 1997. Polycy-clic aromatic hydrocarbons (PAHs). In: McCombs, K., Starkweather,A.W. (Eds.), Introduction into Environmental Chemistry. CRC PressLLC, Boca Raton, FL, pp. 205–217.
De Vivo, B., Belkin, H.E., Barbieri, M., Chelini, W., Lattanzi, P., Lima,A., Tolomeo, L., 1989. The Campi Flegrei (Italy) geothermal system: afluid inclusion study of the Mofete and San Vito fields. J. Volcanol.Geoth. Res. 36, 303–326.
Evers, E.H.G., Laane, R.W.P.M., Groeneveld, G.J.J., Olie, K., 1996.Levels, temporal trends and risk of PCDDs and related compounds inthe Dutch aquatic environment. Organohalogen Compd. 28, 117–122.
Fang, M.-D., Lee, C.-L., Yu, C.-S., 2003. Distribution and sourcerecognition of polycyclic aromatic hydrocarbons in the sediments ofHsin-ta Harbour and adjacent coastal areas, Taiwan. Mar. Pollut.Bull. 46, 941–953.
Federico, C., Aiuppa, A., Allard, P., Bellomo, S., Michel, A., Parello, F.,Valenza, M., 2002. Magmatic gas–water interactions at Vesuviusvolcano: major, minor and trace element composition of the volcanicaquifer. Goechim. Cosmochim. Acta 66, 963–981.
Fox, M.E., Roper, D.S., Thrush, S.F., 1988. Organochlorine contami-nants in surficial 11 sediments of Manukav Harbour, New Zealand.Mar. Pollut. Bull. 19, 333–336.
Frignani, M., Bellucci, L.G., Carraro, C., Raccanelli, S., 2001. Polychlo-rinated biphenyls in sediments of the Venice Lagoon. Chemosphere 43,567–575.
Gogou, A., Stratigakis, N., Kanakidou, M., Stephanou, E.G., 1996.Organic aerosols in Eastern Mediterranean: components sourcereconciliation by using molecular markers and atmospheric backtrajectories. Org. Geochem. 25, 79–96.
Gschwend, P.M., Hites, R.A., 1981. Fluxes of polycyclic aromatichydrocarbons to marine and lacustrine sediments in the north easternUnited States. Goechim. Cosmochim. Acta 45, 2359–2367.
Holland, P.T., Hickey, C.W., Roper, D.S., Trower, T.M., 1993. Variabil-ity of organic contaminants in inter-tidal sandflat sediments fromManukau Harbours, New Zealand. Arch. 12 Environ. Contaminat.Toxicol. 25, 456–463.
Hong, H., Xu, L., Zhang, L., Chen, J.C., Wong, Y.S., Wan, T.S.M., 1995.Environmental fate and chemistry of organic pollutants in thesediment of Xiamen and Victoria Harbours. Mar. Pollut. Bull. 31,229–236.

M. Sprovieri et al. / Chemosphere 67 (2007) 998–1009 1009
IARC, 1987. Monographs on the evaluation of the carcinogenic risk ofchemicals to humansOverall Evaluation of Carcinogenity: An Updat-ing of IAPC Monographs, Vols. 1–42. International Agency forResearch on Cancer, Lyon, France, suppl. 7.
Imperato, M., Adamo, P., Naimo, D., Arienzo, M., Stanzione, D.,Violante, P., 2003. Spatial distribution of heavy metals in urban soilsof Naples city (Italy). Environ. Pollut. 124, 247–256.
Japenga, J., Wagenaar, W.J., Smedes, F., Salomons, W., 1987. A newrapid clean-up 25 procedure for the simultaneous determination ofdifferent groups of organic micropollutants in sediments: application intwo European estuarine sediment studies. Environ. Technol. 2 Lett. 8,9–20.
Jarnberg, U., Asplund, L., de Wit, C., Grafstrom, A.K., Haglund, P.,Jansson, B., Laxen, K., Strandel, M., Olson, M., Jonsson, B., 1993.Polychlorinated biphenyls and polychlorinated naphthalenes in Swed-ish sediments and biota: levels, patterns, and time trends. Environ. Sci.Technol. 27, 1364–1374.
Kang, Y., Sheng, G., Fu, J., Mai, B., Zhang, G., Lin, Z., Min, Y., 2000.Polychlorinated biphenyls in surface sediments from Pearl River Deltaand Macau. Mar. Pollut. Bull. 40, 794–797.
Kannan, K., Johnson, B.-R., Yohn, S.S., Giesy, J.P., Long, D.T., 2005.Spatial and temporal distribution of polycyclic aromatic hydrocarbonsin sediments from inland lakes in Michigan. Environ. Sci. Technol. 39,4700–4706.
Kersten, M., 2002. Speciation of trace metals in sediments. In: Ure, A.M.,Davidson, C.M. (Eds.), Chemical Speciation in the Environment.Blackwell Science, Oxford, pp. 301–321.
Kim, G.B., Maruya, K.A., Lee, R.F., Lee, J.H., Koh, C.H., Tanabe, S.,1999. Distribution and sources of polycyclic aromatic hydrocarbons insediments from Kyeonggi Bay, Korea. Mar. Pollut. Bull. 38, 7–15.
Law, R.J., 1994. Polycyclic aromatic hydrocarbons (PAH)—problems andprogress in sampling, analysis and interpretation. Mar. Pollut. Bull. 29,235–241.
Lee, K.T., Tanabe, S., Koh, C.H., 2001. Distribution of organochlorinepesticides in sediments from Kyeonggi Bay and nearby areas, Korea.Environ. Pollut. 114, 207–213.
Ligero, R.A., Barbera, M., Casas-Ruiz, M., Sales, D., Lopez-Aguayo, F.,2002. Dating of marine sediments and time evolution of heavy metalconcentration in the Bay of Cadiz, Spain. Environ. Pollut. 118, 97–108.
Lindsay, W.L., 1979. Chemical Equilibria In Soils. John Wiley & Sons,New York, 449pp.
Long, E.R., MacDonald, D.D., Smith, S.L., Calder, F.D., 1995. Incidenceof adverse biological effects within ranges of chemical concentrationsin marine and estuarine sediments. Environ. Manage. 19, 81–97.
MacDonald, D.D., Ingersoll, C.G., Berger, T., 2000. Development andevaluation of consensus-based sediment quality guidelines for fresh-water ecosystems. Arch. Environ. Contaminat. Toxicol. 39, 20–31.
McCready, S., Slee, D.J., Birch, G.F., Taylor, S.E., 2000. The distributionof polycyclic aromatic hydrocarbons in superficial sediments of SydneyHarbour, Australia. Mar. Pollut. Bull. 40, 999–1006.
Nishigima, F.N., Weber, R.R., Bıcego, M.C., 2001. Aliphatic andaromatic hydrocarbons in sediments of Santos and Cananeia, SP,Brazil. Mar. Pollut. Bull. 42, 1064–1072.
Page, D.S., Boehm, P.D., Douglas, G.S., Bence, E.A., Burns, W.A.,Mankiewicz, P.J., 1999. Pyrogenic polycyclic aromatic hydrocarbonsin sediments record past human activity: a case study in Prince Williamsound, Alaska. Mar. Pollut. Bull. 38, 247–260.
Pereira, W.E., Hostettler, F.D., Rapp, J.B., 1996. Distributions and fate ofchlorinated 20 pesticides, biomarkers and polycyclic aromatic hydro-carbons in sediments along a contamination gradient from a point-source in San Francisco Bay, California. Mar. Environ. Res. 41 (22),299–314.
Peters, C.A., Knightes, C.D., Brown, D.G., 1999. Long-term compositiondynamics of PAH-containing NAPLs and implications for riskassessment. Environ. Sci. Technol. 33, 4499–4507.
Readman, J.W., Fillmann, G., Tolosa, I., Bartocci, J., Villeneuve, J.P.,Catinni, C., Mee, L.D., 2002. Petroleum and PAH contamination ofthe Black Sea. Mar. Pollut. Bull. 44, 48–62.
Savinov, V.M., Savinova, T.N., Carroll, J., Matishoy, G.G., Dahle, S.,Naes, K., 2000. Polycyclic aromatic-hydrocarbons (PAHs) in sedi-ments of the White-Sea, Russia. Mar. Pollut. Bull. 40, 807–818.
Shepard, F.P., 1954. Nomenclature based on sand, silt, clay ratios. J.Sediment. Petrol 24, 151–158.
Simpson, C.D., Mosi, A.A., Cullen, W.R., Reimer, K.J., 1996. Compo-sition and distribution of polycyclic aromatic hydrocarbon contami-nation in superficial marine sediment from Kitimat Harbour Canada.Sci. Total Environ. 181, 265–278.
Soclo, H.H., Garrigues, P.H., Ewald, M., 2000. Origin of polycyclicaromatic hydrocarbons (PAHs) in coastal marine sediments: casestudies in Cotonou (Benin) and Aquitaine (France) areas. Mar. Pollut.Bull. 40, 387–396.
Sposito, G., 1984. The Surface Chemistry Of Soils. Oxford UniversityPress, New York, 242pp.
Taylor, S.R., McLennan, S.M., McCulloch, M.T., 1983. Geochemistry ofloess, continental crustal composition and crustal model ages.Geochim. Cosmochim. Acta 47, 1897–1905.
US Environmental Protection Agency (US EPA), 1993. ProvisionalGuidance for Quantitative Risk Assessment of Polycyclic AromaticHydrocarbons. EPAy600yRy089. Office of Research and Develop-ment, US EPA, Washington, DC.
Van den Berg, M., Birnbaum, L., Bosveld, A.T.C., Brunstrom, B., Cook,P., Feeley, M., Giesy, J.P., Hanberg, A., Hasegawa, R., Kennedy,S.W., Kubiak, T., Larsen, J.C., Van Leeuwen, F.X.R., Liem, A.K.D.,Nolt, C., Peterson, R.E., Poellinger, L., Safe, S., Schrenk, D., Tillit, D.,Tysklind, M., Younes, M., Wærn, F., Zacharewski, T., 1998. Toxicequivalency factors (TEFs) for PCBs, PCDDs, PCDFs for humans andwildlife. Environ. Health Persp. 106, 775–792.
Venkatesan, M.I., 1988. Occurrence and possible sources of perylene inmarine sediments—a review. Mar. Chem. 25, 1–27.
Wang, Z., Fingas, M., Page, D.S., 1999a. Oil spill identification. J.Chromatogr. A 843, 369–411.
Wang, Z., Fingas, M., Shu, Y.Y., Sigouin, L., Landriault, M., Lambert,P., Turpin, R., Campagna, P., Mullin, J., 1999b. Quantitativecharacterization of PAHs in burn residue and soot samples anddifferentiation of pyrogenic PAHs from petrogenic PAHs—the 1994mobile burn study. Environ. Sci. Technol. 33, 3100–3109.
Wiberg, P.L., Harris, C.K., 2002. Desorption of p,p0-DDE from sedimentduring resuspension events on the Palos Verdes shelf, California: amodelling approach. Cont. Shelf Res. 22, 1005–1023.
Williams, P.T., Bartle, K.D., Andrews, G.E., 1986. The relation betweenpolycyclic aromatic compounds in diesel fuels and exhaust particu-lates. Fuel 65, 1150–1158.
Woodhead, R.J., Law, R.J., Matthiessen, P., 1999. Polycyclic aromatichydrocarbons in 9 surface sediments around England and Wales, andtheir possible biological significance. Mar. Pollut. Bull. 38, 773–790.
Yunker, M.B., Macdonald, R.W., 1995. Alkane and PAH depositionalhistory, sources and fluxes in sediments from the Fraser River Basinand Strait of Georgia, Canada. Org. Geochem. 34, 1429–1454.
Yunker, M.B., Macdonald, R.W., Cretney, W.J., Fowler, B.R., Mc-Laughin, F.A., 1993. Alkane, terpene, and polycyclic aromatichydrocarbons in the Mackenzie River and Mackenzie shelf: riverinecontribution to Beufort Sea coastal sediment. Goechim. Cosmochim.Acta 57, 3041–3061.
Yunker, M.B., Snowdon, L.R., Macdonald, R.W., Smith, J.N., Fowler,M.G., Skibo, D.N., McLaughlin, F.A., Danyushevskaya, A.I., Petr-ova, V.I., Ivanov, G.I., 1996. Polycyclic aromatic hydrocarboncomposition and potential sources for sediment samples from theBeaufort and Barents Seas. Environ. Sci. Technol. 30, 1310–1320.
Yunker, M.B., Macdonald, R.W., Goyette, D., Paton, D.W., Fowler,B.R., Sullivan, D., Boyd, J., 1999. Natural and anthropogenic inputsof hydrocarbons to the Strait of Georgia. Sci. Total Environ. 225, 181–209.
Yunker, M.B., Macdonald, R.W., Vingarzan, R., Mitchell, R.H., Goyette,D., Sylvestre, S., 2002. PAHs in the Fraser River basin: a criticalappraisal of PAH ratios as indicators of PAH source and composition.Org. Geochem. 33, 489–515.