request for redesignation of the libby pm2.5 nonattainment ...

ARTICLE IN PRESS
Aerosol and Air Quality Research, x: 1–13, xxxx Copyright © Taiwan Association for Aerosol Research ISSN: 1680-8584 print / 2071-1409 online doi: 10.4209/aaqr.2015.01.0011 Incremental Lifetime Cancer Risk of PM2.5 Bound Polycyclic Aromatic Hydrocarbons (PAHs) Before and After the Wildland Fire Episode Siwatt Pongpiachan* NIDA Center for Research & Development of Disaster Prevention & Management, School of Social and Environmental
Development, National Institute of Development Administration (NIDA), 118 Moo 3, Sereethai Road, Klong-Chan,
Bangkapi, Bangkok, 10240, Thailand
ABSTRACT
In Northern Thailand, wildland fire during cold period releases large amounts of smoke and fine particles into the atmosphere. The fine particles include several persistent organic compounds such as PAHs. In this study, PM2.5-bound PAH concentrations in the air of nine administrative provinces, namely Chiang-Mai, Chiang-Rai, Nan, Phayao, Mae Hong Son, Phrae, Lampang, Lamphun, Uttaradit (N Thailand) were determined during the wildland fire and non-wildland fire seasons. The monitoring strategy comprised two campaigns in each season. PM2.5 was collected using MiniVolTM portable air samplers (Airmetrics) with quartz fibre filters. Both PAHs and their B[a]PEquivalent concentrations of other urban cities around the world were significantly higher than those of northern provinces for both seasons. The average cancer risks observed at nine administrative provinces were 8.525 × 10⁻⁴ ± 3.493 × 10⁻³ and 2.558 × 10⁻³ ± 6.986 × 10⁻³ for ingestion rate of 50 and 100 mg day–1, respectively. The excess cancer risks of world cities for ingestion rate of 50 and 100 mg day–1 were much higher than those of Northern Thailand for 851 and 567 times in that order. Dust ingestion was exceedingly critical to non-dietary PAH exposure in comparison with PM2.5 inhalation. These results are in good agreement with those of previous studies, underlining the significance of indoor air quality on long-term adverse respiratory diseases in Asian cities. Keywords: Wildland fire; PAHs; Northern Thailand; PM2.5; Incremental lifetime cancer risk. INTRODUCTION
Physico-chemical behavior of particulate polycyclic aromatic hydrocarbons (PAHs) have been extensively investigated in most cities worldwide during the past few years (Dachs et al., 2002; Bartkow et al., 2004; Ciganek et
al., 2004; Dallarosa et al., 2005a, b; Fang et al., 2005; Schnelle-Kreis et al., 2005; Pongpiachan, 2006; Wang et
al., 2006; Vasilakos et al., 2007; Pongpiachan, 2013a, b; Pongpiachan et al., 2013a, b). PAHs are a group of organic compounds that are generated during the incomplete burning of lignite (Liu et al., 2012), fuels (Lu et al., 2012), volcanic eruption (Schwandner et al., 2013), biomass (Sanchis et
al., 2014), garbage (Chen et al., 2013), or other organic substances, such as tobacco (Chalbot et al., 2012). PAHs are highly toxic organic compounds that can cause a range of adverse health effects (e.g., cancer, endocrine disruption, reproductive and developmental effects) (Hoyer, 2001; * Corresponding author.
Tel.: 00 66 2 727 3113; Fax: 00 66 2 732 0276 E-mail address: [email protected]
Matsui, 2008; Liao et al., 2011; Wickramasinghe et al., 2012). In spite of several studies connected with PM2.5-bound PAH contents in different cities, the insight of its fate and behaviour during the episode of wildland fire is severely limited. Early findings apparently focused on the air quality level worsened by agricultural waste burnings, wildland fires, and accidental biomass combustions associated with trans boundary haze pollution from neighbouring countries of Thailand (Pengchai et al., 2009; Oanh et al., 2011; Huang et al., 2013; Shi et al., 2014). Apart from biomass burnings, vehicular exhausts, domestic heating, industrial emissions and other fugitive sources can be acknowledged as important sources of PAHs (Riva et al., 2011; Wei et al., 2012; Amodio et al., 2013; Slezakova et al., 2013; Mu et al., 2014). As a consequence, there is a growing concern for human exposure risk to airborne carcinogens.
Previous epidemiological studies indicate that lung cancer evidences were substantially higher among residents in Northern Thailand, particularly in women (Pisani et al., 2006; Bumroongkit et al., 2008; Kamnerdsupaphon et al., 2008). For instance, a retrospective study used patient’s records at the Chiang Mai Cancer registry and Maharaj Nakorn Chiang Mai Hospital from January 2001 to December 2005 revealed a comparatively high lung and breast cancer incidences

ARTICLE IN PRESS
Pongpiachan, Aerosol and Air Quality Research, x: 1–13, xxxx 2
(Kamnerdsupaphon et al., 2008). Another epidemiological study raised concerns over pesticide exposure or habitation in poorly ventilated houses may instead be related to the tumorigenesis of lung cancer patients in upper Northern Thailand (Bumroongkit et al., 2008). On the contrary, a previous study highlighted “tobacco smoking” as a main cause responsible for 96% of male and 64% of female lung cancer incidences found in rural area of Northern Thailand (Pisani et al., 2006).
In spite of some discrepancies over the causes of high lung cancer incidences, there has been no researches aiming on neither chemical characterization nor human exposure risk assessment of PM2.5 bound PAHs before and after the wildland-burning episode in Northern part of Thailand. Overall, the major objectives of this study are to (i) use three different toxicity equivalent concentration (TEQ) equations for assessing the risk of exposure to PAHs, (ii) calculate daily exposure of PM2.5 bounded PAHs, and (iii) conduct incremental lifetime cancer risk of PM2.5 bounded PAHs via ingestion, inhalation, and dermal contact with dust particles at nine administrative provinces in northern part of Thailand. EXPERIMENTAL Descriptions of Observatory Sites
All nine administrative provinces of Northern Thailand are classified as tropical wet and dry climate (Köppen climate classification: Aw). The weather is fairly dry and warm in winters while the temperatures rise until April with the hottest
average daily maximum at 34.9°C (94.8°F). The monsoon season runs from late April through October, with heavy rain and somewhat cooler temperatures during the day, although nights remain warm. The geographical positions of each monitoring station were written as below: Chiang-Mai Observatory Site (CMOS): (E: 498805, N: 2077713), Chiang-Rai Province Observatory Site (E: 593783, N: 2258302), Nan Province Observatory Site (NPOS; Thewarat Hotel; E: 687123, N: 2077209), Phayao Province Observatory Site (PYOS; Arunothai Coffee House Homestay; E: 594420, N: 2119215), Mae Hong Son Province Observatory Site (MHOS; Mae Hong Son Provincial Forestry Office; E: 391834, N: 2134869), Phrae Province Observatory Site (PHOS; Nana Charoenmuang Hotel; E: 620935, N: 2006155), Lampang Province Observatory Site (LMOS; Maemoh Training Center; E: 568200, N: 2020017), Lamphun Province Observatory Site (LPOS; Lamphun Provincial Administration Organization Stadium; E: 500441, N: 2052987), Uttaradit Province Observatory Site (UTOS; OUM Hotel; E: 615923, N: 1948269) (See Fig. 1). All air quality observatory sites were situated in the city center of each administrative province of Northern Thailand. The population density vary widely, from the relatively urbanized Chiang-Mai and Chiang-Rai Provinces with the range of 80 to 100 people km–2, to the mostly-forest area of Mae Hon Song Province with less than 40 people km–2 (See Fig. 2). It is also worth mentioning that Northern Thailand contrasts remarkably from other regions of Thailand. All monitoring stations are geologically categorized by several mountainous belts, which continue from the Shan Hills in bordering
Fig. 1. PM2.5 monitoring stations in nine administrative provinces of Northern Thailand.

ARTICLE IN PRESS
Pongpiachan, Aerosol and Air Quality Research, x: 1–13, xxxx 3
Fig. 2. Population density in nine administrative provinces of Northern Thailand.
RUM and LPDR, and climatically highlighted by a tropical savanna. Sampling of PM2.5
Samplings of PM2.5 were conducted and collected every week on pre-baked (550°C for 12 h) quartz-fiber filters (QFFs; Whatman 47 mm; Article No., 28418542 (US reference)) with the assistance of MiniVolTM portable air samplers (Airmetrics) using the flow rate of 5 litres minute–1 through a particle size separator (impactor) and consequently through a 47 mm filter. More details of the PM2.5 sampling method was provided in “EPA Quality Assurance Guidance Document: Method Compendium, Field Standard Operating Procedures for the PM2.5 Performance Evaluation Program, United States Environmental Protection Agency Office of Air Quality Planning and Standards” (U.S. EPA, 2002). The weight measurement of PM2.5 was strictly followed the instructions of US-EPA Quality Assurance Document: Method Compendium, PM2.5 Mass Weighing Laboratory Standard Operating Procedures for the Performance Evaluation Program, United States Environmental Protection Agency Office of Air Quality Planning and Standards (U.S. EPA, 1998) with the employment of micro balances (Mettler Toledo, New Classic MF, MS205DU, Switzerland). The sampling campaigns can be separated into two groups according to the monitoring period during which they were conducted: Campaign-І was conducted before the “wildland fire episode” in the winter of 2012 (i.e., from the 7th to 22nd of December 2012), while air sampling during Campaign-
П was done in March 2013 (i.e., from the 4th to 19th of
March 2013).
Campaign-I (Nine Northern Provinces-I (NNP-I);
Sampling before the Haze Episode)
Observations of PM2.5 at cluster-I sampling stations (CROS, PYOS and NPOS), cluster-II sampling stations (LMOS, PHOS and UTOS) and cluster-III sampling stations (MHOS, CMOS and LPOS) was conducted synchronously daily from the 28th of November to the 4th of December 2012, from the 7th to 13th of December 2012 and from the 16th to 22nd of December 2012, respectively. Campaign-II (Nine Northern Provinces-II (NNP-II);
Sampling after the Haze Episode)
Air quality observations at cluster-I monitoring stations (CROS, PYOS and NPOS), cluster-II monitoring stations (LMOS, PHOS and UTOS) and cluster-III monitoring stations (MHOS, CMOS and LPOS) was performed synchronously daily from the 23th of February to the 2nd of March 2013, from the 4th to 11th of March 2013 and from the 13th to 20th of March 2013, respectively.
Since the two campaigns consist of only three weeks durations, it is crucial to carefully investigate seasonal and daily variations, which can be effected by meteorological conditions. The seasonal representativeness of these campaigns should be validated and discussed. As displayed in Fig. 3, the hotspot numbers in northern Thailand provided by the Centre for Remote Imaging, Sensing and Processing (CRISP), the National University of Singapore, were classified into types namely Campaign-I and Campaign-II.

ARTICLE IN PRESS
Pongpiachan, Aerosol and Air Quality Research, x: 1–13, xxxx 4
The average hotspot number during Campaign-II (i.e., 532 ± 543) was significantly (p < 0.05) higher than those of Campaign-I (i.e., 96 ± 92), highlighting the importance of biomass burnings in March 2013 and thus the selected sampling period can be used to justify the seasonal representativeness of monitoring campaigns.
Polycyclic Aromatic Hydrocarbons (PAHs) A mix standard solution of 13 native PAHs [Norwegian
Standard (NS 9815: S-4008-100-T): phenanthrene (Phe), anthracene (An), fluoranthene (Fluo), pyrene (Pyr), b en z [a ] an th r acene ( B[a ]A) , ch r ysen e ( Chr y) , benzo[b]fluoranthene (B[b]F), benzo[k]fluoranthene (B[k]F), benzo[a]pyrene (B[a]P), benzo[e]pyrene (B[e]P), indeno[1,2,3-c,d]pyrene (Ind), dibenz[a,h]anthracene
(D[a,h]A), and benzo[g,h,i]perylene (B[g,h,i]P) and a mix of recovery internal standard (IS) PAHs [d12-perylene (d12-Per) and d10-fluorene (d10-Fl)] were ordered from Chiron AS (Stiklestadveine 1, N-7041 Trondheim, Norway) and used for this study. The exceptionally low concentrations of PAHs in PM2.5 need their pre-concentration through Soxhlet extraction and fractionization prior to their quantitative analysis on a gas chromatograph coupled to a mass spectrometer (Shimadzu GCMS-QP2010 Ultra system with 60 m length × 0.25 mm i.d. capillary column of Agilent JW Scientific DB- 5 GC columns). The analytical procedure used in this study and relevant information has been explained in previous publications (Pongpiachan, 2009, 2011, 2013a, b; Pongpiachan et al., 2013a, b). Briefly, all QFFs samples were chemically extracted with dichloromethane (Fisher
Fig. 3. Hot spot numbers before and after burning episodes in nine administrative provinces of Northern Thailand.

ARTICLE IN PRESS
Pongpiachan, Aerosol and Air Quality Research, x: 1–13, xxxx 5
Scientific, HPLC grade) by employing the Soxhlet apparatus. The QFFs samples were spiked with known amount of deuterated internal standards (i.e., d10-fluorene and d12-perylene) prior to the Soxhlet extraction. The fractionization protocol was started with the elution of PAH fraction with15 mL of 4:6 (v/v) toluene:hexane by using silica gel. Subsequently, the organic extract was rotary evaporated and reduced the volume with the assistance of gentle nitrogen stream to almost dryness until the final volume was 100 µL. More details of GC/MS method were provided in previous studies and will not be discussed here (Pongpiachan et al., 2009, 2011). Both precisions and accuracies were quarantined by applying the standard reference material (SRM 1941b: National Institute of Standard and Technology). Health Risk Assessment of PAHs Toxicity Equivalent Concentration (TEQ)
The toxicity equivalent concentration (TEQ) equation is broadly used for assessing the risk of exposure to PAHs, which can be calculated as described bellows (Yang et al., 2007; Yu et al., 2008; Pongpiachan et al., 2013b): TEQ = ∑
i
[Ci
× TEFi
] (1)
Here, Ci and TEFi are acronyms for the concentrations of individual PAH and the toxic equivalency factors, respectively. Since the poisonousness of a single PAH congener can differ by orders of degree, it is essential to show the toxicity of PAHs in terms of the most toxic form of PAHs, B[a]P. By employing TEF, the toxicity of a combination of PAH congeners can be evaluated in a single number, which is generally referred as the toxic equivalency, TEQ. It is a specific number causing from the product of the concentration and individual TEF values of each PAH, as described in Eq. (1). In this study, three TEQ equations were used with the citations of Nisbet and Lagoy (1992) (Eq. (2)), US EPA (1993) (Eq. (3)), and Cecinato (1997) (Eq. (4)). In these three TEQ formulas, the acronyms for the PAH congeners represent their concentrations.
� �> @� �
> @ > @ > @� �> @ > @
0.001
0.01 , ,
0.1
,
Nisbet and Lagoy
TEQ Phe Fluo Pyr
An B g h i P Chry
B a A B b F B k F Ind
B a P D a h A
� �
� � �
� � � �
� �
(2)
> @� � > @ > @� �
> @ � � > @� � 0.06 0.07
0.08 0.6 ,US EPA
TEQ B a A B b F B k F
B a P Ind D a h A
� � �
� � � (3)
� �> @ > @ > @� �
> @ > @
0.01
0.1
,
Cecinato
TEQ Chry
B a A B b F B k F Ind
B a P D a h A
� � � �
� �
(4)
In addition, the abbreviations of Σ3,4-rings PAHs and
Σ5,6-rings PAHs stand for the sum of Phe, An, Fluo, Pyr,
B[a]A, Chry+Tri and B[b+k]F, B[e]P, B[a]P, Ind, D[a,h]A, B[g,h,i]P, respectively. Daily Exposure of PM
2.5
Bounded PAHs
The calculations of daily exposure of PM2.5 bounded PAHs were conducted by using three different TEQ values as previously described in section 2.3.1.
PM2.5
13 1,000DID
PDI ingestion
TEQ M
M �
u ¦ (5)
MDID (mg day–1) represents the daily intake of dust by
either adults or children. In this study, the MDID values of 4.16–100 and 55–200 mg day–1 were applied for adults and children, respectively (U.S. EPA, 1997). As a consequence, 4.16 and 55 mg day–1 for adults and children were assumed as comparatively low exposure situation whilst 100 and 200 mg day–1 were taken into account as relatively high exposure situation, correspondingly. A similar concept was applied to the calculation of PM2.5 bounded TEQs daily exposure via inhalation (MPDI-inhalation; ng day–1), which is based on Eq. (6):
PM2.513
PDI inhalation inhalation
M IR TEQ� ¦ (6)
where, ∑13TEQPM2.5 (ng m–3) is the sum of the TEQ contents of the 13 PAHs measured in PM2.5. The inhalation rate (IRinhalation) used in this research was 10 and 20 m3 day–1 for children and adults respectively (SFT, 1999). Incremental Lifetime Cancer Risk of PM
2.5
Bounded PAHs
Assuming that (i) there are only ingestion, inhalation, and dermal contact with dust particles, which can be considered as three major pathways for human exposure; (ii) the total carcinogenic risk could be evaluated by using TEQ values as previously mentioned in section 2.3.1; (iii) intake rates and particle emission can be estimated by those developed for soil particles, the exposure risk for environmental PAHs can be quantitatively evaluated by using the concept of incremental lifetime cancer risk (ILCR) (U.S. EPA, 1991; Chen and Liao, 2006; Peng et al., 2011). The subsequent equations were extensively applied to estimate the ILCR in terms of ingestion, dermal contact and inhalation:
3
6
70
10
Ingestion
Ingestion Ingestion
ILCRs
BW
CS CSF IR EF ED
BW AT
§ ·§ ·u u u u u¨ ¸¨ ¸¨ ¸© ¹© ¹u u
(7)
3
6
70
10
Dermal
Dermal
ILCRs
BW
CS CSF SA AF ABS EF ED
BW AT
§ ·§ ·u u u u u u u¨ ¸¨ ¸¨ ¸© ¹© ¹u u
(8)
ARTICLE IN PRESS
Pongpiachan, Aerosol and Air Quality Research, x: 1–13, xxxx 6
370
Inhalation
Inhalation Inhalation
ILCRs
BW
CS CSF IR EF ED
BW AT PEF
§ ·§ ·u u u u u¨ ¸¨ ¸¨ ¸© ¹© ¹u u
(9)
where ILCRsIngestion: Incremental lifetime cancer risk in terms of ingestion. ILCRsDermal: Incremental lifetime cancer risk in terms of dermal. ILCRsInhalation: Incremental lifetime cancer risk in terms of inhalation. CS: The sum of converted PAHs concentrations based on TEQ values as proposed by Nisbet and Lagoy (1992) (Eq. (2)), US EPA (1993) (Eq. (3)), and Cecinato (1997) (Eq. (4)). CSFIngestion: Carcinogenic slope factor for ingestion of B[a]P (7.3 mg kg–1 day–1)–1 (Peng et al., 2011). CSFDermal: Carcinogenic slope factor for dermal of B[a]P (25 mg kg–1 day–1)–1 (Peng et al., 2011). CSFInhalation: Carcinogenic slope factor for inhalation of B[a]P (3.85 mg kg–1 day–1)–1 (Peng et al., 2011). BW: Body weight of child (15 kg) and adult (61.5 kg) (Shi et al., 2011). EF: Exposure frequency of child (180 d a–1) and adult (180 d a–1) (Ferreira-Baptista and De Miguel, 2005). ED: Exposure duration of child (6 a) and adult (24 a) (U.S. EPA, 2001). IRInhalation: Inhalation rate of child (10 m3 day–1) and adult (20 m3 day–1) (SFT, 1999). IRIngestion: Dust ingestion rate of child (200 mg day–1) and adult (100 mg day–1) (U.S. EPA, 2001). SA: Dermal exposure area of child (2,800 cm2) and adult (5,700 cm2) (UE-EPA, 2001). AF: Dermal adherence factor of child (0.2 mg cm–2) and adult (0.07 mg cm–2) (U.S. EPA, 2001). ABS: Dermal adsorption fraction of child (0.13) and adult
(0.13) (U.S. EPA, 2001). AT: Averaging life span of child (25,550 d) and adult (25,550 d) (Ferreira-Baptista and De Miguel, 2005). PEF: Particle emission factor of child (1.36 × 10⁹ m3 kg–1) and adult (1.36 × 10⁹ m3 kg–1) (U.S. EPA, 2001). Note that the model for children (1–6 years old) and adults (7–31 years old) were based on the Risk Assessment Guidance of U.S. EPA and related publications. RESULTS AND DISCUSSION
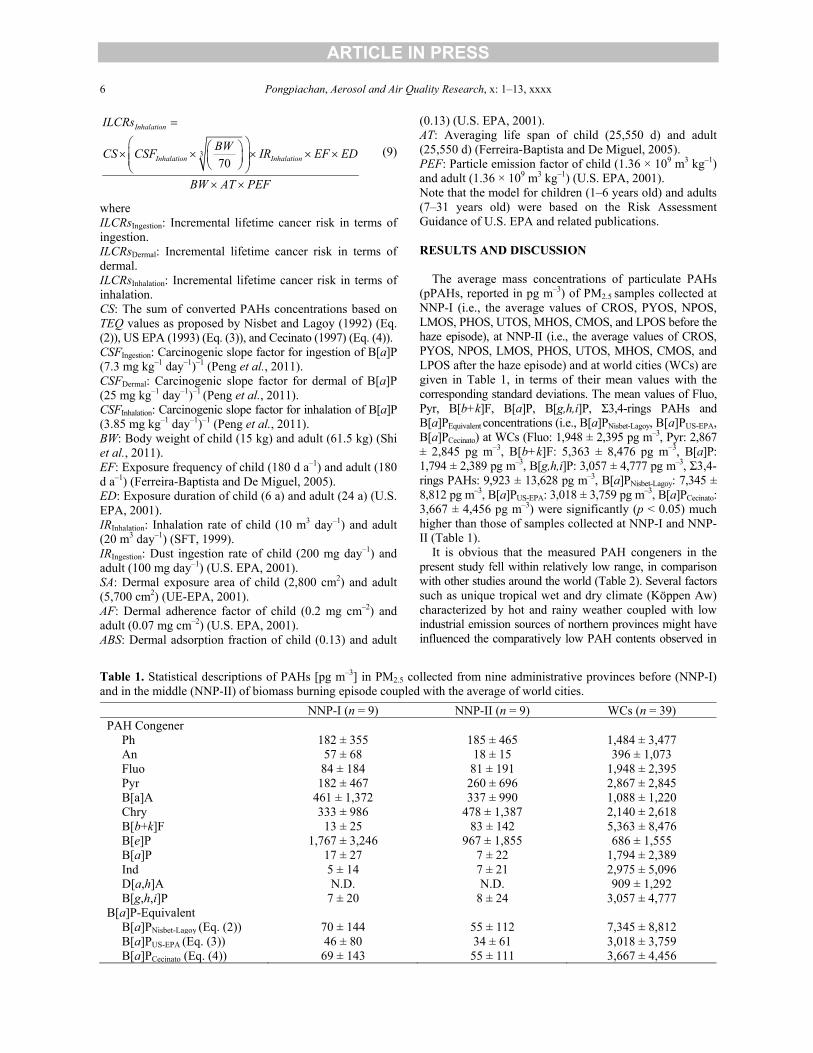
The average mass concentrations of particulate PAHs (pPAHs, reported in pg m–3) of PM2.5 samples collected at NNP-I (i.e., the average values of CROS, PYOS, NPOS, LMOS, PHOS, UTOS, MHOS, CMOS, and LPOS before the haze episode), at NNP-II (i.e., the average values of CROS, PYOS, NPOS, LMOS, PHOS, UTOS, MHOS, CMOS, and LPOS after the haze episode) and at world cities (WCs) are given in Table 1, in terms of their mean values with the corresponding standard deviations. The mean values of Fluo, Pyr, B[b+k]F, B[a]P, B[g,h,i]P, Σ3,4-rings PAHs and B[a]PEquivalent concentrations (i.e., B[a]PNisbet-Lagoy, B[a]PUS-EPA, B[a]PCecinato) at WCs (Fluo: 1,948 ± 2,395 pg m–3, Pyr: 2,867 ± 2,845 pg m–3, B[b+k]F: 5,363 ± 8,476 pg m–3, B[a]P: 1,794 ± 2,389 pg m–3, B[g,h,i]P: 3,057 ± 4,777 pg m–3, Σ3,4-rings PAHs: 9,923 ± 13,628 pg m–3, B[a]PNisbet-Lagoy: 7,345 ± 8,812 pg m–3, B[a]PUS-EPA: 3,018 ± 3,759 pg m–3, B[a]PCecinato: 3,667 ± 4,456 pg m–3) were significantly (p < 0.05) much higher than those of samples collected at NNP-I and NNP-II (Table 1).
It is obvious that the measured PAH congeners in the present study fell within relatively low range, in comparison with other studies around the world (Table 2). Several factors such as unique tropical wet and dry climate (Köppen Aw) characterized by hot and rainy weather coupled with low industrial emission sources of northern provinces might have influenced the comparatively low PAH contents observed in
Table 1. Statistical descriptions of PAHs [pg m–3] in PM2.5 collected from nine administrative provinces before (NNP-I) and in the middle (NNP-II) of biomass burning episode coupled with the average of world cities.
NNP-I (n = 9) NNP-II (n = 9) WCs (n = 39) PAH Congener
Ph 182 ± 355 185 ± 465 1,484 ± 3,477 An 57 ± 68 18 ± 15 396 ± 1,073 Fluo 84 ± 184 81 ± 191 1,948 ± 2,395 Pyr 182 ± 467 260 ± 696 2,867 ± 2,845 B[a]A 461 ± 1,372 337 ± 990 1,088 ± 1,220 Chry 333 ± 986 478 ± 1,387 2,140 ± 2,618 B[b+k]F 13 ± 25 83 ± 142 5,363 ± 8,476 B[e]P 1,767 ± 3,246 967 ± 1,855 686 ± 1,555 B[a]P 17 ± 27 7 ± 22 1,794 ± 2,389 Ind 5 ± 14 7 ± 21 2,975 ± 5,096 D[a,h]A N.D. N.D. 909 ± 1,292 B[g,h,i]P 7 ± 20 8 ± 24 3,057 ± 4,777
B[a]P-Equivalent B[a]PNisbet-Lagoy (Eq. (2)) 70 ± 144 55 ± 112 7,345 ± 8,812 B[a]PUS-EPA (Eq. (3)) 46 ± 80 34 ± 61 3,018 ± 3,759 B[a]PCecinato (Eq. (4)) 69 ± 143 55 ± 111 3,667 ± 4,456

ARTICLE IN PRESS
Pongpiachan, Aerosol and Air Quality Research, x: 1–13, xxxx 7
Table 2. Aerosol observatory sites from cities around the world (WCs) for PAHs analysis. Country City Source Type References Taiwan Taichung Industrial park Fang et al., 2005 Taiwan Southern Taiwan Carbon Black Industrial Tsai et al., 2002 Taiwan Taichung Urban Fang et al., 2004 Taiwan Taichung Rice Straw Burning Yang et al., 2006 Taiwan Taichung Non- Burning Yang et al., 2006 China Guangzhou Urban Tan et al., 2006 China Guangzhou Urban Bi et al., 2002 China Nanjing Urban Wang et al., 2006
Taiwan Taichung Industrial park Fang et al., 2005 China Guangzhou Urban Traffic Li et al., 2005 China Nanjing Urban Wang et al., 2003 China Shantu Urban Deng et al., 2006 China nanjing Urban Wang et al., 2006
Hong Kong Hung hom Urban Guo et al., 2003 Singapore NUS Urban Karthikeyan et al., 2006 Singapore NUS Canteen Karthikeyan et al., 2006 Belgium Antwerp Urban Ravindra et al., 2006 Germany Augburg Urban Schnelle-Kreis et al., 2005 Sweden Gothenberg Urban Wingfors et al., 2001
Italy Naples Urban Caricchia et al., 1999 Greece Athens Urban Vasilakos et al., 2007 Greece Athens Urban Mantis et al., 2005
England Berminghan Traffic Pongpiachan, 2006 England Berminghan Campus Pongpiachan, 2006 England Whitbourne Rural Pongpiachan, 2006 Sweden Gothenberg Urban Wingfors et al., 2001 Czech Brno Urban Ciganek et al., 2004 USA Baltimore Urban Dachs et al., 2002 USA Texus Urban Park et al., 2001 USA Florida Urban Poor et al., 2004 Brazil Rio Grande do Sul Urban Dallarosa et al., 2005a Brazil Rio Grande do Sul Urban Dallarosa et al., 2005b Brazil Rural Dallarosa et al., 2005b Brazil Industry Dallarosa et al., 2005b
Algeria Algiers Industry Yassaa et al., 2001a Algeria Algiers Urban Yassaa et al., 2001b
Australia Melbourne Urban Bartkow et al., 2004 Australia Brisbane Urban Bartkow et al., 2004 Australia Springwood Rural Lim et al., 2005
NNP-I and NNP-II. While using the Σ3,4-rings PAHs level at NNP-I as the background level, the magnitude of Σ3,4-rings PAHs at the WCs increased by factors of 7.6, and that of B[a]PNisbet-Lagoy, B[a]PUS-EPA, and B[a]PCecinato were roughly enhanced by factors of 105, 66, and 53, respectively. Previous studies have indicated that vehicular traffic was the main sources of PM2.5 bounded PAHs in urban cities (Slezakova et al., 2011; Martellini et al., 2012; Slezakova et al., 2013). These findings underline the prominence of traffic emissions as the main contributors of PM2.5 bounded PAHs, and it might have been exceeded numerous emission sources involving wild land fire and biomass burnings. As there were no significant differences detected at NNP-I and NNP-II (Table 1), it seems plausible to mention that the wild land fire episode plays a minor role on variations of PM2.5 bounded PAHs in nine administrative provinces of
Northern Thailand. Health Risk Assessment
In this study, non-dietary exposure is defined as human exposure to PM2.5 bounded PAHs via both household air and dust (Wilford et al., 2005). Table 3 displays the excess cancer risks associated with house dust exposure in NNP-I, NNP-II, and WCs, ranged from 3.732 × 10⁻⁴ ± 7.929 × 10⁻⁴ (NNP-II-TEQUS-EPA with ingestion rate of 50 mg day–1) to 1.451 ± 1.741 (WCs-TEQNisbet-Lagoy with ingestion rate of 100 mg day–1), depending on TEQ equations and ingestion rate (IR) as displayed in Eq (5). The mean cancer risks of NNP were 8.525 × 10⁻⁴ ± 3.493 × 10⁻³ and 2.558 × 10⁻³ ± 6.986 × 10⁻³ for ingestion rate of 50 and 100 mg day–1, respectively. The cancer risks of WCs for ingestion rate of 50 and 100 mg day–1 were greatly higher than those of

ARTICLE IN PRESS
Pongpiachan, Aerosol and Air Quality Research, x: 1–13, xxxx 8
NNP for 851 and 567 times in that order. Although the cancer risks of NNP were much lower than those of WCs, its average values ranged from 10–4 to 10–3 (i.e., one cancer incidence case per million), which can be considered as unacceptable cancer risks (Maertens et al., 2008). These values are comparable to those of foundry workers (9.06 × 10⁻⁴ and 1.09 × 10⁻³) in Taiwan (Liu et al., 2010), but higher than those predicted as occupational exposure for sinter metal workers (3.18 × 10⁻⁵ and 4.98 × 10⁻⁵) (Lin et
al., 2008; Chiang et al., 2009) and the Canadian maximum acceptable level of risk (1 × 10⁻⁵) (Maertens et al., 2008). The current study indicates there is some concerns on adverse health impact related with PM2.5 bounded PAHs exposure for preschool children via non-dietary exposure in home environment, based on the calculation of Eqs. (1)–(5).
The highest average values of TEQ daily exposure doses via house dust (MPDI-ingestion; ng day–1) for adults and children was 7.345 × 10⁴ ± 8.813 × 10⁴ and 1.469 × 10⁵ ± 1.763 ×
105 ng day–1 under high exposure condition (with ingestion rate of 100 and 200 mg day–1 for adults and children) with the application of WCs-TEQNisbet-Lagoy, while 4.715 ± 12.08 and 62.33 ± 159.8 ng day–1 under low exposure condition (4.16 and 55 mg day–1 for adults and children) with the employment of NNP-II-TEQUS-EPA, respectively (Table 4). It is also important to note that MPDI-ingestion values of NNP-II-TEQUS-EPA were almost similar to those of Guangzhou for adults and children with the values of 4.31 and 57.0 ng day–1, respectively (Wang et al., 2013). For TEQs daily exposure via inhalation (MPDI-inhalation; ng day–1), WCs- M-PDI-inhalation-Nisbet-Lagoy shows the highest values for both adults and children with the values of 147 ± 176 and 735 ± 881 ng day–1, in that order (Table 5). Since the values of MPDI-ingestion were two to three orders of magnitude exceed those of MPDI-inhalation, it would be safe to assume that dust ingestion was extremely crucial to non-dietary PAH exposure in comparison with PM2.5 inhalation. These findings in NNP
Table 3. The cancer risks associated with non-dietary ingestion of PAHs in house dust for preschool children as estimated by using Eq. (5) (U.S. EPA, 1997; Maertens et al., 2008).
NNP-I NNP-II WCs (n = 9) (n = 9) (n = 39)
Ingestion Rate [mg day–1] 50 50 50 50 50 50 Aver Stdev Aver Stdev Aver Stdev
Cancer Risk-Nisbet-Lagoy 2.305E-03 6.774E-03 6.037E-04 1.456E-03 7.256E-01 8.707E-01
Ingestion Rate [mg day–1] 100 100 100 100 100 100 Aver Stdev Aver Stdev Aver Stdev
Cancer Risk-Nisbet-Lagoy 4.610E-03 1.355E-02 1.207E-03 2.912E-03 1.451E+00 1.741E+00 Table 4. The calculation of TEQs daily exposure via ingestion (MPDI-ingestion; ng day–1) as displayed in Eq. (6) (U.S. EPA, 1997).
M-DID (mg day–1) Children Children Adult Adult 55 200 4.16 100
M-PDI- ingestion-Nisbet-Lagoy
NNP-I NNP-I NNP-I NNP-I (n = 9) (n = 9) (n = 9) (n = 9)
Aver Stdev Aver Stdev Aver Stdev Aver Stdev 1.283E+02 3.771E+02 4.667E+02 1.371E+03 9.707E+00 2.853E+01 2.333E+02 6.857E+02
M-PDI- ingestion-Nisbet-Lagoy NNP-II NNP-II NNP-II NNP-II (n = 9) (n = 9) (n = 9) (n = 9)
1.008E+02 2.933E+02 3.667E+02 1.067E+03 7.627E+00 2.219E+01 1.833E+02 5.333E+02
M-PDI- ingestion-Nisbet-Lagoy WCs WCs WCs WCs
(n = 39) (n = 39) (n = 39) (n = 39) 4.040E+04 4.847E+04 1.469E+05 1.763E+05 3.056E+03 3.666E+03 7.345E+04 8.813E+04
Table 5. Calculation of TEQs daily exposure via inhalation (MPDI-inhalation; ng day–1) is based on Eq. (6) (SFT, 1999)
NNP-I NNP-II WCs (n = 9) (n = 9) (n = 19) Adult Adult Adult
Inhalation Rate [m3] 20 20 20 20 20 20 Aver Stdev Aver Stdev Aver Stdev
M-PDI-inhalation-Nisbet-Lagoy 1.400E+00 2.880E+00 1.100E+00 2.240E+00 1.469E+02 1.763E+02
Inhalation Rate [m3] 10 10 10 10 10 10 Aver Stdev Aver Stdev Aver Stdev
M-PDI-inhalation-Nisbet-Lagoy 7.000E-01 1.440E+00 5.500E-01 1.120E+00 7.345E+01 8.813E+01

ARTICLE IN PRESS
Pongpiachan, Aerosol and Air Quality Research, x: 1–13, xxxx 9
are consistent with those of Guangzhou (Wang et al., 2013), highlighting the importance of indoor air quality on long-term adverse respiratory diseases in Asian cities.
Incremental Lifetime Cancer Risk
This is the first attempt that evaluated the potential cancer risk of human exposure to PM2.5 bounded PAHs of different exposure routes before and after the haze episode by using three different TEQ methods. The potential cancer risks of adults and children can be assessed by using ILCR for exposure routes of ingestion, dermal contact and inhalation as displayed in Eq. (7), Eq. (8), and Eq. (9), respectively (Table 6) (Chen and Liao, 2006; Peng et al., 2011; Wang et al., 2011). It is important to note that ILCRDermal and ILCRIngestion varied from 10–10 to 10–8 in both NNP-I and NNP-II samples, while those of WCs was 10–7 to 10–6; approximately two to three orders of magnitude higher than those of NNP. This indicates that human activities in urban world cities play an important role in governing potential cancer risk of human exposure to PM2.5 bounded PAHs. It is also worth mentioning that both ILCRDermal and ILCRIngestion were significantly higher than ILCRInhalation, denoting that respiration of PM2.5 bounded PAHs through mouth and nose was practically unimportant, when compared with the other exposure pathways. These findings were in good agreement with studies of exposure to heavy metals in street dust of Angola (Ferreira-Baptista and De Miguel, 2005) and dust samples collected from Guangzhou, a typical urban center in South China (Wang et al., 2011). In the case of children, the ILCRIngestion was significantly eight times higher (p < 0.05) than those of ILCRDermal, suggesting that the hand-to-mouth activity prominently contributed to the cancer risk for children. This finding is also in consistent with the investigation of potential risk of children exposure on heavy metal distribution in dust from elementary schools in Hermosillo, Sonora, Mexico (Meza-Figueroa et
al., 2007) and potential cancer risk of children exposure to urban dust bounded PAHs in Guangzhou, China (Wang et
al., 2011). Therefore, it appears reasonable to conclude that the hazard health risk for children exposed to PM2.5 bounded PAHs through direct ingestion is considered to be noticeably greater than that of dermal contact and inhalation.
Under most guidelines for carcinogen risk assessment, the values of ILCR range from 10–6 to 10–4 implied potential cancer risk, while the practical safety was expressed with an ILCR of 10–6 or less and a potential high risk was evaluated by an ILCR of higher than 10–4 (Chen and Liao, 2006; Wang et al., 2011). Furthermore, U.S. EPA Risk Assessment Guidance for Superfund Program adopts a cancer risk level of 10–6 to suggest the point at which risk management decisions should be taken. By applying the same guidance, the chance of adverse cancer-causing effects in northern provinces of Thailand was considerably lower in comparison to world urban cities. In this study, the average values of ILCR of children as estimated by three different TEQs for NNP for both monitoring campaigns were 5.371 × 10⁻⁹ ± 1.518 × 10⁻⁸, 6.696 × 10⁻¹⁰ ± 1.893 × 10⁻⁹ and 1.042 × 10⁻¹⁴ ± 2.944 × 10⁻¹⁴, for ingestion, dermal contact, and inhalation, respectively; these risk levels are 1.862 × 10², 1.493 × 10³,
Tab
le 6
. Cal
cula
tions
of I
LC
R in
term
s of i
nges
tion
(Eq.
(7))
, der
mal
con
tact
(Eq.
(8))
and
inha
latio
n (E
q. (9
)) d
ue to
hum
an e
xpos
ure
to P
AH
s via
PM
2.5
N
NP-
I N
NP-
I N
NP-
II
NN
P-II
W
orld
Citi
es
Wor
ld C
ities
(n =
9)
(n =
9)
(n =
9)
(n =
9)
(n =
19)
(n
= 1
9)
A
dult
Chi
ldre
n A
dult
Chi
ldre
n A
dult
Chi
ldre
n
Ave
r St
dev
Ave
r St
dev
Ave
r St
dev
Ave
r St
dev
Ave
r St
dev
Ave
r St
dev
ILC
Rs-
Inge
stio
n
N
isb
et-L
ago
y
1.37
1E-0
8 4.
030E
-08
6.85
7E-0
9 2.
015E
-08
1.07
8E-0
8 3.
135E
-08
5.38
8E-0
9 1.
567E
-08
4.31
7E-0
6 5.
180E
-06
2.15
9E-0
6 2.
590E
-06
ILC
Rs-
Der
mal
N
isb
et-L
ago
y
2.43
6E-0
9 7.
159E
-09
8.54
8E-1
0 2.
512E
-09
1.91
4E-0
9 5.
568E
-09
6.71
6E-1
0 1.
954E
-09
7.66
9E-0
7 9.
201E
-07
2.69
1E-0
7 3.
229E
-07
ILC
Rs-
Inha
latio
n
N
isb
et-L
ago
y
1.06
4E-1
3 3.
126E
-13
1.33
0E-1
4 3.
907E
-14
8.35
7E-1
4 2.
431E
-13
1.04
5E-1
4 3.
039E
-14
3.34
8E-1
1 4.
017E
-11
4.18
5E-1
2 5.
022E
-12

ARTICLE IN PRESS
Pongpiachan, Aerosol and Air Quality Research, x: 1–13, xxxx 10
and 9.602 × 10⁷ times lower than that of US EPA (1991) baseline in that order. In addition, the average ILCR of adults living in NNP as estimated by three different TEQs for three various exposure pathways was 256 and 237 times lower than the WCs and US EPA baseline, further indicating that the cancer risk of NNP falls into the ‘‘acceptable level’’ range. CONCLUSIONS
In this study, PAHs analysis in PM2.5 collected in nine administrative provinces of Northern Thailand from December 2012 to March 2013 did not show any significant differences between wildland fire and non-wildland fire seasons. These findings underline the influences of traffic emissions as regular contributors of PM2.5-bound PAHs. While the excess cancer risks of PM2.5-bound PAHs in Northern Thailand were greatly lesser than those of other world cities, its average values ranged from 10–4 to 10–3, which was higher than the Canadian maximum acceptable level of risk (1 × 10⁻⁵) and other previous occupation exposure studies. The average ILCR values of adults living in Northern Thailand as predicted by three different TEQs for ingestion, dermal contact, and inhalation exposure pathways were much lower than the US EPA baseline, further denoting that the cancer risk of NNP falls into the ‘‘acceptable level’’ range. ACKNOWLEDGEMENT
This project was financed by National Institute of Development Administration (NIDA) Research Center. The author acknowledges Assist. Prof. Dr. Torpong Kreetachart from School of Energy and Environment (SEEN), University of Phayao for their contributions on laboratory works. The authors thank the kind support from Pollution Control Department, Ministry of Natural Resources and Environment for providing meteorological data. REFERENCES Amodio, M., Andriani, E., Dambruoso, P.R., de Gennaro,
G., Di Gilio, A., Intini, M., Palmisani, J. and Tutino, M. (2013). A Monitoring Strategy to Assess the Fugitive Emission from a Steel Plant. Atmos. Environ. 79: 455–461.
Bartkow, M.E., Huckins, J.N. and Müller, J.F. (2004). Field-based Evaluation of Semipermeable Membrane Devices (SPMDs) as passive Air Samplers of Polyaromatic Hydrocarbons (PAHs). Atmos. Environ. 38: 5983–5990.
Bi, X., Sheng, G., Peng, P., Zhang, Z. and Fu, J. (2002). Extractable Organic Matter in PM10 from LiWan District of Guangzhou City, PR China. Sci. Total Environ. 300: 213–228.
Bumroongkit, K., Rannala, B., Traisathit, P., Srikummool, M., Wongchai, Y. and Kangwanpong, D. (2008). TP53 Gene Mutations of Lung Cancer Patients in Upper Northern Thailand and Environmental Risk Factors. Cancer Genet. Cytogenet. 185: 20–27.
Caricchia, A.M., Chiavarini, S. and Pezza, M. (1999).
Polycyclic Aromatic Hydrocarbons in the Urban Atmospheric Particulate Matter in the City of Naples (Italy). Atmos. Environ. 33: 3731–3738.
Cecinato, A. (1997). Polynuclear Aromatic Hydrocarbons (PAH), benz(a)pyrene (BaPY) and Nitrated-PAH (NPAH) in Suspended Particulate Matter. Anal. Chim.
87: 483–496. Chalbot, M.C., Vei, I.C., Lianou, M., Kotronarou, A.,
Karakatsani, A., Katsouyanni, K., Hoek, G. and Kavouras, I.G. (2012) Environmental Tobacco Smoke Aerosol in Non-Smoking Households of Patients with Chronic Respiratory Diseases. Atmos. Environ. 62: 82–88.
Chen, S.C. and Liao, C.M. (2006). Health Risk Assessment on Human Exposed to Environmental Polycyclic Aromatic Hydrocarbons Pollution Sources. Sci. Total Environ. 366: 112–123.
Chen, Y., Zhao, R., Xue, J. and Li, J. (2013). Generation and Distribution of PAHs in the Process of Medical Waste Incineration. Waste Manage. 33: 1165–1173.
Ciganek, M., Neca, J., Adamec, V., Janosek, J. and Machala, M. (2004). A Combined Chemical and Bioassay Analysis of Traffic-Emitted Polycyclic Aromatic Hydrocarbons. Sci. Total Environ. 334–335: 141–148.
Dachs, J., Glenn IV, T.R., Gigliotti, C.L., Brunciak, P., Totten, L.A., Nelson, E.D., Franz, T.P. and Eisenreich, S.J. (2002). Processes Driving the Short-Term Variability of Polycyclic Aromatic Hydrocarbons in the Baltimore and Northern Chesapeake Bay Atmosphere, USA. Atmos. Environ. 36: 2281–2295.
Dallarosa, J.B., Teixeira, E.C., Pires, M. and Fachel, J. (2005a). Study of the Profile of Polycyclic Aromatic Hydrocarbons in Atmospheric Particles (PM10) Using Multivariate Methods. Atmos. Environ. 39: 6587–6596.
Dallarosa, J.B., Mônego, J.G., Teixeira, E.C., Stefens, J.L. and Wiegand, F. (2005b) Polycyclic Aromatic Hydrocarbons in Atmospheric Particles in the Metropolitan Area of Porto Alegre, Brazil. Atmos. Environ. 39: 1609–1625.
Deng, W.J., Louie, P.K.K., Liu, W.K., Bi, X.H., Fu, J.M. and Wong, M.H. (2006). Atmospheric Levels and Cytotoxicity of PAHs and Heavy Metals in TSP and PM2.5 at an Electronic Waste Recycling Site in Southeast China. Atmos. Environ. 40: 6945–6955.
Fang, G.C., Chang, K.F., Lu, C. and Bai, H. (2004). Estimation of PAHs Dry Deposition and BaP Toxic Equivalency Factors (TEFs) Study at Urban, Industry Park and Rural Sampling Sites in Central Taiwan, Taichung. Chemosphere 55: 787–796.
Fang, G.C., Wu, Y.S., Chen, J.C., Fu, P.P.C., Chang, C.N., Ho, T.T. and Chen, M.H. (2005). Characteristic Study of Polycyclic Aromatic Hydrocarbons for Fine and Coarse Particulates at Pastureland near Industrial Park Sampling Site of central Taiwan. Chemosphere 60: 427–433.
Ferreira-Baptista, L. and De Miguel, E. (2005). Geochemistry and Risk Assessment of Street Dust in Luanda, Angola: A Tropical Urban Environment. Atmos. Environ. 39: 4501–4512.
Guo, H., Lee, S.C., Ho, K.F., Wang, X.M. and Zou, S.C. (2003). Particle-associated Polycyclic Aromatic

ARTICLE IN PRESS
Pongpiachan, Aerosol and Air Quality Research, x: 1–13, xxxx 11
Hydrocarbons in Urban Air of Hong Kong. Atmos.
Environ. 37: 5307–5317. Hoyer, B.P. (2001). Reproductive Toxicology: Current and
Future Directions. Biochem. Pharmacol. 62: 1557–1564. Huang, K., Fu, J.S., Hsu, N.C., Gao, Y., Dong, X., Tsay,
S.C. and Lam, Y.F. (2013). Impact Assessment of Biomass Burning on Air Quality in Southeast and East Asia during BASE-ASIA. Atmos. Environ. 78: 291–302.
Kamnerdsupaphon, P., Srisukho, S., Sumitsawan, Y., Lorvidhaya, V. and Sukthomya, V. (2008). Cancers in Northern Thailand. Biomed. Imaging Intervention J. 4: e46, doi: 10.2349/biij.4.3.e46.
Karthikeyan, S., Balasubramanian, R. and See, S.W. (2006). Optimization and Validation of a Low Temperature Microwave-Assisted Extraction Method for Analysis of Polycyclic Aromatic Hydrocarbons in Airborne Particulate Matter. Talanta 69: 79–86.
Li, C., Fu, J., Sheng, G., Bi, X., Hao, Y., Wang, X. and Mai, B. (2005). Vertical Distribution of PAHs in the Indoor and Outdoor PM2.5 in Guangzhou, China. Build.
Environ. 40: 329–341. Liao, M.C., Chio, P.C., Chen, Y.W., Ju, R.Y., Li, H.W.,
Cheng, H.Y., Liao, C.H.V., Chen, C.S. and Ling, P.M. (2011). Lung Cancer Risk in Relation to Traffic-Related Nano/Ultrafine Particle-Bound PAHs Exposure: A Preliminary Probabilistic Assessment. J. Hazard. Mater. 190: 150–158.
Lim, M.C.H., Ayoko, G.A. and Morawska, L. (2005). Characterization of Elemental and Polycyclic Aromatic Hydrocarbon Compositions of Urban Air in Brisbane. Atmos. Environ. 39: 463–476.
Liu, H.H., Yang, H.H., Chou, C.D., Lin, M.H. and Chen, H.L. (2010). Risk Assessment of Gaseous/Particulate Phase PAH Exposure in Foundry Industry. J. Hazard.
Mater. 181: 105–111. Liu, S., Wang, C., Zhang, S., Liang, J., Chen, F. and Zhao,
K. (2012). Formation and Distribution of Polycyclic Aromatic Hydrocarbons (PAHs) Derived from Coal Seam Combustion: A Case Study of the Ulanqab Lignite from Inner Mongolia, Northern China. Int. J. Coal Geol.
90–91: 126–134. Lu, T., Huang, Z., Cheung, C.S. and Ma, J. (2012). Size
Distribution of EC, OC and Particle-Phase PAHs Emissions from a Diesel Engine Fueled with Three Fuels. Sci. Total Environ. 438: 33–41.
Maertens, R.M., Yang, X.F., Zhu, J.P., Gagne, R.W., Douglas, G.R. and White, P.A. (2008). Mutagenic and Carcinogenic Hazards of Settled House Dust I: Polycyclic Aromatic Hydrocarbon Content and Excess Lifetime Cancer Risk from Preschool Exposure. Environ. Sci.
Technol. 42: 1747–1753. Mantis, J., Chaloulakou, A. and Samara, C. (2005). PM10-
Bound Polycyclic Aromatic Hydrocarbons (PAHs) in the Greater Area of Athens, Greece. Chemosphere 59: 593–604.
Martellini, T., Giannoni, M., Lepri, L., Katsoyiannis, A. and Alessandra, C.A. (2012). One Year Intensive PM2.5 Bound Polycyclic Aromatic Hydrocarbons Monitoring in the Area of Tuscany, Italy. Concentrations, Source
Understanding and Implications. Environ. Pollut. 164: 252–258.
Matsui, S. (2008). Endocrine Disruptors. Encyclopedia of Ecology, pp. 1259–1260.
Mu, L., Peng, L., Liu, X., Song, C., Bai, H., Zhang, J., Hu, D., He, Q. and Li, F. (2014). Characteristics of Polycyclic Aromatic Hydrocarbons and Their Gas/Particle Partitioning from Fugitive Emissions in Coke Plants. Atmos. Environ. 83: 202–210.
Nisbet, I.C.T. and LaGoy, P.K. (1992). Toxic Equivalency Factors (TEFs) for Polycyclic Aromatic Hydrocarbons (PAHs). Regul. Toxicol. Pharm 16: 290–300.
Oanh, K.N.T. and Leelasakultum, K. (2011). Analysis of Meteorology and Emission in Haze Episode Prevalence over Mountain-Bounded Region for Early Warning. Sci.
Total Environ. 409: 2261–2271. Park, J.S., Wade, T.L. and Sweet, S. (2001). Atmospheric
Distribution of Polycyclic Aromatic Hydrocarbons and Deposition to Galveston Bay, Texas, USA. Atmos.
Environ. 35: 3241–3249. Peng, C., Chen, W.P., Liao, X.L., Wang, M.E., Ouyang, Z.Y.
and Jiao, W.T. (2011). Polycyclic Aromatic Hydrocarbons in Urban Soils of Beijing: Status, Sources, Distribution and Potential Risk. Environ. Pollut. 159: 802–808.
Pengchai, P., Chantara, S., Sopajaree, K., Wangkarn, S., Tengcharoenkul, U. and Rayanakorn, M. (2009). Seasonal Variation, Risk Assessment and Source Estimation of PM10 and PM10-Bound PAHs in the Ambient air of Chiang Mai and Lamphun, Thailand. Environ. Monit.
Assess. 154: 197–218. Pisani, P., Srivatanakul, P., Randerson-Moor, J., Vipasrinimit,
S., Lalitwongsa, S., Unpunyo, P., Bashir, S. and Bishop, D.T. (2006). GSTM1 and CYP1A1 Polymorphisms, Tobacco, Air Pollution, and Lung Cancer: A Study in Rural Thailand. Cancer Epidemiol. Biomarkers Prev.
15: 667–674. Pongpiachan, S. (2006). Source Apportionment of Semi-
volatile Organic Compounds in Urban and Rural Air. PhD Thesis, University of Birmingham, Birmingham.
Pongpiachan, S., Bualert, S., Sompongchaiyakul, P. and Kositanont, C. (2009). Factors Affecting Sensitivity and Stability of Polycyclic Aromatic Hydrocarbons. Anal.
Lett. 42: 2106–2130. Pongpiachan, S., Hirunyatrakul, P., Kittikoon, I. and
Khumsup, C. (2011) Parameters Influencing on Sensitivities of Polycyclic Aromatic Hydrocarbons Measured by Shimadzu GCMS-QP2010 Ultra. Gas Chromatography/Book 3 (ISBN 978-953-51-0298-4), Intech Open Access Publisher. doi: 10.5772/32234.
Pongpiachan, S. (2013a). Vertical Distribution and Potential Risk of Particulate Polycyclic Aromatic Hydrocarbons in High Buildings of Bangkok, Thailand. Asian Pac. J.
Cancer Prev.14: 1865–1877. Pongpiachan, S. (2013b). Diurnal Variation, Vertical
Distribution and Source Apportionment of Carcinogenic Polycyclic Aromatic Hydrocarbons (PAHs) in Chiang-Mai, Thailand. Asian Pac. J. Cancer Prev. 14: 1851–1863.
Pongpiachan, S., Choochuay, C., Hattayanone, M. and Kositanont, C. (2013a). Temporal and Spatial Distribution

ARTICLE IN PRESS
Pongpiachan, Aerosol and Air Quality Research, x: 1–13, xxxx 12
of Particulate Carcinogens and Mutagens in Bangkok, Thailand. Asian Pac. J. Cancer Prev. 14: 1879–1887.
Pongpiachan, S., Tipmanee, D., Deelaman, W., Muprasit, J., Feldens, P. and Schwarzer, K. (2013b). Risk Assessment of the Presence of Polycyclic Aromatic Hydrocarbons (PAHs) in Coastal Areas of Thailand Affected by the 2004 Tsunami. Mar. Pollut. Bull. 76: 370–378.
Poor, N., Tremblay, R., Kay, H., Bhethanabotla, V., Swartz, E., Luther, M. and Campbell, S. (2004). Atmospheric Concentrations and Dry Deposition Rates of Polycyclic Aromatic Hydrocarbons (PAHs) for Tampa Bay, Florida, USA. Atmos. Environ. 38: 6005–6015.
Ravindra, K., Bencs, L., Wauters, E., Hoog, J.D., Deutsch, F., Roekens, E., Bleux, N., Berghmans, P. and Grieken, R.V. (2006). Seasonal and Site-specific Variation in Vapour and Aerosol Phase PAHs over Flanders (Belgium) and Their Relation with Anthropogenic Activities. Atmos. Environ. 40: 771–785.
Riva, G., Pedretti, E.F., Toscano, G., Duca, D. and Pizzi, A. (2011). Determination of Polycyclic Aromatic Hydrocarbons in Domestic Pellet Stove Emissions. Biomass Bioenergy 35: 4261–4267.
Sanchis, E., Ferrer, M., Calvet, S., Coscollà, C., Yusà, V. and Cambra-López, M. (2014) Gaseous and Particulate Emission Profiles during Controlled Rice Straw Burning. Atmos. Environ. 98: 25–31.
Schnelle-Kreis, J., Sklorz, M., Peters, A., Cyrys, J. and Zimmermann, R. (2005). Analysis of Particle-associated Semi-volatile Aromatic and Aliphatic Hydrocarbons in Urban Particulate Matter on a Daily Basis. Atmos.
Environ. 39: 7702–7714. Schwandner, F.M., Seward, T.M., Giże, A.P., Hall, K. and
Dietrich, V.J. (2013). Halocarbons and Other Trace Heteroatomic Organic Compounds in Volcanic Gases from Vulcano (Aeolian Islands, Italy). Geochim.
Cosmochim. Acta 101: 191–221. SFT (1999). Guidelines on Risk Assessment of Contaminated
Sites. SFT Report 99.06. Norwegian Pollution Control Authority.
Shi, G.T., Chen, Z.L., Bi, C.J., Wang, L., Teng, J.Y. and Li, Y.S. (2011). A Comparative Study of Health Risk of Potentially Toxic Metals in Urban and Suburban Road Dust in the Most Populated City of China. Atmos. Environ. 45: 764–771.
Shi, Y., Sasai, T. and Yamaguchi, Y. (2014). Spatio-temporal Evaluation of Carbon Emissions from Biomass Burning in Southeast Asia during the Period 2001–2010. Ecol. Modell. 272: 98–115.
Slezakova, K., Castro, D., Begonha, A., Delerue-Matos, C., Alvim-Ferraz, M.C., Morais, S. and Pereira, M.C. (2011). Air Pollution from Traffic Emissions in Oporto, Portugal: Health and Environmental Implications. Microchem. J. 99: 51–59.
Slezakova, K., Castro, D., Delerue-Matos, C., Alvim-Ferraz, M.C., Morais, S. and Pereira, M.C. (2013). Impact of Vehicular Traffic Emissions on Particulate-bound PAHs: Levels and Associated Health Risks. Atmos. Res.
127: 141–147. Tan, J.H., Bi, X.H., Duan, J.C., Rahn, K.A., Sheng, G.Y.,
Fu, J.M. (2006). Seasonal Variation of Particulate Polycyclic Aromatic Hydrocarbons Associated with PM10 in Guangzhou, China. Atmos. Res. 80: 250–262.
Tsai, P.J., Shieh, H.Y., Lee, W.J. and Lai, S.O. (2002). Characterization of PAHs in the Atmosphere of Carbon Black Manufacturing Workplaces. J. Hazard. Mater. 91: 25–42.
U.S. EPA (1991). Risk Assessment Guidance for Superfund, Volume 1, Human Health Evaluation Manual (Part B, Development of Risk-Based Preliminary Remediation Goals). OSWER; 1991 [9285.7-01B. EPA/540/R-92/003].
U.S. EPA (1993). Provisional Guidance for quantitative Risk Assessment of Polycyclic Aromatic Hydrocarbons. NC EPA-600/R-93/089.Research Triangle Park: US Environmental Protection Agency.
U.S. EPA (1997). Exposure Factors Handbook. U.S. Environmental Protection Agency, Office of Research and Development, Washington, DC. EPA/600/P-95/002Fa, b, c.
U.S. EPA (1998). EPA Quality Assurance Document: Method Compendium, PM2.5 Mass Weighing Laboratory Standard Operating Procedures for the Performance Evaluation Program, United States Environmental Protection Agency Office of Air Quality Planning and Standards, October 1998.
U.S. EPA (2001). Supplemental Guidance for Developing Soil Screening Levels for Superfund Sites. OSWER; 2001 [9355.4-24].
U.S. EPA (2002). EPA Quality Assurance Guidance Document: Method Compendium, Field Standard Operating Procedures for the PM2.5 Performance Evaluation Program, United States Environmental Protection Agency Office of Air Quality Planning and Standards, Revision No. 2, March 2002.
Vasilakos, C.H., Levi, N., Maggos, T.H., Hatzianestis, J., Michopoulos, J. and Helmis, C. (2007). Gas–particle Concentration and Characterization of Sources of PAHs in the Atmosphere of a Suburban Area in Athens, Greece. J. Hazard. Mater. 140: 45–51.
Wang, G., Wang, H., Yu, Y., Gao, S., Feng, J., Gao, S. and Wang, L. (2003). Chemical Characterization of Water-soluble Components of PM10 and PM2.5 Atmospheric Aerosols in Five Locations of Nanjing, China. Atmos.
Environ. 37: 2893–2902. Wang, G., Huang, L., Zhao, X., Niu, H. and Dai, Z. (2006).
Aliphatic and Polycyclic Aromatic Hydrocarbons of Atmospheric Aerosols in Five Locations of Nanjing Urban Area, China. Atmos. Res. 81: 54–66.
Wang, W., Huang, M.J., Kang, Y., Wang, H.S., Leung, A.O.W., Cheung, K.C. and Wong, M.H. (2011). Polycyclic Aromatic Hydrocarbons (PAHs) in Urban Surface Dust of Guangzhou, China: Status, Sources and Human Health Risk Assessment. Sci. Total Environ. 409: 4519–4527.
Wang, W., Huang, M.J., Chan, C.Y., Cheung, K.C. and Wong, M.H. (2013). Risk Assessment of Non-Dietary Exposure to Polycyclic Aromatic Hydrocarbons (PAHs) via House PM2.5, TSP and Dust and the Implications from Human Hair. Atmos. Environ. 73:204–213.
Wei, S., Huang, B., Liu, M., Bi, X., Ren, Z., Sheng, G. and

ARTICLE IN PRESS
Pongpiachan, Aerosol and Air Quality Research, x: 1–13, xxxx 13
Fu, J. (2012). Characterization of PM2.5-bound Nitrated and Oxygenated PAHs in Two Industrial Sites of South China. Atmos. Res. 109–110: 76–83.
Wickramasinghe, P.A., Karunaratne, P.G.G.D. and Sivakanesan, R. (2012). PM10-Bound Polycyclic Aromatic Hydrocarbons: Biological Indicators, Lung Cancer Risk of Realistic Receptors and ‘Source-Exposure-Effect Relationship’ Under Different Source Scenarios. Chemosphere 87: 1381–1387.
Wilford, B., Shoeib, M., Harner, T., Zhu, J. and Jones, K. (2005). Polybrominated Diphenyl Ethers in Indoor Dust in Ottawa, Canada: Implications for Sources and Exposure. Environ. Sci. Technol. 39: 7027–7035.
Wingfors, H., Sjödin, Å., Haglund, P. and Brorström-Lundén, E. (2001). Characterisation and Determination of Profiles of Polycyclic Aromatic Hydrocarbons in a Traffic Tunnel in Gothenburg, Sweden. Atmos. Environ. 35: 6361–6369.
Yang, H.H., Tsai, C.H., Chao, M.R., Su, Y.L. and Chien, S.M. (2006). Source Identification and Size Distribution of Atmospheric Polycyclic Aromatic Hydrocarbons during Rice Straw Burning Period. Atmos. Environ. 40: 1266–1274.
Yang, X., Okada, Y., Tang, N., Matsunaga, S., Tamura, K., Lin, J., Kameda, T., Toriba, A. and Hayakawa, K. (2007). Long-Range Transport of Polycyclic Aromatic Hydrocarbons from China to Japan. Atmos. Environ. 41: 2710–2718.
Yassaa, N., Meklati, B.Y. and Cecinato, A. (2001a). Chemical Characteristics of Organic Aerosols in Algiers City Area: Influence of a Fat Manufacture Plant. Atmos.
Environ. 35: 6003–6013. Yassaa, N., Meklati, B.Y., Cecinato, A. and Marino, F.
(2001b). Chemical Characteristics of Organic Aerosol in Bab-Ezzouar (Algiers). Contribution of Bituminous Product Manufacture. Chemosphere 45: 315–322.
Yu, Y., Guo, H., Liu, Y., Huang, K., Wang, Z. and Zhan, X. (2008). Mixed Uncertainty Analysis of Polycyclic Aromatic Hydrocarbon Inhalation and Risk Assessment in Ambient Air Of Beijing. J. Environ. Sci. 20: 505–512.
Received for review, January 7, 2015
Revised, March 20, 2015
Accepted, August 2, 2015
Copyright © 2022 FDOKUMEN