AMS 14C chronology and ceramic sequences of early farmers in the eastern Adriatic
Upload
independentCategory
view
0download
0
1
Application of 14
C analyses to source apportionment of carbonaceous PM2.5
in the UK
Mathew R. Heal1 *, Philip Naysmith2, Gordon T. Cook2, Sheng Xu2,
Teresa Raventós Duran3 †, Roy M. Harrison3
1 School of Chemistry, University of Edinburgh, West Mains Road, Edinburgh, EH9 3JJ, UK
2 Scottish Universities Environmental Research Centre, Scottish Enterprise Technology Park,
East Kilbride, G75 0QF UK 3 Division of Environmental Health & Risk Management, School of Geography, Earth &
Environmental Sciences, University of Birmingham, Edgbaston, Birmingham, B15 2TT, UK
† Present address: Laboratoire Interuniversitaire des Systèmes Atmosphériques UMR 7583,
Faculté des Sciences, Université Paris Est, 61 Avenue du Général Charles de Gaulle, 94010
Créteil Cedex, France
* Corresponding author:
Dr. M.R. Heal School of Chemistry, University of Edinburgh, West Mains Road Edinburgh, EH9 3JJ, United Kingdom Tel: 0131 6504764 [email protected]
Keywords:
PM2.5, particulate mater, carbon-14, BVOC, SOA, source apportionment.
Post-print of peer-reviewed article published by Elsevier.
Published article available at: http://dx.doi.org/10.1016/j.atmosenv.2011.02.029
Cite as:
Heal, M.R., Naysmith, P., Cook, G.T., Xu, S., Raventos Duran, T., Harrison, R.M.
(2011) Application of 14
C analyses to source apportionment of carbonaceous PM2.5 in
the UK, Atmospheric Environment 45, 2341-2348.
2
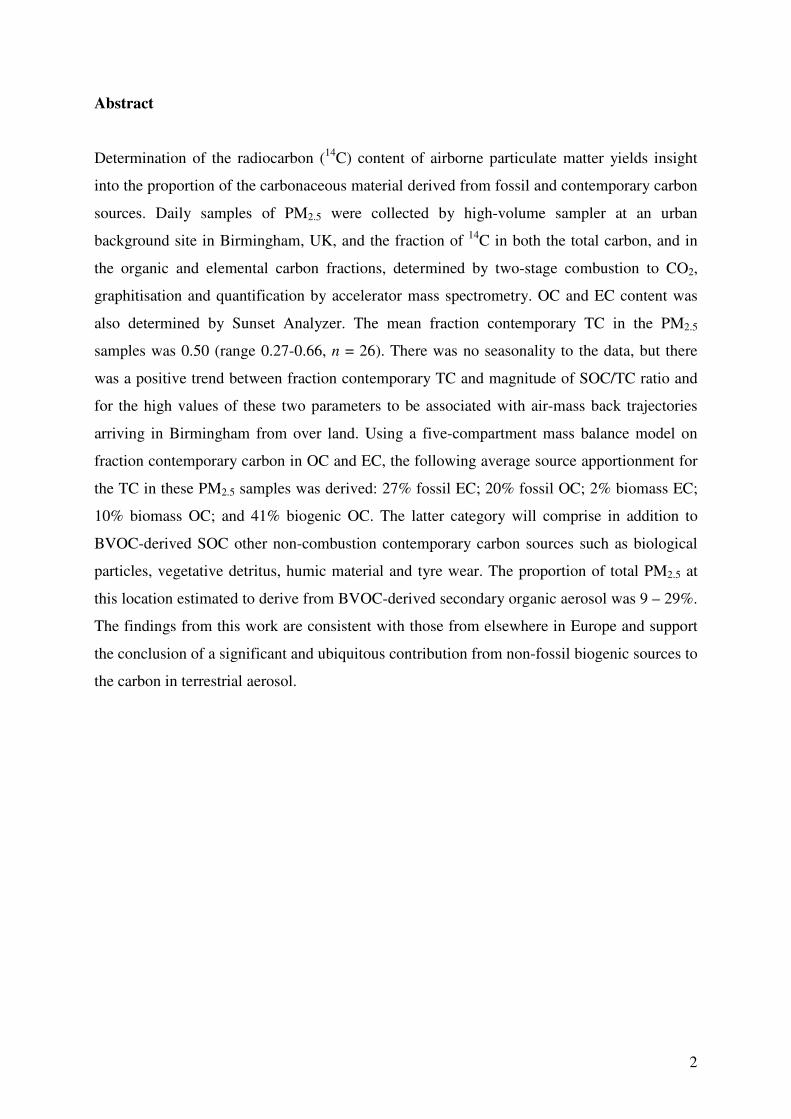
Abstract
Determination of the radiocarbon (14C) content of airborne particulate matter yields insight
into the proportion of the carbonaceous material derived from fossil and contemporary carbon
sources. Daily samples of PM2.5 were collected by high-volume sampler at an urban
background site in Birmingham, UK, and the fraction of 14C in both the total carbon, and in
the organic and elemental carbon fractions, determined by two-stage combustion to CO2,
graphitisation and quantification by accelerator mass spectrometry. OC and EC content was
also determined by Sunset Analyzer. The mean fraction contemporary TC in the PM2.5
samples was 0.50 (range 0.27-0.66, n = 26). There was no seasonality to the data, but there
was a positive trend between fraction contemporary TC and magnitude of SOC/TC ratio and
for the high values of these two parameters to be associated with air-mass back trajectories
arriving in Birmingham from over land. Using a five-compartment mass balance model on
fraction contemporary carbon in OC and EC, the following average source apportionment for
the TC in these PM2.5 samples was derived: 27% fossil EC; 20% fossil OC; 2% biomass EC;
10% biomass OC; and 41% biogenic OC. The latter category will comprise in addition to
BVOC-derived SOC other non-combustion contemporary carbon sources such as biological
particles, vegetative detritus, humic material and tyre wear. The proportion of total PM2.5 at
this location estimated to derive from BVOC-derived secondary organic aerosol was 9 – 29%.
The findings from this work are consistent with those from elsewhere in Europe and support
the conclusion of a significant and ubiquitous contribution from non-fossil biogenic sources to
the carbon in terrestrial aerosol.

3
Introduction
Organic carbon (OC) and elemental carbon (EC) together constitute a substantial fraction of
airborne particulate matter, at least one-third on average in background fine particulate matter,
PM2.5, in the UK and elsewhere (AQEG, 2005; Harrison et al., 2003; Harrison and Yin, 2008;
Putaud et al., 2004; Sillanpaa et al., 2006; Yin et al., 2010). This carbonaceous material is
hard to characterise, not only because it comprises a vast array of individual chemical
components and condensed material that are hard to separate and identify, but because even
its apportionment into fractions labelled EC and OC is methodologically dependent (Chow et
al., 2004a).
An important issue in both scientific and policy terms is the relative contributions of
anthropogenic and biogenic sources to this carbonaceous component, in particular to the
secondary organic aerosol (SOA) component for which there is currently least understanding.
Natural and/or biogenic sources will not be readily amenable to control through deliberate
policy action. Numerical modelling studies suggest that >80% of SOA in the UK atmosphere
derives from biogenic precursors (Derwent and Malcolm, 2000; Whyatt et al., 2007) but this
prediction has not been tested through any kind of atmospheric measurements. On the other
hand, the modelling study of Johnson et al. (2006b; 2006a) found contributions of biogenic
precursors to SOA to vary over the range 16–85% for a series of case studies in the TORCH
2003 campaign in the southern UK, with important contributions from both anthropogenic
and biogenic precursors simulated for the majority of conditions.
The radioisotope of carbon (14C) is an ideal tracer for distinguishing between fossil and
contemporary carbon since the latter contains 14C at a relatively known concentration (in
excess of 226 Bq kg-1 of carbon) whereas the former, on account of its age far exceeding the
half-life of 14C, contains none. Thus, in principle, determination of the ratio of 14C abundance
in a sample of PM to its contemporary abundance directly yields the proportions of
contemporary and fossil carbon in that sample. A challenge is the very high level of accuracy
and precision to which the very low abundances of 14C need to be determined. This requires
the use of accelerator mass spectrometry (AMS) which is now being applied in this context to
samples of atmospheric PM (Bench et al., 2007; Endo et al., 2004; Gelencser et al., 2007;
Hodzic et al., 2010; Lewis et al., 2004; Schichtel et al., 2008; Szidat et al., 2004a; Szidat et
al., 2006; Szidat et al., 2009). The vast majority of these AMS measurements have been

4
applied to the total carbon (TC) content only. In this work, the first of its kind in the UK, the
contemporary/fossil split has been determined in the TC, and OC and EC, components of
samples of PM2.5 collected at an urban background location in Birmingham. Such data has
previously been determined only for two locations: Zürich (Szidat et al., 2006) and Göteborg
(Szidat et al., 2009). A subsequent mass balance approach permits a top-down apportionment
of the broad categories of origin of the PM2.5 carbon.
Methods
Sample collection
Seventy-five samples were collected during two periods, 11 Jun – 1 Sep 2007 and 21 Jan – 9
May 2008, at an urban background site at the University of Birmingham (52° 27′ N, 1° 56′
W). Birmingham is the second largest city in the UK (population 1.0 million) and lies within
the West Midlands conurbation of 2.2 million. The University campus has a suburban setting
in the south east of the city (Figure S1, supplementary information). 24-hour samples of PM2.5
were collected by high-volume sampler (Tisch Environmental TE-6001 fitted with TE-230-
QZ impactor), at flow rates of 1.137 m3 per minute, onto 20.3 × 25.4 cm quartz microfiber
filters (Whatman QM-A sheets) pre-heated at 550 °C for 12 hours. Following exposure, filters
were folded in half, exposed side inwards, and stored wrapped in Al foil at −20 °C.
OC and EC analysis
Punches from each filter (1.5 cm2) were analysed for OC and EC content by Sunset Analyzer
(Tigard, USA) using the temperature protocol detailed in supplementary information Table
S1.
Determination of 14
C content
One-quarter portions of the filters from a sub-set of 26 of the PM2.5 samples (2, 3 & 8 from
Jun, Jul and Aug 07, respectively, and 1, 3, 4, 3 & 2 from months Jan to May 08, respectively)
were analysed for their ‘fraction modern carbon’ (fM). This is an international convention that
expresses sample 14C activity relative to the activity of wood growing in the northern
hemisphere in 1890, prior to the significant changes in atmospheric concentrations of 14C that
occurred in the 20th century from the worldwide increase in fossil-fuel burning and nuclear

5
weapons detonation. Fraction modern values can be converted into more useful fraction
contemporary carbon, fc, using knowledge of recent variations in atmospheric 14C abundance
and assumptions regarding the age of material contributing to the 14C in the sample. This is
discussed in more detail later. It is assumed that inorganic carbonates make negligible
contribution to carbon in UK PM2.5 compared with OC and EC (AQEG, 2005).
Samples were prepared for AMS analysis using two combustion steps (Figure 1), similar to
the methodology developed by Szidat and co-workers (Szidat et al., 2004a; 2004b; 2004c). In
the first step the filter was heated in a sealed quartz chamber with pure O2 for 20 min at 340
°C. The evolved CO2 was collected and purified offline, first by combustion at 850 °C in the
presence of CuO and Ag, then by passage through an ethanol/solid CO2 cold trap (−80 °C) to
remove water vapour followed by a liquid nitrogen trap (−196 °C) in tandem with cryogenic
pumping to remove any non-condensing contaminants. The purified CO2 was quantified
manometrically. The CO2 was then reduced to graphitic C and pressed into aluminium holders
(AMS target) for AMS measurement. For samples of CO2 >3 mL the method of Slota et al.
(1987) was employed for graphitisation and δ13C values were measured off-line on a sub-
sample of CO2 using a VG SIRA 10 isotope ratio mass spectrometer. For samples smaller
than 3 mL the method of Xu et al. (2007) was employed for graphitisation and δ13C values
were measured on-line on the AMS. The fM value from this first step is taken to represent the
overall OC activity as demonstrated by Szidat et al. (2004c). In the second step, the filter was
combusted in O2 for 4 h at 850 °C and the evolved CO2 subject to the same cryogenic
purification and graphitisation procedures for generation of the AMS target. The fM value
from this step is the contribution of any remaining OC activity and the EC activity.
The fM value in each graphitic target, relative to the international Oxalic Acid II (OXII)
standard (SRM-4990C), was determined using either the SUERC National Electrostatics
Corporation tandem-accelerator mass spectrometer which is based on a 5 MV Pelletron or the
single-stage accelerator mass spectrometer. The instruments differ in their ion optics
(including source geometries), ion energies and molecular interference removal, but produce
similar data (Freeman et al., 2010) and long-term QA documentation indicates no significant
difference in 14C results from the two instruments (Naysmith et al., 2010). Each batch of
samples (typically around 130) run on the AMS is split into sub-groups of 10 targets.
Samples are measured to completion in groups of 10 in only a few hours, with OXII primary
standards spanning groups for inter-group consistency. Each group of 10 samples contains

6
one OXII primary standard, one wood secondary standard of just less than one half-life in age,
either a modern secondary standard material or a background standard (i.e. a zero 14C activity
sample derived from either calcite mineral or interglacial wood with an age in excess of
100,000 years) and 7 unknowns. Each sample is automatically repeatedly measured in intra-
group rotation until the sample total counting statistics and the scatter of the repeat 14C/13C
measurements exceeds a quality threshold of typically 3‰, disregarding early inconsistent
measurements as necessary. Any time trends remaining in the completed data sets can be
compensated for in subsequent data reduction and normalization.
Blank quartz filters (both direct from the packet and passed through the PM2.5 sampler)
processed in the same manner contained insignificant amounts of carbon compared with
sample filters so no filter blank adjustment was required.
The value of fM for total carbon was derived by mass and activity balance (Equation 1), where
the F quantities are the mass fractions of TC evolved at each combustion step.
C)(850C)(850 C)(340C)(340TC)( 00
M
00
MM FfFff ×+×= Eqn. 1
In this study, two independent quantifications of the TC content of each PM2.5 sample are
available, from the CO2 evolved during preparation for AMS analysis and from the Sunset
Analyzer. The scatter plot shown in Figure 2 demonstrates excellent quantitative agreement
between the two sets of measurements (R2 = 0.94, gradient 1.0, non-significant intercept) and
provides additional assurance in the cumulative combustion approach used for the
determination of 14C in TC.
A value for fM(EC) was determined by the mass and activity balance in Equation 2, where
FSunset(OC) and FSunset(EC) are the mass fractions of TC defined as OC and EC, respectively,
according to the Sunset Analyzer determinations.
(EC)
)OC()C340()TC(EC)(
Sunset
Sunset
0
MMM
F
Ffff
×−= Eqn. 2
Analysis of standard reference material
Results from analysis of NIST urban dust standard reference material SRM-1649a by the
same procedures are given in Table 1. This is the only PM material for which there are
published 14C data against which to compare. The fM(TC) values of 0.515 and 0.570 obtained

7
here (via single and double combustion, respectively) are within the range 0.505–0.61
provided by NIST (Currie et al., 2002; NIST, 2007), as is the value 0.522 presented by Szidat
et al. (2004c).
The assignment of the split between OC and EC for particulate matter carbon remains a
methodologically-defined quantity (Chow et al., 2004a). The extent to which this is so is
illustrated by the greater than 6-fold range in EC/TC mass ratios (0.075 to 0.52) from 19
different methods or research groups which have been collated for SRM-1649a (Currie et al.,
2002; NIST, 2007). Consequently it must be accepted that the two-staged combustion
separation of OC and EC used in this work (Figure 1) represents one approach only to
defining an OC-EC divide. The approach adopted here was guided by the work of Szidat et al.
(2004c) who reported that whilst the OC/TC mass ratio increased as the first combustion
temperature (or time) was increased the fM(OC) value remained unchanged. Presumably as a
consequence of the inherent methodological differences, NIST do not provide a value for
fM(OC) in SRM-1649a, so the only available comparison for the value of 0.66 ± 0.02 obtained
in this work is with the value 0.70 ± 0.05 reported by Szidat et al. (2004c) (Table 1). Although
the two research teams have used similar methods, the extremely good agreement between the
two values nevertheless provides considerable confidence in the consistency of
measurements. NIST do provide values for fM(EC) in SRM-1649a (Table 1) although the
mean values for groupings of similar measurement methods span the range 0.065 to 0.153. In
this work, combining the 14C determinations from the two combustion stages with data on
OC-EC split from the Sunset Analyzer yields a value of fM(EC) = 0.15. This is within the
range provided by NIST, somewhat higher than the value of 0.066 reported by Szidat et al.
(2004c), but uncertainty estimates are large.
Results and discussion
Secondary organic carbon
The PM2.5 TC concentrations varied between 1.2 and 26.2 µg m-3 (n = 75) and exhibited no
seasonality. Apportionment of the OC content of each sample into primary organic carbon
(POC) and secondary organic carbon (SOC) was undertaken using the assumption that the
minimum OC/EC ratio observed across all sample data indicates the (OC/EC)primary value
applicable to that sampling location, as demonstrated in Figure 3 (Castro et al., 1999;

8
Harrison and Yin, 2008). The individual sample SOC/TC ratios varied between 0 and 0.68,
and likewise exhibited no temporal pattern (Figure S2, supplementary information).
Four-day air-mass back trajectories corresponding to arrival at the sampling location at the
mid-time of each sample collection were calculated using the trajectory facility at the British
Atmospheric Data Centre (www.badc.ac.uk). Sampling days were divided into groups
according to the four geographical sectors from which the air mass had originated, with days
on which air-mass origin was in the westerly sector (SW to NW) being further sub-divided
into ‘Atlantic fast’ and ‘Atlantic slow’ to separate long-range westerlies from trajectories of
slower, circulating air in the near-Atlantic vicinity of the British Isles. Illustrative trajectories
for each group are shown in Figure S3, supplementary information. Both TC concentration
and SOC/TC ratio differed significantly with air-mass trajectory grouping (Figure 4), with
both metrics being higher on average for the easterly and southerly trajectories travelling
extensively over land. TC concentration and SOC/TC ratio were also greater for northerly
trajectories passing over the UK than for Atlantic westerlies.
14C data
fM values were converted to fraction contemporary carbon (fc) by dividing by 1.08. The ratio
of 14C activity relative to ‘modern’ in organic material photosynthesised around the time of
sample collection is about 1.05 (Levin et al., 2008), which will apply to PM carbon derived
from biogenic VOC emissions or from biofuel blends derived from recent-grown crops. The
ratio is about 1.15 for tree wood ~30-50 years old (Szidat et al., 2009) since past atmospheric
14CO2 levels were much higher (maximum atmospheric 14CO2 value occurred in 1963). The
value 1.08 was chosen as between these two, but weighted based on the expectation from
previous similar studies (Szidat et al., 2006; Szidat et al., 2009) that the majority of the non-
fossil carbon in these samples is derived from truly contemporary sources rather than from 50
y old biomass. The sensitivity of the results to this choice is discussed later.
The values for fraction contemporary total carbon, fc(TC), in the PM2.5 samples analysed
ranged from 0.27 to 0.66 (n = 26) with mean 0.50 (median 0.51). Again there was no
seasonality to the data. However, fc(TC) was positively associated with the SOC/TC ratio, and
consequently also (as described above) with air-mass origin (Figure 5); larger values of fc(TC)
were associated with samples collected on days with slower air masses from the east and
south continental regions. These observations are consistent with the hypothesis that
9
secondary organic aerosol generation relies on substantive contribution from terrestrial
contemporary carbon sources, e.g. BVOC emissions.
The mean non-fossil fraction TC of ~50% for these urban background PM2.5 samples from
Birmingham are entirely in line with the few comparative studies elsewhere in Europe: fc(TC)
~50−60% for urban background PM10 in Zürich (Szidat et al., 2004b; 2006), and mean fc(TC)
~50% for urban background PM10 and PM2.5 in Göteborg (Szidat et al., 2009). For samples of
PM2.5 collected at five remote and rural sites in the European CARBOSOL project, fc(TC)
values were higher, in the range ~57-82% (Gelencser et al., 2007), presumably reflecting
greater contribution of biogenic carbon at these non-urban locations. In the US, Schichtel et
al. (2008) similarly report fc(TC) values of ~50% for PM2.5 collected at urban sites within the
IMPROVE network, rising to 70-97% at non-urban locations. Altogether, these studies
confirm a ubiquitous presence of contemporary carbon in PM.
For all samples fM(EC) < fM(OC), indicating greater fossil-fuel contribution to the more
recalcitrant, soot-like carbonaceous material. Mean fM(OC) was 0.76 (n = 26), with range
0.57−0.99 (not including one low outlier). These are consistent with the few other published
data: fM(OC) values in the range 0.55−0.95 (n ≈ 8) for PM10 in Zürich (Szidat et al., 2006),
and in the range 0.59−0.78 (n = 7) for PM10 and PM2.5 in Göteborg (Szidat et al., 2009). A
general observation from these studies is for fM(OC) to be fairly constant (i.e. generally in
excess of ~0.6) over wide variations in OC concentration and OC/TC or SOC/TC ratios.
Mean fM(EC) was 0.11, or 0.087 if excluding one sample with a high value of 0.64. As
discussed later fM(EC) values are subject to particular uncertainty and where negative fM(EC)
values were derived these were set to zero. Values were generally lower than the mean fM(EC)
of 0.31, 0.14 and 0.07 for winter, spring and summer PM10, respectively, in Zürich (Szidat et
al., 2006) and of 0.12 for PM10 and PM2.5 in Göteborg (Szidat et al., 2009), indicating low
contributions of contemporary carbon to EC at the Birmingham location.
Source attribution
Contributions of five broad categories of carbon sources to individual samples were attributed
as illustrated in the following example application to data for the sample from 22nd February
2008. The EC and OC concentrations for this sample were 0.59 and 1.47 µg m-3, respectively,
and it was assigned to the ‘Atlantic fast’ grouping of air mass origin. Fraction contemporary

10
carbon values were fc(TC) = 0.543, fc(OC) = 0.733 and fc(EC) = 0.064. The contemporary-
fossil split for the EC component can be assigned directly from the 14C data as follows:
ECbiomass = 0.064 × 0.59 = 0.038 µg m-3
and
ECfossil = 0.55 µg m-3
Here, the designation ‘biomass’ in the subscript encompasses EC emanating from deliberate
combustion of solid and liquid biofuels as well as from natural wildfires. If it is assumed the
latter source generally makes negligible contribution to UK EC, then the ECbiomass component
derives from primary anthropogenic sources.
The OC component can be sub-divided into three broad categories,
OCtotal = OCfossil + OCbiomass + OCbiogenic
where OCfossil is most likely POC from fossil-fuel combustion but could include SOC formed
from emissions of fossil-derived VOC, OCbiomass designates POC from combustion of
biofuels/biomass, and OCbiogenic designates SOC formed from biogenic VOC oxidation (and
other unaccounted for contemporary carbon – see later discussion). The OCfossil contribution is
calculated directly from the 14C data:
OCfossil = (1 - 0.733) × 1.47 = 0.39 µg m-3
The concentration of OCbiomass can be estimated using an assumed (OC/EC)biomass primary
emission ratio. Using a value of 5 here (Chow et al., 2004b) gives
OCbiomass = 0.038 × 5 = 0.19 µg m-3
The OCbiogenic concentration is then derived by mass balance of contemporary OC:
OCbiogenic = (0.733 × 1.47) - 0.19 = 0.89 µg m-3
The attribution is illustrated in the pie-chart of Figure 6a. A contrasting example
apportionment for 31st Jan 2008, for which EC = 0.75 µg m-3, OC = 0.74 µg m-3, fc (TC) =
0.380, fc(OC) = 0.684 and fc(EC) = 0.082 is shown in Figure 6b.
The mean % apportionment of TC across all 26 samples into the five categorisations
described above is, to nearest integer value: 2% biomass EC; 27% fossil EC; 20% fossil OC;
10% biomass OC; 41% biogenic OC (Figure S4, supplementary information). This mean
relative apportionment for the Birmingham samples is compared in Figure 7 with that for
Zürich (Szidat et al., 2006) and Göteburg (Szidat et al., 2009), derived using similar methods.

11
The apportionments are broadly similar, although the two mainland European cities are
strongly influenced by wood burning in winter, not present in the summer samples, nor in the
Birmingham data which do not show seasonality. Little seasonality in wood-smoke
contribution to PM2.5 at this site was also reported by Yin et al. (2010). The Birmingham
samples have highest EC/TC ratios on average (0.30), as anticipated for the larger and more-
heavily trafficked city, and again consistent with other measurements at this site (Yin et al.,
2010).
The above source attributions must be interpreted in the context of a number of caveats and
uncertainties. As described in the methods section, the apportionment of TC into OC and EC
fractions is highly method dependent as evidenced by a >4-fold variation in EC/TC ratios and
EC 14C abundances presented for the airborne PM SRM-1649a (Currie et al., 2002). To
proceed with any apportionment of OC and EC fractions requires some decision to be made
on the OC-EC division which means that all such studies such derive fM values that are linked
to their method. In this work the Sunset Analyzer protocol (Table S1) was used to assign OC-
EC split, with mass activity Equation 2 used to derive fM(EC), coupled with the information
from Szidat et al. (2004c) that fM(OC) remain unchanged with first combustion temperature
(or time). Following a method similar to that pioneered by Szidat and co-workers ensures a
basis for comparability between the studies shown in Fig. 7. In the majority of cases the
fraction OC-EC assignments via Sunset or AMS preparative protocols were similar. While
this appeared to work well for SRM-1649a the calculation yielded negative values for some
EC which is not possible. The fM(EC) is subject to large uncertainty because it is a small value
difference between two much larger values. However, because fM(EC) is generally
considerably lower than fM(OC) its higher uncertainty actually has reduced practical
consequence; i.e. since average proportion TC assigned as ECbiomass through use of fM(EC) is
only 2%, even fairly large uncertainty does not alter the overall picture that ECbiomass is a very
minor component of TC.
The instrumental uncertainty in the AMS-derived values of fM is small but uncertainty is
introduced in the correction to fc values. A conversion factor of 1.08 was used here, for the
reasons given above. The relatively large ‘biogenic’ source from the source-apportionment
modelling justifies the choice of a factor close to the value 1.05 for wholly contemporary
carbon. It is not possible to know the exact correction value since this depends on the mix of
non-fossil carbon sources to the PM2.5 which is not known and will vary from sample to

12
sample. Varying the conversion factor between 1.08 and its possible range of 1.05 to 1.15 (the
extremes that all non-fossil carbon is entirely contemporary or entirely mature tree-wood,
respectively) corresponds to uncertainty factors in the point estimate of proportion
contemporary ranging from 0.94 to 1.03, i.e. to uncertainty ranges of 1.9-2.1% for the 2%
average ECbiomass portion, and of 26.9-27.1% forthe 27% average ECfossil portion, entirely
negligible compared with other uncertainties. Similarly, applying the same uncertainty in fM
to the 20% average OCfossil assignment yields an uncertainty range of 18.5-23.1%.
The assignment to OCbiomass is defined to be a fixed multiple of the derived ECbiomass value.
Whilst a single value for an (OC/EC)biomass primary ratio must be chosen for this analysis, it is
clearly highly unlikely that a single value for this ratio is applicable for all conditions. Chow
et al. (2004b) report a range 2.5–10 for this ratio. Use of other values for this ratio in the
above analysis would alter the assigned split between what is classified as OCbiomass and
OCbiogenic although the sum of the two contributions would be unchanged. Since ECbiomass (and
hence OCbiomass) are minor contributions to TC, the uncertainty in this ratio, whilst certainly
important, does not fundamentally alter the general pattern of source attribution. Combining
the worse cases from the uncertainties in ECbiomass due to uncertainty in fM and in
(OC/EC)biomass ratio, gives a lower uncertainty for OCbiomass of 1.9% × 2.5 = 4.8% and an
upper uncertainty of 2.1% × 10 = 21%. The OCbiogenic portion is calculated by difference so
again combining the worse cases of both uncertainties gives a lower uncertainty for OCbiogenic
of 71%−23.1%-21% = 26.9% and an upper uncertainty of 71%−18.5%−4.8% = 47.7%.
To summarise, the point estimate and uncertainty ranges for the mean apportionments into the
5 categories presented in Figs. S4 and 7 are ECbiomass 2% (1.9-2.1%), ECfossil 27% (26.9-
27.1%), OCfossil 20% (18.5-23.1%), OCbiomass 10% (4.8-21%) and OCbiogenic 41% (26.9-
47.7%). As with any similar work, these values are based on the methodological split of TC
into OC and EC used. The ranges represent the extreme ends of estimated uncertainty from
the two sources discussed, and will only come about if analyses of all 26 samples were
subject to identical bias. In practice, there will be some tendency for uncertainties to cancel
when averaging across 26 samples, so the extremes in these uncertainty ranges for mean
apportionments are much less likely than values closer to the central estimate. It should also
be noted that apportionments between individual samples vary and that it is not possible to
quantify any bias due to the 26 samples analysed not being representative of the long-term

13
average contributions of these sources to PM2.5 at this sampling location. This latter comment
applies to all studies involving relatively few samples.
If there is a ‘wildfire’ biomass burning contribution to ECbiomass then the current assignment to
ECbiomass could be further subdivided into ECbiomass(biofuel) and ECbiomass(wildfire). The
current OCbiomass assignment would also be subdivided into OCbiomass(biofuel) and
OCbiomass(wildfire). Whether the latter two sub-divisions would still sum to the magnitude of
the current OCbiomass assignment would depend on assumed OC/EC primary emission ratios
for the anthropogenic combustion of biomass/biofuel and wildfire burning of biomass. These
ratios are unlikely to be universally-applicable single values, as already discussed. However,
it is not anticipated that natural wildfire contributes significantly to UK PM carbon on
average.
It is not possible from the data to subdivide the assignment to OCfossil between primary and
secondary. The latter would encompass SOC derived from atmospheric oxidation of, for
example, fossil-derived toluene. Its presence would mean that the current assignment to
OCfossil would be divided into POCfossil and SOCfossil components: no other assignments would
be altered. However, ECfossil and POCfossil are likely to have a common local source,
particularly for an urban sampling location. Previous measurements in Birmingham have
inferred primary OC/EC ratios in the PM2.5 size fraction of 0.4 at a roadside location and 0.65
at a city centre background location (Harrison and Yin, 2008). The (OC/EC)primary ratio
inferred from this work at a more suburban background location in Birmingham is 1.1 (Figure
3), similar to the ratio 1.0 derived from other PM2.5 measurements at the same site (Yin et al.,
2010). These data show a gradient of increasing (OC/EC)primary on moving away from the
immediate roadside. It is therefore reasonable to anticipate that the POCfossil/ECfossil ratio at
this sampling location is also in the approximate range 0.7–1. Comparison of the magnitudes
of the ECfossil and OCfossil contributions in Figure 7 with this estimated POCfossil/ECfossil ratio
therefore suggests that the bulk of the contribution assigned to OCfossil is comprised of
POCfossil rather than SOCfossil at this site. However, the atmospheric processing of semi-
volatile emissions in moving away from roadside sources to background sites leads to a
blurring of distinction between POC and SOC anyway (Robinson et al., 2007).
The category designated OCbiogenic will include, in addition to BVOC-derived secondary
organic carbon, other sources of non-fossil OC not explicitly allocated to biomass/biofuel
14
combustion. These may include primary biological material such as viruses, spores, pollen
plant detritus and particle-bound carbohydrates, amino acids and endotoxin, as well as
particles derived from vehicle tyre wear (where tyres are composed of natural rubber) and
cigarette smoke. The category may also include some OC from food cooking although this
latter may form part of the category assigned as ‘biomass.’ The magnitudes of the
contributions of these sources to individual size fractions of PM OC remains highly uncertain,
and their determination requires identification and quantification of specific marker
components. Despite this, it is reasonable to anticipate that the portion of TC in these
Birmingham samples that is BVOC-derived SOC, although still likely a significant
component, is somewhat lower than the 41% on average shown in Figure 7. Using chemical
markers and a chemical mass balance model based on USEPA source profiles Yin et al.
(2010) estimated a few % contribution each from ‘vegetative detritus’ and ‘soil/dust’ humic
material to other samples of PM2.5 from the same location. Thus, even if OCbiogenic were in
reality split into, say, 29% OCBVOC-SOC and 12% OCother-contemporary (using rough estimates
provided also by Hodzic et al. (2010)), the BVOC-derived SOC still comprises 29/71 ≅ 40%,
on average, of all OC at this Birmingham location. This is comparable to the estimated 33%
contribution to OC, on average, ascribed by the chemical mass balance model to ‘other
organic matter’ – assumed to be secondary organic aerosol – in the Yin et al. (2010) study.
Biogenic SOC therefore appears to dominate anthropogenic SOC, in support of earlier model
studies for the UK (Whyatt et al., 2007). Szidat et al. (2006), using additional evidence from
14C analyses of water-soluble OC, also concluded that biogenic SOC considerably exceeded
anthropogenic SOC in Zürich.
Overall, therefore, this and other studies cited confirm the ubiquitous presence of background
SOC (Zhang et al., 2007) and the predominance of biogenic SOC over anthropogenic SOC,
particularly for air masses passing over land where, in addition to sources of BVOC
precursors, anthropogenic emissions of NOx facilitate its formation (Carlton et al., 2010).
A pertinent policy issue is to express the component assigned as BVOC-derived SOC as a
proportion of total PM2.5. To do so requires both the PM2.5 mass and an appropriate scaling
factor from mass of SOC to mass of secondary organic matter (SOM). The former was not
determined directly from the hi-vol filter samples collected in this study. However, a co-
located FDMS TEOM with PM2.5 inlet was operating during the first period of the sample
collection (Jun-Aug 2007). For the 13 dates during this period for which apportionment via

15
14C was made, the average ratio of BVOC-derived SOC to PM2.5 was 0.09. In their pragmatic
mass closure model, Harrison et al. (2003) assumed an OM/OC ratio of 1.4 for urban
background PM10 in Birmingham. However, recent literature suggests earlier values used for
OM/OC may be rather too low, particularly for the more heavily oxidised secondary organic
aerosol component, for which OM/OC ratios in the approximate range 1.5-2.4 have been
reported (e.g. Aiken et al., 2008; Chan et al., 2010; El Zanan et al., 2009; Polidori et al., 2008;
Simon et al., 2010). Taking the mid-point of this range (2.0) as the OM/OC ratio for this SOC
component yields a proportion ~18%, on average, of the total mass of PM2.5 at this location
comprising BVOC-derived secondary organic aerosol. Note this 18% proportion excludes the
estimated contribution to PM2.5 from other non-combustion sources of contemporary carbon
such as vegetative detritus, humic material, tyre particles. It is also derived from only half the
samples analysed, although other analyses presented here have not demonstrated systematic
difference in average apportionment with season of sampling. An alternative estimate for
proportion of PM2.5 that is BVOC-derived secondary organic aerosol can be obtained by
expressing the average concentration of BVOC-derived SOC from all 26 analysed samples
(1.0 µg m-3) relative to the long-term mean PM2.5 of 11.6 µg m-3 determined by Yin et al.
(2010) from the same site for the immediately preceding year. Applying, as before, a value
2.0 to scale OC to OM yields ~16% as the proportion of PM2.5 mass estimated to be
attributable, on average, to BVOC-derived secondary organic aerosol.
Whilst both these estimates are consistent it should be remembered that they are averages and
that proportions in individual daily samples will vary considerably around this average. In
addition, the values are clearly subject to the same source attribution assumptions that are
discussed at length in this paper. Varying the assumed OM/OC scaling between 1.5 and 2.4
gives an uncertainty range of 13–21 % for the contribution of BVOC-derived SOA to PM2.5.
Including uncertainty in the split of non-combustion contemporary carbon between BVOC-
derived SOC and other types (vegetative detritus, etc.) over the range from 50:50 to 100:0
(earlier calculations assumed 70:30 as an average point-estimate) increases the uncertainty
range for the contribution of BVOC-derived SOA in PM2.5 to 9–29 %. As with other estimates
of uncertainty ranges the true average is more likely to be towards the centre of this range
than the extremes.
Finally, it is worth noting again the problem of OC-EC distinction and its consequence that
attempting to assign a single value of fc to a single entity called OC (and likewise for EC) is

16
both uncertain and of limited interpretive use. If it is recognised that the ideal of a ‘clean’
binary physical separation into OC and EC is not possible, an alternative methodological
approach to gain insight into the contemporary carbon contributions to different components
within TC might be more fruitful. This could be achieved by solvent extraction of the PM
with staged combustion, to yield fc values of the components of TC categorised quasi 2-
dimensionally according to volatility and polarity.
Conclusions
This study has shown that a substantive proportion (~50% on average) of UK urban
background PM2.5 carbon is of contemporary origin. The largest component of this
contemporary carbon has been ascribed to BVOC-derived SOC, although a proportion has
been assigned as contemporary POC from anthropogenic combustion of biofuel/biomass and
a further portion to other non-combustion contemporary sources such as biological particles,
vegetative detritus, humic material and tyre-wear resuspension. The study confirms the
ubiquitous presence of background biogenic SOC, particularly for air masses passing over
land. It is proposed that separation of the PM2.5 according to polarity and volatility may
provide more useful and less method dependent information than is gained from attempting
an OC-EC split.
Acknowledgements
This work was funded by UK Natural Environment Research Council grant NE/E005233.

17
References
Aiken, A. C., DeCarlo, P. F., Kroll, J. H., et al , 2008. O/C and OM/OC ratios of primary, secondary, and ambient organic aerosols with high-resolution time-of-flight aerosol mass spectrometry. Environmental Science & Technology 42, 4478-4485.
AQEG, 2005. Particulate Matter in the United Kingdom. Second report of the Air Quality Expert Group, UK Department for Environment, Food and Rural Affairs, PB10580, London.
Bench, G., Fallon, S., Schichtel, B., Malm, W., McDade, C., 2007. Relative contributions of fossil and contemporary carbon sources to PM 2.5 aerosols at nine Interagency Monitoring for Protection of Visual Environments (IMPROVE) network sites. Journal of Geophysical Research 112, D10205, doi:10.1029/2006JD007708.
Carlton, A. G., Pinder, R. W., Bhave, P. V., Pouliot, G. A., 2010. To What Extent Can Biogenic SOA be Controlled? Environmental Science & Technology 44, 3376-3380.
Castro, L. M., Pio, C. A., Harrison, R. M., Smith, D. J. T., 1999. Carbonaceous aerosol in urban and rural European atmospheres: estimation of secondary organic carbon concentrations. Atmospheric Environment 33, 2771-2781.
Chan, T. W., Huang, L., Leaitch, W. R., Sharma, S., Brook, J. R., Slowik, J. G., Abbatt, J. P. D., Brickell, P. C., Liggio, J., Li, S. M., Moosmuller, H., 2010. Observations of OM/OC and specific attenuation coefficients (SAC) in ambient fine PM at a rural site in central Ontario, Canada. Atmospheric Chemistry and Physics 10, 2393-2411.
Chow, J. C., Watson, J. G., Chen, L. W. A., Arnott, W. P., Moosmuller, H., 2004a. Equivalence of elemental carbon by thermal/optical reflectance and transmittance with different temperature protocols. Environmental Science & Technology 38, 4414-4422.
Chow, J. C., Watson, J. G., Kuhns, H., Etyemezian, V., Lowenthal, D. H., Crow, D., Kohl, S. D., Engelbrecht, J. P., Green, M. C., 2004b. Source profiles for industrial, mobile, and area sources in the Big Bend Regional Aerosol Visibility and Observational study. Chemosphere 54, 185-208.
Currie, L. A., Benner, B. A., Kessler, J. D., et al , 2002. A critical evaluation of interlaboratory data on total, elemental, and isotopic carbon in the carbonaceous particle reference material, NIST SRM 1649a. Journal of Research of the National Institute of Standards and Technology 107, 279-298.
Derwent, R. G., Malcolm, A. L., 2000. Photochemical generation of secondary particles in the United Kingdom. Philosophical Transactions of the Royal Society of London Series A-Mathematical Physical and Engineering Sciences 358, 2643-2655.
El Zanan, H. S., Zielinska, B., Mazzoleni, L. R., Hansen, D. A., 2009. Analytical Determination of the Aerosol Organic Mass-to-Organic Carbon Ratio. Journal Of The Air & Waste Management Association 59, 58-69.
Endo, M., Yamamoto, N., Yoshinaga, J., Yanagisawa, Y., Endo, O., Goto, S., Yoneda, M., Shibata, Y., Morita, M., 2004. C-14 measurement for size-fractionated airborne particulate matters. Atmospheric Environment 38, 6263-6267.

18
Freeman, S. P. H. T., Cook, G. T., Dougans, A. B., Naysmith, P., Wilcken, K. M., Xu, S., 2010. Improved SSAMS performance. Nuclear Instruments & Methods in Physics Research Section B- Beam Interactions with Materials and Atoms 268, 715-717.
Gelencser, A., May, B., Simpson, D., Sanchez-Ochoa, A., Kasper-Giebl, A., Puxbaum, H., Caseiro, A., Pio, C., Legrand, M., 2007. Source apportionment of PM2.5 organic aerosol over Europe: Primary/secondary, natural/anthropogenic, and fossil/biogenic origin. Journal of Geophysical Research 112, D23S04, doi:10.1029/2006JD008094.
Harrison, R. M., Jones, A. M., Lawrence, R. G., 2003. A pragmatic mass closure model for airborne particulate matter at urban background and roadside sites. Atmospheric Environment 37, 4927-4933.
Harrison, R. M., Yin, J. X., 2008. Sources and processes affecting carbonaceous aerosol in central England. Atmospheric Environment 42, 1413-1423.
Hodzic, A., Jimenez, J. L., Prévôt, A. S. H., Szidat, S., Fast, J. D., Madronich, S., 2010. Can 3-D models explain the observed fractions of fossil and non-fossil carbon in and near Mexico City? Atmospheric Chemistry and Physics 10, 10997-11016.
Johnson, D., Utembe, S. R., Jenkin, M. E., 2006a. Simulating the detailed chemical composition of secondary organic aerosol formed on a regional scale during the TORCH 2003 campaign in the southern UK. Atmospheric Chemistry and Physics 6, 419-431.
Johnson, D., Utembe, S. R., Jenkin, M. E., Derwent, R. G., Hayman, G. D., Alfarra, M. R., Coe, H., McFiggans, G., 2006b. Simulating regional scale secondary organic aerosol formation during the TORCH 2003 campaign in the southern UK. Atmospheric Chemistry and Physics 6, 403-418.
Levin, I., Hammer, S., Kromer, B., Meinhardt, F., 2008. Radiocarbon observations in atmospheric CO2: Determining fossil fuel CO2 over Europe using Jungfraujoch observations as background. Science Of The Total Environment 391, 211-216.
Lewis, C. W., Klouda, G. A., Ellenson, W. D., 2004. Radiocarbon measurement of the biogenic contribution to summertime PM-2.5 ambient aerosol in Nashville, TN. Atmospheric Environment 38, 6053-6061.
Naysmith, P., Cook, G. T., Freeman, S. P. H. T., Scott, E. M., Anderson, R., Xu, S., Dunbar, E., Muir, G. K. P., Dougans, A., Wilcken, K. M., Schnabel, C., Russell, N., Ascough, P. L., Maden, C., 2010. 14C AMS at SUERC: Improving QA data with the 5 MV tandem and 250 kV SSAMS. Radiocarbon 52, 263-271.
NIST, 2007. Certificate of analysis for Standard Reference Material 1649a, Urban Dust. Revised Certificate, National Institute of Standards and Technology, Gaithersburg, MD. https://www-s.nist.gov/srmors/view_cert.cfm?srm=1649A.
Polidori, A., Turpin, B. J., Davidson, C. I., Rodenburg, L. A., Maimone, F., 2008. Organic PM2.5: Fractionation by polarity, FTIR spectroscopy, and OM/OC ratio for the Pittsburgh aerosol. Aerosol Science and Technology 42, 233-246.

19
Putaud, J. P., Raes, F., Van Dingenen, R., et al , 2004. European aerosol phenomenology-2: chemical characteristics of particulate matter at kerbside, urban, rural and background sites in Europe. Atmospheric Environment 38, 2579-2595.
Robinson, A. L., Donahue, N. M., Shrivastava, M. K., Weitkamp, E. A., Sage, A. M., Grieshop, A. P., Lane, T. E., Pierce, J. R., Pandis, S. N., 2007. Rethinking organic aerosols: Semivolatile emissions and photochemical aging. Science 315, 1259-1262.
Schichtel, B. A., Malm, W. C., Bench, G., Fallon, S., Mcdade, C. E., Chow, J. C., Watson, J. G., 2008. Fossil and contemporary fine particulate carbon fractions at 12 rural and urban sites in the United States. Journal of Geophysical Research 113, D02311, doi:10.1029/2007JD008605.
Sillanpaa, M., Hillamo, R., Saarikoski, S., et al , 2006. Chemical composition and mass closure of particulate matter at six urban sites in Europe. Atmospheric Environment 40, S212-S223.
Simon, H., Bhave, P. V., Swall, J. L., Frank, N. H., Malm, W. C., 2010. Determining the spatial and seasonal variability in OM/OC ratios across the US using multiple regression. Atmospheric Chemistry and Physics Discussions 10, 24651-24698.
Slota, P. J., Jull, A. J. T., Linick, T. W., Toolin, L. J., 1987. Preparation of small samples for C-14 accelerator targets by catalytic reduction of Co. Radiocarbon 29, 303-306.
Szidat, S., Jenk, T. M., Gaggeler, H. W., Synal, H. A., Fisseha, R., Baltensperger, U., Kalberer, M., Samburova, V., Reimann, S., Kasper-Giebl, A., Hajdas, I., 2004a. Radiocarbon (C-14)-deduced biogenic and anthropogenic contributions to organic carbon (OC) of urban aerosols from Zurich, Switzerland. Atmospheric Environment 38, 4035-4044.
Szidat, S., Jenk, T. M., Gaggeler, H. W., Synal, H. A., Fisseha, R., Baltensperger, U., Kalberer, M., Samburova, V., Wacker, L., Saurer, M., Schwikowski, M., Hajdas, I., 2004b. Source apportionment of aerosols by C-14 measurements in different carbonaceous particle fractions. Radiocarbon 46, 475-484.
Szidat, S., Jenk, T. M., Gaggeler, H. W., Synal, H. A., Hajdas, I., Bonani, G., Saurer, M., 2004c. THEODORE, a two-step heating system for the EC/OC determination of radiocarbon (C-14) in the environment. Nuclear Instruments & Methods in Physics Research Section B- Beam Interactions with Materials and Atoms 223-24, 829-836.
Szidat, S., Jenk, T. M., Synal, H. A., Kalberer, M., Wacker, L., Hajdas, I., Kasper-Giebl, A., Baltensperger, U., 2006. Contributions of fossil fuel, biomass-burning, and biogenic emissions to carbonaceous aerosols in Zurich as traced by 14C. Journal of Geophysical Research 111, D07206, doi:10.1029/2005JD006590.
Szidat, S., Ruff, M., Perron, N., Wacker, L., Synal, H. A., Hallquist, M., Shannigrahi, A. S., Yttri, K. E., Dye, C., Simpson, D., 2009. Fossil and non-fossil sources of organic carbon (OC) and elemental carbon (EC) in Goteborg, Sweden. Atmospheric Chemistry and Physics 9, 1521-1535.
Whyatt, J. D., Metcalfe, S. E., Nicholson, J., Derwent, R. G., Page, T., Stedman, J. R., 2007. Regional scale modelling of particulate matter in the UK, source attribution and an assessment of uncertainties. Atmospheric Environment 41, 3315-3327.

20
Xu, X. M., Trumbore, S. E., Zheng, S. H., Southon, J. R., McDuffee, K. E., Luttgen, M., Liu, J. C., 2007. Modifying a sealed tube zinc reduction method for preparation of AMS graphite targets: Reducing background and attaining high precision. Nuclear Instruments & Methods in Physics Research Section B- Beam Interactions with Materials and Atoms 259, 320-329.
Yin, J., Harrison, R. M., Chen, Q., Rutter, A., Schauer, J. J., 2010. Source apportionment of fine particles at urban background and rural sites in the UK atmosphere. Atmospheric Environment 44, 841-851.
Zhang, Q., Jimenez, J. L., Canagaratna, M. R., et al , 2007. Ubiquity and dominance of oxygenated species in organic aerosols in anthropogenically-influenced Northern Hemisphere midlatitudes. Geophysical Research Letters 34, L13801, doi:10.1029/2007GL029979.

21
Tables
Table 1: Values of fraction modern 14C determined in NIST urban dust SRM-1649a.
fM(TC) fM(EC) fM(OC)
This work
0.515 (single combustion)
0.570 ± 0.014 (two-step combustion) 0.15 ± 0.08 0.66 ± 0.02
NIST (2007) certificate
0.61 ± 0.08 (combustion manometry) 0.065 ± 0.014 (thermal oxidation) no value given
0.505 ± 0.006 (H3PO4-combustion-manometry) 0.153 ± 0.004 (chemical oxidation) no value given
0.517 ± 0.007 (combustion-GC) 0.038 ± 0.024 (thermal kinetic oxidation)
no value given
Szidat et al. (2004c)
0.522 ± 0.018 0.066 ± 0.020 0.70 ± 0.05

22
Figure captions
Figure 1: Schematic of determination of 14C in the TC, OC and EC of samples of PM2.5.
Figure 2: Scatter plot of individual sample total carbon determined independently from the
cumulative CO2 evolved during the two combustions for preparation of AMS targets and by
Sunset Analyzer.
Figure 3: Methodology for assigning OC content of individual samples into POC and SOC for
all PM2.5 samples collected and analysed by Sunset Analyzer (n = 75). One exceptional
sample (18th Feb 08) for which OC was 21.9 µgC m-3 (EC = 4.3 µgC m-3), see Figure 2, is not
illustrated on this figure since to do so would require substantial compression of the
remaining data.
Figure 4: Box-whisker distributions of PM2.5 TC concentrations (upper panel) and SOC/TC
ratios (lower panel) grouped according to incoming air-mass back trajectory direction at the
sampling location. Boxes show interquartile ranges; whiskers extend to maximum (minimum)
value within 1.5 times the IQR above (below) the upper (lower) quartile. Groups annotated
with a common letter have significantly different median values. Sample date 18th Feb 08
with the exceptionally high carbon loading (see Figure 2) is an off-scale outlier of group
‘East’ in the upper plot.
Figure 5: Fraction contemporary carbon in TC plotted as a function of both SOC/TC ratio and
the geographical classification of the incoming air-mass direction at the sampling location.
Figure 6: Source attribution of EC and OC, as described in the text, for the sample of PM2.5
collected on 22nd Feb 2008 (upper) and 31st Jan 2008 (lower). Values are concentrations in
units of µgC m-3.
Figure 7: Mean 5-source apportionment of TC in Birmingham (this work) compared with
similar work from Zurich (Szidat et al., 2006) and Göteburg (Szidat et al., 2009). OCbiomass is
POC from combustion of biofuels/biomass, OCfossil is both fossil-derived POC and any SOC
from fossil-derived VOC, and OCbiogenic is SOC formed from BVOC oxidation together with
any other contemporary OC material not explicitly accounted for elsewhere, for example

23
spores, vegetative detritus, tyre rubber, etc. Uncertainties in the values presented from this
work are discussed in the text.

24
Figure 1: Schematic of determination of 14C in the TC, OC and EC of samples of PM2.5.
PM2.5
20 min @ 340°C in O2 Graphitisation of evolved CO2
fM (OC)
4 h @ 850°C in O2 Graphitisation of evolved CO2
fM (EC + remaining OC)
fM (TC)
Combine with volumes CO2 evolved
fM (EC)
Combine with OC:EC split from Sunset Analyzer

25
Figure 2: Scatter plot of individual sample total carbon determined independently from the
cumulative CO2 evolved during the two combustions for preparation of AMS targets and by
Sunset Analyzer.
0
2000
4000
6000
8000
10000
12000
0 2000 4000 6000 8000 10000 12000
TC via Sunset analyser (µµµµgC)
TC
via
evo
lved
CO
2 f
or
AM
S (
µµ µµg
C) y = x
R2
= 0.94

26
Figure 3: Methodology for assigning OC content of individual samples into POC and SOC for
all PM2.5 samples collected and analysed by Sunset Analyzer (n = 75). One exceptional
sample (18th Feb 08) for which OC was 21.9 µgC m-3 (EC = 4.3 µgC m-3), see Figure 2, is not
illustrated on this figure since to do so would require substantial compression of the
remaining data.
0
2
4
6
8
10
12
0.0 0.5 1.0 1.5 2.0 2.5 3.0 3.5 4.0
EC concentration (µµµµg C m-3
)
OC
co
nc
en
tra
tio
n (
µµ µµg
C m
-3)
additional point off
scale (18-Feb-08)
y = 1.11x
Line assumed to represent
(OC/EC)prim emission ratio
POC
SOC
22nd Feb 08
0
2
4
6
8
10
12
0.0 0.5 1.0 1.5 2.0 2.5 3.0 3.5 4.0
EC concentration (µµµµg C m-3
)
OC
co
nc
en
tra
tio
n (
µµ µµg
C m
-3)
additional point off
scale (18-Feb-08)
y = 1.11x
Line assumed to represent
(OC/EC)prim emission ratio
POC
SOC
22nd Feb 08

27
Figure 4: Box-whisker distributions of PM2.5 TC concentrations (upper panel) and SOC/TC
ratios (lower panel) grouped according to incoming air-mass back trajectory direction at the
sampling location. Boxes show interquartile ranges; whiskers extend to maximum (minimum)
value within 1.5 times the IQR above (below) the upper (lower) quartile. Groups annotated
with a common letter have significantly different median values. Sample date 18th Feb 08
with the exceptionally high carbon loading (see Figure 2) is an off-scale outlier of group
‘East’ in the upper plot.
SouthNorthEastAtlantic slowAtlantic fast
16
14
12
10
8
6
4
2
0
TC / ugC m-3
ba d
a b c
c
d
SouthNorthEastAtlantic slowAtlantic fast
0.8
0.7
0.6
0.5
0.4
0.3
0.2
0.1
0.0
SOC/TC ratio a c d
a
a b
b c
d

28
Figure 5: Fraction contemporary carbon in TC plotted as a function of both SOC/TC ratio and
the geographical classification of the incoming air-mass direction at the sampling location.
0.0
0.1
0.2
0.3
0.4
0.5
0.6
0.7
0.8
0.0 0.1 0.2 0.3 0.4 0.5 0.6 0.7 0.8
SOC/TC ratio
fc (
TC
)
Atlantic fast
Atlantic slow
East
North
South
R2 = 0.32

29
Figure 6: Source attribution of EC and OC, as described in the text, for the sample of PM2.5
collected on 22nd February 2008 (upper) and 31st January 2008 (lower). Values are
concentrations in units of µgC m-3.
22/02/2008
OC fossil,
0.39
EC biomass,
0.04
OC biogenic,
0.89
OC biomass,
0.19
EC fossil,
0.55
Contemporary
Fossil
EC OC
31/01/2008
OC fossil,
0.23
EC biomass,
0.07OC biogenic,
0.13
OC biomass,
0.37
EC fossil,
0.68
Contemporary
Fossil
EC OC

30
Figure 7: Mean 5-source apportionment of TC in Birmingham (this work) compared with
similar work from Zurich (Szidat et al., 2006) and Göteburg (Szidat et al., 2009). OCbiomass is
POC from combustion of biofuels/biomass, OCfossil is both fossil-derived POC and any SOC
from fossil-derived VOC, and OCbiogenic is SOC formed from BVOC oxidation together with
any other contemporary OC material not explicitly accounted for elsewhere, for example
spores, vegetative detritus, tyre rubber, etc. Uncertainties in the values presented from this
work are discussed in the text.
0%
10%
20%
30%
40%
50%
60%
70%
80%
90%
100%
Zurich
(winter)
PM10
Göteborg
(winter)
PM10
Zurich
(summer)
PM10
Göteborg
(summer)
PM2.5
Birmingham
(all year)
PM2.5
EC biomass EC fossil OC fossil OC biomass OC biogenic
Copyright © 2022 FDOKUMEN


![In vitro [14C]-labelled 6-benzyladenine uptake and14CO2 evolution in two Japanese plum cultivars](https://static.fdokumen.com/doc/165x107/6330ca7110331e53560a9149/in-vitro-14c-labelled-6-benzyladenine-uptake-and14co2-evolution-in-two-japanese.jpg)